UNITED STATES
SECURITIES AND EXCHANGE COMMISSION
Washington, D.C. 20549
FORM N-CSR
CERTIFIED SHAREHOLDER REPORT OF REGISTERED
MANAGEMENT INVESTMENT COMPANIES
Investment Company Act file number 811-2720
Fidelity Municipal Trust
(Exact name of registrant as specified in charter)
82 Devonshire St., Boston, Massachusetts 02109
(Address of principal executive offices) (Zip code)
Eric D. Roiter, Secretary
82 Devonshire St.
Boston, Massachusetts 02109
(Name and address of agent for service)
Registrant's telephone number, including area code: 617-563-7000
Date of fiscal year end: | December 31 |
| |
Date of reporting period: | December 31, 2003 |
Item 1. Reports to Stockholders
Spartan®
Michigan Municipal Income
Fund
and
Fidelity ®
Michigan Municipal Money
Market Fund
Annual Report
December 31, 2003
(2_fidelity_logos) (Registered_Trademark)
Contents
Chairman's Message | <Click Here> | Ned Johnson's message to shareholders |
Spartan Michigan Municipal Income Fund |
Performance | <Click Here> | How the fund has done over time. |
Management's Discussion | <Click Here> | The manager's review of fund performance, strategy and outlook. |
Investment Changes | <Click Here> | A summary of major shifts in the fund's investments over the past six months. |
Investments | <Click Here> | A complete list of the fund's investments with their market values. |
Financial Statements | <Click Here> | Statements of assets and liabilities, operations, and changes in net assets,
as well as financial highlights. |
Fidelity Michigan Municipal Money Market Fund |
Investment Changes | <Click Here> | A summary of major shifts in the fund's investments over the past six months and one year. |
Investments | <Click Here> | A complete list of the fund's investments with their market values. |
Financial Statements | <Click Here> | Statements of assets and liabilities, operations, and changes in net assets,
as well as financial highlights. |
Notes | <Click Here> | Notes to the Financial Statements |
Auditors' Opinion | <Click Here> | |
Trustees and Officers | <Click Here> | |
| | |
For a free copy of the funds' proxy voting guidelines visit www.fidelity.com/goto/proxyguidelines, call 1-800-544-8544, or visit the Securities and Exchange Commission (SEC)'s web site at www.sec.gov.
Standard & Poor's, S&P and S&P 500 are registered service marks of The McGraw-Hill Companies, Inc. and have been licensed for use by Fidelity Distributors Corporation.
Other third party marks appearing herein are the property of their respective owners.
All other marks appearing herein are registered or unregistered trademarks or service marks of FMR Corp. or an affiliated company.
(Recycle graphic) This report is printed on recycled paper using soy-based inks.
This report and the financial statements contained herein are submitted for the general information of the shareholders of the funds. This report is not authorized for distribution to prospective investors in the funds unless preceded or accompanied by an effective prospectus.
Mutual fund shares are not deposits or obligations of, or guaranteed by, any depository institution. Shares are not insured by the FDIC, Federal Reserve Board or any other agency, and are subject to investment risks, including possible loss of principal amount invested.
Neither the funds nor Fidelity Distributors Corporation is a bank.
For more information on any Fidelity fund, including charges and expenses, call 1-800-544-6666 for a free prospectus. Read it carefully before you invest or send money.
Annual Report
Chairman's Message
(photo_of_Edward_C_Johnson_3d)
Dear Shareholder:
Many of you have read or heard news stories recently that were critical of mutual funds and made allegations that the mutual fund industry has been less than forthright. I find these reports unsettling and not necessarily an accurate picture of the overall industry, and I would like you to know where we at Fidelity stand.
With specific regard to allegations that certain mutual fund companies were violating the Securities and Exchange Commission's forward pricing rules or were involved in so-called "market timing" activities, I want to say two things:
First, Fidelity does not have agreements that permit customers who buy fund shares after 4 p.m. to obtain the 4 p.m. price. This is not to say that someone could not deceive the company through fraudulent acts. But I underscore that we have no so-called "agreements" which would permit this illegal practice.
Second, Fidelity has been on record for years opposing predatory short-term trading which adversely affects other shareholders in a mutual fund. In fact, in the 1980s, we began charging a fee - which is returned to the fund and, therefore, to investors - to discourage this activity. What's more, several years ago we took the industry lead in developing a Fair Value Pricing Policy to prevent market timing on foreign securities in our funds. It is reasonable to assume that another structure can be developed that would alter the system to make it much more difficult for predatory traders to operate. This, however, will only be achieved through close cooperation among regulators, legislators and the industry.
Certainly no industry is perfect, and there have been instances of unethical and illegal activity from time to time within the mutual fund industry. When this occurs, confessed or convicted offenders should be dealt with appropriately. Clearly, every system can be improved. We applaud well thought out improvements by regulators, legislators and industry representatives that achieve the common goal of building and protecting the value of investors' holdings. But we remain concerned about the risk of over-regulation and the quick application of simplistic solutions to intricate problems.
For more than 57 years, Fidelity Investments has worked very hard to improve its products and service to justify your trust. When our family founded this company in 1946, we had only a few hundred customers. Many of them were family and friends. Today, we serve more than 18 million customers including individual investors and participants in retirement plans across America.
Let me close by saying that we do not take your trust in us for granted, and we realize that we must always work to improve all aspects of our service to you. In turn, we urge you to continue your active participation with your financial matters, so that your interests can be well served.
Best regards,
/s/Edward C. Johnson 3d
Edward C. Johnson 3d
Annual Report
Spartan Michigan Municipal Income Fund
Performance: The Bottom Line
Average annual total return reflects the change in the value of an investment, assuming reinvestment of the fund's dividend income and capital gains (the profits earned upon the sale of securities that have grown in value) and assuming a constant rate of performance each year. During periods of reimbursement by Fidelity, a fund's total return will be greater than it would be had the reimbursement not occurred. The $10,000 table and the fund's returns do not reflect the deduction of taxes that a shareholder would pay on fund distributions or the redemption of fund shares. How a fund did yesterday is no guarantee of how it will do tomorrow.
Average Annual Total Returns
Periods ended December 31, 2003 | Past 1
year | Past 5
years | Past 10
years |
Spartan MI Municipal Income Fund | 5.87% | 5.68% | 5.30% |
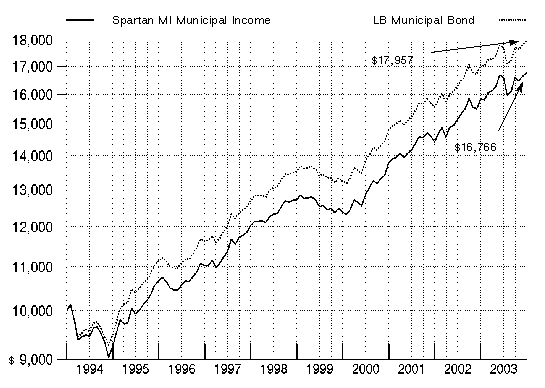
$10,000 Over 10 Years
Let's say hypothetically that $10,000 was invested in Spartan® Michigan Municipal Income Fund on December 31, 1993. The chart shows how the value of your investment would have grown, and also shows how the Lehman Brothers Municipal Bond Index did over the same period.
Annual Report
Spartan Michigan Municipal Income Fund
Management's Discussion of Fund Performance
Comments from Doug McGinley, Portfolio Manager of Spartan® Michigan Municipal Income Fund
While most of the year favored riskier assets, tax-exempt municipal bonds put up solid numbers for the 12 months ending December 31, 2003. In that time, the Lehman Brothers® Municipal Bond Index - a performance measure of about 40,000 investment-grade, fixed-rate, tax-exempt bonds - advanced 5.31%. For munis, it was the fourth straight year of returns in excess of 5%. Munis had an excellent year relative to taxable investment-grade bonds. The Lehman Brothers Aggregate Bond Index, a proxy for the taxable, investment-grade bond market, gained 4.10% in 2003, a full percentage point less than the muni index - a gap made even wider considering muni bonds' tax-equivalent yield advantage. What's more, on a three- and five-year basis, the Lehman Brothers muni index's cumulative return is well above that of most stock market benchmarks. Munis fared well for much of the year against a backdrop of low interest rates and virtually non-existent inflation. Although they stumbled in mid-summer against a brighter economic forecast, munis rebounded later on the heels of strong investor demand and the Federal Reserve Board's accommodative monetary policy.
Spartan Michigan Municipal Income Fund returned 5.87% during the 12-month period, outpacing the LipperSM Michigan Municipal Debt Funds Average, which returned 4.09%, and the 5.48% return of the Lehman Brothers Michigan Municipal Bond Index. The fund's outperformance stemmed from a variety of strategies, including how its holdings were invested in bonds of various maturities at different points throughout the year. Security and sector selection also helped, particularly in the health care sector. The fund was overweighted in hospital bonds, which generally performed well during the year. It also held a number of strong-performing individual holdings in that sector and avoided those that experienced severe credit problems. An emphasis on essential services bonds - meaning those issued by providers of electricity, water and sewer services - also helped. Their stable revenues helped them outperform tax-backed bonds during the period. The fund also benefited from its underweighting in state-issued bonds, which came under pressure due to weakening fiscal health and a credit downgrade. Modestly detracting was a relatively small stake - compared to the Michigan muni market overall - in bonds that were prerefunded during the period, a process whereby the bonds typically emerge with higher credit ratings and prices.
The views expressed in this statement reflect those of the portfolio manager only through the end of the period of the report as stated on the cover and do not necessarily represent the views of Fidelity or any other person in the Fidelity organization. Any such views are subject to change at any time based upon market or other conditions and Fidelity disclaims any responsibility to update such views. These views may not be relied on as investment advice and, because investment decisions for a Fidelity fund are based on numerous factors, may not be relied on as an indication of trading intent on behalf of any Fidelity fund.
Annual Report
Spartan Michigan Municipal Income Fund
Investment Changes
Top Five Sectors as of December 31, 2003 |
| % of fund's
net assets | % of fund's net assets
6 months ago |
General Obligations | 45.4 | 42.1 |
Escrowed/Pre-Refunded | 13.6 | 15.6 |
Water & Sewer | 11.5 | 11.5 |
Health Care | 10.2 | 9.7 |
Electric Utilities | 5.0 | 5.8 |
Average Years to Maturity as of December 31, 2003 |
| | 6 months ago |
Years | 12.7 | 12.9 |
Average years to maturity is based on the average time remaining until principal payments are expected from each of the fund's bonds, weighted by dollar amount. |
Duration as of December 31, 2003 |
| | 6 months ago |
Years | 7.1 | 6.9 |
Duration shows how much a bond fund's price fluctuates with changes in comparable interest rates. If rates rise 1%, for example, a fund with a five-year duration is likely to lose about 5% of its value. Other factors also can influence a bond fund's performance and share price. Accordingly, a bond fund's actual performance may differ from this example. |
Quality Diversification (% of fund's net assets) |
As of December 31, 2003 | As of June 30, 2003 |
 | AAA 75.8% | | | AAA 83.6% | |
 | AA,A 22.0% | | | AA,A 14.2% | |
 | BBB 0.9% | | | BBB 1.0% | |
 | Not Rated 0.0% | | | Not Rated 0.6% | |
 | Short-Term
Investments and
Net Other Assets 1.3% | | | Short-Term
Investments and
Net Other Assets 0.6% | |

We have used ratings from Moody's® Investors Services, Inc. Where Moody's ratings are not available, we have used S&P® ratings. |
Annual Report
Spartan Michigan Municipal Income Fund
Investments December 31, 2003
Showing Percentage of Net Assets
Municipal Bonds - 98.7% |
| Principal
Amount | | Value
(Note 1) |
Michigan - 98.2% |
Anchor Bay School District 2000 School Bldg. & Site: | | | | |
Series II, 5.7% 5/1/25 (Pre-Refunded to 5/1/10 @ 100) (d) | | $ 1,250,000 | | $ 1,463,300 |
Series III, 5.25% 5/1/31 | | 9,300,000 | | 9,688,647 |
Ann Arbor Econ. Dev. Corp. Ltd. Oblig. Rev. (Glacier Hills, Inc. Proj.) 8.375% 1/15/19 (Escrowed to Maturity) (d) | | 3,187,000 | | 4,322,305 |
Bay City Gen. Oblig. 0% 6/1/15 (AMBAC Insured) | | 1,725,000 | | 1,072,916 |
Birmingham County School District Series II, 5.25% 11/1/19 | | 1,200,000 | | 1,299,852 |
Brighton Area School District Livingston County Series II, 0% 5/1/15 (AMBAC Insured) | | 10,000,000 | | 6,241,400 |
Byron Ctr. Pub. Schools 5.5% 5/1/16 | | 1,055,000 | | 1,194,566 |
Caladonia Cmnty. Schools Counties of Kent, Allegan and Barry: | | | | |
5.25% 5/1/17 (Liquidity Facility Sumitomo Bank Lease Fin., Inc. (SBLF)) | | 1,120,000 | | 1,241,274 |
5.25% 5/1/18 (Liquidity Facility Sumitomo Bank Lease Fin., Inc. (SBLF)) | | 1,100,000 | | 1,210,055 |
5.5% 5/1/26 (FGIC Insured) | | 3,000,000 | | 3,229,530 |
Carman-Ainsworth Cmnty. School District: | | | | |
5.5% 5/1/14 (FGIC Insured) | | 1,755,000 | | 2,009,615 |
5.5% 5/1/15 (FGIC Insured) | | 1,850,000 | | 2,114,088 |
5.5% 5/1/16 (FGIC Insured) | | 1,000,000 | | 1,128,870 |
5.5% 5/1/17 (FGIC Insured) | | 2,060,000 | | 2,317,603 |
5.5% 5/1/20 (FGIC Insured) | | 2,000,000 | | 2,210,900 |
Chippewa Valley Schools: | | | | |
Series I, 5.375% 5/1/17 | | 1,000,000 | | 1,103,220 |
5.5% 5/1/17 | | 1,125,000 | | 1,262,261 |
Clintondale Cmnty. Schools 5.5% 5/1/15 | | 2,205,000 | | 2,347,046 |
Constantine Pub. Schools: | | | | |
5% 5/1/25 | | 2,250,000 | | 2,296,958 |
5.5% 5/1/18 | | 1,220,000 | | 1,368,706 |
5.5% 5/1/19 | | 1,245,000 | | 1,386,880 |
5.5% 5/1/20 | | 1,245,000 | | 1,379,049 |
5.5% 5/1/21 | | 1,250,000 | | 1,381,763 |
Crawford Ausable School District (School Bldg. & Site Proj.) Series 2001, 5.625% 5/1/18 | | 1,100,000 | | 1,229,514 |
Davison Cmnty. School District 5.375% 5/1/16 (FGIC Insured) | | 1,000,000 | | 1,092,000 |
Detroit City School District: | | | | |
Series 2003 B, 5.25% 5/1/15 (FGIC Insured) | | 3,085,000 | | 3,457,575 |
Municipal Bonds - continued |
| Principal
Amount | | Value
(Note 1) |
Michigan - continued |
Detroit City School District: - continued | | | | |
Series A: | | | | |
5.5% 5/1/18 (FGIC Insured) | | $ 2,000,000 | | $ 2,235,460 |
5.5% 5/1/18 (FSA Insured) | | 1,000,000 | | 1,118,220 |
Detroit Convention Facilities Rev. (Cobo Hall Expansion Proj.): | | | | |
5% 9/30/10 (MBIA Insured) | | 4,000,000 | | 4,468,960 |
5% 9/30/11 (MBIA Insured) | | 3,000,000 | | 3,350,370 |
5% 9/30/12 (MBIA Insured) | | 3,000,000 | | 3,329,820 |
Detroit Gen. Oblig.: | | | | |
(Distributable State Aid Proj.) 5.25% 5/1/09
(AMBAC Insured) | | 4,500,000 | | 5,090,220 |
Series 2003 A, 5% 4/1/11 (XL Cap. Assurance, Inc. Insured) | | 1,430,000 | | 1,597,153 |
Series A, 5% 4/1/09 (FSA Insured) (a) | | 3,000,000 | | 3,178,020 |
5.5% 4/1/17 (MBIA Insured) | | 2,615,000 | | 2,939,182 |
5.5% 4/1/19 (MBIA Insured) | | 1,500,000 | | 1,665,705 |
5.5% 4/1/20 (MBIA Insured) | | 1,250,000 | | 1,380,675 |
Detroit Swr. Disp. Rev.: | | | | |
Series 2001 D1, 5.5%, tender 7/1/08 (MBIA Insured) (b) | | 10,000,000 | | 11,248,600 |
Series A: | | | | |
0% 7/1/14 (FGIC Insured) | | 6,730,000 | | 4,397,920 |
5.125% 7/1/31 (FGIC Insured) | | 8,020,000 | | 8,243,357 |
5.75% 7/1/26 (Pre-Refunded to 1/1/10 @ 101) (d) | | 10,000,000 | | 11,736,300 |
Detroit Wtr. Supply Sys. Rev.: | | | | |
Series 2001 A, 5.25% 7/1/33 (FGIC Insured) | | 6,325,000 | | 6,607,538 |
Series A: | | | | |
5.5% 7/1/15 (FGIC Insured) | | 3,675,000 | | 4,138,675 |
5.875% 7/1/22 (Pre-Refunded to 1/1/10 @ 101) (d) | | 5,000,000 | | 5,902,450 |
5.875% 7/1/29 (Pre-Refunded to 1/1/10 @ 101) (d) | | 3,085,000 | | 3,641,812 |
Series B, 5.5% 7/1/33 (FGIC Insured) | | 10,000,000 | | 10,721,700 |
6.5% 7/1/15 (FGIC Insured) | | 6,000,000 | | 7,495,320 |
Dexter Cmnty. Schools 5% 5/1/18 (Liquidity Facility Sumitomo Bank Lease Fin., Inc. (SBLF)) | | 1,955,000 | | 2,098,575 |
Dundee Cmnty. School District: | | | | |
Series 2000, 5.375% 5/1/27 | | 1,145,000 | | 1,208,376 |
5.375% 5/1/19 | | 1,000,000 | | 1,085,270 |
East China School District 5.5% 5/1/17 | | 1,775,000 | | 1,984,077 |
Municipal Bonds - continued |
| Principal
Amount | | Value
(Note 1) |
Michigan - continued |
East Grand Rapids Pub. School District 5.5% 5/1/17 | | $ 1,690,000 | | $ 1,883,590 |
Eastern Michigan Univ. Revs. Series 2000 B: | | | | |
5.5% 6/1/20 (FGIC Insured) | | 2,230,000 | | 2,442,118 |
5.625% 6/1/30 (FGIC Insured) | | 1,250,000 | | 1,351,125 |
Ecorse Pub. School District 5.5% 5/1/27 (FGIC Insured) | | 430,000 | | 452,807 |
Ferndale Gen. Oblig. 4.5% 4/1/11 (FGIC Insured) | | 1,335,000 | | 1,452,694 |
Gibraltar School District: | | | | |
5.5% 5/1/18 | | 1,200,000 | | 1,341,504 |
5.5% 5/1/21 | | 1,200,000 | | 1,317,048 |
Grand Blanc Cmnty. Schools 5.5% 5/1/13 (FGIC Insured) | | 1,000,000 | | 1,142,570 |
Grand Rapids Downtown Dev. Auth. Tax Increment Rev. 0% 6/1/11 (MBIA Insured) | | 3,160,000 | | 2,429,598 |
Grand Rapids Wtr. Supply Sys. 5.75% 1/1/11
(FGIC Insured) | | 2,000,000 | | 2,326,740 |
Hamilton Cmnty. Schools District 5% 5/1/24
(FGIC Insured) | | 1,500,000 | | 1,543,200 |
Howell Pub. Schools: | | | | |
0% 5/1/10 (AMBAC Insured) | | 1,130,000 | | 914,023 |
5% 5/1/10 | | 1,350,000 | | 1,514,201 |
5% 5/1/11 | | 2,250,000 | | 2,525,130 |
Huron School District 5.625% 5/1/16 (FSA Insured) | | 1,050,000 | | 1,179,350 |
Huron Valley School District: | | | | |
0% 5/1/10 (FGIC Insured) | | 2,500,000 | | 2,022,175 |
0% 5/1/11 (FGIC Insured) | | 5,830,000 | | 4,495,688 |
0% 5/1/12 (FGIC Insured) | | 1,420,000 | | 1,033,036 |
5.25% 5/1/16 | | 2,450,000 | | 2,733,612 |
5.5% 5/1/18 | | 2,525,000 | | 2,807,926 |
Imlay City Cmnty. School District (School Bldg. and Site Proj.) 0% 5/1/06 (FGIC Insured) | | 1,375,000 | | 1,313,276 |
Jonesville Cmnty. Schools 5.75% 5/1/17 (FGIC Insured) | | 1,150,000 | | 1,297,499 |
Kent Hosp. Fin. Auth. Hosp. Facilities Rev.: | | | | |
(Butterworth Hosp. Proj.) Series A, 7.25% 1/15/13 | | 3,685,000 | | 4,492,899 |
(Spectrum Health Proj.) Series A: | | | | |
5.375% 1/15/11 | | 2,420,000 | | 2,606,098 |
5.375% 1/15/12 | | 2,505,000 | | 2,687,865 |
L'Anse Creuse Pub. Schools: | | | | |
5.375% 5/1/18 | | 1,000,000 | | 1,112,610 |
5.375% 5/1/20 | | 1,000,000 | | 1,098,470 |
Lake Orion Cmnty. School District: | | | | |
Series A, 5.85% 5/1/16 (Pre-Refunded to 5/1/10 @ 100) (d) | | 3,840,000 | | 4,528,474 |
Municipal Bonds - continued |
| Principal
Amount | | Value
(Note 1) |
Michigan - continued |
Lake Orion Cmnty. School District: - continued | | | | |
5.25% 5/1/27 (Liquidity Facility Sumitomo Bank Lease Fin., Inc. (SBLF)) | | $ 1,150,000 | | $ 1,209,421 |
Lansing Bldg. Auth. Rev. 0% 6/1/12 (AMBAC Insured) | | 3,000,000 | | 2,175,540 |
Lansing Cmnty. College 5.5% 5/1/14 (FGIC Insured) | | 3,400,000 | | 3,880,080 |
Lansing Swr. Disp. Sys. Rev.: | | | | |
5% 5/1/10 (FGIC Insured) | | 1,855,000 | | 2,082,905 |
5% 5/1/11 (FGIC Insured) | | 1,050,000 | | 1,181,313 |
Lawton Cmnty. Schools 5.5% 5/1/19 | | 1,050,000 | | 1,167,653 |
Livonia Muni. Bldg. Auth. 5% 5/1/17 (FGIC Insured) | | 1,100,000 | | 1,164,493 |
Livonia Pub. School District 5.875% 5/1/25
(FGIC Insured) | | 7,000,000 | | 7,875,350 |
Marquette City Hosp. Fin. Auth. Rev. (Marquette Gen. Hosp. Proj.) Series D, 5.875% 4/1/11 (FSA Insured) | | 2,750,000 | | 3,009,518 |
Michigan Bldg. Auth. Rev. (Facilities Prog.): | | | | |
Series I, 5.25% 10/15/11 (FSA Insured) | | 3,000,000 | | 3,425,340 |
Series III, 5% 10/15/10 (MBIA Insured) | | 1,000,000 | | 1,124,420 |
Michigan Comprehensive Trans. Rev. Series B: | | | | |
5.25% 5/15/11 (FSA Insured) | | 1,475,000 | | 1,679,273 |
5.25% 5/15/16 (FSA Insured) | | 3,850,000 | | 4,264,838 |
Michigan Ctfs. of Prtn. 5.75% 6/1/17 (AMBAC Insured) | | 3,000,000 | | 3,420,960 |
Michigan Gen. Oblig. (Envir. Protection Prog.) 6.25% 11/1/12 | | 2,015,000 | | 2,398,575 |
Michigan Higher Ed. Student Ln. Auth. Rev. Series XII W, 4.875% 9/1/10 (AMBAC Insured) (c) | | 3,000,000 | | 3,187,620 |
Michigan Hosp. Fin. Auth. Hosp. Rev.: | | | | |
(Ascension Health Cr. Group Proj.) Series A: | | | | |
6% 11/15/19 (Pre-Refunded to 11/15/09 @ 101) (d) | | 17,145,000 | | 20,337,558 |
6.125% 11/15/26 (Pre-Refunded to 11/15/09 @ 101) (d) | | 3,070,000 | | 3,662,326 |
(Crittenton Hosp. Proj.) Series A: | | | | |
5.25% 3/1/14 | | 6,520,000 | | 6,647,010 |
5.5% 3/1/13 | | 455,000 | | 492,305 |
5.5% 3/1/14 | | 1,300,000 | | 1,397,305 |
5.5% 3/1/15 | | 1,985,000 | | 2,110,611 |
(Daughters of Charity Health Sys. Proj.) 5.5% 11/1/05 (Escrowed to Maturity) (d) | | 1,015,000 | | 1,064,268 |
(Genesys Reg'l. Med. Hosp. Proj.) Series A, 5.3% 10/1/11 (Escrowed to Maturity) (d) | | 1,000,000 | | 1,117,170 |
(Henry Ford Health Sys. Proj.): | | | | |
Series 2003 A, 5.5% 3/1/14 | | 2,000,000 | | 2,159,160 |
Series A, 6% 11/15/19 | | 1,945,000 | | 2,061,447 |
Municipal Bonds - continued |
| Principal
Amount | | Value
(Note 1) |
Michigan - continued |
Michigan Hosp. Fin. Auth. Hosp. Rev.: - continued | | | | |
(McLaren Oblig. Group Proj.) Series A, 5.375% 10/15/13 | | $ 9,250,000 | | $ 9,422,328 |
(Mercy Health Svcs. Proj.): | | | | |
Series 1996 R, 5.375% 8/15/26 (Escrowed to Maturity) (d) | | 2,500,000 | | 2,591,650 |
Series Q: | | | | |
5.25% 8/15/10 (Escrowed to Maturity) (d) | | 2,195,000 | | 2,372,246 |
5.375% 8/15/26 (Escrowed to Maturity) (d) | | 2,450,000 | | 2,539,817 |
6% 8/15/08 (Escrowed to Maturity) (d) | | 1,130,000 | | 1,258,696 |
6% 8/15/10 (Escrowed to Maturity) (d) | | 1,265,000 | | 1,400,507 |
Series R, 5.375% 8/15/16 (Escrowed to Maturity) (d) | | 2,500,000 | | 2,658,600 |
(MidMichigan Health Obligated Group Prog.) Series 2002 A, 5.5% 4/15/18 (AMBAC Insured) | | 2,000,000 | | 2,212,900 |
(Oakwood Obligated Group Proj.) 5.5% 11/1/11 | | 3,000,000 | | 3,241,650 |
(Saint John Hosp. & Med. Ctr. Proj.) Series A, 6% 5/15/09 (Escrowed to Maturity) (d) | | 1,710,000 | | 2,008,344 |
(Sisters of Mercy Health Corp. Proj.) Series P, 5.375% 8/15/14 (Escrowed to Maturity) (d) | | 570,000 | | 638,360 |
(Sparrow Hosp. Obligated Group Proj.): | | | | |
5.5% 11/15/21 | | 1,435,000 | | 1,467,704 |
5.625% 11/15/31 | | 4,500,000 | | 4,584,375 |
(Trinity Health Sys. Proj.) Series 2000 A, 6% 12/1/27 | | 1,535,000 | | 1,650,232 |
Michigan Hsg. Dev. Auth. Rental Hsg. Rev. Series B, 5.8% 4/1/19 | | 4,150,000 | | 4,235,781 |
Michigan Hsg. Dev. Auth. Single Family Mtg. Rev.: | | | | |
Series A, 5.15% 12/1/26 (AMBAC Insured) (c) | | 150,000 | | 150,422 |
Series C, 5.95% 12/1/14 | | 745,000 | | 755,780 |
Michigan Muni. Bond Auth. Rev.: | | | | |
(Local Govt. Ln. Prog.): | | | | |
Series A: | | | | |
0% 12/1/06 (FGIC Insured) | | 5,000,000 | | 4,700,400 |
0% 12/1/07 (FGIC Insured) | | 5,340,000 | | 4,837,186 |
4.75% 12/1/09 (FGIC Insured) | | 6,000,000 | | 6,016,140 |
Series CA: | | | | |
0% 6/15/07 (FSA Insured) | | 5,165,000 | | 4,757,843 |
0% 6/15/13 (FSA Insured) | | 3,850,000 | | 2,658,810 |
Series G, 0% 5/1/19 (AMBAC Insured) | | 1,865,000 | | 917,170 |
7.5% 11/1/09 (AMBAC Insured) | | 45,000 | | 45,198 |
Municipal Bonds - continued |
| Principal
Amount | | Value
(Note 1) |
Michigan - continued |
Michigan Muni. Bond Auth. Rev.: - continued | | | | |
Series C: | | | | |
5% 5/1/10 | | $ 5,500,000 | | $ 6,158,845 |
5% 5/1/11 | | 2,000,000 | | 2,243,160 |
5% 10/1/23 | | 5,000,000 | | 5,165,100 |
5.375% 10/1/19 | | 1,950,000 | | 2,154,087 |
Michigan Pub. Pwr. Agcy. Rev. (Belle River Proj.) Series A, 5.25% 1/1/09 (MBIA Insured) | | 2,000,000 | | 2,251,820 |
Michigan Strategic Fund Exempt Facilities Rev. (Waste Mgmt., Inc. Proj.) 4.2%, tender 8/1/04 (b)(c) | | 3,000,000 | | 3,041,100 |
Michigan Strategic Fund Ltd. Oblig. Rev. (Detroit Edison Co. Proj.): | | | | |
Series A, 5.55% 9/1/29 (MBIA Insured) (c) | | 1,000,000 | | 1,060,050 |
Series AA, 6.4% 9/1/25 (MBIA Insured) | | 5,000,000 | | 5,455,100 |
Series BB: | | | | |
7% 7/15/08 (MBIA Insured) | | 2,000,000 | | 2,374,620 |
7% 5/1/21 (AMBAC Insured) | | 8,500,000 | | 11,123,270 |
Michigan Strategic Fund Solid Waste Disp. Rev. (Waste Mgmt., Inc. Proj.) 4.2%, tender 12/1/05 (b)(c) | | 2,000,000 | | 2,080,960 |
Michigan Trunk Line: | | | | |
Series A: | | | | |
0% 10/1/11 (AMBAC Insured) | | 3,630,000 | | 2,747,801 |
5.5% 11/1/16 | | 3,000,000 | | 3,483,300 |
5.25% 10/1/16 (FSA Insured) | | 3,000,000 | | 3,335,760 |
Mona Shores School District School Bldg. & Site 6.75% 5/1/10 (FGIC Insured) | | 2,220,000 | | 2,708,822 |
Montague Pub. School District: | | | | |
5.5% 5/1/16 | | 1,005,000 | | 1,126,997 |
5.5% 5/1/17 | | 1,005,000 | | 1,123,379 |
5.5% 5/1/19 | | 1,090,000 | | 1,206,695 |
Morenci Area Schools 5.25% 5/1/21 (MBIA Insured) | | 1,410,000 | | 1,519,416 |
Mount Clemens Cmnty. School District: | | | | |
0% 5/1/17 (Pre-Refunded to 5/1/07 @ 50.5287) (d) | | 5,000,000 | | 2,347,200 |
5.5% 5/1/16 | | 1,000,000 | | 1,128,640 |
Muskegon County Wastewtr. Mgmt. Sys. #1 5% 7/1/06 (FSA Insured) (c) | | 1,000,000 | | 1,075,430 |
Muskegon Heights Wtr. Sys. Rev. Series 2000 A: | | | | |
5.625% 11/1/20 (MBIA Insured) | | 2,075,000 | | 2,312,422 |
5.625% 11/1/30 (MBIA Insured) | | 1,500,000 | | 1,614,420 |
Okemos Pub. School District: | | | | |
0% 5/1/12 (MBIA Insured) | | 2,500,000 | | 1,818,725 |
0% 5/1/13 (MBIA Insured) | | 1,700,000 | | 1,179,647 |
Municipal Bonds - continued |
| Principal
Amount | | Value
(Note 1) |
Michigan - continued |
Ovid-Elsie Area Schools Counties of Clinton, Shawassee, Saginaw and Gratiot 5% 5/1/18 | | $ 1,515,000 | | $ 1,615,399 |
Paw Paw Pub. School District 5.25% 5/1/25 | | 4,100,000 | | 4,296,595 |
Pinckney Cmnty. Schools Livingston & Washtenaw Counties: | | | | |
5.5% 5/1/10 (FGIC Insured) | | 2,175,000 | | 2,386,628 |
5.5% 5/1/11 (FGIC Insured) | | 2,350,000 | | 2,578,655 |
5.5% 5/1/14 (FGIC Insured) | | 3,075,000 | | 3,374,198 |
Plainwell Cmnty. School District: | | | | |
5.5% 5/1/14 | | 1,000,000 | | 1,138,750 |
5.5% 5/1/16 | | 1,000,000 | | 1,133,900 |
Port Huron Area School District County of Saint Clair: | | | | |
0% 5/1/08 (Liquidity Facility Michigan School Bond Ln. Fund) | | 1,975,000 | | 1,749,021 |
5.25% 5/1/16 | | 1,175,000 | | 1,309,455 |
5.25% 5/1/17 | | 2,125,000 | | 2,352,970 |
5.25% 5/1/18 | | 2,175,000 | | 2,391,217 |
Reese Pub. Schools School District (School Bldg. & Site Proj.) 5.5% 5/1/30 (MBIA Insured) | | 2,140,000 | | 2,298,809 |
River Rouge School District 5% 5/1/19 (FGIC Insured) | | 7,690,000 | | 8,158,629 |
Rochester Cmnty. School District Series II, 5.5% 5/1/16 | | 1,125,000 | | 1,261,564 |
Romulus Cmnty. Schools Series I, 0% 5/1/06
(FSA Insured) | | 3,610,000 | | 3,447,947 |
Royal Oak Hosp. Fin. Auth. Hosp. Rev. (William Beaumont Hosp. Proj.): | | | | |
Series M, 5.25% 11/15/31 (MBIA Insured) | | 2,000,000 | | 2,080,960 |
5.5% 1/1/14 | | 4,000,000 | | 4,175,640 |
Saint Joseph School District 5.5% 5/1/18 | | 1,065,000 | | 1,188,146 |
South Haven Pub. Schools: | | | | |
5% 5/1/20 (FSA Insured) | | 1,450,000 | | 1,533,361 |
5% 5/1/21 (FSA Insured) | | 1,450,000 | | 1,523,080 |
5% 5/1/22 (FSA Insured) | | 1,350,000 | | 1,408,563 |
South Lyon Cmnty. Schools (School Bldg. and Site Prog.) 5.25% 5/1/15 (FGIC Insured) | | 1,000,000 | | 1,119,220 |
Southfield Library Bldg. Auth. 5.5% 5/1/21 (MBIA Insured) | | 1,425,000 | | 1,558,936 |
Southfield Pub. Schools Series A: | | | | |
5.25% 5/1/17 (Liquidity Facility Sumitomo Bank Lease Fin., Inc. (SBLF)) | | 1,025,000 | | 1,135,987 |
5.25% 5/1/18 (Liquidity Facility Sumitomo Bank Lease Fin., Inc. (SBLF)) | | 1,025,000 | | 1,127,551 |
5.25% 5/1/19 (Liquidity Facility Sumitomo Bank Lease Fin., Inc. (SBLF)) | | 1,025,000 | | 1,120,018 |
Municipal Bonds - continued |
| Principal
Amount | | Value
(Note 1) |
Michigan - continued |
Southfield Pub. Schools Series A: - continued | | | | |
5.25% 5/1/20 (Liquidity Facility Sumitomo Bank Lease Fin., Inc. (SBLF)) | | $ 1,025,000 | | $ 1,116,686 |
Standish Sterling Cmnty. Schools 5.15% 5/1/28
(FGIC Insured) | | 4,900,000 | | 4,992,267 |
Stockbridge Cmnty. Schools 5.625% 5/1/26 | | 1,400,000 | | 1,508,682 |
Sturgis Pub. School District 5.625% 5/1/30 | | 3,000,000 | | 3,267,660 |
Taylor City Bldg. Auth. County of Wayne Bldg. Auth. Pub. Facilities: | | | | |
5% 10/1/21 (MBIA Insured) | | 1,735,000 | | 1,825,671 |
5% 10/1/23 (MBIA Insured) | | 1,920,000 | | 1,998,624 |
Tecumseh Pub. Schools 5.5% 5/1/30 (FGIC Insured) | | 1,250,000 | | 1,333,438 |
Utica Cmnty. Schools: | | | | |
5.25% 5/1/15 | | 725,000 | | 818,670 |
5.375% 5/1/16 | | 2,250,000 | | 2,543,760 |
5.5% 5/1/17 | | 1,000,000 | | 1,134,420 |
Warren Consolidated School District 5.375% 5/1/16 (FSA Insured) | | 2,350,000 | | 2,617,148 |
Waverly Cmnty. School District: | | | | |
5.75% 5/1/14 (FGIC Insured) | | 1,000,000 | | 1,152,830 |
5.75% 5/1/16 (FGIC Insured) | | 1,000,000 | | 1,147,870 |
Wayne Charter County Arpt. Rev. (Detroit Metro. Wayne County Arpt. Proj.): | | | | |
Series A, 5.25% 12/1/12 (MBIA Insured) (c) | | 2,500,000 | | 2,692,300 |
Series C, 5.25% 12/1/13 (MBIA Insured) | | 2,000,000 | | 2,045,980 |
West Ottawa Pub. School District 5.25% 5/1/10 (FGIC Insured) | | 850,000 | | 945,804 |
Western Townships Utils. Auth. County of Wayne Swr. Disp. Sys. Series 2001, 5.25% 1/1/09 (MBIA Insured) | | 1,200,000 | | 1,351,092 |
Whitehall District Schools 5.5% 5/1/15 | | 1,000,000 | | 1,131,550 |
Willow Run Cmnty. Schools County of Washtenaw 5.5% 5/1/16 | | 1,630,000 | | 1,827,833 |
Woodhaven-Brownstown School District County of Wayne 5.375% 5/1/18 (FSA Insured) | | 1,875,000 | | 2,073,038 |
Wyandotte City School District 5.375% 5/1/20 | | 1,050,000 | | 1,152,281 |
Wyandotte Elec. Rev.: | | | | |
5.375% 10/1/14 (MBIA Insured) | | 3,485,000 | | 3,896,613 |
5.375% 10/1/15 (MBIA Insured) | | 1,670,000 | | 1,845,300 |
| | 551,099,054 |
Municipal Bonds - continued |
| Principal
Amount | | Value
(Note 1) |
Puerto Rico - 0.5% |
Puerto Rico Commonwealth Hwy. & Trans. Auth. Hwy. Rev. Series 1996 Y, 5% 7/1/36 (MBIA Insured) | | $ 2,500,000 | | $ 2,610,400 |
Puerto Rico Commonwealth Urban Renewal & Hsg. Corp. 7.875% 10/1/04 | | 290,000 | | 291,772 |
| | 2,902,172 |
TOTAL INVESTMENT PORTFOLIO - 98.7% (Cost $516,553,613) | | 554,001,226 |
NET OTHER ASSETS - 1.3% | | 7,393,014 |
NET ASSETS - 100% | $ 561,394,240 |
Legend |
(a) Security or a portion of the security purchased on a delayed delivery or when-issued basis. |
(b) The coupon rate shown on floating or adjustable rate securities represents the rate at period end. |
(c) Private activity obligations whose interest is subject to the federal alternative minimum tax for individuals. |
(d) Security collateralized by an amount sufficient to pay interest and principal. |
Other Information |
The distribution of municipal securities by revenue source, as a percentage of total net assets, is as follows: |
General Obligations | 45.4% |
Escrowed/Pre-Refunded | 13.6 |
Water & Sewer | 11.5 |
Health Care | 10.2 |
Electric Utilities | 5.0 |
Others* (individually less than 5%) | 14.3 |
| 100.0% |
*Includes net other assets |
Purchases and sales of securities, other than short-term securities, aggregated $130,168,817 and $146,641,231, respectively. |
Income Tax Information |
The fund hereby designates approximately $7,000 as a capital gain dividend for the purpose of the dividend paid deduction. |
During the fiscal year ended December 31, 2003, 100.00% of the fund's income dividends was free from federal income tax, and 2.21% of the fund's income dividends was subject to the federal alternative minimum tax (unaudited). The fund will notify shareholders in January 2004 of amounts for use in preparing 2003 income tax returns. |
See accompanying notes which are an integral part of the financial statements.
Annual Report
Spartan Michigan Municipal Income Fund
Financial Statements
Statement of Assets and Liabilities
| December 31, 2003 |
| | |
Assets | | |
Investment in securities, at value (cost $516,553,613) - See accompanying schedule | | $ 554,001,226 |
Cash | | 4,260,314 |
Receivable for fund shares sold | | 1,337,005 |
Interest receivable | | 6,181,561 |
Prepaid expenses | | 3,417 |
Other receivables | | 3,458 |
Total assets | | 565,786,981 |
| | |
Liabilities | | |
Payable for investments purchased on a delayed delivery basis | $ 3,152,730 | |
Payable for fund shares redeemed | 395,837 | |
Distributions payable | 587,232 | |
Accrued management fee | 175,580 | |
Other affiliated payables | 48,228 | |
Other payables and accrued expenses | 33,134 | |
Total liabilities | | 4,392,741 |
| | |
Net Assets | | $ 561,394,240 |
Net Assets consist of: | | |
Paid in capital | | $ 523,925,440 |
Undistributed net investment income | | 429,486 |
Accumulated undistributed net realized gain (loss) on investments | | (408,299) |
Net unrealized appreciation (depreciation) on investments | | 37,447,613 |
Net Assets, for 45,952,744 shares outstanding | | $ 561,394,240 |
Net Asset Value, offering price and redemption price per share ($561,394,240 ÷ 45,952,744 shares) | | $ 12.22 |
See accompanying notes which are an integral part of the financial statements.
Annual Report
Spartan Michigan Municipal Income Fund
Financial Statements - continued
Statement of Operations
| Year ended December 31, 2003 |
| | |
Investment Income | | |
Interest | | $ 26,987,065 |
| | |
Expenses | | |
Management fee | $ 2,174,246 | |
Transfer agent fees | 434,644 | |
Accounting fees and expenses | 170,600 | |
Non-interested trustees' compensation | 3,184 | |
Custodian fees and expenses | 9,754 | |
Registration fees | 20,469 | |
Audit | 53,194 | |
Legal | 6,086 | |
Miscellaneous | 1,379 | |
Total expenses before reductions | 2,873,556 | |
Expense reductions | (79,012) | 2,794,544 |
Net investment income (loss) | | 24,192,521 |
Realized and Unrealized Gain (Loss) Net realized gain (loss) on: | | |
Investment securities | 9,782,541 | |
Swap agreements | (310,149) | |
Total net realized gain (loss) | | 9,472,392 |
Change in net unrealized appreciation (depreciation) on investment securities | | (1,715,675) |
Net gain (loss) | | 7,756,717 |
Net increase (decrease) in net assets resulting from operations | | $ 31,949,238 |
See accompanying notes which are an integral part of the financial statements.
Annual Report
Statement of Changes in Net Assets
| Year ended
December 31,
2003 | Year ended
December 31,
2002 |
Increase (Decrease) in Net Assets | | |
Operations | | |
Net investment income (loss) | $ 24,192,521 | $ 24,393,366 |
Net realized gain (loss) | 9,472,392 | 4,397,145 |
Change in net unrealized appreciation (depreciation) | (1,715,675) | 21,665,043 |
Net increase (decrease) in net assets resulting
from operations | 31,949,238 | 50,455,554 |
Distributions to shareholders from net investment income | (24,202,901) | (24,298,896) |
Share transactions
Net proceeds from sales of shares | 83,885,105 | 118,270,456 |
Reinvestment of distributions | 16,889,514 | 16,612,108 |
Cost of shares redeemed | (119,376,217) | (94,336,208) |
Net increase (decrease) in net assets resulting from share transactions | (18,601,598) | 40,546,356 |
Redemption fees | 7,727 | 5,187 |
Total increase (decrease) in net assets | (10,847,534) | 66,708,201 |
| | |
Net Assets | | |
Beginning of period | 572,241,774 | 505,533,573 |
End of period (including undistributed net investment income of $429,486 and undistributed net investment income of $175,019, respectively) | $ 561,394,240 | $ 572,241,774 |
Other Information Shares | | |
Sold | 6,902,116 | 10,028,699 |
Issued in reinvestment of distributions | 1,391,625 | 1,405,928 |
Redeemed | (9,851,451) | (8,004,894) |
Net increase (decrease) | (1,557,710) | 3,429,733 |
See accompanying notes which are an integral part of the financial statements.
Annual Report
Financial Highlights
Years ended December 31, | 2003 | 2002 | 2001 | 2000 | 1999 |
Selected Per-Share Data | | | | | |
Net asset value,
beginning of period | $ 12.04 | $ 11.47 | $ 11.48 | $ 10.87 | $ 11.72 |
Income from Investment Operations | | | | | |
Net investment income (loss) | .513 B | .532 B | .552 B, D | .570 B | .551 |
Net realized and unrealized gain (loss) | .180 | .568 | (.010) D | .610 | (.850) |
Total from investment operations | .693 | 1.100 | .542 | 1.180 | (.299) |
Distributions from net investment income | (.513) | (.530) | (.552) | (.570) | (.551) |
Redemption fees added to paid
in capital | - B, E | - B, E | - B, E | - | - |
Net asset value, end of period | $ 12.22 | $ 12.04 | $ 11.47 | $ 11.48 | $ 10.87 |
Total Return A | 5.87% | 9.78% | 4.77% | 11.19% | (2.63)% |
Ratios to Average Net Assets C | | | | | |
Expenses before expense reductions | .50% | .50% | .50% | .51% | .52% |
Expenses net of voluntary waivers, if any | .50% | .50% | .50% | .51% | .52% |
Expenses net of all reductions | .49% | .48% | .44% | .45% | .52% |
Net investment income (loss) | 4.22% | 4.51% | 4.76% D | 5.17% | 4.86% |
Supplemental Data | | | | | |
Net assets, end of period
(000 omitted) | $ 561,394 | $ 572,242 | $ 505,534 | $ 458,910 | $ 425,130 |
Portfolio turnover rate | 23% | 17% | 19% | 18% | 19% |
A Total returns would have been lower had certain expenses not been reduced during the periods shown.
B Calculated based on average shares outstanding during the period.
C Expense ratios reflect operating expenses of the fund. Expenses before reductions do not reflect amounts reimbursed by the investment adviser or reductions from brokerage service arrangements or other expense offset arrangements and do not represent the amount paid by the fund during periods when reimbursements or reductions occur. Expenses net of any voluntary waivers reflect expenses after reimbursement by the investment adviser but prior to reductions from brokerage service arrangements or other expense offset arrangements. Expenses net of all reductions represent the net expenses paid by the fund.
D Effective January 1, 2001, the fund adopted the provisions of the AICPA Audit and Accounting Guide for Investment Companies and began amortizing premium and discount on all debt securities. Per-share data and ratios for periods prior to adoption have not been restated to reflect this change.
E Amount represents less than $.001 per share.
See accompanying notes which are an integral part of the financial statements.
Annual Report
Fidelity Michigan Municipal Money Market Fund
Investment Changes
Maturity Diversification |
Days | % of fund's
investments
12/31/03 | % of fund's
investments
6/30/03 | % of fund's
investments
12/31/02 |
0 - 30 | 81.2 | 89.3 | 84.5 |
31 - 90 | 1.9 | 4.2 | 3.7 |
91 - 180 | 2.6 | 4.9 | 2.3 |
181 - 397 | 14.3 | 1.6 | 9.5 |
Weighted Average Maturity |
| 12/31/03 | 6/30/03 | 12/31/02 |
Fidelity Michigan Municipal Money
Market Fund | 44 Days | 19 Days | 34 Days |
All Tax-Free Money Market
Funds Average* | 45 Days | 44 Days | 40 Days |
Asset Allocation (% of fund's net assets) |
As of December 31, 2003 | As of June 30, 2003 |
| Variable Rate
Demand Notes
(VRDNs) 79.5% | | | Variable Rate
Demand Notes
(VRDNs) 84.3% | |
 | Commercial Paper (including
CP Mode) 3.3% | | | Commercial Paper (including
CP Mode) 1.0% | |
 | Tender Bonds 7.5% | | | Tender Bonds 3.3% | |
 | Municipal Notes 3.8% | | | Municipal Notes 2.5% | |
 | Fidelity Municipal
Cash Central Fund 0.7% | | | Fidelity Municipal
Cash Central Fund 2.3% | |
 | Other Investments 4.7% | | | Other Investments 5.4% | |
| Net Other Assets 0.5% | | | Net Other Assets 1.2% | |

Current and Historical Seven-Day Yields
| 12/29/03 | 9/29/03 | 6/30/03 | 3/31/03 | 12/30/02 |
Fidelity Michigan Municipal Money Market Fund | 0.68% | 0.58% | 0.56% | 0.71% | 1.03% |
Yield refers to the income paid by the fund over a given period. Yields for money market funds are usually for seven-day periods, as they are here, though they are expressed as annual percentage rates. Past performance is no guarantee of future results. Yield will vary and it is possible to lose money by investing in the fund.
*Source: iMoneyNet, Inc.
Annual Report
Fidelity Michigan Municipal Money Market Fund
Investments December 31, 2003
Showing Percentage of Net Assets
Municipal Securities - 99.5% |
| Principal
Amount | | Value
(Note 1) |
Michigan - 97.9% |
Allen Park Pub. School District Participating VRDN
Series ROC II R4007, 1.3% (Liquidity Facility Citigroup Global Markets Hldgs., Inc.) (a)(e) | $ 5,165,000 | | $ 5,165,000 |
Charlotte Hosp. Fin. Auth. Ltd. Oblig. Rev. (Hayes Green Beach Proj.) 1.31%, LOC Fifth Third Bank, Cincinnati, VRDN (a) | 7,675,000 | | 7,675,000 |
Clinton Econ. Dev. Corp. Rev. (Clinton Area Care Ctr. Proj.) 1.33%, LOC Northern Trust Co., Chicago, VRDN (a) | 5,305,000 | | 5,305,000 |
Detroit City School District Participating VRDN: | | | |
ROC II R1033, 1.3% (Liquidity Facility Citigroup Global Markets Hldgs., Inc.) (a)(e) | 3,700,000 | | 3,700,000 |
Series PT 1805, 1.3% (Liquidity Facility WestLB AG) (a)(e) | 1,095,000 | | 1,095,000 |
Series Putters 326, 1.29% (Liquidity Facility JPMorgan Chase Bank) (a)(e) | 5,090,000 | | 5,090,000 |
Series ROC II R4004, 1.3% (Liquidity Facility Citigroup Global Markets Hldgs., Inc.) (a)(e) | 5,790,000 | | 5,790,000 |
Detroit Econ. Dev. Corp. Resource Recovery Rev. Participating VRDN Series Merlots 01 A90, 1.26% (Liquidity Facility Wachovia Bank NA) (a)(d)(e) | 2,500,000 | | 2,500,000 |
Detroit Swr. Disp. Rev.: | | | |
Bonds: | | | |
Series 2001 E, 1.05%, tender 9/2/04 (FGIC Insured) (a) | 10,000,000 | | 10,000,000 |
Series 2003 A, 3% 7/1/04 (FSA Insured) | 16,560,000 | | 16,724,932 |
Participating VRDN: | | | |
Series 2002 G, 1.31% (Liquidity Facility Bank of America NA) (a)(e) | 8,520,000 | | 8,520,000 |
Series Merlots 00 I, 1.21% (Liquidity Facility Wachovia Bank NA) (a)(e) | 9,300,000 | | 9,300,000 |
Series Merlots 01 A103, 1.21% (Liquidity Facility Wachovia Bank NA) (a)(e) | 10,020,000 | | 10,020,000 |
Series Merlots 01 A112, 1.21% (Liquidity Facility Wachovia Bank NA) (a)(e) | 5,135,000 | | 5,135,000 |
Series Merlots B41, 1.21% (Liquidity Facility Wachovia Bank NA) (a)(e) | 2,265,000 | | 2,265,000 |
Series PA 1183, 1.28% (Liquidity Facility Merrill Lynch & Co., Inc.) (a)(e) | 6,000,000 | | 6,000,000 |
Series SGB 47, 1.3% (Liquidity Facility Societe Generale) (a)(e) | 5,800,000 | | 5,800,000 |
Detroit Wtr. Supply Sys. Rev.: | | | |
Bonds Series Putters 345, 1%, tender 7/15/04 (Liquidity Facility JPMorgan Chase Bank) (a)(e)(f) | 8,495,000 | | 8,495,000 |
Participating VRDN: | | | |
Series Merlots 00 D, 1.21% (Liquidity Facility Wachovia Bank NA) (a)(e) | 4,500,000 | | 4,500,000 |
Municipal Securities - continued |
| Principal
Amount | | Value
(Note 1) |
Michigan - continued |
Detroit Wtr. Supply Sys. Rev.: - continued | | | |
Participating VRDN: | | | |
Series MS 782, 1.29% (Liquidity Facility Morgan Stanley) (a)(e) | $ 4,000,000 | | $ 4,000,000 |
Series PA 1151, 1.28% (Liquidity Facility Merrill Lynch & Co., Inc.) (a)(e) | 5,800,000 | | 5,800,000 |
Series Putters 200, 1.29% (Liquidity Facility JPMorgan Chase Bank) (a)(e) | 5,370,000 | | 5,370,000 |
Series SG 64, 1.28% (Liquidity Facility Societe Generale) (a)(e) | 3,500,000 | | 3,500,000 |
Series SGB 6, 1.3% (Liquidity Facility Societe Generale) (a)(e) | 7,570,000 | | 7,570,000 |
Detroit Wtr. Sys. Rev. Participating VRDN Series EGL 99 2202, 1.3% (Liquidity Facility Citibank NA, New York) (a)(e) | 8,200,000 | | 8,200,000 |
East Lansing School District Participating VRDN Series SGA 114, 1.17% (Liquidity Facility Societe Generale) (a)(e) | 6,000,000 | | 6,000,000 |
Genesee County Econ. Dev. Corp. (Creative Foam Corp. Proj.) Series 1994, 1.55%, LOC Bank One NA, Chicago, VRDN (a)(d) | 1,400,000 | | 1,400,000 |
Hartland Consolidated School District Participating VRDN Series MSTC 01 127 Class A, 1.17% (Liquidity Facility Bear Stearns Companies, Inc.) (a)(e) | 6,655,000 | | 6,655,000 |
Holland Charter Township Econ. Dev. Corp. Rev. (Chicago Mission Proj.) 1.25%, LOC Comerica Bank, Detroit, VRDN (a)(d) | 2,500,000 | | 2,500,000 |
Jackson Pub. Schools RAN 2% 5/21/04,
LOC Comerica Bank, Detroit | 1,050,000 | | 1,053,937 |
Kentwood Pub. Schools Participating VRDN Series EGL 03 24, 1.3% (Liquidity Facility Citibank NA, New York) (a)(e) | 3,195,000 | | 3,195,000 |
Michigan Bldg. Auth. Rev.: | | | |
Bonds: | | | |
(Facilities Prog.) Series I, 5% 10/15/04 | 2,535,000 | | 2,612,261 |
Series MS 886, 1.25%, tender 12/16/04 (Liquidity Facility Morgan Stanley) (a)(e) | 1,700,000 | | 1,700,000 |
Participating VRDN: | | | |
Series AAB 02 35, 1.19% (Liquidity Facility ABN-AMRO Bank NV) (a)(e) | 5,600,000 | | 5,600,000 |
Series AAB 03 35, 1.28% (Liquidity Facility ABN-AMRO Bank NV) (a)(e) | 5,900,000 | | 5,900,000 |
Series EGL 01 2202, 1.3% (Liquidity Facility Citibank NA, New York) (a)(e) | 3,000,000 | | 3,000,000 |
Series MS 00 481X, 1.29% (Liquidity Facility Morgan Stanley) (a)(e) | 9,670,000 | | 9,670,000 |
Series PT 1938, 1.28% (Liquidity Facility Merrill Lynch & Co., Inc.) (a)(e) | 5,550,000 | | 5,550,000 |
Municipal Securities - continued |
| Principal
Amount | | Value
(Note 1) |
Michigan - continued |
Michigan Bldg. Auth. Rev.: - continued | | | |
Participating VRDN: | | | |
Series PT 2051, 1.28% (Liquidity Facility Merrill Lynch & Co., Inc.) (a)(e) | $ 4,215,000 | | $ 4,215,000 |
Series ROC II R2064, 1.3% (Liquidity Facility Citigroup Global Markets Hldgs., Inc.) (a)(e) | 2,765,000 | | 2,765,000 |
Series ROC II R4057, 1.3% (Liquidity Facility Citigroup Global Markets Hldgs., Inc.) (a)(e) | 2,220,000 | | 2,220,000 |
Series 4, 1.05% 2/12/04, LOC Bank of New York NA, LOC State Street Bank & Trust Co., Boston, CP | 10,000,000 | | 10,000,000 |
Michigan Gen. Oblig.: | | | |
Bonds Series 2003 D: | | | |
1% tender 5/4/04, CP mode | 2,000,000 | | 2,000,000 |
1.03% tender 5/4/04, CP mode | 3,250,000 | | 3,250,000 |
Participating VRDN Series Putters 125, 1.29% (Liquidity Facility J.P. Morgan Chase & Co.) (a)(e) | 9,225,000 | | 9,225,000 |
Michigan Higher Ed. Student Ln. Auth. Rev.: | | | |
Participating VRDN Series PA 1064, 1.33% (Liquidity Facility Merrill Lynch & Co., Inc.) (a)(d)(e) | 7,420,000 | | 7,420,000 |
1.15% (AMBAC Insured), VRDN (a)(d) | 4,000,000 | | 4,000,000 |
Michigan Hosp. Fin. Auth. Hosp. Rev.: | | | |
Bonds (Ascension Health Cr. Group Proj.) Series 1999 B1, 5.05%, tender 11/15/04 (a) | 6,000,000 | | 6,201,050 |
(Health Care Equip. Ln. Prog.): | | | |
Series 2003 C, 1.29%, LOC Fifth Third Bank, Cincinnati, VRDN (a) | 11,600,000 | | 11,600,000 |
Series B, 1.29%, LOC Standard Fed. Bank, VRDN (a) | 6,000,000 | | 6,000,000 |
(Holland Cmnty. Hosp. Proj.) 1.3%, LOC Fifth Third Bank, Cincinnati, VRDN (a) | 3,750,000 | | 3,750,000 |
(United Memorial Hosp. Assoc. Proj.) Series 1999, 1.3%, LOC Fifth Third Bank, Cincinnati, VRDN (a)(d) | 5,900,000 | | 5,900,000 |
Series C, 1.29%, LOC Fifth Third Bank, Cincinnati, VRDN (a) | 5,900,000 | | 5,900,000 |
Michigan Hosp. Fin. Auth. Rev.: | | | |
Series 2002 B, 1.29%, LOC Standard Fed. Bank, VRDN (a) | 2,300,000 | | 2,300,000 |
Series B, 1.29%, LOC Standard Fed. Bank, VRDN (a) | 5,200,000 | | 5,200,000 |
Michigan Hsg. Dev. Auth. Multi-family Hsg. Rev.: | | | |
Bonds Series 1988 A: | | | |
0.95% tender 1/5/04, LOC Landesbank Hessen-Thuringen, CP mode (d) | 2,800,000 | | 2,800,000 |
1.01% tender 2/3/04, LOC Landesbank Hessen-Thuringen, CP mode (d) | 1,000,000 | | 1,000,000 |
(Hunt Club Apts. Proj.) 1.4%, LOC Comerica Bank, Detroit, VRDN (a)(d) | 6,000,000 | | 6,000,000 |
Municipal Securities - continued |
| Principal
Amount | | Value
(Note 1) |
Michigan - continued |
Michigan Hsg. Dev. Auth. Single Family Mtg. Rev.: | | | |
Bonds: | | | |
Series 2003 A, 1.08%, tender 6/1/04 (a)(d) | $ 5,700,000 | | $ 5,700,000 |
Series 2003 C, 1.22%, tender 11/24/04 (FSA Insured) (a)(d) | 3,000,000 | | 3,000,000 |
Participating VRDN Series PT 01 556, 1.33% (Liquidity Facility Landesbank Hessen-Thuringen) (a)(d)(e) | 3,630,000 | | 3,630,000 |
Michigan Muni. Bond Auth. Rev.: | | | |
Participating VRDN: | | | |
Series EGL 00 2201, 1.3% (Liquidity Facility Citibank NA, New York) (a)(e) | 9,500,000 | | 9,500,000 |
Series MS 718, 1.29% (Liquidity Facility Morgan Stanley) (a)(e) | 12,994,000 | | 12,994,000 |
Series MSTC 02 204, 1.17% (Liquidity Facility Bear Stearns Companies, Inc.) (a)(e) | 10,395,000 | | 10,395,000 |
RAN: | | | |
Series 2003 B1, 2% 8/20/04 | 8,845,000 | | 8,900,097 |
Series 2003 B2, 2% 8/23/04, LOC JPMorgan Chase Bank | 12,115,000 | | 12,188,852 |
Michigan Pub. Pwr. Agcy. Rev. Participating VRDN Series PT 1769, 1.28% (Liquidity Facility Merrill Lynch & Co., Inc.) (a)(e) | 3,210,000 | | 3,210,000 |
Michigan Strategic Fund Indl. Dev. Rev. (Althaus Family Investors II Proj.) Series 1997, 1.43%, LOC Huntington Nat'l. Bank, Columbus, VRDN (a) | 2,100,000 | | 2,100,000 |
Michigan Strategic Fund Ltd. Oblig. Rev.: | | | |
Participating VRDN Series MS 00 382, 1.29% (Liquidity Facility Morgan Stanley) (a)(e) | 2,000,000 | | 2,000,000 |
(BC&C Proj.) 1.45%, LOC Comerica Bank, Detroit, VRDN (a)(d) | 1,680,000 | | 1,680,000 |
(Bico Michigan, Inc. Proj.) Series 1999, 1.4%, LOC Bank One NA, VRDN (a)(d) | 3,400,000 | | 3,400,000 |
(Biewer of Lansing LLC Proj.) Series 1999, 1.45%, LOC Standard Fed. Bank, VRDN (a)(d) | 1,430,000 | | 1,430,000 |
(Bosal Ind. Proj.) Series 1998, 1.2%, LOC Bank of New York NA, VRDN (a)(d) | 7,500,000 | | 7,500,000 |
(CJS Properties LLC Proj.) 1.55%, LOC Bank One NA, Chicago, VRDN (a)(d) | 2,000,000 | | 2,000,000 |
(Conti Properties LLC Proj.) Series 1997, 1.45%, LOC Comerica Bank, Detroit, VRDN (a)(d) | 2,740,000 | | 2,740,000 |
(Creative Foam Corp. Proj.) 1.4%, LOC Bank One NA, Chicago, VRDN (a)(d) | 1,200,000 | | 1,200,000 |
(Doss Ind. Dev. Co. Proj.) 1.55%, LOC Bank One NA, Chicago, VRDN (a)(d) | 2,500,000 | | 2,500,000 |
Municipal Securities - continued |
| Principal
Amount | | Value
(Note 1) |
Michigan - continued |
Michigan Strategic Fund Ltd. Oblig. Rev.: - continued | | | |
(Fintex LLC Proj.) Series 2000, 1.45%, LOC Comerica Bank, Detroit, VRDN (a)(d) | $ 2,330,000 | | $ 2,330,000 |
(Future Fence Co. Proj.) 1.45%, LOC Comerica Bank, Detroit, VRDN (a)(d) | 2,500,000 | | 2,500,000 |
(Grandview Plaza Riverview Assoc. One LP Proj.) 1.45%, LOC Nat'l. City Bank, VRDN (a)(d) | 1,910,000 | | 1,910,000 |
(HP Pelzer Automotive Sys. Sterling Heights Proj.) 1.25%, LOC Bank One NA, Chicago, VRDN (a)(d) | 2,250,000 | | 2,250,000 |
(John H. Dekker & Sons Proj.) Series 1998, 1.43%, LOC Standard Fed. Bank, VRDN (a)(d) | 1,200,000 | | 1,200,000 |
(K&M Engineering, Inc. Proj.) 1.45%, LOC Comerica Bank, Detroit, VRDN (a)(d) | 1,860,000 | | 1,860,000 |
(LPB LLC Proj.) 1.4%, LOC Comerica Bank, Detroit, VRDN (a)(d) | 3,100,000 | | 3,100,000 |
(Majestic Ind., Inc. Proj.) 1.45%, LOC Comerica Bank, Detroit, VRDN (a)(d) | 2,535,000 | | 2,535,000 |
(Mans Proj.) Series 1998, 1.45%, LOC Comerica Bank, Detroit, VRDN (a)(d) | 2,260,000 | | 2,260,000 |
(Mid-American Products, Inc. Proj.) Series 1998 1.44%, LOC Standard Fed. Bank, VRDN (a)(d) | 2,145,000 | | 2,145,000 |
(PBL Enterprises, Inc. Proj.) Series 1997, 1.45%, LOC Comerica Bank, Detroit, VRDN (a)(d) | 2,470,000 | | 2,470,000 |
(Pioneer Laboratories, Inc. Proj.) 1.4%, LOC Bank One NA, Chicago, VRDN (a)(d) | 1,400,000 | | 1,400,000 |
(Republic Svcs., Inc. Proj.) 1.4%, LOC Bank of America NA, VRDN (a)(d) | 11,485,000 | | 11,485,000 |
(S&S LLC Proj.) Series 2000, 1.48%, LOC Standard Fed. Bank, VRDN (a)(d) | 3,400,000 | | 3,400,000 |
(TEI Invts. LLC Proj.) Series 1997, 1.45%, LOC Comerica Bank, Detroit, VRDN (a)(d) | 600,000 | | 600,000 |
(Temperance Enterprise Proj.) Series 1996, 1.45%, LOC Nat'l. City Bank, VRDN (a)(d) | 2,480,000 | | 2,480,000 |
(Templeton Properties LLC Proj.) Series 2000, 1.55%, LOC Bank One NA, Chicago, VRDN (a)(d) | 1,800,000 | | 1,800,000 |
(The Monarch Press, Inc. Proj.) Series 2000, 1.45%, LOC Comerica Bank, Detroit, VRDN (a)(d) | 1,940,000 | | 1,940,000 |
(The Spiratex Co. Proj.) Series 1994, 1.55%, LOC Bank One NA, Chicago, VRDN (a)(d) | 1,200,000 | | 1,200,000 |
(Trilan LLC Proj.) 1.4%, LOC Bank One NA, Chicago, VRDN (a)(d) | 3,700,000 | | 3,700,000 |
(Unified-Boring Co., Inc. Proj.) Series 1992, 1.55%, LOC Bank One NA, Chicago, VRDN (a)(d) | 800,000 | | 800,000 |
Municipal Securities - continued |
| Principal
Amount | | Value
(Note 1) |
Michigan - continued |
Michigan Strategic Fund Ltd. Oblig. Rev.: - continued | | | |
(Vent-Rite Valve Corp. Proj.) 1.3%, LOC Fleet Nat'l. Bank, VRDN (a)(d) | $ 920,000 | | $ 920,000 |
(W.H. Porter, Inc. Proj.) Series 2001, 1.45%, LOC Comerica Bank, Detroit, VRDN (a)(d) | 3,550,000 | | 3,550,000 |
(Whitehall Products LLC Proj.) Series 2000, 1.35%, LOC Lasalle Bank NA, VRDN (a)(d) | 2,515,000 | | 2,515,000 |
(Windcrest Properties LLC Proj.) 1.45%, LOC Comerica Bank, Detroit, VRDN (a)(d) | 4,600,000 | | 4,600,000 |
(YMCA Metro. Detroit Proj.) Series 2001, 1.35%, LOC Bank One NA, Chicago, VRDN (a) | 13,000,000 | | 13,000,000 |
Michigan Strategic Fund Poll. Cont. Rev. (Gen. Motors Corp. Proj.): | | | |
Series 1988 A, 1.6%, VRDN (a) | 2,600,000 | | 2,600,000 |
1.75%, VRDN (a) | 2,700,000 | | 2,700,000 |
Michigan Strategic Fund Solid Waste Disp. Rev. (Great Lakes Recovery Proj.) 1.25%, LOC Bank One NA, Chicago, VRDN (a)(d) | 1,100,000 | | 1,100,000 |
Michigan Trunk Line Bonds 4% 10/1/04 | 5,000,000 | | 5,106,869 |
Oakland County Econ. Dev. Corp. Ltd. Oblig. Rev. (Osmic, Inc. Proj.) Series 2001 A, 1.4%, LOC Bank One NA, Chicago, VRDN (a)(d) | 6,300,000 | | 6,300,000 |
Rockford Pub. Schools Participating VRDN Series MS 01 589, 1.29% (Liquidity Facility Morgan Stanley) (a)(e) | 2,135,000 | | 2,135,000 |
Saint Clair County Econ. Dev. Corp. Poll. Cont. Rev. Bonds Series MS 00 282, 1.1%, tender 8/5/04 (Liquidity Facility Morgan Stanley) (a)(e)(f) | 8,895,000 | | 8,895,000 |
Sanilac County Econ. Dev. Corp. (Marlette Cmnty. Hosp. Proj.) Series 2001, 1.33%, LOC Bank One NA, Chicago, VRDN (a) | 12,865,000 | | 12,865,000 |
Sterling Heights Econ. Dev. Corp. Ltd. Oblig. Rev. (Cherrywood Ctr. Assoc. Proj.) 1.35%, LOC Comerica Bank, Detroit, VRDN (a)(d) | 2,400,000 | | 2,400,000 |
Van Buren Township Local Dev. Fin. Auth. Participating VRDN Series ROC 4518, 1.3% (Liquidity Facility Citigroup Global Markets Hldgs., Inc.) (a)(e) | 7,730,000 | | 7,730,000 |
Washtenaw Cmnty. College Bonds 2% 4/1/04 | 2,120,000 | | 2,125,647 |
Wayne-Westland Cmnty. Schools Participating VRDN: | | | |
Series MS 98 56, 1.29% (Liquidity Facility Morgan Stanley) (a)(e) | 7,465,000 | | 7,465,000 |
Series MS 98 67, 1.29% (Liquidity Facility Morgan Stanley) (a)(e) | 11,895,000 | | 11,895,000 |
Municipal Securities - continued |
| Principal
Amount | | Value
(Note 1) |
Michigan - continued |
Western Townships Utils. Auth. County of Wayne Swr. Disp. Sys. Participating VRDN Series Merlots A96, 1.21% (Liquidity Facility Wachovia Bank NA) (a)(e) | $ 5,700,000 | | $ 5,700,000 |
Whitmore Lake Pub. School District Participating VRDN Series ROC 4515, 1.3% (Liquidity Facility Citigroup Global Markets Hldgs., Inc.) (a)(e) | 3,915,000 | | 3,915,000 |
Woodhaven-Brownstown School District County of Wayne Bonds 4.5% 5/1/04 (Michigan Gen. Oblig. Guaranteed) | 1,180,000 | | 1,193,609 |
Zeeland Hosp. Fin. Auth. Rev. (Zeeland Cmnty. Hosp. Proj.) Series 1999, 1.33%, LOC Huntington Nat'l. Bank, Columbus, VRDN (a) | 3,345,000 | | 3,345,000 |
| | 575,591,254 |
New York - 0.9% |
Bank of New York Muni. Ctfs. trust various states Participating VRDN Series BNY 02 3, 1.3% (Liquidity Facility Bank of New York NA) (a)(d)(e) | 5,500,000 | | 5,500,000 |
| Shares | | |
Other - 0.7% |
Fidelity Municipal Cash Central Fund, 1.3% (b)(c) | 4,193,500 | | 4,193,500 |
TOTAL INVESTMENT PORTFOLIO - 99.5% | | 585,284,754 |
NET OTHER ASSETS - 0.5% | | 3,007,684 |
NET ASSETS - 100% | $ 588,292,438 |
Total Cost for Income Tax Purposes $ 585,284,754 |
Security Type Abbreviations |
CP - COMMERCIAL PAPER |
RAN - REVENUE ANTICIPATION NOTE |
VRDN - VARIABLE RATE DEMAND NOTE |
Legend |
(a) The coupon rate shown on floating or adjustable rate securities represents the rate at period end. |
(b) Information in this report regarding holdings by state and security types does not reflect the holdings of the Fidelity Municipal Cash Central Fund. |
(c) The rate quoted is the annualized seven-day yield of the fund at period end. A complete listing of the fund's holdings as of its most recent fiscal year end is available upon request. |
(d) Private activity obligations whose interest is subject to the federal alternative minimum tax for individuals. |
(e) Provides evidence of ownership in one or more underlying municipal bonds. |
(f) Restricted securities - Investment in securities not registered under the Securities Act of 1933 (excluding 144A issues) . At the end of the period, the value of restricted securities (excluding 144A issues) amounted to $17,390,000 or 3.0% of net assets. |
Additional information on each holding is as follows: |
Security | Acquisition Date | Cost |
Detroit Wtr. Supply Sys. Rev. Bonds Series Putters 345, 1%, tender 7/15/04 (Liquidity Facility JPMorgan Chase Bank) | 4/2/03 - 7/17/03 | $ 8,495,000 |
Saint Clair County Econ. Dev. Corp. Poll. Cont. Rev. Bonds Series MS 00 282, 1.1%, tender 8/5/04 (Liquidity Facility Morgan Stanley) | 12/28/00 - 3/4/02 | $ 8,895,000 |
Income Tax Information |
The fund hereby designates approximately $81,000 as a capital gain dividend for the purpose of the dividend paid deduction. |
During the fiscal year ended December 31, 2003, 100.00% of the fund's income dividends was free from federal income tax, and 34.78% of the fund's income dividends was subject to the federal alternative minimum tax (unaudited). The fund will notify shareholders in January 2004 of amounts for use in preparing 2003 income tax returns. |
See accompanying notes which are an integral part of the financial statements.
Annual Report
Fidelity Michigan Municipal Money Market Fund
Financial Statements
Statement of Assets and Liabilities
| December 31, 2003 |
| | |
Assets | | |
Investment in securities, at value - See accompanying schedule | | $ 585,284,754 |
Cash | | 3,144,049 |
Receivable for fund shares sold | | 6,768,112 |
Interest receivable | | 1,831,296 |
Prepaid expenses | | 3,492 |
Other receivables | | 744 |
Total assets | | 597,032,447 |
| | |
Liabilities | | |
Payable for fund shares redeemed | $ 8,423,655 | |
Distributions payable | 28,234 | |
Accrued management fee | 185,071 | |
Other affiliated payables | 78,266 | |
Other payables and accrued expenses | 24,783 | |
Total liabilities | | 8,740,009 |
| | |
Net Assets | | $ 588,292,438 |
Net Assets consist of: | | |
Paid in capital | | $ 588,148,277 |
Accumulated net realized gain (loss) on investments | | 144,161 |
Net Assets, for 587,913,984 shares outstanding | | $ 588,292,438 |
Net Asset Value, offering price and redemption price per share ($588,292,438 ÷ 587,913,984 shares) | | $ 1.00 |
See accompanying notes which are an integral part of the financial statements.
Annual Report
Fidelity Michigan Municipal Money Market Fund
Financial Statements - continued
Statement of Operations
| Year ended December 31, 2003 |
| | |
Investment Income | | |
Interest | | $ 6,756,715 |
| | |
Expenses | | |
Management fee | $ 2,219,966 | |
Transfer agent fees | 836,095 | |
Accounting fees and expenses | 102,666 | |
Non-interested trustees' compensation | 2,880 | |
Custodian fees and expenses | 9,706 | |
Registration fees | 28,377 | |
Audit | 42,235 | |
Legal | 7,677 | |
Miscellaneous | 1,286 | |
Total expenses before reductions | 3,250,888 | |
Expense reductions | (59,527) | 3,191,361 |
Net investment income | | 3,565,354 |
Net realized gain (loss) on investment securities | | 144,635 |
Net increase in net assets resulting from operations | | $ 3,709,989 |
See accompanying notes which are an integral part of the financial statements.
Annual Report
Statement of Changes in Net Assets
| Year ended
December 31,
2003 | Year ended
December 31,
2002 |
Increase (Decrease) in Net Assets | | |
Operations | | |
Net investment income | $ 3,565,354 | $ 5,555,106 |
Net realized gain (loss) | 144,635 | 144,397 |
Net increase (decrease) in net assets resulting
from operations | 3,709,989 | 5,699,503 |
Distributions to shareholders from net investment income | (3,565,354) | (5,555,106) |
Distributions to shareholders from net realized gain | (115,393) | - |
Total distributions | (3,680,747) | (5,555,106) |
Share transactions at net asset value of $1.00 per share
Proceeds from sales of shares | 1,271,889,015 | 1,087,578,173 |
Reinvestment of distributions | 3,578,138 | 5,440,926 |
Cost of shares redeemed | (1,255,965,674) | (1,066,418,797) |
Net increase (decrease) in net assets and shares resulting from share transactions | 19,501,479 | 26,600,302 |
Total increase (decrease) in net assets | 19,530,721 | 26,744,699 |
| | |
Net Assets | | |
Beginning of period | 568,761,717 | 542,017,018 |
End of period | $ 588,292,438 | $ 568,761,717 |
See accompanying notes which are an integral part of the financial statements.
Annual Report
Financial Highlights
Years ended December 31, | 2003 | 2002 | 2001 | 2000 | 1999 |
Selected Per-Share Data | | | | | |
Net asset value,
beginning of period | $ 1.00 | $ 1.00 | $ 1.00 | $ 1.00 | $ 1.00 |
Income from Investment Operations | | | | | |
Net investment income | .006 | .010 | .023 | .036 | .028 |
Net realized and unrealized gain (loss) | - C | - | - | - | - |
Total from investment operations | .006 | .010 | .023 | .036 | .028 |
Distributions from net investment income | (.006) | (.010) | (.023) | (.036) | (.028) |
Distributions from net realized gain | - C | - | - | - | - |
Total distributions | (.006) | (.010) | (.023) | (.036) | (.028) |
Net asset value, end of period | $ 1.00 | $ 1.00 | $ 1.00 | $ 1.00 | $ 1.00 |
Total Return A | .63% | 1.03% | 2.35% | 3.69% | 2.82% |
Ratios to Average Net Assets B | | | | | |
Expenses before expense reductions | .56% | .56% | .56% | .57% | .58% |
Expenses net of voluntary waivers, if any | .56% | .56% | .56% | .57% | .58% |
Expenses net of all reductions | .55% | .52% | .52% | .57% | .58% |
Net investment income | .61% | 1.02% | 2.32% | 3.63% | 2.80% |
Supplemental Data | | | | | |
Net assets, end of period
(000 omitted) | $ 588,292 | $ 568,762 | $ 542,017 | $ 507,223 | $ 444,679 |
A Total returns would have been lower had certain expenses not been reduced during the periods shown.
B Expense ratios reflect operating expenses of the fund. Expenses before reductions do not reflect amounts reimbursed by the investment adviser or reductions from brokerage service arrangements or other expense offset arrangements and do not represent the amount paid by the fund during periods when reimbursements or reductions occur. Expenses net of any voluntary waivers reflect expenses after reimbursement by the investment adviser but prior to reductions from brokerage service arrangements or other expense offset arrangements. Expenses net of all reductions represent the net expenses paid by the fund.
C Amount represents less than $.001 per share.
See accompanying notes which are an integral part of the financial statements.
Annual Report
Notes to Financial Statements
For the period ended December 31, 2003
1. Significant Accounting Policies.
Spartan Michigan Municipal Income Fund (the income fund) is a fund of Fidelity Municipal Trust. Fidelity Michigan Municipal Money Market Fund (the money market fund) is a fund of Fidelity Municipal Trust II. Each trust is registered under the Investment Company Act of 1940, as amended (the 1940 Act), as an open-end management investment company. Fidelity Municipal Trust and Fidelity Municipal Trust II (the trusts) are organized as a Massachusetts business trust and a Delaware statutory trust, respectively. Each fund is authorized to issue an unlimited number of shares. Each fund may be affected by economic and political developments in the state of Michigan. The financial statements have been prepared in conformity with accounting principles generally accepted in the United States of America, which require management to make certain estimates and assumptions at the date of the financial statements. The following summarizes the significant accounting policies of the income fund and the money market fund:
Security Valuation. Net asset value per share (NAV calculation) is calculated as of the close of business of the New York Stock Exchange, normally 4:00 p.m. Eastern time. Debt securities are valued on the basis of information provided by a pricing service. Pricing services use valuation matrices that incorporate both dealer-supplied valuations and valuation models. If an event that is expected to materially affect the value of a security occurs after the close of an exchange or market on which that security trades, but prior to the NAV calculation, then that security will be fair valued taking the event into account. Securities (including restricted securities) for which market quotations are not readily available are valued at their fair value as determined in good faith under consistently applied procedures under the general supervision of the Board of Trustees. Price movements in futures contracts and ADRs, market and trading trends, the bid/ask quotes of brokers and off-exchange institutional trading may be reviewed in the course of making a good faith determination of a security's fair value. Short-term securities with remaining maturities of sixty days or less for which quotations are not readily available are valued on the basis of amortized cost. Investments in open-end investment companies are valued at their net asset value each business day.
As permitted under Rule 2a-7 of the 1940 Act, and certain conditions therein, securities owned by the money market fund are valued initially at cost and thereafter assume a constant amortization to maturity of any discount or premium.
Investment Transactions and Income. Security transactions are accounted for as of trade date. Gains and losses on securities sold are determined on the basis of identified cost. Interest income is accrued as earned. Interest income includes coupon interest and amortization of premium and accretion of discount on debt securities, which is accrued using the interest method.
Annual Report
Notes to Financial Statements - continued
Expenses. Most expenses of each trust can be directly attributed to a fund. Expenses which cannot be directly attributed are apportioned among the funds in the trust.
Annual Report
1. Significant Accounting Policies - continued
Income Tax Information and Distributions to Shareholders. Each year, each fund intends to qualify as a regulated investment company by distributing all of their taxable income and realized gains under Subchapter M of the Internal Revenue Code. As a result, no provision for income taxes is required in the accompanying financial statements. Dividends are declared daily and paid monthly from net investment income. Distributions from realized gains, if any, are recorded on the ex-dividend date.
Income and capital gain distributions are determined in accordance with income tax regulations, which may differ from generally accepted accounting principles. In addition, the income fund will treat a portion of the proceeds from shares redeemed as a distribution from net investment income and realized gain for income tax purposes. There were no significant book-to-tax differences during the period for the money market fund. Capital accounts within the income fund's financial statements are adjusted for permanent and temporary book and tax differences. These adjustments have no impact on net assets or the results of operations. Temporary differences will reverse in a subsequent period. These differences are primarily due to market discount, capital loss carryforwards and losses deferred due to futures transactions.
The tax-basis components of distributable earnings and the federal tax cost for the income fund as of period end were as follows:
Unrealized appreciation | $ 37,348,661 | | |
Unrealized depreciation | (267,580) | |
Net unrealized appreciation (depreciation) | 37,081,081 | |
Cost for federal income tax purposes | $ 516,920,145 | |
The tax character of distributions paid for the income fund was as follows:
| December 31, 2003 | December 31, 3002 |
| | |
Tax-exempt Income | $ 24,202,901 | $ 24,298,896 |
Short-Term Trading (Redemption) Fees. Shares held in the income fund less than 30 days are subject to a short-term trading fee equal to .50% of the proceeds of the redeemed shares. The fee, which is retained by the fund, is accounted for as an addition to paid in capital.
2. Operating Policies.
Delayed Delivery Transactions and When-Issued Securities. Each fund may purchase or sell securities on a delayed delivery or when-issued basis. Payment and delivery may take place after the customary settlement period for that security. The price of the underlying securities and the date when the securities will be delivered and paid for are fixed at the time the transaction is negotiated. During the time a delayed delivery sell is
Annual Report
Notes to Financial Statements - continued
2. Operating Policies - continued
Annual Report
Delayed Delivery Transactions and When-Issued Securities - continued
outstanding, the contract is marked-to-market daily and equivalent deliverable securities are held for the transaction. The value of the securities purchased on a delayed delivery or when-issued basis are identified as such in each applicable fund's Schedule of Investments. Each fund may receive compensation for interest forgone in the purchase of a delayed delivery or when-issued security. With respect to purchase commitments, each fund identifies securities as segregated in its records with a value at least equal to the amount of the commitment. Losses may arise due to changes in the value of the underlying securities or if the counterparty does not perform under the contract's terms, or if the issuer does not issue the securities due to political, economic, or other factors.
Restricted Securities. Certain funds may invest in securities that are subject to legal or contractual restrictions on resale. These securities generally may be resold in transactions exempt from registration or to the public if the securities are registered. Disposal of these securities may involve time-consuming negotiations and expense, and prompt sale at an acceptable price may be difficult. Information regarding restricted securities is included at the end of each applicable fund's Schedule of Investments.
Swap Agreements. The income fund may invest in swaps for the purpose of managing its exposure to interest rate, credit or market risk.
Interest rate swaps are agreements to exchange cash flows periodically based on a notional principal amount, for example, the exchange of fixed rate interest payments for floating rate interest payments. The primary risk associated with interest rate swaps is that unfavorable changes in the fluctuation of interest rates could adversely impact the fund.
Swaps are marked-to-market daily based on dealer-supplied valuations and changes in value are recorded as unrealized appreciation (depreciation). Gains or losses are realized upon early termination of the swap agreement. Collateral, in the form of cash or securities, may be required to be held in segregated accounts with the fund's custodian in compliance with swap contracts.
3. Purchases and Sales of Investments.
Information regarding purchases and sales of securities is included under the caption "Other Information" at the end of each applicable fund's Schedule of Investments.
Annual Report
Notes to Financial Statements - continued
4. Fees and Other Transactions with Affiliates.
Management Fee. Fidelity Management & Research Company (FMR) and its affiliates provide the funds with investment management related services for which the funds pay a monthly management fee. The management fee is the sum of an individual fund fee rate and a group fee rate. The individual fund fee rate is applied to each fund's average net assets. The group fee rate is based upon the average net assets of all the mutual funds advised by FMR. The group fee rate decreases as assets under management increase and increases as assets under management decrease. For the period, each fund's annual management fee rate expressed as a percentage of each fund's average net assets was as follows:
| Individual
Rate | Group
Rate | Total |
Spartan Michigan Municipal Income Fund | .25% | .13% | .38% |
Fidelity Michigan Municipal Money Market Fund | .25% | .13% | .38% |
Transfer Agent and Accounting Fees. Citibank, N.A. (Citibank) is the custodian, transfer agent and shareholder servicing agent for the funds. Citibank has entered into a sub-contract with Fidelity Service Company, Inc. (FSC), an affiliate of FMR, under which FSC performs the activities associated with the funds' transfer and shareholder servicing agent and accounting functions. The funds pay account fees and asset-based fees that vary according to account size and type of account. FSC pays for typesetting, printing and mailing of all shareholder reports, except proxy statements. The accounting fee is based on the level of average net assets for the month plus out-of-pocket expenses.
For the period, the transfer agent fees were equivalent to the following annual rates expressed as a percentage of average net assets:
Spartan Michigan Municipal Income Fund | .08% |
Michigan Municipal Money Market Fund | .14% |
Central Funds. The funds may invest in affiliated Central Funds managed by Fidelity Investments Money Management, Inc. (FIMM), an affiliate of FMR. The Central Funds are open-end investment companies available only to investment companies and other accounts managed by FMR and its affiliates. The Central Funds seek preservation of capital and current income and do not pay a management fee. Income distributions earned by the funds are recorded as income in the accompanying financial statements. Distributions from the Central Funds are noted in the table below:
| Income Distributions |
Fidelity Michigan Municipal Money Market Fund | $ 186,764 |
Annual Report
5. Expense Reductions.
Through arrangements with each applicable fund's custodian and transfer agent, credits realized as a result of uninvested cash balances were used to reduce each applicable fund's expenses. All of the applicable expense reductions are noted in the table below.
| Custody
expense
reduction | Transfer
Agent
expense
reduction |
| | |
Spartan Michigan Municipal Income Fund | $ 9,754 | $ 69,258 |
Fidelity Michigan Municipal Money Market Fund | 9,378 | 50,149 |
Annual Report
Report of Independent Auditors
To the Trustees of Fidelity Municipal Trust and Fidelity Municipal Trust II and the Shareholders of Spartan Michigan Municipal Income Fund and Fidelity Michigan Municipal Money Market Fund:
In our opinion, the accompanying statements of assets and liabilities, including the schedules of investments, and the related statements of operations and of changes in net assets and the financial highlights present fairly, in all material respects, the financial position of Spartan Michigan Municipal Income Fund (a fund of Fidelity Municipal Trust) and Fidelity Michigan Municipal Money Market Fund (a fund of Fidelity Municipal Trust II) at December 31, 2003 and the results of their operations, the changes in their net assets and the financial highlights for the periods indicated, in conformity with accounting principles generally accepted in the United States of America. These financial statements and financial highlights (hereafter referred to as "financial statements") are the responsibility of the Fidelity Municipal Trust's and Fidelity Municipal Trust II's management; our responsibility is to express an opinion on these financial statements based on our audits. We conducted our audits of these financial statements in accordance with auditing standards generally accepted in the United States of America which require that we plan and perform the audit to obtain reasonable assurance about whether the financial statements are free of material misstatement. An audit includes examining, on a test basis, evidence supporting the amounts and disclosures in the financial statements, assessing the accounting principles used and significant estimates made by management, and evaluating the overall financial statement presentation. We believe that our audits, which included confirmation of securities at December 31, 2003 by correspondence with the custodian and brokers, provide a reasonable basis for our opinion.
/s/ PricewaterhouseCoopers LLP
PricewaterhouseCoopers LLP
Boston, Massachusetts
February 11, 2004
Annual Report
Trustees and Officers
The Trustees, Members of the Advisory Board, and executive officers of the trusts and funds, as applicable, are listed below. The Board of Trustees governs each fund and is responsible for protecting the interests of shareholders. The Trustees are experienced executives who meet periodically throughout the year to oversee each fund's activities, review contractual arrangements with companies that provide services to each fund, and review each fund's performance. Except for William O. McCoy, each of the Trustees oversees 292 funds advised by FMR or an affiliate. Mr. McCoy oversees 294 funds advised by FMR or an affiliate.
The Trustees hold office without limit in time except that (a) any Trustee may resign; (b) any Trustee may be removed by written instrument, signed by at least two-thirds of the number of Trustees prior to such removal; (c) any Trustee who requests to be retired or who has become incapacitated by illness or injury may be retired by written instrument signed by a majority of the other Trustees; and (d) any Trustee may be removed at any special meeting of shareholders by a two-thirds vote of the outstanding voting securities of the trust. In any event, each non-interested Trustee shall retire not later than the last day of the calendar year in which his or her 72nd birthday occurs. The executive officers and Advisory Board Members hold office without limit in time, except that any officer and Advisory Board Member may resign or may be removed by a vote of a majority of the Trustees at any regular meeting or any special meeting of the Trustees. Except as indicated, each individual has held the office shown or other offices in the same company for the past five years.
The funds' Statement of Additional Information (SAI) includes more information about the Trustees. To request a free copy, call Fidelity at 1-800-544-8544.
Interested Trustees*:
Correspondence intended for each Trustee who is an "interested person" (as defined in the 1940 Act) may be sent to 82 Devonshire Street, Boston, Massachusetts 02109.
Name, Age; Principal Occupation |
Edward C. Johnson 3d (73)** |
| Year of Election or Appointment: 1984 or 1991 Trustee of Fidelity Municipal Trust (1984) and Fidelity Municipal Trust II (1991). Mr. Johnson is Chairman of the Board of Trustees. Mr. Johnson serves as Chief Executive Officer, Chairman, and a Director of FMR Corp.; a Director and Chairman of the Board and of the Executive Committee of FMR; Chairman and a Director of Fidelity Management & Research (Far East) Inc.; Chairman (1998) and a Director of Fidelity Investments Money Management, Inc.; and Chairman (2001) and a Director (2000) of FMR Co., Inc. |
Abigail P. Johnson (42)** |
| Year of Election or Appointment: 2001 Senior Vice President of Michigan Municipal Money Market (2001) and Spartan Michigan Municipal Income (2001). Ms. Johnson also serves as Senior Vice President of other Fidelity funds (2001). She is President and a Director of FMR (2001), Fidelity Investments Money Management, Inc. (2001), FMR Co., Inc. (2001), and a Director of FMR Corp. Previously, Ms. Johnson managed a number of Fidelity funds. |
Laura B. Cronin (49) |
| Year of Election or Appointment: 2003 Ms. Cronin is an Executive Vice President (2002) and Chief Financial Officer (2002) of FMR Corp. and is a member of the Fidelity Management Committee (2003). Previously, Ms. Cronin served as Vice President of Finance of FMR (1997-1999), and Chief Financial Officer of FMR (1999-2001), Fidelity Personal Investments (2001), and Fidelity Brokerage Company (2001-2002). |
Robert L. Reynolds (51) |
| Year of Election or Appointment: 2003 Mr. Reynolds is a Director (2003) and Chief Operating Officer (2002) of FMR Corp. and is the head of the Fidelity Management Committee (2003). He also serves on the Board at Fidelity Investments Canada, Ltd. (2000). Previously, Mr. Reynolds served as President of Fidelity Investments Institutional Retirement Group (1996-2000). |
* Trustees have been determined to be "Interested Trustees" by virtue of, among other things, their affiliation with the trusts or various entities under common control with FMR.
** Edward C. Johnson 3d, Trustee, is Abigail P. Johnson's father.
Annual Report
Non-Interested Trustees:
Correspondence intended for each non-interested Trustee (that is, the Trustees other than the Interested Trustees) may be sent to Fidelity Investments, P.O. Box 55235, Boston, Massachusetts 02205-5235.
Name, Age; Principal Occupation |
J. Michael Cook (61) |
| Year of Election or Appointment: 2001 Prior to Mr. Cook's retirement in May 1999, he served as Chairman and Chief Executive Officer of Deloitte & Touche LLP (accounting/consulting), Chairman of the Deloitte & Touche Foundation, and a member of the Board of Deloitte Touche Tohmatsu. He currently serves as a Director of Comcast (telecommunications, 2002), International Flavors & Fragrances, Inc. (2000), Rockwell Automation (2000), and The Dow Chemical Company (2000). He is a Member of the Diversity Advisory Council of Marakon (2003) and the Advisory Board of the Directorship Search Group, Chairman Emeritus of the Board of Catalyst (a leading organization for the advancement of women in business), and is Chairman of the Accountability Advisory Council to the Comptroller General of the United States. He also serves as a Member of the Advisory Board of the Graduate School of Business of the University of Florida, his alma mater. |
Ralph F. Cox (71) |
| Year of Election or Appointment: 1991 Mr. Cox is President of RABAR Enterprises (management consulting for the petroleum industry). Prior to February 1994, he was President of Greenhill Petroleum Corporation (petroleum exploration and production). Until March 1990, Mr. Cox was President and Chief Operating Officer of Union Pacific Resources Company (exploration and production). He is a Director of CH2M Hill Companies (engineering), and Abraxas Petroleum (petroleum exploration and production, 1999). In addition, he is a member of advisory boards of Texas A&M University and the University of Texas at Austin. |
Robert M. Gates (60) |
| Year of Election or Appointment: 1997 Dr. Gates is President of Texas A&M University (2002). He was Director of the Central Intelligence Agency (CIA) from 1991 to 1993. From 1989 to 1991, Dr. Gates served as Assistant to the President of the United States and Deputy National Security Advisor. Dr. Gates is a Director of NACCO Industries, Inc. (mining and manufacturing), and Parker Drilling Co., Inc. (drilling and rental tools for the energy industry, 2001). He also serves as a member of the Advisory Board of VoteHere.net (secure internet voting, 2001). Previously, Dr. Gates served as a Director of LucasVarity PLC (automotive components and diesel engines), a Director of TRW Inc. (automotive, space, defense, and information technology), and Dean of the George Bush School of Government and Public Service at Texas A&M University (1999-2001). Dr. Gates also is a Trustee of the Forum for International Policy. |
George H. Heilmeier (67) |
| Year of Election or Appointment: 2004 Dr. Heilmeier is Chairman Emeritus of Telcordia Technologies (communication software and systems), where prior to his retirement, he served as company Chairman and Chief Executive Officer. He currently serves on the Boards of Directors of The Mitre Corporation (systems engineering and information technology support for the government), INET Technologies Inc. (telecommunications network surveillance, 2001) and Teletech Holdings (customer management services, 1998). He is Chairman of the General Motors Technology Advisory Committee and a Life Fellow of the IEEE (2000). Dr. Heilmeier is a member of the Defense Science Board and the National Security Agency Advisory Board. He is also a member of the National Academy of Engineering, the American Academy of Arts and Sciences and The Board of Overseers of the School of Engineering and Applied Science of the University of Pennsylvania. Previously, Dr. Heilmeier served as a Director of TRW Inc. (automotive, space, defense, and information technology, 1992-2002) and Compaq (1994-2002). |
Donald J. Kirk (71) |
| Year of Election or Appointment: 1987 or 1991 Trustee of Fidelity Municipal Trust (1987) and Fidelity Municipal Trust II (1991). Mr. Kirk is a Governor of the American Stock Exchange (2001), a Trustee and former Chairman of the Board of Trustees of the Greenwich Hospital Association, a Director of the Yale-New Haven Health Services Corp. (1998), and a Director Emeritus and former Chairman of the Board of Directors of National Arts Strategies Inc. Mr. Kirk was an Executive-in-Residence (1995-2000) and a Professor (1987-1995) at Columbia University Graduate School of Business. Prior to 1987, he was Chairman of the Financial Accounting Standards Board. Previously, Mr. Kirk served as a Governor of the National Association of Securities Dealers, Inc. (1996-2002), a member and Vice Chairman of the Public Oversight Board of the American Institute of Certified Public Accountants' SEC Practice Section (1995-2002), a Director of General Re Corporation (reinsurance, 1987-1998) and as a Director of Valuation Research Corp. (appraisals and valuations). |
Marie L. Knowles (57) |
| Year of Election or Appointment: 2001 Prior to Ms. Knowles' retirement in June 2000, she served as Executive Vice President and Chief Financial Officer of Atlantic Richfield Company (ARCO) (diversified energy, 1996-2000). From 1993 to 1996, she was a Senior Vice President of ARCO and President of ARCO Transportation Company. She served as a Director of ARCO from 1996 to 1998. She currently serves as a Director of Phelps Dodge Corporation (copper mining and manufacturing), URS Corporation (multidisciplinary engineering, 1999), and McKesson Corporation (healthcare service, 2002). Ms. Knowles is a Trustee of the Brookings Institution and the Catalina Island Conservancy and also serves as a member of the Advisory Board for the School of Engineering of the University of Southern California. |
Ned C. Lautenbach (59) |
| Year of Election or Appointment: 2000 Mr. Lautenbach has been a partner of Clayton, Dubilier & Rice, Inc. (private equity investment firm) since September 1998. Previously, Mr. Lautenbach was with the International Business Machines Corporation (IBM) from 1968 until his retirement in 1998. He was most recently Senior Vice President and Group Executive of Worldwide Sales and Services. From 1993 to 1995, he was Chairman of IBM World Trade Corporation, and from 1994 to 1998 was a member of IBM's Corporate Executive Committee. Mr. Lautenbach serves as Chairman and as a Director (1998) of Acterna Corporation (communications test equipment). He is also Co-Chairman of Covansys, Inc. (global provider of business and technology solutions, 2000). In addition, he is a Director of Eaton Corporation (diversified industrial) and the Philharmonic Center for the Arts in Naples, Florida (1999). He also is a member of the Council on Foreign Relations. |
Marvin L. Mann (70) |
| Year of Election or Appointment: 1993 Mr. Mann is Chairman of the non-interested Trustees (2001). He is Chairman Emeritus of Lexmark International, Inc. (computer peripherals) where he served as CEO until April 1998 and retired as Chairman May 1999, and remains a member of the Board. Prior to 1991, he held the positions of Vice President of International Business Machines Corporation (IBM) and President and General Manager of various IBM divisions and subsidiaries. Mr. Mann is a Board member of Imation Corp. (imaging and information storage) and Acterna Corporation (communications test equipment, 1999). He is also a member of the Director Services Committee of the Investment Company Institute. In addition, Mr. Mann is a member of the President's Cabinet at the University of Alabama and the Board of Visitors of the Culverhouse College of Commerce and Business Administration at the University of Alabama. |
William O. McCoy (70) |
| Year of Election or Appointment: 1997 Prior to his retirement in December 1994, Mr. McCoy was Vice Chairman of the Board of BellSouth Corporation (telecommunications) and President of BellSouth Enterprises. He is currently a Director of Liberty Corporation (holding company), Duke Realty Corporation (real estate), Progress Energy, Inc. (electric utility), and Acterna Corporation (communications test equipment, 1999). He is also a partner of Franklin Street Partners (private investment management firm) and a member of the Research Triangle Foundation Board. In addition, Mr. McCoy served as the Interim Chancellor (1999-2000) and a member of the Board of Visitors (1994-1998) for the University of North Carolina at Chapel Hill and currently serves on the Board of Directors of the University of North Carolina Health Care System and the Board of Visitors of the Kenan-Flagler Business School (University of North Carolina at Chapel Hill). He also served as Vice President of Finance for the University of North Carolina (16-school system, 1995-1998). |
William S. Stavropoulos (64) |
| Year of Election or Appointment: 2001 or 2002 Trustee of Fidelity Municipal Trust II (2001) and Fidelity Municipal Trust (2002). Mr. Stavropoulos is Chairman of the Board, President and CEO (2002), and Chairman of the Executive Committee (2000) and a Director of The Dow Chemical Company. Since joining The Dow Chemical Company in 1967, Mr. Stavropoulos served in numerous senior management positions, including President (1993-2000) and Chief Executive Officer (1995-2000). Currently, he is a Director of NCR Corporation (data warehousing and technology solutions), BellSouth Corporation (telecommunications), Chemical Financial Corporation, and Maersk Inc. (industrial conglomerate, 2002). He also serves as a member of the Board of Trustees of the American Enterprise Institute for Public Policy Research. In addition, Mr. Stavropoulos is a member of The Business Council, J.P. Morgan International Council, World Business Council for Sustainable Development, and the University of Notre Dame Advisory Council for the College of Science. |
Annual Report
Trustees and Officers - continued
Advisory Board Members and Executive Officers:
Correspondence intended for Ms. Small may be sent to Fidelity Investments, P.O. Box 55235, Boston, Massachusetts 02205-5235. Correspondence intended for each executive officer and Mr. Lynch may be sent to 82 Devonshire Street, Boston, Massachusetts 02109.
Name, Age; Principal Occupation |
Peter S. Lynch (60) |
| Year of Election or Appointment: 2003 Member of the Advisory Board of Fidelity Municipal Trust and Fidelity Municipal Trust II. Vice Chairman and a Director of FMR, and Vice Chairman (2001) and a Director (2000) of FMR Co., Inc. Previously, Mr. Lynch served as a Trustee of the Fidelity funds (1990-2003). Prior to May 31, 1990, he was a Director of FMR and Executive Vice President of FMR (a position he held until March 31, 1991), Vice President of Fidelity® Magellan® Fund and FMR Growth Group Leader, and Managing Director of FMR Corp. Mr. Lynch was also Vice President of Fidelity Investments Corporate Services. In addition, he serves as a Trustee of Boston College, Massachusetts Eye & Ear Infirmary, Historic Deerfield, John F. Kennedy Library, and the Museum of Fine Arts of Boston. |
Cornelia M. Small (59) |
| Year of Election or Appointment: 2004 Member of the Advisory Board of Fidelity Municipal Trust and Fidelity Municipal Trust II. Ms. Small is a member (2000) and Chairperson (2002) of the Investment Committee, and a member (2002) of the Board of Trustees of Smith College. Previously, she served as Chief Investment Officer (1999-2000), Director of Global Equity Investments (1996-1999), and a member of the Board of Directors (1998-1999) of Scudder Kemper Investments. In addition, Ms. Small served as Co-Chair (2000-2003) of the Annual Fund for the Fletcher School of Law and Diplomacy. |
Dwight D. Churchill (50) |
| Year of Election or Appointment: 1997 or 2000 Vice President of Michigan Municipal Money Market (2000) and Spartan Michigan Municipal Income (1997). He serves as Head of Fidelity's Fixed-Income Division (2000), Vice President of Fidelity's Money Market Funds (2000), Vice President of Fidelity's Bond Funds (1997), and Senior Vice President of FIMM (2000) and FMR (1997). Mr. Churchill joined Fidelity in 1993 as Vice President and Group Leader of Taxable Fixed-Income Investments. |
Charles S. Morrison (43) |
| Year of Election or Appointment: 2002 Vice President of Spartan Michigan Municipal Income. Mr. Morrison also serves as Vice President of Fidelity's Bond Funds (2002), and Vice President of certain Asset Allocation and Balanced Funds (2002). He serves as Vice President (2002) and Bond Group Leader (2002) of Fidelity Investments Fixed Income Division. Mr. Morrison is also Vice President of FIMM (2002) and FMR (2002). Mr. Morrison joined Fidelity in 1987 as a Corporate Bond Analyst in the Fixed Income Research Division. |
David L. Murphy (55) |
| Year of Election or Appointment: 2002 Vice President of Michigan Municipal Money Market. Mr. Murphy also serves as Vice President of Fidelity's Money Market Funds (2002) and Vice President of certain Asset Allocation Funds (2003). He serves as Senior Vice President (2000) and Money Market Group Leader (2002) of the Fidelity Investments Fixed Income Division. Mr. Murphy is also a Senior Vice President of FIMM (2003) and a Vice President of FMR (2000). Previously, Mr. Murphy served as Bond Group Leader (2000-2002) and Vice President of Fidelity's Taxable Bond Funds (2000-2002) and Fidelity's Municipal Bond Funds (2001-2002). Mr. Murphy joined Fidelity in 1989 as a portfolio manager in the Bond Group. |
Eric D. Roiter (55) |
| Year of Election or Appointment: 1998 Secretary of Michigan Municipal Money Market and Spartan Michigan Municipal Income. He also serves as Secretary of other Fidelity funds (1998); Vice President, General Counsel, and Clerk of FMR Co., Inc. (2001) and FMR (1998); Vice President and Clerk of FDC (1998); Assistant Clerk of Fidelity Management & Research (U.K.) Inc. (2001) and Fidelity Management & Research (Far East) Inc. (2001); and Assistant Secretary of Fidelity Investments Money Management Inc. (2001). Prior to joining Fidelity, Mr. Roiter was with the law firm of Debevoise & Plimpton, as an associate (1981-1984) and as a partner (1985-1997), and served as an Assistant General Counsel of the U.S. Securities and Exchange Commission (1979-1981). Mr. Roiter is an Adjunct Member, Faculty of Law, at Boston College Law School (2003). |
Stuart Fross (44) |
| Year of Election or Appointment: 2003 Assistant Secretary of Michigan Municipal Money Market and Spartan Michigan Municipal Income. Mr. Fross also serves as Assistant Secretary of other Fidelity funds (2003) and is an employee of FMR. |
Maria F. Dwyer (45) |
| Year of Election or Appointment: 2002 President and Treasurer of Michigan Municipal Money Market and Spartan Michigan Municipal Income. Ms. Dwyer also serves as President and Treasurer of other Fidelity funds (2002) and is a Vice President (1999) and an employee (1996) of FMR. |
Timothy F. Hayes (53) |
| Year of Election or Appointment: 2002 Chief Financial Officer of Michigan Municipal Money Market and Spartan Michigan Municipal Income. Mr. Hayes also serves as Chief Financial Officer of other Fidelity funds (2002). Recently he was appointed President of Fidelity Service Company (2003) where he also serves as a Director. Mr. Hayes also serves as President of Fidelity Investments Operations Group (FIOG, 2002), which includes Fidelity Pricing and Cash Management Services Group (FPCMS), where he was appointed President in 1998. Previously, Mr. Hayes served as Chief Financial Officer of Fidelity Investments Corporate Systems and Service Group (1998) and Fidelity Systems Company (1997-1998). |
Jennifer S. Taub (37) |
| Year of Election or Appointment: 2003 Assistant Vice President of Michigan Municipal Money Market and Spartan Michigan Municipal Income. Ms. Taub is Assistant Vice President of Fidelity's Fixed-Income Funds (2003), Assistant Secretary of FIMM (2003), and is an employee of FMR. |
John R. Hebble (45) |
| Year of Election or Appointment: 2003 Deputy Treasurer of Michigan Municipal Money Market and Spartan Michigan Municipal Income. Mr. Hebble also serves as Deputy Treasurer of other Fidelity funds (2003), and is an employee of FMR. Before joining Fidelity Investments, Mr. Hebble worked at Deutsche Asset Management where he served as Director of Fund Accounting (2002-2003) and Assistant Treasurer of the Scudder Funds (1998-2003). |
John H. Costello (57) |
| Year of Election or Appointment: 1986 or 1990 Assistant Treasurer of Michigan Municipal Money Market (1990) and Spartan Michigan Municipal Income (1986). Mr. Costello also serves as Assistant Treasurer of other Fidelity funds and is an employee of FMR. |
Francis V. Knox, Jr. (56) |
| Year of Election or Appointment: 2002 Assistant Treasurer of Michigan Municipal Money Market and Spartan Michigan Municipal Income. Mr. Knox also serves as Assistant Treasurer of other Fidelity funds (2002), and is a Vice President and an employee of FMR. Previously, Mr. Knox served as Vice President of Investment & Advisor Compliance (1990-2001), and Compliance Officer of Fidelity Management & Research (U.K.) Inc. (1992-2002), Fidelity Management & Research (Far East) Inc. (1991-2002), and FMR Corp. (1995-2002). |
Mark Osterheld (48) |
| Year of Election or Appointment: 2002 Assistant Treasurer of Michigan Municipal Money Market and Spartan Michigan Municipal Income. Mr. Osterheld also serves as Assistant Treasurer of other Fidelity funds (2002) and is an employee of FMR. |
Thomas J. Simpson (45) |
| Year of Election or Appointment: 1996 Assistant Treasurer of Michigan Municipal Money Market and Spartan Michigan Municipal Income. Mr. Simpson is Assistant Treasurer of other Fidelity funds (2000) and an employee of FMR (1996). Prior to joining FMR, Mr. Simpson was Vice President and Fund Controller of Liberty Investment Services (1987-1995). |
Annual Report
Managing Your Investments
Fidelity offers several ways to conveniently manage your personal investments via your telephone or PC. You can access your account information, conduct trades and research your investments 24 hours a day.
By Phone
Fidelity Automated Service Telephone provides a single toll-free number to access account balances, positions, quotes and trading. It's easy to navigate the service, and on your first call, the system will help you create a personal identification number (PIN) for security.
(phone_graphic)Fidelity Automated
Service Telephone (FAST®)
1-800-544-5555
Press
1 For mutual fund and brokerage trading.
2 For quotes.*
3 For account balances and holdings.
4 To review orders and mutual
fund activity.
5 To change your PIN.
*0 To speak to a Fidelity representative.
By PC
Fidelity's web site on the Internet provides a wide range of information, including daily financial news, fund performance, interactive planning tools and news about Fidelity products and services.
(computer_graphic)Fidelity's Web Site
www.fidelity.com
* When you call the quotes line, please remember that a fund's yield and return will vary and, except for money market funds, share price will also vary. This means that you may have a gain or loss when you sell your shares. There is no assurance that money market funds will be able to maintain a stable $1 share price; an investment in a money market fund is not insured or guaranteed by the U.S. government. Total returns are historical and include changes in share price, reinvestment of dividends and capital gains, and the effects of any sales charges.
Annual Report
To Write Fidelity
We'll give your correspondence immediate attention and send you written confirmation upon completion of your request.
(letter_graphic)Making Changes
To Your Account
(such as changing name, address, bank, etc.)
Fidelity Investments
P.O. Box 770001
Cincinnati, OH 45277-0002
(letter_graphic)For Non-Retirement
Accounts
Buying shares
Fidelity Investments
P.O. Box 770001
Cincinnati, OH 45277-0003
Overnight Express
Fidelity Investments
Attn: Distribution Services
100 Crosby Parkway - KC1H
Covington, KY 41015
Selling shares
Fidelity Investments
P.O. Box 770001
Cincinnati, OH 45277-0035
Overnight Express
Fidelity Investments
Attn: Distribution Services
100 Crosby Parkway - KC1H
Covington, KY 41015
General Correspondence
Fidelity Investments
P.O. Box 500
Merrimack, NH 03054-0500
(letter_graphic)For Retirement
Accounts
Buying shares
Fidelity Investments
P.O. Box 770001
Cincinnati, OH 45277-0003
Selling shares
Fidelity Investments
P.O. Box 770001
Cincinnati, OH 45277-0035
Overnight Express
Fidelity Investments
Attn: Distribution Services
100 Crosby Parkway - KC1H
Covington, KY 41015
General Correspondence
Fidelity Investments
P.O. Box 500
Merrimack, NH 03054-0500
Annual Report
Investment Adviser
Fidelity Management & Research Company
Boston, MA
Investment Sub-Adviser
Fidelity Investments Money
Management, Inc.
Fidelity International Investment Advisors
Fidelity International Investment Advisors
(U.K.) Limited
General Distributor
Fidelity Distributors Corporation
Boston, MA
Transfer and Shareholder
Servicing Agents
Citibank, N.A.
New York, NY
and
Fidelity Service Company, Inc.
Boston, MA
Custodian
Citibank, N.A.
New York, NY
The Fidelity Telephone Connection
Mutual Fund 24-Hour Service
Exchanges/Redemptions
and Account Assistance 1-800-544-6666
Product Information 1-800-544-6666
Retirement Accounts 1-800-544-4774 (8 a.m. - 9 p.m.)
TDD Service 1-800-544-0118
for the deaf and hearing impaired
(9 a.m. - 9 p.m. Eastern time)
Fidelity Automated Service
Telephone (FAST®) (automated graphic) 1-800-544-5555
(automated graphic) Automated line for quickest service
(Fidelity Investment logo)(registered trademark)
Corporate Headquarters
82 Devonshire St., Boston, MA 02109
www.fidelity.com
MIR-UANN-0204
1.787737.100
Spartan®
Ohio Municipal Income
Fund
and
Fidelity ®
Ohio Municipal Money Market
Fund
Annual Report
December 31, 2003
(2_fidelity_logos) (Registered_Trademark)
Contents
Chairman's Message | <Click Here> | Ned Johnson's message to shareholders |
Spartan Ohio Municipal Income Fund |
Performance | <Click Here> | How the fund has done over time. |
Management's Discussion | <Click Here> | The manager's review of fund performance, strategy and outlook. |
Investment Changes | <Click Here> | A summary of major shifts in the fund's investments over the past six months. |
Investments | <Click Here> | A complete list of the fund's investments with their market values. |
Financial Statements | <Click Here> | Statements of assets and liabilities, operations, and changes in net assets,
as well as financial highlights. |
Fidelity Ohio Municipal Money Market Fund |
Investment Changes/
Performance | <Click Here> | A summary of major shifts in the fund's investments over the past six months and one year. |
Investments | <Click Here> | A complete list of the fund's investments. |
Financial Statements | <Click Here> | Statements of assets and liabilities, operations, and changes in net assets,
as well as financial highlights. |
Notes | <Click Here> | Notes to the Financial Statements |
Auditors' Opinion | <Click Here> | |
Trustees and Officers | <Click Here> | |
Distributions | <Click Here> | |
For a free copy of the funds' proxy voting guidelines visit www.fidelity.com/goto/proxyguidelines, call 1-800-544-8544, or visit the Securities and Exchange Commission (SEC)'s web site at www.sec.gov.
Standard & Poor's, S&P and S&P 500 are registered service marks of The McGraw-Hill Companies, Inc. and have been licensed for use by Fidelity Distributors Corporation.
Other third party marks appearing herein are the property of their respective owners.
All other marks appearing herein are registered or unregistered trademarks or service marks of FMR Corp. or an affiliated company.
(Recycle graphic) This report is printed on recycled paper using soy-based inks.
Annual Report
This report and the financial statements contained herein are submitted for the general information of the shareholders of the funds. This report is not authorized for distribution to prospective investors in the funds unless preceded or accompanied by an effective prospectus.
Mutual fund shares are not deposits or obligations of, or guaranteed by, any depository institution. Shares are not insured by the FDIC, Federal Reserve Board or any other agency, and are subject to investment risks, including possible loss of principal amount invested.
Neither the funds nor Fidelity Distributors Corporation is a bank.
For more information on any Fidelity fund, including charges and expenses, call 1-800-544-6666 for a free prospectus. Read it carefully before you invest or send money.
Annual Report
Chairman's Message
(photo_of_Edward_C_Johnson_3d)
Dear Shareholder:
Many of you have read or heard news stories recently that were critical of mutual funds and made allegations that the mutual fund industry has been less than forthright. I find these reports unsettling and not necessarily an accurate picture of the overall industry, and I would like you to know where we at Fidelity stand.
With specific regard to allegations that certain mutual fund companies were violating the Securities and Exchange Commission's forward pricing rules or were involved in so-called "market timing" activities, I want to say two things:
First, Fidelity does not have agreements that permit customers who buy fund shares after 4 p.m. to obtain the 4 p.m. price. This is not to say that someone could not deceive the company through fraudulent acts. But I underscore that we have no so-called "agreements" which would permit this illegal practice.
Second, Fidelity has been on record for years opposing predatory short-term trading which adversely affects other shareholders in a mutual fund. In fact, in the 1980s, we began charging a fee - which is returned to the fund and, therefore, to investors - to discourage this activity. What's more, several years ago we took the industry lead in developing a Fair Value Pricing Policy to prevent market timing on foreign securities in our funds. It is reasonable to assume that another structure can be developed that would alter the system to make it much more difficult for predatory traders to operate. This, however, will only be achieved through close cooperation among regulators, legislators and the industry.
Certainly no industry is perfect, and there have been instances of unethical and illegal activity from time to time within the mutual fund industry. When this occurs, confessed or convicted offenders should be dealt with appropriately. Clearly, every system can be improved. We applaud well thought out improvements by regulators, legislators and industry representatives that achieve the common goal of building and protecting the value of investors' holdings. But we remain concerned about the risk of over-regulation and the quick application of simplistic solutions to intricate problems.
For more than 57 years, Fidelity Investments has worked very hard to improve its products and service to justify your trust. When our family founded this company in 1946, we had only a few hundred customers. Many of them were family and friends. Today, we serve more than 18 million customers including individual investors and participants in retirement plans across America.
Let me close by saying that we do not take your trust in us for granted, and we realize that we must always work to improve all aspects of our service to you. In turn, we urge you to continue your active participation with your financial matters, so that your interests can be well served.
Best regards,
/s/Edward C. Johnson 3d
Edward C. Johnson 3d
Annual Report
Spartan Ohio Municipal Income Fund
Performance: The Bottom Line
Average annual total return reflects the change in the value of an investment, assuming reinvestment of the fund's dividend income and capital gains (the profits earned upon the sale of securities that have grown in value) and assuming a constant rate of performance each year. During periods of reimbursement by Fidelity, a fund's total return will be greater than it would be had the reimbursement not occurred. The $10,000 table and the fund's returns do not reflect the deduction of taxes that a shareholder would pay on fund distributions or the redemption of fund shares. How a fund did yesterday is no guarantee of how it will do tomorrow.
Average Annual Total Returns
Periods ended December 31, 2003 | Past 1
year | Past 5
years | Past 10
years |
Spartan® OH Municipal Income Fund | 5.72% | 5.67% | 5.68% |
$10,000 Over 10 Years
Let's say hypothetically that $10,000 was invested in Spartan® Ohio Municipal Income Fund on December 31, 1993. The chart shows how the value of your investment would have grown, and also shows how the Lehman Brothers® Municipal Bond Index did over the same period.
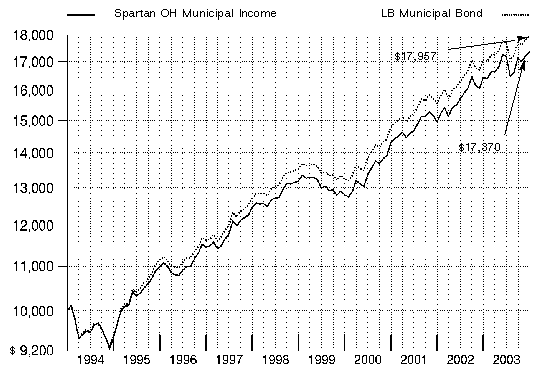
Annual Report
Spartan Ohio Municipal Income Fund
Management's Discussion of Fund Performance
Comments from Doug McGinley, Portfolio Manager of Spartan® Ohio Municipal Income Fund
While most of the year favored riskier assets, tax-exempt municipal bonds put up solid numbers for the 12 months ending December 31, 2003. In that time, the Lehman Brothers® Municipal Bond Index - a performance measure of about 40,000 investment-grade, fixed-rate, tax-exempt bonds - advanced 5.31%. For munis, it was the fourth straight year of returns in excess of 5%. Munis had an excellent year relative to taxable investment-grade bonds. The Lehman Brothers Aggregate Bond Index, a proxy for the taxable, investment-grade bond market, gained 4.10% in 2003, a full percentage point less than the muni index - a gap made even wider considering muni bonds' tax-equivalent yield advantage. What's more, on a three- and five-year basis, the Lehman Brothers muni index's cumulative return is well above that of most stock market benchmarks. Munis fared well for much of the year against a backdrop of low interest rates and virtually non-existent inflation. Although they stumbled in mid-summer against a brighter economic forecast, munis rebounded later on the heels of strong investor demand and the Federal Reserve Board's accommodative monetary policy.
Spartan Ohio Municipal Income Fund returned 5.72% during the 12-month period, outpacing the LipperSM Ohio Municipal Debt Funds Average, which returned 4.57%. Additionally, the Lehman Brothers Ohio 4 Plus Year Enhanced Municipal Bond Index returned 5.96%. The fund's outperformance stemmed from a variety of strategies, including how its holdings were invested in bonds of various maturities at different points throughout the year. Security and sector selection also helped, particularly in the health care sector. The fund held a number of strong-performing hospital bonds and avoided those that experienced severe credit problems. The fund's emphasis on essential services bonds - issued by providers of electricity, water and sewer services - also helped. Their stable revenues helped them outperform tax-backed bonds during the period. The fund also benefited from its underweighting in state-issued bonds, which came under pressure due to challenges the state experienced in balancing its budget. Modestly detracting was a relatively small stake - compared to the Ohio muni market overall - in bonds that were prerefunded during the period, a process whereby the bonds typically emerge with higher credit ratings and prices.
The views expressed in this statement reflect those of the portfolio manager only through the end of the period of the report as stated on the cover and do not necessarily represent the views of Fidelity or any other person in the Fidelity organization. Any such views are subject to change at any time based upon market or other conditions and Fidelity disclaims any responsibility to update such views. These views may not be relied on as investment advice and, because investment decisions for a Fidelity fund are based on numerous factors, may not be relied on as an indication of trading intent on behalf of any Fidelity fund.
Annual Report
Spartan Ohio Municipal Income Fund
Investment Changes
Top Five Sectors as of December 31, 2003 |
| % of fund's
net assets | % of fund's net assets
6 months ago |
General Obligations | 55.6 | 52.6 |
Education | 11.0 | 10.8 |
Water & Sewer | 8.6 | 7.8 |
Electric Utilities | 6.7 | 7.7 |
Health Care | 6.5 | 8.2 |
Average Years to Maturity as of December 31, 2003 |
| | 6 months ago |
Years | 14.0 | 14.4 |
Average years to maturity is based on the average time remaining until principal payments are expected from each of the fund's bonds, weighted by dollar amount. |
Duration as of December 31, 2003 |
| | 6 months ago |
Years | 7.5 | 7.1 |
Duration shows how much a bond fund's price fluctuates with changes in comparable interest rates. If rates rise 1%, for example, a fund with a five-year duration is likely to lose about 5% of its value. Other factors also can influence a bond fund's performance and share price. Accordingly, a bond fund's actual performance may differ from this example. |
Quality Diversification (% of fund's net assets) |
As of December 31, 2003 | As of June 30, 2003 |
| AAA 49.1% | | | AAA 47.6% | |
| AA,A 44.9% | | | AA,A 45.3% | |
| BBB 4.2% | | | BBB 3.7% | |
 | BB and Below 0.1% | | | BB and Below 0.1% | |
| Not Rated 0.7% | | | Not Rated 0.7% | |
| Short-Term
Investments and
Net Other Assets 1.0% | | | Short-Term
Investments and
Net Other Assets 2.6% | |

We have used ratings from Moody's® Investors Services, Inc. Where Moody's ratings are not available, we have used S&P® ratings. Percentages are adjusted for the effect of futures contracts, if applicable. |
Annual Report
Spartan Ohio Municipal Income Fund
Investments December 31, 2003
Showing Percentage of Net Assets
Municipal Bonds - 99.0% |
| Principal
Amount | | Value
(Note 1) |
Ohio - 97.8% |
Adams County Valley Local School District (Adams & Highland County Proj.) 5.25% 12/1/21 (MBIA Insured) | | $ 2,000,000 | | $ 2,102,780 |
Akron City Nontax Rev. Econ. Dev. Series 1997, 6% 12/1/12 (MBIA Insured) | | 1,250,000 | | 1,505,838 |
Akron Gen. Oblig. 5.5% 12/1/21 | | 2,000,000 | | 2,190,760 |
Akron Wtrwks. Rev. 5.25% 12/1/19 (MBIA Insured) | | 1,450,000 | | 1,588,461 |
Avon Lake City School District 5.5% 12/1/26 (FGIC Insured) | | 2,205,000 | | 2,429,072 |
Bowling Green Univ. Gen. Receipts: | | | | |
5.75% 6/1/11 (FGIC Insured) | | 1,455,000 | | 1,700,386 |
5.75% 6/1/14 (FGIC Insured) | | 1,190,000 | | 1,383,875 |
5.75% 6/1/16 (FGIC Insured) | | 1,250,000 | | 1,443,388 |
Brookville Local School District 5.25% 12/1/20 (FSA Insured) | | 1,875,000 | | 2,049,825 |
Buckeye Valley Local School District Delaware County Series A: | | | | |
5.25% 12/1/20 (MBIA Insured) | | 1,000,000 | | 1,053,210 |
6.85% 12/1/15 (MBIA Insured) | | 2,500,000 | | 3,146,000 |
Butler County Gen. Oblig. 5.25% 12/1/16 (MBIA Insured) | | 1,820,000 | | 2,038,546 |
Butler County Trans. Impt. District Series 1997 A, 6% 4/1/10 (FSA Insured) | | 2,325,000 | | 2,679,818 |
Cincinnati City School District 5.25% 6/1/16 (FSA Insured) | | 1,500,000 | | 1,670,655 |
Cincinnati Gen. Oblig.: | | | | |
(Police & Firemen's Disability Proj.) 6% 12/1/35 (b) | | 5,000,000 | | 5,731,100 |
5.375% 12/1/20 | | 2,000,000 | | 2,176,980 |
Cincinnati Student Ln. Fdg. Corp. Student Ln. Rev. Series A, 7.25% 2/1/08 (d) | | 4,000,000 | | 4,017,280 |
Cincinnati Wtr. Sys. Rev. Series 2001, 5.5% 12/1/17 | | 2,000,000 | | 2,238,300 |
Cleveland Arpt. Sys. Rev. Series A, 5.5% 1/1/08 (FSA Insured) (d) | | 1,500,000 | | 1,659,510 |
Cleveland Gen. Oblig.: | | | | |
5.25% 12/1/17 (FGIC Insured) | | 1,355,000 | | 1,480,283 |
5.5% 9/1/16 (AMBAC Insured) | | 2,000,000 | | 2,216,200 |
Cleveland Pub. Pwr. Sys. Rev.: | | | | |
(First Mtg. Prog.): | | | | |
Series A: | | | | |
0% 11/15/08 (MBIA Insured) | | 5,480,000 | | 4,782,999 |
0% 11/15/10 (MBIA Insured) | | 2,685,000 | | 2,127,352 |
0% 11/15/11 (MBIA Insured) | | 2,685,000 | | 2,020,463 |
Sub Series 1, 5.125% 11/15/18 (MBIA Insured) | | 2,000,000 | | 2,119,860 |
Municipal Bonds - continued |
| Principal
Amount | | Value
(Note 1) |
Ohio - continued |
Cleveland Pub. Pwr. Sys. Rev.: - continued | | | | |
5.25% 11/15/14 (MBIA Insured) | | $ 1,000,000 | | $ 1,107,900 |
Cleveland State Univ. Gen. Receipts Series 2003 A, 5% 6/1/18 (FGIC Insured) | | 2,490,000 | | 2,678,319 |
Cleveland Wtrwks. Rev. (First Mtg. Prog.): | | | | |
Series G, 5.5% 1/1/13 (MBIA Insured) | | 2,450,000 | | 2,836,267 |
Series H, 5.75% 1/1/16 (MBIA Insured) | | 45,000 | | 49,200 |
Cuyahoga County Gen. Oblig.: | | | | |
Series A: | | | | |
0% 10/1/08 (MBIA Insured) | | 4,000,000 | | 3,511,280 |
0% 10/1/09 (MBIA Insured) | | 4,200,000 | | 3,523,296 |
0% 10/1/11 (MBIA Insured) | | 2,400,000 | | 1,827,816 |
0% 10/1/12 (MBIA Insured) | | 1,505,000 | | 1,088,792 |
5.75% 12/1/11 | | 4,350,000 | | 5,082,323 |
5.75% 12/1/12 | | 1,950,000 | | 2,245,464 |
5.75% 12/1/13 | | 2,210,000 | | 2,574,562 |
5.75% 12/1/14 | | 1,460,000 | | 1,691,979 |
Delaware City School District: | | | | |
0% 12/1/09 (FGIC Insured) | | 1,000,000 | | 834,640 |
5.5% 12/1/08 (FGIC Insured) | | 1,400,000 | | 1,513,554 |
Delaware County Gen. Oblig.: | | | | |
6% 12/1/25 | | 1,000,000 | | 1,157,380 |
6.25% 12/1/20 | | 1,250,000 | | 1,486,900 |
Dublin City School District: | | | | |
5% 12/1/21 (FSA Insured) | | 1,500,000 | | 1,585,740 |
5% 12/1/22 (FSA Insured) | | 1,000,000 | | 1,049,730 |
Dublin Gen. Oblig. Series 2000 B, 6% 12/1/15 | | 2,000,000 | | 2,378,640 |
Fairborn City School District (School Impt. Proj.) 5.75% 12/1/26 (FSA Insured) | | 2,200,000 | | 2,469,610 |
Fairfield City School District 7.45% 12/1/14 (FGIC Insured) | | 1,000,000 | | 1,306,580 |
Franklin County Gen. Oblig.: | | | | |
5.375% 12/1/20 | | 2,000,000 | | 2,217,940 |
5.5% 12/1/15 | | 1,225,000 | | 1,355,769 |
5.5% 12/1/16 | | 1,290,000 | | 1,427,708 |
Franklin County Hosp. Rev.: | | | | |
(Holy Cross Health Sys. Corp. Proj.) 5.875% 6/1/21 | | 1,000,000 | | 1,040,550 |
5.5% 5/1/13 (AMBAC Insured) | | 1,130,000 | | 1,278,979 |
Franklin County Rev. (OCLC Online Computer Library Ctr., Inc. Proj.) 5% 4/15/12 | | 2,505,000 | | 2,693,176 |
Gallia County Hosp. Facilities Rev. (Holzer Med. Ctr. Proj.) 5.125% 10/1/13 (AMBAC Insured) | | 3,000,000 | | 3,262,800 |
Municipal Bonds - continued |
| Principal
Amount | | Value
(Note 1) |
Ohio - continued |
Gateway Econ. Dev. Corp. Greater Cleveland Stadium Rev. Series 1990, 6.5% 9/15/14 (d) | | $ 3,000,000 | | $ 3,072,030 |
Greene County Swr. Sys. Rev. 0% 12/1/09 (AMBAC Insured) | | 775,000 | | 646,846 |
Greene County Wtr. Sys. Rev. Series A, 6% 12/1/16 (FGIC Insured) | | 2,500,000 | | 2,875,825 |
Hamilton County Gen. Oblig.: | | | | |
5.25% 12/1/16 | | 1,900,000 | | 2,061,481 |
5.25% 12/1/17 | | 2,005,000 | | 2,168,488 |
Hamilton County Sales Tax Series B, 5.25% 12/1/32 (AMBAC Insured) | | 4,700,000 | | 4,898,246 |
Hamilton County Swr. Sys. Rev. (Metro. Swr. District Proj.) Series A, 5.75% 12/1/25 (MBIA Insured) | | 6,000,000 | | 6,709,740 |
Hilliard School District: | | | | |
Series A, 5% 12/1/20 (FGIC Insured) | | 1,000,000 | | 1,040,500 |
0% 12/1/11 (FGIC Insured) | | 3,720,000 | | 2,816,635 |
5.75% 12/1/28 (FGIC Insured) | | 3,005,000 | | 3,363,557 |
Kings Local School District 6.1% 12/1/25 | | 6,800,000 | | 7,888,816 |
Lake Local School District Stark County Series 2000, 5.75% 12/1/26 (FGIC Insured) | | 2,780,000 | | 3,099,283 |
Lakewood Gen. Oblig.: | | | | |
Series A, 6.6% 12/1/11 | | 1,630,000 | | 2,009,611 |
6.6% 12/1/08 | | 1,525,000 | | 1,799,820 |
Lakewood Hosp. Impt. Rev. (Lakewood Hosp. Assoc. Proj.): | | | | |
5.5% 2/15/10 | | 1,000,000 | | 1,092,210 |
5.5% 2/15/11 | | 1,875,000 | | 2,037,919 |
5.5% 2/15/12 | | 1,000,000 | | 1,083,150 |
Licking Heights Local School District (Facilities Construction & Impt. Proj.) Series A, 5.5% 12/1/24 (FGIC Insured) | | 2,400,000 | | 2,615,208 |
Lima Swr. Sys. Rev. Impt. 6.3% 12/1/12 (AMBAC Insured) | | 2,500,000 | | 2,533,200 |
Lorain County 5.5% 12/1/22 (FGIC Insured) | | 2,985,000 | | 3,276,217 |
Lowellville San. Swr. Sys. Rev. (Browning-Ferris Industries, Inc. Proj.) 7.25% 6/1/06 (d) | | 500,000 | | 503,950 |
Lucas County Hosp. Rev. (Promedia Health Care Oblig. Group Proj.): | | | | |
5.375% 11/15/23 (AMBAC Insured) | | 5,000,000 | | 5,278,900 |
5.625% 11/15/12 (AMBAC Insured) | | 2,000,000 | | 2,275,840 |
5.625% 11/15/13 (AMBAC Insured) | | 1,200,000 | | 1,360,680 |
Marion County Hosp. Impt. Rev. (Cmnty. Hosp. Proj.) 6.1% 5/15/06 | | 1,000,000 | | 1,068,620 |
Municipal Bonds - continued |
| Principal
Amount | | Value
(Note 1) |
Ohio - continued |
Medina City School District 5.25% 12/1/28 (FGIC Insured) | | $ 11,175,000 | | $ 11,637,869 |
Montgomery County Gen. Oblig. 5.5% 12/1/25 | | 2,235,000 | | 2,415,834 |
Montgomery County Rev. (Catholic Health Initiatives Proj.) Series A: | | | | |
6% 12/1/19 | | 2,000,000 | | 2,222,420 |
6% 12/1/26 | | 3,000,000 | | 3,236,760 |
Ohio Air Quality Dev. Auth. Rev.: | | | | |
(Columbus & Southern Pwr. Co. Proj.) Series A, 6.375% 12/1/20 (FGIC Insured) | | 3,000,000 | | 3,040,470 |
(Dayton Pwr. & Lt. Co. Proj.) 6.1% 9/1/30 | | 4,000,000 | | 4,072,800 |
(Ohio Edison Co. Proj.) Series A, 3.25%, tender 2/1/08 (AMBAC Insured) (c) | | 2,000,000 | | 2,033,700 |
(Pennsylvania Pwr. Co. Proj.) 2.5%, tender 7/1/04 (c) | | 3,000,000 | | 2,999,850 |
Ohio Bldg. Auth.: | | | | |
(Administration Bldg. Fund Prog.): | | | | |
Series 1999 A, 5.25% 10/1/11 | | 2,205,000 | | 2,472,952 |
Series A: | | | | |
4.75% 10/1/17 | | 1,000,000 | | 1,037,840 |
4.875% 10/1/10 | | 1,000,000 | | 1,075,600 |
(Adult Correctional Bldg. Fund Prog.): | | | | |
Series 1999 A, 5.5% 10/1/11 | | 3,370,000 | | 3,833,072 |
Series 2001 A, 5.5% 10/1/12 (FSA Insured) | | 1,000,000 | | 1,150,770 |
Series A: | | | | |
5.25% 10/1/17 | | 1,000,000 | | 1,092,760 |
5.75% 4/1/11 | | 2,865,000 | | 3,319,504 |
(Juvenile Correctional Bldg. Fund Prog.) 5.5% 4/1/12 | | 2,960,000 | | 3,380,468 |
(Sports Facilities Bldg. Fund Prog.) Series 1999 A, 5.25% 10/1/12 | | 2,940,000 | | 3,278,159 |
Series 2003 A, 5% 4/1/10 (FGIC Insured) | | 4,500,000 | | 5,059,800 |
Series A: | | | | |
5% 4/1/11 (FGIC Insured) | | 6,000,000 | | 6,763,440 |
5% 4/1/11 (FSA Insured) | | 1,425,000 | | 1,606,317 |
5% 4/1/17 (MBIA Insured) | | 2,485,000 | | 2,688,025 |
Ohio Gen. Oblig.: | | | | |
(College Savings Prog.): | | | | |
0% 8/1/09 | | 2,290,000 | | 1,921,287 |
0% 8/1/10 | | 2,000,000 | | 1,602,220 |
0% 8/1/14 | | 1,375,000 | | 895,510 |
(Higher Ed. Cap. Facilities Proj.) Series A, 5.375% 8/1/16 | | 5,930,000 | | 6,618,651 |
Municipal Bonds - continued |
| Principal
Amount | | Value
(Note 1) |
Ohio - continued |
Ohio Gen. Oblig.: - continued | | | | |
(Mental Health Cap. Facilities Proj.): | | | | |
Series 2001 B, 5% 6/1/09 | | $ 1,925,000 | | $ 2,156,077 |
Series IIA, 5.25% 6/1/17 | | 2,670,000 | | 2,936,786 |
Series IIB, 5.5% 6/1/15 | | 2,265,000 | | 2,533,312 |
Series 2001 IIA, 5.5% 12/1/13 | | 2,020,000 | | 2,315,243 |
Series 2002 B, 5.25% 11/1/20 | | 2,520,000 | | 2,731,302 |
Series 2003 C, 5% 3/15/11 | | 3,480,000 | | 3,927,528 |
Series A, 5.5% 9/15/16 | | 11,060,000 | | 12,453,770 |
Series F, 5% 2/1/19 | | 6,665,000 | | 7,075,831 |
Series IIB, 5% 6/1/10 | | 1,925,000 | | 2,158,406 |
6.65% 9/1/09 | | 1,000,000 | | 1,143,430 |
Ohio Higher Edl. Facilities Rev. (Case Western Reserve Univ. 2002 Proj.): | | | | |
Series B, 6.5% 10/1/20 | | 2,250,000 | | 2,869,965 |
Series C, 5.125% 10/1/17 | | 2,985,000 | | 3,206,726 |
6.125% 10/1/15 | | 2,000,000 | | 2,415,320 |
6.25% 10/1/16 | | 2,500,000 | | 3,048,150 |
Ohio Higher Edl. Facility Commission Rev. (Denison Univ. Proj.): | | | | |
5.3% 11/1/21 | | 3,775,000 | | 3,994,139 |
5.5% 11/1/14 | | 1,000,000 | | 1,142,840 |
Ohio Hsg. Fin. Agcy. Mtg. Rev. (Residential Proj.): | | | | |
Series B2, 5.375% 9/1/19 (d) | | 1,250,000 | | 1,255,475 |
Series C, 4.9% 9/1/26 (d) | | 565,000 | | 575,775 |
Ohio Poll. Cont. Rev. (Standard Oil Co. Proj.) 6.75% 12/1/15 | | 3,100,000 | | 3,889,818 |
Ohio Pub. Facilities Commission Rev. (Mental Health Cap. Facilities Proj.) Series 2000 IIA, 5.375% 6/1/14 | | 2,200,000 | | 2,451,988 |
Ohio Rev. Series 2003-1, 5% 6/15/10 (a) | | 3,000,000 | | 3,356,460 |
Ohio Solid Waste Rev. (Waste Mgmt., Inc. Proj.) 4.85%, tender 11/1/07 (c)(d) | | 3,000,000 | | 3,155,550 |
Ohio State Univ. Gen. Receipts: | | | | |
Series 2002 A, 5.125% 12/1/31 | | 4,000,000 | | 4,132,040 |
Series A, 5.8% 12/1/29 | | 3,300,000 | | 3,681,216 |
Series B, 5.25% 6/1/16 | | 2,000,000 | | 2,229,940 |
Ohio Tpk. Commission Tpk. Rev.: | | | | |
Series A, 5.5% 2/15/21 (FGIC Insured) | | 5,000,000 | | 5,801,100 |
5.5% 2/15/26 | | 3,700,000 | | 3,962,330 |
Ohio Univ. Gen. Receipts Athens 5% 12/1/10 (FSA Insured) | | 1,950,000 | | 2,203,325 |
Municipal Bonds - continued |
| Principal
Amount | | Value
(Note 1) |
Ohio - continued |
Ohio Wtr. Dev. Auth. Poll. Cont. Facilities Rev.: | | | | |
(Cleveland Elec. Illuminating Co. Proj.) Series A, 3.4%, tender 10/1/04 (c) | | $ 2,000,000 | | $ 2,012,840 |
(Toledo Edison Co. Proj.) Series B, 4.5%, tender 9/1/05 (c) | | 2,000,000 | | 2,051,220 |
Ohio Wtr. Dev. Auth. Rev.: | | | | |
(Drinking Wtr. Fund Prog.) Series 2002, 5.5% 12/1/21 | | 4,040,000 | | 4,456,282 |
(Fresh Wtr. Impt. Proj.): | | | | |
Series B, 5.5% 6/1/16 (FSA Insured) | | 1,560,000 | | 1,831,877 |
5.375% 12/1/17 | | 135,000 | | 150,204 |
5.375% 12/1/19 | | 3,000,000 | | 3,294,780 |
(Pure Wtr. Proj.): | | | | |
Series I, 6% 12/1/16 (Escrowed to Maturity) (e) | | 1,685,000 | | 2,005,790 |
5.5% 12/1/18 (AMBAC Insured) | | 800,000 | | 810,448 |
Ohio Wtr. Dev. Auth. Solid Waste Disp. Rev. (North Star BHP Steel/Cargill Proj.) 6.3% 9/1/20 (d) | | 6,350,000 | | 6,600,063 |
Ohio Wtr. Dev. Auth. Wtr. Poll. Cont. Rev. 5.25% 6/1/10 | | 3,090,000 | | 3,528,935 |
Olentangy Local School District (School Facilities Construction & Impt. Proj.) Series A, 5.25% 12/1/17 | | 1,335,000 | | 1,479,407 |
Ottawa County San. Swr. Sys. Rev. (Danbury Proj.) 0% 10/1/06 (AMBAC Insured) | | 1,445,000 | | 1,365,467 |
Pickerington Local School District: | | | | |
5.25% 12/1/20 (FGIC Insured) | | 5,000,000 | | 5,385,350 |
5.8% 12/1/09 (FGIC Insured) | | 1,000,000 | | 1,171,590 |
Plain Local School District 6% 12/1/25 (FGIC Insured) | | 990,000 | | 1,141,302 |
Richland County Hosp. Facilities (MedCentral Health Sys. Proj.) Series B: | | | | |
6.375% 11/15/22 | | 1,500,000 | | 1,589,430 |
6.375% 11/15/30 | | 1,000,000 | | 1,054,330 |
Scioto County Marine Term. Facilities Rev. (Norfolk Southern Corp. Proj.) 5.3% 8/15/13 | | 3,000,000 | | 3,108,270 |
Sharonville Gen. Oblig. 5.25% 6/1/16 (FGIC Insured) | | 1,410,000 | | 1,566,214 |
Sugarcreek Local School District 5.25% 12/1/22 (MBIA Insured) | | 1,800,000 | | 1,932,894 |
Summit County Gen. Oblig.: | | | | |
5.25% 12/1/20 | | 1,645,000 | | 1,792,787 |
5.25% 12/1/21 | | 1,740,000 | | 1,887,465 |
Swanton Local School District 5.25% 12/1/21 (FGIC Insured) | | 3,415,000 | | 3,681,370 |
Toledo Swr. Sys. Rev. 5% 11/15/21 (AMBAC Insured) | | 1,000,000 | | 1,056,940 |
Toledo Wtrwks. Rev. 5% 11/15/16 (AMBAC Insured) | | 1,110,000 | | 1,215,317 |
Municipal Bonds - continued |
| Principal
Amount | | Value
(Note 1) |
Ohio - continued |
Univ. of Akron Gen. Receipts Series A: | | | | |
5% 1/1/20 (AMBAC Insured) | | $ 1,425,000 | | $ 1,510,001 |
5% 1/1/21 (AMBAC Insured) | | 1,510,000 | | 1,589,653 |
Univ. of Cincinnati Ctfs. of Prtn.: | | | | |
5.5% 6/1/11 (MBIA Insured) | | 1,045,000 | | 1,204,749 |
5.5% 6/1/12 (MBIA Insured) | | 1,315,000 | | 1,498,429 |
5.5% 6/1/15 (MBIA Insured) | | 1,000,000 | | 1,137,500 |
Warren County Gen. Oblig.: | | | | |
Swr. Impt. (P&G Co./Lower Miami Proj.) 5.5% 12/1/16 | | 1,455,000 | | 1,565,871 |
6.1% 12/1/12 | | 500,000 | | 578,745 |
6.65% 12/1/11 | | 420,000 | | 490,245 |
Westerville City School District: | | | | |
Series 2001, 5.5% 12/1/13 (MBIA Insured) | | 1,250,000 | | 1,424,188 |
5.5% 12/1/14 (MBIA Insured) | | 1,430,000 | | 1,619,246 |
| | 421,455,726 |
Puerto Rico - 1.2% |
Puerto Rico Commonwealth Hwy. & Trans. Auth. Hwy. Rev. Series Y, 5.5% 7/1/36 (FSA Insured) | | 1,000,000 | | 1,111,700 |
Puerto Rico Commonwealth Infrastructure Fing. Auth. Series 2000 A, 5.5% 10/1/40 (Escrowed to Maturity) (e) | | 3,800,000 | | 4,141,316 |
| | 5,253,016 |
TOTAL INVESTMENT PORTFOLIO - 99.0% (Cost $395,505,468) | | 426,708,742 |
NET OTHER ASSETS - 1.0% | | 4,329,804 |
NET ASSETS - 100% | $ 431,038,546 |
Futures Contracts |
| Expiration
Date | | Underlying
Face Amount
at Value | | Unrealized
Appreciation/
(Depreciation) |
Purchased |
Treasury Contracts |
30 US Treasury Bond Contracts | March 2004 | | $ 3,279,375 | | $ 44,815 |
|
The face value of futures purchased as a percentage of net assets - 0.8% |
Swap Agreements |
| | | Notional
Amount | | |
Interest Rate Swap |
Receive quarterly a fixed rate equal to 4.096% and pay quarterly a floating rate based on BMA Municipal Swap Index with JPMorgan Chase, Inc. | June 2019 | | $ 5,000,000 | | $ (15,601) |
Legend |
(a) Security or a portion of the security purchased on a delayed delivery or when-issued basis. |
(b) Security or a portion of the security was pledged to cover margin requirements for futures contracts. At the period end, the value of securities pledged amounted to $171,933. |
(c) The coupon rate shown on floating or adjustable rate securities represents the rate at period end. |
(d) Private activity obligations whose interest is subject to the federal alternative minimum tax for individuals. |
(e) Security collateralized by an amount sufficient to pay interest and principal. |
Other Information |
The distribution of municipal securities by revenue source, as a percentage of total net assets, is as follows: |
General Obligations | 55.6% |
Education | 11.0 |
Water & Sewer | 8.6 |
Electric Utilities | 6.7 |
Health Care | 6.5 |
Others* (individually less than 5%) | 11.6 |
| 100.0% |
*Includes net other assets |
Purchases and sales of securities, other than short-term securities, aggregated $94,695,836 and $96,377,652, respectively. |
Income Tax Information |
The fund hereby designates approximately $3,416,000 as a capital gain dividend for the purpose of the dividend paid deduction. |
See accompanying notes which are an integral part of the financial statements.
Annual Report
Spartan Ohio Municipal Income Fund
Financial Statements
Statement of Assets and Liabilities
| December 31, 2003 |
| | |
Assets | | |
Investment in securities, at value (cost $395,505,468) - See accompanying schedule | | $ 426,708,742 |
Cash | | 5,338,331 |
Receivable for fund shares sold | | 94,296 |
Interest receivable | | 3,205,592 |
Receivable for daily variation on futures contracts | | 3,750 |
Prepaid expenses | | 2,600 |
Other affiliated receivables | | 18 |
Other receivables | | 2,057 |
Total assets | | 435,355,386 |
| | |
Liabilities | | |
Payable for investments purchased
Regular delivery | $ 86,225 | |
Delayed delivery | 3,334,170 | |
Payable for fund shares redeemed | 247,746 | |
Distributions payable | 428,505 | |
Unrealized loss on swap agreements | 15,601 | |
Accrued management fee | 134,889 | |
Other affiliated payables | 37,317 | |
Other payables and accrued expenses | 32,387 | |
Total liabilities | | 4,316,840 |
| | |
Net Assets | | $ 431,038,546 |
Net Assets consist of: | | |
Paid in capital | | $ 398,902,826 |
Undistributed net investment income | | 196,860 |
Accumulated undistributed net realized gain (loss) on investments | | 706,372 |
Net unrealized appreciation (depreciation) on investments | | 31,232,488 |
Net Assets, for 35,627,779 shares outstanding | | $ 431,038,546 |
Net Asset Value, offering price and redemption price per share ($431,038,546 ÷ 35,627,779 shares) | | $ 12.10 |
See accompanying notes which are an integral part of the financial statements.
Annual Report
Spartan Ohio Municipal Income Fund
Financial Statements - continued
Statement of Operations
| Year ended December 31, 2003 |
| | |
Investment Income | | |
Interest | | $ 20,430,240 |
| | |
Expenses | | |
Management fee | $ 1,652,024 | |
Transfer agent fees | 331,942 | |
Accounting fees and expenses | 141,057 | |
Non-interested trustees' compensation | 2,432 | |
Custodian fees and expenses | 7,429 | |
Registration fees | 19,988 | |
Audit | 52,479 | |
Legal | 5,092 | |
Miscellaneous | 1,154 | |
Total expenses before reductions | 2,213,597 | |
Expense reductions | (51,030) | 2,162,567 |
Net investment income (loss) | | 18,267,673 |
Realized and Unrealized Gain (Loss) Net realized gain (loss) on: | | |
Investment securities | 4,184,024 | |
Swap agreements | 85,200 | |
Total net realized gain (loss) | | 4,269,224 |
Change in net unrealized appreciation (depreciation) on: Investment securities | 1,192,127 | |
Futures contracts | 44,815 | |
Swap agreements | (15,601) | |
Total change in net unrealized appreciation (depreciation) | | 1,221,341 |
Net gain (loss) | | 5,490,565 |
Net increase (decrease) in net assets resulting from operations | | $ 23,758,238 |
See accompanying notes which are an integral part of the financial statements.
Annual Report
Statement of Changes in Net Assets
| Year ended
December 31,
2003 | Year ended
December 31,
2002 |
Increase (Decrease) in Net Assets | | |
Operations | | |
Net investment income (loss) | $ 18,267,673 | $ 18,775,062 |
Net realized gain (loss) | 4,269,224 | 4,327,387 |
Change in net unrealized appreciation (depreciation) | 1,221,341 | 15,619,238 |
Net increase (decrease) in net assets resulting
from operations | 23,758,238 | 38,721,687 |
Distributions to shareholders from net investment income | (18,304,425) | (18,686,297) |
Distributions to shareholders from net realized gain | (3,358,167) | (2,874,270) |
Total distributions | (21,662,592) | (21,560,567) |
Share transactions
Net proceeds from sales of shares | 47,985,138 | 73,548,628 |
Reinvestment of distributions | 15,661,112 | 15,418,496 |
Cost of shares redeemed | (69,763,780) | (70,428,334) |
Net increase (decrease) in net assets resulting from share transactions | (6,117,530) | 18,538,790 |
Redemption fees | 3,031 | 4,768 |
Total increase (decrease) in net assets | (4,018,853) | 35,704,678 |
| | |
Net Assets | | |
Beginning of period | 435,057,399 | 399,352,721 |
End of period (including undistributed net investment income of $196,860 and undistributed net investment income of $140,984, respectively) | $ 431,038,546 | $ 435,057,399 |
Other Information Shares | | |
Sold | 3,964,572 | 6,209,617 |
Issued in reinvestment of distributions | 1,296,316 | 1,298,102 |
Redeemed | (5,793,188) | (5,947,963) |
Net increase (decrease) | (532,300) | 1,559,756 |
See accompanying notes which are an integral part of the financial statements.
Annual Report
Financial Highlights
Years ended December 31, | 2003 | 2002 | 2001 | 2000 | 1999 |
Selected Per-Share Data | | | | | |
Net asset value, beginning of period | $ 12.03 | $ 11.54 | $ 11.54 | $ 10.86 | $ 11.74 |
Income from Investment Operations | | | | | |
Net investment income (loss) | .507B | .527B | .542B,D | .552B | .536 |
Net realized and unrealized gain (loss) | .166 | .568 | (.002)D | .681 | (.857) |
Total from investment operations | .673 | 1.095 | .540 | 1.233 | (.321) |
Distributions from net investment income | (.508) | (.525) | (.540) | (.553) | (.536) |
Distributions from net realized gain | (.095) | (.080) | - | - | (.011) |
Distributions in excess of net realized gain | - | - | - | - | (.012) |
Total distributions | (.603) | (.605) | (.540) | (.553) | (.559) |
Redemption fees added to paid in capital | -B,E | -B,E | -B,E | - | - |
Net asset value, end of period | $ 12.10 | $ 12.03 | $ 11.54 | $ 11.54 | $ 10.86 |
Total ReturnA | 5.72% | 9.68% | 4.73% | 11.68% | (2.83)% |
Ratios to Average Net AssetsC | | | | | |
Expenses before expense
reductions | .51% | .51% | .51% | .52% | .52% |
Expenses net of voluntary
waivers, if any | .51% | .51% | .51% | .52% | .52% |
Expenses net of all reductions | .50% | .49% | .46% | .46% | .51% |
Net investment income (loss) | 4.20% | 4.45% | 4.64%D | 4.99% | 4.71% |
Supplemental Data | | | | | |
Net assets, end of period
(000 omitted) | $ 431,039 | $ 435,057 | $ 399,353 | $ 381,052 | $ 352,973 |
Portfolio turnover rate | 22% | 19% | 17% | 28% | 14% |
A Total returns would have been lower had certain expenses not been reduced during the periods shown.
B Calculated based on average shares outstanding during the period.
C Expense ratios reflect operating expenses of the fund. Expenses before reductions do not reflect amounts reimbursed by the investment adviser or reductions from brokerage service arrangements or other expense offset arrangements and do not represent the amount paid by the fund during periods when reimbursements or reductions occur. Expenses net of any voluntary waivers reflect expenses after reimbursement by the investment adviser but prior to reductions from brokerage service arrangements or other expense offset arrangements. Expenses net of all reductions represent the net expenses paid by the fund.
D Effective January 1, 2001, the fund adopted the provisions of the AICPA Audit and Accounting Guide for Investment Companies and began amortizing premium and discount on all debt securities. Per-share data and ratios for periods prior to adoption have not been restated to reflect this change.
E Amount represents less than $.001 per share.
See accompanying notes which are an integral part of the financial statements.
Annual Report
Fidelity Ohio Municipal Money Market Fund
Investment Changes/Performance
Maturity Diversification |
Days | % of fund's
investments
12/31/03 | % of fund's
investments
6/30/03 | % of fund's
investments
12/31/02 |
0 - 30 | 77.0 | 82.5 | 75.6 |
31 - 90 | 3.4 | 4.1 | 3.8 |
91 - 180 | 11.0 | 8.9 | 11.0 |
181 - 397 | 8.6 | 4.5 | 9.6 |
Weighted Average Maturity |
| 12/31/03 | 6/30/03 | 12/31/02 |
Fidelity Ohio Municipal Money
Market Fund | 44 Days | 33 Days | 51 Days |
Ohio Tax-Free Money Market
Funds Average* | 53 Days | 42 Days | 49 Days |
Asset Allocation (% of fund's net assets) |
As of December 31, 2003 | As of June 30, 2003 |
| Variable Rate Demand Notes (VRDNs) 75.9% | | | Variable Rate Demand Notes (VRDNs) 67.9% | |
 | Commercial Paper (including CP Mode) 1.0% | | | Commercial Paper (including CP Mode) 0.0% | |
| Tender Bonds 4.1% | |  | Tender Bonds 3.6% | |
 | Municipal Notes 15.9% | | | Municipal Notes 15.0% | |
| Fidelity Municipal Cash Central Fund 1.0% | | | Fidelity Municipal Cash Central Fund 15.1% | |
 | Other Investments 3.2% | | | Other Investments 0.9% | |
 | Net Other Assets** (1.1)% | | | Net Other Assets** (2.5)% | |

** Net Other Assets are not included in the pie chart.
Current and Historical Seven-Day Yields
| 12/29/03 | 9/29/03 | 6/30/03 | 3/31/03 | 12/30/02 |
Fidelity Ohio Municipal Money Market Fund | 0.69% | 0.60% | 0.61% | 0.79% | 1.17% |
Yield refers to the income paid by the fund over a given period. Yields for money market funds are usually for seven-day periods, as they are here, though they are expressed as annual percentage rates. Past performance is no guarantee of future results. Yield will vary and it is possible to lose money by investing in the fund.
*Source: iMoneyNet, Inc.
Annual Report
Fidelity Ohio Municipal Money Market Fund
Investments December 31, 2003
Showing Percentage of Net Assets
Municipal Securities - 101.1% |
| Principal
Amount | | Value
(Note 1) |
Ohio - 100.1% |
American Muni. Pwr.: | | | |
BAN: | | | |
1.1% 8/19/04 | $ 2,660,000 | | $ 2,660,000 |
1.25% 12/2/04 | 1,641,000 | | 1,641,000 |
RAN 1.2% 10/7/04 | 840,000 | | 840,000 |
Ashtabula County Indl. Dev. Rev. (Plasticolors, Inc. Proj.)
Series 1996 A, 1.35%, LOC Key Bank NA, VRDN (b)(e) | 1,920,000 | | 1,920,000 |
Bellefontaine Healthcare Facilities Rev. (High Point Reg'l. Cancer Ctr. Proj.) 1.18%, LOC Fifth Third Bank, Cincinnati, VRDN (b) | 3,910,000 | | 3,910,000 |
Butler County Gen. Oblig. BAN: | | | |
Series C, 2% 9/23/04 | 1,765,000 | | 1,776,152 |
1.12% 10/14/04 | 1,925,000 | | 1,925,000 |
1.5% 6/10/04 | 1,550,000 | | 1,553,030 |
Cambridge Hosp. Facilities Rev. (Southeastern Reg'l. Med. Ctr. Proj.) 1.4%, LOC Nat'l. City Bank, VRDN (b) | 5,080,000 | | 5,080,000 |
Cincinnati City School District: | | | |
Participating VRDN 1.26% (Liquidity Facility JPMorgan Chase Bank) (b)(f) | 3,870,000 | | 3,870,000 |
BAN 1.65% 9/10/04 | 2,000,000 | | 2,007,521 |
Cincinnati Gen. Oblig. BAN 1.5% 2/2/04 | 4,610,000 | | 4,611,979 |
Cincinnati Student Ln. Fdg. Corp. Student Ln. Rev.: | | | |
Series 1998 A1, 1.15% (Liquidity Facility Sallie Mae), VRDN (b)(e) | 7,700,000 | | 7,700,000 |
Series 1998 A2, 1.15% (Liquidity Facility Sallie Mae), VRDN (b)(e) | 13,200,000 | | 13,200,000 |
Clark County Health Care Facilities Rev. (The Ohio Masonic Home Proj.) 1.33% (AMBAC Insured), VRDN (b) | 5,500,000 | | 5,500,000 |
Clermont County Indl. Dev. Rev. (American Micro Products Proj.) 1.45%, LOC U.S. Bank NA, Minnesota, VRDN (b)(e) | 2,500,000 | | 2,500,000 |
Cleveland Arpt. Sys. Rev. Participating VRDN: | | | |
Series PT 799, 1.34% (Liquidity Facility Merrill Lynch & Co., Inc.) (b)(e)(f) | 1,500,000 | | 1,500,000 |
Series SGA 126, 1.17% (Liquidity Facility Societe Generale) (b)(f) | 10,685,000 | | 10,685,000 |
Cleveland City School District RAN 6% 6/1/04 (AMBAC Insured) | 1,550,000 | | 1,581,508 |
Cleveland Gen. Oblig.: | | | |
Bonds 2% 8/1/04 (FGIC Insured) | 1,865,000 | | 1,875,356 |
Participating VRDN Series PT 2032, 1.28% (Liquidity Facility Merrill Lynch & Co., Inc.) (b)(f) | 3,065,000 | | 3,065,000 |
Cleveland Wtrwks. Rev.: | | | |
Bonds Series 2003 J, 5% 1/1/04 | 3,000,000 | | 3,000,000 |
Municipal Securities - continued |
| Principal
Amount | | Value
(Note 1) |
Ohio - continued |
Cleveland Wtrwks. Rev.: - continued | | | |
Participating VRDN Series Merlots 01 A24, 1.3% (Liquidity Facility Wachovia Bank NA) (b)(f) | $ 4,020,000 | | $ 4,020,000 |
Cleveland-Cuyahoga County Port Auth. Rev. (Euclid/93rd Garage & Office LLC Proj.) Series 2003, 1.15%, LOC Fifth Third Bank, Cincinnati, VRDN (b) | 2,500,000 | | 2,500,000 |
Columbus Gen. Oblig. Participating VRDN Series MS 01 585, 1.29% (Liquidity Facility Morgan Stanley) (b)(f) | 5,175,000 | | 5,175,000 |
Cuyahoga County Civic Facilities Rev. (Fairfax Dev. Corp. Proj.) 1.35%, LOC Key Bank NA, VRDN (b) | 4,745,000 | | 4,745,000 |
Cuyahoga County Econ. Dev. Rev. (Cleveland Botanical Garden Proj.) 1.32%, LOC Allied Irish Banks PLC, VRDN (b) | 10,000,000 | | 10,000,000 |
Cuyahoga County Health Care Facilities Rev. (Althenheim Proj.) 1.38%, LOC U.S. Bank NA, Minnesota, VRDN (b) | 6,700,000 | | 6,700,000 |
Cuyahoga County Hosp. Rev. (Univ. Hosp. Health Sys., Inc. Proj.) Series 1999 A, 1.27% (AMBAC Insured), VRDN (b) | 5,620,000 | | 5,620,000 |
Cuyahoga County Indl. Dev. Rev.: | | | |
(Progressive Plastics, Inc. Proj.) 1.55%, LOC Bank One NA, VRDN (b)(e) | 1,515,000 | | 1,515,000 |
(Pubco Corp. Proj.) Series 2001, 1.45%, LOC Nat'l. City Bank, VRDN (b)(e) | 3,250,000 | | 3,250,000 |
(The Great Lakes Brewing Co. Proj.) Series 1997, 1.44%, LOC Huntington Nat'l. Bank, Columbus, VRDN (b)(e) | 4,435,000 | | 4,435,000 |
Dayton Gen. Oblig. BAN: | | | |
2% 2/26/04 | 1,200,000 | | 1,201,719 |
2% 6/17/04 | 4,125,000 | | 4,141,927 |
Delaware County Health Care Facilities (Willow Brook Christian Cmnty. Proj.) Series 1999, 1.35%, LOC Huntington Nat'l. Bank, Columbus, VRDN (b) | 3,970,000 | | 3,970,000 |
Elyria Gen. Oblig. BAN: | | | |
1.35% 7/28/04 | 5,230,000 | | 5,240,931 |
2% 10/21/04 | 2,500,000 | | 2,518,467 |
Erie County Multi-family Hsg. Rev. (Providence Residential Comnty. Corp. Proj.) Series 1999 A, 1.38%, LOC Bank One NA, VRDN (b) | 10,255,000 | | 10,255,000 |
Euclid Gen. Oblig. BAN 2% 3/4/04 | 2,000,000 | | 2,002,895 |
Fairfield County Gen. Oblig. BAN 1.75% 4/15/04 | 1,400,000 | | 1,402,379 |
Franklin County Hosp. Rev. (Ohio Health Corp. Proj.) Series D, 1.2%, LOC Nat'l. City Bank, VRDN (b) | 4,055,000 | | 4,055,000 |
Franklin County Multi-family Rev. (Golf Pointe Apts. Proj.) Series 2000 A, 1.33%, LOC Lasalle Bank NA, VRDN (b)(e) | 6,800,000 | | 6,800,000 |
Municipal Securities - continued |
| Principal
Amount | | Value
(Note 1) |
Ohio - continued |
Franklin County Rev. (Trinity Health Cr. Group Proj.) Series 2000 F, 1.23% (Liquidity Facility JPMorgan Chase Bank) (Liquidity Facility Bayerische Landesbank Girozentrale), VRDN (b) | $ 6,055,000 | | $ 6,055,000 |
Geauga County Gen. Oblig. BAN 1.55% 3/4/04 | 1,200,000 | | 1,200,713 |
Geauga County Health Care Facilities Rev.: | | | |
(Heather Hill Lifecare Proj.) 1.33%, LOC Bank One NA, VRDN (b) | 9,720,000 | | 9,720,000 |
(Montefiore Hsg. Corp. Proj.) Series 2001, 1.35%, LOC Key Bank NA, VRDN (b) | 5,890,000 | | 5,890,000 |
Hamilton County Health Care Facilities Rev.: | | | |
(Twin Towers & Twin Lakes Proj.) Series B, 1.29%, LOC U.S. Bank NA, Minnesota, VRDN (b) | 6,000,000 | | 6,000,000 |
1.3%, LOC Fifth Third Bank, Cincinnati, VRDN (b) | 4,250,000 | | 4,250,000 |
Hamilton County Hosp. Facilities Rev. Series 2002 A, 1.14%, LOC JPMorgan Chase Bank, VRDN (b) | 10,000,000 | | 10,000,000 |
Hamilton County Indl. Dev. Rev. (Metro Containers, Inc. Proj.) 1.55%, LOC Bank One NA, VRDN (b)(e) | 110,000 | | 110,000 |
Hudson City Gen. Oblig. BAN 1.5% 5/25/04 | 14,155,000 | | 14,179,021 |
Independence Gen. Oblig. BAN 1.75% 7/1/04 | 2,150,000 | | 2,159,327 |
Jefferson Local School District Madison County BAN 1.8% 5/6/04 | 6,000,000 | | 6,014,392 |
Kent City School District BAN 1.72% 5/27/04 | 6,800,000 | | 6,817,726 |
Kent State Univ. Revs. Series 2001, 1.25% (MBIA Insured), VRDN (b) | 9,500,000 | | 9,500,000 |
Kettering Indl. Dev. Rev. (Millat Industries Corp. Proj.) 1.45%, LOC Nat'l. City Bank, VRDN (b)(e) | 3,225,000 | | 3,225,000 |
Keystone Local School District Lorain County BAN 1.75% 8/4/04 | 3,625,000 | | 3,638,131 |
Lake County Gen. Oblig. BAN 2% 4/15/04 | 3,000,000 | | 3,007,232 |
Lake County Indl. Dev. Rev.: | | | |
(American Bus. Co. Proj.) 1.43%, LOC Huntington Nat'l. Bank, Columbus, VRDN (b)(e) | 1,030,000 | | 1,030,000 |
(Norshar Co. Proj.) 1.55%, LOC Bank One NA, VRDN (b)(e) | 3,020,000 | | 3,020,000 |
Lima Hosp. Rev. (Lima Memorial Hosp. Proj.) 1.45%, LOC Bank One NA, Chicago, VRDN (b) | 2,500,000 | | 2,500,000 |
Lucas County Multi-family Rev. (Lakewoods Proj.) 1.35%, LOC Key Bank NA, VRDN (b)(e) | 4,000,000 | | 4,000,000 |
Medina County Indl. Dev. Rev.: | | | |
(Firedex, Inc. Proj.) Series 1997, 1.35%, LOC Key Bank NA, VRDN (b)(e) | 915,000 | | 915,000 |
(Rembond Proj.) Series 1996, 1.55%, LOC Bank One NA, VRDN (b)(e) | 2,035,000 | | 2,035,000 |
Municipal Securities - continued |
| Principal
Amount | | Value
(Note 1) |
Ohio - continued |
Middletown City School District BAN 1.75% 6/10/04 | $ 6,700,000 | | $ 6,717,567 |
Middletown Dev. Rev. (Bishop Fenwick High School Proj.) 1.2%, LOC Bank One NA, VRDN (b) | 2,450,000 | | 2,450,000 |
Montgomery County Health Care Facilities Rev.: | | | |
(Eastway Corp. & Property Resource Proj.) Series 1997, 1.43%, LOC Huntington Nat'l. Bank, Columbus, VRDN (b)(e) | 2,705,000 | | 2,705,000 |
(Kettering Affiliated Proj.) 1.45%, LOC Bank One NA, VRDN (b) | 2,600,000 | | 2,600,000 |
Montgomery County Multi-family Hsg. Dev. Rev. (Pedcor Invts.-Lyons Gate Proj.) 1.32%, LOC Fed. Home Ln. Bank, Cincinnati, VRDN (b)(e) | 4,420,000 | | 4,420,000 |
Ohio Air Quality Dev. Auth. Rev.: | | | |
Participating VRDN Series PA 769R, 1.28% (Liquidity Facility Merrill Lynch & Co., Inc.) (b)(f) | 4,180,000 | | 4,180,000 |
(Cincinnati Gas & Elec. Co. Proj.) Series A, 1.4%, LOC Cr. Lyonnais SA, VRDN (b)(e) | 4,000,000 | | 4,000,000 |
(JMG Fdg. LP Proj.) Series 1995 A, 1.13%, LOC WestLB AG, VRDN (b)(e) | 3,700,000 | | 3,700,000 |
(Timken Co. Proj.) 1.12%, LOC Key Bank NA, VRDN (b) | 5,700,000 | | 5,700,000 |
Series 1994 A, 1.13%, LOC WestLB AG, VRDN (b)(e) | 10,000,000 | | 10,000,000 |
Ohio Bldg. Auth. Participating VRDN: | | | |
Series FRRI 02 L 31J, 1.3% (Liquidity Facility Lehman Brothers Hldgs., Inc.) (b)(f) | 5,375,000 | | 5,375,000 |
Series PT 1824, 1.28% (Liquidity Facility Merrill Lynch & Co., Inc.) (b)(f) | 6,400,000 | | 6,400,000 |
Ohio Gen. Oblig. Participating VRDN: | | | |
Series PT 1808, 1.28% (Liquidity Facility WestLB AG) (b)(f) | 2,590,000 | | 2,590,000 |
Series PT 1823, 1.28% (Liquidity Facility Merrill Lynch & Co., Inc.) (b)(f) | 6,500,000 | | 6,500,000 |
Series PT 1831, 1.28% (Liquidity Facility Merrill Lynch & Co., Inc.) (b)(f) | 5,650,000 | | 5,650,000 |
Series Putters 02 306, 1.27% (Liquidity Facility J.P. Morgan Chase & Co.) (b)(f) | 7,375,000 | | 7,375,000 |
Ohio Higher Edl. Facilities Rev. (Pooled Fing. Prog.): | | | |
Series A, 1.3%, LOC Fifth Third Bank, Cincinnati, VRDN (b) | 3,000,000 | | 3,000,000 |
Series B, 1.27%, LOC Fifth Third Bank, Cincinnati, VRDN (b) | 5,000,000 | | 5,000,000 |
Ohio Higher Edl. Facility Commission Rev.: | | | |
Bonds (Oberlin College 1999 Proj.) Series MS 98 116, 1.05%, tender 7/8/04 (Liquidity Facility Morgan Stanley) (b)(f)(g) | 10,120,000 | | 10,120,000 |
Municipal Securities - continued |
| Principal
Amount | | Value
(Note 1) |
Ohio - continued |
Ohio Higher Edl. Facility Commission Rev.: - continued | | | |
(Pooled Fing. Prog.): | | | |
Series 1996, 1.4%, LOC Fifth Third Bank, Cincinnati, VRDN (b) | $ 2,285,000 | | $ 2,285,000 |
Series 1999, 1.4%, LOC Fifth Third Bank, Cincinnati, VRDN (b) | 6,200,000 | | 6,200,000 |
Series A, 1.3%, LOC Fifth Third Bank, Cincinnati, VRDN (b) | 5,800,000 | | 5,800,000 |
Ohio Hsg. Fin. Agcy. Mtg. Rev.: | | | |
Bonds: | | | |
Series LB 03 L46J, 1.05%, tender 4/7/04 (Liquidity Facility Lehman Brothers Hldgs., Inc.) (b)(e)(f)(g) | 6,700,000 | | 6,700,000 |
Series PT 228, 1.4%, tender 12/9/04 (Liquidity Facility Merrill Lynch & Co., Inc.) (b)(e)(f)(g) | 5,640,000 | | 5,640,000 |
Series PT 567, 1.1%, tender 2/12/04 (Liquidity Facility Danske Bank AS) (b)(e)(f)(g) | 5,675,000 | | 5,675,000 |
Participating VRDN: | | | |
Series BA 00 Q, 1.38% (Liquidity Facility Bank of America NA) (b)(e)(f) | 1,440,000 | | 1,440,000 |
Series BA 01 I, 1.35% (Liquidity Facility Bank of America NA) (b)(e)(f) | 4,800,000 | | 4,800,000 |
Series BA 98 B, 1.38% (Liquidity Facility Bank of America NA) (b)(e)(f) | 14,695,000 | | 14,695,000 |
Series BA 98 Q, 1.38% (Liquidity Facility Bank of America NA) (b)(e)(f) | 4,600,000 | | 4,600,000 |
Series BA 99 Q, 1.38% (Liquidity Facility Bank of America NA) (b)(e)(f) | 3,745,000 | | 3,745,000 |
Series FRRI 25, 1.35% (Liquidity Facility Bank of New York NA) (b)(e)(f) | 1,920,000 | | 1,920,000 |
Series Merlots 00 A1, 1.35% (Liquidity Facility Wachovia Bank NA) (b)(e)(f) | 9,110,000 | | 9,110,000 |
Series Merlots 00 AA, 1.26% (Liquidity Facility Wachovia Bank NA) (b)(e)(f) | 1,910,000 | | 1,910,000 |
Series Merlots 01 A78, 1.26% (Liquidity Facility Wachovia Bank NA) (b)(e)(f) | 3,185,000 | | 3,185,000 |
Series Merlots 02 A34, 1.26% (Liquidity Facility Wachovia Bank NA) (b)(e)(f) | 3,595,000 | | 3,595,000 |
Series PT 1334, 1.33% (Liquidity Facility Merrill Lynch & Co., Inc.) (b)(e)(f) | 5,120,000 | | 5,120,000 |
Series PT 241, 1.33% (Liquidity Facility Merrill Lynch & Co., Inc.) (b)(e)(f) | 5,110,000 | | 5,110,000 |
Series PT 506, 1.33% (Liquidity Facility Merrill Lynch & Co., Inc.) (b)(e)(f) | 4,035,000 | | 4,035,000 |
Municipal Securities - continued |
| Principal
Amount | | Value
(Note 1) |
Ohio - continued |
Ohio Hsg. Fin. Agcy. Mtg. Rev.: - continued | | | |
Participating VRDN: | | | |
Series PT 582, 1.33% (Liquidity Facility Svenska Handelsbanken AB) (b)(e)(f) | $ 2,400,000 | | $ 2,400,000 |
Ohio Hsg. Fin. Agcy. Multi-family Hsg. Rev.: | | | |
(Club at Spring Valley Apts. Proj.) Series 1996 A, 1.22%, LOC Key Bank NA, VRDN (b)(e) | 7,500,000 | | 7,500,000 |
(Pedcor Invt. Willowlake Apts. Proj.): | | | |
Series A, 1.34%, LOC Bank One NA, VRDN (b)(e) | 3,015,000 | | 3,015,000 |
Series B, 1.44%, LOC Fed. Home Ln. Bank, Indianapolis, VRDN (b)(e) | 485,000 | | 485,000 |
Series C, 1.44%, LOC Fed. Home Ln. Bank, Indianapolis, VRDN (b)(e) | 625,000 | | 625,000 |
Series D, 1.44%, LOC Fed. Home Ln. Bank, Indianapolis, VRDN (b)(e) | 625,000 | | 625,000 |
(Pine Crossing Apts. Proj.) 1.33%, LOC Lasalle Bank NA, VRDN (b)(e) | 5,670,000 | | 5,670,000 |
(Shannon Glenn Apts. Proj.) 1.3%, LOC Fannie Mae, VRDN (b)(e) | 6,700,000 | | 6,700,000 |
Ohio Indl. Dev. Rev.: | | | |
(K&S Realty Proj.) Series 1989 I, 1.25%, LOC Nat'l. City Bank, VRDN (b)(e) | 125,000 | | 125,000 |
(K&S Realty/Starr Fabricating, Inc. Proj.) Series 1989 III, 1.25%, LOC Nat'l. City Bank, VRDN (b)(e) | 160,000 | | 160,000 |
(Midwest Acoust-A-Fiber, Inc. Proj.) Series 1989 I, 1.25%, LOC Nat'l. City Bank, VRDN (b)(e) | 105,000 | | 105,000 |
(Plasticos Co. Proj.) Series 1989 IIIA, 1.25%, LOC Nat'l. City Bank, VRDN (b)(e) | 20,000 | | 20,000 |
(Standby Screw & Machine Proj.) Series 1991 IA, 1.25%, LOC Nat'l. City Bank, VRDN (b)(e) | 170,000 | | 170,000 |
Ohio Poll. Cont. Rev. (Gen. Motors Corp. Proj.) Series 1985, 2.12%, VRDN (b) | 4,350,000 | | 4,350,000 |
Ohio Rev. Bonds Series 2003-1, 2% 6/15/04 (a) | 14,225,000 | | 14,284,318 |
Ohio Solid Waste Rev.: | | | |
(BP Exploration & Oil, Inc. Proj.): | | | |
Series 1998, 1.34%, VRDN (b)(e) | 2,300,000 | | 2,300,000 |
Series 1999, 1.34% (BP PLC Guaranteed), VRDN (b)(e) | 1,360,000 | | 1,360,000 |
1.34% (BP PLC Guaranteed), VRDN (b)(e) | 1,300,000 | | 1,300,000 |
(Republic Svcs., Inc. Proj.): | | | |
Series 2001, 1.4%, LOC Bank One NA, VRDN (b)(e) | 5,400,000 | | 5,400,000 |
1.4%, LOC Bank One NA, Chicago, VRDN (b)(e) | 3,500,000 | | 3,500,000 |
Ohio State Univ. Gen. Receipts Participating VRDN Series MS 851, 1.29% (Liquidity Facility Morgan Stanley) (b)(f) | 8,285,000 | | 8,285,000 |
Municipal Securities - continued |
| Principal
Amount | | Value
(Note 1) |
Ohio - continued |
Ohio Tpk. Commission Tpk. Rev. Participating VRDN Series MS 98 71, 1.29% (Liquidity Facility Morgan Stanley) (b)(f) | $ 9,090,000 | | $ 9,090,000 |
Ohio Univ. Gen. Receipts Athens BAN Series A, 1.55% 1/22/04 | 2,425,000 | | 2,425,413 |
Ohio Univ. Gen. Receipts Rev. Bonds 0.95% tender 3/11/04, CP mode | 6,800,000 | | 6,800,000 |
Ohio Wtr. Dev. Auth. (Waste Mgmt., Inc. Proj.) Series B, 1.27%, LOC Fleet Bank NA, VRDN (b)(e) | 4,700,000 | | 4,700,000 |
Ohio Wtr. Dev. Auth. Rev.: | | | |
Bonds (Pure Wtr. Proj.) 5% 6/1/04 (AMBAC Insured) | 2,500,000 | | 2,541,561 |
(Timken Co. Proj.) Series 2001, 1.12%, LOC Northern Trust Co., Chicago, VRDN (b) | 10,200,000 | | 10,200,000 |
Ohio Wtr. Dev. Auth. Solid Waste Disp. Rev. (American Steel & Wire Corp. Proj.) 1.32%, LOC Lasalle Bank NA, VRDN (b)(e) | 9,100,000 | | 9,100,000 |
Perrysburg Gen. Oblig. BAN 1.5% 8/12/04 | 3,485,000 | | 3,493,857 |
Plain Local School District RAN 2% 5/20/04 | 1,000,000 | | 1,003,632 |
Port of Greater Cincinnatti Dev. Auth. Rev. (Nat'l. Underground Railroad Freedom Ctr., Inc. Proj.) Series 2003 A, 1.2%, LOC Bank One NA, LOC Fifth Third Bank, Cincinnati, VRDN (b) | 6,500,000 | | 6,500,000 |
Portage County Gen. Oblig. BAN 1.75% 10/29/04 | 3,300,000 | | 3,318,026 |
Portage County Indl. Dev. Rev. (Mantaline Corp. Proj.) 1.45%, LOC Nat'l. City Bank, VRDN (b)(e) | 3,115,000 | | 3,115,000 |
Richland County Health Care Facilities Rev. (Mansfield Memorial Homes Proj.) Series 2002, 1.33%, LOC Key Bank NA, VRDN (b) | 5,030,000 | | 5,030,000 |
Richland County Indl. Dev. Rev. (Sabin Robbins Paper Co. Proj.) Series 1997, 1.35%, LOC Fifth Third Bank, Cincinnati, VRDN (b)(e) | 1,900,000 | | 1,900,000 |
Rickenbacker Port Auth. Indl. Dev. (Micro Industries Corp. Proj.) Series 2000, 1.55%, LOC Bank One NA, VRDN (b)(e) | 2,755,000 | | 2,755,000 |
Salem City Hosp. Facilities Rev. Series 2000, 1.35%, LOC PNC Bank NA, Pittsburgh, VRDN (b) | 5,800,000 | | 5,800,000 |
Stark County Gen. Oblig. BAN 1.4% 4/22/04 | 2,310,000 | | 2,311,741 |
Stark County Indl. Dev. Rev.: | | | |
(H-P Products, Inc. Proj.) 1.35%, LOC Key Bank NA, VRDN (b)(e) | 2,570,000 | | 2,570,000 |
(Kidd Dev. Proj.) 1.55%, LOC Bank One NA, VRDN (b)(e) | 3,055,000 | | 3,055,000 |
Summit County Indl. Dev. Rev.: | | | |
(Commercial Alloys Corp. Proj.): | | | |
1.45%, LOC Nat'l. City Bank, VRDN (b)(e) | 1,900,000 | | 1,900,000 |
1.6%, LOC Nat'l. City Bank, VRDN (b)(e) | 2,870,000 | | 2,870,000 |
Municipal Securities - continued |
| Principal
Amount | | Value
(Note 1) |
Ohio - continued |
Summit County Indl. Dev. Rev.: - continued | | | |
(Kaiser Dev. Proj.) 1.55%, LOC Nat'l. City Bank, VRDN (b)(e) | $ 685,000 | | $ 685,000 |
(Keltec, Inc. Proj.) Series 1987, 1.4%, LOC Nat'l. City Bank, VRDN (b)(e) | 180,000 | | 180,000 |
(Mannix Co. Proj.) Series 1987, 1.4%, LOC Bank One NA, VRDN (b)(e) | 985,000 | | 985,000 |
(Sigma Properties Proj.) Series 2000 B, 1.45%, LOC Nat'l. City Bank, VRDN (b)(e) | 2,080,000 | | 2,080,000 |
(Summit Plastic Co. Proj.) 1.45%, LOC Nat'l. City Bank, VRDN (b)(e) | 1,205,000 | | 1,205,000 |
(Triumph Hldgs. Proj.) 1.45%, LOC Nat'l. City Bank, VRDN (b)(e) | 1,445,000 | | 1,445,000 |
Talawanda City School District BAN 1.75% 8/3/04 | 3,000,000 | | 3,011,503 |
Tallmadge Gen. Oblig. BAN 1.75% 3/17/04 | 2,350,000 | | 2,353,039 |
Toledo City School District Participating VRDN Series MS 889, 1.28% (Liquidity Facility Morgan Stanley) (b)(f) | 4,535,000 | | 4,535,000 |
Toledo City Svcs. Spl. Assessment Notes 1.35%, LOC Bank One NA, VRDN (b) | 6,600,000 | | 6,600,000 |
Toledo-Lucas County Port Auth. Rev. (P&G Industries Proj.) 1.45%, LOC Nat'l. City Bank, VRDN (b)(e) | 2,395,000 | | 2,395,000 |
Trumbull County Indl. Dev. Rev. (McDonald Steel Corp. Proj.) Series 1990, 1.4%, LOC PNC Bank NA, Pittsburgh, VRDN (b)(e) | 600,000 | | 600,000 |
Twinsburg Indl. Dev. Rev. (United Stationers Supply Co. Proj.) 1.4%, LOC PNC Bank NA, Pittsburgh, VRDN (b)(e) | 1,800,000 | | 1,800,000 |
Union County Gen. Oblig. BAN 1.5% 6/10/04 | 4,225,000 | | 4,232,341 |
Van Wert County Indl. Dev. Rev. (Toledo Molding & Die, Inc. Proj.) Series 1994, 1.55%, LOC Fifth Third Bank, Cincinnati, VRDN (b)(e) | 470,000 | | 470,000 |
Warren City School District BAN 2% 7/15/04 | 8,100,000 | | 8,138,412 |
Warren County Health Care Facilities Rev. (Otterbein Homes Proj.) Series 1998 B, 1.35%, LOC Fifth Third Bank, Cincinnati, VRDN (b) | 5,200,000 | | 5,200,000 |
Wood County Indl. Dev. Rev.: | | | |
(CMC Group Proj.) Series 2001, 1.45%, LOC Nat'l. City Bank, VRDN (b)(e) | 2,350,000 | | 2,350,000 |
(Dowa THT America, Inc. Proj.) Series 1999, 1.2%, LOC Comerica Bank, Detroit, VRDN (b)(e) | 3,800,000 | | 3,800,000 |
Zanesville-Muskingum Port Auth. Indl. Dev. Rev. (Almana II LLC Proj.) Series 2000, 1.45%, LOC Bank One NA, VRDN (b)(e) | 6,550,000 | | 6,550,000 |
| | 688,737,816 |
Municipal Securities - continued |
| Shares | | Value
(Note 1) |
Other - 1.0% |
Fidelity Municipal Cash Central Fund, 1.3% (c)(d) | 6,746,500 | | $ 6,746,500 |
TOTAL INVESTMENT PORTFOLIO - 101.1% | | 695,484,316 |
NET OTHER ASSETS - (1.1)% | | (7,724,717) |
NET ASSETS - 100% | $ 687,759,599 |
Total Cost for Income Tax Purposes $ 695,484,316 |
Security Type Abbreviations |
BAN - BOND ANTICIPATION NOTE |
CP - COMMERCIAL PAPER |
RAN - REVENUE ANTICIPATION NOTE |
VRDN - VARIABLE RATE DEMAND NOTE |
Legend |
(a) Security or a portion of the security purchased on a delayed delivery or when-issued basis. |
(b) The coupon rate shown on floating or adjustable rate securities represents the rate at period end. |
(c) Information in this report regarding holdings by state and security types does not reflect the holdings of the Fidelity Municipal Cash Central Fund. |
(d) The rate quoted is the annualized seven-day yield of the fund at period end. A complete listing of the fund's holdings as of its most recent fiscal year end is available upon request. |
(e) Private activity obligations whose interest is subject to the federal alternative minimum tax for individuals. |
(f) Provides evidence of ownership in one or more underlying municipal bonds. |
(g) Restricted securities - Investment in securities not registered under the Securities Act of 1933 (excluding 144A issues). At the end of the period, the value of restricted securities (excluding 144A issues) amounted to $28,135,000 or 4.1% of net assets. |
Additional information on each holding is as follows: |
Security | Acquisition
Date | Cost |
Ohio Higher Edl. Facility Commission Rev. Bonds (Oberlin College 1999 Proj.) Series MS 98 116, 1.05%, tender 7/8/04 (Liquidity Facility Morgan Stanley) | 11/16/01 - 7/10/03 | $ 10,120,000 |
Ohio Hsg. Fin. Agcy. Mtg. Rev. Bonds:
Series LB 03 L46J, 1.05%, tender 4/7/04 (Liquidity Facility Lehman Brothers Hldgs., Inc.) | 10/29/03 | $ 6,700,000 |
Security | Acquisition
Date | Cost |
Ohio Hsg. Fin. Agcy. Mtg. Rev. Bonds: - continued Series PT 228, 1.4%, tender 12/9/04 (Liquidity Facility Merrill Lynch & Co., Inc.) | 8/10/99 | $ 5,640,000 |
Series PT 567, 1.1%, tender 2/12/04 (Liquidity Facility Danske Bank AS) | 6/28/01 - 2/4/03 | $ 5,675,000 |
Income Tax Information |
During the fiscal year ended December 31, 2003, 100.00% of the fund's income dividends was free from federal income tax, and 41.56% of the fund's income dividends was subject to the federal alternative minimum tax (unaudited). The fund will notify shareholders in January 2004 of amounts for use in preparing 2003 income tax returns. |
See accompanying notes which are an integral part of the financial statements.
Annual Report
Fidelity Ohio Municipal Money Market Fund
Financial Statements
Statement of Assets and Liabilities
| December 31, 2003 |
| | |
Assets | | |
Investment in securities, at value - See accompanying schedule | | $ 695,484,316 |
Cash | | 2,832,648 |
Receivable for fund shares sold | | 6,396,014 |
Interest receivable | | 1,586,415 |
Prepaid expenses | | 3,939 |
Other receivables | | 1,344 |
Total assets | | 706,304,676 |
| | |
Liabilities | | |
Payable for investments purchased on a delayed delivery basis | $ 14,284,318 | |
Payable for fund shares redeemed | 3,917,569 | |
Distributions payable | 5,397 | |
Accrued management fee | 213,178 | |
Other affiliated payables | 77,624 | |
Other payables and accrued expenses | 46,991 | |
Total liabilities | | 18,545,077 |
| | |
Net Assets | | $ 687,759,599 |
Net Assets consist of: | | |
Paid in capital | | $ 687,759,599 |
Net Assets, for 687,703,289 shares outstanding | | $ 687,759,599 |
Net Asset Value, offering price and redemption price per share ($687,759,599 ÷ 687,703,289 shares) | | $ 1.00 |
See accompanying notes which are an integral part of the financial statements.
Annual Report
Fidelity Ohio Municipal Money Market Fund
Financial Statements - continued
Statement of Operations
| Year ended December 31, 2003 |
| | |
Investment Income | | |
Interest | | $ 7,650,861 |
| | |
Expenses | | |
Management fee | $ 2,493,706 | |
Transfer agent fees | 817,484 | |
Accounting fees and expenses | 114,344 | |
Non-interested trustees' compensation | 3,248 | |
Custodian fees and expenses | 10,909 | |
Registration fees | 28,523 | |
Audit | 42,591 | |
Legal | 32,630 | |
Miscellaneous | 1,498 | |
Total expenses before reductions | 3,544,933 | |
Expense reductions | (81,327) | 3,463,606 |
Net investment income | | 4,187,255 |
Net realized gain (loss) on investment securities | | 101,248 |
Net increase in net assets resulting from operations | | $ 4,288,503 |
See accompanying notes which are an integral part of the financial statements.
Annual Report
Statement of Changes in Net Assets
| Year ended
December 31,
2003 | Year ended
December 31,
2002 |
Increase (Decrease) in Net Assets | | |
Operations | | |
Net investment income | $ 4,187,255 | $ 6,861,515 |
Net realized gain (loss) | 101,248 | 28,664 |
Net increase (decrease) in net assets resulting
from operations | 4,288,503 | 6,890,179 |
Distributions to shareholders from net investment income | (4,187,255) | (6,861,515) |
Share transactions at net asset value of $1.00 per share
Proceeds from sales of shares | 1,299,484,550 | 1,116,923,251 |
Reinvestment of distributions | 4,082,891 | 6,740,626 |
Cost of shares redeemed | (1,267,981,040) | (1,094,222,510) |
Net increase (decrease) in net assets and shares
resulting from share transactions | 35,586,401 | 29,441,367 |
Total increase (decrease) in net assets | 35,687,649 | 29,470,031 |
| | |
Net Assets | | |
Beginning of period | 652,071,950 | 622,601,919 |
End of period | $ 687,759,599 | $ 652,071,950 |
See accompanying notes which are an integral part of the financial statements.
Annual Report
Financial Highlights
Years ended December 31, | 2003 | 2002 | 2001 | 2000 | 1999 |
Selected Per-Share Data | | | | | |
Net asset value, beginning of period | $ 1.00 | $ 1.00 | $ 1.00 | $ 1.00 | $ 1.00 |
Income from Investment Operations | | | | | |
Net investment income | .006 | .011 | .025 | .036 | .028 |
Distributions from net investment income | (.006) | (.011) | (.025) | (.036) | (.028) |
Net asset value, end of period | $ 1.00 | $ 1.00 | $ 1.00 | $ 1.00 | $ 1.00 |
Total ReturnA | .64% | 1.13% | 2.52% | 3.71% | 2.86% |
Ratios to Average Net AssetsB | | | | | |
Expenses before expense
reductions | .54% | .54% | .55% | .56% | .57% |
Expenses net of voluntary
waivers, if any | .54% | .54% | .55% | .56% | .57% |
Expenses net of all reductions | .53% | .51% | .51% | .55% | .56% |
Net investment income | .64% | 1.12% | 2.47% | 3.64% | 2.83% |
Supplemental Data | | | | | |
Net assets, end of period
(000 omitted) | $ 687,760 | $ 652,072 | $ 622,602 | $ 516,018 | $ 489,971 |
A Total returns would have been lower had certain expenses not been reduced during the periods shown.
B Expense ratios reflect operating expenses of the fund. Expenses before reductions do not reflect amounts reimbursed by the investment adviser or reductions from brokerage service arrangements or other expense offset arrangements and do not represent the amount paid by the fund during periods when reimbursements or reductions occur. Expenses net of any voluntary waivers reflect expenses after reimbursement by the investment adviser but prior to reductions from brokerage service arrangements or other expense offset arrangements. Expenses net of all reductions represent the net expenses paid by the fund.
See accompanying notes which are an integral part of the financial statements.
Annual Report
Notes to Financial Statements
For the period ended December 31, 2003
1. Significant Accounting Policies.
Spartan Ohio Municipal Income Fund (the income fund) is a fund of Fidelity Municipal Trust. Fidelity Ohio Municipal Money Market Fund (the money market fund) is a fund of Fidelity Municipal Trust II. Each trust is registered under the Investment Company Act of 1940, as amended (the 1940 Act), as an open-end management investment company. Fidelity Municipal Trust and Fidelity Municipal Trust II (the trusts) are organized as a Massachusetts business trust and a Delaware statutory trust, respectively. Each fund is authorized to issue an unlimited number of shares. Each fund may be affected by economic and political developments in the state of Ohio. The financial statements have been prepared in conformity with accounting principles generally accepted in the United States of America, which require management to make certain estimates and assumptions at the date of the financial statements. The following summarizes the significant accounting policies of the income fund and the money market funds:
Security Valuation. Net asset value per share (NAV calculation) is calculated as of the close of business of the New York Stock Exchange, normally 4:00 p.m. Eastern time. Debt securities are valued on the basis of information provided by a pricing service. Pricing services use valuation matrices that incorporate both dealer-supplied valuations and valuation models. If an event that is expected to materially affect the value of a security occurs after the close of an exchange or market on which that security trades, but prior to the NAV calculation, then that security will be fair valued taking the event into account. Securities (including restricted securities) for which market quotations are not readily available are valued at their fair value as determined in good faith under consistently applied procedures under the general supervision of the Board of Trustees. Price movements in futures contracts and ADRs, market and trading trends, the bid/ask quotes of brokers and off-exchange institutional trading may be reviewed in the course of making a good faith determination of a security's fair value. Short-term securities with remaining maturities of sixty days or less for which quotations are not readily available are valued on the basis of amortized cost. Investments in open-end investment companies are valued at their net asset value each business day.
As permitted under Rule 2a-7 of the 1940 Act, and certain conditions therein, securities owned by the money market fund are valued initially at cost and thereafter assume a constant amortization to maturity of any discount or premium.
Investment Transactions and Income. Security transactions are accounted for as of trade date. Gains and losses on securities sold are determined on the basis of identified cost. Interest income is accrued as earned. Interest income includes coupon interest and amortization of premium and accretion of discount on debt securities, which is accrued using the interest method.
Annual Report
Notes to Financial Statements - continued
Expenses. Most expenses of each trust can be directly attributed to a fund. Expenses which cannot be directly attributed are apportioned among the funds in the trust.
1. Significant Accounting Policies - continued
Income Tax Information and Distributions to Shareholders. Each year, each fund intends to qualify as a regulated investment company by distributing all of their taxable income and realized gains under Subchapter M of the Internal Revenue Code. As a result, no provision for income taxes is required in the accompanying financial statements. Dividends are declared daily and paid monthly from net investment income. Distributions from realized gains, if any, are recorded on the ex-dividend date.
Income and capital gain distributions are determined in accordance with income tax regulations, which may differ from generally accepted accounting principles. In addition, the income fund will treat a portion of the proceeds from shares redeemed as a distribution from net investment income and realized gain for income tax purposes. There were no significant book-to-tax differences for the money market fund during the period. Capital accounts within the income fund's financial statements are adjusted for permanent and temporary book and tax differences. These adjustments have no impact on net assets or the results of operations. Temporary differences will reverse in a subsequent period. These differences are primarily due to futures transactions, market discount and losses deferred due to futures transactions.
The tax-basis components of distributable earnings and the federal tax cost for the income fund as of period end were as follows:
Unrealized appreciation | $ 31,125,499 |
Unrealized depreciation | (199,105) |
Net unrealized appreciation (depreciation) | 30,926,394 |
Undistributed ordinary income | 6,805 |
Undistributed long-term capital gain | 874,359 |
| |
Cost for federal income tax purposes | $ 395,782,348 |
The tax character of distributions paid for the income fund was as follows:
| December 31,
2003 | December 31,
2002 |
Tax-exempt Income | $ 18,304,425 | $ 18,686,297 |
Long-term Capital Gains | 3,358,167 | 2,874,270 |
Total | $ 21,662,592 | $ 21,560,567 |
Short-Term Trading (Redemption) Fees. Shares held in the income fund less than 30 days are subject to a short-term trading fee equal to .50% of the proceeds of the redeemed shares. The fee, which is retained by the fund, is accounted for as an addition to paid in capital.
Annual Report
2. Operating Policies.
Annual Report
Delayed Delivery Transactions and When-Issued Securities. Each fund may purchase or sell securities on a delayed delivery or when-issued basis. Payment and delivery may take place after the customary settlement period for that security. The price of the underlying securities and the date when the securities will be delivered and paid for are fixed at the time the transaction is negotiated. During the time a delayed delivery sell is outstanding, the contract is marked-to-market daily and equivalent deliverable securities are held for the transaction. The value of the securities purchased on a delayed delivery or when-issued basis are identified as such in each applicable fund's Schedule of Investments. Each fund may receive compensation for interest forgone in the purchase of a delayed delivery or when-issued security. With respect to purchase commitments, each fund identifies securities as segregated in its records with a value at least equal to the amount of the commitment. Losses may arise due to changes in the value of the underlying securities or if the counterparty does not perform under the contract's terms, or if the issuer does not issue the securities due to political, economic, or other factors.
Futures Contracts. The income fund may use futures contracts to manage its exposure to the bond market and to fluctuations in interest rates. Buying futures tends to increase the fund's exposure to the underlying instrument, while selling futures tends to decrease the fund's exposure to the underlying instrument or hedge other fund investments. Futures contracts involve, to varying degrees, risk of loss in excess of any futures variation margin reflected in each applicable fund's Statement of Assets and Liabilities. The underlying face amount at value of any open futures contracts at period end is shown in each applicable fund's Schedule of Investments under the caption "Futures Contracts." This amount reflects each contract's exposure to the underlying instrument at period end. Losses may arise from changes in the value of the underlying instruments or if the counterparties do not perform under the contracts' terms. Gains (losses) are realized upon the expiration or closing of the futures contracts. Futures contracts are valued at the settlement price established each day by the board of trade or exchange on which they are traded.
Notes to Financial Statements - continued
Restricted Securities. Certain funds may invest in securities that are subject to legal or contractual restrictions on resale. These securities generally may be resold in transactions exempt from registration or to the public if the securities are registered. Disposal of these securities may involve time-consuming negotiations and expense, and prompt sale at an acceptable price may be difficult. Information regarding restricted securities is included at the end of each applicable fund's Schedule of Investments.
Annual Report
2. Operating Policies - continued
Swap Agreements. The income fund may invest in swaps for the purpose of managing its exposure to interest rate, credit or market risk.
Interest rate swaps are agreements to exchange cash flows periodically based on a notional principal amount, for example, the exchange of fixed rate interest payments for floating rate interest payments. The primary risk associated with interest rate swaps is that unfavorable changes in the fluctuation of interest rates could adversely impact the fund.
Swaps are marked-to-market daily based on dealer-supplied valuations and changes in value are recorded as unrealized appreciation (depreciation). Gains or losses are realized upon early termination of the swap agreement. Collateral, in the form of cash or securities, may be required to be held in segregated accounts with the fund's custodian in compliance with swap contracts. Risks may exceed amounts recognized on the Statement of Assets and Liabilities. These risks include changes in the returns of the underlying instruments, failure of the counterparties to perform under the contracts' terms and the possible lack of liquidity with respect to the swap agreements. Details of swap agreements open at period end are included in the fund's Schedule of Investments under the caption "Swap Agreements."
3. Purchases and Sales of Investments.
Information regarding purchases and sales of securities is included under the caption "Other Information" at the end of each applicable fund's Schedule of Investments.
4. Fees and Other Transactions with Affiliates.
Management Fee. Fidelity Management & Research Company (FMR) and its affiliates provide the funds with investment management related services for which the funds pay a monthly management fee. The management fee is the sum of an individual fund fee rate and a group fee rate. The individual fund fee rate is applied to each fund's average net assets. The group fee rate is based upon the average net assets of all the mutual funds advised by FMR. The group fee rate decreases as assets under management increase and increases as assets under management decrease. For the period, each fund's annual management fee rate expressed as a percentage of each fund's average net assets was as follows:
| Individual Rate | Group Rate | Total |
Spartan Ohio Municipal Income Fund | .25% | .13% | .38% |
Fidelity Ohio Municipal Money Market Fund | .25% | .13% | .38% |
Annual Report
Notes to Financial Statements - continued
4. Fees and Other Transactions with Affiliates - continued
Transfer Agent and Accounting Fees. Citibank, N.A. (Citibank) is the custodian, transfer agent and shareholder servicing agent for the funds. Citibank has entered into a sub-contract with Fidelity Service Company, Inc. (FSC), an affiliate of FMR, under which FSC performs the activities associated with the funds' transfer and shareholder servicing agent and accounting functions. The funds pay account fees and asset-based fees that vary according to account size and type of account. FSC pays for typesetting, printing and mailing of all shareholder reports, except proxy statements. The accounting fee is based on the level of average net assets for the month plus out-of-pocket expenses.
For the period, the transfer agent fees were equivalent to the following annual rates expressed as a percentage of average net assets:
Spartan Ohio Municipal Income Fund | .08% | | |
Fidelity Ohio Municipal Money Market Fund | .12% | | |
Central Funds. The funds may invest in affiliated Central Funds managed by Fidelity Investments Money Management, Inc. (FIMM), an affiliate of FMR. The Central Funds are open-end investment companies available only to investment companies and other accounts managed by FMR and its affiliates. The Central Funds seek preservation of capital and current income and do not pay a management fee. Income distributions earned by the funds are recorded as income in the accompanying financial statements. Distributions from the Central Funds are noted in the table below:
| Income Distributions |
Fidelity Ohio Municipal Money Market Fund | $ 398,081 |
5. Expense Reductions.
Through arrangements with each applicable fund's custodian and transfer agent, credits realized as a result of uninvested cash balances were used to reduce each applicable fund's expenses. All of the applicable expense reductions are noted in the table below.
| Custody
expense
reduction | Transfer
Agent
expense
reduction |
| | |
Spartan Ohio Municipal Income Fund | $ 7,429 | $ 43,601 |
Fidelity Ohio Municipal Money Market Fund | 10,506 | 70,821 |
Annual Report
Report of Independent Auditors
To the Trustees of Fidelity Municipal Trust and Fidelity Municipal Trust II and the Shareholders of Spartan Ohio Municipal Income Fund and Fidelity Ohio Municipal Money Market Fund:
In our opinion, the accompanying statements of assets and liabilities, including the schedules of investments, and the related statements of operations and of changes in net assets and the financial highlights present fairly, in all material respects, the financial position of Spartan Ohio Municipal Income Fund (a fund of Fidelity Municipal Trust) and Fidelity Ohio Municipal Money Market Fund (a fund of Fidelity Municipal Trust II) at December 31, 2003 and the results of their operations, the changes in their net assets and the financial highlights for the periods indicated, in conformity with accounting principles generally accepted in the United States of America. These financial statements and financial highlights (hereafter referred to as "financial statements") are the responsibility of the Fidelity Municipal Trust's and Fidelity Municipal Trust II's management; our responsibility is to express an opinion on these financial statements based on our audits. We conducted our audits of these financial statements in accordance with auditing standards generally accepted in the United States of America which require that we plan and perform the audit to obtain reasonable assurance about whether the financial statements are free of material misstatement. An audit includes examining, on a test basis, evidence supporting the amounts and disclosures in the financial statements, assessing the accounting principles used and significant estimates made by management, and evaluating the overall financial statement presentation. We believe that our audits, which included confirmation of securities at December 31, 2003 by correspondence with the custodian and brokers, provide a reasonable basis for our opinion.
/s/PricewaterhouseCoopers LLP
PricewaterhouseCoopers LLP
Boston, Massachusetts
February 12, 2004
Annual Report
Trustees and Officers
The Trustees, Members of the Advisory Board, and executive officers of the trusts and funds, as applicable, are listed below. The Board of Trustees governs each fund and is responsible for protecting the interests of shareholders. The Trustees are experienced executives who meet periodically throughout the year to oversee each fund's activities, review contractual arrangements with companies that provide services to each fund, and review each fund's performance. Except for William O. McCoy, each of the Trustees oversees 292 funds advised by FMR or an affiliate. Mr. McCoy oversees 294 funds advised by FMR or an affiliate.
The Trustees hold office without limit in time except that (a) any Trustee may resign; (b) any Trustee may be removed by written instrument, signed by at least two-thirds of the number of Trustees prior to such removal; (c) any Trustee who requests to be retired or who has become incapacitated by illness or injury may be retired by written instrument signed by a majority of the other Trustees; and (d) any Trustee may be removed at any special meeting of shareholders by a two-thirds vote of the outstanding voting securities of the trust. In any event, each non-interested Trustee shall retire not later than the last day of the calendar year in which his or her 72nd birthday occurs. The executive officers and Advisory Board Members hold office without limit in time, except that any officer and Advisory Board Member may resign or may be removed by a vote of a majority of the Trustees at any regular meeting or any special meeting of the Trustees. Except as indicated, each individual has held the office shown or other offices in the same company for the past five years.
The funds' Statement of Additional Information (SAI) includes more information about the Trustees. To request a free copy, call Fidelity at 1-800-544-8544.
Interested Trustees*:
Correspondence intended for each Trustee who is an "interested person" (as defined in the 1940 Act) may be sent to Fidelity Investments, 82 Devonshire Street, Boston, Massachusetts 02109.
Name, Age; Principal Occupation |
Edward C. Johnson 3d (73)** |
| Year of Election or Appointment: 1984 or 1991 Trustee of Fidelity Municipal Trust (1984) and Fidelity Municipal Trust II (1991). Mr. Johnson is Chairman of the Board of Trustees. Mr. Johnson serves as Chief Executive Officer, Chairman, and a Director of FMR Corp.; a Director and Chairman of the Board and of the Executive Committee of FMR; Chairman and a Director of Fidelity Management & Research (Far East) Inc.; Chairman (1998) and a Director of Fidelity Investments Money Management, Inc.; and Chairman (2001) and a Director (2000) of FMR Co., Inc. |
Abigail P. Johnson (42)** |
| Year of Election or Appointment: 2001 Senior Vice President of Ohio Municipal Money Market (2001) and Spartan Ohio Municipal Income (2001). Ms. Johnson also serves as Senior Vice President of other Fidelity funds (2001). She is President and a Director of FMR (2001), Fidelity Investments Money Management, Inc. (2001), FMR Co., Inc. (2001), and a Director of FMR Corp. Previously, Ms. Johnson managed a number of Fidelity funds. |
Laura B. Cronin (49) |
| Year of Election or Appointment: 2003 Ms. Cronin is an Executive Vice President (2002) and Chief Financial Officer (2002) of FMR Corp. and is a member of the Fidelity Management Committee (2003). Previously, Ms. Cronin served as Vice President of Finance of FMR (1997-1999), and Chief Financial Officer of FMR (1999-2001), Fidelity Personal Investments (2001), and Fidelity Brokerage Company (2001-2002). |
Robert L. Reynolds (51) |
| Year of Election or Appointment: 2003 Mr. Reynolds is a Director (2003) and Chief Operating Officer (2002) of FMR Corp. and is the head of the Fidelity Management Committee (2003). He also serves on the Board at Fidelity Investments Canada, Ltd. (2000). Previously, Mr. Reynolds served as President of Fidelity Investments Institutional Retirement Group (1996-2000). |
* Trustees have been determined to be "Interested Trustees" by virtue of, among other things, their affiliation with the trusts or various entities under common control with FMR.
** Edward C. Johnson 3d, Trustee, is Abigail P. Johnson's father.
Annual Report
Non-Interested Trustees:
Correspondence intended for each non-interested Trustee (that is, the Trustees other than the Interested Trustees) may be sent to Fidelity Investments, P.O. Box 55235, Boston, Massachusetts 02205-5235.
Name, Age; Principal Occupation |
J. Michael Cook (61) |
| Year of Election or Appointment: 2001 Prior to Mr. Cook's retirement in May 1999, he served as Chairman and Chief Executive Officer of Deloitte & Touche LLP (accounting/consulting), Chairman of the Deloitte & Touche Foundation, and a member of the Board of Deloitte Touche Tohmatsu. He currently serves as a Director of Comcast (telecommunications, 2002), International Flavors & Fragrances, Inc. (2000), Rockwell Automation (2000), and The Dow Chemical Company (2000). He is a Member of the Diversity Advisory Council of Marakon (2003) and the Advisory Board of the Directorship Search Group, Chairman Emeritus of the Board of Catalyst (a leading organization for the advancement of women in business), and is Chairman of the Accountability Advisory Council to the Comptroller General of the United States. He also serves as a Member of the Advisory Board of the Graduate School of Business of the University of Florida, his alma mater. |
Ralph F. Cox (71) |
| Year of Election or Appointment: 1991 Mr. Cox is President of RABAR Enterprises (management consulting for the petroleum industry). Prior to February 1994, he was President of Greenhill Petroleum Corporation (petroleum exploration and production). Until March 1990, Mr. Cox was President and Chief Operating Officer of Union Pacific Resources Company (exploration and production). He is a Director of CH2M Hill Companies (engineering), and Abraxas Petroleum (petroleum exploration and production, 1999). In addition, he is a member of advisory boards of Texas A&M University and the University of Texas at Austin. |
Robert M. Gates (60) |
| Year of Election or Appointment: 1997 Dr. Gates is President of Texas A&M University (2002). He was Director of the Central Intelligence Agency (CIA) from 1991 to 1993. From 1989 to 1991, Dr. Gates served as Assistant to the President of the United States and Deputy National Security Advisor. Dr. Gates is a Director of NACCO Industries, Inc. (mining and manufacturing), and Parker Drilling Co., Inc. (drilling and rental tools for the energy industry, 2001). He also serves as a member of the Advisory Board of VoteHere.net (secure internet voting, 2001). Previously, Dr. Gates served as a Director of LucasVarity PLC (automotive components and diesel engines), a Director of TRW Inc. (automotive, space, defense, and information technology), and Dean of the George Bush School of Government and Public Service at Texas A&M University (1999-2001). Dr. Gates also is a Trustee of the Forum for International Policy. |
George H. Heilmeier (67) |
| Year of Election or Appointment: 2004 Dr. Heilmeier is Chairman Emeritus of Telcordia Technologies (communication software and systems), where prior to his retirement, he served as company Chairman and Chief Executive Officer. He currently serves on the Boards of Directors of The Mitre Corporation (systems engineering and information technology support for the government), INET Technologies Inc. (telecommunications network surveillance, 2001) and Teletech Holdings (customer management services, 1998). He is Chairman of the General Motors Technology Advisory Committee and a Life Fellow of the IEEE (2000). Dr. Heilmeier is a member of the Defense Science Board and the National Security Agency Advisory Board. He is also a member of the National Academy of Engineering, the American Academy of Arts and Sciences and The Board of Overseers of the School of Engineering and Applied Science of the University of Pennsylvania. Previously, Dr. Heilmeier served as a Director of TRW Inc. (automotive, space, defense, and information technology, 1992-2002) and Compaq (1994-2002). |
Donald J. Kirk (71) |
| Year of Election or Appointment: 1987 or 1991 Trustee of Fidelity Municipal Trust (1987) and Fidelity Municipal Trust II (1991). Mr. Kirk is a Governor of the American Stock Exchange (2001), a Trustee and former Chairman of the Board of Trustees of the Greenwich Hospital Association, a Director of the Yale-New Haven Health Services Corp. (1998), and a Director Emeritus and former Chairman of the Board of Directors of National Arts Strategies Inc. Mr. Kirk was an Executive-in-Residence (1995-2000) and a Professor (1987-1995) at Columbia University Graduate School of Business. Prior to 1987, he was Chairman of the Financial Accounting Standards Board. Previously, Mr. Kirk served as a Governor of the National Association of Securities Dealers, Inc. (1996-2002), a member and Vice Chairman of the Public Oversight Board of the American Institute of Certified Public Accountants' SEC Practice Section (1995-2002), a Director of General Re Corporation (reinsurance, 1987-1998) and as a Director of Valuation Research Corp. (appraisals and valuations). |
Marie L. Knowles (57) |
| Year of Election or Appointment: 2001 Prior to Ms. Knowles' retirement in June 2000, she served as Executive Vice President and Chief Financial Officer of Atlantic Richfield Company (ARCO) (diversified energy, 1996-2000). From 1993 to 1996, she was a Senior Vice President of ARCO and President of ARCO Transportation Company. She served as a Director of ARCO from 1996 to 1998. She currently serves as a Director of Phelps Dodge Corporation (copper mining and manufacturing), URS Corporation (multidisciplinary engineering, 1999), and McKesson Corporation (healthcare service, 2002). Ms. Knowles is a Trustee of the Brookings Institution and the Catalina Island Conservancy and also serves as a member of the Advisory Board for the School of Engineering of the University of Southern California. |
Ned C. Lautenbach (59) |
| Year of Election or Appointment: 2000 Mr. Lautenbach has been a partner of Clayton, Dubilier & Rice, Inc. (private equity investment firm) since September 1998. Previously, Mr. Lautenbach was with the International Business Machines Corporation (IBM) from 1968 until his retirement in 1998. He was most recently Senior Vice President and Group Executive of Worldwide Sales and Services. From 1993 to 1995, he was Chairman of IBM World Trade Corporation, and from 1994 to 1998 was a member of IBM's Corporate Executive Committee. Mr. Lautenbach serves as Chairman and as a Director (1998) of Acterna Corporation (communications test equipment). He is also Co-Chairman of Covansys, Inc. (global provider of business and technology solutions, 2000). In addition, he is a Director of Eaton Corporation (diversified industrial) and the Philharmonic Center for the Arts in Naples, Florida (1999). He also is a member of the Council on Foreign Relations. |
Marvin L. Mann (70) |
| Year of Election or Appointment: 1993 Mr. Mann is Chairman of the non-interested Trustees (2001). He is Chairman Emeritus of Lexmark International, Inc. (computer peripherals) where he served as CEO until April 1998 and retired as Chairman May 1999, and remains a member of the Board. Prior to 1991, he held the positions of Vice President of International Business Machines Corporation (IBM) and President and General Manager of various IBM divisions and subsidiaries. Mr. Mann is a Board member of Imation Corp. (imaging and information storage) and Acterna Corporation (communications test equipment, 1999). He is also a member of the Director Services Committee of the Investment Company Institute. In addition, Mr. Mann is a member of the President's Cabinet at the University of Alabama and the Board of Visitors of the Culverhouse College of Commerce and Business Administration at the University of Alabama. |
William O. McCoy (70) |
| Year of Election or Appointment: 1997 Prior to his retirement in December 1994, Mr. McCoy was Vice Chairman of the Board of BellSouth Corporation (telecommunications) and President of BellSouth Enterprises. He is currently a Director of Liberty Corporation (holding company), Duke Realty Corporation (real estate), Progress Energy, Inc. (electric utility), and Acterna Corporation (communications test equipment, 1999). He is also a partner of Franklin Street Partners (private investment management firm) and a member of the Research Triangle Foundation Board. In addition, Mr. McCoy served as the Interim Chancellor (1999-2000) and a member of the Board of Visitors (1994-1998) for the University of North Carolina at Chapel Hill and currently serves on the Board of Directors of the University of North Carolina Health Care System and the Board of Visitors of the Kenan-Flagler Business School (University of North Carolina at Chapel Hill). He also served as Vice President of Finance for the University of North Carolina (16-school system, 1995-1998). |
William S. Stavropoulos (64) |
| Year of Election or Appointment: 2001 or 2002 Trustee of Fidelity Municipal Trust II (2001) and Fidelity Municipal Trust (2002). Mr. Stavropoulos is Chairman of the Board, President and CEO (2002), and Chairman of the Executive Committee (2000) and a Director of The Dow Chemical Company. Since joining The Dow Chemical Company in 1967, Mr. Stavropoulos served in numerous senior management positions, including President (1993-2000) and Chief Executive Officer (1995-2000). Currently, he is a Director of NCR Corporation (data warehousing and technology solutions), BellSouth Corporation (telecommunications), Chemical Financial Corporation, and Maersk Inc. (industrial conglomerate, 2002). He also serves as a member of the Board of Trustees of the American Enterprise Institute for Public Policy Research. In addition, Mr. Stavropoulos is a member of The Business Council, J.P. Morgan International Council, World Business Council for Sustainable Development, and the University of Notre Dame Advisory Council for the College of Science. |
Annual Report
Trustees and Officers - continued
Advisory Board Members and Executive Officers:
Correspondence intended for Ms. Small may be sent to Fidelity Investments, P.O. Box 55235, Boston, Massachusetts 02205-5235. Correspondence intended for each executive officer and Mr. Lynch may be sent to 82 Devonshire Street, Boston, Massachusetts 02109.
Name, Age; Principal Occupation |
Peter S. Lynch (60) |
| Year of Election or Appointment: 2003 Member of the Advisory Board of Fidelity Municipal Trust and Fidelity Municipal Trust II. Vice Chairman and a Director of FMR, and Vice Chairman (2001) and a Director (2000) of FMR Co., Inc. Previously, Mr. Lynch served as a Trustee of the Fidelity funds (1990-2003). Prior to May 31, 1990, he was a Director of FMR and Executive Vice President of FMR (a position he held until March 31, 1991), Vice President of Fidelity® Magellan® Fund and FMR Growth Group Leader, and Managing Director of FMR Corp. Mr. Lynch was also Vice President of Fidelity Investments Corporate Services. In addition, he serves as a Trustee of Boston College, Massachusetts Eye & Ear Infirmary, Historic Deerfield, John F. Kennedy Library, and the Museum of Fine Arts of Boston. |
Cornelia M. Small (59) |
| Year of Election or Appointment: 2004 Member of the Advisory Board of Fidelity Municipal Trust and Fidelity Municipal Trust II. Ms. Small is a member (2000) and Chairperson (2002) of the Investment Committee, and a member (2002) of the Board of Trustees of Smith College. Previously, she served as Chief Investment Officer (1999-2000), Director of Global Equity Investments (1996- 1999), and a member of the Board of Directors (1998-1999) of Scudder Kemper Investments. In addition, Ms. Small served as Co-Chair (2000-2003) of the Annual Fund for the Fletcher School of Law and Diplomacy. |
Dwight D. Churchill (50) |
| Year of Election or Appointment: 1997 or 2000 Vice President of Ohio Municipal Money Market (2000) and Spartan Ohio Municipal Income (1997). He serves as Head of Fidelity's Fixed-Income Division (2000), Vice President of Fidelity's Money Market Funds (2000), Vice President of Fidelity's Bond Funds (1997), and Senior Vice President of FIMM (2000) and FMR (1997). Mr. Churchill joined Fidelity in 1993 as Vice President and Group Leader of Taxable Fixed-Income Investments. |
Charles S. Morrison (43) |
| Year of Election or Appointment: 2002 Vice President of Spartan Ohio Municipal Income. Mr. Morrison also serves as Vice President of Fidelity's Bond Funds (2002), and Vice President of certain Asset Allocation and Balanced Funds (2002). He serves as Vice President (2002) and Bond Group Leader (2002) of Fidelity Investments Fixed Income Division. Mr. Morrison is also Vice President of FIMM (2002) and FMR (2002). Mr. Morrison joined Fidelity in 1987 as a Corporate Bond Analyst in the Fixed Income Research Division. |
David L. Murphy (55) |
| Year of Election or Appointment: 2002 Vice President of Ohio Municipal Money Market. Mr. Murphy also serves as Vice President of Fidelity's Money Market Funds (2002) and Vice President of certain Asset Allocation Funds (2003). He serves as Senior Vice President (2000) and Money Market Group Leader (2002) of the Fidelity Investments Fixed Income Division. Mr. Murphy is also a Senior Vice President of FIMM (2003) and a Vice President of FMR (2000). Previously, Mr. Murphy served as Bond Group Leader (2000-2002) and Vice President of Fidelity's Taxable Bond Funds (2000-2002) and Fidelity's Municipal Bond Funds (2001-2002). Mr. Murphy joined Fidelity in 1989 as a portfolio manager in the Bond Group. |
Eric D. Roiter (55) |
| Year of Election or Appointment: 1998 Secretary of Ohio Municipal Money Market and Spartan Ohio Municipal Income. He also serves as Secretary of other Fidelity funds (1998); Vice President, General Counsel, and Clerk of FMR Co., Inc. (2001) and FMR (1998); Vice President and Clerk of FDC (1998); Assistant Clerk of Fidelity Management & Research (U.K.) Inc. (2001) and Fidelity Management & Research (Far East) Inc. (2001); and Assistant Secretary of Fidelity Investments Money Management Inc. (2001). Prior to joining Fidelity, Mr. Roiter was with the law firm of Debevoise & Plimpton, as an associate (1981-1984) and as a partner (1985-1997), and served as an Assistant General Counsel of the U.S. Securities and Exchange Commission (1979-1981). Mr. Roiter is an Adjunct Member, Faculty of Law, at Boston College Law School (2003). |
Stuart Fross (44) |
| Year of Election or Appointment: 2003 Assistant Secretary of Ohio Municipal Money Market and Spartan Ohio Municipal Income. Mr. Fross also serves as Assistant Secretary of other Fidelity funds (2003) and is an employee of FMR. |
Maria F. Dwyer (45) |
| Year of Election or Appointment: 2002 President and Treasurer of Ohio Municipal Money Market and Spartan Ohio Municipal Income. Ms. Dwyer also serves as President and Treasurer of other Fidelity funds (2002) and is a Vice President (1999) and an employee (1996) of FMR. |
Timothy F. Hayes (53) |
| Year of Election or Appointment: 2002 Chief Financial Officer of Ohio Municipal Money Market and Spartan Ohio Municipal Income. Mr. Hayes also serves as Chief Financial Officer of other Fidelity funds (2002). Recently he was appointed President of Fidelity Service Company (2003) where he also serves as a Director. Mr. Hayes also serves as President of Fidelity Investments Operations Group (FIOG, 2002), which includes Fidelity Pricing and Cash Management Services Group (FPCMS), where he was appointed President in 1998. Previously, Mr. Hayes served as Chief Financial Officer of Fidelity Investments Corporate Systems and Service Group (1998) and Fidelity Systems Company (1997-1998). |
Jennifer S. Taub (37) |
| Year of Election or Appointment: 2003 Assistant Vice President of Ohio Municipal Money Market and Spartan Ohio Municipal Income. Ms. Taub is Assistant Vice President of Fidelity's Fixed-Income Funds (2003), Assistant Secretary of FIMM (2003), and is an employee of FMR. |
John R. Hebble (45) |
| Year of Election or Appointment: 2003 Deputy Treasurer of Ohio Municipal Money Market and Spartan Ohio Municipal Income. Mr. Hebble also serves as Deputy Treasurer of other Fidelity funds (2003), and is an employee of FMR. Before joining Fidelity Investments, Mr. Hebble worked at Deutsche Asset Management where he served as Director of Fund Accounting (2002-2003) and Assistant Treasurer of the Scudder Funds (1998-2003). |
John H. Costello (57) |
| Year of Election or Appointment: 1986 or 1989 Assistant Treasurer of Ohio Municipal Money Market (1989) and Spartan Ohio Municipal Income (1986). Mr. Costello also serves as Assistant Treasurer of other Fidelity funds and is an employee of FMR. |
Francis V. Knox, Jr. (56) |
| Year of Election or Appointment: 2002 Assistant Treasurer of Ohio Municipal Money Market and Spartan Ohio Municipal Income. Mr. Knox also serves as Assistant Treasurer of other Fidelity funds (2002), and is a Vice President and an employee of FMR. Previously, Mr. Knox served as Vice President of Investment & Advisor Compliance (1990-2001), and Compliance Officer of Fidelity Management & Research (U.K.) Inc. (1992-2002), Fidelity Management & Research (Far East) Inc. (1991-2002), and FMR Corp. (1995-2002). |
Mark Osterheld (48) |
| Year of Election or Appointment: 2002 Assistant Treasurer of Ohio Municipal Money Market and Spartan Ohio Municipal Income. Mr. Osterheld also serves as Assistant Treasurer of other Fidelity funds (2002) and is an employee of FMR. |
Thomas J. Simpson (45) |
| Year of Election or Appointment: 1996 Assistant Treasurer of Ohio Municipal Money Market and Spartan Ohio Municipal Income. Mr. Simpson is Assistant Treasurer of other Fidelity funds (2000) and an employee of FMR (1996). Prior to joining FMR, Mr. Simpson was Vice President and Fund Controller of Liberty Investment Services (1987-1995). |
Annual Report
Distributions
The Board of Trustees of Spartan Ohio Municipal Income Fund voted to pay on February 9, 2004, to shareholders of record at the opening of business on February 6, 2004, a distribution of $.025 per share derived from capital gains realized from sales of portfolio securities.
During fiscal year ended 2003, 100% of the fund's income dividends was free from federal income tax, and 6.81% of the fund's income dividends was subject to the federal alternative minimum tax.
The fund will notify shareholders in January 2004 of amounts for use in preparing 2003 income tax returns.
Annual Report
Investment Adviser
Fidelity Management & Research Company
Boston, MA
Investment Sub-Adviser
Fidelity Investments Money
Management, Inc.
Fidelity Investments Japan Limited
Fidelity International Investment Advisors
Fidelity International Investment Advisors
(U.K.) Limited
General Distributor
Fidelity Distributors Corporation
Boston, MA
Transfer and Shareholder
Servicing Agents
Citibank, N.A.
New York, NY
Fidelity Service Company, Inc.
Boston, MA
Custodian
Citibank, N.A.
New York, NY
The Fidelity Telephone Connection
Mutual Fund 24-Hour Service
Exchanges/Redemptions
and Account Assistance 1-800-544-6666
Product Information 1-800-544-6666
Retirement Accounts 1-800-544-4774 (8 a.m. - 9 p.m.)
TDD Service 1-800-544-0118
for the deaf and hearing impaired
(9 a.m. - 9 p.m. Eastern time)
Fidelity Automated Service
Telephone (FAST®) (automated graphic) 1-800-544-5555
(automated graphic) Automated lines for quickest service
(Fidelity Investment logo)(registered trademark)
Corporate Headquarters
82 Devonshire St., Boston, MA 02109
www.fidelity.com
OFF-UANN-0204
1.787739.100
Spartan®
Spartan®
Pennsylvania Municipal
Income Fund
and
Fidelity®
Pennsylvania Municipal
Money Market Fund
Annual Report
December 31, 2003
(2_fidelity_logos) (Registered_Trademark)
Contents
Chairman's Message | <Click Here> | Ned Johnson's message to shareholders |
Spartan Pennsylvania Municipal Income Fund |
Performance | <Click Here> | How the fund has done over time. |
Management's Discussion | <Click Here> | The manager's review of fund performance, strategy and outlook. |
Investment Changes | <Click Here> | A summary of major shifts in the fund's investments over the past six months. |
Investments | <Click Here> | A complete list of the fund's investments with their market values. |
Financial Statements | <Click Here> | Statements of assets and liabilities, operations, and changes in net assets,
as well as financial highlights. |
Fidelity Pennsylvania Municipal Money Market Fund |
Investment Changes/
Performance | <Click Here> | A summary of major shifts in the fund's investments over the past six months. |
Investments | <Click Here> | A complete list of the fund's investments with their market values. |
Financial Statements | <Click Here> | Statements of assets and liabilities, operations, and changes in net assets,
as well as financial highlights. |
Notes | <Click Here> | Notes to the Financial Statements |
Auditors' Opinion | <Click Here> | |
Trustees and Officers | <Click Here> | |
Distributions | <Click Here> | |
For a free copy of the funds' proxy voting guidelines visit www.fidelity.com/goto/proxyguidelines, call 1-800-544-8544, or visit the Securities and Exchange Commission (SEC)'s web site at www.sec.gov.
Standard & Poor's, S&P and S&P 500 are registered service marks of The McGraw-Hill Companies, Inc. and have been licensed for use by Fidelity Distributors Corporation.
Other third party marks appearing herein are the property of their respective owners.
All other marks appearing herein are registered or unregistered trademarks or service marks of FMR Corp. or an affiliated company.
(Recycle graphic) This report is printed on recycled paper using soy-based inks.
Annual Report
This report and the financial statements contained herein are submitted for the general information of the shareholders of the funds. This report is not authorized for distribution to prospective investors in the funds unless preceded or accompanied by an effective prospectus.
Mutual fund shares are not deposits or obligations of, or guaranteed by, any depository institution. Shares are not insured by the FDIC, Federal Reserve Board or any other agency, and are subject to investment risks, including possible loss of principal amount invested.
Neither the funds nor Fidelity Distributors Corporation is a bank.
For more information on any Fidelity fund, including charges and expenses, call 1-800-544-6666 for a free prospectus. Read it carefully before you invest or send money.
Annual Report
Chairman's Message
(photo_of_Edward_C_Johnson_3d)
Dear Shareholder:
Many of you have read or heard news stories recently that were critical of mutual funds and made allegations that the mutual fund industry has been less than forthright. I find these reports unsettling and not necessarily an accurate picture of the overall industry, and I would like you to know where we at Fidelity stand.
With specific regard to allegations that certain mutual fund companies were violating the Securities and Exchange Commission's forward pricing rules or were involved in so-called "market timing" activities, I want to say two things:
First, Fidelity does not have agreements that permit customers who buy fund shares after 4 p.m. to obtain the 4 p.m. price. This is not to say that someone could not deceive the company through fraudulent acts. But I underscore that we have no so-called "agreements" which would permit this illegal practice.
Second, Fidelity has been on record for years opposing predatory short-term trading which adversely affects other shareholders in a mutual fund. In fact, in the 1980s, we began charging a fee - which is returned to the fund and, therefore, to investors - to discourage this activity. What's more, several years ago we took the industry lead in developing a Fair Value Pricing Policy to prevent market timing on foreign securities in our funds. It is reasonable to assume that another structure can be developed that would alter the system to make it much more difficult for predatory traders to operate. This, however, will only be achieved through close cooperation among regulators, legislators and the industry.
Certainly no industry is perfect, and there have been instances of unethical and illegal activity from time to time within the mutual fund industry. When this occurs, confessed or convicted offenders should be dealt with appropriately. Clearly, every system can be improved. We applaud well thought out improvements by regulators, legislators and industry representatives that achieve the common goal of building and protecting the value of investors' holdings. But we remain concerned about the risk of over-regulation and the quick application of simplistic solutions to intricate problems.
For more than 57 years, Fidelity Investments has worked very hard to improve its products and service to justify your trust. When our family founded this company in 1946, we had only a few hundred customers. Many of them were family and friends. Today, we serve more than 18 million customers including individual investors and participants in retirement plans across America.
Let me close by saying that we do not take your trust in us for granted, and we realize that we must always work to improve all aspects of our service to you. In turn, we urge you to continue your active participation with your financial matters, so that your interests can be well served.
Best regards,/s/Edward C. Johnson 3d
Edward C. Johnson 3d
Annual Report
Spartan Pennsylvania Municipal Income Fund
Performance: The Bottom Line
Average annual total return reflects the change in the value of an investment, assuming reinvestment of the fund's dividend income and capital gains (the profits earned upon the sale of securities that have grown in value) and assuming a constant rate of performance each year. During periods of reimbursement by Fidelity, a fund's total return will be greater than it would be had the reimbursement not occurred. The $10,000 table and the fund's returns do not reflect the deduction of taxes that a shareholder would pay on fund distributions or the redemption of fund shares. How a fund did yesterday is no guarantee of how it will do tomorrow.
Average Annual Total Returns
Periods ended December 31, 2003 | Past 1
year | Past 5
years | Past 10
years |
Spartan® PA Municipal Income Fund | 5.11% | 5.51% | 5.68% |
$10,000 Over 10 Years
Let's say hypothetically that $10,000 was invested in Spartan® Pennsylvania Municipal Income Fund on December 31, 1993. The chart shows how the value of your investment would have grown, and also shows how the Lehman Brothers® Municipal Bond Index did over the same period.
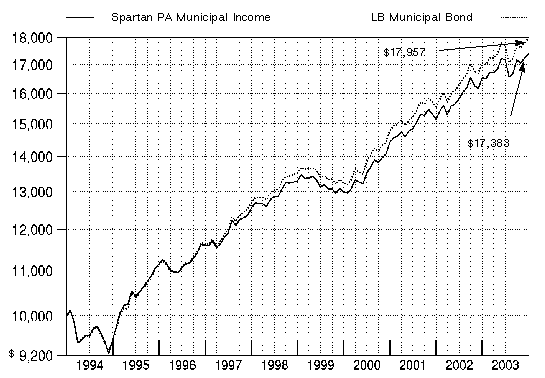
Annual Report
Spartan Pennsylvania Municipal Income Fund
Management's Discussion of Fund Performance
Comments from Mark Sommer, Portfolio Manager of Spartan® Pennsylvania Municipal Income Fund
While most of the year favored riskier assets, tax-exempt municipal bonds put up solid numbers for the 12 months ending December 31, 2003. In that time, the Lehman Brothers® Municipal Bond Index - a performance measure of about 40,000 investment-grade, fixed-rate, tax-exempt bonds - advanced 5.31%. For munis, it was the fourth straight year of returns in excess of 5%. Munis had an excellent year relative to taxable investment-grade bonds. The Lehman Brothers Aggregate Bond Index, a proxy for the taxable, investment-grade bond market, gained 4.10% in 2003, a full percentage point less than the muni index - a gap made even wider considering muni bonds' tax-equivalent yield advantage. What's more, on a three- and five-year basis, the Lehman Brothers muni index's cumulative return is well above that of most stock market benchmarks. Munis fared well for much of the year against a backdrop of low interest rates and virtually non-existent inflation. Although they stumbled in mid-summer against a brighter economic forecast, munis rebounded later on the heels of strong investor demand and the Federal Reserve Board's accommodative monetary policy.
Spartan Pennsylvania Municipal Income Fund returned 5.11% during 2003, outpacing the LipperSM Pennsylvania Municipal Debt Funds Average, which returned 4.83%. Additionally, the Lehman Brothers Pennsylvania Municipal Bond Index returned 5.41%. The fund's outperformance stemmed from a variety of strategies, including how its holdings were invested in bonds of various maturities at different points throughout the year. Security and sector selection also helped. The fund was overweighted in higher education bonds, which generally performed well thanks to strong demand for secondary education and stability in revenues. The fund's emphasis on essential services bonds - issued by providers of electricity, water and sewer services - also contributed. Their stable revenues helped them outperform tax-backed bonds during the year. The fund's stake in hospital bonds worked in its favor, as many hospitals enjoyed better financial trends and, as a result, improving bond prices. Modestly detracting from performance were airport bonds, which lagged the market due to concerns about the financial health of the airlines that help generate the revenues backing the bonds.
The views expressed in this statement reflect those of the portfolio manager only through the end of the period of the report as stated on the cover and do not necessarily represent the views of Fidelity or any other person in the Fidelity organization. Any such views are subject to change at any time based upon market or other conditions and Fidelity disclaims any responsibility to update such views. These views may not be relied on as investment advice and, because investment decisions for a Fidelity fund are based on numerous factors, may not be relied on as an indication of trading intent on behalf of any Fidelity fund.
Annual Report
Spartan Pennsylvania Municipal Income Fund
Investment Changes
Top Five Sectors as of December 31, 2003 |
| % of fund's
net assets | % of fund's net assets
6 months ago |
General Obligations | 42.6 | 37.3 |
Transportation | 12.0 | 11.9 |
Health Care | 11.6 | 11.9 |
Water & Sewer | 11.1 | 11.6 |
Education | 10.9 | 12.9 |
Average Years to Maturity as of December 31, 2003 |
| | 6 months ago |
Years | 13.9 | 13.5 |
Average years to maturity is based on the average time remaining until principal payments are expected from each of the fund's bonds, weighted by dollar amount. |
Duration as of December 31, 2003 |
| | 6 months ago |
Years | 7.0 | 6.7 |
Duration shows how much a bond fund's price fluctuates with changes in comparable interest rates. If rates rise 1%, for example, a fund with a five-year duration is likely to lose about 5% of its value. Other factors also can influence a bond fund's performance and share price. Accordingly, a bond fund's actual performance may differ from this example. |
Quality Diversification (% of fund's net assets) |
As of December 31, 2003 | As of June 30, 2003 |
| AAA 79.2% | | | AAA 73.3% | |
| AA,A 14.9% | | | AA,A 19.1% | |
| BBB 3.2% | | | BBB 7.9% | |
| Not Rated 1.0% | | | Not Rated 0.4% | |
| Short-Term
Investments and
Net Other Assets 1.7% | | | Short-Term
Investments and
Net Other Assets* (0.7)% | |

We have used ratings from Moody's® Investors Services, Inc. Where Moody's ratings are not available, we have used S&P® ratings. |
*Short-Term Investments and Net Other Assets are not includied in the pie chart.
Annual Report
Spartan Pennsylvania Municipal Income Fund
Investments December 31, 2003
Showing Percentage of Net Assets
Municipal Bonds - 98.3% |
| Principal
Amount | | Value
(Note 1) |
New Jersey/Pennsylvania - 1.4% |
Delaware River Joint Toll Bridge Commission Bridge Rev. 5.25% 7/1/19 | | $ 1,000,000 | | $ 1,073,720 |
Delaware River Port Auth. Pennsylvania & New Jersey Rev.: | | | | |
(Port District Proj.) Series A, 5.5% 1/1/18 (FSA Insured) | | 2,000,000 | | 2,228,340 |
Series 1999, 6% 1/1/18 (FSA Insured) | | 700,000 | | 810,915 |
| | 4,112,975 |
Pennsylvania - 95.9% |
Allegheny County Arpt. Rev. (Pittsburgh Int'l. Arpt. Proj.) Series A1: | | | | |
5.75% 1/1/07 (MBIA Insured) (b) | | 1,500,000 | | 1,628,160 |
5.75% 1/1/08 (MBIA Insured) (b) | | 1,000,000 | | 1,101,010 |
5.75% 1/1/11 (MBIA Insured) (b) | | 2,000,000 | | 2,234,820 |
5.75% 1/1/14 (MBIA Insured) (b) | | 3,000,000 | | 3,372,330 |
Allegheny County Higher Ed. Bldg. Auth. Univ. Rev. (Duquesne Univ. Proj.) 6.5% 3/1/10 (AMBAC Insured) | | 400,000 | | 481,592 |
Allegheny County Hosp. Dev. Auth. Rev. (Health Ctr.-UPMC Health Sys. Proj.) Series A: | | | | |
4.625% 8/1/12 (MBIA Insured) | | 1,000,000 | | 1,060,490 |
4.625% 8/1/14 (MBIA Insured) | | 3,560,000 | | 3,717,993 |
5.55% 4/1/12 (MBIA Insured) | | 2,845,000 | | 3,136,385 |
Allegheny County San. Auth. Swr. Rev.: | | | | |
Series 2003: | | | | |
5% 6/1/06 (MBIA Insured) | | 2,775,000 | | 2,991,034 |
5.375% 12/1/13 (MBIA Insured) | | 1,000,000 | | 1,140,000 |
0% 12/1/12 (Escrowed to Maturity) (c) | | 2,260,000 | | 1,629,166 |
5.5% 12/1/30 (MBIA Insured) | | 2,000,000 | | 2,165,580 |
Bucks County Indl. Dev. Auth. Wtr. Facilities Rev. (Pennsylvania Suburban Wtr. Co. Proj.) Series 2002, 5.55% 9/1/32 (FGIC Insured) (b) | | 1,870,000 | | 1,978,049 |
Butler Area School District: | | | | |
Series A: | | | | |
0% 10/1/27 (FGIC Insured) | | 1,500,000 | | 441,630 |
0% 9/15/28 (FGIC Insured) | | 1,000,000 | | 277,570 |
0% 9/15/29 (FGIC Insured) | | 2,705,000 | | 711,009 |
0% 11/15/19 (Pre-Refunded to 11/15/07 @ 50.177) (c) | | 5,650,000 | | 2,587,700 |
Canon McMillan School District: | | | | |
Series 2001 B, 5.75% 12/1/33 (FGIC Insured) | | 8,995,000 | | 10,056,950 |
Series 2002 B, 5.75% 12/1/35 (FGIC Insured) | | 2,500,000 | | 2,790,000 |
Central York School District 5.5% 6/1/16 (FGIC Insured) | | 2,000,000 | | 2,252,300 |
Municipal Bonds - continued |
| Principal
Amount | | Value
(Note 1) |
Pennsylvania - continued |
Chester County Health & Ed. Facilities Auth. Health Sys. Rev. (Jefferson Health Sys. Proj.) Series B: | | | | |
5% 5/15/08 (AMBAC Insured) | | $ 600,000 | | $ 663,162 |
5.25% 5/15/22 (AMBAC Insured) | | 1,450,000 | | 1,528,576 |
Cumberland County Muni. Auth. College Rev. (Dickerson College Proj.) Series A, 5.5% 11/1/30 (AMBAC Insured) | | 4,200,000 | | 4,530,834 |
Delaware County Auth. College Rev. (Haverford College Proj.): | | | | |
5.75% 11/15/29 | | 5,000,000 | | 5,561,450 |
6% 11/15/30 | | 3,620,000 | | 4,127,162 |
Delaware County Auth. Hosp. Rev. (Crozer-Chester Med. Ctr. Proj.): | | | | |
6% 12/15/09 | | 1,500,000 | | 1,536,150 |
6% 12/15/20 | | 2,700,000 | | 2,709,666 |
Delaware County Gen. Oblig. Series 1999, 5.125% 10/1/17 | | 1,000,000 | | 1,076,020 |
Delaware County Indl. Dev. Auth. Rev. (Philadelphia Suburban Wtr. Co. Proj.) 6% 6/1/29 (FGIC Insured) (b) | | 2,500,000 | | 2,777,050 |
Delaware County Reg'l. Wtr. Quality Cont. Auth. Swr. Rev. Series 2001, 5.25% 5/1/12 (FGIC Insured) | | 2,165,000 | | 2,457,448 |
Erie School District 0% 9/1/30 (AMBAC Insured) | | 4,000,000 | | 1,005,320 |
Fox Chapel Area School District 4.5% 8/15/07 (FSA Insured) | | 1,000,000 | | 1,083,320 |
Harrisburg Auth. Dauphin County School Rev. (Harrisburg School District Rfdg. Proj.) 5.5% 4/1/14 (FGIC Insured) | | 1,655,000 | | 1,880,295 |
Harrisburg Auth. Rev. (Pooled Bond Prog.) Series I, 5.625% 4/1/15 (Pre-Refunded to 4/1/06 @ 102) (c) | | 445,000 | | 493,812 |
Harrisburg Auth. Wtr. Rev. 5.75% 7/15/12 (FGIC Insured) | | 1,115,000 | | 1,292,698 |
Hazleton Area School District 6.5% 3/1/05 (FSA Insured) | | 2,165,000 | | 2,295,939 |
Indiana County Indl. Dev. Auth. Poll. Cont. Rev. (PSEG Pwr. LLC Proj.) 5.85% 6/1/27 (b) | | 2,000,000 | | 2,011,920 |
Kennett Consolidated School District Series A, 5.25% 2/15/15 (FGIC Insured) | | 1,310,000 | | 1,465,183 |
Laurel Highlands School District: | | | | |
5% 11/1/15 (FGIC Insured) | | 1,390,000 | | 1,531,016 |
5% 11/1/16 (FGIC Insured) | | 1,460,000 | | 1,591,809 |
Meadville Gen. Oblig. Series B, 6% 10/1/05 (Escrowed to Maturity) (c) | | 1,395,000 | | 1,469,186 |
Municipal Bonds - continued |
| Principal
Amount | | Value
(Note 1) |
Pennsylvania - continued |
Montgomery County Higher Ed. & Health Auth. Hosp. Rev. (Abington Memorial Hosp. Proj.) Series A: | | | | |
5% 6/1/05 (AMBAC Insured) | | $ 3,535,000 | | $ 3,705,564 |
6% 6/1/09 (AMBAC Insured) | | 2,365,000 | | 2,755,769 |
6% 6/1/16 (AMBAC Insured) | | 1,000,000 | | 1,206,950 |
Montgomery County Higher Ed. & Health Auth. Rev. (Health Care-Holy Redeemer Health Proj.) Series A: | | | | |
5.5% 10/1/05 (AMBAC Insured) | | 2,240,000 | | 2,388,938 |
5.5% 10/1/08 (AMBAC Insured) | | 1,000,000 | | 1,120,020 |
Muhlenberg School District Series AA, 5.375% 9/1/15 (FGIC Insured) | | 1,055,000 | | 1,192,635 |
Northumberland County Auth. Commonwealth Lease Rev. (State Correctional Facilities Proj.) 0% 10/15/10 (Escrowed to Maturity) (c) | | 1,000,000 | | 804,330 |
Owen J. Roberts School District 5.5% 8/15/19 (FSA Insured) | | 1,525,000 | | 1,694,107 |
Pennsbury School District 5.5% 1/15/17 (FGIC Insured) | | 2,160,000 | | 2,419,200 |
Pennsylvania Convention Ctr. Auth. Rev. Series A: | | | | |
6.6% 9/1/09 (MBIA Insured) | | 9,150,000 | | 9,640,440 |
6.7% 9/1/14 (MBIA Insured) | | 3,965,000 | | 4,180,101 |
Pennsylvania Econ. Dev. Fing. Auth. Exempt Facilities Rev. (Amtrak Proj.) Series 2001 A: | | | | |
6.25% 11/1/31 (b) | | 3,300,000 | | 3,297,756 |
6.375% 11/1/41 (b) | | 1,300,000 | | 1,303,679 |
Pennsylvania Gen. Oblig.: | | | | |
First Series: | | | | |
5% 1/15/07 | | 2,500,000 | | 2,721,150 |
5% 6/1/19 (MBIA Insured) | | 7,275,000 | | 7,721,030 |
5.25% 2/1/14 | | 125,000 | | 140,290 |
5.25% 2/1/18 | | 1,250,000 | | 1,365,175 |
Second Series: | | | | |
0% 7/1/07 (AMBAC Insured) | | 1,770,000 | | 1,623,143 |
5% 8/1/17 | | 2,450,000 | | 2,613,905 |
5% 5/1/20 (FSA Insured) | | 1,175,000 | | 1,242,868 |
5.75% 10/1/16 (MBIA Insured) | | 475,000 | | 546,754 |
5.25% 2/1/11 | | 1,000,000 | | 1,142,470 |
Pennsylvania Higher Edl. Facilities Auth. College & Univ. Revs.: | | | | |
(RIDC Reg'l. Growth-Carnegie Mellon Univ. Proj.) 6% 11/1/05 | | 1,000,000 | | 1,080,070 |
(Trustees Univ. Proj.) 5.5% 7/15/38 | | 4,380,000 | | 4,630,930 |
(Univ. of Pennsylvania Proj.) Series A, 5.9% 9/1/15 | | 1,200,000 | | 1,279,320 |
Municipal Bonds - continued |
| Principal
Amount | | Value
(Note 1) |
Pennsylvania - continued |
Pennsylvania Higher Edl. Facilities Auth. Rev.: | | | | |
(Drexel Univ. Proj.): | | | | |
6% 5/1/24 | | $ 1,000,000 | | $ 1,097,680 |
6% 5/1/29 | | 3,470,000 | | 3,744,963 |
(Lafayette College Proj.) 6% 5/1/30 | | 2,500,000 | | 2,830,150 |
(Temple Univ. Proj.) 5.375% 7/15/19 (MBIA Insured) | | 1,000,000 | | 1,094,750 |
(UPMC Health Sys. Proj.) Series 1999 A: | | | | |
5.25% 8/1/10 (FSA Insured) | | 1,000,000 | | 1,119,630 |
5.25% 8/1/11 (FSA Insured) | | 1,000,000 | | 1,121,270 |
Pennsylvania Hsg. Fin. Agcy.: | | | | |
Series 52B, 5.55% 10/1/12 (b) | | 560,000 | | 562,458 |
Series 54A, 5.375% 10/1/28 (b) | | 755,000 | | 776,442 |
Pennsylvania Indl. Dev. Auth. Rev. 7% 1/1/07 (AMBAC Insured) | | 1,000,000 | | 1,142,980 |
Pennsylvania Pub. School Bldg. Auth. School Rev. (Northwestern School District Proj.) Series E, 5.75% 1/15/19 (FGIC Insured) | | 500,000 | | 560,095 |
Pennsylvania Tpk. Commission Registration Fee Rev.: | | | | |
Series 2001, 5.5% 7/15/33 (AMBAC Insured) | | 1,000,000 | | 1,079,770 |
5% 7/15/41 (AMBAC Insured) | | 4,500,000 | | 4,590,090 |
Pennsylvania Tpk. Commission Tpk. Rev. Series S, 5.625% 6/1/12 (FGIC Insured) | | 2,000,000 | | 2,322,060 |
Philadelphia Arpt. Rev.: | | | | |
Series 1998, 5.375% 6/15/10 (FGIC Insured) (b) | | 2,000,000 | | 2,209,220 |
5.375% 6/15/11 (FGIC Insured) (b) | | 3,770,000 | | 4,134,672 |
6% 6/15/08 (FGIC Insured) (b) | | 3,000,000 | | 3,398,550 |
Philadelphia Gas Works Rev.: | | | | |
(1975 Gen. Ordinance Proj.) 17th Series, 5% 7/1/07 (FSA Insured) | | 4,000,000 | | 4,389,400 |
Third Series: | | | | |
5% 8/1/05 (FSA Insured) | | 1,000,000 | | 1,056,320 |
5% 8/1/06 (FSA Insured) | | 1,000,000 | | 1,077,890 |
Philadelphia Gen. Oblig. 5.25% 9/15/12 (FSA Insured) | | 2,455,000 | | 2,754,387 |
Philadelphia Hosp. & Higher Ed. Facilities Auth. Health Sys. Rev. (Jefferson Health Sys. Proj.) Series A: | | | | |
5% 5/15/09 | | 1,000,000 | | 1,074,190 |
5.5% 5/15/08 | | 1,000,000 | | 1,088,200 |
Philadelphia Hosps. & Higher Ed. Facilities Auth. Hosp. Rev. (Pennsylvania Hosp. Proj.) 6.25% 7/1/06 (Escrowed to Maturity) (c) | | 2,600,000 | | 2,893,514 |
Philadelphia Muni. Auth. Rev.: | | | | |
(Muni. Svcs. Bldg. Lease Prog.) 0% 3/15/11 (FSA Insured) | | 1,000,000 | | 774,620 |
Municipal Bonds - continued |
| Principal
Amount | | Value
(Note 1) |
Pennsylvania - continued |
Philadelphia Muni. Auth. Rev.: - continued | | | | |
Series B, 5.25% 11/15/11 (FSA Insured) | | $ 2,000,000 | | $ 2,278,820 |
Philadelphia School District: | | | | |
Series 2000 A, 5.75% 2/1/13 (FSA Insured) | | 365,000 | | 420,261 |
Series 2002 A: | | | | |
5.5% 2/1/26 (FSA Insured) | | 3,540,000 | | 3,820,014 |
5.5% 2/1/31 (FSA Insured) | | 1,000,000 | | 1,075,570 |
Series B, 5.375% 4/1/27 (AMBAC Insured) | | 4,000,000 | | 4,204,840 |
Series C, 5.75% 3/1/29 (MBIA Insured) | | 5,000,000 | | 5,518,150 |
Philadelphia Wtr. & Wastewtr. Rev.: | | | | |
Series 14, 0% 10/1/08 (MBIA Insured) | | 5,300,000 | | 4,641,581 |
Series A, 5.375% 11/1/19 (FGIC Insured) | | 3,000,000 | | 3,300,090 |
Pittsburgh Gen. Oblig.: | | | | |
Series 2003 A, 5.5% 9/1/16 (AMBAC Insured) | | 5,000,000 | | 5,558,650 |
Series 2003 D, 5% 9/1/06 (FGIC Insured) | | 250,000 | | 268,740 |
5.5% 9/1/12 (AMBAC Insured) | | 1,065,000 | | 1,177,017 |
Pittsburgh School District Series C: | | | | |
0% 8/1/07 (AMBAC Insured) | | 2,610,000 | | 2,388,515 |
0% 8/1/08 (AMBAC Insured) | | 2,000,000 | | 1,759,660 |
Pittsburgh Wtr. & Swr. Auth. Wtr. & Swr. Sys. Rev. Series A, 6.5% 9/1/13 (FGIC Insured) | | 10,000,000 | | 12,202,198 |
Scranton-Lackawanna Health & Welfare Auth. Rev. (Cmnty. Med. Ctr. Proj.) 5.5% 7/1/12 (MBIA Insured) | | 3,375,000 | | 3,765,555 |
Southeastern Pennsylvania Trans. Auth. Spl. Rev. Series A, 6.5% 3/1/04 (Escrowed to Maturity) (c) | | 85,000 | | 85,723 |
Spring-Ford Area School District: | | | | |
5.375% 4/1/16 (FSA Insured) | | 790,000 | | 880,984 |
5.375% 4/1/17 (FSA Insured) | | 830,000 | | 916,287 |
5.375% 4/1/18 (FSA Insured) | | 875,000 | | 963,375 |
Tredyffrin-Easttown School District: | | | | |
5% 2/15/19 | | 3,000,000 | | 3,140,430 |
5.5% 2/15/13 | | 1,015,000 | | 1,151,112 |
5.5% 2/15/16 | | 2,140,000 | | 2,403,926 |
Union County Higher Edl. Facilities Fing. Auth. Univ. Rev. (Bucknell Univ. Proj.) Series A, 5.25% 4/1/19 | | 1,000,000 | | 1,087,970 |
Upper Saint Clair Township School District 5.375% 7/15/16 (FSA Insured) | | 1,855,000 | | 2,075,189 |
West Allegheny School District Series B: | | | | |
5% 2/1/11 (FGIC Insured) | | 1,225,000 | | 1,373,495 |
5.25% 2/1/12 (FGIC Insured) | | 1,850,000 | | 2,099,991 |
Municipal Bonds - continued |
| Principal
Amount | | Value
(Note 1) |
Pennsylvania - continued |
Westmoreland County Indl. Dev. Auth. Rev. (Nat'l. Waste & Energy Corp./Valley Landfill Expansion Proj.) 5.1%, tender 5/1/09 (a)(b) | | $ 2,700,000 | | $ 2,800,035 |
Westmoreland County Muni. Auth. Muni. Svc. Rev. Series A: | | | | |
0% 8/15/19 (FGIC Insured) | | 5,000,000 | | 2,411,450 |
0% 8/15/20 (FGIC Insured) | | 2,500,000 | | 1,132,150 |
Wyomissing Area School District Series B: | | | | |
5.35% 5/1/09 (FGIC Insured) | | 1,130,000 | | 1,283,804 |
5.35% 5/1/10 (FGIC Insured) | | 1,190,000 | | 1,360,134 |
York City Swr. Auth. Swr. Rev. 0% 12/1/12 (MBIA Insured) | | 3,235,000 | | 2,305,746 |
York County Solid Waste & Refuse Auth. Solid Waste Sys. Rev. 5.25% 12/1/05 (FGIC Insured) | | 2,500,000 | | 2,677,125 |
| | 280,080,266 |
Puerto Rico - 1.0% |
Puerto Rico Commonwealth Hwy. & Trans. Auth. Hwy. Rev. Series Y, 5.5% 7/1/36 (FSA Insured) | | 400,000 | | 444,680 |
Puerto Rico Commonwealth Infrastructure Fing. Auth. Series 2000 A, 5.5% 10/1/32 (Escrowed to Maturity) (c) | | 2,100,000 | | 2,296,413 |
Puerto Rico Commonwealth Urban Renewal & Hsg. Corp. 7.875% 10/1/04 | | 100,000 | | 100,611 |
| | 2,841,704 |
TOTAL INVESTMENT PORTFOLIO - 98.3% (Cost $268,406,256) | | 287,034,945 |
NET OTHER ASSETS - 1.7% | | 4,983,829 |
NET ASSETS - 100% | $ 292,018,774 |
Legend |
(a) The coupon rate shown on floating or adjustable rate securities represents the rate at period end. |
(b) Private activity obligations whose interest is subject to the federal alternative minimum tax for individuals. |
(c) Security collateralized by an amount sufficient to pay interest and principal. |
Other Information |
The distribution of municipal securities by revenue source, as a percentage of total net assets, is as follows: |
General Obligations | 42.6% |
Transportation | 12.0 |
Health Care | 11.6 |
Water & Sewer | 11.1 |
Education | 10.9 |
Others* (individually less than 5%) | 11.8 |
| 100.0% |
*Includes net other assets |
Purchases and sales of securities, other than short-term securities, aggregated $51,989,191 and $70,322,119, respectively. |
Income Tax Information |
The fund hereby designates approximately $2,623,000 as a capital gain dividend for the purpose of the dividend paid deduction. |
During the fiscal year ended December 31, 2003, 100.00% of the fund's income dividends was free from federal income tax, and 15.42% of the fund's income dividends was subject to the federal alternative minimum tax (unaudited). The fund will notify shareholders in January 2004 of amounts for use in preparing 2003 income tax returns. |
See accompanying notes which are an integral part of the financial statements.
Annual Report
Spartan Pennsylvania Municipal Income Fund
Financial Statements
Statement of Assets and Liabilities
| December 31, 2003 |
| | |
Assets | | |
Investment in securities, at value (cost $268,406,256) - See accompanying schedule | | $ 287,034,945 |
Cash | | 1,882,516 |
Receivable for fund shares sold | | 248,233 |
Interest receivable | | 3,501,723 |
Prepaid expenses | | 1,771 |
Other receivables | | 2,312 |
Total assets | | 292,671,500 |
| | |
Liabilities | | |
Payable for fund shares redeemed | $ 233,404 | |
Distributions payable | 271,182 | |
Accrued management fee | 91,638 | |
Other affiliated payables | 24,920 | |
Other payables and accrued expenses | 31,582 | |
Total liabilities | | 652,726 |
| | |
Net Assets | | $ 292,018,774 |
Net Assets consist of: | | |
Paid in capital | | $ 273,597,646 |
Undistributed net investment income | | 23,804 |
Accumulated undistributed net realized gain (loss) on investments | | (231,365) |
Net unrealized appreciation (depreciation) on investments | | 18,628,689 |
Net Assets, for 26,396,932 shares outstanding | | $ 292,018,774 |
Net Asset Value, offering price and redemption price per share ($292,018,774 ÷ 26,396,932 shares) | | $ 11.06 |
See accompanying notes which are an integral part of the financial statements.
Annual Report
Spartan Pennsylvania Municipal Income Fund
Financial Statements - continued
Statement of Operations
| Year ended December 31, 2003 |
| | |
Investment Income | | |
Interest | | $ 13,894,580 |
| | |
Expenses | | |
Management fee | $ 1,128,078 | |
Transfer agent fees | 219,541 | |
Accounting fees and expenses | 95,793 | |
Non-interested trustees' compensation | 1,625 | |
Custodian fees and expenses | 5,323 | |
Registration fees | 19,538 | |
Audit | 51,750 | |
Legal | 4,615 | |
Miscellaneous | 730 | |
Total expenses before reductions | 1,526,993 | |
Expense reductions | (44,028) | 1,482,965 |
Net investment income (loss) | | 12,411,615 |
Realized and Unrealized Gain (Loss) Net realized gain (loss) on: | | |
Investment securities | 3,083,700 | |
Swap agreements | 31,500 | |
Total net realized gain (loss) | | 3,115,200 |
Change in net unrealized appreciation (depreciation) on investment securities | | (684,686) |
Net gain (loss) | | 2,430,514 |
Net increase (decrease) in net assets resulting from operations | | $ 14,842,129 |
See accompanying notes which are an integral part of the financial statements.
Annual Report
Statement of Changes in Net Assets
| Year ended
December 31,
2003 | Year ended
December 31,
2002 |
Increase (Decrease) in Net Assets | | |
Operations | | |
Net investment income (loss) | $ 12,411,615 | $ 12,634,521 |
Net realized gain (loss) | 3,115,200 | 1,063,790 |
Change in net unrealized appreciation (depreciation) | (684,686) | 11,039,864 |
Net increase (decrease) in net assets resulting
from operations | 14,842,129 | 24,738,175 |
Distributions to shareholders from net investment income | (12,386,124) | (12,638,897) |
Distributions to shareholders from net realized gain | (2,676,206) | (1,099,730) |
Total distributions | (15,062,330) | (13,738,627) |
Share transactions
Net proceeds from sales of shares | 33,102,566 | 50,598,095 |
Reinvestment of distributions | 11,095,137 | 10,033,987 |
Cost of shares redeemed | (51,986,017) | (40,873,381) |
Net increase (decrease) in net assets resulting from share transactions | (7,788,314) | 19,758,701 |
Redemption fees | 1,591 | 5,840 |
Total increase (decrease) in net assets | (8,006,924) | 30,764,089 |
| | |
Net Assets | | |
Beginning of period | 300,025,698 | 269,261,609 |
End of period (including undistributed net investment income of $23,804 and undistributed net investment income of $65,166, respectively) | $ 292,018,774 | $ 300,025,698 |
Other Information Shares | | |
Sold | 2,987,477 | 4,635,432 |
Issued in reinvestment of distributions | 1,001,950 | 919,332 |
Redeemed | (4,706,471) | (3,759,129) |
Net increase (decrease) | (717,044) | 1,795,635 |
See accompanying notes which are an integral part of the financial statements.
Annual Report
Financial Highlights
Years ended December 31, | 2003 | 2002 | 2001 | 2000 | 1999 |
Selected Per-Share Data | | | | | |
Net asset value, beginning of period | $ 11.07 | $ 10.64 | $ 10.64 | $ 10.06 | $ 10.83 |
Income from Investment Operations | | | | | |
Net investment income (loss) | .463B | .482B | .494B,D | .494B | .482 |
Net realized and unrealized gain (loss) | .091 | .471 | .030D | .581 | (.709) |
Total from investment operations | .554 | .953 | .524 | 1.075 | (.227) |
Distributions from net investment income | (.462) | (.482) | (.493) | (.495) | (.482) |
Distributions from net realized gain | (.102) | (.041) | (.031) | - | (.042) |
Distributions in excess of net realized gain | - | - | - | - | (.020) |
Total distributions | (.564) | (.523) | (.524) | (.495) | (.544) |
Redemption fees added to paid in capital | -B,E | -B,E | -B,E | -B,E | .001 |
Net asset value, end of period | $ 11.06 | $ 11.07 | $ 10.64 | $ 10.64 | $ 10.06 |
Total ReturnA | 5.11% | 9.14% | 4.97% | 10.99% | (2.16)% |
Ratios to Average Net AssetsC | | | | | |
Expenses before expense
reductions | .51% | .51% | .51% | .52% | .51% |
Expenses net of voluntary
waivers, if any | .51% | .51% | .51% | .52% | .51% |
Expenses net of all reductions | .50% | .49% | .45% | .44% | .51% |
Net investment income (loss) | 4.18% | 4.42% | 4.59%D | 4.84% | 4.58% |
Supplemental Data | | | | | |
Net assets, end of period
(000 omitted) | $ 292,019 | $ 300,026 | $ 269,262 | $ 243,369 | $ 242,001 |
Portfolio turnover rate | 18% | 9% | 22% | 26% | 28% |
A Total returns would have been lower had certain expenses not been reduced during the periods shown.
B Calculated based on average shares outstanding during the period.
C Expense ratios reflect operating expenses of the fund. Expenses before reductions do not reflect amounts reimbursed by the investment adviser or reductions from brokerage service arrangements or other expense offset arrangements and do not represent the amount paid by the fund during periods when reimbursements or reductions occur. Expenses net of any voluntary waivers reflect expenses after reimbursement by the investment adviser but prior to reductions from brokerage service arrangements or other expense offset arrangements. Expenses net of all reductions represent the net expenses paid by the fund.
D Effective January 1, 2001, the fund adopted the provisions of the AICPA Audit and Accounting Guide for Investment Companies and began amortizing premium and discount on all debt securities. Per-share data and ratios for periods prior to adoption have not been restated to reflect this change.
E Amount represents less than $.001 per share.
See accompanying notes which are an integral part of the financial statements.
Annual Report
Fidelity Pennsylvania Municipal Money Market Fund
Investment Changes/Perfomance
Maturity Diversification |
Days | % of fund's
investments
12/31/03 | % of fund's
investments
6/30/03 | % of fund's
investments
12/31/02 |
0 - 30 | 74.0 | 78.8 | 75.5 |
31 - 90 | 2.2 | 9.6 | 3.2 |
91 - 180 | 17.5 | 3.4 | 6.0 |
181 - 397 | 6.3 | 8.2 | 15.3 |
Weighted Average Maturity |
| 12/31/03 | 6/30/03 | 12/31/02 |
Fidelity Pennsylvania Municipal Money Market Fund | 41 Days | 43 Days | 51 Days |
Pennsylvania Tax-Free Money Market Funds Average* | 36 Days | 34 Days | 35 Days |
Asset Allocation (% of fund's net assets) |
As of December 31, 2003 | As of June 30, 2003 |
| Variable Rate
Demand Notes
(VRDNs) 67.2% | | | Variable Rate
Demand Notes
(VRDNs) 69.0% | |
| Commercial Paper (including CP Mode) 15.7% | | | Commercial Paper (including CP Mode) 6.2% | |
| Tender Bonds 7.9% | | | Tender Bonds 10.8% | |
| Municipal Notes 2.0% | | | Municipal Notes 2.4% | |
| Fidelity Municipal
Cash Central Fund 0.6% | | | Fidelity Municipal
Cash Central Fund 3.9% | |
| Other Investments 5.7% | | | Other Investments 6.1% | |
| Net Other Assets 0.9% | | | Net Other Assets 1.6% | |

Current and Historical Seven-Day Yields |
| 12/29/03 | 9/29/03 | 6/30/03 | 3/31/03 | 12/30/02 |
Fidelity Pennsylvania Municipal Money
Market Fund | 0.84% | 0.60% | 0.62% | 0.77% | 1.02% |
Yield refers to the income paid by the fund over a given period. Yields for money market funds are usually for seven-day periods, as they are here, though they are expressed as annual percentage rates. Past performance is no guarantee of future results. Yield will vary and it is possible to lose money by investing in the fund.
Annual Report
*Source: iMoneyNet, Inc.
Annual Report
Fidelity Pennsylvania Municipal Money Market Fund
Investments December 31, 2003
Showing Percentage of Net Assets
Municipal Securities - 99.1% |
| Principal
Amount | | Value
(Note 1) |
Pennsylvania - 98.5% |
Allegheny County Arpt. Rev. Participating VRDN Series PA 567, 1.34% (Liquidity Facility Merrill Lynch & Co., Inc.) (a)(d)(f) | $ 2,000,000 | | $ 2,000,000 |
Allegheny County Hosp. Dev. Auth. Rev.: | | | |
Bonds: | | | |
(South Hills Health Sys. Proj.): | | | |
Series 1998 B, 1.25%, tender 4/1/04, LOC PNC Bank NA, Pittsburgh (a) | 3,250,000 | | 3,250,000 |
Series 2000 A, 1.15%, tender 6/1/04, LOC PNC Bank NA, Pittsburgh (a) | 4,000,000 | | 4,000,000 |
(Univ. of Pittsburgh Med. Ctr. Proj.) Series B, 2.5% 6/15/04 | 2,800,000 | | 2,814,455 |
Series PT 762, 1.25%, tender 8/26/04 (Liquidity Facility Landesbank Hessen-Thuringen) (a)(f)(g) | 2,800,000 | | 2,800,000 |
(Presbyterian Univ. Health Sys. Proj.) Series 1990 B, 1.27% (MBIA Insured), VRDN (a) | 1,500,000 | | 1,500,000 |
(Saint Margaret Mem. Hosp. Proj.) Series 1992 A, 1.33%, LOC Mellon Bank NA, Pittsburgh, VRDN (a) | 5,315,000 | | 5,315,000 |
Allegheny County Indl. Dev. Auth. Econ. Dev. Rev. (Glassport Realty Ltd. Proj.) 1.45%, LOC Huntington Nat'l. Bank, Columbus, VRDN (a)(d) | 1,890,000 | | 1,890,000 |
Allegheny County Indl. Dev. Auth. Rev.: | | | |
Bonds (Children's Museum of Pittsburgh Proj.) 2%, tender 10/1/04, LOC PNC Bank NA, Pittsburgh (a) | 3,000,000 | | 3,020,481 |
Participating VRDN Series Merlots A48, 1.21% (Liquidity Facility Wachovia Bank NA) (a)(f) | 3,000,000 | | 3,000,000 |
(Doren, Inc. Proj.) Series 1997 C, 1.45%, LOC Nat'l. City Bank, PA, VRDN (a)(d) | 1,800,000 | | 1,800,000 |
(North Versailles Shopping Ctr. Proj.) Series 1992, 1.45%, LOC Bank One NA, VRDN (a) | 1,540,000 | | 1,540,000 |
(R.I. Lampus Co. Proj.) Series 1997 A, 1.45%, LOC Nat'l. City Bank, PA, VRDN (a)(d) | 2,560,000 | | 2,560,000 |
(Union Elec. Steel Co. Proj.) Series 1996 A, 1.4%, LOC PNC Bank NA, Pittsburgh, VRDN (a)(d) | 3,120,000 | | 3,120,000 |
(UPMC Health Sys. Proj.) Series 2002 C, 1.4%, LOC Comerica Bank, Detroit, VRDN (a) | 1,880,000 | | 1,880,000 |
Beaver County Indl. Dev. Auth. Poll. Cont. Rev. Participating VRDN Series EGL 95 3503, 1.3% (Liquidity Facility Citibank NA, New York) (a)(f) | 2,700,000 | | 2,700,000 |
Berks County Indl. Dev. Auth. Rev. (Grafika Commercial Printing, Inc. Proj.) Series 1995, 1.3%, LOC Wachovia Bank NA, VRDN (a)(d) | 850,000 | | 850,000 |
Municipal Securities - continued |
| Principal
Amount | | Value
(Note 1) |
Pennsylvania - continued |
Bucks County Indl. Dev. Auth. Rev.: | | | |
(Double H Plastics, Inc. Proj.) Series 1993, 1.3%, LOC Wachovia Bank NA, VRDN (a)(d) | $ 1,020,000 | | $ 1,020,000 |
(Snowball Real Estate LP Proj.) 1.45%, LOC Wachovia Bank NA, VRDN (a)(d) | 2,500,000 | | 2,500,000 |
Butler County Indl. Dev. Auth. Rev. (Armco, Inc. Proj.) Series 1996 A, 1.4%, LOC Fifth Third Bank, Cincinnati, VRDN (a)(d) | 1,500,000 | | 1,500,000 |
Cambria County Ind. Dev. Auth. (Cambria Cogen Co. Proj.) Series 1998 A1, 1.2%, LOC Bayerische Hypo Und Verein Ag, VRDN (a)(d) | 2,525,000 | | 2,525,000 |
Central Bucks School District Series 2000 A, 1.3% (FGIC Insured), VRDN (a) | 4,520,000 | | 4,520,000 |
Chester County Inter Unit 1.35%, LOC PNC Bank NA, Pittsburgh, VRDN (a) | 2,500,000 | | 2,500,000 |
Cumberland County Indl. Dev. Auth. Rev. (Lane Enterprises, Inc. Proj.) Series 1994, 1.3%, LOC Wachovia Bank NA, VRDN (a)(d) | 885,000 | | 885,000 |
Delaware County Indl. Dev. Auth. Poll. Cont. Rev. Bonds (Philadelphia Elec. Co. Proj.) Series A, 1% tender 4/6/04, LOC Bank One NA, Chicago, CP mode | 2,900,000 | | 2,900,000 |
Harrisburg Auth. Wtr. Rev. Series A, 1.35% (FGIC Insured), VRDN (a) | 2,800,000 | | 2,800,000 |
Hatfield Township Indl. Dev. Auth. Exempt Facilities Rev. (Hatfield Quality Meats Proj.) 1.2%, LOC Bank of America NA, VRDN (a) | 2,500,000 | | 2,500,000 |
Indiana County Indl. Dev. Auth. Poll. Cont. Rev. (Conemaught Proj.) Series 1997 A, 1.25%, LOC Bank One NA, Chicago, VRDN (a)(d) | 4,115,000 | | 4,115,000 |
Lancaster County Hosp. Auth. Rev. (Health Ctr. Willow Valley Proj.) Series B, 1.35% (MBIA Insured), VRDN (a) | 2,400,000 | | 2,400,000 |
Lancaster Higher Ed. Auth. College Rev. (Franklin & Marshall College Proj.) Series 1997, 1.35% (Liquidity Facility JPMorgan Chase Bank), VRDN (a) | 2,895,000 | | 2,895,000 |
Lawrence County Indl. Dev. Auth. Indl. Dev. Rev. (Atlantic States Materials Proj.) Series 1999, 1.4%, LOC Wachovia Bank NA, VRDN (a)(d) | 1,600,000 | | 1,600,000 |
Lehigh County Gen. Purp. Auth. Bonds (Muhlenberg Reg'l. Med. Ctr. Proj.) Series A, 6.6% 7/15/22 (Pre-Refunded to 7/15/04 @ 100) (e) | 2,000,000 | | 2,051,413 |
Montgomery County Indl. Dev. Auth. Poll. Cont. Rev.: | | | |
Bonds (Peco Energy Co. Proj.) Series 1994 A: | | | |
1% tender 2/18/04, LOC Wachovia Bank NA, CP mode | 3,000,000 | | 3,000,000 |
1% tender 3/10/04, LOC Wachovia Bank NA, CP mode | 3,500,000 | | 3,500,000 |
Municipal Securities - continued |
| Principal
Amount | | Value
(Note 1) |
Pennsylvania - continued |
Montgomery County Indl. Dev. Auth. Poll. Cont. Rev.: - continued | | | |
(Gaudenzia Foundation, Inc. Prog.) 1.3%, LOC PNC Bank NA, Pittsburgh, VRDN (a) | $ 4,520,000 | | $ 4,520,000 |
(H.P. Cadwallader, Inc. Proj.) Series 1995, 1.35%, LOC Wachovia Bank NA, VRDN (a)(d) | 320,000 | | 320,000 |
(RJI LP Proj.) Series 1992, 1.28%, LOC Nat'l. City Bank, VRDN (a)(d) | 415,000 | | 415,000 |
Northampton County Higher Ed. Auth. Rev. Bonds (Lehigh Univ. Proj.) 5.25% 8/15/04 (MBIA Insured) | 1,900,000 | | 1,949,195 |
Northampton County Indl. Dev. Auth. Rev.: | | | |
Bonds (American Wtr. Cap. Corp. Proj.) Series 1991, 1.12% tender 1/13/04, CP mode (d) | 2,500,000 | | 2,500,000 |
(Binney & Smith, Inc. Proj.) Series 1997 A, 1.25%, LOC Bank One NA, Chicago, VRDN (a)(d) | 2,350,000 | | 2,350,000 |
Northampton Indl. Dev. Auth. Rev. (Ultra-Poly Corp./Portland Ind. Park Proj.) 1.3%, LOC PNC Bank NA, Pittsburgh, VRDN (a)(d) | 1,500,000 | | 1,500,000 |
Northeastern Pennsylvania Hosp. & Edl. Auth. Health Care Rev. (Wyoming Valley Health Care Proj.) Series 1994 A, 1.2% (AMBAC Insured), VRDN (a) | 7,000,000 | | 7,000,000 |
Penn Trafford School District Bonds 6.6% 5/1/08 (Pre-Refunded to 5/1/04 @ 102) (e) | 2,470,000 | | 2,564,540 |
Pennsylvania Econ. Dev. Fing. Auth. Exempt Facilities Rev.: | | | |
(Merck & Co. Proj.) Series 2000, 1.3%, VRDN (a)(d) | 4,000,000 | | 4,000,000 |
(Reliant Energy Seward LLC Proj.): | | | |
Series 2002 A, 1.15%, LOC WestLB AG, VRDN (a)(d) | 9,600,000 | | 9,600,000 |
Series 2002 B, 1.17%, LOC WestLB AG, VRDN (a)(d) | 5,700,000 | | 5,700,000 |
Series A, 1.15%, LOC WestLB AG, VRDN (a)(d) | 10,000,000 | | 10,000,000 |
Pennsylvania Econ. Dev. Fing. Auth. Indl. Dev. Rev.: | | | |
(Dodge-Regupol, Inc. Proj.) Series D4, 1.4%, LOC PNC Bank NA, Pittsburgh, VRDN (a)(d) | 400,000 | | 400,000 |
(Respironics, Inc. Proj.) Series 1989 F, 1.4%, LOC PNC Bank NA, Pittsburgh, VRDN (a)(d) | 100,000 | | 100,000 |
Series 1996 A2, 1.4%, LOC PNC Bank NA, Pittsburgh, VRDN (a)(d) | 900,000 | | 900,000 |
Series 1996 A7, 1.4%, LOC PNC Bank NA, Pittsburgh, VRDN (a)(d) | 475,000 | | 475,000 |
Series B3, 1.4%, LOC PNC Bank NA, Pittsburgh, VRDN (a)(d) | 1,900,000 | | 1,900,000 |
Series B5, 1.4%, LOC PNC Bank NA, Pittsburgh, VRDN (a)(d) | 1,200,000 | | 1,200,000 |
Municipal Securities - continued |
| Principal
Amount | | Value
(Note 1) |
Pennsylvania - continued |
Pennsylvania Gen. Oblig.: | | | |
Bonds First Series, 5% 5/1/04 | $ 1,425,000 | | $ 1,443,834 |
Participating VRDN: | | | |
Series MS 01 465, 1.29% (Liquidity Facility Morgan Stanley) (a)(f) | 6,995,000 | | 6,995,000 |
Series Putters 364, 1.27% (Liquidity Facility JPMorgan Chase Bank) (a)(f) | 3,000,000 | | 3,000,000 |
Pennsylvania Higher Ed. Assistance Agcy. Student Ln. Rev.: | | | |
Series 1988 B, 1.13% (AMBAC Insured), VRDN (a)(d) | 4,350,000 | | 4,350,000 |
Series 2001 B, 1.31% (FSA Insured), VRDN (a)(d) | 800,000 | | 800,000 |
Series 2002 B, 1.34% (FSA Insured), VRDN (a)(d) | 2,800,000 | | 2,800,000 |
Series A, 1.34% (FSA Insured), VRDN (a)(d) | 5,600,000 | | 5,600,000 |
Series A1, 1.34% (AMBAC Insured), VRDN (a)(d) | 5,600,000 | | 5,600,000 |
Pennsylvania Higher Edl. Facilities Auth. Rev.: | | | |
Bonds (Robert Morris College Proj.) Series F2, 1.15%, tender 5/1/04, LOC PNC Bank NA, Pittsburgh (a) | 5,800,000 | | 5,800,000 |
(Mount Aloysius College Proj.) Series L3, 1.32%, LOC Allied Irish Banks PLC, VRDN (a) | 2,600,000 | | 2,600,000 |
(Waynesburg College Proj.) Series 1997, 1.3%, LOC PNC Bank NA, Pittsburgh, VRDN (a) | 1,100,000 | | 1,100,000 |
Pennsylvania Hsg. Fin. Agcy. Participating VRDN: | | | |
Series PA 1235, 1.3% (Liquidity Facility Merrill Lynch & Co., Inc.) (a)(d)(f) | 2,900,000 | | 2,900,000 |
Series PA 930, 1.28% (Liquidity Facility Merrill Lynch & Co., Inc.) (a)(d)(f) | 5,995,000 | | 5,995,000 |
Series PT 119B, 1.28% (Liquidity Facility Merrill Lynch & Co., Inc.) (a)(d)(f) | 615,000 | | 615,000 |
Series PT 890, 1.3% (Liquidity Facility Merrill Lynch & Co., Inc.) (a)(d)(f) | 2,800,000 | | 2,800,000 |
Pennsylvania Pub. School Bldg. Auth. School Rev. Participating VRDN: | | | |
Series AAB 03 24, 1.19% (Liquidity Facility ABN-AMRO Bank NV) (a)(f) | 2,300,000 | | 2,300,000 |
Series Merlots 03 A42, 1.21% (Liquidity Facility Wachovia Bank NA) (a)(f) | 2,900,000 | | 2,900,000 |
Pennsylvania Tpk. Commission Oil Franchise Tax Rev. Participating VRDN Series ROC II R1005, 1.3% (Liquidity Facility Citigroup Global Markets Hldgs., Inc.) (a)(f) | 2,480,000 | | 2,480,000 |
Philadelphia Arpt. Rev. Participating VRDN Series SG 118, 1.34% (Liquidity Facility Societe Generale) (a)(d)(f) | 2,600,000 | | 2,600,000 |
Municipal Securities - continued |
| Principal
Amount | | Value
(Note 1) |
Pennsylvania - continued |
Philadelphia Auth. for Indl. Dev. Arpt. Rev. Participating VRDN: | | | |
Series PA 882, 1.34% (Liquidity Facility Merrill Lynch & Co., Inc.) (a)(d)(f) | $ 2,200,000 | | $ 2,200,000 |
Series Putters 217, 1.31% (Liquidity Facility JPMorgan Chase Bank) (a)(d)(f) | 2,000,000 | | 2,000,000 |
Philadelphia Auth. for Indl. Dev. Revs. (Saint Josephs Preparatory School Proj.) 1.18%, LOC Allied Irish Banks PLC, VRDN (a) | 4,500,000 | | 4,500,000 |
Philadelphia Gas Works Rev.: | | | |
Bonds Series 1998 104, 1%, tender 6/24/04 (Liquidity Facility Morgan Stanley) (a)(f)(g) | 2,195,000 | | 2,195,000 |
Series 2002 D: | | | |
1.13% 1/9/04, LOC JPMorgan Chase Bank, CP | 8,000,000 | | 8,000,000 |
1.17% 1/9/04, LOC JPMorgan Chase Bank, CP | 5,000,000 | | 5,000,000 |
Philadelphia Gen. Oblig.: | | | |
Participating VRDN Series MS 01 751, 1.28% (Liquidity Facility Morgan Stanley) (a)(f) | 2,630,000 | | 2,630,000 |
TRAN 2% 6/30/04 | 3,000,000 | | 3,013,751 |
Philadelphia Wtr. & Wastewtr. Rev. Bonds Series MS 773, 1.15%, tender 4/1/04 (Liquidity Facility Morgan Stanley) (a)(f)(g) | 2,000,000 | | 2,000,000 |
Pittsburgh School District Bonds 2% 9/1/04 (FGIC Insured) | 1,220,000 | | 1,227,639 |
Pittsburgh Wtr. & Swr. Auth. Wtr. & Swr. Sys. Rev. Bonds 1.15% 9/1/04 (FSA Insured) | 4,280,000 | | 4,280,000 |
Schuylkill County Indl. Dev. Auth. Resource Recovery Rev. (Northeastern Pwr. Co. Proj.) Series 1997 B, 1.4%, LOC Dexia Cr. Local de France, VRDN (a)(d) | 15,270,000 | | 15,270,000 |
Schuylkill County Indl. Dev. Auth. Rev. (Metal Sales Manufacturing Corp.) Series 1995, 1.53%, LOC U.S. Bank NA, Minnesota, VRDN (a)(d) | 300,000 | | 300,000 |
Scranton-Lackawanna Health & Welfare Auth. Rev. Participating VRDN Series Merlots 02 A18, 1.21% (Liquidity Facility Wachovia Bank NA) (a)(f) | 3,345,000 | | 3,345,000 |
Temple Univ. of the Commonwealth Sys. of Higher Ed. BAN 1.2% 5/4/04 | 2,800,000 | | 2,800,000 |
Upper Dauphin Indl. Dev. Auth. Rev. (United Church Christ Homes Proj.) Series 2001, 1.35%, LOC First Tennessee Bank NA, Memphis, VRDN (a) | 2,500,000 | | 2,500,000 |
Venango Indl. Dev. Auth. Resource Recovery Rev. Bonds (Scrubgrass Generating Co. LP Proj.): | | | |
Series 1990 A: | | | |
1.05% tender 4/8/04, LOC Dexia Cr. Local de France, CP mode (d) | 2,000,000 | | 2,000,000 |
Municipal Securities - continued |
| Principal
Amount | | Value
(Note 1) |
Pennsylvania - continued |
Venango Indl. Dev. Auth. Resource Recovery Rev. Bonds (Scrubgrass Generating Co. LP Proj.): - continued | | | |
1.05% tender 4/8/04, LOC Dexia Cr. Local de France, CP mode (d) | $ 5,750,000 | | $ 5,750,000 |
Series 1990 B, 1.1% tender 4/8/04, LOC Dexia Cr. Local de France, CP mode (d) | 5,000,000 | | 5,000,000 |
Series 1993: | | | |
1.05% tender 4/8/04, LOC Dexia Cr. Local de France, CP mode (d) | 6,515,000 | | 6,515,000 |
1.05% tender 4/8/04, LOC Dexia Cr. Local de France, CP mode (d) | 2,000,000 | | 2,000,000 |
| | 289,850,308 |
| Shares | | |
Other - 0.6% |
Fidelity Municipal Cash Central Fund, 1.3% (b)(c) | 1,840,300 | | 1,840,300 |
TOTAL INVESTMENT PORTFOLIO - 99.1% | | 291,690,608 |
NET OTHER ASSETS - 0.9% | | 2,621,128 |
NET ASSETS - 100% | $ 294,311,736 |
Total Cost for Income Tax Purposes $ 291,690,608 |
Security Type Abbreviations |
BAN - BOND ANTICIPATION NOTE |
CP - COMMERCIAL PAPER |
TRAN - TAX AND REVENUE ANTICIPATION NOTE |
VRDN - VARIABLE RATE DEMAND NOTE |
Legend |
(a) The coupon rate shown on floating or adjustable rate securities represents the rate at period end. |
(b) Information in this report regarding holdings by state and security types does not reflect the holdings of the Fidelity Municipal Cash Central Fund. |
(c) The rate quoted is the annualized seven-day yield of the fund at period end. A complete listing of the fund's holdings as of its most recent fiscal year end is available upon request. |
(d) Private activity obligations whose interest is subject to the federal alternative minimum tax for individuals. |
(e) Security collateralized by an amount sufficient to pay interest and principal. |
(f) Provides evidence of ownership in one or more underlying municipal bonds. |
(g) Restricted securities - Investment in securities not registered under the Securities Act of 1933 (excluding 144A issues) . At the end of the period, the value of restricted securities (excluding 144A issues) amounted to $6,995,000 or 2.4% of net assets. |
Additional information on each holding is as follows: |
Security | Acquisition Date | Cost |
Allegheny County Hosp. Dev. Auth. Rev. Bonds Series PT 762, 1.25%, tender 8/26/04 (Liquidity Facility Landesbank Hessen-Thuringen) | 9/4/03 | $ 2,800,000 |
Philadelphia Gas Works Rev. Bonds Series 1998 104, 1%, tender 6/24/04 (Liquidity Facility Morgan Stanley) | 5/7/03 - 6/26/03 | $ 2,195,000 |
Philadelphia Wtr. & Wastewtr. Rev. Bonds Series MS 773, 1.15%, tender 4/1/04 (Liquidity Facility Morgan Stanley) | 4/2/03 | $ 2,000,000 |
Income Tax Information |
During the fiscal year ended December 31, 2003, 100.00% of the fund's income dividends was free from federal income tax, and 47.91% of the fund's income dividends was subject to the federal alternative minimum tax (unaudited). The fund will notify shareholders in January 2004 of amounts for use in preparing 2003 income tax returns. |
See accompanying notes which are an integral part of the financial statements.
Annual Report
Fidelity Pennsylvania Municipal Money Market Fund
Financial Statements
Statement of Assets and Liabilities
| December 31, 2003 |
| | |
Assets | | |
Investment in securities, at value - See accompanying schedule | | $ 291,690,608 |
Cash | | 7 |
Receivable for fund shares sold | | 3,528,243 |
Interest receivable | | 658,767 |
Other receivables | | 524 |
Total assets | | 295,878,149 |
| | |
Liabilities | | |
Payable for fund shares redeemed | $ 1,399,799 | |
Distributions payable | 44,793 | |
Accrued management fee | 120,278 | |
Other payables and accrued expenses | 1,543 | |
Total liabilities | | 1,566,413 |
| | |
Net Assets | | $ 294,311,736 |
Net Assets consist of: | | |
Paid in capital | | $ 294,311,736 |
Net Assets, for 294,276,173 shares outstanding | | $ 294,311,736 |
Net Asset Value, offering price and redemption price per share ($294,311,736 ÷ 294,276,173 shares) | | $ 1.00 |
See accompanying notes which are an integral part of the financial statements.
Annual Report
Fidelity Pennsylvania Municipal Money Market Fund
Financial Statements - continued
Statement of Operations
| Year ended December 31, 2003 |
| | |
Investment Income | | |
Interest | | $ 3,284,769 |
| | |
Expenses | | |
Management fee | $ 1,423,058 | |
Non-interested trustees' compensation | 1,426 | |
Total expenses before reductions | 1,424,484 | |
Expense reductions | (27,043) | 1,397,441 |
Net investment income | | 1,887,328 |
Net realized gain (loss) on investment securities | | 34,964 |
Net increase in net assets resulting from operations | | $ 1,922,292 |
See accompanying notes which are an integral part of the financial statements.
Annual Report
Statement of Changes in Net Assets
| Year ended
December 31,
2003 | Year ended
December 31,
2002 |
Increase (Decrease) in Net Assets | | |
Operations | | |
Net investment income | $ 1,887,328 | $ 2,794,694 |
Net realized gain (loss) | 34,964 | 32,985 |
Net increase (decrease) in net assets resulting
from operations | 1,922,292 | 2,827,679 |
Distributions to shareholders from net investment income | (1,887,328) | (2,794,694) |
Share transactions at net asset value of $1.00 per share
Proceeds from sales of shares | 400,930,209 | 289,910,688 |
Reinvestment of distributions | 1,808,695 | 2,725,088 |
Cost of shares redeemed | (386,784,374) | (255,051,367) |
Net increase (decrease) in net assets and shares resulting from share transactions | 15,954,530 | 37,584,409 |
Total increase (decrease) in net assets | 15,989,494 | 37,617,394 |
| | |
Net Assets | | |
Beginning of period | 278,322,242 | 240,704,848 |
End of period | $ 294,311,736 | $ 278,322,242 |
See accompanying notes which are an integral part of the financial statements.
Annual Report
Financial Highlights
Years ended December 31, | 2003 | 2002 | 2001 | 2000 | 1999 |
Selected Per-Share Data | | | | | |
Net asset value, beginning of period | $ 1.00 | $ 1.00 | $ 1.00 | $ 1.00 | $ 1.00 |
Income from Investment Operations | | | | | |
Net investment income | .006 | .011 | .025 | .037 | .029 |
Distributions from net investment income | (.006) | (.011) | (.025) | (.037) | (.029) |
Net asset value, end of period | $ 1.00 | $ 1.00 | $ 1.00 | $ 1.00 | $ 1.00 |
Total ReturnA, C | .65% | 1.09% | 2.50% | 3.80% | 2.91% |
Ratios to Average Net AssetsB | | | | | |
Expenses before expense reductions | .50% | .50% | .50% | .50% | .50% |
Expenses net of voluntary waivers, if any | .50% | .50% | .50% | .50% | .50% |
Expenses net of all reductions | .49% | .46% | .47% | .50% | .50% |
Net investment income | .66% | 1.09% | 2.45% | 3.74% | 2.87% |
Supplemental Data | | | | | |
Net assets, end of period
(000 omitted) | $ 294,312 | $ 278,322 | $ 240,705 | $ 213,847 | $ 201,291 |
A Total returns would have been lower had certain expenses not been reduced during the periods shown.
B Expense ratios reflect operating expenses of the fund. Expenses before reductions do not reflect amounts reimbursed by the investment adviser or reductions from brokerage service arrangements or other expense offset arrangements and do not represent the amount paid by the fund during periods when reimbursements or reductions occur. Expenses net of any voluntary waivers reflect expenses after reimbursement by the investment adviser but prior to reductions from brokerage service arrangements or other expense offset arrangements. Expenses net of all reductions represent the net expenses paid by the fund.
C Total returns do not include the effect of the former account closeout fee.
See accompanying notes which are an integral part of the financial statements.
Annual Report
Notes to Financial Statements
For the period ended December 31, 2003
1. Significant Accounting Policies.
Spartan Pennsylvania Municipal Income Fund (the income fund) is a fund of Fidelity Municipal Trust. Fidelity Pennsylvania Municipal Money Market Fund (the money market fund) is a fund of Fidelity Municipal Trust II. Each trust is registered under the Investment Company Act of 1940, as amended (the 1940 Act), as an open-end management investment company. Fidelity Municipal Trust and Fidelity Municipal Trust II (the trusts) are organized as a Massachusetts business trust and a Delaware statutory trust, respectively. Each fund is authorized to issue an unlimited number of shares. Each fund may be affected by economic and political developments in the state of Pennsylvania. The financial statements have been prepared in conformity with accounting principles generally accepted in the United States of America, which require management to make certain estimates and assumptions at the date of the financial statements. The following summarizes the significant accounting policies of the income fund and the money market fund:
Security Valuation. Net asset value per share (NAV calculation) is calculated as of the close of business of the New York Stock Exchange, normally 4:00 p.m. Eastern time. Debt securities are valued on the basis of information provided by a pricing service. Pricing services use valuation matrices that incorporate both dealer-supplied valuations and valuation models. If an event that is expected to materially affect the value of a security occurs after the close of an exchange or market on which that security trades, but prior to the NAV calculation, then that security will be fair valued taking the event into account. Securities (including restricted securities) for which market quotations are not readily available are valued at their fair value as determined in good faith under consistently applied procedures under the general supervision of the Board of Trustees. Price movements in futures contracts and ADRs, market and trading trends, the bid/ask quotes of brokers and off-exchange institutional trading may be reviewed in the course of making a good faith determination of a security's fair value. Short-term securities with remaining maturities of sixty days or less for which quotations are not readily available are valued on the basis of amortized cost. Investments in open-end investment companies are valued at their net asset value each business day.
As permitted under Rule 2a-7 of the 1940 Act, and certain conditions therein, securities owned by the money market fund are valued initially at cost and thereafter assume a constant amortization to maturity of any discount or premium.
Investment Transactions and Income. Security transactions are accounted for as of trade date. Gains and losses on securities sold are determined on the basis of identified cost. Interest income is accrued as earned. Interest income includes coupon interest and amortization of premium and accretion of discount on debt securities, which is accrued using the interest method.
Annual Report
Notes to Financial Statements - continued
1. Significant Accounting Policies - continued
Expenses. Most expenses of each trust can be directly attributed to a fund. Expenses which cannot be directly attributed are apportioned among the funds in the trust.
Income Tax Information and Distributions to Shareholders. Each year, each fund intends to qualify as a regulated investment company by distributing all of their taxable income and realized gains under Subchapter M of the Internal Revenue Code. As a result, no provision for income taxes is required in the accompanying financial statements. Dividends are declared daily and paid monthly from net investment income. Distributions from realized gains, if any, are recorded on the ex-dividend date.
Income and capital gain distributions are determined in accordance with income tax regulations, which may differ from generally accepted accounting principles. In addition, the income fund will treat a portion of the proceeds from shares redeemed as a distribution from net investment income and realized gain for income tax purposes. There were no significant book-to-tax differences during the period for the money market fund. Capital accounts within the income fund's financial statements are adjusted for permanent and temporary book and tax differences. These adjustments have no impact on net assets or the results of operations. Temporary differences will reverse in a subsequent period. These differences are primarily due to market discount and losses deferred due to wash sales and futures transactions.
The tax-basis components of distributable earnings and the federal tax cost for the income fund as of period end were as follows:
Unrealized appreciation | $ 18,073,557 | | |
Unrealized depreciation | (118,860) | |
Net unrealized appreciation (depreciation) | 17,954,697 | |
Undistributed ordinary income | 9,601 | |
Undistributed long-term capital gain | 185,926 | |
| | |
Cost for federal income tax purposes | $ 269,080,248 | |
The tax character of distributions paid for the income fund was as follows:
| December 31,
2003 | December 31,
2002 |
Tax-exempt Income | $ 12,386,124 | $ 12,638,897 |
Ordinary Income | 54,127 | 14,195 |
Long-term Capital Gains | 2,622,079 | 1,085,535 |
Total | $ 15,062,330 | $ 13,738,627 |
Annual Report
1. Significant Accounting Policies - continued
Short-Term Trading (Redemption) Fees. Shares held in the income fund less than 30 days are subject to a short-term trading fee equal to .50% of the proceeds of the redeemed shares. The fee, which is retained by the fund, is accounted for as an addition to paid in capital.
2. Operating Policies.
Restricted Securities. Certain funds may invest in securities that are subject to legal or contractual restrictions on resale. These securities generally may be resold in transactions exempt from registration or to the public if the securities are registered. Disposal of these securities may involve time-consuming negotiations and expense, and prompt sale at an acceptable price may be difficult. Information regarding restricted securities is included at the end of each applicable fund's Schedule of Investments.
Swap Agreements. The income fund may invest in swaps for the purpose of managing its exposure to interest rate, credit or market risk.
Interest rate swaps are agreements to exchange cash flows periodically based on a notional principal amount, for example, the exchange of fixed rate interest payments for floating rate interest payments. The primary risk associated with interest rate swaps is that unfavorable changes in the fluctuation of interest rates could adversely impact the fund.
Swaps are marked-to-market daily based on dealer-supplied valuations and changes in value are recorded as unrealized appreciation (depreciation). Gains or losses are realized upon early termination of the swap agreement. Collateral, in the form of cash or securities, may be required to be held in segregated accounts with the fund's custodian in compliance with swap contracts.
3. Purchases and Sales of Investments.
Information regarding purchases and sales of securities is included under the caption "Other Information" at the end of each applicable fund's Schedule of Investments.
4. Fees and Other Transactions with Affiliates.
Management Fee. Fidelity Management & Research Company (FMR) and its affiliates provide the income fund with investment management related services for which the fund pays a monthly management fee. The management fee is the sum of an individual fund fee rate that is based on an annual rate of.25% of the fund's average net assets and a group fee rate that averaged .13% during the period. The group fee rate is based upon the average net assets of all the mutual funds advised by FMR. The group fee rate decreases as assets under management increase and increases as assets under management
Annual Report
Notes to Financial Statements - continued
4. Fees and Other Transactions with Affiliates - continued
Management Fee - continued
decrease. For the period, the total annual management fee rate was .38% of the fund's average net assets.
FMR and its affiliates provide the money market fund with investment management related services for which the fund pays a monthly management fee that is based on an annual rate of .50% of the fund's average net assets. FMR pays all other expenses, except the compensation of the non-interested Trustees and certain exceptions such as interest expense. The management fee paid to FMR by the fund is reduced by an amount equal to the fees and expenses paid by the fund to the non-interested Trustees.
Transfer Agent and Accounting Fees. Citibank, N.A. (Citibank) is the custodian, transfer agent and shareholder servicing agent for the income fund. Citibank has entered into a sub-contract with Fidelity Service Company, Inc. (FSC), an affiliate of FMR, under which FSC performs the activities associated with the fund's transfer and shareholder servicing agent and accounting functions. The fund pays account fees and asset-based fees that vary according to account size and type of account. FSC pays for typesetting, printing and mailing of all shareholder reports, except proxy statements. The accounting fee is based on the level of average net assets for the month plus out-of-pocket expenses.
For the period, the transfer agent fees were equivalent to the following annual rates expressed as a percentage of average net assets:
Spartan Pennsylvania Municipal Income Fund | .07% | | |
Central Funds. The funds may invest in affiliated Central Funds managed by Fidelity Investments Money Management, Inc. (FIMM), an affiliate of FMR. The Central Funds are open-end investment companies available only to investment companies and other accounts managed by FMR and its affiliates. The Central Funds seek preservation of capital and current income and do not pay a management fee. Income distributions earned by the funds are recorded as income in the accompanying financial statements. Distributions from the Central Funds are noted in the table below:
| Income
Distributions |
Fidelity Pennsylvania Municipal Money Market Fund | $ 135,775 |
Annual Report
5. Expense Reductions.
Through arrangements with the income fund's custodian and transfer agent, credits realized as a result of uninvested cash balances were used to reduce fund expenses. These expense reductions are noted in the table below.
| Custody
expense
reduction | Transfer
Agent
expense
reduction |
| | |
Spartan Pennsylvania Municipal Income Fund | $ 5,284 | $ 38,744 |
In addition, through an arrangement with Fidelity Pennsylvania Municipal Money Market Fund's custodian and transfer agent, $27,043 of credits realized as a result of uninvested cash balances were used to reduce the fund's expenses.
Annual Report
Report of Independent Auditors
To the Trustees of Fidelity Municipal Trust and Fidelity Municipal Trust II and the Shareholders of Spartan Pennsylvania Municipal Income Fund and Fidelity Pennsylvania Municipal Money Market Fund:
In our opinion, the accompanying statements of assets and liabilities, including the schedules of investments, and the related statements of operations and of changes in net assets and the financial highlights present fairly, in all material respects, the financial position of Spartan Pennsylvania Municipal Income Fund (a fund of Fidelity Municipal Trust) and Fidelity Pennsylvania Municipal Money Market Fund (a fund of Fidelity Municipal Trust II) at December 31, 2003 and the results of their operations, the changes in their net assets and the financial highlights for the periods indicated, in conformity with accounting principles generally accepted in the United States of America. These financial statements and financial highlights (hereafter referred to as "financial statements") are the responsibility of the Fidelity Municipal Trust's and Fidelity Municipal Trust II's management; our responsibility is to express an opinion on these financial statements based on our audits. We conducted our audits of these financial statements in accordance with auditing standards generally accepted in the United States of America which require that we plan and perform the audit to obtain reasonable assurance about whether the financial statements are free of material misstatement. An audit includes examining, on a test basis, evidence supporting the amounts and disclosures in the financial statements, assessing the accounting principles used and significant estimates made by management, and evaluating the overall financial statement presentation. We believe that our audits, which included confirmation of securities at December 31, 2003 by correspondence with the custodian and brokers, provide a reasonable basis for our opinion.
/s/PricewaterhouseCoopers LLP
PricewaterhouseCoopers LLP
Boston, Massachusetts
February 11, 2004
Annual Report
Trustees and Officers
The Trustees, Members of the Advisory Board, and executive officers of the trusts and funds, as applicable, are listed below. The Board of Trustees governs each fund and is responsible for protecting the interests of shareholders. The Trustees are experienced executives who meet periodically throughout the year to oversee each fund's activities, review contractual arrangements with companies that provide services to each fund, and review each fund's performance. Except for William O. McCoy, each of the Trustees oversees 292 funds advised by FMR or an affiliate. Mr. McCoy oversees 294 funds advised by FMR or an affiliate.
The Trustees hold office without limit in time except that (a) any Trustee may resign; (b) any Trustee may be removed by written instrument, signed by at least two-thirds of the number of Trustees prior to such removal; (c) any Trustee who requests to be retired or who has become incapacitated by illness or injury may be retired by written instrument signed by a majority of the other Trustees; and (d) any Trustee may be removed at any special meeting of shareholders by a two-thirds vote of the outstanding voting securities of the trust. In any event, each non-interested Trustee shall retire not later than the last day of the calendar year in which his or her 72nd birthday occurs. The executive officers and Advisory Board Members hold office without limit in time, except that any officer and Advisory Board Member may resign or may be removed by a vote of a majority of the Trustees at any regular meeting or any special meeting of the Trustees. Except as indicated, each individual has held the office shown or other offices in the same company for the past five years.
The funds' Statement of Additional Information (SAI) includes more information about the Trustees. To request a free copy, call Fidelity at 1-800-544-8544.
Interested Trustees*:
Correspondence intended for each Trustee who is an "interested person" (as defined in the 1940 Act) may be sent to 82 Devonshire Street, Boston, Massachusetts 02109.
Name, Age; Principal Occupation |
Edward C. Johnson 3d (73)** |
| Year of Election or Appointment: 1984 or 1991 Trustee of Fidelity Municipal Trust (1984) and Fidelity Municipal Trust II (1991). Mr. Johnson is Chairman of the Board of Trustees. Mr. Johnson serves as Chief Executive Officer, Chairman, and a Director of FMR Corp.; a Director and Chairman of the Board and of the Executive Committee of FMR; Chairman and a Director of Fidelity Management & Research (Far East) Inc.; Chairman (1998) and a Director of Fidelity Investments Money Management, Inc.; and Chairman (2001) and a Director (2000) of FMR Co., Inc. |
Abigail P. Johnson (42)** |
| Year of Election or Appointment: 2001 Senior Vice President of Pennsylvania Municipal Money Market (2001) and Spartan Pennsylvania Municipal Income (2001). Ms. Johnson also serves as Senior Vice President of other Fidelity funds (2001). She is President and a Director of FMR (2001), Fidelity Investments Money Management, Inc. (2001), FMR Co., Inc. (2001), and a Director of FMR Corp. Previously, Ms. Johnson managed a number of Fidelity funds. |
Laura B. Cronin (49) |
| Year of Election or Appointment: 2003 Ms. Cronin is an Executive Vice President (2002) and Chief Financial Officer (2002) of FMR Corp. and is a member of the Fidelity Management Committee (2003). Previously, Ms. Cronin served as Vice President of Finance of FMR (1997-1999), and Chief Financial Officer of FMR (1999-2001), Fidelity Personal Investments (2001), and Fidelity Brokerage Company (2001-2002). |
Robert L. Reynolds (51) |
| Year of Election or Appointment: 2003 Mr. Reynolds is a Director (2003) and Chief Operating Officer (2002) of FMR Corp. and is the head of the Fidelity Management Committee (2003). He also serves on the Board at Fidelity Investments Canada, Ltd. (2000). Previously, Mr. Reynolds served as President of Fidelity Investments Institutional Retirement Group (1996-2000). |
* Trustees have been determined to be "Interested Trustees" by virtue of, among other things, their affiliation with the trusts or various entities under common control with FMR.
** Edward C. Johnson 3d, Trustee, is Abigail P. Johnson's father.
Annual Report
Non-Interested Trustees:
Correspondence intended for each non-interested Trustee (that is, the Trustees other than the Interested Trustees) may be sent to Fidelity Investments, P.O. Box 55235, Boston, Massachusetts 02205-5235.
Name, Age; Principal Occupation |
J. Michael Cook (61) |
| Year of Election or Appointment: 2001 Prior to Mr. Cook's retirement in May 1999, he served as Chairman and Chief Executive Officer of Deloitte & Touche LLP (accounting/consulting), Chairman of the Deloitte & Touche Foundation, and a member of the Board of Deloitte Touche Tohmatsu. He currently serves as a Director of Comcast (telecommunications, 2002), International Flavors & Fragrances, Inc. (2000), Rockwell Automation (2000) and The Dow Chemical Company (2000). He is a Member of the Diversity Advisory Council of Marakon (2003) and the Advisory Board of the Directorship Search Group, Chairman Emeritus of the Board of Catalyst (a leading organization for the advancement of women in business), and is Chairman of the Accountability Advisory Council to the Comptroller General of the United States. He also serves as a Member of the Advisory Board of the Graduate School of Business of the University of Florida, his alma mater. |
Ralph F. Cox (71) |
| Year of Election or Appointment: 1991 Mr. Cox is President of RABAR Enterprises (management consulting for the petroleum industry). Prior to February 1994, he was President of Greenhill Petroleum Corporation (petroleum exploration and production). Until March 1990, Mr. Cox was President and Chief Operating Officer of Union Pacific Resources Company (exploration and production). He is a Director of CH2M Hill Companies (engineering), and Abraxas Petroleum (petroleum exploration and production, 1999). In addition, he is a member of advisory boards of Texas A&M University and the University of Texas at Austin. |
Robert M. Gates (60) |
| Year of Election or Appointment: 1997 Dr. Gates is President of Texas A&M University (2002). He was Director of the Central Intelligence Agency (CIA) from 1991 to 1993. From 1989 to 1991, Dr. Gates served as Assistant to the President of the United States and Deputy National Security Advisor. Dr. Gates is a Director of NACCO Industries, Inc. (mining and manufacturing), and Parker Drilling Co., Inc. (drilling and rental tools for the energy industry, 2001). He also serves as a member of the Advisory Board of VoteHere.net (secure internet voting, 2001). Previously, Dr. Gates served as a Director of LucasVarity PLC (automotive components and diesel engines), a Director of TRW Inc. (automotive, space, defense, and information technology), and Dean of the George Bush School of Government and Public Service at Texas A&M University (1999-2001). Dr. Gates also is a Trustee of the Forum for International Policy. |
George H. Heilmeier (67) |
| Year of Election or Appointment: 2004 Dr. Heilmeier is Chairman Emeritus of Telcordia Technologies (communication software and systems), where prior to his retirement, he served as company Chairman and Chief Executive Officer. He currently serves on the Boards of Directors of The Mitre Corporation (systems engineering and information technology support for the government), INET Technologies Inc. (telecommunications network surveillance, 2001) and Teletech Holdings (customer management services, 1998). He is Chairman of the General Motors Technology Advisory Committee and a Life Fellow of the IEEE (2000). Dr. Heilmeier is a member of the Defense Science Board and the National Security Agency Advisory Board. He is also a member of the National Academy of Engineering, the American Academy of Arts and Sciences and The Board of Overseers of the School of Engineering and Applied Science of the University of Pennsylvania. Previously, Dr. Heilmeier served as a Director of TRW Inc. (automotive, space, defense, and information technology, 1992-2002) and Compaq (1994-2002). |
Donald J. Kirk (71) |
| Year of Election or Appointment: 1987 or 1991 Trustee of Fidelity Municipal Trust (1987) and Fidelity Municipal Trust II (1991). Mr. Kirk is a Governor of the American Stock Exchange (2001), a Trustee and former Chairman of the Board of Trustees of the Greenwich Hospital Association, a Director of the Yale-New Haven Health Services Corp. (1998), and a Director Emeritus and former Chairman of the Board of Directors of National Arts Strategies Inc. Mr. Kirk was an Executive-in-Residence (1995-2000) and a Professor (1987-1995) at Columbia University Graduate School of Business. Prior to 1987, he was Chairman of the Financial Accounting Standards Board. Previously, Mr. Kirk served as a Governor of the National Association of Securities Dealers, Inc. (1996-2002), a member and Vice Chairman of the Public Oversight Board of the American Institute of Certified Public Accountants' SEC Practice Section (1995-2002), a Director of General Re Corporation (reinsurance, 1987-1998) and as a Director of Valuation Research Corp. (appraisals and valuations). |
Marie L. Knowles (57) |
| Year of Election or Appointment: 2001 Prior to Ms. Knowles' retirement in June 2000, she served as Executive Vice President and Chief Financial Officer of Atlantic Richfield Company (ARCO) (diversified energy, 1996-2000). From 1993 to 1996, she was a Senior Vice President of ARCO and President of ARCO Transportation Company. She served as a Director of ARCO from 1996 to 1998. She currently serves as a Director of Phelps Dodge Corporation (copper mining and manufacturing), URS Corporation (multidisciplinary engineering, 1999), and McKesson Corporation (healthcare service, 2002). Ms. Knowles is a Trustee of the Brookings Institution and the Catalina Island Conservancy and also serves as a member of the Advisory Board for the School of Engineering of the University of Southern California. |
Ned C. Lautenbach (59) |
| Year of Election or Appointment: 2000 Mr. Lautenbach has been a partner of Clayton, Dubilier & Rice, Inc. (private equity investment firm) since September 1998. Previously, Mr. Lautenbach was with the International Business Machines Corporation (IBM) from 1968 until his retirement in 1998. He was most recently Senior Vice President and Group Executive of Worldwide Sales and Services. From 1993 to 1995, he was Chairman of IBM World Trade Corporation, and from 1994 to 1998 was a member of IBM's Corporate Executive Committee. Mr. Lautenbach serves as Chairman and as a Director (1998) of Acterna Corporation (communications test equipment). He is also Co-Chairman of Covansys, Inc. (global provider of business and technology solutions, 2000). In addition, he is a Director of Eaton Corporation (diversified industrial) and the Philharmonic Center for the Arts in Naples, Florida (1999). He also is a member of the Council on Foreign Relations. |
Marvin L. Mann (70) |
| Year of Election or Appointment: 1993 Mr. Mann is Chairman of the non-interested Trustees (2001). He is Chairman Emeritus of Lexmark International, Inc. (computer peripherals) where he served as CEO until April 1998 and retired as Chairman May 1999, and remains a member of the Board. Prior to 1991, he held the positions of Vice President of International Business Machines Corporation (IBM) and President and General Manager of various IBM divisions and subsidiaries. Mr. Mann is a Board member of Imation Corp. (imaging and information storage) and Acterna Corporation (communications test equipment, 1999). He is also a member of the Director Services Committee of the Investment Company Institute. In addition, Mr. Mann is a member of the President's Cabinet at the University of Alabama and the Board of Visitors of the Culverhouse College of Commerce and Business Administration at the University of Alabama. |
William O. McCoy (70) |
| Year of Election or Appointment: 1997 Prior to his retirement in December 1994, Mr. McCoy was Vice Chairman of the Board of BellSouth Corporation (telecommunications) and President of BellSouth Enterprises. He is currently a Director of Liberty Corporation (holding company), Duke Realty Corporation (real estate), Progress Energy, Inc. (electric utility), and Acterna Corporation (communications test equipment, 1999). He is also a partner of Franklin Street Partners (private investment management firm) and a member of the Research Triangle Foundation Board. In addition, Mr. McCoy served as the Interim Chancellor (1999-2000) and a member of the Board of Visitors (1994-1998) for the University of North Carolina at Chapel Hill and currently serves on the Board of Directors of the University of North Carolina Health Care System and the Board of Visitors of the Kenan-Flagler Business School (University of North Carolina at Chapel Hill). He also served as Vice President of Finance for the University of North Carolina (16-school system, 1995-1998). |
William S. Stavropoulos (64) |
| Year of Election or Appointment: 2001 or 2002 Trustee of Fidelity Municipal Trust (2002) and Fidelity Municipal Trust II (2001). Mr. Stavropoulos is Chairman of the Board, President and CEO (2002), and Chairman of the Executive Committee (2000) and a Director of The Dow Chemical Company. Since joining The Dow Chemical Company in 1967, Mr. Stavropoulos served in numerous senior management positions, including President (1993-2000) and Chief Executive Officer (1995-2000). Currently, he is a Director of NCR Corporation (data warehousing and technology solutions), BellSouth Corporation (telecommunications), Chemical Financial Corporation, and Maersk Inc. (industrial conglomerate, 2002). He also serves as a member of the Board of Trustees of the American Enterprise Institute for Public Policy Research. In addition, Mr. Stavropoulos is a member of The Business Council, J.P. Morgan International Council, World Business Council for Sustainable Development, and the University of Notre Dame Advisory Council for the College of Science. |
Annual Report
Trustees and Officers - continued
Advisory Board Members and Executive Officers:
Correspondence intended for Ms. Small may be sent to Fidelity Investments, P.O. Box 55235, Boston, Massachusetts 02205-5235. Correspondence intended for each executive officer and Mr. Lynch may be sent to 82 Devonshire Street, Boston, Massachusetts 02109.
Name, Age; Principal Occupation |
Peter S. Lynch (60) |
| Year of Election or Appointment: 2003 Member of the Advisory Board of Fidelity Municipal Trust and Fidelity Municipal Trust II. Vice Chairman and a Director of FMR, and Vice Chairman (2001) and a Director (2000) of FMR Co., Inc. Previously, Mr. Lynch served as a Trustee of the Fidelity funds (1990-2003). Prior to May 31, 1990, he was a Director of FMR and Executive Vice President of FMR (a position he held until March 31, 1991), Vice President of Fidelity® Magellan® Fund and FMR Growth Group Leader, and Managing Director of FMR Corp. Mr. Lynch was also Vice President of Fidelity Investments Corporate Services. In addition, he serves as a Trustee of Boston College, Massachusetts Eye & Ear Infirmary, Historic Deerfield, John F. Kennedy Library, and the Museum of Fine Arts of Boston. |
Cornelia M. Small (59) |
| Year of Election or Appointment: 2004 Member of the Advisory Board of Fidelity Municipal Trust and Fidelity Municipal Trust II. Ms. Small is a member (2000) and Chairperson (2002) of the Investment Committee, and a member (2002) of the Board of Trustees of Smith College. Previously, she served as Chief Investment Officer (1999-2000), Director of Global Equity Investments (1996- 1999), and a member of the Board of Directors (1998-1999) of Scudder Kemper Investments. In addition, Ms. Small served as Co-Chair (2000-2003) of the Annual Fund for the Fletcher School of Law and Diplomacy. |
Dwight D. Churchill (50) |
| Year of Election or Appointment: 1997 or 2000 Vice President of Pennsylvania Municipal Money Market (2000) and Spartan Pennsylvania Municipal Income (1997). He serves as Head of Fidelity's Fixed-Income Division (2000), Vice President of Fidelity's Money Market Funds (2000), Vice President of Fidelity's Bond Funds (1997), and Senior Vice President of FIMM (2000) and FMR (1997). Mr. Churchill joined Fidelity in 1993 as Vice President and Group Leader of Taxable Fixed-Income Investments. |
Charles S. Morrison (43) |
| Year of Election or Appointment: 2002 Vice President of Spartan Pennsylvania Municipal Income. Mr. Morrison also serves as Vice President of Fidelity's Bond Funds (2002), and Vice President of certain Asset Allocation and Balanced Funds (2002). He serves as Vice President (2002) and Bond Group Leader (2002) of Fidelity Investments Fixed Income Division. Mr. Morrison is also Vice President of FIMM (2002) and FMR (2002). Mr. Morrison joined Fidelity in 1987 as a Corporate Bond Analyst in the Fixed Income Research Division. |
David L. Murphy (55) |
| Year of Election or Appointment: 2002 Vice President of Pennsylvania Municipal Money Market. Mr. Murphy also serves as Vice President of Fidelity's Money Market Funds (2002) and Vice President of certain Asset Allocation Funds (2003). He serves as Senior Vice President (2000) and Money Market Group Leader (2002) of the Fidelity Investments Fixed Income Division. Mr. Murphy is also a Senior Vice President of FIMM (2003) and a Vice President of FMR (2000). Previously, Mr. Murphy served as Bond Group Leader (2000-2002) and Vice President of Fidelity's Taxable Bond Funds (2000-2002) and Fidelity's Municipal Bond Funds (2001-2002). Mr. Murphy joined Fidelity in 1989 as a portfolio manager in the Bond Group. |
Eric D. Roiter (55) |
| Year of Election or Appointment: 1998 Secretary of Pennsylvania Municipal Money Market and Spartan Pennsylvania Municipal Income. He also serves as Secretary of other Fidelity funds (1998); Vice President, General Counsel, and Clerk of FMR Co., Inc. (2001) and FMR (1998); Vice President and Clerk of FDC (1998); Assistant Clerk of Fidelity Management & Research (U.K.) Inc. (2001) and Fidelity Management & Research (Far East) Inc. (2001); and Assistant Secretary of Fidelity Investments Money Management Inc. (2001). Prior to joining Fidelity, Mr. Roiter was with the law firm of Debevoise & Plimpton, as an associate (1981-1984) and as a partner (1985-1997), and served as an Assistant General Counsel of the U.S. Securities and Exchange Commission (1979-1981). Mr. Roiter is an Adjunct Member, Faculty of Law, at Boston College Law School (2003). |
Stuart Fross (44) |
| Year of Election or Appointment: 2003 Assistant Secretary of Pennsylvania Municipal Money Market and Spartan Pennsylvania Municipal Income. Mr. Fross also serves as Assistant Secretary of other Fidelity funds (2003) and is an employee of FMR. |
Maria F. Dwyer (45) |
| Year of Election or Appointment: 2002 President and Treasurer of Pennsylvania Municipal Money Market and Spartan Pennsylvania Municipal Income. Ms. Dwyer also serves as President and Treasurer of other Fidelity funds (2002) and is a Vice President (1999) and an employee (1996) of FMR. |
Timothy F. Hayes (53) |
| Year of Election or Appointment: 2002 Chief Financial Officer of Pennsylvania Municipal Money Market and Spartan Pennsylvania Municipal Income. Mr. Hayes also serves as Chief Financial Officer of other Fidelity funds (2002). Recently he was appointed President of Fidelity Service Company (2003) where he also serves as a Director. Mr. Hayes also serves as President of Fidelity Investments Operations Group (FIOG, 2002), which includes Fidelity Pricing and Cash Management Services Group (FPCMS), where he was appointed President in 1998. Previously, Mr. Hayes served as Chief Financial Officer of Fidelity Investments Corporate Systems and Service Group (1998) and Fidelity Systems Company (1997-1998). |
Jennifer S. Taub (37) |
| Year of Election or Appointment: 2003 Assistant Vice President of Pennsylvania Municipal Money Market and Spartan Pennsylvania Municipal Income. Ms. Taub is Assistant Vice President of Fidelity's Fixed-Income Funds (2003), Assistant Secretary of FIMM (2003), and is an employee of FMR. |
John R. Hebble (45) |
| Year of Election or Appointment: 2003 Deputy Treasurer of Pennsylvania Municipal Money Market and Spartan Pennsylvania Municipal Income. Mr. Hebble also serves as Deputy Treasurer of other Fidelity funds (2003), and is an employee of FMR. Before joining Fidelity Investments, Mr. Hebble worked at Deutsche Asset Management where he served as Director of Fund Accounting (2002-2003) and Assistant Treasurer of the Scudder Funds (1998-2003). |
John H. Costello (57) |
| Year of Election or Appointment: 1986 Assistant Treasurer of Pennsylvania Municipal Money Market and Spartan Pennsylvania Municipal Income. Mr. Costello also serves as Assistant Treasurer of other Fidelity funds and is an employee of FMR. |
Francis V. Knox, Jr. (56) |
| Year of Election or Appointment: 2002 Assistant Treasurer of Pennsylvania Municipal Money Market and Spartan Pennsylvania Municipal Income. Mr. Knox also serves as Assistant Treasurer of other Fidelity funds (2002), and is a Vice President and an employee of FMR. Previously, Mr. Knox served as Vice President of Investment & Advisor Compliance (1990-2001), and Compliance Officer of Fidelity Management & Research (U.K.) Inc. (1992-2002), Fidelity Management & Research (Far East) Inc. (1991-2002), and FMR Corp. (1995-2002). |
Mark Osterheld (48) |
| Year of Election or Appointment: 2002 Assistant Treasurer of Pennsylvania Municipal Money Market and Spartan Pennsylvania Municipal Income. Mr. Osterheld also serves as Assistant Treasurer of other Fidelity funds (2002) and is an employee of FMR. |
Thomas J. Simpson (45) |
| Year of Election or Appointment: 1996 Assistant Treasurer of Pennsylvania Municipal Money Market and Spartan Pennsylvania Municipal Income. Mr. Simpson is Assistant Treasurer of other Fidelity funds (2000) and an employee of FMR (1996). Prior to joining FMR, Mr. Simpson was Vice President and Fund Controller of Liberty Investment Services (1987-1995). |
Annual Report
Distributions
The Board of Trustees of Spartan Pennsylvania Municipal Income Fund voted to pay on February 9, 2004, to shareholders of record at the opening of business on February 6, 2004, a distribution of $.01 per share derived from capital gains realized from sales of portfolio securities.
The fund will notify shareholders in January 2004 of amounts for use in preparing 2003 income tax returns.
Annual Report
Managing Your Investments
Fidelity offers several ways to conveniently manage your personal investments via your telephone or PC. You can access your account information, conduct trades and research your investments 24 hours a day.
By Phone
Fidelity Automated Service Telephone provides a single toll-free number to access account balances, positions, quotes and trading. It's easy to navigate the service, and on your first call, the system will help you create a personal identification number (PIN) for security.
(phone_graphic)Fidelity Automated
Service Telephone (FAST®)
1-800-544-5555
Press
1 For mutual fund and brokerage trading.
2 For quotes.*
3 For account balances and holdings.
4 To review orders and mutual
fund activity.
5 To change your PIN.
*0 To speak to a Fidelity representative.
By PC
Fidelity's web site on the Internet provides a wide range of information, including daily financial news, fund performance, interactive planning tools and news about Fidelity products and services.
(computer_graphic)Fidelity's Web Site
www.fidelity.com
* When you call the quotes line, please remember that a fund's yield and return will vary and, except for money market funds, share price will also vary. This means that you may have a gain or loss when you sell your shares. There is no assurance that money market funds will be able to maintain a stable $1 share price; an investment in a money market fund is not insured or guaranteed by the U.S. government. Total returns are historical and include changes in share price, reinvestment of dividends and capital gains, and the effects of any sales charges.
Annual Report
To Write Fidelity
We'll give your correspondence immediate attention and send you written confirmation upon completion of your request.
(letter_graphic)Making Changes
To Your Account
(such as changing name, address, bank, etc.)
Fidelity Investments
P.O. Box 770001
Cincinnati, OH 45277-0002
(letter_graphic)For Non-Retirement
Accounts
Buying shares
Fidelity Investments
P.O. Box 770001
Cincinnati, OH 45277-0003
Overnight Express
Fidelity Investments
Attn: Distribution Services
100 Crosby Parkway - KC1H
Covington, KY 41015
Selling shares
Fidelity Investments
P.O. Box 770001
Cincinnati, OH 45277-0035
Overnight Express
Fidelity Investments
Attn: Distribution Services
100 Crosby Parkway - KC1H
Covington, KY 41015
General Correspondence
Fidelity Investments
P.O. Box 500
Merrimack, NH 03054-0500
(letter_graphic)For Retirement
Accounts
Buying shares
Fidelity Investments
P.O. Box 770001
Cincinnati, OH 45277-0003
Selling shares
Fidelity Investments
P.O. Box 770001
Cincinnati, OH 45277-0035
Overnight Express
Fidelity Investments
Attn: Distribution Services
100 Crosby Parkway - KC1H
Covington, KY 41015
General Correspondence
Fidelity Investments
P.O. Box 500
Merrimack, NH 03054-0500
Annual Report
To Visit Fidelity
For directions and hours,
please call 1-800-544-9797.
Arizona
7001 West Ray Road
Chandler, AZ
7373 N. Scottsdale Road
Scottsdale, AZ
California
815 East Birch Street
Brea, CA
1411 Chapin Avenue
Burlingame, CA
851 East Hamilton Avenue
Campbell, CA
527 North Brand Boulevard
Glendale, CA
19200 Von Karman Avenue
Irvine, CA
601 Larkspur Landing Circle
Larkspur, CA
10100 Santa Monica Blvd.
Los Angeles, CA
27101 Puerta Real
Mission Viejo, CA
73-575 El Paseo
Palm Desert, CA
251 University Avenue
Palo Alto, CA
1760 Challenge Way
Sacramento, CA
7676 Hazard Center Drive
San Diego, CA
8 Montgomery Street
San Francisco, CA
21701 Hawthorne Boulevard
Torrance, CA
2001 North Main Street
Walnut Creek, CA
6300 Canoga Avenue
Woodland Hills, CA
Colorado
1625 Broadway
Denver, CO
9185 East Westview Road
Littleton, CO
Connecticut
48 West Putnam Avenue
Greenwich, CT
265 Church Street
New Haven, CT
300 Atlantic Street
Stamford, CT
29 South Main Street
West Hartford, CT
Delaware
222 Delaware Avenue
Wilmington, DE
Florida
4400 N. Federal Highway
Boca Raton, FL
121 Alhambra Plaza
Coral Gables, FL
2948 N. Federal Highway
Ft. Lauderdale, FL
1907 West State Road 434
Longwood, FL
8880 Tamiami Trail, North
Naples, FL
3501 PGA Boulevard
West Palm Beach, FL
8065 Beneva Road
Sarasota, FL
1502 N. Westshore Blvd.
Tampa, FL
Georgia
3445 Peachtree Road, N.E.
Atlanta, GA
Annual Report
1000 Abernathy Road
Atlanta, GA
Illinois
One North LaSalle Street
Chicago, IL
1415 West 22nd Street
Oak Brook, IL
1700 East Golf Road
Schaumburg, IL
3232 Lake Avenue
Wilmette, IL
Indiana
4729 East 82nd Street
Indianapolis, IN
Kansas
5400 College Boulevard
Overland Park, KS
Maine
Three Canal Plaza
Portland, ME
Maryland
7401 Wisconsin Avenue
Bethesda, MD
One W. Pennsylvania Ave.
Towson, MD
Massachusetts
801 Boylston Street
Boston, MA
155 Congress Street
Boston, MA
300 Granite Street
Braintree, MA
44 Mall Road
Burlington, MA
405 Cochituate Road
Framingham, MA
416 Belmont Street
Worcester, MA
Fidelity Brokerage Services, Inc., 100 Summer St., Boston, MA 02110 Member NYSE/SIPC
Annual Report
Michigan
280 Old N. Woodward Ave.
Birmingham, MI
43420 Grand River Avenue
Novi, MI
29155 Northwestern Hwy.
Southfield, MI
Minnesota
7600 France Avenue South
Edina, MN
Missouri
8885 Ladue Road
Ladue, MO
New Jersey
150 Essex Street
Millburn, NJ
56 South Street
Morristown, NJ
501 Route 17, South
Paramus, NJ
3518 Route 1 North
Princeton, NJ
New York
1055 Franklin Avenue
Garden City, NY
37 West Jericho Turnpike
Huntington Station, NY
1271 Avenue of the Americas
New York, NY
61 Broadway
New York, NY
350 Park Avenue
New York, NY
North Carolina
4611 Sharon Road
Charlotte, NC
Ohio
3805 Edwards Road
Cincinnati, OH
28699 Chagrin Boulevard
Woodmere Village, OH
1324 Polaris Parkway
Columbus, OH
Oregon
16850 SW 72nd Avenue
Tigard, OR
Pennsylvania
600 West DeKalb Pike
King of Prussia, PA
1735 Market Street
Philadelphia, PA
12001 Perry Highway
Wexford, PA
Rhode Island
47 Providence Place
Providence, RI
Tennessee
6150 Poplar Avenue
Memphis, TN
Texas
10000 Research Boulevard
Austin, TX
4017 Northwest Parkway
Dallas, TX
12532 Memorial Drive
Houston, TX
2701 Drexel Drive
Houston, TX
400 East Las Colinas Blvd.
Irving, TX
14100 San Pedro
San Antonio, TX
19740 IH 45 North
Spring, TX
6005 West Park Boulevard
Plano, TX
Annual Report
Utah
215 South State Street
Salt Lake City, UT
Virginia
1861 International Drive
McLean, VA
Washington
411 108th Avenue, N.E.
Bellevue, WA
1518 6th Avenue
Seattle, WA
Washington, DC
1900 K Street, N.W.
Washington, DC
Wisconsin
595 North Barker Road
Brookfield, WI
Fidelity Brokerage Services, Inc., 100 Summer St., Boston, MA 02110 Member NYSE/SIPC
Annual Report
Investment Adviser
Fidelity Management & Research Company
Boston, MA
Sub-Adviser
Fidelity Investments Money
Management, Inc.
Fidelity International Investment
Advisors
Fidelity International Investment
Advisors (U.K.) Limited
General Distributor
Fidelity Distributors Corporation
Boston, MA
Transfer and Shareholder
Servicing Agents
Citibank, N.A.
New York, NY
Fidelity Service Company, Inc.
Boston, MA
Custodian
Citibank, N.A.
New York, NY
The Fidelity Telephone Connection
Mutual Fund 24-Hour Service
Exchanges/Redemptions
and Account Assistance 1-800-544-6666
Product Information 1-800-544-6666
Retirement Accounts 1-800-544-4774 (8 a.m. - 9 p.m.)
TDD Service 1-800-544-0118
for the deaf and hearing impaired
(9 a.m. - 9 p.m. Eastern time)
Fidelity Automated Service
Telephone (FAST®) (automated graphic) 1-800-544-5555
(automated graphic) Automated line for quickest service
(Fidelity Investment logo)(registered trademark)
Corporate Headquarters
82 Devonshire St., Boston, MA 02109
www.fidelity.com
PFR-UANN-0204
1.787740.100
Fidelity Advisor
Short-Intermediate
Municipal Income
Fund - Class A, Class T, Class B
and Class C
Annual Report
December 31, 2003
(2_fidelity_logos) (Registered_Trademark)
Class A, Class T, Class B, and Class C are classes of Spartan Short Intermediate Municipal Income Fund
Contents
Chairman's Message | <Click Here> | Ned Johnson's message to shareholders. |
Performance | <Click Here> | How the fund has done over time. |
Investment Changes | <Click Here> | A summary of major shifts in the fund's investments over the past six months. |
Investments | <Click Here> | A complete list of the fund's investments with their market values. |
Financial Statements | <Click Here> | Statements of assets and liabilities, operations, and changes in net assets,
as well as financial highlights. |
Notes | <Click Here> | Notes to the financial statements. |
Auditors' Opinion | <Click Here> | |
Trustees and Officers | <Click Here> | |
Distributions | <Click Here> | |
| | |
Standard & Poor's, S&P and S&P 500 are registered service marks of The McGraw-Hill Companies, Inc. and have been licensed for use by Fidelity Distributors Corporation.
Other third party marks appearing herein are the property of their respective owners.
All other marks appearing herein are registered or unregistered trademarks or service marks of FMR Corp. or an affiliated company.
(Recycle graphic) This report is printed on recycled paper using soy-based inks.
This report and the financial statements contained herein are submitted for the general information of the shareholders of the fund. This report is not authorized for distribution to prospective investors in the fund unless preceded or accompanied by an effective prospectus.
Mutual fund shares are not deposits or obligations of, or guaranteed by, any depository institution. Shares are not insured by the FDIC, Federal Reserve Board or any other agency, and are subject to investment risks, including possible loss of principal amount invested.
Neither the fund nor Fidelity Distributors Corporation is a bank.
For more information on any Fidelity Advisor fund, including charges and expenses, contact your investment professional for a free prospectus. Read it carefully before you invest or send money.
Annual Report
Chairman's Message
(photo_of_Edward_C_Johnson_3d)
Dear Shareholder:
Many of you have read or heard news stories recently that were critical of mutual funds and made allegations that the mutual fund industry has been less than forthright. I find these reports unsettling and not necessarily an accurate picture of the overall industry, and I would like you to know where we at Fidelity stand.
With specific regard to allegations that certain mutual fund companies were violating the Securities and Exchange Commission's forward pricing rules or were involved in so-called "market timing" activities, I want to say two things:
First, Fidelity does not have agreements that permit customers who buy fund shares after 4 p.m. to obtain the 4 p.m. price. This is not to say that someone could not deceive the company through fraudulent acts. But I underscore that we have no so-called "agreements" which would permit this illegal practice.
Second, Fidelity has been on record for years opposing predatory short-term trading which adversely affects other shareholders in a mutual fund. In fact, in the 1980s, we began charging a fee - which is returned to the fund and, therefore, to investors - to discourage this activity. What's more, several years ago we took the industry lead in developing a Fair Value Pricing Policy to prevent market timing on foreign securities in our funds. It is reasonable to assume that another structure can be developed that would alter the system to make it much more difficult for predatory traders to operate. This, however, will only be achieved through close cooperation among regulators, legislators and the industry.
Certainly no industry is perfect, and there have been instances of unethical and illegal activity from time to time within the mutual fund industry. When this occurs, confessed or convicted offenders should be dealt with appropriately. Clearly, every system can be improved. We applaud well thought out improvements by regulators, legislators and industry representatives that achieve the common goal of building and protecting the value of investors' holdings. But we remain concerned about the risk of over-regulation and the quick application of simplistic solutions to intricate problems.
For more than 57 years, Fidelity Investments has worked very hard to improve its products and service to justify your trust. When our family founded this company in 1946, we had only a few hundred customers. Many of them were family and friends. Today, we serve more than 18 million customers including individual investors and participants in retirement plans across America.
Let me close by saying that we do not take your trust in us for granted, and we realize that we must always work to improve all aspects of our service to you. In turn, we urge you to continue your active participation with your financial matters, so that your interests can be well served.
Best regards,
/s/Edward C. Johnson 3d
Edward C. Johnson 3d
Annual Report
Performance: The Bottom Line
Average annual total return reflects the change in the value of an investment, assuming reinvestment of the fund's dividend income and capital gains (the profits earned upon the sale of securities that have grown in value) and assuming a constant rate of performance each year. During periods of reimbursement by Fidelity, a fund's total return will be greater than it would be had the reimbursement not occurred. The $10,000 table and the fund's returns do not reflect the deduction of taxes that a shareholder would pay on fund distributions or the redemption of fund shares. How a fund did yesterday is no guarantee of how it will do tomorrow. Returns may reflect the conversion of Class B shares to Class A shares after a maximum of four years.
Average Annual Total Returns
Periods ended December 31, 2003 | Past 1
year | Past 5
years | Past 10
years |
Class A (incl. 3.75% sales charge) A | -0.75% | 3.81% | 4.12% |
Class T (incl. 2.75% sales charge) B | 0.04% | 3.97% | 4.21% |
Class B (incl. contingent deferred sales charge) C | -0.32% | 4.51% | 4.48% |
Class C (incl. contingent deferred sales charge) D | 1.53% | 4.48% | 4.46% |
A Class A shares bear a 0.15% 12b-1 fee. The initial offering of Class A shares took place on July 23, 2003. Returns prior to July 23, 2003 are those of Spartan Short-Intermediate Municipal Income Fund, the original retail class of the fund, which has no 12b-1 fee. Had Class A shares' 12b-1 fee been reflected, returns prior to July 23, 2003 would have been lower.
B Class T shares bear a 0.25% 12b-1 fee. The initial offering of Class T shares took place on July 23, 2003. Returns prior to July 23, 2003 are those of Spartan Short-Intermediate Municipal Income Fund, the original retail class of the fund, which has no 12b-1 fee. Had Class T shares' 12b-1 fee been reflected, returns prior to July 23, 2003 would have been lower.
C Class B shares bear a 0.90% 12b-1 fee. The initial offering of Class B shares took place on July 23, 2003. Returns prior to July 23, 2003 are those of Spartan Short-Intermediate Municipal Income Fund, the original retail class of the fund, which has no 12b-1 fee. Had Class B shares' 12b-1 fee been reflected, returns prior to July 23, 2003 would have been lower. Class B shares' contingent deferred sales charges included in the past one year, past five year and past 10 year total return figures are 3%, 0% and 0%, respectively.
D Class C shares bear a 1.00% 12b-1 fee. The initial offering of Class C shares took place on July 23, 2003. Returns prior to July 23, 2003 are those of Spartan Short-Intermediate Municipal Income Fund, the original retail class of the fund, which has no 12b-1 fee. Had Class C shares' 12b-1 fee been reflected, returns prior to July 23, 2003 would have been lower. Class C shares' contingent deferred sales charge included in the past one year, past five year and past 10 year total return figures are 1%, 0% and 0%, respectively.
Annual Report
$10,000 Over 10 Years
Let's say hypothetically that $10,000 was invested in Fidelity Advisor Short-Intermediate Municipal Income - Class T on December 31, 1993, and the current 2.75% sales charge was paid. The chart shows how the value of your investment would have grown, and also shows how the Lehman Brothers® Municipal Bond Index did over the same period.
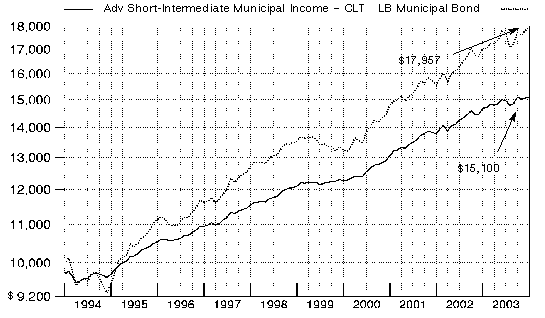
Annual Report
See accompanying notes which are an integral part of the financial statements.
Management's Discussion of Fund Performance
Comments from Mark Sommer, Portfolio Manager of Fidelity Advisor Short-Intermediate Municipal Income Fund
While most of the year favored riskier assets, tax-exempt municipal bonds put up solid numbers for the 12 months ending December 31, 2003. In that time, the Lehman Brothers® Municipal Bond Index - a performance measure of about 40,000 investment-grade, fixed-rate, tax-exempt bonds - advanced 5.31%. For munis, it was the fourth straight year of returns in excess of 5%. Munis had an excellent year relative to taxable investment-grade bonds. The Lehman Brothers Aggregate Bond Index, a proxy for the taxable, investment-grade bond market, gained 4.10% in 2003, a full percentage point less than the muni index - a gap made even wider considering muni bonds' tax-equivalent yield advantage. What's more, on a three- and five-year basis, the Lehman Brothers muni index's cumulative return is well above that of most stock market benchmarks. Munis fared well for much of the year against a backdrop of low interest rates and virtually non-existent inflation. Although they stumbled in mid-summer against a brighter economic forecast, munis rebounded later on the heels of strong investor demand and the Federal Reserve Board's accommodative monetary policy.
Fidelity Advisor Short-Intermediate Municipal Income Fund Class A, Class T, Class B and Class C shares returned 3.12%, 2.87%, 2.67% and 2.53%, respectively, during the 12-month period. Those returns compared with the LipperSM Short-Intermediate Municipal Debt Funds Average, which returned 3.42%, and the Lehman Brothers 1-6 Year Municipal Bond Index returned 3.01%. The fund's underperformance of its peer average stemmed from its shorter duration, meaning it was less interest rate sensitive and, accordingly, benefited less from the bond market rally during the first half of 2003. Additionally, longer duration funds enjoyed a yield advantage. However, the fund's shorter duration helped it during the summer and fall when interest rates rose in response to improving economic conditions. Aiding performance was good sector and security selection. The fund's emphasis on essential services bonds - which are issued by providers of electricity, water and sewer services - was one example of advantageous security selection. The issuers' stable revenues helped these securities outperform tax-backed bonds during the period. The fund's stake in hospital bonds also worked in its favor, as many hospitals enjoyed better financial trends and, as a result, improving bond prices. Avoiding the lagging tobacco sector also boosted the fund's returns.
The views expressed in this statement reflect those of the portfolio manager only through the end of the period of the report as stated on the cover and do not necessarily represent the views of Fidelity or any other person in the Fidelity organization. Any such views are subject to change at any time based upon market or other conditions and Fidelity disclaims any responsibility to update such views. These views may not be relied on as investment advice and, because investment decisions for a Fidelity fund are based on numerous factors, may not be relied on as an indication of trading intent on behalf of any Fidelity fund.
Annual Report
Investment Changes
Top Five States as of December 31, 2003 |
| % of fund's
net assets | % of fund's net assets
6 months ago |
Texas | 14.0 | 14.6 |
Illinois | 7.8 | 7.9 |
Washington | 7.7 | 9.0 |
Massachusetts | 6.6 | 7.6 |
New York | 6.6 | 5.8 |
Top Five Sectors as of December 31, 2003 |
| % of fund's
net assets | % of fund's net assets
6 months ago |
General Obligations | 45.3 | 43.9 |
Electric Utilities | 15.1 | 17.0 |
Transportation | 9.3 | 8.7 |
Escrowed/Pre-Refunded | 6.2 | 6.1 |
Water & Sewer | 6.0 | 8.4 |
Average Years to Maturity as of December 31, 2003 |
| | 6 months ago |
Years | 3.3 | 3.3 |
Average years to maturity is based on the average time remaining until principal payments are expected from each of the fund's bonds, weighted by dollar amount. |
Duration as of December 31, 2003 |
| | 6 months ago |
Years | 2.9 | 2.8 |
Duration shows how much a bond fund's price fluctuates with changes in comparable interest rates. If rates rise 1%, for example, a fund with a five-year duration is likely to lose about 5% of its value. Other factors also can influence a bond fund's performance and share price. Accordingly, a bond fund's actual performance may differ from this example. |
Quality Diversification (% of fund's net assets) |
As of December 31, 2003 | As of June 30, 2003 |
| AAA 58.4% | | | AAA 59.1% | |
| AA,A 31.1% | | | AA,A 34.5% | |
| BBB 7.0% | | | BBB 8.2% | |
| Not Rated 1.1% | | | Not Rated 0.7% | |
| Short-Term
Investments and
Net Other Assets 2.4% | |  | Short-Term
Investments and
Net Other Assets* (2.5)% | |

We have used ratings from Moody's® Investors Services, Inc. Where Moody's ratings are not available, we have used S&P® ratings. |
*Short-Term Investments and Net Other Assets are not included in the pie chart.
Annual Report
Investments December 31, 2003
Showing Percentage of Net Assets
Municipal Bonds - 96.9% |
| Principal
Amount (000s) | | Value (Note 1)
(000s) |
Alabama - 2.2% |
Alabama Agric. & Mechanical Univ. Revs. 6.5% 11/1/25 (Pre-Refunded to 11/1/05 @ 102) (f) | | $ 2,000 | | $ 2,223 |
Alabama Fed. Hwy. Fin. Auth. Series A, 5% 3/1/10 (MBIA Insured) | | 5,000 | | 5,611 |
Huntsville Solid Waste Disp. Auth. & Resource Recovery Rev.: | | | | |
5.25% 10/1/07 (MBIA Insured) (e) | | 1,000 | | 1,092 |
5.25% 10/1/08 (MBIA Insured) (e) | | 2,900 | | 3,174 |
Jefferson County Gen. Oblig. Series 2003 A: | | | | |
3% 4/1/05 (MBIA Insured) | | 4,000 | | 4,086 |
5% 4/1/06 (MBIA Insured) | | 3,000 | | 3,218 |
5% 4/1/07 (MBIA Insured) | | 3,000 | | 3,278 |
Jefferson County Swr. Rev. Series A, 5% 2/1/33 (Pre-Refunded to 2/1/09 @ 101) (f) | | 13,010 | | 14,598 |
Mobile County Gen. Oblig.: | | | | |
5% 2/1/07 (MBIA Insured) | | 1,000 | | 1,091 |
5% 2/1/08 (MBIA Insured) | | 1,475 | | 1,628 |
Opelika Gen. Oblig. Series A, 5% 4/1/05 (MBIA Insured) | | 1,225 | | 1,281 |
| | 41,280 |
Alaska - 2.0% |
Alaska Student Ln. Corp. Student Ln. Rev. Series A: | | | | |
5.1% 7/1/04 (AMBAC Insured) (e) | | 3,630 | | 3,700 |
5.15% 7/1/05 (AMBAC Insured) (e) | | 1,950 | | 2,052 |
5.85% 7/1/13 (AMBAC Insured) (e) | | 3,285 | | 3,599 |
Anchorage Gen. Oblig. Series B, 5.75% 12/1/11 (Pre-Refunded to 12/1/10 @ 100) (f) | | 2,500 | | 2,953 |
North Slope Borough Gen. Oblig.: | | | | |
Series 1996 B, 0% 6/30/07 (MBIA Insured) | | 3,100 | | 2,844 |
Series B: | | | | |
0% 6/30/05 (FSA Insured) | | 8,100 | | 7,918 |
0% 6/30/07 (MBIA Insured) | | 7,050 | | 6,468 |
0% 6/30/08 (MBIA Insured) | | 4,240 | | 3,730 |
0% 6/30/06 (MBIA Insured) | | 3,500 | | 3,325 |
Valdez Marine Term. Rev. (Atlantic Richfield Co. Proj.) Series 1994 B, 2%, tender 1/1/04 (b) | | 1,100 | | 1,100 |
| | 37,689 |
Arizona - 1.4% |
Arizona Pwr. Auth. Pwr. Resource Rev. (Hoover Uprating Proj.): | | | | |
5% 10/1/05 | | 2,160 | | 2,288 |
Municipal Bonds - continued |
| Principal
Amount (000s) | | Value (Note 1)
(000s) |
Arizona - continued |
Arizona Pwr. Auth. Pwr. Resource Rev. (Hoover Uprating Proj.): - continued | | | | |
5% 10/1/06 | | $ 2,525 | | $ 2,735 |
Maricopa County School District #28 Kyrene Elementary Series B, 0% 7/1/04 (FGIC Insured) | | 3,000 | | 2,983 |
Pima County Gen. Oblig. 4% 7/1/04 (FSA Insured) | | 815 | | 827 |
Salt River Proj. Agric. Impt. & Pwr. District Elec. Sys. Rev.: | | | | |
Series A, 5.25% 1/1/06 | | 5,700 | | 6,109 |
Series B: | | | | |
7% 1/1/05 | | 760 | | 803 |
7% 1/1/05 (Escrowed to Maturity) (f) | | 1,240 | | 1,311 |
Series D: | | | | |
5.7% 1/1/04 (f) | | 65 | | 65 |
5.7% 1/1/04 | | 935 | | 935 |
Scottsdale Muni. Property Corp. Excise Tax Rev. 5.5% 7/1/05 | | 2,285 | | 2,427 |
Tucson Gen. Oblig. Series 2002, 5% 7/1/05 | | 1,000 | | 1,054 |
Tucson Street & Hwy. User Rev. 4.5% 7/1/05 (AMBAC Insured) | | 3,090 | | 3,236 |
Tucson Wtr. Rev. Series 2002: | | | | |
5.5% 7/1/05 (FGIC Insured) | | 1,040 | | 1,104 |
5.5% 7/1/06 (FGIC Insured) | | 980 | | 1,069 |
| | 26,946 |
Arkansas - 0.2% |
Little Rock Gen. Oblig. 4% 4/1/07 (FSA Insured) (a) | | 1,000 | | 1,062 |
Rogers Sales & Use Tax Rev. Series A: | | | | |
4.25% 9/1/06 (FGIC Insured) | | 1,000 | | 1,063 |
4.25% 9/1/07 (FGIC Insured) | | 2,175 | | 2,342 |
| | 4,467 |
California - 5.4% |
California Dept. of Wtr. Resources Central Valley Proj. Wtr. Sys. Rev. Series Y, 5% 12/1/06 (FGIC Insured) | | 5,000 | | 5,486 |
California Dept. of Wtr. Resources Pwr. Supply Rev. Series A: | | | | |
5.25% 5/1/07 (MBIA Insured) | | 28,900 | | 31,901 |
5.25% 5/1/10 (MBIA Insured) | | 1,100 | | 1,245 |
California Gen. Oblig.: | | | | |
4.4% 8/1/07 | | 1,000 | | 1,057 |
5.125% 9/1/12 | | 1,000 | | 1,063 |
5.25% 11/1/08 | | 1,045 | | 1,146 |
Municipal Bonds - continued |
| Principal
Amount (000s) | | Value (Note 1)
(000s) |
California - continued |
California Gen. Oblig.: - continued | | | | |
5.25% 2/1/11 | | $ 6,425 | | $ 7,010 |
5.5% 6/1/05 | | 4,725 | | 4,965 |
5.75% 10/1/08 | | 1,085 | | 1,212 |
6.4% 9/1/08 | | 3,075 | | 3,500 |
6.5% 9/1/10 | | 1,740 | | 2,025 |
California Pub. Works Board Lease Rev. (California State Univ. Proj.) Series 1997 A, 5.5% 10/1/07 | | 1,075 | | 1,181 |
California Statewide Cmnty. Dev. Auth. Rev. (Kaiser Fund Hosp./Health Place, Inc. Proj.) Series 2002 C, 3.7%, tender 6/1/05 (b) | | 10,000 | | 10,273 |
Golden State Tobacco Securitization Corp. Series 2003 B, 5% 6/1/08 | | 1,300 | | 1,389 |
Long Beach Hbr. Rev. Series 2000 A: | | | | |
5.5% 5/15/05 (e) | | 3,490 | | 3,671 |
5.5% 5/15/06 (e) | | 3,000 | | 3,247 |
Los Angeles Hbr. Dept. Rev. Series A: | | | | |
5.5% 8/1/04 (AMBAC Insured) (e) | | 2,000 | | 2,051 |
5.5% 8/1/06 (AMBAC Insured) (e) | | 1,495 | | 1,627 |
San Francisco City & County Arpts. Commission Int'l. Arpt. Rev. Second Series 27A, 5% 5/1/05 (MBIA Insured) (e) | | 3,680 | | 3,844 |
San Joaquin Hills Trans. Corridor Agcy. Toll Road Rev. Series A, 0% 1/15/12 (MBIA Insured) | | 3,600 | | 2,647 |
Univ. of California Revs. (UCLA Med. Ctr. Proj.) 4.55% 12/1/09 (g) | | 9,600 | | 10,223 |
| | 100,763 |
Colorado - 0.9% |
Arapahoe County Cap. Impt. Trust Fund Hwy. Rev.: | | | | |
Series C, 0% 8/31/08 (Pre-Refunded to 8/31/05 @ 82.9449) (f) | | 4,500 | | 3,643 |
Series E 470: | | | | |
0% 8/31/07 (Pre-Refunded to 8/31/05 @ 89.2392) (f) | | 2,000 | | 1,742 |
0% 8/31/15 (Pre-Refunded to 8/31/05 @ 48.6181) (f) | | 9,025 | | 4,284 |
Arapahoe County Cherry Creek School District #5 Series B, 6% 12/15/04 | | 1,395 | | 1,459 |
Denver City & County Arpt. Rev. Series 2001 B, 5.25% 11/15/04 (FGIC Insured) (e) | | 1,200 | | 1,242 |
Municipal Bonds - continued |
| Principal
Amount (000s) | | Value (Note 1)
(000s) |
Colorado - continued |
E-470 Pub. Hwy. Auth. Rev. Series 2000 B: | | | | |
0% 9/1/06 (MBIA Insured) | | $ 2,200 | | $ 2,072 |
0% 9/1/07 (MBIA Insured) | | 3,200 | | 2,903 |
| | 17,345 |
Connecticut - 0.2% |
Connecticut Gen. Oblig. Series 2003 D, 5% 8/1/10 (FSA Insured) | | 3,000 | | 3,380 |
District Of Columbia - 1.6% |
District of Columbia Ctfs. of Prtn.: | | | | |
3% 1/1/06 (AMBAC Insured) | | 1,305 | | 1,338 |
5% 1/1/06 (AMBAC Insured) | | 1,000 | | 1,062 |
5% 1/1/07 (AMBAC Insured) | | 1,000 | | 1,083 |
5.25% 1/1/08 (AMBAC Insured) | | 935 | | 1,032 |
District of Columbia Gen. Oblig.: | | | | |
Series 1993 B2, 5.5% 6/1/07 (FSA Insured) | | 3,800 | | 4,210 |
Series 2001 B, 5.5% 6/1/07 (FSA Insured) | | 1,345 | | 1,490 |
District of Columbia Rev. (Medstar Univ. Hosp. Proj.) Series D, 6.875%, tender 2/15/07 (b) | | 9,000 | | 9,621 |
Metro. Washington Arpt. Auth. Sys. Rev. Series D: | | | | |
4% 10/1/05 (FSA Insured) (e) | | 1,000 | | 1,038 |
4% 10/1/06 (FSA Insured) (e) | | 1,750 | | 1,837 |
4% 10/1/07 (FSA Insured) (e) | | 1,000 | | 1,056 |
Metro. Washington Arpts. Auth. Gen. Arpt. Rev. Series B, 5.5% 10/1/08 (FGIC Insured) (e) | | 6,460 | | 7,106 |
| | 30,873 |
Florida - 5.6% |
Brevard County Util. Rev.: | | | | |
5% 3/1/05 (FGIC Insured) | | 1,445 | | 1,508 |
5% 3/1/06 (FGIC Insured) | | 530 | | 568 |
Broward County School District Series A: | | | | |
5% 2/15/05 | | 3,000 | | 3,127 |
5% 2/15/08 | | 5,810 | | 6,429 |
Dade County School District: | | | | |
5% 8/1/07 (MBIA Insured) | | 1,500 | | 1,649 |
5.2% 7/15/07 (AMBAC Insured) | | 8,500 | | 9,405 |
Florida Board of Ed. Lottery Rev. Series B, 6% 7/1/15 (FGIC Insured) | | 1,200 | | 1,408 |
Florida Ports Fing. Commission Rev. (State Trans. Trust Fund Proj.) 6% 6/1/05 (MBIA Insured) (e) | | 4,575 | | 4,846 |
Florida Tpk. Auth. Tpk. Rev. Series B, 5% 7/1/11 (AMBAC Insured) | | 1,700 | | 1,904 |
Municipal Bonds - continued |
| Principal
Amount (000s) | | Value (Note 1)
(000s) |
Florida - continued |
Highlands County Health Facilities Auth. Rev. (Adventist Health Sys./Sunbelt Proj.) 3.35%, tender 9/1/05 (b) | | $ 20,300 | | $ 20,770 |
Hillsborough County Indl. Dev. Auth. Poll. Cont. Rev. (Tampa Elec. Co. Proj.): | | | | |
4%, tender 8/1/07 (b) | | 11,000 | | 11,194 |
4.25%, tender 8/1/07 (b)(e) | | 6,000 | | 6,115 |
Indian River County School District: | | | | |
4% 4/1/05 (FSA Insured) | | 2,185 | | 2,259 |
4% 4/1/06 (FSA Insured) | | 1,470 | | 1,548 |
Miami-Dade County Cap. Asset Acquisition Fixed Rate Spl. Oblig. Series 2002 A: | | | | |
5% 4/1/05 (AMBAC Insured) | | 2,900 | | 3,033 |
5% 4/1/06 (AMBAC Insured) | | 3,365 | | 3,617 |
5% 4/1/08 (AMBAC Insured) | | 2,825 | | 3,135 |
Miami-Dade County School Board Ctfs. of Prtn. 5%, tender 5/1/11 (MBIA Insured) (b) | | 1,500 | | 1,661 |
Palm Beach County School District 5% 8/1/05 (MBIA Insured) | | 5,000 | | 5,285 |
Pasco County Solid Waste Disp. & Resource Recovery Sys. Rev. 5.75% 4/1/06 (AMBAC Insured) (e) | | 1,500 | | 1,603 |
Reedy Creek Impt. District Utils. Rev. Series 2: | | | | |
5% 10/1/05 (MBIA Insured) (a) | | 1,685 | | 1,783 |
5.25% 10/1/10 (MBIA Insured) (a) | | 8,275 | | 9,430 |
Univ. Athletic Assoc., Inc. Athletic Prog. Rev. Series 2001, 2.8%, tender 10/1/08, LOC Suntrust Banks of Florida, Inc. (b) | | 2,000 | | 1,998 |
| | 104,275 |
Georgia - 2.2% |
Atlanta Arpt. Facilities Rev. 6.5% 1/1/06 (Escrowed to Maturity) (f) | | 6,000 | | 6,555 |
Cobb County Solid Waste Mgt. Auth. Rev. Series 1995, 6.05% 1/1/05 (e) | | 1,000 | | 1,045 |
Columbus Wtr. & Swr. Rev. 5.25% 5/1/05 (FSA Insured) | | 1,990 | | 2,093 |
Dalton Bldg. Auth. Rev. Series 2001, 5% 7/1/05 | | 6,030 | | 6,353 |
Fulton DeKalb Hosp. Auth. Hosp. Rev. 5% 1/1/08 (FSA Insured) | | 2,250 | | 2,476 |
Georgia Gen. Oblig.: | | | | |
Series A: | | | | |
4% 5/1/05 | | 7,000 | | 7,250 |
5.8% 3/1/05 | | 2,000 | | 2,105 |
Series B, 6.25% 4/1/06 | | 1,750 | | 1,929 |
Series C, 6.5% 7/1/07 | | 2,185 | | 2,511 |
Municipal Bonds - continued |
| Principal
Amount (000s) | | Value (Note 1)
(000s) |
Georgia - continued |
Georgia Muni. Elec. Auth. Pwr. Rev. Series 1993 CC, 4.8% 1/1/06 (MBIA Insured) | | $ 7,050 | | $ 7,478 |
Gwinnett County Gen. Oblig. 4% 1/1/06 | | 1,000 | | 1,047 |
Henry County Wtr. & Swr. Auth. Rev. 5% 2/1/08 (MBIA Insured) | | 1,095 | | 1,211 |
| | 42,053 |
Hawaii - 1.3% |
Hawaii Arpts. Sys. Rev.: | | | | |
Series 2000 B, 8% 7/1/10 (FGIC Insured) (e) | | 3,850 | | 4,845 |
Series 2001, 5.5% 7/1/05 (FGIC Insured) (e) | | 3,000 | | 3,171 |
Hawaii Gen. Oblig.: | | | | |
Series 2001 CV: | | | | |
5% 8/1/05 (FGIC Insured) | | 3,610 | | 3,809 |
5.5% 8/1/10 (FGIC Insured) | | 4,570 | | 5,276 |
Series CS, 5% 4/1/08 (MBIA Insured) | | 2,200 | | 2,431 |
Series CU, 5.75% 10/1/11 (MBIA Insured) | | 3,210 | | 3,717 |
Honolulu City & County Gen. Oblig. Series B, 5.5% 11/1/04 (FGIC Insured) | | 465 | | 482 |
| | 23,731 |
Illinois - 7.8% |
Chicago Gen. Oblig.: | | | | |
(Neighborhoods Alive 21 Prog.): | | | | |
5% 1/1/07 (MBIA Insured) | | 1,360 | | 1,480 |
5% 1/1/08 (MBIA Insured) | | 1,190 | | 1,311 |
5% 1/1/07 (FGIC Insured) | | 1,000 | | 1,088 |
Chicago Midway Arpt. Rev. Series 2001 B, 5% 1/1/07 (FSA Insured) | | 1,000 | | 1,087 |
Chicago O'Hare Int'l. Arpt. Rev.: | | | | |
Series 2001 C: | | | | |
5% 1/1/05 (AMBAC Insured) (e) | | 1,415 | | 1,469 |
5% 1/1/07 (AMBAC Insured) (e) | | 2,670 | | 2,872 |
5.25% 1/1/06 (AMBAC Insured) (e) | | 2,335 | | 2,479 |
Series A, 6% 1/1/05 (AMBAC Insured) | | 1,030 | | 1,079 |
5.5% 1/1/10 (AMBAC Insured) (e) | | 5,000 | | 5,564 |
Chicago Park District Series C, 5% 1/1/11 (AMBAC Insured) | | 2,515 | | 2,818 |
Chicago Pub. Bldg. Commision Bldg. Rev. Series C, 5.5% 2/1/06 (FGIC Insured) | | 6,000 | | 6,468 |
Chicago Tax Increment Rev.: | | | | |
Series 2000 A, 0% 12/1/08 (AMBAC Insured) | | 10,000 | | 8,658 |
Series A, 0% 12/1/05 (AMBAC Insured) | | 3,000 | | 2,908 |
Municipal Bonds - continued |
| Principal
Amount (000s) | | Value (Note 1)
(000s) |
Illinois - continued |
Chicago Transit Auth. Cap. Grant Receipts Rev. Series A: | | | | |
4% 6/1/06 (AMBAC Insured) | | $ 6,000 | | $ 6,065 |
4.25% 6/1/08 (AMBAC Insured) | | 3,600 | | 3,794 |
Cook County Gen. Oblig. Series 2003 B: | | | | |
5% 11/15/06 (MBIA Insured) | | 14,685 | | 15,988 |
5% 11/15/07 (MBIA Insured) | | 5,000 | | 5,527 |
Du Page Wtr. Commission Wtr. Rev. 5% 5/1/08 (AMBAC Insured) | | 4,525 | | 5,001 |
Illinois Dev. Fin. Auth. Gas Supply Rev. (The Peoples Gas Lt. & Coke Co. Proj.) Series 2003 B, 3.05%, tender 2/1/08 (AMBAC Insured) (b) | | 6,000 | | 6,102 |
Illinois Edl. Facilities Auth. Revs. (Art Institute of Chicago Proj.) Series 2003, 3.85%, tender 3/1/11 (b) | | 12,800 | | 12,634 |
Illinois Gen. Oblig.: | | | | |
First Series: | | | | |
5% 4/1/05 (FSA Insured) | | 3,000 | | 3,136 |
5% 8/1/05 | | 1,000 | | 1,056 |
5% 8/1/06 | | 8,160 | | 8,815 |
5.25% 4/1/08 (MBIA Insured) | | 1,035 | | 1,154 |
5.5% 8/1/10 | | 1,405 | | 1,613 |
Series A: | | | | |
5% 10/1/09 | | 2,600 | | 2,905 |
5% 10/1/10 | | 3,000 | | 3,360 |
5% 6/1/07 | | 6,250 | | 6,836 |
Illinois Sales Tax Rev. 5.375% 6/15/08 | | 4,170 | | 4,686 |
Kane & DuPage Counties Cmnty. Unit School District #303 Saint Charles Series A, 5.5% 1/1/12 (FSA Insured) | | 2,270 | | 2,614 |
Kane County School District #129 Aurora West Side Series A, 5.75% 2/1/14 (FGIC Insured) | | 1,600 | | 1,831 |
Kane, McHenry, Cook & DeKalb Counties Cmnty. Unit School District #300 Carpentersville 5.5% 12/1/13 (MBIA Insured) | | 5,000 | | 5,701 |
Kendall, Kane & Will Counties Cmnty. Unit School District #308: | | | | |
5% 10/1/04 (FGIC Insured) | | 510 | | 524 |
5.25% 10/1/05 (FGIC Insured) | | 560 | | 596 |
5.25% 10/1/06 (FGIC Insured) | | 695 | | 759 |
Rosemont Gen. Oblig. (Tax Increment #3 Proj.) 0% 12/1/07 (FGIC Insured) | | 3,000 | | 2,704 |
Municipal Bonds - continued |
| Principal
Amount (000s) | | Value (Note 1)
(000s) |
Illinois - continued |
Univ. of Illinois Auxiliary Facilities Sys. Rev. Series 2001 A, 5% 4/1/08 (AMBAC Insured) | | $ 2,035 | | $ 2,245 |
Will County School District #122 Series B, 0% 11/1/08 (FSA Insured) | | 1,500 | | 1,302 |
| | 146,229 |
Indiana - 1.2% |
Indiana Health Facility Fing. Auth. Rev. (Ascension Health Cr. Group Prog.) Series 2002 F: | | | | |
5% 11/15/04 | | 1,300 | | 1,343 |
5.5% 11/15/05 | | 1,000 | | 1,071 |
5.5% 11/15/06 | | 1,000 | | 1,091 |
Indiana Univ. Revs. (Student Fee Proj.) Series H, 0% 8/1/05 (AMBAC Insured) | | 5,500 | | 5,368 |
Rockport Poll. Cont. Rev. 4.9%, tender 6/1/07 (b) | | 4,000 | | 4,212 |
Saint Joseph County Ind. Edl. Facilities Rev. (Univ. of Notre Dame Du Lac Proj.) 2.5%, tender 12/3/07 (b) | | 10,000 | | 10,000 |
| | 23,085 |
Kansas - 0.7% |
Burlington Envir. Impt. Rev. (Kansas City Pwr. & Lt. Co. Proj.): | | | | |
Series C, 2.25%, tender 9/1/04 (b) | | 7,000 | | 6,995 |
4.75%, tender 10/1/07 (b) | | 2,400 | | 2,561 |
La Cygne Envir. Impt. Rev. (Kansas City Pwr. & Lt. Co. Proj.) Series 1994, 3.9%, tender 9/1/04 (b) | | 3,700 | | 3,765 |
| | 13,321 |
Kentucky - 0.1% |
Kenton County Arpt. Board Arpt. Rev. Series B, 5% 3/1/09 (MBIA Insured) (e) | | 1,185 | | 1,295 |
Louisiana - 0.9% |
New Orleans Audubon Commission Series A: | | | | |
3% 10/1/05 (FSA Insured) | | 1,930 | | 1,980 |
4% 10/1/06 (FSA Insured) | | 1,990 | | 2,107 |
4% 10/1/07 (FSA Insured) | | 1,065 | | 1,136 |
4% 10/1/08 (FSA Insured) | | 1,105 | | 1,180 |
4% 10/1/09 (FSA Insured) | | 1,090 | | 1,162 |
5% 10/1/10 (FSA Insured) | | 1,325 | | 1,490 |
New Orleans Gen. Oblig.: | | | | |
4% 3/1/05 (MBIA Insured) | | 1,590 | | 1,639 |
Municipal Bonds - continued |
| Principal
Amount (000s) | | Value (Note 1)
(000s) |
Louisiana - continued |
New Orleans Gen. Oblig.: - continued | | | | |
4% 3/1/06 (MBIA Insured) | | $ 3,695 | | $ 3,879 |
5% 3/1/07 (MBIA Insured) | | 2,000 | | 2,186 |
| | 16,759 |
Maryland - 0.8% |
Anne Arundel County Gen. Oblig. 5% 3/1/06 | | 6,200 | | 6,657 |
Carroll County Gen. Oblig. 4% 11/1/04 | | 1,000 | | 1,024 |
Maryland Gen. Oblig. (State & Local Facilities Ln. Prog.): | | | | |
Series 2002 B, 5.25% 2/1/08 | | 2,700 | | 3,019 |
Series A, 5.25% 3/1/06 | | 4,100 | | 4,427 |
| | 15,127 |
Massachusetts - 4.9% |
Massachusetts Dev. Fin. Agcy. Rev. (Massachusetts Biomedical Research Corp. Proj.) Series C: | | | | |
5.75% 8/1/06 | | 1,200 | | 1,298 |
5.875% 8/1/08 | | 1,630 | | 1,824 |
Massachusetts Gen. Oblig.: | | | | |
Series 2001 A, 5.5% 1/1/11 | | 5,000 | | 5,702 |
Series 2002 B, 5% 2/1/06 | | 40,000 | | 42,664 |
Series 2003 A, 5.375% 8/1/08 | | 5,165 | | 5,794 |
Series 2003 C: | | | | |
5% 12/1/06 (XL Cap. Assurance, Inc. Insured) | | 13,975 | | 15,222 |
5.5% 10/1/10 (MBIA Insured) | | 1,130 | | 1,300 |
Series A, 5.5% 2/1/07 (MBIA Insured) | | 7,500 | | 8,271 |
Massachusetts Health & Edl. Facilities Auth. Rev. (Caritas Christi Oblig. Group Proj.): | | | | |
5% 7/1/04 | | 1,805 | | 1,826 |
5.5% 7/1/05 | | 1,000 | | 1,026 |
New England Ed. Ln. Marketing Corp.: | | | | |
Series A, 5.7% 7/1/05 (e) | | 2,800 | | 2,963 |
Series F, 5.625% 7/1/04 (e) | | 3,500 | | 3,577 |
Springfield Gen. Oblig. 5% 1/15/06 (MBIA Insured) | | 1,000 | | 1,066 |
| | 92,533 |
Michigan - 2.0% |
Battle Creek Downtown Dev. Auth. 6% 5/1/06 (MBIA Insured) | | 1,500 | | 1,647 |
Detroit Gen. Oblig. Series A: | | | | |
5% 4/1/06 (FSA Insured) (a) | | 2,200 | | 2,262 |
5% 4/1/07 (FSA Insured) (a) | | 6,910 | | 7,208 |
Municipal Bonds - continued |
| Principal
Amount (000s) | | Value (Note 1)
(000s) |
Michigan - continued |
Ferndale Gen. Oblig.: | | | | |
3.5% 4/1/05 (FGIC Insured) | | $ 1,280 | | $ 1,315 |
3.5% 4/1/06 (FGIC Insured) | | 1,960 | | 2,038 |
Holly Area School District Series 1999, 5.375% 5/1/11 (Pre-Refunded to 5/1/05 @ 101) (f) | | 1,275 | | 1,359 |
Michigan Gen. Oblig. Series 1995, 5.7% 12/1/12 (Pre-Refunded to 12/1/05 @ 102) (f) | | 11,985 | | 13,192 |
Michigan Hosp. Fin. Auth. Hosp. Rev. (Sparrow Hosp. Obligated Group Proj.) 5% 11/15/04 | | 1,500 | | 1,544 |
Michigan Strategic Fund Exempt Facilities Rev. (Waste Mgmt., Inc. Proj.) 4.2%, tender 8/1/04 (b)(e) | | 7,000 | | 7,096 |
| | 37,661 |
Minnesota - 1.9% |
Hopkins Independent School District #270 Series B, 4% 2/1/06 | | 2,575 | | 2,702 |
Mankato Independent School District #77 Series A, 4% 2/1/06 (FSA Insured) | | 1,420 | | 1,490 |
Minneapolis & Saint Paul Hsg. & Redev. Auth. Health Care Sys. Rev. (Health Partners Oblig. Group Proj.): | | | | |
5.25% 12/1/08 | | 1,200 | | 1,289 |
5.25% 12/1/10 | | 500 | | 529 |
Minnesota Pub. Facilities Auth. Wtr. Poll. Cont. Rev. Series A, 4.5% 3/1/07 | | 2,240 | | 2,419 |
Southern Minnesota Muni. Pwr. Agcy. Pwr. Supply Sys. Rev.: | | | | |
5% 1/1/05 | | 17,245 | | 17,875 |
5% 1/1/06 (AMBAC Insured) | | 4,580 | | 4,883 |
5% 1/1/08 (AMBAC Insured) | | 2,310 | | 2,552 |
Waconia Independent School District #110 Series A, 5% 2/1/11 (FSA Insured) | | 940 | | 1,056 |
| | 34,795 |
Mississippi - 1.4% |
Jackson Wtr. & Swr. Sys. Rev. Series 2003: | | | | |
5% 9/1/05 (FSA Insured) | | 5,285 | | 5,582 |
5% 9/1/07 (FSA Insured) | | 5,825 | | 6,407 |
5% 9/1/08 (FSA Insured) | | 2,620 | | 2,908 |
5.25% 9/1/09 (FSA Insured) | | 3,105 | | 3,512 |
5.25% 9/1/11 (FSA Insured) | | 1,595 | | 1,812 |
Municipal Bonds - continued |
| Principal
Amount (000s) | | Value (Note 1)
(000s) |
Mississippi - continued |
Mississippi Bus. Fin. Corp. Solid Waste Disp. Rev. (Waste Mgmt., Inc. Proj.) 4.65%, tender 3/1/04 (b)(e) | | $ 5,000 | | $ 5,022 |
Mississippi Higher Ed. Student Ln. Series 2000 B3, 5.3% 9/1/08 (e) | | 1,190 | | 1,285 |
| | 26,528 |
Missouri - 0.5% |
Kansas City School District Bldg. Corp. Rev.: | | | | |
(Elementary School Proj.) Series B, 5% 2/1/12 (FGIC Insured) | | 3,100 | | 3,464 |
Series A, 5% 2/1/08 (FGIC Insured) | | 2,000 | | 2,209 |
Missouri Envir. Impt. & Energy Resources Auth. Wtr. Poll. Cont. & Drinking Wtr. Rev. (State Revolving Fund Prog.) Series D, 6% 1/1/05 | | 1,100 | | 1,153 |
Saint Louis Muni. Fin. Corp. Leasehold Rev. (Civil Courts Bldg. Proj.) Series 2003 A, 5% 8/1/06 (FSA Insured) | | 1,635 | | 1,769 |
| | 8,595 |
Montana - 0.2% |
Forsyth Poll. Cont. Rev. (Portland Gen. Elec. Co. Projs.) Series A, 5.2%, tender 5/1/09 (b) | | 2,900 | | 2,996 |
Nebraska - 2.1% |
Lancaster County School District #1 (Lincoln Pub. Schools Proj.): | | | | |
3% 1/15/05 | | 1,870 | | 1,905 |
4% 1/15/06 | | 1,000 | | 1,046 |
Lincoln Wtrwks. Rev. Series 2003, 5% 8/15/05 | | 3,265 | | 3,452 |
Nebraska Pub. Pwr. District Rev.: | | | | |
Series 1998 A, 5.25% 1/1/06 (MBIA Insured) | | 5,000 | | 5,352 |
Series A: | | | | |
0% 1/1/06 (MBIA Insured) | | 24,465 | | 23,586 |
0% 1/1/07 (MBIA Insured) | | 4,000 | | 3,732 |
| | 39,073 |
Nevada - 1.5% |
Clark County Arpt. Rev. Series C: | | | | |
5% 7/1/05 (AMBAC Insured) (e) | | 800 | | 840 |
5% 7/1/06 (AMBAC Insured) (e) | | 800 | | 855 |
5% 7/1/08 (AMBAC Insured) (e) | | 2,215 | | 2,409 |
5% 7/1/09 (AMBAC Insured) (e) | | 2,700 | | 2,954 |
5% 7/1/10 (AMBAC Insured) (e) | | 1,225 | | 1,336 |
5% 7/1/11 (AMBAC Insured) (e) | | 1,790 | | 1,939 |
Municipal Bonds - continued |
| Principal
Amount (000s) | | Value (Note 1)
(000s) |
Nevada - continued |
Clark County Las Vegas-McCarran Int'l. Arpt. Passenger Facility Charge Rev. Series 2002 A, 5% 7/1/06 (MBIA Insured) (e) | | $ 5,415 | | $ 5,785 |
Clark County School District: | | | | |
Series 2000 A, 5.75% 6/15/17 (MBIA Insured) | | 1,600 | | 1,822 |
Series D, 5% 6/15/09 (MBIA Insured) | | 7,000 | | 7,831 |
Washoe County Gen. Oblig. 4% 9/1/05 (FSA Insured) | | 2,170 | | 2,264 |
| | 28,035 |
New Hampshire - 0.1% |
New Hampshire Health & Ed. Facilities Auth. Rev. (Univ. Sys. of New Hampshire Proj.) 5.25% 7/1/05 (AMBAC Insured) | | 1,695 | | 1,792 |
New Jersey - 1.3% |
New Jersey Gen. Oblig. Series E, 6% 7/15/05 | | 3,700 | | 3,961 |
New Jersey Trans. Trust Fund Auth. Series 2001 A, 5% 6/15/06 | | 6,300 | | 6,789 |
New Jersey Transit Corp.: | | | | |
Series 2000 B, 5.5% 2/1/08 (AMBAC Insured) | | 1,000 | | 1,118 |
Series 2000 C, 5.25% 2/1/04 (AMBAC Insured) | | 10,000 | | 10,029 |
North Jersey District Wtr. Supply Commission (Wanaque South Proj.) Series A, 5% 7/1/05 (MBIA Insured) | | 1,680 | | 1,769 |
| | 23,666 |
New Jersey/Pennsylvania - 0.4% |
Delaware River Joint Toll Bridge Commission Bridge Rev.: | | | | |
3% 7/1/04 | | 1,630 | | 1,645 |
5% 7/1/09 | | 5,170 | | 5,702 |
| | 7,347 |
New Mexico - 1.4% |
New Mexico Edl. Assistance Foundation Student Ln. Rev. Sr. Series IV A1, 6.5% 3/1/04 (e) | | 1,540 | | 1,549 |
New Mexico Gen. Oblig. 4% 3/1/05 | | 9,875 | | 10,191 |
San Juan County Gross Receipts Tax Rev. Series B, 2.5% 8/15/05 | | 13,600 | | 13,759 |
| | 25,499 |
New York - 6.6% |
Metro. Trans. Auth. Commuter Facilities Rev. Series A: | | | | |
5% 7/1/06 (Escrowed to Maturity) (f) | | 1,520 | | 1,651 |
5.375% 7/1/09 (Escrowed to Maturity) (f) | | 3,635 | | 4,178 |
Municipal Bonds - continued |
| Principal
Amount (000s) | | Value (Note 1)
(000s) |
New York - continued |
Metro. Trans. Auth. Svc. Contract Rev. Series B: | | | | |
4% 1/1/05 | | $ 4,265 | | $ 4,378 |
5% 1/1/06 | | 10,110 | | 10,726 |
Nassau County Gen. Oblig. Series Z: | | | | |
5% 9/1/11 (FGIC Insured) | | 800 | | 884 |
5% 9/1/12 (FGIC Insured) | | 1,500 | | 1,644 |
New York City Gen. Oblig.: | | | | |
Series 2000 A, 6.5% 5/15/11 | | 2,450 | | 2,868 |
Series A, 5.25% 11/1/14 (MBIA Insured) | | 600 | | 669 |
Series E, 6% 8/1/11 | | 1,250 | | 1,380 |
Series G, 5.25% 8/1/14 (AMBAC Insured) | | 1,000 | | 1,106 |
Series H, 5.75% 3/15/11 (FGIC Insured) | | 1,700 | | 1,977 |
New York City Transitional Fin. Auth. Rev. Series 2003 E: | | | | |
4.5% 2/1/07 | | 1,750 | | 1,879 |
4.5% 2/1/08 | | 1,500 | | 1,621 |
5% 2/1/09 | | 2,000 | | 2,224 |
New York State Dorm. Auth. Revs.: | | | | |
(City Univ. Sys. Proj.) Series 2000 A, 6.125% 7/1/12 (AMBAC Insured) | | 5,540 | | 6,538 |
Series 2003 A: | | | | |
5% 1/1/06 (AMBAC Insured) | | 1,250 | | 1,325 |
5% 1/1/07 (AMBAC Insured) | | 10,855 | | 11,722 |
5% 3/15/08 | | 2,000 | | 2,196 |
New York State Envir. Facilities Corp. State Wtr. Poll. Cont. Revolving Fund Rev. (New York City Muni. Wtr. Fin. Auth. Proj.) Series 1997 E, 6% 6/15/11 (MBIA Insured) | | 3,500 | | 4,191 |
New York State Urban Dev. Corp. Rev. (Correctional Facilities-Svc. Contract Proj.) Series B, 4.75% 1/1/28 (Pre-Refunded to 1/1/09 @ 101) (f) | | 2,615 | | 2,919 |
Tobacco Settlement Fing. Corp.: | | | | |
Series A1: | | | | |
5.25% 6/1/12 | | 5,000 | | 5,245 |
5.25% 6/1/13 | | 17,500 | | 18,526 |
Series B1, 5% 6/1/06 | | 17,815 | | 18,993 |
Triborough Bridge & Tunnel Auth. Revs.: | | | | |
Series A, 5.5% 1/1/14 (Pre-Refunded to 1/1/12 @ 100) (f) | | 3,745 | | 4,359 |
Series Y, 5.9% 1/1/08 (Escrowed to Maturity) (f) | | 10,000 | | 11,396 |
| | 124,595 |
Municipal Bonds - continued |
| Principal
Amount (000s) | | Value (Note 1)
(000s) |
New York & New Jersey - 0.9% |
Port Auth. of New York & New Jersey: | | | | |
124th Series, 5% 8/1/13 (FGIC Insured) (e) | | $ 1,200 | | $ 1,278 |
127th Series: | | | | |
5% 12/15/04 (AMBAC Insured) (e) | | 5,310 | | 5,503 |
5% 12/15/06 (AMBAC Insured) (e) | | 4,965 | | 5,394 |
5% 12/15/08 (AMBAC Insured) (e) | | 3,510 | | 3,889 |
| | 16,064 |
North Carolina - 0.8% |
Mecklenburg County Gen. Oblig. Series B, 3.25% 2/1/06 | | 3,305 | | 3,422 |
North Carolina Eastern Muni. Pwr. Agcy. Pwr. Sys. Rev.: | | | | |
Series 1993 B, 7% 1/1/08 (MBIA Insured) | | 1,500 | | 1,763 |
Series A, 5.5% 1/1/10 | | 3,000 | | 3,299 |
Series B, 6% 1/1/05 | | 2,000 | | 2,025 |
Series C, 5% 1/1/08 | | 1,190 | | 1,274 |
Series D, 5.375% 1/1/10 | | 3,700 | | 4,044 |
| | 15,827 |
North Dakota - 0.1% |
North Dakota Bldg. Auth. Lease Rev. Series A, 5.25% 6/1/05 (FGIC Insured) | | 2,060 | | 2,172 |
Ohio - 3.8% |
Cleveland Arpt. Sys. Rev. Series A, 5.5% 1/1/05 (FSA Insured) (e) | | 2,250 | | 2,339 |
Cleveland Pub. Pwr. Sys. Rev. (First Mtg. Prog.) Series 1994 A, 0% 11/15/09 (MBIA Insured) | | 2,250 | | 1,875 |
Columbus Gen. Oblig. Series 1, 5% 6/15/05 | | 1,645 | | 1,732 |
Franklin County Rev. (OCLC Online Computer Library Ctr., Inc. Proj.) 5% 4/15/07 | | 1,960 | | 2,104 |
Lakewood Hosp. Impt. Rev. (Lakewood Hosp. Assoc. Proj.) 5.5% 2/15/07 | | 1,420 | | 1,530 |
Montgomery County Rev. (Catholic Health Initiatives Proj.) 4% 9/1/04 | | 1,695 | | 1,726 |
Ohio Air Quality Dev. Auth. Rev. (Pennsylvania Pwr. Co. Proj.) 2.5%, tender 7/1/04 (b) | | 2,400 | | 2,400 |
Ohio Bldg. Auth.: | | | | |
(Adult Correctional Bldg. Fund Prog.) Series A: | | | | |
5.75% 4/1/08 | | 3,555 | | 4,040 |
6% 10/1/05 | | 5,600 | | 6,039 |
Series A, 5% 4/1/11 (FGIC Insured) | | 1,000 | | 1,127 |
Ohio Gen. Oblig.: | | | | |
Series 2003 A, 4% 3/15/05 | | 9,245 | | 9,548 |
Municipal Bonds - continued |
| Principal
Amount (000s) | | Value (Note 1)
(000s) |
Ohio - continued |
Ohio Gen. Oblig.: - continued | | | | |
Series A, 5% 2/1/05 | | $ 8,550 | | $ 8,897 |
Series IIA, 5.25% 12/1/05 | | 5,000 | | 5,354 |
Ohio Rev. Series 2003-1, 5% 6/15/08 (a) | | 5,000 | | 5,545 |
Ohio Univ. Gen. Receipts Athens: | | | | |
5% 12/1/05 (FSA Insured) | | 1,650 | | 1,759 |
5% 12/1/06 (FSA Insured) | | 3,600 | | 3,932 |
5% 12/1/07 (FSA Insured) | | 1,285 | | 1,427 |
Ohio Wtr. Dev. Auth. Poll. Cont. Facilities Rev.: | | | | |
(Cleveland Elec. Illuminating Co. Proj.) Series A, 3.4%, tender 10/1/04 (b) | | 2,350 | | 2,365 |
(Toledo Edison Co. Proj.) Series B, 4.5%, tender 9/1/05 (b) | | 7,000 | | 7,179 |
Ohio Wtr. Dev. Auth. Rev. (Fresh Wtr. Proj.) Series A, 5.4% 6/1/05 (AMBAC Insured) | | 1,000 | | 1,057 |
| | 71,975 |
Oklahoma - 0.7% |
Oklahoma City Gen. Oblig. 4% 3/1/05 (FGIC Insured) | | 1,955 | | 2,018 |
Oklahoma Dev. Fin. Auth. Rev. (Samuel Roberts Noble, Inc. Proj.): | | | | |
Series 2001, 5% 5/1/05 | | 7,615 | | 7,986 |
5% 5/1/06 | | 3,200 | | 3,444 |
| | 13,448 |
Oregon - 0.8% |
Deschutes & Jefferson Counties School District #2J Redmond: | | | | |
5.5% 6/1/05 (FGIC Insured) | | 1,000 | | 1,058 |
5.5% 6/1/06 (FGIC Insured) | | 2,610 | | 2,847 |
Eugene Elec. Util. Rev. Series A: | | | | |
5.25% 8/1/05 (FSA Insured) | | 1,210 | | 1,277 |
5.25% 8/1/06 (FSA Insured) | | 1,280 | | 1,379 |
5.25% 8/1/07 (FSA Insured) | | 1,350 | | 1,481 |
5.25% 8/1/08 (FSA Insured) | | 1,425 | | 1,582 |
Oregon Dept. of Trans. Hwy. User Tax Rev. 5.5% 11/15/13 | | 3,365 | | 3,894 |
Oregon Gen. Oblig. 8.25% 1/1/07 | | 1,000 | | 1,178 |
| | 14,696 |
Municipal Bonds - continued |
| Principal
Amount (000s) | | Value (Note 1)
(000s) |
Pennsylvania - 3.0% |
Allegheny County Hosp. Dev. Auth. Rev. (Univ. of Pittsburgh Med. Ctr. Proj.) Series B: | | | | |
5.5% 6/15/05 | | $ 2,545 | | $ 2,670 |
5.5% 6/15/06 | | 3,065 | | 3,277 |
5.5% 6/15/07 | | 2,000 | | 2,163 |
Allegheny County San. Auth. Swr. Rev. 6% 12/1/11 (MBIA Insured) | | 1,495 | | 1,772 |
Hazleton Area School District 6.5% 3/1/06 (FSA Insured) | | 1,155 | | 1,273 |
Pennsylvania Econ. Dev. Fing. Auth. Exempt Facilities Rev. (Shippingport Proj.) Series A, 5%, tender 6/1/05 (b)(e) | | 6,200 | | 6,317 |
Pennsylvania Higher Edl. Facilities Auth. Rev. (UPMC Health Sys. Proj.) Series 2001 A, 5.75% 1/15/09 | | 1,750 | | 1,918 |
Pennsylvania State Univ.: | | | | |
5% 3/1/05 | | 6,935 | | 7,234 |
5% 3/1/06 | | 7,280 | | 7,795 |
Philadelphia Gas Works Rev. First Series A, 5.25% 7/1/05 (FSA Insured) | | 5,000 | | 5,269 |
Philadelphia Muni. Auth. Rev. Series A: | | | | |
4% 5/15/05 (FSA Insured) | | 2,500 | | 2,592 |
5% 5/15/07 (FSA Insured) | | 5,500 | | 6,026 |
5% 5/15/08 (FSA Insured) | | 5,000 | | 5,537 |
Wyoming Valley San. Auth. Swr. Rev. 5% 11/15/06 (MBIA Insured) | | 1,865 | | 2,032 |
| | 55,875 |
Rhode Island - 0.3% |
Rhode Island Health & Edl. Bldg. Corp. Rev. (Johnson & Wales Univ. Proj.): | | | | |
4% 4/1/05 (XL Cap. Assurance, Inc. Insured) | | 1,270 | | 1,312 |
5% 4/1/06 (XL Cap. Assurance, Inc. Insured) | | 2,225 | | 2,381 |
5% 4/1/08 (XL Cap. Assurance, Inc. Insured) | | 1,700 | | 1,877 |
| | 5,570 |
South Carolina - 1.8% |
Berkeley County School District 7% 4/1/07 | | 2,615 | | 3,011 |
Piedmont Muni. Pwr. Agcy. Elec. Rev. 5.6% 1/1/09 (MBIA Insured) | | 2,345 | | 2,684 |
Richland County School District #1 4.75% 3/1/11 (FSA Insured) | | 2,520 | | 2,788 |
Richland County School District #2 Series B, 5% 2/1/05 (FGIC Insured) | | 1,000 | | 1,041 |
Municipal Bonds - continued |
| Principal
Amount (000s) | | Value (Note 1)
(000s) |
South Carolina - continued |
Rock Hill Util. Sys. Rev. Series 2003 A: | | | | |
5% 1/1/08 (FSA Insured) | | $ 1,850 | | $ 2,042 |
5% 1/1/09 (FSA Insured) | | 1,945 | | 2,173 |
South Carolina Pub. Svc. Auth. Rev.: | | | | |
Series 2002 A: | | | | |
5% 1/1/05 (FSA Insured) | | 2,000 | | 2,076 |
5% 1/1/06 (FSA Insured) | | 1,705 | | 1,819 |
5% 1/1/07 (FSA Insured) | | 4,105 | | 4,474 |
Series A, 5.5% 1/1/11 (MBIA Insured) | | 3,000 | | 3,428 |
Series D: | | | | |
5% 1/1/06 | | 2,500 | | 2,664 |
5% 1/1/07 | | 5,000 | | 5,436 |
| | 33,636 |
Tennessee - 1.8% |
Elizabethton Health & Edl. Facilities Board Rev. (First Mtg. Prog.) 6% 7/1/11 (MBIA Insured) | | 2,005 | | 2,372 |
Memphis Gen. Oblig. 6% 11/1/06 | | 1,585 | | 1,767 |
Memphis-Shelby County Arpt. Auth. Arpt. Rev.: | | | | |
Series A: | | | | |
4% 9/1/06 (MBIA Insured) | | 1,500 | | 1,582 |
4.5% 9/1/08 (MBIA Insured) | | 1,620 | | 1,763 |
4.5% 9/1/09 (MBIA Insured) | | 1,685 | | 1,840 |
4% 9/1/05 (MBIA Insured) | | 1,445 | | 1,507 |
Metro. Nashville Arpt. Auth. Rev. Series C, 5% 7/1/06 (FGIC Insured) (e) | | 1,675 | | 1,792 |
Shelby County Gen. Oblig. Series A: | | | | |
0% 5/1/10 (Pre-Refunded to 5/1/05 @ 74.444) (f) | | 15,750 | | 11,517 |
0% 5/1/12 (Pre-Refunded to 5/1/05 @ 65.1568) (f) | | 15,130 | | 9,684 |
| | 33,824 |
Texas - 14.0% |
Arlington Independent School District 0% 2/15/16 (Pre-Refunded to 2/15/05 @ 51.4017) (f) | | 6,820 | | 3,455 |
Austin Arpt. Sys. Rev. Series A: | | | | |
6.5% 11/15/04 (MBIA Insured) (e) | | 3,215 | | 3,362 |
6.5% 11/15/05 (Escrowed to Maturity) (e)(f) | | 940 | | 1,026 |
6.5% 11/15/05 (MBIA Insured) (e) | | 6,870 | | 7,452 |
Austin Gen. Oblig. 5.5% 9/1/15 (Pre-Refunded to 9/1/05 @ 100) (f) | | 3,380 | | 3,608 |
Austin Util. Sys. Rev.: | | | | |
Series 1992 A, 0% 11/15/09 (MBIA Insured) | | 4,130 | | 3,438 |
Municipal Bonds - continued |
| Principal
Amount (000s) | | Value (Note 1)
(000s) |
Texas - continued |
Austin Util. Sys. Rev.: - continued | | | | |
Series A: | | | | |
0% 11/15/10 (MBIA Insured) | | $ 3,100 | | $ 2,448 |
5.5% 11/15/06 | | 5,000 | | 5,123 |
Birdville Independent School District 5% 2/15/10 | | 1,300 | | 1,453 |
Brazos River Auth. Poll. Cont. Rev. (Texas Utils. Elec. Co. Proj.) Series 1995 B, 5.05%, tender 6/19/06 (b)(e) | | 6,500 | | 6,810 |
Corpus Christi Gen. Oblig.: | | | | |
4% 3/1/05 (FSA Insured) | | 1,200 | | 1,238 |
4% 3/1/06 (FSA Insured) | | 1,285 | | 1,349 |
5% 3/1/07 (FSA Insured) | | 2,735 | | 2,983 |
Corpus Christi Util. Sys. Rev. 3% 7/15/05 (FSA Insured) | | 1,285 | | 1,317 |
Cypress-Fairbanks Independent School District: | | | | |
Series B, 0% 8/1/07 (AMBAC Insured) | | 10,000 | | 9,132 |
4.5% 2/15/06 | | 2,245 | | 2,377 |
5% 2/15/08 | | 2,000 | | 2,211 |
5% 2/15/10 | | 1,300 | | 1,453 |
5% 2/15/11 | | 4,940 | | 5,532 |
Deer Park Independent School District 6% 2/15/05 | | 2,000 | | 2,106 |
El Paso Wtr. & Swr. Rev.: | | | | |
5% 3/1/06 (AMBAC Insured) | | 1,000 | | 1,071 |
5% 3/1/07 (AMBAC Insured) | | 2,000 | | 2,183 |
5% 3/1/08 (AMBAC Insured) | | 2,770 | | 3,060 |
Fort Worth Gen. Oblig. Series A: | | | | |
5% 3/1/05 | | 1,000 | | 1,043 |
5% 3/1/06 | | 1,000 | | 1,071 |
Frisco Gen. Oblig.: | | | | |
Series 2003 A: | | | | |
4% 2/15/07 (FSA Insured) | | 1,320 | | 1,400 |
4% 2/15/08 (FSA Insured) | | 1,145 | | 1,221 |
5% 2/15/10 (FSA Insured) | | 1,710 | | 1,912 |
4% 2/15/06 (FSA Insured) | | 2,975 | | 3,119 |
4% 2/15/07 (FSA Insured) | | 3,115 | | 3,305 |
Garland Independent School District: | | | | |
Series A: | | | | |
4% 2/15/05 | | 1,000 | | 1,031 |
4% 2/15/06 | | 500 | | 524 |
0% 2/15/07 | | 1,610 | | 1,494 |
Harris County Gen. Oblig. Series A, 0% 8/15/07 (FGIC Insured) | | 4,400 | | 4,014 |
Municipal Bonds - continued |
| Principal
Amount (000s) | | Value (Note 1)
(000s) |
Texas - continued |
Harris County Health Facilities Dev. Corp. Rev. (Saint Luke's Episcopal Hosp. Proj.) Series 2001 A, 5.5% 2/15/09 | | $ 3,710 | | $ 4,080 |
Houston Gen. Oblig.: | | | | |
Series A, 5% 3/1/05 | | 8,800 | | 9,177 |
Series A1, 5% 3/1/11 (MBIA Insured) | | 3,335 | | 3,737 |
5% 3/1/09 (MBIA Insured) | | 1,700 | | 1,898 |
Houston Wtr. & Swr. Sys. Rev. Series B: | | | | |
5.5% 12/1/07 (AMBAC Insured) | | 5,455 | | 6,138 |
5.5% 12/1/08 (AMBAC Insured) | | 6,000 | | 6,830 |
Killeen Independent School District 4% 2/15/08 | | 1,200 | | 1,280 |
La Porte Independent School District 4% 2/15/08 | | 2,000 | | 2,133 |
Lewisville Gen. Oblig. 4% 2/15/06 (FSA Insured) | | 1,300 | | 1,363 |
McKinney Independent School District 5% 2/15/05 | | 2,280 | | 2,376 |
Mesquite Independent School District Series A, 0% 8/15/06 | | 1,115 | | 1,056 |
New Braunfels Independent School District 0% 2/1/07 | | 2,000 | | 1,858 |
North East Texas Independent School District 7% 2/1/11 | | 3,600 | | 4,402 |
North Texas Tollway Auth. Dallas North Tollway Sys. Rev. Series C: | | | | |
5% 1/1/09 (FSA Insured) | | 2,000 | | 2,219 |
5%, tender 7/1/08 (FSA Insured) (b) | | 2,650 | | 2,931 |
Northside Independent School District Series B, 2.45%, tender 8/1/06 (Liquidity Facility Dexia Cr. Local de France) (b) | | 7,500 | | 7,504 |
Pasadena Independent School District 5% 2/15/05 | | 11,445 | | 11,926 |
Port Houston Auth. Harris County 6% 10/1/06 (FGIC Insured) (e) | | 2,000 | | 2,212 |
Red River Ed. Fin. Corp. Ed. Rev. (Texas Christian Univ. Proj.) Series 2001, 3.25%, tender 3/1/04 (b) | | 6,000 | | 6,019 |
Rockwall Independent School District: | | | | |
4% 2/15/05 | | 1,155 | | 1,191 |
4% 2/15/06 | | 2,370 | | 2,485 |
5% 2/15/07 | | 3,510 | | 3,829 |
5% 2/15/08 | | 3,825 | | 4,229 |
5% 2/15/09 | | 4,690 | | 5,231 |
San Antonio Elec. & Gas Systems Rev.: | | | | |
Series 1991 A, 0% 2/1/05 (Escrowed to Maturity) (f) | | 1,000 | | 986 |
Series 2000 A, 5.75% 2/1/15 (Pre-Refunded to 2/1/10 @ 100) (f) | | 5,000 | | 5,806 |
5.25% 2/1/07 | | 2,500 | | 2,736 |
5.25% 2/1/08 | | 1,000 | | 1,111 |
Texas A&M Univ. Rev. 5.75% 5/15/05 | | 3,000 | | 3,178 |
Municipal Bonds - continued |
| Principal
Amount (000s) | | Value (Note 1)
(000s) |
Texas - continued |
Texas Gen. Oblig.: | | | | |
(College Student Ln. Prog.): | | | | |
5% 8/1/06 (e) | | $ 6,770 | | $ 7,232 |
5% 8/1/11 (e) | | 3,000 | | 3,243 |
Series C, 0% 4/1/08 (Escrowed to Maturity) (f) | | 3,100 | | 2,776 |
Texas Pub. Fin. Auth. Bldg. Rev.: | | | | |
(Dept. of Criminal Justice Prog.) Series A, 5% 2/1/07 (FSA Insured) | | 2,000 | | 2,178 |
0% 2/1/05 (MBIA Insured) | | 3,725 | | 3,672 |
Texas State Univ. Sys. Fing. Rev. 3% 3/15/05 (FSA Insured) | | 1,830 | | 1,868 |
Texas Tech Univ. Revs. Ninth Series: | | | | |
4% 2/15/09 (AMBAC Insured) | | 1,460 | | 1,554 |
5% 2/15/11 (AMBAC Insured) | | 1,250 | | 1,398 |
Trinity River Auth. Red Oak Creek Sys. Rev. 3.5% 2/1/06 (FSA Insured) | | 1,270 | | 1,318 |
Trinity River Auth. Reg'l. Wastewtr. Sys. Rev.: | | | | |
5% 8/1/06 (MBIA Insured) | | 4,000 | | 4,320 |
5% 8/1/07 (MBIA Insured) | | 1,595 | | 1,751 |
Tyler Health Facilities Dev. Corp. Hosp. Rev. (Mother Frances Hosp. Reg'l. Health Care Ctr. Proj.): | | | | |
4% 7/1/05 | | 1,800 | | 1,848 |
4.5% 7/1/06 | | 1,220 | | 1,269 |
5% 7/1/07 | | 1,000 | | 1,057 |
Univ. of Houston Univ. Revs. Series A: | | | | |
3.5% 2/15/06 (FSA Insured) | | 4,955 | | 5,144 |
3.75% 2/15/07 (FSA Insured) | | 5,100 | | 5,369 |
4% 2/15/08 (FSA Insured) | | 5,265 | | 5,605 |
Webb County Gen. Oblig.: | | | | |
5% 2/15/04 (FGIC Insured) | | 705 | | 708 |
5% 2/15/05 (FGIC Insured) | | 1,005 | | 1,047 |
5% 2/15/06 (FGIC Insured) | | 1,055 | | 1,128 |
5% 2/15/07 (FGIC Insured) | | 1,110 | | 1,211 |
5% 2/15/08 (FGIC Insured) | | 1,170 | | 1,294 |
Wichita Falls Independent School District 0% 2/1/10 | | 2,325 | | 1,892 |
| | 263,124 |
Utah - 1.0% |
Box Elder County School District 5% 6/15/05 | | 3,620 | | 3,812 |
Salt Lake City School District Series A, 6.25% 3/1/13 (Pre-Refunded to 3/1/05 @ 100) (f) | | 3,695 | | 3,912 |
Municipal Bonds - continued |
| Principal
Amount (000s) | | Value (Note 1)
(000s) |
Utah - continued |
Salt Lake County Wtr. Conservancy District Rev. Series A: | | | | |
0% 10/1/11 (AMBAC Insured) | | $ 3,800 | | $ 2,872 |
0% 10/1/12 (AMBAC Insured) | | 3,800 | | 2,723 |
0% 10/1/13 (AMBAC Insured) | | 3,760 | | 2,565 |
Utah Muni. Pwr. Agcy. Elec. Sys. Rev. Series A, 4% 7/1/05 (AMBAC Insured) | | 1,000 | | 1,038 |
Utah Trans. Auth. Sales Tax Rev. Series A, 5% 6/15/05 (FSA Insured) | | 1,550 | | 1,629 |
| | 18,551 |
Virginia - 0.1% |
Virginia Commonwealth Trans. Board Trans. Rev. (U.S. Route 58 Corridor Dev. Prog.) Series B, 5.375% 5/15/12 | | 1,800 | | 2,036 |
Washington - 7.7% |
Clark County Pub. Util. District #1 Elec. Rev.: | | | | |
Series B: | | | | |
5% 1/1/06 (FSA Insured) | | 1,375 | | 1,465 |
5% 1/1/07 (FSA Insured) | | 1,395 | | 1,516 |
5.25% 1/1/08 (FSA Insured) | | 1,515 | | 1,683 |
5.25% 1/1/09 (FSA Insured) | | 1,595 | | 1,788 |
5% 1/1/11 (MBIA Insured) | | 1,680 | | 1,876 |
Energy Northwest Elec. Rev. (#3 Proj.) Series B, 6% 7/1/16 (AMBAC Insured) | | 5,000 | | 5,789 |
King & Snohomish Counties School District #417 Northshore: | | | | |
5.5% 12/1/14 (FSA Insured) | | 6,300 | | 7,173 |
5.75% 12/1/15 (FSA Insured) | | 2,500 | | 2,874 |
King County Swr. Rev. Series B: | | | | |
5% 1/1/05 (FSA Insured) | | 2,000 | | 2,076 |
5% 1/1/06 (FSA Insured) | | 3,000 | | 3,196 |
5% 1/1/07 (FSA Insured) | | 5,000 | | 5,434 |
5.25% 1/1/08 (FSA Insured) | | 3,500 | | 3,888 |
Port of Seattle Rev.: | | | | |
Series B: | | | | |
5.25% 9/1/06 (FGIC Insured) (e) | | 2,330 | | 2,518 |
5.5% 2/1/06 (MBIA Insured) (e) | | 4,250 | | 4,554 |
5.5% 2/1/07 (MBIA Insured) (e) | | 5,775 | | 6,321 |
Series D, 5.75% 11/1/15 (FGIC Insured) (e) | | 3,640 | | 4,067 |
Seattle Muni. Lt. & Pwr. Rev. 5.25% 3/1/07 (FSA Insured) | | 1,690 | | 1,858 |
Municipal Bonds - continued |
| Principal
Amount (000s) | | Value (Note 1)
(000s) |
Washington - continued |
Snohomish County Pub. Hosp. District #2 (Stevens Health Care Proj.): | | | | |
4% 12/1/05 (FGIC Insured) | | $ 1,570 | | $ 1,639 |
4.5% 12/1/09 (FGIC Insured) | | 1,000 | | 1,089 |
Washington Gen. Oblig.: | | | | |
Series 2001 RA, 5.25% 9/1/06 | | 11,750 | | 12,772 |
Series A: | | | | |
3.5% 1/1/06 (MBIA Insured) | | 12,500 | | 12,944 |
4% 1/1/08 (MBIA Insured) | | 33,175 | | 35,347 |
5.5% 7/1/11 | | 3,500 | | 3,987 |
Series C, 5% 1/1/08 (FSA Insured) | | 8,320 | | 9,180 |
Washington Pub. Pwr. Supply Sys. Nuclear Proj. #2 Rev. Series A, 5.75% 7/1/08 | | 3,000 | | 3,397 |
Washington Pub. Pwr. Supply Sys. Nuclear Proj. #3 Rev. Series C, 5% 7/1/06 (FSA Insured) | | 5,000 | | 5,394 |
| | 143,825 |
Wisconsin - 1.3% |
Wisconsin Clean Wtr. Rev. Series 2, 5% 6/1/05 (MBIA Insured) | | 4,840 | | 5,084 |
Wisconsin Health & Edl. Facilities Auth. Rev.: | | | | |
(Hosp. Sisters Svcs., Inc. Proj.) Series 2003 B, 4%, tender 12/1/06 (FSA Insured) (b) | | 15,000 | | 15,716 |
(Wheaton Franciscan Svcs., Inc. Proj.) Series A: | | | | |
5% 8/15/09 | | 1,000 | | 1,079 |
5% 8/15/10 | | 1,870 | | 2,001 |
| | 23,880 |
TOTAL MUNICIPAL BONDS (Cost $1,772,670) | 1,816,236 |
Municipal Notes - 2.5% |
| | | |
Kansas - 0.3% |
Wichita Solid Waste Disp. Rev. (Weyerhaeuser Co. Proj.) 2.23%, VRDN (b)(e) | 4,950 | | 4,950 |
Massachusetts - 1.7% |
Acton & Boxborough Reg'l. School District BAN 3.5% 4/1/05 | 8,000 | | 8,216 |
Lynnfield Gen. Oblig. BAN 2.5% 3/1/05 | 24,000 | | 24,342 |
| | 32,558 |
Municipal Notes - continued |
| Principal
Amount (000s) | | Value (Note 1)
(000s) |
Oklahoma - 0.3% |
Southeastern Oklahoma Indl. Auth. Solid Waste Disp. Rev. (Weyerhaeuser Co. Proj.) Series 2000 A, 2.1%, VRDN (b)(e) | $ 6,000 | | $ 6,000 |
Oregon - 0.2% |
Lane County Swr. Disp. Rev. (Weyerhauser Co. Proj.) 2.23%, VRDN (b)(e) | 4,200 | | 4,200 |
TOTAL MUNICIPAL NOTES (Cost $47,669) | 47,708 |
Money Market Funds - 0.8% |
| Shares | | |
Fidelity Municipal Cash Central Fund, 1.3% (c)(d)
(Cost $14,115) | 14,115,000 | | 14,115 |
TOTAL INVESTMENT PORTFOLIO - 100.2% (Cost $1,834,454) | | 1,878,059 |
NET OTHER ASSETS - (0.2)% | | (3,707) |
NET ASSETS - 100% | $ 1,874,352 |
Security Type Abbreviations |
BAN - BOND ANTICIPATION NOTE |
VRDN - VARIABLE RATE DEMAND NOTE |
Legend |
(a) Security or a portion of the security purchased on a delayed delivery or when-issued basis. |
(b) The coupon rate shown on floating or adjustable rate securities represents the rate at period end. |
(c) Information in this report regarding holdings by state and security types does not reflect the holdings of the Fidelity Municipal Cash Central Fund. |
(d) The rate quoted is the annualized seven-day yield of the fund at period end. A complete listing of the fund's holdings as of its most recent fiscal year end is available upon request. |
(e) Private activity obligations whose interest is subject to the federal alternative minimum tax for individuals. |
(f) Security collateralized by an amount sufficient to pay interest and principal. |
(g) Restricted securities - Investment in securities not registered under the Securities Act of 1933 (excluding 144A issues). At the end of the period, the value of restricted securities (excluding 144A issues) amounted to $10,223,000 or 0.5% of net assets. |
Additional information on each holding is as follows: |
Security | Acquisition
Date | Acquisition
Cost (000s) |
Univ. of California Revs. (UCLA Med. Ctr. Proj.) 4.55% 12/1/09 | 3/6/02 | $ 9,600 |
Other Information |
The distribution of municipal securities by revenue source, as a percentage of total net assets, is as follows: |
General Obligations | 45.3% |
Electric Utilities | 15.1 |
Transportation | 9.3 |
Escrowed/Pre-Refunded | 6.2 |
Water & Sewer | 6.0 |
Health Care | 5.8 |
Education | 5.4 |
Others* (individually less than 5%) | 6.9 |
| 100.0% |
*Includes cash equivalents and net other assets |
Purchases and sales of securities, other than short-term securities, aggregated $815,297,000 and $610,795,000, respectively. |
Income Tax Information |
The fund hereby designates approximately $12,640,000 as a capital gain dividend for the purpose of the dividend paid deduction. |
See accompanying notes which are an integral part of the financial statements.
Annual Report
Financial Statements
Statement of Assets and Liabilities
Amounts in thousands (except per-share amounts) | December 31, 2003 |
| | |
Assets | | |
Investment in securities, at value (cost $1,834,454) - See accompanying schedule | | $ 1,878,059 |
Cash | | 92 |
Receivable for fund shares sold | | 3,158 |
Interest receivable | | 24,458 |
Prepaid expenses | | 11 |
Total assets | | 1,905,778 |
| | |
Liabilities | | |
Payable for investments purchased
Regular delivery | $ 12 | |
Delayed delivery | 27,159 | |
Payable for fund shares redeemed | 2,597 | |
Distributions payable | 869 | |
Accrued management fee | 585 | |
Distribution fees payable | 11 | |
Other affiliated payables | 145 | |
Other payables and accrued expenses | 48 | |
Total liabilities | | 31,426 |
| | |
Net Assets | | $ 1,874,352 |
Net Assets consist of: | | |
Paid in capital | | $ 1,829,370 |
Undistributed net investment income | | 351 |
Accumulated undistributed net realized gain (loss) on investments | | 1,026 |
Net unrealized appreciation (depreciation) on investments | | 43,605 |
Net Assets | | $ 1,874,352 |
See accompanying notes which are an integral part of the financial statements.
Annual Report
Financial Statements - continued
Statement of Assets and Liabilities - continued
Amounts in thousands (except per-share amounts) | December 31, 2003 |
| | |
Calculation of Maximum Offering Price
Class A:
Net Asset Value and redemption price per share
($9,104 ÷ 867 shares) | | $ 10.50 |
| | |
Maximum offering price per share (100/96.25 of $10.50) | | $ 10.91 |
Class T:
Net Asset Value and redemption price per share ($12,104 ÷ 1,155 shares) | | $ 10.48 |
| | |
Maximum offering price per share (100/97.25 of $10.48) | | $ 10.78 |
Class B:
Net Asset Value and offering price per share
($2,455 ÷ 234 shares) A | | $ 10.49 |
| | |
Class C:
Net Asset Value and offering price per share
($7,584.1 ÷ 723.39 shares) A | | $ 10.48 |
| | |
Spartan Short-Intermediate Municipal Income:
Net Asset Value, offering price and redemption price per share ($1,842,691 ÷ 175,754 shares) | | $ 10.48 |
| | |
Institutional Class:
Net Asset Value, offering price and redemption price per share ($414.3 ÷ 39.511 shares) | | $ 10.49 |
A Redemption price per share is equal to net asset value less any applicable contingent deferred sales charge.
See accompanying notes which are an integral part of the financial statements.
Annual Report
Statement of Operations
Amounts in thousands | Year ended December 31, 2003 |
| | |
Investment Income | | |
Interest | | $ 56,981 |
| | |
Expenses | | |
Management fee | $ 6,841 | |
Transfer agent fees | 1,292 | |
Distribution fees | 36 | |
Accounting fees and expenses | 414 | |
Non-interested trustees' compensation | 9 | |
Custodian fees and expenses | 29 | |
Registration fees | 179 | |
Audit | 55 | |
Legal | 27 | |
Miscellaneous | 7 | |
Total expenses before reductions | 8,889 | |
Expense reductions | (308) | 8,581 |
Net investment income (loss) | | 48,400 |
Realized and Unrealized Gain (Loss) Net realized gain (loss) on: | | |
Investment securities | 14,019 | |
Swap agreements | (1,302) | |
Total net realized gain (loss) | | 12,717 |
Change in net unrealized appreciation (depreciation) on: Investment securities | (8,702) | |
Swap agreements | 131 | |
Total change in net unrealized appreciation (depreciation) | | (8,571) |
Net gain (loss) | | 4,146 |
Net increase (decrease) in net assets resulting from operations | | $ 52,546 |
See accompanying notes which are an integral part of the financial statements.
Annual Report
Financial Statements - continued
Statement of Changes in Net Assets
Amounts in thousands | Year ended
December 31,
2003 | Year ended
December 31,
2002 |
Increase (Decrease) in Net Assets | | |
Operations | | |
Net investment income (loss) | $ 48,400 | $ 44,777 |
Net realized gain (loss) | 12,717 | 10,257 |
Change in net unrealized appreciation (depreciation) | (8,571) | 30,522 |
Net increase (decrease) in net assets resulting
from operations | 52,546 | 85,556 |
Distributions to shareholders from net investment income | (48,268) | (44,681) |
Distributions to shareholders from net realized gain | (12,396) | (9,372) |
Total distributions | (60,664) | (54,053) |
Share transactions - net increase (decrease) | 199,628 | 467,957 |
Redemption fees | 43 | 66 |
Total increase (decrease) in net assets | 191,553 | 499,526 |
| | |
Net Assets | | |
Beginning of period | 1,682,799 | 1,183,273 |
End of period (including undistributed net investment income of $351 and undistributed net investment income of $238, respectively) | $ 1,874,352 | $ 1,682,799 |
See accompanying notes which are an integral part of the financial statements.
Annual Report
Financial Highlights - Class A
Years ended December 31, | 2003 F |
Selected Per-Share Data | |
Net asset value, beginning of period | $ 10.49 |
Income from Investment Operations | |
Net investment income (loss) E | .115 |
Net realized and unrealized gain (loss) | .071 |
Total from investment operations | .186 |
Distributions from net investment income | (.111) |
Distributions from net realized gain | (.065) |
Total distributions | (.176) |
Redemption fees added to paid in capitalE | - H |
Net asset value, end of period | $ 10.50 |
Total Return B, C, D | 1.78% |
Ratios to Average Net Assets G | |
Expenses before expense reductions | .65% A |
Expenses net of voluntary waivers, if any | .65% A |
Expenses net of all reductions | .64% A |
Net investment income (loss) | 2.52% A |
Supplemental Data | |
Net assets, end of period (in millions) | $ 9 |
Portfolio turnover rate | 34% |
A Annualized
B Total returns for periods of less than one year are not annualized.
C Total returns would have been lower had certain expenses not been reduced during the periods shown.
D Total returns do not include the effect of the sales charges.
E Calculated based on average shares outstanding during the period.
F For the period July 23, 2003 (commencement of sale of shares) to December 31, 2003.
G Expense ratios reflect operating expenses of the class. Expenses before reductions do not reflect amounts reimbursed by the investment adviser or reductions from brokerage service arrangements or other expense offset arrangements and do not represent the amount paid by the class during periods when reimbursements or reductions occur. Expense ratios before reductions for start-up periods may not be representative of longer-term operating periods. Expenses net of any voluntary waivers reflect expenses after reimbursement by the investment adviser but prior to reductions from brokerage service arrangements or other expense offset arrangements. Expenses net of all reductions represent the net expenses paid by the class.
H Amount represents less than .001 per share.
See accompanying notes which are an integral part of the financial statements.
Annual Report
Financial Highlights - Class T
Years ended December 31, | 2003 F |
Selected Per-Share Data | |
Net asset value, beginning of period | $ 10.49 |
Income from Investment Operations | |
Net investment income (loss) E | .110 |
Net realized and unrealized gain (loss) | .050 |
Total from investment operations | .160 |
Distributions from net investment income | (.105) |
Distributions from net realized gain | (.065) |
Total distributions | (.170) |
Redemption fees added to paid in capitalE | - H |
Net asset value, end of period | $ 10.48 |
Total Return B, C, D | 1.54% |
Ratios to Average Net Assets G | |
Expenses before expense reductions | .77% A |
Expenses net of voluntary waivers, if any | .77% A |
Expenses net of all reductions | .76% A |
Net investment income (loss) | 2.41% A |
Supplemental Data | |
Net assets, end of period (in millions) | $ 12 |
Portfolio turnover rate | 34% |
A Annualized
B Total returns for periods of less than one year are not annualized.
C Total returns would have been lower had certain expenses not been reduced during the periods shown.
D Total returns do not include the effect of the sales charges.
E Calculated based on average shares outstanding during the period.
F For the period July 23, 2003 (commencement of sale of shares) to December 31, 2003.
G Expense ratios reflect operating expenses of the class. Expenses before reductions do not reflect amounts reimbursed by the investment adviser or reductions from brokerage service arrangements or other expense offset arrangements and do not represent the amount paid by the class during periods when reimbursements or reductions occur. Expense ratios before reductions for start-up periods may not be representative of longer-term operating periods. Expenses net of any voluntary waivers reflect expenses after reimbursement by the investment adviser but prior to reductions from brokerage service arrangements or other expense offset arrangements. Expenses net of all reductions represent the net expenses paid by the class.
H Amount represents less than .001 per share.
See accompanying notes which are an integral part of the financial statements.
Annual Report
Financial Highlights - Class B
Years ended December 31, | 2003 F |
Selected Per-Share Data | |
Net asset value, beginning of period | $ 10.49 |
Income from Investment Operations | |
Net investment income (loss) E | .081 |
Net realized and unrealized gain (loss) | .059 |
Total from investment operations | .140 |
Distributions from net investment income | (.075) |
Distributions from net realized gain | (.065) |
Total distributions | (.140) |
Redemption fees added to paid in capitalE | - H |
Net asset value, end of period | $ 10.49 |
Total Return B, C, D | 1.34% |
Ratios to Average Net Assets G | |
Expenses before expense reductions | 1.40% A |
Expenses net of voluntary waivers, if any | 1.40% A |
Expenses net of all reductions | 1.39% A |
Net investment income (loss) | 1.78% A |
Supplemental Data | |
Net assets, end of period (in millions) | $ 2 |
Portfolio turnover rate | 34% |
A Annualized
B Total returns for periods of less than one year are not annualized.
C Total returns would have been lower had certain expenses not been reduced during the periods shown.
D Total returns do not include the effect of the contingent deferred sales charge.
E Calculated based on average shares outstanding during the period.
F For the period July 23, 2003 (commencement of sale of shares) to December 31, 2003.
G Expense ratios reflect operating expenses of the class. Expenses before reductions do not reflect amounts reimbursed by the investment adviser or reductions from brokerage service arrangements or other expense offset arrangements and do not represent the amount paid by the class during periods when reimbursements or reductions occur. Expense ratios before reductions for start-up periods may not be representative of longer-term operating periods. Expenses net of any voluntary waivers reflect expenses after reimbursement by the investment adviser but prior to reductions from brokerage service arrangements or other expense offset arrangements. Expenses net of all reductions represent the net expenses paid by the class.
H Amount represents less than .001 per share.
See accompanying notes which are an integral part of the financial statements.
Annual Report
Financial Highlights - Class C
Years ended December 31, | 2003 F |
Selected Per-Share Data | |
Net asset value, beginning of period | $ 10.49 |
Income from Investment Operations | |
Net investment income (loss) E | .077 |
Net realized and unrealized gain (loss) | .048 |
Total from investment operations | .125 |
Distributions from net investment income | (.070) |
Distributions from net realized gain | (.065) |
Total distributions | (.135) |
Redemption fees added to paid in capitalE | - H |
Net asset value, end of period | $ 10.48 |
Total Return B, C, D | 1.20% |
Ratios to Average Net Assets G | |
Expenses before expense reductions | 1.50% A |
Expenses net of voluntary waivers, if any | 1.50% A |
Expenses net of all reductions | 1.49% A |
Net investment income (loss) | 1.67% A |
Supplemental Data | |
Net assets, end of period (in millions) | $ 8 |
Portfolio turnover rate | 34% |
A Annualized
B Total returns for periods of less than one year are not annualized.
C Total returns would have been lower had certain expenses not been reduced during the periods shown.
D Total returns do not include the effect of the contingent deferred sales charge.
E Calculated based on average shares outstanding during the period.
F For the period July 23, 2003 (commencement of sale of shares) to December 31, 2003.
G Expense ratios reflect operating expenses of the class. Expenses before reductions do not reflect amounts reimbursed by the investment adviser or reductions from brokerage service arrangements or other expense offset arrangements and do not represent the amount paid by the class during periods when reimbursements or reductions occur. Expense ratios before reductions for start-up periods may not be representative of longer-term operating periods. Expenses net of any voluntary waivers reflect expenses after reimbursement by the investment adviser but prior to reductions from brokerage service arrangements or other expense offset arrangements. Expenses net of all reductions represent the net expenses paid by the class.
H Amount represents less than .001 per share.
See accompanying notes which are an integral part of the financial statements.
Annual Report
Financial Highlights - Spartan Short-Intermediate Municipal Income
Years ended December 31, | 2003 | 2002 | 2001 | 2000 F | 2000 H | 1999 H |
Selected Per-Share Data | | | | | |
Net asset value,
beginning of period | $ 10.52 | $ 10.27 | $ 10.12 | $ 10.03 | $ 10.00 | $ 10.15 |
Income from Investment Operations | | | | | | |
Net investment income (loss) | .283 D | .336 D | .396 D, G | .139 D | .399 D | .395 |
Net realized and unrealized gain (loss) | .030 | .317 | .173 G | .092 | .034 | (.150) |
Total from investment operations | .313 | .653 | .569 | .231 | .433 | .245 |
Distributions from net investment income | (.283) | (.339) | (.396) | (.140) | (.400) | (.395) |
Distributions from net realized gain | (.070) | (.064) | (.023) | (.001) | - | - |
Distributions in excess of net realized gain | - | - | - | - | (.003) | - |
Total distributions | (.353) | (.403) | (.419) | (.141) | (.403) | (.395) |
Redemption fees added to paid in capital | -D, I | -D, I | -D, I | - | - | - |
Net asset value,
end of period | $ 10.48 | $ 10.52 | $ 10.27 | $ 10.12 | $ 10.03 | $ 10.00 |
Total Return B, C | 3.01% | 6.47% | 5.70% | 2.32% | 4.45% | 2.44% |
Ratios to Average Net Assets E | | | | | |
Expenses before expense reductions | .49% | .49% | .49% | .49% A | .55% | .55% |
Expenses net of voluntary waivers, if any | .49% | .49% | .49% | .49% A | .54% | .55% |
Expenses net of all reductions | .47% | .45% | .41% | .45% A | .54% | .55% |
Net investment income (loss) | 2.69% | 3.23% | 3.85% G | 4.17% A | 4.02% | 3.89% |
Supplemental Data | | | | | | |
Net assets, end of period (in millions) | $ 1,843 | $ 1,683 | $ 1,183 | $ 965 | $ 904 | $ 698 |
Portfolio turnover rate | 34% | 38% | 43% | 106% A | 53% | 66% |
A Annualized
B Total returns for periods of less than one year are not annualized.
C Total returns would have been lower had certain expenses not been reduced during the periods shown.
D Calculated based on average shares outstanding during the period.
E Expense ratios reflect operating expenses of the class. Expenses before reductions do not reflect amounts reimbursed by the investment adviser or reductions from brokerage service arrangements or other expense offset arrangements and do not represent the amount paid by the class during periods when reimbursements or reductions occur. Expenses net of any voluntary waivers reflect expenses after reimbursement by the investment adviser but prior to reductions from brokerage service arrangements or other expense offset arrangements. Expenses net of all reductions represent the net expenses paid by the class.
F For the four months ended December 31.
G Effective January 1, 2001, the fund adopted the provisions of the AICPA Audit and Accounting Guide for Investment Companies and began amortizing premium and discount on all debt securities. Per-share data and ratios for periods prior to adoption have not been restated to reflect this change.
H For the year ended August 31.
I Amount represents less than .001 per share.
See accompanying notes which are an integral part of the financial statements.
Annual Report
Financial Highlights - Institutional Class
Years ended December 31, | 2003 E |
Selected Per-Share Data | |
Net asset value, beginning of period | $ 10.49 |
Income from Investment Operations | |
Net investment income (loss) D | .125 |
Net realized and unrealized gain (loss) | .059 |
Total from investment operations | .184 |
Distributions from net investment income | (.119) |
Distributions from net realized gain | (.065) |
Total distributions | (.184) |
Redemption fees added to paid in capitalD | - G |
Net asset value, end of period | $ 10.49 |
Total Return B, C | 1.77% |
Ratios to Average Net Assets F | |
Expenses before expense reductions | .48% A |
Expenses net of voluntary waivers, if any | .48% A |
Expenses net of all reductions | .47% A |
Net investment income (loss) | 2.69% A |
Supplemental Data | |
Net assets, end of period (000 omitted) | $ 414 |
Portfolio turnover rate | 34% |
A Annualized
B Total returns for periods of less than one year are not annualized.
C Total returns would have been lower had certain expenses not been reduced during the periods shown.
D Calculated based on average shares outstanding during the period.
E For the period July 23, 2003 (commencement of sale of shares) to December 31, 2003.
F Expense ratios reflect operating expenses of the class. Expenses before reductions do not reflect amounts reimbursed by the investment adviser or reductions from brokerage service arrangements or other expense offset arrangements and do not represent the amount paid by the class during periods when reimbursements or reductions occur. Expense ratios before reductions for start-up periods may not be representative of longer-term operating periods. Expenses net of any voluntary waivers reflect expenses after reimbursement by the investment adviser but prior to reductions from brokerage service arrangements or other expense offset arrangements. Expenses net of all reductions represent the net expenses paid by the class.
G Amount represents less than .001 per share.
See accompanying notes which are an integral part of the financial statements.
Annual Report
Notes to Financial Statements
For the period ended December 31, 2003
1. Significant Accounting Policies.
Spartan Short-Intermediate Municipal Income Fund (the fund) is a fund of Fidelity Municipal Trust (the trust) and is authorized to issue an unlimited number of shares. The trust is registered under the Investment Company Act of 1940, as amended (the 1940 Act), as an open-end management investment company organized as a Massachusetts business trust.
The fund offers Class A, Class T, Class B, Class C, Spartan Short Intermediate Municipal Income and Institutional Class shares, each of which has equal rights as to assets and voting privileges. Each class has exclusive voting rights with respect to matters that affect that class. The fund commenced sale of Class A, Class T, Class B, Class C and Institutional Class shares on July 23, 2003. Class B shares will automatically convert to Class A shares after a holding period of four years from the initial date of purchase. Investment income, realized and unrealized capital gains and losses, the common expenses of the fund, and certain fund-level expense reductions, if any, are allocated on a pro rata basis to each class based on the relative net assets of each class to the total net assets of the fund. Each class differs with respect to transfer agent and distribution and service plan fees incurred. Certain expense reductions also differ by class.
The financial statements have been prepared in conformity with accounting principles generally accepted in the United States of America, which require management to make certain estimates and assumptions at the date of the financial statements. The following summarizes the significant accounting policies of the fund:
Security Valuation. Net asset value per share (NAV calculation) is calculated as of the close of business of the New York Stock Exchange, normally 4:00 p.m. Eastern time. Debt securities are valued on the basis of information provided by a pricing service. Pricing services use valuation matrices that incorporate both dealer-supplied valuations and valuation models. If an event that is expected to materially affect the value of a security occurs after the close of an exchange or market on which that security trades, but prior to the NAV calculation, then that security will be fair valued taking the event into account. Securities (including restricted securities) for which market quotations are not readily available are valued at their fair value as determined in good faith under consistently applied procedures under the general supervision of the Board of Trustees. Price movements in futures contracts and ADRs, market and trading trends, the bid/ask quotes of brokers and off-exchange institutional trading may be reviewed in the course of making a good faith determination of a security's fair value. Short-term securities with remaining maturities of sixty days or less for which quotations are not readily available are valued on the basis of amortized cost. Investments in open-end investment companies are valued at their net asset value each business day.
Annual Report
Notes to Financial Statements - continued
1. Significant Accounting Policies - continued
Investment Transactions and Income. Security transactions are accounted for as of trade date. Gains and losses on securities sold are determined on the basis of identified cost. Interest income is accrued as earned. Interest income includes coupon interest and amortization of premium and accretion of discount on debt securities, which is accrued using the interest method.
Expenses. Most expenses of the trust can be directly attributed to a fund. Expenses which cannot be directly attributed are apportioned among the funds in the trust.
Income Tax Information and Distributions to Shareholders. Each year, the fund intends to qualify as a regulated investment company by distributing all of its taxable income and realized gains under Subchapter M of the Internal Revenue Code. As a result, no provision for income taxes is required in the accompanying financial statements. Income dividends and capital gain distributions are declared separately for each class. Dividends are declared daily and paid monthly from net investment income. Distributions from realized gains, if any, are recorded on the ex-dividend date.
Income and capital gain distributions are determined in accordance with income tax regulations, which may differ from generally accepted accounting principles. In addition, the fund will treat a portion of the proceeds from shares redeemed as a distribution from net investment income and realized gain for income tax purposes. Capital accounts within the financial statements are adjusted for permanent and temporary book and tax differences. These adjustments have no impact on net assets or the results of operations. Temporary differences will reverse in a subsequent period. These differences are primarily due to short-term capital gains and market discount.
The tax-basis components of distributable earnings and the federal tax cost as of period end were as follows:
Unrealized appreciation | $ 44,793,540 | | |
Unrealized depreciation | (865,706) | |
Net unrealized appreciation (depreciation) | 43,927,834 | |
Undistributed ordinary income | 27,223 | |
Cost for federal income tax purposes | $ 1,834,130,928 | |
The tax character of distributions paid was as follows:
| December 31, 2003 | December 31, 2002 |
Tax-exempt Income | $ 48,268,450 | $ 44,746,408 |
Long-term Capital Gains | 12,396,165 | 9,306,879 |
Total | $ 60,664,615 | $ 54,053,287 |
Annual Report
1. Significant Accounting Policies - continued
Short-Term Trading (Redemption) Fees. Shares held in the fund less than 30 days are subject to a short-term trading fee equal to .50% of the proceeds of the redeemed shares. The fee, which is retained by the fund, is accounted for as an addition to paid in capital.
2. Operating Policies.
Delayed Delivery Transactions and When-Issued Securities. The fund may purchase or sell securities on a delayed delivery or when-issued basis. Payment and delivery may take place after the customary settlement period for that security. The price of the underlying securities and the date when the securities will be delivered and paid for are fixed at the time the transaction is negotiated. During the time a delayed delivery sell is outstanding, the contract is marked-to-market daily and equivalent deliverable securities are held for the transaction. The value of the securities purchased on a delayed delivery or when-issued basis are identified as such in the fund's Schedule of Investments. The fund may receive compensation for interest forgone in the purchase of a delayed delivery or when-issued security. With respect to purchase commitments, the fund identifies securities as segregated in its records with a value at least equal to the amount of the commitment. Losses may arise due to changes in the value of the underlying securities or if the counterparty does not perform under the contract's terms, or if the issuer does not issue the securities due to political, economic, or other factors.
Restricted Securities. The fund may invest in securities that are subject to legal or contractual restrictions on resale. These securities generally may be resold in transactions exempt from registration or to the public if the securities are registered. Disposal of these securities may involve time-consuming negotiations and expense, and prompt sale at an acceptable price may be difficult. Information regarding restricted securities is included at the end of the fund's Schedule of Investments.
Swap Agreements. The fund may invest in swaps for the purpose of managing its exposure to interest rate, credit or market risk.
Interest rate swaps are agreements to exchange cash flows periodically based on a notional principal amount, for example, the exchange of fixed rate interest payments for floating rate interest payments. The primary risk associated with interest rate swaps is that unfavorable changes in the fluctuation of interest rates could adversely impact the fund.
Swaps are marked-to-market daily based on dealer-supplied valuations and changes in value are recorded as unrealized appreciation (depreciation). Gains or losses are realized upon early termination of the swap agreement. Collateral, in the form of cash or securities, may be required to be held in segregated accounts with the fund's custodian in compliance with swap contracts.
Annual Report
Notes to Financial Statements - continued
3. Purchases and Sales of Investments.
Information regarding purchases and sales of securities is included under the caption "Other Information" at the end of the fund's Schedule of Investments.
4. Fees and Other Transactions with Affiliates.
Management Fee. Fidelity Management & Research Company (FMR) and its affiliates provide the fund with investment management related services for which the fund pays a monthly management fee. The management fee is the sum of an individual fund fee rate that is based on an annual rate of .25% of the fund's average net assets and a group fee rate that averaged .13% during the period. The group fee rate is based upon the average net assets of all the mutual funds advised by FMR. The group fee rate decreases as assets under management increase and increases as assets under management decrease. For the period, the total annual management fee rate was .38% of the fund's average net assets.
Distribution and Service Plan. In accordance with Rule 12b-1 of the 1940 Act, the Fund has adopted separate Distribution and Service Plans for each class of shares. Certain classes pay Fidelity Distributors Corporation (FDC), an affiliate of FMR, separate Distribution and Service Fees, each of which is based on an annual percentage of each class' average net assets. In addition, FDC may pay financial intermediaries for selling shares of the fund and providing shareholder support services. For the period, the Distribution and Service Fee rates and the total amounts paid to and retained by FDC were as follows:
| Distribution
Fee | Service
Fee | Paid to
FDC | Retained
by FDC |
Class A | 0% | .15% | $ 2,665 | $ - |
Class T | 0% | .25% | 6,191 | - |
Class B | .65% | .25% | 6,237 | 4,590 |
Class C | .75% | .25% | 20,491 | 18,306 |
| | | $ 35,584 | $ 22,896 |
Sales Load. FDC receives a front-end sales charge of up to 3.75% for selling Class A shares, and 2.75% for selling Class T shares of the fund. FDC receives the proceeds of contingent deferred sales charges levied on Class A, Class T, Class B, and Class C redemptions. These charges depend on the holding period. The deferred sales charges range from 3% to 1% for Class B, 1% for Class C, and .25% for certain purchases of Class A and Class T shares.
For the period, sales charge amounts retained by FDC were as follows:
| Retained
by FDC |
Class A | $ 10,303 |
Class T | 2,690 |
Class B* | - |
Class C* | 1,331 |
| $ 14,324 |
* When Class B and Class C shares are initially sold, FDC pays commissions from its own resources to financial intermediaries through which the sales
are made.
Annual Report
Notes to Financial Statements - continued
4. Fees and Other Transactions with Affiliates - continued
Transfer Agent and Accounting Fees. Citibank, N.A. (Citibank) is the custodian, transfer agent, and shareholder servicing agent for the fund's Class A, Class T, Class B, Class C, Spartan Short Intermediate Municipal Income and Institutional Class shares. Citibank has entered into a sub-arrangement with Fidelity Investments Institutional Operations Company, Inc. (FIIOC), an affiliate of FMR, with respect to all classes of the fund, except for Spartan Short Intermediate Municipal Income, to perform the transfer, dividend disbursing, and shareholder servicing agent functions. Citibank has also entered into a sub-agreement with Fidelity Service Company (FSC), an affiliate of FMR, with respect to Spartan Short Intermediate Municipal Income, to perform the transfer, dividend disbursing, and shareholder servicing agent functions. FIIOC and FSC receive account fees and asset-based fees that vary according to the account size and type of account of the shareholders of the respective classes of the fund. All fees are paid to FIIOC by Citibank, which is reimbursed by each class for such payments. FIIOC and FSC pay for typesetting, printing and mailing of all shareholder reports, except proxy statements. For the period, each class paid the following transfer agent fees:
| Amount | % of
Average
Net Assets |
Class A | $ 1,566 | .09* |
Class T | 2,565 | .10* |
Class B | 575 | .08* |
Class C | 1,852 | .09* |
Spartan Short Intermediate Municipal Income | 1,285,080 | .07 |
Institutional Class | 83 | .06* |
| $ 1,291,721 | |
* Annualized
Citibank also has a sub-contract with Fidelity Service Company, Inc. (FSC), an affiliate of FMR, under which FSC maintains the fund's accounting records. The fee is based on the level of average net assets for the month plus out-of-pocket expenses.
Central Funds. The fund may invest in affiliated Central Funds managed by Fidelity Investments Money Management, Inc. (FIMM), an affiliate of FMR. The Central Funds are open-end investment companies available only to investment companies and other accounts managed by FMR and its affiliates. The Central Funds seek preservation of capital and current income and do not pay a management fee. Income distributions earned by the fund are recorded as income in the accompanying financial statements and totaled $267,679 for the period.
Annual Report
5. Expense Reductions.
FMR voluntarily agreed to reimburse a portion of Spartan Short Intermediate Municipal Income's operating expenses. During the period, this reimbursement reduced the class' expenses by $69,192.
In addition, through arrangements with the fund's custodian and each class' transfer agent, credits realized as a result of uninvested cash balances were used to reduce the fund's expenses. During the period, these credits reduced the fund's custody and accounting expenses by $20,921 and $170,069, respectively. During the period, credits reduced each class' transfer agent expense as noted in the table below.
| Transfer Agent
expense reduction | | |
Class A | $ 48 | |
Class T | 67 | |
Class B | 19 | |
Class C | 53 | |
Spartan Short-Intermediate Municipal Income | 47,919 | |
Institutional Class | 5 | |
| $ 48,111 | |
6. Distributions to Shareholders.
Distributions to shareholders of each class were as follows:
| Years ended December 31, |
| 2003 | 2002 |
From net investment income | | |
Class A | $ 41,170 | $ - |
Class T | 55,194 | - |
Class B | 11,175 | - |
Class C | 30,513 | - |
Spartan Short-Intermediate Municipal Income | 48,127,109 | 44,681,023 |
Institutional Class | 3,289 | - |
Total | $ 48,268,450 | $ 44,681,023 |
From net realized gain | | |
Class A | $ 38,125 | $ - |
Class T | 64,235 | - |
Class B | 14,227 | - |
Class C | 43,979 | - |
Spartan Short-Intermediate Municipal Income | 12,233,045 | 9,372,264 |
Institutional Class | 2,554 | - |
Total | $ 12,396,165 | $ 9,372,264 |
Annual Report
Notes to Financial Statements - continued
7. Share Transactions.
Transactions for each class of shares were as follows:
| Years ended December 31, |
| 2003 | 2002 | 2003 | 2002 |
| Shares | Dollars |
Class A | | | | |
Shares sold | 945,702 | - | $ 9,928,421 | $ - |
Reinvestment of distributions | 5,258 | - | 55,287 | - |
Shares redeemed | (83,727) | - | (881,839) | - |
Net increase (decrease) | 867,233 | - | $ 9,101,869 | $ - |
Class T | | | | |
Shares sold | 1,169,015 | - | $ 12,268,522 | $ - |
Reinvestment of distributions | 7,662 | - | 80,416 | - |
Shares redeemed | (21,964) | - | (231,439) | - |
Net increase (decrease) | 1,154,713 | - | $ 12,117,499 | $ - |
Class B | | | | |
Shares sold | 233,819 | - | $ 2,453,550 | $ - |
Reinvestment of distributions | 1,571 | - | 16,518 | - |
Shares redeemed | (1,490) | - | (15,701) | - |
Net increase (decrease) | 233,900 | - | $ 2,454,367 | $ - |
Class C | | | | |
Shares sold | 776,760 | - | $ 8,149,505 | $ - |
Reinvestment of distributions | 3,424 | - | 35,965 | - |
Shares redeemed | (56,795) | - | (598,264) | - |
Net increase (decrease) | 723,389 | - | $ 7,587,206 | $ - |
Spartan Short-Intermediate Municipal Income | | |
Shares sold | 89,460,531 | 111,439,341 | $ 942,789,927 | $ 1,162,261,393 |
Reinvestment of distributions | 4,591,399 | 4,243,826 | 48,317,099 | 44,278,450 |
Shares redeemed | (78,186,633) | (71,046,928) | (823,154,240) | (738,583,535) |
Net increase (decrease) | 15,865,297 | 44,636,239 | $ 167,952,786 | $ 467,956,308 |
Institutional Class | | | | |
Shares sold | 41,387 | - | $ 434,150 | $ - |
Reinvestment of distributions | 399 | - | 4,193 | - |
Shares redeemed | (2,275) | - | (24,000) | - |
Net increase (decrease) | 39,511 | - | $ 414,343 | $ - |
Annual Report
Report of Independent Auditors
To the Trustees of Fidelity Municipal Trust and the Shareholders of Spartan Short-Intermediate Municipal Income Fund:
In our opinion, the accompanying statement of assets and liabilities, including the schedule of investments, and the related statements of operations and of changes in net assets and the financial highlights present fairly, in all material respects, the financial position of Spartan Short-Intermediate Municipal Income Fund (a fund of Fidelity Municipal Trust) at December 31, 2003 and the results of its operations, the changes in its net assets and the financial highlights for the periods indicated, in conformity with accounting principles generally accepted in the United States of America. These financial statements and financial highlights (hereafter referred to as "financial statements") are the responsibility of the Spartan Short-Intermediate Municipal Income Fund's management; our responsibility is to express an opinion on these financial statements based on our audits. We conducted our audits of these financial statements in accordance with auditing standards generally accepted in the United States of America which require that we plan and perform the audit to obtain reasonable assurance about whether the financial statements are free of material misstatement. An audit includes examining, on a test basis, evidence supporting the amounts and disclosures in the financial statements, assessing the accounting principles used and significant estimates made by management, and evaluating the overall financial statement presentation. We believe that our audits, which included confirmation of securities at December 31, 2003 by correspondence with the custodian and brokers, provide a reasonable basis for our opinion.
/s/PricewaterhouseCoopers LLP
PricewaterhouseCoopers LLP
Boston, Massachusetts
February 20, 2004
Annual Report
Trustees and Officers
The Trustees , Members of the Advisory Board, and executive officers of the trust and fund, as applicable, are listed below. The Board of Trustees governs the fund and is responsible for protecting the interests of shareholders. The Trustees are experienced executives who meet periodically throughout the year to oversee the fund's activities, review contractual arrangements with companies that provide services to the fund, and review the fund's performance. Except for William O. McCoy, each of the Trustees oversees 292 funds advised by FMR or an affiliate. Mr. McCoy oversees 294 funds advised by FMR or an affiliate.
The Trustees hold office without limit in time except that (a) any Trustee may resign; (b) any Trustee may be removed by written instrument, signed by at least two-thirds of the number of Trustees prior to such removal; (c) any Trustee who requests to be retired or who has become incapacitated by illness or injury may be retired by written instrument signed by a majority of the other Trustees; and (d) any Trustee may be removed at any special meeting of shareholders by a two-thirds vote of the outstanding voting securities of the trust. In any event, each non-interested Trustee shall retire not later than the last day of the calendar year in which his or her 72nd birthday occurs. The executive officers and Advisory Board Members hold office without limit in time, except that any officer and Advisory Board Member may resign or may be removed by a vote of a majority of the Trustees at any regular meeting or any special meeting of the Trustees. Except as indicated, each individual has held the office shown or other offices in the same company for the past five years.
The fund's Statement of Additional Information (SAI) includes more information about the Trustees. To request a free copy, call Fidelity at 1-800-544-8544.
Interested Trustees*:
Correspondence intended for each Trustee who is an "interested person" (as defined in the 1940 Act) may be sent to Fidelity Investments, 82 Devonshire Street, Boston, Massachusetts 02109.
Name, Age; Principal Occupation |
Edward C. Johnson 3d (73)** |
| Year of Election or Appointment: 1984 Mr. Johnson is Chairman of the Board of Trustees. Mr. Johnson serves as Chief Executive Officer, Chairman, and a Director of FMR Corp.; a Director and Chairman of the Board and of the Executive Committee of FMR; Chairman and a Director of Fidelity Management & Research (Far East) Inc.; Chairman (1998) and a Director of Fidelity Investments Money Management, Inc.; and Chairman (2001) and a Director (2000) of FMR Co., Inc. |
Abigail P. Johnson (42)** |
| Year of Election or Appointment: 2001 Senior Vice President of Spartan Short-Intermediate Municipal Income (2001). Ms. Johnson also serves as Senior Vice President of other Fidelity funds (2001). She is President and a Director of FMR (2001), Fidelity Investments Money Management, Inc. (2001), FMR Co., Inc. (2001), and a Director of FMR Corp. Previously, Ms. Johnson managed a number of Fidelity funds. |
Laura B. Cronin (49) |
| Year of Election or Appointment: 2003 Ms. Cronin is an Executive Vice President (2002) and Chief Financial Officer (2002) of FMR Corp. and is a member of the Fidelity Management Committee (2003). Previously, Ms. Cronin served as Vice President of Finance of FMR (1997-1999), and Chief Financial Officer of FMR (1999-2001), Fidelity Personal Investments (2001), and Fidelity Brokerage Company (2001-2002). |
Robert L. Reynolds (51) |
| Year of Election or Appointment: 2003 Mr. Reynolds is a Director (2003) and Chief Operating Officer (2002) of FMR Corp. and is the head of the Fidelity Management Committee (2003). He also serves on the Board at Fidelity Investments Canada, Ltd. (2000). Previously, Mr. Reynolds served as President of Fidelity Investments Institutional Retirement Group (1996-2000). |
* Trustees have been determined to be "Interested Trustees" by virtue of, among other things, their affiliation with the trust or various entities under common control with FMR.
** Edward C. Johnson 3d, Trustee, is Abigail P. Johnson's father.
Annual Report
Non-Interested Trustees:
Correspondence intended for each non-interested Trustee (that is, the Trustees other than the Interested Trustees) may be sent to Fidelity Investments, P.O. Box 55235, Boston, Massachusetts 02205-5235.
Name, Age; Principal Occupation |
J. Michael Cook (61) |
| Year of Election or Appointment: 2001 Prior to Mr. Cook's retirement in May 1999, he served as Chairman and Chief Executive Officer of Deloitte & Touche LLP (accounting/consulting), Chairman of the Deloitte & Touche Foundation, and a member of the Board of Deloitte Touche Tohmatsu. He currently serves as a Director of Comcast (telecommunications, 2002), International Flavors & Fragrances, Inc. (2000), Rockwell Automation (2000), and The Dow Chemical Company (2000). He is a Member of the Diversity Advisory Council of Marakon (2003) and the Advisory Board of the Directorship Search Group, Chairman Emeritus of the Board of Catalyst (a leading organization for the advancement of women in business), and is Chairman of the Accountability Advisory Council to the Comptroller General of the United States. He also serves as a Member of the Advisory Board of the Graduate School of Business of the University of Florida, his alma mater. |
Ralph F. Cox (71) |
| Year of Election or Appointment: 1991 Mr. Cox is President of RABAR Enterprises (management consulting for the petroleum industry). Prior to February 1994, he was President of Greenhill Petroleum Corporation (petroleum exploration and production). Until March 1990, Mr. Cox was President and Chief Operating Officer of Union Pacific Resources Company (exploration and production). He is a Director of CH2M Hill Companies (engineering), and Abraxas Petroleum (petroleum exploration and production, 1999). In addition, he is a member of advisory boards of Texas A&M University and the University of Texas at Austin. |
Robert M. Gates (60) |
| Year of Election or Appointment: 1997 Dr. Gates is President of Texas A&M University (2002). He was Director of the Central Intelligence Agency (CIA) from 1991 to 1993. From 1989 to 1991, Dr. Gates served as Assistant to the President of the United States and Deputy National Security Advisor. Dr. Gates is a Director of NACCO Industries, Inc. (mining and manufacturing), and Parker Drilling Co., Inc. (drilling and rental tools for the energy industry, 2001). He also serves as a member of the Advisory Board of VoteHere.net (secure internet voting, 2001). Previously, Dr. Gates served as a Director of LucasVarity PLC (automotive components and diesel engines), a Director of TRW Inc. (automotive, space, defense, and information technology), and Dean of the George Bush School of Government and Public Service at Texas A&M University (1999-2001). Dr. Gates also is a Trustee of the Forum for International Policy. |
George H. Heilmeier (67) |
| Year of Election or Appointment: 2004 Dr. Heilmeier is Chairman Emeritus of Telcordia Technologies (communication software and systems), where prior to his retirement, he served as company Chairman and Chief Executive Officer. He currently serves on the Boards of Directors of The Mitre Corporation (systems engineering and information technology support for the government), INET Technologies Inc. (telecommunications network surveillance, 2001) and Teletech Holdings (customer management services, 1998). He is Chairman of the General Motors Technology Advisory Committee and a Life Fellow of the IEEE (2000). Dr. Heilmeier is a member of the Defense Science Board and the National Security Agency Advisory Board. He is also a member of the National Academy of Engineering, the American Academy of Arts and Sciences and The Board of Overseers of the School of Engineering and Applied Science of the University of Pennsylvania. Previously, Dr. Heilmeier served as a Director of TRW Inc. (automotive, space, defense, and information technology, 1992-2002) and Compaq (1994-2002). |
Donald J. Kirk (71) |
| Year of Election or Appointment: 1987 Mr. Kirk is a Governor of the American Stock Exchange (2001), a Trustee and former Chairman of the Board of Trustees of the Greenwich Hospital Association, a Director of the Yale-New Haven Health Services Corp. (1998), and a Director Emeritus and former Chairman of the Board of Directors of National Arts Strategies Inc. Mr. Kirk was an Executive-in-Residence (1995-2000) and a Professor (1987-1995) at Columbia University Graduate School of Business. Prior to 1987, he was Chairman of the Financial Accounting Standards Board. Previously, Mr. Kirk served as a Governor of the National Association of Securities Dealers, Inc. (1996-2002), a member and Vice Chairman of the Public Oversight Board of the American Institute of Certified Public Accountants' SEC Practice Section (1995-2002), a Director of General Re Corporation (reinsurance, 1987-1998) and as a Director of Valuation Research Corp. (appraisals and valuations). |
Marie L. Knowles (57) |
| Year of Election or Appointment: 2001 Prior to Ms. Knowles' retirement in June 2000, she served as Executive Vice President and Chief Financial Officer of Atlantic Richfield Company (ARCO) (diversified energy, 1996-2000). From 1993 to 1996, she was a Senior Vice President of ARCO and President of ARCO Transportation Company. She served as a Director of ARCO from 1996 to 1998. She currently serves as a Director of Phelps Dodge Corporation (copper mining and manufacturing), URS Corporation (multidisciplinary engineering, 1999), and McKesson Corporation (healthcare service, 2002). Ms. Knowles is a Trustee of the Brookings Institution and the Catalina Island Conservancy and also serves as a member of the Advisory Board for the School of Engineering of the University of Southern California. |
Ned C. Lautenbach (59) |
| Year of Election or Appointment: 2000 Mr. Lautenbach has been a partner of Clayton, Dubilier & Rice, Inc. (private equity investment firm) since September 1998. Previously, Mr. Lautenbach was with the International Business Machines Corporation (IBM) from 1968 until his retirement in 1998. He was most recently Senior Vice President and Group Executive of Worldwide Sales and Services. From 1993 to 1995, he was Chairman of IBM World Trade Corporation, and from 1994 to 1998 was a member of IBM's Corporate Executive Committee. Mr. Lautenbach serves as Chairman and as a Director (1998) of Acterna Corporation (communications test equipment). He is also Co-Chairman of Covansys, Inc. (global provider of business and technology solutions, 2000). In addition, he is a Director of Eaton Corporation (diversified industrial) and the Philharmonic Center for the Arts in Naples, Florida (1999). He also is a member of the Council on Foreign Relations. |
Marvin L. Mann (70) |
| Year of Election or Appointment: 1993 Mr. Mann is Chairman of the non-interested Trustees (2001). He is Chairman Emeritus of Lexmark International, Inc. (computer peripherals) where he served as CEO until April 1998 and retired as Chairman May 1999, and remains a member of the Board. Prior to 1991, he held the positions of Vice President of International Business Machines Corporation (IBM) and President and General Manager of various IBM divisions and subsidiaries. Mr. Mann is a Board member of Imation Corp. (imaging and information storage) and Acterna Corporation (communications test equipment, 1999). He is also a member of the Director Services Committee of the Investment Company Institute. In addition, Mr. Mann is a member of the President's Cabinet at the University of Alabama and the Board of Visitors of the Culverhouse College of Commerce and Business Administration at the University of Alabama. |
William O. McCoy (70) |
| Year of Election or Appointment: 1997 Prior to his retirement in December 1994, Mr. McCoy was Vice Chairman of the Board of BellSouth Corporation (telecommunications) and President of BellSouth Enterprises. He is currently a Director of Liberty Corporation (holding company), Duke Realty Corporation (real estate), Progress Energy, Inc. (electric utility), and Acterna Corporation (communications test equipment, 1999). He is also a partner of Franklin Street Partners (private investment management firm) and a member of the Research Triangle Foundation Board. In addition, Mr. McCoy served as the Interim Chancellor (1999-2000) and a member of the Board of Visitors (1994-1998) for the University of North Carolina at Chapel Hill and currently serves on the Board of Directors of the University of North Carolina Health Care System and the Board of Visitors of the Kenan-Flagler Business School (University of North Carolina at Chapel Hill). He also served as Vice President of Finance for the University of North Carolina (16-school system, 1995-1998). |
William S. Stavropoulos (64) |
| Year of Election or Appointment: 2002 Mr. Stavropoulos is Chairman of the Board, President and CEO (2002), and Chairman of the Executive Committee (2000) and a Director of The Dow Chemical Company. Since joining The Dow Chemical Company in 1967, Mr. Stavropoulos served in numerous senior management positions, including President (1993-2000) and Chief Executive Officer (1995-2000). Currently, he is a Director of NCR Corporation (data warehousing and technology solutions), BellSouth Corporation (telecommunications), Chemical Financial Corporation, and Maersk Inc. (industrial conglomerate, 2002). He also serves as a member of the Board of Trustees of the American Enterprise Institute for Public Policy Research. In addition, Mr. Stavropoulos is a member of The Business Council, J.P. Morgan International Council, World Business Council for Sustainable Development, and the University of Notre Dame Advisory Council for the College of Science. |
Annual Report
Trustees and Officers - continued
Advisory Board Members and Executive Officers:
Correspondence intended for Ms. Small may be sent to Fidelity Investments, P.O. Box 55235, Boston, Massachusetts 02205-5235. Correspondence intended for each executive officer and Mr. Lynch may be sent to Fidelity Investments, 82 Devonshire Street, Boston, Massachusetts 02109.
Name, Age; Principal Occupation |
Peter S. Lynch (60) |
| Year of Election or Appointment: 2003 Member of the Advisory Board of Fidelity Municipal Trust. Vice Chairman and a Director of FMR, and Vice Chairman (2001) and a Director (2000) of FMR Co., Inc. Previously, Mr. Lynch served as a Trustee of the Fidelity funds (1990-2003). Prior to May 31, 1990, he was a Director of FMR and Executive Vice President of FMR (a position he held until March 31, 1991), Vice President of Fidelity® Magellan® Fund and FMR Growth Group Leader, and Managing Director of FMR Corp. Mr. Lynch was also Vice President of Fidelity Investments Corporate Services. In addition, he serves as a Trustee of Boston College, Massachusetts Eye & Ear Infirmary, Historic Deerfield, John F. Kennedy Library, and the Museum of Fine Arts of Boston. |
Cornelia M. Small (59) |
| Year of Election or Appointment: 2004 Member of the Advisory Board of Fidelity Municipal Trust. Ms. Small is a member (2000) and Chairperson (2002) of the Investment Committee, and a member (2002) of the Board of Trustees of Smith College. Previously, she served as Chief Investment Officer (1999-2000), Director of Global Equity Investments (1996-1999), and a member of the Board of Directors (1998-1999) of Scudder Kemper Investments. In addition, Ms. Small served as Co-Chair (2000-2003) of the Annual Fund for the Fletcher School of Law and Diplomacy. |
Dwight D. Churchill (50) |
| Year of Election or Appointment: 1997 Vice President of Spartan Short-Intermediate Municipal Income. He serves as Head of Fidelity's Fixed-Income Division (2000), Vice President of Fidelity's Money Market Funds (2000), Vice President of Fidelity's Bond Funds (1997), and Senior Vice President of FIMM (2000) and FMR (1997). Mr. Churchill joined Fidelity in 1993 as Vice President and Group Leader of Taxable Fixed-Income Investments. |
Charles S. Morrison (43) |
| Year of Election or Appointment: 2002 Vice President of Spartan Short-Intermediate Municipal Income. Mr. Morrison also serves as Vice President of Fidelity's Bond Funds (2002), and Vice President of certain Asset Allocation and Balanced Funds (2002). He serves as Vice President (2002) and Bond Group Leader (2002) of Fidelity Investments Fixed Income Division. Mr. Morrison is also Vice President of FIMM (2002) and FMR (2002). Mr. Morrison joined Fidelity in 1987 as a Corporate Bond Analyst in the Fixed Income Research Division. |
Eric D. Roiter (55) |
| Year of Election or Appointment: 1998 Secretary of Spartan Short-Intermediate Municipal Income. He also serves as Secretary of other Fidelity funds (1998); Vice President, General Counsel, and Clerk of FMR Co., Inc. (2001) and FMR (1998); Vice President and Clerk of FDC (1998); Assistant Clerk of Fidelity Management & Research (U.K.) Inc. (2001) and Fidelity Management & Research (Far East) Inc. (2001); and Assistant Secretary of Fidelity Investments Money Management Inc. (2001). Prior to joining Fidelity, Mr. Roiter was with the law firm of Debevoise & Plimpton, as an associate (1981-1984) and as a partner (1985-1997), and served as an Assistant General Counsel of the U.S. Securities and Exchange Commission (1979-1981). Mr. Roiter is an Adjunct Member, Faculty of Law, at Boston College Law School (2003). |
Stuart Fross (44) |
| Year of Election or Appointment: 2003 Assistant Secretary of Spartan Short-Intermediate Municipal Income. Mr. Fross also serves as Assistant Secretary of other Fidelity funds (2003) and is an employee of FMR. |
Maria F. Dwyer (45) |
| Year of Election or Appointment: 2002 President and Treasurer of Spartan Short-Intermediate Municipal Income. Ms. Dwyer also serves as President and Treasurer of other Fidelity funds (2002) and is a Vice President (1999) and an employee (1996) of FMR. |
Timothy F. Hayes (53) |
| Year of Election or Appointment: 2002 Chief Financial Officer of Spartan Short-Intermediate Municipal Income. Mr. Hayes also serves as Chief Financial Officer of other Fidelity funds (2002). Recently he was appointed President of Fidelity Service Company (2003) where he also serves as a Director. Mr. Hayes also serves as President of Fidelity Investments Operations Group (FIOG, 2002), which includes Fidelity Pricing and Cash Management Services Group (FPCMS), where he was appointed President in 1998. Previously, Mr. Hayes served as Chief Financial Officer of Fidelity Investments Corporate Systems and Service Group (1998) and Fidelity Systems Company (1997-1998). |
Jennifer S. Taub (37) |
| Year of Election or Appointment: 2003 Assistant Vice President of Spartan Short-Intermediate Municipal Income. Ms. Taub is Assistant Vice President of Fidelity's Fixed-Income Funds (2003), Assistant Secretary of FIMM (2003), and is an employee of FMR. |
John R. Hebble (45) |
| Year of Election or Appointment: 2003 Deputy Treasurer of Spartan Short-Intermediate Municipal Income. Mr. Hebble also serves as Deputy Treasurer of other Fidelity funds (2003), and is an employee of FMR. Before joining Fidelity Investments, Mr. Hebble worked at Deutsche Asset Management where he served as Director of Fund Accounting (2002-2003) and Assistant Treasurer of the Scudder Funds (1998-2003). |
John H. Costello (57) |
| Year of Election or Appointment: 1986 Assistant Treasurer of Spartan Short-Intermediate Municipal Income. Mr. Costello also serves as Assistant Treasurer of other Fidelity funds and is an employee of FMR. |
Francis V. Knox, Jr. (56) |
| Year of Election or Appointment: 2002 Assistant Treasurer of Spartan Short-Intermediate Municipal Income. Mr. Knox also serves as Assistant Treasurer of other Fidelity funds (2002), and is a Vice President and an employee of FMR. Previously, Mr. Knox served as Vice President of Investment & Advisor Compliance (1990-2001), and Compliance Officer of Fidelity Management & Research (U.K.) Inc. (1992-2002), Fidelity Management & Research (Far East) Inc. (1991-2002), and FMR Corp. (1995-2002). |
Mark Osterheld (48) |
| Year of Election or Appointment: 2002 Assistant Treasurer of Spartan Short-Intermediate Municipal Income. Mr. Osterheld also serves as Assistant Treasurer of other Fidelity funds (2002) and is an employee of FMR. |
Thomas J. Simpson (45) |
| Year of Election or Appointment: 1996 Assistant Treasurer of Spartan Short-Intermediate Municipal Income. Mr. Simpson is Assistant Treasurer of other Fidelity funds (2000) and an employee of FMR (1996). Prior to joining FMR, Mr. Simpson was Vice President and Fund Controller of Liberty Investment Services (1987-1995). |
Annual Report
Distributions
During fiscal year ended 2003, 100% of the fund's income dividends was free from federal income tax, and 15.52% of the fund's income dividends was subject to the federal alternative minimum tax.
The fund will notify shareholders in January 2004 of amounts for use in preparing 2003 income tax returns.
Annual Report
Annual Report
Annual Report
Annual Report
Annual Report
Annual Report
Investment Adviser
Fidelity Management & Research Company
Boston, MA
Investment Sub-Advisers
Fidelity Investments Money
Management, Inc.
Fidelity International Investment Advisors
Fidelity International Investment Advisors
(U.K.) Limited
General Distributor
Fidelity Distributors Corporation
Boston, MA
Transfer and Shareholder
Servicing Agents
Citibank, N.A.
New York, NY
Fidelity Investments Institutional
Operations Company, Inc.
Boston, MA
Custodian
Citibank, N.A.
New York, NY
Annual Report
Fidelity Advisor Aggressive Growth Fund |
Fidelity Advisor Asset Allocation Fund |
Fidelity Advisor Balanced Fund |
Fidelity Advisor Biotechnology Fund |
Fidelity Advisor California Municipal Income Fund |
Fidelity Advisor Consumer Industries Fund |
Fidelity Advisor Cyclical Industries Fund |
Fidelity Advisor Developing Communications Fund |
Fidelity Advisor Diversified International Fund |
Fidelity Advisor Dividend Growth Fund |
Fidelity Advisor Dynamic Capital Appreciation Fund |
Fidelity Advisor Electronics Fund |
Fidelity Advisor Emerging Asia Fund |
Fidelity Advisor Emerging Markets Income Fund |
Fidelity Advisor Equity Growth Fund |
Fidelity Advisor Equity Income Fund |
Fidelity Advisor Equity Value Fund |
Fidelity Advisor Europe Capital Appreciation Fund |
Fidelity Advisor Fifty Fund |
Fidelity Advisor Financial Services Fund |
Fidelity Advisor Floating Rate High Income Fund |
Fidelity Advisor Freedom Income, 2005, 2010, 2015, 2020, 2025, 2030, 2035,
2040 FundsSM |
Fidelity Advisor Global Equity Fund |
Fidelity Advisor Government Investment Fund |
Fidelity Advisor Growth & Income Fund |
Fidelity Advisor Growth Opportunities |
Fidelity Advisor Health Care Fund |
Fidelity Advisor High Income Advantage Fund |
Fidelity Advisor High Income Fund |
Fidelity Advisor Inflation-Protected Bond Fund |
Fidelity Advisor Intermediate Bond Fund |
Fidelity Advisor International Capital Appreciation Fund |
Fidelity Advisor International Small Cap Fund |
Fidelity Advisor Investment Grade Bond Fund |
Fidelity Advisor Japan Fund |
Fidelity Advisor Korea Fund |
Fidelity Advisor Large Cap Fund |
Fidelity Advisor Latin America Fund |
Fidelity Advisor Leveraged Company Stock Fund |
Fidelity Advisor Mid Cap Fund |
Fidelity Advisor Mortgage Securities Fund |
Fidelity Advisor Municipal Income Fund |
Fidelity Advisor Natural Resources Fund |
Fidelity Advisor New Insights Fund |
Fidelity Advisor New York
Municipal Income Fund |
Fidelity Advisor Overseas Fund |
Fidelity Advisor Real Estate Fund |
Fidelity Advisor Short Fixed-Income Fund |
Fidelity Advisor Short Intermediate Municipal Income Fund |
Fidelity Advisor Small Cap Fund |
Fidelity Advisor Strategic Dividend &
Income Fund |
Fidelity Advisor Strategic Growth Fund |
Fidelity Advisor Strategic Income Fund |
Fidelity Advisor Tax Managed
Stock Fund |
Fidelity Advisor Technology Fund |
Fidelity Advisor Telecommunications & Utilities Growth Fund |
Fidelity Advisor Strategic Dividend &
Income Fund |
Fidelity Advisor Value Leaders Fund |
Fidelity Advisor Value Strategies Fund |
Prime Fund |
Tax-Exempt Fund |
Treasury Fund |
(Fidelity Investment logo)(registered trademark)
Corporate Headquarters
82 Devonshire St., Boston, MA 02109
www.fidelity.com
ASTM-UANN-0204
1.796655.100
Fidelity Advisor
Short-Intermediate
Municipal Income
Fund - Institutional Class
Annual Report
December 31, 2003
(2_fidelity_logos) (Registered_Trademark)
Institutional Class is a class of Spartan Short-Intermediate
Municipal Income Fund
Contents
Chairman's Message | <Click Here> | Ned Johnson's message to shareholders. |
Performance | <Click Here> | How the fund has done over time. |
Investment Changes | <Click Here> | A summary of major shifts in the fund's investments over the past six months. |
Investments | <Click Here> | A complete list of the fund's investments with their market values. |
Financial Statements | <Click Here> | Statements of assets and liabilities, operations, and changes in net assets,
as well as financial highlights. |
Notes | <Click Here> | Notes to the financial statements. |
Auditors' Opinion | <Click Here> | |
Trustees and Officers | <Click Here> | |
Distributions | <Click Here> | |
| | |
Standard & Poor's, S&P and S&P 500 are registered service marks of The McGraw-Hill Companies, Inc. and have been licensed for use by Fidelity Distributors Corporation.
Other third party marks appearing herein are the property of their respective owners.
All other marks appearing herein are registered or unregistered trademarks or service marks of FMR Corp. or an affiliated company.
(Recycle graphic) This report is printed on recycled paper using soy-based inks.
This report and the financial statements contained herein are submitted for the general information of the shareholders of the fund. This report is not authorized for distribution to prospective investors in the fund unless preceded or accompanied by an effective prospectus.
Mutual fund shares are not deposits or obligations of, or guaranteed by, any depository institution. Shares are not insured by the FDIC, Federal Reserve Board or any other agency, and are subject to investment risks, including possible loss of principal amount invested.
Neither the fund nor Fidelity Distributors Corporation is a bank.
For more information on any Fidelity Advisor fund, including charges and expenses, contact your investment professional for a free prospectus. Read it carefully before you invest or send money.
Annual Report
Chairman's Message
(photo_of_Edward_C_Johnson_3d)
Dear Shareholder:
Many of you have read or heard news stories recently that were critical of mutual funds and made allegations that the mutual fund industry has been less than forthright. I find these reports unsettling and not necessarily an accurate picture of the overall industry, and I would like you to know where we at Fidelity stand.
With specific regard to allegations that certain mutual fund companies were violating the Securities and Exchange Commission's forward pricing rules or were involved in so-called "market timing" activities, I want to say two things:
First, Fidelity does not have agreements that permit customers who buy fund shares after 4 p.m. to obtain the 4 p.m. price. This is not to say that someone could not deceive the company through fraudulent acts. But I underscore that we have no so-called "agreements" which would permit this illegal practice.
Second, Fidelity has been on record for years opposing predatory short-term trading which adversely affects other shareholders in a mutual fund. In fact, in the 1980s, we began charging a fee - which is returned to the fund and, therefore, to investors - to discourage this activity. What's more, several years ago we took the industry lead in developing a Fair Value Pricing Policy to prevent market timing on foreign securities in our funds. It is reasonable to assume that another structure can be developed that would alter the system to make it much more difficult for predatory traders to operate. This, however, will only be achieved through close cooperation among regulators, legislators and the industry.
Certainly no industry is perfect, and there have been instances of unethical and illegal activity from time to time within the mutual fund industry. When this occurs, confessed or convicted offenders should be dealt with appropriately. Clearly, every system can be improved. We applaud well thought out improvements by regulators, legislators and industry representatives that achieve the common goal of building and protecting the value of investors' holdings. But we remain concerned about the risk of over-regulation and the quick application of simplistic solutions to intricate problems.
For more than 57 years, Fidelity Investments has worked very hard to improve its products and service to justify your trust. When our family founded this company in 1946, we had only a few hundred customers. Many of them were family and friends. Today, we serve more than 18 million customers including individual investors and participants in retirement plans across America.
Let me close by saying that we do not take your trust in us for granted, and we realize that we must always work to improve all aspects of our service to you. In turn, we urge you to continue your active participation with your financial matters, so that your interests can be well served.
Annual Report
Best regards,
/s/Edward C. Johnson 3d
Edward C. Johnson 3d
Annual Report
Performance: The Bottom Line
Average annual total return reflects the change in the value of an investment, assuming reinvestment of the fund's dividend income and capital gains (the profits earned upon the sale of securities that have grown in value) and assuming a constant rate of performance each year. During periods of reimbursement by Fidelity, a fund's total return will be greater than it would be had the reimbursement not occurred. The $10,000 table and the fund's returns do not reflect the deduction of taxes that a shareholder would pay on fund distributions or the redemption of fund shares. How a fund did yesterday is no guarantee of how it will do tomorrow.
Average Annual Total Returns
Periods ended December 31, 2003 | Past 1
year | Past 5
years | Past 10
years |
Institutional Class A | 3.11% | 4.60% | 4.52% |
A The initial offering of Institutional Class shares took place on July 23, 2003. Returns prior to July 23, 2003 are those of Spartan® Short-Intermediate Municipal Income Fund, the original retail class of the fund
Annual Report
$10,000 Over 10 Years
Let's say hypothetically that $10,000 was invested in Fidelity Advisor Short-Intermediate Municipal Income - Institutional Class on December 31, 1993. The chart shows how the value of your investment would have grown, and also shows how the Lehman Brothers® Municipal Bond Index did over the same period.
Annual Report
See accompanying notes which are an integral part of the financial statements.
Management's Discussion of Fund Performance
Comments from Mark Sommer, Portfolio Manager of Fidelity Advisor Short-Intermediate Municipal Income Fund
While most of the year favored riskier assets, tax-exempt municipal bonds put up solid numbers for the 12 months ending December 31, 2003. In that time, the Lehman Brothers® Municipal Bond Index - a performance measure of about 40,000 investment-grade, fixed-rate, tax-exempt bonds - advanced 5.31%. For munis, it was the fourth straight year of returns in excess of 5%. Munis had an excellent year relative to taxable investment-grade bonds. The Lehman Brothers Aggregate Bond Index, a proxy for the taxable, investment-grade bond market, gained 4.10% in 2003, a full percentage point less than the muni index - a gap made even wider considering muni bonds' tax-equivalent yield advantage. What's more, on a three- and five-year basis, the Lehman Brothers muni index's cumulative return is well above that of most stock market benchmarks. Munis fared well for much of the year against a backdrop of low interest rates and virtually non-existent inflation. Although they stumbled in mid-summer against a brighter economic forecast, munis rebounded later on the heels of strong investor demand and the Federal Reserve Board's accommodative monetary policy.
Fidelity Advisor Short-Intermediate Municipal Income Fund Institutional Class shares returned 3.11% during the 12-month period, lagging the LipperSM Short-Intermediate Municipal Debt Funds Average, which returned 3.42%. Additionally, the Lehman Brothers 1-6 Year Municipal Bond Index returned 3.01%. The fund's underperformance of its peer average stemmed from its shorter duration, meaning it was less interest rate sensitive and, accordingly, benefited less from the bond market rally during the first half of 2003. Additionally, longer duration funds enjoyed a yield advantage. However, the fund's shorter duration helped it during the summer and fall when interest rates rose in response to improving economic conditions. Aiding performance was good sector and security selection. The fund's emphasis on essential services bonds - which are issued by providers of electricity, water and sewer services - was one example of advantageous security selection. The issuers' stable revenues helped these securities outperform tax-backed bonds during the period. The fund's stake in hospital bonds also worked in its favor, as many hospitals enjoyed better financial trends and, as a result, improving bond prices. Avoiding the lagging tobacco sector also boosted the fund's returns.
The views expressed in this statement reflect those of the portfolio manager only through the end of the period of the report as stated on the cover and do not necessarily represent the views of Fidelity or any other person in the Fidelity organization. Any such views are subject to change at any time based upon market or other conditions and Fidelity disclaims any responsibility to update such views. These views may not be relied on as investment advice and, because investment decisions for a Fidelity fund are based on numerous factors, may not be relied on as an indication of trading intent on behalf of any Fidelity fund.
Annual Report
Investment Changes
Top Five States as of December 31, 2003 |
| % of fund's
net assets | % of fund's net assets
6 months ago |
Texas | 14.0 | 14.6 |
Illinois | 7.8 | 7.9 |
Washington | 7.7 | 9.0 |
Massachusetts | 6.6 | 7.6 |
New York | 6.6 | 5.8 |
Top Five Sectors as of December 31, 2003 |
| % of fund's
net assets | % of fund's net assets
6 months ago |
General Obligations | 45.3 | 43.9 |
Electric Utilities | 15.1 | 17.0 |
Transportation | 9.3 | 8.7 |
Escrowed/Pre-Refunded | 6.2 | 6.1 |
Water & Sewer | 6.0 | 8.4 |
Average Years to Maturity as of December 31, 2003 |
| | 6 months ago |
Years | 3.3 | 3.3 |
Average years to maturity is based on the average time remaining until principal payments are expected from each of the fund's bonds, weighted by dollar amount. |
Duration as of December 31, 2003 |
| | 6 months ago |
Years | 2.9 | 2.8 |
Duration shows how much a bond fund's price fluctuates with changes in comparable interest rates. If rates rise 1%, for example, a fund with a five-year duration is likely to lose about 5% of its value. Other factors also can influence a bond fund's performance and share price. Accordingly, a bond fund's actual performance may differ from this example. |
Quality Diversification (% of fund's net assets) |
As of December 31, 2003 | As of June 30, 2003 |
 | AAA 58.4% | | | AAA 59.1% | |
 | AA,A 31.1% | | | AA,A 34.5% | |
 | BBB 7.0% | | | BBB 8.2% | |
 | Not Rated 1.1% | | | Not Rated 0.7% | |
 | Short-Term
Investments and
Net Other Assets 2.4% | |  | Short-Term
Investments and
Net Other Assets* (2.5)% | |

We have used ratings from Moody's® Investors Services, Inc. Where Moody's ratings are not available, we have used S&P® ratings. |
*Short-Term Investments and Net Other Assets are not included in the pie chart.
Annual Report
Investments December 31, 2003
Showing Percentage of Net Assets
Municipal Bonds - 96.9% |
| Principal
Amount (000s) | | Value (Note 1)
(000s) |
Alabama - 2.2% |
Alabama Agric. & Mechanical Univ. Revs. 6.5% 11/1/25 (Pre-Refunded to 11/1/05 @ 102) (f) | | $ 2,000 | | $ 2,223 |
Alabama Fed. Hwy. Fin. Auth. Series A, 5% 3/1/10 (MBIA Insured) | | 5,000 | | 5,611 |
Huntsville Solid Waste Disp. Auth. & Resource Recovery Rev.: | | | | |
5.25% 10/1/07 (MBIA Insured) (e) | | 1,000 | | 1,092 |
5.25% 10/1/08 (MBIA Insured) (e) | | 2,900 | | 3,174 |
Jefferson County Gen. Oblig. Series 2003 A: | | | | |
3% 4/1/05 (MBIA Insured) | | 4,000 | | 4,086 |
5% 4/1/06 (MBIA Insured) | | 3,000 | | 3,218 |
5% 4/1/07 (MBIA Insured) | | 3,000 | | 3,278 |
Jefferson County Swr. Rev. Series A, 5% 2/1/33 (Pre-Refunded to 2/1/09 @ 101) (f) | | 13,010 | | 14,598 |
Mobile County Gen. Oblig.: | | | | |
5% 2/1/07 (MBIA Insured) | | 1,000 | | 1,091 |
5% 2/1/08 (MBIA Insured) | | 1,475 | | 1,628 |
Opelika Gen. Oblig. Series A, 5% 4/1/05 (MBIA Insured) | | 1,225 | | 1,281 |
| | 41,280 |
Alaska - 2.0% |
Alaska Student Ln. Corp. Student Ln. Rev. Series A: | | | | |
5.1% 7/1/04 (AMBAC Insured) (e) | | 3,630 | | 3,700 |
5.15% 7/1/05 (AMBAC Insured) (e) | | 1,950 | | 2,052 |
5.85% 7/1/13 (AMBAC Insured) (e) | | 3,285 | | 3,599 |
Anchorage Gen. Oblig. Series B, 5.75% 12/1/11 (Pre-Refunded to 12/1/10 @ 100) (f) | | 2,500 | | 2,953 |
North Slope Borough Gen. Oblig.: | | | | |
Series 1996 B, 0% 6/30/07 (MBIA Insured) | | 3,100 | | 2,844 |
Series B: | | | | |
0% 6/30/05 (FSA Insured) | | 8,100 | | 7,918 |
0% 6/30/07 (MBIA Insured) | | 7,050 | | 6,468 |
0% 6/30/08 (MBIA Insured) | | 4,240 | | 3,730 |
0% 6/30/06 (MBIA Insured) | | 3,500 | | 3,325 |
Valdez Marine Term. Rev. (Atlantic Richfield Co. Proj.) Series 1994 B, 2%, tender 1/1/04 (b) | | 1,100 | | 1,100 |
| | 37,689 |
Arizona - 1.4% |
Arizona Pwr. Auth. Pwr. Resource Rev. (Hoover Uprating Proj.): | | | | |
5% 10/1/05 | | 2,160 | | 2,288 |
Municipal Bonds - continued |
| Principal
Amount (000s) | | Value (Note 1)
(000s) |
Arizona - continued |
Arizona Pwr. Auth. Pwr. Resource Rev. (Hoover Uprating Proj.): - continued | | | | |
5% 10/1/06 | | $ 2,525 | | $ 2,735 |
Maricopa County School District #28 Kyrene Elementary Series B, 0% 7/1/04 (FGIC Insured) | | 3,000 | | 2,983 |
Pima County Gen. Oblig. 4% 7/1/04 (FSA Insured) | | 815 | | 827 |
Salt River Proj. Agric. Impt. & Pwr. District Elec. Sys. Rev.: | | | | |
Series A, 5.25% 1/1/06 | | 5,700 | | 6,109 |
Series B: | | | | |
7% 1/1/05 | | 760 | | 803 |
7% 1/1/05 (Escrowed to Maturity) (f) | | 1,240 | | 1,311 |
Series D: | | | | |
5.7% 1/1/04 (f) | | 65 | | 65 |
5.7% 1/1/04 | | 935 | | 935 |
Scottsdale Muni. Property Corp. Excise Tax Rev. 5.5% 7/1/05 | | 2,285 | | 2,427 |
Tucson Gen. Oblig. Series 2002, 5% 7/1/05 | | 1,000 | | 1,054 |
Tucson Street & Hwy. User Rev. 4.5% 7/1/05 (AMBAC Insured) | | 3,090 | | 3,236 |
Tucson Wtr. Rev. Series 2002: | | | | |
5.5% 7/1/05 (FGIC Insured) | | 1,040 | | 1,104 |
5.5% 7/1/06 (FGIC Insured) | | 980 | | 1,069 |
| | 26,946 |
Arkansas - 0.2% |
Little Rock Gen. Oblig. 4% 4/1/07 (FSA Insured) (a) | | 1,000 | | 1,062 |
Rogers Sales & Use Tax Rev. Series A: | | | | |
4.25% 9/1/06 (FGIC Insured) | | 1,000 | | 1,063 |
4.25% 9/1/07 (FGIC Insured) | | 2,175 | | 2,342 |
| | 4,467 |
California - 5.4% |
California Dept. of Wtr. Resources Central Valley Proj. Wtr. Sys. Rev. Series Y, 5% 12/1/06 (FGIC Insured) | | 5,000 | | 5,486 |
California Dept. of Wtr. Resources Pwr. Supply Rev. Series A: | | | | |
5.25% 5/1/07 (MBIA Insured) | | 28,900 | | 31,901 |
5.25% 5/1/10 (MBIA Insured) | | 1,100 | | 1,245 |
California Gen. Oblig.: | | | | |
4.4% 8/1/07 | | 1,000 | | 1,057 |
5.125% 9/1/12 | | 1,000 | | 1,063 |
5.25% 11/1/08 | | 1,045 | | 1,146 |
Municipal Bonds - continued |
| Principal
Amount (000s) | | Value (Note 1)
(000s) |
California - continued |
California Gen. Oblig.: - continued | | | | |
5.25% 2/1/11 | | $ 6,425 | | $ 7,010 |
5.5% 6/1/05 | | 4,725 | | 4,965 |
5.75% 10/1/08 | | 1,085 | | 1,212 |
6.4% 9/1/08 | | 3,075 | | 3,500 |
6.5% 9/1/10 | | 1,740 | | 2,025 |
California Pub. Works Board Lease Rev. (California State Univ. Proj.) Series 1997 A, 5.5% 10/1/07 | | 1,075 | | 1,181 |
California Statewide Cmnty. Dev. Auth. Rev. (Kaiser Fund Hosp./Health Place, Inc. Proj.) Series 2002 C, 3.7%, tender 6/1/05 (b) | | 10,000 | | 10,273 |
Golden State Tobacco Securitization Corp. Series 2003 B, 5% 6/1/08 | | 1,300 | | 1,389 |
Long Beach Hbr. Rev. Series 2000 A: | | | | |
5.5% 5/15/05 (e) | | 3,490 | | 3,671 |
5.5% 5/15/06 (e) | | 3,000 | | 3,247 |
Los Angeles Hbr. Dept. Rev. Series A: | | | | |
5.5% 8/1/04 (AMBAC Insured) (e) | | 2,000 | | 2,051 |
5.5% 8/1/06 (AMBAC Insured) (e) | | 1,495 | | 1,627 |
San Francisco City & County Arpts. Commission Int'l. Arpt. Rev. Second Series 27A, 5% 5/1/05 (MBIA Insured) (e) | | 3,680 | | 3,844 |
San Joaquin Hills Trans. Corridor Agcy. Toll Road Rev. Series A, 0% 1/15/12 (MBIA Insured) | | 3,600 | | 2,647 |
Univ. of California Revs. (UCLA Med. Ctr. Proj.) 4.55% 12/1/09 (g) | | 9,600 | | 10,223 |
| | 100,763 |
Colorado - 0.9% |
Arapahoe County Cap. Impt. Trust Fund Hwy. Rev.: | | | | |
Series C, 0% 8/31/08 (Pre-Refunded to 8/31/05 @ 82.9449) (f) | | 4,500 | | 3,643 |
Series E 470: | | | | |
0% 8/31/07 (Pre-Refunded to 8/31/05 @ 89.2392) (f) | | 2,000 | | 1,742 |
0% 8/31/15 (Pre-Refunded to 8/31/05 @ 48.6181) (f) | | 9,025 | | 4,284 |
Arapahoe County Cherry Creek School District #5 Series B, 6% 12/15/04 | | 1,395 | | 1,459 |
Denver City & County Arpt. Rev. Series 2001 B, 5.25% 11/15/04 (FGIC Insured) (e) | | 1,200 | | 1,242 |
Municipal Bonds - continued |
| Principal
Amount (000s) | | Value (Note 1)
(000s) |
Colorado - continued |
E-470 Pub. Hwy. Auth. Rev. Series 2000 B: | | | | |
0% 9/1/06 (MBIA Insured) | | $ 2,200 | | $ 2,072 |
0% 9/1/07 (MBIA Insured) | | 3,200 | | 2,903 |
| | 17,345 |
Connecticut - 0.2% |
Connecticut Gen. Oblig. Series 2003 D, 5% 8/1/10 (FSA Insured) | | 3,000 | | 3,380 |
District Of Columbia - 1.6% |
District of Columbia Ctfs. of Prtn.: | | | | |
3% 1/1/06 (AMBAC Insured) | | 1,305 | | 1,338 |
5% 1/1/06 (AMBAC Insured) | | 1,000 | | 1,062 |
5% 1/1/07 (AMBAC Insured) | | 1,000 | | 1,083 |
5.25% 1/1/08 (AMBAC Insured) | | 935 | | 1,032 |
District of Columbia Gen. Oblig.: | | | | |
Series 1993 B2, 5.5% 6/1/07 (FSA Insured) | | 3,800 | | 4,210 |
Series 2001 B, 5.5% 6/1/07 (FSA Insured) | | 1,345 | | 1,490 |
District of Columbia Rev. (Medstar Univ. Hosp. Proj.) Series D, 6.875%, tender 2/15/07 (b) | | 9,000 | | 9,621 |
Metro. Washington Arpt. Auth. Sys. Rev. Series D: | | | | |
4% 10/1/05 (FSA Insured) (e) | | 1,000 | | 1,038 |
4% 10/1/06 (FSA Insured) (e) | | 1,750 | | 1,837 |
4% 10/1/07 (FSA Insured) (e) | | 1,000 | | 1,056 |
Metro. Washington Arpts. Auth. Gen. Arpt. Rev. Series B, 5.5% 10/1/08 (FGIC Insured) (e) | | 6,460 | | 7,106 |
| | 30,873 |
Florida - 5.6% |
Brevard County Util. Rev.: | | | | |
5% 3/1/05 (FGIC Insured) | | 1,445 | | 1,508 |
5% 3/1/06 (FGIC Insured) | | 530 | | 568 |
Broward County School District Series A: | | | | |
5% 2/15/05 | | 3,000 | | 3,127 |
5% 2/15/08 | | 5,810 | | 6,429 |
Dade County School District: | | | | |
5% 8/1/07 (MBIA Insured) | | 1,500 | | 1,649 |
5.2% 7/15/07 (AMBAC Insured) | | 8,500 | | 9,405 |
Florida Board of Ed. Lottery Rev. Series B, 6% 7/1/15 (FGIC Insured) | | 1,200 | | 1,408 |
Florida Ports Fing. Commission Rev. (State Trans. Trust Fund Proj.) 6% 6/1/05 (MBIA Insured) (e) | | 4,575 | | 4,846 |
Florida Tpk. Auth. Tpk. Rev. Series B, 5% 7/1/11 (AMBAC Insured) | | 1,700 | | 1,904 |
Municipal Bonds - continued |
| Principal
Amount (000s) | | Value (Note 1)
(000s) |
Florida - continued |
Highlands County Health Facilities Auth. Rev. (Adventist Health Sys./Sunbelt Proj.) 3.35%, tender 9/1/05 (b) | | $ 20,300 | | $ 20,770 |
Hillsborough County Indl. Dev. Auth. Poll. Cont. Rev. (Tampa Elec. Co. Proj.): | | | | |
4%, tender 8/1/07 (b) | | 11,000 | | 11,194 |
4.25%, tender 8/1/07 (b)(e) | | 6,000 | | 6,115 |
Indian River County School District: | | | | |
4% 4/1/05 (FSA Insured) | | 2,185 | | 2,259 |
4% 4/1/06 (FSA Insured) | | 1,470 | | 1,548 |
Miami-Dade County Cap. Asset Acquisition Fixed Rate Spl. Oblig. Series 2002 A: | | | | |
5% 4/1/05 (AMBAC Insured) | | 2,900 | | 3,033 |
5% 4/1/06 (AMBAC Insured) | | 3,365 | | 3,617 |
5% 4/1/08 (AMBAC Insured) | | 2,825 | | 3,135 |
Miami-Dade County School Board Ctfs. of Prtn. 5%, tender 5/1/11 (MBIA Insured) (b) | | 1,500 | | 1,661 |
Palm Beach County School District 5% 8/1/05 (MBIA Insured) | | 5,000 | | 5,285 |
Pasco County Solid Waste Disp. & Resource Recovery Sys. Rev. 5.75% 4/1/06 (AMBAC Insured) (e) | | 1,500 | | 1,603 |
Reedy Creek Impt. District Utils. Rev. Series 2: | | | | |
5% 10/1/05 (MBIA Insured) (a) | | 1,685 | | 1,783 |
5.25% 10/1/10 (MBIA Insured) (a) | | 8,275 | | 9,430 |
Univ. Athletic Assoc., Inc. Athletic Prog. Rev. Series 2001, 2.8%, tender 10/1/08, LOC Suntrust Banks of Florida, Inc. (b) | | 2,000 | | 1,998 |
| | 104,275 |
Georgia - 2.2% |
Atlanta Arpt. Facilities Rev. 6.5% 1/1/06 (Escrowed to Maturity) (f) | | 6,000 | | 6,555 |
Cobb County Solid Waste Mgt. Auth. Rev. Series 1995, 6.05% 1/1/05 (e) | | 1,000 | | 1,045 |
Columbus Wtr. & Swr. Rev. 5.25% 5/1/05 (FSA Insured) | | 1,990 | | 2,093 |
Dalton Bldg. Auth. Rev. Series 2001, 5% 7/1/05 | | 6,030 | | 6,353 |
Fulton DeKalb Hosp. Auth. Hosp. Rev. 5% 1/1/08 (FSA Insured) | | 2,250 | | 2,476 |
Georgia Gen. Oblig.: | | | | |
Series A: | | | | |
4% 5/1/05 | | 7,000 | | 7,250 |
5.8% 3/1/05 | | 2,000 | | 2,105 |
Series B, 6.25% 4/1/06 | | 1,750 | | 1,929 |
Series C, 6.5% 7/1/07 | | 2,185 | | 2,511 |
Municipal Bonds - continued |
| Principal
Amount (000s) | | Value (Note 1)
(000s) |
Georgia - continued |
Georgia Muni. Elec. Auth. Pwr. Rev. Series 1993 CC, 4.8% 1/1/06 (MBIA Insured) | | $ 7,050 | | $ 7,478 |
Gwinnett County Gen. Oblig. 4% 1/1/06 | | 1,000 | | 1,047 |
Henry County Wtr. & Swr. Auth. Rev. 5% 2/1/08 (MBIA Insured) | | 1,095 | | 1,211 |
| | 42,053 |
Hawaii - 1.3% |
Hawaii Arpts. Sys. Rev.: | | | | |
Series 2000 B, 8% 7/1/10 (FGIC Insured) (e) | | 3,850 | | 4,845 |
Series 2001, 5.5% 7/1/05 (FGIC Insured) (e) | | 3,000 | | 3,171 |
Hawaii Gen. Oblig.: | | | | |
Series 2001 CV: | | | | |
5% 8/1/05 (FGIC Insured) | | 3,610 | | 3,809 |
5.5% 8/1/10 (FGIC Insured) | | 4,570 | | 5,276 |
Series CS, 5% 4/1/08 (MBIA Insured) | | 2,200 | | 2,431 |
Series CU, 5.75% 10/1/11 (MBIA Insured) | | 3,210 | | 3,717 |
Honolulu City & County Gen. Oblig. Series B, 5.5% 11/1/04 (FGIC Insured) | | 465 | | 482 |
| | 23,731 |
Illinois - 7.8% |
Chicago Gen. Oblig.: | | | | |
(Neighborhoods Alive 21 Prog.): | | | | |
5% 1/1/07 (MBIA Insured) | | 1,360 | | 1,480 |
5% 1/1/08 (MBIA Insured) | | 1,190 | | 1,311 |
5% 1/1/07 (FGIC Insured) | | 1,000 | | 1,088 |
Chicago Midway Arpt. Rev. Series 2001 B, 5% 1/1/07 (FSA Insured) | | 1,000 | | 1,087 |
Chicago O'Hare Int'l. Arpt. Rev.: | | | | |
Series 2001 C: | | | | |
5% 1/1/05 (AMBAC Insured) (e) | | 1,415 | | 1,469 |
5% 1/1/07 (AMBAC Insured) (e) | | 2,670 | | 2,872 |
5.25% 1/1/06 (AMBAC Insured) (e) | | 2,335 | | 2,479 |
Series A, 6% 1/1/05 (AMBAC Insured) | | 1,030 | | 1,079 |
5.5% 1/1/10 (AMBAC Insured) (e) | | 5,000 | | 5,564 |
Chicago Park District Series C, 5% 1/1/11 (AMBAC Insured) | | 2,515 | | 2,818 |
Chicago Pub. Bldg. Commision Bldg. Rev. Series C, 5.5% 2/1/06 (FGIC Insured) | | 6,000 | | 6,468 |
Chicago Tax Increment Rev.: | | | | |
Series 2000 A, 0% 12/1/08 (AMBAC Insured) | | 10,000 | | 8,658 |
Series A, 0% 12/1/05 (AMBAC Insured) | | 3,000 | | 2,908 |
Municipal Bonds - continued |
| Principal
Amount (000s) | | Value (Note 1)
(000s) |
Illinois - continued |
Chicago Transit Auth. Cap. Grant Receipts Rev. Series A: | | | | |
4% 6/1/06 (AMBAC Insured) | | $ 6,000 | | $ 6,065 |
4.25% 6/1/08 (AMBAC Insured) | | 3,600 | | 3,794 |
Cook County Gen. Oblig. Series 2003 B: | | | | |
5% 11/15/06 (MBIA Insured) | | 14,685 | | 15,988 |
5% 11/15/07 (MBIA Insured) | | 5,000 | | 5,527 |
Du Page Wtr. Commission Wtr. Rev. 5% 5/1/08 (AMBAC Insured) | | 4,525 | | 5,001 |
Illinois Dev. Fin. Auth. Gas Supply Rev. (The Peoples Gas Lt. & Coke Co. Proj.) Series 2003 B, 3.05%, tender 2/1/08 (AMBAC Insured) (b) | | 6,000 | | 6,102 |
Illinois Edl. Facilities Auth. Revs. (Art Institute of Chicago Proj.) Series 2003, 3.85%, tender 3/1/11 (b) | | 12,800 | | 12,634 |
Illinois Gen. Oblig.: | | | | |
First Series: | | | | |
5% 4/1/05 (FSA Insured) | | 3,000 | | 3,136 |
5% 8/1/05 | | 1,000 | | 1,056 |
5% 8/1/06 | | 8,160 | | 8,815 |
5.25% 4/1/08 (MBIA Insured) | | 1,035 | | 1,154 |
5.5% 8/1/10 | | 1,405 | | 1,613 |
Series A: | | | | |
5% 10/1/09 | | 2,600 | | 2,905 |
5% 10/1/10 | | 3,000 | | 3,360 |
5% 6/1/07 | | 6,250 | | 6,836 |
Illinois Sales Tax Rev. 5.375% 6/15/08 | | 4,170 | | 4,686 |
Kane & DuPage Counties Cmnty. Unit School District #303 Saint Charles Series A, 5.5% 1/1/12 (FSA Insured) | | 2,270 | | 2,614 |
Kane County School District #129 Aurora West Side Series A, 5.75% 2/1/14 (FGIC Insured) | | 1,600 | | 1,831 |
Kane, McHenry, Cook & DeKalb Counties Cmnty. Unit School District #300 Carpentersville 5.5% 12/1/13 (MBIA Insured) | | 5,000 | | 5,701 |
Kendall, Kane & Will Counties Cmnty. Unit School District #308: | | | | |
5% 10/1/04 (FGIC Insured) | | 510 | | 524 |
5.25% 10/1/05 (FGIC Insured) | | 560 | | 596 |
5.25% 10/1/06 (FGIC Insured) | | 695 | | 759 |
Rosemont Gen. Oblig. (Tax Increment #3 Proj.) 0% 12/1/07 (FGIC Insured) | | 3,000 | | 2,704 |
Municipal Bonds - continued |
| Principal
Amount (000s) | | Value (Note 1)
(000s) |
Illinois - continued |
Univ. of Illinois Auxiliary Facilities Sys. Rev. Series 2001 A, 5% 4/1/08 (AMBAC Insured) | | $ 2,035 | | $ 2,245 |
Will County School District #122 Series B, 0% 11/1/08 (FSA Insured) | | 1,500 | | 1,302 |
| | 146,229 |
Indiana - 1.2% |
Indiana Health Facility Fing. Auth. Rev. (Ascension Health Cr. Group Prog.) Series 2002 F: | | | | |
5% 11/15/04 | | 1,300 | | 1,343 |
5.5% 11/15/05 | | 1,000 | | 1,071 |
5.5% 11/15/06 | | 1,000 | | 1,091 |
Indiana Univ. Revs. (Student Fee Proj.) Series H, 0% 8/1/05 (AMBAC Insured) | | 5,500 | | 5,368 |
Rockport Poll. Cont. Rev. 4.9%, tender 6/1/07 (b) | | 4,000 | | 4,212 |
Saint Joseph County Ind. Edl. Facilities Rev. (Univ. of Notre Dame Du Lac Proj.) 2.5%, tender 12/3/07 (b) | | 10,000 | | 10,000 |
| | 23,085 |
Kansas - 0.7% |
Burlington Envir. Impt. Rev. (Kansas City Pwr. & Lt. Co. Proj.): | | | | |
Series C, 2.25%, tender 9/1/04 (b) | | 7,000 | | 6,995 |
4.75%, tender 10/1/07 (b) | | 2,400 | | 2,561 |
La Cygne Envir. Impt. Rev. (Kansas City Pwr. & Lt. Co. Proj.) Series 1994, 3.9%, tender 9/1/04 (b) | | 3,700 | | 3,765 |
| | 13,321 |
Kentucky - 0.1% |
Kenton County Arpt. Board Arpt. Rev. Series B, 5% 3/1/09 (MBIA Insured) (e) | | 1,185 | | 1,295 |
Louisiana - 0.9% |
New Orleans Audubon Commission Series A: | | | | |
3% 10/1/05 (FSA Insured) | | 1,930 | | 1,980 |
4% 10/1/06 (FSA Insured) | | 1,990 | | 2,107 |
4% 10/1/07 (FSA Insured) | | 1,065 | | 1,136 |
4% 10/1/08 (FSA Insured) | | 1,105 | | 1,180 |
4% 10/1/09 (FSA Insured) | | 1,090 | | 1,162 |
5% 10/1/10 (FSA Insured) | | 1,325 | | 1,490 |
New Orleans Gen. Oblig.: | | | | |
4% 3/1/05 (MBIA Insured) | | 1,590 | | 1,639 |
Municipal Bonds - continued |
| Principal
Amount (000s) | | Value (Note 1)
(000s) |
Louisiana - continued |
New Orleans Gen. Oblig.: - continued | | | | |
4% 3/1/06 (MBIA Insured) | | $ 3,695 | | $ 3,879 |
5% 3/1/07 (MBIA Insured) | | 2,000 | | 2,186 |
| | 16,759 |
Maryland - 0.8% |
Anne Arundel County Gen. Oblig. 5% 3/1/06 | | 6,200 | | 6,657 |
Carroll County Gen. Oblig. 4% 11/1/04 | | 1,000 | | 1,024 |
Maryland Gen. Oblig. (State & Local Facilities Ln. Prog.): | | | | |
Series 2002 B, 5.25% 2/1/08 | | 2,700 | | 3,019 |
Series A, 5.25% 3/1/06 | | 4,100 | | 4,427 |
| | 15,127 |
Massachusetts - 4.9% |
Massachusetts Dev. Fin. Agcy. Rev. (Massachusetts Biomedical Research Corp. Proj.) Series C: | | | | |
5.75% 8/1/06 | | 1,200 | | 1,298 |
5.875% 8/1/08 | | 1,630 | | 1,824 |
Massachusetts Gen. Oblig.: | | | | |
Series 2001 A, 5.5% 1/1/11 | | 5,000 | | 5,702 |
Series 2002 B, 5% 2/1/06 | | 40,000 | | 42,664 |
Series 2003 A, 5.375% 8/1/08 | | 5,165 | | 5,794 |
Series 2003 C: | | | | |
5% 12/1/06 (XL Cap. Assurance, Inc. Insured) | | 13,975 | | 15,222 |
5.5% 10/1/10 (MBIA Insured) | | 1,130 | | 1,300 |
Series A, 5.5% 2/1/07 (MBIA Insured) | | 7,500 | | 8,271 |
Massachusetts Health & Edl. Facilities Auth. Rev. (Caritas Christi Oblig. Group Proj.): | | | | |
5% 7/1/04 | | 1,805 | | 1,826 |
5.5% 7/1/05 | | 1,000 | | 1,026 |
New England Ed. Ln. Marketing Corp.: | | | | |
Series A, 5.7% 7/1/05 (e) | | 2,800 | | 2,963 |
Series F, 5.625% 7/1/04 (e) | | 3,500 | | 3,577 |
Springfield Gen. Oblig. 5% 1/15/06 (MBIA Insured) | | 1,000 | | 1,066 |
| | 92,533 |
Michigan - 2.0% |
Battle Creek Downtown Dev. Auth. 6% 5/1/06 (MBIA Insured) | | 1,500 | | 1,647 |
Detroit Gen. Oblig. Series A: | | | | |
5% 4/1/06 (FSA Insured) (a) | | 2,200 | | 2,262 |
5% 4/1/07 (FSA Insured) (a) | | 6,910 | | 7,208 |
Municipal Bonds - continued |
| Principal
Amount (000s) | | Value (Note 1)
(000s) |
Michigan - continued |
Ferndale Gen. Oblig.: | | | | |
3.5% 4/1/05 (FGIC Insured) | | $ 1,280 | | $ 1,315 |
3.5% 4/1/06 (FGIC Insured) | | 1,960 | | 2,038 |
Holly Area School District Series 1999, 5.375% 5/1/11 (Pre-Refunded to 5/1/05 @ 101) (f) | | 1,275 | | 1,359 |
Michigan Gen. Oblig. Series 1995, 5.7% 12/1/12 (Pre-Refunded to 12/1/05 @ 102) (f) | | 11,985 | | 13,192 |
Michigan Hosp. Fin. Auth. Hosp. Rev. (Sparrow Hosp. Obligated Group Proj.) 5% 11/15/04 | | 1,500 | | 1,544 |
Michigan Strategic Fund Exempt Facilities Rev. (Waste Mgmt., Inc. Proj.) 4.2%, tender 8/1/04 (b)(e) | | 7,000 | | 7,096 |
| | 37,661 |
Minnesota - 1.9% |
Hopkins Independent School District #270 Series B, 4% 2/1/06 | | 2,575 | | 2,702 |
Mankato Independent School District #77 Series A, 4% 2/1/06 (FSA Insured) | | 1,420 | | 1,490 |
Minneapolis & Saint Paul Hsg. & Redev. Auth. Health Care Sys. Rev. (Health Partners Oblig. Group Proj.): | | | | |
5.25% 12/1/08 | | 1,200 | | 1,289 |
5.25% 12/1/10 | | 500 | | 529 |
Minnesota Pub. Facilities Auth. Wtr. Poll. Cont. Rev. Series A, 4.5% 3/1/07 | | 2,240 | | 2,419 |
Southern Minnesota Muni. Pwr. Agcy. Pwr. Supply Sys. Rev.: | | | | |
5% 1/1/05 | | 17,245 | | 17,875 |
5% 1/1/06 (AMBAC Insured) | | 4,580 | | 4,883 |
5% 1/1/08 (AMBAC Insured) | | 2,310 | | 2,552 |
Waconia Independent School District #110 Series A, 5% 2/1/11 (FSA Insured) | | 940 | | 1,056 |
| | 34,795 |
Mississippi - 1.4% |
Jackson Wtr. & Swr. Sys. Rev. Series 2003: | | | | |
5% 9/1/05 (FSA Insured) | | 5,285 | | 5,582 |
5% 9/1/07 (FSA Insured) | | 5,825 | | 6,407 |
5% 9/1/08 (FSA Insured) | | 2,620 | | 2,908 |
5.25% 9/1/09 (FSA Insured) | | 3,105 | | 3,512 |
5.25% 9/1/11 (FSA Insured) | | 1,595 | | 1,812 |
Municipal Bonds - continued |
| Principal
Amount (000s) | | Value (Note 1)
(000s) |
Mississippi - continued |
Mississippi Bus. Fin. Corp. Solid Waste Disp. Rev. (Waste Mgmt., Inc. Proj.) 4.65%, tender 3/1/04 (b)(e) | | $ 5,000 | | $ 5,022 |
Mississippi Higher Ed. Student Ln. Series 2000 B3, 5.3% 9/1/08 (e) | | 1,190 | | 1,285 |
| | 26,528 |
Missouri - 0.5% |
Kansas City School District Bldg. Corp. Rev.: | | | | |
(Elementary School Proj.) Series B, 5% 2/1/12 (FGIC Insured) | | 3,100 | | 3,464 |
Series A, 5% 2/1/08 (FGIC Insured) | | 2,000 | | 2,209 |
Missouri Envir. Impt. & Energy Resources Auth. Wtr. Poll. Cont. & Drinking Wtr. Rev. (State Revolving Fund Prog.) Series D, 6% 1/1/05 | | 1,100 | | 1,153 |
Saint Louis Muni. Fin. Corp. Leasehold Rev. (Civil Courts Bldg. Proj.) Series 2003 A, 5% 8/1/06 (FSA Insured) | | 1,635 | | 1,769 |
| | 8,595 |
Montana - 0.2% |
Forsyth Poll. Cont. Rev. (Portland Gen. Elec. Co. Projs.) Series A, 5.2%, tender 5/1/09 (b) | | 2,900 | | 2,996 |
Nebraska - 2.1% |
Lancaster County School District #1 (Lincoln Pub. Schools Proj.): | | | | |
3% 1/15/05 | | 1,870 | | 1,905 |
4% 1/15/06 | | 1,000 | | 1,046 |
Lincoln Wtrwks. Rev. Series 2003, 5% 8/15/05 | | 3,265 | | 3,452 |
Nebraska Pub. Pwr. District Rev.: | | | | |
Series 1998 A, 5.25% 1/1/06 (MBIA Insured) | | 5,000 | | 5,352 |
Series A: | | | | |
0% 1/1/06 (MBIA Insured) | | 24,465 | | 23,586 |
0% 1/1/07 (MBIA Insured) | | 4,000 | | 3,732 |
| | 39,073 |
Nevada - 1.5% |
Clark County Arpt. Rev. Series C: | | | | |
5% 7/1/05 (AMBAC Insured) (e) | | 800 | | 840 |
5% 7/1/06 (AMBAC Insured) (e) | | 800 | | 855 |
5% 7/1/08 (AMBAC Insured) (e) | | 2,215 | | 2,409 |
5% 7/1/09 (AMBAC Insured) (e) | | 2,700 | | 2,954 |
5% 7/1/10 (AMBAC Insured) (e) | | 1,225 | | 1,336 |
5% 7/1/11 (AMBAC Insured) (e) | | 1,790 | | 1,939 |
Municipal Bonds - continued |
| Principal
Amount (000s) | | Value (Note 1)
(000s) |
Nevada - continued |
Clark County Las Vegas-McCarran Int'l. Arpt. Passenger Facility Charge Rev. Series 2002 A, 5% 7/1/06 (MBIA Insured) (e) | | $ 5,415 | | $ 5,785 |
Clark County School District: | | | | |
Series 2000 A, 5.75% 6/15/17 (MBIA Insured) | | 1,600 | | 1,822 |
Series D, 5% 6/15/09 (MBIA Insured) | | 7,000 | | 7,831 |
Washoe County Gen. Oblig. 4% 9/1/05 (FSA Insured) | | 2,170 | | 2,264 |
| | 28,035 |
New Hampshire - 0.1% |
New Hampshire Health & Ed. Facilities Auth. Rev. (Univ. Sys. of New Hampshire Proj.) 5.25% 7/1/05 (AMBAC Insured) | | 1,695 | | 1,792 |
New Jersey - 1.3% |
New Jersey Gen. Oblig. Series E, 6% 7/15/05 | | 3,700 | | 3,961 |
New Jersey Trans. Trust Fund Auth. Series 2001 A, 5% 6/15/06 | | 6,300 | | 6,789 |
New Jersey Transit Corp.: | | | | |
Series 2000 B, 5.5% 2/1/08 (AMBAC Insured) | | 1,000 | | 1,118 |
Series 2000 C, 5.25% 2/1/04 (AMBAC Insured) | | 10,000 | | 10,029 |
North Jersey District Wtr. Supply Commission (Wanaque South Proj.) Series A, 5% 7/1/05 (MBIA Insured) | | 1,680 | | 1,769 |
| | 23,666 |
New Jersey/Pennsylvania - 0.4% |
Delaware River Joint Toll Bridge Commission Bridge Rev.: | | | | |
3% 7/1/04 | | 1,630 | | 1,645 |
5% 7/1/09 | | 5,170 | | 5,702 |
| | 7,347 |
New Mexico - 1.4% |
New Mexico Edl. Assistance Foundation Student Ln. Rev. Sr. Series IV A1, 6.5% 3/1/04 (e) | | 1,540 | | 1,549 |
New Mexico Gen. Oblig. 4% 3/1/05 | | 9,875 | | 10,191 |
San Juan County Gross Receipts Tax Rev. Series B, 2.5% 8/15/05 | | 13,600 | | 13,759 |
| | 25,499 |
New York - 6.6% |
Metro. Trans. Auth. Commuter Facilities Rev. Series A: | | | | |
5% 7/1/06 (Escrowed to Maturity) (f) | | 1,520 | | 1,651 |
5.375% 7/1/09 (Escrowed to Maturity) (f) | | 3,635 | | 4,178 |
Municipal Bonds - continued |
| Principal
Amount (000s) | | Value (Note 1)
(000s) |
New York - continued |
Metro. Trans. Auth. Svc. Contract Rev. Series B: | | | | |
4% 1/1/05 | | $ 4,265 | | $ 4,378 |
5% 1/1/06 | | 10,110 | | 10,726 |
Nassau County Gen. Oblig. Series Z: | | | | |
5% 9/1/11 (FGIC Insured) | | 800 | | 884 |
5% 9/1/12 (FGIC Insured) | | 1,500 | | 1,644 |
New York City Gen. Oblig.: | | | | |
Series 2000 A, 6.5% 5/15/11 | | 2,450 | | 2,868 |
Series A, 5.25% 11/1/14 (MBIA Insured) | | 600 | | 669 |
Series E, 6% 8/1/11 | | 1,250 | | 1,380 |
Series G, 5.25% 8/1/14 (AMBAC Insured) | | 1,000 | | 1,106 |
Series H, 5.75% 3/15/11 (FGIC Insured) | | 1,700 | | 1,977 |
New York City Transitional Fin. Auth. Rev. Series 2003 E: | | | | |
4.5% 2/1/07 | | 1,750 | | 1,879 |
4.5% 2/1/08 | | 1,500 | | 1,621 |
5% 2/1/09 | | 2,000 | | 2,224 |
New York State Dorm. Auth. Revs.: | | | | |
(City Univ. Sys. Proj.) Series 2000 A, 6.125% 7/1/12 (AMBAC Insured) | | 5,540 | | 6,538 |
Series 2003 A: | | | | |
5% 1/1/06 (AMBAC Insured) | | 1,250 | | 1,325 |
5% 1/1/07 (AMBAC Insured) | | 10,855 | | 11,722 |
5% 3/15/08 | | 2,000 | | 2,196 |
New York State Envir. Facilities Corp. State Wtr. Poll. Cont. Revolving Fund Rev. (New York City Muni. Wtr. Fin. Auth. Proj.) Series 1997 E, 6% 6/15/11 (MBIA Insured) | | 3,500 | | 4,191 |
New York State Urban Dev. Corp. Rev. (Correctional Facilities-Svc. Contract Proj.) Series B, 4.75% 1/1/28 (Pre-Refunded to 1/1/09 @ 101) (f) | | 2,615 | | 2,919 |
Tobacco Settlement Fing. Corp.: | | | | |
Series A1: | | | | |
5.25% 6/1/12 | | 5,000 | | 5,245 |
5.25% 6/1/13 | | 17,500 | | 18,526 |
Series B1, 5% 6/1/06 | | 17,815 | | 18,993 |
Triborough Bridge & Tunnel Auth. Revs.: | | | | |
Series A, 5.5% 1/1/14 (Pre-Refunded to 1/1/12 @ 100) (f) | | 3,745 | | 4,359 |
Series Y, 5.9% 1/1/08 (Escrowed to Maturity) (f) | | 10,000 | | 11,396 |
| | 124,595 |
Municipal Bonds - continued |
| Principal
Amount (000s) | | Value (Note 1)
(000s) |
New York & New Jersey - 0.9% |
Port Auth. of New York & New Jersey: | | | | |
124th Series, 5% 8/1/13 (FGIC Insured) (e) | | $ 1,200 | | $ 1,278 |
127th Series: | | | | |
5% 12/15/04 (AMBAC Insured) (e) | | 5,310 | | 5,503 |
5% 12/15/06 (AMBAC Insured) (e) | | 4,965 | | 5,394 |
5% 12/15/08 (AMBAC Insured) (e) | | 3,510 | | 3,889 |
| | 16,064 |
North Carolina - 0.8% |
Mecklenburg County Gen. Oblig. Series B, 3.25% 2/1/06 | | 3,305 | | 3,422 |
North Carolina Eastern Muni. Pwr. Agcy. Pwr. Sys. Rev.: | | | | |
Series 1993 B, 7% 1/1/08 (MBIA Insured) | | 1,500 | | 1,763 |
Series A, 5.5% 1/1/10 | | 3,000 | | 3,299 |
Series B, 6% 1/1/05 | | 2,000 | | 2,025 |
Series C, 5% 1/1/08 | | 1,190 | | 1,274 |
Series D, 5.375% 1/1/10 | | 3,700 | | 4,044 |
| | 15,827 |
North Dakota - 0.1% |
North Dakota Bldg. Auth. Lease Rev. Series A, 5.25% 6/1/05 (FGIC Insured) | | 2,060 | | 2,172 |
Ohio - 3.8% |
Cleveland Arpt. Sys. Rev. Series A, 5.5% 1/1/05 (FSA Insured) (e) | | 2,250 | | 2,339 |
Cleveland Pub. Pwr. Sys. Rev. (First Mtg. Prog.) Series 1994 A, 0% 11/15/09 (MBIA Insured) | | 2,250 | | 1,875 |
Columbus Gen. Oblig. Series 1, 5% 6/15/05 | | 1,645 | | 1,732 |
Franklin County Rev. (OCLC Online Computer Library Ctr., Inc. Proj.) 5% 4/15/07 | | 1,960 | | 2,104 |
Lakewood Hosp. Impt. Rev. (Lakewood Hosp. Assoc. Proj.) 5.5% 2/15/07 | | 1,420 | | 1,530 |
Montgomery County Rev. (Catholic Health Initiatives Proj.) 4% 9/1/04 | | 1,695 | | 1,726 |
Ohio Air Quality Dev. Auth. Rev. (Pennsylvania Pwr. Co. Proj.) 2.5%, tender 7/1/04 (b) | | 2,400 | | 2,400 |
Ohio Bldg. Auth.: | | | | |
(Adult Correctional Bldg. Fund Prog.) Series A: | | | | |
5.75% 4/1/08 | | 3,555 | | 4,040 |
6% 10/1/05 | | 5,600 | | 6,039 |
Series A, 5% 4/1/11 (FGIC Insured) | | 1,000 | | 1,127 |
Ohio Gen. Oblig.: | | | | |
Series 2003 A, 4% 3/15/05 | | 9,245 | | 9,548 |
Municipal Bonds - continued |
| Principal
Amount (000s) | | Value (Note 1)
(000s) |
Ohio - continued |
Ohio Gen. Oblig.: - continued | | | | |
Series A, 5% 2/1/05 | | $ 8,550 | | $ 8,897 |
Series IIA, 5.25% 12/1/05 | | 5,000 | | 5,354 |
Ohio Rev. Series 2003-1, 5% 6/15/08 (a) | | 5,000 | | 5,545 |
Ohio Univ. Gen. Receipts Athens: | | | | |
5% 12/1/05 (FSA Insured) | | 1,650 | | 1,759 |
5% 12/1/06 (FSA Insured) | | 3,600 | | 3,932 |
5% 12/1/07 (FSA Insured) | | 1,285 | | 1,427 |
Ohio Wtr. Dev. Auth. Poll. Cont. Facilities Rev.: | | | | |
(Cleveland Elec. Illuminating Co. Proj.) Series A, 3.4%, tender 10/1/04 (b) | | 2,350 | | 2,365 |
(Toledo Edison Co. Proj.) Series B, 4.5%, tender 9/1/05 (b) | | 7,000 | | 7,179 |
Ohio Wtr. Dev. Auth. Rev. (Fresh Wtr. Proj.) Series A, 5.4% 6/1/05 (AMBAC Insured) | | 1,000 | | 1,057 |
| | 71,975 |
Oklahoma - 0.7% |
Oklahoma City Gen. Oblig. 4% 3/1/05 (FGIC Insured) | | 1,955 | | 2,018 |
Oklahoma Dev. Fin. Auth. Rev. (Samuel Roberts Noble, Inc. Proj.): | | | | |
Series 2001, 5% 5/1/05 | | 7,615 | | 7,986 |
5% 5/1/06 | | 3,200 | | 3,444 |
| | 13,448 |
Oregon - 0.8% |
Deschutes & Jefferson Counties School District #2J Redmond: | | | | |
5.5% 6/1/05 (FGIC Insured) | | 1,000 | | 1,058 |
5.5% 6/1/06 (FGIC Insured) | | 2,610 | | 2,847 |
Eugene Elec. Util. Rev. Series A: | | | | |
5.25% 8/1/05 (FSA Insured) | | 1,210 | | 1,277 |
5.25% 8/1/06 (FSA Insured) | | 1,280 | | 1,379 |
5.25% 8/1/07 (FSA Insured) | | 1,350 | | 1,481 |
5.25% 8/1/08 (FSA Insured) | | 1,425 | | 1,582 |
Oregon Dept. of Trans. Hwy. User Tax Rev. 5.5% 11/15/13 | | 3,365 | | 3,894 |
Oregon Gen. Oblig. 8.25% 1/1/07 | | 1,000 | | 1,178 |
| | 14,696 |
Municipal Bonds - continued |
| Principal
Amount (000s) | | Value (Note 1)
(000s) |
Pennsylvania - 3.0% |
Allegheny County Hosp. Dev. Auth. Rev. (Univ. of Pittsburgh Med. Ctr. Proj.) Series B: | | | | |
5.5% 6/15/05 | | $ 2,545 | | $ 2,670 |
5.5% 6/15/06 | | 3,065 | | 3,277 |
5.5% 6/15/07 | | 2,000 | | 2,163 |
Allegheny County San. Auth. Swr. Rev. 6% 12/1/11 (MBIA Insured) | | 1,495 | | 1,772 |
Hazleton Area School District 6.5% 3/1/06 (FSA Insured) | | 1,155 | | 1,273 |
Pennsylvania Econ. Dev. Fing. Auth. Exempt Facilities Rev. (Shippingport Proj.) Series A, 5%, tender 6/1/05 (b)(e) | | 6,200 | | 6,317 |
Pennsylvania Higher Edl. Facilities Auth. Rev. (UPMC Health Sys. Proj.) Series 2001 A, 5.75% 1/15/09 | | 1,750 | | 1,918 |
Pennsylvania State Univ.: | | | | |
5% 3/1/05 | | 6,935 | | 7,234 |
5% 3/1/06 | | 7,280 | | 7,795 |
Philadelphia Gas Works Rev. First Series A, 5.25% 7/1/05 (FSA Insured) | | 5,000 | | 5,269 |
Philadelphia Muni. Auth. Rev. Series A: | | | | |
4% 5/15/05 (FSA Insured) | | 2,500 | | 2,592 |
5% 5/15/07 (FSA Insured) | | 5,500 | | 6,026 |
5% 5/15/08 (FSA Insured) | | 5,000 | | 5,537 |
Wyoming Valley San. Auth. Swr. Rev. 5% 11/15/06 (MBIA Insured) | | 1,865 | | 2,032 |
| | 55,875 |
Rhode Island - 0.3% |
Rhode Island Health & Edl. Bldg. Corp. Rev. (Johnson & Wales Univ. Proj.): | | | | |
4% 4/1/05 (XL Cap. Assurance, Inc. Insured) | | 1,270 | | 1,312 |
5% 4/1/06 (XL Cap. Assurance, Inc. Insured) | | 2,225 | | 2,381 |
5% 4/1/08 (XL Cap. Assurance, Inc. Insured) | | 1,700 | | 1,877 |
| | 5,570 |
South Carolina - 1.8% |
Berkeley County School District 7% 4/1/07 | | 2,615 | | 3,011 |
Piedmont Muni. Pwr. Agcy. Elec. Rev. 5.6% 1/1/09 (MBIA Insured) | | 2,345 | | 2,684 |
Richland County School District #1 4.75% 3/1/11 (FSA Insured) | | 2,520 | | 2,788 |
Richland County School District #2 Series B, 5% 2/1/05 (FGIC Insured) | | 1,000 | | 1,041 |
Municipal Bonds - continued |
| Principal
Amount (000s) | | Value (Note 1)
(000s) |
South Carolina - continued |
Rock Hill Util. Sys. Rev. Series 2003 A: | | | | |
5% 1/1/08 (FSA Insured) | | $ 1,850 | | $ 2,042 |
5% 1/1/09 (FSA Insured) | | 1,945 | | 2,173 |
South Carolina Pub. Svc. Auth. Rev.: | | | | |
Series 2002 A: | | | | |
5% 1/1/05 (FSA Insured) | | 2,000 | | 2,076 |
5% 1/1/06 (FSA Insured) | | 1,705 | | 1,819 |
5% 1/1/07 (FSA Insured) | | 4,105 | | 4,474 |
Series A, 5.5% 1/1/11 (MBIA Insured) | | 3,000 | | 3,428 |
Series D: | | | | |
5% 1/1/06 | | 2,500 | | 2,664 |
5% 1/1/07 | | 5,000 | | 5,436 |
| | 33,636 |
Tennessee - 1.8% |
Elizabethton Health & Edl. Facilities Board Rev. (First Mtg. Prog.) 6% 7/1/11 (MBIA Insured) | | 2,005 | | 2,372 |
Memphis Gen. Oblig. 6% 11/1/06 | | 1,585 | | 1,767 |
Memphis-Shelby County Arpt. Auth. Arpt. Rev.: | | | | |
Series A: | | | | |
4% 9/1/06 (MBIA Insured) | | 1,500 | | 1,582 |
4.5% 9/1/08 (MBIA Insured) | | 1,620 | | 1,763 |
4.5% 9/1/09 (MBIA Insured) | | 1,685 | | 1,840 |
4% 9/1/05 (MBIA Insured) | | 1,445 | | 1,507 |
Metro. Nashville Arpt. Auth. Rev. Series C, 5% 7/1/06 (FGIC Insured) (e) | | 1,675 | | 1,792 |
Shelby County Gen. Oblig. Series A: | | | | |
0% 5/1/10 (Pre-Refunded to 5/1/05 @ 74.444) (f) | | 15,750 | | 11,517 |
0% 5/1/12 (Pre-Refunded to 5/1/05 @ 65.1568) (f) | | 15,130 | | 9,684 |
| | 33,824 |
Texas - 14.0% |
Arlington Independent School District 0% 2/15/16 (Pre-Refunded to 2/15/05 @ 51.4017) (f) | | 6,820 | | 3,455 |
Austin Arpt. Sys. Rev. Series A: | | | | |
6.5% 11/15/04 (MBIA Insured) (e) | | 3,215 | | 3,362 |
6.5% 11/15/05 (Escrowed to Maturity) (e)(f) | | 940 | | 1,026 |
6.5% 11/15/05 (MBIA Insured) (e) | | 6,870 | | 7,452 |
Austin Gen. Oblig. 5.5% 9/1/15 (Pre-Refunded to 9/1/05 @ 100) (f) | | 3,380 | | 3,608 |
Austin Util. Sys. Rev.: | | | | |
Series 1992 A, 0% 11/15/09 (MBIA Insured) | | 4,130 | | 3,438 |
Municipal Bonds - continued |
| Principal
Amount (000s) | | Value (Note 1)
(000s) |
Texas - continued |
Austin Util. Sys. Rev.: - continued | | | | |
Series A: | | | | |
0% 11/15/10 (MBIA Insured) | | $ 3,100 | | $ 2,448 |
5.5% 11/15/06 | | 5,000 | | 5,123 |
Birdville Independent School District 5% 2/15/10 | | 1,300 | | 1,453 |
Brazos River Auth. Poll. Cont. Rev. (Texas Utils. Elec. Co. Proj.) Series 1995 B, 5.05%, tender 6/19/06 (b)(e) | | 6,500 | | 6,810 |
Corpus Christi Gen. Oblig.: | | | | |
4% 3/1/05 (FSA Insured) | | 1,200 | | 1,238 |
4% 3/1/06 (FSA Insured) | | 1,285 | | 1,349 |
5% 3/1/07 (FSA Insured) | | 2,735 | | 2,983 |
Corpus Christi Util. Sys. Rev. 3% 7/15/05 (FSA Insured) | | 1,285 | | 1,317 |
Cypress-Fairbanks Independent School District: | | | | |
Series B, 0% 8/1/07 (AMBAC Insured) | | 10,000 | | 9,132 |
4.5% 2/15/06 | | 2,245 | | 2,377 |
5% 2/15/08 | | 2,000 | | 2,211 |
5% 2/15/10 | | 1,300 | | 1,453 |
5% 2/15/11 | | 4,940 | | 5,532 |
Deer Park Independent School District 6% 2/15/05 | | 2,000 | | 2,106 |
El Paso Wtr. & Swr. Rev.: | | | | |
5% 3/1/06 (AMBAC Insured) | | 1,000 | | 1,071 |
5% 3/1/07 (AMBAC Insured) | | 2,000 | | 2,183 |
5% 3/1/08 (AMBAC Insured) | | 2,770 | | 3,060 |
Fort Worth Gen. Oblig. Series A: | | | | |
5% 3/1/05 | | 1,000 | | 1,043 |
5% 3/1/06 | | 1,000 | | 1,071 |
Frisco Gen. Oblig.: | | | | |
Series 2003 A: | | | | |
4% 2/15/07 (FSA Insured) | | 1,320 | | 1,400 |
4% 2/15/08 (FSA Insured) | | 1,145 | | 1,221 |
5% 2/15/10 (FSA Insured) | | 1,710 | | 1,912 |
4% 2/15/06 (FSA Insured) | | 2,975 | | 3,119 |
4% 2/15/07 (FSA Insured) | | 3,115 | | 3,305 |
Garland Independent School District: | | | | |
Series A: | | | | |
4% 2/15/05 | | 1,000 | | 1,031 |
4% 2/15/06 | | 500 | | 524 |
0% 2/15/07 | | 1,610 | | 1,494 |
Harris County Gen. Oblig. Series A, 0% 8/15/07 (FGIC Insured) | | 4,400 | | 4,014 |
Municipal Bonds - continued |
| Principal
Amount (000s) | | Value (Note 1)
(000s) |
Texas - continued |
Harris County Health Facilities Dev. Corp. Rev. (Saint Luke's Episcopal Hosp. Proj.) Series 2001 A, 5.5% 2/15/09 | | $ 3,710 | | $ 4,080 |
Houston Gen. Oblig.: | | | | |
Series A, 5% 3/1/05 | | 8,800 | | 9,177 |
Series A1, 5% 3/1/11 (MBIA Insured) | | 3,335 | | 3,737 |
5% 3/1/09 (MBIA Insured) | | 1,700 | | 1,898 |
Houston Wtr. & Swr. Sys. Rev. Series B: | | | | |
5.5% 12/1/07 (AMBAC Insured) | | 5,455 | | 6,138 |
5.5% 12/1/08 (AMBAC Insured) | | 6,000 | | 6,830 |
Killeen Independent School District 4% 2/15/08 | | 1,200 | | 1,280 |
La Porte Independent School District 4% 2/15/08 | | 2,000 | | 2,133 |
Lewisville Gen. Oblig. 4% 2/15/06 (FSA Insured) | | 1,300 | | 1,363 |
McKinney Independent School District 5% 2/15/05 | | 2,280 | | 2,376 |
Mesquite Independent School District Series A, 0% 8/15/06 | | 1,115 | | 1,056 |
New Braunfels Independent School District 0% 2/1/07 | | 2,000 | | 1,858 |
North East Texas Independent School District 7% 2/1/11 | | 3,600 | | 4,402 |
North Texas Tollway Auth. Dallas North Tollway Sys. Rev. Series C: | | | | |
5% 1/1/09 (FSA Insured) | | 2,000 | | 2,219 |
5%, tender 7/1/08 (FSA Insured) (b) | | 2,650 | | 2,931 |
Northside Independent School District Series B, 2.45%, tender 8/1/06 (Liquidity Facility Dexia Cr. Local de France) (b) | | 7,500 | | 7,504 |
Pasadena Independent School District 5% 2/15/05 | | 11,445 | | 11,926 |
Port Houston Auth. Harris County 6% 10/1/06 (FGIC Insured) (e) | | 2,000 | | 2,212 |
Red River Ed. Fin. Corp. Ed. Rev. (Texas Christian Univ. Proj.) Series 2001, 3.25%, tender 3/1/04 (b) | | 6,000 | | 6,019 |
Rockwall Independent School District: | | | | |
4% 2/15/05 | | 1,155 | | 1,191 |
4% 2/15/06 | | 2,370 | | 2,485 |
5% 2/15/07 | | 3,510 | | 3,829 |
5% 2/15/08 | | 3,825 | | 4,229 |
5% 2/15/09 | | 4,690 | | 5,231 |
San Antonio Elec. & Gas Systems Rev.: | | | | |
Series 1991 A, 0% 2/1/05 (Escrowed to Maturity) (f) | | 1,000 | | 986 |
Series 2000 A, 5.75% 2/1/15 (Pre-Refunded to 2/1/10 @ 100) (f) | | 5,000 | | 5,806 |
5.25% 2/1/07 | | 2,500 | | 2,736 |
5.25% 2/1/08 | | 1,000 | | 1,111 |
Texas A&M Univ. Rev. 5.75% 5/15/05 | | 3,000 | | 3,178 |
Municipal Bonds - continued |
| Principal
Amount (000s) | | Value (Note 1)
(000s) |
Texas - continued |
Texas Gen. Oblig.: | | | | |
(College Student Ln. Prog.): | | | | |
5% 8/1/06 (e) | | $ 6,770 | | $ 7,232 |
5% 8/1/11 (e) | | 3,000 | | 3,243 |
Series C, 0% 4/1/08 (Escrowed to Maturity) (f) | | 3,100 | | 2,776 |
Texas Pub. Fin. Auth. Bldg. Rev.: | | | | |
(Dept. of Criminal Justice Prog.) Series A, 5% 2/1/07 (FSA Insured) | | 2,000 | | 2,178 |
0% 2/1/05 (MBIA Insured) | | 3,725 | | 3,672 |
Texas State Univ. Sys. Fing. Rev. 3% 3/15/05 (FSA Insured) | | 1,830 | | 1,868 |
Texas Tech Univ. Revs. Ninth Series: | | | | |
4% 2/15/09 (AMBAC Insured) | | 1,460 | | 1,554 |
5% 2/15/11 (AMBAC Insured) | | 1,250 | | 1,398 |
Trinity River Auth. Red Oak Creek Sys. Rev. 3.5% 2/1/06 (FSA Insured) | | 1,270 | | 1,318 |
Trinity River Auth. Reg'l. Wastewtr. Sys. Rev.: | | | | |
5% 8/1/06 (MBIA Insured) | | 4,000 | | 4,320 |
5% 8/1/07 (MBIA Insured) | | 1,595 | | 1,751 |
Tyler Health Facilities Dev. Corp. Hosp. Rev. (Mother Frances Hosp. Reg'l. Health Care Ctr. Proj.): | | | | |
4% 7/1/05 | | 1,800 | | 1,848 |
4.5% 7/1/06 | | 1,220 | | 1,269 |
5% 7/1/07 | | 1,000 | | 1,057 |
Univ. of Houston Univ. Revs. Series A: | | | | |
3.5% 2/15/06 (FSA Insured) | | 4,955 | | 5,144 |
3.75% 2/15/07 (FSA Insured) | | 5,100 | | 5,369 |
4% 2/15/08 (FSA Insured) | | 5,265 | | 5,605 |
Webb County Gen. Oblig.: | | | | |
5% 2/15/04 (FGIC Insured) | | 705 | | 708 |
5% 2/15/05 (FGIC Insured) | | 1,005 | | 1,047 |
5% 2/15/06 (FGIC Insured) | | 1,055 | | 1,128 |
5% 2/15/07 (FGIC Insured) | | 1,110 | | 1,211 |
5% 2/15/08 (FGIC Insured) | | 1,170 | | 1,294 |
Wichita Falls Independent School District 0% 2/1/10 | | 2,325 | | 1,892 |
| | 263,124 |
Utah - 1.0% |
Box Elder County School District 5% 6/15/05 | | 3,620 | | 3,812 |
Salt Lake City School District Series A, 6.25% 3/1/13 (Pre-Refunded to 3/1/05 @ 100) (f) | | 3,695 | | 3,912 |
Municipal Bonds - continued |
| Principal
Amount (000s) | | Value (Note 1)
(000s) |
Utah - continued |
Salt Lake County Wtr. Conservancy District Rev. Series A: | | | | |
0% 10/1/11 (AMBAC Insured) | | $ 3,800 | | $ 2,872 |
0% 10/1/12 (AMBAC Insured) | | 3,800 | | 2,723 |
0% 10/1/13 (AMBAC Insured) | | 3,760 | | 2,565 |
Utah Muni. Pwr. Agcy. Elec. Sys. Rev. Series A, 4% 7/1/05 (AMBAC Insured) | | 1,000 | | 1,038 |
Utah Trans. Auth. Sales Tax Rev. Series A, 5% 6/15/05 (FSA Insured) | | 1,550 | | 1,629 |
| | 18,551 |
Virginia - 0.1% |
Virginia Commonwealth Trans. Board Trans. Rev. (U.S. Route 58 Corridor Dev. Prog.) Series B, 5.375% 5/15/12 | | 1,800 | | 2,036 |
Washington - 7.7% |
Clark County Pub. Util. District #1 Elec. Rev.: | | | | |
Series B: | | | | |
5% 1/1/06 (FSA Insured) | | 1,375 | | 1,465 |
5% 1/1/07 (FSA Insured) | | 1,395 | | 1,516 |
5.25% 1/1/08 (FSA Insured) | | 1,515 | | 1,683 |
5.25% 1/1/09 (FSA Insured) | | 1,595 | | 1,788 |
5% 1/1/11 (MBIA Insured) | | 1,680 | | 1,876 |
Energy Northwest Elec. Rev. (#3 Proj.) Series B, 6% 7/1/16 (AMBAC Insured) | | 5,000 | | 5,789 |
King & Snohomish Counties School District #417 Northshore: | | | | |
5.5% 12/1/14 (FSA Insured) | | 6,300 | | 7,173 |
5.75% 12/1/15 (FSA Insured) | | 2,500 | | 2,874 |
King County Swr. Rev. Series B: | | | | |
5% 1/1/05 (FSA Insured) | | 2,000 | | 2,076 |
5% 1/1/06 (FSA Insured) | | 3,000 | | 3,196 |
5% 1/1/07 (FSA Insured) | | 5,000 | | 5,434 |
5.25% 1/1/08 (FSA Insured) | | 3,500 | | 3,888 |
Port of Seattle Rev.: | | | | |
Series B: | | | | |
5.25% 9/1/06 (FGIC Insured) (e) | | 2,330 | | 2,518 |
5.5% 2/1/06 (MBIA Insured) (e) | | 4,250 | | 4,554 |
5.5% 2/1/07 (MBIA Insured) (e) | | 5,775 | | 6,321 |
Series D, 5.75% 11/1/15 (FGIC Insured) (e) | | 3,640 | | 4,067 |
Seattle Muni. Lt. & Pwr. Rev. 5.25% 3/1/07 (FSA Insured) | | 1,690 | | 1,858 |
Municipal Bonds - continued |
| Principal
Amount (000s) | | Value (Note 1)
(000s) |
Washington - continued |
Snohomish County Pub. Hosp. District #2 (Stevens Health Care Proj.): | | | | |
4% 12/1/05 (FGIC Insured) | | $ 1,570 | | $ 1,639 |
4.5% 12/1/09 (FGIC Insured) | | 1,000 | | 1,089 |
Washington Gen. Oblig.: | | | | |
Series 2001 RA, 5.25% 9/1/06 | | 11,750 | | 12,772 |
Series A: | | | | |
3.5% 1/1/06 (MBIA Insured) | | 12,500 | | 12,944 |
4% 1/1/08 (MBIA Insured) | | 33,175 | | 35,347 |
5.5% 7/1/11 | | 3,500 | | 3,987 |
Series C, 5% 1/1/08 (FSA Insured) | | 8,320 | | 9,180 |
Washington Pub. Pwr. Supply Sys. Nuclear Proj. #2 Rev. Series A, 5.75% 7/1/08 | | 3,000 | | 3,397 |
Washington Pub. Pwr. Supply Sys. Nuclear Proj. #3 Rev. Series C, 5% 7/1/06 (FSA Insured) | | 5,000 | | 5,394 |
| | 143,825 |
Wisconsin - 1.3% |
Wisconsin Clean Wtr. Rev. Series 2, 5% 6/1/05 (MBIA Insured) | | 4,840 | | 5,084 |
Wisconsin Health & Edl. Facilities Auth. Rev.: | | | | |
(Hosp. Sisters Svcs., Inc. Proj.) Series 2003 B, 4%, tender 12/1/06 (FSA Insured) (b) | | 15,000 | | 15,716 |
(Wheaton Franciscan Svcs., Inc. Proj.) Series A: | | | | |
5% 8/15/09 | | 1,000 | | 1,079 |
5% 8/15/10 | | 1,870 | | 2,001 |
| | 23,880 |
TOTAL MUNICIPAL BONDS (Cost $1,772,670) | 1,816,236 |
Municipal Notes - 2.5% |
| | | |
Kansas - 0.3% |
Wichita Solid Waste Disp. Rev. (Weyerhaeuser Co. Proj.) 2.23%, VRDN (b)(e) | 4,950 | | 4,950 |
Massachusetts - 1.7% |
Acton & Boxborough Reg'l. School District BAN 3.5% 4/1/05 | 8,000 | | 8,216 |
Lynnfield Gen. Oblig. BAN 2.5% 3/1/05 | 24,000 | | 24,342 |
| | 32,558 |
Municipal Notes - continued |
| Principal
Amount (000s) | | Value (Note 1)
(000s) |
Oklahoma - 0.3% |
Southeastern Oklahoma Indl. Auth. Solid Waste Disp. Rev. (Weyerhaeuser Co. Proj.) Series 2000 A, 2.1%, VRDN (b)(e) | $ 6,000 | | $ 6,000 |
Oregon - 0.2% |
Lane County Swr. Disp. Rev. (Weyerhauser Co. Proj.) 2.23%, VRDN (b)(e) | 4,200 | | 4,200 |
TOTAL MUNICIPAL NOTES (Cost $47,669) | 47,708 |
Money Market Funds - 0.8% |
| Shares | | |
Fidelity Municipal Cash Central Fund, 1.3% (c)(d)
(Cost $14,115) | 14,115,000 | | 14,115 |
TOTAL INVESTMENT PORTFOLIO - 100.2% (Cost $1,834,454) | | 1,878,059 |
NET OTHER ASSETS - (0.2)% | | (3,707) |
NET ASSETS - 100% | $ 1,874,352 |
Security Type Abbreviations |
BAN - BOND ANTICIPATION NOTE |
VRDN - VARIABLE RATE DEMAND NOTE |
Legend |
(a) Security or a portion of the security purchased on a delayed delivery or when-issued basis. |
(b) The coupon rate shown on floating or adjustable rate securities represents the rate at period end. |
(c) Information in this report regarding holdings by state and security types does not reflect the holdings of the Fidelity Municipal Cash Central Fund. |
(d) The rate quoted is the annualized seven-day yield of the fund at period end. A complete listing of the fund's holdings as of its most recent fiscal year end is available upon request. |
(e) Private activity obligations whose interest is subject to the federal alternative minimum tax for individuals. |
(f) Security collateralized by an amount sufficient to pay interest and principal. |
(g) Restricted securities - Investment in securities not registered under the Securities Act of 1933 (excluding 144A issues). At the end of the period, the value of restricted securities (excluding 144A issues) amounted to $10,223,000 or 0.5% of net assets. |
Additional information on each holding is as follows: |
Security | Acquisition
Date | Acquisition
Cost (000s) |
Univ. of California Revs. (UCLA Med. Ctr. Proj.) 4.55% 12/1/09 | 3/6/02 | $ 9,600 |
Other Information |
The distribution of municipal securities by revenue source, as a percentage of total net assets, is as follows: |
General Obligations | 45.3% |
Electric Utilities | 15.1 |
Transportation | 9.3 |
Escrowed/Pre-Refunded | 6.2 |
Water & Sewer | 6.0 |
Health Care | 5.8 |
Education | 5.4 |
Others* (individually less than 5%) | 6.9 |
| 100.0% |
*Includes cash equivalents and net other assets |
Purchases and sales of securities, other than short-term securities, aggregated $815,297,000 and $610,795,000, respectively. |
Income Tax Information |
The fund hereby designates approximately $12,640,000 as a capital gain dividend for the purpose of the dividend paid deduction. |
See accompanying notes which are an integral part of the financial statements.
Annual Report
Financial Statements
Statement of Assets and Liabilities
Amounts in thousands (except per-share amounts) | December 31, 2003 |
| | |
Assets | | |
Investment in securities, at value (cost $1,834,454) - See accompanying schedule | | $ 1,878,059 |
Cash | | 92 |
Receivable for fund shares sold | | 3,158 |
Interest receivable | | 24,458 |
Prepaid expenses | | 11 |
Total assets | | 1,905,778 |
| | |
Liabilities | | |
Payable for investments purchased
Regular delivery | $ 12 | |
Delayed delivery | 27,159 | |
Payable for fund shares redeemed | 2,597 | |
Distributions payable | 869 | |
Accrued management fee | 585 | |
Distribution fees payable | 11 | |
Other affiliated payables | 145 | |
Other payables and accrued expenses | 48 | |
Total liabilities | | 31,426 |
| | |
Net Assets | | $ 1,874,352 |
Net Assets consist of: | | |
Paid in capital | | $ 1,829,370 |
Undistributed net investment income | | 351 |
Accumulated undistributed net realized gain (loss) on investments | | 1,026 |
Net unrealized appreciation (depreciation) on investments | | 43,605 |
Net Assets | | $ 1,874,352 |
See accompanying notes which are an integral part of the financial statements.
Annual Report
Financial Statements - continued
Statement of Assets and Liabilities - continued
Amounts in thousands (except per-share amounts) | December 31, 2003 |
| | |
Calculation of Maximum Offering Price
Class A:
Net Asset Value and redemption price per share
($9,104 ÷ 867 shares) | | $ 10.50 |
| | |
Maximum offering price per share (100/96.25 of $10.50) | | $ 10.91 |
Class T:
Net Asset Value and redemption price per share ($12,104 ÷ 1,155 shares) | | $ 10.48 |
| | |
Maximum offering price per share (100/97.25 of $10.48) | | $ 10.78 |
Class B:
Net Asset Value and offering price per share
($2,455 ÷ 234 shares) A | | $ 10.49 |
| | |
Class C:
Net Asset Value and offering price per share
($7,584.1 ÷ 723.39 shares) A | | $ 10.48 |
| | |
Spartan Short-Intermediate Municipal Income:
Net Asset Value, offering price and redemption price per share ($1,842,691 ÷ 175,754 shares) | | $ 10.48 |
| | |
Institutional Class:
Net Asset Value, offering price and redemption price per share ($414.3 ÷ 39.511 shares) | | $ 10.49 |
A Redemption price per share is equal to net asset value less any applicable contingent deferred sales charge.
See accompanying notes which are an integral part of the financial statements.
Annual Report
Statement of Operations
Amounts in thousands | Year ended December 31, 2003 |
| | |
Investment Income | | |
Interest | | $ 56,981 |
| | |
Expenses | | |
Management fee | $ 6,841 | |
Transfer agent fees | 1,292 | |
Distribution fees | 36 | |
Accounting fees and expenses | 414 | |
Non-interested trustees' compensation | 9 | |
Custodian fees and expenses | 29 | |
Registration fees | 179 | |
Audit | 55 | |
Legal | 27 | |
Miscellaneous | 7 | |
Total expenses before reductions | 8,889 | |
Expense reductions | (308) | 8,581 |
Net investment income (loss) | | 48,400 |
Realized and Unrealized Gain (Loss) Net realized gain (loss) on: | | |
Investment securities | 14,019 | |
Swap agreements | (1,302) | |
Total net realized gain (loss) | | 12,717 |
Change in net unrealized appreciation (depreciation) on: Investment securities | (8,702) | |
Swap agreements | 131 | |
Total change in net unrealized appreciation (depreciation) | | (8,571) |
Net gain (loss) | | 4,146 |
Net increase (decrease) in net assets resulting from operations | | $ 52,546 |
See accompanying notes which are an integral part of the financial statements.
Annual Report
Financial Statements - continued
Statement of Changes in Net Assets
Amounts in thousands | Year ended
December 31,
2003 | Year ended
December 31,
2002 |
Increase (Decrease) in Net Assets | | |
Operations | | |
Net investment income (loss) | $ 48,400 | $ 44,777 |
Net realized gain (loss) | 12,717 | 10,257 |
Change in net unrealized appreciation (depreciation) | (8,571) | 30,522 |
Net increase (decrease) in net assets resulting
from operations | 52,546 | 85,556 |
Distributions to shareholders from net investment income | (48,268) | (44,681) |
Distributions to shareholders from net realized gain | (12,396) | (9,372) |
Total distributions | (60,664) | (54,053) |
Share transactions - net increase (decrease) | 199,628 | 467,957 |
Redemption fees | 43 | 66 |
Total increase (decrease) in net assets | 191,553 | 499,526 |
| | |
Net Assets | | |
Beginning of period | 1,682,799 | 1,183,273 |
End of period (including undistributed net investment income of $351 and undistributed net investment income of $238, respectively) | $ 1,874,352 | $ 1,682,799 |
See accompanying notes which are an integral part of the financial statements.
Annual Report
Financial Highlights - Class A
Years ended December 31, | 2003 F |
Selected Per-Share Data | |
Net asset value, beginning of period | $ 10.49 |
Income from Investment Operations | |
Net investment income (loss) E | .115 |
Net realized and unrealized gain (loss) | .071 |
Total from investment operations | .186 |
Distributions from net investment income | (.111) |
Distributions from net realized gain | (.065) |
Total distributions | (.176) |
Redemption fees added to paid in capitalE | - H |
Net asset value, end of period | $ 10.50 |
Total Return B, C, D | 1.78% |
Ratios to Average Net Assets G | |
Expenses before expense reductions | .65% A |
Expenses net of voluntary waivers, if any | .65% A |
Expenses net of all reductions | .64% A |
Net investment income (loss) | 2.52% A |
Supplemental Data | |
Net assets, end of period (in millions) | $ 9 |
Portfolio turnover rate | 34% |
A Annualized
B Total returns for periods of less than one year are not annualized.
C Total returns would have been lower had certain expenses not been reduced during the periods shown.
D Total returns do not include the effect of the sales charges.
E Calculated based on average shares outstanding during the period.
F For the period July 23, 2003 (commencement of sale of shares) to December 31, 2003.
G Expense ratios reflect operating expenses of the class. Expenses before reductions do not reflect amounts reimbursed by the investment adviser or reductions from brokerage service arrangements or other expense offset arrangements and do not represent the amount paid by the class during periods when reimbursements or reductions occur. Expense ratios before reductions for start-up periods may not be representative of longer-term operating periods. Expenses net of any voluntary waivers reflect expenses after reimbursement by the investment adviser but prior to reductions from brokerage service arrangements or other expense offset arrangements. Expenses net of all reductions represent the net expenses paid by the class.
H Amount represents less than .001 per share.
See accompanying notes which are an integral part of the financial statements.
Annual Report
Financial Highlights - Class T
Years ended December 31, | 2003 F |
Selected Per-Share Data | |
Net asset value, beginning of period | $ 10.49 |
Income from Investment Operations | |
Net investment income (loss) E | .110 |
Net realized and unrealized gain (loss) | .050 |
Total from investment operations | .160 |
Distributions from net investment income | (.105) |
Distributions from net realized gain | (.065) |
Total distributions | (.170) |
Redemption fees added to paid in capitalE | - H |
Net asset value, end of period | $ 10.48 |
Total Return B, C, D | 1.54% |
Ratios to Average Net Assets G | |
Expenses before expense reductions | .77% A |
Expenses net of voluntary waivers, if any | .77% A |
Expenses net of all reductions | .76% A |
Net investment income (loss) | 2.41% A |
Supplemental Data | |
Net assets, end of period (in millions) | $ 12 |
Portfolio turnover rate | 34% |
A Annualized
B Total returns for periods of less than one year are not annualized.
C Total returns would have been lower had certain expenses not been reduced during the periods shown.
D Total returns do not include the effect of the sales charges.
E Calculated based on average shares outstanding during the period.
F For the period July 23, 2003 (commencement of sale of shares) to December 31, 2003.
G Expense ratios reflect operating expenses of the class. Expenses before reductions do not reflect amounts reimbursed by the investment adviser or reductions from brokerage service arrangements or other expense offset arrangements and do not represent the amount paid by the class during periods when reimbursements or reductions occur. Expense ratios before reductions for start-up periods may not be representative of longer-term operating periods. Expenses net of any voluntary waivers reflect expenses after reimbursement by the investment adviser but prior to reductions from brokerage service arrangements or other expense offset arrangements. Expenses net of all reductions represent the net expenses paid by the class.
H Amount represents less than .001 per share.
See accompanying notes which are an integral part of the financial statements.
Annual Report
Financial Highlights - Class B
Years ended December 31, | 2003 F |
Selected Per-Share Data | |
Net asset value, beginning of period | $ 10.49 |
Income from Investment Operations | |
Net investment income (loss) E | .081 |
Net realized and unrealized gain (loss) | .059 |
Total from investment operations | .140 |
Distributions from net investment income | (.075) |
Distributions from net realized gain | (.065) |
Total distributions | (.140) |
Redemption fees added to paid in capitalE | - H |
Net asset value, end of period | $ 10.49 |
Total Return B, C, D | 1.34% |
Ratios to Average Net Assets G | |
Expenses before expense reductions | 1.40% A |
Expenses net of voluntary waivers, if any | 1.40% A |
Expenses net of all reductions | 1.39% A |
Net investment income (loss) | 1.78% A |
Supplemental Data | |
Net assets, end of period (in millions) | $ 2 |
Portfolio turnover rate | 34% |
A Annualized
B Total returns for periods of less than one year are not annualized.
C Total returns would have been lower had certain expenses not been reduced during the periods shown.
D Total returns do not include the effect of the contingent deferred sales charge.
E Calculated based on average shares outstanding during the period.
F For the period July 23, 2003 (commencement of sale of shares) to December 31, 2003.
G Expense ratios reflect operating expenses of the class. Expenses before reductions do not reflect amounts reimbursed by the investment adviser or reductions from brokerage service arrangements or other expense offset arrangements and do not represent the amount paid by the class during periods when reimbursements or reductions occur. Expense ratios before reductions for start-up periods may not be representative of longer-term operating periods. Expenses net of any voluntary waivers reflect expenses after reimbursement by the investment adviser but prior to reductions from brokerage service arrangements or other expense offset arrangements. Expenses net of all reductions represent the net expenses paid by the class.
H Amount represents less than .001 per share.
See accompanying notes which are an integral part of the financial statements.
Annual Report
Financial Highlights - Class C
Years ended December 31, | 2003 F |
Selected Per-Share Data | |
Net asset value, beginning of period | $ 10.49 |
Income from Investment Operations | |
Net investment income (loss) E | .077 |
Net realized and unrealized gain (loss) | .048 |
Total from investment operations | .125 |
Distributions from net investment income | (.070) |
Distributions from net realized gain | (.065) |
Total distributions | (.135) |
Redemption fees added to paid in capitalE | - H |
Net asset value, end of period | $ 10.48 |
Total Return B, C, D | 1.20% |
Ratios to Average Net Assets G | |
Expenses before expense reductions | 1.50% A |
Expenses net of voluntary waivers, if any | 1.50% A |
Expenses net of all reductions | 1.49% A |
Net investment income (loss) | 1.67% A |
Supplemental Data | |
Net assets, end of period (in millions) | $ 8 |
Portfolio turnover rate | 34% |
A Annualized
B Total returns for periods of less than one year are not annualized.
C Total returns would have been lower had certain expenses not been reduced during the periods shown.
D Total returns do not include the effect of the contingent deferred sales charge.
E Calculated based on average shares outstanding during the period.
F For the period July 23, 2003 (commencement of sale of shares) to December 31, 2003.
G Expense ratios reflect operating expenses of the class. Expenses before reductions do not reflect amounts reimbursed by the investment adviser or reductions from brokerage service arrangements or other expense offset arrangements and do not represent the amount paid by the class during periods when reimbursements or reductions occur. Expense ratios before reductions for start-up periods may not be representative of longer-term operating periods. Expenses net of any voluntary waivers reflect expenses after reimbursement by the investment adviser but prior to reductions from brokerage service arrangements or other expense offset arrangements. Expenses net of all reductions represent the net expenses paid by the class.
H Amount represents less than .001 per share.
See accompanying notes which are an integral part of the financial statements.
Annual Report
Financial Highlights - Spartan Short-Intermediate Municipal Income
Years ended December 31, | 2003 | 2002 | 2001 | 2000 F | 2000 H | 1999 H |
Selected Per-Share Data | | | | | |
Net asset value,
beginning of period | $ 10.52 | $ 10.27 | $ 10.12 | $ 10.03 | $ 10.00 | $ 10.15 |
Income from Investment Operations | | | | | | |
Net investment income (loss) | .283 D | .336 D | .396 D, G | .139 D | .399 D | .395 |
Net realized and unrealized gain (loss) | .030 | .317 | .173 G | .092 | .034 | (.150) |
Total from investment operations | .313 | .653 | .569 | .231 | .433 | .245 |
Distributions from net investment income | (.283) | (.339) | (.396) | (.140) | (.400) | (.395) |
Distributions from net realized gain | (.070) | (.064) | (.023) | (.001) | - | - |
Distributions in excess of net realized gain | - | - | - | - | (.003) | - |
Total distributions | (.353) | (.403) | (.419) | (.141) | (.403) | (.395) |
Redemption fees added to paid in capital | -D, I | -D, I | -D, I | - | - | - |
Net asset value,
end of period | $ 10.48 | $ 10.52 | $ 10.27 | $ 10.12 | $ 10.03 | $ 10.00 |
Total Return B, C | 3.01% | 6.47% | 5.70% | 2.32% | 4.45% | 2.44% |
Ratios to Average Net Assets E | | | | | |
Expenses before expense reductions | .49% | .49% | .49% | .49% A | .55% | .55% |
Expenses net of voluntary waivers, if any | .49% | .49% | .49% | .49% A | .54% | .55% |
Expenses net of all reductions | .47% | .45% | .41% | .45% A | .54% | .55% |
Net investment income (loss) | 2.69% | 3.23% | 3.85% G | 4.17% A | 4.02% | 3.89% |
Supplemental Data | | | | | | |
Net assets, end of period (in millions) | $ 1,843 | $ 1,683 | $ 1,183 | $ 965 | $ 904 | $ 698 |
Portfolio turnover rate | 34% | 38% | 43% | 106% A | 53% | 66% |
A Annualized
B Total returns for periods of less than one year are not annualized.
C Total returns would have been lower had certain expenses not been reduced during the periods shown.
D Calculated based on average shares outstanding during the period.
E Expense ratios reflect operating expenses of the class. Expenses before reductions do not reflect amounts reimbursed by the investment adviser or reductions from brokerage service arrangements or other expense offset arrangements and do not represent the amount paid by the class during periods when reimbursements or reductions occur. Expenses net of any voluntary waivers reflect expenses after reimbursement by the investment adviser but prior to reductions from brokerage service arrangements or other expense offset arrangements. Expenses net of all reductions represent the net expenses paid by the class.
F For the four months ended December 31.
G Effective January 1, 2001, the fund adopted the provisions of the AICPA Audit and Accounting Guide for Investment Companies and began amortizing premium and discount on all debt securities. Per-share data and ratios for periods prior to adoption have not been restated to reflect this change.
H For the year ended August 31.
I Amount represents less than .001 per share.
See accompanying notes which are an integral part of the financial statements.
Annual Report
Financial Highlights - Institutional Class
Years ended December 31, | 2003 E |
Selected Per-Share Data | |
Net asset value, beginning of period | $ 10.49 |
Income from Investment Operations | |
Net investment income (loss) D | .125 |
Net realized and unrealized gain (loss) | .059 |
Total from investment operations | .184 |
Distributions from net investment income | (.119) |
Distributions from net realized gain | (.065) |
Total distributions | (.184) |
Redemption fees added to paid in capitalD | - G |
Net asset value, end of period | $ 10.49 |
Total Return B, C | 1.77% |
Ratios to Average Net Assets F | |
Expenses before expense reductions | .48% A |
Expenses net of voluntary waivers, if any | .48% A |
Expenses net of all reductions | .47% A |
Net investment income (loss) | 2.69% A |
Supplemental Data | |
Net assets, end of period (000 omitted) | $ 414 |
Portfolio turnover rate | 34% |
A Annualized
B Total returns for periods of less than one year are not annualized.
C Total returns would have been lower had certain expenses not been reduced during the periods shown.
D Calculated based on average shares outstanding during the period.
E For the period July 23, 2003 (commencement of sale of shares) to December 31, 2003.
F Expense ratios reflect operating expenses of the class. Expenses before reductions do not reflect amounts reimbursed by the investment adviser or reductions from brokerage service arrangements or other expense offset arrangements and do not represent the amount paid by the class during periods when reimbursements or reductions occur. Expense ratios before reductions for start-up periods may not be representative of longer-term operating periods. Expenses net of any voluntary waivers reflect expenses after reimbursement by the investment adviser but prior to reductions from brokerage service arrangements or other expense offset arrangements. Expenses net of all reductions represent the net expenses paid by the class.
G Amount represents less than .001 per share.
See accompanying notes which are an integral part of the financial statements.
Annual Report
Notes to Financial Statements
For the period ended December 31, 2003
1. Significant Accounting Policies.
Spartan Short-Intermediate Municipal Income Fund (the fund) is a fund of Fidelity Municipal Trust (the trust) and is authorized to issue an unlimited number of shares. The trust is registered under the Investment Company Act of 1940, as amended (the 1940 Act), as an open-end management investment company organized as a Massachusetts business trust.
The fund offers Class A, Class T, Class B, Class C, Spartan Short Intermediate Municipal Income and Institutional Class shares, each of which has equal rights as to assets and voting privileges. Each class has exclusive voting rights with respect to matters that affect that class. The fund commenced sale of Class A, Class T, Class B, Class C and Institutional Class shares on July 23, 2003. Class B shares will automatically convert to Class A shares after a holding period of four years from the initial date of purchase. Investment income, realized and unrealized capital gains and losses, the common expenses of the fund, and certain fund-level expense reductions, if any, are allocated on a pro rata basis to each class based on the relative net assets of each class to the total net assets of the fund. Each class differs with respect to transfer agent and distribution and service plan fees incurred. Certain expense reductions also differ by class.
The financial statements have been prepared in conformity with accounting principles generally accepted in the United States of America, which require management to make certain estimates and assumptions at the date of the financial statements. The following summarizes the significant accounting policies of the fund:
Security Valuation. Net asset value per share (NAV calculation) is calculated as of the close of business of the New York Stock Exchange, normally 4:00 p.m. Eastern time. Debt securities are valued on the basis of information provided by a pricing service. Pricing services use valuation matrices that incorporate both dealer-supplied valuations and valuation models. If an event that is expected to materially affect the value of a security occurs after the close of an exchange or market on which that security trades, but prior to the NAV calculation, then that security will be fair valued taking the event into account. Securities (including restricted securities) for which market quotations are not readily available are valued at their fair value as determined in good faith under consistently applied procedures under the general supervision of the Board of Trustees. Price movements in futures contracts and ADRs, market and trading trends, the bid/ask quotes of brokers and off-exchange institutional trading may be reviewed in the course of making a good faith determination of a security's fair value. Short-term securities with remaining maturities of sixty days or less for which quotations are not readily available are valued on the basis of amortized cost. Investments in open-end investment companies are valued at their net asset value each business day.
Annual Report
Notes to Financial Statements - continued
1. Significant Accounting Policies - continued
Investment Transactions and Income. Security transactions are accounted for as of trade date. Gains and losses on securities sold are determined on the basis of identified cost. Interest income is accrued as earned. Interest income includes coupon interest and amortization of premium and accretion of discount on debt securities, which is accrued using the interest method.
Expenses. Most expenses of the trust can be directly attributed to a fund. Expenses which cannot be directly attributed are apportioned among the funds in the trust.
Income Tax Information and Distributions to Shareholders. Each year, the fund intends to qualify as a regulated investment company by distributing all of its taxable income and realized gains under Subchapter M of the Internal Revenue Code. As a result, no provision for income taxes is required in the accompanying financial statements. Income dividends and capital gain distributions are declared separately for each class. Dividends are declared daily and paid monthly from net investment income. Distributions from realized gains, if any, are recorded on the ex-dividend date.
Income and capital gain distributions are determined in accordance with income tax regulations, which may differ from generally accepted accounting principles. In addition, the fund will treat a portion of the proceeds from shares redeemed as a distribution from net investment income and realized gain for income tax purposes. Capital accounts within the financial statements are adjusted for permanent and temporary book and tax differences. These adjustments have no impact on net assets or the results of operations. Temporary differences will reverse in a subsequent period. These differences are primarily due to short-term capital gains and market discount.
The tax-basis components of distributable earnings and the federal tax cost as of period end were as follows:
Unrealized appreciation | $ 44,793,540 | | |
Unrealized depreciation | (865,706) | |
Net unrealized appreciation (depreciation) | 43,927,834 | |
Undistributed ordinary income | 27,223 | |
Cost for federal income tax purposes | $ 1,834,130,928 | |
The tax character of distributions paid was as follows:
| December 31, 2003 | December 31, 2002 |
Tax-exempt Income | $ 48,268,450 | $ 44,746,408 |
Long-term Capital Gains | 12,396,165 | 9,306,879 |
Total | $ 60,664,615 | $ 54,053,287 |
Annual Report
1. Significant Accounting Policies - continued
Short-Term Trading (Redemption) Fees. Shares held in the fund less than 30 days are subject to a short-term trading fee equal to .50% of the proceeds of the redeemed shares. The fee, which is retained by the fund, is accounted for as an addition to paid in capital.
2. Operating Policies.
Delayed Delivery Transactions and When-Issued Securities. The fund may purchase or sell securities on a delayed delivery or when-issued basis. Payment and delivery may take place after the customary settlement period for that security. The price of the underlying securities and the date when the securities will be delivered and paid for are fixed at the time the transaction is negotiated. During the time a delayed delivery sell is outstanding, the contract is marked-to-market daily and equivalent deliverable securities are held for the transaction. The value of the securities purchased on a delayed delivery or when-issued basis are identified as such in the fund's Schedule of Investments. The fund may receive compensation for interest forgone in the purchase of a delayed delivery or when-issued security. With respect to purchase commitments, the fund identifies securities as segregated in its records with a value at least equal to the amount of the commitment. Losses may arise due to changes in the value of the underlying securities or if the counterparty does not perform under the contract's terms, or if the issuer does not issue the securities due to political, economic, or other factors.
Restricted Securities. The fund may invest in securities that are subject to legal or contractual restrictions on resale. These securities generally may be resold in transactions exempt from registration or to the public if the securities are registered. Disposal of these securities may involve time-consuming negotiations and expense, and prompt sale at an acceptable price may be difficult. Information regarding restricted securities is included at the end of the fund's Schedule of Investments.
Swap Agreements. The fund may invest in swaps for the purpose of managing its exposure to interest rate, credit or market risk.
Interest rate swaps are agreements to exchange cash flows periodically based on a notional principal amount, for example, the exchange of fixed rate interest payments for floating rate interest payments. The primary risk associated with interest rate swaps is that unfavorable changes in the fluctuation of interest rates could adversely impact the fund.
Swaps are marked-to-market daily based on dealer-supplied valuations and changes in value are recorded as unrealized appreciation (depreciation). Gains or losses are realized upon early termination of the swap agreement. Collateral, in the form of cash or securities, may be required to be held in segregated accounts with the fund's custodian in compliance with swap contracts.
Annual Report
Notes to Financial Statements - continued
3. Purchases and Sales of Investments.
Information regarding purchases and sales of securities is included under the caption "Other Information" at the end of the fund's Schedule of Investments.
4. Fees and Other Transactions with Affiliates.
Management Fee. Fidelity Management & Research Company (FMR) and its affiliates provide the fund with investment management related services for which the fund pays a monthly management fee. The management fee is the sum of an individual fund fee rate that is based on an annual rate of .25% of the fund's average net assets and a group fee rate that averaged .13% during the period. The group fee rate is based upon the average net assets of all the mutual funds advised by FMR. The group fee rate decreases as assets under management increase and increases as assets under management decrease. For the period, the total annual management fee rate was .38% of the fund's average net assets.
Distribution and Service Plan. In accordance with Rule 12b-1 of the 1940 Act, the Fund has adopted separate Distribution and Service Plans for each class of shares. Certain classes pay Fidelity Distributors Corporation (FDC), an affiliate of FMR, separate Distribution and Service Fees, each of which is based on an annual percentage of each class' average net assets. In addition, FDC may pay financial intermediaries for selling shares of the fund and providing shareholder support services. For the period, the Distribution and Service Fee rates and the total amounts paid to and retained by FDC were as follows:
| Distribution
Fee | Service
Fee | Paid to
FDC | Retained
by FDC |
Class A | 0% | .15% | $ 2,665 | $ - |
Class T | 0% | .25% | 6,191 | - |
Class B | .65% | .25% | 6,237 | 4,590 |
Class C | .75% | .25% | 20,491 | 18,306 |
| | | $ 35,584 | $ 22,896 |
Sales Load. FDC receives a front-end sales charge of up to 3.75% for selling Class A shares, and 2.75% for selling Class T shares of the fund. FDC receives the proceeds of contingent deferred sales charges levied on Class A, Class T, Class B, and Class C redemptions. These charges depend on the holding period. The deferred sales charges range from 3% to 1% for Class B, 1% for Class C, and .25% for certain purchases of Class A and Class T shares.
For the period, sales charge amounts retained by FDC were as follows:
| Retained
by FDC |
Class A | $ 10,303 |
Class T | 2,690 |
Class B* | - |
Class C* | 1,331 |
| $ 14,324 |
* When Class B and Class C shares are initially sold, FDC pays commissions from its own resources to financial intermediaries through which the sales
are made.
Annual Report
Notes to Financial Statements - continued
4. Fees and Other Transactions with Affiliates - continued
Transfer Agent and Accounting Fees. Citibank, N.A. (Citibank) is the custodian, transfer agent, and shareholder servicing agent for the fund's Class A, Class T, Class B, Class C, Spartan Short Intermediate Municipal Income and Institutional Class shares. Citibank has entered into a sub-arrangement with Fidelity Investments Institutional Operations Company, Inc. (FIIOC), an affiliate of FMR, with respect to all classes of the fund, except for Spartan Short Intermediate Municipal Income, to perform the transfer, dividend disbursing, and shareholder servicing agent functions. Citibank has also entered into a sub-agreement with Fidelity Service Company (FSC), an affiliate of FMR, with respect to Spartan Short Intermediate Municipal Income, to perform the transfer, dividend disbursing, and shareholder servicing agent functions. FIIOC and FSC receive account fees and asset-based fees that vary according to the account size and type of account of the shareholders of the respective classes of the fund. All fees are paid to FIIOC by Citibank, which is reimbursed by each class for such payments. FIIOC and FSC pay for typesetting, printing and mailing of all shareholder reports, except proxy statements. For the period, each class paid the following transfer agent fees:
| Amount | % of
Average
Net Assets |
Class A | $ 1,566 | .09* |
Class T | 2,565 | .10* |
Class B | 575 | .08* |
Class C | 1,852 | .09* |
Spartan Short Intermediate Municipal Income | 1,285,080 | .07 |
Institutional Class | 83 | .06* |
| $ 1,291,721 | |
* Annualized
Citibank also has a sub-contract with Fidelity Service Company, Inc. (FSC), an affiliate of FMR, under which FSC maintains the fund's accounting records. The fee is based on the level of average net assets for the month plus out-of-pocket expenses.
Central Funds. The fund may invest in affiliated Central Funds managed by Fidelity Investments Money Management, Inc. (FIMM), an affiliate of FMR. The Central Funds are open-end investment companies available only to investment companies and other accounts managed by FMR and its affiliates. The Central Funds seek preservation of capital and current income and do not pay a management fee. Income distributions earned by the fund are recorded as income in the accompanying financial statements and totaled $267,679 for the period.
Annual Report
5. Expense Reductions.
FMR voluntarily agreed to reimburse a portion of Spartan Short Intermediate Municipal Income's operating expenses. During the period, this reimbursement reduced the class' expenses by $69,192.
In addition, through arrangements with the fund's custodian and each class' transfer agent, credits realized as a result of uninvested cash balances were used to reduce the fund's expenses. During the period, these credits reduced the fund's custody and accounting expenses by $20,921 and $170,069, respectively. During the period, credits reduced each class' transfer agent expense as noted in the table below.
| Transfer Agent
expense reduction | | |
Class A | $ 48 | |
Class T | 67 | |
Class B | 19 | |
Class C | 53 | |
Spartan Short-Intermediate Municipal Income | 47,919 | |
Institutional Class | 5 | |
| $ 48,111 | |
6. Distributions to Shareholders.
Distributions to shareholders of each class were as follows:
| Years ended December 31, |
| 2003 | 2002 |
From net investment income | | |
Class A | $ 41,170 | $ - |
Class T | 55,194 | - |
Class B | 11,175 | - |
Class C | 30,513 | - |
Spartan Short-Intermediate Municipal Income | 48,127,109 | 44,681,023 |
Institutional Class | 3,289 | - |
Total | $ 48,268,450 | $ 44,681,023 |
From net realized gain | | |
Class A | $ 38,125 | $ - |
Class T | 64,235 | - |
Class B | 14,227 | - |
Class C | 43,979 | - |
Spartan Short-Intermediate Municipal Income | 12,233,045 | 9,372,264 |
Institutional Class | 2,554 | - |
Total | $ 12,396,165 | $ 9,372,264 |
Annual Report
Notes to Financial Statements - continued
7. Share Transactions.
Transactions for each class of shares were as follows:
| Years ended December 31, |
| 2003 | 2002 | 2003 | 2002 |
| Shares | Dollars |
Class A | | | | |
Shares sold | 945,702 | - | $ 9,928,421 | $ - |
Reinvestment of distributions | 5,258 | - | 55,287 | - |
Shares redeemed | (83,727) | - | (881,839) | - |
Net increase (decrease) | 867,233 | - | $ 9,101,869 | $ - |
Class T | | | | |
Shares sold | 1,169,015 | - | $ 12,268,522 | $ - |
Reinvestment of distributions | 7,662 | - | 80,416 | - |
Shares redeemed | (21,964) | - | (231,439) | - |
Net increase (decrease) | 1,154,713 | - | $ 12,117,499 | $ - |
Class B | | | | |
Shares sold | 233,819 | - | $ 2,453,550 | $ - |
Reinvestment of distributions | 1,571 | - | 16,518 | - |
Shares redeemed | (1,490) | - | (15,701) | - |
Net increase (decrease) | 233,900 | - | $ 2,454,367 | $ - |
Class C | | | | |
Shares sold | 776,760 | - | $ 8,149,505 | $ - |
Reinvestment of distributions | 3,424 | - | 35,965 | - |
Shares redeemed | (56,795) | - | (598,264) | - |
Net increase (decrease) | 723,389 | - | $ 7,587,206 | $ - |
Spartan Short-Intermediate Municipal Income | | |
Shares sold | 89,460,531 | 111,439,341 | $ 942,789,927 | $ 1,162,261,393 |
Reinvestment of distributions | 4,591,399 | 4,243,826 | 48,317,099 | 44,278,450 |
Shares redeemed | (78,186,633) | (71,046,928) | (823,154,240) | (738,583,535) |
Net increase (decrease) | 15,865,297 | 44,636,239 | $ 167,952,786 | $ 467,956,308 |
Institutional Class | | | | |
Shares sold | 41,387 | - | $ 434,150 | $ - |
Reinvestment of distributions | 399 | - | 4,193 | - |
Shares redeemed | (2,275) | - | (24,000) | - |
Net increase (decrease) | 39,511 | - | $ 414,343 | $ - |
Annual Report
Report of Independent Auditors
To the Trustees of Fidelity Municipal Trust and the Shareholders of Spartan Short-Intermediate Municipal Income Fund:
In our opinion, the accompanying statement of assets and liabilities, including the schedule of investments, and the related statements of operations and of changes in net assets and the financial highlights present fairly, in all material respects, the financial position of Spartan Short-Intermediate Municipal Income Fund (a fund of Fidelity Municipal Trust) at December 31, 2003 and the results of its operations, the changes in its net assets and the financial highlights for the periods indicated, in conformity with accounting principles generally accepted in the United States of America. These financial statements and financial highlights (hereafter referred to as "financial statements") are the responsibility of the Spartan Short-Intermediate Municipal Income Fund's management; our responsibility is to express an opinion on these financial statements based on our audits. We conducted our audits of these financial statements in accordance with auditing standards generally accepted in the United States of America which require that we plan and perform the audit to obtain reasonable assurance about whether the financial statements are free of material misstatement. An audit includes examining, on a test basis, evidence supporting the amounts and disclosures in the financial statements, assessing the accounting principles used and significant estimates made by management, and evaluating the overall financial statement presentation. We believe that our audits, which included confirmation of securities at December 31, 2003 by correspondence with the custodian and brokers, provide a reasonable basis for our opinion.
/s/PricewaterhouseCoopers LLP
PricewaterhouseCoopers LLP
Boston, Massachusetts
February 20, 2004
Annual Report
Trustees and Officers
The Trustees , Members of the Advisory Board, and executive officers of the trust and fund, as applicable, are listed below. The Board of Trustees governs the fund and is responsible for protecting the interests of shareholders. The Trustees are experienced executives who meet periodically throughout the year to oversee the fund's activities, review contractual arrangements with companies that provide services to the fund, and review the fund's performance. Except for William O. McCoy, each of the Trustees oversees 292 funds advised by FMR or an affiliate. Mr. McCoy oversees 294 funds advised by FMR or an affiliate.
The Trustees hold office without limit in time except that (a) any Trustee may resign; (b) any Trustee may be removed by written instrument, signed by at least two-thirds of the number of Trustees prior to such removal; (c) any Trustee who requests to be retired or who has become incapacitated by illness or injury may be retired by written instrument signed by a majority of the other Trustees; and (d) any Trustee may be removed at any special meeting of shareholders by a two-thirds vote of the outstanding voting securities of the trust. In any event, each non-interested Trustee shall retire not later than the last day of the calendar year in which his or her 72nd birthday occurs. The executive officers and Advisory Board Members hold office without limit in time, except that any officer and Advisory Board Member may resign or may be removed by a vote of a majority of the Trustees at any regular meeting or any special meeting of the Trustees. Except as indicated, each individual has held the office shown or other offices in the same company for the past five years.
The fund's Statement of Additional Information (SAI) includes more information about the Trustees. To request a free copy, call Fidelity at 1-800-544-8544.
Interested Trustees*:
Correspondence intended for each Trustee who is an "interested person" (as defined in the 1940 Act) may be sent to Fidelity Investments, 82 Devonshire Street, Boston, Massachusetts 02109.
Name, Age; Principal Occupation |
Edward C. Johnson 3d (73)** |
| Year of Election or Appointment: 1984 Mr. Johnson is Chairman of the Board of Trustees. Mr. Johnson serves as Chief Executive Officer, Chairman, and a Director of FMR Corp.; a Director and Chairman of the Board and of the Executive Committee of FMR; Chairman and a Director of Fidelity Management & Research (Far East) Inc.; Chairman (1998) and a Director of Fidelity Investments Money Management, Inc.; and Chairman (2001) and a Director (2000) of FMR Co., Inc. |
Abigail P. Johnson (42)** |
| Year of Election or Appointment: 2001 Senior Vice President of Spartan Short-Intermediate Municipal Income (2001). Ms. Johnson also serves as Senior Vice President of other Fidelity funds (2001). She is President and a Director of FMR (2001), Fidelity Investments Money Management, Inc. (2001), FMR Co., Inc. (2001), and a Director of FMR Corp. Previously, Ms. Johnson managed a number of Fidelity funds. |
Laura B. Cronin (49) |
| Year of Election or Appointment: 2003 Ms. Cronin is an Executive Vice President (2002) and Chief Financial Officer (2002) of FMR Corp. and is a member of the Fidelity Management Committee (2003). Previously, Ms. Cronin served as Vice President of Finance of FMR (1997-1999), and Chief Financial Officer of FMR (1999-2001), Fidelity Personal Investments (2001), and Fidelity Brokerage Company (2001-2002). |
Robert L. Reynolds (51) |
| Year of Election or Appointment: 2003 Mr. Reynolds is a Director (2003) and Chief Operating Officer (2002) of FMR Corp. and is the head of the Fidelity Management Committee (2003). He also serves on the Board at Fidelity Investments Canada, Ltd. (2000). Previously, Mr. Reynolds served as President of Fidelity Investments Institutional Retirement Group (1996-2000). |
* Trustees have been determined to be "Interested Trustees" by virtue of, among other things, their affiliation with the trust or various entities under common control with FMR.
** Edward C. Johnson 3d, Trustee, is Abigail P. Johnson's father.
Annual Report
Non-Interested Trustees:
Correspondence intended for each non-interested Trustee (that is, the Trustees other than the Interested Trustees) may be sent to Fidelity Investments, P.O. Box 55235, Boston, Massachusetts 02205-5235.
Name, Age; Principal Occupation |
J. Michael Cook (61) |
| Year of Election or Appointment: 2001 Prior to Mr. Cook's retirement in May 1999, he served as Chairman and Chief Executive Officer of Deloitte & Touche LLP (accounting/consulting), Chairman of the Deloitte & Touche Foundation, and a member of the Board of Deloitte Touche Tohmatsu. He currently serves as a Director of Comcast (telecommunications, 2002), International Flavors & Fragrances, Inc. (2000), Rockwell Automation (2000), and The Dow Chemical Company (2000). He is a Member of the Diversity Advisory Council of Marakon (2003) and the Advisory Board of the Directorship Search Group, Chairman Emeritus of the Board of Catalyst (a leading organization for the advancement of women in business), and is Chairman of the Accountability Advisory Council to the Comptroller General of the United States. He also serves as a Member of the Advisory Board of the Graduate School of Business of the University of Florida, his alma mater. |
Ralph F. Cox (71) |
| Year of Election or Appointment: 1991 Mr. Cox is President of RABAR Enterprises (management consulting for the petroleum industry). Prior to February 1994, he was President of Greenhill Petroleum Corporation (petroleum exploration and production). Until March 1990, Mr. Cox was President and Chief Operating Officer of Union Pacific Resources Company (exploration and production). He is a Director of CH2M Hill Companies (engineering), and Abraxas Petroleum (petroleum exploration and production, 1999). In addition, he is a member of advisory boards of Texas A&M University and the University of Texas at Austin. |
Robert M. Gates (60) |
| Year of Election or Appointment: 1997 Dr. Gates is President of Texas A&M University (2002). He was Director of the Central Intelligence Agency (CIA) from 1991 to 1993. From 1989 to 1991, Dr. Gates served as Assistant to the President of the United States and Deputy National Security Advisor. Dr. Gates is a Director of NACCO Industries, Inc. (mining and manufacturing), and Parker Drilling Co., Inc. (drilling and rental tools for the energy industry, 2001). He also serves as a member of the Advisory Board of VoteHere.net (secure internet voting, 2001). Previously, Dr. Gates served as a Director of LucasVarity PLC (automotive components and diesel engines), a Director of TRW Inc. (automotive, space, defense, and information technology), and Dean of the George Bush School of Government and Public Service at Texas A&M University (1999-2001). Dr. Gates also is a Trustee of the Forum for International Policy. |
George H. Heilmeier (67) |
| Year of Election or Appointment: 2004 Dr. Heilmeier is Chairman Emeritus of Telcordia Technologies (communication software and systems), where prior to his retirement, he served as company Chairman and Chief Executive Officer. He currently serves on the Boards of Directors of The Mitre Corporation (systems engineering and information technology support for the government), INET Technologies Inc. (telecommunications network surveillance, 2001) and Teletech Holdings (customer management services, 1998). He is Chairman of the General Motors Technology Advisory Committee and a Life Fellow of the IEEE (2000). Dr. Heilmeier is a member of the Defense Science Board and the National Security Agency Advisory Board. He is also a member of the National Academy of Engineering, the American Academy of Arts and Sciences and The Board of Overseers of the School of Engineering and Applied Science of the University of Pennsylvania. Previously, Dr. Heilmeier served as a Director of TRW Inc. (automotive, space, defense, and information technology, 1992-2002) and Compaq (1994-2002). |
Donald J. Kirk (71) |
| Year of Election or Appointment: 1987 Mr. Kirk is a Governor of the American Stock Exchange (2001), a Trustee and former Chairman of the Board of Trustees of the Greenwich Hospital Association, a Director of the Yale-New Haven Health Services Corp. (1998), and a Director Emeritus and former Chairman of the Board of Directors of National Arts Strategies Inc. Mr. Kirk was an Executive-in-Residence (1995-2000) and a Professor (1987-1995) at Columbia University Graduate School of Business. Prior to 1987, he was Chairman of the Financial Accounting Standards Board. Previously, Mr. Kirk served as a Governor of the National Association of Securities Dealers, Inc. (1996-2002), a member and Vice Chairman of the Public Oversight Board of the American Institute of Certified Public Accountants' SEC Practice Section (1995-2002), a Director of General Re Corporation (reinsurance, 1987-1998) and as a Director of Valuation Research Corp. (appraisals and valuations). |
Marie L. Knowles (57) |
| Year of Election or Appointment: 2001 Prior to Ms. Knowles' retirement in June 2000, she served as Executive Vice President and Chief Financial Officer of Atlantic Richfield Company (ARCO) (diversified energy, 1996-2000). From 1993 to 1996, she was a Senior Vice President of ARCO and President of ARCO Transportation Company. She served as a Director of ARCO from 1996 to 1998. She currently serves as a Director of Phelps Dodge Corporation (copper mining and manufacturing), URS Corporation (multidisciplinary engineering, 1999), and McKesson Corporation (healthcare service, 2002). Ms. Knowles is a Trustee of the Brookings Institution and the Catalina Island Conservancy and also serves as a member of the Advisory Board for the School of Engineering of the University of Southern California. |
Ned C. Lautenbach (59) |
| Year of Election or Appointment: 2000 Mr. Lautenbach has been a partner of Clayton, Dubilier & Rice, Inc. (private equity investment firm) since September 1998. Previously, Mr. Lautenbach was with the International Business Machines Corporation (IBM) from 1968 until his retirement in 1998. He was most recently Senior Vice President and Group Executive of Worldwide Sales and Services. From 1993 to 1995, he was Chairman of IBM World Trade Corporation, and from 1994 to 1998 was a member of IBM's Corporate Executive Committee. Mr. Lautenbach serves as Chairman and as a Director (1998) of Acterna Corporation (communications test equipment). He is also Co-Chairman of Covansys, Inc. (global provider of business and technology solutions, 2000). In addition, he is a Director of Eaton Corporation (diversified industrial) and the Philharmonic Center for the Arts in Naples, Florida (1999). He also is a member of the Council on Foreign Relations. |
Marvin L. Mann (70) |
| Year of Election or Appointment: 1993 Mr. Mann is Chairman of the non-interested Trustees (2001). He is Chairman Emeritus of Lexmark International, Inc. (computer peripherals) where he served as CEO until April 1998 and retired as Chairman May 1999, and remains a member of the Board. Prior to 1991, he held the positions of Vice President of International Business Machines Corporation (IBM) and President and General Manager of various IBM divisions and subsidiaries. Mr. Mann is a Board member of Imation Corp. (imaging and information storage) and Acterna Corporation (communications test equipment, 1999). He is also a member of the Director Services Committee of the Investment Company Institute. In addition, Mr. Mann is a member of the President's Cabinet at the University of Alabama and the Board of Visitors of the Culverhouse College of Commerce and Business Administration at the University of Alabama. |
William O. McCoy (70) |
| Year of Election or Appointment: 1997 Prior to his retirement in December 1994, Mr. McCoy was Vice Chairman of the Board of BellSouth Corporation (telecommunications) and President of BellSouth Enterprises. He is currently a Director of Liberty Corporation (holding company), Duke Realty Corporation (real estate), Progress Energy, Inc. (electric utility), and Acterna Corporation (communications test equipment, 1999). He is also a partner of Franklin Street Partners (private investment management firm) and a member of the Research Triangle Foundation Board. In addition, Mr. McCoy served as the Interim Chancellor (1999-2000) and a member of the Board of Visitors (1994-1998) for the University of North Carolina at Chapel Hill and currently serves on the Board of Directors of the University of North Carolina Health Care System and the Board of Visitors of the Kenan-Flagler Business School (University of North Carolina at Chapel Hill). He also served as Vice President of Finance for the University of North Carolina (16-school system, 1995-1998). |
William S. Stavropoulos (64) |
| Year of Election or Appointment: 2002 Mr. Stavropoulos is Chairman of the Board, President and CEO (2002), and Chairman of the Executive Committee (2000) and a Director of The Dow Chemical Company. Since joining The Dow Chemical Company in 1967, Mr. Stavropoulos served in numerous senior management positions, including President (1993-2000) and Chief Executive Officer (1995-2000). Currently, he is a Director of NCR Corporation (data warehousing and technology solutions), BellSouth Corporation (telecommunications), Chemical Financial Corporation, and Maersk Inc. (industrial conglomerate, 2002). He also serves as a member of the Board of Trustees of the American Enterprise Institute for Public Policy Research. In addition, Mr. Stavropoulos is a member of The Business Council, J.P. Morgan International Council, World Business Council for Sustainable Development, and the University of Notre Dame Advisory Council for the College of Science. |
Annual Report
Trustees and Officers - continued
Advisory Board Members and Executive Officers:
Correspondence intended for Ms. Small may be sent to Fidelity Investments, P.O. Box 55235, Boston, Massachusetts 02205-5235. Correspondence intended for each executive officer and Mr. Lynch may be sent to Fidelity Investments, 82 Devonshire Street, Boston, Massachusetts 02109.
Name, Age; Principal Occupation |
Peter S. Lynch (60) |
| Year of Election or Appointment: 2003 Member of the Advisory Board of Fidelity Municipal Trust. Vice Chairman and a Director of FMR, and Vice Chairman (2001) and a Director (2000) of FMR Co., Inc. Previously, Mr. Lynch served as a Trustee of the Fidelity funds (1990-2003). Prior to May 31, 1990, he was a Director of FMR and Executive Vice President of FMR (a position he held until March 31, 1991), Vice President of Fidelity® Magellan® Fund and FMR Growth Group Leader, and Managing Director of FMR Corp. Mr. Lynch was also Vice President of Fidelity Investments Corporate Services. In addition, he serves as a Trustee of Boston College, Massachusetts Eye & Ear Infirmary, Historic Deerfield, John F. Kennedy Library, and the Museum of Fine Arts of Boston. |
Cornelia M. Small (59) |
| Year of Election or Appointment: 2004 Member of the Advisory Board of Fidelity Municipal Trust. Ms. Small is a member (2000) and Chairperson (2002) of the Investment Committee, and a member (2002) of the Board of Trustees of Smith College. Previously, she served as Chief Investment Officer (1999-2000), Director of Global Equity Investments (1996-1999), and a member of the Board of Directors (1998-1999) of Scudder Kemper Investments. In addition, Ms. Small served as Co-Chair (2000-2003) of the Annual Fund for the Fletcher School of Law and Diplomacy. |
Dwight D. Churchill (50) |
| Year of Election or Appointment: 1997 Vice President of Spartan Short-Intermediate Municipal Income. He serves as Head of Fidelity's Fixed-Income Division (2000), Vice President of Fidelity's Money Market Funds (2000), Vice President of Fidelity's Bond Funds (1997), and Senior Vice President of FIMM (2000) and FMR (1997). Mr. Churchill joined Fidelity in 1993 as Vice President and Group Leader of Taxable Fixed-Income Investments. |
Charles S. Morrison (43) |
| Year of Election or Appointment: 2002 Vice President of Spartan Short-Intermediate Municipal Income. Mr. Morrison also serves as Vice President of Fidelity's Bond Funds (2002), and Vice President of certain Asset Allocation and Balanced Funds (2002). He serves as Vice President (2002) and Bond Group Leader (2002) of Fidelity Investments Fixed Income Division. Mr. Morrison is also Vice President of FIMM (2002) and FMR (2002). Mr. Morrison joined Fidelity in 1987 as a Corporate Bond Analyst in the Fixed Income Research Division. |
Eric D. Roiter (55) |
| Year of Election or Appointment: 1998 Secretary of Spartan Short-Intermediate Municipal Income. He also serves as Secretary of other Fidelity funds (1998); Vice President, General Counsel, and Clerk of FMR Co., Inc. (2001) and FMR (1998); Vice President and Clerk of FDC (1998); Assistant Clerk of Fidelity Management & Research (U.K.) Inc. (2001) and Fidelity Management & Research (Far East) Inc. (2001); and Assistant Secretary of Fidelity Investments Money Management Inc. (2001). Prior to joining Fidelity, Mr. Roiter was with the law firm of Debevoise & Plimpton, as an associate (1981-1984) and as a partner (1985-1997), and served as an Assistant General Counsel of the U.S. Securities and Exchange Commission (1979-1981). Mr. Roiter is an Adjunct Member, Faculty of Law, at Boston College Law School (2003). |
Stuart Fross (44) |
| Year of Election or Appointment: 2003 Assistant Secretary of Spartan Short-Intermediate Municipal Income. Mr. Fross also serves as Assistant Secretary of other Fidelity funds (2003) and is an employee of FMR. |
Maria F. Dwyer (45) |
| Year of Election or Appointment: 2002 President and Treasurer of Spartan Short-Intermediate Municipal Income. Ms. Dwyer also serves as President and Treasurer of other Fidelity funds (2002) and is a Vice President (1999) and an employee (1996) of FMR. |
Timothy F. Hayes (53) |
| Year of Election or Appointment: 2002 Chief Financial Officer of Spartan Short-Intermediate Municipal Income. Mr. Hayes also serves as Chief Financial Officer of other Fidelity funds (2002). Recently he was appointed President of Fidelity Service Company (2003) where he also serves as a Director. Mr. Hayes also serves as President of Fidelity Investments Operations Group (FIOG, 2002), which includes Fidelity Pricing and Cash Management Services Group (FPCMS), where he was appointed President in 1998. Previously, Mr. Hayes served as Chief Financial Officer of Fidelity Investments Corporate Systems and Service Group (1998) and Fidelity Systems Company (1997-1998). |
Jennifer S. Taub (37) |
| Year of Election or Appointment: 2003 Assistant Vice President of Spartan Short-Intermediate Municipal Income. Ms. Taub is Assistant Vice President of Fidelity's Fixed-Income Funds (2003), Assistant Secretary of FIMM (2003), and is an employee of FMR. |
John R. Hebble (45) |
| Year of Election or Appointment: 2003 Deputy Treasurer of Spartan Short-Intermediate Municipal Income. Mr. Hebble also serves as Deputy Treasurer of other Fidelity funds (2003), and is an employee of FMR. Before joining Fidelity Investments, Mr. Hebble worked at Deutsche Asset Management where he served as Director of Fund Accounting (2002-2003) and Assistant Treasurer of the Scudder Funds (1998-2003). |
John H. Costello (57) |
| Year of Election or Appointment: 1986 Assistant Treasurer of Spartan Short-Intermediate Municipal Income. Mr. Costello also serves as Assistant Treasurer of other Fidelity funds and is an employee of FMR. |
Francis V. Knox, Jr. (56) |
| Year of Election or Appointment: 2002 Assistant Treasurer of Spartan Short-Intermediate Municipal Income. Mr. Knox also serves as Assistant Treasurer of other Fidelity funds (2002), and is a Vice President and an employee of FMR. Previously, Mr. Knox served as Vice President of Investment & Advisor Compliance (1990-2001), and Compliance Officer of Fidelity Management & Research (U.K.) Inc. (1992-2002), Fidelity Management & Research (Far East) Inc. (1991-2002), and FMR Corp. (1995-2002). |
Mark Osterheld (48) |
| Year of Election or Appointment: 2002 Assistant Treasurer of Spartan Short-Intermediate Municipal Income. Mr. Osterheld also serves as Assistant Treasurer of other Fidelity funds (2002) and is an employee of FMR. |
Thomas J. Simpson (45) |
| Year of Election or Appointment: 1996 Assistant Treasurer of Spartan Short-Intermediate Municipal Income. Mr. Simpson is Assistant Treasurer of other Fidelity funds (2000) and an employee of FMR (1996). Prior to joining FMR, Mr. Simpson was Vice President and Fund Controller of Liberty Investment Services (1987-1995). |
Annual Report
Distributions
During fiscal year ended 2003, 100% of the fund's income dividends was free from federal income tax, and 15.52% of the fund's income dividends was subject to the federal alternative minimum tax.
The fund will notify shareholders in January 2004 of amounts for use in preparing 2003 income tax returns.
Annual Report
Investment Adviser
Fidelity Management & Research Company
Boston, MA
Investment Sub-Adviser
Fidelity Investments Money
Management, Inc.
Fidelity International Investment Advisors
Fidelity International Investment Advisors
(U.K.) Limited
General Distributor
Fidelity Distributors Corporation
Boston, MA
Transfer and Shareholder
Servicing Agents
Citibank, N.A.
New York, NY
Fidelity Investments Institutional
Operations Company, Inc.
Boston, MA
Custodian
Citibank, N.A.
New York, NY
(Fidelity Investment logo)(registered trademark)
Corporate Headquarters
82 Devonshire St., Boston, MA 02109
www.fidelity.com
ASTMI-UANN-0204
1.796657.100
Spartan®
Short-Intermediate
Municipal Income
Fund
Annual Report
December 31, 2003
(2_fidelity_logos) (Registered_Trademark)
Contents
Chairman's Message | <Click Here> | Ned Johnson's message to shareholders. |
Performance | <Click Here> | How the fund has done over time. |
Management's Discussion | <Click Here> | The manager's review of fund performance, strategy and outlook. |
Investment Changes | <Click Here> | A summary of major shifts in the fund's investments over the past six months. |
Investments | <Click Here> | A complete list of the fund's investments with their market values. |
Financial Statements | <Click Here> | Statements of assets and liabilities, operations, and changes in net assets,
as well as financial highlights. |
Notes | <Click Here> | Notes to the financial statements. |
Auditors' Opinion | <Click Here> | |
Trustees and Officers | <Click Here> | |
Distributions | <Click Here> | |
For a free copy of the fund's proxy voting guidelines visit www.fidelity.com/goto/proxyguidelines, call 1-800-544-8544, or visit the Securities and Exchange Commission (SEC)'s web site at www.sec.gov.
Standard & Poor's, S&P and S&P 500 are registered service marks of The McGraw-Hill Companies, Inc. and have been licensed for use by Fidelity Distributors Corporation.
Other third party marks appearing herein are the property of their respective owners.
All other marks appearing herein are registered or unregistered trademarks or service marks of FMR Corp. or an affiliated company.
(Recycle graphic) This report is printed on recycled paper using soy-based inks.
This report and the financial statements contained herein are submitted for the general information of the shareholders of the funds. This report is not authorized for distribution to prospective investors in the funds unless preceded or accompanied by an effective prospectus.
Mutual fund shares are not deposits or obligations of, or guaranteed by, any depository institution. Shares are not insured by the FDIC, Federal Reserve Board or any other agency, and are subject to investment risks, including possible loss of principal amount invested.
Neither the funds nor Fidelity Distributors Corporation is a bank.
For more information on any Fidelity fund, including charges and expenses, call 1-800-544-6666 for a free prospectus. Read it carefully before you invest or send money.
Annual Report
Chairman's Message
(photo_of_Edward_C_Johnson_3d)
Dear Shareholder:
Many of you have read or heard news stories recently that were critical of mutual funds and made allegations that the mutual fund industry has been less than forthright. I find these reports unsettling and not necessarily an accurate picture of the overall industry, and I would like you to know where we at Fidelity stand.
With specific regard to allegations that certain mutual fund companies were violating the Securities and Exchange Commission's forward pricing rules or were involved in so-called "market timing" activities, I want to say two things:
First, Fidelity does not have agreements that permit customers who buy fund shares after 4 p.m. to obtain the 4 p.m. price. This is not to say that someone could not deceive the company through fraudulent acts. But I underscore that we have no so-called "agreements" which would permit this illegal practice.
Second, Fidelity has been on record for years opposing predatory short-term trading which adversely affects other shareholders in a mutual fund. In fact, in the 1980s, we began charging a fee - which is returned to the fund and, therefore, to investors - to discourage this activity. What's more, several years ago we took the industry lead in developing a Fair Value Pricing Policy to prevent market timing on foreign securities in our funds. It is reasonable to assume that another structure can be developed that would alter the system to make it much more difficult for predatory traders to operate. This, however, will only be achieved through close cooperation among regulators, legislators and the industry.
Certainly no industry is perfect, and there have been instances of unethical and illegal activity from time to time within the mutual fund industry. When this occurs, confessed or convicted offenders should be dealt with appropriately. Clearly, every system can be improved. We applaud well thought out improvements by regulators, legislators and industry representatives that achieve the common goal of building and protecting the value of investors' holdings. But we remain concerned about the risk of over-regulation and the quick application of simplistic solutions to intricate problems.
For more than 57 years, Fidelity Investments has worked very hard to improve its products and service to justify your trust. When our family founded this company in 1946, we had only a few hundred customers. Many of them were family and friends. Today, we serve more than 18 million customers including individual investors and participants in retirement plans across America.
Let me close by saying that we do not take your trust in us for granted, and we realize that we must always work to improve all aspects of our service to you. In turn, we urge you to continue your active participation with your financial matters, so that your interests can be well served.
Best regards,
/s/Edward C. Johnson 3d
Edward C. Johnson 3d
Annual Report
Performance: The Bottom Line
Average annual total return reflects the change in the value of an investment, assuming reinvestment of the fund's dividend income and capital gains (the profits earned upon the sale of securities that have grown in value) and assuming a constant rate of performance each year. The $10,000 table and the fund's returns do not reflect the deduction of taxes that a shareholder would pay on fund distributions or the redemption of fund shares. During periods of reimbursement by Fidelity, a fund's total return will be greater than it would be had the reimbursement not occurred. How a fund did yesterday is no guarantee of how it will do tomorrow.
Average Annual Total Returns
Periods ended December 31, 2003 | Past 1
year | Past 5
years | Past 10
years |
Spartan® Short-Intermediate Municipal Income Fund | 3.01% | 4.58% | 4.51% |
$10,000 Over 10 Years
Let's say hypothetically that $10,000 was invested in Spartan® Short-Intermediate Municipal Income Fund on December 31, 1993. The chart shows how the value of your investment would have grown, and also shows how the Lehman Brothers® Municipal Bond Index did over the same period.
Annual Report
Management's Discussion of Fund Performance
Comments from Mark Sommer, Portfolio Manager of Spartan® Short-Intermediate Municipal Income Fund
While most of the year favored riskier assets, tax-exempt municipal bonds put up solid numbers for the 12 months ending December 31, 2003. In that time, the Lehman Brothers® Municipal Bond Index - a performance measure of about 40,000 investment-grade, fixed-rate, tax-exempt bonds - advanced 5.31%. For munis, it was the fourth straight year of returns in excess of 5%. Munis had an excellent year relative to taxable investment-grade bonds. The Lehman Brothers Aggregate Bond Index, a proxy for the taxable, investment-grade bond market, gained 4.10% in 2003, a full percentage point less than the muni index - a gap made even wider considering muni bonds' tax-equivalent yield advantage. What's more, on a three- and five-year basis, the Lehman Brothers muni index's cumulative return is well above that of most stock market benchmarks. Munis fared well for much of the year against a backdrop of low interest rates and virtually non-existent inflation. Although they stumbled in mid-summer against a brighter economic forecast, munis rebounded later on the heels of strong investor demand and the Federal Reserve Board's accommodative monetary policy.
Spartan Short-Intermediate Municipal Income Fund returned 3.01% during the 12-month period, lagging the LipperSM Short-Intermediate Municipal Debt Funds Average, which returned 3.42%. Additionally, the Lehman Brothers 1-6 Year Municipal Bond Index returned 3.01%. The fund's underperformance of its peer average stemmed from its shorter duration, meaning it was less interest rate sensitive and, accordingly, benefited less from the bond market rally during the first half of 2003. Additionally, longer duration funds enjoyed a yield advantage. However, the fund's shorter duration helped it during the summer and fall when interest rates rose in response to improving economic conditions. Aiding performance was good sector and security selection. The fund's emphasis on essential services bonds - which are issued by providers of electricity, water and sewer services - was one example of advantageous security selection. The issuers' stable revenues helped these securities outperform tax-backed bonds during the period. The fund's stake in hospital bonds also worked in its favor, as many hospitals enjoyed better financial trends and, as a result, improving bond prices. Avoiding the lagging tobacco sector also boosted the fund's returns.
The views expressed in this statement reflect those of the portfolio manager only through the end of the period of the report as stated on the cover and do not necessarily represent the views of Fidelity or any other person in the Fidelity organization. Any such views are subject to change at any time based upon market or other conditions and Fidelity disclaims any responsibility to update such views. These views may not be relied on as investment advice and, because investment decisions for a Fidelity fund are based on numerous factors, may not be relied on as an indication of trading intent on behalf of any Fidelity fund.
Annual Report
Investment Changes
Top Five States as of December 31, 2003 |
| % of fund's
net assets | % of fund's net assets
6 months ago |
Texas | 14.0 | 14.6 |
Illinois | 7.8 | 7.9 |
Washington | 7.7 | 9.0 |
Massachusetts | 6.6 | 7.6 |
New York | 6.6 | 5.8 |
Top Five Sectors as of December 31, 2003 |
| % of fund's
net assets | % of fund's net assets
6 months ago |
General Obligations | 45.3 | 43.9 |
Electric Utilities | 15.1 | 17.0 |
Transportation | 9.3 | 8.7 |
Escrowed/Pre-Refunded | 6.2 | 6.1 |
Water & Sewer | 6.0 | 8.4 |
Average Years to Maturity as of December 31, 2003 |
| | 6 months ago |
Years | 3.3 | 3.3 |
Average years to maturity is based on the average time remaining until principal payments are expected from each of the fund's bonds, weighted by dollar amount. |
Duration as of December 31, 2003 |
| | 6 months ago |
Years | 2.9 | 2.8 |
Duration shows how much a bond fund's price fluctuates with changes in comparable interest rates. If rates rise 1%, for example, a fund with a five-year duration is likely to lose about 5% of its value. Other factors also can influence a bond fund's performance and share price. Accordingly, a bond fund's actual performance may differ from this example. |
Quality Diversification (% of fund's net assets) |
As of December 31, 2003 | As of June 30, 2003 |
| AAA 58.4% | | | AAA 59.1% | |
| AA,A 31.1% | | | AA,A 34.5% | |
| BBB 7.0% | | | BBB 8.2% | |
| Not Rated 1.1% | | | Not Rated 0.7% | |
| Short-Term
Investments and
Net Other Assets 2.4% | | | Short-Term
Investments and
Net Other Assets* (2.5)% | |

We have used ratings from Moody's® Investors Services, Inc. Where Moody's ratings are not available, we have used S&P® ratings. |
*Short-Term Investments and Net Other Assets are not included in the pie chart.
Annual Report
Investments December 31, 2003
Showing Percentage of Net Assets
Municipal Bonds - 96.9% |
| Principal
Amount (000s) | | Value (Note 1)
(000s) |
Alabama - 2.2% |
Alabama Agric. & Mechanical Univ. Revs. 6.5% 11/1/25 (Pre-Refunded to 11/1/05 @ 102) (f) | | $ 2,000 | | $ 2,223 |
Alabama Fed. Hwy. Fin. Auth. Series A, 5% 3/1/10 (MBIA Insured) | | 5,000 | | 5,611 |
Huntsville Solid Waste Disp. Auth. & Resource Recovery Rev.: | | | | |
5.25% 10/1/07 (MBIA Insured) (e) | | 1,000 | | 1,092 |
5.25% 10/1/08 (MBIA Insured) (e) | | 2,900 | | 3,174 |
Jefferson County Gen. Oblig. Series 2003 A: | | | | |
3% 4/1/05 (MBIA Insured) | | 4,000 | | 4,086 |
5% 4/1/06 (MBIA Insured) | | 3,000 | | 3,218 |
5% 4/1/07 (MBIA Insured) | | 3,000 | | 3,278 |
Jefferson County Swr. Rev. Series A, 5% 2/1/33 (Pre-Refunded to 2/1/09 @ 101) (f) | | 13,010 | | 14,598 |
Mobile County Gen. Oblig.: | | | | |
5% 2/1/07 (MBIA Insured) | | 1,000 | | 1,091 |
5% 2/1/08 (MBIA Insured) | | 1,475 | | 1,628 |
Opelika Gen. Oblig. Series A, 5% 4/1/05 (MBIA Insured) | | 1,225 | | 1,281 |
| | 41,280 |
Alaska - 2.0% |
Alaska Student Ln. Corp. Student Ln. Rev. Series A: | | | | |
5.1% 7/1/04 (AMBAC Insured) (e) | | 3,630 | | 3,700 |
5.15% 7/1/05 (AMBAC Insured) (e) | | 1,950 | | 2,052 |
5.85% 7/1/13 (AMBAC Insured) (e) | | 3,285 | | 3,599 |
Anchorage Gen. Oblig. Series B, 5.75% 12/1/11 (Pre-Refunded to 12/1/10 @ 100) (f) | | 2,500 | | 2,953 |
North Slope Borough Gen. Oblig.: | | | | |
Series 1996 B, 0% 6/30/07 (MBIA Insured) | | 3,100 | | 2,844 |
Series B: | | | | |
0% 6/30/05 (FSA Insured) | | 8,100 | | 7,918 |
0% 6/30/07 (MBIA Insured) | | 7,050 | | 6,468 |
0% 6/30/08 (MBIA Insured) | | 4,240 | | 3,730 |
0% 6/30/06 (MBIA Insured) | | 3,500 | | 3,325 |
Valdez Marine Term. Rev. (Atlantic Richfield Co. Proj.) Series 1994 B, 2%, tender 1/1/04 (b) | | 1,100 | | 1,100 |
| | 37,689 |
Arizona - 1.4% |
Arizona Pwr. Auth. Pwr. Resource Rev. (Hoover Uprating Proj.): | | | | |
5% 10/1/05 | | 2,160 | | 2,288 |
Municipal Bonds - continued |
| Principal
Amount (000s) | | Value (Note 1)
(000s) |
Arizona - continued |
Arizona Pwr. Auth. Pwr. Resource Rev. (Hoover Uprating Proj.): - continued | | | | |
5% 10/1/06 | | $ 2,525 | | $ 2,735 |
Maricopa County School District #28 Kyrene Elementary Series B, 0% 7/1/04 (FGIC Insured) | | 3,000 | | 2,983 |
Pima County Gen. Oblig. 4% 7/1/04 (FSA Insured) | | 815 | | 827 |
Salt River Proj. Agric. Impt. & Pwr. District Elec. Sys. Rev.: | | | | |
Series A, 5.25% 1/1/06 | | 5,700 | | 6,109 |
Series B: | | | | |
7% 1/1/05 | | 760 | | 803 |
7% 1/1/05 (Escrowed to Maturity) (f) | | 1,240 | | 1,311 |
Series D: | | | | |
5.7% 1/1/04 (f) | | 65 | | 65 |
5.7% 1/1/04 | | 935 | | 935 |
Scottsdale Muni. Property Corp. Excise Tax Rev. 5.5% 7/1/05 | | 2,285 | | 2,427 |
Tucson Gen. Oblig. Series 2002, 5% 7/1/05 | | 1,000 | | 1,054 |
Tucson Street & Hwy. User Rev. 4.5% 7/1/05 (AMBAC Insured) | | 3,090 | | 3,236 |
Tucson Wtr. Rev. Series 2002: | | | | |
5.5% 7/1/05 (FGIC Insured) | | 1,040 | | 1,104 |
5.5% 7/1/06 (FGIC Insured) | | 980 | | 1,069 |
| | 26,946 |
Arkansas - 0.2% |
Little Rock Gen. Oblig. 4% 4/1/07 (FSA Insured) (a) | | 1,000 | | 1,062 |
Rogers Sales & Use Tax Rev. Series A: | | | | |
4.25% 9/1/06 (FGIC Insured) | | 1,000 | | 1,063 |
4.25% 9/1/07 (FGIC Insured) | | 2,175 | | 2,342 |
| | 4,467 |
California - 5.4% |
California Dept. of Wtr. Resources Central Valley Proj. Wtr. Sys. Rev. Series Y, 5% 12/1/06 (FGIC Insured) | | 5,000 | | 5,486 |
California Dept. of Wtr. Resources Pwr. Supply Rev. Series A: | | | | |
5.25% 5/1/07 (MBIA Insured) | | 28,900 | | 31,901 |
5.25% 5/1/10 (MBIA Insured) | | 1,100 | | 1,245 |
California Gen. Oblig.: | | | | |
4.4% 8/1/07 | | 1,000 | | 1,057 |
5.125% 9/1/12 | | 1,000 | | 1,063 |
5.25% 11/1/08 | | 1,045 | | 1,146 |
Municipal Bonds - continued |
| Principal
Amount (000s) | | Value (Note 1)
(000s) |
California - continued |
California Gen. Oblig.: - continued | | | | |
5.25% 2/1/11 | | $ 6,425 | | $ 7,010 |
5.5% 6/1/05 | | 4,725 | | 4,965 |
5.75% 10/1/08 | | 1,085 | | 1,212 |
6.4% 9/1/08 | | 3,075 | | 3,500 |
6.5% 9/1/10 | | 1,740 | | 2,025 |
California Pub. Works Board Lease Rev. (California State Univ. Proj.) Series 1997 A, 5.5% 10/1/07 | | 1,075 | | 1,181 |
California Statewide Cmnty. Dev. Auth. Rev. (Kaiser Fund Hosp./Health Place, Inc. Proj.) Series 2002 C, 3.7%, tender 6/1/05 (b) | | 10,000 | | 10,273 |
Golden State Tobacco Securitization Corp. Series 2003 B, 5% 6/1/08 | | 1,300 | | 1,389 |
Long Beach Hbr. Rev. Series 2000 A: | | | | |
5.5% 5/15/05 (e) | | 3,490 | | 3,671 |
5.5% 5/15/06 (e) | | 3,000 | | 3,247 |
Los Angeles Hbr. Dept. Rev. Series A: | | | | |
5.5% 8/1/04 (AMBAC Insured) (e) | | 2,000 | | 2,051 |
5.5% 8/1/06 (AMBAC Insured) (e) | | 1,495 | | 1,627 |
San Francisco City & County Arpts. Commission Int'l. Arpt. Rev. Second Series 27A, 5% 5/1/05 (MBIA Insured) (e) | | 3,680 | | 3,844 |
San Joaquin Hills Trans. Corridor Agcy. Toll Road Rev. Series A, 0% 1/15/12 (MBIA Insured) | | 3,600 | | 2,647 |
Univ. of California Revs. (UCLA Med. Ctr. Proj.) 4.55% 12/1/09 (g) | | 9,600 | | 10,223 |
| | 100,763 |
Colorado - 0.9% |
Arapahoe County Cap. Impt. Trust Fund Hwy. Rev.: | | | | |
Series C, 0% 8/31/08 (Pre-Refunded to 8/31/05 @ 82.9449) (f) | | 4,500 | | 3,643 |
Series E 470: | | | | |
0% 8/31/07 (Pre-Refunded to 8/31/05 @ 89.2392) (f) | | 2,000 | | 1,742 |
0% 8/31/15 (Pre-Refunded to 8/31/05 @ 48.6181) (f) | | 9,025 | | 4,284 |
Arapahoe County Cherry Creek School District #5 Series B, 6% 12/15/04 | | 1,395 | | 1,459 |
Denver City & County Arpt. Rev. Series 2001 B, 5.25% 11/15/04 (FGIC Insured) (e) | | 1,200 | | 1,242 |
Municipal Bonds - continued |
| Principal
Amount (000s) | | Value (Note 1)
(000s) |
Colorado - continued |
E-470 Pub. Hwy. Auth. Rev. Series 2000 B: | | | | |
0% 9/1/06 (MBIA Insured) | | $ 2,200 | | $ 2,072 |
0% 9/1/07 (MBIA Insured) | | 3,200 | | 2,903 |
| | 17,345 |
Connecticut - 0.2% |
Connecticut Gen. Oblig. Series 2003 D, 5% 8/1/10 (FSA Insured) | | 3,000 | | 3,380 |
District Of Columbia - 1.6% |
District of Columbia Ctfs. of Prtn.: | | | | |
3% 1/1/06 (AMBAC Insured) | | 1,305 | | 1,338 |
5% 1/1/06 (AMBAC Insured) | | 1,000 | | 1,062 |
5% 1/1/07 (AMBAC Insured) | | 1,000 | | 1,083 |
5.25% 1/1/08 (AMBAC Insured) | | 935 | | 1,032 |
District of Columbia Gen. Oblig.: | | | | |
Series 1993 B2, 5.5% 6/1/07 (FSA Insured) | | 3,800 | | 4,210 |
Series 2001 B, 5.5% 6/1/07 (FSA Insured) | | 1,345 | | 1,490 |
District of Columbia Rev. (Medstar Univ. Hosp. Proj.) Series D, 6.875%, tender 2/15/07 (b) | | 9,000 | | 9,621 |
Metro. Washington Arpt. Auth. Sys. Rev. Series D: | | | | |
4% 10/1/05 (FSA Insured) (e) | | 1,000 | | 1,038 |
4% 10/1/06 (FSA Insured) (e) | | 1,750 | | 1,837 |
4% 10/1/07 (FSA Insured) (e) | | 1,000 | | 1,056 |
Metro. Washington Arpts. Auth. Gen. Arpt. Rev. Series B, 5.5% 10/1/08 (FGIC Insured) (e) | | 6,460 | | 7,106 |
| | 30,873 |
Florida - 5.6% |
Brevard County Util. Rev.: | | | | |
5% 3/1/05 (FGIC Insured) | | 1,445 | | 1,508 |
5% 3/1/06 (FGIC Insured) | | 530 | | 568 |
Broward County School District Series A: | | | | |
5% 2/15/05 | | 3,000 | | 3,127 |
5% 2/15/08 | | 5,810 | | 6,429 |
Dade County School District: | | | | |
5% 8/1/07 (MBIA Insured) | | 1,500 | | 1,649 |
5.2% 7/15/07 (AMBAC Insured) | | 8,500 | | 9,405 |
Florida Board of Ed. Lottery Rev. Series B, 6% 7/1/15 (FGIC Insured) | | 1,200 | | 1,408 |
Florida Ports Fing. Commission Rev. (State Trans. Trust Fund Proj.) 6% 6/1/05 (MBIA Insured) (e) | | 4,575 | | 4,846 |
Florida Tpk. Auth. Tpk. Rev. Series B, 5% 7/1/11 (AMBAC Insured) | | 1,700 | | 1,904 |
Municipal Bonds - continued |
| Principal
Amount (000s) | | Value (Note 1)
(000s) |
Florida - continued |
Highlands County Health Facilities Auth. Rev. (Adventist Health Sys./Sunbelt Proj.) 3.35%, tender 9/1/05 (b) | | $ 20,300 | | $ 20,770 |
Hillsborough County Indl. Dev. Auth. Poll. Cont. Rev. (Tampa Elec. Co. Proj.): | | | | |
4%, tender 8/1/07 (b) | | 11,000 | | 11,194 |
4.25%, tender 8/1/07 (b)(e) | | 6,000 | | 6,115 |
Indian River County School District: | | | | |
4% 4/1/05 (FSA Insured) | | 2,185 | | 2,259 |
4% 4/1/06 (FSA Insured) | | 1,470 | | 1,548 |
Miami-Dade County Cap. Asset Acquisition Fixed Rate Spl. Oblig. Series 2002 A: | | | | |
5% 4/1/05 (AMBAC Insured) | | 2,900 | | 3,033 |
5% 4/1/06 (AMBAC Insured) | | 3,365 | | 3,617 |
5% 4/1/08 (AMBAC Insured) | | 2,825 | | 3,135 |
Miami-Dade County School Board Ctfs. of Prtn. 5%, tender 5/1/11 (MBIA Insured) (b) | | 1,500 | | 1,661 |
Palm Beach County School District 5% 8/1/05 (MBIA Insured) | | 5,000 | | 5,285 |
Pasco County Solid Waste Disp. & Resource Recovery Sys. Rev. 5.75% 4/1/06 (AMBAC Insured) (e) | | 1,500 | | 1,603 |
Reedy Creek Impt. District Utils. Rev. Series 2: | | | | |
5% 10/1/05 (MBIA Insured) (a) | | 1,685 | | 1,783 |
5.25% 10/1/10 (MBIA Insured) (a) | | 8,275 | | 9,430 |
Univ. Athletic Assoc., Inc. Athletic Prog. Rev. Series 2001, 2.8%, tender 10/1/08, LOC Suntrust Banks of Florida, Inc. (b) | | 2,000 | | 1,998 |
| | 104,275 |
Georgia - 2.2% |
Atlanta Arpt. Facilities Rev. 6.5% 1/1/06 (Escrowed to Maturity) (f) | | 6,000 | | 6,555 |
Cobb County Solid Waste Mgt. Auth. Rev. Series 1995, 6.05% 1/1/05 (e) | | 1,000 | | 1,045 |
Columbus Wtr. & Swr. Rev. 5.25% 5/1/05 (FSA Insured) | | 1,990 | | 2,093 |
Dalton Bldg. Auth. Rev. Series 2001, 5% 7/1/05 | | 6,030 | | 6,353 |
Fulton DeKalb Hosp. Auth. Hosp. Rev. 5% 1/1/08 (FSA Insured) | | 2,250 | | 2,476 |
Georgia Gen. Oblig.: | | | | |
Series A: | | | | |
4% 5/1/05 | | 7,000 | | 7,250 |
5.8% 3/1/05 | | 2,000 | | 2,105 |
Series B, 6.25% 4/1/06 | | 1,750 | | 1,929 |
Series C, 6.5% 7/1/07 | | 2,185 | | 2,511 |
Municipal Bonds - continued |
| Principal
Amount (000s) | | Value (Note 1)
(000s) |
Georgia - continued |
Georgia Muni. Elec. Auth. Pwr. Rev. Series 1993 CC, 4.8% 1/1/06 (MBIA Insured) | | $ 7,050 | | $ 7,478 |
Gwinnett County Gen. Oblig. 4% 1/1/06 | | 1,000 | | 1,047 |
Henry County Wtr. & Swr. Auth. Rev. 5% 2/1/08 (MBIA Insured) | | 1,095 | | 1,211 |
| | 42,053 |
Hawaii - 1.3% |
Hawaii Arpts. Sys. Rev.: | | | | |
Series 2000 B, 8% 7/1/10 (FGIC Insured) (e) | | 3,850 | | 4,845 |
Series 2001, 5.5% 7/1/05 (FGIC Insured) (e) | | 3,000 | | 3,171 |
Hawaii Gen. Oblig.: | | | | |
Series 2001 CV: | | | | |
5% 8/1/05 (FGIC Insured) | | 3,610 | | 3,809 |
5.5% 8/1/10 (FGIC Insured) | | 4,570 | | 5,276 |
Series CS, 5% 4/1/08 (MBIA Insured) | | 2,200 | | 2,431 |
Series CU, 5.75% 10/1/11 (MBIA Insured) | | 3,210 | | 3,717 |
Honolulu City & County Gen. Oblig. Series B, 5.5% 11/1/04 (FGIC Insured) | | 465 | | 482 |
| | 23,731 |
Illinois - 7.8% |
Chicago Gen. Oblig.: | | | | |
(Neighborhoods Alive 21 Prog.): | | | | |
5% 1/1/07 (MBIA Insured) | | 1,360 | | 1,480 |
5% 1/1/08 (MBIA Insured) | | 1,190 | | 1,311 |
5% 1/1/07 (FGIC Insured) | | 1,000 | | 1,088 |
Chicago Midway Arpt. Rev. Series 2001 B, 5% 1/1/07 (FSA Insured) | | 1,000 | | 1,087 |
Chicago O'Hare Int'l. Arpt. Rev.: | | | | |
Series 2001 C: | | | | |
5% 1/1/05 (AMBAC Insured) (e) | | 1,415 | | 1,469 |
5% 1/1/07 (AMBAC Insured) (e) | | 2,670 | | 2,872 |
5.25% 1/1/06 (AMBAC Insured) (e) | | 2,335 | | 2,479 |
Series A, 6% 1/1/05 (AMBAC Insured) | | 1,030 | | 1,079 |
5.5% 1/1/10 (AMBAC Insured) (e) | | 5,000 | | 5,564 |
Chicago Park District Series C, 5% 1/1/11 (AMBAC Insured) | | 2,515 | | 2,818 |
Chicago Pub. Bldg. Commision Bldg. Rev. Series C, 5.5% 2/1/06 (FGIC Insured) | | 6,000 | | 6,468 |
Chicago Tax Increment Rev.: | | | | |
Series 2000 A, 0% 12/1/08 (AMBAC Insured) | | 10,000 | | 8,658 |
Series A, 0% 12/1/05 (AMBAC Insured) | | 3,000 | | 2,908 |
Municipal Bonds - continued |
| Principal
Amount (000s) | | Value (Note 1)
(000s) |
Illinois - continued |
Chicago Transit Auth. Cap. Grant Receipts Rev. Series A: | | | | |
4% 6/1/06 (AMBAC Insured) | | $ 6,000 | | $ 6,065 |
4.25% 6/1/08 (AMBAC Insured) | | 3,600 | | 3,794 |
Cook County Gen. Oblig. Series 2003 B: | | | | |
5% 11/15/06 (MBIA Insured) | | 14,685 | | 15,988 |
5% 11/15/07 (MBIA Insured) | | 5,000 | | 5,527 |
Du Page Wtr. Commission Wtr. Rev. 5% 5/1/08 (AMBAC Insured) | | 4,525 | | 5,001 |
Illinois Dev. Fin. Auth. Gas Supply Rev. (The Peoples Gas Lt. & Coke Co. Proj.) Series 2003 B, 3.05%, tender 2/1/08 (AMBAC Insured) (b) | | 6,000 | | 6,102 |
Illinois Edl. Facilities Auth. Revs. (Art Institute of Chicago Proj.) Series 2003, 3.85%, tender 3/1/11 (b) | | 12,800 | | 12,634 |
Illinois Gen. Oblig.: | | | | |
First Series: | | | | |
5% 4/1/05 (FSA Insured) | | 3,000 | | 3,136 |
5% 8/1/05 | | 1,000 | | 1,056 |
5% 8/1/06 | | 8,160 | | 8,815 |
5.25% 4/1/08 (MBIA Insured) | | 1,035 | | 1,154 |
5.5% 8/1/10 | | 1,405 | | 1,613 |
Series A: | | | | |
5% 10/1/09 | | 2,600 | | 2,905 |
5% 10/1/10 | | 3,000 | | 3,360 |
5% 6/1/07 | | 6,250 | | 6,836 |
Illinois Sales Tax Rev. 5.375% 6/15/08 | | 4,170 | | 4,686 |
Kane & DuPage Counties Cmnty. Unit School District #303 Saint Charles Series A, 5.5% 1/1/12 (FSA Insured) | | 2,270 | | 2,614 |
Kane County School District #129 Aurora West Side Series A, 5.75% 2/1/14 (FGIC Insured) | | 1,600 | | 1,831 |
Kane, McHenry, Cook & DeKalb Counties Cmnty. Unit School District #300 Carpentersville 5.5% 12/1/13 (MBIA Insured) | | 5,000 | | 5,701 |
Kendall, Kane & Will Counties Cmnty. Unit School District #308: | | | | |
5% 10/1/04 (FGIC Insured) | | 510 | | 524 |
5.25% 10/1/05 (FGIC Insured) | | 560 | | 596 |
5.25% 10/1/06 (FGIC Insured) | | 695 | | 759 |
Rosemont Gen. Oblig. (Tax Increment #3 Proj.) 0% 12/1/07 (FGIC Insured) | | 3,000 | | 2,704 |
Municipal Bonds - continued |
| Principal
Amount (000s) | | Value (Note 1)
(000s) |
Illinois - continued |
Univ. of Illinois Auxiliary Facilities Sys. Rev. Series 2001 A, 5% 4/1/08 (AMBAC Insured) | | $ 2,035 | | $ 2,245 |
Will County School District #122 Series B, 0% 11/1/08 (FSA Insured) | | 1,500 | | 1,302 |
| | 146,229 |
Indiana - 1.2% |
Indiana Health Facility Fing. Auth. Rev. (Ascension Health Cr. Group Prog.) Series 2002 F: | | | | |
5% 11/15/04 | | 1,300 | | 1,343 |
5.5% 11/15/05 | | 1,000 | | 1,071 |
5.5% 11/15/06 | | 1,000 | | 1,091 |
Indiana Univ. Revs. (Student Fee Proj.) Series H, 0% 8/1/05 (AMBAC Insured) | | 5,500 | | 5,368 |
Rockport Poll. Cont. Rev. 4.9%, tender 6/1/07 (b) | | 4,000 | | 4,212 |
Saint Joseph County Ind. Edl. Facilities Rev. (Univ. of Notre Dame Du Lac Proj.) 2.5%, tender 12/3/07 (b) | | 10,000 | | 10,000 |
| | 23,085 |
Kansas - 0.7% |
Burlington Envir. Impt. Rev. (Kansas City Pwr. & Lt. Co. Proj.): | | | | |
Series C, 2.25%, tender 9/1/04 (b) | | 7,000 | | 6,995 |
4.75%, tender 10/1/07 (b) | | 2,400 | | 2,561 |
La Cygne Envir. Impt. Rev. (Kansas City Pwr. & Lt. Co. Proj.) Series 1994, 3.9%, tender 9/1/04 (b) | | 3,700 | | 3,765 |
| | 13,321 |
Kentucky - 0.1% |
Kenton County Arpt. Board Arpt. Rev. Series B, 5% 3/1/09 (MBIA Insured) (e) | | 1,185 | | 1,295 |
Louisiana - 0.9% |
New Orleans Audubon Commission Series A: | | | | |
3% 10/1/05 (FSA Insured) | | 1,930 | | 1,980 |
4% 10/1/06 (FSA Insured) | | 1,990 | | 2,107 |
4% 10/1/07 (FSA Insured) | | 1,065 | | 1,136 |
4% 10/1/08 (FSA Insured) | | 1,105 | | 1,180 |
4% 10/1/09 (FSA Insured) | | 1,090 | | 1,162 |
5% 10/1/10 (FSA Insured) | | 1,325 | | 1,490 |
New Orleans Gen. Oblig.: | | | | |
4% 3/1/05 (MBIA Insured) | | 1,590 | | 1,639 |
Municipal Bonds - continued |
| Principal
Amount (000s) | | Value (Note 1)
(000s) |
Louisiana - continued |
New Orleans Gen. Oblig.: - continued | | | | |
4% 3/1/06 (MBIA Insured) | | $ 3,695 | | $ 3,879 |
5% 3/1/07 (MBIA Insured) | | 2,000 | | 2,186 |
| | 16,759 |
Maryland - 0.8% |
Anne Arundel County Gen. Oblig. 5% 3/1/06 | | 6,200 | | 6,657 |
Carroll County Gen. Oblig. 4% 11/1/04 | | 1,000 | | 1,024 |
Maryland Gen. Oblig. (State & Local Facilities Ln. Prog.): | | | | |
Series 2002 B, 5.25% 2/1/08 | | 2,700 | | 3,019 |
Series A, 5.25% 3/1/06 | | 4,100 | | 4,427 |
| | 15,127 |
Massachusetts - 4.9% |
Massachusetts Dev. Fin. Agcy. Rev. (Massachusetts Biomedical Research Corp. Proj.) Series C: | | | | |
5.75% 8/1/06 | | 1,200 | | 1,298 |
5.875% 8/1/08 | | 1,630 | | 1,824 |
Massachusetts Gen. Oblig.: | | | | |
Series 2001 A, 5.5% 1/1/11 | | 5,000 | | 5,702 |
Series 2002 B, 5% 2/1/06 | | 40,000 | | 42,664 |
Series 2003 A, 5.375% 8/1/08 | | 5,165 | | 5,794 |
Series 2003 C: | | | | |
5% 12/1/06 (XL Cap. Assurance, Inc. Insured) | | 13,975 | | 15,222 |
5.5% 10/1/10 (MBIA Insured) | | 1,130 | | 1,300 |
Series A, 5.5% 2/1/07 (MBIA Insured) | | 7,500 | | 8,271 |
Massachusetts Health & Edl. Facilities Auth. Rev. (Caritas Christi Oblig. Group Proj.): | | | | |
5% 7/1/04 | | 1,805 | | 1,826 |
5.5% 7/1/05 | | 1,000 | | 1,026 |
New England Ed. Ln. Marketing Corp.: | | | | |
Series A, 5.7% 7/1/05 (e) | | 2,800 | | 2,963 |
Series F, 5.625% 7/1/04 (e) | | 3,500 | | 3,577 |
Springfield Gen. Oblig. 5% 1/15/06 (MBIA Insured) | | 1,000 | | 1,066 |
| | 92,533 |
Michigan - 2.0% |
Battle Creek Downtown Dev. Auth. 6% 5/1/06 (MBIA Insured) | | 1,500 | | 1,647 |
Detroit Gen. Oblig. Series A: | | | | |
5% 4/1/06 (FSA Insured) (a) | | 2,200 | | 2,262 |
5% 4/1/07 (FSA Insured) (a) | | 6,910 | | 7,208 |
Municipal Bonds - continued |
| Principal
Amount (000s) | | Value (Note 1)
(000s) |
Michigan - continued |
Ferndale Gen. Oblig.: | | | | |
3.5% 4/1/05 (FGIC Insured) | | $ 1,280 | | $ 1,315 |
3.5% 4/1/06 (FGIC Insured) | | 1,960 | | 2,038 |
Holly Area School District Series 1999, 5.375% 5/1/11 (Pre-Refunded to 5/1/05 @ 101) (f) | | 1,275 | | 1,359 |
Michigan Gen. Oblig. Series 1995, 5.7% 12/1/12 (Pre-Refunded to 12/1/05 @ 102) (f) | | 11,985 | | 13,192 |
Michigan Hosp. Fin. Auth. Hosp. Rev. (Sparrow Hosp. Obligated Group Proj.) 5% 11/15/04 | | 1,500 | | 1,544 |
Michigan Strategic Fund Exempt Facilities Rev. (Waste Mgmt., Inc. Proj.) 4.2%, tender 8/1/04 (b)(e) | | 7,000 | | 7,096 |
| | 37,661 |
Minnesota - 1.9% |
Hopkins Independent School District #270 Series B, 4% 2/1/06 | | 2,575 | | 2,702 |
Mankato Independent School District #77 Series A, 4% 2/1/06 (FSA Insured) | | 1,420 | | 1,490 |
Minneapolis & Saint Paul Hsg. & Redev. Auth. Health Care Sys. Rev. (Health Partners Oblig. Group Proj.): | | | | |
5.25% 12/1/08 | | 1,200 | | 1,289 |
5.25% 12/1/10 | | 500 | | 529 |
Minnesota Pub. Facilities Auth. Wtr. Poll. Cont. Rev. Series A, 4.5% 3/1/07 | | 2,240 | | 2,419 |
Southern Minnesota Muni. Pwr. Agcy. Pwr. Supply Sys. Rev.: | | | | |
5% 1/1/05 | | 17,245 | | 17,875 |
5% 1/1/06 (AMBAC Insured) | | 4,580 | | 4,883 |
5% 1/1/08 (AMBAC Insured) | | 2,310 | | 2,552 |
Waconia Independent School District #110 Series A, 5% 2/1/11 (FSA Insured) | | 940 | | 1,056 |
| | 34,795 |
Mississippi - 1.4% |
Jackson Wtr. & Swr. Sys. Rev. Series 2003: | | | | |
5% 9/1/05 (FSA Insured) | | 5,285 | | 5,582 |
5% 9/1/07 (FSA Insured) | | 5,825 | | 6,407 |
5% 9/1/08 (FSA Insured) | | 2,620 | | 2,908 |
5.25% 9/1/09 (FSA Insured) | | 3,105 | | 3,512 |
5.25% 9/1/11 (FSA Insured) | | 1,595 | | 1,812 |
Municipal Bonds - continued |
| Principal
Amount (000s) | | Value (Note 1)
(000s) |
Mississippi - continued |
Mississippi Bus. Fin. Corp. Solid Waste Disp. Rev. (Waste Mgmt., Inc. Proj.) 4.65%, tender 3/1/04 (b)(e) | | $ 5,000 | | $ 5,022 |
Mississippi Higher Ed. Student Ln. Series 2000 B3, 5.3% 9/1/08 (e) | | 1,190 | | 1,285 |
| | 26,528 |
Missouri - 0.5% |
Kansas City School District Bldg. Corp. Rev.: | | | | |
(Elementary School Proj.) Series B, 5% 2/1/12 (FGIC Insured) | | 3,100 | | 3,464 |
Series A, 5% 2/1/08 (FGIC Insured) | | 2,000 | | 2,209 |
Missouri Envir. Impt. & Energy Resources Auth. Wtr. Poll. Cont. & Drinking Wtr. Rev. (State Revolving Fund Prog.) Series D, 6% 1/1/05 | | 1,100 | | 1,153 |
Saint Louis Muni. Fin. Corp. Leasehold Rev. (Civil Courts Bldg. Proj.) Series 2003 A, 5% 8/1/06 (FSA Insured) | | 1,635 | | 1,769 |
| | 8,595 |
Montana - 0.2% |
Forsyth Poll. Cont. Rev. (Portland Gen. Elec. Co. Projs.) Series A, 5.2%, tender 5/1/09 (b) | | 2,900 | | 2,996 |
Nebraska - 2.1% |
Lancaster County School District #1 (Lincoln Pub. Schools Proj.): | | | | |
3% 1/15/05 | | 1,870 | | 1,905 |
4% 1/15/06 | | 1,000 | | 1,046 |
Lincoln Wtrwks. Rev. Series 2003, 5% 8/15/05 | | 3,265 | | 3,452 |
Nebraska Pub. Pwr. District Rev.: | | | | |
Series 1998 A, 5.25% 1/1/06 (MBIA Insured) | | 5,000 | | 5,352 |
Series A: | | | | |
0% 1/1/06 (MBIA Insured) | | 24,465 | | 23,586 |
0% 1/1/07 (MBIA Insured) | | 4,000 | | 3,732 |
| | 39,073 |
Nevada - 1.5% |
Clark County Arpt. Rev. Series C: | | | | |
5% 7/1/05 (AMBAC Insured) (e) | | 800 | | 840 |
5% 7/1/06 (AMBAC Insured) (e) | | 800 | | 855 |
5% 7/1/08 (AMBAC Insured) (e) | | 2,215 | | 2,409 |
5% 7/1/09 (AMBAC Insured) (e) | | 2,700 | | 2,954 |
5% 7/1/10 (AMBAC Insured) (e) | | 1,225 | | 1,336 |
5% 7/1/11 (AMBAC Insured) (e) | | 1,790 | | 1,939 |
Municipal Bonds - continued |
| Principal
Amount (000s) | | Value (Note 1)
(000s) |
Nevada - continued |
Clark County Las Vegas-McCarran Int'l. Arpt. Passenger Facility Charge Rev. Series 2002 A, 5% 7/1/06 (MBIA Insured) (e) | | $ 5,415 | | $ 5,785 |
Clark County School District: | | | | |
Series 2000 A, 5.75% 6/15/17 (MBIA Insured) | | 1,600 | | 1,822 |
Series D, 5% 6/15/09 (MBIA Insured) | | 7,000 | | 7,831 |
Washoe County Gen. Oblig. 4% 9/1/05 (FSA Insured) | | 2,170 | | 2,264 |
| | 28,035 |
New Hampshire - 0.1% |
New Hampshire Health & Ed. Facilities Auth. Rev. (Univ. Sys. of New Hampshire Proj.) 5.25% 7/1/05 (AMBAC Insured) | | 1,695 | | 1,792 |
New Jersey - 1.3% |
New Jersey Gen. Oblig. Series E, 6% 7/15/05 | | 3,700 | | 3,961 |
New Jersey Trans. Trust Fund Auth. Series 2001 A, 5% 6/15/06 | | 6,300 | | 6,789 |
New Jersey Transit Corp.: | | | | |
Series 2000 B, 5.5% 2/1/08 (AMBAC Insured) | | 1,000 | | 1,118 |
Series 2000 C, 5.25% 2/1/04 (AMBAC Insured) | | 10,000 | | 10,029 |
North Jersey District Wtr. Supply Commission (Wanaque South Proj.) Series A, 5% 7/1/05 (MBIA Insured) | | 1,680 | | 1,769 |
| | 23,666 |
New Jersey/Pennsylvania - 0.4% |
Delaware River Joint Toll Bridge Commission Bridge Rev.: | | | | |
3% 7/1/04 | | 1,630 | | 1,645 |
5% 7/1/09 | | 5,170 | | 5,702 |
| | 7,347 |
New Mexico - 1.4% |
New Mexico Edl. Assistance Foundation Student Ln. Rev. Sr. Series IV A1, 6.5% 3/1/04 (e) | | 1,540 | | 1,549 |
New Mexico Gen. Oblig. 4% 3/1/05 | | 9,875 | | 10,191 |
San Juan County Gross Receipts Tax Rev. Series B, 2.5% 8/15/05 | | 13,600 | | 13,759 |
| | 25,499 |
New York - 6.6% |
Metro. Trans. Auth. Commuter Facilities Rev. Series A: | | | | |
5% 7/1/06 (Escrowed to Maturity) (f) | | 1,520 | | 1,651 |
5.375% 7/1/09 (Escrowed to Maturity) (f) | | 3,635 | | 4,178 |
Municipal Bonds - continued |
| Principal
Amount (000s) | | Value (Note 1)
(000s) |
New York - continued |
Metro. Trans. Auth. Svc. Contract Rev. Series B: | | | | |
4% 1/1/05 | | $ 4,265 | | $ 4,378 |
5% 1/1/06 | | 10,110 | | 10,726 |
Nassau County Gen. Oblig. Series Z: | | | | |
5% 9/1/11 (FGIC Insured) | | 800 | | 884 |
5% 9/1/12 (FGIC Insured) | | 1,500 | | 1,644 |
New York City Gen. Oblig.: | | | | |
Series 2000 A, 6.5% 5/15/11 | | 2,450 | | 2,868 |
Series A, 5.25% 11/1/14 (MBIA Insured) | | 600 | | 669 |
Series E, 6% 8/1/11 | | 1,250 | | 1,380 |
Series G, 5.25% 8/1/14 (AMBAC Insured) | | 1,000 | | 1,106 |
Series H, 5.75% 3/15/11 (FGIC Insured) | | 1,700 | | 1,977 |
New York City Transitional Fin. Auth. Rev. Series 2003 E: | | | | |
4.5% 2/1/07 | | 1,750 | | 1,879 |
4.5% 2/1/08 | | 1,500 | | 1,621 |
5% 2/1/09 | | 2,000 | | 2,224 |
New York State Dorm. Auth. Revs.: | | | | |
(City Univ. Sys. Proj.) Series 2000 A, 6.125% 7/1/12 (AMBAC Insured) | | 5,540 | | 6,538 |
Series 2003 A: | | | | |
5% 1/1/06 (AMBAC Insured) | | 1,250 | | 1,325 |
5% 1/1/07 (AMBAC Insured) | | 10,855 | | 11,722 |
5% 3/15/08 | | 2,000 | | 2,196 |
New York State Envir. Facilities Corp. State Wtr. Poll. Cont. Revolving Fund Rev. (New York City Muni. Wtr. Fin. Auth. Proj.) Series 1997 E, 6% 6/15/11 (MBIA Insured) | | 3,500 | | 4,191 |
New York State Urban Dev. Corp. Rev. (Correctional Facilities-Svc. Contract Proj.) Series B, 4.75% 1/1/28 (Pre-Refunded to 1/1/09 @ 101) (f) | | 2,615 | | 2,919 |
Tobacco Settlement Fing. Corp.: | | | | |
Series A1: | | | | |
5.25% 6/1/12 | | 5,000 | | 5,245 |
5.25% 6/1/13 | | 17,500 | | 18,526 |
Series B1, 5% 6/1/06 | | 17,815 | | 18,993 |
Triborough Bridge & Tunnel Auth. Revs.: | | | | |
Series A, 5.5% 1/1/14 (Pre-Refunded to 1/1/12 @ 100) (f) | | 3,745 | | 4,359 |
Series Y, 5.9% 1/1/08 (Escrowed to Maturity) (f) | | 10,000 | | 11,396 |
| | 124,595 |
Municipal Bonds - continued |
| Principal
Amount (000s) | | Value (Note 1)
(000s) |
New York & New Jersey - 0.9% |
Port Auth. of New York & New Jersey: | | | | |
124th Series, 5% 8/1/13 (FGIC Insured) (e) | | $ 1,200 | | $ 1,278 |
127th Series: | | | | |
5% 12/15/04 (AMBAC Insured) (e) | | 5,310 | | 5,503 |
5% 12/15/06 (AMBAC Insured) (e) | | 4,965 | | 5,394 |
5% 12/15/08 (AMBAC Insured) (e) | | 3,510 | | 3,889 |
| | 16,064 |
North Carolina - 0.8% |
Mecklenburg County Gen. Oblig. Series B, 3.25% 2/1/06 | | 3,305 | | 3,422 |
North Carolina Eastern Muni. Pwr. Agcy. Pwr. Sys. Rev.: | | | | |
Series 1993 B, 7% 1/1/08 (MBIA Insured) | | 1,500 | | 1,763 |
Series A, 5.5% 1/1/10 | | 3,000 | | 3,299 |
Series B, 6% 1/1/05 | | 2,000 | | 2,025 |
Series C, 5% 1/1/08 | | 1,190 | | 1,274 |
Series D, 5.375% 1/1/10 | | 3,700 | | 4,044 |
| | 15,827 |
North Dakota - 0.1% |
North Dakota Bldg. Auth. Lease Rev. Series A, 5.25% 6/1/05 (FGIC Insured) | | 2,060 | | 2,172 |
Ohio - 3.8% |
Cleveland Arpt. Sys. Rev. Series A, 5.5% 1/1/05 (FSA Insured) (e) | | 2,250 | | 2,339 |
Cleveland Pub. Pwr. Sys. Rev. (First Mtg. Prog.) Series 1994 A, 0% 11/15/09 (MBIA Insured) | | 2,250 | | 1,875 |
Columbus Gen. Oblig. Series 1, 5% 6/15/05 | | 1,645 | | 1,732 |
Franklin County Rev. (OCLC Online Computer Library Ctr., Inc. Proj.) 5% 4/15/07 | | 1,960 | | 2,104 |
Lakewood Hosp. Impt. Rev. (Lakewood Hosp. Assoc. Proj.) 5.5% 2/15/07 | | 1,420 | | 1,530 |
Montgomery County Rev. (Catholic Health Initiatives Proj.) 4% 9/1/04 | | 1,695 | | 1,726 |
Ohio Air Quality Dev. Auth. Rev. (Pennsylvania Pwr. Co. Proj.) 2.5%, tender 7/1/04 (b) | | 2,400 | | 2,400 |
Ohio Bldg. Auth.: | | | | |
(Adult Correctional Bldg. Fund Prog.) Series A: | | | | |
5.75% 4/1/08 | | 3,555 | | 4,040 |
6% 10/1/05 | | 5,600 | | 6,039 |
Series A, 5% 4/1/11 (FGIC Insured) | | 1,000 | | 1,127 |
Ohio Gen. Oblig.: | | | | |
Series 2003 A, 4% 3/15/05 | | 9,245 | | 9,548 |
Municipal Bonds - continued |
| Principal
Amount (000s) | | Value (Note 1)
(000s) |
Ohio - continued |
Ohio Gen. Oblig.: - continued | | | | |
Series A, 5% 2/1/05 | | $ 8,550 | | $ 8,897 |
Series IIA, 5.25% 12/1/05 | | 5,000 | | 5,354 |
Ohio Rev. Series 2003-1, 5% 6/15/08 (a) | | 5,000 | | 5,545 |
Ohio Univ. Gen. Receipts Athens: | | | | |
5% 12/1/05 (FSA Insured) | | 1,650 | | 1,759 |
5% 12/1/06 (FSA Insured) | | 3,600 | | 3,932 |
5% 12/1/07 (FSA Insured) | | 1,285 | | 1,427 |
Ohio Wtr. Dev. Auth. Poll. Cont. Facilities Rev.: | | | | |
(Cleveland Elec. Illuminating Co. Proj.) Series A, 3.4%, tender 10/1/04 (b) | | 2,350 | | 2,365 |
(Toledo Edison Co. Proj.) Series B, 4.5%, tender 9/1/05 (b) | | 7,000 | | 7,179 |
Ohio Wtr. Dev. Auth. Rev. (Fresh Wtr. Proj.) Series A, 5.4% 6/1/05 (AMBAC Insured) | | 1,000 | | 1,057 |
| | 71,975 |
Oklahoma - 0.7% |
Oklahoma City Gen. Oblig. 4% 3/1/05 (FGIC Insured) | | 1,955 | | 2,018 |
Oklahoma Dev. Fin. Auth. Rev. (Samuel Roberts Noble, Inc. Proj.): | | | | |
Series 2001, 5% 5/1/05 | | 7,615 | | 7,986 |
5% 5/1/06 | | 3,200 | | 3,444 |
| | 13,448 |
Oregon - 0.8% |
Deschutes & Jefferson Counties School District #2J Redmond: | | | | |
5.5% 6/1/05 (FGIC Insured) | | 1,000 | | 1,058 |
5.5% 6/1/06 (FGIC Insured) | | 2,610 | | 2,847 |
Eugene Elec. Util. Rev. Series A: | | | | |
5.25% 8/1/05 (FSA Insured) | | 1,210 | | 1,277 |
5.25% 8/1/06 (FSA Insured) | | 1,280 | | 1,379 |
5.25% 8/1/07 (FSA Insured) | | 1,350 | | 1,481 |
5.25% 8/1/08 (FSA Insured) | | 1,425 | | 1,582 |
Oregon Dept. of Trans. Hwy. User Tax Rev. 5.5% 11/15/13 | | 3,365 | | 3,894 |
Oregon Gen. Oblig. 8.25% 1/1/07 | | 1,000 | | 1,178 |
| | 14,696 |
Municipal Bonds - continued |
| Principal
Amount (000s) | | Value (Note 1)
(000s) |
Pennsylvania - 3.0% |
Allegheny County Hosp. Dev. Auth. Rev. (Univ. of Pittsburgh Med. Ctr. Proj.) Series B: | | | | |
5.5% 6/15/05 | | $ 2,545 | | $ 2,670 |
5.5% 6/15/06 | | 3,065 | | 3,277 |
5.5% 6/15/07 | | 2,000 | | 2,163 |
Allegheny County San. Auth. Swr. Rev. 6% 12/1/11 (MBIA Insured) | | 1,495 | | 1,772 |
Hazleton Area School District 6.5% 3/1/06 (FSA Insured) | | 1,155 | | 1,273 |
Pennsylvania Econ. Dev. Fing. Auth. Exempt Facilities Rev. (Shippingport Proj.) Series A, 5%, tender 6/1/05 (b)(e) | | 6,200 | | 6,317 |
Pennsylvania Higher Edl. Facilities Auth. Rev. (UPMC Health Sys. Proj.) Series 2001 A, 5.75% 1/15/09 | | 1,750 | | 1,918 |
Pennsylvania State Univ.: | | | | |
5% 3/1/05 | | 6,935 | | 7,234 |
5% 3/1/06 | | 7,280 | | 7,795 |
Philadelphia Gas Works Rev. First Series A, 5.25% 7/1/05 (FSA Insured) | | 5,000 | | 5,269 |
Philadelphia Muni. Auth. Rev. Series A: | | | | |
4% 5/15/05 (FSA Insured) | | 2,500 | | 2,592 |
5% 5/15/07 (FSA Insured) | | 5,500 | | 6,026 |
5% 5/15/08 (FSA Insured) | | 5,000 | | 5,537 |
Wyoming Valley San. Auth. Swr. Rev. 5% 11/15/06 (MBIA Insured) | | 1,865 | | 2,032 |
| | 55,875 |
Rhode Island - 0.3% |
Rhode Island Health & Edl. Bldg. Corp. Rev. (Johnson & Wales Univ. Proj.): | | | | |
4% 4/1/05 (XL Cap. Assurance, Inc. Insured) | | 1,270 | | 1,312 |
5% 4/1/06 (XL Cap. Assurance, Inc. Insured) | | 2,225 | | 2,381 |
5% 4/1/08 (XL Cap. Assurance, Inc. Insured) | | 1,700 | | 1,877 |
| | 5,570 |
South Carolina - 1.8% |
Berkeley County School District 7% 4/1/07 | | 2,615 | | 3,011 |
Piedmont Muni. Pwr. Agcy. Elec. Rev. 5.6% 1/1/09 (MBIA Insured) | | 2,345 | | 2,684 |
Richland County School District #1 4.75% 3/1/11 (FSA Insured) | | 2,520 | | 2,788 |
Richland County School District #2 Series B, 5% 2/1/05 (FGIC Insured) | | 1,000 | | 1,041 |
Municipal Bonds - continued |
| Principal
Amount (000s) | | Value (Note 1)
(000s) |
South Carolina - continued |
Rock Hill Util. Sys. Rev. Series 2003 A: | | | | |
5% 1/1/08 (FSA Insured) | | $ 1,850 | | $ 2,042 |
5% 1/1/09 (FSA Insured) | | 1,945 | | 2,173 |
South Carolina Pub. Svc. Auth. Rev.: | | | | |
Series 2002 A: | | | | |
5% 1/1/05 (FSA Insured) | | 2,000 | | 2,076 |
5% 1/1/06 (FSA Insured) | | 1,705 | | 1,819 |
5% 1/1/07 (FSA Insured) | | 4,105 | | 4,474 |
Series A, 5.5% 1/1/11 (MBIA Insured) | | 3,000 | | 3,428 |
Series D: | | | | |
5% 1/1/06 | | 2,500 | | 2,664 |
5% 1/1/07 | | 5,000 | | 5,436 |
| | 33,636 |
Tennessee - 1.8% |
Elizabethton Health & Edl. Facilities Board Rev. (First Mtg. Prog.) 6% 7/1/11 (MBIA Insured) | | 2,005 | | 2,372 |
Memphis Gen. Oblig. 6% 11/1/06 | | 1,585 | | 1,767 |
Memphis-Shelby County Arpt. Auth. Arpt. Rev.: | | | | |
Series A: | | | | |
4% 9/1/06 (MBIA Insured) | | 1,500 | | 1,582 |
4.5% 9/1/08 (MBIA Insured) | | 1,620 | | 1,763 |
4.5% 9/1/09 (MBIA Insured) | | 1,685 | | 1,840 |
4% 9/1/05 (MBIA Insured) | | 1,445 | | 1,507 |
Metro. Nashville Arpt. Auth. Rev. Series C, 5% 7/1/06 (FGIC Insured) (e) | | 1,675 | | 1,792 |
Shelby County Gen. Oblig. Series A: | | | | |
0% 5/1/10 (Pre-Refunded to 5/1/05 @ 74.444) (f) | | 15,750 | | 11,517 |
0% 5/1/12 (Pre-Refunded to 5/1/05 @ 65.1568) (f) | | 15,130 | | 9,684 |
| | 33,824 |
Texas - 14.0% |
Arlington Independent School District 0% 2/15/16 (Pre-Refunded to 2/15/05 @ 51.4017) (f) | | 6,820 | | 3,455 |
Austin Arpt. Sys. Rev. Series A: | | | | |
6.5% 11/15/04 (MBIA Insured) (e) | | 3,215 | | 3,362 |
6.5% 11/15/05 (Escrowed to Maturity) (e)(f) | | 940 | | 1,026 |
6.5% 11/15/05 (MBIA Insured) (e) | | 6,870 | | 7,452 |
Austin Gen. Oblig. 5.5% 9/1/15 (Pre-Refunded to 9/1/05 @ 100) (f) | | 3,380 | | 3,608 |
Austin Util. Sys. Rev.: | | | | |
Series 1992 A, 0% 11/15/09 (MBIA Insured) | | 4,130 | | 3,438 |
Municipal Bonds - continued |
| Principal
Amount (000s) | | Value (Note 1)
(000s) |
Texas - continued |
Austin Util. Sys. Rev.: - continued | | | | |
Series A: | | | | |
0% 11/15/10 (MBIA Insured) | | $ 3,100 | | $ 2,448 |
5.5% 11/15/06 | | 5,000 | | 5,123 |
Birdville Independent School District 5% 2/15/10 | | 1,300 | | 1,453 |
Brazos River Auth. Poll. Cont. Rev. (Texas Utils. Elec. Co. Proj.) Series 1995 B, 5.05%, tender 6/19/06 (b)(e) | | 6,500 | | 6,810 |
Corpus Christi Gen. Oblig.: | | | | |
4% 3/1/05 (FSA Insured) | | 1,200 | | 1,238 |
4% 3/1/06 (FSA Insured) | | 1,285 | | 1,349 |
5% 3/1/07 (FSA Insured) | | 2,735 | | 2,983 |
Corpus Christi Util. Sys. Rev. 3% 7/15/05 (FSA Insured) | | 1,285 | | 1,317 |
Cypress-Fairbanks Independent School District: | | | | |
Series B, 0% 8/1/07 (AMBAC Insured) | | 10,000 | | 9,132 |
4.5% 2/15/06 | | 2,245 | | 2,377 |
5% 2/15/08 | | 2,000 | | 2,211 |
5% 2/15/10 | | 1,300 | | 1,453 |
5% 2/15/11 | | 4,940 | | 5,532 |
Deer Park Independent School District 6% 2/15/05 | | 2,000 | | 2,106 |
El Paso Wtr. & Swr. Rev.: | | | | |
5% 3/1/06 (AMBAC Insured) | | 1,000 | | 1,071 |
5% 3/1/07 (AMBAC Insured) | | 2,000 | | 2,183 |
5% 3/1/08 (AMBAC Insured) | | 2,770 | | 3,060 |
Fort Worth Gen. Oblig. Series A: | | | | |
5% 3/1/05 | | 1,000 | | 1,043 |
5% 3/1/06 | | 1,000 | | 1,071 |
Frisco Gen. Oblig.: | | | | |
Series 2003 A: | | | | |
4% 2/15/07 (FSA Insured) | | 1,320 | | 1,400 |
4% 2/15/08 (FSA Insured) | | 1,145 | | 1,221 |
5% 2/15/10 (FSA Insured) | | 1,710 | | 1,912 |
4% 2/15/06 (FSA Insured) | | 2,975 | | 3,119 |
4% 2/15/07 (FSA Insured) | | 3,115 | | 3,305 |
Garland Independent School District: | | | | |
Series A: | | | | |
4% 2/15/05 | | 1,000 | | 1,031 |
4% 2/15/06 | | 500 | | 524 |
0% 2/15/07 | | 1,610 | | 1,494 |
Harris County Gen. Oblig. Series A, 0% 8/15/07 (FGIC Insured) | | 4,400 | | 4,014 |
Municipal Bonds - continued |
| Principal
Amount (000s) | | Value (Note 1)
(000s) |
Texas - continued |
Harris County Health Facilities Dev. Corp. Rev. (Saint Luke's Episcopal Hosp. Proj.) Series 2001 A, 5.5% 2/15/09 | | $ 3,710 | | $ 4,080 |
Houston Gen. Oblig.: | | | | |
Series A, 5% 3/1/05 | | 8,800 | | 9,177 |
Series A1, 5% 3/1/11 (MBIA Insured) | | 3,335 | | 3,737 |
5% 3/1/09 (MBIA Insured) | | 1,700 | | 1,898 |
Houston Wtr. & Swr. Sys. Rev. Series B: | | | | |
5.5% 12/1/07 (AMBAC Insured) | | 5,455 | | 6,138 |
5.5% 12/1/08 (AMBAC Insured) | | 6,000 | | 6,830 |
Killeen Independent School District 4% 2/15/08 | | 1,200 | | 1,280 |
La Porte Independent School District 4% 2/15/08 | | 2,000 | | 2,133 |
Lewisville Gen. Oblig. 4% 2/15/06 (FSA Insured) | | 1,300 | | 1,363 |
McKinney Independent School District 5% 2/15/05 | | 2,280 | | 2,376 |
Mesquite Independent School District Series A, 0% 8/15/06 | | 1,115 | | 1,056 |
New Braunfels Independent School District 0% 2/1/07 | | 2,000 | | 1,858 |
North East Texas Independent School District 7% 2/1/11 | | 3,600 | | 4,402 |
North Texas Tollway Auth. Dallas North Tollway Sys. Rev. Series C: | | | | |
5% 1/1/09 (FSA Insured) | | 2,000 | | 2,219 |
5%, tender 7/1/08 (FSA Insured) (b) | | 2,650 | | 2,931 |
Northside Independent School District Series B, 2.45%, tender 8/1/06 (Liquidity Facility Dexia Cr. Local de France) (b) | | 7,500 | | 7,504 |
Pasadena Independent School District 5% 2/15/05 | | 11,445 | | 11,926 |
Port Houston Auth. Harris County 6% 10/1/06 (FGIC Insured) (e) | | 2,000 | | 2,212 |
Red River Ed. Fin. Corp. Ed. Rev. (Texas Christian Univ. Proj.) Series 2001, 3.25%, tender 3/1/04 (b) | | 6,000 | | 6,019 |
Rockwall Independent School District: | | | | |
4% 2/15/05 | | 1,155 | | 1,191 |
4% 2/15/06 | | 2,370 | | 2,485 |
5% 2/15/07 | | 3,510 | | 3,829 |
5% 2/15/08 | | 3,825 | | 4,229 |
5% 2/15/09 | | 4,690 | | 5,231 |
San Antonio Elec. & Gas Systems Rev.: | | | | |
Series 1991 A, 0% 2/1/05 (Escrowed to Maturity) (f) | | 1,000 | | 986 |
Series 2000 A, 5.75% 2/1/15 (Pre-Refunded to 2/1/10 @ 100) (f) | | 5,000 | | 5,806 |
5.25% 2/1/07 | | 2,500 | | 2,736 |
5.25% 2/1/08 | | 1,000 | | 1,111 |
Texas A&M Univ. Rev. 5.75% 5/15/05 | | 3,000 | | 3,178 |
Municipal Bonds - continued |
| Principal
Amount (000s) | | Value (Note 1)
(000s) |
Texas - continued |
Texas Gen. Oblig.: | | | | |
(College Student Ln. Prog.): | | | | |
5% 8/1/06 (e) | | $ 6,770 | | $ 7,232 |
5% 8/1/11 (e) | | 3,000 | | 3,243 |
Series C, 0% 4/1/08 (Escrowed to Maturity) (f) | | 3,100 | | 2,776 |
Texas Pub. Fin. Auth. Bldg. Rev.: | | | | |
(Dept. of Criminal Justice Prog.) Series A, 5% 2/1/07 (FSA Insured) | | 2,000 | | 2,178 |
0% 2/1/05 (MBIA Insured) | | 3,725 | | 3,672 |
Texas State Univ. Sys. Fing. Rev. 3% 3/15/05 (FSA Insured) | | 1,830 | | 1,868 |
Texas Tech Univ. Revs. Ninth Series: | | | | |
4% 2/15/09 (AMBAC Insured) | | 1,460 | | 1,554 |
5% 2/15/11 (AMBAC Insured) | | 1,250 | | 1,398 |
Trinity River Auth. Red Oak Creek Sys. Rev. 3.5% 2/1/06 (FSA Insured) | | 1,270 | | 1,318 |
Trinity River Auth. Reg'l. Wastewtr. Sys. Rev.: | | | | |
5% 8/1/06 (MBIA Insured) | | 4,000 | | 4,320 |
5% 8/1/07 (MBIA Insured) | | 1,595 | | 1,751 |
Tyler Health Facilities Dev. Corp. Hosp. Rev. (Mother Frances Hosp. Reg'l. Health Care Ctr. Proj.): | | | | |
4% 7/1/05 | | 1,800 | | 1,848 |
4.5% 7/1/06 | | 1,220 | | 1,269 |
5% 7/1/07 | | 1,000 | | 1,057 |
Univ. of Houston Univ. Revs. Series A: | | | | |
3.5% 2/15/06 (FSA Insured) | | 4,955 | | 5,144 |
3.75% 2/15/07 (FSA Insured) | | 5,100 | | 5,369 |
4% 2/15/08 (FSA Insured) | | 5,265 | | 5,605 |
Webb County Gen. Oblig.: | | | | |
5% 2/15/04 (FGIC Insured) | | 705 | | 708 |
5% 2/15/05 (FGIC Insured) | | 1,005 | | 1,047 |
5% 2/15/06 (FGIC Insured) | | 1,055 | | 1,128 |
5% 2/15/07 (FGIC Insured) | | 1,110 | | 1,211 |
5% 2/15/08 (FGIC Insured) | | 1,170 | | 1,294 |
Wichita Falls Independent School District 0% 2/1/10 | | 2,325 | | 1,892 |
| | 263,124 |
Utah - 1.0% |
Box Elder County School District 5% 6/15/05 | | 3,620 | | 3,812 |
Salt Lake City School District Series A, 6.25% 3/1/13 (Pre-Refunded to 3/1/05 @ 100) (f) | | 3,695 | | 3,912 |
Municipal Bonds - continued |
| Principal
Amount (000s) | | Value (Note 1)
(000s) |
Utah - continued |
Salt Lake County Wtr. Conservancy District Rev. Series A: | | | | |
0% 10/1/11 (AMBAC Insured) | | $ 3,800 | | $ 2,872 |
0% 10/1/12 (AMBAC Insured) | | 3,800 | | 2,723 |
0% 10/1/13 (AMBAC Insured) | | 3,760 | | 2,565 |
Utah Muni. Pwr. Agcy. Elec. Sys. Rev. Series A, 4% 7/1/05 (AMBAC Insured) | | 1,000 | | 1,038 |
Utah Trans. Auth. Sales Tax Rev. Series A, 5% 6/15/05 (FSA Insured) | | 1,550 | | 1,629 |
| | 18,551 |
Virginia - 0.1% |
Virginia Commonwealth Trans. Board Trans. Rev. (U.S. Route 58 Corridor Dev. Prog.) Series B, 5.375% 5/15/12 | | 1,800 | | 2,036 |
Washington - 7.7% |
Clark County Pub. Util. District #1 Elec. Rev.: | | | | |
Series B: | | | | |
5% 1/1/06 (FSA Insured) | | 1,375 | | 1,465 |
5% 1/1/07 (FSA Insured) | | 1,395 | | 1,516 |
5.25% 1/1/08 (FSA Insured) | | 1,515 | | 1,683 |
5.25% 1/1/09 (FSA Insured) | | 1,595 | | 1,788 |
5% 1/1/11 (MBIA Insured) | | 1,680 | | 1,876 |
Energy Northwest Elec. Rev. (#3 Proj.) Series B, 6% 7/1/16 (AMBAC Insured) | | 5,000 | | 5,789 |
King & Snohomish Counties School District #417 Northshore: | | | | |
5.5% 12/1/14 (FSA Insured) | | 6,300 | | 7,173 |
5.75% 12/1/15 (FSA Insured) | | 2,500 | | 2,874 |
King County Swr. Rev. Series B: | | | | |
5% 1/1/05 (FSA Insured) | | 2,000 | | 2,076 |
5% 1/1/06 (FSA Insured) | | 3,000 | | 3,196 |
5% 1/1/07 (FSA Insured) | | 5,000 | | 5,434 |
5.25% 1/1/08 (FSA Insured) | | 3,500 | | 3,888 |
Port of Seattle Rev.: | | | | |
Series B: | | | | |
5.25% 9/1/06 (FGIC Insured) (e) | | 2,330 | | 2,518 |
5.5% 2/1/06 (MBIA Insured) (e) | | 4,250 | | 4,554 |
5.5% 2/1/07 (MBIA Insured) (e) | | 5,775 | | 6,321 |
Series D, 5.75% 11/1/15 (FGIC Insured) (e) | | 3,640 | | 4,067 |
Seattle Muni. Lt. & Pwr. Rev. 5.25% 3/1/07 (FSA Insured) | | 1,690 | | 1,858 |
Municipal Bonds - continued |
| Principal
Amount (000s) | | Value (Note 1)
(000s) |
Washington - continued |
Snohomish County Pub. Hosp. District #2 (Stevens Health Care Proj.): | | | | |
4% 12/1/05 (FGIC Insured) | | $ 1,570 | | $ 1,639 |
4.5% 12/1/09 (FGIC Insured) | | 1,000 | | 1,089 |
Washington Gen. Oblig.: | | | | |
Series 2001 RA, 5.25% 9/1/06 | | 11,750 | | 12,772 |
Series A: | | | | |
3.5% 1/1/06 (MBIA Insured) | | 12,500 | | 12,944 |
4% 1/1/08 (MBIA Insured) | | 33,175 | | 35,347 |
5.5% 7/1/11 | | 3,500 | | 3,987 |
Series C, 5% 1/1/08 (FSA Insured) | | 8,320 | | 9,180 |
Washington Pub. Pwr. Supply Sys. Nuclear Proj. #2 Rev. Series A, 5.75% 7/1/08 | | 3,000 | | 3,397 |
Washington Pub. Pwr. Supply Sys. Nuclear Proj. #3 Rev. Series C, 5% 7/1/06 (FSA Insured) | | 5,000 | | 5,394 |
| | 143,825 |
Wisconsin - 1.3% |
Wisconsin Clean Wtr. Rev. Series 2, 5% 6/1/05 (MBIA Insured) | | 4,840 | | 5,084 |
Wisconsin Health & Edl. Facilities Auth. Rev.: | | | | |
(Hosp. Sisters Svcs., Inc. Proj.) Series 2003 B, 4%, tender 12/1/06 (FSA Insured) (b) | | 15,000 | | 15,716 |
(Wheaton Franciscan Svcs., Inc. Proj.) Series A: | | | | |
5% 8/15/09 | | 1,000 | | 1,079 |
5% 8/15/10 | | 1,870 | | 2,001 |
| | 23,880 |
TOTAL MUNICIPAL BONDS (Cost $1,772,670) | 1,816,236 |
Municipal Notes - 2.5% |
| | | |
Kansas - 0.3% |
Wichita Solid Waste Disp. Rev. (Weyerhaeuser Co. Proj.) 2.23%, VRDN (b)(e) | 4,950 | | 4,950 |
Massachusetts - 1.7% |
Acton & Boxborough Reg'l. School District BAN 3.5% 4/1/05 | 8,000 | | 8,216 |
Lynnfield Gen. Oblig. BAN 2.5% 3/1/05 | 24,000 | | 24,342 |
| | 32,558 |
Municipal Notes - continued |
| Principal
Amount (000s) | | Value (Note 1)
(000s) |
Oklahoma - 0.3% |
Southeastern Oklahoma Indl. Auth. Solid Waste Disp. Rev. (Weyerhaeuser Co. Proj.) Series 2000 A, 2.1%, VRDN (b)(e) | $ 6,000 | | $ 6,000 |
Oregon - 0.2% |
Lane County Swr. Disp. Rev. (Weyerhauser Co. Proj.) 2.23%, VRDN (b)(e) | 4,200 | | 4,200 |
TOTAL MUNICIPAL NOTES (Cost $47,669) | 47,708 |
Money Market Funds - 0.8% |
| Shares | | |
Fidelity Municipal Cash Central Fund, 1.3% (c)(d)
(Cost $14,115) | 14,115,000 | | 14,115 |
TOTAL INVESTMENT PORTFOLIO - 100.2% (Cost $1,834,454) | | 1,878,059 |
NET OTHER ASSETS - (0.2)% | | (3,707) |
NET ASSETS - 100% | $ 1,874,352 |
Security Type Abbreviations |
BAN - BOND ANTICIPATION NOTE |
VRDN - VARIABLE RATE DEMAND NOTE |
Legend |
(a) Security or a portion of the security purchased on a delayed delivery or when-issued basis. |
(b) The coupon rate shown on floating or adjustable rate securities represents the rate at period end. |
(c) Information in this report regarding holdings by state and security types does not reflect the holdings of the Fidelity Municipal Cash Central Fund. |
(d) The rate quoted is the annualized seven-day yield of the fund at period end. A complete listing of the fund's holdings as of its most recent fiscal year end is available upon request. |
(e) Private activity obligations whose interest is subject to the federal alternative minimum tax for individuals. |
(f) Security collateralized by an amount sufficient to pay interest and principal. |
(g) Restricted securities - Investment in securities not registered under the Securities Act of 1933 (excluding 144A issues). At the end of the period, the value of restricted securities (excluding 144A issues) amounted to $10,223,000 or 0.5% of net assets. |
Additional information on each holding is as follows: |
Security | Acquisition
Date | Acquisition
Cost (000s) |
Univ. of California Revs. (UCLA Med. Ctr. Proj.) 4.55% 12/1/09 | 3/6/02 | $ 9,600 |
Other Information |
The distribution of municipal securities by revenue source, as a percentage of total net assets, is as follows: |
General Obligations | 45.3% |
Electric Utilities | 15.1 |
Transportation | 9.3 |
Escrowed/Pre-Refunded | 6.2 |
Water & Sewer | 6.0 |
Health Care | 5.8 |
Education | 5.4 |
Others* (individually less than 5%) | 6.9 |
| 100.0% |
*Includes cash equivalents and net other assets |
Purchases and sales of securities, other than short-term securities, aggregated $815,297,000 and $610,795,000, respectively. |
Income Tax Information |
The fund hereby designates approximately $12,640,000 as a capital gain dividend for the purpose of the dividend paid deduction. |
See accompanying notes which are an integral part of the financial statements.
Annual Report
Financial Statements
Statement of Assets and Liabilities
Amounts in thousands (except per-share amounts) | December 31, 2003 |
| | |
Assets | | |
Investment in securities, at value (cost $1,834,454) - See accompanying schedule | | $ 1,878,059 |
Cash | | 92 |
Receivable for fund shares sold | | 3,158 |
Interest receivable | | 24,458 |
Prepaid expenses | | 11 |
Total assets | | 1,905,778 |
| | |
Liabilities | | |
Payable for investments purchased
Regular delivery | $ 12 | |
Delayed delivery | 27,159 | |
Payable for fund shares redeemed | 2,597 | |
Distributions payable | 869 | |
Accrued management fee | 585 | |
Distribution fees payable | 11 | |
Other affiliated payables | 145 | |
Other payables and accrued expenses | 48 | |
Total liabilities | | 31,426 |
| | |
Net Assets | | $ 1,874,352 |
Net Assets consist of: | | |
Paid in capital | | $ 1,829,370 |
Undistributed net investment income | | 351 |
Accumulated undistributed net realized gain (loss) on investments | | 1,026 |
Net unrealized appreciation (depreciation) on investments | | 43,605 |
Net Assets | | $ 1,874,352 |
See accompanying notes which are an integral part of the financial statements.
Annual Report
Financial Statements - continued
Statement of Assets and Liabilities - continued
Amounts in thousands (except per-share amounts) | December 31, 2003 |
| | |
Calculation of Maximum Offering Price
Class A:
Net Asset Value and redemption price per share
($9,104 ÷ 867 shares) | | $ 10.50 |
| | |
Maximum offering price per share (100/96.25 of $10.50) | | $ 10.91 |
Class T:
Net Asset Value and redemption price per share ($12,104 ÷ 1,155 shares) | | $ 10.48 |
| | |
Maximum offering price per share (100/97.25 of $10.48) | | $ 10.78 |
Class B:
Net Asset Value and offering price per share
($2,455 ÷ 234 shares) A | | $ 10.49 |
| | |
Class C:
Net Asset Value and offering price per share
($7,584.1 ÷ 723.39 shares) A | | $ 10.48 |
| | |
Spartan Short-Intermediate Municipal Income:
Net Asset Value, offering price and redemption price per share ($1,842,691 ÷ 175,754 shares) | | $ 10.48 |
| | |
Institutional Class:
Net Asset Value, offering price and redemption price per share ($414.3 ÷ 39.511 shares) | | $ 10.49 |
A Redemption price per share is equal to net asset value less any applicable contingent deferred sales charge.
See accompanying notes which are an integral part of the financial statements.
Annual Report
Statement of Operations
Amounts in thousands | Year ended December 31, 2003 |
| | |
Investment Income | | |
Interest | | $ 56,981 |
| | |
Expenses | | |
Management fee | $ 6,841 | |
Transfer agent fees | 1,292 | |
Distribution fees | 36 | |
Accounting fees and expenses | 414 | |
Non-interested trustees' compensation | 9 | |
Custodian fees and expenses | 29 | |
Registration fees | 179 | |
Audit | 55 | |
Legal | 27 | |
Miscellaneous | 7 | |
Total expenses before reductions | 8,889 | |
Expense reductions | (308) | 8,581 |
Net investment income (loss) | | 48,400 |
Realized and Unrealized Gain (Loss) Net realized gain (loss) on: | | |
Investment securities | 14,019 | |
Swap agreements | (1,302) | |
Total net realized gain (loss) | | 12,717 |
Change in net unrealized appreciation (depreciation) on: Investment securities | (8,702) | |
Swap agreements | 131 | |
Total change in net unrealized appreciation (depreciation) | | (8,571) |
Net gain (loss) | | 4,146 |
Net increase (decrease) in net assets resulting from operations | | $ 52,546 |
See accompanying notes which are an integral part of the financial statements.
Annual Report
Financial Statements - continued
Statement of Changes in Net Assets
Amounts in thousands | Year ended
December 31,
2003 | Year ended
December 31,
2002 |
Increase (Decrease) in Net Assets | | |
Operations | | |
Net investment income (loss) | $ 48,400 | $ 44,777 |
Net realized gain (loss) | 12,717 | 10,257 |
Change in net unrealized appreciation (depreciation) | (8,571) | 30,522 |
Net increase (decrease) in net assets resulting
from operations | 52,546 | 85,556 |
Distributions to shareholders from net investment income | (48,268) | (44,681) |
Distributions to shareholders from net realized gain | (12,396) | (9,372) |
Total distributions | (60,664) | (54,053) |
Share transactions - net increase (decrease) | 199,628 | 467,957 |
Redemption fees | 43 | 66 |
Total increase (decrease) in net assets | 191,553 | 499,526 |
| | |
Net Assets | | |
Beginning of period | 1,682,799 | 1,183,273 |
End of period (including undistributed net investment income of $351 and undistributed net investment income of $238, respectively) | $ 1,874,352 | $ 1,682,799 |
See accompanying notes which are an integral part of the financial statements.
Annual Report
Financial Highlights - Class A
Years ended December 31, | 2003 F |
Selected Per-Share Data | |
Net asset value, beginning of period | $ 10.49 |
Income from Investment Operations | |
Net investment income (loss) E | .115 |
Net realized and unrealized gain (loss) | .071 |
Total from investment operations | .186 |
Distributions from net investment income | (.111) |
Distributions from net realized gain | (.065) |
Total distributions | (.176) |
Redemption fees added to paid in capitalE | - H |
Net asset value, end of period | $ 10.50 |
Total Return B, C, D | 1.78% |
Ratios to Average Net Assets G | |
Expenses before expense reductions | .65% A |
Expenses net of voluntary waivers, if any | .65% A |
Expenses net of all reductions | .64% A |
Net investment income (loss) | 2.52% A |
Supplemental Data | |
Net assets, end of period (in millions) | $ 9 |
Portfolio turnover rate | 34% |
A Annualized
B Total returns for periods of less than one year are not annualized.
C Total returns would have been lower had certain expenses not been reduced during the periods shown.
D Total returns do not include the effect of the sales charges.
E Calculated based on average shares outstanding during the period.
F For the period July 23, 2003 (commencement of sale of shares) to December 31, 2003.
G Expense ratios reflect operating expenses of the class. Expenses before reductions do not reflect amounts reimbursed by the investment adviser or reductions from brokerage service arrangements or other expense offset arrangements and do not represent the amount paid by the class during periods when reimbursements or reductions occur. Expense ratios before reductions for start-up periods may not be representative of longer-term operating periods. Expenses net of any voluntary waivers reflect expenses after reimbursement by the investment adviser but prior to reductions from brokerage service arrangements or other expense offset arrangements. Expenses net of all reductions represent the net expenses paid by the class.
H Amount represents less than .001 per share.
See accompanying notes which are an integral part of the financial statements.
Annual Report
Financial Highlights - Class T
Years ended December 31, | 2003 F |
Selected Per-Share Data | |
Net asset value, beginning of period | $ 10.49 |
Income from Investment Operations | |
Net investment income (loss) E | .110 |
Net realized and unrealized gain (loss) | .050 |
Total from investment operations | .160 |
Distributions from net investment income | (.105) |
Distributions from net realized gain | (.065) |
Total distributions | (.170) |
Redemption fees added to paid in capitalE | - H |
Net asset value, end of period | $ 10.48 |
Total Return B, C, D | 1.54% |
Ratios to Average Net Assets G | |
Expenses before expense reductions | .77% A |
Expenses net of voluntary waivers, if any | .77% A |
Expenses net of all reductions | .76% A |
Net investment income (loss) | 2.41% A |
Supplemental Data | |
Net assets, end of period (in millions) | $ 12 |
Portfolio turnover rate | 34% |
A Annualized
B Total returns for periods of less than one year are not annualized.
C Total returns would have been lower had certain expenses not been reduced during the periods shown.
D Total returns do not include the effect of the sales charges.
E Calculated based on average shares outstanding during the period.
F For the period July 23, 2003 (commencement of sale of shares) to December 31, 2003.
G Expense ratios reflect operating expenses of the class. Expenses before reductions do not reflect amounts reimbursed by the investment adviser or reductions from brokerage service arrangements or other expense offset arrangements and do not represent the amount paid by the class during periods when reimbursements or reductions occur. Expense ratios before reductions for start-up periods may not be representative of longer-term operating periods. Expenses net of any voluntary waivers reflect expenses after reimbursement by the investment adviser but prior to reductions from brokerage service arrangements or other expense offset arrangements. Expenses net of all reductions represent the net expenses paid by the class.
H Amount represents less than .001 per share.
See accompanying notes which are an integral part of the financial statements.
Annual Report
Financial Highlights - Class B
Years ended December 31, | 2003 F |
Selected Per-Share Data | |
Net asset value, beginning of period | $ 10.49 |
Income from Investment Operations | |
Net investment income (loss) E | .081 |
Net realized and unrealized gain (loss) | .059 |
Total from investment operations | .140 |
Distributions from net investment income | (.075) |
Distributions from net realized gain | (.065) |
Total distributions | (.140) |
Redemption fees added to paid in capitalE | - H |
Net asset value, end of period | $ 10.49 |
Total Return B, C, D | 1.34% |
Ratios to Average Net Assets G | |
Expenses before expense reductions | 1.40% A |
Expenses net of voluntary waivers, if any | 1.40% A |
Expenses net of all reductions | 1.39% A |
Net investment income (loss) | 1.78% A |
Supplemental Data | |
Net assets, end of period (in millions) | $ 2 |
Portfolio turnover rate | 34% |
A Annualized
B Total returns for periods of less than one year are not annualized.
C Total returns would have been lower had certain expenses not been reduced during the periods shown.
D Total returns do not include the effect of the contingent deferred sales charge.
E Calculated based on average shares outstanding during the period.
F For the period July 23, 2003 (commencement of sale of shares) to December 31, 2003.
G Expense ratios reflect operating expenses of the class. Expenses before reductions do not reflect amounts reimbursed by the investment adviser or reductions from brokerage service arrangements or other expense offset arrangements and do not represent the amount paid by the class during periods when reimbursements or reductions occur. Expense ratios before reductions for start-up periods may not be representative of longer-term operating periods. Expenses net of any voluntary waivers reflect expenses after reimbursement by the investment adviser but prior to reductions from brokerage service arrangements or other expense offset arrangements. Expenses net of all reductions represent the net expenses paid by the class.
H Amount represents less than .001 per share.
See accompanying notes which are an integral part of the financial statements.
Annual Report
Financial Highlights - Class C
Years ended December 31, | 2003 F |
Selected Per-Share Data | |
Net asset value, beginning of period | $ 10.49 |
Income from Investment Operations | |
Net investment income (loss) E | .077 |
Net realized and unrealized gain (loss) | .048 |
Total from investment operations | .125 |
Distributions from net investment income | (.070) |
Distributions from net realized gain | (.065) |
Total distributions | (.135) |
Redemption fees added to paid in capitalE | - H |
Net asset value, end of period | $ 10.48 |
Total Return B, C, D | 1.20% |
Ratios to Average Net Assets G | |
Expenses before expense reductions | 1.50% A |
Expenses net of voluntary waivers, if any | 1.50% A |
Expenses net of all reductions | 1.49% A |
Net investment income (loss) | 1.67% A |
Supplemental Data | |
Net assets, end of period (in millions) | $ 8 |
Portfolio turnover rate | 34% |
A Annualized
B Total returns for periods of less than one year are not annualized.
C Total returns would have been lower had certain expenses not been reduced during the periods shown.
D Total returns do not include the effect of the contingent deferred sales charge.
E Calculated based on average shares outstanding during the period.
F For the period July 23, 2003 (commencement of sale of shares) to December 31, 2003.
G Expense ratios reflect operating expenses of the class. Expenses before reductions do not reflect amounts reimbursed by the investment adviser or reductions from brokerage service arrangements or other expense offset arrangements and do not represent the amount paid by the class during periods when reimbursements or reductions occur. Expense ratios before reductions for start-up periods may not be representative of longer-term operating periods. Expenses net of any voluntary waivers reflect expenses after reimbursement by the investment adviser but prior to reductions from brokerage service arrangements or other expense offset arrangements. Expenses net of all reductions represent the net expenses paid by the class.
H Amount represents less than .001 per share.
See accompanying notes which are an integral part of the financial statements.
Annual Report
Financial Highlights - Spartan Short-Intermediate Municipal Income
Years ended December 31, | 2003 | 2002 | 2001 | 2000 F | 2000 H | 1999 H |
Selected Per-Share Data | | | | | |
Net asset value,
beginning of period | $ 10.52 | $ 10.27 | $ 10.12 | $ 10.03 | $ 10.00 | $ 10.15 |
Income from Investment Operations | | | | | | |
Net investment income (loss) | .283 D | .336 D | .396 D, G | .139 D | .399 D | .395 |
Net realized and unrealized gain (loss) | .030 | .317 | .173 G | .092 | .034 | (.150) |
Total from investment operations | .313 | .653 | .569 | .231 | .433 | .245 |
Distributions from net investment income | (.283) | (.339) | (.396) | (.140) | (.400) | (.395) |
Distributions from net realized gain | (.070) | (.064) | (.023) | (.001) | - | - |
Distributions in excess of net realized gain | - | - | - | - | (.003) | - |
Total distributions | (.353) | (.403) | (.419) | (.141) | (.403) | (.395) |
Redemption fees added to paid in capital | -D, I | -D, I | -D, I | - | - | - |
Net asset value,
end of period | $ 10.48 | $ 10.52 | $ 10.27 | $ 10.12 | $ 10.03 | $ 10.00 |
Total Return B, C | 3.01% | 6.47% | 5.70% | 2.32% | 4.45% | 2.44% |
Ratios to Average Net Assets E | | | | | |
Expenses before expense reductions | .49% | .49% | .49% | .49% A | .55% | .55% |
Expenses net of voluntary waivers, if any | .49% | .49% | .49% | .49% A | .54% | .55% |
Expenses net of all reductions | .47% | .45% | .41% | .45% A | .54% | .55% |
Net investment income (loss) | 2.69% | 3.23% | 3.85% G | 4.17% A | 4.02% | 3.89% |
Supplemental Data | | | | | | |
Net assets, end of period (in millions) | $ 1,843 | $ 1,683 | $ 1,183 | $ 965 | $ 904 | $ 698 |
Portfolio turnover rate | 34% | 38% | 43% | 106% A | 53% | 66% |
A Annualized
B Total returns for periods of less than one year are not annualized.
C Total returns would have been lower had certain expenses not been reduced during the periods shown.
D Calculated based on average shares outstanding during the period.
E Expense ratios reflect operating expenses of the class. Expenses before reductions do not reflect amounts reimbursed by the investment adviser or reductions from brokerage service arrangements or other expense offset arrangements and do not represent the amount paid by the class during periods when reimbursements or reductions occur. Expenses net of any voluntary waivers reflect expenses after reimbursement by the investment adviser but prior to reductions from brokerage service arrangements or other expense offset arrangements. Expenses net of all reductions represent the net expenses paid by the class.
F For the four months ended December 31.
G Effective January 1, 2001, the fund adopted the provisions of the AICPA Audit and Accounting Guide for Investment Companies and began amortizing premium and discount on all debt securities. Per-share data and ratios for periods prior to adoption have not been restated to reflect this change.
H For the year ended August 31.
I Amount represents less than .001 per share.
See accompanying notes which are an integral part of the financial statements.
Annual Report
Financial Highlights - Institutional Class
Years ended December 31, | 2003 E |
Selected Per-Share Data | |
Net asset value, beginning of period | $ 10.49 |
Income from Investment Operations | |
Net investment income (loss) D | .125 |
Net realized and unrealized gain (loss) | .059 |
Total from investment operations | .184 |
Distributions from net investment income | (.119) |
Distributions from net realized gain | (.065) |
Total distributions | (.184) |
Redemption fees added to paid in capitalD | - G |
Net asset value, end of period | $ 10.49 |
Total Return B, C | 1.77% |
Ratios to Average Net Assets F | |
Expenses before expense reductions | .48% A |
Expenses net of voluntary waivers, if any | .48% A |
Expenses net of all reductions | .47% A |
Net investment income (loss) | 2.69% A |
Supplemental Data | |
Net assets, end of period (000 omitted) | $ 414 |
Portfolio turnover rate | 34% |
A Annualized
B Total returns for periods of less than one year are not annualized.
C Total returns would have been lower had certain expenses not been reduced during the periods shown.
D Calculated based on average shares outstanding during the period.
E For the period July 23, 2003 (commencement of sale of shares) to December 31, 2003.
F Expense ratios reflect operating expenses of the class. Expenses before reductions do not reflect amounts reimbursed by the investment adviser or reductions from brokerage service arrangements or other expense offset arrangements and do not represent the amount paid by the class during periods when reimbursements or reductions occur. Expense ratios before reductions for start-up periods may not be representative of longer-term operating periods. Expenses net of any voluntary waivers reflect expenses after reimbursement by the investment adviser but prior to reductions from brokerage service arrangements or other expense offset arrangements. Expenses net of all reductions represent the net expenses paid by the class.
G Amount represents less than .001 per share.
See accompanying notes which are an integral part of the financial statements.
Annual Report
Notes to Financial Statements
For the period ended December 31, 2003
1. Significant Accounting Policies.
Spartan Short-Intermediate Municipal Income Fund (the fund) is a fund of Fidelity Municipal Trust (the trust) and is authorized to issue an unlimited number of shares. The trust is registered under the Investment Company Act of 1940, as amended (the 1940 Act), as an open-end management investment company organized as a Massachusetts business trust.
The fund offers Class A, Class T, Class B, Class C, Spartan Short Intermediate Municipal Income and Institutional Class shares, each of which has equal rights as to assets and voting privileges. Each class has exclusive voting rights with respect to matters that affect that class. The fund commenced sale of Class A, Class T, Class B, Class C and Institutional Class shares on July 23, 2003. Class B shares will automatically convert to Class A shares after a holding period of four years from the initial date of purchase. Investment income, realized and unrealized capital gains and losses, the common expenses of the fund, and certain fund-level expense reductions, if any, are allocated on a pro rata basis to each class based on the relative net assets of each class to the total net assets of the fund. Each class differs with respect to transfer agent and distribution and service plan fees incurred. Certain expense reductions also differ by class.
The financial statements have been prepared in conformity with accounting principles generally accepted in the United States of America, which require management to make certain estimates and assumptions at the date of the financial statements. The following summarizes the significant accounting policies of the fund:
Security Valuation. Net asset value per share (NAV calculation) is calculated as of the close of business of the New York Stock Exchange, normally 4:00 p.m. Eastern time. Debt securities are valued on the basis of information provided by a pricing service. Pricing services use valuation matrices that incorporate both dealer-supplied valuations and valuation models. If an event that is expected to materially affect the value of a security occurs after the close of an exchange or market on which that security trades, but prior to the NAV calculation, then that security will be fair valued taking the event into account. Securities (including restricted securities) for which market quotations are not readily available are valued at their fair value as determined in good faith under consistently applied procedures under the general supervision of the Board of Trustees. Price movements in futures contracts and ADRs, market and trading trends, the bid/ask quotes of brokers and off-exchange institutional trading may be reviewed in the course of making a good faith determination of a security's fair value. Short-term securities with remaining maturities of sixty days or less for which quotations are not readily available are valued on the basis of amortized cost. Investments in open-end investment companies are valued at their net asset value each business day.
Annual Report
Notes to Financial Statements - continued
1. Significant Accounting Policies - continued
Investment Transactions and Income. Security transactions are accounted for as of trade date. Gains and losses on securities sold are determined on the basis of identified cost. Interest income is accrued as earned. Interest income includes coupon interest and amortization of premium and accretion of discount on debt securities, which is accrued using the interest method.
Expenses. Most expenses of the trust can be directly attributed to a fund. Expenses which cannot be directly attributed are apportioned among the funds in the trust.
Income Tax Information and Distributions to Shareholders. Each year, the fund intends to qualify as a regulated investment company by distributing all of its taxable income and realized gains under Subchapter M of the Internal Revenue Code. As a result, no provision for income taxes is required in the accompanying financial statements. Income dividends and capital gain distributions are declared separately for each class. Dividends are declared daily and paid monthly from net investment income. Distributions from realized gains, if any, are recorded on the ex-dividend date.
Income and capital gain distributions are determined in accordance with income tax regulations, which may differ from generally accepted accounting principles. In addition, the fund will treat a portion of the proceeds from shares redeemed as a distribution from net investment income and realized gain for income tax purposes. Capital accounts within the financial statements are adjusted for permanent and temporary book and tax differences. These adjustments have no impact on net assets or the results of operations. Temporary differences will reverse in a subsequent period. These differences are primarily due to short-term capital gains and market discount.
The tax-basis components of distributable earnings and the federal tax cost as of period end were as follows:
Unrealized appreciation | $ 44,793,540 | | |
Unrealized depreciation | (865,706) | |
Net unrealized appreciation (depreciation) | 43,927,834 | |
Undistributed ordinary income | 27,223 | |
Cost for federal income tax purposes | $ 1,834,130,928 | |
The tax character of distributions paid was as follows:
| December 31, 2003 | December 31, 2002 |
Tax-exempt Income | $ 48,268,450 | $ 44,746,408 |
Long-term Capital Gains | 12,396,165 | 9,306,879 |
Total | $ 60,664,615 | $ 54,053,287 |
Annual Report
1. Significant Accounting Policies - continued
Short-Term Trading (Redemption) Fees. Shares held in the fund less than 30 days are subject to a short-term trading fee equal to .50% of the proceeds of the redeemed shares. The fee, which is retained by the fund, is accounted for as an addition to paid in capital.
2. Operating Policies.
Delayed Delivery Transactions and When-Issued Securities. The fund may purchase or sell securities on a delayed delivery or when-issued basis. Payment and delivery may take place after the customary settlement period for that security. The price of the underlying securities and the date when the securities will be delivered and paid for are fixed at the time the transaction is negotiated. During the time a delayed delivery sell is outstanding, the contract is marked-to-market daily and equivalent deliverable securities are held for the transaction. The value of the securities purchased on a delayed delivery or when-issued basis are identified as such in the fund's Schedule of Investments. The fund may receive compensation for interest forgone in the purchase of a delayed delivery or when-issued security. With respect to purchase commitments, the fund identifies securities as segregated in its records with a value at least equal to the amount of the commitment. Losses may arise due to changes in the value of the underlying securities or if the counterparty does not perform under the contract's terms, or if the issuer does not issue the securities due to political, economic, or other factors.
Restricted Securities. The fund may invest in securities that are subject to legal or contractual restrictions on resale. These securities generally may be resold in transactions exempt from registration or to the public if the securities are registered. Disposal of these securities may involve time-consuming negotiations and expense, and prompt sale at an acceptable price may be difficult. Information regarding restricted securities is included at the end of the fund's Schedule of Investments.
Swap Agreements. The fund may invest in swaps for the purpose of managing its exposure to interest rate, credit or market risk.
Interest rate swaps are agreements to exchange cash flows periodically based on a notional principal amount, for example, the exchange of fixed rate interest payments for floating rate interest payments. The primary risk associated with interest rate swaps is that unfavorable changes in the fluctuation of interest rates could adversely impact the fund.
Swaps are marked-to-market daily based on dealer-supplied valuations and changes in value are recorded as unrealized appreciation (depreciation). Gains or losses are realized upon early termination of the swap agreement. Collateral, in the form of cash or securities, may be required to be held in segregated accounts with the fund's custodian in compliance with swap contracts.
Annual Report
Notes to Financial Statements - continued
3. Purchases and Sales of Investments.
Information regarding purchases and sales of securities is included under the caption "Other Information" at the end of the fund's Schedule of Investments.
4. Fees and Other Transactions with Affiliates.
Management Fee. Fidelity Management & Research Company (FMR) and its affiliates provide the fund with investment management related services for which the fund pays a monthly management fee. The management fee is the sum of an individual fund fee rate that is based on an annual rate of .25% of the fund's average net assets and a group fee rate that averaged .13% during the period. The group fee rate is based upon the average net assets of all the mutual funds advised by FMR. The group fee rate decreases as assets under management increase and increases as assets under management decrease. For the period, the total annual management fee rate was .38% of the fund's average net assets.
Distribution and Service Plan. In accordance with Rule 12b-1 of the 1940 Act, the Fund has adopted separate Distribution and Service Plans for each class of shares. Certain classes pay Fidelity Distributors Corporation (FDC), an affiliate of FMR, separate Distribution and Service Fees, each of which is based on an annual percentage of each class' average net assets. In addition, FDC may pay financial intermediaries for selling shares of the fund and providing shareholder support services. For the period, the Distribution and Service Fee rates and the total amounts paid to and retained by FDC were as follows:
| Distribution
Fee | Service
Fee | Paid to
FDC | Retained
by FDC |
Class A | 0% | .15% | $ 2,665 | $ - |
Class T | 0% | .25% | 6,191 | - |
Class B | .65% | .25% | 6,237 | 4,590 |
Class C | .75% | .25% | 20,491 | 18,306 |
| | | $ 35,584 | $ 22,896 |
Sales Load. FDC receives a front-end sales charge of up to 3.75% for selling Class A shares, and 2.75% for selling Class T shares of the fund. FDC receives the proceeds of contingent deferred sales charges levied on Class A, Class T, Class B, and Class C redemptions. These charges depend on the holding period. The deferred sales charges range from 3% to 1% for Class B, 1% for Class C, and .25% for certain purchases of Class A and Class T shares.
For the period, sales charge amounts retained by FDC were as follows:
| Retained
by FDC |
Class A | $ 10,303 |
Class T | 2,690 |
Class B* | - |
Class C* | 1,331 |
| $ 14,324 |
* When Class B and Class C shares are initially sold, FDC pays commissions from its own resources to financial intermediaries through which the sales
are made.
Annual Report
Notes to Financial Statements - continued
4. Fees and Other Transactions with Affiliates - continued
Transfer Agent and Accounting Fees. Citibank, N.A. (Citibank) is the custodian, transfer agent, and shareholder servicing agent for the fund's Class A, Class T, Class B, Class C, Spartan Short Intermediate Municipal Income and Institutional Class shares. Citibank has entered into a sub-arrangement with Fidelity Investments Institutional Operations Company, Inc. (FIIOC), an affiliate of FMR, with respect to all classes of the fund, except for Spartan Short Intermediate Municipal Income, to perform the transfer, dividend disbursing, and shareholder servicing agent functions. Citibank has also entered into a sub-agreement with Fidelity Service Company (FSC), an affiliate of FMR, with respect to Spartan Short Intermediate Municipal Income, to perform the transfer, dividend disbursing, and shareholder servicing agent functions. FIIOC and FSC receive account fees and asset-based fees that vary according to the account size and type of account of the shareholders of the respective classes of the fund. All fees are paid to FIIOC by Citibank, which is reimbursed by each class for such payments. FIIOC and FSC pay for typesetting, printing and mailing of all shareholder reports, except proxy statements. For the period, each class paid the following transfer agent fees:
| Amount | % of
Average
Net Assets |
Class A | $ 1,566 | .09* |
Class T | 2,565 | .10* |
Class B | 575 | .08* |
Class C | 1,852 | .09* |
Spartan Short Intermediate Municipal Income | 1,285,080 | .07 |
Institutional Class | 83 | .06* |
| $ 1,291,721 | |
* Annualized
Citibank also has a sub-contract with Fidelity Service Company, Inc. (FSC), an affiliate of FMR, under which FSC maintains the fund's accounting records. The fee is based on the level of average net assets for the month plus out-of-pocket expenses.
Central Funds. The fund may invest in affiliated Central Funds managed by Fidelity Investments Money Management, Inc. (FIMM), an affiliate of FMR. The Central Funds are open-end investment companies available only to investment companies and other accounts managed by FMR and its affiliates. The Central Funds seek preservation of capital and current income and do not pay a management fee. Income distributions earned by the fund are recorded as income in the accompanying financial statements and totaled $267,679 for the period.
Annual Report
5. Expense Reductions.
FMR voluntarily agreed to reimburse a portion of Spartan Short Intermediate Municipal Income's operating expenses. During the period, this reimbursement reduced the class' expenses by $69,192.
In addition, through arrangements with the fund's custodian and each class' transfer agent, credits realized as a result of uninvested cash balances were used to reduce the fund's expenses. During the period, these credits reduced the fund's custody and accounting expenses by $20,921 and $170,069, respectively. During the period, credits reduced each class' transfer agent expense as noted in the table below.
| Transfer Agent
expense reduction | | |
Class A | $ 48 | |
Class T | 67 | |
Class B | 19 | |
Class C | 53 | |
Spartan Short-Intermediate Municipal Income | 47,919 | |
Institutional Class | 5 | |
| $ 48,111 | |
6. Distributions to Shareholders.
Distributions to shareholders of each class were as follows:
| Years ended December 31, |
| 2003 | 2002 |
From net investment income | | |
Class A | $ 41,170 | $ - |
Class T | 55,194 | - |
Class B | 11,175 | - |
Class C | 30,513 | - |
Spartan Short-Intermediate Municipal Income | 48,127,109 | 44,681,023 |
Institutional Class | 3,289 | - |
Total | $ 48,268,450 | $ 44,681,023 |
From net realized gain | | |
Class A | $ 38,125 | $ - |
Class T | 64,235 | - |
Class B | 14,227 | - |
Class C | 43,979 | - |
Spartan Short-Intermediate Municipal Income | 12,233,045 | 9,372,264 |
Institutional Class | 2,554 | - |
Total | $ 12,396,165 | $ 9,372,264 |
Annual Report
Notes to Financial Statements - continued
7. Share Transactions.
Transactions for each class of shares were as follows:
| Years ended December 31, |
| 2003 | 2002 | 2003 | 2002 |
| Shares | Dollars |
Class A | | | | |
Shares sold | 945,702 | - | $ 9,928,421 | $ - |
Reinvestment of distributions | 5,258 | - | 55,287 | - |
Shares redeemed | (83,727) | - | (881,839) | - |
Net increase (decrease) | 867,233 | - | $ 9,101,869 | $ - |
Class T | | | | |
Shares sold | 1,169,015 | - | $ 12,268,522 | $ - |
Reinvestment of distributions | 7,662 | - | 80,416 | - |
Shares redeemed | (21,964) | - | (231,439) | - |
Net increase (decrease) | 1,154,713 | - | $ 12,117,499 | $ - |
Class B | | | | |
Shares sold | 233,819 | - | $ 2,453,550 | $ - |
Reinvestment of distributions | 1,571 | - | 16,518 | - |
Shares redeemed | (1,490) | - | (15,701) | - |
Net increase (decrease) | 233,900 | - | $ 2,454,367 | $ - |
Class C | | | | |
Shares sold | 776,760 | - | $ 8,149,505 | $ - |
Reinvestment of distributions | 3,424 | - | 35,965 | - |
Shares redeemed | (56,795) | - | (598,264) | - |
Net increase (decrease) | 723,389 | - | $ 7,587,206 | $ - |
Spartan Short-Intermediate Municipal Income | | |
Shares sold | 89,460,531 | 111,439,341 | $ 942,789,927 | $ 1,162,261,393 |
Reinvestment of distributions | 4,591,399 | 4,243,826 | 48,317,099 | 44,278,450 |
Shares redeemed | (78,186,633) | (71,046,928) | (823,154,240) | (738,583,535) |
Net increase (decrease) | 15,865,297 | 44,636,239 | $ 167,952,786 | $ 467,956,308 |
Institutional Class | | | | |
Shares sold | 41,387 | - | $ 434,150 | $ - |
Reinvestment of distributions | 399 | - | 4,193 | - |
Shares redeemed | (2,275) | - | (24,000) | - |
Net increase (decrease) | 39,511 | - | $ 414,343 | $ - |
Annual Report
Report of Independent Auditors
To the Trustees of Fidelity Municipal Trust and the Shareholders of Spartan Short-Intermediate Municipal Income Fund:
In our opinion, the accompanying statement of assets and liabilities, including the schedule of investments, and the related statements of operations and of changes in net assets and the financial highlights present fairly, in all material respects, the financial position of Spartan Short-Intermediate Municipal Income Fund (a fund of Fidelity Municipal Trust) at December 31, 2003 and the results of its operations, the changes in its net assets and the financial highlights for the periods indicated, in conformity with accounting principles generally accepted in the United States of America. These financial statements and financial highlights (hereafter referred to as "financial statements") are the responsibility of the Spartan Short-Intermediate Municipal Income Fund's management; our responsibility is to express an opinion on these financial statements based on our audits. We conducted our audits of these financial statements in accordance with auditing standards generally accepted in the United States of America which require that we plan and perform the audit to obtain reasonable assurance about whether the financial statements are free of material misstatement. An audit includes examining, on a test basis, evidence supporting the amounts and disclosures in the financial statements, assessing the accounting principles used and significant estimates made by management, and evaluating the overall financial statement presentation. We believe that our audits, which included confirmation of securities at December 31, 2003 by correspondence with the custodian and brokers, provide a reasonable basis for our opinion.
/s/PricewaterhouseCoopers LLP
PricewaterhouseCoopers LLP
Boston, Massachusetts
February 20, 2004
Annual Report
Trustees and Officers
The Trustees , Members of the Advisory Board, and executive officers of the trust and fund, as applicable, are listed below. The Board of Trustees governs the fund and is responsible for protecting the interests of shareholders. The Trustees are experienced executives who meet periodically throughout the year to oversee the fund's activities, review contractual arrangements with companies that provide services to the fund, and review the fund's performance. Except for William O. McCoy, each of the Trustees oversees 292 funds advised by FMR or an affiliate. Mr. McCoy oversees 294 funds advised by FMR or an affiliate.
The Trustees hold office without limit in time except that (a) any Trustee may resign; (b) any Trustee may be removed by written instrument, signed by at least two-thirds of the number of Trustees prior to such removal; (c) any Trustee who requests to be retired or who has become incapacitated by illness or injury may be retired by written instrument signed by a majority of the other Trustees; and (d) any Trustee may be removed at any special meeting of shareholders by a two-thirds vote of the outstanding voting securities of the trust. In any event, each non-interested Trustee shall retire not later than the last day of the calendar year in which his or her 72nd birthday occurs. The executive officers and Advisory Board Members hold office without limit in time, except that any officer and Advisory Board Member may resign or may be removed by a vote of a majority of the Trustees at any regular meeting or any special meeting of the Trustees. Except as indicated, each individual has held the office shown or other offices in the same company for the past five years.
The fund's Statement of Additional Information (SAI) includes more information about the Trustees. To request a free copy, call Fidelity at 1-800-544-8544.
Interested Trustees*:
Correspondence intended for each Trustee who is an "interested person" (as defined in the 1940 Act) may be sent to Fidelity Investments, 82 Devonshire Street, Boston, Massachusetts 02109.
Name, Age; Principal Occupation |
Edward C. Johnson 3d (73)** |
| Year of Election or Appointment: 1984 Mr. Johnson is Chairman of the Board of Trustees. Mr. Johnson serves as Chief Executive Officer, Chairman, and a Director of FMR Corp.; a Director and Chairman of the Board and of the Executive Committee of FMR; Chairman and a Director of Fidelity Management & Research (Far East) Inc.; Chairman (1998) and a Director of Fidelity Investments Money Management, Inc.; and Chairman (2001) and a Director (2000) of FMR Co., Inc. |
Abigail P. Johnson (42)** |
| Year of Election or Appointment: 2001 Senior Vice President of Spartan Short-Intermediate Municipal Income (2001). Ms. Johnson also serves as Senior Vice President of other Fidelity funds (2001). She is President and a Director of FMR (2001), Fidelity Investments Money Management, Inc. (2001), FMR Co., Inc. (2001), and a Director of FMR Corp. Previously, Ms. Johnson managed a number of Fidelity funds. |
Laura B. Cronin (49) |
| Year of Election or Appointment: 2003 Ms. Cronin is an Executive Vice President (2002) and Chief Financial Officer (2002) of FMR Corp. and is a member of the Fidelity Management Committee (2003). Previously, Ms. Cronin served as Vice President of Finance of FMR (1997-1999), and Chief Financial Officer of FMR (1999-2001), Fidelity Personal Investments (2001), and Fidelity Brokerage Company (2001-2002). |
Robert L. Reynolds (51) |
| Year of Election or Appointment: 2003 Mr. Reynolds is a Director (2003) and Chief Operating Officer (2002) of FMR Corp. and is the head of the Fidelity Management Committee (2003). He also serves on the Board at Fidelity Investments Canada, Ltd. (2000). Previously, Mr. Reynolds served as President of Fidelity Investments Institutional Retirement Group (1996-2000). |
* Trustees have been determined to be "Interested Trustees" by virtue of, among other things, their affiliation with the trust or various entities under common control with FMR.
** Edward C. Johnson 3d, Trustee, is Abigail P. Johnson's father.
Annual Report
Non-Interested Trustees:
Correspondence intended for each non-interested Trustee (that is, the Trustees other than the Interested Trustees) may be sent to Fidelity Investments, P.O. Box 55235, Boston, Massachusetts 02205-5235.
Name, Age; Principal Occupation |
J. Michael Cook (61) |
| Year of Election or Appointment: 2001 Prior to Mr. Cook's retirement in May 1999, he served as Chairman and Chief Executive Officer of Deloitte & Touche LLP (accounting/consulting), Chairman of the Deloitte & Touche Foundation, and a member of the Board of Deloitte Touche Tohmatsu. He currently serves as a Director of Comcast (telecommunications, 2002), International Flavors & Fragrances, Inc. (2000), Rockwell Automation (2000), and The Dow Chemical Company (2000). He is a Member of the Diversity Advisory Council of Marakon (2003) and the Advisory Board of the Directorship Search Group, Chairman Emeritus of the Board of Catalyst (a leading organization for the advancement of women in business), and is Chairman of the Accountability Advisory Council to the Comptroller General of the United States. He also serves as a Member of the Advisory Board of the Graduate School of Business of the University of Florida, his alma mater. |
Ralph F. Cox (71) |
| Year of Election or Appointment: 1991 Mr. Cox is President of RABAR Enterprises (management consulting for the petroleum industry). Prior to February 1994, he was President of Greenhill Petroleum Corporation (petroleum exploration and production). Until March 1990, Mr. Cox was President and Chief Operating Officer of Union Pacific Resources Company (exploration and production). He is a Director of CH2M Hill Companies (engineering), and Abraxas Petroleum (petroleum exploration and production, 1999). In addition, he is a member of advisory boards of Texas A&M University and the University of Texas at Austin. |
Robert M. Gates (60) |
| Year of Election or Appointment: 1997 Dr. Gates is President of Texas A&M University (2002). He was Director of the Central Intelligence Agency (CIA) from 1991 to 1993. From 1989 to 1991, Dr. Gates served as Assistant to the President of the United States and Deputy National Security Advisor. Dr. Gates is a Director of NACCO Industries, Inc. (mining and manufacturing), and Parker Drilling Co., Inc. (drilling and rental tools for the energy industry, 2001). He also serves as a member of the Advisory Board of VoteHere.net (secure internet voting, 2001). Previously, Dr. Gates served as a Director of LucasVarity PLC (automotive components and diesel engines), a Director of TRW Inc. (automotive, space, defense, and information technology), and Dean of the George Bush School of Government and Public Service at Texas A&M University (1999-2001). Dr. Gates also is a Trustee of the Forum for International Policy. |
George H. Heilmeier (67) |
| Year of Election or Appointment: 2004 Dr. Heilmeier is Chairman Emeritus of Telcordia Technologies (communication software and systems), where prior to his retirement, he served as company Chairman and Chief Executive Officer. He currently serves on the Boards of Directors of The Mitre Corporation (systems engineering and information technology support for the government), INET Technologies Inc. (telecommunications network surveillance, 2001) and Teletech Holdings (customer management services, 1998). He is Chairman of the General Motors Technology Advisory Committee and a Life Fellow of the IEEE (2000). Dr. Heilmeier is a member of the Defense Science Board and the National Security Agency Advisory Board. He is also a member of the National Academy of Engineering, the American Academy of Arts and Sciences and The Board of Overseers of the School of Engineering and Applied Science of the University of Pennsylvania. Previously, Dr. Heilmeier served as a Director of TRW Inc. (automotive, space, defense, and information technology, 1992-2002) and Compaq (1994-2002). |
Donald J. Kirk (71) |
| Year of Election or Appointment: 1987 Mr. Kirk is a Governor of the American Stock Exchange (2001), a Trustee and former Chairman of the Board of Trustees of the Greenwich Hospital Association, a Director of the Yale-New Haven Health Services Corp. (1998), and a Director Emeritus and former Chairman of the Board of Directors of National Arts Strategies Inc. Mr. Kirk was an Executive-in-Residence (1995-2000) and a Professor (1987-1995) at Columbia University Graduate School of Business. Prior to 1987, he was Chairman of the Financial Accounting Standards Board. Previously, Mr. Kirk served as a Governor of the National Association of Securities Dealers, Inc. (1996-2002), a member and Vice Chairman of the Public Oversight Board of the American Institute of Certified Public Accountants' SEC Practice Section (1995-2002), a Director of General Re Corporation (reinsurance, 1987-1998) and as a Director of Valuation Research Corp. (appraisals and valuations). |
Marie L. Knowles (57) |
| Year of Election or Appointment: 2001 Prior to Ms. Knowles' retirement in June 2000, she served as Executive Vice President and Chief Financial Officer of Atlantic Richfield Company (ARCO) (diversified energy, 1996-2000). From 1993 to 1996, she was a Senior Vice President of ARCO and President of ARCO Transportation Company. She served as a Director of ARCO from 1996 to 1998. She currently serves as a Director of Phelps Dodge Corporation (copper mining and manufacturing), URS Corporation (multidisciplinary engineering, 1999), and McKesson Corporation (healthcare service, 2002). Ms. Knowles is a Trustee of the Brookings Institution and the Catalina Island Conservancy and also serves as a member of the Advisory Board for the School of Engineering of the University of Southern California. |
Ned C. Lautenbach (59) |
| Year of Election or Appointment: 2000 Mr. Lautenbach has been a partner of Clayton, Dubilier & Rice, Inc. (private equity investment firm) since September 1998. Previously, Mr. Lautenbach was with the International Business Machines Corporation (IBM) from 1968 until his retirement in 1998. He was most recently Senior Vice President and Group Executive of Worldwide Sales and Services. From 1993 to 1995, he was Chairman of IBM World Trade Corporation, and from 1994 to 1998 was a member of IBM's Corporate Executive Committee. Mr. Lautenbach serves as Chairman and as a Director (1998) of Acterna Corporation (communications test equipment). He is also Co-Chairman of Covansys, Inc. (global provider of business and technology solutions, 2000). In addition, he is a Director of Eaton Corporation (diversified industrial) and the Philharmonic Center for the Arts in Naples, Florida (1999). He also is a member of the Council on Foreign Relations. |
Marvin L. Mann (70) |
| Year of Election or Appointment: 1993 Mr. Mann is Chairman of the non-interested Trustees (2001). He is Chairman Emeritus of Lexmark International, Inc. (computer peripherals) where he served as CEO until April 1998 and retired as Chairman May 1999, and remains a member of the Board. Prior to 1991, he held the positions of Vice President of International Business Machines Corporation (IBM) and President and General Manager of various IBM divisions and subsidiaries. Mr. Mann is a Board member of Imation Corp. (imaging and information storage) and Acterna Corporation (communications test equipment, 1999). He is also a member of the Director Services Committee of the Investment Company Institute. In addition, Mr. Mann is a member of the President's Cabinet at the University of Alabama and the Board of Visitors of the Culverhouse College of Commerce and Business Administration at the University of Alabama. |
William O. McCoy (70) |
| Year of Election or Appointment: 1997 Prior to his retirement in December 1994, Mr. McCoy was Vice Chairman of the Board of BellSouth Corporation (telecommunications) and President of BellSouth Enterprises. He is currently a Director of Liberty Corporation (holding company), Duke Realty Corporation (real estate), Progress Energy, Inc. (electric utility), and Acterna Corporation (communications test equipment, 1999). He is also a partner of Franklin Street Partners (private investment management firm) and a member of the Research Triangle Foundation Board. In addition, Mr. McCoy served as the Interim Chancellor (1999-2000) and a member of the Board of Visitors (1994-1998) for the University of North Carolina at Chapel Hill and currently serves on the Board of Directors of the University of North Carolina Health Care System and the Board of Visitors of the Kenan-Flagler Business School (University of North Carolina at Chapel Hill). He also served as Vice President of Finance for the University of North Carolina (16-school system, 1995-1998). |
William S. Stavropoulos (64) |
| Year of Election or Appointment: 2002 Mr. Stavropoulos is Chairman of the Board, President and CEO (2002), and Chairman of the Executive Committee (2000) and a Director of The Dow Chemical Company. Since joining The Dow Chemical Company in 1967, Mr. Stavropoulos served in numerous senior management positions, including President (1993-2000) and Chief Executive Officer (1995-2000). Currently, he is a Director of NCR Corporation (data warehousing and technology solutions), BellSouth Corporation (telecommunications), Chemical Financial Corporation, and Maersk Inc. (industrial conglomerate, 2002). He also serves as a member of the Board of Trustees of the American Enterprise Institute for Public Policy Research. In addition, Mr. Stavropoulos is a member of The Business Council, J.P. Morgan International Council, World Business Council for Sustainable Development, and the University of Notre Dame Advisory Council for the College of Science. |
Annual Report
Trustees and Officers - continued
Advisory Board Members and Executive Officers:
Correspondence intended for Ms. Small may be sent to Fidelity Investments, P.O. Box 55235, Boston, Massachusetts 02205-5235. Correspondence intended for each executive officer and Mr. Lynch may be sent to Fidelity Investments, 82 Devonshire Street, Boston, Massachusetts 02109.
Name, Age; Principal Occupation |
Peter S. Lynch (60) |
| Year of Election or Appointment: 2003 Member of the Advisory Board of Fidelity Municipal Trust. Vice Chairman and a Director of FMR, and Vice Chairman (2001) and a Director (2000) of FMR Co., Inc. Previously, Mr. Lynch served as a Trustee of the Fidelity funds (1990-2003). Prior to May 31, 1990, he was a Director of FMR and Executive Vice President of FMR (a position he held until March 31, 1991), Vice President of Fidelity® Magellan® Fund and FMR Growth Group Leader, and Managing Director of FMR Corp. Mr. Lynch was also Vice President of Fidelity Investments Corporate Services. In addition, he serves as a Trustee of Boston College, Massachusetts Eye & Ear Infirmary, Historic Deerfield, John F. Kennedy Library, and the Museum of Fine Arts of Boston. |
Cornelia M. Small (59) |
| Year of Election or Appointment: 2004 Member of the Advisory Board of Fidelity Municipal Trust. Ms. Small is a member (2000) and Chairperson (2002) of the Investment Committee, and a member (2002) of the Board of Trustees of Smith College. Previously, she served as Chief Investment Officer (1999-2000), Director of Global Equity Investments (1996-1999), and a member of the Board of Directors (1998-1999) of Scudder Kemper Investments. In addition, Ms. Small served as Co-Chair (2000-2003) of the Annual Fund for the Fletcher School of Law and Diplomacy. |
Dwight D. Churchill (50) |
| Year of Election or Appointment: 1997 Vice President of Spartan Short-Intermediate Municipal Income. He serves as Head of Fidelity's Fixed-Income Division (2000), Vice President of Fidelity's Money Market Funds (2000), Vice President of Fidelity's Bond Funds (1997), and Senior Vice President of FIMM (2000) and FMR (1997). Mr. Churchill joined Fidelity in 1993 as Vice President and Group Leader of Taxable Fixed-Income Investments. |
Charles S. Morrison (43) |
| Year of Election or Appointment: 2002 Vice President of Spartan Short-Intermediate Municipal Income. Mr. Morrison also serves as Vice President of Fidelity's Bond Funds (2002), and Vice President of certain Asset Allocation and Balanced Funds (2002). He serves as Vice President (2002) and Bond Group Leader (2002) of Fidelity Investments Fixed Income Division. Mr. Morrison is also Vice President of FIMM (2002) and FMR (2002). Mr. Morrison joined Fidelity in 1987 as a Corporate Bond Analyst in the Fixed Income Research Division. |
Eric D. Roiter (55) |
| Year of Election or Appointment: 1998 Secretary of Spartan Short-Intermediate Municipal Income. He also serves as Secretary of other Fidelity funds (1998); Vice President, General Counsel, and Clerk of FMR Co., Inc. (2001) and FMR (1998); Vice President and Clerk of FDC (1998); Assistant Clerk of Fidelity Management & Research (U.K.) Inc. (2001) and Fidelity Management & Research (Far East) Inc. (2001); and Assistant Secretary of Fidelity Investments Money Management Inc. (2001). Prior to joining Fidelity, Mr. Roiter was with the law firm of Debevoise & Plimpton, as an associate (1981-1984) and as a partner (1985-1997), and served as an Assistant General Counsel of the U.S. Securities and Exchange Commission (1979-1981). Mr. Roiter is an Adjunct Member, Faculty of Law, at Boston College Law School (2003). |
Stuart Fross (44) |
| Year of Election or Appointment: 2003 Assistant Secretary of Spartan Short-Intermediate Municipal Income. Mr. Fross also serves as Assistant Secretary of other Fidelity funds (2003) and is an employee of FMR. |
Maria F. Dwyer (45) |
| Year of Election or Appointment: 2002 President and Treasurer of Spartan Short-Intermediate Municipal Income. Ms. Dwyer also serves as President and Treasurer of other Fidelity funds (2002) and is a Vice President (1999) and an employee (1996) of FMR. |
Timothy F. Hayes (53) |
| Year of Election or Appointment: 2002 Chief Financial Officer of Spartan Short-Intermediate Municipal Income. Mr. Hayes also serves as Chief Financial Officer of other Fidelity funds (2002). Recently he was appointed President of Fidelity Service Company (2003) where he also serves as a Director. Mr. Hayes also serves as President of Fidelity Investments Operations Group (FIOG, 2002), which includes Fidelity Pricing and Cash Management Services Group (FPCMS), where he was appointed President in 1998. Previously, Mr. Hayes served as Chief Financial Officer of Fidelity Investments Corporate Systems and Service Group (1998) and Fidelity Systems Company (1997-1998). |
Jennifer S. Taub (37) |
| Year of Election or Appointment: 2003 Assistant Vice President of Spartan Short-Intermediate Municipal Income. Ms. Taub is Assistant Vice President of Fidelity's Fixed-Income Funds (2003), Assistant Secretary of FIMM (2003), and is an employee of FMR. |
John R. Hebble (45) |
| Year of Election or Appointment: 2003 Deputy Treasurer of Spartan Short-Intermediate Municipal Income. Mr. Hebble also serves as Deputy Treasurer of other Fidelity funds (2003), and is an employee of FMR. Before joining Fidelity Investments, Mr. Hebble worked at Deutsche Asset Management where he served as Director of Fund Accounting (2002-2003) and Assistant Treasurer of the Scudder Funds (1998-2003). |
John H. Costello (57) |
| Year of Election or Appointment: 1986 Assistant Treasurer of Spartan Short-Intermediate Municipal Income. Mr. Costello also serves as Assistant Treasurer of other Fidelity funds and is an employee of FMR. |
Francis V. Knox, Jr. (56) |
| Year of Election or Appointment: 2002 Assistant Treasurer of Spartan Short-Intermediate Municipal Income. Mr. Knox also serves as Assistant Treasurer of other Fidelity funds (2002), and is a Vice President and an employee of FMR. Previously, Mr. Knox served as Vice President of Investment & Advisor Compliance (1990-2001), and Compliance Officer of Fidelity Management & Research (U.K.) Inc. (1992-2002), Fidelity Management & Research (Far East) Inc. (1991-2002), and FMR Corp. (1995-2002). |
Mark Osterheld (48) |
| Year of Election or Appointment: 2002 Assistant Treasurer of Spartan Short-Intermediate Municipal Income. Mr. Osterheld also serves as Assistant Treasurer of other Fidelity funds (2002) and is an employee of FMR. |
Thomas J. Simpson (45) |
| Year of Election or Appointment: 1996 Assistant Treasurer of Spartan Short-Intermediate Municipal Income. Mr. Simpson is Assistant Treasurer of other Fidelity funds (2000) and an employee of FMR (1996). Prior to joining FMR, Mr. Simpson was Vice President and Fund Controller of Liberty Investment Services (1987-1995). |
Annual Report
Distributions
During fiscal year ended 2003, 100% of the fund's income dividends was free from federal income tax, and 15.52% of the fund's income dividends was subject to the federal alternative minimum tax.
The fund will notify shareholders in January 2004 of amounts for use in preparing 2003 income tax returns.
Annual Report
Managing Your Investments
Fidelity offers several ways to conveniently manage your personal investments via your telephone or PC. You can access your account information, conduct trades and research your investments 24 hours a day.
By Phone
Fidelity Automated Service Telephone provides a single toll-free number to access account balances, positions, quotes and trading. It's easy to navigate the service, and on your first call, the system will help you create a personal identification number (PIN) for security.
(phone_graphic)Fidelity Automated
Service Telephone (FAST®)
1-800-544-5555
Press
1 For mutual fund and brokerage trading.
2 For quotes.*
3 For account balances and holdings.
4 To review orders and mutual
fund activity.
5 To change your PIN.
*0 To speak to a Fidelity representative.
By PC
Fidelity's web site on the Internet provides a wide range of information, including daily financial news, fund performance, interactive planning tools and news about Fidelity products and services.
(computer_graphic)Fidelity's Web Site
www.fidelity.com
* When you call the quotes line, please remember that a fund's yield and return will vary and, except for money market funds, share price will also vary. This means that you may have a gain or loss when you sell your shares. There is no assurance that money market funds will be able to maintain a stable $1 share price; an investment in a money market fund is not insured or guaranteed by the U.S. government. Total returns are historical and include changes in share price, reinvestment of dividends and capital gains, and the effects of any sales charges.
Annual Report
To Visit Fidelity
For directions and hours,
please call 1-800-544-9797.
Arizona
7001 West Ray Road
Chandler, AZ
7373 N. Scottsdale Road
Scottsdale, AZ
California
815 East Birch Street
Brea, CA
1411 Chapin Avenue
Burlingame, CA
851 East Hamilton Avenue
Campbell, CA
527 North Brand Boulevard
Glendale, CA
19200 Von Karman Avenue
Irvine, CA
601 Larkspur Landing Circle
Larkspur, CA
10100 Santa Monica Blvd.
Los Angeles, CA
27101 Puerta Real
Mission Viejo, CA
73-575 El Paseo
Palm Desert, CA
251 University Avenue
Palo Alto, CA
1760 Challenge Way
Sacramento, CA
7676 Hazard Center Drive
San Diego, CA
8 Montgomery Street
San Francisco, CA
21701 Hawthorne Boulevard
Torrance, CA
2001 North Main Street
Walnut Creek, CA
6300 Canoga Avenue
Woodland Hills, CA
Colorado
1625 Broadway
Denver, CO
9185 East Westview Road
Littleton, CO
Connecticut
48 West Putnam Avenue
Greenwich, CT
265 Church Street
New Haven, CT
300 Atlantic Street
Stamford, CT
29 South Main Street
West Hartford, CT
Delaware
222 Delaware Avenue
Wilmington, DE
Florida
4400 N. Federal Highway
Boca Raton, FL
121 Alhambra Plaza
Coral Gables, FL
2948 N. Federal Highway
Ft. Lauderdale, FL
1907 West State Road 434
Longwood, FL
8880 Tamiami Trail, North
Naples, FL
3501 PGA Boulevard
West Palm Beach, FL
8065 Beneva Road
Sarasota, FL
1502 N. Westshore Blvd.
Tampa, FL
Georgia
3445 Peachtree Road, N.E.
Atlanta, GA
Annual Report
1000 Abernathy Road
Atlanta, GA
Illinois
One North LaSalle Street
Chicago, IL
1415 West 22nd Street
Oak Brook, IL
1700 East Golf Road
Schaumburg, IL
3232 Lake Avenue
Wilmette, IL
Indiana
4729 East 82nd Street
Indianapolis, IN
Kansas
5400 College Boulevard
Overland Park, KS
Maine
Three Canal Plaza
Portland, ME
Maryland
7401 Wisconsin Avenue
Bethesda, MD
One W. Pennsylvania Ave.
Towson, MD
Massachusetts
801 Boylston Street
Boston, MA
155 Congress Street
Boston, MA
300 Granite Street
Braintree, MA
44 Mall Road
Burlington, MA
405 Cochituate Road
Framingham, MA
416 Belmont Street
Worcester, MA
Fidelity Brokerage Services, Inc., 100 Summer St., Boston, MA 02110 Member NYSE/SIPC
Annual Report
Michigan
280 Old N. Woodward Ave.
Birmingham, MI
43420 Grand River Avenue
Novi, MI
29155 Northwestern Hwy.
Southfield, MI
Minnesota
7600 France Avenue South
Edina, MN
Missouri
8885 Ladue Road
Ladue, MO
New Jersey
150 Essex Street
Millburn, NJ
56 South Street
Morristown, NJ
501 Route 17, South
Paramus, NJ
3518 Route 1 North
Princeton, NJ
New York
1055 Franklin Avenue
Garden City, NY
37 West Jericho Turnpike
Huntington Station, NY
1271 Avenue of the Americas
New York, NY
61 Broadway
New York, NY
350 Park Avenue
New York, NY
North Carolina
4611 Sharon Road
Charlotte, NC
Ohio
3805 Edwards Road
Cincinnati, OH
28699 Chagrin Boulevard
Woodmere Village, OH
1324 Polaris Parkway
Columbus, OH
Oregon
16850 SW 72nd Avenue
Tigard, OR
Pennsylvania
600 West DeKalb Pike
King of Prussia, PA
1735 Market Street
Philadelphia, PA
12001 Perry Highway
Wexford, PA
Rhode Island
47 Providence Place
Providence, RI
Tennessee
6150 Poplar Avenue
Memphis, TN
Texas
10000 Research Boulevard
Austin, TX
4017 Northwest Parkway
Dallas, TX
12532 Memorial Drive
Houston, TX
2701 Drexel Drive
Houston, TX
400 East Las Colinas Blvd.
Irving, TX
14100 San Pedro
San Antonio, TX
19740 IH 45 North
Spring, TX
6005 West Park Boulevard
Plano, TX
Annual Report
Utah
215 South State Street
Salt Lake City, UT
Virginia
1861 International Drive
McLean, VA
Washington
411 108th Avenue, N.E.
Bellevue, WA
1518 6th Avenue
Seattle, WA
Washington, DC
1900 K Street, N.W.
Washington, DC
Wisconsin
595 North Barker Road
Brookfield, WI
Fidelity Brokerage Services, Inc., 100 Summer St., Boston, MA 02110 Member NYSE/SIPC
Annual Report
Investment Adviser
Fidelity Management & Research Company
Boston, MA
Investment Sub-Adviser
Fidelity Investments Money
Management, Inc.
Fidelity International Investment Advisors
Fidelity International Investment Advisors
(U.K.) Limited
General Distributor
Fidelity Distributors Corporation
Boston, MA
Transfer and Shareholder
Servicing Agents
Citibank, N.A.
New York, NY
Fidelity Service Company, Inc.
Boston, MA
Custodian
Citibank, N.A.
New York, NY
Fidelity's Municipal Bond Funds
Spartan(automated graphic) Arizona Municipal Income
Spartan California Municipal Income
Spartan Connecticut Municipal Income
Spartan Florida Municipal Income
Spartan Intermediate Municipal Income
Spartan Maryland Municipal Income
Spartan Massachusetts Municipal Income
Spartan Michigan Municipal Income
Spartan Minnesota Municipal Income
Spartan Municipal Income
Spartan New Jersey Municipal Income
Spartan New York Municipal Income
Spartan Ohio Municipal Income
Spartan Pennsylvania Municipal Income
Spartan Short-Intermediate Municipal Income
Spartan Tax-Free Bond Fund
The Fidelity Telephone Connection
Mutual Fund 24-Hour Service
Exchanges/Redemptions
and Account Assistance 1-800-544-6666
Product Information 1-800-544-6666
Retirement Accounts 1-800-544-4774
(8 a.m. - 9 p.m.)
TDD Service 1-800-544-0118
for the deaf and hearing impaired
(9 a.m. - 9 p.m. Eastern time)
Fidelity Automated Service
Telephone (FAST®) (automated graphic) 1-800-544-5555
(automated graphic) Automated line for quickest service
(Fidelity Investment logo)(registered trademark)
Corporate Headquarters
82 Devonshire St., Boston, MA 02109
www.fidelity.com
STM-UANN-0204
1.787742.100
Spartan®
Minnesota Municipal Income
Fund
Annual Report
December 31, 2003
(2_fidelity_logos) (Registered_Trademark)
Contents
Chairman's Message | <Click Here> | Ned Johnson's message to shareholders. |
Performance | <Click Here> | How the fund has done over time. |
Management's Discussion | <Click Here> | The manager's review of fund performance, strategy and outlook. |
Investment Changes | <Click Here> | A summary of major shifts in the fund's investments over the past six months. |
Investments | <Click Here> | A complete list of the fund's investments with their market values. |
Financial Statements | <Click Here> | Statements of assets and liabilities, operations, and changes in net assets,
as well as financial highlights. |
Notes | <Click Here> | Notes to the financial statements. |
Auditors' Opinion | <Click Here> | |
Trustees and Officers | <Click Here> | |
Distributions | <Click Here> | |
| | |
For a free copy of the fund's proxy voting guidelines visit www.fidelity.com/goto/proxyguidelines, call 1-800-544-8544, or visit the Securities and Exchange Commission (SEC)'s web site at www.sec.gov.
Standard & Poor's, S&P and S&P 500 are registered service marks of The McGraw-Hill Companies, Inc. and have been licensed for use by Fidelity Distributors Corporation.
Other third party marks appearing herein are the property of their respective owners.
All other marks appearing herein are registered or unregistered trademarks or service marks of FMR Corp. or an affiliated company.
(Recycle graphic) This report is printed on recycled paper using soy-based inks.
Annual Report
This report and the financial statements contained herein are submitted for the general information of the shareholders of the fund. This report is not authorized for distribution to prospective investors in the fund unless preceded or accompanied by an effective prospectus.
Mutual fund shares are not deposits or obligations of, or guaranteed by, any depository institution. Shares are not insured by the FDIC, Federal Reserve Board or any other agency, and are subject to investment risks, including possible loss of principal amount invested.
Neither the fund nor Fidelity Distributors Corporation is a bank.
For more information on any Fidelity fund, including charges and expenses, call 1-800-544-6666 for a free prospectus. Read it carefully before you invest or send money.
Annual Report
Chairman's Message
(photo_of_Edward_C_Johnson_3d)
Dear Shareholder:
Many of you have read or heard news stories recently that were critical of mutual funds and made allegations that the mutual fund industry has been less than forthright. I find these reports unsettling and not necessarily an accurate picture of the overall industry, and I would like you to know where we at Fidelity stand.
With specific regard to allegations that certain mutual fund companies were violating the Securities and Exchange Commission's forward pricing rules or were involved in so-called "market timing" activities, I want to say two things:
First, Fidelity does not have agreements that permit customers who buy fund shares after 4 p.m. to obtain the 4 p.m. price. This is not to say that someone could not deceive the company through fraudulent acts. But I underscore that we have no so-called "agreements" which would permit this illegal practice.
Second, Fidelity has been on record for years opposing predatory short-term trading which adversely affects other shareholders in a mutual fund. In fact, in the 1980s, we began charging a fee - which is returned to the fund and, therefore, to investors - to discourage this activity. What's more, several years ago we took the industry lead in developing a Fair Value Pricing Policy to prevent market timing on foreign securities in our funds. It is reasonable to assume that another structure can be developed that would alter the system to make it much more difficult for predatory traders to operate. This, however, will only be achieved through close cooperation among regulators, legislators and the industry.
Certainly no industry is perfect, and there have been instances of unethical and illegal activity from time to time within the mutual fund industry. When this occurs, confessed or convicted offenders should be dealt with appropriately. Clearly, every system can be improved. We applaud well thought out improvements by regulators, legislators and industry representatives that achieve the common goal of building and protecting the value of investors' holdings. But we remain concerned about the risk of over-regulation and the quick application of simplistic solutions to intricate problems.
For more than 57 years, Fidelity Investments has worked very hard to improve its products and service to justify your trust. When our family founded this company in 1946, we had only a few hundred customers. Many of them were family and friends. Today, we serve more than 18 million customers including individual investors and participants in retirement plans across America.
Let me close by saying that we do not take your trust in us for granted, and we realize that we must always work to improve all aspects of our service to you. In turn, we urge you to continue your active participation with your financial matters, so that your interests can be well served.
Best regards,
/s/Edward C. Johnson 3d
Edward C. Johnson 3d
Annual Report
Performance: The Bottom Line
Average annual total return reflects the change in the value of an investment, assuming reinvestment of the fund's dividend income and capital gains (the profits earned upon the sale of securities that have grown in value) and assuming a constant rate of performance each year. The $10,000 table and the fund's returns do not reflect the deduction of taxes that a shareholder would pay on fund distributions or the redemption of fund shares. During periods of reimbursement by Fidelity, a fund's total return will be greater than it would be had the reimbursement not occurred. How a fund did yesterday is no guarantee of how it will do tomorrow.
Average Annual Total Returns
Periods ended December 31, 2003 | Past 1
year | Past 5
years | Past 10
years |
Spartan® MN Municipal Income Fund | 5.27% | 5.24% | 5.31% |
$10,000 Over 10 Years
Let's say hypothetically that $10,000 was invested in Spartan® Minnesota Municipal Income Fund on December 31, 1993. The chart shows how the value of your investment would have grown, and also shows how the Lehman Brothers® Municipal Bond Index did over the same period.
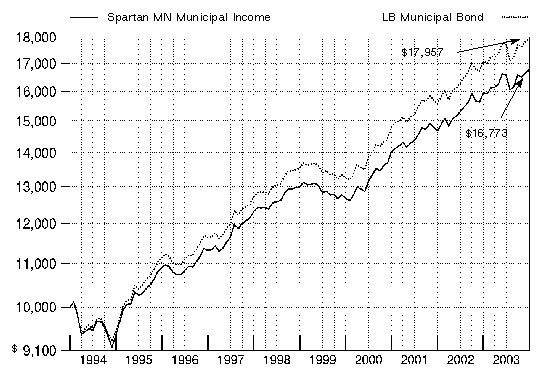
Annual Report
Management's Discussion of Fund Performance
Comments from Christine Thompson, Portfolio Manager of Spartan® Minnesota Municipal Income Fund
While most of the year favored riskier assets, tax-exempt municipal bonds put up solid numbers for the 12 months ending December 31, 2003. In that time, the Lehman Brothers® Municipal Bond Index - a performance measure of about 40,000 investment-grade, fixed-rate, tax-exempt bonds - advanced 5.31%. For munis, it was the fourth straight year of returns in excess of 5%. Munis had an excellent year relative to taxable investment-grade bonds. The Lehman Brothers Aggregate Bond Index, a proxy for the taxable, investment-grade bond market, gained 4.10% in 2003, a full percentage point less than the muni index - a gap made even wider considering muni bonds' tax-equivalent yield advantage. What's more, on a three- and five-year basis, the Lehman Brothers muni index's cumulative return is well above that of most stock market benchmarks. Munis fared well for much of the year against a backdrop of low interest rates and virtually non-existent inflation. Although they stumbled in mid-summer against a brighter economic forecast, munis rebounded later on the heels of strong investor demand and the Federal Reserve Board's accommodative monetary policy.
Spartan Minnesota Municipal Income Fund returned 5.27%, outpacing the 5.06% return for the fund's peer group, the LipperSM Minnesota Municipal Debt Funds Average. Additionally, the fund's benchmark - the Lehman Brothers Minnesota Enhanced Municipal Bond Index - returned 5.72%. The fund's outperformance of its peer group stemmed from good security and sector selection. Its overweighting in bonds backed by fees and revenues rather than by taxes also helped, as these securities outpaced bonds backed by economically sensitive taxes throughout much of the period. The fund's emphasis on education bonds also worked well because they were in strong demand during the period. Further, an overweighted position in hospital bonds was advantageous due to improving financial trends in the sector. The fund also benefited from underweighting state-issued bonds, which came under pressure due to a modest downgrade in the state's credit rating in response to its fiscal challenges. Detracting from performance was the fund's underweighting in par bonds, which sell at face value. These bonds were in strong demand by retail investors at times, helping them to outperform premium and discount bonds, which sell above and below face value, respectively.
The views expressed in this statement reflect those of the portfolio manager only through the end of the period of the report as stated on the cover and do not necessarily represent the views of Fidelity or any other person in the Fidelity organization. Any such views are subject to change at any time based upon market or other conditions and Fidelity disclaims any responsibility to update such views. These views may not be relied on as investment advice and, because investment decisions for a Fidelity fund are based on numerous factors, may not be relied on as an indication of trading intent on behalf of any Fidelity fund.
Annual Report
Investment Changes
Top Five Sectors as of December 31, 2003 |
| % of fund's
net assets | % of fund's net assets
6 months ago |
General Obligations | 46.3 | 47.7 |
Electric Utilities | 12.0 | 12.2 |
Health Care | 10.4 | 10.7 |
Education | 6.5 | 6.3 |
Water & Sewer | 5.9 | 6.2 |
Average Years to Maturity as of December 31, 2003 |
| | 6 months ago |
Years | 13.5 | 13.0 |
Average years to maturity is based on the average time remaining until principal payments are expected from each of the fund's bonds, weighted by dollar amount. |
Duration as of December 31, 2003 |
| | 6 months ago |
Years | 6.6 | 6.3 |
Duration shows how much a bond fund's price fluctuates with changes in comparable interest rates. If rates rise 1%, for example, a fund with a five-year duration is likely to lose about 5% of its value. Other factors also can influence a bond fund's performance and share price. Accordingly, a bond fund's actual performance may differ from this example. |
Quality Diversification (% of fund's net assets) |
As of December 31, 2003 | As of June 30, 2003 |
| AAA 55.2% | | | AAA 57.4% | |
| AA,A 36.9% | | | AA,A 37.7% | |
| BBB 3.9% | | | BBB 3.1% | |
| Not Rated 1.1% | | | Not Rated 1.4% | |
| Short-Term
Investments and
Net Other Assets 2.9% | | | Short-Term
Investments and
Net Other Assets 0.4% | |

We have used ratings from Moody's ® Investors Services, Inc. Where Moody's ratings are not available, we have used S&P ® ratings. |
Annual Report
Investments December 31, 2003
Showing Percentage of Net Assets
Municipal Bonds - 97.1% |
| Principal Amount | | Value
(Note 1) |
Minnesota - 93.3% |
Albany Independent School District #745 Series A, 6% 2/1/16 | | $ 1,000,000 | | $ 1,003,270 |
Anoka-Hennepin Independent School District #11
Series A, 5.75% 2/1/20 | | 3,950,000 | | 4,445,528 |
Brainerd Independent School District #181 Series A: | | | | |
5.375% 2/1/17 (FGIC Insured) | | 4,705,000 | | 5,251,251 |
5.375% 2/1/19 (FGIC Insured) | | 2,700,000 | | 2,971,890 |
Brooklyn Ctr. Independent School District #286 5.1% 2/1/31 (FGIC Insured) | | 6,000,000 | | 6,196,740 |
Centennial Independent School District #12: | | | | |
Series 1996 A, 5.625% 2/1/16 | | 1,000,000 | | 1,109,520 |
Series A, 5% 2/1/19 (FSA Insured) | | 580,000 | | 616,453 |
Cloquet Poll. Cont. Rev. (Potlach Corp. Proj.) 5.9% 10/1/26 | | 3,995,000 | | 3,662,017 |
Hastings Independent School District #200 Series A, 5% 2/1/22 | | 4,750,000 | | 4,890,078 |
Hopkins Independent School District #270: | | | | |
5% 2/1/11 | | 1,250,000 | | 1,408,300 |
5% 2/1/16 (FGIC Insured) | | 1,350,000 | | 1,463,859 |
5.125% 2/1/17 (FGIC Insured) | | 1,015,000 | | 1,105,680 |
Jackson County Central Independent School District #2895 5% 2/1/21 (FSA Insured) | | 1,220,000 | | 1,281,244 |
Lake Superior Independent School District #381 Series A: | | | | |
5% 4/1/15 (FSA Insured) | | 1,970,000 | | 2,169,482 |
5% 4/1/16 (FSA Insured) | | 2,065,000 | | 2,252,130 |
5% 4/1/17 (FSA Insured) | | 2,165,000 | | 2,343,634 |
5% 4/1/18 (FSA Insured) | | 1,260,000 | | 1,353,845 |
Mankato Independent School District #77 Series A, 5% 2/1/12 (FSA Insured) | | 1,855,000 | | 2,027,738 |
Maple Grove Gen. Oblig. Impt. Series A, 5.2% 2/1/17 | | 1,120,000 | | 1,184,960 |
Minneapolis & Saint Paul Hsg. & Redev. Auth. Health Care Sys. Rev.: | | | | |
(Health Partners Oblig. Group Proj.): | | | | |
5.875% 12/1/29 | | 800,000 | | 804,816 |
6% 12/1/19 | | 2,415,000 | | 2,520,729 |
(Healthspan Corp. Proj.) Series A, 4.75% 11/15/18 (AMBAC Insured) | | 4,500,000 | | 4,583,925 |
Minneapolis & Saint Paul Metro. Arpts. Commission Series 13, 5.25% 1/1/11 (a) | | 2,840,000 | | 3,121,501 |
Minneapolis & Saint Paul Metro. Arpts. Commission Arpt. Rev.: | | | | |
Series 1999 A, 5.125% 1/1/31 (FGIC Insured) | | 3,375,000 | | 3,457,350 |
Municipal Bonds - continued |
| Principal Amount | | Value
(Note 1) |
Minnesota - continued |
Minneapolis & Saint Paul Metro. Arpts. Commission Arpt. Rev.: - continued | | | | |
Series 2000 A, 5.75% 1/1/32 (FGIC Insured) | | $ 1,000,000 | | $ 1,095,620 |
Series 2001 C, 5.25% 1/1/32 (FGIC Insured) | | 1,000,000 | | 1,037,200 |
Series A, 5% 1/1/19 (AMBAC Insured) | | 4,000,000 | | 4,190,720 |
Series B: | | | | |
5.25% 1/1/11 (AMBAC Insured) (a) | | 3,475,000 | | 3,778,402 |
5.4% 1/1/09 (FGIC Insured) (a) | | 1,375,000 | | 1,525,714 |
5.625% 1/1/13 (FGIC Insured) (a) | | 1,000,000 | | 1,090,170 |
Minneapolis Art Ctr. Facilities Rev. (Walker Art Ctr. Proj.) 5.125% 7/1/21 | | 1,250,000 | | 1,308,950 |
Minneapolis Cmnty. Dev. Agcy. Tax Increment Rev.: | | | | |
0% 9/1/07 (MBIA Insured) | | 2,860,000 | | 2,614,698 |
0% 9/1/08 (MBIA Insured) | | 4,600,000 | | 4,049,012 |
Minneapolis Gen. Oblig.: | | | | |
(Sports Arena Proj.) 5.125% 10/1/20 | | 2,565,000 | | 2,707,768 |
Series B, 5.1% 9/1/08 | | 2,000,000 | | 2,111,320 |
Minneapolis Health Care Sys. Rev. (Allina Health Sys. Proj.) Series 2002 A, 6% 11/15/18 | | 2,655,000 | | 2,891,906 |
Minneapolis Rev. (Univ. of Minnesota Gateway Proj.) Series 1997 A, 5.25% 12/1/24 | | 1,900,000 | | 1,971,744 |
Minneapolis Spl. School District #1: | | | | |
Ctfs. of Prtn.: | | | | |
Series B, 5% 2/1/13 | | 2,575,000 | | 2,752,984 |
5.5% 2/1/21 (MBIA Insured) | | 1,305,000 | | 1,419,188 |
5.75% 2/1/20 (Pre-Refunded to 2/1/08 @ 100) (b) | | 3,210,000 | | 3,648,518 |
5.3% 2/1/14 | | 3,275,000 | | 3,591,627 |
Minnesota Agric. & Econ. Dev. Board Rev. (Health Care Sys. Proj.) Series A, 6.375% 11/15/29 | | 3,000,000 | | 3,239,760 |
Minnesota Gen. Oblig.: | | | | |
(Duluth Arpt. Proj.) Series B, 6.25% 8/1/14 (a) | | 1,000,000 | | 1,060,520 |
5% 8/1/16 | | 3,000,000 | | 3,271,140 |
5.2% 5/1/07 | | 3,750,000 | | 4,032,038 |
5.25% 8/1/13 | | 745,000 | | 834,720 |
5.5% 6/1/17 | | 1,950,000 | | 2,183,727 |
Minnesota Higher Ed. Facilities Auth. Rev.: | | | | |
(Carleton College Proj.): | | | | |
Series 3L 1, 5.75% 11/1/12 | | 2,000,000 | | 2,160,560 |
Series 4N, 5% 11/1/18 | | 2,000,000 | | 2,091,720 |
(Hamline Univ. Proj.): | | | | |
Series 4I, 6% 10/1/12 | | 2,000,000 | | 2,130,860 |
Series 5B, 5.95% 10/1/19 | | 600,000 | | 648,108 |
Municipal Bonds - continued |
| Principal Amount | | Value
(Note 1) |
Minnesota - continued |
Minnesota Higher Ed. Facilities Auth. Rev.: - continued | | | | |
(MacAlester College Proj.) Series 4C: | | | | |
5.2% 3/1/08 | | $ 1,070,000 | | $ 1,112,426 |
5.5% 3/1/12 | | 815,000 | | 849,996 |
(Saint Johns Univ. Proj.) Series 4L, 5.4% 10/1/22 | | 3,500,000 | | 3,624,005 |
(Saint Thomas Univ. Proj.): | | | | |
Series 3R 1, 5.6% 10/1/15 | | 1,000,000 | | 1,010,000 |
Series 3R 2: | | | | |
5.45% 9/1/07 | | 650,000 | | 656,500 |
5.6% 9/1/14 | | 4,275,000 | | 4,317,750 |
Series 4M, 5.35% 4/1/17 | | 1,500,000 | | 1,572,405 |
Minnesota Hsg. Fin. Agcy. (Single Family Mtg. Prog.): | | | | |
Series B, 5.8% 7/1/25 (a) | | 4,955,000 | | 4,960,847 |
Series H, 6.5% 1/1/26 (a) | | 1,410,000 | | 1,428,739 |
Minnesota Pub. Facilities Auth. Drinking Wtr. Rev.
Series B: | | | | |
5% 3/1/07 | | 2,500,000 | | 2,737,625 |
5% 3/1/08 | | 2,500,000 | | 2,776,325 |
Minnesota Pub. Facilities Auth. Wtr. Poll. Cont. Rev.: | | | | |
Series A: | | | | |
5% 3/1/06 | | 1,150,000 | | 1,233,663 |
5% 3/1/16 | | 1,000,000 | | 1,059,700 |
6% 3/1/07 | | 2,605,000 | | 2,931,980 |
Series B: | | | | |
5.125% 3/1/13 | | 1,000,000 | | 1,100,970 |
5.125% 3/1/15 | | 5,000,000 | | 5,447,450 |
5% 3/1/06 | | 2,500,000 | | 2,681,875 |
Minnesota Retirement Sys. Bldg. Rev.: | | | | |
5.55% 6/1/14 | | 590,000 | | 659,520 |
5.6% 6/1/15 | | 590,000 | | 672,836 |
5.65% 6/1/16 | | 625,000 | | 695,750 |
5.7% 6/1/17 | | 900,000 | | 1,024,263 |
5.75% 6/1/18 | | 975,000 | | 1,111,208 |
5.75% 6/1/19 | | 1,050,000 | | 1,190,847 |
5.8% 6/1/20 | | 1,000,000 | | 1,131,460 |
5.875% 6/1/22 | | 2,425,000 | | 2,751,163 |
Mounds View Independent School District #621
Series 2000 A, 5.375% 2/1/24 | | 3,000,000 | | 3,187,200 |
Northern Muni. Pwr. Agcy. Elec. Sys. Rev.: | | | | |
Series B, 4.75% 1/1/20 (AMBAC Insured) | | 3,500,000 | | 3,602,165 |
5.25% 1/1/13 (FSA Insured) | | 1,500,000 | | 1,674,000 |
Municipal Bonds - continued |
| Principal Amount | | Value
(Note 1) |
Minnesota - continued |
Northern Muni. Pwr. Agcy. Elec. Sys. Rev.: - continued | | | | |
5.375% 1/1/14 (FSA Insured) | | $ 8,500,000 | | $ 9,476,046 |
Osseo Independent School District #279: | | | | |
(School Bldg. Proj.): | | | | |
Series 2000 A, 5.25% 2/1/21 | | 2,625,000 | | 2,807,989 |
Series A: | | | | |
5.75% 2/1/11 | | 2,420,000 | | 2,820,486 |
5.75% 2/1/12 | | 3,100,000 | | 3,563,047 |
Series A, 5.25% 2/1/14 (FSA Insured) | | 2,705,000 | | 3,033,847 |
Series B, 5% 2/1/13 | | 2,000,000 | | 2,171,620 |
Owatonna Pub. Utils. Commission Pub. Utils. Rev.: | | | | |
4% 1/1/06 (AMBAC Insured) | | 610,000 | | 638,505 |
5% 1/1/11 (AMBAC Insured) | | 720,000 | | 807,322 |
5% 1/1/13 (AMBAC Insured) | | 800,000 | | 896,080 |
5% 1/1/15 (AMBAC Insured) | | 715,000 | | 784,612 |
Prior Lake Ind. School District #719 Series 2000, 5.5% 2/1/15 (FSA Insured) | | 1,500,000 | | 1,689,675 |
Ramsey County Gen. Oblig. Series A, 5% 2/1/18 | | 1,530,000 | | 1,650,717 |
Robbinsdale Independent School District #281: | | | | |
5% 2/1/09 | | 2,035,000 | | 2,269,127 |
5% 2/1/16 (FSA Insured) | | 3,425,000 | | 3,713,865 |
5% 2/1/17 (FSA Insured) | | 2,535,000 | | 2,730,499 |
5% 2/1/18 (FSA Insured) | | 2,520,000 | | 2,696,299 |
Rochester Health Care Facilities Rev.: | | | | |
(Mayo Foundation Proj.) Series A, 5.5% 11/15/27 | | 4,750,000 | | 5,005,550 |
(Mayo Foundation/Mayo Med. Ctr. Proj.) Series I: | | | | |
5.875% 11/15/08 | | 1,000,000 | | 1,145,040 |
5.9% 11/15/09 | | 1,000,000 | | 1,154,520 |
Roseville Independent School District #623 (School District Cr. Enhancement Prog.) Series A: | | | | |
5% 2/1/14 (FSA Insured) | | 1,460,000 | | 1,604,803 |
5% 2/1/15 (FSA Insured) | | 1,015,000 | | 1,106,340 |
Saint Cloud Health Care Rev. (Saint Cloud Hosp. Group Oblig. Proj.) Series A: | | | | |
5.75% 5/1/26 (FSA Insured) | | 4,500,000 | | 4,986,315 |
5.875% 5/1/30 (FSA Insured) | | 4,000,000 | | 4,460,040 |
Saint Cloud Hosp. Facilities Rev. (Saint Cloud Hosp. Proj.): | | | | |
Series A, 5.5% 7/1/05 (AMBAC Insured) | | 995,000 | | 1,052,213 |
Series B, 5% 7/1/20 (AMBAC Insured) | | 1,000,000 | | 1,036,350 |
Saint Louis Park Health Care Facilities Rev. (Park Nicollet Health Services Proj.) Series B, 5.5% 7/1/25 | | 2,000,000 | | 2,072,520 |
Municipal Bonds - continued |
| Principal Amount | | Value
(Note 1) |
Minnesota - continued |
Saint Louis Park Independent School District #283: | | | | |
5.65% 2/1/16 | | $ 2,630,000 | | $ 2,939,025 |
5.75% 2/1/20 | | 3,765,000 | | 4,193,118 |
Saint Michael Independent School District #885 5% 2/1/27 (FSA Insured) | | 7,000,000 | | 7,178,010 |
Saint Paul Hsg. & Redev. Auth. Health Care Facilities Rev. (Regions Hosp. Proj.) 5.3% 5/15/28 | | 1,250,000 | | 1,233,300 |
Saint Paul Independent School District #625: | | | | |
Series 2000 A, 5.5% 2/1/21 | | 1,060,000 | | 1,157,902 |
Series A, 5% 2/1/17 (FSA Insured) | | 220,000 | | 237,882 |
Series B: | | | | |
5% 2/1/18 (FSA Insured) | | 395,000 | | 423,981 |
5.8% 2/1/12 | | 1,200,000 | | 1,252,956 |
Saint Paul Port Auth. Energy Park Tax Increment Rev. 5% 2/1/08 (FSA Insured) | | 2,500,000 | | 2,750,475 |
Saint Paul Port Auth. Lease Rev.: | | | | |
Series 2003 11, 5.25% 12/1/20 | | 3,000,000 | | 3,256,800 |
Series 2003 12, 5.25% 12/1/18 | | 3,185,000 | | 3,509,297 |
Seaway Port Auth. Duluth Indl. Dev. Dock & Wharf Rev. (Cargill, Inc. Proj.) Series B, 6.8% 5/1/12 (c) | | 2,750,000 | | 2,789,875 |
South Washington County Independent School District #833 Series A: | | | | |
5.4% 2/1/15 | | 3,925,000 | | 4,363,148 |
5.5% 2/1/19 (MBIA Insured) | | 1,000,000 | | 1,103,780 |
Southern Minnesota Muni. Pwr. Agcy. Pwr. Supply Sys. Rev.: | | | | |
Series 2002 A, 5% 1/1/12 (AMBAC Insured) | | 2,660,000 | | 2,981,780 |
Series A, 5% 1/1/10 (MBIA Insured) | | 2,000,000 | | 2,241,960 |
5% 1/1/07 (AMBAC Insured) | | 2,815,000 | | 3,064,578 |
Suburban Hennepin Reg'l. Park District 5% 2/1/12 | | 1,000,000 | | 1,090,170 |
Waconia Independent School District #110 Series A: | | | | |
5% 2/1/06 (FSA Insured) | | 750,000 | | 802,013 |
5% 2/1/08 (FSA Insured) | | 800,000 | | 885,728 |
5% 2/1/09 (FSA Insured) | | 850,000 | | 949,085 |
5% 2/1/10 (FSA Insured) | | 900,000 | | 1,008,675 |
Washington County Gen. Oblig. 5.5% 2/1/21 | | 1,450,000 | | 1,583,922 |
Wayzata Ind. School District #284 Series 2002 A: | | | | |
4.5% 2/1/07 | | 3,830,000 | | 4,120,735 |
4.5% 2/1/08 | | 1,920,000 | | 2,086,234 |
Municipal Bonds - continued |
| Principal Amount | | Value
(Note 1) |
Minnesota - continued |
Western Minnesota Muni. Pwr. Agcy. Pwr. Supply Rev.: | | | | |
Series A: | | | | |
5% 1/1/26 (MBIA Insured) | | $ 1,000,000 | | $ 1,030,890 |
5.375% 1/1/08 (AMBAC Insured) | | 3,900,000 | | 4,235,634 |
5.4% 1/1/09 (AMBAC Insured) | | 4,325,000 | | 4,699,286 |
5.5% 1/1/11 (AMBAC Insured) | | 1,000,000 | | 1,088,480 |
5.5% 1/1/12 (AMBAC Insured) | | 1,000,000 | | 1,088,480 |
6.375% 1/1/16 (Escrowed to Maturity) (b) | | 1,585,000 | | 1,878,177 |
Western Minnesota Muni. Pwr. Agcy. Transmission Rev.: | | | | |
Series 2001 A, 5.5% 1/1/08 (AMBAC Insured) | | 1,125,000 | | 1,264,106 |
Series A, 5.5% 1/1/09 (AMBAC Insured) | | 1,000,000 | | 1,137,050 |
| | 320,867,261 |
Puerto Rico - 3.8% |
Puerto Rico Commonwealth Hwy. & Trans. Auth. Hwy. Rev. Series Y, 5.5% 7/1/36 (FSA Insured) | | 2,680,000 | | 2,979,356 |
Puerto Rico Commonwealth Hwy. & Trans. Auth. Trans. Rev. Series D, 5.25% 7/1/38 | | 2,500,000 | | 2,572,750 |
Puerto Rico Commonwealth Infrastructure Fing. Auth. Series 2000 A: | | | | |
5.5% 10/1/32 (Escrowed to Maturity) (b) | | 3,100,000 | | 3,389,943 |
5.5% 10/1/40 (Escrowed to Maturity) (b) | | 1,000,000 | | 1,089,820 |
Puerto Rico Elec. Pwr. Auth. Pwr. Rev. Series HH, 5.25% 7/1/29 (FSA Insured) | | 3,000,000 | | 3,169,140 |
| | 13,201,009 |
TOTAL INVESTMENT PORTFOLIO - 97.1% (Cost $314,097,375) | 334,068,270 |
NET OTHER ASSETS - 2.9% | 9,812,130 |
NET ASSETS - 100% | $ 343,880,400 |
Legend |
(a) Private activity obligations whose interest is subject to the federal alternative minimum tax for individuals. |
(b) Security collateralized by an amount sufficient to pay interest and principal. |
(c) Restricted securities - Investment in securities not registered under the Securities Act of 1933 (excluding 144A issues). At the end of the period, the value of restricted securities (excluding 144A issues) amounted to $2,789,875 or 0.8% of net assets. |
Additional information on each holding is as follows: |
Security | Acquisition Date | Acquisition Cost |
Seaway Port Auth. Duluth Indl. Dev. Dock & Wharf Rev. (Cargill, Inc. Proj.) Series B, 6.8% 5/1/12 | 5/20/92 | $ 2,750,000 |
Other Information |
The distribution of municipal securities by revenue source, as a percentage of total net assets, is as follows: |
General Obligations | 46.3% |
Electric Utilities | 12.0% |
Health Care | 10.4% |
Education | 6.5% |
Water & Sewer | 5.9% |
Others* (individually less than 5%) | 18.9% |
| 100.0% |
*Includes net other assets |
Purchases and sales of securities, other than short-term securities, aggregated $51,998,223 and $51,177,103, respectively. |
Income Tax Information |
The fund hereby designates approximately $1,528,000 as a capital gain dividend for the purpose of the dividend paid deduction. |
See accompanying notes which are an integral part of the financial statements.
Annual Report
Financial Statements
Statement of Assets and Liabilities
| December 31, 2003 |
| | |
Assets | | |
Investment in securities, at value (cost $314,097,375) - See accompanying schedule | | $ 334,068,270 |
Cash | | 4,391,934 |
Receivable for fund shares sold | | 489,825 |
Interest receivable | | 5,612,364 |
Prepaid expenses | | 2,054 |
Other receivables | | 5,169 |
Total assets | | 344,569,616 |
| | |
Liabilities | | |
Payable for investments purchased | $ 119,414 | |
Payable for fund shares redeemed | 114,420 | |
Distributions payable | 286,030 | |
Accrued management fee | 107,842 | |
Other affiliated payables | 29,954 | |
Other payables and accrued expenses | 31,556 | |
Total liabilities | | 689,216 |
| | |
Net Assets | | $ 343,880,400 |
Net Assets consist of: | | |
Paid in capital | | $ 322,981,373 |
Undistributed net investment income | | 247,426 |
Accumulated undistributed net realized gain (loss) on investments | | 680,706 |
Net unrealized appreciation (depreciation) on investments | | 19,970,895 |
Net Assets, for 29,415,139 shares outstanding | | $ 343,880,400 |
Net Asset Value, offering price and redemption price per share ($343,880,400 ÷ 29,415,139 shares) | | $ 11.69 |
See accompanying notes which are an integral part of the financial statements.
Annual Report
Financial Statements - continued
Statement of Operations
| Year ended December 31, 2003 |
| | |
Investment Income | | |
Interest | | $ 15,453,090 |
| | |
Expenses | | |
Management fee | $ 1,305,639 | |
Transfer agent fees | 265,138 | |
Accounting fees and expenses | 110,114 | |
Non-interested trustees' compensation | 1,884 | |
Custodian fees and expenses | 6,008 | |
Registration fees | 18,533 | |
Audit | 51,995 | |
Legal | 8,950 | |
Miscellaneous | 1,085 | |
Total expenses before reductions | 1,769,346 | |
Expense reductions | (87,532) | 1,681,814 |
Net investment income (loss) | | 13,771,276 |
Realized and Unrealized Gain (Loss) Net realized gain (loss) on investment securities | | 2,512,792 |
Change in net unrealized appreciation (depreciation) on investment securities | | 1,291,690 |
Net gain (loss) | | 3,804,482 |
Net increase (decrease) in net assets resulting from operations | | $ 17,575,758 |
See accompanying notes which are an integral part of the financial statements.
Annual Report
Statement of Changes in Net Assets
| Year ended
December 31,
2003 | Year ended
December 31,
2002 |
Increase (Decrease) in Net Assets | | |
Operations | | |
Net investment income (loss) | $ 13,771,276 | $ 14,960,242 |
Net realized gain (loss) | 2,512,792 | 2,905,165 |
Change in net unrealized appreciation (depreciation) | 1,291,690 | 9,513,499 |
Net increase (decrease) in net assets resulting
from operations | 17,575,758 | 27,378,906 |
Distributions to shareholders from net investment income | (13,684,949) | (14,977,464) |
Distributions to shareholders from net realized gain | (1,935,603) | - |
Total distributions | (15,620,552) | (14,977,464) |
Share transactions
Net proceeds from sales of shares | 47,539,027 | 62,455,371 |
Reinvestment of distributions | 11,834,902 | 11,411,568 |
Cost of shares redeemed | (61,886,380) | (58,208,874) |
Net increase (decrease) in net assets resulting from share transactions | (2,512,451) | 15,658,065 |
Redemption fees | 2,193 | 4,741 |
Total increase (decrease) in net assets | (555,052) | 28,064,248 |
| | |
Net Assets | | |
Beginning of period | 344,435,452 | 316,371,204 |
End of period (including undistributed net investment income of $247,426 and undistributed net investment income of $166,360, respectively) | $ 343,880,400 | $ 344,435,452 |
Other Information Shares | | |
Sold | 4,073,369 | 5,472,689 |
Issued in reinvestment of distributions | 1,014,251 | 997,558 |
Redeemed | (5,316,888) | (5,094,816) |
Net increase (decrease) | (229,268) | 1,375,431 |
See accompanying notes which are an integral part of the financial statements.
Annual Report
Financial Highlights
Years ended December 31, | 2003 | 2002 | 2001 | 2000 | 1999 |
Selected Per-Share Data | | | | | |
Net asset value, beginning of period | $ 11.62 | $ 11.19 | $ 11.20 | $ 10.63 | $ 11.41 |
Income from Investment Operations | | | | | |
Net investment income (loss) | .467 B | .509 B | .529 B, D | .529 B | .511 |
Net realized and unrealized gain (loss) | .133 | .431 | (.016) D | .568 | (.780) |
Total from investment operations | .600 | .940 | .513 | 1.097 | (.269) |
Distributions from net investment income | (.464) | (.510) | (.523) | (.527) | (.511) |
Distributions from net realized gain | (.066) | - | - | - | - |
Total distributions | (.530) | (.510) | (.523) | (.527) | (.511) |
Redemption fees added to paid in capital | - B, E | - B, E | - B, E | - | - |
Net asset value, end of period | $ 11.69 | $ 11.62 | $ 11.19 | $ 11.20 | $ 10.63 |
Total Return A | 5.27% | 8.57% | 4.64% | 10.62% | (2.43)% |
Ratios to Average Net Assets C | | | | |
Expenses before expense reductions | .51% | .51% | .51% | .52% | .53% |
Expenses net of voluntary waivers, if any | .51% | .51% | .51% | .52% | .53% |
Expenses net of all reductions | .49% | .49% | .46% | .46% | .51% |
Net investment income (loss) | 4.00% | 4.45% | 4.69% D | 4.90% | 4.62% |
Supplemental Data | | | | | |
Net assets, end of period (000 omitted) | $ 343,880 | $ 344,435 | $ 316,371 | $ 293,666 | $ 285,029 |
Portfolio turnover rate | 15% | 25% | 7% | 18% | 21% |
A Total returns would have been lower had certain expenses not been reduced during the periods shown.
B Calculated based on average shares outstanding during the period.
C Expense ratios reflect operating expenses of the fund. Expenses before reductions do not reflect amounts reimbursed by the investment adviser or reductions from brokerage service arrangements or other expense offset arrangements and do not represent the amount paid by the fund during periods when reimbursements or reductions occur. Expenses net of any voluntary waivers reflect expenses after reimbursement by the investment adviser but prior to reductions from brokerage service arrangements or other expense offset arrangements. Expenses net of all reductions represent the net expenses paid by the fund.
D Effective January 1, 2001, the fund adopted the provisions of the AICPA Audit and Accounting Guide for Investment Companies and began amortizing premium and discount on all debt securities. Per-share data and ratios for periods prior to adoption have not been restated to reflect this change.
E Amount represents less than $.001 per share.
See accompanying notes which are an integral part of the financial statements.
Annual Report
Notes to Financial Statements
For the period ended December 31, 2003
1. Significant Accounting Policies.
Spartan Minnesota Municipal Income Fund (the fund) is a fund of Fidelity Municipal Trust (the trust) and is authorized to issue an unlimited number of shares. The trust is registered under the Investment Company Act of 1940, as amended (the 1940 Act), as an open-end management investment company organized as a Massachusetts business trust. The fund may be affected by economic and political developments in the state of Minnesota. The financial statements have been prepared in conformity with accounting principles generally accepted in the United States of America, which require management to make certain estimates and assumptions at the date of the financial statements. The following summarizes the significant accounting policies of the fund:
Security Valuation. Net asset value per share (NAV calculation) is calculated as of the close of business of the New York Stock Exchange, normally 4:00 p.m. Eastern time. Debt securities are valued on the basis of information provided by a pricing service. Pricing services use valuation matrices that incorporate both dealer-supplied valuations and valuation models. If an event that is expected to materially affect the value of a security occurs after the close of an exchange or market on which that security trades, but prior to the NAV calculation, then that security will be fair valued taking the event into account. Securities (including restricted securities) for which market quotations are not readily available are valued at their fair value as determined in good faith under consistently applied procedures under the general supervision of the Board of Trustees. Price movements in futures contracts and ADRs, market and trading trends, the bid/ask quotes of brokers and off-exchange institutional trading may be reviewed in the course of making a good faith determination of a security's fair value. Short-term securities with remaining maturities of sixty days or less for which quotations are not readily available are valued on the basis of amortized cost. Investments in open-end investment companies are valued at their net asset value each business day.
Investment Transactions and Income. Security transactions are accounted for as of trade date. Gains and losses on securities sold are determined on the basis of identified cost. Interest income is accrued as earned. Interest income includes coupon interest and amortization of premium and accretion of discount on debt securities, which is accrued using the interest method.
Expenses. Most expenses of the trust can be directly attributed to a fund. Expenses which cannot be directly attributed are apportioned among the funds in the trust.
Income Tax Information and Distributions to Shareholders. Each year, the fund intends to qualify as a regulated investment company by distributing all of its taxable income and realized gains under Subchapter M of the Internal Revenue Code. As a result, no provision for income taxes is required in the accompanying financial statements. Dividends are declared daily and paid monthly from net investment income. Distributions from realized gains, if any, are recorded on the ex-dividend date.
Annual Report
Notes to Financial Statements - continued
1. Significant Accounting Policies.
Income Tax Information and Distributions to Shareholders - continued
Income and capital gain distributions are determined in accordance with income tax regulations, which may differ from generally accepted accounting principles. In addition, the fund will treat a portion of the proceeds from shares redeemed as a distribution from net investment income and realized gain for income tax purposes. Capital accounts within the financial statements are adjusted for permanent and temporary book and tax differences. These adjustments have no impact on net assets or the results of operations. Temporary differences will reverse in a subsequent period. These differences are primarily due to market discount and losses deferred due to futures transactions.
The tax-basis components of distributable earnings and the federal tax cost as of period end were as follows:
Unrealized appreciation | $ 20,184,063 |
Unrealized depreciation | (401,057) |
Net unrealized appreciation (depreciation) | 19,783,006 |
Undistributed ordinary income | 35,916 |
Undistributed long-term capital gain | 889,427 |
Cost for federal income tax purposes | $ 314,285,264 |
The tax character of distributions paid was as follows:
| December 31, 2003 | December 31, 2002 |
Tax-exempt Income | $ 13,684,949 | $ 14,977,464 |
Ordinary Income | 469,237 | - |
Long-term Capital Gains | 1,466,366 | - |
Total | $ 15,620,552 | $ 14,977,464 |
Short-Term Trading (Redemption) Fees. Shares held in the fund less than 30 days are subject to a short-term trading fee equal to .50% of the proceeds of the redeemed shares. The fee, which is retained by the fund, is accounted for as an addition to paid in capital.
2. Operating Policies.
Restricted Securities. The fund may invest in securities that are subject to legal or contractual restrictions on resale. These securities generally may be resold in transactions exempt from registration or to the public if the securities are registered. Disposal of these securities may involve time-consuming negotiations and expense, and prompt sale at an acceptable price may be difficult. Information regarding restricted securities is included at the end of the fund's Schedule of Investments.
Annual Report
3. Purchases and Sales of Investments.
Annual Report
Information regarding purchases and sales of securities is included under the caption "Other Information" at the end of the fund's Schedule of Investments.
4. Fees and Other Transactions with Affiliates.
Management Fee. Fidelity Management & Research Company (FMR) and its affiliates provide the fund with investment management related services for which the fund pays a monthly management fee. The management fee is the sum of an individual fund fee rate that is based on an annual rate of .25% of the fund's average net assets and a group fee rate that averaged .13% during the period. The group fee rate is based upon the average net assets of all the mutual funds advised by FMR. The group fee rate decreases as assets under management increase and increases as assets under management decrease. For the period, the total annual management fee rate was .38% of the fund's average net assets.
Transfer Agent and Accounting Fees. Citibank, N.A. (Citibank) is the custodian, transfer agent and shareholder servicing agent for the fund. Citibank has entered into a sub-contract with Fidelity Service Company, Inc. (FSC), an affiliate of FMR, under which FSC performs the activities associated with the fund's transfer and shareholder servicing agent and accounting functions. The fund pays account fees and asset-based fees that vary according to account size and type of account. FSC pays for typesetting, printing and mailing of all shareholder reports, except proxy statements. The accounting fee is based on the level of average net assets for the month plus out-of-pocket expenses.
For the period, the transfer agent fees were equivalent to an annual rate of .08% of average net assets.
5. Expense Reductions.
Notes to Financial Statements - continued
Through arrangements with the fund's custodian and transfer agent, credits realized as a result of uninvested cash balances were used to reduce the fund's expenses. During the period, these credits reduced the fund's custody and transfer agent expenses by $5,939 and $81,593, respectively.
Annual Report
Report of Independent Auditors
To the Trustees of Fidelity Municipal Trust and the Shareholders of Spartan Minnesota Municipal Income Fund:
In our opinion, the accompanying statement of assets and liabilities, including the schedule of investments, and the related statements of operations and of changes in net assets and the financial highlights present fairly, in all material respects, the financial position of Spartan Minnesota Municipal Income Fund (a fund of Fidelity Municipal Trust) at December 31, 2003 and the results of its operations, the changes in its net assets and the financial highlights for the periods indicated, in conformity with accounting principles generally accepted in the United States of America. These financial statements and financial highlights (hereafter referred to as "financial statements") are the responsibility of the Spartan Minnesota Municipal Income Fund's management; our responsibility is to express an opinion on these financial statements based on our audits. We conducted our audits of these financial statements in accordance with auditing standards generally accepted in the United States of America which require that we plan and perform the audit to obtain reasonable assurance about whether the financial statements are free of material misstatement. An audit includes examining, on a test basis, evidence supporting the amounts and disclosures in the financial statements, assessing the accounting principles used and significant estimates made by management, and evaluating the overall financial statement presentation. We believe that our audits, which included confirmation of securities at December 31, 2003 by correspondence with the custodian and brokers, provide a reasonable basis for our opinion.
/s/ PricewaterhouseCoopers LLP
PricewaterhouseCoopers LLP
Boston, Massachusetts
February 11, 2004
Annual Report
Trustees and Officers
The Trustees, Members of the Advisory Board, and executive officers of the trust and fund, as applicable, are listed below. The Board of Trustees governs the fund and is responsible for protecting the interests of shareholders. The Trustees are experienced executives who meet periodically throughout the year to oversee the fund's activities, review contractual arrangements with companies that provide services to the fund, and review the fund's performance. Except for William O. McCoy, each of the Trustees oversees 292 funds advised by FMR or an affiliate. Mr. McCoy oversees 294 funds advised by FMR or an affiliate.
The Trustees hold office without limit in time except that (a) any Trustee may resign; (b) any Trustee may be removed by written instrument, signed by at least two-thirds of the number of Trustees prior to such removal; (c) any Trustee who requests to be retired or who has become incapacitated by illness or injury may be retired by written instrument signed by a majority of the other Trustees; and (d) any Trustee may be removed at any special meeting of shareholders by a two-thirds vote of the outstanding voting securities of the trust. In any event, each non-interested Trustee shall retire not later than the last day of the calendar year in which his or her 72nd birthday occurs. The executive officers and Advisory Board Members hold office without limit in time, except that any officer and Advisory Board Member may resign or may be removed by a vote of a majority of the Trustees at any regular meeting or any special meeting of the Trustees. Except as indicated, each individual has held the office shown or other offices in the same company for the past five years.
The fund's Statement of Additional Information (SAI) includes more information about the Trustees. To request a free copy, call Fidelity at 1-800-544-8544.
Interested Trustees*:
Correspondence intended for each Trustee who is an "interested person" (as defined in the 1940 Act) may be sent to 82 Devonshire Street, Boston, Massachusetts 02109.
Name, Age; Principal Occupation |
Edward C. Johnson 3d (73)** |
| Year of Election or Appointment: 1984 Mr. Johnson is Chairman of the Board of Trustees. Mr. Johnson serves as Chief Executive Officer, Chairman, and a Director of FMR Corp.; a Director and Chairman of the Board and of the Executive Committee of FMR; Chairman and a Director of Fidelity Management & Research (Far East) Inc.; Chairman (1998) and a Director of Fidelity Investments Money Management, Inc.; and Chairman (2001) and a Director (2000) of FMR Co., Inc. |
Abigail P. Johnson (42)** |
| Year of Election or Appointment: 2001 Senior Vice President of Spartan Minnesota Municipal Income (2001). Ms. Johnson also serves as Senior Vice President of other Fidelity funds (2001). She is President and a Director of FMR (2001), Fidelity Investments Money Management, Inc. (2001), FMR Co., Inc. (2001), and a Director of FMR Corp. Previously, Ms. Johnson managed a number of Fidelity funds. |
Laura B. Cronin (49) |
| Year of Election or Appointment: 2003 Ms. Cronin is an Executive Vice President (2002) and Chief Financial Officer (2002) of FMR Corp. and is a member of the Fidelity Management Committee (2003). Previously, Ms. Cronin served as Vice President of Finance of FMR (1997-1999), and Chief Financial Officer of FMR (1999-2001), Fidelity Personal Investments (2001), and Fidelity Brokerage Company (2001-2002). |
Robert L. Reynolds (51) |
| Year of Election or Appointment: 2003 Mr. Reynolds is a Director (2003) and Chief Operating Officer (2002) of FMR Corp. and is the head of the Fidelity Management Committee (2003). He also serves on the Board at Fidelity Investments Canada, Ltd. (2000). Previously, Mr. Reynolds served as President of Fidelity Investments Institutional Retirement Group (1996-2000). |
* Trustees have been determined to be "Interested Trustees" by virtue of, among other things, their affiliation with the trust or various entities under common control with FMR.
** Edward C. Johnson 3d, Trustee, is Abigail P. Johnson's father.
Annual Report
Non-Interested Trustees:
Correspondence intended for each non-interested Trustee (that is, the Trustees other than the Interested Trustees) may be sent to Fidelity Investments, P.O. Box 55235, Boston, Massachusetts 02205-5235.
Name, Age; Principal Occupation |
J. Michael Cook (61) |
| Year of Election or Appointment: 2001 Prior to Mr. Cook's retirement in May 1999, he served as Chairman and Chief Executive Officer of Deloitte & Touche LLP (accounting/consulting), Chairman of the Deloitte & Touche Foundation, and a member of the Board of Deloitte Touche Tohmatsu. He currently serves as a Director of Comcast (telecommunications, 2002), International Flavors & Fragrances, Inc. (2000), Rockwell Automation (2000), and The Dow Chemical Company (2000). He is a Member of the Diversity Advisory Council of Marakon (2003) and the Advisory Board of the Directorship Search Group, Chairman Emeritus of the Board of Catalyst (a leading organization for the advancement of women in business), and is Chairman of the Accountability Advisory Council to the Comptroller General of the United States. He also serves as a Member of the Advisory Board of the Graduate School of Business of the University of Florida, his alma mater. |
Ralph F. Cox (71) |
| Year of Election or Appointment: 1991 Mr. Cox is President of RABAR Enterprises (management consulting for the petroleum industry). Prior to February 1994, he was President of Greenhill Petroleum Corporation (petroleum exploration and production). Until March 1990, Mr. Cox was President and Chief Operating Officer of Union Pacific Resources Company (exploration and production). He is a Director of CH2M Hill Companies (engineering), and Abraxas Petroleum (petroleum exploration and production, 1999). In addition, he is a member of advisory boards of Texas A&M University and the University of Texas at Austin. |
Robert M. Gates (60) |
| Year of Election or Appointment: 1997 Dr. Gates is President of Texas A&M University (2002). He was Director of the Central Intelligence Agency (CIA) from 1991 to 1993. From 1989 to 1991, Dr. Gates served as Assistant to the President of the United States and Deputy National Security Advisor. Dr. Gates is a Director of NACCO Industries, Inc. (mining and manufacturing), and Parker Drilling Co., Inc. (drilling and rental tools for the energy industry, 2001). He also serves as a member of the Advisory Board of VoteHere.net (secure internet voting, 2001). Previously, Dr. Gates served as a Director of LucasVarity PLC (automotive components and diesel engines), a Director of TRW Inc. (automotive, space, defense, and information technology), and Dean of the George Bush School of Government and Public Service at Texas A&M University (1999-2001). Dr. Gates also is a Trustee of the Forum for International Policy. |
George H. Heilmeier (67) |
| Year of Election or Appointment: 2004 Dr. Heilmeier is Chairman Emeritus of Telcordia Technologies (communication software and systems), where prior to his retirement, he served as company Chairman and Chief Executive Officer. He currently serves on the Boards of Directors of The Mitre Corporation (systems engineering and information technology support for the government), INET Technologies Inc. (telecommunications network surveillance, 2001) and Teletech Holdings (customer management services, 1998). He is Chairman of the General Motors Technology Advisory Committee and a Life Fellow of the IEEE (2000). Dr. Heilmeier is a member of the Defense Science Board and the National Security Agency Advisory Board. He is also a member of the National Academy of Engineering, the American Academy of Arts and Sciences and The Board of Overseers of the School of Engineering and Applied Science of the University of Pennsylvania. Previously, Dr. Heilmeier served as a Director of TRW Inc. (automotive, space, defense, and information technology, 1992-2002) and Compaq (1994-2002). |
Donald J. Kirk (71) |
| Year of Election or Appointment: 1987 Mr. Kirk is a Governor of the American Stock Exchange (2001), a Trustee and former Chairman of the Board of Trustees of the Greenwich Hospital Association, a Director of the Yale-New Haven Health Services Corp. (1998), and a Director Emeritus and former Chairman of the Board of Directors of National Arts Strategies Inc. Mr. Kirk was an Executive-in-Residence (1995-2000) and a Professor (1987-1995) at Columbia University Graduate School of Business. Prior to 1987, he was Chairman of the Financial Accounting Standards Board. Previously, Mr. Kirk served as a Governor of the National Association of Securities Dealers, Inc. (1996-2002), a member and Vice Chairman of the Public Oversight Board of the American Institute of Certified Public Accountants' SEC Practice Section (1995-2002), a Director of General Re Corporation (reinsurance, 1987-1998) and as a Director of Valuation Research Corp. (appraisals and valuations). |
Marie L. Knowles (57) |
| Year of Election or Appointment: 2001 Prior to Ms. Knowles' retirement in June 2000, she served as Executive Vice President and Chief Financial Officer of Atlantic Richfield Company (ARCO) (diversified energy, 1996-2000). From 1993 to 1996, she was a Senior Vice President of ARCO and President of ARCO Transportation Company. She served as a Director of ARCO from 1996 to 1998. She currently serves as a Director of Phelps Dodge Corporation (copper mining and manufacturing), URS Corporation (multidisciplinary engineering, 1999), and McKesson Corporation (healthcare service, 2002). Ms. Knowles is a Trustee of the Brookings Institution and the Catalina Island Conservancy and also serves as a member of the Advisory Board for the School of Engineering of the University of Southern California. |
Ned C. Lautenbach (59) |
| Year of Election or Appointment: 2000 Mr. Lautenbach has been a partner of Clayton, Dubilier & Rice, Inc. (private equity investment firm) since September 1998. Previously, Mr. Lautenbach was with the International Business Machines Corporation (IBM) from 1968 until his retirement in 1998. He was most recently Senior Vice President and Group Executive of Worldwide Sales and Services. From 1993 to 1995, he was Chairman of IBM World Trade Corporation, and from 1994 to 1998 was a member of IBM's Corporate Executive Committee. Mr. Lautenbach serves as Chairman and as a Director (1998) of Acterna Corporation (communications test equipment). He is also Co-Chairman of Covansys, Inc. (global provider of business and technology solutions, 2000). In addition, he is a Director of Eaton Corporation (diversified industrial) and the Philharmonic Center for the Arts in Naples, Florida (1999). He also is a member of the Council on Foreign Relations. |
Marvin L. Mann (70) |
| Year of Election or Appointment: 1993 Mr. Mann is Chairman of the non-interested Trustees (2001). He is Chairman Emeritus of Lexmark International, Inc. (computer peripherals) where he served as CEO until April 1998 and retired as Chairman May 1999, and remains a member of the Board. Prior to 1991, he held the positions of Vice President of International Business Machines Corporation (IBM) and President and General Manager of various IBM divisions and subsidiaries. Mr. Mann is a Board member of Imation Corp. (imaging and information storage) and Acterna Corporation (communications test equipment, 1999). He is also a member of the Director Services Committee of the Investment Company Institute. In addition, Mr. Mann is a member of the President's Cabinet at the University of Alabama and the Board of Visitors of the Culverhouse College of Commerce and Business Administration at the University of Alabama. |
William O. McCoy (70) |
| Year of Election or Appointment: 1997 Prior to his retirement in December 1994, Mr. McCoy was Vice Chairman of the Board of BellSouth Corporation (telecommunications) and President of BellSouth Enterprises. He is currently a Director of Liberty Corporation (holding company), Duke Realty Corporation (real estate), Progress Energy, Inc. (electric utility), and Acterna Corporation (communications test equipment, 1999). He is also a partner of Franklin Street Partners (private investment management firm) and a member of the Research Triangle Foundation Board. In addition, Mr. McCoy served as the Interim Chancellor (1999-2000) and a member of the Board of Visitors (1994-1998) for the University of North Carolina at Chapel Hill and currently serves on the Board of Directors of the University of North Carolina Health Care System and the Board of Visitors of the Kenan-Flagler Business School (University of North Carolina at Chapel Hill). He also served as Vice President of Finance for the University of North Carolina (16-school system, 1995-1998). |
William S. Stavropoulos (64) |
| Year of Election or Appointment: 2002 Mr. Stavropoulos is Chairman of the Board, President and CEO (2002), and Chairman of the Executive Committee (2000) and a Director of The Dow Chemical Company. Since joining The Dow Chemical Company in 1967, Mr. Stavropoulos served in numerous senior management positions, including President (1993-2000) and Chief Executive Officer (1995-2000). Currently, he is a Director of NCR Corporation (data warehousing and technology solutions), BellSouth Corporation (telecommunications), Chemical Financial Corporation, and Maersk Inc. (industrial conglomerate, 2002). He also serves as a member of the Board of Trustees of the American Enterprise Institute for Public Policy Research. In addition, Mr. Stavropoulos is a member of The Business Council, J.P. Morgan International Council, World Business Council for Sustainable Development, and the University of Notre Dame Advisory Council for the College of Science. |
Annual Report
Trustees and Officers - continued
Advisory Board Members and Executive Officers:
Correspondence intended for Ms. Small may be sent to Fidelity Investments, P.O. Box 55235, Boston, Massachusetts 02205-5235. Correspondence intended for each executive officer and Mr. Lynch may be sent to 82 Devonshire Street, Boston, Massachusetts 02109.
Name, Age; Principal Occupation |
Peter S. Lynch (60) |
| Year of Election or Appointment: 2003 Member of the Advisory Board of Fidelity Municipal Trust. Vice Chairman and a Director of FMR, and Vice Chairman (2001) and a Director (2000) of FMR Co., Inc. Previously, Mr. Lynch served as a Trustee of the Fidelity funds (1990-2003). Prior to May 31, 1990, he was a Director of FMR and Executive Vice President of FMR (a position he held until March 31, 1991), Vice President of Fidelity® Magellan® Fund and FMR Growth Group Leader, and Managing Director of FMR Corp. Mr. Lynch was also Vice President of Fidelity Investments Corporate Services. In addition, he serves as a Trustee of Boston College, Massachusetts Eye & Ear Infirmary, Historic Deerfield, John F. Kennedy Library, and the Museum of Fine Arts of Boston. |
Cornelia M. Small (59) |
| Year of Election or Appointment: 2004 Member of the Advisory Board of Fidelity Municipal Trust. Ms. Small is a member (2000) and Chairperson (2002) of the Investment Committee, and a member (2002) of the Board of Trustees of Smith College. Previously, she served as Chief Investment Officer (1999-2000), Director of Global Equity Investments (1996-1999), and a member of the Board of Directors (1998-1999) of Scudder Kemper Investments. In addition, Ms. Small served as Co-Chair (2000-2003) of the Annual Fund for the Fletcher School of Law and Diplomacy. |
Dwight D. Churchill (50) |
| Year of Election or Appointment: 1997 Vice President of Spartan Minnesota Municipal Income. He serves as Head of Fidelity's Fixed-Income Division (2000), Vice President of Fidelity's Money Market Funds (2000), Vice President of Fidelity's Bond Funds (1997), and Senior Vice President of FIMM (2000) and FMR (1997). Mr. Churchill joined Fidelity in 1993 as Vice President and Group Leader of Taxable Fixed-Income Investments. |
Charles S. Morrison (43) |
| Year of Election or Appointment: 2002 Vice President of Spartan Minnesota Municipal Income. Mr. Morrison also serves as Vice President of Fidelity's Bond Funds (2002), and Vice President of certain Asset Allocation and Balanced Funds (2002). He serves as Vice President (2002) and Bond Group Leader (2002) of Fidelity Investments Fixed Income Division. Mr. Morrison is also Vice President of FIMM (2002) and FMR (2002). Mr. Morrison joined Fidelity in 1987 as a Corporate Bond Analyst in the Fixed Income Research Division. |
Christine J. Thompson (45) |
| Year of Election or Appointment: 1998 Vice President of Spartan Minnesota Municipal Income. Ms. Thompson is also Vice President of other funds advised by FMR. |
Eric D. Roiter (55) |
| Year of Election or Appointment: 1998 Secretary of Spartan Minnesota Municipal Income. He also serves as Secretary of other Fidelity funds (1998); Vice President, General Counsel, and Clerk of FMR Co., Inc. (2001) and FMR (1998); Vice President and Clerk of FDC (1998); Assistant Clerk of Fidelity Management & Research (U.K.) Inc. (2001) and Fidelity Management & Research (Far East) Inc. (2001); and Assistant Secretary of Fidelity Investments Money Management Inc. (2001). Prior to joining Fidelity, Mr. Roiter was with the law firm of Debevoise & Plimpton, as an associate (1981-1984) and as a partner (1985-1997), and served as an Assistant General Counsel of the U.S. Securities and Exchange Commission (1979-1981). Mr. Roiter is an Adjunct Member, Faculty of Law, at Boston College Law School (2003). |
Stuart Fross (44) |
| Year of Election or Appointment: 2003 Assistant Secretary of Spartan Minnesota Municipal Income. Mr. Fross also serves as Assistant Secretary of other Fidelity funds (2003) and is an employee of FMR. |
Maria F. Dwyer (45) |
| Year of Election or Appointment: 2002 President and Treasurer of Spartan Minnesota Municipal Income. Ms. Dwyer also serves as President and Treasurer of other Fidelity funds (2002) and is a Vice President (1999) and an employee (1996) of FMR. |
Timothy F. Hayes (53) |
| Year of Election or Appointment: 2002 Chief Financial Officer of Spartan Minnesota Municipal Income. Mr. Hayes also serves as Chief Financial Officer of other Fidelity funds (2002). Recently he was appointed President of Fidelity Service Company (2003) where he also serves as a Director. Mr. Hayes also serves as President of Fidelity Investments Operations Group (FIOG, 2002), which includes Fidelity Pricing and Cash Management Services Group (FPCMS), where he was appointed President in 1998. Previously, Mr. Hayes served as Chief Financial Officer of Fidelity Investments Corporate Systems and Service Group (1998) and Fidelity Systems Company (1997-1998). |
Jennifer S. Taub (37) |
| Year of Election or Appointment: 2003 Assistant Vice President of Spartan Minnesota Municipal Income. Ms. Taub is Assistant Vice President of Fidelity's Fixed-Income Funds (2003), Assistant Secretary of FIMM (2003), and is an employee of FMR. |
John R. Hebble (45) |
| Year of Election or Appointment: 2003 Deputy Treasurer of Spartan Minnesota Municipal Income. Mr. Hebble also serves as Deputy Treasurer of other Fidelity funds (2003), and is an employee of FMR. Before joining Fidelity Investments, Mr. Hebble worked at Deutsche Asset Management where he served as Director of Fund Accounting (2002-2003) and Assistant Treasurer of the Scudder Funds (1998-2003). |
John H. Costello (57) |
| Year of Election or Appointment: 1986 Assistant Treasurer of Spartan Minnesota Municipal Income. Mr. Costello also serves as Assistant Treasurer of other Fidelity funds and is an employee of FMR. |
Francis V. Knox, Jr. (56) |
| Year of Election or Appointment: 2002 Assistant Treasurer of Spartan Minnesota Municipal Income. Mr. Knox also serves as Assistant Treasurer of other Fidelity funds (2002), and is a Vice President and an employee of FMR. Previously, Mr. Knox served as Vice President of Investment & Advisor Compliance (1990-2001), and Compliance Officer of Fidelity Management & Research (U.K.) Inc. (1992-2002), Fidelity Management & Research (Far East) Inc. (1991-2002), and FMR Corp. (1995-2002). |
Mark Osterheld (48) |
| Year of Election or Appointment: 2002 Assistant Treasurer of Spartan Minnesota Municipal Income. Mr. Osterheld also serves as Assistant Treasurer of other Fidelity funds (2002) and is an employee of FMR. |
Thomas J. Simpson (45) |
| Year of Election or Appointment: 1996 Assistant Treasurer of Spartan Minnesota Municipal Income. Mr. Simpson is Assistant Treasurer of other Fidelity funds (2000) and an employee of FMR (1996). Prior to joining FMR, Mr. Simpson was Vice President and Fund Controller of Liberty Investment Services (1987-1995). |
Annual Report
Distributions
The Board of Trustees of Spartan Minnesota Municipal Income Fund voted to pay on February 9, 2004, to shareholders of record at the opening of business on February 6, 2004, a distribution of $.03 per share derived from capital gains realized from sales of portfolio securities.
During fiscal year ended 2003, 100% of the Spartan Minnesota Municipal Income Fund's income dividends was free from federal income tax, and 5.93% of the fund's income dividends was subject to the federal alternative minimum tax.
The fund will notify shareholders in January 2004 of amounts for use in preparing 2003 income tax returns.
Annual Report
Managing Your Investments
Fidelity offers several ways to conveniently manage your personal investments via your telephone or PC. You can access your account information, conduct trades and research your investments 24 hours a day.
By Phone
Fidelity Automated Service Telephone provides a single toll-free number to access account balances, positions, quotes and trading. It's easy to navigate the service, and on your first call, the system will help you create a personal identification number (PIN) for security.
(phone_graphic)Fidelity Automated
Service Telephone (FAST®)
1-800-544-5555
Press
1 For mutual fund and brokerage trading.
2 For quotes.*
3 For account balances and holdings.
4 To review orders and mutual
fund activity.
5 To change your PIN.
*0 To speak to a Fidelity representative.
By PC
Fidelity's web site on the Internet provides a wide range of information, including daily financial news, fund performance, interactive planning tools and news about Fidelity products and services.
(computer_graphic)Fidelity's Web Site
www.fidelity.com
* When you call the quotes line, please remember that a fund's yield and return will vary and, except for money market funds, share price will also vary. This means that you may have a gain or loss when you sell your shares. There is no assurance that money market funds will be able to maintain a stable $1 share price; an investment in a money market fund is not insured or guaranteed by the U.S. government. Total returns are historical and include changes in share price, reinvestment of dividends and capital gains, and the effects of any sales charges.
Annual Report
To Write Fidelity
We'll give your correspondence immediate attention and send you written confirmation upon completion of your request.
(letter_graphic)Making Changes
To Your Account
(such as changing name, address, bank, etc.)
Fidelity Investments
P.O. Box 770001
Cincinnati, OH 45277-0002
(letter_graphic)For Non-Retirement
Accounts
Buying shares
Fidelity Investments
P.O. Box 770001
Cincinnati, OH 45277-0003
Overnight Express
Fidelity Investments
Attn: Distribution Services
100 Crosby Parkway - KC1H
Covington, KY 41015
Selling shares
Fidelity Investments
P.O. Box 770001
Cincinnati, OH 45277-0035
Overnight Express
Fidelity Investments
Attn: Distribution Services
100 Crosby Parkway - KC1H
Covington, KY 41015
General Correspondence
Fidelity Investments
P.O. Box 500
Merrimack, NH 03054-0500
(letter_graphic)For Retirement
Accounts
Buying shares
Fidelity Investments
P.O. Box 770001
Cincinnati, OH 45277-0003
Selling shares
Fidelity Investments
P.O. Box 770001
Cincinnati, OH 45277-0035
Overnight Express
Fidelity Investments
Attn: Distribution Services
100 Crosby Parkway - KC1H
Covington, KY 41015
General Correspondence
Fidelity Investments
P.O. Box 500
Merrimack, NH 03054-0500
Annual Report
To Visit Fidelity
For directions and hours,
please call 1-800-544-9797.
Arizona
7001 West Ray Road
Chandler, AZ
7373 N. Scottsdale Road
Scottsdale, AZ
California
815 East Birch Street
Brea, CA
1411 Chapin Avenue
Burlingame, CA
851 East Hamilton Avenue
Campbell, CA
527 North Brand Boulevard
Glendale, CA
19200 Von Karman Avenue
Irvine, CA
601 Larkspur Landing Circle
Larkspur, CA
10100 Santa Monica Blvd.
Los Angeles, CA
27101 Puerta Real
Mission Viejo, CA
73-575 El Paseo
Palm Desert, CA
251 University Avenue
Palo Alto, CA
1760 Challenge Way
Sacramento, CA
7676 Hazard Center Drive
San Diego, CA
8 Montgomery Street
San Francisco, CA
21701 Hawthorne Boulevard
Torrance, CA
2001 North Main Street
Walnut Creek, CA
6300 Canoga Avenue
Woodland Hills, CA
Colorado
1625 Broadway
Denver, CO
9185 East Westview Road
Littleton, CO
Connecticut
48 West Putnam Avenue
Greenwich, CT
265 Church Street
New Haven, CT
300 Atlantic Street
Stamford, CT
29 South Main Street
West Hartford, CT
Delaware
222 Delaware Avenue
Wilmington, DE
Florida
4400 N. Federal Highway
Boca Raton, FL
121 Alhambra Plaza
Coral Gables, FL
2948 N. Federal Highway
Ft. Lauderdale, FL
1907 West State Road 434
Longwood, FL
8880 Tamiami Trail, North
Naples, FL
3501 PGA Boulevard
West Palm Beach, FL
8065 Beneva Road
Sarasota, FL
1502 N. Westshore Blvd.
Tampa, FL
Georgia
3445 Peachtree Road, N.E.
Atlanta, GA
Annual Report
1000 Abernathy Road
Atlanta, GA
Illinois
One North LaSalle Street
Chicago, IL
1415 West 22nd Street
Oak Brook, IL
1700 East Golf Road
Schaumburg, IL
3232 Lake Avenue
Wilmette, IL
Indiana
4729 East 82nd Street
Indianapolis, IN
Kansas
5400 College Boulevard
Overland Park, KS
Maine
Three Canal Plaza
Portland, ME
Maryland
7401 Wisconsin Avenue
Bethesda, MD
One W. Pennsylvania Ave.
Towson, MD
Massachusetts
801 Boylston Street
Boston, MA
155 Congress Street
Boston, MA
300 Granite Street
Braintree, MA
44 Mall Road
Burlington, MA
405 Cochituate Road
Framingham, MA
416 Belmont Street
Worcester, MA
Fidelity Brokerage Services, Inc., 100 Summer St., Boston, MA 02110 Member NYSE/SIPC
Annual Report
Michigan
280 Old N. Woodward Ave.
Birmingham, MI
43420 Grand River Avenue
Novi, MI
29155 Northwestern Hwy.
Southfield, MI
Minnesota
7600 France Avenue South
Edina, MN
Missouri
8885 Ladue Road
Ladue, MO
New Jersey
150 Essex Street
Millburn, NJ
56 South Street
Morristown, NJ
501 Route 17, South
Paramus, NJ
3518 Route 1 North
Princeton, NJ
New York
1055 Franklin Avenue
Garden City, NY
37 West Jericho Turnpike
Huntington Station, NY
1271 Avenue of the Americas
New York, NY
61 Broadway
New York, NY
350 Park Avenue
New York, NY
North Carolina
4611 Sharon Road
Charlotte, NC
Ohio
3805 Edwards Road
Cincinnati, OH
28699 Chagrin Boulevard
Woodmere Village, OH
1324 Polaris Parkway
Columbus, OH
Oregon
16850 SW 72nd Avenue
Tigard, OR
Pennsylvania
600 West DeKalb Pike
King of Prussia, PA
1735 Market Street
Philadelphia, PA
12001 Perry Highway
Wexford, PA
Rhode Island
47 Providence Place
Providence, RI
Tennessee
6150 Poplar Avenue
Memphis, TN
Texas
10000 Research Boulevard
Austin, TX
4017 Northwest Parkway
Dallas, TX
12532 Memorial Drive
Houston, TX
2701 Drexel Drive
Houston, TX
400 East Las Colinas Blvd.
Irving, TX
14100 San Pedro
San Antonio, TX
19740 IH 45 North
Spring, TX
6005 West Park Boulevard
Plano, TX
Annual Report
Utah
215 South State Street
Salt Lake City, UT
Virginia
1861 International Drive
McLean, VA
Washington
411 108th Avenue, N.E.
Bellevue, WA
1518 6th Avenue
Seattle, WA
Washington, DC
1900 K Street, N.W.
Washington, DC
Wisconsin
595 North Barker Road
Brookfield, WI
Fidelity Brokerage Services, Inc., 100 Summer St., Boston, MA 02110 Member NYSE/SIPC
Annual Report
Annual Report
Annual Report
Investment Adviser
Fidelity Management & Research Company
Boston, MA
Investment Sub-Adviser
Fidelity Investments Money
Management Inc.
Fidelity International
Investment Advisors
Fidelity International
Investment Advisors (U.K.) Limited
General Distributor
Fidelity Distributors Corporation
Boston, MA
Transfer and Shareholder
Servicing Agents
Citibank, N.A.
New York, NY
Fidelity Service Company, Inc.
Boston, MA
Custodian
Citibank, N.A.
New York, NY
Fidelity's Municipal Bond Funds
Spartan® Arizona Municipal Income
Spartan California Municipal Income
Spartan Connecticut Municipal Income
Spartan Florida Municipal Income
Spartan Intermediate Municipal Income
Spartan Maryland Municipal Income
Spartan Massachusetts Municipal Income
Spartan Michigan Municipal Income
Spartan Minnesota Municipal Income
Spartan Municipal Income
Spartan New Jersey Municipal Income
Spartan New York Municipal Income
Spartan Ohio Municipal Income
Spartan Pennsylvania Municipal Income
Spartan Short-Intermediate
Municipal Income
Spartan Tax-Free Bond
MNF-UANN-0204
1.787738.100
The Fidelity Telephone Connection
Mutual Fund 24-Hour Service
Exchanges/Redemptions
and Account Assistance 1-800-544-6666
Product Information 1-800-544-6666
Retirement Accounts 1-800-544-4774 (8 a.m. - 9 p.m.)
TDD Service 1-800-544-0118
for the deaf and hearing impaired
(9 a.m. - 9 p.m. Eastern time)
Fidelity Automated Service
Telephone (FAST®) (automated graphic) 1-800-544-5555
(automated graphic) Automated line for quickest service
(Fidelity Investment logo)(registered trademark)
Corporate Headquarters
82 Devonshire St., Boston, MA 02109
www.fidelity.com
Spartan®
Municipal Income
Fund
Annual Report
December 31, 2003
(2_fidelity_logos) (Registered_Trademark)
Contents
Chairman's Message | <Click Here> | Ned Johnson's message to shareholders. |
Performance | <Click Here> | How the fund has done over time. |
Management's Discussion | <Click Here> | The manager's review of fund performance, strategy and outlook. |
Investment Changes | <Click Here> | A summary of major shifts in the fund's investments over the past six months. |
Investments | <Click Here> | A complete list of the fund's investments with their market values. |
Financial Statements | <Click Here> | Statements of assets and liabilities, operations, and changes in net assets,
as well as financial highlights. |
Notes | <Click Here> | Notes to the financial statements. |
Auditors' Opinion | <Click Here> | |
Trustees and Officers | <Click Here> | |
Distributions | <Click Here> | |
For a free copy of the fund's proxy voting guidelines visit www.fidelity.com/goto/proxyguidelines, call 1-800-544-8544, or visit the Securities and Exchange Commission (SEC)'s web site at www.sec.gov.
Standard & Poor's, S&P and S&P 500 are registered service marks of The McGraw-Hill Companies, Inc. and have been licensed for use by Fidelity Distributors Corporation.
Other third party marks appearing herein are the property of their respective owners.
All other marks appearing herein are registered or unregistered trademarks or service marks of FMR Corp. or an affiliated company.
(Recycle graphic) This report is printed on recycled paper using soy-based inks.
This report and the financial statements contained herein are submitted for the general information of the shareholders of the fund. This report is not authorized for distribution to prospective investors in the fund unless preceded or accompanied by an effective prospectus.
Mutual fund shares are not deposits or obligations of, or guaranteed by, any depository institution. Shares are not insured by the FDIC, Federal Reserve Board or any other agency, and are subject to investment risks, including possible loss of principal amount invested.
Neither the fund nor Fidelity Distributors Corporation is a bank.
For more information on any Fidelity fund, including charges and expenses, call 1-800-544-6666 for a free prospectus. Read it carefully before you invest or send money.
Annual Report
Chairman's Message
(photo_of_Edward_C_Johnson_3d)
Dear Shareholder:
Many of you have read or heard news stories recently that were critical of mutual funds and made allegations that the mutual fund industry has been less than forthright. I find these reports unsettling and not necessarily an accurate picture of the overall industry, and I would like you to know where we at Fidelity stand.
With specific regard to allegations that certain mutual fund companies were violating the Securities and Exchange Commission's forward pricing rules or were involved in so-called "market timing" activities, I want to say two things:
First, Fidelity does not have agreements that permit customers who buy fund shares after 4 p.m. to obtain the 4 p.m. price. This is not to say that someone could not deceive the company through fraudulent acts. But I underscore that we have no so-called "agreements" which would permit this illegal practice.
Second, Fidelity has been on record for years opposing predatory short-term trading which adversely affects other shareholders in a mutual fund. In fact, in the 1980s, we began charging a fee - which is returned to the fund and, therefore, to investors - to discourage this activity. What's more, several years ago we took the industry lead in developing a Fair Value Pricing Policy to prevent market timing on foreign securities in our funds. It is reasonable to assume that another structure can be developed that would alter the system to make it much more difficult for predatory traders to operate. This, however, will only be achieved through close cooperation among regulators, legislators and the industry.
Certainly no industry is perfect, and there have been instances of unethical and illegal activity from time to time within the mutual fund industry. When this occurs, confessed or convicted offenders should be dealt with appropriately. Clearly, every system can be improved. We applaud well thought out improvements by regulators, legislators and industry representatives that achieve the common goal of building and protecting the value of investors' holdings. But we remain concerned about the risk of over-regulation and the quick application of simplistic solutions to intricate problems.
For more than 57 years, Fidelity Investments has worked very hard to improve its products and service to justify your trust. When our family founded this company in 1946, we had only a few hundred customers. Many of them were family and friends. Today, we serve more than 18 million customers including individual investors and participants in retirement plans across America.
Let me close by saying that we do not take your trust in us for granted, and we realize that we must always work to improve all aspects of our service to you. In turn, we urge you to continue your active participation with your financial matters, so that your interests can be well served.
Best regards,
/s/Edward C. Johnson 3d
Edward C. Johnson 3d
Annual Report
Performance: The Bottom Line
Average annual total return reflects the change in the value of an investment, assuming reinvestment of the fund's dividend income and capital gains (the profits earned upon the sale of securities that have grown in value) and assuming a constant rate of performance each year. The $10,000 table and the fund's returns do not reflect the deduction of taxes that a shareholder would pay on fund distributions or the redemption of fund shares. During periods of reimbursement by Fidelity, a fund's total return will be greater than it would be had the reimbursement not occurred. How a fund did yesterday is no guarantee of how it will do tomorrow.
Average Annual Total Returns
Periods ended December 31, 2003 | Past 1
year | Past 5
years | Past 10
years |
Spartan® Municipal Income Fund | 5.80% | 6.09% | 5.80% |
$10,000 Over 10 Years
Let's say, hypothetically, that $10,000 was invested in Spartan® Municipal Income Fund on December 31, 1993. The chart shows how the value of your investment would have grown, and also shows how the Lehman Brothers® Municipal Bond Index did over the same period.
Annual Report
Management's Discussion of Fund Performance
Comments from Christine Thompson, Portfolio Manager of Spartan® Municipal Income Fund:
While most of the year favored riskier assets, tax-exempt municipal bonds put up solid numbers for the 12 months ending December 31, 2003. In that time, the Lehman Brothers® Municipal Bond Index - a performance measure of about 40,000 investment-grade, fixed-rate, tax-exempt bonds - advanced 5.31%. For munis, it was the fourth straight year of returns in excess of 5%. Munis had an excellent year relative to taxable investment-grade bonds. The Lehman Brothers Aggregate Bond Index, a proxy for the taxable, investment-grade bond market, gained 4.10% in 2003, a full percentage point less than the muni index - a gap made even wider considering muni bonds' tax-equivalent yield advantage. What's more, on a three- and five-year basis, the Lehman Brothers muni index's cumulative return is well above that of most stock market benchmarks. Munis fared well for much of the year against a backdrop of low interest rates and virtually non-existent inflation. Although they stumbled in mid-summer against a brighter economic forecast, munis rebounded later on the heels of strong investor demand and the Federal Reserve Board's accommodative monetary policy.
Spartan Municipal Income Fund returned 5.80% during 2003, outpacing the 4.75% return for the fund's peer group - the LipperSM General Municipal Debt Funds Average - and the 5.68% return of the fund's benchmark - the Lehman Brothers 3 Plus Year Municipal Bond Index. The fund's outperformance stemmed from good security and sector selection. Its overweighting of strong-performing hospital bonds, coupled with its emphasis on securities in the sector that performed particularly well, worked in the fund's favor during the year. Additionally, an overweighting in bonds backed by fees and revenues rather than taxes also helped, as these securities outpaced bonds backed by economically sensitive taxes throughout much of the period. The fund also benefited from underweighting state-issued bonds - particularly those in California and New York - which came under pressure due to fiscal challenges faced at the state level. The fund's underweighting in par bonds, which sell at face value, detracted from the fund's performance. These bonds were in strong demand by retail investors at times, helping them to outpace premium and discount bonds, which sell above and below face value, respectively.
The views expressed in this statement reflect those of the portfolio manager only through the end of the period of the report as stated on the cover and do not necessarily represent the views of Fidelity or any other person in the Fidelity organization. Any such views are subject to change at any time based upon market or other conditions and Fidelity disclaims any responsibility to update such views. These views may not be relied on as investment advice and, because investment decisions for a Fidelity fund are based on numerous factors, may not be relied on as an indication of trading intent on behalf of any Fidelity fund.
Annual Report
Investment Changes
Top Five States as of December 31, 2003 |
| % of fund's
net assets | % of fund's net assets
6 months ago |
Illinois | 15.5 | 15.8 |
Texas | 14.0 | 14.0 |
New York | 10.6 | 10.5 |
Massachusetts | 7.5 | 7.6 |
California | 7.5 | 5.7 |
Top Five Sectors as of December 31, 2003 |
| % of fund's
net assets | % of fund's net assets
6 months ago |
General Obligations | 33.5 | 30.9 |
Electric Utilities | 16.4 | 17.7 |
Health Care | 11.3 | 12.2 |
Transportation | 10.5 | 9.8 |
Water & Sewer | 9.4 | 10.1 |
Average Years to Maturity as of December 31, 2003 |
| | 6 months ago |
Years | 15.3 | 15.2 |
Average years to maturity is based on the average time remaining until principal payments are expected from each of the fund's bonds, weighted by dollar amount. |
Duration as of December 31, 2003 |
| | 6 months ago |
Years | 7.5 | 7.3 |
Duration shows how much a bond fund's price fluctuates with changes in comparable interest rates. If rates rise 1%, for example, a fund with a five-year duration is likely to lose about 5% of its value. Other factors also can influence a bond fund's performance and share price. Accordingly, a bond fund's actual performance may differ from this example. |
Quality Diversification (% of fund's net assets) |
As of December 31, 2003 | As of June 30, 2003 |
| AAA 67.7% | | | AAA 66.3% | |
| AA,A 24.3% | | | AA,A 26.2% | |
| BBB 7.3% | | | BBB 7.2% | |
 | BB and Below 0.0% | | | BB and Below 0.1% | |
| Not Rated 0.4% | | | Not Rated 1.5% | |
| Short-Term
Investments and
Net Other Assets 0.3% | |  | Short-Term
Investments and
Net Other Assets* (1.3)% | |

We have used ratings from Moody's® Investors Services, Inc. Where Moody's ratings are not available, we have used S&P® ratings. |
*Short-Term Investments and Net Other Assets are not included in the pie chart.
Annual Report
Investments December 31, 2003
Showing Percentage of Net Assets
Municipal Bonds - 99.7% |
| Principal
Amount (000s) | | Value (Note 1)
(000s) |
Alabama - 0.4% |
Alabama Pub. School & College Auth. Rev. Series 1999 C, 5.75% 7/1/18 | | $ 2,000 | | $ 2,264 |
Cullman Med. Park South Med. Clinic Board Rev. (Cullman Reg'l. Med. Ctr. Proj.) Series A, 6.5% 2/15/23 | | 4,000 | | 4,029 |
Jefferson County Swr. Rev.: | | | | |
Series 1997 D, 5.7% 2/1/18 (Pre-Refunded to 8/1/12 @ 100) (i) | | 100 | | 112 |
Series 1999 A, 5.125% 2/1/39 (Pre-Refunded to 2/1/09 @ 101) (i) | | 3,885 | | 4,382 |
Series A: | | | | |
5% 2/1/33 (Pre-Refunded to 2/1/09 @ 101) (i) | | 2,375 | | 2,665 |
5% 2/1/33 (Pre-Refunded to 2/1/09 @ 101) (i) | | 4,900 | | 5,523 |
5% 2/1/41 (Pre-Refunded to 2/1/11 @ 101) (i) | | 1,495 | | 1,696 |
| | 20,671 |
Alaska - 0.2% |
North Slope Borough Gen. Oblig. Series 2000 B, 0% 6/30/09 (MBIA Insured) | | 10,000 | | 8,385 |
Arizona - 0.9% |
Arizona Student Ln. Acquisition Auth. Student Ln. Rev. Sr. Series A1, 5.9% 5/1/24 (h) | | 2,000 | | 2,111 |
Maricopa County Cmnty. College District Series B, 5.25% 7/1/10 | | 17,000 | | 18,696 |
Maricopa County Hosp. Rev. (Sun Health Corp. Proj.): | | | | |
5.4% 4/1/05 | | 2,935 | | 3,043 |
5.65% 4/1/06 | | 3,625 | | 3,834 |
Maricopa County Indl. Dev. Auth. Hosp. Facilities Rev. (Samaritan Health Svcs. Proj.) Series A, 7% 12/1/16 (Escrowed to Maturity) (i) | | 2,000 | | 2,601 |
Scottsdale Indl. Dev. Auth. Hosp. Rev. (Scottsdale Health Care Proj.) 5.8% 12/1/31 | | 3,250 | | 3,382 |
Tucson Gen. Oblig. Series 2002, 5% 7/1/10 | | 2,645 | | 2,960 |
Tucson Street & Hwy. User Rev. 4.5% 7/1/10 (AMBAC Insured) | | 1,930 | | 2,114 |
Yavapai County Indl. Dev. Auth. Solid Waste Disp. Rev. (Waste Mgmt., Inc. Proj.) 4.625%, tender 6/1/05 (e)(h) | | 5,500 | | 5,697 |
| | 44,438 |
Municipal Bonds - continued |
| Principal
Amount (000s) | | Value (Note 1)
(000s) |
Arkansas - 0.2% |
Little Rock School District Series 2001 C, 5.25% 2/1/33 (FSA Insured) | | $ 6,500 | | $ 6,760 |
North Little Rock Elec. Rev. Series A, 6.5% 7/1/10 (MBIA Insured) | | 3,840 | | 4,580 |
| | 11,340 |
California - 7.5% |
ABC Unified School District 0% 8/1/28 (FGIC Insured) | | 3,925 | | 1,073 |
Brea Redev. Agcy. 0% 8/1/29 (AMBAC Insured) | | 7,715 | | 1,995 |
Cabrillo Unified School District Series A, 0% 8/1/20 (AMBAC Insured) | | 4,275 | | 1,929 |
California Dept. of Wtr. Resources Pwr. Supply Rev.: | | | | |
Series 2002 A, 5.75% 5/1/17 | | 4,900 | | 5,413 |
Series A: | | | | |
5.25% 5/1/09 (MBIA Insured) | | 7,900 | | 8,945 |
5.25% 5/1/10 (MBIA Insured) | | 22,800 | | 25,802 |
5.5% 5/1/15 (AMBAC Insured) | | 8,800 | | 9,915 |
5.875% 5/1/16 | | 7,500 | | 8,406 |
6% 5/1/15 | | 9,300 | | 10,589 |
California Edl. Facilities Auth. Rev. (Loyola Marymount Univ. Proj.): | | | | |
0% 10/1/16 (MBIA Insured) | | 2,140 | | 1,217 |
0% 10/1/17 (MBIA Insured) | | 2,050 | | 1,101 |
0% 10/1/18 (MBIA Insured) | | 1,675 | | 847 |
0% 10/1/22 (MBIA Insured) | | 5,000 | | 1,953 |
0% 10/1/23 (MBIA Insured) | | 3,240 | | 1,188 |
California Gen. Oblig.: | | | | |
Series 1999, 5.75% 12/1/12 (FGIC Insured) | | 5,000 | | 5,760 |
4.5% 2/1/09 | | 5,825 | | 6,153 |
5% 2/1/09 | | 1,435 | | 1,549 |
5% 2/1/11 | | 8,000 | | 8,606 |
5.125% 9/1/12 | | 2,000 | | 2,126 |
5.25% 2/1/11 | | 1,000 | | 1,091 |
5.25% 2/1/14 | | 7,600 | | 8,183 |
5.25% 2/1/15 | | 10,000 | | 10,645 |
5.25% 2/1/15 | | 8,300 | | 8,836 |
5.25% 2/1/16 | | 4,300 | | 4,536 |
5.25% 2/1/19 | | 5,620 | | 5,809 |
5.25% 2/1/20 | | 4,000 | | 4,113 |
5.25% 2/1/22 | | 16,700 | | 16,968 |
5.5% 2/1/12 | | 8,000 | | 8,810 |
5.5% 3/1/12 | | 2,000 | | 2,189 |
Municipal Bonds - continued |
| Principal
Amount (000s) | | Value (Note 1)
(000s) |
California - continued |
California Gen. Oblig.: - continued | | | | |
5.5% 11/1/33 | | $ 7,900 | | $ 8,082 |
5.75% 12/1/24 | | 4,000 | | 4,211 |
California Hsg. Fin. Agcy. Home Mtg. Rev.: | | | | |
Series 1983 A, 0% 2/1/15 | | 187 | | 65 |
Series B, 5.2% 8/1/26 (MBIA Insured) (h) | | 690 | | 691 |
Series G: | | | | |
5.9% 2/1/09 (MBIA Insured) (h) | | 1,000 | | 1,051 |
5.9% 8/1/09 (MBIA Insured) (h) | | 2,000 | | 2,101 |
California Pub. Works Board Lease Rev. (Various California State Univ. Projs.) Series A, 5.25% 12/1/13 | | 5,000 | | 5,119 |
California State Univ. Rev. & Colleges Series 1999 AY, 5.875% 11/1/30 (FGIC Insured) | | 9,775 | | 10,902 |
Compton Cmnty. Redev. Agcy. (Tax Allocation-Compton Redev. Proj.) Series A, 6.5% 8/1/13 (FSA Insured) | | 4,000 | | 4,382 |
Encinitas Union School District 0% 8/1/20 (MBIA Insured) | | 3,500 | | 1,580 |
Foothill/Eastern Trans. Corridor Agcy. Toll Road Rev.: | | | | |
Series A, 5% 1/1/35 (MBIA Insured) | | 5,070 | | 5,169 |
0% 1/15/27 (b) | | 2,500 | | 1,868 |
5% 1/15/16 (MBIA Insured) | | 2,800 | | 3,000 |
5.75% 1/15/40 | | 6,300 | | 6,459 |
Golden State Tobacco Securitization Corp.: | | | | |
Series 2003 A1: | | | | |
5% 6/1/21 | | 2,000 | | 1,988 |
6.75% 6/1/39 | | 8,800 | | 8,672 |
Series 2003 B: | | | | |
5% 6/1/08 | | 1,400 | | 1,496 |
5% 6/1/10 | | 2,000 | | 2,142 |
5% 6/1/12 | | 2,255 | | 2,375 |
5.75% 6/1/21 | | 10,000 | | 10,453 |
5.75% 6/1/23 | | 3,400 | | 3,537 |
Long Beach Hbr. Rev. 5.125% 5/15/18 (h) | | 5,000 | | 5,067 |
Los Angeles Dept. of Wtr. & Pwr. Wtrwks. Rev. Series 2001 A, 5.125% 7/1/41 | | 5,000 | | 5,079 |
Los Angeles Hbr. Dept. Rev. Series A: | | | | |
5.5% 8/1/08 (AMBAC Insured) (h) | | 5,000 | | 5,612 |
5.5% 8/1/09 (AMBAC Insured) (h) | | 5,275 | | 5,969 |
Los Angeles Unified School District: | | | | |
Series A: | | | | |
5.375% 7/1/18 (MBIA Insured) | | 14,600 | | 16,227 |
Municipal Bonds - continued |
| Principal
Amount (000s) | | Value (Note 1)
(000s) |
California - continued |
Los Angeles Unified School District: - continued | | | | |
Series A: | | | | |
5.5% 7/1/15 (MBIA Insured) | | $ 4,210 | | $ 4,808 |
Series F, 5% 7/1/18 (FSA Insured) | | 10,000 | | 10,738 |
Manhattan Beach Unified School District 0% 9/1/26 (FGIC Insured) | | 6,385 | | 1,939 |
Modesto Irrigation District Elec. Rev. Series A, 9.625% 1/1/11 (Escrowed to Maturity) (i) | | 3,800 | | 4,826 |
Monrovia Unified School District Series B, 0% 8/1/29 (FGIC Insured) | | 4,525 | | 1,170 |
Placer County Wtr. Agcy. Rev. (Middle Fork Proj.)
Series A: | | | | |
3.75% 7/1/12 | | 7,820 | | 7,825 |
3.75% 1/1/13 | | 1,500 | | 1,424 |
Sacramento Cogeneration Auth. Cogeneration Proj. Rev. (Procter & Gamble Proj.) 6.375% 7/1/10 | | 700 | | 752 |
Sacramento Pwr. Auth. Cogeneration Proj. Rev.: | | | | |
6.5% 7/1/07 | | 1,000 | | 1,104 |
6.5% 7/1/09 | | 2,200 | | 2,437 |
San Bruno Park School District Election of 1998 Series C, 0% 8/1/26 (FSA Insured) | | 3,745 | | 1,142 |
San Francisco City & County Arpts. Commission Int'l. Arpt. Rev.: | | | | |
Second Series Issue 10A, 5.55% 5/1/14 (MBIA Insured) (h) | | 5,875 | | 6,398 |
Second Series 27A, 5.5% 5/1/09 (MBIA Insured) (h) | | 4,330 | | 4,898 |
San Joaquin Hills Trans. Corridor Agcy. Toll Road Rev. Series A: | | | | |
0% 1/15/12 (MBIA Insured) | | 9,900 | | 7,279 |
0% 1/15/34 (MBIA Insured) | | 10,000 | | 2,025 |
San Mateo County Cmnty. College District Series A, 0% 9/1/26 (FGIC Insured) | | 5,430 | | 1,649 |
| | 359,458 |
Colorado - 1.0% |
Arapahoe County Cherry Creek School District #5 5.5% 12/15/19 | | 3,500 | | 3,882 |
Colorado Health Facilities Auth. Rev.: | | | | |
Series 2001: | | | | |
6.5% 11/15/31 | | 5,040 | | 5,517 |
6.625% 11/15/26 | | 2,700 | | 2,981 |
6.25% 2/1/04 | | 500 | | 501 |
Colorado Springs Arpt. Rev. Series C: | | | | |
0% 1/1/06 (MBIA Insured) | | 250 | | 240 |
Municipal Bonds - continued |
| Principal
Amount (000s) | | Value (Note 1)
(000s) |
Colorado - continued |
Colorado Springs Arpt. Rev. Series C: - continued | | | | |
0% 1/1/09 (MBIA Insured) | | $ 1,655 | | $ 1,402 |
0% 1/1/10 (MBIA Insured) | | 1,500 | | 1,213 |
Denver City & County Arpt. Rev.: | | | | |
Series A, 0% 11/15/05 (MBIA Insured) (h) | | 4,480 | | 4,305 |
Series D, 0% 11/15/05 (MBIA Insured) (h) | | 3,000 | | 2,883 |
E-470 Pub. Hwy. Auth. Rev. Series 2000 A, 5.75% 9/1/29 (MBIA Insured) | | 10,000 | | 11,235 |
El Paso County School District #20 Series A, 0% 6/15/08 (AMBAC Insured) | | 2,600 | | 2,282 |
Highlands Ranch Metro. District #2 6.5% 6/15/10 (FSA Insured) | | 1,000 | | 1,214 |
Larimer County School District #R1 Poudre 5.5% 12/15/23 (MBIA Insured) | | 3,500 | | 3,841 |
Longmont Sales & Use Tax Rev. 5.7% 11/15/18 (FGIC Insured) | | 2,280 | | 2,581 |
Thornton County Gen. Oblig. 0% 12/1/08 (FGIC Insured) | | 5,000 | | 4,319 |
| | 48,396 |
Connecticut - 0.1% |
Connecticut Gen. Oblig. Series D, 5.375% 11/15/18 | | 4,000 | | 4,468 |
Eastern Connecticut Resources Recovery Auth. Solid Waste Rev. (Wheelabrator Lisbon Proj.) Series A, 5% 1/1/04 (h) | | 900 | | 900 |
| | 5,368 |
District Of Columbia - 1.3% |
District of Columbia Gen. Oblig.: | | | | |
Series 1998 A, 5.25% 6/1/27 (MBIA Insured) | | 17,330 | | 17,838 |
Series 2001 E: | | | | |
5% 6/1/04 (Escrowed to Maturity) (i) | | 900 | | 914 |
5% 6/1/04 (FGIC Insured) | | 65 | | 66 |
District of Columbia Rev.: | | | | |
(American Assoc. of Advancement in Science Proj.) 5.125% 1/1/27 (AMBAC Insured) | | 9,250 | | 9,417 |
(George Washington Univ. Proj.) Series A, 5.75% 9/15/20 (MBIA Insured) | | 12,600 | | 14,229 |
(Georgetown Univ. Proj.) Series A: | | | | |
5.95% 4/1/14 (MBIA Insured) | | 2,000 | | 2,290 |
6% 4/1/18 (MBIA Insured) | | 13,835 | | 15,850 |
| | 60,604 |
Municipal Bonds - continued |
| Principal
Amount (000s) | | Value (Note 1)
(000s) |
Florida - 2.7% |
Boynton Beach Util. Sys. Rev. 5.5% 11/1/19 (FGIC Insured) | | $ 3,300 | | $ 3,780 |
Dade County Aviation Rev. (Miami Int'l. Arpt. Proj.) Series B, 6% 10/1/24 (MBIA Insured) (h) | | 3,750 | | 3,998 |
Florida Board of Ed. Lottery Rev. Series B, 6% 7/1/15 (FGIC Insured) | | 3,300 | | 3,873 |
Florida Tpk. Auth. Tpk. Rev. Series B, 5% 7/1/11 (AMBAC Insured) | | 4,385 | | 4,911 |
Highlands County Health Facilities Auth. Rev. (Adventist Health Sys./Sunbelt Proj.): | | | | |
3.35%, tender 9/1/05 (e) | | 17,300 | | 17,700 |
5.25% 11/15/12 | | 3,935 | | 4,180 |
5.25% 11/15/13 | | 3,140 | | 3,317 |
Jacksonville Elec. Auth. Rev.: | | | | |
(Saint Johns River Proj.) Series 13 Issue 2, 5.375% 10/1/16 | | 4,535 | | 4,894 |
(Third Installment Proj.) Series 73, 6.8% 7/1/12 (Escrowed to Maturity) (i) | | 2,695 | | 3,187 |
Jacksonville Health Facilities Auth. Indl. Dev. Rev. (Cypress Village/Nat'l. Benevolent Assoc. Proj.) 7% 12/1/22 (a) | | 2,000 | | 995 |
Jacksonville Port Auth. Rev.: | | | | |
5.5% 11/1/06 (MBIA Insured) (h) | | 4,140 | | 4,415 |
5.75% 11/1/09 (MBIA Insured) (h) | | 1,000 | | 1,115 |
Miami-Dade County Edl. Facilities Auth. Rev. 5.75% 4/1/29 (AMBAC Insured) | | 5,000 | | 5,573 |
Miami-Dade County School Board Ctfs. of Prtn. 5%, tender 5/1/11 (MBIA Insured) (e) | | 3,600 | | 3,985 |
Palm Beach County School Board Ctfs. of Prtn. Series A: | | | | |
5.5% 8/1/21 (AMBAC Insured) | | 6,135 | | 6,764 |
5.5% 8/1/22 (AMBAC Insured) | | 8,210 | | 9,030 |
Pasco County Solid Waste Disp. & Resource Recovery Sys. Rev.: | | | | |
6% 4/1/08 (AMBAC Insured) (h) | | 5,000 | | 5,546 |
6% 4/1/09 (AMBAC Insured) (h) | | 8,090 | | 9,056 |
Reedy Creek Impt. District Utils. Rev. Series 2: | | | | |
5% 10/1/08 (MBIA Insured) (c) | | 1,945 | | 2,169 |
5% 10/1/09 (MBIA Insured) (c) | | 2,035 | | 2,284 |
5.25% 10/1/11 (MBIA Insured) (c) | | 4,605 | | 5,252 |
5.25% 10/1/12 (MBIA Insured) (c) | | 15,375 | | 17,539 |
Municipal Bonds - continued |
| Principal
Amount (000s) | | Value (Note 1)
(000s) |
Florida - continued |
South Broward Hosp. District Rev. 5.625% 5/1/32 (MBIA Insured) | | $ 2,630 | | $ 2,827 |
Tampa Wtr. & Swr. Rev. 6% 10/1/17 (FSA Insured) | | 1,000 | | 1,218 |
| | 127,608 |
Georgia - 1.1% |
Atlanta & Fulton County Resource Auth. Rev. (Downtown Area Pub. Impt. Proj.) Series A, 5.375% 12/1/21 (MBIA Insured) | | 6,000 | | 6,422 |
College Park Bus. & Indl. Dev. Auth. Civic Ctr. Proj. Rev. Series 2000, 5.75% 9/1/20 (AMBAC Insured) | | 5,200 | | 5,975 |
Fulton County Wtr. & Swr. Rev. 6.375% 1/1/14 (FGIC Insured) | | 140 | | 169 |
Fulton DeKalb Hosp. Auth. Hosp. Rev.: | | | | |
5% 1/1/09 (FSA Insured) | | 3,100 | | 3,434 |
5% 1/1/11 (FSA Insured) | | 3,100 | | 3,464 |
Gainesville & Hall County Hosp. Auth. Rev. Anticipation Ctfs. (Northeast Georgia Health Sys., Inc. Proj.) 5.5% 5/15/31 | | 4,500 | | 4,534 |
Georgia Gen. Oblig. Series D, 5.8% 11/1/13 | | 15,350 | | 18,039 |
Georgia Muni. Elec. Auth. Pwr. Rev. Series B, 6.2% 1/1/10 (AMBAC Insured) | | 5,000 | | 5,922 |
Henry County Wtr. & Swr. Auth. Rev. 5% 2/1/12 (MBIA Insured) | | 1,330 | | 1,492 |
Private Colleges & Univs. Auth. Rev. (Emory Univ. Proj.) Series A, 5.5% 11/1/24 | | 5,000 | | 5,419 |
| | 54,870 |
Hawaii - 0.8% |
Hawaii Arpts. Sys. Rev.: | | | | |
Series 2000 A, 5.75% 7/1/21 (FGIC Insured) | | 2,640 | | 2,940 |
Series 2000 B, 8% 7/1/11 (FGIC Insured) (h) | | 9,250 | | 11,791 |
Hawaii Gen. Oblig.: | | | | |
Series CN, 5.25% 3/1/12 (FGIC Insured) | | 17,300 | | 19,036 |
Series CU, 5.75% 10/1/12 (MBIA Insured) | | 2,130 | | 2,432 |
Maui County Gen. Oblig. 5% 9/1/10 (MBIA Insured) | | 3,425 | | 3,857 |
| | 40,056 |
Idaho - 0.2% |
Boise City Urban Renewal Agcy. Lease Rev. 5.9% 8/15/29 (AMBAC Insured) | | 6,950 | | 7,784 |
Municipal Bonds - continued |
| Principal
Amount (000s) | | Value (Note 1)
(000s) |
Illinois - 15.5% |
Chicago Board of Ed.: | | | | |
Series A: | | | | |
0% 12/1/14 (FGIC Insured) | | $ 4,800 | | $ 3,029 |
0% 12/1/16 (FGIC Insured) | | 10,100 | | 5,632 |
0% 12/1/17 (FGIC Insured) | | 10,800 | | 5,679 |
5.5% 12/1/28 (MBIA Insured) | | 4,760 | | 5,153 |
5.5% 12/1/31 (FGIC Insured) | | 8,360 | | 9,000 |
5.75% 12/1/20 (AMBAC Insured) | | 4,880 | | 5,427 |
5.75% 12/1/27 (AMBAC Insured) | | 50,050 | | 54,997 |
Chicago Gen. Oblig.: | | | | |
(City Colleges Proj.): | | | | |
0% 1/1/14 (FGIC Insured) | | 17,000 | | 11,149 |
0% 1/1/15 (FGIC Insured) | | 20,000 | | 12,347 |
0% 1/1/26 (FGIC Insured) | | 16,000 | | 4,992 |
0% 1/1/28 (FGIC Insured) | | 23,555 | | 6,594 |
0% 1/1/30 (FGIC Insured) | | 15,335 | | 3,840 |
(Neighborhoods Alive 21 Prog.): | | | | |
Series 2000 A, 6% 1/1/28 (FGIC Insured) | | 8,400 | | 9,550 |
Series A, 5.75% 1/1/40 (FGIC Insured) | | 18,500 | | 20,453 |
Series 1993, 5.25% 1/1/18 (FGIC Insured) | | 7,200 | | 7,344 |
Series 2000 C, 5.5% 1/1/40 (FGIC Insured) | | 14,750 | | 15,750 |
Series 2000 D, 5.5% 1/1/35 (FGIC Insured) | | 15,000 | | 15,981 |
Series A: | | | | |
5% 1/1/42 (AMBAC Insured) | | 18,955 | | 19,259 |
5.5% 1/1/38 (MBIA Insured) | | 15,000 | | 15,978 |
Series C, 5.7% 1/1/30 (FGIC Insured) | | 15,415 | | 17,018 |
Chicago Midway Arpt. Rev.: | | | | |
Series A, 5.5% 1/1/29 (MBIA Insured) | | 24,775 | | 25,981 |
Series B: | | | | |
5.25% 1/1/13 (MBIA Insured) (h) | | 2,910 | | 3,063 |
5.25% 1/1/14 (MBIA Insured) (h) | | 3,060 | | 3,217 |
6% 1/1/08 (MBIA Insured) (h) | | 2,170 | | 2,389 |
6% 1/1/10 (MBIA Insured) (h) | | 2,435 | | 2,693 |
6.125% 1/1/11 (MBIA Insured) (h) | | 2,580 | | 2,863 |
Chicago Motor Fuel Tax Rev. Series A, 5.25% 1/1/19 (AMBAC Insured) | | 1,780 | | 1,939 |
Chicago O'Hare Int'l. Arpt. Rev.: | | | | |
Series 1999, 5.5% 1/1/11 (AMBAC Insured) (h) | | 10,000 | | 11,078 |
Series A: | | | | |
5.5% 1/1/16 (AMBAC Insured) (h) | | 12,000 | | 12,768 |
5.6% 1/1/10 (AMBAC Insured) | | 4,500 | | 4,890 |
6.25% 1/1/09 (AMBAC Insured) (h) | | 6,730 | | 7,554 |
Municipal Bonds - continued |
| Principal
Amount (000s) | | Value (Note 1)
(000s) |
Illinois - continued |
Chicago O'Hare Int'l. Arpt. Rev.: - continued | | | | |
Series A: | | | | |
6.375% 1/1/12 (MBIA Insured) | | $ 4,500 | | $ 4,792 |
6.375% 1/1/15 (MBIA Insured) | | 14,900 | | 15,853 |
Series B, 5.75% 1/1/30 (AMBAC Insured) | | 13,420 | | 14,692 |
Chicago Park District Series A: | | | | |
5.25% 1/1/18 (FGIC Insured) | | 4,690 | | 5,151 |
5.25% 1/1/19 (FGIC Insured) | | 3,000 | | 3,268 |
5.25% 1/1/20 (FGIC Insured) | | 2,195 | | 2,376 |
Chicago Transit Auth. Cap. Grant Receipts Rev. (Douglas Branch Proj.) Series 2003 B, 5% 6/1/07 (AMBAC Insured) | | 9,950 | | 10,407 |
Chicago Wtr. Rev.: | | | | |
0% 11/1/16 (AMBAC Insured) | | 7,555 | | 4,229 |
5.25% 11/1/27 (FGIC Insured) | | 1,300 | | 1,349 |
Cicero Gen. Oblig. 5.25% 12/1/26 (MBIA Insured) | | 3,000 | | 3,157 |
City of Chicago Spl. Trans. Rev. Series 2001, 5.25% 1/1/31 (AMBAC Insured) | | 11,670 | | 12,150 |
Cook County Gen. Oblig.: | | | | |
Series C, 5.5% 11/15/26 (AMBAC Insured) | | 5,000 | | 5,363 |
0% 11/1/08 (Escrowed to Maturity) (i) | | 8,280 | | 7,266 |
0% 11/1/09 (Escrowed to Maturity) (i) | | 4,000 | | 3,364 |
DeKalb Single Family Mtg. Rev. Series A, 7.45% 12/1/09 (h) | | 5 | | 5 |
Evanston Gen. Oblig. Series C: | | | | |
5.25% 1/1/16 | | 1,000 | | 1,098 |
5.25% 1/1/22 | | 2,000 | | 2,123 |
Illinois Dev. Fin. Auth. Poll. Cont. Rev. (Commonwealth Edison Co. Proj.) Series D, 6.75% 3/1/15 (AMBAC Insured) | | 7,000 | | 7,546 |
Illinois Dev. Fin. Auth. Rev. (Revolving Fund-Master Trust Prog.): | | | | |
5.5% 9/1/18 | | 5,365 | | 5,958 |
5.5% 9/1/19 | | 4,405 | | 4,862 |
Illinois Edl. Facilities Auth. Revs. (DePaul Univ. Proj.) 5.5% 10/1/17 (AMBAC Insured) | | 1,800 | | 2,008 |
Illinois Gen. Oblig.: | | | | |
First Series: | | | | |
5.25% 12/1/17 (FSA Insured) | | 2,260 | | 2,478 |
5.25% 12/1/20 (FSA Insured) | | 2,000 | | 2,171 |
5.375% 7/1/15 (MBIA Insured) | | 3,700 | | 4,183 |
5.5% 8/1/16 (MBIA Insured) | | 13,000 | | 14,719 |
5.5% 8/1/17 (MBIA Insured) | | 7,500 | | 8,451 |
5.5% 2/1/18 (FGIC Insured) | | 1,000 | | 1,112 |
Municipal Bonds - continued |
| Principal
Amount (000s) | | Value (Note 1)
(000s) |
Illinois - continued |
Illinois Gen. Oblig.: - continued | | | | |
First Series: | | | | |
5.5% 8/1/18 (MBIA Insured) | | $ 5,000 | | $ 5,587 |
5.75% 12/1/18 (MBIA Insured) | | 1,200 | | 1,375 |
5.5% 4/1/17 (MBIA Insured) | | 7,065 | | 7,854 |
5.6% 4/1/21 (MBIA Insured) | | 7,500 | | 8,260 |
5.7% 4/1/16 (MBIA Insured) | | 7,350 | | 8,350 |
Illinois Health Facilities Auth. Rev.: | | | | |
(Condell Med. Ctr. Proj.): | | | | |
6.5% 5/15/30 | | 9,000 | | 9,515 |
7% 5/15/22 | | 5,000 | | 5,465 |
(Lake Forest Hosp. Proj.): | | | | |
Series A, 6.25% 7/1/22 | | 4,200 | | 4,552 |
6% 7/1/33 | | 3,775 | | 3,921 |
(Lutheran Gen. Health Care Sys. Proj.) Series C: | | | | |
6% 4/1/18 | | 3,000 | | 3,328 |
7% 4/1/14 | | 1,500 | | 1,816 |
(OSF Health Care Sys. Proj.) 6% 11/15/13 | | 7,000 | | 7,158 |
(Riverside Health Sys. Proj.) 6.85% 11/15/29 | | 5,025 | | 5,448 |
(Swedish American Hosp. Proj.): | | | | |
5.375% 11/15/13 (AMBAC Insured) | | 3,000 | | 3,075 |
6.875% 11/15/30 | | 6,980 | | 7,544 |
6.75% 2/15/15 | | 1,000 | | 1,134 |
Illinois Reg'l. Trans. Auth. Series A, 8% 6/1/17 (AMBAC Insured) | | 4,500 | | 6,132 |
Illinois Sales Tax Rev. 6% 6/15/20 | | 4,600 | | 5,304 |
Kane & DuPage Counties Cmnty. Unit School District #303 Saint Charles Series A: | | | | |
5.5% 1/1/15 (FSA Insured) | | 5,210 | | 5,905 |
5.5% 1/1/16 (FSA Insured) | | 5,680 | | 6,383 |
5.5% 1/1/17 (FSA Insured) | | 3,230 | | 3,606 |
Kane County School District #129 Aurora West Side: | | | | |
Series A: | | | | |
5.75% 2/1/17 (FGIC Insured) | | 3,455 | | 3,918 |
5.75% 2/1/20 (FGIC Insured) | | 7,360 | | 8,264 |
6% 2/1/23 (FGIC Insured) | | 1,335 | | 1,511 |
Kane, Cook, & Du Page Counties School District #46 Elgin 6.375% 1/1/18 (FSA Insured) | | 1,850 | | 2,185 |
Kane, McHenry, Cook & DeKalb Counties Cmnty. Unit School District #300 Carpentersville: | | | | |
5.5% 12/1/16 (MBIA Insured) | | 2,500 | | 2,812 |
5.5% 12/1/17 (MBIA Insured) | | 4,000 | | 4,481 |
Municipal Bonds - continued |
| Principal
Amount (000s) | | Value (Note 1)
(000s) |
Illinois - continued |
Lake County Cmnty. Consolidated School District #50 Woodland Series 2000 A, 6% 12/1/20 (FGIC Insured) | | $ 6,000 | | $ 6,869 |
Lake County Forest Preservation District 0% 12/1/08 | | 12,505 | | 10,817 |
McHenry County Conservation District Series A, 5.625% 2/1/21 (FGIC Insured) | | 5,730 | | 6,251 |
Metro. Pier & Exposition Auth. Dedicated State Tax Rev.: | | | | |
(McCormick Place Expansion Proj.): | | | | |
Series 2002 A: | | | | |
0% 12/15/32 (MBIA Insured) | | 15,000 | | 3,145 |
5.75% 6/15/41 (MBIA Insured) | | 9,800 | | 10,860 |
Series 2002 B, 0% 6/15/20 (MBIA Insured) (b) | | 2,000 | | 1,394 |
Series A: | | | | |
0% 6/15/08 (Escrowed to Maturity) (i) | | 3,335 | | 2,971 |
0% 6/15/08 (MBIA Insured) | | 3,820 | | 3,360 |
0% 6/15/11 (Escrowed to Maturity) (i) | | 6,000 | | 4,669 |
0% 6/15/15 (FGIC Insured) | | 15,000 | | 9,077 |
0% 6/15/31 (MBIA Insured) | | 13,300 | | 3,041 |
5.25% 12/15/10 (AMBAC Insured) | | 12,950 | | 14,326 |
6.65% 6/15/12 (FGIC Insured) | | 250 | | 256 |
Series 2002 A: | | | | |
0% 6/15/09 (Escrowed to Maturity) (i) | | 18,150 | | 15,518 |
0% 6/15/09 (FGIC Insured) | | 460 | | 386 |
Series 2002: | | | | |
0% 6/15/10 (Escrowed to Maturity) (i) | | 16,640 | | 13,432 |
0% 6/15/13 (Escrowed to Maturity) (i) | | 4,155 | | 2,931 |
0% 6/15/13 (FGIC Insured) | | 5,430 | | 3,698 |
Series A, 0% 6/15/09 (Escrowed to Maturity) (i) | | 2,325 | | 1,988 |
0% 6/15/10 (FGIC Insured) | | 360 | | 288 |
Moline Gen. Oblig. Series A, 5.5% 2/1/17 (FGIC Insured) | | 1,000 | | 1,117 |
Univ. of Illinois Auxiliary Facilities Sys. Rev.: | | | | |
Series A, 0% 4/1/21 (MBIA Insured) | | 4,965 | | 2,099 |
0% 4/1/17 (MBIA Insured) | | 16,270 | | 8,834 |
0% 4/1/20 (MBIA Insured) | | 8,000 | | 3,618 |
| | 743,566 |
Indiana - 0.7% |
Hamilton Southeastern Cumberland Campus School Bldg. Corp. 5.125% 1/15/23 (AMBAC Insured) | | 1,250 | | 1,299 |
Indiana Bond Bank Rev. Series B: | | | | |
5% 2/1/19 (MBIA Insured) | | 1,940 | | 2,062 |
Municipal Bonds - continued |
| Principal
Amount (000s) | | Value (Note 1)
(000s) |
Indiana - continued |
Indiana Bond Bank Rev. Series B: - continued | | | | |
5% 2/1/20 (MBIA Insured) | | $ 1,635 | | $ 1,726 |
Indiana Dev. Fin. Auth. Rev. 5.95% 8/1/30 (h) | | 7,350 | | 7,075 |
Indiana Health Facilities Fing. Auth. Hosp. Rev.: | | | | |
(Columbus Reg'l. Hosp. Proj.) 7% 8/15/15 (FSA Insured) | | 2,500 | | 3,158 |
5.5% 2/15/30 (MBIA Insured) | | 5,295 | | 5,672 |
Indianapolis Arpt. Auth. Rev. Series A, 5.6% 7/1/15 (FGIC Insured) | | 1,000 | | 1,095 |
Indianapolis Econ. Dev. Rev. (Nat'l. Benevolent Assoc. Proj.) 7.625% 10/1/22 (a) | | 3,000 | | 1,493 |
Petersburg Poll. Cont. Rev.: | | | | |
(Indianapolis Pwr. & Lt. Co. Proj.) 5.9% 12/1/24 (h) | | 10,000 | | 9,927 |
5.95% 12/1/29 (h) | | 2,000 | | 1,984 |
| | 35,491 |
Iowa - 0.7% |
Iowa Fin. Auth. Hosp. Facilities Rev.: | | | | |
5.875% 2/15/30 (AMBAC Insured) | | 15,000 | | 16,549 |
6.625% 2/15/12 | | 2,000 | | 2,287 |
6.75% 2/15/13 | | 1,000 | | 1,136 |
6.75% 2/15/14 | | 1,280 | | 1,446 |
6.75% 2/15/15 | | 1,000 | | 1,121 |
6.75% 2/15/17 | | 1,000 | | 1,104 |
Tobacco Settlement Auth. Tobacco Settlement Rev. 5.3% 6/1/25 | | 10,000 | | 8,662 |
| | 32,305 |
Kansas - 0.6% |
Burlington Envir. Impt. Rev. (Kansas City Pwr. & Lt. Co. Proj.) 4.75%, tender 10/1/07 (e) | | 7,800 | | 8,324 |
Kansas City Util. Sys. Rev.: | | | | |
0% 3/1/09 (Escrowed to Maturity) (i) | | 3,975 | | 3,427 |
0% 9/1/10 (AMBAC Insured) | | 2,865 | | 2,301 |
0% 9/1/10 (Escrowed to Maturity) (i) | | 3,825 | | 3,089 |
Kansas Dept. of Trans. Hwy. Rev. Series 2000 A, 5.75% 9/1/15 | | 4,800 | | 5,641 |
Kansas Dev. Fin. Auth. Health Facilities Rev. (Sisters of Charity Proj.) Series J, 6.25% 12/1/28 | | 4,500 | | 4,896 |
| | 27,678 |
Municipal Bonds - continued |
| Principal
Amount (000s) | | Value (Note 1)
(000s) |
Kentucky - 2.1% |
Jefferson County Cap. Projs. Corp. Rev. (Lease Prog.) Series A, 0% 8/15/11 | | $ 5,250 | | $ 3,968 |
Louisville & Jefferson County Metro. Swr. District Swr. & Drain Sys. Rev. Series A, 5.75% 5/15/33 (FGIC Insured) | | 65,000 | | 72,393 |
Louisville & Jefferson County Reg'l. Arpt. Auth. Arpt. Sys. Rev. Series 2001 A: | | | | |
5.25% 7/1/09 (FSA Insured) (h) | | 1,545 | | 1,710 |
5.5% 7/1/10 (FSA Insured) (h) | | 3,800 | | 4,259 |
Owensboro Elec. Lt. & Pwr. Rev. Series B: | | | | |
0% 1/1/07 (AMBAC Insured) | | 10,000 | | 9,348 |
0% 1/1/08 (AMBAC Insured) | | 600 | | 541 |
0% 1/1/09 (AMBAC Insured) | | 2,000 | | 1,718 |
0% 1/1/10 (AMBAC Insured) | | 7,440 | | 6,114 |
| | 100,051 |
Louisiana - 0.8% |
Louisiana Gas & Fuel Tax Rev. Series A, 5.375% 6/1/20 (AMBAC Insured) | | 3,000 | | 3,257 |
Monroe-West Monroe Pub. Trust Fing. Auth. Mtg. Rev. Series C, 0% 8/20/14 | | 9,000 | | 5,466 |
New Orleans Gen. Oblig.: | | | | |
0% 9/1/08 (AMBAC Insured) | | 10,000 | | 8,746 |
0% 9/1/09 (AMBAC Insured) | | 16,500 | | 13,723 |
0% 9/1/11 (AMBAC Insured) | | 3,665 | | 2,762 |
0% 9/1/14 (AMBAC Insured) | | 4,000 | | 2,572 |
| | 36,526 |
Maryland - 0.4% |
Maryland Cmnty. Dev. Administration Dept. of Hsg. & Cmnty. Dev. (Residential Proj.) Series B, 5.05% 9/1/19 (h) | | 970 | | 983 |
Maryland Health & Higher Edl. Facilities Auth. Rev.: | | | | |
(Good Samaritan Hosp. Proj.): | | | | |
5.75% 7/1/13 (Escrowed to Maturity) (i) | | 1,605 | | 1,869 |
5.75% 7/1/13 (Escrowed to Maturity) (i) | | 995 | | 1,159 |
(Univ. of Maryland Med. Sys. Proj.) 6.75% 7/1/30 | | 10,415 | | 11,854 |
Prince Georges County Solid Waste Mgmt. Sys. Rev. 5.25% 6/15/13 (FSA Insured) | | 1,500 | | 1,531 |
| | 17,396 |
Municipal Bonds - continued |
| Principal
Amount (000s) | | Value (Note 1)
(000s) |
Massachusetts - 7.5% |
Massachusetts Bay Trans. Auth.: | | | | |
Series 2000 A, 5.25% 7/1/30 | | $ 7,105 | | $ 7,409 |
Series A: | | | | |
5.375% 3/1/19 | | 15,000 | | 16,145 |
5.75% 3/1/26 | | 17,795 | | 19,696 |
Series B: | | | | |
5.25% 3/1/26 (FSA Insured) | | 14,850 | | 15,446 |
6.2% 3/1/16 | | 3,800 | | 4,588 |
Massachusetts Bay Trans. Auth. Sales Tax Rev. Series 2000 A, 5.5% 7/1/30 | | 17,500 | | 18,923 |
Massachusetts Ed. Ln. Auth. Ed. Ln. Rev.: | | | | |
Series A Issue E, 4.9% 7/1/13 (AMBAC Insured) (h) | | 4,705 | | 4,876 |
Series B Issue E: | | | | |
5.75% 7/1/05 (AMBAC Insured) (h) | | 1,280 | | 1,327 |
5.85% 7/1/06 (AMBAC Insured) (h) | | 1,525 | | 1,574 |
5.95% 7/1/07 (AMBAC Insured) (h) | | 1,650 | | 1,702 |
6.05% 7/1/08 (AMBAC Insured) (h) | | 1,700 | | 1,753 |
6.15% 7/1/10 (AMBAC Insured) (h) | | 680 | | 701 |
6.25% 7/1/11 (AMBAC Insured) (h) | | 400 | | 412 |
6.3% 7/1/12 (AMBAC Insured) (h) | | 415 | | 428 |
Massachusetts Fed. Hwy. Series 2000 A: | | | | |
5.75% 6/15/11 | | 10,000 | | 11,638 |
5.75% 6/15/12 | | 5,000 | | 5,711 |
5.75% 6/15/13 | | 5,000 | | 5,829 |
Massachusetts Gen. Oblig.: | | | | |
Series 2001 A, 5.5% 1/1/10 | | 7,500 | | 8,529 |
Series 2002 A, 7.5% 6/1/04 (Escrowed to Maturity) (i) | | 90 | | 92 |
Series D: | | | | |
5.25% 10/1/20 | | 3,000 | | 3,241 |
5.25% 10/1/21 | | 9,000 | | 9,618 |
Massachusetts Health & Edl. Facilities Auth. Rev.: | | | | |
(Blood Research Institute Proj.) Series A, 6.5% 2/1/22 | | 4,215 | | 4,264 |
(Massachusetts Gen. Hosp. Proj.) Series F, 6.25% 7/1/12 (AMBAC Insured) | | 2,000 | | 2,336 |
(New England Med. Ctr. Hosp. Proj.) Series G, 5.375% 7/1/24 (MBIA Insured) | | 3,800 | | 3,898 |
(South Shore Hosp. Proj.) Series F, 5.75% 7/1/29 | | 11,930 | | 12,280 |
(Tufts Univ. Proj.) Series I, 5.5% 2/15/36 | | 10,000 | | 10,596 |
(Univ. of Massachusetts Proj.) Series A, 5.875% 10/1/29 (FGIC Insured) | | 10,000 | | 11,307 |
(Wellesley College Proj.) Series F, 5.125% 7/1/39 | | 5,705 | | 5,835 |
Municipal Bonds - continued |
| Principal
Amount (000s) | | Value (Note 1)
(000s) |
Massachusetts - continued |
Massachusetts Hsg. Fin. Agcy. Hsg. Rev. (Rental Proj.) Series A: | | | | |
6.6% 7/1/14 (AMBAC Insured) (h) | | $ 2,190 | | $ 2,256 |
6.65% 7/1/19 (AMBAC Insured) (h) | | 1,760 | | 1,812 |
Massachusetts Indl. Fin. Agcy. Resource Recovery Rev. (Ogden Haverhill Proj.): | | | | |
Series 1992 A: | | | | |
4.8% 12/1/04 | | 3,750 | | 3,758 |
4.95% 12/1/06 | | 2,000 | | 1,988 |
Series A, 4.85% 12/1/05 | | 2,200 | | 2,197 |
Massachusetts Indl. Fin. Agcy. Rev. (Massachusetts Biomedical Research Corp. Proj.) Series A2: | | | | |
0% 8/1/06 | | 30,800 | | 29,057 |
0% 8/1/08 | | 5,000 | | 4,377 |
0% 8/1/09 | | 21,800 | | 18,130 |
0% 8/1/10 | | 2,000 | | 1,585 |
Massachusetts Muni. Wholesale Elec. Co. Pwr. Supply Sys. Rev. Series A, 5% 7/1/10 (Escrowed to Maturity) (i) | | 3,010 | | 3,086 |
Massachusetts Port Auth. Rev. Series 1999 C, 5.75% 7/1/29 (FSA Insured) | | 15,845 | | 17,502 |
Massachusetts Tpk. Auth. Metro. Hwy. Sys. Rev.: | | | | |
Series 1999 A, 5.25% 1/1/29 (AMBAC Insured) | | 14,400 | | 15,020 |
Sr. Series A, 5.125% 1/1/23 (MBIA Insured) | | 7,950 | | 8,217 |
Massachusetts Tpk. Auth. Western Tpk. Rev. Series A, 5.55% 1/1/17 (MBIA Insured) | | 18,430 | | 18,759 |
Massachusetts Wtr. Poll. Abatement Trust Wtr. Poll. Abatement Rev. (MWRA Ln. Prog.) Series A, 5.25% 8/1/13 | | 90 | | 98 |
Massachusetts Wtr. Resources Auth. Series A, 5.75% 8/1/39 (FGIC Insured) | | 33,000 | | 36,803 |
Route 3 North Trans. Impt. Assoc. Lease Rev. 5.75% 6/15/16 (MBIA Insured) | | 4,850 | | 5,580 |
| | 360,379 |
Michigan - 2.3% |
Caladonia Cmnty. Schools Counties of Kent, Allegan and Barry 5.5% 5/1/26 (FGIC Insured) | | 7,000 | | 7,536 |
Detroit Gen. Oblig. Series A: | | | | |
5% 4/1/06 (FSA Insured) (c) | | 5,700 | | 5,860 |
5% 4/1/07 (FSA Insured) (c) | | 14,000 | | 14,604 |
5% 4/1/10 (FSA Insured) (c) | | 3,870 | | 4,106 |
Municipal Bonds - continued |
| Principal
Amount (000s) | | Value (Note 1)
(000s) |
Michigan - continued |
Detroit Wtr. Supply Sys. Rev. Series 2001 A, 5.25% 7/1/33 (FGIC Insured) | | $ 4,520 | | $ 4,722 |
Livonia Pub. School District 5.875% 5/1/25 (FGIC Insured) | | 3,000 | | 3,375 |
Michigan Ctfs. of Prtn. 5.75% 6/1/17 (AMBAC Insured) | | 1,460 | | 1,665 |
Michigan Hosp. Fin. Auth. Hosp. Rev.: | | | | |
(Mercy Health Svcs. Proj.): | | | | |
Series Q, 5.375% 8/15/26 (Escrowed to Maturity) (i) | | 4,750 | | 4,924 |
Series W, 5.25% 8/15/27 (Escrowed to Maturity) (i) | | 4,000 | | 4,146 |
Series X, 6% 8/15/34 (MBIA Insured) | | 10,675 | | 11,867 |
(Sisters of Mercy Health Corp. Proj.) Series P, 5.375% 8/15/14 (Escrowed to Maturity) (i) | | 420 | | 470 |
(Trinity Health Sys. Proj.) Series 2000 A, 6% 12/1/27 | | 2,000 | | 2,150 |
Michigan Hsg. Dev. Auth. Rental Hsg. Rev. Series B, 5.7% 4/1/12 | | 3,750 | | 3,838 |
Michigan Muni. Bond Auth. Rev. (State Revolving Fund Prog.) 5.125% 10/1/20 | | 18,300 | | 19,308 |
Michigan Strategic Fund Solid Waste Disp. Rev. (Waste Mgmt., Inc. Proj.) 4.2%, tender 12/1/05 (e)(h) | | 5,000 | | 5,202 |
Michigan Trunk Line Series A, 0% 10/1/09 (AMBAC Insured) | | 8,010 | | 6,674 |
Royal Oak Hosp. Fin. Auth. Hosp. Rev. (William Beaumont Hosp. Proj.): | | | | |
Series M, 5.25% 11/15/31 (MBIA Insured) | | 7,000 | | 7,283 |
5.5% 1/1/14 | | 3,695 | | 3,857 |
6.25% 1/1/09 | | 400 | | 454 |
| | 112,041 |
Minnesota - 1.2% |
Mankato Independent School District #77 Series A: | | | | |
4.5% 2/1/08 (FSA Insured) | | 1,520 | | 1,653 |
4.5% 2/1/09 (FSA Insured) | | 1,000 | | 1,093 |
Minneapolis & Saint Paul Hsg. & Redev. Auth. Health Care Sys. Rev.: | | | | |
(Health Partners Oblig. Group Proj.) 6% 12/1/18 | | 1,000 | | 1,051 |
(Healthspan Corp. Proj.) Series A, 4.75% 11/15/18 (AMBAC Insured) | | 9,700 | | 9,881 |
Minneapolis Health Care Sys. Rev. (Allina Health Sys. Proj.) Series 2002 A, 6% 11/15/23 | | 6,000 | | 6,392 |
Minnesota Agric. & Econ. Dev. Board Rev. (Health Care Sys. Proj.) Series A, 6.375% 11/15/29 | | 12,000 | | 12,959 |
Municipal Bonds - continued |
| Principal
Amount (000s) | | Value (Note 1)
(000s) |
Minnesota - continued |
Minnesota Hsg. Fin. Agcy. (Single Family Mtg. Prog.) Series B, 5.8% 7/1/25 (h) | | $ 4,070 | | $ 4,075 |
Saint Cloud Health Care Rev. (Saint Cloud Hosp. Group Oblig. Proj.) Series A, 5.875% 5/1/30 (FSA Insured) | | 8,500 | | 9,478 |
Saint Cloud Hosp. Facilities Rev. (Saint Cloud Hosp. Proj.) Series C, 5.25% 10/1/13 (AMBAC Insured) | | 2,000 | | 2,052 |
Saint Paul Port Auth. Lease Rev. Series 2003 11: | | | | |
5.25% 12/1/18 | | 1,710 | | 1,884 |
5.25% 12/1/19 | | 2,850 | | 3,116 |
Waconia Independent School District #110 Series A: | | | | |
5% 2/1/14 (FSA Insured) | | 1,055 | | 1,153 |
5% 2/1/15 (FSA Insured) | | 1,155 | | 1,251 |
| | 56,038 |
Mississippi - 0.1% |
Hinds County Rev. (Mississippi Methodist Hosp. & Rehabilitation Proj.) 5.6% 5/1/12 (AMBAC Insured) | | 4,000 | | 4,496 |
Missouri - 0.2% |
Missouri Envir. Impt. & Energy Resources Auth. Wtr. Poll. Cont. & Drinking Wtr. Rev. (State Revolving Fund Prog.): | | | | |
Series 2002 B, 5.5% 7/1/17 | | 1,780 | | 2,012 |
Series 2003 A: | | | | |
5.125% 1/1/19 | | 5,000 | | 5,419 |
5.25% 1/1/18 | | 1,280 | | 1,413 |
Missouri Hsg. Dev. Commission Single Family Mtg. Rev. Series C, 5.5% 3/1/16 (h) | | 435 | | 436 |
| | 9,280 |
Montana - 0.3% |
Forsyth Poll. Cont. Rev. (Portland Gen. Elec. Co. Projs.) Series A, 5.2%, tender 5/1/09 (e) | | 7,700 | | 7,955 |
Montana Board of Invt. (Payroll Tax Workers Compensation Prog.): | | | | |
Series 1996: | | | | |
6.875% 6/1/20 (Escrowed to Maturity) (i) | | 1,255 | | 1,446 |
6.875% 6/1/20 (Escrowed to Maturity) (i) | | 3,870 | | 4,458 |
6.875% 6/1/20 (Escrowed to Maturity) (i) | | 2,005 | | 2,309 |
| | 16,168 |
Municipal Bonds - continued |
| Principal
Amount (000s) | | Value (Note 1)
(000s) |
Nebraska - 0.4% |
Nebraska Pub. Pwr. District Rev. Series A: | | | | |
0% 1/1/07 (MBIA Insured) | | $ 15,485 | | $ 14,446 |
5.25% 1/1/12 (MBIA Insured) | | 3,250 | | 3,615 |
| | 18,061 |
Nevada - 1.4% |
Clark County Arpt. Rev. Series C: | | | | |
5.375% 7/1/17 (AMBAC Insured) (h) | | 4,310 | | 4,659 |
5.375% 7/1/19 (AMBAC Insured) (h) | | 1,100 | | 1,175 |
5.375% 7/1/21 (AMBAC Insured) (h) | | 1,600 | | 1,689 |
Clark County Gen. Oblig. Series 2000, 5.5% 7/1/30 (MBIA Insured) | | 4,500 | | 4,831 |
Clark County School District: | | | | |
Series 2000 A: | | | | |
5.75% 6/15/17 (MBIA Insured) | | 4,115 | | 4,685 |
5.75% 6/15/20 (MBIA Insured) | | 7,690 | | 8,637 |
Series B, 0% 3/1/09 (FGIC Insured) | | 4,000 | | 3,402 |
Nevada Gen. Oblig. (Cap. Impt. Proj.) Series B, 5.25% 6/1/11 | | 5,025 | | 5,598 |
Truckee Meadows Wtr. Auth. Wtr. Rev. 5.25% 7/1/34 (FSA Insured) | | 18,840 | | 19,621 |
Washoe County Gen. Oblig.: | | | | |
(Reno Sparks Proj.) Series B: | | | | |
0% 7/1/12 (FSA Insured) | | 4,605 | | 3,323 |
0% 7/1/13 (FSA Insured) | | 4,590 | | 3,153 |
0% 7/1/14 (FSA Insured) | | 3,000 | | 1,950 |
5% 9/1/10 (FSA Insured) | | 1,745 | | 1,953 |
| | 64,676 |
New Hampshire - 0.1% |
Manchester School Facilities Rev. 5.5% 6/1/28 (MBIA Insured) | | 2,495 | | 2,685 |
New Hampshire Health & Ed. Facilities Auth. Rev. (Univ. Sys. of New Hampshire Proj.) 5.25% 7/1/09 (AMBAC Insured) | | 1,080 | | 1,223 |
| | 3,908 |
New Jersey - 1.2% |
Evesham Township Muni. Utils. Auth. Rev. Series 2003 A, 5.125% 7/1/14 (AMBAC Insured) | | 2,440 | | 2,707 |
New Jersey Health Care Facilities Fing. Auth. Rev. (Christ Hosp. Group Issue Proj.) 7% 7/1/06 (AMBAC Insured) | | 1,635 | | 1,841 |
Municipal Bonds - continued |
| Principal
Amount (000s) | | Value (Note 1)
(000s) |
New Jersey - continued |
New Jersey Tpk. Auth. Tpk. Rev. Series A: | | | | |
5.625% 1/1/15 (MBIA Insured) | | $ 1,475 | | $ 1,642 |
5.625% 1/1/15 (Pre-Refunded to 1/1/10 @ 100) (i) | | 5,425 | | 6,284 |
New Jersey Trans. Trust Fund Auth. Series B, 5% 6/15/13 (AMBAC Insured) | | 11,055 | | 12,052 |
North Hudson Swr. Auth. Swr. Rev. Series A: | | | | |
5.25% 8/1/18 (FGIC Insured) | | 3,235 | | 3,541 |
5.25% 8/1/19 (FGIC Insured) | | 2,735 | | 2,975 |
Ocean County Utils. Auth. Wastewtr. Rev. 5.25% 1/1/07 | | 1,850 | | 1,975 |
Tobacco Settlement Fing. Corp.: | | | | |
4.375% 6/1/19 | | 4,200 | | 4,039 |
5.75% 6/1/32 | | 9,700 | | 8,986 |
6.125% 6/1/24 | | 8,500 | | 8,272 |
6.125% 6/1/42 | | 4,500 | | 4,054 |
Warren County Poll. Cont. Fing. Auth. Resource Recovery Rev. 6.55% 12/1/06 (MBIA Insured) | | 1,000 | | 1,031 |
| | 59,399 |
New Mexico - 0.6% |
Albuquerque Arpt. Rev.: | | | | |
6.5% 7/1/08 (AMBAC Insured) (h) | | 1,500 | | 1,729 |
6.7% 7/1/18 (AMBAC Insured) (h) | | 2,500 | | 2,865 |
6.75% 7/1/09 (AMBAC Insured) (h) | | 1,150 | | 1,364 |
6.75% 7/1/10 (AMBAC Insured) (h) | | 1,700 | | 2,032 |
6.75% 7/1/12 (AMBAC Insured) (h) | | 1,935 | | 2,345 |
Bernalillo County Gross Receipt Tax Rev. 5.25% 10/1/26 | | 5,790 | | 5,985 |
New Mexico Edl. Assistance Foundation Sr. Series A3, 4.95% 3/1/09 (h) | | 5,000 | | 5,334 |
Univ. of New Mexico Univ. Revs. Series A, 6% 6/1/21 | | 5,340 | | 6,405 |
| | 28,059 |
New York - 10.6% |
Erie County Indl. Dev. Agcy. School Facility Rev. (Buffalo City School District Proj.): | | | | |
5.75% 5/1/18 (FSA Insured) | | 3,460 | | 3,936 |
5.75% 5/1/23 (FSA Insured) | | 1,750 | | 1,959 |
Metro. Trans. Auth. Svc. Contract Rev.: | | | | |
Series A, 5.5% 1/1/20 (MBIA Insured) | | 4,200 | | 4,647 |
Series B, 5% 1/1/08 (FGIC Insured) | | 14,225 | | 15,686 |
Series O, 5.75% 7/1/13 (Escrowed to Maturity) (i) | | 14,250 | | 16,629 |
Municipal Bonds - continued |
| Principal
Amount (000s) | | Value (Note 1)
(000s) |
New York - continued |
Metro. Trans. Auth. Transit Facilities Rev.: | | | | |
(Svc. Contract Proj.) Series R, 5.4% 7/1/10 (Escrowed to Maturity) (i) | | $ 2,680 | | $ 3,068 |
Series B2, 5% 7/1/17 (Escrowed to Maturity) (i) | | 2,950 | | 3,168 |
Series C, 5.125% 7/1/14 (Pre-Refunded to 1/1/12 @ 100) (i) | | 500 | | 569 |
Nassau County Gen. Oblig. Series Z: | | | | |
5% 9/1/11 (FGIC Insured) | | 2,300 | | 2,543 |
5% 9/1/12 (FGIC Insured) | | 4,500 | | 4,932 |
Nassau County Interim Fin. Auth. Series 2000 A, 5.75% 11/15/11 (MBIA Insured) | | 1,000 | | 1,165 |
New York City Gen. Oblig.: | | | | |
Series 2000 A, 6.5% 5/15/11 | | 6,300 | | 7,376 |
Series A: | | | | |
5.25% 11/1/14 (MBIA Insured) | | 1,850 | | 2,063 |
6% 8/1/18 (Escrowed to Maturity) (i) | | 4,900 | | 4,914 |
Series C, 5.75% 3/15/27 (FSA Insured) | | 4,000 | | 4,409 |
Series D: | | | | |
8% 2/1/05 | | 1,810 | | 1,933 |
8% 2/1/05 (Escrowed to Maturity) (i) | | 740 | | 794 |
Series E, 6% 8/1/11 | | 3,500 | | 3,864 |
Series G, 5.25% 8/1/14 (AMBAC Insured) | | 2,500 | | 2,765 |
New York City Indl. Dev. Agcy. Indl. Dev. Rev. (Japan Airlines Co. Ltd. Proj.) Series 1991, 6% 11/1/15 (FSA Insured) (h) | | 1,575 | | 1,651 |
New York City Indl. Dev. Agcy. Spl. Facilities Rev. (Term. One Group Assoc. Proj.) 6% 1/1/08 (h) | | 500 | | 512 |
New York City Muni. Wtr. Fin. Auth. Wtr. & Swr. Sys. Rev.: | | | | |
Series 1996 B: | | | | |
5.75% 6/15/26 (MBIA Insured) | | 5,970 | | 6,493 |
5.875% 6/15/26 | | 1,125 | | 1,240 |
Series A: | | | | |
5.75% 6/15/31 (FGIC Insured) | | 2,725 | | 3,021 |
6% 6/15/28 | | 12,500 | | 14,357 |
Series B: | | | | |
5.125% 6/15/31 | | 10,545 | | 10,837 |
5.75% 6/15/26 | | 10,000 | | 10,931 |
5.75% 6/15/26 (AMBAC Insured) | | 10,000 | | 10,983 |
5.75% 6/15/29 | | 56,120 | | 61,135 |
5.75% 6/15/29 (MBIA Insured) | | 15,950 | | 17,534 |
Municipal Bonds - continued |
| Principal
Amount (000s) | | Value (Note 1)
(000s) |
New York - continued |
New York City Transitional Fin. Auth. Rev. Series A, 5.75% 2/15/16 | | $ 2,800 | | $ 3,199 |
New York City Trust Cultural Resources Rev. (American Museum of Natural History Proj.) Series A, 5.65% 4/1/27 (MBIA Insured) | | 6,500 | | 7,007 |
New York Local Govt. Assistance Corp.: | | | | |
Series B, 0% 4/1/08 | | 4,500 | | 3,999 |
Series C, 5.5% 4/1/17 | | 21,915 | | 25,142 |
New York State Dorm. Auth. Revs.: | | | | |
(City Univ. Sys. Consolidation Proj.): | | | | |
Series A, 5.75% 7/1/09 | | 4,370 | | 4,990 |
Series C, 7.5% 7/1/10 (FGIC Insured) | | 24,650 | | 29,345 |
Series D, 7% 7/1/09 (Escrowed to Maturity) (i) | | 2,000 | | 2,255 |
(Long Island Jewish Med. Ctr. Proj.) 5.25% 7/1/11 (MBIA Insured) | | 3,770 | | 4,211 |
(State Univ. Edl. Facilities Proj.) Series A, 5.875% 5/15/17 (FGIC Insured) | | 6,865 | | 8,289 |
(Suffolk County Judicial Facilities Proj.) Series A, 9.5% 4/15/14 | | 690 | | 849 |
Series 2002 A, 5.75% 10/1/17 (MBIA Insured) | | 3,000 | | 3,447 |
New York State Envir. Facilities Corp. Clean Wtr. & Drinking Wtr. Rev. Series F: | | | | |
4.875% 6/15/18 | | 4,205 | | 4,390 |
4.875% 6/15/18 (Escrowed to Maturity) (i) | | 3,075 | | 3,228 |
4.875% 6/15/20 | | 8,500 | | 8,811 |
5% 6/15/15 | | 3,015 | | 3,257 |
New York State Envir. Facilities Corp. State Wtr. Poll. Cont. Revolving Fund Rev. (New York City Muni. Wtr. Fin. Auth. Proj.): | | | | |
Series 1997 E, 6% 6/15/11 (MBIA Insured) | | 12,150 | | 14,549 |
Series D, 5.125% 6/15/19 (Escrowed to Maturity) (i) | | 4,930 | | 5,246 |
New York State Med. Care Facilities Fin. Agcy. Rev. (Mtg. Prog.) Series E, 6.2% 2/15/15 | | 1,500 | | 1,613 |
New York State Thruway Auth. Gen. Rev. (Spl. Oblig. Cross Proj.) Series A, 0% 1/1/05 | | 8,400 | | 8,248 |
New York State Thruway Auth. State Personal Income Tax Rev. Series A, 5.5% 3/15/17 | | 3,500 | | 3,927 |
New York State Thruway Auth. Svc. Contract Rev.: | | | | |
Series B, 5.375% 4/1/11 (MBIA Insured) | | 10,000 | | 11,226 |
5.5% 4/1/16 | | 2,350 | | 2,673 |
5.5% 4/1/16 (Pre-Refunded to 4/1/12 @ 100) (i) | | 5,150 | | 5,977 |
New York State Urban Dev. Corp. Rev. Series C1: | | | | |
5.5% 3/15/18 (FGIC Insured) | | 1,045 | | 1,171 |
Municipal Bonds - continued |
| Principal
Amount (000s) | | Value (Note 1)
(000s) |
New York - continued |
New York State Urban Dev. Corp. Rev. Series C1: - continued | | | | |
5.5% 3/15/20 (FGIC Insured) | | $ 2,795 | | $ 3,102 |
New York Thruway Auth. Second Gen. Hwy. & Bridge Trust Fund Series A, 5.25% 4/1/22 (MBIA Insured) | | 2,190 | | 2,341 |
Niagara Falls City Niagara County Pub. Impt. (Pub. Impt. Proj.) 7.5% 3/1/18 (MBIA Insured) | | 500 | | 684 |
Tobacco Settlement Fing. Corp.: | | | | |
Series A1: | | | | |
5.25% 6/1/21 (AMBAC Insured) | | 5,645 | | 6,013 |
5.25% 6/1/22 (AMBAC Insured) | | 3,850 | | 4,073 |
5.5% 6/1/15 | | 33,500 | | 36,074 |
Series C1, 5.5% 6/1/14 | | 7,300 | | 7,880 |
Triborough Bridge & Tunnel Auth. (Convention Ctr. Proj.) Series E, 7.25% 1/1/10 (XL Cap. Assurance, Inc. Insured) | | 9,650 | | 11,055 |
Triborough Bridge & Tunnel Auth. Revs.: | | | | |
Series A, 5.25% 1/1/28 (Pre-Refunded to 7/1/22 @ 100) (i) | | 13,315 | | 14,888 |
Series B, 5.2% 1/1/27 (Pre-Refunded to 1/1/22 @ 100) (i) | | 2,000 | | 2,224 |
Series SR, 5.5% 1/1/12 (Escrowed to Maturity) (i) | | 10,185 | | 11,526 |
Series Y, 5.5% 1/1/17 (Escrowed to Maturity) (i) | | 9,100 | | 10,605 |
Triborough Bridge & Tunnel Auth. Spl. Oblig. Series A, 5.25% 1/1/11 (Escrowed to Maturity) (i) | | 3,320 | | 3,698 |
| | 506,326 |
New York & New Jersey - 0.1% |
Port Auth. of New York & New Jersey 124th Series, 5% 8/1/13 (FGIC Insured) (h) | | 3,400 | | 3,622 |
North Carolina - 4.3% |
North Carolina Cap. Facilities Fin. Agcy. Rev. (Duke Univ. Proj.) Series A, 5.125% 7/1/42 | | 21,500 | | 22,151 |
North Carolina Eastern Muni. Pwr. Agcy. Pwr. Sys. Rev.: | | | | |
Series 1993 B, 7% 1/1/08 (MBIA Insured) | | 6,900 | | 8,108 |
Series A: | | | | |
5.5% 1/1/11 | | 8,675 | | 9,573 |
5.75% 1/1/26 | | 4,000 | | 4,141 |
Series B: | | | | |
5.875% 1/1/21 (MBIA Insured) | | 22,725 | | 25,355 |
6% 1/1/05 | | 17,500 | | 17,719 |
7% 1/1/08 | | 9,000 | | 10,285 |
7.25% 1/1/07 | | 8,375 | | 9,433 |
Municipal Bonds - continued |
| Principal
Amount (000s) | | Value (Note 1)
(000s) |
North Carolina - continued |
North Carolina Eastern Muni. Pwr. Agcy. Pwr. Sys. Rev.: - continued | | | | |
Series C: | | | | |
5.25% 1/1/09 | | $ 2,500 | | $ 2,719 |
5.5% 1/1/07 | | 5,950 | | 6,414 |
7% 1/1/07 | | 15,715 | | 17,588 |
Series D: | | | | |
5.375% 1/1/10 | | 4,500 | | 4,919 |
6.7% 1/1/19 | | 5,000 | | 5,579 |
6.75% 1/1/26 | | 7,000 | | 7,739 |
North Carolina Muni. Pwr. Agcy. #1 Catawba Elec. Rev.: | | | | |
Series 1992, 7.25% 1/1/07 | | 5,200 | | 5,865 |
Series 1999 B, 6.375% 1/1/08 | | 7,000 | | 7,879 |
Series A: | | | | |
5.125% 1/1/15 (MBIA Insured) | | 6,860 | | 7,401 |
5.125% 1/1/17 (MBIA Insured) | | 15,350 | | 16,346 |
5.125% 1/1/17 (MBIA Insured) | | 16,000 | | 17,257 |
| | 206,471 |
North Dakota - 0.8% |
Mercer County Poll. Cont. Rev.: | | | | |
(Antelope Valley Station/Basin Elec. Pwr. Coop. Proj.) 7.2% 6/30/13 (AMBAC Insured) | | 26,000 | | 32,630 |
(Montana-Dakota Utils. Co. Proj.) 6.65% 6/1/22 (FGIC Insured) | | 3,750 | | 3,801 |
North Dakota Bldg. Auth. Lease Rev. Series A, 5.25% 6/1/08 (FGIC Insured) | | 1,675 | | 1,873 |
| | 38,304 |
Ohio - 1.3% |
Cincinnati Gen. Oblig. (Police & Firemen's Disability Proj.) 6% 12/1/35 | | 11,000 | | 12,608 |
Franklin County Hosp. Rev. 5.5% 5/1/28 (AMBAC Insured) | | 4,265 | | 4,570 |
Hilliard School District 5.75% 12/1/24 (FGIC Insured) | | 4,725 | | 5,338 |
Lake Local School District Stark County Series 2000, 5.75% 12/1/26 (FGIC Insured) | | 2,760 | | 3,077 |
Lakewood Hosp. Impt. Rev. (Lakewood Hosp. Assoc. Proj.) 5.5% 2/15/08 | | 1,225 | | 1,331 |
Montgomery County Rev. (Catholic Health Initiatives Proj.) Series A: | | | | |
6% 12/1/19 | | 10,000 | | 11,112 |
6% 12/1/26 | | 10,000 | | 10,789 |
Municipal Bonds - continued |
| Principal
Amount (000s) | | Value (Note 1)
(000s) |
Ohio - continued |
Ohio Bldg. Auth. Series A, 5% 4/1/11 (FGIC Insured) | | $ 1,065 | | $ 1,201 |
Ohio Solid Waste Rev. (Waste Mgmt., Inc. Proj.) 4.85%, tender 11/1/07 (e)(h) | | 5,000 | | 5,259 |
Ohio Wtr. Dev. Auth. Poll. Cont. Facilities Rev. (Buckeye Pwr., Inc. Proj.) 7.8% 11/1/14 (AMBAC Insured) | | 2,200 | | 2,355 |
Richland County Hosp. Facilities (MedCentral Health Sys. Proj.) Series B, 6.375% 11/15/30 | | 3,000 | | 3,163 |
Univ. of Cincinnati Ctfs. of Prtn. 5.125% 6/1/28 (MBIA Insured) | | 3,750 | | 3,867 |
| | 64,670 |
Oklahoma - 0.8% |
Oklahoma Dev. Fin. Auth. Rev. (Saint John Health Sys. Proj.) 6% 2/15/29 | | 15,000 | | 16,162 |
Oklahoma Industries Auth. Rev. (Health Sys. Oblig. Group Proj.) Series A, 5.75% 8/15/29 (MBIA Insured) | | 19,750 | | 21,396 |
| | 37,558 |
Oregon - 0.6% |
Multnomah County Gen. Oblig. Series 2000 A, 5.5% 4/1/20 | | 1,540 | | 1,685 |
Oregon Health Hsg. Edl. & Cultural Facilities Auth. (Lewis & Clark College Proj.) Series A: | | | | |
6% 10/1/13 (MBIA Insured) | | 1,750 | | 1,843 |
6.125% 10/1/24 (MBIA Insured) | | 1,000 | | 1,052 |
Port Morrow Poll. Cont. Rev. (Pacific Northwest Proj.) Series A: | | | | |
8% 7/15/06 | | 385 | | 403 |
8% 7/15/07 | | 430 | | 449 |
8% 7/15/08 | | 480 | | 501 |
8% 7/15/09 | | 540 | | 563 |
8% 7/15/10 | | 605 | | 631 |
8% 7/15/11 | | 385 | | 402 |
Portland Swr. Sys. Rev.: | | | | |
Series 2000 A, 5.75% 8/1/18 (FGIC Insured) | | 3,000 | | 3,429 |
5.75% 8/1/20 (FGIC Insured) | | 14,390 | | 16,329 |
| | 27,287 |
Pennsylvania - 2.0% |
Allegheny County Arpt. Rev. (Pittsburgh Int'l. Arpt. Proj.) Series A1, 5.75% 1/1/07 (MBIA Insured) (h) | | 6,500 | | 7,055 |
Canon McMillan School District Series 2001 B, 5.75% 12/1/33 (FGIC Insured) | | 3,000 | | 3,354 |
Municipal Bonds - continued |
| Principal
Amount (000s) | | Value (Note 1)
(000s) |
Pennsylvania - continued |
Chester County Health & Ed. Facilities Auth. Health Sys. Rev. (Jefferson Health Sys. Proj.) Series B, 5.25% 5/15/22 (AMBAC Insured) | | $ 4,400 | | $ 4,638 |
Delaware County Auth. Hosp. Rev. (Crozer-Chester Med. Ctr. Proj.) 6% 12/15/20 | | 3,500 | | 3,513 |
Delaware County Auth. Rev. (First Mtg. Riddle Village Proj.) 8.25% 6/1/22 (Escrowed to Maturity) (i) | | 4,240 | | 4,472 |
Montgomery County Higher Ed. & Health Auth. Hosp. Rev. (Abington Memorial Hosp. Proj.) Series A: | | | | |
6% 6/1/22 (AMBAC Insured) | | 2,000 | | 2,395 |
6.1% 6/1/12 (AMBAC Insured) | | 3,000 | | 3,581 |
6.125% 6/1/14 (AMBAC Insured) | | 5,230 | | 6,305 |
Northumberland County Auth. Commonwealth Lease Rev. (State Correctional Facilities Proj.) 0% 10/15/13 (Escrowed to Maturity) (i) | | 11,455 | | 7,944 |
Pennsylvania Convention Ctr. Auth. Rev. Series A: | | | | |
6.6% 9/1/09 (MBIA Insured) | | 3,000 | | 3,161 |
6.7% 9/1/14 (MBIA Insured) | | 1,500 | | 1,581 |
6.7% 9/1/16 (Escrowed to Maturity) (i) | | 2,000 | | 2,489 |
Pennsylvania Econ. Dev. Fing. Auth. Exempt Facilities Rev. (Amtrak Proj.) Series 2001 A, 6.375% 11/1/41 (h) | | 8,700 | | 8,725 |
Pennsylvania Hsg. Fin. Agcy.: | | | | |
Series 54A, 5.375% 10/1/28 (h) | | 755 | | 776 |
8.1% 7/1/13 | | 2,000 | | 2,012 |
Philadelphia Arpt. Rev. Series 1998, 5.375% 6/15/10 (FGIC Insured) (h) | | 4,425 | | 4,888 |
Philadelphia Gen. Oblig. Series 2003 A: | | | | |
5% 2/15/10 (XL Cap. Assurance, Inc. Insured) | | 2,000 | | 2,220 |
5% 2/15/12 (XL Cap. Assurance, Inc. Insured) | | 1,000 | | 1,111 |
Philadelphia School District: | | | | |
Series 2002 A, 5.5% 2/1/31 (FSA Insured) | | 10,700 | | 11,509 |
Series C, 5.75% 3/1/29 (MBIA Insured) | | 6,500 | | 7,174 |
West Allegheny School District Series B, 5.25% 2/1/14 (FGIC Insured) | | 2,010 | | 2,284 |
Wyoming Valley San. Auth. Swr. Rev. 5% 11/15/10 (MBIA Insured) | | 2,270 | | 2,556 |
| | 93,743 |
Municipal Bonds - continued |
| Principal
Amount (000s) | | Value (Note 1)
(000s) |
Puerto Rico - 0.3% |
Puerto Rico Commonwealth Hwy. & Trans. Auth. Trans. Rev.: | | | | |
Series 1998, 5.75% 7/1/22 (Cdc Ixis Finl. Guaranty Insured) | | $ 2,300 | | $ 2,646 |
5.75% 7/1/19 (FGIC Insured) | | 3,240 | | 3,780 |
Puerto Rico Commonwealth Infrastructure Fing. Auth. Series 2000 A: | | | | |
5.5% 10/1/32 (Escrowed to Maturity) (i) | | 6,900 | | 7,545 |
5.5% 10/1/40 (Escrowed to Maturity) (i) | | 1,000 | | 1,090 |
| | 15,061 |
Rhode Island - 0.1% |
Providence Redev. Agcy. Rev. Series A, 5.75% 4/1/29 (AMBAC Insured) | | 6,400 | | 7,122 |
South Carolina - 0.8% |
Charleston County Gen. Oblig. 6% 6/1/13 (Pre-Refunded to 6/1/06 @ 100) (i) | | 2,500 | | 2,764 |
Lexington County Health Svcs. District, Inc. Hosp. Rev. 6% 11/1/18 | | 3,500 | | 3,843 |
Piedmont Muni. Pwr. Agcy. Elec. Rev.: | | | | |
Series B, 5.25% 1/1/11 (MBIA Insured) | | 8,625 | | 9,434 |
5.5% 1/1/10 (MBIA Insured) | | 1,455 | | 1,659 |
Richland County Hosp. Facilities Rev. (Cmnty. Provider Pooled Ln. Prog.) Series A, 7.125% 7/1/17 (Escrowed to Maturity) (i) | | 1,500 | | 1,901 |
Rock Hill Util. Sys. Rev. Series 2003 A: | | | | |
5.375% 1/1/17 (FSA Insured) | | 2,100 | | 2,335 |
5.375% 1/1/23 (FSA Insured) | | 1,025 | | 1,104 |
South Carolina Jobs Econ. Dev. Auth. Hosp. Facilities Rev. (Palmetto Health Alliance Proj.) Series A, 7.375% 12/15/21 (Pre-Refunded to 12/15/10 @ 102) (i) | | 4,000 | | 5,114 |
South Carolina Ports Auth. Ports Rev. 5.5% 7/1/08 (FSA Insured) (h) | | 3,515 | | 3,955 |
South Carolina Pub. Svc. Auth. Rev. Series A, 5.75% 1/1/10 (MBIA Insured) | | 4,705 | | 5,144 |
York County Wtr. & Swr. Rev. 5.25% 12/1/30 (MBIA Insured) | | 1,120 | | 1,186 |
| | 38,439 |
Municipal Bonds - continued |
| Principal
Amount (000s) | | Value (Note 1)
(000s) |
South Dakota - 0.1% |
Sioux Falls School District #49-5 5.5% 7/1/20 | | $ 2,735 | | $ 3,039 |
South Dakota Lease Rev. Series A, 6.625% 9/1/12 (FSA Insured) | | 1,000 | | 1,230 |
| | 4,269 |
Tennessee - 1.4% |
Knox County Health Edl. & Hsg. Facilities Board Hosp. Facilities Rev. (Fort Sanders Alliance Proj.) Series C: | | | | |
5.75% 1/1/14 (MBIA Insured) | | 2,000 | | 2,335 |
7.25% 1/1/10 (MBIA Insured) | | 2,660 | | 3,274 |
Memphis Gen. Oblig. 5.25% 7/1/16 | | 8,730 | | 9,252 |
Memphis-Shelby County Arpt. Auth. Arpt. Rev.: | | | | |
Series A: | | | | |
6% 2/15/05 (MBIA Insured) (h) | | 1,000 | | 1,049 |
6.25% 2/15/09 (MBIA Insured) (h) | | 1,500 | | 1,730 |
6.25% 2/15/10 (MBIA Insured) (h) | | 1,000 | | 1,158 |
6.25% 2/15/11 (MBIA Insured) (h) | | 1,415 | | 1,643 |
Series B, 6.5% 2/15/09 (MBIA Insured) (h) | | 500 | | 583 |
Metro. Govt. Nashville & Davidson County Health & Edl. Facilities Board Rev. (Ascension Health Cr. Group Proj.) Series A: | | | | |
5.875% 11/15/28 (Pre-Refunded to 11/15/09 @ 101) (i) | | 3,100 | | 3,675 |
6% 11/15/30 (Pre-Refunded to 11/15/09 @ 101) (i) | | 4,400 | | 5,246 |
Metro. Govt. Nashville & Davidson County Sports Auth. Rev. (Stadium Proj.) 5.875% 7/1/21 (AMBAC Insured) | | 6,455 | | 7,082 |
Metro. Govt. Nashville & Davidson County Wtr. & Swr. Sys. Rev. 7.7% 1/1/12 (FGIC Insured) | | 5,600 | | 7,088 |
Shelby County Health Edl. & Hsg. Facility Board Hosp. Rev. (Methodist Health Care Proj.) 6.5% 9/1/26 | | 22,500 | | 24,607 |
| | 68,722 |
Texas - 14.0% |
Arlington Gen. Oblig. 5% 8/15/18 (FGIC Insured) | | 1,215 | | 1,300 |
Austin Cmnty. College District 5% 8/1/17 (AMBAC Insured) | | 1,095 | | 1,180 |
Austin Util. Sys. Rev.: | | | | |
Series A: | | | | |
0% 11/15/08 (MBIA Insured) | | 3,895 | | 3,390 |
0% 11/15/10 (MBIA Insured) | | 8,400 | | 6,633 |
0% 11/15/09 (AMBAC Insured) | | 4,000 | | 3,330 |
0% 5/15/10 (MBIA Insured) | | 7,970 | | 6,422 |
Municipal Bonds - continued |
| Principal
Amount (000s) | | Value (Note 1)
(000s) |
Texas - continued |
Austin Util. Sys. Rev.: - continued | | | | |
0% 11/15/10 (AMBAC Insured) | | $ 4,900 | | $ 3,869 |
Bexar Metro. Wtr. District Wtrwks. Sys. Rev. 5.375% 5/1/20 (FSA Insured) | | 1,660 | | 1,808 |
Birdville Independent School District: | | | | |
0% 2/15/11 | | 8,665 | | 6,704 |
0% 2/15/13 | | 13,690 | | 9,527 |
Board of Regents of The Univ. of Texas Sys. Permanent Univ. Fund: | | | | |
5% 7/1/10 | | 2,000 | | 2,198 |
5.25% 7/1/11 | | 7,080 | | 7,864 |
Brazos River Auth. Poll. Cont. Rev. (Texas Utils. Elec. Co. Proj.) Series 1995 B, 5.05%, tender 6/19/06 (e)(h) | | 5,000 | | 5,238 |
Canyon Independent School District Series A, 5.5% 2/15/21 | | 1,855 | | 2,022 |
Cedar Hill Independent School District 0% 8/15/09 | | 1,575 | | 1,299 |
Clint Independent School District: | | | | |
5.5% 8/15/19 | | 1,055 | | 1,168 |
5.5% 8/15/20 | | 1,110 | | 1,221 |
5.5% 8/15/21 | | 1,175 | | 1,285 |
Conroe Independent School District: | | | | |
Lot B: | | | | |
0% 2/15/07 | | 2,360 | | 2,191 |
0% 2/15/08 | | 3,000 | | 2,678 |
0% 2/15/09 | | 1,100 | | 940 |
Series B, 0% 2/15/10 | | 2,805 | | 2,279 |
0% 2/15/11 | | 1,500 | | 1,160 |
Cypress-Fairbanks Independent School District: | | | | |
Series A: | | | | |
0% 2/15/12 | | 20,900 | | 15,218 |
0% 2/15/13 | | 6,425 | | 4,471 |
0% 2/15/14 | | 11,465 | | 7,488 |
0% 2/15/16 | | 9,700 | | 5,667 |
5% 2/15/10 | | 3,400 | | 3,801 |
5.25% 2/15/22 | | 3,500 | | 3,690 |
5.75% 2/15/19 | | 4,400 | | 4,959 |
5.75% 2/15/21 | | 1,000 | | 1,116 |
Dallas Fort Worth Reg'l. Arpt. Rev. Series A, 7.375% 11/1/12 (FGIC Insured) | | 1,000 | | 1,038 |
Dallas Hsg. Corp. Cap. Prog. Rev. (Section 8 Assorted Projs.): | | | | |
7.7% 8/1/05 | | 490 | | 490 |
Municipal Bonds - continued |
| Principal
Amount (000s) | | Value (Note 1)
(000s) |
Texas - continued |
Dallas Hsg. Corp. Cap. Prog. Rev. (Section 8 Assorted Projs.): - continued | | | | |
7.85% 8/1/13 | | $ 1,000 | | $ 1,001 |
Duncanville Independent School District 5.65% 2/15/28 | | 4,000 | | 4,319 |
Edinburg Consolidated Independent School District 5.5% 2/15/30 | | 5,025 | | 5,356 |
El Paso Property Fin. Auth. Single Family Mtg. Rev. Series A, 8.7% 12/1/18 (h) | | 270 | | 274 |
Elgin Independent School District 5.25% 10/1/24 | | 2,000 | | 2,070 |
Frisco Gen. Oblig.: | | | | |
5% 2/15/09 (FSA Insured) | | 3,655 | | 4,077 |
5% 2/15/10 (FSA Insured) | | 3,810 | | 4,259 |
Frisco Independent School District 5.375% 8/15/17 | | 2,715 | | 3,012 |
Garland Independent School District Series A: | | | | |
4% 2/15/09 | | 2,000 | | 2,136 |
4% 2/15/17 | | 5,000 | | 4,968 |
Guadalupe-Blanco River Auth. Contract Rev. (Western Canyon Reg'l. Wtr. Supply Proj.): | | | | |
5.25% 4/15/15 (MBIA Insured) | | 1,570 | | 1,752 |
5.25% 4/15/16 (MBIA Insured) | | 1,680 | | 1,857 |
5.25% 4/15/17 (MBIA Insured) | | 2,295 | | 2,518 |
5.25% 4/15/18 (MBIA Insured) | | 1,915 | | 2,087 |
5.25% 4/15/19 (MBIA Insured) | | 1,000 | | 1,087 |
5.25% 4/15/20 (MBIA Insured) | | 1,565 | | 1,691 |
Harlandale Independent School District: | | | | |
5.5% 8/15/35 | | 3,625 | | 3,892 |
5.7% 8/15/30 | | 8,290 | | 9,096 |
6% 8/15/16 | | 2,445 | | 2,875 |
Harris County Gen. Oblig.: | | | | |
(Toll Road Proj.) 0% 8/1/08 | | 8,005 | | 7,018 |
0% 10/1/13 (MBIA Insured) | | 5,550 | | 3,785 |
0% 10/1/14 (MBIA Insured) | | 11,000 | | 7,034 |
0% 8/15/25 (MBIA Insured) | | 8,000 | | 2,568 |
0% 8/15/28 (MBIA Insured) | | 5,000 | | 1,357 |
Harris County Health Facilities Dev. Corp. Rev. (Saint Luke's Episcopal Hosp. Proj.) Series 2001 A: | | | | |
5.375% 2/15/26 | | 3,000 | | 3,053 |
5.625% 2/15/13 | | 4,625 | | 5,092 |
Harris County Hosp. District Mtg. Rev.: | | | | |
7.4% 2/15/10 (AMBAC Insured) | | 1,740 | | 2,011 |
7.4% 2/15/10 (Escrowed to Maturity) (i) | | 1,260 | | 1,405 |
Municipal Bonds - continued |
| Principal
Amount (000s) | | Value (Note 1)
(000s) |
Texas - continued |
Houston Arpt. Sys. Rev.: | | | | |
Series A: | | | | |
5.625% 7/1/20 (FSA Insured) (h) | | $ 2,000 | | $ 2,162 |
5.625% 7/1/21 (FSA Insured) (h) | | 3,350 | | 3,602 |
6% 7/1/08 (FGIC Insured) (h) | | 1,000 | | 1,126 |
Series B, 5.5% 7/1/30 (FSA Insured) | | 10,645 | | 11,286 |
Houston Gen. Oblig.: | | | | |
Series A2, 5% 3/1/09 (MBIA Insured) | | 3,605 | | 4,024 |
5% 3/1/09 (MBIA Insured) | | 4,600 | | 5,135 |
Houston Independent School District: | | | | |
Series A, 0% 8/15/11 | | 6,400 | | 4,845 |
0% 8/15/13 | | 9,835 | | 6,678 |
Houston Wtr. & Swr. Sys. Rev.: | | | | |
Series 2000 B, 6% 12/1/20 (FGIC Insured) | | 2,900 | | 3,372 |
Series C, 0% 12/1/09 (AMBAC Insured) | | 3,250 | | 2,702 |
Hurst Euless Bedford Independent School District: | | | | |
0% 8/15/11 | | 3,620 | | 2,740 |
0% 8/15/12 | | 5,105 | | 3,645 |
0% 8/15/13 | | 3,610 | | 2,463 |
Katy Independent School District: | | | | |
Series A: | | | | |
0% 2/15/07 | | 2,450 | | 2,274 |
5% 2/15/10 | | 2,000 | | 2,178 |
5% 2/15/16 | | 2,500 | | 2,706 |
0% 8/15/11 | | 4,170 | | 3,157 |
Keller Independent School District Series A, 5.125% 8/15/25 | | 3,000 | | 3,054 |
Killeen Independent School District: | | | | |
5.25% 2/15/17 | | 2,105 | | 2,306 |
5.25% 2/15/18 | | 1,325 | | 1,442 |
La Joya Independent School District 5.5% 2/15/22 | | 8,140 | | 8,841 |
Leander Independent School District 7.5% 8/15/08 | | 300 | | 366 |
Little Elm Independent School District 5.5% 8/15/21 | | 2,540 | | 2,774 |
Lower Colorado River Auth. Rev.: | | | | |
0% 1/1/09 (Escrowed to Maturity) (i) | | 3,000 | | 2,599 |
5.25% 1/1/15 (Escrowed to Maturity) (i) | | 6,000 | | 6,851 |
5.25% 5/15/18 (AMBAC Insured) | | 2,020 | | 2,203 |
Lower Colorado River Auth. Transmission Contract Rev. (LCRA Transmission Services Corp. Proj.) Series C: | | | | |
5.25% 5/15/18 (AMBAC Insured) | | 1,000 | | 1,091 |
5.25% 5/15/19 (AMBAC Insured) | | 1,000 | | 1,083 |
5.25% 5/15/20 (AMBAC Insured) | | 2,000 | | 2,154 |
Municipal Bonds - continued |
| Principal
Amount (000s) | | Value (Note 1)
(000s) |
Texas - continued |
Mansfield Independent School District 5.5% 2/15/18 | | $ 3,855 | | $ 4,275 |
Mesquite Independent School District 5.375% 8/15/11 | | 1,385 | | 1,540 |
Midlothian Independent School District: | | | | |
0% 2/15/07 | | 1,935 | | 1,796 |
0% 2/15/09 | | 1,970 | | 1,683 |
0% 2/15/10 | | 1,525 | | 1,239 |
Montgomery County Gen. Oblig. Series A, 5.625% 3/1/20 (FSA Insured) | | 3,800 | | 4,210 |
North Central Health Facilities Dev. Corp. Rev. Series 1997 B, 5.75% 2/15/14 (MBIA Insured) | | 5,215 | | 6,074 |
Northside Independent School District 5.5% 2/15/12 | | 3,715 | | 4,237 |
Pflugerville Gen. Oblig. 5.5% 8/1/22 (AMBAC Insured) | | 1,000 | | 1,087 |
Rockwall Independent School District: | | | | |
5.375% 2/15/19 | | 1,450 | | 1,580 |
5.375% 2/15/20 | | 1,230 | | 1,332 |
5.375% 2/15/21 | | 1,560 | | 1,674 |
5.625% 2/15/12 | | 4,090 | | 4,697 |
5.625% 2/15/13 | | 1,190 | | 1,359 |
5.625% 2/15/14 | | 1,160 | | 1,318 |
Round Rock Independent School District: | | | | |
Series 2001 A, 5.5% 8/1/16 | | 2,305 | | 2,593 |
0% 2/15/08 | | 9,800 | | 8,748 |
0% 8/15/09 (MBIA Insured) | | 7,430 | | 6,233 |
0% 8/15/10 (MBIA Insured) | | 10,800 | | 8,601 |
0% 8/15/11 (MBIA Insured) | | 4,300 | | 3,255 |
4.5% 8/1/17 | | 5,575 | | 5,683 |
Sabine River Auth. Poll. Cont. Rev. (Texas Utils. Elec. Co. Proj.) Series B, 5.75%, tender 11/1/11 (e)(h) | | 16,000 | | 16,728 |
San Antonio Elec. & Gas Systems Rev.: | | | | |
Series B: | | | | |
0% 2/1/09 (Escrowed to Maturity) (i) | | 7,000 | | 6,049 |
0% 2/1/10 (Escrowed to Maturity) (i) | | 19,000 | | 15,499 |
0% 2/1/12 (Escrowed to Maturity) (i) | | 7,000 | | 5,207 |
5.25% 2/1/07 | | 6,900 | | 7,551 |
5.375% 2/1/18 | | 5,000 | | 5,485 |
5.375% 2/1/19 | | 6,000 | | 6,544 |
San Antonio Wtr. Sys. Rev.: | | | | |
5.875% 5/15/19 | | 3,000 | | 3,418 |
6.5% 5/15/10 (Escrowed to Maturity) (i) | | 440 | | 536 |
6.5% 5/15/10 (Pre-Refunded to 5/15/04 @ 100) (i) | | 95 | | 97 |
San Benito Consolidated Independent School District 6% 2/15/25 | | 6,200 | | 7,055 |
Municipal Bonds - continued |
| Principal
Amount (000s) | | Value (Note 1)
(000s) |
Texas - continued |
South San Antonio Independent School District 5% 8/15/17 | | $ 1,025 | | $ 1,102 |
Southlake Gen. Oblig. Series 2000 D, 5.75% 2/15/21 (AMBAC Insured) | | 2,345 | | 2,608 |
Southwest Higher Ed. Auth. Rev. (Southern Methodist Univ. Proj.) 5.5% 10/1/17 (AMBAC Insured) | | 3,825 | | 4,293 |
Spring Branch Independent School District Series 2001: | | | | |
5.375% 2/1/12 | | 2,000 | | 2,257 |
5.375% 2/1/13 | | 3,130 | | 3,524 |
Spring Independent School District 4.875% 8/15/10 (Pre-Refunded to 8/15/08 @ 100) (i) | | 3,500 | | 3,905 |
Tarrant County Health Facilities Dev. Corp. Hosp. Rev. 5.375% 11/15/20 | | 5,750 | | 5,783 |
Texas Gen. Oblig.: | | | | |
(College Student Ln. Prog.): | | | | |
5% 8/1/11 (h) | | 7,515 | | 8,206 |
5% 8/1/12 (h) | | 6,655 | | 7,171 |
5.375% 8/1/10 (h) | | 6,205 | | 6,951 |
5.25% 10/1/11 | | 7,150 | | 7,892 |
5.75% 8/1/26 | | 5,000 | | 5,502 |
Texas Pub. Fin. Auth. Bldg. Rev.: | | | | |
Series 1990: | | | | |
0% 2/1/12 (MBIA Insured) | | 4,400 | | 3,209 |
0% 2/1/14 (MBIA Insured) | | 6,900 | | 4,536 |
0% 2/1/09 (MBIA Insured) | | 2,000 | | 1,710 |
Texas Tpk. Auth. Central Tpk. Sys. Rev.: | | | | |
Series A, 0% 8/15/25 (AMBAC Insured) | | 16,000 | | 5,114 |
5.5% 8/15/39 (AMBAC Insured) | | 37,550 | | 40,518 |
5.75% 8/15/38 (AMBAC Insured) (d) | | 27,000 | | 29,880 |
Texas Tpk. Auth. Dallas North Tollway Rev.: | | | | |
0% 1/1/10 (Escrowed to Maturity) (i) | | 3,000 | | 2,490 |
5.25% 1/1/23 (FGIC Insured) | | 18,775 | | 19,680 |
Travis County Health Facilities Dev. Corp. Rev. (Ascension Health Cr. Prog.) Series A, 6.25% 11/15/18 (Pre-Refunded to 11/15/09 @ 101) (i) | | 15,550 | | 18,749 |
Trinity River Auth. Rev. (Tarrant Cnty. Wtr. Proj.): | | | | |
5.5% 2/1/19 (MBIA Insured) | | 1,665 | | 1,838 |
5.5% 2/1/22 (MBIA Insured) | | 2,000 | | 2,167 |
Tyler Health Facilities Dev. Corp. Hosp. Rev. (Mother Frances Hosp. Reg'l. Health Care Ctr. Proj.) 6% 7/1/31 | | 6,225 | | 6,388 |
United Independent School District 5.25% 8/15/22 | | 4,340 | | 4,625 |
Municipal Bonds - continued |
| Principal
Amount (000s) | | Value (Note 1)
(000s) |
Texas - continued |
Weatherford Independent School District: | | | | |
Series 2000, 0% 2/15/25 (Pre-Refunded to 2/15/10 @ 36.782) (i) | | $ 6,155 | | $ 1,872 |
0% 2/15/22 (Pre-Refunded to 2/15/10 @ 45.084) (i) | | 2,980 | | 1,111 |
0% 2/15/26 (Pre-Refunded to 2/15/10 @ 34.41) (i) | | 2,985 | | 849 |
0% 2/15/33 | | 6,985 | | 1,464 |
Wichita Falls Wtr. & Swr. Rev. Series 2001, 5.375% 8/1/24 (AMBAC Insured) | | 3,000 | | 3,187 |
| | 670,117 |
Utah - 2.7% |
Intermountain Pwr. Agcy. Pwr. Supply Rev.: | | | | |
Series A: | | | | |
6% 7/1/16 (AMBAC Insured) | | 5,640 | | 6,413 |
6% 7/1/16 (Escrowed to Maturity) (i) | | 9,705 | | 10,923 |
6.5% 7/1/10 (AMBAC Insured) | | 300 | | 363 |
Series B: | | | | |
5.75% 7/1/16 (MBIA Insured) | | 30,260 | | 34,111 |
6% 7/1/16 (MBIA Insured) | | 29,500 | | 32,886 |
Series D, 5% 7/1/21 (MBIA Insured) | | 12,100 | | 12,567 |
Salt Lake City Hosp. Rev. (Intermountain Health Care Hosp., Inc. Proj.) Series A, 8.125% 5/15/15 (Escrowed to Maturity) (i) | | 2,975 | | 3,968 |
Salt Lake County Hosp. Rev. (IHC Health Svcs., Inc. Proj.): | | | | |
5.5% 5/15/10 (AMBAC Insured) | | 5,400 | | 6,173 |
5.5% 5/15/11 (AMBAC Insured) | | 9,100 | | 10,444 |
Utah Associated Muni. Pwr. Sys. Rev. (Payson Pwr. Proj.) Series A: | | | | |
5.25% 4/1/16 (FSA Insured) | | 2,590 | | 2,860 |
5.25% 4/1/17 (FSA Insured) | | 2,335 | | 2,565 |
Utah Board of Regents Student Ln. Rev. Series H, 4.65% 5/1/06 (h) | | 5,000 | | 5,235 |
| | 128,508 |
Vermont - 0.3% |
Vermont Edl. & Health Bldgs. Fing. Agcy. Rev. (Fletcher Allen Health Care, Inc. Proj.): | | | | |
Series 2000 A, 6.125% 12/1/27 (AMBAC Insured) | | 8,600 | | 9,961 |
Series A, 5.75% 12/1/18 (AMBAC Insured) | | 3,100 | | 3,537 |
| | 13,498 |
Municipal Bonds - continued |
| Principal
Amount (000s) | | Value (Note 1)
(000s) |
Virginia - 0.7% |
Hampton Museum Rev.: | | | | |
5.25% 1/1/09 | | $ 3,360 | | $ 3,439 |
5.25% 1/1/14 | | 4,500 | | 4,606 |
Loudoun County Indl. Dev. Auth. Residential Care Facilities Rev. (Falcons Landing Proj.) Series A, 9.25% 11/1/04 (Escrowed to Maturity) (i) | | 300 | | 320 |
Peninsula Ports Auth. Hosp. Facilities Rev. (Whittaker Memorial Hosp. Proj.) 8.7% 8/1/23 | | 1,490 | | 1,833 |
Virginia Beach Dev. Auth. Hosp. Facilities Rev. (Virginia Beach Gen. Hosp. Proj.): | | | | |
6% 2/15/12 (AMBAC Insured) | | 2,150 | | 2,547 |
6% 2/15/13 (AMBAC Insured) | | 1,460 | | 1,737 |
Virginia Commonwealth Trans. Board Trans. Rev. (U.S. Route 58 Corridor Dev. Prog.) Series B: | | | | |
5.375% 5/15/12 | | 4,700 | | 5,315 |
5.75% 5/15/21 | | 10,000 | | 11,255 |
Virginia Hsg. Dev. Auth. Multi-family Hsg. Rev. Series I, 5.95% 5/1/09 (h) | | 1,890 | | 2,001 |
| | 33,053 |
Washington - 4.7% |
Douglas County Pub. Util. District #1 Wells Hydroelectric Rev. Series A, 8.75% 9/1/18 | | 2,790 | | 3,393 |
Energy Northwest Elec. Rev.: | | | | |
(#1 Proj.) Series 2001 A, 5.5% 7/1/12 (FSA Insured) | | 5,000 | | 5,718 |
(#3 Proj.) Series B, 6% 7/1/16 (AMBAC Insured) | | 28,000 | | 32,420 |
King County School District #411 Issaquah 6.25% 12/1/16 (FSA Insured) | | 2,000 | | 2,371 |
King County Swr. Rev. Series B, 5.125% 1/1/33 (FSA Insured) | | 22,390 | | 22,959 |
Port of Seattle Gen. Oblig. 5.8% 5/1/09 (h) | | 4,000 | | 4,129 |
Port of Seattle Rev.: | | | | |
Series B: | | | | |
5.5% 9/1/09 (FGIC Insured) (h) | | 4,010 | | 4,374 |
5.6% 9/1/10 (FGIC Insured) (h) | | 4,230 | | 4,619 |
Series D: | | | | |
5.75% 11/1/13 (FGIC Insured) (h) | | 1,500 | | 1,694 |
5.75% 11/1/14 (FGIC Insured) (h) | | 3,055 | | 3,416 |
5.75% 11/1/16 (FGIC Insured) (h) | | 2,250 | | 2,504 |
Seattle Wtr. Sys. Rev. Series B, 5.75% 7/1/23 (FGIC Insured) | | 3,175 | | 3,541 |
Municipal Bonds - continued |
| Principal
Amount (000s) | | Value (Note 1)
(000s) |
Washington - continued |
Snohomish County Pub. Hosp. District #2 (Stevens Health Care Proj.): | | | | |
4.5% 12/1/08 (FGIC Insured) | | $ 1,775 | | $ 1,930 |
4.5% 12/1/11 (FGIC Insured) | | 1,155 | | 1,248 |
Spokane Pub. Facilities District Hotel & Motel Tax & Sales Use Tax Rev. 5.75% 12/1/19 (MBIA Insured) | | 2,000 | | 2,290 |
Thurston & Pierce Counties Cmnty. Schools 5.25% 12/1/17 (FSA Insured) | | 2,000 | | 2,197 |
Washington Gen. Oblig.: | | | | |
Series 2000 A, 5.625% 7/1/24 | | 5,185 | | 5,622 |
Series R 97A, 0% 7/1/17 | | 7,015 | | 3,731 |
Washington Health Care Facilities Auth. Rev. (Providence Health Systems Proj.) Series A, 5.5% 10/1/12 (MBIA Insured) | | 5,455 | | 6,174 |
Washington Pub. Pwr. Supply Sys. Nuclear Proj. #1 Rev.: | | | | |
(Bonneville Pwr. Administration Proj.) Series B, 7% 7/1/08 | | 1,000 | | 1,183 |
Series A, 7% 7/1/08 | | 310 | | 367 |
Series B, 5.125% 7/1/13 | | 14,600 | | 15,721 |
5.75% 7/1/10 (MBIA Insured) | | 5,000 | | 5,544 |
Washington Pub. Pwr. Supply Sys. Nuclear Proj. #2 Rev.: | | | | |
Series A: | | | | |
0% 7/1/11 (Escrowed to Maturity) (i) | | 1,350 | | 1,018 |
5.125% 7/1/11 (FSA Insured) | | 10,420 | | 11,511 |
5.9% 7/1/04 | | 195 | | 200 |
6% 7/1/07 | | 2,500 | | 2,799 |
5.4% 7/1/12 | | 56,550 | | 63,662 |
Washington Pub. Pwr. Supply Sys. Nuclear Proj. #3 Rev.: | | | | |
Series A, 0% 7/1/12 (MBIA Insured) | | 4,000 | | 2,841 |
0% 7/1/08 (MBIA Insured) | | 3,000 | | 2,619 |
0% 7/1/10 (MBIA Insured) | | 2,800 | | 2,224 |
| | 224,019 |
West Virginia - 0.6% |
Marshall County Poll. Cont. Rev. (Ohio Pwr. Co./Kammer Plant Proj.) Series B, 5.45% 7/1/14 (MBIA Insured) | | 22,650 | | 23,197 |
West Virginia Wtr. Dev. Auth. Infrastructure Rev. Series A, 5.625% 10/1/26 (FSA Insured) | | 5,000 | | 5,451 |
| | 28,648 |
Municipal Bonds - continued |
| Principal
Amount (000s) | | Value (Note 1)
(000s) |
Wisconsin - 0.9% |
Badger Tobacco Asset Securitization Corp. 6.125% 6/1/27 | | $ 6,650 | | $ 6,532 |
Douglas County Gen. Oblig. 5.5% 2/1/19 (FGIC Insured) | | 3,155 | | 3,475 |
Fond Du Lac School District 5.75% 4/1/16 (FGIC Insured) | | 3,100 | | 3,543 |
Menomonee Falls Wtr. Sys. Mtg. Rev. 5.875% 12/1/16 (FSA Insured) | | 3,375 | | 3,739 |
Wisconsin Health & Edl. Facilities Auth. Rev. (Wheaton Franciscan Svcs., Inc. Proj.): | | | | |
Series A: | | | | |
5.5% 8/15/15 | | 1,480 | | 1,589 |
5.5% 8/15/16 | | 1,545 | | 1,641 |
5.75% 8/15/30 | | 15,000 | | 15,665 |
6.25% 8/15/22 | | 4,300 | | 4,673 |
Wisconsin Hsg. & Econ. Dev. Auth. Home Ownership Rev. Series F, 5.2% 9/1/26 (h) | | 420 | | 421 |
| | 41,278 |
Wyoming - 0.1% |
Gillette Spl. Purp. Wtr. & Swr. Utils. Sys. Rev. 7.7% 12/1/10 (MBIA Insured) (Escrowed to Maturity) (i) | | 5,190 | | 6,524 |
TOTAL MUNICIPAL BONDS (Cost $4,432,125) | 4,771,735 |
Money Market Funds - 0.3% |
| Shares | | |
Fidelity Municipal Cash Central Fund, 1.3% (f)(g)
(Cost $12,600) | 12,600,000 | | 12,600 |
TOTAL INVESTMENT PORTFOLIO - 100.0% (Cost $4,444,725) | | 4,784,335 |
NET OTHER ASSETS - 0.0% | | 8 |
NET ASSETS - 100% | $ 4,784,343 |
Futures Contracts |
| Expiration
Date | | Underlying
Face Amount
at Value (000s) | | Unrealized Appreciation/
(Depreciation)
(000s) |
Purchased |
Treasury Contracts |
278 US Treasury Bond Contracts | March 2004 | | $ 30,389 | | $ 107 |
|
The face value of futures purchased as a percentage of net assets - 0.6% |
Legend |
(a) Non-income producing - issuer filed for bankruptcy or is in default of interest payments. |
(b) Debt obligation initially issued in zero coupon form which converts to coupon form at a specified rate and date. The rate shown is the rate at period end. |
(c) Security or a portion of the security purchased on a delayed delivery or when-issued basis. |
(d) Security or a portion of the security was pledged to cover margin requirements for futures contracts. At the period end, the value of securities pledged amounted to $1,217,000. |
(e) The coupon rate shown on floating or adjustable rate securities represents the rate at period end. |
(f) Information in this report regarding holdings by state and security types does not reflect the holdings of the Fidelity Municipal Cash Central Fund. |
(g) The rate quoted is the annualized seven-day yield of the fund at period end. A complete listing of the fund's holdings as of its most recent fiscal year end is available upon request. |
(h) Private activity obligations whose interest is subject to the federal alternative minimum tax for individuals. |
(i) Security collateralized by an amount sufficient to pay interest and principal. |
Other Information |
The distribution of municipal securities by revenue source, as a percentage of total net assets, is as follows: |
General Obligations | 33.5% |
Electric Utilities | 16.4 |
Health Care | 11.3 |
Transportation | 10.5 |
Water & Sewer | 9.4 |
Escrowed/Pre-Refunded | 7.0 |
Others* (individually less than 5%) | 11.9 |
| 100.0% |
*Includes cash equivalents and net other assets |
Purchases and sales of securities, other than short-term securities, aggregated $1,087,248,000 and $1,237,566,000, respectively. |
Income Tax Information |
The fund hereby designates approximately $70,199,000 as a capital gain dividend for the purpose of the dividend paid deduction. |
See accompanying notes which are an integral part of the financial statements.
Annual Report
Financial Statements
Statement of Assets and Liabilities
Amounts in thousands (except per-share amount) | December 31, 2003 |
| | |
Assets | | |
Investment in securities, at value (cost $4,444,725) - See accompanying schedule | | $ 4,784,335 |
Cash | | 88 |
Receivable for fund shares sold | | 2,135 |
Interest receivable | | 68,890 |
Receivable for daily variation on futures contracts | | 35 |
Prepaid expenses | | 29 |
Other receivables | | 300 |
Total assets | | 4,855,812 |
| | |
Liabilities | | |
Payable for investments purchased
Regular delivery | $ 6,625 | |
Delayed delivery | 51,607 | |
Payable for fund shares redeemed | 5,595 | |
Distributions payable | 5,706 | |
Accrued management fee | 1,499 | |
Other affiliated payables | 355 | |
Other payables and accrued expenses | 82 | |
Total liabilities | | 71,469 |
| | |
Net Assets | | $ 4,784,343 |
Net Assets consist of: | | |
Paid in capital | | $ 4,437,569 |
Undistributed net investment income | | 2,625 |
Accumulated undistributed net realized gain (loss) on investments | | 4,432 |
Net unrealized appreciation (depreciation) on investments | | 339,717 |
Net Assets, for 363,004 shares outstanding | | $ 4,784,343 |
Net Asset Value, offering price and redemption price per share ($4,784,343 ÷ 363,004 shares) | | $ 13.18 |
See accompanying notes which are an integral part of the financial statements.
Annual Report
Financial Statements - continued
Statement of Operations
Amounts in thousands | Year ended December 31, 2003 |
| | |
Investment Income | | |
Interest | | $ 234,195 |
| | |
Expenses | | |
Management fee | $ 18,168 | |
Transfer agent fees | 3,603 | |
Accounting fees and expenses | 706 | |
Non-interested trustees' compensation | 28 | |
Custodian fees and expenses | 75 | |
Registration fees | 49 | |
Audit | 84 | |
Legal | 30 | |
Miscellaneous | 12 | |
Total expenses before reductions | 22,755 | |
Expense reductions | (127) | 22,628 |
Net investment income (loss) | | 211,567 |
Realized and Unrealized Gain (Loss) Net realized gain (loss) on: | | |
Investment securities | 80,430 | |
Futures contracts | 1,048 | |
Swap agreements | (1,802) | |
Total net realized gain (loss) | | 79,676 |
Change in net unrealized appreciation (depreciation) on: Investment securities | (23,849) | |
Futures contracts | 107 | |
Total change in net unrealized appreciation (depreciation) | | (23,742) |
Net gain (loss) | | 55,934 |
Net increase (decrease) in net assets resulting from operations | | $ 267,501 |
See accompanying notes which are an integral part of the financial statements.
Annual Report
Statement of Changes in Net Assets
Amounts in thousands | Year ended
December 31,
2003 | Year ended
December 31,
2002 |
Increase (Decrease) in Net Assets | | |
Operations | | |
Net investment income (loss) | $ 211,567 | $ 218,785 |
Net realized gain (loss) | 79,676 | 69,756 |
Change in net unrealized appreciation (depreciation) | (23,742) | 180,155 |
Net increase (decrease) in net assets resulting
from operations | 267,501 | 468,696 |
Distributions to shareholders from net investment income | (211,728) | (217,713) |
Distributions to shareholders from net realized gain | (72,466) | (57,604) |
Total distributions | (284,194) | (275,317) |
Share transactions
Net proceeds from sales of shares | 715,293 | 790,439 |
Reinvestment of distributions | 196,844 | 192,721 |
Cost of shares redeemed | (911,880) | (902,963) |
Net increase (decrease) in net assets resulting from share transactions | 257 | 80,197 |
Redemption fees | 76 | 89 |
Total increase (decrease) in net assets | (16,360) | 273,665 |
| | |
Net Assets | | |
Beginning of period | 4,800,703 | 4,527,038 |
End of period (including undistributed net investment income of $2,625 and undistributed net investment income of $3,105, respectively) | $ 4,784,343 | $ 4,800,703 |
Other Information Shares | | |
Sold | 54,068 | 60,633 |
Issued in reinvestment of distributions | 14,891 | 14,740 |
Redeemed | (69,173) | (69,130) |
Net increase (decrease) | (214) | 6,243 |
See accompanying notes which are an integral part of the financial statements.
Annual Report
Financial Highlights
Years ended December 31, | 2003 | 2002 | 2001 | 2000H | 2000G | 1999G |
Selected Per-Share Data | | | | | | |
Net asset value, beginning of period | $ 13.22 | $ 12.68 | $ 12.70 | $ 12.40 | $ 12.07 | $ 12.85 |
Income from Investment Operations | | | | | | |
Net investment income (loss) | .585D | .603D | .617D,F | .053D | .626D | .595 |
Net realized and unrealized gain (loss) | .162 | .697 | .011F | .303 | .337 | (.773) |
Total from investment
operations | .747 | 1.300 | .628 | .356 | .963 | (.178) |
Distributions from net investment income | (.585) | (.600) | (.613) | (.053) | (.627) | (.595) |
Distributions from net realized gain | (.202) | (.160) | (.035) | (.003) | (.006) | (.007) |
Total distributions | (.787) | (.760) | (.648) | (.056) | (.633) | (.602) |
Redemption fees added to paid in capital | -D,I | -D,I | -D,I | - | - | - |
Net asset value, end of period | $ 13.18 | $ 13.22 | $ 12.68 | $ 12.70 | $ 12.40 | $ 12.07 |
Total ReturnB,C | 5.80% | 10.48% | 5.00% | 2.87% | 8.24% | (1.44)% |
Ratios to Average Net AssetsE | | | | | | |
Expenses before expense
reductions | .48% | .48% | .47% | .47%A | .48% | .49% |
Expenses net of voluntary waivers, if any | .48% | .48% | .47% | .47%A | .48% | .49% |
Expenses net of all reductions | .47% | .46% | .43% | .42%A | .48% | .49% |
Net investment income (loss) | 4.42% | 4.62% | 4.80%F | 4.98%A | 5.17% | 4.77% |
Supplemental Data | | | | | | |
Net assets, end of period
(in millions) | $ 4,784 | $ 4,801 | $ 4,527 | $ 4,464 | $ 4,313 | $ 4,225 |
Portfolio turnover rate | 23% | 23% | 27% | 4%A | 26% | 28% |
A Annualized
B Total returns for periods of less than one year are not annualized.
C Total returns would have been lower had certain expenses not been reduced during the periods shown.
D Calculated based on average shares outstanding during the period.
E Expense ratios reflect operating expenses of the fund. Expenses before reductions do not reflect amounts reimbursed by the investment adviser or reductions from brokerage service arrangements or other expense offset arrangements and do not represent the amount paid by the fund during periods when reimbursements or reductions occur. Expenses net of any voluntary waivers reflect expenses after reimbursement by the investment adviser but prior to reductions from brokerage service arrangements or other expense offset arrangements. Expenses net of all reductions represent the net expenses paid by the fund.
F Effective January 1, 2001, the fund adopted the provisions of the AICPA Audit and Accounting Guide for Investment Companies and began amortizing premium and discount on all debt securities. Per-share data and ratios for periods prior to adoption have not been restated to reflect this change.
G For the year ended November 30.
H For the one month ended December 31, 2000.
I Amount represents less than $.001 per share.
See accompanying notes which are an integral part of the financial statements.
Annual Report
Notes to Financial Statements
For the period ended December 31, 2003
(Amounts in thousands except ratios)
1. Significant Accounting Policies.
Spartan Municipal Income Fund (the fund) is a fund of Fidelity Municipal Trust (the trust) and is authorized to issue an unlimited number of shares. The trust is registered under the Investment Company Act of 1940, as amended (the 1940 Act), as an open-end management investment company organized as a Massachusetts business trust. The financial statements have been prepared in conformity with accounting principles generally accepted in the United States of America, which require management to make certain estimates and assumptions at the date of the financial statements. The following summarizes the significant accounting policies of the fund:
Security Valuation. Net asset value per share (NAV calculation) is calculated as of the close of business of the New York Stock Exchange, normally 4:00 p.m. Eastern time. Debt securities are valued on the basis of information provided by a pricing service. Pricing services use valuation matrices that incorporate both dealer-supplied valuations and valuation models. If an event that is expected to materially affect the value of a security occurs after the close of an exchange or market on which that security trades, but prior to the NAV calculation, then that security will be fair valued taking the event into account. Securities (including restricted securities) for which market quotations are not readily available are valued at their fair value as determined in good faith under consistently applied procedures under the general supervision of the Board of Trustees. Price movements in futures contracts and ADRs, market and trading trends, the bid/ask quotes of brokers and off-exchange institutional trading may be reviewed in the course of making a good faith determination of a security's fair value. Short-term securities with remaining maturities of sixty days or less for which quotations are not readily available are valued on the basis of amortized cost. Investments in open-end investment companies are valued at their net asset value each business day.
Investment Transactions and Income. Security transactions are accounted for as of trade date. Gains and losses on securities sold are determined on the basis of identified cost. Interest income is accrued as earned. Interest income includes coupon interest and amortization of premium and accretion of discount on debt securities, which is accrued using the interest method. Debt obligations may be placed on non-accrual status and related interest income may be reduced by ceasing current accruals and writing off interest receivables when the collection of all or a portion of interest has become doubtful based on consistently applied procedures. A debt obligation is removed from non-accrual status when the issuer resumes interest payments or when collectibility of interest is reasonably assured.
Expenses. Most expenses of the trust can be directly attributed to a fund. Expenses which cannot be directly attributed are apportioned among the funds in the trust.
Annual Report
Notes to Financial Statements - continued
(Amounts in thousands except ratios)
1. Significant Accounting Policies - continued
Income Tax Information and Distributions to Shareholders. Each year, the fund intends to qualify as a regulated investment company by distributing all of its taxable income and realized gains under Subchapter M of the Internal Revenue Code. As a result, no provision for income taxes is required in the accompanying financial statements. Dividends are declared daily and paid monthly from net investment income. Distributions from realized gains, if any, are recorded on the ex-dividend date.
Income and capital gain distributions are determined in accordance with income tax regulations, which may differ from generally accepted accounting principles. In addition, the fund will treat a portion of the proceeds from shares redeemed as a distribution from net investment income and realized gain for income tax purposes. Capital accounts within the financial statements are adjusted for permanent and temporary book and tax differences. These adjustments have no impact on net assets or the results of operations. Temporary differences will reverse in a subsequent period. These differences are primarily due to futures transactions, market discount and losses deferred due to wash sales and futures transactions.
The tax-basis components of distributable earnings and the federal tax cost as of period end were as follows:
Unrealized appreciation | $ 343,545 | | |
Unrealized depreciation | (8,677) | |
Net unrealized appreciation (depreciation) | 334,868 | |
Undistributed long-term capital gain | 4,569 | |
| | |
Cost for federal income tax purposes | $ 4,449,467 | |
The tax character of distributions paid was as follows:
| December 31,
2003 | December 31,
2002 |
Tax-exempt Income | $ 211,728 | $ 217,713 |
Ordinary Income | 3,582 | - |
Long-term Capital Gains | 68,884 | 57,604 |
Total | $ 284,194 | $ 275,317 |
Short-Term Trading (Redemption) Fees. Shares held in the fund less than 30 days are subject to a short-term trading fee equal to .50% of the proceeds of the redeemed shares. The fee, which is retained by the fund, is accounted for as an addition to paid in capital.
Annual Report
2. Operating Policies.
Delayed Delivery Transactions and When-Issued Securities. The fund may purchase or sell securities on a delayed delivery or when-issued basis. Payment and delivery may take place after the customary settlement period for that security. The price of the underlying securities and the date when the securities will be delivered and paid for are fixed at the time the transaction is negotiated. During the time a delayed delivery sell is outstanding, the contract is marked-to-market daily and equivalent deliverable securities are held for the transaction. The value of the securities purchased on a delayed delivery or when-issued basis are identified as such in the fund's Schedule of Investments. The fund may receive compensation for interest forgone in the purchase of a delayed delivery or when-issued security. With respect to purchase commitments, the fund identifies securities as segregated in its records with a value at least equal to the amount of the commitment. Losses may arise due to changes in the value of the underlying securities or if the counterparty does not perform under the contract's terms, or if the issuer does not issue the securities due to political, economic, or other factors.
Futures Contracts. The fund may use futures contracts to manage its exposure to the bond market and to fluctuations in interest rates and currency values. Buying futures tends to increase the fund's exposure to the underlying instrument, while selling futures tends to decrease the fund's exposure to the underlying instrument or hedge other fund investments. Futures contracts involve, to varying degrees, risk of loss in excess of any futures variation margin reflected in the Statement of Assets and Liabilities. The underlying face amount at value of any open futures contracts at period end is shown in the Schedule of Investments under the caption "Futures Contracts." This amount reflects each contract's exposure to the underlying instrument at period end. Losses may arise from changes in the value of the underlying instruments or if the counter-parties do not perform under the contracts' terms. Gains (losses) are realized upon the expiration or closing of the futures contracts. Futures contracts are valued at the settlement price established each day by the board of trade or exchange on which they are traded.
Swap Agreements. The fund may invest in swaps for the purpose of managing its exposure to interest rate, credit or market risk.
Interest rate swaps are agreements to exchange cash flows periodically based on a notional principal amount, for example, the exchange of fixed rate interest payments for floating rate interest payments. The primary risk associated with interest rate swaps is that unfavorable changes in the fluctuation of interest rates could adversely impact the fund.
Swaps are marked-to-market daily based on dealer-supplied valuations and changes in value are recorded as unrealized appreciation (depreciation). Gains or losses are realized upon early termination of the swap agreement. Collateral, in the form of cash or securities, may be required to be held in segregated accounts with the fund's custodian in compliance with swap contracts.
Annual Report
Notes to Financial Statements - continued
(Amounts in thousands except ratios)
3. Purchases and Sales of Investments.
Annual Report
Information regarding purchases and sales of securities is included under the caption "Other Information" at the end of the fund's Schedule of Investments.
4. Fees and Other Transactions with Affiliates.
Management Fee. Fidelity Management & Research Company (FMR) and its affiliates provide the fund with investment management related services for which the fund pays a monthly management fee. The management fee is the sum of an individual fund fee rate that is based on an annual rate of .25% of the fund's average net assets and a group fee rate that averaged .13% during the period. The group fee rate is based upon the average net assets of all the mutual funds advised by FMR. The group fee rate decreases as assets under management increase and increases as assets under management decrease. For the period, the total annual management fee rate was .38% of the fund's average net assets.
Transfer Agent and Accounting Fees. Citibank, N.A. (Citibank) is the custodian, transfer agent and shareholder servicing agent for the fund. Citibank has entered into a sub-contract with Fidelity Service Company, Inc. (FSC), an affiliate of FMR, under which FSC performs the activities associated with the fund's transfer and shareholder servicing agent and accounting functions. The fund pays account fees and asset-based fees that vary according to account size and type of account. FSC pays for typesetting, printing and mailing of all shareholder reports, except proxy statements. The accounting fee is based on the level of average net assets for the month plus out-of-pocket expenses.
For the period, the transfer agent fees were equivalent to an annual rate of .08% of average net assets.
Central Funds. The fund may invest in affiliated Central Funds managed by Fidelity Investments Money Management, Inc. (FIMM), an affiliate of FMR. The Central Funds are open-end investment companies available only to investment companies and other accounts managed by FMR and its affiliates. The Central Funds seek preservation of capital and current income and do not pay a management fee. Income distributions earned by the fund are recorded as income in the accompanying financial statements and totaled $109 for the period.
5. Expense Reductions.
Through arrangements with the fund's custodian and transfer agent, credits realized as a result of uninvested cash balances were used to reduce the fund's expenses. During the period, these credits reduced the fund's custody and transfer agent expenses by $52 and $75, respectively.
Annual Report
Report of Independent Auditors
To the Trustees of Fidelity Municipal Trust and the Shareholders of Spartan Municipal Income Fund:
In our opinion, the accompanying statement of assets and liabilities, including the schedule of investments, and the related statements of operations and of changes in net assets and the financial highlights present fairly, in all material respects, the financial position of Spartan Municipal Income Fund (a fund of Fidelity Municipal Trust) at December 31, 2003 and the results of its operations, the changes in its net assets and the financial highlights for the periods indicated, in conformity with accounting principles generally accepted in the United States of America. These financial statements and financial highlights (hereafter referred to as "financial statements") are the responsibility of the Spartan Municipal Income Fund's management; our responsibility is to express an opinion on these financial statements based on our audits. We conducted our audits of these financial statements in accordance with auditing standards generally accepted in the United States of America which require that we plan and perform the audit to obtain reasonable assurance about whether the financial statements are free of material misstatement. An audit includes examining, on a test basis, evidence supporting the amounts and disclosures in the financial statements, assessing the accounting principles used and significant estimates made by management, and evaluating the overall financial statement presentation. We believe that our audits, which included confirmation of securities at December 31, 2003 by correspondence with the custodian and brokers, provide a reasonable basis for our opinion.
/s/ PricewaterhouseCoopers LLP
PricewaterhouseCoopers LLP
Boston, Massachusetts
February 11, 2004
Annual Report
Trustees and Officers
The Trustees , Members of the Advisory Board, and executive officers of the trust and funds, as applicable, are listed below. The Board of Trustees governs the fund and is responsible for protecting the interests of shareholders. The Trustees are experienced executives who meet periodically throughout the year to oversee the fund's activities, review contractual arrangements with companies that provide services to the fund, and review the fund's performance. Except for William O. McCoy, each of the Trustees oversees 292 funds advised by FMR or an affiliate. Mr. McCoy oversees 294 funds advised by FMR or an affiliate.
The Trustees hold office without limit in time except that (a) any Trustee may resign; (b) any Trustee may be removed by written instrument, signed by at least two-thirds of the number of Trustees prior to such removal; (c) any Trustee who requests to be retired or who has become incapacitated by illness or injury may be retired by written instrument signed by a majority of the other Trustees; and (d) any Trustee may be removed at any special meeting of shareholders by a two-thirds vote of the outstanding voting securities of the trust. In any event, each non-interested Trustee shall retire not later than the last day of the calendar year in which his or her 72nd birthday occurs. The executive officers and Advisory Board Members hold office without limit in time, except that any officer and Advisory Board Member may resign or may be removed by a vote of a majority of the Trustees at any regular meeting or any special meeting of the Trustees. Except as indicated, each individual has held the office shown or other offices in the same company for the past five years.
The fund's Statement of Additional Information (SAI) includes more information about the Trustees. To request a free copy, call Fidelity at 1-800-544-8544.
Interested Trustees*:
Correspondence intended for each Trustee who is an "interested person" (as defined in the 1940 Act) may be sent to 82 Devonshire Street, Boston, Massachusetts 02109.
Name, Age; Principal Occupation |
Edward C. Johnson 3d (73)** |
| Year of Election or Appointment: 1984 Mr. Johnson is Chairman of the Board of Trustees. Mr. Johnson serves as Chief Executive Officer, Chairman, and a Director of FMR Corp.; a Director and Chairman of the Board and of the Executive Committee of FMR; Chairman and a Director of Fidelity Management & Research (Far East) Inc.; Chairman (1998) and a Director of Fidelity Investments Money Management, Inc.; and Chairman (2001) and a Director (2000) of FMR Co., Inc. |
Abigail P. Johnson (42)** |
| Year of Election or Appointment: 2001 Senior Vice President of Spartan Municipal Income (2001). Ms. Johnson also serves as Senior Vice President of other Fidelity funds (2001). She is President and a Director of FMR (2001), Fidelity Investments Money Management, Inc. (2001), FMR Co., Inc. (2001), and a Director of FMR Corp. Previously, Ms. Johnson managed a number of Fidelity funds. |
Laura B. Cronin (49) |
| Year of Election or Appointment: 2003 Ms. Cronin is an Executive Vice President (2002) and Chief Financial Officer (2002) of FMR Corp. and is a member of the Fidelity Management Committee (2003). Previously, Ms. Cronin served as Vice President of Finance of FMR (1997-1999), and Chief Financial Officer of FMR (1999-2001), Fidelity Personal Investments (2001), and Fidelity Brokerage Company (2001-2002). |
Robert L. Reynolds (51) |
| Year of Election or Appointment: 2003 Mr. Reynolds is a Director (2003) and Chief Operating Officer (2002) of FMR Corp. and is the head of the Fidelity Management Committee (2003). He also serves on the Board at Fidelity Investments Canada, Ltd. (2000). Previously, Mr. Reynolds served as President of Fidelity Investments Institutional Retirement Group (1996-2000). |
* Trustees have been determined to be "Interested Trustees" by virtue of, among other things, their affiliation with the trust or various entities under common control with FMR.
** Edward C. Johnson 3d, Trustee, is Abigail P. Johnson's father.
Annual Report
Non-Interested Trustees:
Correspondence intended for each non-interested Trustee (that is, the Trustees other than the Interested Trustees) may be sent to Fidelity Investments, P.O. Box 55235, Boston, Massachusetts 02205-5235.
Name, Age; Principal Occupation |
J. Michael Cook (61) |
| Year of Election or Appointment: 2001 Prior to Mr. Cook's retirement in May 1999, he served as Chairman and Chief Executive Officer of Deloitte & Touche LLP (accounting/consulting), Chairman of the Deloitte & Touche Foundation, and a member of the Board of Deloitte Touche Tohmatsu. He currently serves as a Director of Comcast (telecommunications, 2002), International Flavors & Fragrances, Inc. (2000), Rockwell Automation (2000), and The Dow Chemical Company (2000). He is a Member of the Diversity Advisory Council of Marakon (2003) and the Advisory Board of the Directorship Search Group, Chairman Emeritus of the Board of Catalyst (a leading organization for the advancement of women in business), and is Chairman of the Accountability Advisory Council to the Comptroller General of the United States. He also serves as a Member of the Advisory Board of the Graduate School of Business of the University of Florida, his alma mater. |
Ralph F. Cox (71) |
| Year of Election or Appointment: 1991 Mr. Cox is President of RABAR Enterprises (management consulting for the petroleum industry). Prior to February 1994, he was President of Greenhill Petroleum Corporation (petroleum exploration and production). Until March 1990, Mr. Cox was President and Chief Operating Officer of Union Pacific Resources Company (exploration and production). He is a Director of CH2M Hill Companies (engineering), and Abraxas Petroleum (petroleum exploration and production, 1999). In addition, he is a member of advisory boards of Texas A&M University and the University of Texas at Austin. |
Robert M. Gates (60) |
| Year of Election or Appointment: 1997 Dr. Gates is President of Texas A&M University (2002). He was Director of the Central Intelligence Agency (CIA) from 1991 to 1993. From 1989 to 1991, Dr. Gates served as Assistant to the President of the United States and Deputy National Security Advisor. Dr. Gates is a Director of NACCO Industries, Inc. (mining and manufacturing), and Parker Drilling Co., Inc. (drilling and rental tools for the energy industry, 2001). He also serves as a member of the Advisory Board of VoteHere.net (secure internet voting, 2001). Previously, Dr. Gates served as a Director of LucasVarity PLC (automotive components and diesel engines), a Director of TRW Inc. (automotive, space, defense, and information technology), and Dean of the George Bush School of Government and Public Service at Texas A&M University (1999-2001). Dr. Gates also is a Trustee of the Forum for International Policy. |
George H. Heilmeier (67) |
| Year of Election or Appointment: 2004 Dr. Heilmeier is Chairman Emeritus of Telcordia Technologies (communication software and systems), where prior to his retirement, he served as company Chairman and Chief Executive Officer. He currently serves on the Boards of Directors of The Mitre Corporation (systems engineering and information technology support for the government), INET Technologies Inc. (telecommunications network surveillance, 2001) and Teletech Holdings (customer management services, 1998). He is Chairman of the General Motors Technology Advisory Committee and a Life Fellow of the IEEE (2000). Dr. Heilmeier is a member of the Defense Science Board and the National Security Agency Advisory Board. He is also a member of the National Academy of Engineering, the American Academy of Arts and Sciences and The Board of Overseers of the School of Engineering and Applied Science of the University of Pennsylvania. Previously, Dr. Heilmeier served as a Director of TRW Inc. (automotive, space, defense, and information technology, 1992-2002) and Compaq (1994-2002). |
Donald J. Kirk (71) |
| Year of Election or Appointment: 1987 Mr. Kirk is a Governor of the American Stock Exchange (2001), a Trustee and former Chairman of the Board of Trustees of the Greenwich Hospital Association, a Director of the Yale-New Haven Health Services Corp. (1998), and a Director Emeritus and former Chairman of the Board of Directors of National Arts Strategies Inc. Mr. Kirk was an Executive-in-Residence (1995-2000) and a Professor (1987-1995) at Columbia University Graduate School of Business. Prior to 1987, he was Chairman of the Financial Accounting Standards Board. Previously, Mr. Kirk served as a Governor of the National Association of Securities Dealers, Inc. (1996-2002), a member and Vice Chairman of the Public Oversight Board of the American Institute of Certified Public Accountants' SEC Practice Section (1995-2002), a Director of General Re Corporation (reinsurance, 1987-1998) and as a Director of Valuation Research Corp. (appraisals and valuations). |
Marie L. Knowles (57) |
| Year of Election or Appointment: 2001 Prior to Ms. Knowles' retirement in June 2000, she served as Executive Vice President and Chief Financial Officer of Atlantic Richfield Company (ARCO) (diversified energy, 1996-2000). From 1993 to 1996, she was a Senior Vice President of ARCO and President of ARCO Transportation Company. She served as a Director of ARCO from 1996 to 1998. She currently serves as a Director of Phelps Dodge Corporation (copper mining and manufacturing), URS Corporation (multidisciplinary engineering, 1999), and McKesson Corporation (healthcare service, 2002). Ms. Knowles is a Trustee of the Brookings Institution and the Catalina Island Conservancy and also serves as a member of the Advisory Board for the School of Engineering of the University of Southern California. |
Ned C. Lautenbach (59) |
| Year of Election or Appointment: 2000 Mr. Lautenbach has been a partner of Clayton, Dubilier & Rice, Inc. (private equity investment firm) since September 1998. Previously, Mr. Lautenbach was with the International Business Machines Corporation (IBM) from 1968 until his retirement in 1998. He was most recently Senior Vice President and Group Executive of Worldwide Sales and Services. From 1993 to 1995, he was Chairman of IBM World Trade Corporation, and from 1994 to 1998 was a member of IBM's Corporate Executive Committee. Mr. Lautenbach serves as Chairman and as a Director (1998) of Acterna Corporation (communications test equipment). He is also Co-Chairman of Covansys, Inc. (global provider of business and technology solutions, 2000). In addition, he is a Director of Eaton Corporation (diversified industrial) and the Philharmonic Center for the Arts in Naples, Florida (1999). He also is a member of the Council on Foreign Relations. |
Marvin L. Mann (70) |
| Year of Election or Appointment: 1993 Mr. Mann is Chairman of the non-interested Trustees (2001). He is Chairman Emeritus of Lexmark International, Inc. (computer peripherals) where he served as CEO until April 1998 and retired as Chairman May 1999, and remains a member of the Board. Prior to 1991, he held the positions of Vice President of International Business Machines Corporation (IBM) and President and General Manager of various IBM divisions and subsidiaries. Mr. Mann is a Board member of Imation Corp. (imaging and information storage) and Acterna Corporation (communications test equipment, 1999). He is also a member of the Director Services Committee of the Investment Company Institute. In addition, Mr. Mann is a member of the President's Cabinet at the University of Alabama and the Board of Visitors of the Culverhouse College of Commerce and Business Administration at the University of Alabama. |
William O. McCoy (70) |
| Year of Election or Appointment: 1997 Prior to his retirement in December 1994, Mr. McCoy was Vice Chairman of the Board of BellSouth Corporation (telecommunications) and President of BellSouth Enterprises. He is currently a Director of Liberty Corporation (holding company), Duke Realty Corporation (real estate), Progress Energy, Inc. (electric utility), and Acterna Corporation (communications test equipment, 1999). He is also a partner of Franklin Street Partners (private investment management firm) and a member of the Research Triangle Foundation Board. In addition, Mr. McCoy served as the Interim Chancellor (1999-2000) and a member of the Board of Visitors (1994-1998) for the University of North Carolina at Chapel Hill and currently serves on the Board of Directors of the University of North Carolina Health Care System and the Board of Visitors of the Kenan-Flagler Business School (University of North Carolina at Chapel Hill). He also served as Vice President of Finance for the University of North Carolina (16-school system, 1995-1998). |
William S. Stavropoulos (64) |
| Year of Election or Appointment: 2002 Mr. Stavropoulos is Chairman of the Board, President and CEO (2002), and Chairman of the Executive Committee (2000) and a Director of The Dow Chemical Company. Since joining The Dow Chemical Company in 1967, Mr. Stavropoulos served in numerous senior management positions, including President (1993-2000) and Chief Executive Officer (1995-2000). Currently, he is a Director of NCR Corporation (data warehousing and technology solutions), BellSouth Corporation (telecommunications), Chemical Financial Corporation, and Maersk Inc. (industrial conglomerate, 2002). He also serves as a member of the Board of Trustees of the American Enterprise Institute for Public Policy Research. In addition, Mr. Stavropoulos is a member of The Business Council, J.P. Morgan International Council, World Business Council for Sustainable Development, and the University of Notre Dame Advisory Council for the College of Science. |
Annual Report
Trustees and Officers - continued
Advisory Board Members and Executive Officers:
Correspondence intended for Ms. Small may be sent to Fidelity Investments, P.O. Box 55235, Boston, Massachusetts 02205-5235. Correspondence intended for each executive officer and Mr. Lynch may be sent to 82 Devonshire Street, Boston, Massachusetts 02109.
Name, Age; Principal Occupation |
Peter S. Lynch (60) |
| Year of Election or Appointment: 2003 Member of the Advisory Board of Fidelity Municipal Trust. Vice Chairman and a Director of FMR, and Vice Chairman (2001) and a Director (2000) of FMR Co., Inc. Previously, Mr. Lynch served as a Trustee of the Fidelity funds (1990-2003). Prior to May 31, 1990, he was a Director of FMR and Executive Vice President of FMR (a position he held until March 31, 1991), Vice President of Fidelity® Magellan® Fund and FMR Growth Group Leader, and Managing Director of FMR Corp. Mr. Lynch was also Vice President of Fidelity Investments Corporate Services. In addition, he serves as a Trustee of Boston College, Massachusetts Eye & Ear Infirmary, Historic Deerfield, John F. Kennedy Library, and the Museum of Fine Arts of Boston. |
Cornelia M. Small (59) |
| Year of Election or Appointment: 2004 Member of the Advisory Board of Fidelity Municipal Trust. Ms. Small is a member (2000) and Chairperson (2002) of the Investment Committee, and a member (2002) of the Board of Trustees of Smith College. Previously, she served as Chief Investment Officer (1999-2000), Director of Global Equity Investments (1996-1999), and a member of the Board of Directors (1998-1999) of Scudder Kemper Investments. In addition, Ms. Small served as Co-Chair (2000-2003) of the Annual Fund for the Fletcher School of Law and Diplomacy. |
Dwight D. Churchill (50) |
| Year of Election or Appointment: 1997 Vice President of Spartan Municipal Income. He serves as Head of Fidelity's Fixed-Income Division (2000), Vice President of Fidelity's Money Market Funds (2000), Vice President of Fidelity's Bond Funds (1997), and Senior Vice President of FIMM (2000) and FMR (1997). Mr. Churchill joined Fidelity in 1993 as Vice President and Group Leader of Taxable Fixed-Income Investments. |
Charles S. Morrison (43) |
| Year of Election or Appointment: 2002 Vice President of Spartan Intermediate Municipal Income and Spartan Municipal Income. Mr. Morrison also serves as Vice President of Fidelity's Bond Funds (2002), and Vice President of certain Asset Allocation and Balanced Funds (2002). He serves as Vice President (2002) and Bond Group Leader (2002) of Fidelity Investments Fixed Income Division. Mr. Morrison is also Vice President of FIMM (2002) and FMR (2002). Mr. Morrison joined Fidelity in 1987 as a Corporate Bond Analyst in the Fixed Income Research Division. |
Christine J. Thompson (45) |
| Year of Election or Appointment: 2002 Vice President of Spartan Municipal Income. Ms. Thompson also serves as Vice President of other funds advised by FMR. Prior to assuming her current responsibilities, Ms. Thompson managed a variety of Fidelity funds. |
Eric D. Roiter (55) |
| Year of Election or Appointment: 1998 Secretary of Spartan Municipal Income. He also serves as Secretary of other Fidelity funds (1998); Vice President, General Counsel, and Clerk of FMR Co., Inc. (2001) and FMR (1998); Vice President and Clerk of FDC (1998); Assistant Clerk of Fidelity Management & Research (U.K.) Inc. (2001) and Fidelity Management & Research (Far East) Inc. (2001); and Assistant Secretary of Fidelity Investments Money Management Inc. (2001). Prior to joining Fidelity, Mr. Roiter was with the law firm of Debevoise & Plimpton, as an associate (1981-1984) and as a partner (1985-1997), and served as an Assistant General Counsel of the U.S. Securities and Exchange Commission (1979-1981). Mr. Roiter is an Adjunct Member, Faculty of Law, at Boston College Law School (2003). |
Stuart Fross (44) |
| Year of Election or Appointment: 2003 Assistant Secretary of Spartan Municipal Income. Mr. Fross also serves as Assistant Secretary of other Fidelity funds (2003) and is an employee of FMR. |
Maria F. Dwyer (45) |
| Year of Election or Appointment: 2002 President and Treasurer of Spartan Municipal Income. Ms. Dwyer also serves as President and Treasurer of other Fidelity funds (2002) and is a Vice President (1999) and an employee (1996) of FMR. |
Timothy F. Hayes (53) |
| Year of Election or Appointment: 2002 Chief Financial Officer of Spartan Municipal Income. Mr. Hayes also serves as Chief Financial Officer of other Fidelity funds (2002). Recently he was appointed President of Fidelity Service Company (2003) where he also serves as a Director. Mr. Hayes also serves as President of Fidelity Investments Operations Group (FIOG, 2002), which includes Fidelity Pricing and Cash Management Services Group (FPCMS), where he was appointed President in 1998. Previously, Mr. Hayes served as Chief Financial Officer of Fidelity Investments Corporate Systems and Service Group (1998) and Fidelity Systems Company (1997-1998). |
Jennifer S. Taub (37) |
| Year of Election or Appointment: 2003 Assistant Vice President of Spartan Municipal Income. Ms. Taub is Assistant Vice President of Fidelity's Fixed-Income Funds (2003), Assistant Secretary of FIMM (2003), and is an employee of FMR. |
John R. Hebble (45) |
| Year of Election or Appointment: 2003 Deputy Treasurer of Spartan Municipal Income. Mr. Hebble also serves as Deputy Treasurer of other Fidelity funds (2003), and is an employee of FMR. Before joining Fidelity Investments, Mr. Hebble worked at Deutsche Asset Management where he served as Director of Fund Accounting (2002-2003) and Assistant Treasurer of the Scudder Funds (1998-2003). |
John H. Costello (57) |
| Year of Election or Appointment: 1986 Assistant Treasurer of Spartan Municipal Income. Mr. Costello also serves as Assistant Treasurer of other Fidelity funds and is an employee of FMR. |
Francis V. Knox, Jr. (56) |
| Year of Election or Appointment: 2002 Assistant Treasurer of Spartan Municipal Income. Mr. Knox also serves as Assistant Treasurer of other Fidelity funds (2002), and is a Vice President and an employee of FMR. Previously, Mr. Knox served as Vice President of Investment & Advisor Compliance (1990-2001), and Compliance Officer of Fidelity Management & Research (U.K.) Inc. (1992-2002), Fidelity Management & Research (Far East) Inc. (1991-2002), and FMR Corp. (1995-2002). |
Mark Osterheld (48) |
| Year of Election or Appointment: 2002 Assistant Treasurer of Spartan Municipal Income. Mr. Osterheld also serves as Assistant Treasurer of other Fidelity funds (2002) and is an employee of FMR. |
Thomas J. Simpson (45) |
| Year of Election or Appointment: 1996 Assistant Treasurer of Spartan Municipal Income. Mr. Simpson is Assistant Treasurer of other Fidelity funds (2000) and an employee of FMR (1996). Prior to joining FMR, Mr. Simpson was Vice President and Fund Controller of Liberty Investment Services (1987-1995). |
Annual Report
Distributions
The Board of Trustees of Spartan Municipal Income Fund voted to pay on February 9, 2004, to shareholders of record at the opening of business on February 6, 2004, a distribution of $.015 per share derived from capital gains realized from sales of portfolio securities.
During fiscal year ended 2003, 100% of the fund's income dividends was free from federal income tax, and 8.29% of the fund's income dividends was subject to the federal alternative minimum tax.
The fund will notify shareholders in January 2004 of amounts for use in preparing 2003 income tax returns.
Annual Report
Managing Your Investments
Fidelity offers several ways to conveniently manage your personal investments via your telephone or PC. You can access your account information, conduct trades and research your investments 24 hours a day.
By Phone
Fidelity Automated Service Telephone provides a single toll-free number to access account balances, positions, quotes and trading. It's easy to navigate the service, and on your first call, the system will help you create a personal identification number (PIN) for security.
(phone_graphic)Fidelity Automated
Service Telephone (FAST®)
1-800-544-5555
Press
1 For mutual fund and brokerage trading.
2 For quotes.*
3 For account balances and holdings.
4 To review orders and mutual
fund activity.
5 To change your PIN.
*0 To speak to a Fidelity representative.
By PC
Fidelity's web site on the Internet provides a wide range of information, including daily financial news, fund performance, interactive planning tools and news about Fidelity products and services.
(computer_graphic)Fidelity's Web Site
www.fidelity.com
* When you call the quotes line, please remember that a fund's yield and return will vary and, except for money market funds, share price will also vary. This means that you may have a gain or loss when you sell your shares. There is no assurance that money market funds will be able to maintain a stable $1 share price; an investment in a money market fund is not insured or guaranteed by the U.S. government. Total returns are historical and include changes in share price, reinvestment of dividends and capital gains, and the effects of any sales charges.
Annual Report
To Visit Fidelity
For directions and hours,
please call 1-800-544-9797.
Arizona
7001 West Ray Road
Chandler, AZ
7373 N. Scottsdale Road
Scottsdale, AZ
California
815 East Birch Street
Brea, CA
1411 Chapin Avenue
Burlingame, CA
851 East Hamilton Avenue
Campbell, CA
527 North Brand Boulevard
Glendale, CA
19200 Von Karman Avenue
Irvine, CA
601 Larkspur Landing Circle
Larkspur, CA
10100 Santa Monica Blvd.
Los Angeles, CA
27101 Puerta Real
Mission Viejo, CA
73-575 El Paseo
Palm Desert, CA
251 University Avenue
Palo Alto, CA
1760 Challenge Way
Sacramento, CA
7676 Hazard Center Drive
San Diego, CA
8 Montgomery Street
San Francisco, CA
21701 Hawthorne Boulevard
Torrance, CA
2001 North Main Street
Walnut Creek, CA
6300 Canoga Avenue
Woodland Hills, CA
Colorado
1625 Broadway
Denver, CO
9185 East Westview Road
Littleton, CO
Connecticut
48 West Putnam Avenue
Greenwich, CT
265 Church Street
New Haven, CT
300 Atlantic Street
Stamford, CT
29 South Main Street
West Hartford, CT
Delaware
222 Delaware Avenue
Wilmington, DE
Florida
4400 N. Federal Highway
Boca Raton, FL
121 Alhambra Plaza
Coral Gables, FL
2948 N. Federal Highway
Ft. Lauderdale, FL
1907 West State Road 434
Longwood, FL
8880 Tamiami Trail, North
Naples, FL
3501 PGA Boulevard
West Palm Beach, FL
8065 Beneva Road
Sarasota, FL
1502 N. Westshore Blvd.
Tampa, FL
Georgia
3445 Peachtree Road, N.E.
Atlanta, GA
Annual Report
1000 Abernathy Road
Atlanta, GA
Illinois
One North LaSalle Street
Chicago, IL
1415 West 22nd Street
Oak Brook, IL
1700 East Golf Road
Schaumburg, IL
3232 Lake Avenue
Wilmette, IL
Indiana
4729 East 82nd Street
Indianapolis, IN
Kansas
5400 College Boulevard
Overland Park, KS
Maine
Three Canal Plaza
Portland, ME
Maryland
7401 Wisconsin Avenue
Bethesda, MD
One W. Pennsylvania Ave.
Towson, MD
Massachusetts
801 Boylston Street
Boston, MA
155 Congress Street
Boston, MA
300 Granite Street
Braintree, MA
44 Mall Road
Burlington, MA
405 Cochituate Road
Framingham, MA
416 Belmont Street
Worcester, MA
Fidelity Brokerage Services, Inc., 100 Summer St., Boston, MA 02110 Member NYSE/SIPC
Annual Report
Michigan
280 Old N. Woodward Ave.
Birmingham, MI
43420 Grand River Avenue
Novi, MI
29155 Northwestern Hwy.
Southfield, MI
Minnesota
7600 France Avenue South
Edina, MN
Missouri
8885 Ladue Road
Ladue, MO
New Jersey
150 Essex Street
Millburn, NJ
56 South Street
Morristown, NJ
501 Route 17, South
Paramus, NJ
3518 Route 1 North
Princeton, NJ
New York
1055 Franklin Avenue
Garden City, NY
37 West Jericho Turnpike
Huntington Station, NY
1271 Avenue of the Americas
New York, NY
61 Broadway
New York, NY
350 Park Avenue
New York, NY
North Carolina
4611 Sharon Road
Charlotte, NC
Ohio
3805 Edwards Road
Cincinnati, OH
28699 Chagrin Boulevard
Woodmere Village, OH
1324 Polaris Parkway
Columbus, OH
Oregon
16850 SW 72nd Avenue
Tigard, OR
Pennsylvania
600 West DeKalb Pike
King of Prussia, PA
1735 Market Street
Philadelphia, PA
12001 Perry Highway
Wexford, PA
Rhode Island
47 Providence Place
Providence, RI
Tennessee
6150 Poplar Avenue
Memphis, TN
Texas
10000 Research Boulevard
Austin, TX
4017 Northwest Parkway
Dallas, TX
12532 Memorial Drive
Houston, TX
2701 Drexel Drive
Houston, TX
400 East Las Colinas Blvd.
Irving, TX
14100 San Pedro
San Antonio, TX
19740 IH 45 North
Spring, TX
6005 West Park Boulevard
Plano, TX
Annual Report
Utah
215 South State Street
Salt Lake City, UT
Virginia
1861 International Drive
McLean, VA
Washington
411 108th Avenue, N.E.
Bellevue, WA
1518 6th Avenue
Seattle, WA
Washington, DC
1900 K Street, N.W.
Washington, DC
Wisconsin
595 North Barker Road
Brookfield, WI
Fidelity Brokerage Services, Inc., 100 Summer St., Boston, MA 02110 Member NYSE/SIPC
Annual Report
To Write Fidelity
We'll give your correspondence immediate attention and send you written confirmation upon completion of your request.
(letter_graphic)Making Changes
To Your Account
(such as changing name, address, bank, etc.)
Fidelity Investments
P.O. Box 770001
Cincinnati, OH 45277-0002
(letter_graphic)For Non-Retirement
Accounts
Buying shares
Fidelity Investments
P.O. Box 770001
Cincinnati, OH 45277-0003
Overnight Express
Fidelity Investments
Attn: Distribution Services
100 Crosby Parkway - KC1H
Covington, KY 41015
Selling shares
Fidelity Investments
P.O. Box 770001
Cincinnati, OH 45277-0035
Overnight Express
Fidelity Investments
Attn: Distribution Services
100 Crosby Parkway - KC1H
Covington, KY 41015
General Correspondence
Fidelity Investments
P.O. Box 500
Merrimack, NH 03054-0500
(letter_graphic)For Retirement
Accounts
Buying shares
Fidelity Investments
P.O. Box 770001
Cincinnati, OH 45277-0003
Selling shares
Fidelity Investments
P.O. Box 770001
Cincinnati, OH 45277-0035
Overnight Express
Fidelity Investments
Attn: Distribution Services
100 Crosby Parkway - KC1H
Covington, KY 41015
General Correspondence
Fidelity Investments
P.O. Box 500
Merrimack, NH 03054-0500
Annual Report
Annual Report
Annual Report
Annual Report
Investment Adviser
Fidelity Management & Research Company
Boston, MA
Investment Sub-Adviser
Fidelity Investments Money
Management, Inc.
Fidelity Investments Japan Limited
Fidelity International Investment Advisors
Fidelity International Investment Advisors
(U.K.) Limited
General Distributor
Fidelity Distributors Corporation
Boston, MA
Transfer and Shareholder
Servicing Agent
Citibank N.A.
New York NY
Fidelity Service Company, Inc.
Boston, MA
Custodian
Citibank N.A.
New York NY
Fidelity's Municipal Bond Funds
Spartan® Arizona Municipal Income
Spartan California Municipal Income
Spartan Connecticut Municipal Income
Spartan Florida Municipal Income
Spartan Intermediate Municipal Income
Spartan Maryland Municipal Income
Spartan Massachusetts Municipal Income
Spartan Michigan Municipal Income
Spartan Minnesota Municipal Income
Spartan Municipal Income
Spartan New Jersey Municipal Income
Spartan New York Municipal Income
Spartan Ohio Municipal Income
Spartan Pennsylvania Municipal Income
Spartan Short-Intermediate
Municipal Income
Spartan Tax-Free Bond
The Fidelity Telephone Connection
Mutual Fund 24-Hour Service
Exchanges/Redemptions
and Account Assistance 1-800-544-6666
Product Information 1-800-544-6666
Retirement Accounts 1-800-544-4774
(8 a.m. - 9 p.m.)
TDD Service 1-800-544-0118
for the deaf and hearing impaired
(9 a.m. - 9 p.m. Eastern time)
Fidelity Automated Service
Telephone(FAST®) (automated graphic) 1-800-544-5555
(automated graphic) Automated line for quickest service
(Fidelity Investment logo)(registered trademark)
Corporate Headquarters
82 Devonshire St., Boston, MA 02109
www.fidelity.com
HIY-UANN-0204
1.787741.100
Item 2. Code of Ethics
As of the end of the period, December 31, 2003, Fidelity Municipal Trust (the trust) has adopted a code of ethics, as defined in Item 2 of Form N-CSR, that applies to its President and Treasurer and its Chief Financial Officer. A copy of the code of ethics is filed as an exhibit to this Form N-CSR.
Item 3. Audit Committee Financial Expert
The Board of Trustees of the trust has determined that Marie L. Knowles and Donald J. Kirk are each audit committee financial experts, as defined in Item 3 of Form N-CSR. Ms. Knowles and Mr. Kirk are each independent for purposes of Item 3 of Form N-CSR.
Item 4. Principal Accountant Fees and Services
(a) Audit Fees.
For the fiscal years ended December 31, 2003 and December 31, 2002, the aggregate Audit Fees billed by PricewaterhouseCoopers LLP (PwC) for professional services rendered for the audits of the financial statements, or services that are normally provided in connection with statutory and regulatory filings or engagements for those fiscal years, for Spartan Michigan Municipal Income Fund, Spartan Minnesota Municipal Income Fund, Spartan Municipal Income Fund, Spartan Ohio Municipal Income Fund, Spartan Pennsylvania Municipal Income Fund, and Spartan Short-Intermediate Municipal Income Fund (the funds) and for all funds in the Fidelity Group of Funds are shown in the table below.
Fund | 2003A | 2002A |
Spartan Michigan Municipal Income Fund | $47,000 | $28,000 |
Spartan Minnesota Municipal Income Fund | $46,000 | $28,000 |
Spartan Municipal Income Fund | $58,000 | $47,000 |
Spartan Ohio Municipal Income Fund | $46,000 | $28,000 |
Spartan Pennsylvania Municipal Income Fund | $46,000 | $28,000 |
Spartan Short-Intermediate Municipal Income Fund | $50,000 | $30,000 |
All funds in the Fidelity Group of Funds audited by PwC | $10,600,000 | $7,900,000 |
A | Aggregate amounts may reflect rounding. |
(b) Audit-Related Fees.
In each of the fiscal years ended December 31, 2003 and December 31, 2002, the aggregate Audit-Related Fees billed by PwC for services rendered for assurance and related services to each fund that are reasonably related to the performance of the audit or review of the fund's financial statements, but not reported as Audit Fees, are shown in the table below.
Fund | 2003A, B | 2002 A, B |
Spartan Michigan Municipal Income Fund | $0 | $0 |
Spartan Minnesota Municipal Income Fund | $0 | $0 |
Spartan Municipal Income Fund | $0 | $0 |
Spartan Ohio Municipal Income Fund | $0 | $0 |
Spartan Pennsylvania Municipal Income Fund | $0 | $0 |
Spartan Short-Intermediate Municipal Income Fund | $0 | $0 |
A | Aggregate amounts may reflect rounding. |
B | Includes amounts related to non-audit services prior to May 6, 2003 that would have been subject to pre-approval if the SEC rules relating to the pre-approval of non-audit services had been in effect at that time. |
In each of the fiscal years ended December 31, 2003 and December 31, 2002, the aggregate Audit-Related Fees that were billed by PwC that were required to be approved by the Audit Committee for services rendered on behalf of Fidelity Management & Research Company (FMR) and entities controlling, controlled by, or under common control with FMR (not including any sub-adviser whose role is primarily portfolio management and is subcontracted with or overseen by another investment adviser) that provide ongoing services to the funds ("Fund Service Providers") for assurance and related services that relate directly to the operations and financial reporting of each fund that are reasonably related to the performance of the audit or review of the fund's financial statements, but not reported as Audit Fees, are shown in the table below.
Billed By | 2003 A, B | 2002A, B |
PwC | $50,000 | $0 |
A | Aggregate amounts may reflect rounding. |
B | Includes amounts related to non-audit services prior to May 6, 2003 that would have been subject to pre-approval if the SEC rules relating to the pre-approval of non-audit services had been in effect at that time. |
Fees included in the audit-related category comprise assurance and related services (e.g., due diligence services) that are traditionally performed by the independent accountant. These audit-related services include due diligence related to mergers and acquisitions, accounting consultations and audits in connection with acquisitions, internal control reviews, attest services that are not required by statute or regulation and consultation concerning financial accounting and reporting standards.
(c) Tax Fees.
In each of the fiscal years ended December 31, 2003 and December 31, 2002, the aggregate Tax Fees billed by PwC for professional services rendered for tax compliance, tax advice, and tax planning for each fund is shown in the table below.
Fund | 2003A, B | 2002A, B |
Spartan Michigan Municipal Income Fund | $2,200 | $2,000 |
Spartan Minnesota Municipal Income Fund | $2,200 | $2,000 |
Spartan Municipal Income Fund | $2,200 | $2,000 |
Spartan Ohio Municipal Income Fund | $2,200 | $2,000 |
Spartan Pennsylvania Municipal Income Fund | $2,200 | $2,000 |
Spartan Short-Intermediate Municipal Income Fund | $2,200 | $2,000 |
A | Aggregate amounts may reflect rounding. |
B | Includes amounts related to non-audit services prior to May 6, 2003 that would have been subject to pre-approval if the SEC rules relating to the pre-approval of non-audit services had been in effect at that time. |
In each of the fiscal years ended December 31, 2003 and December 31, 2002, the aggregate Tax Fees billed by PwC that were required to be approved by the Audit Committee for professional services rendered on behalf of the Fund Service Providers for tax compliance, tax advice, and tax planning that relate directly to the operations and financial reporting of each fund is shown in the table below.
Billed By | 2003A, B | 2002A, B |
PwC | $0 | $0 |
A | Aggregate amounts may reflect rounding. |
B | Includes amounts related to non-audit services prior to May 6, 2003 that would have been subject to pre-approval if the SEC rules relating to the pre-approval of non-audit services had been in effect at that time. |
Fees included in the Tax Fees category comprise all services performed by professional staff in the independent accountant's tax division except those services related to the audit. Typically, this category would include fees for tax compliance, tax planning, and tax advice. Tax compliance, tax advice, and tax planning services include preparation of original and amended tax returns, claims for refund and tax payment-planning services, assistance with tax audits and appeals, tax advice related to mergers and acquisitions and requests for rulings or technical advice from taxing authorities.
(d) All Other Fees.
In each of the fiscal years ended December 31, 2003 and December 31, 2002, the aggregate Other Fees billed by PwC for all other non-audit services rendered to the funds is shown in the table below.
Fund | 2003A, B | 2002A, B |
Spartan Michigan Municipal Income Fund | $1,700 | $1,400 |
Spartan Minnesota Municipal Income Fund | $1,500 | $1,300 |
Spartan Municipal Income Fund | $5,500 | $4,300 |
Spartan Ohio Municipal Income Fund | $1,500 | $1,300 |
Spartan Pennsylvania Municipal Income Fund | $1,400 | $1,200 |
Spartan Short-Intermediate Municipal Income Fund | $2,700 | $1,900 |
A | Aggregate amounts may reflect rounding. |
B | Includes amounts related to non-audit services prior to May 6, 2003 that would have been subject to pre-approval if the SEC rules relating to the pre-approval of non-audit services had been in effect at that time. |
In each of the fiscal years ended December 31, 2003 and December 31, 2002, the aggregate Other Fees billed by PwC that were required to be approved by the Audit Committee for all other non-audit services rendered on behalf of the Fund Service Providers that relate directly to the operations and financial reporting of each fund is shown in the table below.
Billed By | 2003A, B | 2002A, B |
PwC | $190,000 | $150,000 |
A | Aggregate amounts may reflect rounding. |
B | Includes amounts related to non-audit services prior to May 6, 2003 that would have been subject to pre-approval if the SEC rules relating to the pre-approval of non-audit services had been in effect at that time. |
Fees included in the All Other Fees category include services related to internal control reviews, strategy and other consulting, financial information systems design and implementation, consulting on other information systems, and other tax services unrelated to the fund.
(e) (1) | Audit Committee Pre-Approval Policies and Procedures: |
The trust's Audit Committee must pre-approve all audit and non-audit services provided by the independent accountant relating to the operations or financial reporting of the funds. Prior to the commencement of any audit or non-audit services to a fund, the Audit Committee reviews the services to determine whether they are appropriate and permissible under applicable law.
The trust's Audit Committee has adopted policies and procedures to, among other purposes, provide a framework for the Committee's consideration of non-audit services by the audit firms that audit the Fidelity funds. The policies and procedures require that any non-audit service provided by a fund audit firm to a Fidelity Fund and any non-audit service provided by a fund auditor to a Fund Service Provider that relates directly to the operations and financial reporting of a Fidelity fund (Covered Service) are subject to approval by the Audit Committee before such service is provided. Non-audit services provided by a fund audit firm for a Fund Service Provider that do not relate directly to the operations and financial reporting of a Fidelity fund (Non-Covered Service) but that are expected to exceed $50,000 are also subject to pre-approval by the Audit Committee.
All Covered Services, as well as Non-Covered Services that are expected to exceed $50,000, must be approved in advance of provision of the service either: (i) by formal resolution of the Audit Committee, or (ii) by oral or written approval of the service by the Chair of the Audit Committee (or if the Chair is unavailable, such other member of the Audit Committee as may be designated by the Audit Committee to act in the Chair's absence). The approval contemplated by (ii) above is permitted where the Treasurer determines that action on such an engagement is necessary before the next meeting of the Audit Committee. Neither pre-approval nor advance notice of Non-Covered Service engagements for which fees are not expected to exceed $50,000 is required; such engagements are to be reported to the Audit Committee monthly.
(e) (2) | Services approved pursuant to paragraph (c)(7)(i)(C) of Rule 2-01 of Regulation S-X: |
Audit-Related Fees:
There were no amounts that were approved by the Audit Committee pursuant to the de minimis exception for the fiscal years ended December 31, 2003 and December 31, 2002 on behalf of each fund. These percentages include amounts related to non-audit services prior to May 6, 2003 that would have been subject to pre-approval if the SEC rules relating to the pre-approval of non-audit services had been in effect at that time.
There were no amounts that were required to be approved by the Audit Committee pursuant to the de minimis exception for the fiscal years ended December 31, 2003 and December 31, 2002 on behalf of the Fund Service Providers that relate directly to the operations and financial reporting of each fund. These percentages include amounts related to non-audit services prior to May 6, 2003 that would have been subject to pre-approval if the SEC rules relating to the pre-approval of non-audit services had been in effect at that time.
Tax Fees:
There were no amounts that were approved by the Audit Committee pursuant to the de minimis exception for the fiscal years ended December 31, 2003 and December 31, 2002 on behalf of each fund. These percentages include amounts related to non-audit services prior to May 6, 2003 that would have been subject to pre-approval if the SEC rules relating to the pre-approval of non-audit services had been in effect at that time.
There were no amounts that were required to be approved by the Audit Committee pursuant to the de minimis exception for the fiscal years ended December 31, 2003 and December 31, 2002 on behalf of the Fund Service Providers that relate directly to the operations and financial reporting of each fund. These percentages include amounts related to non-audit services prior to May 6, 2003 that would have been subject to pre-approval if the SEC rules relating to the pre-approval of non-audit services had been in effect at that time.
All Other Fees:
There were no amounts that were approved by the Audit Committee pursuant to the de minimis exception for the fiscal years ended December 31, 2003 and December 31, 2002 on behalf of each fund. These percentages include amounts related to non-audit services prior to May 6, 2003 that would have been subject to pre-approval if the SEC rules relating to the pre-approval of non-audit services had been in effect at that time.
There were no amounts that were required to be approved by the Audit Committee pursuant to the de minimis exception for the fiscal years ended December 31, 2003 and December 31, 2002 on behalf of the Fund Service Providers that relate directly to the operations and financial reporting of each fund. These percentages include amounts related to non-audit services prior to May 6, 2003 that would have been subject to pre-approval if the SEC rules relating to the pre-approval of non-audit services had been in effect at that time.
(f) According to PwC for the fiscal year ended December 31, 2003, the percentage of hours spent on the audit of each fund's financial statements for the most recent fiscal year that were attributed to work performed by persons who are not full-time, permanent employees of PwC is as follows:
Fund | 2003 |
Spartan Michigan Municipal Income Fund | 0% |
Spartan Minnesota Municipal Income Fund | 0% |
Spartan Municipal Income Fund | 0% |
Spartan Ohio Municipal Income Fund | 0% |
Spartan Pennsylvania Municipal Income Fund | 0% |
Spartan Short-Intermediate Municipal Income Fund | 0% |
(g) For the fiscal years ended December 31, 2003 and December 31, 2002, the aggregate fees billed by PwC of $1,900,000A and $1,600,000A for non-audit services rendered on behalf of the funds, FMR (not including any sub-adviser whose role is primarily portfolio management and is subcontracted with or overseen by another investment adviser) and Fund Service Providers relating to Covered Services and Non-Covered Services are shown in the table below.
| 2003A | 2002A |
Covered Services | $250,000 | $200,000 |
Non-Covered Services | $1,650,000 | $1,400,000 |
A | Aggregate amounts may reflect rounding. |
(h) The trust's Audit Committee has considered Non-Covered Services that were not pre-approved that were provided by PwC to Fund Service Providers to be compatible with maintaining the independence of PwC in its audit of the funds, taking into account representations from PwC, in accordance with Independence Standards Board Standard No.1, regarding its independence from the funds and their related entities.
Item 5. Audit Committee of Listed Registrants
Not applicable.
Item 6. Reserved
Item 7. Disclosure of Proxy Voting Policies and Procedures for Closed-End Management Investment Companies
Not applicable.
Item 8. Reserved
Item 9. Submission of Matters to a Vote of Security Holders
Not applicable.
Item 10. Controls and Procedures
(a)(i) The President and Treasurer and the Chief Financial Officer have concluded that the trust's disclosure controls and procedures (as defined in Rule 30a-3(c) under the Investment Company Act) provide reasonable assurances that material information relating to the trust is made known to them by the appropriate persons, based on their evaluation of these controls and procedures as of a date within 90 days of the filing date of this report.
(a)(ii) There was no change in the trust's internal control over financial reporting (as defined in Rule 30a-3(d) under the Investment Company Act) that occurred during the trust's second fiscal half-year that has materially affected, or is reasonably likely to materially affect, the trust's internal control over financial reporting.
Item 11. Exhibits
(a) | (1) | Code of Ethics pursuant to Item 2 of Form N-CSR is filed and attached hereto as EX-99.CODE ETH. |
(a) | (2) | Certification pursuant to Rule 30a-2(a) under the Investment Company Act of 1940 (17 CFR 270.30a-2(a)) is filed and attached hereto as Exhibit 99.CERT. |
(b) | | Certification pursuant to Rule 30a-2(b) under the Investment Company Act of 1940 (17 CFR 270.30a-2(b)) is furnished and attached hereto as Exhibit 99.906CERT. |
SIGNATURES
Pursuant to the requirements of the Securities Exchange Act of 1934 and the Investment Company Act of 1940, the registrant has duly caused this report to be signed on its behalf by the undersigned, thereunto duly authorized.
Fidelity Municipal Trust
By: | /s/Maria Dwyer |
| Maria Dwyer |
| President and Treasurer |
| |
Date: | February 23, 2004 |
Pursuant to the requirements of the Securities Exchange Act of 1934 and the Investment Company Act of 1940, this report has been signed below by the following persons on behalf of the registrant and in the capacities and on the dates indicated.
By: | /s/Maria Dwyer |
| Maria Dwyer |
| President and Treasurer |
| |
Date: | February 23, 2004 |
By: | /s/Timothy F. Hayes |
| Timothy F. Hayes |
| Chief Financial Officer |
| |
Date: | February 23, 2004 |