UNITED STATES
SECURITIES AND EXCHANGE COMMISSION
Washington, D.C. 20549
FORM N-CSR
CERTIFIED SHAREHOLDER REPORT OF REGISTERED
MANAGEMENT INVESTMENT COMPANIES
Investment Company Act file number 81102628
Fidelity Municipal Trust
(Exact name of registrant as specified in charter)
82 Devonshire St., Boston, Massachusetts 02109
(Address of principal executive offices) (Zip code)
Scott C. Goebel, Secretary
82 Devonshire St.
Boston, Massachusetts 02109
(Name and address of agent for service)
Registrant's telephone number, including area code: 617-563-7000
Date of fiscal year end: | December 31 |
| |
Date of reporting period: | June 30, 2012 |
Item 1. Reports to Stockholders
Fidelity®
Michigan Municipal
Income Fund
and
Fidelity
Michigan Municipal Money Market Fund
Semiannual Report
June 30, 2012
(Fidelity Cover Art)
Contents
Shareholder Expense Example | (Click Here) | An example of shareholder expenses. |
Fidelity® Michigan Municipal Income Fund |
Investment Changes | (Click Here) | A summary of major shifts in the fund's investments over the past six months. |
Investments | (Click Here) | A complete list of the fund's investments with their market values. |
Financial Statements | (Click Here) | Statements of assets and liabilities, operations, and changes in net assets, as well as financial highlights. |
Fidelity Michigan Municipal Money Market Fund |
Investment Changes/
Performance | (Click Here) | A summary of major shifts in the fund's investments over the past six months. |
Investments | (Click Here) | A complete list of the fund's investments. |
Financial Statements | (Click Here) | Statements of assets and liabilities, operations, and changes in net assets, as well as financial highlights. |
Notes | (Click Here) | Notes to the Financial Statements |
To view a fund's proxy voting guidelines and proxy voting record for the 12-month period ended June 30, visit http://www.fidelity.com/proxyvotingresults or visit the Securities and Exchange Commission's (SEC) web site at http://www.sec.gov. You may also call 1-800-544-8544 to request a free copy of the proxy voting guidelines.
Standard & Poor's, S&P and S&P 500 are registered service marks of The McGraw-Hill Companies, Inc. and have been licensed for use by Fidelity Distributors Corporation.
Other third party marks appearing herein are the property of their respective owners.
All other marks appearing herein are registered or unregistered trademarks or service marks of FMR LLC or an affiliated company. © 2012 FMR LLC. All rights reserved.
This report and the financial statements contained herein are submitted for the general information of the shareholders of the funds. This report is not authorized for distribution to prospective investors in the funds unless preceded or accompanied by an effective prospectus.
A fund files its complete schedule of portfolio holdings with the SEC for the first and third quarters of each fiscal year on Form N-Q. Forms N-Q are available on the SEC's web site at http://www.sec.gov. A fund's Forms N-Q may be reviewed and copied at the SEC's Public Reference Room in Washington, DC. Information regarding the operation of the SEC's Public Reference Room may be obtained by calling 1-800-SEC-0330. For a complete list of a fund's portfolio holdings, view the most recent holdings listing, semiannual report, or annual report on Fidelity's web site at http://www.fidelity.com, http://www.advisor.fidelity.com, or http://www.401k.com, as applicable.
NOT FDIC INSURED • MAY LOSE VALUE • NO BANK GUARANTEE
Neither the funds nor Fidelity Distributors Corporation is a bank.
Semiannual Report
Shareholder Expense Example
As a shareholder of a Fund, you incur two types of costs: (1) transaction costs, including redemption fees and (2) ongoing costs, including management fees and other Fund expenses. This Example is intended to help you understand your ongoing costs (in dollars) of investing in the Funds and to compare these costs with the ongoing costs of investing in other mutual funds.
The Example is based on an investment of $1,000 invested at the beginning of the period and held for the entire period (January 1, 2012 to June 30, 2012).
Actual Expenses
The first line of the accompanying table for each fund provides information about actual account values and actual expenses. You may use the information in this line, together with the amount you invested, to estimate the expenses that you paid over the period. Simply divide your account value by $1,000.00 (for example, an $8,600 account value divided by $1,000.00 = 8.6), then multiply the result by the number in the first line for a fund under the heading entitled "Expenses Paid During Period" to estimate the expenses you paid on your account during this period. A small balance maintenance fee of $12.00 that is charged once a year may apply for certain accounts with a value of less than $2,000. This fee is not included in the table below. If it was, the estimate of expenses you paid during the period would be higher, and your ending account value lower, by this amount. In addition, each Fund, as a shareholder in the underlying Fidelity Central Funds, will indirectly bear its pro-rata share of the fees and expenses incurred by the underlying Fidelity Central Funds. These fees and expenses are not included in the Fund's annualized expense ratio used to calculate the expense estimate in the table below.
Hypothetical Example for Comparison Purposes
The second line of the accompanying table for each fund provides information about hypothetical account values and hypothetical expenses based on a fund's actual expense ratio and an assumed rate of return of 5% per year before expenses, which is not the Fund's actual return. The hypothetical account values and expenses may not be used to estimate the actual ending account balance or expenses you paid for the period. You may use this information to compare the ongoing costs of investing in the Fund and other funds. To do so, compare this 5% hypothetical example with the 5% hypothetical examples that appear in the shareholder reports of the other funds. A small balance maintenance fee of $12.00 that is charged once a year may apply for certain accounts with a value of less than $2,000. This fee is not included in the table below. If it was, the estimate of expenses you paid during the period would be higher, and your ending account value lower, by this amount. In addition, each Fund, as a shareholder in the underlying Fidelity Central Funds, will indirectly bear its pro-rata share of the fees and expenses incurred by the underlying Fidelity Central Funds. These fees and expenses are not included in the Fund's annualized expense ratio used to calculate the expense estimate in the table below.
Please note that the expenses shown in the table are meant to highlight your ongoing costs only and do not reflect any transaction costs. Therefore, the second line of the table is useful in comparing ongoing costs only, and will not help you determine the relative total costs of owning different funds. In addition, if these transactional costs were included, your costs would have been higher.
Semiannual Report
Shareholder Expense Example - continued
| Annualized Expense Ratio | Beginning
Account Value
January 1, 2012 | Ending
Account Value
June 30, 2012 | Expenses Paid
During Period*
January 1, 2012
to June 30, 2012 |
Fidelity Michigan Municipal Income Fund | .49% | | | |
Actual | | $ 1,000.00 | $ 1,033.90 | $ 2.48 |
HypotheticalA | | $ 1,000.00 | $ 1,022.43 | $ 2.46 |
Fidelity Michigan Municipal Money Market Fund | .19% | | | |
Actual | | $ 1,000.00 | $ 1,000.05 | $ .94** |
HypotheticalA | | $ 1,000.00 | $ 1,023.92 | $ .96** |
A 5% return per year before expenses
* Expenses are equal to each Fund's annualized expense ratio, multiplied by the average account value over the period, multiplied by 182/366 (to reflect the one-half year period).
** If certain fees were not voluntarily waived by FMR or its affiliates during the period, the annualized expense ratio for the Michigan Municipal Money Market Fund would have been .55% and the expenses paid in the actual and hypothetical examples above would have been $2.73 and $2.77, respectively.
Semiannual Report
Fidelity Michigan Municipal Income Fund
Investment Changes (Unaudited)
Top Five Sectors as of June 30, 2012 |
| % of fund's
net assets | % of fund's net assets
6 months ago |
General Obligations | 43.5 | 44.3 |
Water & Sewer | 18.1 | 19.4 |
Health Care | 16.8 | 15.4 |
Special Tax | 6.0 | 5.5 |
Education | 4.8 | 5.1 |
Weighted Average Maturity as of June 30, 2012 |
| | 6 months ago |
Years | 5.6 | 6.0 |
This is a weighted average of all the maturities of the securities held in a fund. Weighted Average Maturity (WAM) can be used as a measure of sensitivity to interest rate changes and market changes. Generally, the longer the maturity, the greater the sensitivity to such changes. WAM is based on the dollar-weighted average length of time until principal payments must be paid. Depending on the types of securities held in a fund, certain maturity shortening devices (e.g., demand features, interest rate resets, and call options) may be taken into account when calculating the WAM. |
Duration as of June 30, 2012 |
| | 6 months ago |
Years | 6.4 | 6.7 |
Duration estimates how much a bond fund's price will change with a change in comparable interest rates. If rates rise 1%, for example, a fund with a 5-year duration is likely to lose about 5% of its value. Other factors also can influence a bond fund's performance and share price. Accordingly, a bond fund's actual performance may differ from this example. Duration takes into account any call or put option embedded in the bonds. |
Quality Diversification (% of fund's net assets) |
As of June 30, 2012 | As of December 31, 2011 |
 | AAA 7.0% | | | AAA 6.9% | |
 | AA,A 80.0% | | | AA,A 84.3% | |
 | BBB 8.8% | | | BBB 2.4% | |
 | BB and Below 0.9% | | | BB and Below 1.3% | |
 | Not Rated 0.6% | | | Not Rated 1.7% | |
 | Short-Term
Investments and
Net Other Assets
(Liabilities) 2.7% | | | Short-Term
Investments and
Net Other Assets
(Liabilities) 3.4% | |

We have used ratings from Moody's Investors Service, Inc. Where Moody's® ratings are not available, we have used S&P® ratings. All ratings are as of the date indicated and do not reflect subsequent changes. |
Semiannual Report
Fidelity Michigan Municipal Income Fund
Investments June 30, 2012 (Unaudited)
Showing Percentage of Net Assets
Municipal Bonds - 97.3% |
| Principal Amount | | Value |
Guam - 0.3% |
Guam Ed. Fing. Foundation Ctfs. of Prtn.: | | | | |
(Guam Pub. School Facilities Proj.) Series 2006 A, 5% 10/1/16 | | $ 1,045,000 | | $ 1,109,581 |
Series 2006 A, 5% 10/1/23 | | 1,000,000 | | 1,002,570 |
| | 2,112,151 |
Michigan - 94.2% |
Algonac Cmnty. Schools Series 2008, 5.25% 5/1/28 (FSA Insured) | | 1,575,000 | | 1,746,077 |
Allegan Pub. School District Series 2008: | | | | |
5% 5/1/14 (Nat'l. Pub. Fin. Guarantee Corp. Insured) | | 1,570,000 | | 1,689,037 |
5% 5/1/16 (Nat'l. Pub. Fin. Guarantee Corp. Insured) | | 1,545,000 | | 1,762,428 |
Ann Arbor Bldg. Auth. Series 2005 A: | | | | |
5% 3/1/17 (Nat'l. Pub. Fin. Guarantee Corp. Insured) | | 1,405,000 | | 1,545,669 |
5% 3/1/18 (Nat'l. Pub. Fin. Guarantee Corp. Insured) | | 1,440,000 | | 1,580,990 |
Ann Arbor Econ. Dev. Corp. Ltd. Oblig. Rev. (Glacier Hills, Inc. Proj.) 8.375% 1/15/19 (Escrowed to Maturity) | | 2,033,000 | | 2,507,462 |
Ann Arbor Pub. School District 5% 5/1/28 | | 2,900,000 | | 3,411,734 |
Bay City Gen. Oblig. Series 1991, 0% 6/1/15 (AMBAC Insured) | | 1,725,000 | | 1,596,591 |
Brighton Area School District Livingston County Series II, 0% 5/1/15 (AMBAC Insured) | | 10,000,000 | | 9,461,800 |
Caledonia Cmnty. Schools Counties of Kent, Allegan and Barry Series 2003: | | | | |
5.25% 5/1/17 | | 1,370,000 | | 1,418,114 |
5.25% 5/1/18 | | 1,100,000 | | 1,136,872 |
Carman-Ainsworth Cmnty. School District Series 2005: | | | | |
5% 5/1/16 (FSA Insured) | | 1,000,000 | | 1,098,380 |
5% 5/1/17 (FSA Insured) | | 2,065,000 | | 2,258,532 |
Carrier Creek Drainage District #326 Series 2005: | | | | |
5% 6/1/16 (AMBAC Insured) | | 1,620,000 | | 1,792,303 |
5% 6/1/25 (AMBAC Insured) | | 1,775,000 | | 1,905,800 |
Charles Stewart Mott Cmnty. College Series 2005, 5% 5/1/17 (Nat'l. Pub. Fin. Guarantee Corp. Insured) | | 1,675,000 | | 1,834,427 |
Charter Township of Commerce Gen. Oblig. Series 2009 B, 5.125% 12/1/38 | | 970,000 | | 1,057,397 |
Chelsea School District Series 2008: | | | | |
5% 5/1/15 (Nat'l. Pub. Fin. Guarantee Corp. Insured) | | 1,720,000 | | 1,886,702 |
5% 5/1/18 (Nat'l. Pub. Fin. Guarantee Corp. Insured) | | 1,675,000 | | 1,943,838 |
Clarkston Cmnty. Schools Series 2008: | | | | |
5% 5/1/15 (FSA Insured) | | 1,905,000 | | 2,094,643 |
5% 5/1/16 (FSA Insured) | | 1,855,000 | | 2,088,637 |
Municipal Bonds - continued |
| Principal Amount | | Value |
Michigan - continued |
Comstock Park Pub. Schools Series 2005, 5% 5/1/16 (FSA Insured) | | $ 1,000,000 | | $ 1,091,980 |
Constantine Pub. Schools: | | | | |
Series 2002, 5% 5/1/25 (Pre-Refunded to 11/1/12 @ 100) | | 935,000 | | 949,539 |
Series 2006, 5% 5/1/25 (Pre-Refunded to 11/1/12 @ 100) | | 195,000 | | 198,032 |
Detroit City School District: | | | | |
(School Bldg. & Site Impt. Proj.) Series 2003, 5% 5/1/33 (Pre-Refunded to 5/1/13 @ 100) | | 1,800,000 | | 1,869,876 |
Series 2003 B, 5% 5/1/24 (Pre-Refunded to 5/1/13 @ 100) | | 5,000,000 | | 5,194,100 |
Series 2003, 5.25% 5/1/15 (Pre-Refunded to 5/1/13 @ 100) | | 3,085,000 | | 3,211,084 |
Series 2005 A, 5.25% 5/1/30 | | 5,000,000 | | 5,889,300 |
Detroit Convention Facilities Rev. (Cobo Hall Expansion Proj.) Series 2003, 5% 9/30/12 (Nat'l. Pub. Fin. Guarantee Corp. Insured) | | 4,765,000 | | 4,807,551 |
Detroit Gen. Oblig.: | | | | |
Series 2004 B1, 5% 4/1/13 (AMBAC Insured) | | 2,000,000 | | 2,001,000 |
Series 2004, 5% 4/1/15 (AMBAC Insured) | | 3,800,000 | | 3,752,918 |
Series 2005 B, 5% 4/1/13 (FSA Insured) | | 1,830,000 | | 1,862,263 |
Series 2005 C, 5% 4/1/13 (FSA Insured) | | 1,995,000 | | 2,030,172 |
Detroit School District Series 2012 A, 5% 5/1/24 | | 5,000,000 | | 5,703,400 |
Detroit Swr. Disp. Rev.: | | | | |
Series 1998, 5.5% 7/1/17 (Nat'l. Pub. Fin. Guarantee Corp. Insured) | | 3,050,000 | | 3,429,420 |
Series 2001 E, 5.75% 7/1/31 (Berkshire Hathaway Assurance Corp. Insured) (FGIC Insured) | | 2,700,000 | | 3,089,934 |
Series 2003 B, 7.5% 7/1/33 (FSA Insured) | | 2,600,000 | | 3,139,474 |
Series 2003, 5% 7/1/32 (FSA Insured) | | 535,000 | | 538,017 |
Series 2006: | | | | |
5% 7/1/15 (Nat'l. Pub. Fin. Guarantee Corp. Insured) | | 1,085,000 | | 1,148,505 |
5% 7/1/36 (Nat'l. Pub. Fin. Guarantee Corp. Insured) | | 7,800,000 | | 7,692,672 |
Series A, 0% 7/1/14 (Nat'l. Pub. Fin. Guarantee Corp. Insured) | | 6,730,000 | | 6,356,687 |
Detroit Wtr. Supply Sys. Rev.: | | | | |
Series 1993, 6.5% 7/1/15 (Nat'l. Pub. Fin. Guarantee Corp. Insured) | | 6,340,000 | | 6,936,784 |
Series 2003 A, 5% 7/1/34 (Nat'l. Pub. Fin. Guarantee Corp. Insured) | | 5,000,000 | | 5,003,800 |
Municipal Bonds - continued |
| Principal Amount | | Value |
Michigan - continued |
Detroit Wtr. Supply Sys. Rev.: - continued | | | | |
Series 2004: | | | | |
5% 7/1/20 (Nat'l. Pub. Fin. Guarantee Corp. Insured) | | $ 5,000,000 | | $ 5,400,650 |
5.25% 7/1/16 (Nat'l. Pub. Fin. Guarantee Corp. Insured) | | 1,000,000 | | 1,099,790 |
5.25% 7/1/17 (Nat'l. Pub. Fin. Guarantee Corp. Insured) | | 2,000,000 | | 2,190,040 |
5.25% 7/1/21 (Nat'l. Pub. Fin. Guarantee Corp. Insured) | | 6,035,000 | | 6,390,401 |
Series 2005 B, 5.5% 7/1/35 (Berkshire Hathaway Assurance Corp. Insured) (FGIC Insured) | | 2,800,000 | | 3,092,236 |
Series 2006 B, 7% 7/1/36 (FSA Insured) | | 2,700,000 | | 3,229,605 |
Series 2006, 5% 7/1/33 (FSA Insured) | | 5,000,000 | | 5,081,200 |
DeWitt Pub. Schools Gen. Oblig. Series 2008: | | | | |
5% 5/1/15 (Nat'l. Pub. Fin. Guarantee Corp. Insured) | | 1,475,000 | | 1,627,884 |
5% 5/1/17 (Nat'l. Pub. Fin. Guarantee Corp. Insured) | | 1,550,000 | | 1,799,070 |
Dexter Cmnty. Schools: | | | | |
(School Bldg. and Site Proj.) Series 1998, 5.1% 5/1/18 (Nat'l. Pub. Fin. Guarantee Corp. Insured) | | 1,000,000 | | 1,142,940 |
Series 2003, 5% 5/1/18 (Pre-Refunded to 5/1/13 @ 100) | | 1,955,000 | | 2,031,714 |
Durand Area Schools Gen. Oblig. Series 2006: | | | | |
5% 5/1/27 (FSA Insured) | | 1,225,000 | | 1,324,311 |
5% 5/1/28 (FSA Insured) | | 1,250,000 | | 1,347,563 |
5% 5/1/29 (FSA Insured) | | 1,275,000 | | 1,370,689 |
East Grand Rapids Pub. School District Gen. Oblig. Series 2004: | | | | |
5% 5/1/16 (FSA Insured) | | 1,425,000 | | 1,541,166 |
5% 5/1/17 (FSA Insured) | | 1,985,000 | | 2,144,554 |
East Lansing School District Gen. Oblig. Series 2005, 5% 5/1/30 (Nat'l. Pub. Fin. Guarantee Corp. Insured) | | 3,530,000 | | 3,788,784 |
Farmington Pub. School District Gen. Oblig. Series 2005, 5% 5/1/18 (FSA Insured) | | 4,500,000 | | 5,004,945 |
Fenton Area Pub. Schools Gen. Oblig. Series 2005, 5% 5/1/14 (Nat'l. Pub. Fin. Guarantee Corp. Insured) | | 1,775,000 | | 1,915,633 |
Ferris State Univ. Rev. Series 2005: | | | | |
5% 10/1/16 (Nat'l. Pub. Fin. Guarantee Corp. Insured) | | 1,255,000 | | 1,342,135 |
5% 10/1/17 (Nat'l. Pub. Fin. Guarantee Corp. Insured) | | 1,320,000 | | 1,403,556 |
Fraser Pub. School District Series 2005: | | | | |
5% 5/1/16 (FSA Insured) | | 1,055,000 | | 1,156,945 |
Municipal Bonds - continued |
| Principal Amount | | Value |
Michigan - continued |
Fraser Pub. School District Series 2005: - continued | | | | |
5% 5/1/17 (FSA Insured) | | $ 1,615,000 | | $ 1,766,826 |
Garden City School District: | | | | |
Series 2005: | | | | |
5% 5/1/14 (FSA Insured) | | 1,210,000 | | 1,302,420 |
5% 5/1/17 (FSA Insured) | | 1,390,000 | | 1,511,834 |
Series 2006, 5% 5/1/19 (FSA Insured) | | 1,205,000 | | 1,320,114 |
Genesee County Gen. Oblig. Series 2005: | | | | |
5% 5/1/17 (Nat'l. Pub. Fin. Guarantee Corp. Insured) | | 1,355,000 | | 1,476,896 |
5% 5/1/18 (Nat'l. Pub. Fin. Guarantee Corp. Insured) | | 1,505,000 | | 1,627,823 |
Gibraltar School District Series 2005: | | | | |
5% 5/1/16 (FSA Insured) | | 1,230,000 | | 1,341,008 |
5% 5/1/17 (FSA Insured) | | 1,230,000 | | 1,337,453 |
Grand Ledge Pub. Schools District (School Bldg. & Site Proj.) Series 2007: | | | | |
5% 5/1/23 (Nat'l. Pub. Fin. Guarantee Corp. Insured) | | 1,175,000 | | 1,290,808 |
5% 5/1/24 (Nat'l. Pub. Fin. Guarantee Corp. Insured) | | 1,300,000 | | 1,419,535 |
5% 5/1/28 (Nat'l. Pub. Fin. Guarantee Corp. Insured) | | 4,300,000 | | 4,603,408 |
Grand Rapids Cmnty. College Series 2008: | | | | |
5% 5/1/17 (FSA Insured) | | 1,315,000 | | 1,523,651 |
5% 5/1/19 (FSA Insured) | | 1,315,000 | | 1,533,908 |
Grand Rapids San. Swr. Sys. Rev.: | | | | |
Series 2004, 5% 1/1/28 (Nat'l. Pub. Fin. Guarantee Corp. Insured) | | 2,500,000 | | 2,593,375 |
Series 2005: | | | | |
5% 1/1/34 (Nat'l. Pub. Fin. Guarantee Corp. Insured) | | 3,000,000 | | 3,118,860 |
5.125% 1/1/25 (Nat'l. Pub. Fin. Guarantee Corp. Insured) | | 2,000,000 | | 2,187,760 |
Series 2008, 5% 1/1/38 | | 3,320,000 | | 3,561,596 |
Series 2010, 5% 1/1/28 | | 3,000,000 | | 3,647,250 |
Grand Rapids Wtr. Supply Sys. Series 2005, 5% 1/1/35 (Nat'l. Pub. Fin. Guarantee Corp. Insured) | | 5,000,000 | | 5,465,900 |
Grand Traverse County Hosp. Series 2011 A, 5.375% 7/1/35 | | 2,000,000 | | 2,151,160 |
Grand Valley Michigan State Univ. Rev.: | | | | |
Series 2007, 5% 12/1/19 (AMBAC Insured) | | 500,000 | | 569,880 |
Series 2008, 5% 12/1/33 (FSA Insured) | | 5,000,000 | | 5,358,250 |
Series 2009, 5.625% 12/1/29 | | 2,400,000 | | 2,670,672 |
Grosse Ile Township School District Unltd. Tax Gen. Oblig. Series 2006: | | | | |
5% 5/1/29 (Nat'l. Pub. Fin. Guarantee Corp. Insured) | | 1,950,000 | | 2,099,994 |
Municipal Bonds - continued |
| Principal Amount | | Value |
Michigan - continued |
Grosse Ile Township School District Unltd. Tax Gen. Oblig. Series 2006: - continued | | | | |
5% 5/1/32 (Nat'l. Pub. Fin. Guarantee Corp. Insured) | | $ 1,950,000 | | $ 2,080,319 |
Harper Creek Cmnty. School District (School Bldg. & Site Proj.) Series 2008: | | | | |
4.75% 5/1/27 (FSA Insured) | | 500,000 | | 545,845 |
5.25% 5/1/21 (FSA Insured) | | 2,000,000 | | 2,338,720 |
5.25% 5/1/24 (FSA Insured) | | 2,100,000 | | 2,398,788 |
Haslett Pub. Schools Series 2005, 5% 5/1/16 (Nat'l. Pub. Fin. Guarantee Corp. Insured) | | 1,100,000 | | 1,209,186 |
Hudsonville Pub. Schools: | | | | |
Series 2005, 5% 5/1/16 (FSA Insured) | | 1,000,000 | | 1,106,000 |
5.25% 5/1/41 | | 1,750,000 | | 1,945,528 |
Huron Valley School District Series 2003, 5.25% 5/1/16 | | 2,450,000 | | 2,545,771 |
Ingham, Eaton and Clinton Counties Lansing School District 5% 5/1/22 | | 1,730,000 | | 2,077,834 |
Jackson County Hosp. Fin. Auth. Hosp. Rev. (Allegiance Health Proj.) Series 2010 A, 5% 6/1/37 (FSA Insured) | | 2,250,000 | | 2,382,368 |
Kalamazoo Hosp. Fin. Auth. Hosp. Facilities Rev. (Bronson Methodist Hosp. Proj.) Series 2003 B, 5.25% 5/15/14 (FSA Insured) | | 1,200,000 | | 1,277,916 |
Kalamazoo Pub. Schools Series 2006: | | | | |
5% 5/1/17 (FSA Insured) | | 3,165,000 | | 3,610,410 |
5.25% 5/1/16 (FSA Insured) | | 1,500,000 | | 1,715,370 |
Kent County Arpt. Rev. (Gerald R. Ford Int'l. Arpt. Proj.) Series 2007, 5% 1/1/37 | | 4,180,000 | | 4,510,429 |
Kent County Bldg. Auth. Series 2005, 5.5% 6/1/21 | | 3,025,000 | | 3,862,018 |
Kent Hosp. Fin. Auth. Hosp. Facilities Rev.: | | | | |
(Butterworth Hosp. Proj.) Series A, 7.25% 1/15/13 (Escrowed to Maturity) | | 305,000 | | 316,303 |
(Spectrum Health Sys. Proj.): | | | | |
Series 2011 A, 5.5% 11/15/25 | | 5,000,000 | | 5,826,900 |
Series 2011 C, 5% 1/15/42 | | 5,000,000 | | 5,347,850 |
Kentwood Pub. Schools Series 2012: | | | | |
4% 5/1/21 | | 1,000,000 | | 1,146,190 |
4% 5/1/22 | | 1,000,000 | | 1,141,120 |
L'Anse Creuse Pub. Schools: | | | | |
Series 2005, 5% 5/1/24 (FSA Insured) | | 1,350,000 | | 1,476,914 |
Series 2012: | | | | |
5% 5/1/22 | | 1,500,000 | | 1,815,000 |
5% 5/1/23 | | 1,500,000 | | 1,791,255 |
Lansing Board Wtr. & Lt. Rev. 5.5% 7/1/41 | | 5,000,000 | | 5,703,400 |
Municipal Bonds - continued |
| Principal Amount | | Value |
Michigan - continued |
Lapeer Cmnty. Schools Series 2007: | | | | |
5% 5/1/19 (FSA Insured) | | $ 1,350,000 | | $ 1,549,895 |
5% 5/1/20 (FSA Insured) | | 1,425,000 | | 1,622,662 |
5% 5/1/22 (FSA Insured) | | 1,395,000 | | 1,567,548 |
Lenawee Co. Hosp. Fin. Auth. Hosp. Rev. (ProMedica Heathcare Oblig. Group Proj.) Series 2011 B, 6% 11/15/35 | | 3,000,000 | | 3,484,860 |
Lincoln Consolidated School District Series 2008: | | | | |
5% 5/1/14 (FSA Insured) | | 1,460,000 | | 1,575,676 |
5% 5/1/16 (FSA Insured) | | 1,425,000 | | 1,614,682 |
Michigan Bldg. Auth. Rev.: | | | | |
(Facilities Prog.) Series 2008 I, 6% 10/15/38 | | 5,000,000 | | 5,716,900 |
Series 1, 5.25% 10/15/16 (FSA Insured) | | 5,000,000 | | 5,269,700 |
Series 2009 I, 5.25% 10/15/25 (Assured Guaranty Corp. Insured) | | 2,000,000 | | 2,333,400 |
Series IA 5.375% 10/15/41 | | 3,000,000 | | 3,419,220 |
Series IA, 5.5% 10/15/45 | | 10,000,000 | | 11,469,790 |
Michigan Fin. Auth. Rev.: | | | | |
(Trinity Health Sys. Proj.): | | | | |
Series 2010 A, 5% 12/1/27 | | 1,100,000 | | 1,250,095 |
Series 2011 MI, 5% 12/1/39 | | 7,000,000 | | 7,566,790 |
Series 2012 B, 5% 7/1/22 | | 2,600,000 | | 2,964,052 |
Series 2012, 5% 11/1/26 | | 5,000,000 | | 5,485,700 |
Michigan Gen. Oblig.: | | | | |
(Envir. Protection Prog.) Series 1992, 6.25% 11/1/12 | | 1,335,000 | | 1,360,992 |
Series 2007, 5.25% 9/15/21 (FSA Insured) | | 5,000,000 | | 5,702,350 |
Michigan Hosp. Fin. Auth. Rev.: | | | | |
(Ascension Health Sr. Cr. Group Proj.) Series 2010 F, 5% 11/15/23 | | 7,500,000 | | 8,595,825 |
(Crittenton Hosp. Proj.) Series 2002: | | | | |
5.5% 3/1/13 | | 455,000 | | 460,446 |
5.5% 3/1/14 | | 1,300,000 | | 1,315,379 |
5.5% 3/1/15 | | 1,985,000 | | 2,008,383 |
(Henry Ford Health Sys. Proj.): | | | | |
Series 2006 A: | | | | |
5% 11/15/12 | | 1,485,000 | | 1,507,216 |
5% 11/15/14 | | 1,000,000 | | 1,079,180 |
5% 11/15/17 | | 1,000,000 | | 1,125,560 |
Series 2009, 5.25% 11/15/24 | | 3,000,000 | | 3,319,500 |
(McLaren Health Care Corp. Proj.): | | | | |
Series 2008 A: | | | | |
5.25% 5/15/15 | | 1,615,000 | | 1,802,760 |
Municipal Bonds - continued |
| Principal Amount | | Value |
Michigan - continued |
Michigan Hosp. Fin. Auth. Rev.: - continued | | | | |
(McLaren Health Care Corp. Proj.): | | | | |
Series 2008 A: | | | | |
5.75% 5/15/38 | | $ 6,880,000 | | $ 7,666,522 |
Series 2012 A: | | | | |
5% 6/1/24 (a) | | 2,765,000 | | 3,141,814 |
5% 6/1/25 (a) | | 2,895,000 | | 3,242,892 |
(MidMichigan Obligated Group Proj.): | | | | |
Series 2002 A, 5.5% 4/15/18 (AMBAC Insured) | | 2,000,000 | | 2,004,540 |
Series 2009 A, 6.125% 6/1/39 | | 3,740,000 | | 4,261,206 |
(Oakwood Hosp. Proj.) Series 2007, 5% 7/15/17 | | 1,000,000 | | 1,146,420 |
(Sisters of Mercy Health Corp. Proj.) Series 1993, 5.375% 8/15/14 (Escrowed to Maturity) | | 195,000 | | 199,413 |
(Sparrow Hosp. Obligated Group Proj.) Series 2007: | | | | |
5% 11/15/17 | | 535,000 | | 615,903 |
5% 11/15/18 | | 1,725,000 | | 1,948,388 |
5% 11/15/19 | | 1,000,000 | | 1,118,820 |
5% 11/15/20 | | 2,000,000 | | 2,216,500 |
5% 11/15/31 | | 5,000,000 | | 5,233,950 |
(Trinity Health Sys. Proj.): | | | | |
Series 2008 A, 6.5% 12/1/33 | | 5,000,000 | | 6,016,000 |
5% 12/1/26 | | 3,725,000 | | 4,132,478 |
5% 12/1/26 (Pre-Refunded to 12/1/16 @ 100) | | 830,000 | | 984,563 |
5.375% 12/1/30 (Pre-Refunded to 12/1/12 @ 100) | | 1,000,000 | | 1,021,090 |
5.375% 12/1/30 (Pre-Refunded to 12/1/12 @ 100) | | 95,000 | | 97,004 |
Michigan Muni. Bond Auth. Rev.: | | | | |
(Clean Wtr. Pooled Proj.) Series 2010, 5% 10/1/30 | | 4,850,000 | | 5,560,816 |
(Clean Wtr. Proj.) Series 2004, 5% 10/1/26 | | 4,925,000 | | 5,313,238 |
(Local Govt. Ln. Prog.): | | | | |
Series 2007, 5% 12/1/21 (AMBAC Insured) | | 1,155,000 | | 1,171,493 |
Series G, 0% 5/1/19 (AMBAC Insured) | | 1,865,000 | | 1,439,705 |
(State Clean Wtr. Revolving Fund Proj.) Series 2006, 5% 10/1/27 | | 4,225,000 | | 4,777,968 |
Series 2002, 5.375% 10/1/19 (Pre-Refunded to 10/1/12 @ 100) | | 2,005,000 | | 2,030,163 |
Series 2005, 5% 10/1/23 | | 385,000 | | 455,913 |
Series 2009, 5% 10/1/26 | | 5,000,000 | | 5,786,950 |
Series C, 0% 6/15/15 (FSA Insured) | | 3,000,000 | | 2,859,150 |
Michigan Strategic Fund Ltd. Oblig. Rev.: | | | | |
(Cadillac Place Office Bldg. Proj.) Series 2011, 5.25% 10/15/26 | | 3,585,000 | | 4,072,094 |
Municipal Bonds - continued |
| Principal Amount | | Value |
Michigan - continued |
Michigan Strategic Fund Ltd. Oblig. Rev.: - continued | | | | |
(Detroit Edison Co. Proj.) Series BB, 7% 5/1/21 (AMBAC Insured) | | $ 8,520,000 | | $ 11,082,475 |
Michigan Technological Univ. Series 2008, 5.25% 10/1/17 (Assured Guaranty Corp. Insured) | | 1,875,000 | | 2,211,356 |
Michigan Trunk Line Fund Rev.: | | | | |
Series 1998 A, 5.5% 11/1/16 | | 3,000,000 | | 3,579,450 |
Series 2002 B, 5.25% 10/1/16 (FSA Insured) | | 3,000,000 | | 3,033,510 |
Series 2005, 5.5% 11/1/20 (FSA Insured) | | 2,500,000 | | 3,172,075 |
Series 2006, 5.25% 11/1/15 (Nat'l. Pub. Fin. Guarantee Corp. Insured) | | 5,000,000 | | 5,738,600 |
Series 2011, 5% 11/15/36 | | 2,000,000 | | 2,220,760 |
North Kent Swr. Auth. Wtr. & Swr. Rev. Series 2006: | | | | |
5% 11/1/19 (Nat'l. Pub. Fin. Guarantee Corp. Insured) | | 420,000 | | 477,700 |
5% 11/1/20 (Nat'l. Pub. Fin. Guarantee Corp. Insured) | | 490,000 | | 555,346 |
5% 11/1/22 (Nat'l. Pub. Fin. Guarantee Corp. Insured) | | 1,645,000 | | 1,851,957 |
5% 11/1/23 (Nat'l. Pub. Fin. Guarantee Corp. Insured) | | 1,290,000 | | 1,440,930 |
Northview Pub. Schools District Series 2008, 5% 5/1/21 (FSA Insured) | | 1,070,000 | | 1,217,799 |
Northville Pub. Schools Series 2005: | | | | |
5% 5/1/15 (FSA Insured) | | 1,525,000 | | 1,693,406 |
5% 5/1/16 (FSA Insured) | | 1,475,000 | | 1,621,836 |
5% 5/1/17 (FSA Insured) | | 3,675,000 | | 3,977,930 |
Okemos Pub. School District Series 1993, 0% 5/1/13 (Nat'l. Pub. Fin. Guarantee Corp. Insured) | | 1,700,000 | | 1,683,357 |
Olivet Cmnty. School District (School Bldg. & Site Proj.) Series 2008: | | | | |
5.25% 5/1/23 (FSA Insured) | | 1,010,000 | | 1,154,885 |
5.25% 5/1/27 (FSA Insured) | | 1,135,000 | | 1,271,087 |
Ottawa County Wtr. Supply Sys. Rev. Series 2010: | | | | |
4.5% 5/1/33 | | 2,680,000 | | 2,958,318 |
5% 5/1/37 | | 1,100,000 | | 1,231,164 |
Petoskey Pub. School District Series 2005: | | | | |
5% 5/1/14 (Nat'l. Pub. Fin. Guarantee Corp. Insured) | | 1,430,000 | | 1,543,299 |
5% 5/1/16 (Nat'l. Pub. Fin. Guarantee Corp. Insured) | | 1,175,000 | | 1,294,721 |
Plainwell Cmnty. School District: | | | | |
(School Bldg. & Site Proj.): | | | | |
Series 2002, 5.5% 5/1/14 | | 1,000,000 | | 1,017,160 |
Municipal Bonds - continued |
| Principal Amount | | Value |
Michigan - continued |
Plainwell Cmnty. School District: - continued | | | | |
(School Bldg. & Site Proj.): | | | | |
Series 2008: | | | | |
5% 5/1/23 (Assured Guaranty Corp. Insured) | | $ 1,885,000 | | $ 2,120,305 |
5% 5/1/28 (Assured Guaranty Corp. Insured) | | 1,000,000 | | 1,101,020 |
Series 2005: | | | | |
5% 5/1/15 (FSA Insured) | | 1,030,000 | | 1,141,312 |
5% 5/1/16 (FSA Insured) | | 1,025,000 | | 1,131,846 |
Plymouth-Canton Cmnty. School District Series 2008, 5% 5/1/20 (FSA Insured) | | 5,000,000 | | 5,769,850 |
Portage Pub. Schools Series 2008, 5% 5/1/22 (FSA Insured) | | 4,300,000 | | 4,831,867 |
Ravenna Pub. Schools Gen. Oblig. (2008 School Bldg. and Site Proj.) Series 2008: | | | | |
5% 5/1/31 (FSA Insured) | | 2,080,000 | | 2,254,346 |
5% 5/1/38 (FSA Insured) | | 1,000,000 | | 1,063,710 |
Riverview Cmnty. School District Series 2004: | | | | |
5% 5/1/14 | | 630,000 | | 679,915 |
5% 5/1/15 | | 955,000 | | 1,022,356 |
5% 5/1/17 | | 1,000,000 | | 1,070,150 |
5% 5/1/18 | | 1,000,000 | | 1,066,210 |
Rochester Cmnty. School District 5% 5/1/19 (Nat'l. Pub. Fin. Guarantee Corp. Insured) | | 1,475,000 | | 1,716,974 |
Rockford Pub. Schools Gen. Oblig. (2008 School Bldg. and Site Proj.) 5% 5/1/30 (FSA Insured) | | 3,975,000 | | 4,336,725 |
Royal Oak Hosp. Fin. Auth. Hosp. Rev. (William Beaumont Hosp. Proj.) Series 2009 V: | | | | |
8% 9/1/29 | | 1,750,000 | | 2,194,710 |
8.25% 9/1/39 | | 3,425,000 | | 4,377,595 |
Saginaw Hosp. Fin. Auth. Hosp. Rev. (Covenant Med. Ctr., Inc.) Series 2010 H, 5% 7/1/30 | | 5,000,000 | | 5,190,000 |
Saint Clair County Gen. Oblig.: | | | | |
Series 2004: | | | | |
5% 4/1/17 (AMBAC Insured) | | 1,380,000 | | 1,476,393 |
5% 4/1/19 (AMBAC Insured) | | 1,475,000 | | 1,569,297 |
5% 4/1/26 | | 1,495,000 | | 1,705,137 |
Shepherd Pub. Schools Series 2008, 5% 5/1/17 (FSA Insured) | | 1,025,000 | | 1,189,195 |
South Haven Gen. Oblig. Series 2009: | | | | |
4.875% 12/1/28 (Assured Guaranty Corp. Insured) | | 2,500,000 | | 2,812,675 |
5.125% 12/1/33 (Assured Guaranty Corp. Insured) | | 1,000,000 | | 1,123,200 |
South Redford School District Series 2005, 5% 5/1/16 (Nat'l. Pub. Fin. Guarantee Corp. Insured) | | 1,125,000 | | 1,257,930 |
Municipal Bonds - continued |
| Principal Amount | | Value |
Michigan - continued |
Three Rivers Cmnty. Schools Series 2008: | | | | |
5% 5/1/14 (FSA Insured) | | $ 1,765,000 | | $ 1,904,841 |
5% 5/1/16 (FSA Insured) | | 1,750,000 | | 1,975,960 |
Troy School District: | | | | |
Series 2006: | | | | |
5% 5/1/15 (Nat'l. Pub. Fin. Guarantee Corp. Insured) | | 1,000,000 | | 1,104,240 |
5% 5/1/16 (Nat'l. Pub. Fin. Guarantee Corp. Insured) | | 1,000,000 | | 1,135,110 |
5% 5/1/15 | | 2,135,000 | | 2,279,561 |
Univ. of Michigan Univ. Rev. Series 2010 C, 5% 4/1/26 | | 6,085,000 | | 7,167,887 |
Utica Cmnty. Schools: | | | | |
Series 2004, 5% 5/1/17 (Pre-Refunded to 11/1/13 @ 100) | | 3,000,000 | | 3,187,980 |
Series 2007: | | | | |
5% 5/1/15 (Nat'l. Pub. Fin. Guarantee Corp. Insured) | | 1,000,000 | | 1,111,320 |
5% 5/1/16 (Nat'l. Pub. Fin. Guarantee Corp. Insured) | | 2,000,000 | | 2,290,320 |
Waverly Cmnty. School District Series 2005, 5% 5/1/17 (FSA Insured) | | 3,090,000 | | 3,443,156 |
Wayne Charter County Gen. Oblig. Series 2001 A, 5.5% 12/1/17 (Nat'l. Pub. Fin. Guarantee Corp. Insured) | | 1,000,000 | | 1,009,220 |
Wayne County Arpt. Auth. Rev. Series 2011 A, 5% 12/1/21 (c) | | 5,000,000 | | 5,583,750 |
West Ottawa Pub. School District Series 2012 A: | | | | |
5% 5/1/25 (a) | | 4,310,000 | | 4,904,521 |
5% 5/1/26 (a) | | 2,000,000 | | 2,264,460 |
Western Michigan Univ. Rev.: | | | | |
Series 2005, 5% 11/15/35 (Nat'l. Pub. Fin. Guarantee Corp. Insured) | | 5,435,000 | | 5,638,378 |
Series 2008, 5% 11/15/20 (FSA Insured) | | 5,280,000 | | 6,088,685 |
Williamston Cmnty. Schools Gen. Oblig. Series 2005, 5% 5/1/18 (Nat'l. Pub. Fin. Guarantee Corp. Insured) | | 1,000,000 | | 1,113,390 |
Willow Run Cmnty. Schools County of Washtenaw Series 2005, 5% 5/1/17 (FSA Insured) | | 1,875,000 | | 2,083,163 |
Wyoming Sewage Disp. Sys. Rev. Series 2005, 5% 6/1/30 (Nat'l. Pub. Fin. Guarantee Corp. Insured) | | 4,000,000 | | 4,302,960 |
Zeeland Pub. Schools: | | | | |
Series 2004, 5.25% 5/1/16 (Nat'l. Pub. Fin. Guarantee Corp. Insured) | | 1,050,000 | | 1,126,797 |
Municipal Bonds - continued |
| Principal Amount | | Value |
Michigan - continued |
Zeeland Pub. Schools: - continued | | | | |
Series 2005: | | | | |
5% 5/1/16 (Nat'l. Pub. Fin. Guarantee Corp. Insured) | | $ 2,035,000 | | $ 2,244,137 |
5% 5/1/17 (Nat'l. Pub. Fin. Guarantee Corp. Insured) | | 170,000 | | 186,924 |
| | 624,853,720 |
Puerto Rico - 2.4% |
Puerto Rico Commonwealth Aqueduct & Swr. Auth. Series 2012 A: | | | | |
5.25% 7/1/42 | | 1,700,000 | | 1,682,252 |
5.75% 7/1/37 | | 2,000,000 | | 2,091,200 |
Puerto Rico Elec. Pwr. Auth. Pwr. Rev. Series QQ, 5.5% 7/1/18 (XL Cap. Assurance, Inc. Insured) | | 1,000,000 | | 1,150,300 |
Puerto Rico Pub. Bldg. Auth. Rev. Bonds Series M2, 5.75%, tender 7/1/17 (b) | | 2,000,000 | | 2,206,280 |
Puerto Rico Sales Tax Fing. Corp. Sales Tax Rev.: | | | | |
Series 2007 A: | | | | |
0% 8/1/41 (Nat'l. Pub. Fin. Guarantee Corp. Insured) | | 12,000,000 | | 2,335,320 |
0% 8/1/47 (AMBAC Insured) | | 1,000,000 | | 135,090 |
Series 2009 A: | | | | |
6% 8/1/42 | | 4,000,000 | | 4,457,160 |
6.5% 8/1/44 | | 1,500,000 | | 1,735,965 |
| | 15,793,567 |
Virgin Islands - 0.4% |
Virgin Islands Pub. Fin. Auth.: | | | | |
(Cruzan Proj.) Series 2009 A, 6% 10/1/39 | | 1,500,000 | | 1,653,150 |
Series 2009 B, 5% 10/1/25 | | 1,200,000 | | 1,295,832 |
| | 2,948,982 |
TOTAL INVESTMENT PORTFOLIO - 97.3% (Cost $601,841,218) | 645,708,420 |
NET OTHER ASSETS (LIABILITIES) - 2.7% | | 17,651,520 |
NET ASSETS - 100% | $ 663,359,940 |
Legend |
(a) Security or a portion of the security purchased on a delayed delivery or when-issued basis. |
(b) Coupon rates for floating and adjustable rate securities reflect the rates in effect at period end. |
(c) Private activity obligations whose interest is subject to the federal alternative minimum tax for individuals. |
Other Information |
All investments are categorized as Level 2 under the Fair Value Hierarchy. The inputs or methodology used for valuing securities may not be an indication of the risk associated with investing in those securities. For more information on valuation inputs, please refer to the Security Valuation section in the accompanying Notes to Financial Statements. |
The distribution of municipal securities by revenue source, as a percentage of total net assets, is as follows (Unaudited): |
General Obligations | 43.5% |
Water & Sewer | 18.1% |
Health Care | 16.8% |
Special Tax | 6.0% |
Others* (Individually Less Than 5%) | 15.6% |
| 100.0% |
* Includes net other assets (liabilities). |
See accompanying notes which are an integral part of the financial statements.
Semiannual Report
Fidelity Michigan Municipal Income Fund
Statement of Assets and Liabilities
| June 30, 2012 (Unaudited) |
| | |
Assets | | |
Investment in securities, at value - See accompanying schedule: Unaffiliated issuers (cost $601,841,218) | | $ 645,708,420 |
Cash | | 25,390,366 |
Receivable for fund shares sold | | 213,481 |
Interest receivable | | 6,801,552 |
Other receivables | | 4,546 |
Total assets | | 678,118,365 |
| | |
Liabilities | | |
Payable for investments purchased on a delayed delivery basis | $ 13,546,992 | |
Payable for fund shares redeemed | 83,116 | |
Distributions payable | 732,781 | |
Accrued management fee | 200,658 | |
Other affiliated payables | 170,675 | |
Other payables and accrued expenses | 24,203 | |
Total liabilities | | 14,758,425 |
| | |
Net Assets | | $ 663,359,940 |
Net Assets consist of: | | |
Paid in capital | | $ 619,956,424 |
Undistributed net investment income | | 126,063 |
Accumulated undistributed net realized gain (loss) on investments | | (589,749) |
Net unrealized appreciation (depreciation) on investments | | 43,867,202 |
Net Assets, for 53,365,333 shares outstanding | | $ 663,359,940 |
Net Asset Value, offering price and redemption price per share ($663,359,940 ÷ 53,365,333 shares) | | $ 12.43 |
See accompanying notes which are an integral part of the financial statements.
Semiannual Report
Statement of Operations
Six months ended June 30, 2012 (Unaudited) |
| | |
Investment Income | | |
Interest | | $ 13,239,390 |
| | |
Expenses | | |
Management fee | $ 1,177,716 | |
Transfer agent fees | 262,583 | |
Accounting fees and expenses | 76,013 | |
Custodian fees and expenses | 3,807 | |
Independent trustees' compensation | 1,161 | |
Registration fees | 18,139 | |
Audit | 23,284 | |
Legal | 6,296 | |
Miscellaneous | 3,255 | |
Total expenses before reductions | 1,572,254 | |
Expense reductions | (5,742) | 1,566,512 |
Net investment income (loss) | | 11,672,878 |
Realized and Unrealized Gain (Loss) Net realized gain (loss) on: | | |
Investment securities: | | |
Unaffiliated issuers | | (519,085) |
Change in net unrealized appreciation (depreciation) on investment securities | | 10,006,724 |
Net gain (loss) | | 9,487,639 |
Net increase (decrease) in net assets resulting from operations | | $ 21,160,517 |
See accompanying notes which are an integral part of the financial statements.
Semiannual Report
Fidelity Michigan Municipal Income Fund
Financial Statements - continued
Statement of Changes in Net Assets
| Six months ended June 30, 2012
(Unaudited) | Year ended
December 31, 2011 |
Increase (Decrease) in Net Assets | | |
Operations | | |
Net investment income (loss) | $ 11,672,878 | $ 23,231,202 |
Net realized gain (loss) | (519,085) | (1,334) |
Change in net unrealized appreciation (depreciation) | 10,006,724 | 28,932,158 |
Net increase (decrease) in net assets resulting
from operations | 21,160,517 | 52,162,026 |
Distributions to shareholders from net investment income | (11,592,300) | (23,214,211) |
Distributions to shareholders from net realized gain | - | (352,543) |
Total distributions | (11,592,300) | (23,566,754) |
Share transactions
Proceeds from sales of shares | 54,622,643 | 71,220,723 |
Reinvestment of distributions | 7,141,624 | 14,650,857 |
Cost of shares redeemed | (29,966,851) | (119,227,678) |
Net increase (decrease) in net assets resulting from share transactions | 31,797,416 | (33,356,098) |
Redemption fees | 66 | 2,805 |
Total increase (decrease) in net assets | 41,365,699 | (4,758,021) |
| | |
Net Assets | | |
Beginning of period | 621,994,241 | 626,752,262 |
End of period (including undistributed net investment income of $126,063 and undistributed net investment income of $45,485, respectively) | $ 663,359,940 | $ 621,994,241 |
Other Information Shares | | |
Sold | 4,402,825 | 6,005,757 |
Issued in reinvestment of distributions | 574,934 | 1,233,872 |
Redeemed | (2,419,152) | (10,174,511) |
Net increase (decrease) | 2,558,607 | (2,934,882) |
See accompanying notes which are an integral part of the financial statements.
Semiannual Report
Financial Highlights
| Six months ended June 30, 2012 | Years ended December 31, |
| (Unaudited) | 2011 | 2010 | 2009 | 2008 | 2007 |
Selected Per-Share Data | | | | | |
Net asset value, beginning of period | $ 12.24 | $ 11.66 | $ 11.85 | $ 11.29 | $ 11.76 | $ 11.82 |
Income from Investment Operations | | | | | | |
Net investment income (loss)D | .225 | .463 | .462 | .460 | .457 | .461 |
Net realized and unrealized gain (loss) | .188 | .586 | (.184) | .575 | (.465) | (.031) |
Total from investment operations | .413 | 1.049 | .278 | 1.035 | (.008) | .430 |
Distributions from net investment income | (.223) | (.462) | (.461) | (.460) | (.457) | (.462) |
Distributions from net realized gain | - | (.007) | (.007) | (.015) | (.005) | (.028) |
Total distributions | (.223) | (.469) | (.468) | (.475) | (.462) | (.490) |
Redemption fees added to paid in capital D,F | - | - | - | - | - | - |
Net asset value, end of period | $ 12.43 | $ 12.24 | $ 11.66 | $ 11.85 | $ 11.29 | $ 11.76 |
Total ReturnB,C | 3.39% | 9.20% | 2.32% | 9.30% | (.06)% | 3.73% |
Ratios to Average Net AssetsE | | | | | |
Expenses before reductions | .49%A | .49% | .49% | .50% | .49% | .49% |
Expenses net of fee waivers, if any | .49%A | .49% | .49% | .50% | .49% | .49% |
Expenses net of all reductions | .49%A | .49% | .49% | .50% | .47% | .44% |
Net investment income (loss) | 3.64%A | 3.90% | 3.86% | 3.94% | 3.96% | 3.94% |
Supplemental Data | | | | | |
Net assets, end of period (000 omitted) | $ 663,360 | $ 621,994 | $ 626,752 | $ 645,195 | $ 568,852 | $ 592,633 |
Portfolio turnover rate | 6%A | 9% | 7% | 6% | 19% | 15% |
A Annualized
B Total returns for periods of less than one year are not annualized.
C Total returns would have been lower if certain expenses had not been reduced during the applicable periods shown.
D Calculated based on average shares outstanding during the period.
E Expense ratios reflect operating expenses of the Fund. Expenses before reductions do not reflect amounts reimbursed by the investment adviser or reductions from expense offset arrangements and do not represent the amount paid by the Fund during periods when reimbursements or reductions occur. Expenses net of fee waivers reflect expenses after reimbursement by the investment adviser but prior to reductions from expense offset arrangements. Expenses net of all reductions represent the net expenses paid by the Fund.
F Amount represents less than $.001 per share.
See accompanying notes which are an integral part of the financial statements.
Semiannual Report
Fidelity Michigan Municipal Money Market Fund
Investment Changes/Performance (Unaudited)
Effective Maturity Diversification |
Days | % of fund's investments 6/30/12 | % of fund's investments 12/31/11 | % of fund's
investments
6/30/11 |
1 - 7 | 75.0 | 75.0 | 70.2 |
8 - 30 | 5.4 | 4.7 | 9.0 |
31 - 60 | 1.2 | 4.6 | 10.3 |
61 - 90 | 6.7 | 2.7 | 0.1 |
91 - 180 | 4.7 | 7.0 | 4.5 |
> 180 | 7.0 | 6.0 | 5.9 |
Effective maturity is determined in accordance with the requirements of Rule 2a-7 under the Investment Company Act of 1940. |
Weighted Average Maturity |
| 6/30/12 | 12/31/11 | 6/30/11 |
Fidelity Michigan Municipal Money Market Fund | 38 Days | 34 Days | 29 Days |
All Tax-Free Money Market Funds Average* | 30 Days | 32 Days | 26 Days |
* Source: iMoneyNet, Inc. |
This is a weighted average of all the maturities of the securities held in a fund. Weighted Average Maturity (WAM) can be used as a measure of sensitivity to interest rate changes and market changes. Generally, the longer the maturity, the greater the sensitivity to such changes. WAM is based on the dollar-weighted average length of time until principal payments must be paid. Depending on the types of securities held in a fund, certain maturity shortening devices (e.g., demand features, interest rate resets, and call options) may be taken into account when calculating the WAM. |
Weighted Average Life |
| 6/30/12 | 12/31/11 | 6/30/11 |
Fidelity Michigan Municipal Money Market Fund | 38 Days | 34 Days | 29 Days |
Weighted Average Life (WAL) is the weighted average of the life of the securities held in a fund or portfolio and can be used as a measure of sensitivity to changes in liquidity and/or credit risk. Generally, the higher the value, the greater the sensitivity. WAL is based on the dollar-weighted average length of time until principal payments must be paid, taking into account any call options exercised by the issuer and any permissible maturity shortening features other than interest rate resets. The difference between WAM and WAL is that WAM takes into account interest rate resets and WAL does not. WAL for money market funds is not the same as WAL of a mortgage- or asset-backed security. |
Asset Allocation (% of fund's net assets) |
As of June 30, 2012 | As of December 31, 2011 |
| Variable Rate
Demand Notes
(VRDNs) 71.7% | | | Variable Rate
Demand Notes
(VRDNs) 70.3% | |
 | Other Municipal
Debt 25.2% | | | Other Municipal
Debt 25.0% | |
| Investment
Companies 4.1% | | | Investment
Companies 4.4% | |
 | Net Other Assets (Liabilities)** (1.0)% | | | Net Other Assets
(Liabilities) 0.3% | |

Current and Historical Seven-Day Yields
| 6/30/12 | 3/31/12 | 1/2/12 | 10/3/11 | 6/27/11 |
Fidelity Michigan Municipal Money Market Fund | 0.01% | 0.01% | 0.01% | 0.01% | 0.01% |
Yield refers to the income paid by the fund over a given period. Yields for money market funds are usually for seven-day periods, as they are here, though they are expressed as annual percentage rates. Past performance is no guarantee of future results. Yield will vary and it's possible to lose money investing in the Fund. A portion of the fund's expenses was reimbursed and/or waived. Absent such reimbursements and/or waivers the yield for the period ending June 30, 2012, the most recent period shown in the table, would have been -0.33%.
** Short-Term Investments and Net Other Assets (Liabilities) are not included in the pie chart. |
Semiannual Report
Fidelity Michigan Municipal Money Market Fund
Investments June 30, 2012 (Unaudited)
Showing Percentage of Net Assets
Variable Rate Demand Note - 71.7% |
| Principal Amount | | Value |
Alabama - 0.1% |
Decatur Indl. Dev. Board Exempt Facilities Rev. (Nucor Steel Decatur LLC Proj.) Series 2003 A, 0.24% 7/6/12, VRDN (b)(e) | $ 600,000 | | $ 600,000 |
Delaware - 0.3% |
Delaware Econ. Dev. Auth. Rev. (Delmarva Pwr. & Lt. Co. Proj.) Series 1987, 0.34% 7/2/12, VRDN (b)(e) | 2,300,000 | | 2,300,000 |
Illinois - 0.2% |
Chicago Wtr. Rev. Series 2004 A2, 0.19% 7/6/12, LOC California Pub. Employees Retirement Sys., VRDN (b) | 1,370,000 | | 1,370,000 |
Louisiana - 0.7% |
Louisiana Pub. Facilities Auth. Rev. (Air Products & Chemicals, Inc. Proj.): | | | |
Series 2002, 0.18% 7/6/12, VRDN (b)(e) | 3,300,000 | | 3,300,000 |
Series 2003, 0.18% 7/6/12, VRDN (b)(e) | 3,000,000 | | 3,000,000 |
| | 6,300,000 |
Michigan - 69.1% |
Detroit City School District Participating VRDN Series Solar 06 01, 0.17% 7/6/12 (Liquidity Facility U.S. Bank NA, Cincinnati) (b)(f) | 30,100,000 | | 30,100,000 |
Eastern Michigan Univ. Revs.: | | | |
Series 2009 A, 0.16% 7/2/12, LOC JPMorgan Chase Bank, VRDN (b) | 8,625,000 | | 8,625,000 |
Series 2009 B, 0.16% 7/2/12, LOC JPMorgan Chase Bank, VRDN (b) | 8,300,000 | | 8,300,000 |
Grand Rapids Econ. Dev. Corp. (Cornerstone Univ. Proj.) 0.17% 7/6/12, LOC PNC Bank NA, VRDN (b) | 6,445,000 | | 6,445,000 |
Grand Traverse County Hosp. Series 2011 B, 0.22% 7/6/12, LOC JPMorgan Chase Bank, VRDN (b) | 17,825,000 | | 17,825,000 |
Grand Valley Michigan State Univ. Rev.: | | | |
Series 2005, 0.15% 7/6/12, LOC PNC Bank NA, VRDN (b) | 29,410,000 | | 29,410,000 |
Series 2008 B, 0.16% 7/6/12, LOC U.S. Bank NA, Cincinnati, VRDN (b) | 16,440,000 | | 16,440,000 |
Kent Hosp. Fin. Auth. Hosp. Facilities Rev. (Metropolitan Hosp. Proj.) Series 2012, 0.3% 7/6/12, LOC Bank of America NA, VRDN (b) | 8,600,000 | | 8,600,000 |
Livonia Econ. Dev. Corp. (Madonna Univ. Proj.) Series 2009, 0.17% 7/6/12, LOC Fed. Home Ln. Bank Chicago, VRDN (b) | 8,675,000 | | 8,675,000 |
Michigan Bldg. Auth. Rev.: | | | |
Participating VRDN Series Solar 06 21, 0.16% 7/6/12 (Liquidity Facility U.S. Bank NA, Cincinnati) (b)(f) | 3,800,000 | | 3,800,000 |
Series 2007 I, 0.16% 7/6/12, LOC JPMorgan Chase Bank, VRDN (b) | 2,600,000 | | 2,600,000 |
Variable Rate Demand Note - continued |
| Principal Amount | | Value |
Michigan - continued |
Michigan Fin. Auth. Rev.: | | | |
Participating VRDN: | | | |
Series RBC O 32, 0.18% 7/6/12 (Liquidity Facility Royal Bank of Canada) (b)(f) | $ 3,850,000 | | $ 3,850,000 |
Series ROC II R 14014, 0.19% 7/6/12 (Liquidity Facility Citibank NA) (b)(f) | 8,600,000 | | 8,600,000 |
Series 2012 C, 0.22% 7/6/12, LOC Citibank NA, VRDN (b) | 8,500,000 | | 8,500,000 |
Michigan Higher Ed. Rev. (Thomas M. Cooley Law School Proj.) Series 2008 A, 0.15% 7/6/12, LOC Wells Fargo Bank NA, VRDN (b) | 16,605,000 | | 16,605,000 |
Michigan Hosp. Fin. Auth. Rev. Participating VRDN Series RBC O 33, 0.18% 7/6/12 (Liquidity Facility Royal Bank of Canada) (b)(f) | 2,500,000 | | 2,500,000 |
Michigan Hsg. Dev. Auth. Ltd.: | | | |
(Sand Creek Apts., Phase I Proj.) Series 2007 A, 0.22% 7/6/12, LOC Citibank NA, VRDN (b)(e) | 3,700,000 | | 3,700,000 |
(Sand Creek II Apts. Proj.) Series 2007 A, 0.22% 7/6/12, LOC Citibank NA, VRDN (b)(e) | 5,495,000 | | 5,495,000 |
(Teal Run I Apts. Proj.) Series 2007 A, 0.22% 7/6/12, LOC Citibank NA, VRDN (b)(e) | 6,350,000 | | 6,350,000 |
Michigan Hsg. Dev. Auth. Multi-family Hsg. Rev.: | | | |
(Canton Club East Apts. Proj.) Series 1998 A, 0.21% 7/6/12, LOC Fannie Mae, VRDN (b)(e) | 6,800,000 | | 6,800,000 |
(Hunt Club Apts. Proj.) 0.2% 7/6/12, LOC Fannie Mae, VRDN (b)(e) | 6,695,000 | | 6,695,000 |
Michigan Hsg. Dev. Auth. Single Family Mtg. Rev.: | | | |
Series 2007 B, 0.18% 7/6/12 (Liquidity Facility Fannie Mae) (Liquidity Facility Freddie Mac), VRDN (b)(e) | 77,900,000 | | 77,900,000 |
Series 2009 D, 0.16% 7/6/12 (Liquidity Facility Fannie Mae) (Liquidity Facility Freddie Mac), VRDN (b) | 47,650,000 | | 47,650,000 |
Michigan Hsg. Dev. Ltd. Oblig. Rev. (JAS Non-Profit Hsg. Corp. VI Proj.) Series 2000, 0.18% 7/6/12, LOC JPMorgan Chase Bank, VRDN (b) | 6,000,000 | | 6,000,000 |
Michigan State Univ. Revs.: | | | |
Participating VRDN Series WF 11 33 C, 0.19% 7/6/12 (Liquidity Facility Wells Fargo Bank NA) (b)(f) | 7,630,000 | | 7,630,000 |
Series 2000 A, 0.16% 7/6/12 (Liquidity Facility Northern Trust Co.), VRDN (b) | 2,100,000 | | 2,100,000 |
Michigan Strategic Fund Indl. Dev. Rev. (Lapeer Industries, Inc. Proj.) Series 2007, 0.6% 7/6/12, LOC Bank of America NA, VRDN (b)(e) | 1,100,000 | | 1,100,000 |
Variable Rate Demand Note - continued |
| Principal Amount | | Value |
Michigan - continued |
Michigan Strategic Fund Ltd. Oblig. Rev.: | | | |
(Air Products and Chemicals, Inc. Proj.) Series 2007 V1, 0.16% 7/2/12, VRDN (b) | $ 900,000 | | $ 900,000 |
(Almond Products, Inc. Proj.) 0.6% 7/6/12, LOC Bank of America NA, VRDN (b)(e) | 6,615,000 | | 6,615,000 |
(BC & C Proj.) 0.28% 7/6/12, LOC Comerica Bank, VRDN (b)(e) | 535,000 | | 535,000 |
(Consumers Energy Co. Proj.) 0.15% 7/6/12, LOC Bank of Nova Scotia New York Branch, VRDN (b)(e) | 20,000,000 | | 20,000,000 |
(Evangelical Homes of Michigan Proj.) Series 2008, 0.18% 7/6/12, LOC JPMorgan Chase & Co., VRDN (b) | 6,800,000 | | 6,800,000 |
(Greenpath, Inc. Proj.) Series 2011, 0.17% 7/6/12, LOC PNC Bank NA, VRDN (b) | 5,860,000 | | 5,860,000 |
(Henry Ford Museum & Greenfield Village Projs.) Series 2002, 0.18% 7/2/12, LOC Comerica Bank, VRDN (b) | 10,550,000 | | 10,550,000 |
(PBL Enterprises, Inc. Proj.) Series 1997, 0.28% 7/6/12, LOC Comerica Bank, VRDN (b)(e) | 140,000 | | 140,000 |
(Pioneer Laboratories, Inc. Proj.) 0.28% 7/6/12, LOC JPMorgan Chase Bank, VRDN (b)(e) | 700,000 | | 700,000 |
(S & S LLC Proj.) Series 2000, 0.47% 7/6/12, LOC U.S. Bank NA, Cincinnati, VRDN (b)(e) | 1,105,000 | | 1,105,000 |
(The Kroger Co. Recovery Zone Facilities Bond Proj.) Series 2010, 0.18% 7/6/12, LOC Bank of Tokyo-Mitsubishi UFJ Ltd., VRDN (b) | 19,000,000 | | 19,000,000 |
(The YMCA of Greater Grand Rapids Proj.) Series 2010, 0.19% 7/6/12, LOC Comerica Bank, VRDN (b) | 11,350,000 | | 11,350,000 |
(Van Andel Research Institute Proj.) Series 2008, 0.32% 7/6/12, LOC Bank of America NA, VRDN (b) | 91,000,000 | | 91,000,000 |
(W.H. Porter, Inc. Proj.) Series 2001, 1.03% 7/2/12, LOC Bank of America NA, VRDN (b)(e) | 1,850,000 | | 1,850,000 |
(YMCA Metropolitan Detroit Proj.) Series 2001, 0.19% 7/6/12, LOC JPMorgan Chase Bank, VRDN (b) | 10,330,000 | | 10,330,000 |
(YMCA Metropolitan Lansing Proj.) Series 2002, 0.33% 7/6/12, LOC Bank of America NA, VRDN (b) | 7,925,000 | | 7,925,000 |
Oakland County Econ. Dev. Corp. Ltd. Oblig. Rev.: | | | |
(Osmic, Inc. Proj.) Series 2001 A, 0.23% 7/6/12, LOC JPMorgan Chase Bank, VRDN (b)(e) | 4,800,000 | | 4,800,000 |
(Pratt & Miller Engineering & Fabrication, Inc. Proj.) Series 2004, 0.6% 7/6/12, LOC Bank of America NA, VRDN (b)(e) | 2,380,000 | | 2,380,000 |
Waterford Econ. Dev. Corp. Ltd. Oblig. Rev. (Canterbury Health Care, Inc. Proj.) Series 2009, 0.19% 7/6/12, LOC Fed. Home Ln. Bank of Boston, VRDN (b) | 5,865,000 | | 5,865,000 |
Variable Rate Demand Note - continued |
| Principal Amount | | Value |
Michigan - continued |
Wayne County Arpt. Auth. Rev.: | | | |
0.18% 7/6/12, LOC PNC Bank NA, VRDN (b)(e) | $ 9,000,000 | | $ 9,000,000 |
0.19% 7/6/12, LOC JPMorgan Chase Bank, VRDN (b)(e) | 9,000,000 | | 9,000,000 |
0.19% 7/6/12, LOC JPMorgan Chase Bank, VRDN (b) | 13,000,000 | | 13,000,000 |
| | 591,000,000 |
Minnesota - 0.3% |
St. Paul City Port Auth. District Heating Rev. Series 2009 8R, 0.22% 7/6/12, LOC Deutsche Bank AG, VRDN (b)(e) | 3,060,000 | | 3,060,000 |
Nebraska - 0.1% |
Douglas County Solid Waste Disp. Rev. (Waste Mgmt., Inc. Proj.) Series A, 0.29% 7/6/12, LOC Bank of America NA, VRDN (b)(e) | 1,000,000 | | 1,000,000 |
New Jersey - 0.1% |
Salem County Poll. Cont. Fin. Auth. Rev. (Pub. Svc. Elec. and Gas Co. Proj.) Series 2012 A, 0.45% 7/6/12, VRDN (b)(e) | 500,000 | | 500,000 |
North Carolina - 0.0% |
Parson County Indl. Facilities and Poll. Cont. Fing. Auth. (CertainTeed Gypsum NC, Inc. Proj.) Series 2010, 0.62% 7/6/12, LOC Cr. Industriel et Commercial, VRDN (b) | 400,000 | | 400,000 |
Ohio - 0.4% |
Ohio Air Quality Dev. Auth. Rev. (Cincinnati Gas & Elec. Co. Proj.) Series B, 0.38% 7/6/12, VRDN (b) | 2,200,000 | | 2,200,000 |
Ohio Higher Edl. Facility Commission Rev. (Univ. Hosp. Health Sys. Proj.) Series 2008 B, 0.23% 7/6/12, LOC RBS Citizens NA, VRDN (b) | 1,000,000 | | 1,000,000 |
| | 3,200,000 |
Texas - 0.1% |
Port Arthur Navigation District Indl. Dev. Corp. Exempt Facilities Rev. (Air Products Proj.) Series 2000, 0.18% 7/6/12, VRDN (b)(e) | 1,000,000 | | 1,000,000 |
Virginia - 0.3% |
Newport News Indl. Dev. Auth. (CNU Warwick LLC Student Apts. Proj.) 0.37% 7/6/12, LOC Bank of America NA, VRDN (b) | 1,205,000 | | 1,205,000 |
Virginia Hsg. Dev. Auth. Commonwealth Mtg. Rev. Participating VRDN Series BA 1046, 0.33% 7/6/12 (Liquidity Facility Bank of America NA) (b)(e)(f) | 1,000,000 | | 1,000,000 |
| | 2,205,000 |
TOTAL VARIABLE RATE DEMAND NOTE |
612,935,000
|
Other Municipal Debt - 25.2% |
| Principal Amount | | Value |
Kentucky - 0.2% |
Trimble County Poll. Cont. Rev. Bonds (Louisville Gas & Elec. Co. Proj.) Series 2001 B, 0.45% tender 7/12/12, CP mode (e) | $ 1,400,000 | | $ 1,400,000 |
Massachusetts - 0.2% |
Massachusetts Indl. Fin. Agcy. Poll. Cont. Rev. Bonds (New England Pwr. Co. Proj.) Series 1993 B, 0.55% tender 8/10/12, CP mode | 2,000,000 | | 2,000,000 |
Michigan - 24.2% |
Central Michigan Univ. Rev. Bonds Series 2009, 5% 10/1/12 | 1,315,000 | | 1,330,259 |
Clarkston Cmnty. Schools Bonds 5% 5/1/13 | 2,750,000 | | 2,855,725 |
Michigan Bldg. Auth. Rev. Series 6, 0.22% 9/27/12, LOC State Street Bank & Trust Co., Boston, LOC U.S. Bank NA, Cincinnati, CP | 53,075,000 | | 53,075,000 |
Michigan Fin. Auth. Rev.: | | | |
Bonds: | | | |
Series 2011: | | | |
2% 10/1/12 | 8,400,000 | | 8,436,923 |
2% 10/1/12 | 4,150,000 | | 4,168,242 |
Series 2012 A, 2% 7/1/13 | 15,000,000 | | 15,272,563 |
RAN Series 2011 C3, 2% 8/20/12, LOC Bank of Nova Scotia New York Branch | 8,400,000 | | 8,419,442 |
Michigan Gen. Oblig. Bonds: | | | |
Series 2002, 5.25% 12/1/12 | 18,215,000 | | 18,598,986 |
Series 2003 A, 5% 5/1/13 | 1,600,000 | | 1,661,147 |
Series 2005 B, 5% 11/1/12 | 5,000,000 | | 5,080,451 |
Michigan Hosp. Fin. Auth. Rev. Bonds: | | | |
(Ascension Health Cr. Group Proj.) Series 2010 F4, 1.35%, tender 4/1/13 (b) | 5,925,000 | | 5,975,811 |
(Ascension Health Sr. Cr. Group Proj.) Series 2010 F: | | | |
0.27%, tender 1/25/13 (b) | 7,600,000 | | 7,600,000 |
0.27%, tender 1/25/13 (b) | 8,800,000 | | 8,800,000 |
0.27%, tender 1/25/13 (b) | 7,100,000 | | 7,100,000 |
(Trinity Health Sys. Proj.) Series 2008 C: | | | |
0.2% tender 7/9/12, CP mode | 19,800,000 | | 19,800,000 |
0.2% tender 7/16/12, CP mode | 19,630,000 | | 19,630,000 |
Series 2012 A, 2% 6/1/13 (a) | 7,340,000 | | 7,452,302 |
Michigan Muni. Bond Auth. Rev. Bonds: | | | |
Series 2002, 5.25% 10/1/12 | 1,000,000 | | 1,012,589 |
Series 2007, 5% 10/1/12 | 2,050,000 | | 2,074,801 |
Michigan State Univ. Revs. Bonds Series 2010 C, 5% 2/15/13 | 2,500,000 | | 2,574,876 |
Other Municipal Debt - continued |
| Principal Amount | | Value |
Michigan - continued |
Michigan Trunk Line Fund Rev. Bonds Series 2005 B, 5% 9/1/12 | $ 5,000,000 | | $ 5,039,654 |
Troy School District Bonds Series 2004, 5% 5/1/13 (Michigan Gen. Oblig. Guaranteed) | 1,090,000 | | 1,132,070 |
| | 207,090,841 |
New Hampshire - 0.2% |
New Hampshire Bus. Fin. Auth. Poll. Cont. Rev. Bonds (New England Pwr. Co. Proj.): | | | |
Series 1990 A, 0.5% tender 7/25/12, CP mode (e) | 1,600,000 | | 1,600,000 |
Series A1, 0.45% tender 7/12/12, CP mode (e) | 600,000 | | 600,000 |
| | 2,200,000 |
Virginia - 0.4% |
Halifax County Indl. Dev. Auth. Poll. Cont. Rev. Bonds (Virginia Elec. & Pwr. Co. Proj.) Series 1992, 1.25% tender 7/12/12, CP mode (e) | 3,200,000 | | 3,200,000 |
TOTAL OTHER MUNICIPAL DEBT |
215,890,841
|
Investment Company - 4.1% |
| Shares | | |
Fidelity Municipal Cash Central Fund, 0.21% (c)(d) | 34,722,000 | |
34,722,000
|
TOTAL INVESTMENT PORTFOLIO - 101.0% (Cost $863,547,841) | 863,547,841 |
NET OTHER ASSETS (LIABILITIES) - (1.0)% | (8,219,629) |
NET ASSETS - 100% | $ 855,328,212 |
Security Type Abbreviations |
CP | - | COMMERCIAL PAPER |
RAN | - | REVENUE ANTICIPATION NOTE |
VRDN | - | VARIABLE RATE DEMAND NOTE (A debt instrument that is payable upon demand, either daily, weekly or monthly) |
Legend |
(a) Security or a portion of the security purchased on a delayed delivery or when-issued basis. |
(b) Coupon rates for floating and adjustable rate securities reflect the rates in effect at period end. |
(c) Information in this report regarding holdings by state and security types does not reflect the holdings of the Fidelity Municipal Cash Central Fund. |
(d) Affiliated fund that is available only to investment companies and other accounts managed by Fidelity Investments. The rate quoted is the annualized seven-day yield of the fund at period end. A complete unaudited listing of the fund's holdings as of its most recent quarter end is available upon request. In addition, each Fidelity Central Fund's financial statements are available on the SEC's website or upon request. |
(e) Private activity obligations whose interest is subject to the federal alternative minimum tax for individuals. |
(f) Provides evidence of ownership in one or more underlying municipal bonds. |
Affiliated Central Funds |
Information regarding fiscal year to date income earned by the Fund from investments in Fidelity Central Funds is as follows: |
Fund | Income earned |
Fidelity Municipal Cash Central Fund | $ 45,987 |
Other Information |
The date shown for securities represents the date when principal payments must be paid, taking into account any call options exercised by the issuer and any permissible maturity shortening features other than interest rate resets. |
All investments are categorized as Level 2 under the Fair Value Hierarchy. The inputs or methodology used for valuing securities may not be an indication of the risk associated with investing in those securities. For more information on valuation inputs, please refer to the Security Valuation section in the accompanying Notes to Financial Statements. |
See accompanying notes which are an integral part of the financial statements.
Semiannual Report
Fidelity Michigan Municipal Money Market Fund
Statement of Assets and Liabilities
| June 30, 2012 (Unaudited) |
| | |
Assets | | |
Investment in securities, at value - See accompanying schedule: Unaffiliated issuers (cost $828,825,841) | $ 828,825,841 | |
Fidelity Central Funds (cost $34,722,000) | 34,722,000 | |
Total Investments (cost $863,547,841) | | $ 863,547,841 |
Cash | | 111,360 |
Receivable for investments sold | | 1,000,017 |
Receivable for fund shares sold | | 5,884,738 |
Interest receivable | | 703,062 |
Distributions receivable from Fidelity Central Funds | | 13,313 |
Receivable from investment adviser for expense reductions | | 2,656 |
Other receivables | | 29 |
Total assets | | 871,263,016 |
| | |
Liabilities | | |
Payable for investments purchased on a delayed delivery basis | $ 7,452,302 | |
Payable for fund shares redeemed | 8,076,382 | |
Distributions payable | 144 | |
Accrued management fee | 134,598 | |
Other affiliated payables | 251,192 | |
Other payables and accrued expenses | 20,186 | |
Total liabilities | | 15,934,804 |
| | |
Net Assets | | $ 855,328,212 |
Net Assets consist of: | | |
Paid in capital | | $ 855,323,293 |
Undistributed net investment income | | 244 |
Accumulated undistributed net realized gain (loss) on investments | | 4,675 |
Net Assets, for 854,371,100 shares outstanding | | $ 855,328,212 |
Net Asset Value, offering price and redemption price per share ($855,328,212 ÷ 854,371,100 shares) | | $ 1.00 |
See accompanying notes which are an integral part of the financial statements.
Semiannual Report
Fidelity Michigan Municipal Money Market Fund
Financial Statements - continued
Statement of Operations
Six months ended June 30, 2012 (Unaudited) |
| | |
Investment Income | | |
Interest | | $ 810,395 |
Income from Fidelity Central Funds | | 45,987 |
Total income | | 856,382 |
| | |
Expenses | | |
Management fee | $ 1,572,524 | |
Transfer agent fees | 675,875 | |
Accounting fees and expenses | 53,046 | |
Custodian fees and expenses | 6,086 | |
Independent trustees' compensation | 1,524 | |
Registration fees | 24,257 | |
Audit | 18,487 | |
Legal | 8,715 | |
Miscellaneous | 3,512 | |
Total expenses before reductions | 2,364,026 | |
Expense reductions | (1,550,719) | 813,307 |
Net investment income (loss) | | 43,075 |
Realized and Unrealized Gain (Loss) Net realized gain (loss) on: | | |
Investment securities: | | |
Unaffiliated issuers | | (41) |
Net increase in net assets resulting from operations | | $ 43,034 |
See accompanying notes which are an integral part of the financial statements.
Semiannual Report
Statement of Changes in Net Assets
| Six months ended June 30, 2012
(Unaudited) | Year ended
December 31, 2011 |
Increase (Decrease) in Net Assets | | |
Operations | | |
Net investment income (loss) | $ 43,075 | $ 86,215 |
Net realized gain (loss) | (41) | (10) |
Net increase in net assets resulting
from operations | 43,034 | 86,205 |
Distributions to shareholders from net investment income | (42,831) | (86,008) |
Share transactions at net asset value of $1.00 per share
Proceeds from sales of shares | 1,128,457,620 | 2,427,760,562 |
Reinvestment of distributions | 42,013 | 85,070 |
Cost of shares redeemed | (1,148,807,669) | (2,442,465,101) |
Net increase (decrease) in net assets and shares resulting from share transactions | (20,308,036) | (14,619,469) |
Total increase (decrease) in net assets | (20,307,833) | (14,619,272) |
| | |
Net Assets | | |
Beginning of period | 875,636,045 | 890,255,317 |
End of period (including undistributed net investment income of $244 and undistributed net investment income of $0, respectively) | $ 855,328,212 | $ 875,636,045 |
See accompanying notes which are an integral part of the financial statements.
Semiannual Report
Financial Highlights
| Six months ended June 30, 2012 | Years ended December 31, |
| (Unaudited) | 2011 | 2010 | 2009 | 2008 | 2007 |
Selected Per-Share Data | | | | | |
Net asset value, beginning of period | $ 1.00 | $ 1.00 | $ 1.00 | $ 1.00 | $ 1.00 | $ 1.00 |
Income from Investment Operations | | | | | | |
Net investment income (loss) | - F | - F | - F | - F | .017 | .032 |
Net realized and unrealized gain (loss) F | - | - | - | - | - | - |
Total from investment operations | - F | - F | - F | - F | .017 | .032 |
Distributions from net investment income | - F | - F | - F | - F | (.017) | (.032) |
Distributions from net realized gain | - | - | - | - F | - | - F |
Total distributions | - F | - F | - F | - F | (.017) | (.032) |
Net asset value, end of period | $ 1.00 | $ 1.00 | $ 1.00 | $ 1.00 | $ 1.00 | $ 1.00 |
Total Return B,C | -% | .01% | .01% | .02% | 1.68% | 3.21% |
Ratios to Average Net Assets D,E | | | | | |
Expenses before reductions | .55%A | .55% | .55% | .60% | .54% | .54% |
Expenses net of fee waivers, if any | .19%A | .22% | .30% | .48% | .54% | .54% |
Expenses net of all reductions | .19%A | .22% | .30% | .48% | .48% | .42% |
Net investment income (loss) | .01%A | .01% | .01% | .02% | 1.66% | 3.15% |
Supplemental Data | | | | | | |
Net assets,
end of period (000 omitted) | $ 855,328 | $ 875,636 | $ 890,255 | $ 902,486 | $ 1,121,825 | $ 1,087,587 |
A Annualized
B Total returns for periods of less than one year are not annualized.
C Total returns would have been lower if certain expenses had not been reduced during the applicable periods shown.
D Fees and expenses of any underlying Fidelity Central Funds are not included in the Fund's expense ratio. The Fund indirectly bears its proportionate share of the expenses of any underlying Fidelity Central Funds.
E Expense ratios reflect operating expenses of the Fund. Expenses before reductions do not reflect amounts reimbursed or waived or reductions from expense offset arrangements and do not represent the amount paid by the Fund during periods when reimbursements, waivers or reductions occur. Expenses net of fee waivers reflect expenses after reimbursement and waivers but prior to reductions from expense offset arrangements. Expenses net of all reductions represent the net expenses paid by the Fund.
F Amount represents less than $.001 per share.
See accompanying notes which are an integral part of the financial statements.
Semiannual Report
Notes to Financial Statements
For the period ended June 30, 2012 (Unaudited)
1. Organization.
Fidelity® Michigan Municipal Income Fund (the Income Fund) is a fund of Fidelity Municipal Trust. Fidelity Michigan Municipal Money Market Fund (the Money Market Fund is a fund of Fidelity Municipal Trust II. Each Trust is registered under the Investment Company Act of 1940, as amended (the 1940 Act), as an open-end management investment company. Fidelity Municipal Trust and Fidelity Municipal Trust II (the Trusts) are organized as a Massachusetts business trust and a Delaware statutory trust, respectively. The Income Fund is a non-diversified fund. Each Fund is authorized to issue an unlimited number of shares. Each Fund may be affected by economic and political developments in the state of Michigan.
2. Investments in Fidelity Central Funds.
The Funds may invest in Fidelity Central Funds, which are open-end investment companies available only to other investment companies and accounts managed by Fidelity Management & Research Company (FMR) and its affiliates. The Funds' Schedules of Investments list each of the Fidelity Central Funds held as of period end, if any, as an investment of each Fund, but do not include the underlying holdings of each Fidelity Central Fund. As an Investing Fund, each Fund indirectly bears its proportionate share of the expenses of the underlying Fidelity Central Funds.
The Money Market Central Funds seek preservation of capital and current income and are managed by Fidelity Investments Money Management, Inc. (FIMM), an affiliate of FMR.
A complete unaudited list of holdings for each Fidelity Central Fund is available upon request or at the Securities and Exchange Commission (the SEC) web site at www.sec.gov. In addition, the financial statements of the Fidelity Central Funds are available on the SEC web site or upon request.
3. Significant Accounting Policies.
The financial statements have been prepared in conformity with accounting principles generally accepted in the United States of America (GAAP), which require management to make certain estimates and assumptions at the date of the financial statements. Actual results could differ from those estimates. Subsequent events, if any, through the date that the financial statements were issued have been evaluated in the preparation of the financial statements. The following summarizes the significant accounting policies of the Funds:
Semiannual Report
Notes to Financial Statements (Unaudited) - continued
3. Significant Accounting Policies - continued
Security Valuation. Investments are valued as of 4:00 p.m. Eastern time on the last calendar day of the period. In accordance with valuation policies and procedures approved by the Board of Trustees (the Board), the Income Fund attempts to obtain prices from one or more third party pricing vendor or broker to value their investments. When current market prices, quotations or rates are not readily available or reliable, securities will be fair valued in good faith by the FMR Fair Value Committee (the Committee), in accordance with procedures adopted by the Board. Factors used in determining fair value vary by security type and may include market or security specific events, changes in interest rates and credit quality. The frequency with which these procedures are used cannot be predicted and they may be utilized to a significant extent. The Committee oversees the Income Fund's valuation policies and procedures and is responsible for approving and reporting to the Board all fair value determinations.
Each Fund categorizes the inputs to valuation techniques used to value their investments into a disclosure hierarchy consisting of three levels as shown below:
Level 1 - quoted prices in active markets for identical investments
Level 2 - other significant observable inputs (including quoted prices for similar investments, interest rates, prepayment speeds, etc.)
Level 3 - unobservable inputs (including the Fund's own assumptions based on the best information available)
Valuation techniques used to value each Fund's investments by major category are as follows:
For the Income Fund, debt securities, including restricted securities, are valued based on evaluated prices received from third party pricing vendors or from brokers who make markets in such securities. For municipal securities, pricing vendors utilize matrix pricing which considers yield or price of bonds of comparable quality, coupon, maturity and type as well as broker-supplied prices and are generally categorized as Level 2 in the hierarchy. When independent prices are unavailable or unreliable, debt securities may be valued utilizing pricing methodologies which consider similar factors that would be used by third party pricing vendors. These are generally categorized as Level 2 in the hierarchy but may be Level 3 depending on the circumstances.
For the Money Market Fund, as permitted by compliance with certain conditions under Rule 2a-7 of the 1940 Act, securities are valued at amortized cost, which approximates fair value. The amortized cost of an instrument is determined by valuing it at its original cost and thereafter amortizing any discount or premium from its face value at a constant rate until maturity. Securities held by a money market fund are generally high quality
Semiannual Report
3. Significant Accounting Policies - continued
Security Valuation - continued
and liquid; however, they are reflected as Level 2 because the inputs used to determine fair value are not quoted prices in an active market.
For the Income Fund, changes in valuation techniques may result in transfers in or out of an assigned level within the disclosure hierarchy.
Investment Transactions and Income. For financial reporting purposes, the Funds' investment holdings and NAV include trades executed through the end of the last business day of the period. The NAV per share for processing shareholder transactions is calculated as of the close of business of the New York Stock Exchange (NYSE), normally 4:00 p.m. Eastern time and includes trades executed through the end of the prior business day for the Income Fund and trades executed through the end of the current business day for the Money Market Fund. Gains and losses on securities sold are determined on the basis of identified cost. Interest income and distributions from the Fidelity Central Funds are accrued as earned. Interest income includes coupon interest and amortization of premium and accretion of discount on debt securities.
Expenses. Expenses directly attributable to a fund are charged to that fund. Expenses attributable to more than one fund are allocated among the respective funds on the basis of relative net assets or other appropriate methods. Expense estimates are accrued in the period to which they relate and adjustments are made when actual amounts are known.
Income Tax Information and Distributions to Shareholders. Each year, each Fund intends to qualify as a regulated investment company under Subchapter M of the Internal Revenue Code, including distributing substantially all of its taxable income and realized gains. As a result, no provision for income taxes is required. Each Fund files a U.S. federal tax return, in addition to state and local tax returns as required. A fund's federal income tax returns are subject to examination by the Internal Revenue Service (IRS) for a period of three fiscal years after they are filed. State and local tax returns may be subject to examination for an additional fiscal year depending on the jurisdiction.
Dividends are declared and recorded daily and paid monthly from net investment income. Distributions from realized gains, if any, are declared and recorded on the ex-dividend date. Income and capital gain distributions are determined in accordance with income tax regulations, which may differ from GAAP.
Capital accounts within the financial statements are adjusted for permanent book-tax differences. These adjustments have no impact on net assets or the results of operations. Temporary book-tax differences will reverse in a subsequent period.
Semiannual Report
Notes to Financial Statements (Unaudited) - continued
3. Significant Accounting Policies - continued
Income Tax Information and Distributions to Shareholders - continued
Book-tax differences are primarily due to market discount, deferred trustees compensation, capital loss carryforwards, and losses deferred due to futures transactions and excise tax regulations.
The Funds purchase municipal securities whose interest, in the opinion of the issuer, is free from federal income tax. There is no assurance that the IRS will agree with this opinion. In the event the IRS determines that the issuer does not comply with relevant tax requirements, interest payments from a security could become federally taxable, possibly retroactively to the date the security was issued.
The federal tax cost of investment securities and unrealized appreciation (depreciation) as of period end were as follows for each Fund:
| Tax cost | Gross
unrealized
appreciation | Gross
unrealized
depreciation | Net unrealized
appreciation
(depreciation) on securities and other investments |
Fidelity Michigan Municipal Income Fund | $ 601,792,492 | $ 44,534,785 | $ (618,857) | $ 43,915,928 |
Fidelity Michigan Municipal Money Market Fund | 863,547,841 | - | - | - |
Capital loss carryforwards are only available to offset future capital gains of the Funds to the extent provided by regulations and may be limited. Under the Regulated Investment Company Modernization Act of 2010 (the Act), the Funds are permitted to carry forward capital losses incurred in taxable years beginning after December 22, 2010 for an unlimited period and such capital losses are required to be used prior to any losses that expire. At December 31, 2011, capital loss carryforwards were as follows:
| Fiscal Year of
Expiration |
| 2018 |
Fidelity Michigan Municipal Money Market Fund | $ (39) |
| | No expiration | |
| Short-term | Long-term | Total capital loss
carryforward |
Fidelity Michigan Municipal Income Fund | $ (30,263) | $ (40,401) | $ (70,664) |
Fidelity Michigan Municipal Money Market Fund | (7) | (-) | (46) |
Semiannual Report
3. Significant Accounting Policies - continued
Short-Term Trading (Redemption) Fees. Shares held by investors in the Income Fund less than 30 days are subject to a redemption fee equal to ..50% of the net asset value of shares redeemed. All redemption fees, which reduce the proceeds of the shareholder redemption, are retained by the Fund and accounted for as an addition to paid in capital.
4. Operating Policies.
Delayed Delivery Transactions and When-Issued Securities. During the period, the Funds transacted in securities on a delayed delivery or when-issued basis. Payment and delivery may take place after the customary settlement period for that security. The price of the underlying securities and the date when the securities will be delivered and paid for are fixed at the time the transaction is negotiated. The securities purchased on a delayed delivery or when-issued basis are identified as such in each applicable Fund's Schedule of Investments. The Funds may receive compensation for interest forgone in the purchase of a delayed delivery or when-issued security. With respect to purchase commitments, each applicable Fund identifies securities as segregated in its records with a value at least equal to the amount of the commitment. Losses may arise due to changes in the value of the underlying securities or if the counterparty does not perform under the contract's terms, or if the issuer does not issue the securities due to political, economic, or other factors.
5. Purchases and Sales of Investments.
Purchases and sales of securities, other than short-term securities, for the Income Fund aggregated $56,633,784 and $20,218,798, respectively.
6. Fees and Other Transactions with Affiliates.
Management Fee. FMR and its affiliates provide the Funds with investment management related services for which the Funds pay a monthly management fee. The management fee is the sum of an individual fund fee rate and an annualized group fee rate. The individual fund fee rate is applied to each Fund's average net assets. The group fee rate is based upon the average net assets of all the mutual funds advised by FMR. The group fee rate decreases as assets under management increase and increases as assets under management decrease. For the period, each Fund's annualized management fee rate expressed as a percentage of each Fund's average net assets was as follows:
| Individual Rate | Group Rate | Total |
Fidelity Michigan Municipal Income Fund | .25% | .12% | .37% |
Fidelity Michigan Municipal Money Market Fund | .25% | .12% | .37% |
Semiannual Report
Notes to Financial Statements (Unaudited) - continued
6. Fees and Other Transactions with Affiliates - continued
Transfer Agent and Accounting Fees. Citibank, N.A. (Citibank) is the custodian, transfer agent and servicing agent for the Funds. Citibank has entered into a sub-arrangement with Fidelity Investments Institutional Operations Company, Inc. (FIIOC), an affiliate of FMR, under which FIIOC performs the activities associated with the Funds' transfer agency, dividend disbursing and shareholder servicing functions. The Funds pay account fees and asset-based fees that vary according to account size and type of account. FIIOC pays for typesetting, printing and mailing of shareholder reports, except proxy statements. For the period, the transfer agent fees were equivalent to the following annualized rates expressed as a percentage of average net assets:
Fidelity Michigan Municipal Income Fund | .08% |
Fidelity Michigan Municipal Money Market Fund | .16% |
During the period, FMR or its affiliates waived a portion of these fees for the Money Market Fund.
Citibank also has a sub-arrangement with Fidelity Service Company, Inc. (FSC), an affiliate of FMR, under which FSC maintains each Fund's accounting records. The fee is based on the level of average net assets for the month.
7. Committed Line of Credit.
The Income Fund participates with other funds managed by FMR or an affiliate in a $4.25 billion credit facility (the "line of credit") to be utilized for temporary or emergency purposes to fund shareholder redemptions or for other short-term liquidity purposes. The participating funds have agreed to pay commitment fees on their pro-rata portion of the line of credit, which are reflected in Miscellaneous expenses on the Statement of Operations, and are as follows:
Fidelity Michigan Municipal Income Fund | $ 938 |
During the period, there were no borrowings on this line of credit.
8. Expense Reductions.
FMR voluntarily agreed to reimburse the Funds to the extent annual operating expenses exceeded certain levels of average net assets as noted in the table below. Some expenses, for example interest expense, including commitment fees, are excluded from this reimbursement.
Semiannual Report
8. Expense Reductions - continued
The following Funds were in reimbursement during the period:
| Expense
Limitations | Reimbursement
from adviser |
Fidelity Michigan Municipal Money Market Fund | .55% | $ 10,239 |
Additionally, FMR or its affiliates voluntarily agreed to waive certain fees for the Money Market Fund in order to maintain a minimum annualized yield of .01%. Such arrangements may be discontinued by FMR at any time. For the period, the amount of the waiver was $1,540,384.
In addition, through arrangements with each applicable Fund's custodian, credits realized as a result of uninvested cash balances were used to reduce each applicable Fund's expenses. All of the applicable expense reductions are noted in the table below.
| Custody
expense
reduction | Transfer
Agent
expense
reduction | Accounting
expense
reduction |
Fidelity Michigan Municipal Income Fund | $ 3,463 | $ 2,274 | $ 5 |
Fidelity Michigan Municipal Money Market Fund | 96 | - | - |
9. Other.
The Funds' organizational documents provide former and current trustees and officers with a limited indemnification against liabilities arising in connection with the performance of their duties to the Funds. In the normal course of business, the Funds may also enter into contracts that provide general indemnifications. The Funds' maximum exposure under these arrangements is unknown as this would be dependent on future claims that may be made against the Funds. The risk of material loss from such claims is considered remote.
Semiannual Report
Investment Adviser
Fidelity Management & Research Company
Boston, MA
Investment Sub-Advisers
Fidelity Investments Money
Management, Inc.
Fidelity Management & Research
(U.K.) Inc.
Fidelity Management & Research
(Hong Kong) Limited
Fidelity Management & Research
(Japan) Inc.
General Distributor
Fidelity Distributors Corporation
Smithfield, RI
Transfer and Service Agents
Citibank, N.A.
New York, NY
Fidelity Investments Institutional
Operations Company, Inc.
Boston, MA
Fidelity Service Company, Inc.
Boston, MA
Custodian
Citibank, N.A.
New York, NY
The Fidelity Telephone Connection
Mutual Fund 24-Hour Service
Exchanges/Redemptions
and Account Assistance 1-800-544-6666
Product Information 1-800-544-6666
Retirement Accounts 1-800-544-4774 (8 a.m. - 9 p.m.)
TDD Service 1-800-544-0118
for the deaf and hearing impaired
(9 a.m. - 9 p.m. Eastern time)
Fidelity Automated Service
Telephone (FAST®) 1-800-544-5555
Automated line for quickest service
MIR-USAN-0812
1.787785.109
(Fidelity Investment logo)(registered trademark)
Corporate Headquarters
82 Devonshire St., Boston, MA 02109
www.fidelity.com
Fidelity®
Municipal Income
Fund
Semiannual Report
June 30, 2012
(Fidelity Cover Art)
Contents
Shareholder Expense Example | (Click Here) | An example of shareholder expenses. |
Investment Changes | (Click Here) | A summary of major shifts in the fund's investments over the past six months. |
Investments | (Click Here) | A complete list of the fund's investments with their market values. |
Financial Statements | (Click Here) | Statements of assets and liabilities, operations, and changes in net assets, as well as financial highlights. |
Notes | (Click Here) | Notes to the financial statements. |
To view a fund's proxy voting guidelines and proxy voting record for the 12-month period ended June 30, visit http://www.fidelity.com/proxyvotingresults or visit the Securities and Exchange Commission's (SEC) web site at http://www.sec.gov. You may also call 1-800-544-8544 to request a free copy of the proxy voting guidelines.
Standard & Poor's, S&P and S&P 500 are registered service marks of The McGraw-Hill Companies, Inc. and have been licensed for use by Fidelity Distributors Corporation.
Other third party marks appearing herein are the property of their respective owners.
All other marks appearing herein are registered or unregistered trademarks or service marks of FMR LLC or an affiliated company. © 2012 FMR LLC. All rights reserved.
This report and the financial statements contained herein are submitted for the general information of the shareholders of the fund. This report is not authorized for distribution to prospective investors in the fund unless preceded or accompanied by an effective prospectus.
A fund files its complete schedule of portfolio holdings with the SEC for the first and third quarters of each fiscal year on Form N-Q. Forms N-Q are available on the SEC's web site at http://www.sec.gov. A fund's Forms N-Q may be reviewed and copied at the SEC's Public Reference Room in Washington, DC. Information regarding the operation of the SEC's Public Reference Room may be obtained by calling 1-800-SEC-0330. For a complete list of a fund's portfolio holdings, view the most recent holdings listing, semiannual report, or annual report on Fidelity's web site at http://www.fidelity.com, http://www.advisor.fidelity.com, or http://www.401k.com, as applicable.
NOT FDIC INSURED • MAY LOSE VALUE • NO BANK GUARANTEE
Neither the fund nor Fidelity Distributors Corporation is a bank.
Semiannual Report
Shareholder Expense Example
As a shareholder of the Fund, you incur two types of costs: (1) transaction costs, including redemption fees and (2) ongoing costs, including management fees and other Fund expenses. This Example is intended to help you understand your ongoing costs (in dollars) of investing in the Fund and to compare these costs with the ongoing costs of investing in other mutual funds.
The Example is based on an investment of $1,000 invested at the beginning of the period and held for the entire period (January 1, 2012 to June 30, 2012).
Actual Expenses
The first line of the accompanying table provides information about actual account values and actual expenses. You may use the information in this line, together with the amount you invested, to estimate the expenses that you paid over the period. Simply divide your account value by $1,000.00 (for example, an $8,600 account value divided by $1,000.00 = 8.6), then multiply the result by the number in the first line under the heading entitled "Expenses Paid During Period" to estimate the expenses you paid on your account during this period. A small balance maintenance fee of $12.00 that is charged once a year may apply for certain accounts with a value of less than $2,000. This fee is not included in the table below. If it was, the estimate of expenses you paid during the period would be higher, and your ending account value lower, by this amount. In addition, the Fund, as a shareholder in the underlying Fidelity Central Funds, will indirectly bear its pro-rata share of the fees and expenses incurred by the underlying Fidelity Central Funds. These fees and expenses are not included in the Fund's annualized expense ratio used to calculate the expense estimate in the table below.
Hypothetical Example for Comparison Purposes
The second line of the accompanying table provides information about hypothetical account values and hypothetical expenses based on the Fund's actual expense ratio and an assumed rate of return of 5% per year before expenses, which is not the Fund's actual return. The hypothetical account values and expenses may not be used to estimate the actual ending account balance or expenses you paid for the period. You may use this information to compare the ongoing costs of investing in the Fund and other funds. To do so, compare this 5% hypothetical example with the 5% hypothetical examples that appear in the shareholder reports of the other funds. A small balance maintenance fee of $12.00 that is charged once a year may apply for certain accounts with a value of less than $2,000. This fee is not included in the table below. If it was, the estimate of expenses you paid during the period would be higher, and your ending account value lower, by this amount. In addition, the Fund, as a shareholder in the underlying Fidelity Central Funds, will indirectly bear its pro-rata share of the fees and expenses incurred by the underlying Fidelity Central Funds. These fees and expenses are not included in the Fund's annualized expense ratio used to calculate the expense estimate in the table below.
Please note that the expenses shown in the table are meant to highlight your ongoing costs only and do not reflect any transaction costs. Therefore, the second line of the table is useful in comparing ongoing costs only, and will not help you determine the relative total costs of owning different funds. In addition, if these transactional costs were included, your costs would have been higher.
Semiannual Report
Shareholder Expense Example - continued
| Annualized Expense Ratio | Beginning
Account Value
January 1, 2012 | Ending
Account Value
June 30, 2012 | Expenses Paid
During Period*
January 1, 2012
to June 30, 2012 |
Actual | .47% | $ 1,000.00 | $ 1,042.40 | $ 2.39 |
Hypothetical (5% return per year before expenses) | | $ 1,000.00 | $ 1,022.53 | $ 2.36 |
* Expenses are equal to the Fund's annualized expense ratio, multiplied by the average account value over the period, multiplied by 182/366 (to reflect the one-half year period).
Semiannual Report
Investment Changes (Unaudited)
Top Five States as of June 30, 2012 |
| % of fund's
net assets | % of fund's net assets
6 months ago |
California | 18.4 | 16.9 |
Illinois | 13.5 | 13.1 |
New York | 12.3 | 10.0 |
Texas | 10.6 | 10.3 |
Florida | 9.0 | 8.4 |
Top Five Sectors as of June 30, 2012 |
| % of fund's
net assets | % of fund's net assets
6 months ago |
General Obligations | 35.1 | 34.6 |
Health Care | 16.1 | 17.4 |
Water & Sewer | 10.6 | 9.3 |
Transportation | 9.5 | 9.9 |
Special Tax | 8.8 | 9.2 |
Weighted Average Maturity as of June 30, 2012 |
| | 6 months ago |
Years | 5.9 | 6.1 |
This is a weighted average of all the maturities of the securities held in a fund. Weighted Average Maturity (WAM) can be used as a measure of sensitivity to interest rate changes and market changes. Generally, the longer the maturity, the greater the sensitivity to such changes. WAM is based on the dollar-weighted average length of time until principal payments must be paid. Depending on the types of securities held in a fund, certain maturity shortening devices (e.g., demand features, interest rate resets, and call options) may be taken into account when calculating the WAM. |
Duration as of June 30, 2012 |
| | 6 months ago |
Years | 7.6 | 7.9 |
Duration estimates how much a bond fund's price will change with a change in comparable interest rates. If rates rise 1%, for example, a fund with a 5-year duration is likely to lose about 5% of its value. Other factors also can influence a bond fund's performance and share price. Accordingly, a bond fund's actual performance may differ from this example. Duration takes into account any call or put option embedded in the bonds. |
Quality Diversification (% of fund's net assets) |
As of June 30, 2012 | As of December 31, 2011 |
 | AAA 8.6% | | | AAA 7.3% | |
 | AA,A 79.5% | | | AA,A 77.3% | |
 | BBB 8.6% | | | BBB 9.0% | |
 | BB and Below 0.3% | | | BB and Below 0.8% | |
 | Not Rated 1.7% | | | Not Rated 2.0% | |
 | Short-Term
Investments and
Net Other Assets 1.3% | | | Short-Term
Investments and
Net Other Assets 3.6% | |

We have used ratings from Moody's Investors Service, Inc. Where Moody's® ratings are not available, we have used S&P® ratings. All ratings are as of the date indicated and do not reflect subsequent changes. |
Semiannual Report
Investments June 30, 2012 (Unaudited)
Showing Percentage of Net Assets
Municipal Bonds - 98.7% |
| Principal Amount (000s) | | Value (000s) |
Alabama - 0.1% |
Jefferson County Ltd. Oblig. School Warrants Series 2004 A, 5.5% 1/1/22 | | $ 5,500 | | $ 5,488 |
Univ. of Alabama at Birmingham Hosp. Rev. Series 2008 A, 5.75% 9/1/22 | | 3,000 | | 3,477 |
| | 8,965 |
Arizona - 1.7% |
Arizona Ctfs. of Partnership Series 2010 A: | | | | |
5% 10/1/18 (FSA Insured) | | 2,670 | | 3,085 |
5.25% 10/1/20 (FSA Insured) | | 8,000 | | 9,373 |
5.25% 10/1/26 (FSA Insured) | | 2,570 | | 2,890 |
5.25% 10/1/28 (FSA Insured) | | 8,345 | | 9,322 |
Arizona Health Facilities Auth. Rev. (Banner Health Sys. Proj.): | | | | |
Series 2007 A, 5% 1/1/21 | | 2,000 | | 2,231 |
Series 2007 B, 1.124% 1/1/37 (c) | | 3,000 | | 2,175 |
Series 2008 D: | | | | |
5.5% 1/1/38 | | 12,000 | | 13,014 |
6% 1/1/27 | | 2,600 | | 3,013 |
Arizona State Lottery Rev. Series 2010 A, 5% 7/1/21 (FSA Insured) | | 5,800 | | 6,712 |
Arizona State Univ. Ctfs. of Partnership (Research Infrastructure Proj.) Series 2004: | | | | |
5.25% 9/1/21 | | 2,545 | | 2,743 |
5.25% 9/1/22 | | 1,000 | | 1,078 |
Goodyear McDowell Road Commercial Corridor Impt. District 5.25% 1/1/18 (AMBAC Insured) | | 1,660 | | 1,848 |
Marana Muni. Property Corp. Facilities Rev. Series 2008 A, 5% 7/1/21 | | 1,580 | | 1,768 |
Maricopa County Indl. Dev. Auth. Hosp. Facilities Rev. (Samaritan Health Svcs. Proj.) Series 1990 A, 7% 12/1/16 (Escrowed to Maturity) | | 2,000 | | 2,328 |
Maricopa County Poll. Cont. Rev. (Southern California Edison Co. Proj.) Series 2000 A, 5% 6/1/35 | | 3,600 | | 3,898 |
McAllister Academic Village LLC Rev. (Arizona State Univ. Hassayampa Academic Village Proj.) Series 2008, 5.25% 7/1/39 | | 4,800 | | 5,085 |
Phoenix Civic Impt. Corp. District Rev. (Plaza Expansion Proj.) Series 2005 B, 0% 7/1/38 (Nat'l. Pub. Fin. Guarantee Corp. Insured) (a) | | 12,000 | | 13,756 |
Phoenix Civic Impt. Corp. Excise Tax Rev. Series 2011 C: | | | | |
5% 7/1/22 | | 1,000 | | 1,216 |
5% 7/1/23 | | 2,000 | | 2,413 |
Municipal Bonds - continued |
| Principal Amount (000s) | | Value (000s) |
Arizona - continued |
Pima County Swr. Sys. Rev. Series 2011 B, 5% 7/1/22 | | $ 1,500 | | $ 1,786 |
Salt Verde Finl. Corp. Sr. Gas Rev. Series 2007: | | | | |
5.25% 12/1/21 | | 3,500 | | 3,791 |
5.5% 12/1/29 | | 7,900 | | 8,528 |
Scottsdale Indl. Dev. Auth. Hosp. Rev. (Scottsdale Healthcare Proj.) Series 2006 C, 5% 9/1/35 (FSA Insured) | | 845 | | 914 |
Univ. Med. Ctr. Corp. Hosp. Rev. Series 2011, 6% 7/1/39 | | 3,000 | | 3,420 |
Univ. of Arizona Univ. Revs. Series 2005 A: | | | | |
5% 6/1/18 (AMBAC Insured) | | 1,000 | | 1,097 |
5% 6/1/31 (AMBAC Insured) | | 2,025 | | 2,133 |
| | 109,617 |
California - 18.4% |
ABAG Fin. Auth. for Nonprofit Corps. Rev. (Sharp HealthCare Proj.) Series 2009 B, 6.25% 8/1/39 | | 2,800 | | 3,269 |
ABC Unified School District Series 1997 C, 0% 8/1/28 (Nat'l. Pub. Fin. Guarantee Corp. Insured) | | 3,925 | | 1,863 |
Bay Area Toll Auth. San Francisco Bay Toll Bridge Rev. Series 2009 F1, 5.625% 4/1/44 | | 6,350 | | 7,194 |
Cabrillo Unified School District Series A, 0% 8/1/20 (AMBAC Insured) | | 4,275 | | 3,351 |
California Dept. of Wtr. Resources: | | | | |
(Central Valley Proj.): | | | | |
Series AL: | | | | |
5% 12/1/19 (b) | | 1,300 | | 1,593 |
5% 12/1/22 (b) | | 5,875 | | 7,345 |
Series AM, 5% 12/1/22 (b) | | 6,500 | | 7,840 |
Series AI: | | | | |
5% 12/1/16 | | 2,195 | | 2,614 |
5% 12/1/18 | | 10,315 | | 12,782 |
5% 12/1/19 | | 1,000 | | 1,268 |
California Econ. Recovery: | | | | |
Series 2009 A, 5% 7/1/22 | | 7,500 | | 8,522 |
Series A, 5% 7/1/18 | | 5,700 | | 6,871 |
California Edl. Facilities Auth. Rev. (Loyola Marymount Univ. Proj.) Series 2001 A: | | | | |
0% 10/1/16 (Nat'l. Pub. Fin. Guarantee Corp. Insured) | | 2,140 | | 1,931 |
0% 10/1/17 (Nat'l. Pub. Fin. Guarantee Corp. Insured) | | 2,050 | | 1,779 |
Municipal Bonds - continued |
| Principal Amount (000s) | | Value (000s) |
California - continued |
California Edl. Facilities Auth. Rev. (Loyola Marymount Univ. Proj.) Series 2001 A: - continued | | | | |
0% 10/1/18 (Nat'l. Pub. Fin. Guarantee Corp. Insured) | | $ 1,675 | | $ 1,388 |
0% 10/1/22 (Nat'l. Pub. Fin. Guarantee Corp. Insured) | | 5,000 | | 3,387 |
California Gen. Oblig.: | | | | |
Series 2007, 5.625% 5/1/20 | | 210 | | 211 |
5% 3/1/19 | | 1,800 | | 2,085 |
5% 8/1/19 | | 16,310 | | 18,460 |
5% 8/1/20 | | 5,355 | | 6,046 |
5% 10/1/22 | | 2,300 | | 2,646 |
5% 11/1/22 | | 3,100 | | 3,560 |
5% 12/1/22 | | 6,800 | | 7,825 |
5% 11/1/24 | | 1,600 | | 1,808 |
5% 3/1/26 | | 5,100 | | 5,507 |
5% 6/1/27 (AMBAC Insured) | | 4,100 | | 4,370 |
5% 9/1/27 | | 10,500 | | 11,400 |
5% 2/1/31 (Nat'l. Pub. Fin. Guarantee Corp. Insured) | | 2,305 | | 2,321 |
5% 2/1/31 (Pre-Refunded to 2/1/13 @ 100) | | 2,195 | | 2,255 |
5% 9/1/31 | | 22,500 | | 24,521 |
5% 12/1/31 (Nat'l. Pub. Fin. Guarantee Corp. Insured) | | 5,595 | | 5,835 |
5% 9/1/32 | | 24,995 | | 26,712 |
5% 9/1/33 | | 19,115 | | 20,420 |
5% 9/1/35 | | 4,050 | | 4,288 |
5.125% 11/1/24 | | 4,300 | | 4,549 |
5.125% 2/1/26 | | 2,500 | | 2,621 |
5.25% 2/1/16 | | 1,320 | | 1,390 |
5.25% 2/1/16 (Pre-Refunded to 8/1/13 @ 100) | | 2,480 | | 2,613 |
5.25% 2/1/19 | | 165 | | 173 |
5.25% 2/1/19 (Pre-Refunded to 8/1/13 @ 100) | | 5,455 | | 5,747 |
5.25% 2/1/20 | | 40 | | 42 |
5.25% 2/1/20 (Pre-Refunded to 8/1/13 @ 100) | | 1,960 | | 2,065 |
5.25% 9/1/23 | | 24,300 | | 29,208 |
5.25% 2/1/24 | | 4,000 | | 4,193 |
5.25% 2/1/27 (Nat'l. Pub. Fin. Guarantee Corp. Insured) | | 3,700 | | 3,784 |
5.25% 2/1/28 | | 4,800 | | 4,996 |
5.25% 11/1/28 | | 4,485 | | 4,711 |
5.25% 2/1/33 (Pre-Refunded to 2/1/13 @ 100) | | 16,300 | | 16,773 |
5.25% 12/1/33 | | 160 | | 167 |
Municipal Bonds - continued |
| Principal Amount (000s) | | Value (000s) |
California - continued |
California Gen. Oblig.: - continued | | | | |
5.25% 4/1/35 | | $ 12,000 | | $ 13,302 |
5.25% 3/1/38 | | 9,000 | | 9,587 |
5.25% 11/1/40 | | 3,200 | | 3,495 |
5.5% 8/1/27 | | 14,700 | | 16,822 |
5.5% 4/1/28 | | 10 | | 11 |
5.5% 8/1/29 | | 9,850 | | 11,114 |
5.5% 4/1/30 | | 5 | | 5 |
5.5% 11/1/33 | | 39,350 | | 41,169 |
5.5% 3/1/40 | | 5,900 | | 6,523 |
5.6% 3/1/36 | | 2,550 | | 2,868 |
5.75% 4/1/31 | | 5,020 | | 5,754 |
6% 3/1/33 | | 23,800 | | 28,150 |
6% 4/1/38 | | 19,600 | | 22,709 |
6% 11/1/39 | | 10,020 | | 11,703 |
6.5% 4/1/33 | | 7,900 | | 9,522 |
California Health Facilities Fing. Auth. Rev.: | | | | |
(Catholic Healthcare West Proj.): | | | | |
Series 2008 H, 5.125% 7/1/22 | | 2,765 | | 3,034 |
Series 2008 L, 5.125% 7/1/22 | | 4,000 | | 4,389 |
Series 2009 E, 5.625% 7/1/25 | | 10,000 | | 11,427 |
(Cedars-Sinai Med. Ctr. Proj.) Series 2005, 5% 11/15/13 | | 1,000 | | 1,061 |
(St. Joseph Health Sys. Proj.) Series 2009 A, 5.75% 7/1/39 | | 6,800 | | 7,576 |
(Stanford Health and Clinics Proj.) Series 2012 A, 5% 8/15/51 | | 10,000 | | 10,670 |
(Stanford Hosp. & Clinics Proj.) Series 2010 B, 5.75% 11/15/31 | | 12,500 | | 14,984 |
Bonds (Catholic Healthcare West Proj.) Series 2009 D, 5%, tender 7/1/14 (c) | | 5,900 | | 6,354 |
California Pub. Works Board Lease Rev.: | | | | |
(Butterfield State Office Complex Proj.) Series 2005 A, 5.25% 6/1/30 | | 14,000 | | 14,498 |
(Dept. of Health Svcs. Proj.) Series 2005 K, 5% 11/1/23 | | 4,575 | | 4,835 |
(Madera County, Valley State Prison for Women Proj.) Series 2005 H, 5% 6/1/16 | | 6,000 | | 6,586 |
(Monterey Bay Campus Library Proj.) Series 2009 D, 6.25% 4/1/34 | | 7,280 | | 8,467 |
(Office of Emergency Svcs. Proj.) Series 2007 A: | | | | |
5% 3/1/21 | | 3,515 | | 3,833 |
Municipal Bonds - continued |
| Principal Amount (000s) | | Value (000s) |
California - continued |
California Pub. Works Board Lease Rev.: - continued | | | | |
(Office of Emergency Svcs. Proj.) Series 2007 A: | | | | |
5% 3/1/22 | | $ 1,695 | | $ 1,842 |
(Porterville Developmental Ctr. Hsg. Expansion and Recreation Complex Proj.) Series 2009 C, 6.25% 4/1/34 | | 2,825 | | 3,174 |
(Univ. Proj.) Series 2011 B, 5.25% 10/1/26 | | 2,515 | | 2,828 |
(Various California State Univ. Projs.) Series 1993 A, 5.25% 12/1/13 | | 1,830 | | 1,836 |
(Various Cap. Projects) Series 2011 A: | | | | |
5% 10/1/27 | | 10,000 | | 10,862 |
5.25% 10/1/26 | | 5,000 | | 5,577 |
(Various Cap. Projs.) Series 2012 A: | | | | |
5% 4/1/25 | | 4,700 | | 5,228 |
5% 4/1/26 | | 13,495 | | 14,918 |
(Various Judicial Council Projects) Series 2011 D: | | | | |
5% 12/1/22 | | 4,100 | | 4,717 |
5% 12/1/23 | | 7,355 | | 8,340 |
Series 2005 B, 5.25% 11/1/24 (XL Cap. Assurance, Inc. Insured) | | 1,575 | | 1,694 |
Series 2005 H: | | | | |
5% 6/1/17 | | 5,000 | | 5,457 |
5% 6/1/18 | | 10,300 | | 11,150 |
Series 2005 J, 5% 1/1/17 | | 6,105 | | 6,767 |
Series 2009 G1, 5.75% 10/1/30 | | 2,500 | | 2,808 |
Series 2009 I: | | | | |
6.125% 11/1/29 | | 1,600 | | 1,862 |
6.375% 11/1/34 | | 4,600 | | 5,363 |
Series 2010 A, 5.75% 3/1/30 | | 4,900 | | 5,498 |
Series B, 5.25% 11/1/26 (XL Cap. Assurance, Inc. Insured) | | 2,860 | | 3,042 |
California State Univ. Rev. Series 2009 A, 6% 11/1/40 | | 5,000 | | 5,756 |
California Statewide Cmntys. Dev. Auth. Rev.: | | | | |
(St. Joseph Health Sys. Proj.) Series 2007 C, 5.75% 7/1/47 (FGIC Insured) | | 5,000 | | 5,484 |
(State of California Proposition 1A Receivables Prog.) Series 2009, 5% 6/15/13 | | 26,800 | | 27,977 |
(Sutter Health Proj.) Series 2011 A, 6% 8/15/42 | | 11,700 | | 13,704 |
Series 2012 A, 5% 4/1/42 | | 7,200 | | 7,686 |
Clovis Pub. Fing. Auth. Wastewtr. Rev. Series 2005, 5% 8/1/35 (Nat'l. Pub. Fin. Guarantee Corp. Insured) | | 9,380 | | 9,545 |
Encinitas Union School District Series 1996: | | | | |
0% 8/1/20 (Nat'l. Pub. Fin. Guarantee Corp. Insured) | | 3,500 | | 2,649 |
Municipal Bonds - continued |
| Principal Amount (000s) | | Value (000s) |
California - continued |
Encinitas Union School District Series 1996: - continued | | | | |
0% 8/1/21 (Nat'l. Pub. Fin. Guarantee Corp. Insured) | | $ 2,810 | | $ 2,001 |
Fontana Unified School District Gen. Oblig. 5% 5/1/19 (Assured Guaranty Corp. Insured) | | 1,300 | | 1,551 |
Foothill-De Anza Cmnty. College District Series C, 5% 8/1/40 | | 5,000 | | 5,624 |
Foothill/Eastern Trans. Corridor Agcy. Toll Road Rev.: | | | | |
Series 1995 A, 5% 1/1/35 (Nat'l. Pub. Fin. Guarantee Corp. Insured) | | 5,070 | | 4,795 |
Series 1999: | | | | |
5% 1/15/16 (Nat'l. Pub. Fin. Guarantee Corp. Insured) | | 2,800 | | 2,805 |
5.75% 1/15/40 | | 6,300 | | 6,304 |
5.875% 1/15/27 | | 2,500 | | 2,592 |
Golden State Tobacco Securitization Corp. Tobacco Settlement Rev.: | | | | |
Series 2005 A: | | | | |
5% 6/1/45 | | 27,395 | | 27,741 |
5% 6/1/45 | | 5,305 | | 5,372 |
5% 6/1/45 (FSA Insured) | | 445 | | 453 |
Long Beach Unified School District Series A: | | | | |
5.5% 8/1/28 | | 3,810 | | 4,374 |
5.5% 8/1/29 | | 2,000 | | 2,288 |
Los Angeles Cmnty. College District Series 2008 A, 6% 8/1/33 | | 7,000 | | 8,458 |
Los Angeles Cmnty. Redev. Agcy. Lease Rev. (Vermont Manchester Social Svcs. Proj.) Series 2005: | | | | |
5% 9/1/18 (AMBAC Insured) | | 1,000 | | 1,073 |
5% 9/1/19 (AMBAC Insured) | | 2,545 | | 2,715 |
Los Angeles Dept. of Wtr. & Pwr. Rev.: | | | | |
Series 2005 A1, 5% 7/1/35 | | 4,000 | | 4,333 |
Series A2, 5% 7/1/25 (FSA Insured) | | 1,800 | | 1,999 |
Los Angeles Muni. Impt. Corp. Lease Rev. Series 2012 C: | | | | |
5% 3/1/23 | | 5,335 | | 6,079 |
5% 3/1/27 | | 2,000 | | 2,182 |
Los Angeles Wastewtr. Sys. Rev.: | | | | |
Series 2009 A, 5.75% 6/1/34 | | 9,715 | | 11,416 |
Series 2012 B, 5% 6/1/28 | | 16,785 | | 19,518 |
Madera County Ctfs. of Prtn. (Children's Hosp. Central California Proj.) Series 2010, 5.375% 3/15/36 | | 3,000 | | 3,157 |
Monrovia Unified School District Series B, 0% 8/1/29 (Nat'l. Pub. Fin. Guarantee Corp. Insured) | | 4,525 | | 1,925 |
Municipal Bonds - continued |
| Principal Amount (000s) | | Value (000s) |
California - continued |
Monterey County Pub. Impt. Corp. Ctfs. of Prtn. Series 2007, 5% 8/1/19 (AMBAC Insured) | | $ 2,320 | | $ 2,623 |
Newport Beach Rev.: | | | | |
(Hoag Memorial Hosp. Presbyterian Proj.) Series 2011 A, 6% 12/1/40 | | 2,000 | | 2,384 |
Bonds (Hoag Memorial Hosp. Presbyterian Proj.) Series 2009 E, 5%, tender 2/7/13 (c) | | 5,100 | | 5,231 |
North City West School Facilities Fing. Auth. Spl. Tax Series C, 5% 9/1/19 (AMBAC Insured) | | 3,015 | | 3,504 |
Oakland Gen. Oblig.: | | | | |
Series 2009 B, 6% 1/15/34 | | 2,500 | | 2,846 |
Series 2012: | | | | |
5% 1/15/26 | | 4,535 | | 5,140 |
5% 1/15/28 | | 4,345 | | 4,873 |
5% 1/15/29 | | 5,370 | | 5,993 |
Oakland Unified School District Alameda County Series 2009 A, 6.5% 8/1/22 | | 2,320 | | 2,727 |
Oakland-Alameda County Coliseum Auth. (Oakland Coliseum Proj.): | | | | |
Series 2012 A, 5% 2/1/24 | | 8,200 | | 9,207 |
Series 2012 A. 5% 2/1/19 | | 4,190 | | 4,843 |
Placer County Wtr. Agcy. Rev. (Middle Fork Proj.) Series A, 3.75% 7/1/12 | | 60 | | 60 |
Port of Oakland Rev.: | | | | |
Series 2007 B, 5% 11/1/19 (Nat'l. Pub. Fin. Guarantee Corp. Insured) | | 7,000 | | 7,811 |
Series C, 5% 11/1/18 (Nat'l. Pub. Fin. Guarantee Corp. Insured) | | 6,650 | | 7,459 |
Poway Unified School District: | | | | |
(District #2007-1 School Facilities Proj.) Series 2008 A, 0% 8/1/32 | | 4,900 | | 1,794 |
Series B: | | | | |
0% 8/1/37 | | 7,800 | | 2,081 |
0% 8/1/38 | | 10,200 | | 2,568 |
0% 8/1/39 | | 20,100 | | 4,788 |
0% 8/1/40 | | 3,000 | | 676 |
0% 8/1/41 | | 13,610 | | 2,900 |
Poway Unified School District Pub. Fing. Auth. Lease Rev. Bonds Series 2008 B, 0%, tender 12/1/14 (FSA Insured) (c) | | 5,980 | | 5,778 |
Sacramento Muni. Util. District Elec. Rev. Series 2012 Y, 5% 8/15/26 | | 10,000 | | 11,752 |
Municipal Bonds - continued |
| Principal Amount (000s) | | Value (000s) |
California - continued |
San Bernardino Cmnty. College District Series A: | | | | |
6.25% 8/1/33 | | $ 2,200 | | $ 2,612 |
6.375% 8/1/26 | | 4,080 | | 4,999 |
San Bernardino County Ctfs. of Prtn. (Arrowhead Proj.) Series 2009 A, 5.25% 8/1/26 | | 2,800 | | 2,991 |
San Diego Convention Ctr. Expansion Series 2012 A, 5% 4/15/25 | | 10,425 | | 11,537 |
San Diego Unified School District: | | | | |
Series 2008 C: | | | | |
0% 7/1/34 | | 3,600 | | 1,159 |
0% 7/1/39 | | 9,650 | | 2,291 |
0% 7/1/41 | | 21,370 | | 4,535 |
Series 2008 E: | | | | |
0% 7/1/47 (a) | | 7,400 | | 2,588 |
0% 7/1/49 | | 19,500 | | 2,630 |
San Joaquin County Ctfs. of Prtn. (County Administration Bldg. Proj.) Series 2007, 5% 11/15/18 (Nat'l. Pub. Fin. Guarantee Corp. Insured) | | 3,495 | | 3,839 |
San Leandro Unified School District Series 2006 B, 6.25% 8/1/33 (FSA Insured) | | 6,375 | | 7,509 |
San Marcos Unified School District: | | | | |
Series 2010 B, 0% 8/1/47 | | 18,400 | | 2,878 |
Series A, 5% 8/1/38 | | 5,150 | | 5,612 |
San Mateo County Cmnty. College District Series A, 0% 9/1/26 (Nat'l. Pub. Fin. Guarantee Corp. Insured) | | 5,430 | | 2,961 |
Santa Clara County Fing. Auth. Rev. (El Camino Hosp. Proj.) Series 2007 C, 5.75% 2/1/41 (AMBAC Insured) | | 10,000 | | 10,844 |
Santa Monica-Malibu Unified School District Series 1999, 0% 8/1/20 (Nat'l. Pub. Fin. Guarantee Corp. Insured) | | 2,815 | | 2,138 |
Sonoma County Jr. College District Rev. Series 2002 B, 5% 8/1/28 (FSA Insured) | | 2,200 | | 2,386 |
Sweetwater Union High School District Series 2008 A, 5.625% 8/1/47 (FSA Insured) | | 45,225 | | 49,457 |
Torrance Ctfs. of Prtn. (Refing. & Pub. Impt. Proj.) Series B, 5.25% 6/1/34 (AMBAC Insured) | | 4,475 | | 4,577 |
Union Elementary School District: | | | | |
Series A, 0% 9/1/19 (Nat'l. Pub. Fin. Guarantee Corp. Insured) | | 1,750 | | 1,408 |
Series B, 0% 9/1/22 (Nat'l. Pub. Fin. Guarantee Corp. Insured) | | 1,500 | | 1,025 |
Municipal Bonds - continued |
| Principal Amount (000s) | | Value (000s) |
California - continued |
Univ. of California Revs.: | | | | |
(UCLA Med. Ctr. Proj.): | | | | |
Series A: | | | | |
5.5% 5/15/15 (AMBAC Insured) | | $ 1,110 | | $ 1,125 |
5.5% 5/15/16 (AMBAC Insured) | | 1,170 | | 1,185 |
5.5% 5/15/17 (AMBAC Insured) | | 1,235 | | 1,250 |
5.5% 5/15/19 (AMBAC Insured) | | 1,375 | | 1,391 |
5.5% 5/15/22 (AMBAC Insured) | | 370 | | 374 |
5.5% 5/15/23 (AMBAC Insured) | | 380 | | 384 |
Series B: | | | | |
5.5% 5/15/15 (AMBAC Insured) | | 1,890 | | 2,027 |
5.5% 5/15/17 (AMBAC Insured) | | 2,545 | | 2,692 |
Series 2009 O: | | | | |
5.25% 5/15/39 | | 2,400 | | 2,699 |
5.75% 5/15/30 | | 12,000 | | 14,228 |
Val Verde Unified School District Ctfs. of Prtn. Series B, 5% 1/1/30 (FGIC Insured) | | 1,495 | | 1,497 |
Ventura County Cmnty. College District Series C, 5.5% 8/1/33 | | 5,100 | | 5,809 |
Washington Township Health Care District Rev.: | | | | |
Series 2007 A: | | | | |
5% 7/1/18 | | 1,185 | | 1,318 |
5% 7/1/27 | | 1,840 | | 1,940 |
Series 2009 A, 5.75% 7/1/24 | | 1,705 | | 1,964 |
Series 2010 A, 5.5% 7/1/38 | | 3,815 | | 4,111 |
West Contra Costa Unified School District: | | | | |
(Election of 2005 Proj.) Series B, 5.625% 8/1/35 (Berkshire Hathaway Assurance Corp. Insured) | | 3,850 | | 4,307 |
Series 2012: | | | | |
5% 8/1/24 (b) | | 3,625 | | 4,123 |
5% 8/1/25 (b) | | 10,000 | | 11,282 |
| | 1,181,986 |
Colorado - 1.4% |
Aurora Hosp. Rev. (Children's Hosp. Assoc. Proj.) Series 2010 A, 5% 12/1/40 | | 4,000 | | 4,297 |
Colorado Ctfs. of Prtn. (UCDHSC Fitzsimons Academic Proj.) Series 2005 B: | | | | |
5% 11/1/17 (Nat'l. Pub. Fin. Guarantee Corp. Insured) | | 2,475 | | 2,763 |
5.25% 11/1/24 (Pre-Refunded to 11/1/15 @ 100) | | 2,600 | | 3,005 |
Municipal Bonds - continued |
| Principal Amount (000s) | | Value (000s) |
Colorado - continued |
Colorado Health Facilities Auth. Retirement Hsg. Rev. (Liberty Heights Proj.): | | | | |
Series B, 0% 7/15/20 (Escrowed to Maturity) | | $ 5,800 | | $ 4,932 |
0% 7/15/22 (Escrowed to Maturity) | | 15,700 | | 12,335 |
Colorado Health Facilities Auth. Rev. (Parkview Episcopal Med. Ctr. Proj.) Series B: | | | | |
5% 9/1/19 | | 1,115 | | 1,229 |
5% 9/1/22 | | 1,500 | | 1,615 |
Colorado Wtr. Resources and Pwr. Dev. Auth. Wtr. Resources Rev. (Parker Wtr. and Sanitation District Proj.) Series 2004 D, 5.25% 9/1/43 (Nat'l. Pub. Fin. Guarantee Corp. Insured) | | 33,385 | | 33,892 |
Denver City & County Arpt. Rev.: | | | | |
Series 2007 E, 5% 11/15/32 (AMBAC Insured) | | 2,500 | | 2,735 |
5% 11/15/15 (f) | | 3,000 | | 3,356 |
Denver Health & Hosp. Auth. Healthcare Rev. Series 2007 A, 5% 12/1/13 | | 3,005 | | 3,195 |
Douglas and Elbert Counties School District #RE1 Series 2004: | | | | |
5.75% 12/15/20 (Pre-Refunded to 12/15/14 @ 100) | | 1,500 | | 1,693 |
5.75% 12/15/22 (Pre-Refunded to 12/15/14 @ 100) | | 1,000 | | 1,129 |
E-470 Pub. Hwy. Auth. Rev.: | | | | |
Series 1997 B, 0% 9/1/15 (Nat'l. Pub. Fin. Guarantee Corp. Insured) | | 3,500 | | 3,226 |
Series 2000 B, 0% 9/1/20 (Nat'l. Pub. Fin. Guarantee Corp. Insured) | | 12,075 | | 8,672 |
Series 2010 A, 0% 9/1/41 | | 9,600 | | 1,757 |
Series 2010 C, 5.375% 9/1/26 | | 1,000 | | 1,088 |
| | 90,919 |
District Of Columbia - 1.0% |
District of Columbia Hosp. Rev. (Sibley Memorial Hosp. Proj.) Series 2009, 6.375% 10/1/39 | | 8,140 | | 9,322 |
District of Columbia Rev.: | | | | |
(Medlantic/Helix Proj.) Series 1998 C, 5% 8/15/17 (FSA Insured) | | 1,700 | | 1,930 |
Series B, 4.75% 6/1/32 | | 2,200 | | 2,341 |
District of Columbia Wtr. & Swr. Auth. Pub. Util. Rev. Series 2007 A, 5.5% 10/1/41 | | 23,535 | | 26,574 |
Municipal Bonds - continued |
| Principal Amount (000s) | | Value (000s) |
District Of Columbia - continued |
Metropolitan Washington Arpts. Auth. Dulles Toll Road Rev. Series 2009 B: | | | | |
0% 10/1/33 (Assured Guaranty Corp. Insured) | | $ 15,000 | | $ 5,010 |
0% 10/1/34 (Assured Guaranty Corp. Insured) | | 15,000 | | 4,697 |
0% 10/1/35 (Assured Guaranty Corp. Insured) | | 33,975 | | 9,938 |
0% 10/1/39 (Assured Guaranty Corp. Insured) | | 5,030 | | 1,154 |
Metropolitan Washington DC Arpts. Auth. Sys. Rev. Series 2010 A, 5% 10/1/39 | | 3,200 | | 3,526 |
| | 64,492 |
Florida - 9.0% |
Alachua County Health Facilities Auth. Health Facilities Rev. (Avmed/Santa Fe Health Care Sys. Proj.) Series 1993, 6.05% 11/15/16 (Escrowed to Maturity) | | 4,700 | | 5,277 |
Boynton Beach Util. Sys. Rev. Series 2002, 5.5% 11/1/19 (Nat'l. Pub. Fin. Guarantee Corp. Insured) | | 3,300 | | 3,766 |
Brevard County School Board Ctfs. of Prtn. Series 2007 B: | | | | |
5% 7/1/24 (AMBAC Insured) | | 1,365 | | 1,473 |
5% 7/1/25 (AMBAC Insured) | | 3,540 | | 3,805 |
Broward County Gen. Oblig. (Parks & Land Preservation Proj.) Series 2005: | | | | |
5% 1/1/24 (Pre-Refunded to 1/1/15 @ 100) | | 1,000 | | 1,113 |
5% 1/1/25 (Pre-Refunded to 1/1/15 @ 100) | | 1,000 | | 1,113 |
Broward County School Board Ctfs. of Prtn.: | | | | |
Series 2003 A: | | | | |
5.25% 7/1/16 (Pre-Refunded to 7/1/13 @ 100) | | 6,060 | | 6,359 |
5.25% 7/1/20 (Pre-Refunded to 7/1/13 @ 100) | | 3,000 | | 3,148 |
Series 2007 A: | | | | |
5% 7/1/17 (Nat'l. Pub. Fin. Guarantee Corp. Insured) | | 3,660 | | 4,211 |
5% 7/1/19 (Nat'l. Pub. Fin. Guarantee Corp. Insured) | | 3,700 | | 4,179 |
Series 2012 A: | | | | |
5% 7/1/23 | | 21,020 | | 24,156 |
5% 7/1/27 | | 5,695 | | 6,314 |
Broward County Wtr. & Swr. Util. Rev. Series 2009 A, 5.25% 10/1/34 | | 8,500 | | 9,632 |
Cap. Projs. Fin. Auth. Student Hsg. Rev. Series 2000 F1: | | | | |
5.5% 10/1/12 (Nat'l. Pub. Fin. Guarantee Corp. Insured) | | 1,460 | | 1,461 |
5.5% 10/1/13 (Nat'l. Pub. Fin. Guarantee Corp. Insured) | | 1,265 | | 1,265 |
Municipal Bonds - continued |
| Principal Amount (000s) | | Value (000s) |
Florida - continued |
Citizens Property Ins. Corp.: | | | | |
Series 2010 A1: | | | | |
5% 6/1/15 (FSA Insured) | | $ 5,000 | | $ 5,503 |
5% 6/1/16 (FSA Insured) | | 7,500 | | 8,416 |
Series 2011 A1: | | | | |
5% 6/1/19 | | 1,715 | | 1,938 |
5% 6/1/20 | | 3,000 | | 3,379 |
Series 2012 A1, 5% 6/1/21 | | 8,400 | | 9,439 |
Collier County Indl. Dev. Auth. Healthcare Facilities Rev. (NCH Healthcare Sys. Proj.) Series 2011, 6.25% 10/1/39 | | 24,285 | | 27,855 |
Emerald Coast Utils. Auth. Rev.: | | | | |
5.25% 1/1/26 (Nat'l. Pub. Fin. Guarantee Corp. Insured) | | 1,000 | | 1,066 |
5.25% 1/1/36 (Nat'l. Pub. Fin. Guarantee Corp. Insured) | | 1,310 | | 1,368 |
Escambia City Health Facilities Auth. Rev. (Ascension Health Cr. Group Proj.) Series 2002 C, 5.75% 11/15/32 | | 6,900 | | 7,075 |
Escambia County Utils. Auth. Util. Sys. Rev. Series 1992 B, 6.25% 1/1/15 (Nat'l. Pub. Fin. Guarantee Corp. Insured) | | 3,050 | | 3,275 |
Florida Board of Ed. Series 2003 J, 5% 6/1/31 | | 2,500 | | 2,586 |
Florida Board of Ed. Lottery Rev.: | | | | |
Series 2002 A, 5.375% 7/1/17 | | 1,000 | | 1,010 |
Series 2011 A, 5% 7/1/20 | | 12,400 | | 15,124 |
Florida Board of Ed. Pub. Ed. Cap. Outlay: | | | | |
Seires 2011 E, 5% 6/1/27 | | 6,500 | | 7,553 |
Series 2004 A, 5% 6/1/31 | | 1,240 | | 1,327 |
Series 2006 E, 5% 6/1/35 | | 3,200 | | 3,628 |
Series 2011 E, 5% 6/1/24 | | 6,600 | | 7,892 |
Series 2011 F, 5% 6/1/23 | | 6,045 | | 7,315 |
Series A, 5.5% 6/1/38 | | 2,000 | | 2,305 |
Florida Dept. of Children and Family Svcs. Ctfs. of Prtn. (South Florida Evaluation Treatment Ctr. Proj.): | | | | |
5% 10/1/16 | | 2,025 | | 2,215 |
5% 10/1/17 | | 2,130 | | 2,317 |
Florida Dept. of Envir. Protection Rev. Series 2002 A, 5.375% 7/1/17 | | 6,000 | | 6,060 |
Florida Dept. of Trans. Rev. Series 2005 A: | | | | |
5% 7/1/17 | | 3,360 | | 3,691 |
5% 7/1/18 | | 3,320 | | 3,624 |
Municipal Bonds - continued |
| Principal Amount (000s) | | Value (000s) |
Florida - continued |
Florida Gen. Oblig.: | | | | |
(Dept. of Trans. Right-of-Way and Bridge Construction Proj.) Series 2003 A, 5% 7/1/33 (Pre-Refunded to 7/1/13 @ 101) | | $ 395 | | $ 418 |
Series 2008 A, 5.25% 7/1/37 | | 3,000 | | 3,344 |
Series 2011 B, 5% 7/1/23 | | 10,175 | | 12,450 |
Florida Muni. Pwr. Agcy. Rev. Series A, 6.25% 10/1/31 | | 3,000 | | 3,507 |
Florida Wtr. Poll. Cont. Fing. Corp. Rev. Series 2003, 5.25% 1/15/20 | | 1,950 | | 2,099 |
Gulf Breeze Util. Sys. Rev. Series 2004, 5% 10/1/16 (AMBAC Insured) | | 1,010 | | 1,087 |
Halifax Hosp. Med. Ctr. Rev.: | | | | |
Series 2006 A: | | | | |
5% 6/1/38 | | 2,995 | | 3,086 |
5.25% 6/1/19 | | 2,375 | | 2,589 |
Series 2006 B1, 5.5% 6/1/38 (FSA Insured) | | 3,575 | | 3,814 |
Highlands County Health Facilities Auth. Rev. (Adventist Health Sys./Sunbelt, Inc. Prog.): | | | | |
Series 2005 A: | | | | |
5% 11/15/15 | | 1,000 | | 1,123 |
5% 11/15/17 | | 1,200 | | 1,348 |
5% 11/15/22 | | 1,000 | | 1,098 |
Series 2005 B: | | | | |
5% 11/15/15 | | 875 | | 982 |
5% 11/15/15 (Escrowed to Maturity) | | 125 | | 143 |
5% 11/15/16 | | 1,040 | | 1,174 |
5% 11/15/16 (Pre-Refunded to 11/15/15 @ 100) | | 150 | | 171 |
5% 11/15/30 | | 3,565 | | 3,752 |
5% 11/15/30 (Pre-Refunded to 11/15/15 @ 100) | | 485 | | 554 |
Series 2006 G: | | | | |
5% 11/15/14 | | 1,285 | | 1,404 |
5% 11/15/14 (Escrowed to Maturity) | | 45 | | 50 |
5% 11/15/15 | | 965 | | 1,083 |
5% 11/15/15 (Escrowed to Maturity) | | 35 | | 40 |
5% 11/15/16 | | 1,020 | | 1,178 |
5% 11/15/16 (Escrowed to Maturity) | | 30 | | 35 |
5.125% 11/15/17 | | 2,750 | | 3,177 |
5.125% 11/15/17 (Pre-Refunded to 11/15/16 @ 100) | | 95 | | 112 |
5.125% 11/15/18 | | 965 | | 1,100 |
5.125% 11/15/18 (Pre-Refunded to 11/15/16 @ 100) | | 35 | | 41 |
Municipal Bonds - continued |
| Principal Amount (000s) | | Value (000s) |
Florida - continued |
Highlands County Health Facilities Auth. Rev. (Adventist Health Sys./Sunbelt, Inc. Prog.): - continued | | | | |
Series 2006 G: | | | | |
5.125% 11/15/19 | | $ 1,930 | | $ 2,182 |
5.125% 11/15/19 (Pre-Refunded to 11/15/16 @ 100) | | 70 | | 83 |
Series 2008 B, 6% 11/15/37 | | 11,000 | | 12,571 |
Hillsborough County Indl. Dev.: | | | | |
(H Lee Moffitt Cancer Ctr. Proj.) Series A: | | | | |
5% 7/1/17 | | 1,930 | | 2,166 |
5% 7/1/18 | | 2,125 | | 2,374 |
(Tampa Gen. Hosp. Proj.) Series 2006, 5.25% 10/1/41 | | 8,405 | | 8,662 |
Hillsborough County Indl. Dev. Auth. Indl. Dev. Rev.: | | | | |
(Health Facilities/Univ. Cmnty. Hosp. Proj.) Series 2008 B, 8% 8/15/32 (Pre-Refunded to 8/15/19 @ 101) | | 4,900 | | 6,962 |
(Univ. Cmnty. Hosp. Proj.) Series 2008 A, 5.625% 8/15/29 (Pre-Refunded to 8/15/18 @ 100) | | 2,270 | | 2,871 |
Hillsborough County Indl. Dev. Auth. Poll. Cont. Rev. (Tampa Elec. Co. Proj.) 5.1% 10/1/13 | | 3,005 | | 3,035 |
Jacksonville Elec. Auth. Elec. Sys. Rev.: | | | | |
(Third Installment Proj.) Series 73, 6.8% 7/1/12 (Escrowed to Maturity) | | 440 | | 440 |
Series 2006 A, 5% 10/1/41 (FSA Insured) | | 18,800 | | 19,750 |
Series 2009 B, 5% 10/1/18 | | 7,500 | | 8,025 |
Series Three 2010 D, 5% 10/1/38 | | 8,100 | | 8,975 |
Jacksonville Sales Tax Rev.: | | | | |
Series 2003, 5.25% 10/1/19 (Pre-Refunded to 10/1/13 @ 100) | | 1,500 | | 1,593 |
Series 2012, 5% 10/1/24 | | 5,500 | | 6,281 |
Lee County Arpt. Rev. Series 2011 A, 5.375% 10/1/32 (f) | | 5,260 | | 5,641 |
Marco Island Util. Sys. Rev. 5% 10/1/33 (Nat'l. Pub. Fin. Guarantee Corp. Insured) | | 5,025 | | 5,137 |
Melbourne Wtr. & Swr. Rev. 5% 10/1/34 (Nat'l. Pub. Fin. Guarantee Corp. Insured) | | 5,000 | | 5,170 |
Miami Beach Health Facilities Auth. Hosp. Rev. (Mount Sinai Med. Ctr. of Florida Proj.) Series A, 6.8% 11/15/31 | | 1,395 | | 1,411 |
Miami Beach Wtr. & Swr. Rev. 5.5% 9/1/27 (AMBAC Insured) | | 6,000 | | 6,032 |
Miami-Dade County Aviation Rev.: | | | | |
Series 2010 A, 5.375% 10/1/41 | | 5,800 | | 6,436 |
Municipal Bonds - continued |
| Principal Amount (000s) | | Value (000s) |
Florida - continued |
Miami-Dade County Aviation Rev.: - continued | | | | |
Series 2010 A1, 5.5% 10/1/30 | | $ 3,000 | | $ 3,424 |
Series 2010 B, 5% 10/1/35 (FSA Insured) | | 13,610 | | 14,785 |
Miami-Dade County Expressway Auth.: | | | | |
Series 2010 A, 5% 7/1/40 | | 9,500 | | 10,124 |
Series B, 5.25% 7/1/25 (Nat'l. Pub. Fin. Guarantee Corp. Insured) | | 5,000 | | 5,322 |
Miami-Dade County Gen. Oblig. (Bldg. Better Cmntys. Prog.) 5% 7/1/35 (Nat'l. Pub. Fin. Guarantee Corp. Insured) | | 4,565 | | 4,762 |
Miami-Dade County School Board Ctfs. of Prtn.: | | | | |
Series 2008 A: | | | | |
5% 8/1/17 (AMBAC Insured) | | 3,500 | | 3,927 |
5% 8/1/18 (AMBAC Insured) | | 4,000 | | 4,493 |
5% 8/1/20 (AMBAC Insured) | | 2,500 | | 2,822 |
5% 8/1/21 (AMBAC Insured) | | 5,095 | | 5,714 |
5% 8/1/22 (AMBAC Insured) | | 3,325 | | 3,676 |
Series 2011 B, 5.625% 5/1/31 | | 6,600 | | 7,375 |
Ocala Util. Sys. Rev. Series B, 5.25% 10/1/22 (Nat'l. Pub. Fin. Guarantee Corp. Insured) | | 1,000 | | 1,093 |
Orange County Edl. Facilities Auth. Ed. Rev. (Rollins College Proj.): | | | | |
5.25% 12/1/32 (AMBAC Insured) | | 1,350 | | 1,447 |
5.25% 12/1/37 (AMBAC Insured) | | 1,365 | | 1,451 |
Orange County Health Facilities Auth. (Orlando Health, Inc.) Series 2009, 5.125% 10/1/26 | | 5,000 | | 5,472 |
Orange County Health Facilities Auth. Rev. (Orlando Reg'l. Health Care Sys. Proj.) Series 1996 A, 6.25% 10/1/18 (Nat'l. Pub. Fin. Guarantee Corp. Insured) | | 4,500 | | 5,403 |
Orange County Sales Tax Rev. Series 2002 B, 5% 1/1/25 (Pre-Refunded to 1/1/13 @ 100) | | 2,800 | | 2,865 |
Orange County School Board Ctfs. of Prtn.: | | | | |
Series 1997 A, 0% 8/1/13 (Nat'l. Pub. Fin. Guarantee Corp. Insured) | | 2,275 | | 2,240 |
Series A, 5% 8/1/16 (Nat'l. Pub. Fin. Guarantee Corp. Insured) | | 2,940 | | 3,289 |
Orlando Utils. Commission Util. Sys. Rev. Series 2009 B, 5% 10/1/33 | | 3,700 | | 4,170 |
Osceola County Infrastructure Sales Surtax Rev. 5.375% 10/1/17 (Pre-Refunded to 10/1/12 @ 100) | | 1,000 | | 1,012 |
Osceola County Tourist Dev. Tax Rev. Series A, 5.5% 10/1/19 (Nat'l. Pub. Fin. Guarantee Corp. Insured) | | 1,190 | | 1,201 |
Municipal Bonds - continued |
| Principal Amount (000s) | | Value (000s) |
Florida - continued |
Palm Beach County School Board Ctfs. of Prtn. Series D, 5.25% 8/1/17 (FSA Insured) | | $ 2,025 | | $ 2,032 |
Palm Beach County Solid Waste Auth. Rev. Series 2011, 5% 10/1/24 | | 11,100 | | 13,006 |
Pasco County School Board Ctfs. of Prtn. Series A, 5% 8/1/30 (AMBAC Insured) | | 4,000 | | 4,125 |
Peace River/Manasota Reg'l. Wtr. Supply Auth. Rev. Series A: | | | | |
5% 10/1/30 (FSA Insured) | | 3,105 | | 3,290 |
5% 10/1/35 (FSA Insured) | | 5,000 | | 5,265 |
Plant City Util. Sys. Rev. 6% 10/1/15 (Nat'l. Pub. Fin. Guarantee Corp. Insured) | | 1,810 | | 1,913 |
Polk County Pub. Facilities Rev. 5% 12/1/33 (Nat'l. Pub. Fin. Guarantee Corp. Insured) | | 2,000 | | 2,095 |
Port Orange Gen. Oblig. 5% 4/1/29 (Nat'l. Pub. Fin. Guarantee Corp. Insured) | | 2,015 | | 2,178 |
Reedy Creek Impt. District Utils. Rev. Series 1, 5.25% 10/1/19 (Nat'l. Pub. Fin. Guarantee Corp. Insured) | | 3,700 | | 3,856 |
Seminole County School Board Ctfs. of Prtn.: | | | | |
Series 2005 A, 5% 7/1/16 (Nat'l. Pub. Fin. Guarantee Corp. Insured) | | 1,645 | | 1,873 |
Series A, 5% 7/1/20 (Nat'l. Pub. Fin. Guarantee Corp. Insured) | | 1,745 | | 1,947 |
South Lake County Hosp. District (South Lake Hosp., Inc.): | | | | |
Series 2009 A, 6.25% 4/1/39 | | 3,300 | | 3,650 |
Series 2010: | | | | |
5% 10/1/25 | | 4,140 | | 4,441 |
5.25% 10/1/34 | | 3,500 | | 3,677 |
St. Johns County School Board 5.25% 7/1/16 (Nat'l. Pub. Fin. Guarantee Corp. Insured) | | 1,400 | | 1,557 |
St. Petersburg Pub. Util. Rev. Series 2009 A, 5.5% 10/1/37 | | 7,000 | | 7,960 |
Sumter County School District Rev. (Multi-District Ln. Prog.) 7.15% 11/1/15 (Escrowed to Maturity) | | 985 | | 1,193 |
Tallahassee Energy Sys. Rev. 5% 10/1/35 (Nat'l. Pub. Fin. Guarantee Corp. Insured) | | 3,065 | | 3,198 |
Tampa Bay Wtr. Reg'l. Wtr. Supply Auth. Util. Sys. Rev. Series 2011 B, 5% 10/1/18 | | 6,900 | | 8,374 |
Tampa Health Sys. Rev. (Baycare Health Sys. Proj.) Series 2010, 5% 11/15/23 | | 8,080 | | 9,192 |
Tampa Rev. (Catholic Health East Proj.) Series A1, 5.5% 11/15/12 (Nat'l. Pub. Fin. Guarantee Corp. Insured) | | 1,045 | | 1,063 |
Municipal Bonds - continued |
| Principal Amount (000s) | | Value (000s) |
Florida - continued |
Univ. of Central Florida Athletics Assoc., Inc. Ctfs. of Prtn. Series A: | | | | |
5% 10/1/17 (Nat'l. Pub. Fin. Guarantee Corp. Insured) | | $ 1,805 | | $ 1,910 |
5% 10/1/35 (Nat'l. Pub. Fin. Guarantee Corp. Insured) | | 3,275 | | 3,301 |
5.25% 10/1/34 (Nat'l. Pub. Fin. Guarantee Corp. Insured) | | 2,000 | | 2,025 |
USF Fing. Corp. Ctfs. of Prtn. (Master Lease Prog.)
Series A: | | | | |
5.25% 7/1/15 (AMBAC Insured) | | 2,690 | | 2,945 |
5.25% 7/1/16 (AMBAC Insured) | | 2,830 | | 3,100 |
Volusia County Edl. Facilities Auth. Rev. 5% 10/15/12 (Radian Asset Assurance, Inc. Insured) | | 1,260 | | 1,275 |
Walton County School Board Ctfs. of Prtn. 5.25% 7/1/18 (FSA Insured) | | 1,865 | | 2,181 |
| | 578,678 |
Georgia - 3.0% |
Atlanta Tax Allocation (Atlantic Station Proj.) Series 2007, 5.25% 12/1/20 (Assured Guaranty Corp. Insured) | | 2,000 | | 2,203 |
Atlanta Wtr. & Wastewtr. Rev.: | | | | |
Series 2004, 5% 11/1/43 | | 36,165 | | 37,791 |
Series 2009 A: | | | | |
6% 11/1/25 | | 9,785 | | 11,666 |
6.25% 11/1/39 | | 10,800 | | 12,749 |
Augusta Wtr. & Swr. Rev. Series 2004, 5.25% 10/1/39 (FSA Insured) | | 11,600 | | 12,490 |
Colquitt County Dev. Auth. Rev. Series C, 0% 12/1/21 (Escrowed to Maturity) | | 10,200 | | 8,188 |
DeKalb County Wtr. & Swr. Rev. Series 2011 A: | | | | |
5.25% 10/1/36 | | 3,000 | | 3,339 |
5.25% 10/1/41 | | 5,600 | | 6,195 |
Fulton County Wtr. & Swr. Rev. Series 2011: | | | | |
5% 1/1/23 | | 1,500 | | 1,800 |
5% 1/1/24 | | 6,500 | | 7,714 |
Georgia Gen. Oblig.: | | | | |
Series 2007 E, 5% 8/1/22 | | 575 | | 676 |
Series 2009 I, 5% 7/1/20 | | 10,250 | | 12,889 |
Series 2011 E2, 5% 9/1/20 | | 10,000 | | 12,598 |
Main Street Natural Gas, Inc. Georgia Gas Proj. Rev. Series A, 5.25% 9/15/19 | | 1,915 | | 2,086 |
Municipal Bonds - continued |
| Principal Amount (000s) | | Value (000s) |
Georgia - continued |
Metropolitan Atlanta Rapid Transit Auth. Sales Tax Rev. Third Series 2009 A, 5.25% 7/1/36 | | $ 8,500 | | $ 9,504 |
Richmond County Dev. Auth. Rev. (Southern Care Corp. Facility Proj.): | | | | |
Series A, 0% 12/1/21 (Escrowed to Maturity) | | 5,615 | | 4,507 |
Series C, 0% 12/1/21 (Escrowed to Maturity) | | 19,400 | | 15,573 |
Richmond County Hosp. Auth. (Univ. Health Svcs., Inc. Proj.) Series 2009, 5.5% 1/1/36 | | 13,550 | | 14,478 |
Savannah Econ. Dev. Auth. Rev. (Southern Care Corp. Proj.) Series C, 0% 12/1/21 (Escrowed to Maturity) | | 18,045 | | 14,485 |
Valdosta & Lowndes County Hosp. (South Georgia Med. Ctr. Proj.) 5% 10/1/20 | | 1,570 | | 1,728 |
| | 192,659 |
Hawaii - 0.1% |
Honolulu City & County Board of Wtr. Supply Wtr. Sys. Rev. Series B: | | | | |
5% 7/1/12 (Nat'l. Pub. Fin. Guarantee Corp. Insured) (f) | | 1,690 | | 1,690 |
5% 7/1/13 (Nat'l. Pub. Fin. Guarantee Corp. Insured) (f) | | 1,000 | | 1,041 |
5% 7/1/14 (Nat'l. Pub. Fin. Guarantee Corp. Insured) (f) | | 1,140 | | 1,231 |
5% 7/1/15 (Nat'l. Pub. Fin. Guarantee Corp. Insured) (f) | | 1,430 | | 1,590 |
5.25% 7/1/18 (Nat'l. Pub. Fin. Guarantee Corp. Insured) (f) | | 3,205 | | 3,627 |
| | 9,179 |
Idaho - 0.2% |
Idaho Health Facilities Auth. Rev.: | | | | |
(St. Luke's Health Sys. Proj.) Series 2008 A: | | | | |
6.5% 11/1/28 | | 4,340 | | 5,038 |
6.75% 11/1/37 | | 4,300 | | 5,062 |
(Trinity Health Group Proj.) 2008 B, 6.25% 12/1/33 | | 2,190 | | 2,602 |
| | 12,702 |
Illinois - 13.5% |
Boone & Winnebago County Cmnty. Unit School District 200: | | | | |
0% 1/1/21 (Nat'l. Pub. Fin. Guarantee Corp. Insured) | | 1,810 | | 1,340 |
0% 1/1/22 (Nat'l. Pub. Fin. Guarantee Corp. Insured) | | 1,950 | | 1,371 |
Municipal Bonds - continued |
| Principal Amount (000s) | | Value (000s) |
Illinois - continued |
Chicago Board of Ed.: | | | | |
Series 1999 A, 0% 12/1/16 (Nat'l. Pub. Fin. Guarantee Corp. Insured) | | $ 3,200 | | $ 2,943 |
Series 2011A, 5.5% 12/1/39 | | 7,900 | | 8,960 |
Chicago Gen. Oblig.: | | | | |
(Cap. Impt. Proj.) Series 1999, 0% 1/1/27 (Nat'l. Pub. Fin. Guarantee Corp. Insured) | | 4,700 | | 2,411 |
(City Colleges Proj.): | | | | |
0% 1/1/14 (Nat'l. Pub. Fin. Guarantee Corp. Insured) | | 17,000 | | 16,685 |
0% 1/1/15 (Nat'l. Pub. Fin. Guarantee Corp. Insured) | | 20,000 | | 19,222 |
(Neighborhoods Alive 21 Prog.): | | | | |
Series 2003, 5% 1/1/33 (AMBAC Insured) | | 2,100 | | 2,174 |
5% 1/1/28 (Pre-Refunded to 1/1/14 @ 100) | | 2,000 | | 2,138 |
Series 2003 A, 5.25% 1/1/22 (Nat'l. Pub. Fin. Guarantee Corp. Insured) | | 740 | | 757 |
Series 2003 C, 5% 1/1/35 (Nat'l. Pub. Fin. Guarantee Corp. Insured) | | 1,445 | | 1,495 |
Series 2004 A: | | | | |
5% 1/1/34 (FSA Insured) | | 12,510 | | 12,953 |
5.25% 1/1/29 (FSA Insured) | | 435 | | 455 |
Series 2007 C, 5% 1/1/30 (Nat'l. Pub. Fin. Guarantee Corp. Insured) | | 20,300 | | 21,935 |
Series 2009 A, 5% 1/1/27 (FSA Insured) | | 5,200 | | 5,793 |
Series 2011 A, 5% 1/1/40 | | 11,260 | | 12,080 |
Series 2012 A, 5% 1/1/33 | | 10,000 | | 10,965 |
Series A, 5% 1/1/42 (AMBAC Insured) | | 40 | | 40 |
Chicago Midway Arpt. Rev. Series B: | | | | |
5.25% 1/1/13 (Nat'l. Pub. Fin. Guarantee Corp. Insured) (f) | | 2,910 | | 2,919 |
5.25% 1/1/14 (Nat'l. Pub. Fin. Guarantee Corp. Insured) (f) | | 3,060 | | 3,068 |
Chicago Motor Fuel Tax Rev. Series A: | | | | |
5% 1/1/33 (AMBAC Insured) | | 3,810 | | 3,868 |
5.25% 1/1/19 (AMBAC Insured) | | 1,780 | | 1,856 |
Chicago O'Hare Int'l. Arpt. Rev.: | | | | |
Series 2001 B, 5.75% 1/1/30 (AMBAC Insured) | | 13,420 | | 13,438 |
Series 2008 A, 5% 1/1/16 (FSA Insured) | | 6,800 | | 7,525 |
Series 2011 C, 6.5% 1/1/41 | | 19,400 | | 23,311 |
Series A, 5.5% 1/1/16 (AMBAC Insured) (f) | | 3,000 | | 3,009 |
Municipal Bonds - continued |
| Principal Amount (000s) | | Value (000s) |
Illinois - continued |
Chicago Park District Gen. Oblig.: | | | | |
Series 2010 C, 5.25% 1/1/40 | | $ 7,700 | | $ 8,539 |
Series A: | | | | |
5.25% 1/1/18 (Nat'l. Pub. Fin. Guarantee Corp. Insured) | | 4,690 | | 4,909 |
5.25% 1/1/19 (Nat'l. Pub. Fin. Guarantee Corp. Insured) | | 3,000 | | 3,136 |
5.25% 1/1/20 (Nat'l. Pub. Fin. Guarantee Corp. Insured) | | 2,195 | | 2,289 |
Chicago Transit Auth. Cap. Grant Receipts Rev.: | | | | |
(Fed. Transit Administration Section 5307 Proj.): | | | | |
Series 2006 A, 5% 6/1/21 | | 2,600 | | 2,869 |
Series 2008 A: | | | | |
5.25% 6/1/23 (Assured Guaranty Corp. Insured) | | 2,425 | | 2,692 |
5.25% 6/1/25 (Assured Guaranty Corp. Insured) | | 3,495 | | 3,826 |
5% 6/1/20 (AMBAC Insured) | | 5,610 | | 6,229 |
5% 6/1/20 (Pre-Refunded to 12/1/16 @ 100) | | 1,390 | | 1,649 |
Chicago Wtr. Rev. Series 2000, 0% 11/1/16 (AMBAC Insured) | | 7,555 | | 6,792 |
Cicero Gen. Oblig. 5.25% 12/1/26 (Pre-Refunded to 12/1/12 @ 101) | | 3,010 | | 3,101 |
Cook County Forest Preservation District: | | | | |
(Ltd. Tax Proj.) Series 2012 B, 5% 12/15/37 | | 2,500 | | 2,725 |
Series 2012 A, 5% 11/15/22 | | 2,000 | | 2,373 |
Series 2012 C, 5% 12/15/37 | | 1,000 | | 1,090 |
Cook County Gen. Oblig.: | | | | |
Series 2002 C, 5% 11/15/25 | | 8,400 | | 8,517 |
Series 2004 B: | | | | |
5.25% 11/15/26 (Nat'l. Pub. Fin. Guarantee Corp. Insured) | | 2,700 | | 2,903 |
5.25% 11/15/28 (Nat'l. Pub. Fin. Guarantee Corp. Insured) | | 1,400 | | 1,500 |
Series 2010 A, 5.25% 11/15/33 | | 19,775 | | 21,737 |
Series B, 5% 11/15/19 (Nat'l. Pub. Fin. Guarantee Corp. Insured) | | 2,600 | | 2,986 |
DuPage County Forest Preserve District Rev. Series 2000, 0% 11/1/17 | | 6,665 | | 6,100 |
Evanston Gen. Oblig. Series C: | | | | |
5.25% 1/1/16 | | 185 | | 186 |
5.25% 1/1/22 | | 380 | | 381 |
Franklin Park Village Cook County Gen. Oblig. Series B, 5% 7/1/18 (AMBAC Insured) | | 1,450 | | 1,465 |
Municipal Bonds - continued |
| Principal Amount (000s) | | Value (000s) |
Illinois - continued |
Grundy, Kendall & Will County Cmnty. High School District #111 Gen. Oblig. Series 2006 A: | | | | |
5.25% 5/1/25 (Nat'l. Pub. Fin. Guarantee Corp. Insured) | | $ 5,000 | | $ 5,407 |
5.5% 5/1/23 (Nat'l. Pub. Fin. Guarantee Corp. Insured) | | 3,000 | | 3,310 |
Illinois Dedicated Tax Rev. Series B, 0% 12/15/18 (AMBAC Insured) | | 4,500 | | 3,619 |
Illinois Dev. Fin. Auth. Retirement Hsg. Regency Park Rev. 0% 7/15/23 (Escrowed to Maturity) | | 29,680 | | 22,202 |
Illinois Dev. Fin. Auth. Rev.: | | | | |
(DePaul Univ. Proj.) Series 2004 C, 5.625% 10/1/17 | | 2,800 | | 3,114 |
(Revolving Fund-Master Trust Prog.): | | | | |
5.5% 9/1/18 | | 5,365 | | 5,402 |
5.5% 9/1/19 | | 4,405 | | 4,434 |
Illinois Edl. Facilities Auth. Rev. (Univ. of Chicago Proj.) Series 2005 A, 5.25% 7/1/41 | | 55 | | 55 |
Illinois Fin. Auth. Gas Supply Rev. Bonds (Peoples Gas Lt. and Coke Co. Proj.) Series 2005 A, 4.3%, tender 6/1/16 (AMBAC Insured) (c) | | 3,860 | | 4,132 |
Illinois Fin. Auth. Rev.: | | | | |
(Advocate Health Care Proj.) Series 2010 A, 5.5% 4/1/44 | | 3,000 | | 3,284 |
(Advocate Heath Care Proj.) Series 2008 D, 6.5% 11/1/38 | | 4,300 | | 5,125 |
(Central DuPage Health Proj.) Series 2009 B, 5.375% 11/1/39 | | 6,500 | | 7,097 |
(Children's Memorial Hosp. Proj.) Series 2008 A: | | | | |
5.25% 8/15/33 (Assured Guaranty Corp. Insured) | | 7,800 | | 8,337 |
5.25% 8/15/47 (Assured Guaranty Corp. Insured) | | 2,000 | | 2,079 |
(Edward Hosp. Obligated Group Proj.) Series 2008 A: | | | | |
5.5% 2/1/40 (AMBAC Insured) | | 2,850 | | 3,005 |
6% 2/1/28 (AMBAC Insured) | | 2,080 | | 2,326 |
(Newman Foundation Proj.): | | | | |
5% 2/1/32 (Radian Asset Assurance, Inc. Insured) | | 1,300 | | 1,271 |
5% 2/1/37 (Radian Asset Assurance, Inc. Insured) | | 10,000 | | 9,617 |
(Northwest Cmnty. Hosp. Proj.) Series 2008 A, 5.5% 7/1/38 | | 12,580 | | 13,322 |
(Northwestern Memorial Hosp. Proj.) Series 2009 A, 6% 8/15/39 | | 4,000 | | 4,603 |
(Palos Cmnty. Hosp. Proj.) Series 2010 C, 5.375% 5/15/25 | | 25,230 | | 28,326 |
(Provena Health Proj.) Series 2010 A, 6% 5/1/28 | | 13,500 | | 15,317 |
Municipal Bonds - continued |
| Principal Amount (000s) | | Value (000s) |
Illinois - continued |
Illinois Fin. Auth. Rev.: - continued | | | | |
(Rush Univ. Med. Ctr. Proj.): | | | | |
Series 2009 C, 6.625% 11/1/39 | | $ 8,200 | | $ 9,776 |
Series 2009 D, 6.625% 11/1/39 | | 8,000 | | 9,537 |
(Sherman Health Systems Proj.) Series 2007 A, 5.5% 8/1/37 | | 14,000 | | 14,500 |
(Southern Illinois Healthcare Enterprises, Inc. Proj.) Series 2005, 5.25% 3/1/30 | | 5,900 | | 6,414 |
(The Carle Foundation Proj.) Series 2009 A, 5.5% 2/15/16 (Assured Guaranty Corp. Insured) | | 5,385 | | 6,066 |
(The Univ. of Chicago Med. Ctr. Proj.) Series 2009 B, 5% 8/15/23 | | 5,550 | | 6,387 |
Series 2008 A, 5.625% 1/1/37 | | 17,245 | | 18,171 |
Series 2009: | | | | |
6.875% 8/15/38 | | 430 | | 491 |
7% 8/15/44 | | 1,560 | | 1,782 |
Series 2010 A: | | | | |
5.5% 8/15/24 | | 2,830 | | 3,145 |
5.75% 8/15/29 | | 2,290 | | 2,543 |
5.25% 5/1/25 | | 7,000 | | 7,919 |
Illinois Gen. Oblig.: | | | | |
First Series: | | | | |
5.25% 12/1/20 (Pre-Refunded to 12/1/12 @ 100) | | 2,000 | | 2,041 |
5.5% 8/1/16 (Pre-Refunded to 8/1/12 @ 100) | | 13,000 | | 13,050 |
5.5% 8/1/17 (Pre-Refunded to 8/1/12 @ 100) | | 7,500 | | 7,529 |
5.5% 8/1/18 (Pre-Refunded to 8/1/12 @ 100) | | 5,000 | | 5,019 |
Series 2002, 5.25% 12/1/17 (Pre-Refunded to 12/1/12 @ 100) | | 2,260 | | 2,307 |
Series 2006: | | | | |
5% 1/1/19 | | 4,200 | | 4,734 |
5.5% 1/1/31 | | 3,000 | | 3,490 |
Series 2010, 5% 1/1/23 (FSA Insured) | | 6,600 | | 7,188 |
Series 2012: | | | | |
5% 3/1/23 | | 4,000 | | 4,402 |
5% 3/1/35 | | 2,000 | | 2,095 |
5% 3/1/37 | | 1,000 | | 1,048 |
Illinois Health Facilities Auth. Rev.: | | | | |
(Delnor-Cmnty. Hosp. Proj.) Series 2002 D, 5.25% 5/15/32 (FSA Insured) | | 3,000 | | 3,170 |
(Lake Forest Hosp. Proj.): | | | | |
Series A, 6.25% 7/1/22 | | 4,200 | | 4,217 |
6% 7/1/33 | | 3,775 | | 3,929 |
Municipal Bonds - continued |
| Principal Amount (000s) | | Value (000s) |
Illinois - continued |
Illinois Health Facilities Auth. Rev.: - continued | | | | |
(Lutheran Gen. Health Care Sys. Proj.) Series C: | | | | |
6% 4/1/18 | | $ 3,000 | | $ 3,468 |
7% 4/1/14 | | 975 | | 1,033 |
(Sherman Hosp. Proj.) 5.25% 8/1/27 (AMBAC Insured) | | 3,000 | | 3,002 |
Illinois Reg'l. Trans. Auth. Series A, 8% 6/1/17 (AMBAC Insured) | | 4,500 | | 5,619 |
Illinois Sales Tax Rev. Series 2010, 5% 6/15/17 | | 13,500 | | 15,941 |
Kane & DeKalb Counties Cmnty. Unit School District #302 5.5% 2/1/25 (FSA Insured) | | 3,000 | | 3,395 |
Kane, McHenry, Cook & DeKalb Counties Unit School District #300: | | | | |
Series 2001, 0% 12/1/17 (AMBAC Insured) | | 3,700 | | 3,282 |
Series 2007, 6.5% 1/1/20 (AMBAC Insured) | | 7,865 | | 9,910 |
0% 12/1/21 (AMBAC Insured) | | 5,000 | | 3,737 |
Lake County Cmnty. Consolidated School District #73 Gen. Oblig.: | | | | |
0% 12/1/14 (Escrowed to Maturity) | | 630 | | 620 |
0% 12/1/14 (Nat'l. Pub. Fin. Guarantee Corp. Insured) | | 1,370 | | 1,302 |
0% 12/1/16 (Escrowed to Maturity) | | 585 | | 561 |
0% 12/1/16 (Nat'l. Pub. Fin. Guarantee Corp. Insured) | | 1,905 | | 1,721 |
Lake County Cmnty. High School District #117, Antioch Series B, 0% 12/1/18 (Nat'l. Pub. Fin. Guarantee Corp. Insured) | | 7,240 | | 5,983 |
Lake County Forest Preservation District Series 2007 A, 0.663% 12/15/13 (c) | | 1,895 | | 1,896 |
Lake County Warren Township High School District #121, Gurnee Series C: | | | | |
5.5% 3/1/24 (AMBAC Insured) | | 2,945 | | 3,133 |
5.625% 3/1/21 (AMBAC Insured) | | 2,505 | | 2,686 |
5.75% 3/1/19 (AMBAC Insured) | | 2,240 | | 2,418 |
McHenry & Kane Counties Cmnty. Consolidated School District #158 Series 2003, 0% 1/1/19 (Nat'l. Pub. Fin. Guarantee Corp. Insured) | | 3,000 | | 2,308 |
Metropolitan Pier & Exposition: | | | | |
(McCormick Place Expansion Proj.): | | | | |
Series 1992 A, 0% 6/15/20 (Nat'l. Pub. Fin. Guarantee Corp. Insured) | | 3,610 | | 2,745 |
Series 1996 A, 0% 6/15/23 (Nat'l. Pub. Fin. Guarantee Corp. Insured) | | 5,300 | | 3,417 |
Municipal Bonds - continued |
| Principal Amount (000s) | | Value (000s) |
Illinois - continued |
Metropolitan Pier & Exposition: - continued | | | | |
(McCormick Place Expansion Proj.): | | | | |
Series 2002 A: | | | | |
5% 12/15/28 (Nat'l. Pub. Fin. Guarantee Corp. Insured) | | $ 2,000 | | $ 2,022 |
5.75% 6/15/41 (Nat'l. Pub. Fin. Guarantee Corp. Insured) | | 26,420 | | 26,713 |
Series 2002 B, 5.5% 6/15/20 (Nat'l. Pub. Fin. Guarantee Corp. Insured) | | 2,000 | | 2,302 |
Series 2010 B1, 0% 6/15/44 (FSA Insured) | | 49,500 | | 8,747 |
Series 2012 B: | | | | |
0% 12/15/51 (b) | | 16,200 | | 1,834 |
5% 6/15/52 (b) | | 19,400 | | 20,329 |
Series A: | | | | |
0% 6/15/19 (Nat'l. Pub. Fin. Guarantee Corp. Insured) | | 3,305 | | 2,651 |
0% 6/15/19 (Nat'l. Pub. Fin. Guarantee Corp. Insured) | | 2,935 | | 2,403 |
0% 6/15/36 (Nat'l. Pub. Fin. Guarantee Corp. Insured) | | 4,000 | | 1,151 |
Series 1996 A, 0% 6/15/24 | | 3,060 | | 1,863 |
Series 2002 A, 0% 12/15/30 (Nat'l. Pub. Fin. Guarantee Corp. Insured) | | 32,600 | | 13,494 |
Series 2002, 0% 6/15/13 (Escrowed to Maturity) | | 4,155 | | 4,134 |
Series 2010 B1: | | | | |
0% 6/15/43 (FSA Insured) | | 42,600 | | 7,972 |
0% 6/15/45 (FSA Insured) | | 27,900 | | 4,670 |
0% 6/15/47 (FSA Insured) | | 11,570 | | 1,714 |
Series A: | | | | |
0% 6/15/13 (Escrowed to Maturity) | | 5,415 | | 5,389 |
0% 12/15/19 (Nat'l. Pub. Fin. Guarantee Corp. Insured) | | 2,115 | | 1,660 |
0% 6/15/13 (Nat'l. Pub. Fin. Guarantee Corp. Insured) | | 210 | | 207 |
0% 6/15/15 (Escrowed to Maturity) | | 5,355 | | 5,235 |
0% 6/15/15 (FGIC Insured) (Nat'l. Pub. Fin. Guarantee Corp. Insured) | | 9,645 | | 9,020 |
Quincy Hosp. Rev.: | | | | |
(Blessing Hosp. Proj.) 5% 11/15/16 | | 1,200 | | 1,313 |
Series 2007, 5% 11/15/14 | | 1,000 | | 1,059 |
5% 11/15/18 | | 1,000 | | 1,095 |
Schaumburg Village Gen. Oblig. Series B, 5% 12/1/38 (Nat'l. Pub. Fin. Guarantee Corp. Insured) | | 11,350 | | 12,104 |
Municipal Bonds - continued |
| Principal Amount (000s) | | Value (000s) |
Illinois - continued |
Univ. of Illinois Board of Trustees Ctfs. of Prtn. Series 2009 A: | | | | |
5% 10/1/17 | | $ 1,300 | | $ 1,518 |
5% 10/1/18 | | 1,435 | | 1,654 |
5% 10/1/20 | | 1,290 | | 1,459 |
Univ. of Illinois Rev.: | | | | |
(Auxiliary Facilities Sys. Proj.): | | | | |
Series 1991: | | | | |
0% 4/1/17 (Nat'l. Pub. Fin. Guarantee Corp. Insured) | | 16,270 | | 14,862 |
0% 4/1/20 (Nat'l. Pub. Fin. Guarantee Corp. Insured) | | 8,000 | | 6,305 |
Series 1999 A, 0% 4/1/21 (Nat'l. Pub. Fin. Guarantee Corp. Insured) | | 4,965 | | 3,654 |
Series 2009 A, 5.75% 4/1/38 | | 7,805 | | 8,604 |
Series 2010 A: | | | | |
5% 4/1/25 | | 5,125 | | 5,708 |
5.25% 4/1/30 | | 3,200 | | 3,535 |
Will County Cmnty. Unit School District #365-U: | | | | |
0% 11/1/14 (Escrowed to Maturity) | | 2,305 | | 2,264 |
0% 11/1/14 (FSA Insured) | | 1,995 | | 1,936 |
0% 11/1/16 (Escrowed to Maturity) | | 1,615 | | 1,546 |
0% 11/1/16 (FSA Insured) | | 4,885 | | 4,511 |
0% 11/1/17 (FSA Insured) | | 3,200 | | 2,854 |
0% 11/1/19 (Escrowed to Maturity) | | 675 | | 592 |
0% 11/1/19 (FSA Insured) | | 4,325 | | 3,518 |
| | 868,817 |
Indiana - 2.5% |
Avon 2000 Cmnty. School Bldg. Corp. Series 2005, 5% 7/15/17 (FSA Insured) | | 2,835 | | 3,092 |
Clark-Pleasant 2004 School Bldg. Corp.: | | | | |
5.25% 7/15/23 (FSA Insured) | | 1,545 | | 1,659 |
5.25% 7/15/25 (FSA Insured) | | 1,720 | | 1,834 |
Crown Point Multi-School Bldg. Corp. 0% 1/15/21 (Nat'l. Pub. Fin. Guarantee Corp. Insured) | | 7,480 | | 5,649 |
Franklin Township Independent School Bldg. Corp., Marion County: | | | | |
5% 7/15/24 (Nat'l. Pub. Fin. Guarantee Corp. Insured) | | 1,365 | | 1,485 |
5.25% 7/15/17 (Nat'l. Pub. Fin. Guarantee Corp. Insured) | | 1,885 | | 2,143 |
Municipal Bonds - continued |
| Principal Amount (000s) | | Value (000s) |
Indiana - continued |
GCS School Bldg. Corp. One 5% 7/15/22 (FSA Insured) | | $ 1,545 | | $ 1,638 |
Hobart Bldg. Corp. Series 2006, 6.5% 1/15/29 (Nat'l. Pub. Fin. Guarantee Corp. Insured) | | 25,900 | | 32,685 |
Indiana Bond Bank Series B: | | | | |
5% 2/1/19 (Pre-Refunded to 8/1/13 @ 100) | | 1,940 | | 2,038 |
5% 2/1/20 (Pre-Refunded to 8/1/13 @ 100) | | 1,635 | | 1,717 |
Indiana Dev. Fin. Auth. Solid Waste Disp. Rev. Bonds (Waste Mgmt., Inc. Proj.) Series 2001, 4.7%, tender 10/1/15 (c)(f) | | 3,500 | | 3,868 |
Indiana Fin. Auth. Health Sys. Rev. (Sisters of Saint Francis Health Svcs., Inc. Obligated Group Proj.): | | | | |
Series 2008 C, 5.375% 11/1/32 | | 7,815 | | 8,542 |
Series 2009 A, 5.25% 11/1/39 | | 5,300 | | 5,748 |
Indiana Fin. Auth. Rev. (Trinity Health Cr. Group Proj.) Series 2009 A, 5.25% 12/1/38 | | 8,000 | | 8,737 |
Indiana Health & Edl. Facilities Fing. Auth. Hosp. Rev. Series B: | | | | |
5% 2/15/14 | | 1,060 | | 1,126 |
5% 2/15/15 | | 1,500 | | 1,639 |
Indiana Health & Edl. Facilities Fing. Auth. Rev. Bonds (Ascension Health Sr. Cr. Group Proj.) Series 2006 B1, 4.1%, tender 11/3/16 (c) | | 11,200 | | 12,535 |
Indiana Health Facilities Fing. Auth. Hosp. Rev. (Columbus Reg'l. Hosp. Proj.) Series 1993, 7% 8/15/15 (FSA Insured) | | 1,575 | | 1,675 |
Indiana Health Facility Fing. Auth. Rev. Bonds: | | | | |
(Ascension Health Cr. Group Proj.) Series 2001 A2, 1.6%, tender 2/1/17 (c) | | 7,700 | | 7,700 |
(Ascension Health Subordinate Cr. Proj.) Series 2005 A1, 5%, tender 5/1/13 (c) | | 3,000 | | 3,109 |
Indiana Muni. Pwr. Agcy. Pwr. Supply Sys. Rev.: | | | | |
Series 2011 A: | | | | |
5% 1/1/22 | | 2,000 | | 2,391 |
5% 1/1/23 | | 1,800 | | 2,121 |
Series A, 5% 1/1/32 (Nat'l. Pub. Fin. Guarantee Corp. Insured) | | 2,500 | | 2,610 |
Indiana St Fin. Auth. Wastewtr.: | | | | |
Series 2011 A, 5.25% 10/1/25 | | 1,750 | | 2,072 |
Series 2011 B, 5% 10/1/41 | | 5,500 | | 6,010 |
Indiana Trans. Fin. Auth. Hwy. Rev. Series 1993 A: | | | | |
0% 6/1/16 (AMBAC Insured) | | 6,470 | | 5,993 |
0% 6/1/18 (AMBAC Insured) | | 1,700 | | 1,477 |
Municipal Bonds - continued |
| Principal Amount (000s) | | Value (000s) |
Indiana - continued |
Indianapolis Local Pub. Impt. Bond Bank (Indianapolis Arpt. Auth. Proj.) Series 2006 F: | | | | |
5% 1/1/16 (AMBAC Insured) (f) | | $ 1,525 | | $ 1,690 |
5% 1/1/17 (AMBAC Insured) (f) | | 1,700 | | 1,890 |
5.25% 1/1/14 (AMBAC Insured) (f) | | 2,675 | | 2,825 |
Jasper County Indl. Poll. Ctl. Rev. (Northern Indiana Pub. Svc. Co. Proj.) Series 1988 C, 5.6% 11/1/16 (Nat'l. Pub. Fin. Guarantee Corp. Insured) | | 4,000 | | 4,514 |
Purdue Univ. Rev. (Student Facilities Sys. Proj.) Series 2009 B: | | | | |
5% 7/1/24 | | 1,150 | | 1,329 |
5% 7/1/25 | | 1,000 | | 1,146 |
5% 7/1/26 | | 1,325 | | 1,514 |
5% 7/1/29 | | 670 | | 755 |
5% 7/1/35 | | 3,000 | | 3,310 |
Southmont School Bldg. Corp. Series 2004, 5% 7/15/15 (Pre-Refunded to 1/15/13 @ 100) | | 2,000 | | 2,050 |
Wayne Township Marion County School Bldg. Corp. Series 2007, 5.5% 1/15/31 (Nat'l. Pub. Fin. Guarantee Corp. Insured) | | 5,560 | | 6,090 |
Westfield Washington Multi-School Bldg. Corp. Series A, 5% 7/15/18 (FSA Insured) | | 1,500 | | 1,645 |
Zionsville Cmnty. Schools Bldg. Series 2005, 5% 7/15/20 (FSA Insured) | | 1,945 | | 2,325 |
| | 162,376 |
Iowa - 0.1% |
Iowa Fin. Auth. Health Facilities Rev. Series 2008 A, 5.625% 8/15/37 (Assured Guaranty Corp. Insured) | | 4,800 | | 5,332 |
Kansas - 0.5% |
Kansas Dev. Fin. Agcy. (Adventist Health Sys./Sunbelt Obligated Group Proj.): | | | | |
Series 2009 C, 5.75% 11/15/38 | | 10,600 | | 12,010 |
Series 2009 D, 5% 11/15/29 | | 4,600 | | 4,920 |
Kansas Dev. Fin. Auth. Health Facilities Rev.: | | | | |
(Hayes Med. Ctr., Inc. Proj.) Series 2010 Q, 5% 5/15/35 | | 4,000 | | 4,235 |
(KU Health Sys. Proj.) Series 2011 H, 5.125% 3/1/39 | | 2,500 | | 2,652 |
Leavenworth County Unified School District #453 general obligation Series 2009 A, 5.25% 9/1/24 (Assured Guaranty Corp. Insured) | | 1,575 | | 1,811 |
Topeka Combined Util. Impt. Rev. Series 2005 A: | | | | |
6% 8/1/20 (XL Cap. Assurance, Inc. Insured) | | 1,200 | | 1,377 |
Municipal Bonds - continued |
| Principal Amount (000s) | | Value (000s) |
Kansas - continued |
Topeka Combined Util. Impt. Rev. Series 2005 A: - continued | | | | |
6% 8/1/25 (XL Cap. Assurance, Inc. Insured) | | $ 1,100 | | $ 1,248 |
6% 8/1/27 (XL Cap. Assurance, Inc. Insured) | | 1,235 | | 1,397 |
Wichita Hosp. Facilities Rev. (Via Christi Health Sys., Inc. Proj.) Series 2009 X: | | | | |
4% 11/15/18 | | 1,300 | | 1,421 |
5% 11/15/17 | | 2,500 | | 2,856 |
| | 33,927 |
Kentucky - 1.4% |
Ashland Med. Ctr. Rev. (Ashland Hosp. Corp. d/b/a/ King's Daughters Med. Ctr. Proj.) Series 2010 B, 5% 2/1/22 | | 1,355 | | 1,510 |
Kentucky Econ. Dev. Fin. Auth. Hosp. Rev.: | | | | |
(Baptist Healthcare Sys. Proj.) Series A: | | | | |
5% 8/15/16 | | 9,410 | | 10,658 |
5% 8/15/17 | | 3,650 | | 4,199 |
(St. Elizabeth Med. Ctr., Inc. Proj.) Series 2009 A, 5.5% 5/1/39 | | 4,000 | | 4,375 |
Kentucky Econ. Dev. Fin. Auth. Rev. (Ashland Hosp. Corp. d/b/a/ King's Daughters Med. Ctr. Proj.) Series 2010 A, 5% 2/1/30 | | 5,000 | | 5,274 |
Louisville & Jefferson County Metropolitan Govt. Health Facilities Rev. (Jewish Hosp. & St. Mary's HealthCare Proj.) Series 2008, 6.125% 2/1/37 (Pre-Refunded to 2/1/18 @ 100) | | 36,220 | | 46,166 |
Louisville & Jefferson County Metropolitan Swr. District Swr. & Drain Sys. Rev. Series A, 5.25% 5/15/37 (Nat'l. Pub. Fin. Guarantee Corp. Insured) | | 15,750 | | 16,844 |
Pikeville Hosp. Rev. (Pikeville Med. Ctr., Inc. Proj.) Series 2011, 6.5% 3/1/41 | | 3,000 | | 3,477 |
| | 92,503 |
Louisiana - 0.7% |
Louisiana Pub. Facilities Auth. Rev. (Nineteenth Judicial District Court Proj.) Series 2007: | | | | |
5.375% 6/1/19 (Nat'l. Pub. Fin. Guarantee Corp. Insured) | | 1,000 | | 1,143 |
5.375% 6/1/32 (Nat'l. Pub. Fin. Guarantee Corp. Insured) | | 1,900 | | 2,048 |
5.5% 6/1/41 (Nat'l. Pub. Fin. Guarantee Corp. Insured) | | 15,500 | | 16,597 |
Municipal Bonds - continued |
| Principal Amount (000s) | | Value (000s) |
Louisiana - continued |
Monroe-West Monroe Pub. Trust Fing. Auth. Mtg. Rev. Series C, 0% 8/20/14 | | $ 8,625 | | $ 8,188 |
New Orleans Aviation Board Rev.: | | | | |
Series 2007 A, 5% 1/1/17 (FSA Insured) (f) | | 1,420 | | 1,578 |
Series 2007 B2, 5% 1/1/16 (FSA Insured) (f) | | 1,000 | | 1,100 |
New Orleans Gen. Oblig.: | | | | |
Series 2005: | | | | |
5% 12/1/29 (Nat'l. Pub. Fin. Guarantee Corp. Insured) | | 4,690 | | 4,808 |
5.25% 12/1/24 (Nat'l. Pub. Fin. Guarantee Corp. Insured) | | 3,450 | | 3,631 |
0% 9/1/13 (AMBAC Insured) | | 3,350 | | 3,251 |
0% 9/1/14 (AMBAC Insured) | | 3,165 | | 2,987 |
Tobacco Settlement Fing. Corp. Series 2001 B, 5.875% 5/15/39 | | 1,000 | | 1,024 |
| | 46,355 |
Maine - 0.3% |
Maine Tpk. Auth. Tpk. Rev.: | | | | |
Series 2004, 5.25% 7/1/30 (Pre-Refunded to 7/1/14 @ 100) | | 3,000 | | 3,290 |
Series 2007, 5.25% 7/1/37 (AMBAC Insured) | | 9,060 | | 9,897 |
6% 7/1/38 | | 2,700 | | 3,161 |
| | 16,348 |
Maryland - 0.7% |
Baltimore Convention Ctr. Hotel Rev. Series A, 5.25% 9/1/39 (XL Cap. Assurance, Inc. Insured) | | 4,710 | | 4,711 |
Baltimore Proj. Rev. (Wtr. Proj.) Series 2009 A, 5.75% 7/1/39 | | 1,250 | | 1,445 |
Maryland Econ. Dev. Corp. Student Hsg. Rev. (Univ. of Maryland, Baltimore County Student Hsg. Proj.) Series 2006: | | | | |
5% 6/1/14 (CIFG North America Insured) | | 1,020 | | 1,101 |
5% 6/1/16 (CIFG North America Insured) | | 1,000 | | 1,128 |
5% 6/1/19 (CIFG North America Insured) | | 1,500 | | 1,639 |
Maryland Health & Higher Edl. Facilities Auth. Rev.: | | | | |
(Anne Arundel Health Sys. Proj.) Series 2010, 5% 7/1/40 | | 2,000 | | 2,106 |
(Doctors Cmnty. Hosp. Proj.) Series 2010, 5.75% 7/1/38 | | 2,245 | | 2,413 |
(Good Samaritan Hosp. Proj.) Series 1993, 5.75% 7/1/13 (Escrowed to Maturity) | | 1,605 | | 1,605 |
Municipal Bonds - continued |
| Principal Amount (000s) | | Value (000s) |
Maryland - continued |
Maryland Health & Higher Edl. Facilities Auth. Rev.: - continued | | | | |
(Johns Hopkins Med. Institutions Utils. Proj.) Series 2005 B, 5% 5/15/35 | | $ 2,700 | | $ 2,963 |
(Univ. of Maryland Med. Sys. Proj.) Series 2010, 5.125% 7/1/39 | | 4,400 | | 4,760 |
(Upper Chesapeake Hosp. Proj.) Series 2008 C, 6% 1/1/38 | | 3,000 | | 3,252 |
(Washington County Health Sys. Proj.) Series 2008: | | | | |
6% 1/1/28 | | 5,000 | | 5,442 |
6% 1/1/43 | | 1,500 | | 1,599 |
Washington Suburban San. District 5% 6/1/20 | | 6,630 | | 8,142 |
| | 42,306 |
Massachusetts - 2.4% |
Massachusetts Bay Trans. Auth. Series 1992 B, 6.2% 3/1/16 | | 3,800 | | 4,172 |
Massachusetts Dev. Fin. Agcy. Rev.: | | | | |
(Boston Univ. Proj.) Series U4, 5.7% 10/1/40 | | 7,500 | | 8,304 |
Series I, 6.75% 1/1/36 | | 3,000 | | 3,440 |
Massachusetts Gen. Oblig.: | | | | |
Series 2007 A, 0.882% 5/1/37 (c) | | 3,500 | | 2,788 |
Series 2007 C: | | | | |
5.25% 8/1/22 | | 7,700 | | 9,180 |
5.25% 8/1/23 | | 3,600 | | 4,263 |
5.25% 8/1/24 | | 9,000 | | 10,575 |
Massachusetts Health & Edl. Facilities Auth. Rev.: | | | | |
(Blood Research Institute Proj.) Series A, 6.5% 2/1/22 (g) | | 2,825 | | 2,836 |
(Massachusetts Gen. Hosp. Proj.) Series F, 6.25% 7/1/12 (Escrowed to Maturity) | | 345 | | 345 |
(South Shore Hosp. Proj.) Series F, 5.75% 7/1/29 | | 4,455 | | 4,460 |
Bonds (Baystate Health Sys. Proj.) Series 2009 K, 5%, tender 7/1/13 (c) | | 4,000 | | 4,145 |
Massachusetts Port Auth. Spl. Facilities Rev. (Delta Air Lines, Inc. Proj.) Series 2001 A, 5.5% 1/1/14 (AMBAC Insured) (f) | | 2,540 | | 2,540 |
Massachusetts School Bldg. Auth. Dedicated Sales Tax Rev.: | | | | |
Series 2005 A: | | | | |
5% 8/15/23 (Pre-Refunded to 8/15/15 @ 100) | | 29,965 | | 34,102 |
5% 8/15/26 (Pre-Refunded to 8/15/15 @ 100) | | 10,000 | | 11,381 |
5% 8/15/30 | | 30,000 | | 33,006 |
Municipal Bonds - continued |
| Principal Amount (000s) | | Value (000s) |
Massachusetts - continued |
Massachusetts School Bldg. Auth. Dedicated Sales Tax Rev.: - continued | | | | |
Series 2007 A: | | | | |
4.5% 8/15/35 | | $ 13,790 | | $ 14,582 |
5% 8/15/22 (AMBAC Insured) | | 2,900 | | 3,382 |
Massachusetts Wtr. Poll. Abatement Trust Wtr. Poll. Abatement Rev. (MWRA Ln. Prog.) Series 1998 A, 5.25% 8/1/13 | | 90 | | 90 |
| | 153,591 |
Michigan - 1.9% |
Detroit School District Series 2012 A, 5% 5/1/23 | | 4,000 | | 4,617 |
Detroit Swr. Disp. Rev.: | | | | |
Series 2001 E, 5.75% 7/1/31 (Berkshire Hathaway Assurance Corp. Insured) (FGIC Insured) | | 8,000 | | 9,155 |
Series 2003 B, 7.5% 7/1/33 (FSA Insured) | | 4,200 | | 5,071 |
Series 2006, 5% 7/1/36 (Nat'l. Pub. Fin. Guarantee Corp. Insured) | | 20,700 | | 20,415 |
Detroit Wtr. Supply Sys. Rev.: | | | | |
Series 2003 A, 5% 7/1/34 (Nat'l. Pub. Fin. Guarantee Corp. Insured) | | 12,000 | | 12,009 |
Series 2004 A, 5.25% 7/1/15 (Nat'l. Pub. Fin. Guarantee Corp. Insured) | | 2,380 | | 2,568 |
Series 2004, 5.25% 7/1/16 (Nat'l. Pub. Fin. Guarantee Corp. Insured) | | 1,685 | | 1,853 |
Series 2005 B, 5.5% 7/1/35 (Berkshire Hathaway Assurance Corp. Insured) (FGIC Insured) | | 5,000 | | 5,522 |
Series 2006 B, 7% 7/1/36 (FSA Insured) | | 4,900 | | 5,861 |
DeWitt Pub. Schools Gen. Oblig. 5% 5/1/21 (Nat'l. Pub. Fin. Guarantee Corp. Insured) | | 1,650 | | 1,901 |
Ferris State Univ. Rev. 5% 10/1/20 (Nat'l. Pub. Fin. Guarantee Corp. Insured) | | 3,165 | | 3,326 |
Fowlerville Cmnty. School District 5.25% 5/1/17 (Nat'l. Pub. Fin. Guarantee Corp. Insured) | | 1,425 | | 1,528 |
Kent Hosp. Fin. Auth. Hosp. Facilities Rev. Bonds (Spectrum Health Sys. Proj.) Series 2008 A, 5.25%, tender 1/15/14 (c) | | 3,300 | | 3,488 |
Lansing Board Wtr. & Lt. Rev. 5.5% 7/1/41 | | 2,500 | | 2,852 |
Lapeer Cmnty. Schools Series 2007, 5% 5/1/33 (FSA Insured) | | 2,600 | | 2,788 |
Michigan Fin. Auth. Rev. Series 2012 B, 5% 7/1/22 | | 3,900 | | 4,446 |
Municipal Bonds - continued |
| Principal Amount (000s) | | Value (000s) |
Michigan - continued |
Michigan Hosp. Fin. Auth. Rev.: | | | | |
(McLaren Health Care Corp. Proj.) Series 2008 A, 5.75% 5/15/38 | | $ 3,000 | | $ 3,343 |
(Sisters of Mercy Health Corp. Proj.) Series 1993, 5.375% 8/15/14 (Escrowed to Maturity) | | 145 | | 148 |
(Trinity Health Sys. Proj.): | | | | |
Series 2008 A, 6.5% 12/1/33 | | 4,000 | | 4,813 |
5% 12/1/26 | | 1,115 | | 1,237 |
5% 12/1/26 (Pre-Refunded to 12/1/16 @ 100) | | 245 | | 291 |
Series 2012 A: | | | | |
5% 6/1/23 (b) | | 2,395 | | 2,765 |
5% 6/1/26 (b) | | 2,000 | | 2,228 |
Portage Pub. Schools 5% 5/1/21 (FSA Insured) | | 6,300 | | 7,152 |
Royal Oak Hosp. Fin. Auth. Hosp. Rev. (William Beaumont Hosp. Proj.) Series 2009 V, 8.25% 9/1/39 | | 3,400 | | 4,346 |
Three Rivers Cmnty. Schools 5% 5/1/21 (FSA Insured) | | 1,710 | | 1,957 |
Wayne County Arpt. Auth. Rev.: | | | | |
Series 2010 A, 5% 12/1/18 (f) | | 2,100 | | 2,337 |
Series 2011 A, 5% 12/1/19 (f) | | 3,805 | | 4,251 |
| | 122,268 |
Minnesota - 0.9% |
Maple Grove Health Care Sys. Rev.: | | | | |
(Maple Grove Hosp. Corp. Proj.) Series 2007, 5.25% 5/1/28 | | 3,500 | | 3,679 |
5% 5/1/20 | | 1,000 | | 1,079 |
Minneapolis & Saint Paul Hsg. & Redev. Auth. Health Care Sys. Rev. (HealthPartners Obligated Group Proj.) 6% 12/1/18 | | 1,000 | | 1,066 |
Minneapolis & Saint Paul Metropolitan Arpts. Commission Arpt. Rev. Series 2005 A, 5% 1/1/35 (AMBAC Insured) | | 4,000 | | 4,135 |
Minnesota 911 Rev. (Pub. Safety Radio Communications Sys. Proj.) Series 2009, 5% 6/1/20 (Assured Guaranty Corp. Insured) | | 3,835 | | 4,681 |
Minnesota Agric. & Econ. Dev. Board Rev. (Health Care Sys. Proj.) Series 2000 A, 6.375% 11/15/29 | | 210 | | 211 |
Saint Paul Port Auth. Lease Rev. Series 2003 11: | | | | |
5.25% 12/1/18 | | 1,710 | | 1,825 |
5.25% 12/1/19 | | 2,850 | | 3,039 |
St. Louis Park Health Care Facilities Rev. (Park Nicollet Health Svcs. Proj.): | | | | |
Series 2008 C, 5.5% 7/1/18 | | 5,600 | | 6,604 |
Municipal Bonds - continued |
| Principal Amount (000s) | | Value (000s) |
Minnesota - continued |
St. Louis Park Health Care Facilities Rev. (Park Nicollet Health Svcs. Proj.): - continued | | | | |
Series 2009, 5.75% 7/1/39 | | $ 20,700 | | $ 22,836 |
St. Paul Hsg. & Redev. Auth. Health Care Facilities Rev. (HealthPartners Oblig. Group Proj.): | | | | |
Series 2006, 5.25% 5/15/36 | | 4,250 | | 4,424 |
5.25% 5/15/18 | | 1,650 | | 1,803 |
5.25% 5/15/23 | | 2,000 | | 2,135 |
Tobacco Securitization Auth. Series 2011 B, 5% 3/1/19 | | 1,350 | | 1,558 |
| | 59,075 |
Mississippi - 0.0% |
Mississippi Hosp. Equip. & Facilities Auth. (Mississippi Baptist Med. Ctr. Proj.) Series 2007 A, 5% 8/15/14 | | 2,500 | | 2,661 |
Missouri - 0.1% |
Metropolitan St. Louis Swr. District Wastewtr. Sys. Rev. Series 2008 A, 5.75% 5/1/38 | | 1,000 | | 1,127 |
Missouri Dev. Fin. Board Infrastructure Facilities Rev. (City of Branson-Branson Landing Proj.) Series 2005 A, 6% 6/1/20 | | 2,125 | | 2,487 |
| | 3,614 |
Montana - 0.1% |
Forsyth Poll. Cont. Rev. (Portland Gen. Elec. Co. Proj.) Series 1998 A, 5% 5/1/33 | | 3,900 | | 4,320 |
Nebraska - 0.3% |
Central Plains Energy Proj. Rev. (Nebraska Gas Proj.) Series 2007 B, 0.813% 12/1/17 (c) | | 7,900 | | 6,778 |
Douglas County Hosp. Auth. #2 Health Facilities Rev. (Children's Hosp. Proj.): | | | | |
6% 8/15/23 | | 2,130 | | 2,423 |
6% 8/15/28 | | 3,500 | | 3,924 |
6.125% 8/15/31 | | 2,250 | | 2,517 |
Omaha Pub. Pwr. District Elec. Rev. Series A, 5% 2/1/46 | | 5,500 | | 5,650 |
| | 21,292 |
Nevada - 0.6% |
Clark County Arpt. Rev. Series 2003 C: | | | | |
5.375% 7/1/17 (AMBAC Insured) (f) | | 4,310 | | 4,451 |
5.375% 7/1/19 (AMBAC Insured) (f) | | 1,100 | | 1,134 |
5.375% 7/1/21 (AMBAC Insured) (f) | | 1,600 | | 1,647 |
Municipal Bonds - continued |
| Principal Amount (000s) | | Value (000s) |
Nevada - continued |
Clark County Wtr. Reclamation District Series 2009 A, 5.25% 7/1/29 (Berkshire Hathaway Assurance Corp. Insured) | | $ 4,300 | | $ 4,897 |
Las Vegas Valley Wtr. District Wtr. Impt. Gen. Oblig.: | | | | |
Series 2003 B, 5.25% 6/1/17 (Pre-Refunded to 12/1/12 @ 100) | | 6,285 | | 6,414 |
Series 2011 C, 5% 6/1/24 | | 5,415 | | 6,265 |
Washoe County Gen. Oblig. (Reno Sparks Proj.)
Series B: | | | | |
0% 7/1/12 (FSA Insured) | | 4,605 | | 4,605 |
0% 7/1/13 (FSA Insured) | | 4,590 | | 4,530 |
0% 7/1/14 (FSA Insured) | | 3,000 | | 2,902 |
| | 36,845 |
New Hampshire - 0.5% |
New Hampshire Bus. Fin. Auth. Rev. Series 2009 A, 6.125% 10/1/39 | | 9,300 | | 10,010 |
New Hampshire Health & Ed. Facilities Auth. Rev.: | | | | |
(Dartmouth College Proj.) Series 2009, 5.25% 6/1/39 | | 4,000 | | 4,555 |
(Dartmouth-Hitchcock Obligated Group Proj.) Series 2010, 5% 8/1/40 | | 4,700 | | 5,052 |
New Hampshire Tpk. Sys. Rev.: | | | | |
Series 2012 B: | | | | |
5% 2/1/19 (b) | | 2,000 | | 2,322 |
5% 2/1/24 (b) | | 1,775 | | 2,043 |
5% 10/1/18 | | 4,315 | | 5,154 |
| | 29,136 |
New Jersey - 1.4% |
Garden State Preservation Trust Open Space & Farmland Preservation Series 2005 A, 5.8% 11/1/19 (Pre-Refunded to 11/1/15 @ 100) | | 5,100 | | 5,967 |
New Jersey Econ. Dev. Auth. School Facilities Construction Rev.: | | | | |
Series 2005 O: | | | | |
5.125% 3/1/28 | | 6,000 | | 6,429 |
5.125% 3/1/30 | | 5,000 | | 5,344 |
5.25% 3/1/21 (Nat'l. Pub. Fin. Guarantee Corp. Insured) | | 2,800 | | 3,099 |
5.25% 3/1/23 | | 4,500 | | 4,876 |
5.25% 3/1/25 | | 9,900 | | 10,706 |
5.25% 3/1/26 | | 11,305 | | 12,195 |
Series 2005 P, 5.125% 9/1/28 | | 2,445 | | 2,598 |
Municipal Bonds - continued |
| Principal Amount (000s) | | Value (000s) |
New Jersey - continued |
New Jersey Econ. Dev. Auth. School Facilities Construction Rev.: - continued | | | | |
Series 2009 AA, 5.5% 12/15/29 | | $ 4,000 | | $ 4,598 |
Series 2012, 5% 6/15/21 | | 4,600 | | 5,209 |
New Jersey Tpk. Auth. Tpk. Rev. Series 2009 E, 5.25% 1/1/40 | | 3,000 | | 3,367 |
New Jersey Trans. Trust Fund Auth.: | | | | |
Series 2001 A, 6% 6/15/35 | | 3,900 | | 4,676 |
Series B, 5.5% 12/15/21 (Nat'l. Pub. Fin. Guarantee Corp. Insured) | | 5,000 | | 6,137 |
North Hudson Swr. Auth. Wtr. & Swr. Rev. Series A: | | | | |
5.25% 8/1/18 (Pre-Refunded to 8/1/12 @ 100) | | 3,235 | | 3,247 |
5.25% 8/1/19 (Pre-Refunded to 8/1/12 @ 100) | | 2,735 | | 2,745 |
Union County Impt. Auth. (Juvenile Detention Ctr. Facility Proj.) Series 2005, 5.5% 5/1/28 (Nat'l. Pub. Fin. Guarantee Corp. Insured) | | 5,560 | | 5,862 |
| | 87,055 |
New Mexico - 0.2% |
Albuquerque Arpt. Rev. Series 1997, 6.75% 7/1/12 (AMBAC Insured) (f) | | 1,935 | | 1,935 |
New Mexico Edl. Assistance Foundation Series 2010 A1: | | | | |
4% 12/1/17 | | 5,000 | | 5,575 |
5% 12/1/18 | | 2,000 | | 2,334 |
| | 9,844 |
New York - 12.3% |
Albany Indl. Dev. Agcy. Civic Facility Rev. (St. Peters Hosp. Proj.) Series 2008 A: | | | | |
5.25% 11/15/16 | | 1,955 | | 2,272 |
5.25% 11/15/17 (St Peters Hosp. Insured) | | 1,500 | | 1,772 |
Erie County Indl. Dev. Agcy. School Facilities Rev. (Buffalo City School District Proj.) Series 2004: | | | | |
5.75% 5/1/16 (Pre-Refunded to 5/1/14 @ 100) | | 13,120 | | 14,416 |
5.75% 5/1/18 (Pre-Refunded to 5/1/14 @ 100) | | 14,720 | | 16,174 |
5.75% 5/1/20 (Pre-Refunded to 5/1/14 @ 100) | | 8,000 | | 8,790 |
5.75% 5/1/21 (Pre-Refunded to 5/1/14 @ 100) | | 3,845 | | 4,225 |
5.75% 5/1/22 (Pre-Refunded to 5/1/14 @ 100) | | 1,000 | | 1,099 |
5.75% 5/1/23 (Pre-Refunded to 5/1/14 @ 100) | | 3,000 | | 3,296 |
5.75% 5/1/24 (Pre-Refunded to 5/1/14 @ 100) | | 3,000 | | 3,296 |
5.75% 5/1/25 (Pre-Refunded to 5/1/14 @ 100) | | 3,400 | | 3,736 |
5.75% 5/1/26 (Pre-Refunded to 5/1/14 @ 100) | | 5,200 | | 5,714 |
Municipal Bonds - continued |
| Principal Amount (000s) | | Value (000s) |
New York - continued |
Hudson Yards Infrastructure Corp. New York Rev.: | | | | |
Series 2012 A, 5.75% 2/15/47 | | $ 14,600 | | $ 16,766 |
Series A: | | | | |
5% 2/15/47 | | 14,500 | | 15,123 |
5% 2/15/47 | | 13,100 | | 13,663 |
Long Island Pwr. Auth. Elec. Sys. Rev. Series 2012 A, 5% 9/1/42 (b) | | 13,000 | | 14,110 |
Metropolitan Trans. Auth. Svc. Contract Rev.: | | | | |
Series 2002 A, 5.75% 7/1/31 | | 3,800 | | 3,800 |
Series 2002 B, 5.5% 7/1/19 (Nat'l. Pub. Fin. Guarantee Corp. Insured) | | 2,000 | | 2,000 |
New York City Gen. Oblig.: | | | | |
Series 2003 A: | | | | |
5.5% 8/1/20 (Nat'l. Pub. Fin. Guarantee Corp. Insured) | | 6,990 | | 7,345 |
5.5% 8/1/20 (Pre-Refunded to 8/1/13 @ 100) | | 50 | | 53 |
Series 2008 A1, 5.25% 8/15/27 | | 9,940 | | 11,401 |
Series 2008 D1, 5.125% 12/1/22 | | 5,000 | | 5,918 |
Series 2009 I-1, 5.625% 4/1/29 | | 3,600 | | 4,286 |
Series 2012 F, 5% 8/1/24 | | 32,525 | | 38,707 |
Series 2012 G1, 5% 4/1/27 | | 19,380 | | 22,667 |
New York City Indl. Dev. Agcy. Civic Facility Rev. (Polytechnic Univ. NY Proj.) 5.25% 11/1/27 (ACA Finl. Guaranty Corp. Insured) | | 3,100 | | 3,318 |
New York City Indl. Dev. Agcy. Rev.: | | | | |
(Queens Baseball Stadium Proj.) 5% 1/1/19 (AMBAC Insured) | | 3,735 | | 3,952 |
(Yankee Stadium Proj.) Series 2006, 5% 3/1/31 | | 4,725 | | 4,906 |
New York City Muni. Wtr. Fin. Auth. Wtr. & Swr. Sys. Rev.: | | | | |
Series 2002 A: | | | | |
5.125% 6/15/34 | | 600 | | 602 |
5.125% 6/15/34 (Nat'l. Pub. Fin. Guarantee Corp. Insured) | | 1,960 | | 1,967 |
Series 2003 E, 5% 6/15/34 | | 11,120 | | 11,549 |
Series 2007 DD, 4.75% 6/15/36 | | 2,900 | | 3,079 |
Series 2009 A, 5.75% 6/15/40 | | 1,500 | | 1,804 |
Series 2009 C, 5% 6/15/44 | | 5,675 | | 6,297 |
Series 2009 EE, 5.25% 6/15/40 | | 11,600 | | 12,993 |
Series 2009 FF 2, 5.5% 6/15/40 | | 17,800 | | 20,212 |
Series 2011 EE, 5.375% 6/15/43 | | 42,080 | | 48,235 |
Series 2012 AA, 5% 6/15/44 | | 11,900 | | 13,145 |
Municipal Bonds - continued |
| Principal Amount (000s) | | Value (000s) |
New York - continued |
New York City Muni. Wtr. Fin. Auth. Wtr. & Swr. Sys. Rev.: - continued | | | | |
Series 2012 CC, 5% 6/15/45 | | $ 11,100 | | $ 12,316 |
Series 2012 EE, 5.25% 6/15/30 | | 28,100 | | 33,368 |
Series GG, 5% 6/15/43 | | 12,340 | | 13,631 |
New York City Transitional Fin. Auth. Bldg. Aid Rev.: | | | | |
Series 2009 S1: | | | | |
5.5% 7/15/31 | | 4,000 | | 4,567 |
5.5% 7/15/38 | | 1,600 | | 1,807 |
5.625% 7/15/38 | | 2,825 | | 3,209 |
Series 2009 S3: | | | | |
5.25% 1/15/34 | | 24,000 | | 26,698 |
5.25% 1/15/39 | | 3,400 | | 3,757 |
5.375% 1/15/34 | | 2,750 | | 3,079 |
Series 2009 S4: | | | | |
5.5% 1/15/39 | | 8,800 | | 10,017 |
5.75% 1/15/39 | | 4,100 | | 4,727 |
Series 2011 S2 A, 5% 7/15/40 | | 17,200 | | 18,903 |
New York City Transitional Fin. Auth. Rev.: | | | | |
Series 2004 B: | | | | |
5% 8/1/32 | | 14,700 | | 15,151 |
5% 8/1/32 (Pre-Refunded to 8/1/13 @ 100) | | 15 | | 16 |
Series 2004 C, 5% 2/1/33 (Nat'l. Pub. Fin. Guarantee Corp. Insured) | | 5,000 | | 5,233 |
5% 2/1/31 | | 3,410 | | 3,472 |
5% 2/1/31 (Pre-Refunded to 2/1/13 @ 100) | | 90 | | 92 |
5.25% 8/1/19 (Pre-Refunded to 8/1/13 @ 100) | | 1,880 | | 1,980 |
New York Dorm. Auth. Mental Health Svcs. Facilities Impt. Rev.: | | | | |
(State Univ. Proj.) Series 2012 A: | | | | |
5% 5/15/21 | | 10,710 | | 13,131 |
5% 5/15/22 | | 4,300 | | 5,310 |
Series 2012 A: | | | | |
4% 5/15/21 | | 3,500 | | 3,996 |
5% 5/15/23 | | 5,600 | | 6,828 |
New York Dorm. Auth. Personal Income Tax Rev.: | | | | |
(Ed. Proj.) Series 2008 B, 5.75% 3/15/36 | | 3,400 | | 3,979 |
Series 2009 A, 5% 2/15/39 | | 4,000 | | 4,416 |
New York Dorm. Auth. Revs.: | | | | |
(City Univ. Sys. Consolidation Proj.) Series A, 5.75% 7/1/13 | | 4,945 | | 5,056 |
Municipal Bonds - continued |
| Principal Amount (000s) | | Value (000s) |
New York - continued |
New York Dorm. Auth. Revs.: - continued | | | | |
(New York Univ. Hosp. Ctr. Proj.): | | | | |
Series 2006 A: | | | | |
5% 7/1/15 | | $ 3,000 | | $ 3,368 |
5% 7/1/16 | | 1,400 | | 1,613 |
Series 2007 A, 5% 7/1/14 | | 1,895 | | 2,056 |
Series 2007 B, 5.25% 7/1/24 | | 2,100 | | 2,349 |
(State Univ. Edl. Facilities Proj.) Series A: | | | | |
5.25% 5/15/15 (Nat'l. Pub. Fin. Guarantee Corp. Insured) | | 12,400 | | 13,524 |
5.875% 5/15/17 (Nat'l. Pub. Fin. Guarantee Corp. Insured) | | 6,865 | | 8,147 |
(Suffolk County Judicial Facilities Proj.) Series A, 9.5% 4/15/14 (Escrowed to Maturity) | | 690 | | 754 |
Series 2002 A, 5.75% 10/1/17 (Nat'l. Pub. Fin. Guarantee Corp. Insured) | | 3,000 | | 3,036 |
Series 2010 A, 5% 7/1/26 | | 4,000 | | 4,363 |
New York Metropolitan Trans. Auth. Dedicated Tax Fund Rev. Series 2009 B, 5% 11/15/34 | | 11,800 | | 13,004 |
New York Metropolitan Trans. Auth. Rev.: | | | | |
Series 2008 A, 5.25% 11/15/36 | | 26,700 | | 28,721 |
Series 2010 D, 5.25% 11/15/40 | | 6,600 | | 7,330 |
Series 2012 D, 5% 11/15/25 (b) | | 25,900 | | 29,770 |
New York Sales Tax Asset Receivables Corp. Series 2005 A, 5.25% 10/15/27 (AMBAC Insured) | | 10,500 | | 11,545 |
New York Thruway Auth. Gen. Rev. Series 2005 G: | | | | |
5% 1/1/32 (FSA Insured) | | 2,900 | | 3,148 |
5.25% 1/1/27 | | 12,500 | | 13,815 |
New York Thruway Auth. Personal Income Tax Rev. Series 2007 A, 5.25% 3/15/25 | | 3,500 | | 4,089 |
Niagara Falls City Niagara County Pub. Impt. 7.5% 3/1/18 (Nat'l. Pub. Fin. Guarantee Corp. Insured) | | 460 | | 571 |
Tobacco Settlement Asset Securitization Corp. Series 2002-1, 5.5% 7/15/24 (Pre-Refunded to 7/15/12 @ 100) | | 6,075 | | 6,084 |
Tobacco Settlement Fing. Corp.: | | | | |
Series 2003 A1: | | | | |
5.25% 6/1/21 (AMBAC Insured) | | 5,645 | | 5,881 |
5.25% 6/1/22 (AMBAC Insured) | | 9,850 | | 10,252 |
5.5% 6/1/18 (Nat'l. Pub. Fin. Guarantee Corp. Insured) | | 170 | | 171 |
5.5% 6/1/19 | | 4,050 | | 4,243 |
Series 2003 B, 5.5% 6/1/18 | | 2,225 | | 2,233 |
Municipal Bonds - continued |
| Principal Amount (000s) | | Value (000s) |
New York - continued |
Tobacco Settlement Fing. Corp.: - continued | | | | |
Series 2003B 1C: | | | | |
5.5% 6/1/19 | | $ 10,800 | | $ 11,314 |
5.5% 6/1/20 | | 2,700 | | 2,827 |
5.5% 6/1/20 (Nat'l. Pub. Fin. Guarantee Corp. Insured) | | 5,050 | | 5,288 |
5.5% 6/1/22 | | 10,065 | | 10,527 |
Series 2011: | | | | |
5% 6/1/17 | | 11,700 | | 13,818 |
5% 6/1/17 | | 10,700 | | 12,637 |
| | 793,905 |
New York & New Jersey - 0.2% |
Port Auth. of New York & New Jersey 124th Series, 5% 8/1/13 (Nat'l. Pub. Fin. Guarantee Corp. Insured) (f) | | 3,400 | | 3,411 |
Port Auth. of New York & New Jersey Spl. Oblig. Rev. (JFK Int'l. Air Term. Spl. Proj.) Series 6, 6.25% 12/1/13 (Nat'l. Pub. Fin. Guarantee Corp. Insured) (f) | | 10,275 | | 10,824 |
| | 14,235 |
Non State Specific - 0.1% |
Washington DC Metropolitan Transit Auth. Rev. Series 2009 A: | | | | |
5.125% 7/1/32 | | 1,000 | | 1,116 |
5.25% 7/1/27 | | 4,390 | | 5,053 |
5.25% 7/1/28 | | 3,000 | | 3,437 |
| | 9,606 |
North Carolina - 1.0% |
Catawba County Ctfs. of Prtn. (Pub. School and Cmnty. College Proj.) 5.25% 6/1/20 (Pre-Refunded to 6/1/14 @ 100) | | 1,800 | | 1,967 |
Charlotte Int'l. Arpt. Rev. (Charlotte Douglas Int'l. Arpt. Proj.) Series 2010 B, 5.5% 7/1/23 (f) | | 1,200 | | 1,413 |
Charlotte-Mecklenburg Hosp. Auth. Health Care Sys. Rev. Series A, 5% 1/15/20 (FSA Insured) | | 960 | | 1,064 |
Dare County Ctfs. of Prtn.: | | | | |
5.25% 6/1/17 (AMBAC Insured) | | 1,620 | | 1,745 |
5.25% 6/1/18 (AMBAC Insured) | | 1,620 | | 1,740 |
5.25% 6/1/19 (AMBAC Insured) | | 1,540 | | 1,649 |
5.25% 6/1/22 (AMBAC Insured) | | 1,620 | | 1,721 |
5.25% 6/1/23 (AMBAC Insured) | | 1,620 | | 1,716 |
Municipal Bonds - continued |
| Principal Amount (000s) | | Value (000s) |
North Carolina - continued |
Nash Health Care Sys. Health Care Facilities Rev. Series 2012, 5% 11/1/41 | | $ 3,610 | | $ 3,796 |
North Carolina Ctfs. of Prtn. (Repair and Renovation Proj.) Series 2004 B, 5.25% 6/1/17 (Pre-Refunded to 6/1/14 @ 100) | | 3,600 | | 3,933 |
North Carolina Eastern Muni. Pwr. Agcy. Pwr. Sys. Rev. Series 2009 B, 5% 1/1/26 | | 11,300 | | 12,567 |
North Carolina Infrastructure Fin. Corp. Ctfs. of Prtn. (North Carolina Correctional Facilities Proj.) Series A: | | | | |
5% 2/1/19 (Pre-Refunded to 2/1/14 @ 100) | | 2,945 | | 3,160 |
5% 2/1/20 (Pre-Refunded to 2/1/14 @ 100) | | 1,500 | | 1,610 |
North Carolina Med. Care Cmnty. Health (Memorial Mission Hosp. Proj.): | | | | |
Series 2007, 5% 10/1/20 | | 1,225 | | 1,400 |
5% 10/1/21 | | 5,690 | | 6,471 |
North Carolina Med. Care Commission Health Care Facilities Rev. (Rex Healthcare Proj.) Series 2010 A, 5% 7/1/30 | | 7,830 | | 8,439 |
North Carolina Muni. Pwr. Agcy. #1 Catawba Elec. Rev.: | | | | |
Series 2009 A, 5% 1/1/30 | | 2,300 | | 2,527 |
Series 2010 B, 5% 1/1/20 | | 6,700 | | 8,066 |
| | 64,984 |
North Dakota - 0.3% |
Cass County Health Care Facilities Rev. (Essentia Health Obligated Group Proj.) Series 2008, 5.125% 2/15/37 (Assured Guaranty Corp. Insured) | | 4,600 | | 4,924 |
Fargo Health Sys. Rev. (Sanford Proj.) Series 2011, 6% 11/1/28 | | 1,500 | | 1,778 |
Grand Forks Health Care Sys. Rev. (Altru Health Sys. Proj.): | | | | |
5% 12/1/12 (Assured Guaranty Corp. Insured) | | 1,475 | | 1,499 |
5% 12/1/14 (Assured Guaranty Corp. Insured) | | 1,675 | | 1,820 |
Mercer County Poll. Cont. Rev. (Antelope Valley Station/Basin Elec. Pwr. Coop. Proj.) 7.2% 6/30/13 (AMBAC Insured) | | 3,625 | | 3,675 |
Ward County Health Care Facility Rev. (Trinity Med. Ctr. Proj.): | | | | |
5.125% 7/1/19 | | 2,765 | | 2,955 |
5.25% 7/1/15 | | 1,300 | | 1,429 |
| | 18,080 |
Municipal Bonds - continued |
| Principal Amount (000s) | | Value (000s) |
Ohio - 0.6% |
Buckeye Tobacco Settlement Fing. Auth. Series 2007 A1: | | | | |
5% 6/1/16 | | $ 4,400 | | $ 4,709 |
5% 6/1/17 | | 5,045 | | 5,411 |
Cleveland Parking Facilities Rev.: | | | | |
5.25% 9/15/18 (Escrowed to Maturity) | | 640 | | 799 |
5.25% 9/15/18 (FSA Insured) | | 1,360 | | 1,581 |
Franklin County Hosp. Rev. (Nationwide Children's Hosp. Proj.) Series 2009, 5.25% 11/1/40 | | 1,500 | | 1,649 |
Lake County Hosp. Facilities Rev. (Lake Hosp. Sys., Inc. Proj.) Series 2008 C, 6% 8/15/43 | | 5,000 | | 5,339 |
Lucas County Hosp. Rev. (ProMedica Heathcare Oblig. Group Proj.) Series 2011 A, 6.5% 11/15/37 | | 6,000 | | 7,319 |
Ohio Higher Edl. Facility Commission Rev. (Cleveland Clinic Foundation Proj.) Series 2008 A, 5.5% 1/1/43 | | 1,500 | | 1,639 |
Ohio Wtr. Dev. Auth. Poll. Cont. Facilities Rev. Bonds (FirstEnergy Corp. Proj.) Series 2009 A, 5.875%, tender 6/1/16 (c) | | 8,500 | | 9,568 |
| | 38,014 |
Oklahoma - 0.3% |
Oklahoma City Pub. Property Auth. Hotel Tax Rev.: | | | | |
5.5% 10/1/22 (Nat'l. Pub. Fin. Guarantee Corp. Insured) | | 2,845 | | 3,171 |
5.5% 10/1/23 (Nat'l. Pub. Fin. Guarantee Corp. Insured) | | 3,005 | | 3,340 |
5.5% 10/1/24 (Nat'l. Pub. Fin. Guarantee Corp. Insured) | | 3,175 | | 3,523 |
Oklahoma City Wtr. Utils. Trust Wtr. and Swr. Rev. Series 2009 A, 5% 7/1/34 | | 1,000 | | 1,133 |
Oklahoma Dev. Fin. Auth. Health Sys. Rev. (Integris Baptist Med. Ctr. Proj.) Series C, 5.5% 8/15/20 | | 5,000 | | 5,935 |
Tulsa County Indl. Auth. Health Care Rev. 5% 12/15/19 | | 1,680 | | 1,923 |
| | 19,025 |
Oregon - 0.4% |
Clackamas County School District #62C, Oregon City Series 2004, 5% 6/15/19 (FSA Insured) | | 3,395 | | 3,657 |
Clackamas County School District #7J: | | | | |
5.25% 6/1/23 | | 2,000 | | 2,537 |
5.25% 6/1/24 (FSA Insured) | | 2,605 | | 3,314 |
Multnomah County Hosp. Facilities Auth. Rev. (Adventist Health Sys./West Proj.) Series 2009 A, 5.125% 9/1/40 | | 2,500 | | 2,656 |
Municipal Bonds - continued |
| Principal Amount (000s) | | Value (000s) |
Oregon - continued |
Oregon Facilities Auth. Rev. (Legacy Health Sys. Proj.) Series 2009 A, 5% 3/15/30 | | $ 1,000 | | $ 1,064 |
Oregon State Dept. of Administrative Svcs. Lottery Rev. Series 2011 A, 5.25% 4/1/31 | | 5,600 | | 6,576 |
Port Morrow Poll. Cont. Rev. (Portland Gen. Elec. Co. Proj.) Series 1998 A, 5% 5/1/33 | | 5,000 | | 5,506 |
Washington County School District #15: | | | | |
5.5% 6/15/20 (FSA Insured) | | 1,770 | | 2,241 |
5.5% 6/15/21 (FSA Insured) | | 1,060 | | 1,359 |
| | 28,910 |
Pennsylvania - 1.4% |
Allegheny County Arpt. Auth. Rev. (Pittsburg Int'l. Arpt. Proj.) Series B, 5% 1/1/16 (Nat'l. Pub. Fin. Guarantee Corp. Insured) (f) | | 3,000 | | 3,251 |
Allegheny County Hosp. Dev. Auth. Rev.: | | | | |
(Pittsburgh Med. Ctr. Proj.) Series B, 5% 6/15/16 | | 1,365 | | 1,567 |
(Univ. of Pittsburgh Med. Ctr. Proj.) Series 2009 A, 5.625% 8/15/39 | | 6,225 | | 6,874 |
Annville-Cleona School District Series 2005: | | | | |
5.5% 3/1/24 (FSA Insured) | | 1,350 | | 1,468 |
5.5% 3/1/25 (FSA Insured) | | 1,400 | | 1,517 |
Easton Area School District Series 2006: | | | | |
7.75% 4/1/25 (FSA Insured) | | 2,180 | | 2,650 |
7.75% 4/1/25 (FSA Insured) (Pre-Refunded to 4/1/16 @ 100) | | 2,620 | | 3,313 |
Mifflin County School District Series 2007, 7.75% 9/1/30 (XL Cap. Assurance, Inc. Insured) | | 3,400 | | 4,153 |
Montgomery County Higher Ed. & Health Auth. Hosp. Rev. (Abington Memorial Hosp. Proj.): | | | | |
Series 1993 A, 6% 6/1/22 (AMBAC Insured) | | 2,000 | | 2,404 |
Series A, 6.125% 6/1/14 (AMBAC Insured) | | 5,230 | | 5,701 |
Pennsylvania Convention Ctr. Auth. Rev. Series A, 6.7% 9/1/16 (Escrowed to Maturity) | | 1,370 | | 1,550 |
Pennsylvania Higher Edl. Facilities Auth. Rev.: | | | | |
(The Univ. of Pennsylvania Health Sys. Proj.) Series 2009 A, 5.25% 8/15/21 | | 2,900 | | 3,406 |
(Univ. of Pennsylvania Health Sys. Proj.) Series A, 5% 8/15/16 | | 3,600 | | 4,034 |
Pennsylvania Tpk. Commission Tpk. Rev. Series 2009 D, 5.5% 12/1/41 | | 12,600 | | 13,809 |
Municipal Bonds - continued |
| Principal Amount (000s) | | Value (000s) |
Pennsylvania - continued |
Philadelphia Gas Works Rev.: | | | | |
(1975 Gen. Ordinance Proj.) Seventeenth Series, 5.375% 7/1/20 (FSA Insured) | | $ 4,000 | | $ 4,104 |
(1998 Gen. Ordinance Proj.): | | | | |
Fifth Series A1, 5% 9/1/33 (FSA Insured) | | 1,095 | | 1,114 |
Ninth Series, 5.25% 8/1/40 | | 3,750 | | 3,941 |
Seventh Series, 5% 10/1/37 (AMBAC Insured) | | 8,900 | | 9,155 |
Philadelphia Gen. Oblig.: | | | | |
Series 2008 A, 5.25% 12/15/32 (FSA Insured) | | 2,500 | | 2,734 |
Series 2008 B, 7.125% 7/15/38 (Assured Guaranty Corp. Insured) | | 3,200 | | 3,644 |
Philadelphia Redev. Auth. Rev. (Philadelphia Neighborhood Transformation Initiative Proj.) Series 2005 C, 5% 4/15/31 (Nat'l. Pub. Fin. Guarantee Corp. Insured) | | 3,000 | | 3,099 |
Philadelphia School District Series 2005 A, 5% 8/1/22 (AMBAC Insured) | | 1,675 | | 1,775 |
Southeastern Pennsylvania Trans. Auth. Rev. Series 2011: | | | | |
5% 6/1/22 | | 1,000 | | 1,182 |
5% 6/1/23 | | 2,500 | | 2,920 |
| | 89,365 |
Puerto Rico - 0.9% |
Puerto Rico Commonwealth Hwy. & Trans. Auth. Trans. Rev.: | | | | |
Series 1998, 5.75% 7/1/22 (CIFG North America Insured) | | 2,300 | | 2,374 |
Series 2003, 5.75% 7/1/19 (FGIC Insured) | | 3,240 | | 3,371 |
Puerto Rico Commonwealth Infrastructure Fing. Auth. Series C, 5.5% 7/1/21 | | 3,000 | | 3,366 |
Puerto Rico Govt. Dev. Bank: | | | | |
Series 2006 B, 5% 12/1/12 | | 5,000 | | 5,085 |
Series 2006 C, 5.25% 1/1/15 (f) | | 5,000 | | 5,295 |
Puerto Rico Pub. Bldg. Auth. Rev.: | | | | |
Bonds Series M2: | | | | |
5.5%, tender 7/1/17 (AMBAC Insured) (c) | | 4,600 | | 5,022 |
5.75%, tender 7/1/17 (c) | | 8,500 | | 9,377 |
Series N: | | | | |
5.5% 7/1/21 | | 5,000 | | 5,388 |
5.5% 7/1/22 | | 3,250 | | 3,496 |
Municipal Bonds - continued |
| Principal Amount (000s) | | Value (000s) |
Puerto Rico - continued |
Puerto Rico Sales Tax Fing. Corp. Sales Tax Rev.: | | | | |
Series 2007 A, 0% 8/1/41 (Nat'l. Pub. Fin. Guarantee Corp. Insured) | | $ 20,300 | | $ 3,951 |
Series 2009 A, 6% 8/1/42 | | 7,600 | | 8,469 |
Series A, 0% 8/1/54 (AMBAC Insured) | | 6,000 | | 511 |
| | 55,705 |
Rhode Island - 0.1% |
Rhode Island Health & Edl. Bldg. Corp. Higher Ed. Facilities Rev. (Univ. of Rhode Island Univ. Revs. Proj.): | | | | |
Series 2004 A, 5.5% 9/15/24 (AMBAC Insured) | | 3,400 | | 3,627 |
Series A: | | | | |
5.25% 9/15/15 (AMBAC Insured) | | 1,725 | | 1,880 |
5.25% 9/15/16 (AMBAC Insured) | | 1,815 | | 1,976 |
5.25% 9/15/18 (AMBAC Insured) | | 1,005 | | 1,083 |
| | 8,566 |
South Carolina - 1.7% |
Greenwood Fifty School Facilities Installment: | | | | |
5% 12/1/18 (Assured Guaranty Corp. Insured) | | 3,930 | | 4,454 |
5% 12/1/19 (Assured Guaranty Corp. Insured) | | 2,375 | | 2,675 |
Lexington County Health Svcs. District, Inc. Hosp. Rev.: | | | | |
5% 11/1/18 | | 1,090 | | 1,248 |
5% 11/1/19 | | 1,000 | | 1,131 |
Lexington One School Facilities Corp. Rev. (Lexington County School District No. 1 Proj.) 5.25% 12/1/18 | | 1,540 | | 1,748 |
Richland County Hosp. Facilities Rev. (Cmnty. Provider Pooled Ln. Prog.) Series A, 7.125% 7/1/17 (Escrowed to Maturity) | | 705 | | 788 |
Rock Hill Util. Sys. Rev. Series 2003 A: | | | | |
5.375% 1/1/17 (FSA Insured) | | 1,380 | | 1,411 |
5.375% 1/1/17 (Pre-Refunded to 1/1/13 @ 100) | | 720 | | 738 |
5.375% 1/1/23 (Pre-Refunded to 1/1/13 @ 100) | | 1,025 | | 1,051 |
South Carolina Jobs-Econ. Dev. Auth. Health Facilities Rev. (Bishop Gadsden Proj.): | | | | |
5% 4/1/15 | | 1,000 | | 1,075 |
5% 4/1/24 | | 4,000 | | 4,148 |
South Carolina Pub. Svc. Auth. (Santee Cooper) Rev. Oblig.: | | | | |
Series 2012 B: | | | | |
5% 12/1/18 | | 5,000 | | 6,055 |
5% 12/1/20 | | 1,500 | | 1,852 |
Municipal Bonds - continued |
| Principal Amount (000s) | | Value (000s) |
South Carolina - continued |
South Carolina Pub. Svc. Auth. (Santee Cooper) Rev. Oblig.: - continued | | | | |
Series 2012 C: | | | | |
5% 12/1/14 (b) | | $ 1,000 | | $ 1,087 |
5% 12/1/14 | | 2,000 | | 2,211 |
5% 12/1/16 (b) | | 5,065 | | 5,832 |
5% 12/1/16 | | 2,000 | | 2,340 |
5% 12/1/19 (b) | | 13,990 | | 16,781 |
Series 2012 D, 5% 12/1/43 | | 18,250 | | 20,202 |
South Carolina Pub. Svc. Auth. Rev.: | | | | |
(Santee Cooper Proj.) Series 2009 B: | | | | |
5.25% 1/1/34 | | 6,000 | | 6,802 |
5.25% 1/1/39 | | 2,800 | | 3,148 |
Series 2004 A, 5% 1/1/39 | | 7,600 | | 7,892 |
Series 2005 B, 5% 1/1/19 (Nat'l. Pub. Fin. Guarantee Corp. Insured) | | 2,500 | | 2,839 |
Series A, 5% 1/1/36 (Nat'l. Pub. Fin. Guarantee Corp. Insured) | | 5,000 | | 5,433 |
Univ. of South Carolina Athletic Facilities Rev. Series 2008 A, 5.5% 5/1/38 | | 6,900 | | 7,783 |
York County Wtr. & Swr. Rev. 5.25% 12/1/30 (Nat'l. Pub. Fin. Guarantee Corp. Insured) | | 1,120 | | 1,134 |
| | 111,858 |
South Dakota - 0.1% |
South Dakota Health & Edl. Facilities Auth. Rev. (Reg'l. Health Proj.) Series 2010: | | | | |
4.625% 9/1/27 | | 1,000 | | 1,039 |
5% 9/1/28 | | 3,000 | | 3,188 |
South Dakota Lease Rev. Series A, 6.625% 9/1/12 (FSA Insured) | | 270 | | 273 |
| | 4,500 |
Tennessee - 0.6% |
Clarksville Natural Gas Acquisition Corp. Gas Rev.: | | | | |
Series 2006, 5% 12/15/13 | | 8,000 | | 8,395 |
5% 12/15/12 | | 4,500 | | 4,586 |
5% 12/15/14 | | 3,870 | | 4,070 |
Jackson Hosp. Rev. (Jackson-Madison County Gen. Hosp. Proj.) Series 2008, 5.75% 4/1/41 | | 6,600 | | 7,286 |
Knox County Health Edl. & Hsg. Facilities Board Rev. (Univ. Health Sys. Proj.) 5% 4/1/15 | | 5,245 | | 5,743 |
Municipal Bonds - continued |
| Principal Amount (000s) | | Value (000s) |
Tennessee - continued |
Memphis-Shelby County Arpt. Auth. Arpt. Rev. Series 2010 B: | | | | |
5.75% 7/1/23 (f) | | $ 5,820 | | $ 6,752 |
5.75% 7/1/24 (f) | | 2,400 | | 2,754 |
| | 39,586 |
Texas - 10.6% |
Aledo Independent School District (School Bldg. Proj.) Series 2006 A, 5% 2/15/43 | | 6,800 | | 7,431 |
Argyle Independent School District Series 2005, 5.25% 8/15/40 (FSA Insured) | | 1,745 | | 1,817 |
Austin Cmnty. College District Pub. Facilities Lease Rev. (Round Rock Campus Proj.) Series 2008, 5.25% 8/1/33 | | 5,000 | | 5,527 |
Austin Cmnty. College District Rev. (Convention Ctr. Proj.) Series 2002, 0% 2/1/22 (AMBAC Insured) | | 2,900 | | 2,210 |
Austin Elec. Util. Sys. Rev.: | | | | |
0% 5/15/17 (Nat'l. Pub. Fin. Guarantee Corp. Insured) | | 9,200 | | 8,280 |
0% 5/15/18 (Nat'l. Pub. Fin. Guarantee Corp. Insured) | | 5,000 | | 4,340 |
Austin Wtr. & Wastewtr. Sys. Rev.: | | | | |
Series 2004 A, 5% 11/15/27 (AMBAC Insured) | | 1,780 | | 1,944 |
Series 2005 A, 5% 5/15/31 (AMBAC Insured) | | 4,690 | | 5,126 |
Bastrop Independent School District Series 2007: | | | | |
5.25% 2/15/37 | | 2,700 | | 2,985 |
5.25% 2/15/42 | | 5,000 | | 5,515 |
Beaumont Independent School District 5% 2/15/38 (Assured Guaranty Corp. Insured) | | 1,450 | | 1,599 |
Bexar Metropolitan Wtr. District Wtrwks. Sys. Rev. 5.375% 5/1/20 (FSA Insured) | | 220 | | 221 |
Boerne Independent School District Series 2004, 5.25% 2/1/35 (Pre-Refunded to 2/1/13 @ 100) | | 5,100 | | 5,248 |
Canyon Reg'l. Wtr. Auth. Contract Rev. (Wells Ranch Proj.): | | | | |
5% 8/1/19 (AMBAC Insured) | | 1,695 | | 1,909 |
5% 8/1/20 (AMBAC Insured) | | 1,780 | | 1,977 |
Clint Independent School District 5.5% 8/15/20
(Pre-Refunded to 8/15/12 @ 100) | | 210 | | 211 |
Coppell Independent School District 0% 8/15/20 | | 2,000 | | 1,686 |
Corpus Christi Util. Sys. Rev.: | | | | |
5.25% 7/15/18 (FSA Insured) | | 3,305 | | 3,915 |
5.25% 7/15/19 (FSA Insured) | | 4,000 | | 4,681 |
Municipal Bonds - continued |
| Principal Amount (000s) | | Value (000s) |
Texas - continued |
Cypress-Fairbanks Independent School District Series A, 0% 2/15/16 | | $ 9,700 | | $ 9,404 |
Dallas Area Rapid Transit Sales Tax Rev. Series 2008, 5.25% 12/1/38 | | 21,000 | | 23,219 |
Dallas Fort Worth Int'l. Arpt. Rev.: | | | | |
Series 2009 A, 5% 11/1/23 | | 1,250 | | 1,391 |
Series A: | | | | |
5% 11/1/42 | | 14,800 | | 15,979 |
5.25% 11/1/12 (f) | | 5,820 | | 5,911 |
5% 11/1/13 (XL Cap. Assurance, Inc. Insured) (f) | | 2,665 | | 2,817 |
5% 11/1/14 (XL Cap. Assurance, Inc. Insured) (f) | | 2,625 | | 2,851 |
5% 11/1/17 (XL Cap. Assurance, Inc. Insured) (f) | | 4,325 | | 4,656 |
Dallas Independent School District Series 2008, 6.375% 2/15/34 | | 1,800 | | 2,218 |
Del Mar College District 5.25% 8/15/20 (Pre-Refunded to 8/15/13 @ 100) | | 2,960 | | 3,124 |
DeSoto Independent School District 0% 8/15/20 | | 3,335 | | 2,811 |
Duncanville Independent School District 5.65% 2/15/28 | | 30 | | 31 |
Freer Independent School District Series 2007, 5.25% 8/15/37 | | 4,215 | | 4,712 |
Gainesville Independent School District Series 2006, 5.25% 2/15/36 | | 1,900 | | 2,097 |
Garland Wtr. & Swr. Rev. 5.25% 3/1/23 (AMBAC Insured) | | 1,315 | | 1,402 |
Grand Prairie Independent School District 0% 2/15/16 | | 3,775 | | 3,660 |
Guadalupe-Blanco River Auth. Contract Rev. (Western Canyon Reg'l. Wtr. Supply Proj.): | | | | |
5.25% 4/15/15 (Nat'l. Pub. Fin. Guarantee Corp. Insured) | | 1,570 | | 1,624 |
5.25% 4/15/16 (Nat'l. Pub. Fin. Guarantee Corp. Insured) | | 1,680 | | 1,737 |
5.25% 4/15/17 (Nat'l. Pub. Fin. Guarantee Corp. Insured) | | 2,295 | | 2,371 |
5.25% 4/15/18 (Nat'l. Pub. Fin. Guarantee Corp. Insured) | | 1,915 | | 1,976 |
5.25% 4/15/19 (Nat'l. Pub. Fin. Guarantee Corp. Insured) | | 1,000 | | 1,031 |
5.25% 4/15/20 (Nat'l. Pub. Fin. Guarantee Corp. Insured) | | 1,565 | | 1,612 |
Gulf Coast Waste Disp. Auth. Solid Waste Disp. Rev. Bonds (Waste Mgmt. of Texas, Inc. Denton County Proj.) Series 2003 B, 3.5%, tender 5/1/13 (c)(f) | | 2,500 | | 2,551 |
Municipal Bonds - continued |
| Principal Amount (000s) | | Value (000s) |
Texas - continued |
Harris County Gen. Oblig.: | | | | |
(Permanent Impt. Proj.) Series 1996, 0% 10/1/14 (Nat'l. Pub. Fin. Guarantee Corp. Insured) | | $ 11,000 | | $ 10,800 |
(Road Proj.): | | | | |
Series 1996, 0% 10/1/13 (Nat'l. Pub. Fin. Guarantee Corp. Insured) | | 5,550 | | 5,506 |
Series 2008 B, 5.25% 8/15/47 | | 25,440 | | 27,636 |
Series 2002: | | | | |
0% 8/15/25 (Nat'l. Pub. Fin. Guarantee Corp. Insured) | | 3,000 | | 2,122 |
0% 8/15/28 (Nat'l. Pub. Fin. Guarantee Corp. Insured) | | 5,000 | | 3,124 |
5.25% 10/1/24 | | 1,700 | | 1,864 |
5.25% 10/1/24 (Pre-Refunded to 10/1/14 @ 100) | | 1,020 | | 1,128 |
Harris County Health Facilities Dev. Corp. Hosp. Rev. (Memorial Hermann Healthcare Sys. Proj.) Series 2008 B, 7.25% 12/1/35 | | 3,200 | | 3,941 |
Houston Arpt. Sys. Rev.: | | | | |
Series 2011 A: | | | | |
5% 7/1/23 (f) | | 3,000 | | 3,421 |
5% 7/1/25 (f) | | 1,500 | | 1,669 |
Series A: | | | | |
5.625% 7/1/20 (f) | | 2,000 | | 2,000 |
5.625% 7/1/21 (f) | | 3,350 | | 3,350 |
Houston Independent School District: | | | | |
Bonds Series 2012, 2.5%, tender 6/1/15 (c) | | 10,600 | | 11,082 |
Series 2005 A, 0% 2/15/16 | | 5,500 | | 5,332 |
0% 8/15/13 | | 9,835 | | 9,803 |
Humble Independent School District: | | | | |
Series 2000: | | | | |
0% 2/15/16 | | 3,000 | | 2,908 |
0% 2/15/17 | | 3,480 | | 3,302 |
Series 2005 B, 5.25% 2/15/22 (Nat'l. Pub. Fin. Guarantee Corp. Insured) | | 1,995 | | 2,200 |
Series 2009, 5% 2/15/34 | | 4,300 | | 4,834 |
Judson Independent School District Series 2005 B, 5% 2/1/22 (FSA Insured) | | 2,250 | | 2,363 |
Keller Independent School District Series 1996 A, 0% 8/15/17 | | 2,000 | | 1,880 |
Kermit Independent School District 5.25% 2/15/37 | | 4,130 | | 4,572 |
Kingsville Independent School District 5.25% 2/15/37 | | 3,650 | | 3,968 |
Liberty Hill Independent School District (School Bldg. Proj.) Series 2006, 5.25% 8/1/35 | | 8,615 | | 9,494 |
Municipal Bonds - continued |
| Principal Amount (000s) | | Value (000s) |
Texas - continued |
Little Elm Independent School District 5.5% 8/15/21 | | $ 60 | | $ 60 |
Lower Colorado River Auth. Rev.: | | | | |
Series 2, 5.25% 5/15/18 (AMBAC Insured) | | 1,775 | | 1,846 |
Series 2008, 5.75% 5/15/37 | | 6,640 | | 7,217 |
Series 2010, 5.25% 5/15/18 (Pre-Refunded to 5/15/13 @ 100) | | 80 | | 83 |
Series 2012-2, 5% 5/15/31 (AMBAC Insured) | | 925 | | 926 |
5.25% 5/15/18 (Pre-Refunded to 5/15/13 @ 100) | | 5 | | 5 |
5.25% 5/15/18 (Pre-Refunded to 5/15/13 @ 100) | | 10 | | 10 |
5.25% 5/15/18 (Pre-Refunded to 5/15/13 @ 100) | | 10 | | 10 |
Lower Colorado River Auth. Transmission Contract Rev. (LCRA Transmission Svcs. Corp. Proj.): | | | | |
Series 2003 C, 5% 5/15/33 | | 5,495 | | 5,563 |
Series C: | | | | |
5.25% 5/15/18 (Pre-Refunded to 5/15/13 @ 100) | | 1,000 | | 1,043 |
5.25% 5/15/19 (Pre-Refunded to 5/15/13 @ 100) | | 1,000 | | 1,043 |
5.25% 5/15/20 (Pre-Refunded to 5/15/13 @ 100) | | 2,000 | | 2,087 |
Mansfield Independent School District 5.5% 2/15/18 | | 40 | | 40 |
Midway Independent School District Series 2000, 0% 8/15/19 | | 3,600 | | 3,158 |
Navasota Independent School District: | | | | |
Series 2005, 5.25% 8/15/34 (Nat'l. Pub. Fin. Guarantee Corp. Insured) | | 2,275 | | 2,400 |
5.5% 8/15/25 (Nat'l. Pub. Fin. Guarantee Corp. Insured) | | 1,675 | | 1,800 |
New Caney Independent School District Series 2007 A, 5.25% 2/15/37 | | 2,680 | | 2,989 |
North Forest Independent School District Series B, 5% 8/15/18 (FSA Insured) | | 1,470 | | 1,654 |
North Texas Muni. Wtr. District Wtr. Sys. Rev. Series 2006, 5% 9/1/35 | | 4,000 | | 4,407 |
North Texas Tollway Auth. Dallas North Tollway Sys. Rev. Series 2003 A, 5% 1/1/28 (Pre-Refunded to 1/1/13 @ 100) | | 7,175 | | 7,342 |
North Texas Tollway Auth. Rev.: | | | | |
Bonds Series 2008 E3, 5.75%, tender 1/1/16 (c) | | 4,000 | | 4,596 |
Series 2008 A: | | | | |
6% 1/1/23 | | 4,800 | | 5,654 |
6% 1/1/24 | | 2,000 | | 2,334 |
Series 2008 I, 0% 1/1/42 (Assured Guaranty Corp. Insured) (a) | | 7,200 | | 7,290 |
Series 2009 A, 6.25% 1/1/39 | | 10,200 | | 11,531 |
Municipal Bonds - continued |
| Principal Amount (000s) | | Value (000s) |
Texas - continued |
North Texas Tollway Auth. Rev.: - continued | | | | |
Series 2011 A: | | | | |
5.5% 9/1/41 | | $ 3,950 | | $ 4,591 |
6% 9/1/41 | | 6,200 | | 7,513 |
Series 2011 D, 5% 9/1/28 | | 13,000 | | 14,955 |
Pflugerville Gen. Oblig. 5.5% 8/1/22 (Pre-Refunded to 8/1/13 @ 100) | | 1,000 | | 1,056 |
Prosper Independent School District: | | | | |
Series 2005, 5.125% 8/15/30 | | 3,110 | | 3,436 |
5.375% 8/15/37 | | 15,255 | | 17,339 |
5.75% 8/15/29 | | 280 | | 281 |
5.75% 8/15/29 (Pre-Refunded to 8/15/12 @ 100) | | 970 | | 976 |
Robstown Independent School District 5.25% 2/15/29 (Pre-Refunded to 2/15/14 @ 100) | | 3,165 | | 3,417 |
Rockdale Independent School District Series 2007, 5.25% 2/15/37 | | 5,100 | | 5,607 |
San Antonio Arpt. Sys. Rev.: | | | | |
5% 7/1/15 (FSA Insured) (f) | | 2,510 | | 2,781 |
5% 7/1/17 (FSA Insured) (f) | | 2,765 | | 3,118 |
5% 7/1/17 (FSA Insured) (f) | | 2,385 | | 2,677 |
5.25% 7/1/19 (FSA Insured) (f) | | 2,635 | | 2,932 |
5.25% 7/1/20 (FSA Insured) (f) | | 3,215 | | 3,556 |
5.25% 7/1/20 (FSA Insured) (f) | | 2,775 | | 3,056 |
San Antonio Elec. & Gas Sys. Rev. Series 2008, 5% 2/1/24 | | 2,590 | | 2,949 |
San Antonio Wtr. Sys. Rev. Series 2012: | | | | |
5% 5/15/24 | | 7,500 | | 9,181 |
5% 5/15/25 | | 10,000 | | 12,099 |
5% 5/15/27 | | 10,000 | | 11,960 |
San Jacinto Cmnty. College District Series 2009, 5% 2/15/39 | | 3,620 | | 3,976 |
Snyder Independent School District: | | | | |
5.25% 2/15/21 (AMBAC Insured) | | 1,035 | | 1,110 |
5.25% 2/15/22 (AMBAC Insured) | | 1,090 | | 1,165 |
5.25% 2/15/30 (AMBAC Insured) | | 1,800 | | 1,888 |
Southwest Higher Ed. Auth. Rev. (Southern Methodist Univ. Proj.) Series 2010, 5% 10/1/35 | | 1,700 | | 1,899 |
Spring Branch Independent School District Series 2008, 5.25% 2/1/38 | | 2,000 | | 2,271 |
Municipal Bonds - continued |
| Principal Amount (000s) | | Value (000s) |
Texas - continued |
Tarrant County Cultural Ed. Facilities Fin. Corp. Hosp. Rev.: | | | | |
(Baylor Health Care Sys. Proj.) Series 2009, 5.75% 11/15/24 | | $ 6,900 | | $ 8,087 |
(Hendrick Med. Ctr. Proj.) Series 2009 B: | | | | |
5.25% 9/1/26 (Assured Guaranty Corp. Insured) | | 1,785 | | 1,992 |
5.25% 9/1/27 (Assured Guaranty Corp. Insured) | | 2,375 | | 2,636 |
Texas Gen. Oblig.: | | | | |
(Trans. Commission Mobility Fund Proj.): | | | | |
Series 2005 A, 4.75% 4/1/35 | | 8,380 | | 8,952 |
Series 2008, 4.75% 4/1/37 | | 21,920 | | 23,687 |
Series 2006 A, 5% 4/1/29 | | 2,500 | | 2,862 |
Series 2008, 5% 4/1/25 | | 4,300 | | 5,039 |
5.75% 8/1/26 | | 3,320 | | 3,331 |
Texas Muni. Pwr. Agcy. Rev. 0% 9/1/16 (Nat'l. Pub. Fin. Guarantee Corp. Insured) | | 18,715 | | 17,683 |
Texas Private Activity Bond Surface Trans. Corp.: | | | | |
(LBJ Infrastructure Group LLC IH-635 Managed Lanes Proj.) Series 2010, 7% 6/30/40 | | 5,200 | | 6,214 |
(NTE Mobility Partners LLC North Tarrant Express Managed Lanes Proj.) Series 2009, 6.875% 12/31/39 | | 7,300 | | 8,595 |
Texas Pub. Fin. Auth. Bldg. Rev. Series 1990, 0% 2/1/14 (Nat'l. Pub. Fin. Guarantee Corp. Insured) | | 6,910 | | 6,714 |
Texas Tpk. Auth. Central Texas Tpk. Sys. Rev. Series 2002 A: | | | | |
5.5% 8/15/39 | | 37,550 | | 37,592 |
5.75% 8/15/38 (AMBAC Insured) | | 15,900 | | 15,931 |
Texas Trans. Commission State Hwy. Fund Rev. Series 2007: | | | | |
5% 4/1/23 | | 2,320 | | 2,669 |
5% 4/1/26 | | 4,300 | | 4,878 |
Texas Wtr. Dev. Board Rev.: | | | | |
Series B, 5.375% 7/15/16 | | 5,000 | | 5,014 |
5.625% 7/15/21 | | 1,315 | | 1,318 |
Trinity River Auth. Rev. (Tarrant County Wtr. Proj.) 5% 2/1/17 (Nat'l. Pub. Fin. Guarantee Corp. Insured) | | 4,930 | | 5,501 |
Tyler Health Facilities Dev. Corp. Hosp. Rev. (Mother Frances Hosp. Reg'l. Health Care Ctr. Proj.) 5.75% 7/1/27 (Pre-Refunded to 7/1/13 @ 100) | | 1,000 | | 1,054 |
Waller Independent School District 5.5% 2/15/37 | | 4,920 | | 5,470 |
Weatherford Independent School District 0% 2/15/33 | | 6,985 | | 3,222 |
Municipal Bonds - continued |
| Principal Amount (000s) | | Value (000s) |
Texas - continued |
White Settlement Independent School District: | | | | |
5.75% 8/15/30 (Pre-Refunded to 8/15/12 @ 100) | | $ 2,890 | | $ 2,908 |
5.75% 8/15/34 (Pre-Refunded to 8/15/12 @ 100) | | 2,860 | | 2,878 |
5.75% 8/15/34 (Pre-Refunded to 8/15/12 @ 100) | | 140 | | 141 |
Wylie Independent School District Series 2001, 0% 8/15/20 | | 1,790 | | 1,509 |
| | 680,860 |
Utah - 0.5% |
Intermountain Pwr. Agcy. Pwr. Supply Rev. Series A, 6% 7/1/16 (Escrowed to Maturity) | | 9,205 | | 9,236 |
Salt Lake City Hosp. Rev. (Intermountain Health Care Hosp., Inc. Proj.) Series A, 8.125% 5/15/15 (Escrowed to Maturity) | | 1,070 | | 1,197 |
Utah Associated Muni. Pwr. Sys. Rev. (Payson Pwr. Proj.) Series A: | | | | |
5.25% 4/1/16 (Pre-Refunded to 4/1/13 @ 100) | | 3,590 | | 3,723 |
5.25% 4/1/17 (Pre-Refunded to 4/1/13 @ 100) | | 4,335 | | 4,496 |
Utah State Board of Regents Rev. Series 2011 B: | | | | |
5% 8/1/24 | | 2,670 | | 3,121 |
5% 8/1/25 | | 2,175 | | 2,515 |
Utah Transit Auth. Sales Tax Rev. Series 2008 A, 5.25% 6/15/38 | | 9,070 | | 10,105 |
| | 34,393 |
Vermont - 0.2% |
Vermont Edl. & Health Bldg. Fin. Agcy. Rev.: | | | | |
(Fletcher Allen Health Care, Inc. Proj.) Series 2000 A, 6.125% 12/1/27 (AMBAC Insured) | | 7,120 | | 7,147 |
(Middlebury College Proj.) Series 2006 A, 5% 10/31/46 | | 4,075 | | 4,330 |
| | 11,477 |
Virginia - 0.1% |
King George County Indl. Dev. Auth. Solid Waste Disp. Fac. Rev. Bonds (King George Landfill, Inc. Proj.) Series 2003 A, 3.5%, tender 5/1/13 (c)(f) | | 4,050 | | 4,119 |
Municipal Bonds - continued |
| Principal Amount (000s) | | Value (000s) |
Virginia - continued |
Virginia Beach Dev. Auth. Hosp. Facilities Rev. (Virginia Beach Gen. Hosp. Proj.) 6% 2/15/13 (AMBAC Insured) | | $ 1,460 | | $ 1,510 |
York County Econ. Dev. Auth. Poll. Cont. Rev. Bonds (Virginia Elec. and Pwr. Co. Proj.) Series 2009 A, 4.05%, tender 5/1/14 (c) | | 3,700 | | 3,880 |
| | 9,509 |
Washington - 3.7% |
Central Puget Sound Reg'l. Trans. Auth. Sales & Use Tax Rev. Series 2007 A, 5% 11/1/27 | | 3,500 | | 3,849 |
Chelan County Pub. Util. District #1 Columbia River-Rock Island Hydro-Elec. Sys. Rev. Series 1997 A, 0% 6/1/17 (Nat'l. Pub. Fin. Guarantee Corp. Insured) | | 7,200 | | 6,549 |
Chelan County Pub. Util. District #1 Rev. Bonds Series 2005 A, 5.125%, tender 7/1/15 (FGIC Insured) (c)(f) | | 2,430 | | 2,614 |
Clark County School District #37, Vancouver Series 2001 C, 0% 12/1/19 (Nat'l. Pub. Fin. Guarantee Corp. Insured) | | 2,030 | | 1,680 |
Energy Northwest Elec. Rev.: | | | | |
(#3 Proj.) Series 2002 B, 6% 7/1/16 (AMBAC Insured) | | 20,000 | | 20,000 |
Series 2012 A, 5% 7/1/21 | | 20,000 | | 24,858 |
Grant County Pub. Util. District #2 Wanapum Hydro Elec. Rev. Series B: | | | | |
5.25% 1/1/18 (Nat'l. Pub. Fin. Guarantee Corp. Insured) (f) | | 1,590 | | 1,725 |
5.25% 1/1/20 (Nat'l. Pub. Fin. Guarantee Corp. Insured) (f) | | 1,760 | | 1,884 |
5.25% 1/1/23 (Nat'l. Pub. Fin. Guarantee Corp. Insured) (f) | | 2,055 | | 2,174 |
Kent Spl. Events Ctr. Pub. Facilities District Rev.: | | | | |
5.25% 12/1/25 (FSA Insured) | | 2,575 | | 2,877 |
5.25% 12/1/36 (FSA Insured) | | 9,180 | | 9,863 |
King County Gen. Oblig.: | | | | |
(Pub. Trans. Proj.) Series 2004, 5.125% 6/1/34 (Nat'l. Pub. Fin. Guarantee Corp. Insured) | | 4,750 | | 4,997 |
(Swr. Proj.) Series 2005, 5% 1/1/26 (Nat'l. Pub. Fin. Guarantee Corp. Insured) | | 5,000 | | 5,381 |
King County Swr. Rev.: | | | | |
Series 2008, 5.75% 1/1/43 | | 22,700 | | 25,986 |
Series 2009, 5.25% 1/1/42 | | 2,600 | | 2,923 |
Series 2010, 5% 1/1/50 | | 6,500 | | 7,084 |
Municipal Bonds - continued |
| Principal Amount (000s) | | Value (000s) |
Washington - continued |
Pierce County School District #10 Tacoma Series A, 5% 12/1/18 (FSA Insured) | | $ 4,000 | | $ 4,533 |
Port of Seattle Rev. Series D: | | | | |
5.75% 11/1/13 (Pre-Refunded to 11/1/12 @ 100) (f) | | 1,500 | | 1,525 |
5.75% 11/1/14 (Pre-Refunded to 11/1/12 @ 100) (f) | | 3,055 | | 3,106 |
5.75% 11/1/16 (Pre-Refunded to 11/1/12 @ 100) (f) | | 2,250 | | 2,287 |
Snohomish County School District #4, Lake Stevens 5.125% 12/1/19 (Nat'l. Pub. Fin. Guarantee Corp. Insured) | | 1,875 | | 2,100 |
Spokane Pub. Facilities District Hotel/Motel Tax & Sales/Use Tax Rev.: | | | | |
5.75% 12/1/19 (Nat'l. Pub. Fin. Guarantee Corp. Insured) | | 2,000 | | 2,128 |
5.75% 12/1/21 (Nat'l. Pub. Fin. Guarantee Corp. Insured) | | 2,000 | | 2,124 |
Washington Gen. Oblig.: | | | | |
Series 2008 D, 5% 1/1/24 | | 2,975 | | 3,455 |
Series B, 5% 7/1/28 | | 395 | | 431 |
Series R 97A: | | | | |
0% 7/1/17 (Escrowed to Maturity) | | 7,045 | | 6,660 |
0% 7/1/19 (Escrowed to Maturity) | | 9,100 | | 8,113 |
Washington Health Care Facilities Auth. Rev.: | | | | |
(Catholic Heath Initiatives Proj.) Series 2008 D, 6.375% 10/1/36 | | 5,000 | | 5,919 |
(Childrens Hosp. Reg'l. Med. Ctr. Proj.) Series 2008 C, 5.5% 10/1/35 | | 10,000 | | 11,153 |
(MultiCare Health Sys. Proj.) Series 2010 A: | | | | |
5.25% 8/15/19 | | 3,850 | | 4,489 |
5.25% 8/15/20 | | 2,000 | | 2,297 |
(Providence Health Systems Proj.): | | | | |
Series 2006 D, 5.25% 10/1/33 | | 2,000 | | 2,200 |
Series 2012 A: | | | | |
5% 10/1/25 (b) | | 5,130 | | 5,811 |
5% 10/1/26 (b) | | 13,395 | | 15,062 |
(Seattle Children's Hosp. Proj.) Series 2009, 5.625% 10/1/38 | | 7,550 | | 8,552 |
5.7% 7/1/38 | | 11,300 | | 12,233 |
Municipal Bonds - continued |
| Principal Amount (000s) | | Value (000s) |
Washington - continued |
Washington Health Care Facilities Auth. Rev.: - continued | | | | |
7% 7/1/39 | | $ 3,000 | | $ 3,447 |
Washington Pub. Pwr. Supply Sys. Nuclear Proj. #3 Rev. Series A, 0% 7/1/12 | | 4,000 | | 4,000 |
| | 236,069 |
West Virginia - 0.1% |
West Virginia Hosp. Fin. Auth. Hosp. Rev.: | | | | |
(West Virginia United Health Sys. Proj.) Series 2008 E, 5.625% 6/1/35 | | 700 | | 761 |
(West Virginia Univ. Hospitals, Inc. Proj.) Series 2003 D, 5.5% 6/1/33 (FSA Insured) | | 2,600 | | 2,814 |
| | 3,575 |
Wisconsin - 0.4% |
Wisconsin Gen. Oblig. Series 2008 D, 5.5% 5/1/26 | | 1,245 | | 1,447 |
Wisconsin Health & Edl. Facilities Auth. Rev.: | | | | |
(Agnesian HealthCare, Inc. Proj.) Series 2010: | | | | |
5.5% 7/1/40 | | 2,375 | | 2,512 |
5.75% 7/1/30 | | 2,655 | | 2,960 |
(Children's Hosp. of Wisconsin Proj.) 5.25% 8/15/22 | | 2,000 | | 2,292 |
(Children's Hosp. Proj.) Series 2008 B, 5.375% 8/15/37 | | 8,045 | | 8,753 |
(Marshfield Clinic Proj.) Series A, 5.375% 2/15/34 | | 3,250 | | 3,398 |
(Wheaton Franciscan Healthcare Sys. Proj.) Series 2003 A: | | | | |
5.5% 8/15/15 | | 1,480 | | 1,544 |
5.5% 8/15/16 | | 975 | | 1,014 |
| | 23,920 |
Wyoming - 0.1% |
Campbell County Solid Waste Facilities Rev. (Basin Elec. Pwr. Coop. - Dry Fork Station Facilities Proj.) Series 2009 A, 5.75% 7/15/39 | | 8,600 | | 9,630 |
TOTAL MUNICIPAL BONDS (Cost $5,927,377) |
6,352,634
|
Money Market Funds - 1.2% |
| Shares | | Value (000s) |
Fidelity Municipal Cash Central Fund, 0.21% (d)(e)
(Cost $74,210) | 74,210,000 | | $ 74,210 |
TOTAL INVESTMENT PORTFOLIO - 99.9% (Cost $6,001,587) | | 6,426,844 |
NET OTHER ASSETS (LIABILITIES) - 0.1% | | 7,670 |
NET ASSETS - 100% | $ 6,434,514 |
Legend |
(a) Security initially issued in zero coupon form which converts to coupon form at a specified rate and date. The rate shown is the rate at period end. |
(b) Security or a portion of the security purchased on a delayed delivery or when-issued basis. |
(c) Coupon rates for floating and adjustable rate securities reflect the rates in effect at period end. |
(d) Information in this report regarding holdings by state and security types does not reflect the holdings of the Fidelity Municipal Cash Central Fund. |
(e) Affiliated fund that is available only to investment companies and other accounts managed by Fidelity Investments. The rate quoted is the annualized seven-day yield of the fund at period end. A complete unaudited listing of the fund's holdings as of its most recent quarter end is available upon request. In addition, each Fidelity Central Fund's financial statements are available on the SEC's website or upon request. |
(f) Private activity obligations whose interest is subject to the federal alternative minimum tax for individuals. |
(g) Restricted securities - Investment in securities not registered under the Securities Act of 1933 (excluding 144A issues). At the end of the period, the value of restricted securities (excluding 144A issues) amounted to $2,836,000 or 0.0% of net assets. |
Additional information on each restricted holding is as follows: |
Security | Acquisition Date | Acquisition Cost (000s) |
Massachusetts Health & Edl. Facilities Auth. Rev. (Blood Research Institute Proj.) Series A, 6.5% 2/1/22 | 9/3/92 | $ 2,663 |
Affiliated Central Funds |
Information regarding fiscal year to date income earned by the Fund from investments in Fidelity Central Funds is as follows: |
Fund | Income earned
(Amounts in thousands) |
Fidelity Municipal Cash Central Fund | $ 58 |
Other Information |
The following is a summary of the inputs used, as of June 30, 2012, involving the Fund's assets and liabilities carried at fair value. The inputs or methodology used for valuing securities may not be an indication of the risk associated with investing in those securities. For more information on valuation inputs, and their aggregation into the levels used in the table below, please refer to the Security Valuation section in the accompanying Notes to Financial Statements. |
Valuation Inputs at Reporting Date: |
Description
(Amounts in thousands) | Total | Level 1 | Level 2 | Level 3 |
Investments in Securities: | | | | |
Municipal Securities | $ 6,352,634 | $ - | $ 6,352,634 | $ - |
Money Market Funds | 74,210 | 74,210 | - | - |
Total Investments in Securities: | $ 6,426,844 | $ 74,210 | $ 6,352,634 | $ - |
The distribution of municipal securities by revenue source, as a percentage of total net assets, is as follows (Unaudited): |
General Obligations | 35.1% |
Health Care | 16.1% |
Water & Sewer | 10.6% |
Transportation | 9.5% |
Special Tax | 8.8% |
Escrowed/Pre-Refunded | 7.2% |
Electric Utilities | 6.6% |
Others* (Individually Less Than 5%) | 6.1% |
| 100.0% |
* Includes net other assets |
See accompanying notes which are an integral part of the financial statements.
Semiannual Report
Statement of Assets and Liabilities
Amounts in thousands (except per-share amount) | June 30, 2012 (Unaudited) |
| | |
Assets | | |
Investment in securities, at value - See accompanying schedule: Unaffiliated issuers (cost $5,927,377) | $ 6,352,634 | |
Fidelity Central Funds (cost $74,210) | 74,210 | |
Total Investments (cost $6,001,587) | | $ 6,426,844 |
Cash | | 89,782 |
Receivable for investments sold | | 17,200 |
Receivable for fund shares sold | | 4,320 |
Interest receivable | | 78,713 |
Distributions receivable from Fidelity Central Funds | | 13 |
Other receivables | | 37 |
Total assets | | 6,616,909 |
| | |
Liabilities | | |
Payable for investments purchased
Regular delivery | $ 16,098 | |
Delayed delivery | 151,288 | |
Payable for fund shares redeemed | 3,957 | |
Distributions payable | 7,590 | |
Accrued management fee | 1,956 | |
Other affiliated payables | 1,425 | |
Other payables and accrued expenses | 81 | |
Total liabilities | | 182,395 |
| | |
Net Assets | | $ 6,434,514 |
Net Assets consist of: | | |
Paid in capital | | $ 6,018,689 |
Undistributed net investment income | | 1,433 |
Accumulated undistributed net realized gain (loss) on investments | | (10,865) |
Net unrealized appreciation (depreciation) on investments | | 425,257 |
Net Assets, for 482,229 shares outstanding | | $ 6,434,514 |
Net Asset Value, offering price and redemption price per share ($6,434,514 ÷ 482,229 shares) | | $ 13.34 |
See accompanying notes which are an integral part of the financial statements.
Semiannual Report
Financial Statements - continued
Statement of Operations
Amounts in thousands | Six months ended June 30, 2012 (Unaudited) |
| | |
Investment Income | | |
Interest | | $ 129,391 |
Income from Fidelity Central Funds | | 58 |
Total income | | 129,449 |
| | |
Expenses | | |
Management fee | $ 11,437 | |
Transfer agent fees | 2,453 | |
Accounting fees and expenses | 355 | |
Custodian fees and expenses | 36 | |
Independent trustees' compensation | 11 | |
Registration fees | 128 | |
Audit | 35 | |
Legal | 7 | |
Miscellaneous | 30 | |
Total expenses before reductions | 14,492 | |
Expense reductions | (59) | 14,433 |
Net investment income (loss) | | 115,016 |
Realized and Unrealized Gain (Loss) Net realized gain (loss) on: | | |
Investment securities: | | |
Unaffiliated issuers | | 2,667 |
Change in net unrealized appreciation (depreciation) on investment securities | | 139,593 |
Net gain (loss) | | 142,260 |
Net increase (decrease) in net assets resulting from operations | | $ 257,276 |
See accompanying notes which are an integral part of the financial statements.
Semiannual Report
Statement of Changes in Net Assets
Amounts in thousands | Six months ended June 30, 2012
(Unaudited) | Year ended
December 31, 2011 |
Increase (Decrease) in Net Assets | | |
Operations | | |
Net investment income (loss) | $ 115,016 | $ 227,027 |
Net realized gain (loss) | 2,667 | 1,487 |
Change in net unrealized appreciation (depreciation) | 139,593 | 331,458 |
Net increase (decrease) in net assets resulting
from operations | 257,276 | 559,972 |
Distributions to shareholders from net investment income | (113,182) | (227,872) |
Distributions to shareholders from net realized gain | - | (905) |
Total distributions | (113,182) | (228,777) |
Share transactions
Proceeds from sales of shares | 774,571 | 1,259,784 |
Reinvestment of distributions | 68,707 | 144,401 |
Cost of shares redeemed | (469,456) | (1,473,902) |
Net increase (decrease) in net assets resulting from share transactions | 373,822 | (69,717) |
Redemption fees | 26 | 55 |
Total increase (decrease) in net assets | 517,942 | 261,533 |
| | |
Net Assets | | |
Beginning of period | 5,916,572 | 5,655,039 |
End of period (including undistributed net investment income of $1,433 and distributions in excess of net investment income of $401, respectively) | $ 6,434,514 | $ 5,916,572 |
Other Information Shares | | |
Sold | 58,397 | 100,767 |
Issued in reinvestment of distributions | 5,163 | 11,488 |
Redeemed | (35,352) | (118,949) |
Net increase (decrease) | 28,208 | (6,694) |
See accompanying notes which are an integral part of the financial statements.
Semiannual Report
Financial Highlights
| Six months ended June 30, 2012 | Years ended December 31, |
| (Unaudited) | 2011 | 2010 | 2009 | 2008 | 2007 |
Selected Per-Share Data | | | | | | |
Net asset value, beginning of period | $ 13.03 | $ 12.27 | $ 12.46 | $ 11.49 | $ 12.58 | $ 12.77 |
Income from Investment Operations | | | | | | |
Net investment income (loss) D | .244 | .513 | .516 | .517 | .515 | .514 |
Net realized and unrealized gain (loss) | .306 | .764 | (.189) | .970 | (1.081) | (.125) |
Total from investment operations | .550 | 1.277 | .327 | 1.487 | (.566) | .389 |
Distributions from net investment income | (.240) | (.515) | (.516) | (.517) | (.513) | (.514) |
Distributions from net realized gain | - | (.002) | (.001) | - I | (.011) | (.065) |
Total distributions | (.240) | (.517) | (.517) | (.517) | (.524) | (.579) |
Redemption fees added to paid in capital D,I | - | - | - | - | - | - |
Net asset value, end of period | $ 13.34 | $ 13.03 | $ 12.27 | $ 12.46 | $ 11.49 | $ 12.58 |
Total Return B,C | 4.24% | 10.64% | 2.58% | 13.14% | (4.61)% | 3.13% |
Ratios to Average Net Assets E,G | | | | | | |
Expenses before reductions | .47% A | .46% | .46% | .48% | .47% | .47% |
Expenses net of fee waivers, if any | .47% A | .46% | .46% | .48% | .47% | .47% |
Expenses net of all reductions | .46% A | .46% | .46% | .48% | .46% | .44% |
Net investment income (loss) | 3.70% A | 4.08% | 4.08% | 4.25% | 4.23% | 4.08% |
Supplemental Data | | | | | | |
Net assets, end of period (in millions) | $ 6,435 | $ 5,917 | $ 5,655 | $ 5,641 | $ 4,545 | $ 5,141 |
Portfolio turnover rate F | 10% A | 11% | 10% | 10% | 15% | 22% H |
A Annualized
B Total returns for periods of less than one year are not annualized.
C Total returns would have been lower if certain expenses had not been reduced during the applicable periods shown.
D Calculated based on average shares outstanding during the period.
E Fees and expenses of any underlying Fidelity Central Funds are not included in the Fund's expense ratio. The Fund indirectly bears its proportionate share of the expenses of any underlying Fidelity Central Funds.
F Amount does not include the portfolio activity of any underlying Fidelity Central Funds.
G Expense ratios reflect operating expenses of the Fund. Expenses before reductions do not reflect amounts reimbursed by the investment adviser or reductions from expense offset arrangements and do not represent the amount paid by the Fund during periods when reimbursements or reductions occur. Expenses net of fee waivers reflect expenses after reimbursement by the investment adviser but prior to reductions from expense offset arrangements. Expenses net of all reductions represent the net expenses paid by the Fund.
H The portfolio turnover rate does not include the assets acquired in the merger.
I Amount represents less than $.001 per share.
Semiannual Report
See accompanying notes which are an integral part of the financial statements.
Notes to Financial Statements
For the period ended June 30, 2012 (Unaudited)
(Amounts in thousands except percentages)
1. Organization.
Fidelity® Municipal Income Fund (the Fund) is a fund of Fidelity Municipal Trust (the Trust) and is authorized to issue an unlimited number of shares. The Trust is registered under the Investment Company Act of 1940, as amended (the 1940 Act), as an open-end management investment company organized as a Massachusetts business trust.
2. Investments in Fidelity Central Funds.
The Fund invests in Fidelity Central Funds, which are open-end investment companies available only to other investment companies and accounts managed by Fidelity Management & Research Company (FMR) and its affiliates. The Fund's Schedule of Investments lists each of the Fidelity Central Funds held as of period end, if any, as an investment of the Fund, but does not include the underlying holdings of each Fidelity Central Fund. As an Investing Fund, the Fund indirectly bears its proportionate share of the expenses of the underlying Fidelity Central Funds.
The Money Market Central Funds seek preservation of capital and current income and are managed by Fidelity Investments Money Management, Inc. (FIMM), an affiliate of FMR.
A complete unaudited list of holdings for each Fidelity Central Fund is available upon request or at the Securities and Exchange Commission (the SEC) web site at www.sec.gov. In addition, the financial statements of the Fidelity Central Funds are available on the SEC web site or upon request.
3. Significant Accounting Policies.
The financial statements have been prepared in conformity with accounting principles generally accepted in the United States of America (GAAP), which require management to make certain estimates and assumptions at the date of the financial statements. Actual results could differ from those estimates. Subsequent events, if any, through the date that the financial statements were issued have been evaluated in the preparation of the financial statements. The following summarizes the significant accounting policies of the Fund:
Security Valuation. Investments are valued as of 4:00 p.m. Eastern time on the last calendar day of the period. In accordance with valuation policies and procedures approved by the Board of Trustees (the Board), the Fund attempts to obtain prices from one or more third party pricing vendor or broker to value its investments. When current market prices, quotations or rates are not readily available or reliable, securities will be fair valued in good faith by the FMR Fair Value Committee (the Committee), in accordance with procedures adopted by the Board. Factors used in determining fair value vary by security type and may include market or security specific events, changes in interest
Semiannual Report
Notes to Financial Statements (Unaudited) - continued
(Amounts in thousands except percentages)
3. Significant Accounting Policies - continued
Security Valuation - continued
rates and credit quality. The frequency with which these procedures are used cannot be predicted and they may be utilized to a significant extent. The Committee oversees the Fund's valuation policies and procedures and is responsible for approving and reporting to the Board all fair value determinations.
The Fund categorizes the inputs to valuation techniques used to value its investments into a disclosure hierarchy consisting of three levels as shown below:
Level 1 - quoted prices in active markets for identical investments
Level 2 - other significant observable inputs (including quoted prices for similar investments, interest rates, prepayment speeds, etc.)
Level 3 - unobservable inputs (including the Fund's own assumptions based on the best information available)
Valuation techniques used to value the Fund's investments by major category are as follows:
Debt securities, including restricted securities, are valued based on evaluated prices received from third party pricing vendors or from brokers who make markets in such securities. For municipal securities, pricing vendors utilize matrix pricing which considers yield or price of bonds of comparable quality, coupon, maturity and type as well as broker-supplied prices and are generally categorized as Level 2 in the hierarchy. When independent prices are unavailable or unreliable, debt securities may be valued utilizing pricing methodologies which consider similar factors that would be used by third party pricing vendors. These are generally categorized as Level 2 in the hierarchy but may be Level 3 depending on the circumstances.
Investments in open-end mutual funds, including the Fidelity Central Funds, are valued at their closing net asset value each business day and are categorized as Level 1 in the hierarchy.
Changes in valuation techniques may result in transfers in or out of an assigned level within the disclosure hierarchy. The aggregate value of investments by input level, as of June 30, 2012 for the Fund's investments is included at the end of Fund's Schedule of Investments.
Semiannual Report
3. Significant Accounting Policies - continued
Investment Transactions and Income. For financial reporting purposes, the Fund's investment holdings and NAV include trades executed through the end of the last business day of the period. The NAV per share for processing shareholder transactions is calculated as of the close of business of the New York Stock Exchange (NYSE), normally 4:00 p.m. Eastern time and includes trades executed through the end of the prior business day. Gains and losses on securities sold are determined on the basis of identified cost. Interest income and distributions from the Fidelity Central Funds are accrued as earned. Interest income includes coupon interest and amortization of premium and accretion of discount on debt securities.
Expenses. Expenses directly attributable to a fund are charged to that fund. Expenses attributable to more than one fund are allocated among the respective funds on the basis of relative net assets or other appropriate methods. Expense estimates are accrued in the period to which they relate and adjustments are made when actual amounts are known.
Income Tax Information and Distributions to Shareholders. Each year, the Fund intends to qualify as a regulated investment company under Subchapter M of the Internal Revenue Code, including distributing substantially all of its taxable income and realized gains. As a result, no provision for income taxes is required. The Fund files a U.S. federal tax return, in addition to state and local tax returns as required. A fund's federal income tax returns are subject to examination by the Internal Revenue Service (IRS) for a period of three fiscal years after they are filed. State and local tax returns may be subject to examination for an additional fiscal year depending on the jurisdiction.
Dividends are declared and recorded daily and paid monthly from net investment income. Distributions from realized gains, if any, are declared and recorded on the ex-dividend date. Income and capital gain distributions are determined in accordance with income tax regulations, which may differ from GAAP.
Capital accounts within the financial statements are adjusted for permanent book-tax differences. These adjustments have no impact on net assets or the results of operations. Temporary book-tax differences will reverse in a subsequent period.
Book-tax differences are primarily due to market discount, deferred trustees compensation, capital loss carryforwards, losses deferred due to wash sales, futures transactions and excise tax regulations.
The Fund purchases municipal securities whose interest, in the opinion of the issuer, is free from federal income tax. There is no assurance that the IRS will agree with this opinion. In the event the IRS determines that the issuer does not comply with relevant tax requirements, interest payments from a security could become federally taxable, possibly retroactively to the date the security was issued.
Semiannual Report
Notes to Financial Statements (Unaudited) - continued
(Amounts in thousands except percentages)
3. Significant Accounting Policies - continued
Income Tax Information and Distributions to Shareholders - continued
The federal tax cost of investment securities and unrealized appreciation (depreciation) as of period end were as follows:
Gross unrealized appreciation | $ 433,418 |
Gross unrealized depreciation | (7,693) |
Net unrealized appreciation (depreciation) on securities and other investments | $ 425,725 |
| |
Tax cost | $ 6,001,119 |
Capital loss carryforwards are only available to offset future capital gains of the Fund to the extent provided by regulations and may be limited. Under the Regulated Investment Company Modernization Act of 2010 (the Act), the Fund is permitted to carry forward capital losses incurred in taxable years beginning after December 22, 2010 for an unlimited period and such capital losses are required to be used prior to any losses that expire. At December 31, 2011, capital loss carryforwards were as follows:
Fiscal year of expiration | |
2016 | $ (8,010) |
2018 | (2,786) |
Total with expiration | (10,796) |
No expiration | |
Short-term | (2,086) |
Total capital loss carryforward | $ (12,882) |
Short-Term Trading (Redemption) Fees. Shares held by investors in the Fund less than 30 days are subject to a redemption fee equal to .50% of the net asset value of shares redeemed. All redemption fees, which reduce the proceeds of the shareholder redemption, are retained by the Fund and accounted for as an addition to paid in capital.
4. Operating Policies.
Delayed Delivery Transactions and When-Issued Securities. During the period, the Fund transacted in securities on a delayed delivery or when-issued basis. Payment and delivery may take place after the customary settlement period for that security. The price of the underlying securities and the date when the securities will be delivered and paid for are fixed at the time the transaction is negotiated. The securities purchased on a delayed delivery or when-issued basis are identified as such in the Fund's Schedule of Investments. The Fund may receive compensation for interest forgone in the purchase of
Semiannual Report
4. Operating Policies - continued
Delayed Delivery Transactions and When-Issued Securities - continued
a delayed delivery or when-issued security. With respect to purchase commitments, the Fund identifies securities as segregated in its records with a value at least equal to the amount of the commitment. Losses may arise due to changes in the value of the underlying securities or if the counterparty does not perform under the contract's terms, or if the issuer does not issue the securities due to political, economic, or other factors.
Restricted Securities. The Fund may invest in securities that are subject to legal or contractual restrictions on resale. These securities generally may be resold in transactions exempt from registration or to the public if the securities are registered. Disposal of these securities may involve time-consuming negotiations and expense, and prompt sale at an acceptable price may be difficult. Information regarding restricted securities is included at the end of the Fund's Schedule of Investments.
5. Purchases and Sales of Investments.
Purchases and sales of securities, other than short-term securities, aggregated $816,189 and $307,059, respectively.
6. Fees and Other Transactions with Affiliates.
Management Fee. FMR and its affiliates provide the Fund with investment management related services for which the Fund pays a monthly management fee. The management fee is the sum of an individual fund fee rate that is based on an annual rate of .25% of the Fund's average net assets and an annualized group fee rate that averaged .12% during the period. The group fee rate is based upon the average net assets of all the mutual funds advised by FMR. The group fee rate decreases as assets under management increase and increases as assets under management decrease. For the period, the total annualized management fee rate was .37% of the Fund's average net assets.
Transfer Agent and Accounting Fees. Citibank, N.A. (Citibank) is the custodian, transfer agent and servicing agent for the Fund. Citibank has entered into a sub-arrangement with Fidelity Investments Institutional Operations Company, Inc. (FIIOC), an affiliate of FMR, under which FIIOC performs the activities associated with the Fund's transfer agency, dividend disbursing and shareholder servicing functions. The Fund pays account fees and asset-based fees that vary according to account size and type of account. FIIOC pays for typesetting, printing and mailing of shareholder reports, except proxy statements. For the period, transfer agent fees were equivalent to an annualized rate of .08% of average net assets.
Semiannual Report
Notes to Financial Statements (Unaudited) - continued
(Amounts in thousands except percentages)
6. Fees and Other Transactions with Affiliates - continued
Transfer Agent and Accounting Fees - continued
Citibank also has a sub-arrangement with Fidelity Service Company, Inc. (FSC), an affiliate of FMR, under which FSC maintains the Fund's accounting records. The fee is based on the level of average net assets for the month.
7. Committed Line of Credit.
The Fund participates with other funds managed by FMR or an affiliate in a $4.25 billion credit facility (the "line of credit") to be utilized for temporary or emergency purposes to fund shareholder redemptions or for other short-term liquidity purposes. The Fund has agreed to pay commitment fees on its pro-rata portion of the line of credit, which amounted to $9 and is reflected in Miscellaneous expenses on the Statement of Operations. During the period, there were no borrowings on this line of credit.
8. Expense Reductions.
Through arrangements with the Fund's custodian and transfer agent, credits realized as a result of uninvested cash balances were used to reduce the Fund's expenses. During the period, these credits reduced the Fund's custody and transfer agent expenses by $36 and $23, respectively.
9. Other.
The Fund's organizational documents provide former and current trustees and officers with a limited indemnification against liabilities arising in connection with the performance of their duties to the Fund. In the normal course of business, the Fund may also enter into contracts that provide general indemnifications. The Fund's maximum exposure under these arrangements is unknown as this would be dependent on future claims that may be made against the Fund. The risk of material loss from such claims is considered remote.
Semiannual Report
Investment Adviser
Fidelity Management & Research Company
Boston, MA
Investment Sub-Advisers
Fidelity Investments Money
Management, Inc.
Fidelity Management & Research
(U.K.) Inc.
Fidelity Management & Research
(Hong Kong) Limited
Fidelity Management & Research
(Japan) Inc.
General Distributor
Fidelity Distributors Corporation
Smithfield, RI
Transfer and Service Agents
Citibank, N.A.
New York, NY
Fidelity Investments Institutional
Operations Company, Inc.
Boston, MA
Fidelity Service Company, Inc.
Boston, MA
Custodian
Citibank, N.A.
New York, NY
The Fidelity Telephone Connection
Mutual Fund 24-Hour Service
Exchanges/Redemptions
and Account Assistance 1-800-544-6666
Product Information 1-800-544-6666
Retirement Accounts 1-800-544-4774
(8 a.m. - 9 p.m.)
TDD Service 1-800-544-0118
for the deaf and hearing impaired
(9 a.m. - 9 p.m. Eastern time)
Fidelity Automated Service
Telephone(FAST®) 1-800-544-5555
Automated line for quickest service
HIY-USAN-0812
1.787789.109
(Fidelity Investment logo)(registered trademark)
Corporate Headquarters
82 Devonshire St., Boston, MA 02109
www.fidelity.com
Fidelity®
Minnesota Municipal Income
Fund
Semiannual Report
June 30, 2012
(Fidelity Cover Art)
Contents
Shareholder Expense Example | (Click Here) | An example of shareholder expenses. |
Investment Changes | (Click Here) | A summary of major shifts in the fund's investments over the past six months. |
Investments | (Click Here) | A complete list of the fund's investments with their market values. |
Financial Statements | (Click Here) | Statements of assets and liabilities, operations, and changes in net assets, as well as financial highlights. |
Notes | (Click Here) | Notes to the financial statements. |
To view a fund's proxy voting guidelines and proxy voting record for the 12-month period ended June 30, visit http://www.fidelity.com/proxyvotingresults or visit the Securities and Exchange Commission's (SEC) web site at http://www.sec.gov. You may also call 1-800-544-8544 to request a free copy of the proxy voting guidelines.
Standard & Poor's, S&P and S&P 500 are registered service marks of The McGraw-Hill Companies, Inc. and have been licensed for use by Fidelity Distributors Corporation.
Other third party marks appearing herein are the property of their respective owners.
All other marks appearing herein are registered or unregistered trademarks or service marks of FMR LLC or an affiliated company. © 2012 FMR LLC. All rights reserved.
This report and the financial statements contained herein are submitted for the general information of the shareholders of the fund. This report is not authorized for distribution to prospective investors in the fund unless preceded or accompanied by an effective prospectus.
A fund files its complete schedule of portfolio holdings with the SEC for the first and third quarters of each fiscal year on Form N-Q. Forms N-Q are available on the SEC's web site at http://www.sec.gov. A fund's Forms N-Q may be reviewed and copied at the SEC's Public Reference Room in Washington, DC. Information regarding the operation of the SEC's Public Reference Room may be obtained by calling 1-800-SEC-0330. For a complete list of a fund's portfolio holdings, view the most recent holdings listing, semiannual report, or annual report on Fidelity's web site at http://www.fidelity.com, http://www.advisor.fidelity.com, or http://www.401k.com, as applicable.
NOT FDIC INSURED • MAY LOSE VALUE • NO BANK GUARANTEE
Neither the fund nor Fidelity Distributors Corporation is a bank.
Semiannual Report
Shareholder Expense Example
As a shareholder of the Fund, you incur two types of costs: (1) transaction costs, including redemption fees and (2) ongoing costs, including management fees and other Fund expenses. This Example is intended to help you understand your ongoing costs (in dollars) of investing in the Fund and to compare these costs with the ongoing costs of investing in other mutual funds.
The Example is based on an investment of $1,000 invested at the beginning of the period and held for the entire period (January 1, 2012 to June 30, 2012).
Actual Expenses
The first line of the accompanying table provides information about actual account values and actual expenses. You may use the information in this line, together with the amount you invested, to estimate the expenses that you paid over the period. Simply divide your account value by $1,000.00 (for example, an $8,600 account value divided by $1,000.00 = 8.6), then multiply the result by the number in the first line under the heading entitled "Expenses Paid During Period" to estimate the expenses you paid on your account during this period. A small balance maintenance fee of $12.00 that is charged once a year may apply for certain accounts with a value of less than $2,000. This fee is not included in the table below. If it was, the estimate of expenses you paid during the period would be higher, and your ending account value lower, by this amount.
Hypothetical Example for Comparison Purposes
The second line of the accompanying table provides information about hypothetical account values and hypothetical expenses based on the Fund's actual expense ratio and an assumed rate of return of 5% per year before expenses, which is not the Fund's actual return. The hypothetical account values and expenses may not be used to estimate the actual ending account balance or expenses you paid for the period. You may use this information to compare the ongoing costs of investing in the Fund and other funds. To do so, compare this 5% hypothetical example with the 5% hypothetical examples that appear in the shareholder reports of the other funds. A small balance maintenance fee of $12.00 that is charged once a year may apply for certain accounts with a value of less than $2,000. This fee is not included in the table below. If it was, the estimate of expenses you paid during the period would be higher, and your ending account value lower, by this amount.
Please note that the expenses shown in the table are meant to highlight your ongoing costs only and do not reflect any transaction costs. Therefore, the second line of the table is useful in comparing ongoing costs only, and will not help you determine the relative total costs of owning different funds. In addition, if these transactional costs were included, your costs would have been higher.
Semiannual Report
Shareholder Expense Example - continued
| Annualized
Expense Ratio | Beginning
Account Value
January 1, 2012 | Ending
Account Value
June 30, 2012 | Expenses Paid
During Period*
January 1, 2012
to June 30, 2012 |
Actual | .50% | $ 1,000.00 | $ 1,028.60 | $ 2.52 |
Hypothetical (5% return per year before expenses) | | $ 1,000.00 | $ 1,022.38 | $ 2.51 |
* Expenses are equal to the Fund's annualized expense ratio, multiplied by the average account value over the period, multiplied by 182/366 (to reflect the one-half year period).
Semiannual Report
Investment Changes (Unaudited)
Top Five Sectors as of June 30, 2012 |
| % of fund's
net assets | % of fund's net assets
6 months ago |
General Obligations | 32.6 | 30.5 |
Health Care | 18.9 | 18.6 |
Electric Utilities | 12.1 | 12.3 |
Escrowed/Pre-Refunded | 8.8 | 13.7 |
Education | 7.2 | 9.7 |
Weighted Average Maturity as of June 30, 2012 |
| | 6 months ago |
Years | 5.4 | 5.3 |
This is a weighted average of all the maturities of the securities held in a fund. Weighted Average Maturity (WAM) can be used as a measure of sensitivity to interest rate changes and market changes. Generally, the longer the maturity, the greater the sensitivity to such changes. WAM is based on the dollar-weighted average length of time until principal payments must be paid. Depending on the types of securities held in a fund, certain maturity shortening devices (e.g., demand features, interest rate resets, and call options) may be taken into account when calculating the WAM. |
Duration as of June 30, 2012 |
| | 6 months ago |
Years | 5.8 | 6.3 |
Duration estimates how much a bond fund's price will change with a change in comparable interest rates. If rates rise 1%, for example, a fund with a 5-year duration is likely to lose about 5% of its value. Other factors also can influence a bond fund's performance and share price. Accordingly, a bond fund's actual performance may differ from this example. Duration takes into account any call or put option embedded in the bonds. |
Quality Diversification (% of fund's net assets) |
As of June 30, 2012 | As of December 31, 2011 |
 | AAA 6.4% | | | AAA 7.0% | |
 | AA,A 82.6% | | | AA,A 86.4% | |
 | BBB 5.0% | | | BBB 3.7% | |
 | BB and Below 0.6% | | | BB and Below 0.6% | |
 | Not Rated 0.4% | | | Not Rated 0.5% | |
 | Short-Term
Investments and
Net Other Assets 5.0% | | | Short-Term
Investments and
Net Other Assets 1.8% | |

We have used ratings from Moody's Investors Service, Inc. Where Moody's® ratings are not available, we have used S&P® ratings. All ratings are as of the date indicated and do not reflect subsequent changes. |
Semiannual Report
Investments June 30, 2012 (Unaudited)
Showing Percentage of Net Assets
Municipal Bonds - 95.0% |
| Principal Amount | | Value |
Guam - 0.3% |
Guam Ed. Fing. Foundation Ctfs. of Prtn. Series 2006 A, 5% 10/1/23 | | $ 1,500,000 | | $ 1,503,855 |
Minnesota - 92.5% |
Alexandria Independent School District #206 Gen. Oblig. (Minnesota School District Cr. Enhancement Prog.) Series 2008 A, 5% 2/1/17 (FSA Insured) | | 1,000,000 | | 1,176,370 |
Brainerd Independent School District #181 Series 2002 A: | | | | |
5.375% 2/1/16 (Nat'l. Pub. Fin. Guarantee Corp. Insured) (Pre-Refunded to 8/1/12 @ 100) | | 3,285,000 | | 3,296,892 |
5.375% 2/1/17 (Nat'l. Pub. Fin. Guarantee Corp. Insured) (Pre-Refunded to 8/1/12 @ 100) | | 4,100,000 | | 4,114,842 |
5.375% 2/1/19 (Nat'l. Pub. Fin. Guarantee Corp. Insured) (Pre-Refunded to 8/1/12 @ 100) | | 2,200,000 | | 2,207,964 |
Breckenridge Gen. Oblig. (Catholic Health Initiatives Proj.) Series 2004 A, 5% 5/1/30 | | 4,575,000 | | 4,773,189 |
Burnsville-Eagan-Savage Independent School District #191 Gen. Oblig. (Minnesota School Distric Cr. Enhancement Prog.) Series 2007 A, 5% 2/1/17 (FSA Insured) | | 525,000 | | 612,476 |
Cambridge Independent School District #911 Gen. Oblig. (Minnesota School District Prog.) Series 2005 C, 5% 4/1/14 (Nat'l. Pub. Fin. Guarantee Corp. Insured) | | 1,200,000 | | 1,287,708 |
Chaska Elec. Rev. (Generating Facilities Proj.) Series 2005 A: | | | | |
5.25% 10/1/20 | | 2,000,000 | | 2,180,440 |
5.25% 10/1/25 | | 1,955,000 | | 2,099,103 |
Chaska Independent School District #112 Gen. Oblig.: | | | | |
(Cr. Enhancement Prog.) Series 2012 A: | | | | |
5% 2/1/19 | | 4,090,000 | | 4,994,135 |
5% 2/1/22 | | 4,975,000 | | 6,234,819 |
(School Bldg. Proj.) Series 2007 A, 5% 2/1/17 (Nat'l. Pub. Fin. Guarantee Corp. Insured) | | 750,000 | | 884,850 |
Series 2009 A: | | | | |
4% 2/1/16 | | 1,000,000 | | 1,115,470 |
5% 2/1/17 | | 1,000,000 | | 1,179,800 |
Duluth Independent School District #709 Ctfs. of Prtn. Series 2009 B: | | | | |
4% 3/1/16 | | 1,445,000 | | 1,519,721 |
4% 3/1/17 | | 1,495,000 | | 1,575,431 |
4% 3/1/18 | | 1,235,000 | | 1,298,109 |
5% 3/1/30 | | 2,770,000 | | 2,734,655 |
Municipal Bonds - continued |
| Principal Amount | | Value |
Minnesota - continued |
Elk River Independent School District #728: | | | | |
Series 2002 A: | | | | |
5% 2/1/16 (FSA Insured) (Pre-Refunded to 2/1/13 @ 100) | | $ 3,000,000 | | $ 3,078,270 |
5.25% 2/1/18 (FSA Insured) (Pre-Refunded to 2/1/13 @ 100) | | 3,600,000 | | 3,699,036 |
Series 2004 A, 5% 2/1/17 (FGIC Insured) (Pre-Refunded to 8/1/14 @ 100) | | 1,000,000 | | 1,088,090 |
Series 2006 A, 5% 2/1/19 (FSA Insured) | | 3,500,000 | | 3,982,125 |
Hennepin County Gen. Oblig. Series 2010 E, 5% 12/15/20 | | 4,945,000 | | 6,199,349 |
Hennepin County Sales Tax Rev. (Ballpark Proj.) Series 2007 A, 5% 12/15/24 | | 1,000,000 | | 1,160,730 |
Lake Superior Independent School District #381 Series 2002 A: | | | | |
5% 4/1/15 (FSA Insured) (Pre-Refunded to 4/1/13 @ 100) | | 1,970,000 | | 2,036,330 |
5% 4/1/16 (FSA Insured) (Pre-Refunded to 4/1/13 @ 100) | | 2,065,000 | | 2,134,529 |
5% 4/1/17 (FSA Insured) (Pre-Refunded to 4/1/13 @ 100) | | 2,165,000 | | 2,237,896 |
5% 4/1/18 (FSA Insured) (Pre-Refunded to 4/1/13 @ 100) | | 1,260,000 | | 1,302,424 |
Lakeville Independent School District #194 Series 2002 A, 5% 2/1/22 (FGIC Insured) (Pre-Refunded to 2/1/13 @ 100) | | 1,000,000 | | 1,026,090 |
Maple Grove Health Care Sys. Rev. (Maple Grove Hosp. Corp. Proj.) Series 2007: | | | | |
5% 5/1/16 | | 1,000,000 | | 1,105,170 |
5.25% 5/1/24 | | 1,500,000 | | 1,603,800 |
5.25% 5/1/25 | | 2,000,000 | | 2,129,300 |
5.25% 5/1/28 | | 3,720,000 | | 3,910,241 |
Metropolitan Council Gen. Oblig. Rev. (Wastewtr. Proj.) Series 2008 C, 5% 3/1/21 | | 5,000,000 | | 5,768,700 |
Minneapolis & Saint Paul Hsg. & Redev. Auth. Health Care Sys. Rev.: | | | | |
(Children's Health Care Proj.): | | | | |
Series 1995 B, 5% 8/15/25 (FSA Insured) | | 3,000,000 | | 3,436,020 |
Series 2010 A, 5.25% 8/15/25 | | 1,000,000 | | 1,132,420 |
(Children's Hospitals and Clinics Proj.) Series 2004 A1, 5% 8/15/34 (FSA Insured) | | 500,000 | | 550,320 |
(HealthPartners Obligated Group Proj.) Series 2003: | | | | |
5.875% 12/1/29 | | 800,000 | | 830,056 |
Municipal Bonds - continued |
| Principal Amount | | Value |
Minnesota - continued |
Minneapolis & Saint Paul Hsg. & Redev. Auth. Health Care Sys. Rev.: - continued | | | | |
(HealthPartners Obligated Group Proj.) Series 2003: | | | | |
6% 12/1/19 | | $ 2,815,000 | | $ 3,001,100 |
Minneapolis & Saint Paul Metropolitan Arpts. Commission Arpt. Rev.: | | | | |
Series 2005 A: | | | | |
5% 1/1/15 (AMBAC Insured) | | 2,000,000 | | 2,189,940 |
5% 1/1/35 (AMBAC Insured) | | 8,500,000 | | 8,786,960 |
Series 2005 C, 5% 1/1/31 (Nat'l. Pub. Fin. Guarantee Corp. Insured) | | 2,090,000 | | 2,172,701 |
Series 2007 A, 5% 1/1/21 | | 5,000,000 | | 5,599,850 |
Series 2007 B, 5% 1/1/18 (Nat'l. Pub. Fin. Guarantee Corp. Insured) | | 2,000,000 | | 2,288,740 |
Series 2008 A: | | | | |
5% 1/1/13 (b) | | 655,000 | | 669,600 |
5% 1/1/14 (b) | | 3,000,000 | | 3,193,500 |
Series 2010 D, 5% 1/1/17 (b) | | 4,155,000 | | 4,720,122 |
Series B, 5% 1/1/20 (Nat'l. Pub. Fin. Guarantee Corp. Insured) | | 2,830,000 | | 3,161,789 |
Minneapolis Gen. Oblig. Series 2009: | | | | |
4% 12/1/20 | | 2,800,000 | | 3,083,472 |
4% 12/1/21 | | 2,330,000 | | 2,547,179 |
Minneapolis Health Care Sys. Rev. (Fairview Health Svcs. Proj.): | | | | |
Series 2005 D, 5% 11/15/34 (AMBAC Insured) | | 5,120,000 | | 5,306,982 |
Series 2008 B, 6.5% 11/15/38 (Assured Guaranty Corp. Insured) | | 3,500,000 | | 4,139,940 |
Minneapolis Spl. School District #1 Series 2005 A, 5% 2/1/17 (FSA Insured) | | 2,000,000 | | 2,134,560 |
Minnesota 911 Rev.: | | | | |
(Pub. Safety Radio Communications Sys. Proj.) Series 2009, 5% 6/1/21 (Assured Guaranty Corp. Insured) | | 2,220,000 | | 2,660,204 |
5% 6/1/21 | | 2,000,000 | | 2,396,580 |
Minnesota Agric. & Econ. Dev. Board Rev. (Essentia Health Obligated Group Proj.): | | | | |
Series 2008 C1: | | | | |
5% 2/15/16 (Assured Guaranty Corp. Insured) | | 415,000 | | 465,709 |
5% 2/15/30 (Assured Guaranty Corp. Insured) | | 3,750,000 | | 4,094,063 |
5.25% 2/15/23 (Assured Guaranty Corp. Insured) | | 1,660,000 | | 1,923,425 |
5.5% 2/15/25 (Assured Guaranty Corp. Insured) | | 2,500,000 | | 2,883,775 |
Series 2008, 5% 2/15/17 (Assured Guaranty Corp. Insured) | | 1,975,000 | | 2,260,960 |
Municipal Bonds - continued |
| Principal Amount | | Value |
Minnesota - continued |
Minnesota Gen. Oblig.: | | | | |
Series 2008 A, 5% 6/1/21 | | $ 3,300,000 | | $ 3,919,575 |
Series 2009 A, 5% 12/1/23 | | 15,540,000 | | 19,203,544 |
Series 2009 H, 5% 11/1/21 | | 4,590,000 | | 5,736,077 |
Series 2010 A, 5% 8/1/27 | | 5,000,000 | | 6,117,100 |
Series 2010 D: | | | | |
5% 8/1/21 | | 1,000,000 | | 1,253,060 |
5% 8/1/22 | | 5,000,000 | | 6,214,000 |
5% 8/1/23 | | 10,000,000 | | 12,394,100 |
Series 2011 B: | | | | |
5% 10/1/24 | | 2,500,000 | | 3,084,625 |
5% 10/1/30 | | 3,000,000 | | 3,558,030 |
5% 11/1/15 | | 5,135,000 | | 5,689,272 |
5% 6/1/21 | | 8,585,000 | | 9,872,063 |
5% 8/1/22 | | 2,600,000 | | 3,045,588 |
5% 11/1/24 (Pre-Refunded to 11/1/14 @ 100) | | 9,155,000 | | 10,111,698 |
5% 11/1/26 | | 4,270,000 | | 4,809,088 |
Minnesota Higher Ed. Facilities Auth. Rev.: | | | | |
(College of St. Scholastica, Inc. Proj.) Series Seven-H, 5.25% 12/1/35 | | 1,000,000 | | 1,078,070 |
(Gustovus Adolphus College Proj.) Series Seven-B: | | | | |
5% 10/1/22 | | 2,250,000 | | 2,573,798 |
5% 10/1/23 | | 1,000,000 | | 1,136,890 |
(Hamline Univ. Proj.) Series Seven-E: | | | | |
5% 10/1/17 | | 1,565,000 | | 1,794,852 |
5% 10/1/19 | | 1,000,000 | | 1,158,830 |
(Macalester College Proj.) Series Six-P: | | | | |
5% 3/1/21 | | 2,315,000 | | 2,613,404 |
5% 3/1/22 | | 2,535,000 | | 2,843,814 |
(St. Olaf College Proj.) Series Six-O, 5% 10/1/15 | | 1,000,000 | | 1,115,270 |
(Univ. of St. Thomas Proj.): | | | | |
Series Seven-A, 5% 10/1/39 | | 1,650,000 | | 1,790,498 |
Series Six-I, 5% 4/1/23 | | 1,000,000 | | 1,108,290 |
Series Six-X, 5.25% 4/1/39 | | 1,500,000 | | 1,610,235 |
Minnesota Muni. Pwr. Agcy. Elec. Rev.: | | | | |
Series 2005, 5.25% 10/1/21 | | 8,450,000 | | 9,182,108 |
Series 2007, 5.25% 10/1/22 | | 1,000,000 | | 1,132,110 |
Minnesota Pub. Facilities Auth. Drinking Wtr. Rev. Series 2005 A, 5% 3/1/21 | | 5,060,000 | | 5,597,473 |
Minnesota Retirement Sys. Bldg. Rev.: | | | | |
5.55% 6/1/14 | | 590,000 | | 592,036 |
5.6% 6/1/15 | | 615,000 | | 617,232 |
Municipal Bonds - continued |
| Principal Amount | | Value |
Minnesota - continued |
Minnesota Retirement Sys. Bldg. Rev.: - continued | | | | |
5.65% 6/1/16 | | $ 625,000 | | $ 627,169 |
5.7% 6/1/17 | | 900,000 | | 903,078 |
5.75% 6/1/18 | | 975,000 | | 978,208 |
5.75% 6/1/19 | | 1,050,000 | | 1,053,329 |
5.8% 6/1/20 | | 1,000,000 | | 1,003,100 |
5.875% 6/1/22 | | 2,425,000 | | 2,432,421 |
Minnesota State Colleges & Univs. Board of Trustees Rev.: | | | | |
Series 2005 A, 5% 10/1/18 (Nat'l. Pub. Fin. Guarantee Corp. Insured) | | 1,465,000 | | 1,671,946 |
Series 2009 A: | | | | |
4% 10/1/17 | | 1,445,000 | | 1,654,568 |
4% 10/1/18 | | 1,490,000 | | 1,716,793 |
4% 10/1/19 | | 1,550,000 | | 1,784,980 |
4% 10/1/20 | | 1,580,000 | | 1,807,978 |
Series 2011 A, 5% 10/1/30 | | 1,495,000 | | 1,746,459 |
North Saint Paul-Maplewood-Oakdale Independent School District 622 Series 2006 B: | | | | |
5% 2/1/17 (FSA Insured) | | 1,525,000 | | 1,803,694 |
5% 8/1/17 (FSA Insured) | | 1,575,000 | | 1,825,252 |
Northeast Metropolitan Intermediate School District #916 Ctfs. of Prtn. Series 2004, 5% 1/1/13 | | 1,000,000 | | 1,018,910 |
Northern Muni. Pwr. Agcy. Elec. Sys. Rev.: | | | | |
Series 2009 A, 5% 1/1/16 (Assured Guaranty Corp. Insured) | | 3,000,000 | | 3,413,760 |
Series 2010 A1: | | | | |
5% 1/1/19 | | 3,000,000 | | 3,585,450 |
5% 1/1/20 | | 1,000,000 | | 1,195,400 |
Series A, 5% 1/1/18 (Assured Guaranty Corp. Insured) | | 3,000,000 | | 3,552,990 |
Northfield Hosp. Rev. Series 2006: | | | | |
5.375% 11/1/26 | | 1,000,000 | | 1,061,770 |
5.5% 11/1/16 | | 1,025,000 | | 1,159,183 |
Owatonna Pub. Utils. Commission Pub. Utils. Rev. Series 2003: | | | | |
5% 1/1/13 (AMBAC Insured) | | 800,000 | | 817,320 |
5% 1/1/15 (AMBAC Insured) | | 715,000 | | 729,057 |
Ramsey County Gen. Oblig. Series 2003 A, 5% 2/1/18 | | 1,530,000 | | 1,569,642 |
Rochester Elec. Util. Rev. Series 2007 C, 5% 12/1/30 | | 2,000,000 | | 2,217,880 |
Rochester Health Care Facilities Rev.: | | | | |
(Mayo Clinic Proj.) Series 2008 E, 5% 11/15/38 | | 4,000,000 | | 4,476,120 |
Municipal Bonds - continued |
| Principal Amount | | Value |
Minnesota - continued |
Rochester Health Care Facilities Rev.: - continued | | | | |
(Mayo Foundation Proj.) Series 2006, 5% 11/15/36 | | $ 2,000,000 | | $ 2,151,540 |
Bonds: | | | | |
(Mayo Clinic Proj.): | | | | |
Series 2011, 4%, tender 11/15/18 (a) | | 2,475,000 | | 2,837,711 |
Series B, 4%, tender 11/15/18 (a) | | 3,000,000 | | 3,439,650 |
(Mayo Foundation Proj.) Series C, 4.5%, tender 11/15/21 (a) | | 1,000,000 | | 1,193,600 |
Saint Cloud Health Care Rev. (CentraCare Health Sys. Proj.) Series 2010 A, 5.125% 5/1/30 | | 5,000,000 | | 5,465,650 |
Saint Paul Hsg. & Redev. Auth. Hosp. Rev. (HealthEast Proj.) Series 2005, 5.25% 11/15/14 | | 1,000,000 | | 1,063,790 |
Saint Paul Independent School District #625: | | | | |
Series 2002 A: | | | | |
5% 2/1/17 (FSA Insured) (Pre-Refunded to 2/1/13 @ 100) | | 220,000 | | 225,740 |
5% 2/1/18 (FSA Insured) (Pre-Refunded to 2/1/13 @ 100) | | 395,000 | | 405,306 |
Series 2004 B, 5% 2/1/17 (FSA Insured) (Pre-Refunded to 2/1/15 @ 100) | | 1,300,000 | | 1,437,319 |
Series 2004 C, 5% 2/1/16 (FSA Insured) (Pre-Refunded to 2/1/15 @ 100) | | 1,025,000 | | 1,133,271 |
Saint Paul Port Auth. Series 2007-2, 5% 3/1/37 | | 1,500,000 | | 1,634,160 |
Saint Paul Port Auth. Lease Rev.: | | | | |
(HealthEast Midway Campus Proj.) Series 2003 A, 5.75% 5/1/25 | | 2,000,000 | | 2,080,480 |
(Regions Hosp. Package Proj.) Series 2007-1: | | | | |
5% 8/1/12 | | 410,000 | | 410,808 |
5% 8/1/13 | | 430,000 | | 441,434 |
5% 8/1/14 | | 455,000 | | 476,226 |
5% 8/1/15 | | 480,000 | | 509,122 |
5% 8/1/16 | | 500,000 | | 533,700 |
Series 2003 11, 5.25% 12/1/20 | | 3,000,000 | | 3,196,260 |
Series 2003 12: | | | | |
5.125% 12/1/27 | | 5,000,000 | | 5,294,350 |
5.25% 12/1/18 | | 3,685,000 | | 3,932,006 |
Shakopee Health Care Facilities Rev. (Saint Francis Reg'l. Med. Ctr. Proj.) Series 2004, 5.25% 9/1/34 | | 2,520,000 | | 2,560,849 |
Southern Minnesota Muni. Pwr. Agcy. Pwr. Supply Sys. Rev.: | | | | |
(Cap. Appreciation) Series 1994 A: | | | | |
0% 1/1/19 (Nat'l. Pub. Fin. Guarantee Corp. Insured) | | 6,210,000 | | 5,238,197 |
Municipal Bonds - continued |
| Principal Amount | | Value |
Minnesota - continued |
Southern Minnesota Muni. Pwr. Agcy. Pwr. Supply Sys. Rev.: - continued | | | | |
(Cap. Appreciation) Series 1994 A: | | | | |
0% 1/1/21 (Nat'l. Pub. Fin. Guarantee Corp. Insured) | | $ 14,670,000 | | $ 11,364,849 |
0% 1/1/26 (Nat'l. Pub. Fin. Guarantee Corp. Insured) | | 2,000,000 | | 1,210,060 |
Series 2002 A: | | | | |
5.25% 1/1/15 (AMBAC Insured) | | 1,125,000 | | 1,247,828 |
5.25% 1/1/16 (AMBAC Insured) | | 4,490,000 | | 5,159,369 |
Series 2009 A: | | | | |
5% 1/1/13 | | 2,500,000 | | 2,557,225 |
5% 1/1/14 | | 960,000 | | 1,024,742 |
5.25% 1/1/30 | | 2,000,000 | | 2,264,800 |
5.5% 1/1/24 | | 500,000 | | 590,320 |
Spring Lake Park Independent School District #16: | | | | |
Series 2004 B: | | | | |
5% 2/1/15 (Nat'l. Pub. Fin. Guarantee Corp. Insured) (Pre-Refunded to 2/1/13 @ 100) | | 2,085,000 | | 2,139,398 |
5% 2/1/16 (Nat'l. Pub. Fin. Guarantee Corp. Insured) (Pre-Refunded to 2/1/13 @ 100) | | 2,230,000 | | 2,288,181 |
5% 2/1/17 (Nat'l. Pub. Fin. Guarantee Corp. Insured) (Pre-Refunded to 2/1/13 @ 100) | | 2,400,000 | | 2,462,616 |
Series 2006 A, 5% 2/1/29 (FSA Insured) | | 4,000,000 | | 4,359,680 |
St. Louis Park Health Care Facilities Rev. (Park Nicollet Health Svcs. Proj.): | | | | |
Series 2008 C, 5.75% 7/1/30 | | 3,555,000 | | 3,955,364 |
Series 2009, 5.75% 7/1/39 | | 9,000,000 | | 9,928,890 |
St. Paul Hsg. & Redev. Auth. Health Care Facilities Rev.: | | | | |
(Allina Health Sys. Proj.): | | | | |
Series 2007 A: | | | | |
5% 11/15/15 (Nat'l. Pub. Fin. Guarantee Corp. Insured) | | 240,000 | | 268,855 |
5% 11/15/22 (Nat'l. Pub. Fin. Guarantee Corp. Insured) | | 2,100,000 | | 2,364,075 |
Series 2009 A1, 5.25% 11/15/29 | | 3,000,000 | | 3,276,900 |
(Gillette Children's Speciality Healthcare Proj.) 5% 2/1/16 | | 1,460,000 | | 1,534,183 |
(HealthPartners Oblig. Group Proj.) Series 2006: | | | | |
5% 5/15/15 | | 250,000 | | 271,040 |
5% 5/15/16 | | 345,000 | | 378,013 |
5.25% 5/15/17 | | 590,000 | | 650,717 |
5.25% 5/15/26 | | 1,000,000 | | 1,057,720 |
5.25% 5/15/36 | | 1,000,000 | | 1,040,990 |
Municipal Bonds - continued |
| Principal Amount | | Value |
Minnesota - continued |
St. Paul Hsg. & Redev. Auth. Health Care Facilities Rev.: - continued | | | | |
(Regions Hosp. Proj.) 5.3% 5/15/28 | | $ 1,250,000 | | $ 1,250,775 |
Series 2009 A2, 5.5% 11/15/24 | | 2,000,000 | | 2,288,200 |
Tobacco Securitization Auth. Series 2011 B: | | | | |
5% 3/1/19 | | 2,600,000 | | 3,001,336 |
5% 3/1/21 | | 8,000,000 | | 9,270,880 |
5.25% 3/1/31 | | 6,005,000 | | 6,677,320 |
Univ. of Minnesota Gen. Oblig.: | | | | |
Series 2009 A: | | | | |
5% 4/1/23 | | 200,000 | | 235,438 |
5.125% 4/1/34 | | 1,000,000 | | 1,126,790 |
5.25% 4/1/29 | | 1,000,000 | | 1,160,120 |
Series 2009 C: | | | | |
5% 12/1/17 | | 1,000,000 | | 1,204,120 |
5% 12/1/21 | | 1,000,000 | | 1,190,450 |
Series 2011 D: | | | | |
5% 12/1/23 | | 1,180,000 | | 1,452,545 |
5% 12/1/26 | | 1,020,000 | | 1,228,733 |
5% 12/1/36 | | 1,000,000 | | 1,149,550 |
Univ. of Minnesota Spl. Purp. Rev.: | | | | |
(State Supported Biomedical Science Research Facilities Fdg. Prog.) Series 2011 B, 5% 8/1/25 | | 2,095,000 | | 2,550,013 |
(State Supported Stadium Proj.) Series 2006: | | | | |
5% 8/1/20 | | 6,625,000 | | 7,616,829 |
5% 8/1/29 | | 4,000,000 | | 4,480,320 |
Series 2010 A, 5% 8/1/25 | | 1,800,000 | | 2,151,756 |
Virginia Hsg. & Redev. Auth. Health Care Facility Lease Rev. Series 2005, 5.25% 10/1/25 | | 440,000 | | 456,795 |
Watertown Independent School District #111 Series 2005 A, 5% 2/1/22 (FSA Insured) | | 1,495,000 | | 1,681,277 |
Wayzata Independent School District #284 Series 2004 B, 5% 2/1/16 (FSA Insured) | | 1,005,000 | | 1,109,259 |
Western Minnesota Muni. Pwr. Agcy. Pwr. Supply Rev.: | | | | |
Series 1977 A, 6.375% 1/1/16 (Escrowed to Maturity) | | 630,000 | | 702,179 |
Series 2003 A, 5% 1/1/30 (Nat'l. Pub. Fin. Guarantee Corp. Insured) | | 3,000,000 | | 3,027,720 |
Series 2006 A, 5% 1/1/16 (FSA Insured) | | 2,000,000 | | 2,271,420 |
| | 502,478,017 |
Municipal Bonds - continued |
| Principal Amount | | Value |
Puerto Rico - 2.0% |
Puerto Rico Govt. Dev. Bank Series 2006 B, 5% 12/1/12 | | $ 1,000,000 | | $ 1,016,920 |
Puerto Rico Pub. Bldg. Auth. Rev. Bonds Series M2, 5.75%, tender 7/1/17 (a) | | 600,000 | | 661,884 |
Puerto Rico Sales Tax Fing. Corp. Sales Tax Rev.: | | | | |
Series 2007 A, 0% 8/1/41 (Nat'l. Pub. Fin. Guarantee Corp. Insured) | | 9,300,000 | | 1,809,873 |
Series 2009 A, 6% 8/1/42 | | 1,000,000 | | 1,114,290 |
Series 2011 C: | | | | |
0% 8/1/37 | | 6,800,000 | | 1,698,504 |
0% 8/1/38 | | 1,310,000 | | 308,033 |
0% 8/1/39 | | 19,550,000 | | 4,337,168 |
| | 10,946,672 |
Virgin Islands - 0.2% |
Virgin Islands Pub. Fin. Auth. Series 2009 B, 5% 10/1/25 | | 1,000,000 | | 1,079,860 |
TOTAL INVESTMENT PORTFOLIO - 95.0% (Cost $481,522,175) | | 516,008,404 |
NET OTHER ASSETS (LIABILITIES) - 5.0% | | 27,144,559 |
NET ASSETS - 100% | $ 543,152,963 |
Legend |
(a) Coupon rates for floating and adjustable rate securities reflect the rates in effect at period end. |
(b) Private activity obligations whose interest is subject to the federal alternative minimum tax for individuals. |
Other Information |
All investments are categorized as Level 2 under the Fair Value Hierarchy. The inputs or methodology used for valuing securities may not be an indication of the risk associated with investing in those securities. For more information on valuation inputs, please refer to the Security Valuation section in the accompanying Notes to Financial Statements. |
The distribution of municipal securities by revenue source, as a percentage of total net assets, is as follows (Unaudited): |
General Obligations | 32.6% |
Health Care | 18.9% |
Electric Utilities | 12.1% |
Escrowed/Pre-Refunded | 8.8% |
Education | 7.2% |
Transportation | 6.0% |
Others (Individually Less Than 5%) | 9.4% |
Net Other Assets | 5.0% |
| 100.0% |
See accompanying notes which are an integral part of the financial statements.
Semiannual Report
Statement of Assets and Liabilities
| June 30, 2012 (Unaudited) |
| | |
Assets | | |
Investment in securities, at value - See accompanying schedule: Unaffiliated issuers (cost $481,522,175) | | $ 516,008,404 |
Cash | | 21,634,132 |
Receivable for fund shares sold | | 301,038 |
Interest receivable | | 6,436,784 |
Other receivables | | 6,244 |
Total assets | | 544,386,602 |
| | |
Liabilities | | |
Payable for fund shares redeemed | $ 515,454 | |
Distributions payable | 381,795 | |
Accrued management fee | 165,021 | |
Transfer agent fee payable | 111,743 | |
Other affiliated payables | 34,272 | |
Other payables and accrued expenses | 25,354 | |
Total liabilities | | 1,233,639 |
| | |
Net Assets | | $ 543,152,963 |
Net Assets consist of: | | |
Paid in capital | | $ 507,896,880 |
Undistributed net investment income | | 89,839 |
Accumulated undistributed net realized gain (loss) on investments | | 680,015 |
Net unrealized appreciation (depreciation) on investments | | 34,486,229 |
Net Assets, for 45,463,496 shares outstanding | | $ 543,152,963 |
Net Asset Value, offering price and redemption price per share ($543,152,963 ÷ 45,463,496 shares) | | $ 11.95 |
See accompanying notes which are an integral part of the financial statements.
Semiannual Report
Statement of Operations
Six months ended June 30, 2012 (Unaudited) |
| | |
Investment Income | | |
Interest | | $ 9,702,193 |
| | |
Expenses | | |
Management fee | $ 975,279 | |
Transfer agent fees | 222,183 | |
Accounting fees and expenses | 67,374 | |
Custodian fees and expenses | 3,102 | |
Independent trustees' compensation | 950 | |
Registration fees | 34,889 | |
Audit | 23,196 | |
Legal | 4,086 | |
Miscellaneous | 2,161 | |
Total expenses before reductions | 1,333,220 | |
Expense reductions | (9,028) | 1,324,192 |
Net investment income (loss) | | 8,378,001 |
Realized and Unrealized Gain (Loss) Net realized gain (loss) on: | | |
Investment securities: | | |
Unaffiliated issuers | | 727,870 |
Change in net unrealized appreciation (depreciation) on investment securities | | 5,826,184 |
Net gain (loss) | | 6,554,054 |
Net increase (decrease) in net assets resulting from operations | | $ 14,932,055 |
See accompanying notes which are an integral part of the financial statements.
Semiannual Report
Financial Statements - continued
Statement of Changes in Net Assets
| Six months ended
June 30, 2012
(Unaudited) | Year ended
December 31,
2011 |
Increase (Decrease) in Net Assets | | |
Operations | | |
Net investment income (loss) | $ 8,378,001 | $ 17,307,768 |
Net realized gain (loss) | 727,870 | 2,028,016 |
Change in net unrealized appreciation (depreciation) | 5,826,184 | 23,563,920 |
Net increase (decrease) in net assets resulting
from operations | 14,932,055 | 42,899,704 |
Distributions to shareholders from net investment income | (8,327,751) | (17,313,267) |
Distributions to shareholders from net realized gain | - | (2,223,703) |
Total distributions | (8,327,751) | (19,536,970) |
Share transactions
Proceeds from sales of shares | 47,109,467 | 74,910,585 |
Reinvestment of distributions | 5,985,458 | 13,858,387 |
Cost of shares redeemed | (35,639,200) | (90,716,185) |
Net increase (decrease) in net assets resulting from share transactions | 17,455,725 | (1,947,213) |
Redemption fees | 633 | 4,082 |
Total increase (decrease) in net assets | 24,060,662 | 21,419,603 |
| | |
Net Assets | | |
Beginning of period | 519,092,301 | 497,672,698 |
End of period (including undistributed net investment income of $89,839 and undistributed net investment income of $39,589, respectively) | $ 543,152,963 | $ 519,092,301 |
Other Information Shares | | |
Sold | 3,947,915 | 6,529,176 |
Issued in reinvestment of distributions | 500,607 | 1,202,602 |
Redeemed | (2,985,407) | (7,968,872) |
Net increase (decrease) | 1,463,115 | (237,094) |
See accompanying notes which are an integral part of the financial statements.
Semiannual Report
Financial Highlights
| Six months ended
June 30, 2012 | Years ended December 31, |
| (Unaudited) | 2011 | 2010 | 2009 | 2008 | 2007 |
Selected Per-Share Data | | | | | |
Net asset value, beginning of period | $ 11.80 | $ 11.25 | $ 11.38 | $ 10.74 | $ 11.22 | $ 11.36 |
Income from Investment Operations | | | | | | |
Net investment income (loss) D | .187 | .403 | .393 | .403 | .430 | .444 |
Net realized and unrealized gain (loss) | .149 | .601 | (.115) | .648 | (.460) | (.090) |
Total from investment operations | .336 | 1.004 | .278 | 1.051 | (.030) | .354 |
Distributions from net investment income | (.186) | (.403) | (.394) | (.404) | (.430) | (.444) |
Distributions from net realized gain | - | (.051) | (.014) | (.007) | (.020) | (.050) |
Total distributions | (.186) | (.454) | (.408) | (.411) | (.450) | (.494) |
Redemption fees added to paid in capital D, F | - | - | - | - | - | - |
Net asset value, end of period | $ 11.95 | $ 11.80 | $ 11.25 | $ 11.38 | $ 10.74 | $ 11.22 |
Total Return B, C | 2.86% | 9.09% | 2.42% | 9.89% | (.28)% | 3.19% |
Ratios to Average Net Assets E | | | | | |
Expenses before reductions | .50% A | .49% | .50% | .51% | .50% | .50% |
Expenses net of fee waivers, if any | .50% A | .49% | .50% | .51% | .50% | .50% |
Expenses net of all reductions | .50% A | .49% | .49% | .51% | .47% | .44% |
Net investment income (loss) | 3.16% A | 3.50% | 3.41% | 3.59% | 3.91% | 3.95% |
Supplemental Data | | | | | |
Net assets, end of period (000 omitted) | $ 543,153 | $ 519,092 | $ 497,673 | $ 473,438 | $ 372,276 | $ 349,886 |
Portfolio turnover rate | 11% A | 9% | 13% | 7% | 9% | 11% |
A Annualized
B Total returns for periods of less than one year are not annualized.
C Total returns would have been lower if certain expenses had not been reduced during the applicable periods shown.
D Calculated based on average shares outstanding during the period.
E Expense ratios reflect operating expenses of the Fund. Expenses before reductions do not reflect amounts reimbursed by the investment adviser or reductions from expense offset arrangements and do not represent the amount paid by the Fund during periods when reimbursements or reductions occur. Expenses net of fee waivers reflect expenses after reimbursement by the investment adviser but prior to reductions from expense offset arrangements. Expenses net of all reductions represent the net expenses paid by the Fund.
F Amount represents less than $.001 per share.
See accompanying notes which are an integral part of the financial statements.
Semiannual Report
Notes to Financial Statements
For the period ended June 30, 2012 (Unaudited)
1. Organization.
Fidelity® Minnesota Municipal Income Fund (the Fund) is a non-diversified fund of Fidelity Municipal Trust (the Trust) and is authorized to issue an unlimited number of shares. The Trust is registered under the Investment Company Act of 1940, as amended (the 1940 Act), as an open-end management investment company organized as a Massachusetts business trust. The Fund may be affected by economic and political developments in the state of Minnesota.
2. Significant Accounting Policies.
The financial statements have been prepared in conformity with accounting principles generally accepted in the United States of America (GAAP), which require management to make certain estimates and assumptions at the date of the financial statements. Actual results could differ from those estimates. Subsequent events, if any, through the date that the financial statements were issued have been evaluated in the preparation of the financial statements. The following summarizes the significant accounting policies of the Fund:
Security Valuation. Investments are valued as of 4:00 p.m. Eastern time on the last calendar day of the period. In accordance with valuation policies and procedures approved by the Board of Trustees (the Board), the Fund attempts to obtain prices from one or more third party pricing vendor or broker to value its investments. When current market prices, quotations or rates are not readily available or reliable, securities will be fair valued in good faith by the FMR Fair Value Committee (the Committee), in accordance with procedures adopted by the Board. Factors used in determining fair value vary by security type and may include market or security specific events, changes in interest rates and credit quality. The frequency with which these procedures are used cannot be predicted and they may be utilized to a significant extent. The Committee oversees the Fund's valuation policies and procedures and is responsible for approving and reporting to the Board all fair value determinations.
The Fund categorizes the inputs to valuation techniques used to value its investments into a disclosure hierarchy consisting of three levels as shown below:
Level 1 - quoted prices in active markets for identical investments
Level 2 - other significant observable inputs (including quoted prices for similar investments, interest rates, prepayment speeds, etc.)
Level 3 - unobservable inputs (including the Fund's own assumptions based on the best information available)
Semiannual Report
2. Significant Accounting Policies - continued
Security Valuation - continued
Valuation techniques used to value the Fund's investments by major category are as follows:
Debt securities, including restricted securities, are valued based on evaluated prices received from third party pricing vendors or from brokers who make markets in such securities. For municipal securities, pricing vendors utilize matrix pricing which considers yield or price of bonds of comparable quality, coupon, maturity and type as well as broker-supplied prices and are generally categorized as Level 2 in the hierarchy. When independent prices are unavailable or unreliable, debt securities may be valued utilizing pricing methodologies which consider similar factors that would be used by third party pricing vendors. These are generally categorized as Level 2 in the hierarchy but may be Level 3 depending on the circumstances.
Changes in valuation techniques may result in transfers in or out of an assigned level within the disclosure hierarchy.
Investment Transactions and Income. For financial reporting purposes, the Fund's investment holdings and NAV include trades executed through the end of the last business day of the period. The NAV per share for processing shareholder transactions is calculated as of the close of business of the New York Stock Exchange (NYSE), normally 4:00 p.m. Eastern time and includes trades executed through the end of the prior business day. Gains and losses on securities sold are determined on the basis of identified cost. Interest income is accrued as earned. Interest income includes coupon interest and amortization of premium and accretion of discount on debt securities.
Expenses. Expenses directly attributable to a fund are charged to that fund. Expenses attributable to more than one fund are allocated among the respective funds on the basis of relative net assets or other appropriate methods. Expense estimates are accrued in the period to which they relate and adjustments are made when actual amounts are known.
Income Tax Information and Distributions to Shareholders. Each year, the Fund intends to qualify as a regulated investment company under Subchapter M of the Internal Revenue Code, including distributing substantially all of its taxable income and realized gains. As a result, no provision for income taxes is required. The Fund files a U.S. federal tax return, in addition to state and local tax returns as required. A fund's federal income tax returns are subject to examination by the Internal Revenue Service (IRS) for a period of three fiscal years after they are filed. State and local tax returns may be subject to examination for an additional fiscal year depending on the jurisdiction.
Dividends are declared and recorded daily and paid monthly from net investment income. Distributions from realized gains, if any, are declared and recorded on the
Semiannual Report
Notes to Financial Statements (Unaudited) - continued
2. Significant Accounting Policies - continued
Income Tax Information and Distributions to Shareholders - continued
ex-dividend date. Income and capital gain distributions are determined in accordance with income tax regulations, which may differ from GAAP.
Capital accounts within the financial statements are adjusted for permanent book-tax differences. These adjustments have no impact on net assets or the results of operations. Temporary book-tax differences will reverse in a subsequent period.
Book-tax differences are primarily due to market discount, deferred trustees compensation and losses deferred due to futures transactions.
The Fund purchases municipal securities whose interest, in the opinion of the issuer, is free from federal income tax. There is no assurance that the IRS will agree with this opinion. In the event the IRS determines that the issuer does not comply with relevant tax requirements, interest payments from a security could become federally taxable, possibly retroactively to the date the security was issued.
The federal tax cost of investment securities and unrealized appreciation (depreciation) as of period end were as follows:
Gross unrealized appreciation | $ 34,899,153 |
Gross unrealized depreciation | (432,127) |
Net unrealized appreciation (depreciation) on securities and other investments | $ 34,467,026 |
| |
Tax cost | $ 481,541,378 |
Short-Term Trading (Redemption) Fees. Shares held by investors in the Fund less than 30 days are subject to a redemption fee equal to .50% of the net asset value of shares redeemed. All redemption fees, which reduce the proceeds of the shareholder redemption, are retained by the Fund and accounted for as an addition to paid in capital.
3. Purchases and Sales of Investments.
Purchases and sales of securities, other than short-term securities, aggregated $30,180,644 and $29,039,080, respectively.
4. Fees and Other Transactions with Affiliates.
Management Fee. Fidelity Management & Research Company (FMR) and its affiliates provide the Fund with investment management related services for which the Fund pays a monthly management fee. The management fee is the sum of an individual fund fee rate that is based on an annual rate of .25% of the Fund's average net assets and an
Semiannual Report
4. Fees and Other Transactions with Affiliates - continued
Management Fee - continued
annualized group fee rate that averaged .12% during the period. The group fee rate is based upon the average net assets of all the mutual funds advised by FMR. The group fee rate decreases as assets under management increase and increases as assets under management decrease. For the period, the total annualized management fee rate was .37% of the Fund's average net assets.
Transfer Agent and Accounting Fees. Citibank, N.A. (Citibank) is the custodian, transfer agent and servicing agent for the Fund. Citibank has entered into a sub-arrangement with Fidelity Investments Institutional Operations Company, Inc. (FIIOC), an affiliate of FMR, under which FIIOC performs the activities associated with the Fund's transfer agency, dividend disbursing and shareholder servicing functions. The Fund pays account fees and asset-based fees that vary according to account size and type of account. FIIOC pays for typesetting, printing and mailing of shareholder reports, except proxy statements. For the period, transfer agent fees were equivalent to an annualized rate of .08% of average net assets.
Citibank also has a sub-arrangement with Fidelity Service Company, Inc. (FSC), an affiliate of FMR, under which FSC maintains the Fund's accounting records. The fee is based on the level of average net assets for the month.
5. Committed Line of Credit.
The Fund participates with other funds managed by FMR or an affiliate in a $4.25 billion credit facility (the "line of credit") to be utilized for temporary or emergency purposes to fund shareholder redemptions or for other short-term liquidity purposes. The Fund has agreed to pay commitment fees on its pro-rata portion of the line of credit, which amounted to $778 and is reflected in Miscellaneous expenses on the Statement of Operations. During the period, there were no borrowings on this line of credit.
6. Expense Reductions.
Through arrangements with the Fund's custodian and transfer agent, credits realized as a result of uninvested cash balances were used to reduce the Fund's expenses. During the period, these credits reduced the Fund's custody and transfer agent expenses by $2,736 and $6,292, respectively.
7. Other.
The Fund's organizational documents provide former and current trustees and officers with a limited indemnification against liabilities arising in connection with the performance of their duties to the Fund. In the normal course of business, the Fund may also
Semiannual Report
Notes to Financial Statements (Unaudited) - continued
7. Other - continued
enter into contracts that provide general indemnifications. The Fund's maximum exposure under these arrangements is unknown as this would be dependent on future claims that may be made against the Fund. The risk of material loss from such claims is considered remote.
Semiannual Report
Investment Adviser
Fidelity Management & Research Company
Boston, MA
Investment Sub-Advisers
Fidelity Investments Money
Management Inc.
Fidelity Management & Research (U.K.) Inc.
Fidelity Management & Research (Japan) Inc.
Fidelity Management & Research
(Hong Kong) Limited
General Distributor
Fidelity Distributors Corporation
Smithfield, RI
Transfer and Service Agents
Citibank, N.A.
New York, NY
Fidelity Investments Institutional Operations Company, Inc.
Boston, MA
Fidelity Service Company, Inc.
Boston, MA
Custodian
Citibank, N.A.
New York, NY
The Fidelity Telephone Connection
Mutual Fund 24-Hour Service
Exchanges/Redemptions
and Account Assistance 1-800-544-6666
Product Information 1-800-544-6666
Retirement Accounts 1-800-544-4774 (8 a.m. - 9 p.m.)
TDD Service 1-800-544-0118
for the deaf and hearing impaired
(9 a.m. - 9 p.m. Eastern time)
Fidelity Automated Service
Telephone (FAST®) 1-800-544-5555
Automated line for quickest service
MNF-USAN-0812
1.787786.109
(Fidelity Investment logo)(registered trademark)
Corporate Headquarters
82 Devonshire St., Boston, MA 02109
www.fidelity.com
Fidelity®
Ohio Municipal Income Fund
and
Fidelity
Ohio Municipal Money Market
Fund
Semiannual Report
June 30, 2012
(Fidelity Cover Art)
Contents
Shareholder Expense Example | (Click Here) | An example of shareholder expenses. |
Fidelity® Ohio Municipal Income Fund |
Investment Changes | (Click Here) | A summary of major shifts in the fund's investments over the past six months. |
Investments | (Click Here) | A complete list of the fund's investments with their market values. |
Financial Statements | (Click Here) | Statements of assets and liabilities, operations, and changes in net assets, as well as financial highlights. |
Fidelity Ohio Municipal Money Market Fund |
Investment
Changes/Performance | (Click Here) | A summary of major shifts in the fund's investments over the past six months. |
Investments | (Click Here) | A complete list of the fund's investments. |
Financial Statements | (Click Here) | Statements of assets and liabilities, operations, and changes in net assets, as well as financial highlights. |
Notes | (Click Here) | Notes to the financial statements. |
To view a fund's proxy voting guidelines and proxy voting record for the 12-month period ended June 30, visit http://www.fidelity.com/proxyvotingresults or visit the Securities and Exchange Commission's (SEC) web site at http://www.sec.gov. You may also call 1-800-544-8544 to request a free copy of the proxy voting guidelines.
Standard & Poor's, S&P and S&P 500 are registered service marks of The McGraw-Hill Companies, Inc. and have been licensed for use by Fidelity Distributors Corporation.
Other third party marks appearing herein are the property of their respective owners.
All other marks appearing herein are registered or unregistered trademarks or service marks of FMR LLC or an affiliated company. © 2012 FMR LLC. All rights reserved.
This report and the financial statements contained herein are submitted for the general information of the shareholders of the funds. This report is not authorized for distribution to prospective investors in the funds unless preceded or accompanied by an effective prospectus.
A fund files its complete schedule of portfolio holdings with the SEC for the first and third quarters of each fiscal year on Form N-Q. Forms N-Q are available on the SEC's web site at http://www.sec.gov. A fund's Forms N-Q may be reviewed and copied at the SEC's Public Reference Room in Washington, DC. Information regarding the operation of the SEC's Public Reference Room may be obtained by calling 1-800-SEC-0330. For a complete list of a fund's portfolio holdings, view the most recent holdings listing, semiannual report, or annual report on Fidelity's web site at http://www.fidelity.com, http://www.advisor.fidelity.com, or http://www.401k.com, as applicable.
NOT FDIC INSURED • MAY LOSE VALUE • NO BANK GUARANTEE
Neither the funds nor Fidelity Distributors Corporation is a bank.
Semiannual Report
Shareholder Expense Example
As a shareholder of a Fund, you incur two types of costs: (1) transaction costs, including redemption fees and (2) ongoing costs, including management fees and other Fund expenses. This Example is intended to help you understand your ongoing costs (in dollars) of investing in the Funds and to compare these costs with the ongoing costs of investing in other mutual funds.
The Example is based on an investment of $1,000 invested at the beginning of the period and held for the entire period (January 1, 2012 to June 30, 2012).
Actual Expenses
The first line of the accompanying table for each fund provides information about actual account values and actual expenses. You may use the information in this line, together with the amount you invested, to estimate the expenses that you paid over the period. Simply divide your account value by $1,000.00 (for example, an $8,600 account value divided by $1,000.00 = 8.6), then multiply the result by the number in the first line for a fund under the heading entitled "Expenses Paid During Period" to estimate the expenses you paid on your account during this period. A small balance maintenance fee of $12.00 that is charged once a year may apply for certain accounts with a value of less than $2,000. This fee is not included in the table below. If it was, the estimate of expenses you paid during the period would be higher, and your ending account value lower, by this amount. In addition, each Fund, as a shareholder in the underlying Fidelity Central Funds, will indirectly bear its pro-rata share of the fees and expenses incurred by the underlying Fidelity Central Funds. These fees and expenses are not included in the Fund's annualized expense ratio used to calculate the expense estimate in the table below.
Hypothetical Example for Comparison Purposes
The second line of the accompanying table for each fund provides information about hypothetical account values and hypothetical expenses based on a fund's actual expense ratio and an assumed rate of return of 5% per year before expenses, which is not the Fund's actual return. The hypothetical account values and expenses may not be used to estimate the actual ending account balance or expenses you paid for the period. You may use this information to compare the ongoing costs of investing in the Fund and other funds. To do so, compare this 5% hypothetical example with the 5% hypothetical examples that appear in the shareholder reports of the other funds. A small balance maintenance fee of $12.00 that is charged once a year may apply for certain accounts with a value of less than $2,000. This fee is not included in the table below. If it was, the estimate of expenses you paid during the period would be higher, and your ending account value lower, by this amount. In addition, each Fund, as a shareholder in the underlying Fidelity Central Funds, will indirectly bear its pro-rata share of the fees and expenses incurred by the underlying Fidelity Central Funds. These fees and expenses are not included in the Fund's annualized expense ratio used to calculate the expense estimate in the table below.
Please note that the expenses shown in the table are meant to highlight your ongoing costs only and do not reflect any transaction costs. Therefore, the second line of the table is useful in comparing ongoing costs only, and will not help you determine the relative total costs of owning different funds. In addition, if these transactional costs were included, your costs would have been higher.
Semiannual Report
Shareholder Expense Example - continued
| Annualized
Expense Ratio | Beginning
Account Value
January 1, 2012 | Ending
Account Value
June 30, 2012 | Expenses Paid
During Period*
January 1, 2012
to June 30, 2012 |
Fidelity® Ohio Municipal Income Fund | .49% | | | |
Actual | | $ 1,000.00 | $ 1,035.40 | $ 2.48 |
HypotheticalA | | $ 1,000.00 | $ 1,022.43 | $ 2.46 |
Fidelity Ohio Municipal Money Market Fund | .20% | | | |
Actual | | $ 1,000.00 | $ 1,000.00 | $ .99** |
HypotheticalA | | $ 1,000.00 | $ 1,023.87 | $ 1.01** |
A 5% return per year before expenses
* Expenses are equal to each Fund's annualized expense ratio, multiplied by the average account value over the period, multiplied by 182/366 (to reflect the one-half year period).
** If certain fees were not voluntarily waived by FMR or its affiliates during the period, the annualized expense ratio for the Fidelity Ohio Municipal Money Market Fund would have been .53% and the expenses paid in the actual and hypothetical examples above would have been $2.63 and $2.66, respectively.
Semiannual Report
Fidelity Ohio Municipal Income Fund
Investment Changes (Unaudited)
Top Five Sectors as of June 30, 2012 |
| % of fund's
net assets | % of fund's net assets
6 months ago |
General Obligations | 36.6 | 34.5 |
Health Care | 17.9 | 17.8 |
Education | 14.9 | 14.1 |
Water & Sewer | 10.6 | 11.7 |
Electric Utilities | 5.5 | 3.8 |
Weighted Average Maturity as of June 30, 2012 |
| | 6 months ago |
Years | 6.0 | 5.7 |
This is a weighted average of all the maturities of the securities held in a fund. Weighted Average Maturity (WAM) can be used as a measure of sensitivity to interest rate changes and market changes. Generally, the longer the maturity, the greater the sensitivity to such changes. WAM is based on the dollar-weighted average length of time until principal payments must be paid. Depending on the types of securities held in a fund, certain maturity shortening devices (e.g., demand features, interest rate resets, and call options) may be taken into account when calculating the WAM. |
Duration as of June 30, 2012 |
| | 6 months ago |
Years | 7.5 | 7.5 |
Duration estimates how much a bond fund's price will change with a change in comparable interest rates. If rates rise 1%, for example, a fund with a 5-year duration is likely to lose about 5% of its value. Other factors also can influence a bond fund's performance and share price. Accordingly, a bond fund's actual performance may differ from this example. Duration takes into account any call or put option embedded in the bonds. |
Quality Diversification (% of fund's net assets) |
As of June 30, 2012 | As of December 31, 2011 |
 | AAA 8.7% | | | AAA 10% | |
 | AA,A 82.8% | |  | AA,A 78.0% | |
 | BBB 7.3% | | | BBB 6.7% | |
 | BB and Below 0.0% | |  | BB and Below 0.5% | |
 | Not Rated 0.1% | | | Not Rated 1.0% | |
 | Short-Term
Investments and
Net Other Assets 1.1% | | | Short-Term
Investments and
Net Other Assets 3.8% | |

We have used ratings from Moody's Investors Service, Inc. Where Moody's® ratings are not available, we have used S&P® ratings. All ratings are as of the date indicated and do not reflect subsequent changes. |
Semiannual Report
Fidelity Ohio Municipal Income Fund
Investments June 30, 2012 (Unaudited)
Showing Percentage of Net Assets
Municipal Bonds - 98.9% |
| Principal Amount | | Value |
Guam - 0.3% |
Guam Ed. Fing. Foundation Ctfs. of Prtn. Series 2006 A, 5% 10/1/23 | | $ 1,600,000 | | $ 1,604,112 |
Ohio - 95.4% |
Akron Bath Copley Hosp. District Rev.: | | | | |
(Akron Gen. Health Systems Proj.) Series A: | | | | |
5% 1/1/14 | | 1,500,000 | | 1,578,600 |
5% 1/1/15 | | 1,275,000 | | 1,372,257 |
(Children's Hosp. Med. Ctr. Proj.): | | | | |
Series 2012 5% 11/15/22 | | 1,000,000 | | 1,147,510 |
Series 2012, 5% 11/15/23 | | 3,245,000 | | 3,670,971 |
Akron City Non-tax Rev. Econ. Dev. Series 1997, 6% 12/1/12 (Escrowed to Maturity) | | 440,000 | | 450,305 |
Akron Ctfs. of Prtn. Series 2005, 5% 12/1/15 (Assured Guaranty Corp. Insured) | | 1,475,000 | | 1,596,230 |
Allen County Hosp. Facilities Rev. (Catholic Healthcare Partners Proj.) Series 2010 B, 5.25% 9/1/27 | | 5,000,000 | | 5,653,800 |
American Muni. Pwr., Inc. Rev.: | | | | |
(Amp Freemont Energy Ctr. Proj.) Series 2012: | | | | |
5% 2/15/25 | | 4,000,000 | | 4,580,840 |
5.25% 2/15/28 | | 8,040,000 | | 9,193,737 |
(Prairie State Energy Campus Proj.): | | | | |
Series 2008 A, 5% 2/15/38 | | 4,075,000 | | 4,349,574 |
Series 2009 A, 5.75% 2/15/39 (Assured Guaranty Corp. Insured) | | 3,000,000 | | 3,391,410 |
Avon Gen. Oblig. Series 2009 B: | | | | |
5% 12/1/36 | | 1,040,000 | | 1,130,033 |
5% 12/1/37 | | 1,095,000 | | 1,187,834 |
Beavercreek City School District Series 2009, 5% 12/1/36 | | 2,250,000 | | 2,472,750 |
Bowling Green City School District 5% 12/1/34 (FSA Insured) | | 2,000,000 | | 2,131,300 |
Buckeye Tobacco Settlement Fing. Auth. Series 2007 A1: | | | | |
5% 6/1/16 | | 2,800,000 | | 2,996,336 |
5% 6/1/17 | | 2,865,000 | | 3,073,114 |
Buckeye Valley Local School District Delaware County Series A, 6.85% 12/1/15 (Nat'l. Pub. Fin. Guarantee Corp. Insured) | | 1,180,000 | | 1,307,676 |
Bucyrus City School District 5% 12/1/30 (FSA Insured) | | 5,120,000 | | 5,480,550 |
Butler County Hosp. Facilities Rev.: | | | | |
(Kettering Health Network Obligated Group Proj.) Series 2011, 6.375% 4/1/36 | | 5,000,000 | | 5,896,450 |
(UC Health Proj.) Series 2010, 5.5% 11/1/40 | | 3,000,000 | | 3,216,900 |
Municipal Bonds - continued |
| Principal Amount | | Value |
Ohio - continued |
Butler County Sales Tax (Govt. Svcs. Ctr. Proj.) Series A, 5% 12/15/16 (AMBAC Insured) | | $ 2,455,000 | | $ 2,699,322 |
Butler County Trans. Impt. District Series 2007, 5% 12/1/18 (XL Cap. Assurance, Inc. Insured) | | 1,015,000 | | 1,190,138 |
Canal Winchester Local School District Series B, 5% 12/1/18 (Nat'l. Pub. Fin. Guarantee Corp. Insured) | | 1,030,000 | | 1,105,602 |
Chagrin Falls Exempted Village School District Series 2005, 5.25% 12/1/19 (Nat'l. Pub. Fin. Guarantee Corp. Insured) | | 1,915,000 | | 2,075,956 |
Cincinnati City School District 5.25% 12/1/18 (Nat'l. Pub. Fin. Guarantee Corp. Insured) | | 3,000,000 | | 3,664,080 |
Cincinnati City School District Ctfs. of Prtn. (School Impt. Proj.) 5% 12/15/28 (FSA Insured) | | 1,000,000 | | 1,103,640 |
Cincinnati Gen. Oblig. Series 2009 A: | | | | |
4.5% 12/1/29 | | 500,000 | | 541,910 |
5% 12/1/20 | | 1,240,000 | | 1,486,760 |
Cincinnati Wtr. Sys. Rev.: | | | | |
Series A, 5% 12/1/36 | | 1,750,000 | | 1,990,345 |
Series B, 5% 12/1/32 | | 6,500,000 | | 7,299,240 |
Cleveland Arpt. Sys. Rev. Series 2000 C, 5% 1/1/20 (FSA Insured) | | 3,500,000 | | 3,853,710 |
Cleveland Gen. Oblig.: | | | | |
Series 2005, 5.5% 10/1/20 (AMBAC Insured) | | 7,350,000 | | 9,013,011 |
Series 2012, 5% 12/1/25 | | 2,350,000 | | 2,703,840 |
Series C: | | | | |
5.25% 11/15/20 (Nat'l. Pub. Fin. Guarantee Corp. Insured) | | 1,100,000 | | 1,331,550 |
5.25% 11/15/21 (Nat'l. Pub. Fin. Guarantee Corp. Insured) | | 1,145,000 | | 1,385,049 |
5.25% 11/15/22 (Nat'l. Pub. Fin. Guarantee Corp. Insured) | | 1,210,000 | | 1,464,064 |
5.25% 11/15/23 (Nat'l. Pub. Fin. Guarantee Corp. Insured) | | 1,885,000 | | 2,280,586 |
Cleveland Muni. School District Series 2004: | | | | |
5.25% 12/1/17 (FSA Insured) | | 2,215,000 | | 2,401,459 |
5.25% 12/1/19 (FSA Insured) | | 1,045,000 | | 1,125,099 |
5.25% 12/1/23 (FSA Insured) | | 1,000,000 | | 1,064,910 |
Cleveland Parking Facilities Rev.: | | | | |
5.25% 9/15/17 (Escrowed to Maturity) | | 1,440,000 | | 1,762,920 |
5.25% 9/15/17 (FSA Insured) | | 3,040,000 | | 3,508,829 |
Cleveland Pub. Pwr. Sys. Rev. Series 2010: | | | | |
5% 11/15/15 | | 2,335,000 | | 2,608,382 |
5% 11/15/16 | | 1,820,000 | | 2,079,623 |
Municipal Bonds - continued |
| Principal Amount | | Value |
Ohio - continued |
Cleveland State Univ. Gen. Receipts: | | | | |
Series 2003 A, 5% 6/1/18 (Nat'l. Pub. Fin. Guarantee Corp. Insured) | | $ 2,490,000 | | $ 2,582,304 |
Series 2004, 5% 6/1/34 (Nat'l. Pub. Fin. Guarantee Corp. Insured) | | 4,750,000 | | 4,906,703 |
Cleveland Wtrwks. Rev.: | | | | |
(First Mtg. Prog.) Series G, 5.5% 1/1/13 (Nat'l. Pub. Fin. Guarantee Corp. Insured) | | 20,000 | | 20,520 |
Series 2007 O, 5% 1/1/37 | | 3,200,000 | | 3,423,872 |
Columbus City School District (School Facilities Construction and Impt. Proj.): | | | | |
Series 2006, 5% 12/1/18 (FSA Insured) | | 5,000,000 | | 5,836,300 |
Series 2009 B: | | | | |
5% 12/1/26 | | 1,805,000 | | 2,120,297 |
5% 12/1/28 | | 3,105,000 | | 3,610,773 |
5% 12/1/29 | | 1,000,000 | | 1,157,780 |
Columbus Swr. Sys. Rev. Series 2008 A, 5% 6/1/24 | | 1,515,000 | | 1,735,872 |
Cuyahoga Cmnty. College District Gen. Oblig. Series 2009 C: | | | | |
5% 8/1/25 | | 1,140,000 | | 1,300,022 |
5% 8/1/27 | | 1,200,000 | | 1,353,672 |
Cuyahoga County Gen. Oblig. Series A, 0% 10/1/12 (Nat'l. Pub. Fin. Guarantee Corp. Insured) | | 1,405,000 | | 1,400,954 |
Dayton School District (School Facility Construction & Impt. Proj.) Series 2003 A, 5% 12/1/31 (Nat'l. Pub. Fin. Guarantee Corp. Insured) | | 4,975,000 | | 5,065,794 |
Dublin City School District 5% 12/1/21 | | 1,200,000 | | 1,418,580 |
Fairfield City School District 7.45% 12/1/14 (Nat'l. Pub. Fin. Guarantee Corp. Insured) | | 600,000 | | 649,884 |
Fairless Local School District 5% 12/1/32 (Pre-Refunded to 12/1/14 @ 100) | | 3,300,000 | | 3,659,667 |
Fairview Park City School District 5% 12/1/33 (Nat'l. Pub. Fin. Guarantee Corp. Insured) | | 4,350,000 | | 4,916,457 |
Fairview Park Gen. Oblig. 5% 12/1/30 (Nat'l. Pub. Fin. Guarantee Corp. Insured) | | 5,955,000 | | 6,435,985 |
Franklin County Convention Facilities Auth. Tax & Lease Rev. 5.25% 12/1/19 (AMBAC Insured) | | 4,000,000 | | 4,065,800 |
Franklin County Hosp. Rev. (Nationwide Children's Hosp. Proj.): | | | | |
Series 2009, 5.25% 11/1/40 | | 5,000,000 | | 5,496,250 |
Series A: | | | | |
5% 11/1/15 | | 260,000 | | 294,078 |
5% 11/1/16 | | 265,000 | | 308,017 |
Municipal Bonds - continued |
| Principal Amount | | Value |
Ohio - continued |
Gallia County Local School District (School Impt. Proj.) 5% 12/1/33 (FSA Insured) | | $ 3,000,000 | | $ 3,115,080 |
Greater Cleveland Reg'l. Transit Auth. Series 2012: | | | | |
5% 12/1/23 | | 1,000,000 | | 1,196,320 |
5% 12/1/24 | | 1,800,000 | | 2,127,042 |
5% 12/1/25 | | 1,170,000 | | 1,368,865 |
Hamilton County Convention Facilities Auth. Rev.: | | | | |
5% 12/1/17 (Nat'l. Pub. Fin. Guarantee Corp. Insured) | | 1,985,000 | | 2,113,072 |
5% 12/1/18 (Nat'l. Pub. Fin. Guarantee Corp. Insured) | | 1,075,000 | | 1,144,359 |
5% 12/1/19 (Nat'l. Pub. Fin. Guarantee Corp. Insured) | | 2,190,000 | | 2,317,283 |
5% 12/1/19 (Nat'l. Pub. Fin. Guarantee Corp. Insured) | | 1,130,000 | | 1,199,167 |
Hamilton County Econ. Dev. Rev. (King Highland Cmnty. Urban Redev. Corp. Proj.) Series A, 5% 6/1/17 (Nat'l. Pub. Fin. Guarantee Corp. Insured) | | 1,070,000 | | 1,192,130 |
Hamilton County Health Care Facilities Rev. (Christ Hosp. Proj.) Series 2012, 5.25% 6/1/24 | | 3,000,000 | | 3,270,780 |
Hamilton County Hosp. Facilities Rev. (Childrens Hosp. Med. Ctr. Proj.) Series 2004 J: | | | | |
5.25% 5/15/15 (Nat'l. Pub. Fin. Guarantee Corp. Insured) | | 1,835,000 | | 1,955,193 |
5.25% 5/15/17 (Nat'l. Pub. Fin. Guarantee Corp. Insured) | | 2,585,000 | | 2,720,170 |
5.25% 5/15/18 (Nat'l. Pub. Fin. Guarantee Corp. Insured) | | 2,720,000 | | 2,846,997 |
Hamilton County Sales Tax Rev. Series 2011 A, 5% 12/1/24 | | 4,870,000 | | 5,389,288 |
Hamilton County Student Hsg. Rev. (Stratford Heights Proj.) Series 2010, 5% 6/1/30 (FSA Insured) | | 2,500,000 | | 2,744,275 |
Hamilton County Swr. Sys. Rev.: | | | | |
(Metropolitan Swr. District Proj.) Series 2005 B, 5% 12/1/30 (Nat'l. Pub. Fin. Guarantee Corp. Insured) | | 4,000,000 | | 4,364,080 |
Series 06A, 5% 12/1/17 (Nat'l. Pub. Fin. Guarantee Corp. Insured) | | 2,050,000 | | 2,398,664 |
Hamilton Wtrwks. Rev. 5% 10/15/16 (Nat'l. Pub. Fin. Guarantee Corp. Insured) | | 1,000,000 | | 1,022,450 |
Hancock County Hosp. Facilities Rev. (Blanchard Valley Reg'l. Health Ctr. Proj.) Series 2011 A, 6.25% 12/1/34 | | 4,100,000 | | 4,709,055 |
Hilliard Gen. Oblig. 5% 12/1/18 (Nat'l. Pub. Fin. Guarantee Corp. Insured) | | 1,000,000 | | 1,135,390 |
Municipal Bonds - continued |
| Principal Amount | | Value |
Ohio - continued |
Huber Heights City School District Unltd. Tax School Impt. Gen. Oblig. Series 2009, 5% 12/1/36 | | $ 1,500,000 | | $ 1,646,640 |
Huber Heights Wtr. Sys. Rev. 5% 12/1/30 (Nat'l. Pub. Fin. Guarantee Corp. Insured) | | 2,285,000 | | 2,415,131 |
Kent City School District Series 2004, 5% 12/1/20 (Nat'l. Pub. Fin. Guarantee Corp. Insured) | | 1,400,000 | | 1,534,162 |
Kent State Univ. Revs.: | | | | |
Series 2009 B: | | | | |
5% 5/1/26 (Assured Guaranty Corp. Insured) | | 4,100,000 | | 4,610,409 |
5% 5/1/28 (Assured Guaranty Corp. Insured) | | 5,000,000 | | 5,570,150 |
5% 5/1/29 (Assured Guaranty Corp. Insured) | | 1,000,000 | | 1,109,490 |
5% 5/1/30 (Assured Guaranty Corp. Insured) | | 1,115,000 | | 1,232,053 |
Series 2012 A: | | | | |
5% 5/1/24 | | 1,385,000 | | 1,638,497 |
5% 5/1/25 | | 1,500,000 | | 1,756,305 |
5% 5/1/26 | | 1,600,000 | | 1,860,080 |
Kings Local School District 5% 12/1/19 (Nat'l. Pub. Fin. Guarantee Corp. Insured) | | 1,365,000 | | 1,497,446 |
Lake County Hosp. Facilities Rev. (Lake Hosp. Sys., Inc. Proj.) Series 2008 C: | | | | |
5% 8/15/14 | | 2,055,000 | | 2,198,110 |
5% 8/15/15 | | 1,160,000 | | 1,252,406 |
5% 8/15/16 | | 1,260,000 | | 1,392,174 |
5% 8/15/17 | | 1,000,000 | | 1,108,590 |
Lakewood City School District: | | | | |
0% 12/1/15 (FSA Insured) | | 1,500,000 | | 1,425,090 |
0% 12/1/16 (FSA Insured) | | 1,200,000 | | 1,118,148 |
Licking Heights Local School District: | | | | |
5% 12/1/32 (Nat'l. Pub. Fin. Guarantee Corp. Insured) | | 1,500,000 | | 1,606,605 |
5% 12/1/32 (Nat'l. Pub. Fin. Guarantee Corp. Insured) (Pre-Refunded to 6/1/15 @ 100) | | 2,245,000 | | 2,531,170 |
Lucas County Hosp. Rev.: | | | | |
(Promedia Health Care Oblig. Group Proj.): | | | | |
5% 11/15/13 (AMBAC Insured) | | 1,135,000 | | 1,200,512 |
5% 11/15/38 | | 1,090,000 | | 1,135,093 |
(ProMedica Heathcare Oblig. Group Proj.) Series 2011 A, 6.5% 11/15/37 | | 2,800,000 | | 3,415,384 |
Series 2011 D, 5% 11/15/25 | | 5,000,000 | | 5,788,600 |
Lucas-Plaza Hsg. Dev. Corp. Mtg. Rev. (The Plaza Section 8 Assisted Proj.) Series 1991 A, 0% 6/1/24 (Escrowed to Maturity) | | 9,000,000 | | 6,418,170 |
Municipal Bonds - continued |
| Principal Amount | | Value |
Ohio - continued |
Marysville Village School District 5% 12/1/29 (FSA Insured) | | $ 4,000,000 | | $ 4,243,720 |
Marysville Wastewtr. Treatment Sys. Rev.: | | | | |
4% 12/1/20 (XL Cap. Assurance, Inc. Insured) | | 115,000 | | 120,697 |
4.125% 12/1/21 (XL Cap. Assurance, Inc. Insured) | | 85,000 | | 89,304 |
4.15% 12/1/22 (XL Cap. Assurance, Inc. Insured) | | 25,000 | | 26,183 |
Miamisburg City School District: | | | | |
Series 2008, 5% 12/1/33 | | 1,340,000 | | 1,452,801 |
Series 2009, 5% 12/1/23 (Assured Guaranty Corp. Insured) | | 1,405,000 | | 1,600,969 |
Middleburg Heights Hosp. Rev. Series 2011, 5.25% 8/1/41 | | 3,000,000 | | 3,177,450 |
Milford Exempt Village School District 5.25% 12/1/33 | | 5,000,000 | | 5,489,050 |
Montgomery County Rev.: | | | | |
(Catholic Health Initiatives Proj.): | | | | |
Series 2008 D, 6.25% 10/1/33 | | 2,500,000 | | 2,985,725 |
Series C1, 5% 10/1/41 (FSA Insured) | | 5,000,000 | | 5,241,050 |
(Miami Valley Hosp. Proj.) Series 2009 A, 6% 11/15/28 | | 2,000,000 | | 2,137,580 |
Bonds (Catholic Health Initiatives Proj.) Series 2008 D2, 5.25%, tender 11/12/13 (a) | | 2,000,000 | | 2,126,500 |
Series A, 6.25% 11/15/39 | | 2,250,000 | | 2,407,410 |
North Olmsted Gen. Oblig. Series D, 5.25% 12/1/20 (AMBAC Insured) | | 2,075,000 | | 2,366,455 |
Northmont City School District Series 2012 A, 5% 11/1/49 | | 5,000,000 | | 5,446,550 |
Oak Hills Local School District Facilities Construction and Impt. Series B, 6.9% 12/1/12 (Nat'l. Pub. Fin. Guarantee Corp. Insured) | | 500,000 | | 512,840 |
Ohio Air Quality Dev. Auth. Rev. Bonds (FirstEnergy Nuclear Generation Corp. Proj.) Series 2008 C, 7.25%, tender 11/1/12 (a)(b) | | 2,000,000 | | 2,044,580 |
Ohio Bldg. Auth. (Adult Correctional Bldg. Fund Proj.): | | | | |
Series 2009 B, 5% 10/1/24 | | 1,790,000 | | 2,048,870 |
Series 2010 A, 5% 10/1/24 | | 6,030,000 | | 6,961,394 |
Ohio Gen. Oblig.: | | | | |
(College Savings Prog.) 0% 8/1/14 | | 1,375,000 | | 1,341,051 |
(Common Schools Proj.) Series 2006 D, 5% 9/15/21 | | 500,000 | | 568,065 |
(Higher Ed. Cap. Facilities Proj.) Series 2005 B, 5% 5/1/16 | | 1,000,000 | | 1,158,190 |
(Infrastructure Impt. Proj.) Series A, 5% 3/1/26 | | 1,850,000 | | 2,037,775 |
Series 2006 D, 5% 9/15/20 | | 5,000,000 | | 5,700,100 |
Municipal Bonds - continued |
| Principal Amount | | Value |
Ohio - continued |
Ohio Gen. Oblig.: - continued | | | | |
Series 2008 A: | | | | |
5.375% 9/1/23 | | $ 1,165,000 | | $ 1,385,208 |
5.375% 9/1/28 | | 7,210,000 | | 8,458,556 |
Series 2011 A, 5% 9/15/21 | | 6,450,000 | | 8,024,703 |
Series 2012 A, 5% 2/1/27 | | 5,000,000 | | 5,884,550 |
Series 2012 B: | | | | |
5% 9/1/21 | | 1,390,000 | | 1,728,048 |
5% 3/15/25 | | 7,500,000 | | 8,936,325 |
Series Q, 5% 4/1/25 | | 1,845,000 | | 2,199,830 |
Ohio Higher Edl. Facility Commission Rev.: | | | | |
(Case Western Reserve Univ. Proj.): | | | | |
Series 1990 B, 6.5% 10/1/20 | | 2,335,000 | | 2,881,787 |
Series 1994: | | | | |
6.125% 10/1/15 | | 2,000,000 | | 2,310,560 |
6.25% 10/1/16 | | 2,500,000 | | 3,008,700 |
(Cleveland Clinic Foundation Proj.) Series 2008 A: | | | | |
5.25% 1/1/33 | | 1,635,000 | | 1,794,723 |
5.5% 1/1/43 | | 3,500,000 | | 3,824,870 |
(John Carroll Univ. Proj.) 5% 4/1/17 | | 1,000,000 | | 1,102,210 |
(Kenyon College Proj.) Series 2010, 5.25% 7/1/44 | | 2,750,000 | | 2,953,885 |
(Univ. Hosp. Health Sys. Proj.): | | | | |
Series 2007 A, 5.25% 1/15/46 | | 4,000,000 | | 4,113,360 |
Series 2010 A, 5.25% 1/15/23 | | 2,500,000 | | 2,835,050 |
(Univ. of Dayton Proj.): | | | | |
Series 2004, 5% 12/1/17 (AMBAC Insured) | | 2,170,000 | | 2,346,074 |
Series 2009, 5.5% 12/1/36 | | 5,000,000 | | 5,431,700 |
Ohio Hosp. Facilities Rev.: | | | | |
(Cleveland Clinic Proj.) Series 2009 A, 5.5% 1/1/39 | | 7,000,000 | | 7,780,640 |
Series 2011 A, 5% 1/1/32 | | 3,500,000 | | 3,888,115 |
Ohio Muni. Elec. Gen. Agcy. (Belleville Hydroelectric Proj.) 5% 2/15/17 (AMBAC Insured) | | 1,215,000 | | 1,288,435 |
Ohio Solid Waste Disp. Rev. (Cargill, Inc. Proj.) 4.95% 9/1/20 (b) | | 3,000,000 | | 3,009,210 |
Ohio State Univ. Gen. Receipts: | | | | |
Series 2008 A, 5% 12/1/26 | | 2,225,000 | | 2,615,621 |
Series B, 5.25% 6/1/16 | | 915,000 | | 955,068 |
Ohio Tpk. Commission Tpk. Rev.: | | | | |
Series 1998 A, 5.5% 2/15/20 (Nat'l. Pub. Fin. Guarantee Corp. Insured) | | 3,000,000 | | 3,725,880 |
Series 2010 A, 5% 2/15/31 | | 5,000,000 | | 5,571,350 |
Municipal Bonds - continued |
| Principal Amount | | Value |
Ohio - continued |
Ohio Univ. Gen. Receipts Athens: | | | | |
Series 2004, 5% 12/1/18 (Pre-Refunded to 6/1/14 @ 100) | | $ 1,980,000 | | $ 2,153,903 |
Series A, 5% 12/1/33 (FSA Insured) | | 1,190,000 | | 1,282,475 |
Series B, 5% 12/1/31 (FSA Insured) | | 3,540,000 | | 3,786,278 |
Ohio Wtr. Dev. Auth. Poll. Cont. Facilities Rev. Bonds (FirstEnergy Corp. Proj.) Series 2009 A, 5.875%, tender 6/1/16 (a) | | 1,000,000 | | 1,125,610 |
Ohio Wtr. Dev. Auth. Rev.: | | | | |
(Drinking Wtr. Fund Prog.): | | | | |
Series 2004, 5% 12/1/17 | | 80,000 | | 86,595 |
Series 2005: | | | | |
5.25% 6/1/18 | | 2,610,000 | | 3,207,533 |
5.25% 12/1/18 | | 2,610,000 | | 3,241,620 |
(Fresh Wtr. Impt. Proj.): | | | | |
Series 2005, 5.5% 6/1/17 | | 4,710,000 | | 5,737,251 |
Series 2009 B, 5% 12/1/24 | | 1,025,000 | | 1,310,719 |
Series B, 5.5% 6/1/16 (FSA Insured) | | 1,560,000 | | 1,847,976 |
(Fresh Wtr. Proj.) Series 2009 B, 5% 12/1/25 | | 1,950,000 | | 2,494,655 |
(Pure Wtr. Proj.) Series I, 6% 12/1/16 (Escrowed to Maturity) | | 1,000,000 | | 1,101,630 |
5.25% 12/1/15 (Nat'l. Pub. Fin. Guarantee Corp. Insured) | | 1,180,000 | | 1,346,640 |
5.25% 6/1/17 (Nat'l. Pub. Fin. Guarantee Corp. Insured) | | 1,160,000 | | 1,381,316 |
Ohio Wtr. Dev. Auth. Wtr. Poll. Cont. Rev.: | | | | |
(Wtr. Quality Proj.): | | | | |
Series 2010 A: | | | | |
5% 12/1/29 | | 2,000,000 | | 2,301,040 |
5% 6/1/30 | | 1,000,000 | | 1,145,480 |
Series 2010, 5% 12/1/22 | | 3,000,000 | | 3,630,360 |
Series 2005 B, 0% 12/1/14 | | 1,500,000 | | 1,467,240 |
5.25% 12/1/19 | | 1,975,000 | | 2,484,372 |
Olentangy Local School District: | | | | |
5% 12/1/30 (FSA Insured) | | 4,025,000 | | 4,427,057 |
5% 12/1/36 | | 2,700,000 | | 2,923,290 |
Reynoldsburg City School District (School Facilities Construction & Impt. Proj.): | | | | |
0% 12/1/16 | | 1,250,000 | | 1,144,075 |
0% 12/1/17 | | 1,250,000 | | 1,107,600 |
5% 12/1/32 | | 1,500,000 | | 1,639,140 |
RiverSouth Auth. Rev. Series 2005 A, 5.25% 12/1/15 | | 1,000,000 | | 1,137,610 |
Municipal Bonds - continued |
| Principal Amount | | Value |
Ohio - continued |
Rocky River Gen. Oblig. 5% 12/1/19 (AMBAC Insured) | | $ 2,125,000 | | $ 2,296,381 |
Ross County Hosp. Facilities Rev. (Adena Health Sys. Proj.) Series 2008, 5.75% 12/1/35 | | 2,600,000 | | 2,839,408 |
Scioto County Marine Term. Facilities Rev. (Norfolk Southern Corp. Proj.) 5.3% 8/15/13 | | 3,000,000 | | 3,005,790 |
Sharonville Gen. Oblig. 5.25% 6/1/16 (Nat'l. Pub. Fin. Guarantee Corp. Insured) | | 1,410,000 | | 1,466,485 |
Springboro Cmnty. City School District 5.25% 12/1/20 (FSA Insured) | | 2,780,000 | | 3,356,266 |
St. Marys City School District: | | | | |
5% 12/1/27 (FSA Insured) | | 470,000 | | 515,449 |
5% 12/1/35 (FSA Insured) | | 2,500,000 | | 2,665,450 |
Strongsville Gen. Oblig. (Street Impt. Proj.) Series 2009, 5% 12/1/27 | | 1,680,000 | | 2,020,166 |
Summit County Gen. Oblig.: | | | | |
5.25% 12/1/20 | | 1,645,000 | | 1,734,949 |
5.25% 12/1/21 | | 1,740,000 | | 1,832,394 |
Sylvania City School District Series 2009, 5.25% 12/1/36 (Assured Guaranty Corp. Insured) | | 7,055,000 | | 7,593,649 |
Tallmadge School District Gen. Oblig. 5% 12/1/31 (FSA Insured) | | 4,000,000 | | 4,279,640 |
Toledo City School District (School Facilities Impt. Proj.) Series 2009, 5.375% 12/1/35 | | 1,000,000 | | 1,109,150 |
Toledo Wtrwks. Rev.: | | | | |
5% 11/15/16 (AMBAC Insured) | | 1,110,000 | | 1,170,639 |
5% 11/15/30 (Nat'l. Pub. Fin. Guarantee Corp. Insured) | | 3,500,000 | | 3,731,350 |
Univ. of Akron Gen. Receipts: | | | | |
Series A, 5.25% 1/1/30 (FSA Insured) | | 3,000,000 | | 3,304,140 |
Series B, 5% 1/1/27 (Nat'l. Pub. Fin. Guarantee Corp. Insured) | | 1,405,000 | | 1,443,539 |
Univ. of Cincinnati Gen. Receipts: | | | | |
Series 2004 A: | | | | |
5% 6/1/18 (AMBAC Insured) | | 1,445,000 | | 1,554,950 |
5% 6/1/19 (AMBAC Insured) | | 1,520,000 | | 1,630,565 |
Series 2008 C: | | | | |
5% 6/1/22 (FSA Insured) | | 1,000,000 | | 1,139,980 |
5% 6/1/23 (FSA Insured) | | 2,000,000 | | 2,261,160 |
5% 6/1/24 (FSA Insured) | | 2,000,000 | | 2,243,700 |
Series 2010 F, 5% 6/1/32 | | 2,000,000 | | 2,238,400 |
Series 2012 A: | | | | |
5% 6/1/22 | | 2,000,000 | | 2,438,240 |
5% 6/1/23 | | 2,000,000 | | 2,407,060 |
Municipal Bonds - continued |
| Principal Amount | | Value |
Ohio - continued |
Vandalia-Butler City School District Series 2010, 5% 12/1/38 | | $ 2,170,000 | | $ 2,396,179 |
Warren County Gen. Oblig. 6.1% 12/1/12 | | 85,000 | | 87,039 |
West Muskingum Local School District School Facilities Construction and Impt. 5% 12/1/30 (Nat'l. Pub. Fin. Guarantee Corp. Insured) | | 670,000 | | 677,578 |
Wright State Univ. Gen. Receipts: | | | | |
Series 2011 A, 5% 5/1/23 | | 2,665,000 | | 3,020,111 |
5% 5/1/17 (Nat'l. Pub. Fin. Guarantee Corp. Insured) | | 1,375,000 | | 1,452,220 |
5% 5/1/18 (Nat'l. Pub. Fin. Guarantee Corp. Insured) | | 1,440,000 | | 1,513,973 |
5% 5/1/19 (Nat'l. Pub. Fin. Guarantee Corp. Insured) | | 1,515,000 | | 1,586,705 |
| | 575,030,795 |
Puerto Rico - 2.7% |
Puerto Rico Commonwealth Aqueduct & Swr. Auth. Series 2012 A: | | | | |
5.25% 7/1/42 | | 1,500,000 | | 1,484,340 |
5.75% 7/1/37 | | 1,900,000 | | 1,986,640 |
Puerto Rico Elec. Pwr. Auth. Pwr. Rev.: | | | | |
Series KK, 5.5% 7/1/15 | | 1,800,000 | | 2,005,200 |
Series QQ, 5.5% 7/1/17 (XL Cap. Assurance, Inc. Insured) | | 1,300,000 | | 1,481,857 |
Puerto Rico Pub. Bldg. Auth. Rev.: | | | | |
Bonds Series M2, 5.75%, tender 7/1/17 (a) | | 1,000,000 | | 1,103,140 |
Series G, 5.25% 7/1/13 | | 1,000,000 | | 1,000,840 |
Puerto Rico Sales Tax Fing. Corp. Sales Tax Rev.: | | | | |
Series 2007 A: | | | | |
0% 8/1/41 (Nat'l. Pub. Fin. Guarantee Corp. Insured) | | 9,300,000 | | 1,809,873 |
0% 8/1/45 (Nat'l. Pub. Fin. Guarantee Corp. Insured) | | 1,100,000 | | 168,179 |
0% 8/1/47 (AMBAC Insured) | | 1,000,000 | | 135,090 |
Series 2009 A, 6% 8/1/42 | | 1,000,000 | | 1,114,290 |
Series 2010 C, 6% 8/1/39 | | 1,800,000 | | 2,034,270 |
Series 2011 C: | | | | |
0% 8/1/39 | | 6,990,000 | | 1,550,732 |
0% 8/1/41 | | 1,600,000 | | 311,376 |
| | 16,185,827 |
Virgin Islands - 0.5% |
Virgin Islands Pub. Fin. Auth.: | | | | |
(Cruzan Proj.) Series 2009 A, 6% 10/1/39 | | 1,000,000 | | 1,102,100 |
Municipal Bonds - continued |
| Principal Amount | | Value |
Virgin Islands - continued |
Virgin Islands Pub. Fin. Auth.: - continued | | | | |
Series 2009 A, 6.75% 10/1/37 | | $ 1,000,000 | | $ 1,150,260 |
Series 2009 B, 5% 10/1/25 | | 1,000,000 | | 1,079,860 |
| | 3,332,220 |
TOTAL INVESTMENT PORTFOLIO - 98.9% (Cost $556,882,431) | 596,152,954 |
NET OTHER ASSETS (LIABILITIES) - 1.1% | 6,680,260 |
NET ASSETS - 100% | $ 602,833,214 |
Legend |
(a) Coupon rates for floating and adjustable rate securities reflect the rates in effect at period end. |
(b) Private activity obligations whose interest is subject to the federal alternative minimum tax for individuals. |
Other Information |
All investments are categorized as Level 2 under the Fair Value Hierarchy. The inputs or methodology used for valuing securities may not be an indication of the risk associated with investing in those securities. For more information on valuation inputs, please refer to the Security Valuation section in the accompanying Notes to Financial Statements. |
Other Information |
The distribution of municipal securities by revenue source, as a percentage of total net assets, is as follows (Unaudited): |
General Obligations | 36.6% |
Health Care | 17.9% |
Education | 14.9% |
Water & Sewer | 10.6% |
Electric Utilities | 5.5% |
Special Tax | 5.5% |
Others* (Individually Less Than 5%) | 9.0% |
| 100.0% |
* Includes net other assets |
See accompanying notes which are an integral part of the financial statements.
Semiannual Report
Fidelity Ohio Municipal Income Fund
Statement of Assets and Liabilities
| June 30, 2012 (Unaudited) |
| | |
Assets | | |
Investment in securities, at value - See accompanying schedule: Unaffiliated issuers (cost $556,882,431) | | $ 596,152,954 |
Cash | | 12,468,645 |
Receivable for investments sold | | 8,409,627 |
Receivable for fund shares sold | | 384,959 |
Interest receivable | | 4,786,540 |
Other receivables | | 3,758 |
Total assets | | 622,206,483 |
| | |
Liabilities | | |
Payable for investments purchased | $ 18,240,551 | |
Payable for fund shares redeemed | 103,665 | |
Distributions payable | 660,804 | |
Accrued management fee | 182,645 | |
Other affiliated payables | 158,211 | |
Other payables and accrued expenses | 27,393 | |
Total liabilities | | 19,373,269 |
| | |
Net Assets | | $ 602,833,214 |
Net Assets consist of: | | |
Paid in capital | | $ 563,038,974 |
Undistributed net investment income | | 60,417 |
Accumulated undistributed net realized gain (loss) on investments | | 463,300 |
Net unrealized appreciation (depreciation) on investments | | 39,270,523 |
Net Assets, for 49,331,710 shares outstanding | | $ 602,833,214 |
Net Asset Value, offering price and redemption price per share ($602,833,214 ÷ 49,331,710 shares) | | $ 12.22 |
See accompanying notes which are an integral part of the financial statements.
Semiannual Report
Fidelity Ohio Municipal Income Fund
Financial Statements - continued
Statement of Operations
Six months ended June 30, 2012 (Unaudited) |
| | |
Investment Income | | |
Interest | | $ 11,620,119 |
| | |
Expenses | | |
Management fee | $ 1,068,001 | |
Transfer agent fees | 242,696 | |
Accounting fees and expenses | 71,327 | |
Custodian fees and expenses | 3,463 | |
Independent trustees' compensation | 1,043 | |
Registration fees | 20,446 | |
Audit | 23,233 | |
Legal | 1,029 | |
Miscellaneous | 2,900 | |
Total expenses before reductions | 1,434,138 | |
Expense reductions | (6,796) | 1,427,342 |
Net investment income (loss) | | 10,192,777 |
Realized and Unrealized Gain (Loss) Net realized gain (loss) on: | | |
Investment securities: | | |
Unaffiliated issuers | | 649,941 |
Change in net unrealized appreciation (depreciation) on investment securities | | 9,376,587 |
Net gain (loss) | | 10,026,528 |
Net increase (decrease) in net assets resulting from operations | | $ 20,219,305 |
See accompanying notes which are an integral part of the financial statements.
Semiannual Report
Statement of Changes in Net Assets
| Six months ended June 30, 2012
(Unaudited) | Year ended
December 31, 2011 |
Increase (Decrease) in Net Assets | | |
Operations | | |
Net investment income (loss) | $ 10,192,777 | $ 20,003,125 |
Net realized gain (loss) | 649,941 | 800,331 |
Change in net unrealized appreciation (depreciation) | 9,376,587 | 27,060,115 |
Net increase (decrease) in net assets resulting
from operations | 20,219,305 | 47,863,571 |
Distributions to shareholders from net investment income | (10,127,226) | (20,007,020) |
Distributions to shareholders from net realized gain | (94,399) | - |
Total distributions | (10,221,625) | (20,007,020) |
Share transactions
Proceeds from sales of shares | 58,514,448 | 81,031,529 |
Reinvestment of distributions | 6,338,910 | 12,501,977 |
Cost of shares redeemed | (26,960,248) | (99,473,703) |
Net increase (decrease) in net assets resulting from share transactions | 37,893,110 | (5,940,197) |
Redemption fees | 543 | 1,055 |
Total increase (decrease) in net assets | 47,891,333 | 21,917,409 |
| | |
Net Assets | | |
Beginning of period | 554,941,881 | 533,024,472 |
End of period (including undistributed net investment income of $60,417 and distributions in excess of net investment income of $5,134, respectively) | $ 602,833,214 | $ 554,941,881 |
Other Information Shares | | |
Sold | 4,809,355 | 6,982,450 |
Issued in reinvestment of distributions | 519,745 | 1,074,162 |
Redeemed | (2,217,633) | (8,656,173) |
Net increase (decrease) | 3,111,467 | (599,561) |
See accompanying notes which are an integral part of the financial statements.
Semiannual Report
Financial Highlights
| Six months ended June 30, 2012 | Years ended December 31, |
| (Unaudited) | 2011 | 2010 | 2009 | 2008 | 2007 |
Selected Per-Share Data | | | | | |
Net asset value, beginning of period | $ 12.01 | $ 11.38 | $ 11.60 | $ 10.87 | $ 11.51 | $ 11.60 |
Income from Investment Operations | | | | | | |
Net investment income (loss) D | .212 | .443 | .447 | .455 | .449 | .444 |
Net realized and unrealized gain (loss) | .211 | .630 | (.216) | .737 | (.632) | (.040) |
Total from investment operations | .423 | 1.073 | .231 | 1.192 | (.183) | .404 |
Distributions from net investment income | (.211) | (.443) | (.447) | (.455) | (.449) | (.444) |
Distributions from net realized gain | (.002) | - | (.004) | (.007) | (.008) | (.050) |
Total distributions | (.213) | (.443) | (.451) | (.462) | (.457) | (.494) |
Redemption fees added to paid in capital D, F | - | - | - | - | - | - |
Net asset value, end of period | $ 12.22 | $ 12.01 | $ 11.38 | $ 11.60 | $ 10.87 | $ 11.51 |
Total Return B, C | 3.54% | 9.62% | 1.95% | 11.11% | (1.62)% | 3.59% |
Ratios to Average Net AssetsE | | | | | |
Expenses before reductions | .49% A | .49% | .49% | .50% | .49% | .49% |
Expenses net of fee waivers, if any | .49% A | .49% | .49% | .50% | .49% | .49% |
Expenses net of all reductions | .49% A | .49% | .48% | .50% | .47% | .45% |
Net investment income (loss) | 3.51% A | 3.81% | 3.82% | 3.99% | 4.01% | 3.88% |
Supplemental Data | | | | | | |
Net assets, end of period (000 omitted) | $ 602,833 | $ 554,942 | $ 533,024 | $ 523,499 | $ 429,831 | $ 424,400 |
Portfolio turnover rate | 12% A | 8% | 7% | 10% | 11% | 22% |
A Annualized
B Total returns for periods of less than one year are not annualized.
C Total returns would have been lower if certain expenses had not been reduced during the applicable periods shown.
D Calculated based on average shares outstanding during the period.
E Expense ratios reflect operating expenses of the Fund. Expenses before reductions do not reflect amounts reimbursed by the investment adviser or reductions from expense offset arrangements and do not represent the amount paid by the Fund during periods when reimbursements or reductions occur. Expenses net of fee waivers reflect expenses after reimbursement by the investment adviser but prior to reductions from expense offset arrangements. Expenses net of all reductions represent the net expenses paid by the Fund.
F Amount represents less than $.001 per share.
See accompanying notes which are an integral part of the financial statements.
Semiannual Report
Fidelity Ohio Municipal Money Market Fund
Effective Maturity Diversification |
Days | % of fund's investments 6/30/12 | % of fund's investments 12/31/11 | % of fund's
investments
6/30/11 |
1 - 7 | 77.1 | 77.0 | 76.6 |
8 - 30 | 1.9 | 0.2 | 1.4 |
31 - 60 | 1.7 | 1.6 | 0.9 |
61 - 90 | 2.2 | 1.7 | 2.5 |
91 - 180 | 11.0 | 12.9 | 9.7 |
> 180 | 6.1 | 6.6 | 8.9 |
Effective maturity is determined in accordance with the requirements of Rule 2a-7 under the Investment Company Act of 1940. |
Weighted Average Maturity |
| 6/30/12 | 12/31/11 | 6/30/11 |
Fidelity Ohio Municipal Money Market Fund | 46 Days | 43 Days | 48 Days |
Ohio Tax-Free Money Market Average * | 42 Days | 37 Days | 38 Days |
This is a weighted average of all the maturities of the securities held in a fund. Weighted Average Maturity (WAM) can be used as a measure of sensitivity to interest rate changes and market changes. Generally, the longer the maturity, the greater the sensitivity to such changes. WAM is based on the dollar-weighted average length of time until principal payments must be paid. Depending on the types of securities held in a fund, certain maturity shortening devices (e.g., demand features, interest rate resets, and call options) may be taken into account when calculating the WAM. |
Weighted Average Life |
| 6/30/12 | 12/31/11 | 6/30/11 |
Fidelity Ohio Municipal Money Market Fund | 46 Days | 43 Days | 48 Days |
Weighted Average Life (WAL) is the weighted average of the life of the securities held in a fund or portfolio and can be used as a measure of sensitivity to changes in liquidity and/or credit risk. Generally, the higher the value, the greater the sensitivity. WAL is based on the dollar-weighted average length of time until principal payments must be paid, taking into account any call options exercised by the issuer and any permissible maturity shortening features other than interest rate resets. The difference between WAM and WAL is that WAM takes into account interest rate resets and WAL does not. WAL for money market funds is not the same as WAL of a mortgage- or asset-backed security. |
Asset Allocation (% of fund's net assets) |
As of June 30, 2012 | As of December 31, 2011 |
 | Variable Rate
Demand Notes
(VRDNs) 65.2% | |  | Variable Rate
Demand Notes
(VRDNs) 66.8% | |
 | Other
Municipal Debt 26.8% | | | Other
Municipal Debt 23.6% | |
 | Investment
Companies 9.1% | |  | Investment
Companies 9.1% | |
 | Net Other Assets (Liabilities)** (1.1)% | |  | Net Other Assets (Liabilities) 0.5% | |

* Source: iMoneyNet, Inc.
** Net Other Assets are not included in the pie chart.
Semiannual Report
Fidelity Ohio Municipal Money Market Fund
Investment Changes/Performance (Unaudited) - continued
Current and Historical Seven-Day Yields
| 6/30/12 | 3/31/12 | 1/2/12 | 10/3/11 | 6/27/11 |
Fidelity Ohio Municipal Money Market Fund | 0.01% | 0.01% | 0.01% | 0.01% | 0.01% |
Yield refers to the income paid by the fund over a given period. Yields for money market funds are usually for seven-day periods, as they are here, though they are expressed as annual percentage rates. Past performance is no guarantee of future results. Yield will vary and it's possible to lose money investing in the Fund. A portion of the fund's expenses was reimbursed and/or waived. Absent such reimbursements and/or waivers the yield for the period ending June 30, 2012, the most recent period shown in the table, would have been -0.30%.
Semiannual Report
Fidelity Ohio Municipal Money Market Fund
Investments June 30, 2012 (Unaudited)
Showing Percentage of Net Assets
Variable Rate Demand Note - 65.2% |
| Principal Amount | | Value |
Alabama - 0.0% |
Decatur Indl. Dev. Board Exempt Facilities Rev. (Nucor Steel Decatur LLC Proj.) Series 2003 A, 0.24% 7/6/12, VRDN (a)(c) | $ 700,000 | | $ 700,000 |
Delaware - 0.1% |
Delaware Econ. Dev. Auth. Rev. (Delmarva Pwr. & Lt. Co. Proj.) Series 1987, 0.34% 7/2/12, VRDN (a)(c) | 1,100,000 | | 1,100,000 |
Georgia - 0.1% |
Burke County Indl. Dev. Auth. Poll. Cont. Rev. (Georgia Pwr. Co. Plant Vogtle Proj.) Eighth Series 1994, 0.25% 7/2/12, VRDN (a) | 1,110,000 | | 1,110,000 |
Iowa - 0.4% |
Iowa Fin. Auth. Health Facilities Rev. (Iowa Health Sys. Proj.) Series 2009 D, 0.38% 7/2/12, LOC Bank of America NA, VRDN (a) | 4,000,000 | | 4,000,000 |
Kentucky - 0.1% |
Elizabethtown Indl. Bldg. Rev. (Altec Industries, Inc. Proj.) Series 1997, 0.26% 7/6/12, LOC Wells Fargo Bank NA, VRDN (a)(c) | 1,000,000 | | 1,000,000 |
New Jersey - 0.1% |
Salem County Poll. Cont. Fin. Auth. Rev. (Pub. Svc. Elec. and Gas Co. Proj.) Series 2012 A, 0.45% 7/6/12, VRDN (a)(c) | 700,000 | | 700,000 |
Ohio - 63.6% |
Akron Bath Copley Hosp. District Rev. (Akron Gen. Health Systems Proj.) Series 2008, 0.22% 7/6/12, LOC JPMorgan Chase Bank, VRDN (a) | 6,700,000 | | 6,700,000 |
Allen County Hosp. Facilities Rev. (Catholic Healthcare Partners Proj.): | | | |
Series 2008 A, 0.21% 7/2/12, LOC Bank of America NA, VRDN (a) | 20,000,000 | | 20,000,000 |
Series 2010 D, 0.17% 7/6/12, LOC JPMorgan Chase Bank, VRDN (a) | 41,400,000 | | 41,400,000 |
Alliance Hosp. Rev. (Alliance Obligated Group Proj.) Series 2003, 0.2% 7/2/12, LOC JPMorgan Chase Bank, VRDN (a) | 2,045,000 | | 2,045,000 |
Cincinnati Wtr. Sys. Rev. Participating VRDN Series MS 3280, 0.27% 7/6/12 (Liquidity Facility Morgan Stanley Bank, West Valley City Utah) (a)(d) | 3,330,000 | | 3,330,000 |
Cleveland Arpt. Sys. Rev.: | | | |
Series 2009 A, 0.18% 7/6/12, LOC Bank of New York, New York, VRDN (a)(c) | 10,800,000 | | 10,800,000 |
Series 2009 D, 0.15% 7/6/12, LOC PNC Bank NA, VRDN (a) | 20,785,000 | | 20,785,000 |
Columbus City School District Participating VRDN Series 1488, 0.2% 7/6/12 (Liquidity Facility JPMorgan Chase Bank) (a)(d) | 10,945,000 | | 10,945,000 |
Variable Rate Demand Note - continued |
| Principal Amount | | Value |
Ohio - continued |
Columbus Gen. Oblig.: | | | |
(San. Swr. Proj.) Series 2006 1, 0.16% 7/6/12, VRDN (a) | $ 11,580,000 | | $ 11,580,000 |
Participating VRDN Series Clipper 08 2, 0.18% 7/6/12 (Liquidity Facility State Street Bank & Trust Co., Boston) (a)(d) | 4,000,000 | | 4,000,000 |
Columbus Swr. Sys. Rev. Participating VRDN Series Putters 2456, 0.18% 7/6/12 (Liquidity Facility JPMorgan Chase Bank) (a)(d) | 1,400,000 | | 1,400,000 |
Cuyahoga County Health Care Facilities Rev. (Altenheim Proj.) 0.2% 7/6/12, LOC U.S. Bank NA, Cincinnati, VRDN (a) | 10,690,000 | | 10,690,000 |
Cuyahoga County Hosp. Facilities Rev. (Sisters of Charity of Saint Augustine Health Sys. Proj.) Series 2000, 0.15% 7/6/12, LOC PNC Bank NA, VRDN (a) | 3,500,000 | | 3,500,000 |
Cuyahoga County Hsg. Rev. (Euclid Avenue Hsg. Corp. Proj.) Series 2009 A, 0.15% 7/6/12, LOC PNC Bank NA, VRDN (a) | 16,000,000 | | 16,000,000 |
Cuyahoga County Indl. Dev. Rev. (Pubco Corp. Proj.) Series 2001, 0.36% 7/6/12, LOC PNC Bank NA, VRDN (a)(c) | 440,000 | | 440,000 |
Franklin County Hosp. Rev.: | | | |
(OhioHealth Corp. Proj.) Series D, 0.17% 7/6/12, LOC U.S. Bank NA, Cincinnati, VRDN (a) | 1,000,000 | | 1,000,000 |
(U.S. Health Corp. of Columbus Proj.) Series 1996 B, 0.17% 7/6/12, LOC U.S. Bank NA, Cincinnati, VRDN (a) | 8,575,000 | | 8,575,000 |
Participating VRDN Series WF 11 78C, 0.19% 7/6/12 (Liquidity Facility Wells Fargo Bank NA) (a)(d) | 12,035,000 | | 12,035,000 |
Geauga County Rev. (South Franklin Circle Proj.): | | | |
Series 2007 A, 0.4% 7/2/12, LOC KeyBank NA, VRDN (a) | 5,095,000 | | 5,095,000 |
Series 2007B, 0.4% 7/2/12, LOC KeyBank NA, VRDN (a) | 2,500,000 | | 2,500,000 |
Hamilton County Health Care Facilities Rev.: | | | |
(Deaconess Long Term. Care, Inc. Proj.) Series 2000 A, 0.19% 7/6/12, LOC JPMorgan Chase Bank, VRDN (a) | 8,150,000 | | 8,150,000 |
(The Children's Home of Cincinnati Proj.) Series 2009, 0.18% 7/6/12, LOC U.S. Bank NA, Cincinnati, VRDN (a) | 3,365,000 | | 3,365,000 |
Hamilton County Healthcare Rev. (Life Enriching Cmntys. Proj.): | | | |
Series 2006 C, 0.19% 7/6/12, LOC PNC Bank NA, VRDN (a) | 8,415,000 | | 8,415,000 |
Series 2011 B, 0.19% 7/6/12, LOC PNC Bank NA, VRDN (a) | 2,700,000 | | 2,700,000 |
Hamilton County Hosp. Facilities Rev. (Children's Hosp. Med. Ctr. Proj.): | | | |
Series 1997 A, 0.18% 7/6/12, LOC PNC Bank NA, VRDN (a) | 12,580,000 | | 12,580,000 |
Series 2000, 0.19% 7/6/12, LOC JPMorgan Chase Bank, VRDN (a) | 6,915,000 | | 6,915,000 |
Variable Rate Demand Note - continued |
| Principal Amount | | Value |
Ohio - continued |
Hamilton County Hosp. Facilities Rev. (Children's Hosp. Med. Ctr. Proj.): - continued | | | |
Series 2002 I, 0.18% 7/6/12, LOC U.S. Bank NA, Cincinnati, VRDN (a) | $ 17,335,000 | | $ 17,335,000 |
Kent State Univ. Revs. Series 2008 B, 0.3% 7/6/12, LOC Bank of America NA, VRDN (a) | 44,400,000 | | 44,400,000 |
Lake County Indl. Dev. Rev. (Norshar Co. Proj.) 0.38% 7/6/12, LOC JPMorgan Chase Bank, VRDN (a)(c) | 2,100,000 | | 2,100,000 |
Lancaster Port Auth. Gas Rev. 0.18% 7/6/12 (Liquidity Facility Royal Bank of Canada), VRDN (a) | 44,245,000 | | 44,245,000 |
Lima Hosp. Rev. (Lima Memorial Hosp. Proj.) 0.18% 7/6/12, LOC JPMorgan Chase Bank, VRDN (a) | 905,000 | | 905,000 |
Lorain County Port Auth. Edl. Facilities Rev. (St. Ignatius High School Proj.) 0.17% 7/6/12, LOC U.S. Bank NA, Cincinnati, VRDN (a) | 2,250,000 | | 2,250,000 |
Middletown Dev. Rev. (Bishop Fenwick High School Proj.) 0.25% 7/6/12, LOC JPMorgan Chase Bank, VRDN (a) | 8,990,000 | | 8,990,000 |
Middletown Hosp. Facilities Rev. (Atrium Med. Ctr. Obligated Group Proj.) Series 2008 A, 0.2% 7/6/12, LOC JPMorgan Chase Bank, VRDN (a) | 4,615,000 | | 4,615,000 |
Montgomery County Rev. Participating VRDN Series Floaters 3260, 0.27% 7/6/12 (Liquidity Facility Morgan Stanley Bank, West Valley City Utah) (a)(d) | 8,965,000 | | 8,965,000 |
Ohio Air Quality Dev. Auth. Rev.: | | | |
(Cincinnati Gas & Elec. Co. Proj.): | | | |
Series A, 0.39% 7/6/12, VRDN (a) | 2,400,000 | | 2,400,000 |
Series B, 0.38% 7/6/12, VRDN (a) | 2,700,000 | | 2,700,000 |
(Dayton Pwr. & Lt. Co. Proj.) Series 2008 A, 0.2% 7/6/12, LOC JPMorgan Chase Bank, VRDN (a)(c) | 13,700,000 | | 13,700,000 |
(Ohio Valley Elec. Corp. Proj.): | | | |
Series 2009 C, 0.16% 7/6/12, LOC Bank of Tokyo-Mitsubishi UFJ Ltd., VRDN (a) | 12,100,000 | | 12,100,000 |
Series 2009 D, 0.17% 7/6/12, LOC Bank of Tokyo-Mitsubishi UFJ Ltd., VRDN (a) | 24,400,000 | | 24,400,000 |
(Timken Co. Proj.) 0.37% 7/6/12, LOC KeyBank NA, VRDN (a) | 800,000 | | 800,000 |
Ohio Higher Edl. Facility Commission Rev.: | | | |
(Case Western Reserve Univ. Proj.) Series 2008 A, 0.17% 7/6/12, LOC PNC Bank NA, VRDN (a) | 32,900,000 | | 32,900,000 |
(Ohio Northern Univ. Proj.) Series 2008 A, 0.19% 7/6/12, LOC JPMorgan Chase Bank, VRDN (a) | 14,000,000 | | 14,000,000 |
(Univ. Hosp. Health Sys. Proj.) Series 2008 B, 0.23% 7/6/12, LOC RBS Citizens NA, VRDN (a) | 10,000,000 | | 10,000,000 |
Variable Rate Demand Note - continued |
| Principal Amount | | Value |
Ohio - continued |
Ohio Higher Edl. Facility Commission Rev.: - continued | | | |
(Xavier Univ. Proj.): | | | |
Series 2008 A, 0.15% 7/6/12, LOC U.S. Bank NA, Cincinnati, VRDN (a) | $ 9,100,000 | | $ 9,100,000 |
Series B, 0.15% 7/6/12, LOC PNC Bank NA, VRDN (a) | 3,000,000 | | 3,000,000 |
Ohio Hosp. Facilities Rev. Participating VRDN: | | | |
Series Putters 3552, 0.18% 7/6/12 (Liquidity Facility JPMorgan Chase Bank) (a)(d) | 2,440,000 | | 2,440,000 |
Series Putters 3558, 0.18% 7/6/12 (Liquidity Facility JPMorgan Chase Bank) (a)(d) | 1,200,000 | | 1,200,000 |
Ohio Hsg. Fin. Agcy. Mtg. Rev.: | | | |
(Mtg.-Backed Securities Prog.): | | | |
Series 2005 B1, 0.18% 7/6/12 (Liquidity Facility Fed. Home Ln. Bank, Cincinnati), VRDN (a)(c) | 7,500,000 | | 7,500,000 |
Series 2005 B2, 0.21% 7/6/12 (Liquidity Facility Fed. Home Ln. Bank, Cincinnati), VRDN (a)(c) | 5,000,000 | | 5,000,000 |
Series 2005 F, 0.21% 7/6/12 (Liquidity Facility Fed. Home Ln. Bank, Cincinnati), VRDN (a)(c) | 14,800,000 | | 14,800,000 |
Series F, 0.17% 7/6/12 (Liquidity Facility Fed. Home Ln. Bank, Cincinnati), VRDN (a)(c) | 2,000,000 | | 2,000,000 |
Participating VRDN: | | | |
Series Clipper 06 8, 0.3% 7/6/12 (Liquidity Facility State Street Bank & Trust Co., Boston) (a)(c)(d) | 1,230,000 | | 1,230,000 |
Series Merlots 06 A2, 0.24% 7/6/12 (Liquidity Facility Wells Fargo Bank NA) (a)(c)(d) | 1,990,000 | | 1,990,000 |
Series 2004 D, 0.21% 7/6/12 (Liquidity Facility Fed. Home Ln. Bank, Cincinnati), VRDN (a)(c) | 10,860,000 | | 10,860,000 |
Ohio Hsg. Fin. Agcy. Multi-family Hsg. Rev.: | | | |
(Pedcor Invts. Willow Lake Apts. Proj.) Series B, 0.33% 7/6/12, LOC Fed. Home Ln. Bank, Indianapolis, VRDN (a)(c) | 425,000 | | 425,000 |
(Wingate at Belle Meadows Proj.) 0.2% 7/6/12, LOC Fed. Home Ln. Bank, Cincinnati, VRDN (a)(c) | 8,630,000 | | 8,630,000 |
Ohio Hsg. Fin. Agcy. Residential Mtg. Rev.: | | | |
(Mtg.-Backed Securities Prog.) Series 2008 D, 0.18% 7/6/12 (Liquidity Facility Fed. Home Ln. Bank, Cincinnati), VRDN (a)(c) | 20,550,000 | | 20,550,000 |
Participating VRDN: | | | |
Series BC 11 115B, 0.22% 7/6/12 (Liquidity Facility Barclays Bank PLC) (a)(c)(d) | 4,920,000 | | 4,920,000 |
Series Putters 4180, 0.24% 7/6/12 (Liquidity Facility JPMorgan Chase Bank) (a)(c)(d) | 4,865,000 | | 4,865,000 |
Variable Rate Demand Note - continued |
| Principal Amount | | Value |
Ohio - continued |
Ohio Hsg. Fin. Agcy. Residential Mtg. Rev.: - continued | | | |
Series 2006 I, 0.28% 7/6/12 (Liquidity Facility Citibank NA), VRDN (a)(c)(f) | $ 5,000,000 | | $ 5,000,000 |
Series 2008 B, 0.17% 7/6/12 (Liquidity Facility Fed. Home Ln. Bank, Cincinnati), VRDN (a)(c) | 26,375,000 | | 26,375,000 |
Series 2008 H, 0.18% 7/6/12 (Liquidity Facility Fed. Home Ln. Bank, Cincinnati), VRDN (a)(c) | 4,100,000 | | 4,100,000 |
Ohio Wtr. Dev. Auth. (Waste Mgmt., Inc. Proj.) Series B, 0.26% 7/6/12, LOC Bank of America NA, VRDN (a)(c) | 6,900,000 | | 6,900,000 |
Olentangy Local School District Participating VRDN Series Solar 07-7, 0.17% 7/6/12 (Liquidity Facility U.S. Bank NA, Cincinnati) (a)(d) | 12,300,000 | | 12,300,000 |
Portage County Hosp. Rev. (Robinson Memorial Hosp. Proj.) Series 2008, 0.19% 7/6/12, LOC JPMorgan Chase Bank, VRDN (a) | 20,405,000 | | 20,405,000 |
Rickenbacker Port Auth. Indl. Dev. (Micro Inds. Corp. Proj.) Series 2000, 0.38% 7/2/12, LOC JPMorgan Chase Bank, VRDN (a)(c) | 1,105,000 | | 1,105,000 |
Village of Indian Hill Econ. Dev. Rev. (Cincinnati Country Day School Proj.) Series 1999, 0.22% 7/6/12, LOC PNC Bank NA, VRDN (a) | 4,345,000 | | 4,345,000 |
Westlake Health Facilities Rev. (Lutheran Home Proj.) Series 2005, 0.3% 7/6/12, LOC RBS Citizens NA, VRDN (a) | 2,000,000 | | 2,000,000 |
Wood County Indl. Dev. Rev. (CMC Group Proj.) Series 2001, 0.31% 7/6/12, LOC PNC Bank NA, VRDN (a)(c) | 975,000 | | 975,000 |
Zanesville-Muskingum Port Auth. Indl. Dev. Rev. (Almana II LLC Proj.) Series 2000, 0.75% 7/6/12, LOC JPMorgan Chase Bank, VRDN (a)(c) | 1,950,000 | | 1,950,000 |
| | 665,715,000 |
Texas - 0.5% |
Port Arthur Navigation District Indl. Dev. Corp. Exempt Facilities Rev. (Air Products Proj.) Series 2010 A, 0.28% 7/6/12 (Total SA Guaranteed), VRDN (a) | 5,000,000 | | 5,000,000 |
Virginia - 0.3% |
Virginia Hsg. Dev. Auth. Commonwealth Mtg. Rev. Participating VRDN Series BA 1047, 0.33% 7/6/12 (Liquidity Facility Bank of America NA) (a)(c)(d) | 3,200,000 | | 3,200,000 |
TOTAL VARIABLE RATE DEMAND NOTE |
682,525,000
|
Other Municipal Debt - 26.8% |
| Principal Amount | | Value |
Kentucky - 0.1% |
Trimble County Poll. Cont. Rev. Bonds (Louisville Gas & Elec. Co. Proj.) Series 2001 B, 0.45% tender 7/12/12, CP mode (c) | $ 1,600,000 | | $ 1,600,000 |
Massachusetts - 0.4% |
Massachusetts Indl. Fin. Agcy. Poll. Cont. Rev. Bonds (New England Pwr. Co. Proj.) Series 1992, 0.45% tender 7/25/12, CP mode | 4,000,000 | | 4,000,000 |
New Hampshire - 0.1% |
New Hampshire Bus. Fin. Auth. Poll. Cont. Rev. Bonds (New England Pwr. Co. Proj.) Series 1990 A, 0.5% tender 7/25/12, CP mode (c) | 1,200,000 | | 1,200,000 |
Ohio - 25.9% |
American Muni. Pwr. Bonds (Omega Joint Venture 6 Proj.) 0.28%, tender 2/15/13 (a) | 3,454,000 | | 3,454,000 |
Avon Gen. Oblig. BAN: | | | |
Series 2012-1, 1% 6/27/13 | 5,955,000 | | 5,993,093 |
Series A, 1% 7/3/12 | 6,500,000 | | 6,500,209 |
Series B, 1% 7/19/12 | 3,285,000 | | 3,285,964 |
Avon Local School District BAN 1% 12/13/12 | 1,675,000 | | 1,678,526 |
Beachwood Gen. Oblig. BAN 1.5% 8/9/12 | 6,000,000 | | 6,007,129 |
Cincinnati Gen. Oblig. Bonds Series 2011 E, 2% 12/1/12 | 2,510,000 | | 2,529,111 |
Columbus City School District BAN Series 2011, 1% 11/30/12 | 1,325,000 | | 1,328,175 |
Columbus Gen. Oblig. Bonds: | | | |
Series 2004-2, 5.5% 7/1/12 | 1,545,000 | | 1,545,000 |
Series 2005 D, 5% 12/15/12 | 4,150,000 | | 4,241,269 |
Series 2006 A, 5% 12/15/12 | 1,500,000 | | 1,532,829 |
Cuyahoga County Rev. Bonds (Cleveland Clinic Health Sys. Obligated Group Prog.) Series 2003 A, 5.5% 1/1/13 | 1,070,000 | | 1,097,895 |
Cuyahoga Falls Gen. Oblig. BAN 1% 12/6/12 | 2,185,000 | | 2,189,218 |
Franklin County Hosp. Rev. Bonds (U.S. Health Corp. of Columbus Proj.) Series 2011 B, 2%, tender 7/3/12 (a) | 30,300,000 | | 30,300,899 |
Green Gen. Oblig. BAN Series 2012 B, 0.75% 6/19/13 | 1,473,000 | | 1,477,957 |
Independence Gen. Oblig. BAN Series 2012, 1.125% 4/19/13 | 1,500,000 | | 1,508,664 |
Mason City School District BAN Series 2012, 2% 1/31/13 | 5,000,000 | | 5,048,194 |
Mason Gen. Oblig. BAN 1.5% 6/27/13 | 3,200,000 | | 3,234,656 |
Miami Univ. Gen. Recpts Bonds Series 2011, 2% 9/1/12 | 2,755,000 | | 2,762,985 |
Ohio Bldg. Auth. Bonds: | | | |
(Adult Correctional Bldg. Fund Proj.): | | | |
Series 2004 B, 5% 10/1/12 | 1,000,000 | | 1,011,850 |
Series 2011 B, 1.5% 10/1/12 | 6,000,000 | | 6,020,078 |
Other Municipal Debt - continued |
| Principal Amount | | Value |
Ohio - continued |
Ohio Bldg. Auth. Bonds: - continued | | | |
Series 2003 A: | | | |
5% 4/1/13 | $ 1,900,000 | | $ 1,967,147 |
5% 4/1/13 | 1,400,000 | | 1,449,500 |
Ohio Gen. Oblig. Bonds: | | | |
Series 1992, 6.1% 8/1/12 | 4,000,000 | | 4,019,923 |
Series 2002 C, 5.5% 11/1/12 | 1,000,000 | | 1,017,668 |
Series 2003 A: | | | |
4.5% 3/15/13 (Pre-Refunded to 3/15/13 @ 100) | 1,000,000 | | 1,029,875 |
5% 3/15/13 | 1,900,000 | | 1,964,260 |
Series 2010 A, 5% 11/1/12 | 3,715,000 | | 3,774,306 |
Series 2012 A: | | | |
2% 2/1/13 | 10,900,000 | | 11,014,631 |
4% 2/1/13 | 4,515,000 | | 4,615,731 |
Series II 2004 A, 5% 8/1/12 | 2,500,000 | | 2,509,852 |
Series Q, 4% 4/1/13 | 1,305,000 | | 1,342,187 |
Ohio Higher Edl. Facility Commission Rev. Bonds: | | | |
(Denison Univ. Proj.) Series 2004, 5% 11/1/12 | 1,850,000 | | 1,878,787 |
(The Cleveland Clinic Foundation Proj.): | | | |
Series 2008 B5: | | | |
0.16% tender 9/13/12, CP mode | 10,300,000 | | 10,300,000 |
0.17% tender 10/23/12, CP mode | 2,000,000 | | 2,000,000 |
0.19% tender 9/25/12, CP mode | 10,200,000 | | 10,200,000 |
0.19% tender 10/4/12, CP mode | 7,100,000 | | 7,100,000 |
0.2% tender 10/11/12, CP mode | 22,700,000 | | 22,700,000 |
Series 2008 B6: | | | |
0.14% tender 8/9/12, CP mode | 5,000,000 | | 5,000,000 |
0.17% tender 10/23/12, CP mode | 23,900,000 | | 23,900,000 |
0.18% tender 12/6/12, CP mode | 5,000,000 | | 5,000,000 |
0.18% tender 12/6/12, CP mode | 7,300,000 | | 7,300,000 |
Series 2012 A, 2% 1/1/13 | 3,335,000 | | 3,365,164 |
Ohio State Univ. Gen. Receipts Bonds: | | | |
Series 2003 B, 5.25% 6/1/13 (Pre-Refunded to 6/1/13 @ 100) | 4,090,000 | | 4,278,768 |
Series 2010 A, 5% 12/1/12 | 3,000,000 | | 3,060,444 |
Ohio Wtr. Dev. Auth. Wtr. Poll. Cont. Rev. Bonds: | | | |
Series 2003, 5% 12/1/12 | 1,625,000 | | 1,657,048 |
Series 2004, 5% 6/1/13 | 1,000,000 | | 1,043,873 |
Univ. of Cincinnati Gen. Receipts BAN: | | | |
Series 2011 D, 2% 7/19/12 | 6,990,000 | | 6,995,652 |
Other Municipal Debt - continued |
| Principal Amount | | Value |
Ohio - continued |
Univ. of Cincinnati Gen. Receipts BAN: - continued | | | |
Series 2011 F, 2% 12/13/12 | $ 17,000,000 | | $ 17,128,273 |
Series 2012 B, 2% 5/9/13 | 10,600,000 | | 10,753,515 |
| | 271,114,305 |
Virginia - 0.3% |
Virginia Hsg. Dev. Auth. Commonwealth Mtg. Rev. Bonds Series Merlots 06 B21, 0.25%, tender 7/25/12 (Liquidity Facility Wells Fargo Bank NA) (a)(c)(d)(g) | 3,035,000 | | 3,035,000 |
TOTAL OTHER MUNICIPAL DEBT |
280,949,305
|
Investment Company - 9.1% |
| Shares | | |
Fidelity Municipal Cash Central Fund, 0.21% (b)(e) | 95,299,000 | |
95,299,000
|
TOTAL INVESTMENT PORTFOLIO - 101.1% (Cost $1,058,773,305) | 1,058,773,305 |
NET OTHER ASSETS (LIABILITIES) - (1.1)% | (11,948,179) $ 1,046,825,126 |
NET ASSETS - 100% |
Security Type Abbreviations |
BAN | - | BOND ANTICIPATION NOTE |
CP | - | COMMERCIAL PAPER |
VRDN | - | VARIABLE RATE DEMAND NOTE (A debt instrument that is payable upon demand, either daily, weekly or monthly) |
Legend |
(a) Coupon rates for floating and adjustable rate securities reflect the rates in effect at period end. |
(b) Affiliated fund that is available only to investment companies and other accounts managed by Fidelity Investments. The rate quoted is the annualized seven-day yield of the fund at period end. A complete unaudited listing of the fund's holdings as of its most recent quarter end is available upon request. In addition, each Fidelity Central Fund's financial statements are available on the SEC's website or upon request. |
(c) Private activity obligations whose interest is subject to the federal alternative minimum tax for individuals. |
(d) Provides evidence of ownership in one or more underlying municipal bonds. |
(e) Information in this report regarding holdings by state and security types does not reflect the holdings of the Fidelity Municipal Cash Central Fund. |
(f) A portion of the security is subject to a forward commitment to sell. |
(g) Restricted securities - Investment in securities not registered under the Securities Act of 1933 (excluding 144A issues). At the end of the period, the value of restricted securities (excluding 144A issues) amounted to $3,035,000 or 0.3% of net assets. |
Additional information on each restricted holding is as follows: |
Security | Acquisition Date | Cost |
Virginia Hsg. Dev. Auth. Commonwealth Mtg. Rev. Bonds Series Merlots 06 B21, 0.25%, tender 7/25/12 (Liquidity Facility Wells Fargo Bank NA) | 8/4/11 | $ 3,035,000 |
Affiliated Central Funds |
Information regarding fiscal year to date income earned by the Fund from investments in Fidelity Central Funds is as follows: |
Fund | Income earned |
Fidelity Municipal Cash Central Fund | $ 84,665 |
Other Information |
The date shown for securities represents the date when principal payments must be paid, taking into account any call options exercised by the issuer and any permissible maturity shortening features other than interest rate resets. |
All investments are categorized as Level 2 under the Fair Value Hierarchy. The inputs or methodology used for valuing securities may not be an indication of the risk associated with investing in those securities. For more information on valuation inputs, please refer to the Security Valuation section in the accompanying Notes to Financial Statements. |
See accompanying notes which are an integral part of the financial statements.
Semiannual Report
Fidelity Ohio Municipal Money Market Fund
Statement of Assets and Liabilities
| June 30, 2012 (Unaudited) |
| | |
Assets | | |
Investment in securities, at value - See accompanying schedule: Unaffiliated issuers (cost $963,474,305) | $ 963,474,305 | |
Fidelity Central Funds (cost $95,299,000) | 95,299,000 | |
Total Investments (cost $1,058,773,305) | | $ 1,058,773,305 |
Cash | | 349,318 |
Receivable for investments sold | | |
Regular delivery | | 4,300,475 |
Delayed delivery | | 3,002,493 |
Receivable for fund shares sold | | 8,687,474 |
Interest receivable | | 1,390,932 |
Distributions receivable from Fidelity Central Funds | | 17,387 |
Other receivables | | 60 |
Total assets | | 1,076,521,444 |
| | |
Liabilities | | |
Payable for investments purchased | $ 21,498,222 | |
Payable for fund shares redeemed | 7,738,501 | |
Distributions payable | 236 | |
Accrued management fee | 164,581 | |
Other affiliated payables | 274,085 | |
Other payables and accrued expenses | 20,693 | |
Total liabilities | | 29,696,318 |
| | |
Net Assets | | $ 1,046,825,126 |
Net Assets consist of: | | |
Paid in capital | | $ 1,046,806,767 |
Undistributed net investment income | | 219 |
Accumulated undistributed net realized gain (loss) on investments | | 18,140 |
Net Assets, for 1,046,337,364 shares outstanding | | $ 1,046,825,126 |
Net Asset Value, offering price and redemption price per share ($1,046,825,126 ÷ 1,046,337,364 shares) | | $ 1.00 |
See accompanying notes which are an integral part of the financial statements.
Semiannual Report
Statement of Operations
Six months ended June 30, 2012 (Unaudited) |
| | |
Investment Income | | |
Interest | | $ 1,044,769 |
Income from Fidelity Central Funds | | 84,665 |
Total income | | 1,129,434 |
| | |
Expenses | | |
Management fee | $ 1,969,559 | |
Transfer agent fees | 738,568 | |
Accounting fees and expenses | 61,513 | |
Custodian fees and expenses | 6,962 | |
Independent trustees' compensation | 1,907 | |
Registration fees | 26,271 | |
Audit | 18,665 | |
Legal | 1,988 | |
Miscellaneous | 4,094 | |
Total expenses before reductions | 2,829,527 | |
Expense reductions | (1,753,929) | 1,075,598 |
Net investment income (loss) | | 53,836 |
Realized and Unrealized Gain (Loss) Net realized gain (loss) on: | | |
Investment securities: | | |
Unaffiliated issuers | | 7,318 |
Net increase in net assets resulting from operations | | $ 61,154 |
See accompanying notes which are an integral part of the financial statements.
Semiannual Report
Fidelity Ohio Municipal Money Market Fund
Financial Statements - continued
Statement of Changes in Net Assets
| Six months ended June 30, 2012
(Unaudited) | Year ended
December 31, 2011 |
Increase (Decrease) in Net Assets | | |
Operations | | |
Net investment income (loss) | $ 53,836 | $ 100,582 |
Net realized gain (loss) | 7,318 | (29) |
Net increase in net assets resulting
from operations | 61,154 | 100,553 |
Distributions to shareholders from net investment income | (53,617) | (100,344) |
Share transactions at net asset value of $1.00 per share
Proceeds from sales of shares | 1,287,297,195 | 3,000,350,460 |
Reinvestment of distributions | 52,415 | 99,383 |
Cost of shares redeemed | (1,347,132,695) | (2,904,823,286) |
Net increase (decrease) in net assets and shares resulting from share transactions | (59,783,085) | 95,626,557 |
Total increase (decrease) in net assets | (59,775,548) | 95,626,766 |
| | |
Net Assets | | |
Beginning of period | 1,106,600,674 | 1,010,973,908 |
End of period (including undistributed net investment income of $219 and $0, respectively) | $ 1,046,825,126 | $ 1,106,600,674 |
See accompanying notes which are an integral part of the financial statements.
Semiannual Report
Financial Highlights
| Six months ended June 30, 2012 | Years ended December 31, |
| (Unaudited) | 2011 | 2010 | 2009 | 2008 | 2007 |
Selected Per-Share
Data | | | | | |
Net asset value, beginning of period | $ 1.00 | $ 1.00 | $ 1.00 | $ 1.00 | $ 1.00 | $ 1.00 |
Income from Investment Operations | | | | | | |
Net investment income (loss) | - F | - F | - F | - F | .018 | .032 |
Distributions from net investment income | - F | - F | - F | - F | (.018) | (.032) |
Net asset value, end of period | $ 1.00 | $ 1.00 | $ 1.00 | $ 1.00 | $ 1.00 | $ 1.00 |
Total Return B, C | 0.0% | .01% | .01% | .15% | 1.77% | 3.22% |
Ratios to Average Net Assets D, E | | | | | |
Expenses before reductions | .53% A | .52% | .52% | .57% | .54% | .52% |
Expenses net of fee waivers, if any | .20% A | .24% | .37% | .55% | .54% | .52% |
Expenses net of all reductions | .20% A | .24% | .37% | .55% | .48% | .41% |
Net investment income (loss) | .01% A | .01% | .01% | .15% | 1.75% | 3.17% |
Supplemental Data | | | | | |
Net assets, end of period (000 omitted) | $ 1,046,825 | $ 1,106,601 | $ 1,010,974 | $ 1,029,552 | $ 1,224,236 | $ 1,217,252 |
A Annualized
B Total returns for periods of less than one year are not annualized.
C Total returns would have been lower if certain expenses had not been reduced during the applicable periods shown.
D Fees and expenses of any underlying Fidelity Central Funds are not included in the Fund's expense ratio. The Fund indirectly bears its proportionate share of the expenses of any underlying Fidelity Central Funds.
E Expense ratios reflect operating expenses of the Fund. Expenses before reductions do not reflect amounts reimbursed or waived or reductions from expense offset arrangements and do not represent the amount paid by the Fund during periods when reimbursements, waivers or reductions occur. Expenses net of fee waivers reflect expenses after reimbursement and waivers but prior to reductions from expense offset arrangements. Expenses net of all reductions represent the net expenses paid by the Fund.
F Amount represents less than $.001 per share.
See accompanying notes which are an integral part of the financial statements.
Semiannual Report
Notes to Financial Statements
For the period ended June 30, 2012 (Unaudited)
1. Organization.
Fidelity Ohio Municipal Income Fund (the Income Fund) is a fund of Fidelity Municipal Trust. Fidelity Ohio Municipal Money Market Fund (the Money Market Fund is a fund of Fidelity Municipal Trust II. Each Trust is registered under the Investment Company Act of 1940, as amended (the 1940 Act), as an open-end management investment company. Fidelity Municipal Trust and Fidelity Municipal Trust II (the Trusts) are organized as a Massachusetts business trust and a Delaware statutory trust, respectively. Each Fund is authorized to issue an unlimited number of shares. Each Fund may be affected by economic and political developments in the state of Ohio.
2. Investments in Fidelity Central Funds.
The Funds invest in Fidelity Central Funds, which are open-end investment companies available only to other investment companies and accounts managed by Fidelity Management & Research Company (FMR) and its affiliates. The Funds' Schedules of Investments list each of the Fidelity Central Funds held as of period end, if any, as an investment of each Fund, but do not include the underlying holdings of each Fidelity Central Fund. As an Investing Fund, each Fund indirectly bears its proportionate share of the expenses of the underlying Fidelity Central Funds.
The Money Market Central Funds seek preservation of capital and current income and are managed by Fidelity Investments Money Management, Inc. (FIMM), an affiliate of FMR.
A complete unaudited list of holdings for each Fidelity Central Fund is available upon request or at the Securities and Exchange Commission (the SEC) web site at www.sec.gov. In addition, the financial statements of the Fidelity Central Funds are available on the SEC web site or upon request.
3. Significant Accounting Policies.
The financial statements have been prepared in conformity with accounting principles generally accepted in the United States of America (GAAP), which require management to make certain estimates and assumptions at the date of the financial statements. Actual results could differ from those estimates. Subsequent events, if any, through the date that the financial statements were issued have been evaluated in the preparation of the financial statements. The following summarizes the significant accounting policies of the Funds:
Semiannual Report
3. Significant Accounting Policies - continued
Security Valuation. Investments are valued as of 4:00 p.m. Eastern time on the last calendar day of the period. In accordance with valuation policies and procedures approved by the Board of Trustees (the Board), the Income Fund attempts to obtain prices from one or more third party pricing vendor or broker to value their investments. When current market prices, quotations or rates are not readily available or reliable, securities will be fair valued in good faith by the FMR Fair Value Committee (the Committee), in accordance with procedures adopted by the Board. Factors used in determining fair value vary by security type and may include market or security specific events, changes in interest rates and credit quality. The frequency with which these procedures are used cannot be predicted and they may be utilized to a significant extent. The Committee oversees the Income Fund's valuation policies and procedures and is responsible for approving and reporting to the Board all fair value determinations.
Each Fund categorizes the inputs to valuation techniques used to value their investments into a disclosure hierarchy consisting of three levels as shown below:
Level 1 - quoted prices in active markets for identical investments
Level 2 - other significant observable inputs (including quoted prices for similar investments, interest rates, prepayment speeds, etc.)
Level 3 - unobservable inputs (including the Fund's own assumptions based on the best information available)
Valuation techniques used to value each Fund's investments by major category are as follows:
For the Income Fund, debt securities, including restricted securities, are valued based on evaluated prices received from third party pricing vendors or from brokers who make markets in such securities. For municipal securities, pricing vendors utilize matrix pricing which considers yield or price of bonds of comparable quality, coupon, maturity and type as well as broker-supplied prices and are generally categorized as Level 2 in the hierarchy.
When independent prices are unavailable or unreliable, debt securities may be valued utilizing pricing methodologies which consider similar factors that would be used by third party pricing vendors. These are generally categorized as Level 2 in the hierarchy but may be Level 3 depending on the circumstances.
Semiannual Report
Notes to Financial Statements (Unaudited) - continued
3. Significant Accounting Policies - continued
Security Valuation - continued
For the Money Market Fund, as permitted by compliance with certain conditions under Rule 2a-7 of the 1940 Act, securities are valued at amortized cost, which approximates fair value. The amortized cost of an instrument is determined by valuing it at its original cost and thereafter amortizing any discount or premium from its face value at a constant rate until maturity. Securities held by a money market fund are generally high quality and liquid; however, they are reflected as Level 2 because the inputs used to determine fair value are not quoted prices in an active market.
For the Income Fund, changes in valuation techniques may result in transfers in or out of an assigned level within the disclosure hierarchy.
Investment Transactions and Income. For financial reporting purposes, the Funds' investment holdings and NAV include trades executed through the end of the last business day of the period. The NAV per share for processing shareholder transactions is calculated as of the close of business of the New York Stock Exchange (NYSE), normally 4:00 p.m. Eastern time and includes trades executed through the end of the prior business day for the Income Fund and trades executed through the end of the current business day for the Money Market Fund. Gains and losses on securities sold are determined on the basis of identified cost. Interest income and distributions from the Fidelity Central Funds are accrued as earned. Interest income includes coupon interest and amortization of premium and accretion of discount on debt securities.
Expenses. Expenses directly attributable to a fund are charged to that fund. Expenses attributable to more than one fund are allocated among the respective funds on the basis of relative net assets or other appropriate methods. Expense estimates are accrued in the period to which they relate and adjustments are made when actual amounts are known.
Income Tax Information and Distributions to Shareholders. Each year, each Fund intends to qualify as a regulated investment company under Subchapter M of the Internal Revenue Code, including distributing substantially all of its taxable income and realized gains. As a result, no provision for income taxes is required. Each Fund files a U.S. federal tax return, in addition to state and local tax returns as required. A fund's federal income tax returns are subject to examination by the Internal Revenue Service (IRS) for a period of three fiscal years after they are filed. State and local tax returns may be subject to examination for an additional fiscal year depending on the jurisdiction.
Dividends are declared and recorded daily and paid monthly from net investment income. Distributions from realized gains, if any, are declared and recorded on the ex-dividend date. Income and capital gain distributions are determined in accordance with income tax regulations, which may differ from GAAP.
Semiannual Report
3. Significant Accounting Policies - continued
Income Tax Information and Distributions to Shareholders - continued
Capital accounts within the financial statements are adjusted for permanent book-tax differences. These adjustments have no impact on net assets or the results of operations. Temporary book-tax differences will reverse in a subsequent period.
Book-tax differences are primarily due to market discount, deferred trustees compensation, capital loss carryforwards, losses deferred due to futures transactions and excise tax regulations.
The Funds purchase municipal securities whose interest, in the opinion of the issuer, is free from federal income tax. There is no assurance that the IRS will agree with this opinion. In the event the IRS determines that the issuer does not comply with relevant tax requirements, interest payments from a security could become federally taxable, possibly retroactively to the date the security was issued.
The federal tax cost of investment securities and unrealized appreciation (depreciation) as of period end were as follows for each Fund:
| Tax cost | Gross unrealized appreciation | Gross unrealized depreciation | Net unrealized appreciation
(depreciation) on securities and other investments |
Fidelity Ohio Municipal Income Fund | $ 556,898,490 | $ 39,645,657 | $ (391,193) | $ 39,254,464 |
Fidelity Ohio Municipal Money Market Fund | 1,058,773,305 | - | - | - |
Capital loss carryforwards are only available to offset future capital gains of the Funds to the extent provided by regulations and may be limited. Under the Regulated Investment Company Modernization Act of 2010 (the Act), the Funds are permitted to carry forward capital losses incurred in taxable years beginning after December 22, 2010 for an unlimited period and such capital losses are required to be used prior to any losses that expire. At December 31, 2011, capital loss carryforwards were as follows:
No expiration | Short-term |
Fidelity Ohio Municipal Money Market Fund | $ (36) |
Short-Term Trading (Redemption) Fees. Shares held by investors in the Income Fund less than 30 days are subject to a redemption fee equal to ..50% of the net asset value of shares redeemed. All redemption fees, which reduce the proceeds of the shareholder redemption, are retained by the Fund and accounted for as an addition to paid in capital.
Semiannual Report
Notes to Financial Statements (Unaudited) - continued
4. Operating Policies.
Delayed Delivery Transactions and When-Issued Securities. During the period, the Fund transacted in securities on a delayed delivery or when-issued basis. Payment and delivery may take place after the customary settlement period for that security. The price of the underlying securities and the date when the securities will be delivered and paid for are fixed at the time the transaction is negotiated. The Fund may receive compensation for interest forgone in the purchase of a delayed delivery or when-issued security. With respect to purchase commitments, the Fund identifies securities as segregated in its records with a value at least equal to the amount of the commitment. Losses may arise due to changes in the value of the underlying securities or if the counterparty does not perform under the contract's terms, or if the issuer does not issue the securities due to political, economic, or other factors.
Restricted Securities. The Funds may invest in securities that are subject to legal or contractual restrictions on resale. These securities generally may be resold in transactions exempt from registration or to the public if the securities are registered. Disposal of these securities may involve time-consuming negotiations and expense, and prompt sale at an acceptable price may be difficult. Information regarding restricted securities is included at the end of each applicable Fund's Schedule of Investments.
5. Purchases and Sales of Investments.
Purchases and sales of securities, other than short-term securities, for the Income Fund aggregated $85,812,058 and $32,600,229, respectively.
6. Fees and Other Transactions with Affiliates.
Management Fee. FMR and its affiliates provide the Funds with investment management related services for which the Funds pay a monthly management fee. The management fee is the sum of an individual fund fee rate and an annualized group fee rate. The individual fund fee rate is applied to each Fund's average net assets. The group fee rate is based upon the average net assets of all the mutual funds advised by FMR. The group fee rate decreases as assets under management increase and increases as assets under management decrease. For the period, each Fund's annualized management fee rate expressed as a percentage of each Fund's average net assets was as follows:
| Individual Rate | Group Rate | Total |
Fidelity Ohio Municipal Income Fund | .25% | .12% | .37% |
Fidelity Ohio Municipal Money Market Fund | .25% | .12% | .37% |
Semiannual Report
6. Fees and Other Transactions with Affiliates - continued
Transfer Agent and Accounting Fees. Citibank, N.A. (Citibank) is the custodian, transfer agent and servicing agent for the Funds. Citibank has entered into a sub-arrangement with Fidelity Investments Institutional Operations Company, Inc. (FIIOC), an affiliate of FMR, under which FIIOC performs the activities associated with the Funds' transfer agency, dividend disbursing and shareholder servicing functions. The Funds pay account fees and asset-based fees that vary according to account size and type of account. FIIOC pays for typesetting, printing and mailing of shareholder reports, except proxy statements. For the period, the transfer agent fees were equivalent to the following annualized rates expressed as a percentage of average net assets:
Fidelity Ohio Municipal Income Fund | .08% |
Fidelity Ohio Municipal Money Market Fund | .14% |
During the period, FMR or its affiliates waived a portion of these fees for the Money Market Fund.
Citibank also has a sub-arrangement with Fidelity Service Company, Inc. (FSC), an affiliate of FMR, under which FSC maintains each Fund's accounting records. The fee is based on the level of average net assets for the month.
7. Committed Line of Credit.
The Income Fund participates with other funds managed by FMR or an affiliate in a $4.25 billion credit facility (the "line of credit") to be utilized for temporary or emergency purposes to fund shareholder redemptions or for other short-term liquidity purposes. The participating funds have agreed to pay commitment fees on their pro-rata portion of the line of credit, which are reflected in Miscellaneous expenses on the Statement of Operations, and are as follows:
Fidelity Ohio Municipal Income Fund | $ 837 |
During the period, there were no borrowings on this line of credit.
8. Expense Reductions.
FMR or its affiliates voluntarily agreed to waive certain fees for the Money Market Fund in order to maintain a minimum annualized yield of .01%. Such arrangements may be discontinued by FMR at any time. For the period, the amount of the waiver was $1,753,736.
Semiannual Report
Notes to Financial Statements (Unaudited) - continued
8. Expense Reductions - continued
In addition, through arrangements with each applicable Fund's custodian, credits realized as a result of uninvested cash balances were used to reduce each applicable Fund's expenses. All of the applicable expense reductions are noted in the table below.
| Custody
expense
reduction |
Fidelity Ohio Municipal Income Fund | $ 6,796 |
Fidelity Ohio Municipal Money Market Fund | 193 |
9. Other.
The Funds' organizational documents provide former and current trustees and officers with a limited indemnification against liabilities arising in connection with the performance of their duties to the Funds. In the normal course of business, the Funds may also enter into contracts that provide general indemnifications. The Funds' maximum exposure under these arrangements is unknown as this would be dependent on future claims that may be made against the Funds. The risk of material loss from such claims is considered remote.
Semiannual Report
Investment Adviser
Fidelity Management & Research Company
Boston, MA
Investment Sub-Advisers
Fidelity Investments Money
Management, Inc.
Fidelity Management & Research
(Hong Kong) Limited
Fidelity Management & Research
(Japan) Inc.
Fidelity Management & Research
(U.K.) Inc.
General Distributor
Fidelity Distributors Corporation
Smithfield, RI
Transfer and Service Agents
Fidelity Investments Institutional
Operations Company, Inc.
Boston, MA
Citibank, N.A.
New York, NY
Fidelity Service Company, Inc.
Boston, MA
Custodian
Citibank, N.A.
New York, NY
The Fidelity Telephone Connection
Mutual Fund 24-Hour Service
Exchanges/Redemptions
and Account Assistance 1-800-544-6666
Product Information 1-800-544-6666
Retirement Accounts 1-800-544-4774 (8 a.m. - 9 p.m.)
TDD Service 1-800-544-0118
for the deaf and hearing impaired
(9 a.m. - 9 p.m. Eastern time)
Fidelity Automated Service
Telephone (FAST®) 1-800-544-5555
Automated lines for quickest service
OFF-USAN-0812
1.787787.109
(Fidelity Investment logo)(registered trademark)
Corporate Headquarters
82 Devonshire St., Boston, MA 02109
www.fidelity.com
Fidelity®
Pennsylvania Municipal
Income Fund
and
Fidelity
Pennsylvania Municipal
Money Market Fund
Semiannual Report
June 30, 2012
(Fidelity Cover Art)
Contents
Shareholder Expense Example | (Click Here) | An example of shareholder expenses. |
Fidelity® Pennsylvania Municipal Income Fund |
Investment Changes | (Click Here) | A summary of major shifts in the fund's investments over the past six months. |
Investments | (Click Here) | A complete list of the fund's investments with their market values. |
Financial Statements | (Click Here) | Statements of assets and liabilities, operations, and changes in net assets, as well as financial highlights. |
Fidelity Pennsylvania Municipal Money Market Fund |
Investment
Changes/Performance | (Click Here) | A summary of major shifts in the fund's investments over the past six months. |
Investments | (Click Here) | A complete list of the fund's investments. |
Financial Statements | (Click Here) | Statements of assets and liabilities, operations, and changes in net assets, as well as financial highlights. |
Notes | (Click Here) | Notes to the financial statements. |
To view a fund's proxy voting guidelines and proxy voting record for the 12-month period ended June 30, visit http://www.fidelity.com/proxyvotingresults or visit the Securities and Exchange Commission's (SEC) web site at http://www.sec.gov. You may also call 1-800-544-8544 to request a free copy of the proxy voting guidelines.
Standard & Poor's, S&P and S&P 500 are registered service marks of The McGraw-Hill Companies, Inc. and have been licensed for use by Fidelity Distributors Corporation.
Other third party marks appearing herein are the property of their respective owners.
All other marks appearing herein are registered or unregistered trademarks or service marks of FMR LLC or an affiliated company. © 2012 FMR LLC. All rights reserved.
This report and the financial statements contained herein are submitted for the general information of the shareholders of the funds. This report is not authorized for distribution to prospective investors in the funds unless preceded or accompanied by an effective prospectus.
A fund files its complete schedule of portfolio holdings with the SEC for the first and third quarters of each fiscal year on Form N-Q. Forms N-Q are available on the SEC's web site at http://www.sec.gov. A fund's Forms N-Q may be reviewed and copied at the SEC's Public Reference Room in Washington, DC. Information regarding the operation of the SEC's Public Reference Room may be obtained by calling 1-800-SEC-0330. For a complete list of a fund's portfolio holdings, view the most recent holdings listing, semiannual report, or annual report on Fidelity's web site at http://www.fidelity.com, http://www.advisor.fidelity.com, or http://www.401k.com, as applicable.
NOT FDIC INSURED • MAY LOSE VALUE • NO BANK GUARANTEE
Neither the funds nor Fidelity Distributors Corporation is a bank.
Semiannual Report
Shareholder Expense Example
As a shareholder of the Fund, you incur two types of costs: (1) transaction costs, and (2) ongoing costs, including management fees and other Fund expenses. This Example is intended to help you understand your ongoing costs (in dollars) of investing in the Fund and to compare these costs with the ongoing costs of investing in other mutual funds.
The Example is based on an investment of $1,000 invested at the beginning of the period and held for the entire period (January 1, 2012 to June 30, 2012).
Actual Expenses
The first line of the accompanying table for each fund provides information about actual account values and actual expenses. You may use the information in this line, together with the amount you invested, to estimate the expenses that you paid over the period. Simply divide your account value by $1,000.00 (for example, an $8,600 account value divided by $1,000.00 = 8.6), then multiply the result by the number in the first line under the heading entitled "Expenses Paid During Period" to estimate the expenses you paid on your account during this period. A small balance maintenance fee of $12.00 that is charged once a year may apply for certain accounts with a value of less than $2,000. This fee is not included in the table below. If it was, the estimate of expenses you paid during the period would be higher, and your ending account value lower, by this amount. In addition, each Fund, as a shareholder in the underlying Fidelity Central Funds, will indirectly bear its pro-rata share of the fees and expenses incurred by the underlying Fidelity Central Funds. These fees and expenses are not included in the Fund's annualized expense ratio used to calculate the expense estimate in the table below.
Hypothetical Example for Comparison Purposes
The second line of the accompanying table for each fund provides information about hypothetical account values and hypothetical expenses based on the Fund's actual expense ratio and an assumed rate of return of 5% per year before expenses, which is not the Fund's actual return. The hypothetical account values and expenses may not be used to estimate the actual ending account balance or expenses you paid for the period. You may use this information to compare the ongoing costs of investing in the Fund and other funds. To do so, compare this 5% hypothetical example with the 5% hypothetical examples that appear in the shareholder reports of the other funds. A small balance maintenance fee of $12.00 that is charged once a year may apply for certain accounts with a value of less than $2,000. This fee is not included in the table below. If it was, the estimate of expenses you paid during the period would be higher, and your ending account value lower, by this amount. In addition, each Fund, as a shareholder in the underlying Fidelity Central Funds, will indirectly bear its pro-rata share of the fees and expenses incurred by the underlying Fidelity Central Funds. These fees and expenses are not included in the Fund's annualized expense ratio used to calculate the expense estimate in the table below.
Semiannual Report
Please note that the expenses shown in the table are meant to highlight your ongoing costs only and do not reflect any transaction costs. Therefore, the second line of the table is useful in comparing ongoing costs only, and will not help you determine the relative total costs of owning different funds. In addition, if these transactional costs were included, your costs would have been higher.
| Annualized
Expense Ratio | Beginning
Account Value
January 1, 2012 | Ending
Account Value
June 30, 2012 | Expenses Paid
During Period*
January 1, 2012
to June 30, 2012 |
Fidelity Pennsylvania Municipal Income Fund | .49% | | | |
Actual | | $ 1,000.00 | $ 1,038.60 | $ 2.48 |
HypotheticalA | | $ 1,000.00 | $ 1,022.43 | $ 2.46 |
Fidelity Pennsylvania Municipal Money Market Fund | .18% | | | |
Actual | | $ 1,000.00 | $ 1,000.05 | $ .90** |
HypotheticalA | | $ 1,000.00 | $ 1,023.97 | $ .91** |
A 5% return per year before expenses
* Expenses are equal to each Fund's annualized expense ratio, multiplied by the average account value over the period, multiplied by 182/366 (to reflect the one-half year period).
** If certain fees were not voluntarily waived by FMR or its affiliates during the period, the annualized expense ratio for the Fidelity Pennsylvania Municipal Money Market Fund would have been 0.50% and the expenses paid in the actual and hypothetical examples above would have been $2.48 and $2.51, respectively.
Semiannual Report
Fidelity Pennsylvania Municipal Income Fund
Investment Changes (Unaudited)
Top Five Sectors as of June 30, 2012 |
| % of fund's
net assets | % of fund's net assets
6 months ago |
General Obligations | 32.7 | 33.1 |
Health Care | 17.3 | 16.5 |
Education | 11.9 | 12.0 |
Transportation | 9.7 | 12.1 |
Electric Utilities | 7.6 | 9.0 |
Weighted Average Maturity as of June 30, 2012 |
| | 6 months ago |
Years | 5.8 | 5.9 |
This is a weighted average of all the maturities of the securities held in a fund. Weighted Average Maturity (WAM) can be used as a measure of sensitivity to interest rate changes and market changes. Generally, the longer the maturity, the greater the sensitivity to such changes. WAM is based on the dollar-weighted average length of time until principal payments must be paid. Depending on the types of securities held in a fund, certain maturity shortening devices (e.g., demand features, interest rate resets, and call options) may be taken into account when calculating the WAM. |
Duration as of June 30, 2012 |
| | 6 months ago |
Years | 6.9 | 7.3 |
Duration estimates how much a bond fund's price will change with a change in comparable interest rates. If rates rise 1%, for example, a fund with a 5-year duration is likely to lose about 5% of its value. Other factors also can influence a bond fund's performance and share price. Accordingly, a bond fund's actual performance may differ from this example. Duration takes into account any call or put option embedded in the bonds. |
Quality Diversification (% of fund's net assets) |
As of June 30, 2012 | As of December 31, 2011 |
 | AAA 0.1% | | | AAA 0.1% | |
 | AA,A 83.0% | | | AA,A 84.3% | |
 | BBB 9.9% | | | BBB 11.5% | |
 | BB and Below 0.6% | |  | BB and Below 0.0% | |
 | Not Rated 0.9% | | | Not Rated 2.0% | |
 | Short-Term
Investments and
Net Other Assets 5.5% | | | Short-Term
Investments and
Net Other Assets 2.1% | |

We have used ratings from Moody's Investors Service, Inc. Where Moody's® ratings are not available, we have used S&P® ratings. All ratings are as of the date indicated and do not reflect subsequent changes. |
Semiannual Report
Fidelity Pennsylvania Municipal Income Fund
Investments June 30, 2012 (Unaudited)
Showing Percentage of Net Assets
Municipal Bonds - 94.5% |
| Principal Amount | | Value |
New Jersey/Pennsylvania - 1.8% |
Delaware River Joint Toll Bridge Commission Pennsylvania-New Jersey Bridge Rev. Series A, 5% 7/1/27 (Nat'l. Pub. Fin. Guarantee Corp. Insured) | | $ 1,425,000 | | $ 1,532,189 |
Delaware River Port Auth. Pennsylvania & New Jersey Rev.: | | | | |
(Port District Proj.) Series 2001 A, 5.5% 1/1/18 (FSA Insured) | | 3,000,000 | | 3,009,600 |
Series 2010 D, 5% 1/1/30 | | 3,500,000 | | 3,850,490 |
| | 8,392,279 |
Pennsylvania - 91.9% |
Adams County Indl. Dev. Auth. Rev. (Gettysburg College Proj.) Series 2010, 5% 8/15/24 | | 1,000,000 | | 1,120,080 |
Allegheny County Series C-55, 5.375% 11/1/15 (Nat'l. Pub. Fin. Guarantee Corp. Insured) | | 3,535,000 | | 3,584,914 |
Allegheny County Arpt. Auth. Rev. (Pittsburg Int'l. Arpt. Proj.) Series B, 5% 1/1/16 (Nat'l. Pub. Fin. Guarantee Corp. Insured) (b) | | 2,545,000 | | 2,758,067 |
Allegheny County Arpt. Rev. (Pittsburgh Int'l. Arpt. Proj.) Series A1, 5.75% 1/1/14 (Nat'l. Pub. Fin. Guarantee Corp. Insured) (b) | | 3,000,000 | | 3,172,410 |
Allegheny County Higher Ed. Bldg. Auth. Series 2012 A, 5% 3/1/24 | | 4,000,000 | | 4,833,920 |
Allegheny County Hosp. Dev. Auth. Rev.: | | | | |
(Pittsburgh Med. Ctr. Proj.) Series A, 5% 9/1/14 | | 2,525,000 | | 2,753,437 |
(Univ. of Pittsburgh Med. Ctr. Proj.) Series 2009 A, 5% 8/15/21 | | 2,000,000 | | 2,315,380 |
Allegheny County Port Auth. Spl. Rev. 5% 3/1/17 | | 2,000,000 | | 2,294,180 |
Allegheny County Sanitation Auth. Swr. Rev.: | | | | |
Series 2010, 5% 6/1/40 (FSA Insured) | | 6,690,000 | | 7,247,745 |
Series A, 5% 12/1/30 (Nat'l. Pub. Fin. Guarantee Corp. Insured) | | 1,725,000 | | 1,857,894 |
Annville-Cleona School District Series 2005: | | | | |
6% 3/1/28 (FSA Insured) | | 1,500,000 | | 1,638,885 |
6% 3/1/31 (FSA Insured) | | 1,975,000 | | 2,146,687 |
Berks County Muni. Auth. Rev. (Reading Hosp. & Med. Ctr. Proj.) Series 2009 A3, 5.25% 11/1/18 | | 3,000,000 | | 3,599,910 |
Bucks County Cmnty. College Auth. College Bldg. Rev. 5% 6/15/28 | | 250,000 | | 279,633 |
Bucks County Indl. Dev. Auth. Wtr. Facilities Rev. (Pennsylvania Suburban Wtr. Co. Proj.) Series 2002, 5.55% 9/1/32 (Nat'l. Pub. Fin. Guarantee Corp. Insured) (b) | | 1,870,000 | | 1,872,992 |
Municipal Bonds - continued |
| Principal Amount | | Value |
Pennsylvania - continued |
Bucks County Wtr. & Swr. Auth. Sys. Rev. Series 2006, 5% 6/1/15 (FSA Insured) | | $ 1,785,000 | | $ 1,979,726 |
Butler County Hosp. Auth. Hosp. Rev. (Butler Health Sys. Proj.) Series 2009 B, 7.125% 7/1/29 | | 1,000,000 | | 1,227,890 |
Canon McMillan School District Series 2002 B, 5.75% 12/1/35 (Nat'l. Pub. Fin. Guarantee Corp. Insured) | | 2,500,000 | | 2,526,275 |
Centennial School District: | | | | |
Series 2010 A, 5% 12/15/30 | | 3,000,000 | | 3,540,210 |
Series A, 5.25% 12/15/37 (FSA Insured) | | 5,000,000 | | 5,586,350 |
Central Bradford Prog. Auth. Rev. Series 2011, 5.375% 12/1/41 | | 2,000,000 | | 2,222,020 |
Centre County Hosp. Auth. Rev. (Mount Nittany Med. Ctr. Proj.) Series 2011, 7% 11/15/46 | | 2,000,000 | | 2,364,960 |
Chambersburg Area School District Series 2007: | | | | |
5.25% 3/1/26 (Nat'l. Pub. Fin. Guarantee Corp. Insured) | | 2,000,000 | | 2,197,120 |
5.25% 3/1/27 (Nat'l. Pub. Fin. Guarantee Corp. Insured) | | 2,000,000 | | 2,191,960 |
5.25% 3/1/29 (Nat'l. Pub. Fin. Guarantee Corp. Insured) | | 3,600,000 | | 3,928,248 |
Dauphin County Gen. Auth. (Pinnacle Health Sys. Proj.) Series 2009 A, 5.25% 6/1/17 | | 3,000,000 | | 3,369,750 |
Delaware County Auth. College Rev. (Haverford College Proj.) Series 2010 A, 5% 11/15/31 | | 4,090,000 | | 4,616,588 |
Delaware County Auth. Univ. Rev. Series 2010, 5.25% 12/1/31 | | 2,450,000 | | 2,754,682 |
East Stroudsburg Area School District: | | | | |
Series 2007 A: | | | | |
7.5% 9/1/22 (Nat'l. Pub. Fin. Guarantee Corp. Insured) | | 1,000,000 | | 1,271,490 |
7.75% 9/1/27 (Nat'l. Pub. Fin. Guarantee Corp. Insured) | | 8,200,000 | | 10,247,294 |
Series 2007, 7.75% 9/1/28 (Pre-Refunded to 9/1/16 @ 100) | | 2,750,000 | | 3,553,138 |
Easton Area School District Series 2006: | | | | |
7.5% 4/1/22 (FSA Insured) | | 2,700,000 | | 3,303,369 |
7.75% 4/1/25 (FSA Insured) | | 395,000 | | 480,075 |
7.75% 4/1/25 (FSA Insured) (Pre-Refunded to 4/1/16 @ 100) | | 480,000 | | 606,898 |
Erie County Hosp. Auth. Rev. (Saint Vincent Health Ctr. Proj.) Series 2010 A, 7% 7/1/27 | | 2,750,000 | | 2,969,533 |
Municipal Bonds - continued |
| Principal Amount | | Value |
Pennsylvania - continued |
Franklin County Indl. Dev. Auth. (The Chambersburg Hosp. Proj.) Series 2010: | | | | |
5.3% 7/1/30 | | $ 1,770,000 | | $ 1,917,211 |
5.375% 7/1/42 | | 1,130,000 | | 1,194,952 |
Harrisburg Auth. Wtr. Rev. Series 2001 A, 5.75% 7/15/12 (Nat'l. Pub. Fin. Guarantee Corp. Insured) | | 575,000 | | 575,535 |
Kennett Consolidated School District Series A, 5.25% 2/15/15 (FGIC Insured) | | 705,000 | | 723,245 |
Lancaster County Hosp. Auth. Health Ctr. Rev. (Masonic Homes Proj.) Series 2006, 5% 11/1/20 | | 1,065,000 | | 1,174,780 |
Luzerne County Indl. Dev. Auth. Wtr. Facilities Rev. (Pennsylvania-American Wtr. Co. Proj.) Series 2009, 5.5% 12/1/39 | | 2,500,000 | | 2,743,250 |
Lycoming County Auth. Health Sys. Rev. (Susquehanna Health Sys.) Series 2009 A, 5.5% 7/1/21 | | 3,500,000 | | 3,974,740 |
Mifflin County School District Series 2007: | | | | |
7.5% 9/1/26 (XL Cap. Assurance, Inc. Insured) | | 1,125,000 | | 1,378,958 |
7.75% 9/1/30 (XL Cap. Assurance, Inc. Insured) | | 1,175,000 | | 1,435,298 |
Monroe County Hosp. Auth. Rev.: | | | | |
(Pocono Med. Ctr. Proj.) Series 2012 A, 5% 1/1/32 | | 1,400,000 | | 1,466,794 |
(Ponco Med. Ctr. Proj.) Series 2012 A, 5% 1/1/41 | | 1,750,000 | | 1,807,400 |
Montgomery County Indl. Dev. Series 2012 A, 5% 10/1/41 | | 5,000,000 | | 5,353,900 |
Montgomery County Higher Ed. & Health Auth. Hosp. Rev. (Abington Memorial Hosp. Proj.): | | | | |
Series 2009 A, 5% 6/1/17 | | 2,000,000 | | 2,258,020 |
Series A, 6% 6/1/16 (AMBAC Insured) | | 1,000,000 | | 1,154,830 |
Montgomery County Higher Ed. & Health Auth. Rev. (Dickinson College Proj.) Series 2006 FF1, 5% 5/1/28 (CDC IXIS Finl. Guaranty Insured) | | 900,000 | | 958,473 |
Mount Lebanon School District Series 2009 A: | | | | |
5% 2/15/15 | | 500,000 | | 553,195 |
5% 2/15/34 | | 2,250,000 | | 2,520,833 |
Muhlenberg School District Series AA, 5.375% 9/1/15 (Pre-Refunded to 9/1/12 @ 100) | | 1,055,000 | | 1,063,535 |
North Hampton County Gen. Purp. Auth. Hosp. Rev. (St. Luke's Hosp. Proj.) Series 2010 A: | | | | |
5.25% 8/15/16 | | 1,245,000 | | 1,396,056 |
5.25% 8/15/18 | | 1,450,000 | | 1,630,888 |
Oxford Area School District 5.375% 2/1/27 (Nat'l. Pub. Fin. Guarantee Corp. Insured) | | 1,790,000 | | 1,960,694 |
Municipal Bonds - continued |
| Principal Amount | | Value |
Pennsylvania - continued |
Pennsylvania Econ. Dev. Auth. Governmental Lease (Forum Place Proj.) Series 2012: | | | | |
5% 3/1/24 | | $ 1,745,000 | | $ 2,011,898 |
5% 3/1/25 | | 3,255,000 | | 3,714,997 |
Pennsylvania Econ. Dev. Fing. Auth. Exempt Facilities Rev. Bonds (PPL Energy Supply LLC Proj.) Series 2009 A, 3%, tender 9/1/15 (a) | | 2,000,000 | | 2,082,040 |
Pennsylvania Econ. Dev. Fing. Auth. Health Sys. Rev. (Albert Einstein Med. Ctr. Proj.) Series 2009 A, 5.25% 10/15/15 | | 2,000,000 | | 2,140,040 |
Pennsylvania Gen. Oblig.: | | | | |
First Series 2007 A, 5% 11/1/23 | | 9,710,000 | | 11,420,214 |
First Series 2008, 5% 5/15/27 | | 805,000 | | 907,976 |
First Series 2009, 5% 3/15/27 | | 3,000,000 | | 3,518,100 |
First Series 2011, 5% 11/15/25 | | 4,000,000 | | 4,800,360 |
First Series of 2011, 5% 11/15/24 | | 5,000,000 | | 6,065,300 |
Second Series 2005, 5% 1/1/25 | | 9,900,000 | | 11,041,272 |
Second Series 2007 A, 5% 8/1/25 | | 2,500,000 | | 2,870,425 |
Second Series 2009: | | | | |
5% 4/15/25 | | 500,000 | | 592,880 |
5% 4/15/28 | | 5,000,000 | | 5,846,000 |
Pennsylvania Higher Edl. Facilities Auth. Rev.: | | | | |
(Slippery Rock Univ. Proj.) Series 2007 A, 5% 7/1/39 (XL Cap. Assurance, Inc. Insured) | | 2,500,000 | | 2,555,300 |
(Univ. of Pennsylvania Health Sys. Proj.): | | | | |
Series 2005 A, 5% 8/15/17 | | 3,000,000 | | 3,342,180 |
Series 2009 A, 5.25% 8/15/22 | | 2,655,000 | | 3,129,794 |
Series 2011 A, 5.75% 8/15/41 | | 4,980,000 | | 5,730,038 |
Series 2010 E, 5% 5/15/31 | | 2,500,000 | | 2,710,950 |
Series 2010: | | | | |
5% 9/1/30 | | 1,150,000 | | 1,323,340 |
5% 9/1/31 | | 1,025,000 | | 1,173,892 |
Pennsylvania Indl. Dev. Auth. Rev.: | | | | |
5.5% 7/1/16 | | 45,000 | | 45,450 |
5.5% 7/1/16 (AMBAC Insured) | | 1,035,000 | | 1,045,350 |
Pennsylvania State Univ.: | | | | |
Series 2005, 5% 9/1/29 | | 1,550,000 | | 1,684,525 |
Series 2008 A, 5% 8/15/29 | | 3,945,000 | | 4,384,000 |
Series 2010: | | | | |
5% 3/1/22 | | 2,640,000 | | 3,158,126 |
5% 3/1/40 | | 3,635,000 | | 4,008,496 |
Municipal Bonds - continued |
| Principal Amount | | Value |
Pennsylvania - continued |
Pennsylvania Tpk. Commission Oil Franchise Tax Rev. Series 2003 C, 5% 12/1/29 (Nat'l. Pub. Fin. Guarantee Corp. Insured) | | $ 3,000,000 | | $ 3,310,440 |
Pennsylvania Tpk. Commission Tpk. Rev.: | | | | |
Series 2004 A, 5.25% 12/1/32 (AMBAC Insured) | | 2,900,000 | | 3,123,068 |
Series 2006 A: | | | | |
5% 12/1/23 (AMBAC Insured) | | 7,695,000 | | 8,635,021 |
5% 12/1/25 (AMBAC Insured) | | 7,345,000 | | 8,160,001 |
5% 12/1/26 (AMBAC Insured) | | 3,500,000 | | 3,875,830 |
Series 2008 B1, 5.5% 6/1/33 | | 4,000,000 | | 4,360,960 |
Series 2008 C4, 6.25% 6/1/38 (Assured Guaranty Corp. Insured) | | 2,000,000 | | 2,307,200 |
Philadelphia Auth. Indl. Dev. Lease Rev. Series 2007 A, 5% 10/1/13 (Nat'l. Pub. Fin. Guarantee Corp. Insured) | | 1,500,000 | | 1,556,625 |
Philadelphia Gas Works Rev.: | | | | |
(1975 Gen. Ordinance Proj.): | | | | |
Eighteenth Series: | | | | |
5.25% 8/1/17 (Assured Guaranty Corp. Insured) | | 1,500,000 | | 1,592,160 |
5.25% 8/1/19 (Assured Guaranty Corp. Insured) | | 1,000,000 | | 1,053,520 |
5.25% 8/1/20 (Assured Guaranty Corp. Insured) | | 1,000,000 | | 1,048,970 |
Seventeenth Series, 5.375% 7/1/20 (FSA Insured) | | 2,700,000 | | 2,770,011 |
(1998 Gen. Ordinance Proj.): | | | | |
Fifth Series A1: | | | | |
5% 9/1/33 (FSA Insured) | | 2,800,000 | | 2,849,588 |
5.25% 9/1/17 (Assured Guaranty Corp. Insured) | | 3,665,000 | | 3,894,979 |
5.25% 9/1/18 (Assured Guaranty Corp. Insured) | | 3,340,000 | | 3,534,355 |
Ninth Series, 5.25% 8/1/40 | | 5,595,000 | | 5,880,065 |
Seventh Series, 5% 10/1/37 (AMBAC Insured) | | 5,245,000 | | 5,395,427 |
Philadelphia Gen. Oblig.: | | | | |
Series 2008 A, 5.25% 12/15/32 (FSA Insured) | | 6,000,000 | | 6,561,120 |
Series 2008 B, 7.125% 7/15/38 (Assured Guaranty Corp. Insured) | | 3,550,000 | | 4,042,350 |
Philadelphia Hospitals & Higher Ed. Facilities Auth. Health Systems Rev. (Jefferson Health Sys. Proj.) Series 2010 B, 5.25% 5/15/30 | | 4,000,000 | | 4,445,320 |
Philadelphia Hospitals & Higher Ed. Facilities Auth. Hosp. Rev. (Children's Hosp. of Philadelphia Proj.) Series 2011 D, 5% 7/1/32 | | 2,500,000 | | 2,830,325 |
Philadelphia Redev. Auth. Rev.: | | | | |
(Philadelphia Neighborhood Transformation Initiative Proj.) Series 2005 C, 5% 4/15/31 (Nat'l. Pub. Fin. Guarantee Corp. Insured) | | 1,000,000 | | 1,032,890 |
Municipal Bonds - continued |
| Principal Amount | | Value |
Pennsylvania - continued |
Philadelphia Redev. Auth. Rev.: - continued | | | | |
Series 2012: | | | | |
5% 4/15/21 | | $ 1,000,000 | | $ 1,165,890 |
5% 4/15/25 | | 2,230,000 | | 2,508,772 |
Philadelphia School District: | | | | |
Series 2005 A, 5% 8/1/22 (AMBAC Insured) | | 2,900,000 | | 3,072,463 |
Series 2005 D, 5.5% 6/1/16 (FSA Insured) | | 2,030,000 | | 2,302,162 |
Series 2010 C, 5% 9/1/21 | | 4,000,000 | | 4,553,080 |
Philadelphia Wtr. & Wastewtr. Rev.: | | | | |
Series 2010 C, 5% 8/1/40 (FSA Insured) | | 4,000,000 | | 4,307,840 |
Series 2011 A, 5% 1/1/41 | | 2,715,000 | | 2,910,806 |
Series A: | | | | |
5% 11/1/31 (FGIC Insured) | | 400,000 | | 401,948 |
5.375% 11/1/19 (Pre-Refunded to 11/1/12 @ 100) | | 3,000,000 | | 3,050,280 |
Pittsburgh & Allegheny County Sports & Exhibition Auth. Series 2012, 5% 2/1/25 (FSA Insured) | | 2,250,000 | | 2,548,643 |
Pittsburgh Gen. Oblig.: | | | | |
Series 2006 B: | | | | |
5.25% 9/1/15 (FSA Insured) | | 2,000,000 | | 2,232,240 |
5.25% 9/1/16 (FSA Insured) | | 3,000,000 | | 3,438,480 |
Series 2012 A, 5% 9/1/22 | | 2,000,000 | | 2,349,780 |
Pittsburgh School District Series 2012 A, 5% 9/1/21 (FSA Insured) | | 4,000,000 | | 4,868,480 |
Pittsburgh Wtr. & Swr. Auth. Wtr. & Swr. Sys. Rev. Series 1993 A: | | | | |
6.5% 9/1/13 (Escrowed to Maturity) | | 3,435,000 | | 3,556,152 |
6.5% 9/1/13 (FGIC Insured) | | 3,435,000 | | 3,535,268 |
South Fork Muni. Auth. Hosp. Rev. (Conemaugh Health Sys. Proj.) Series 2010, 5.25% 7/1/23 | | 1,000,000 | | 1,091,180 |
Southcentral Pennsylvania Gen. Auth. Rev. (WellSpan Health Obligated Group Proj.) Series 2008 A, 6% 6/1/25 | | 2,500,000 | | 2,907,475 |
Southeastern Pennsylvania Trans. Auth. Rev. Series 2010, 5% 3/1/16 | | 1,500,000 | | 1,706,130 |
State Pub. School Bldg. Auth. College Rev.: | | | | |
(Delaware County Cmnty. College Proj.) Series 2008, 5% 10/1/20 (FSA Insured) | | 1,000,000 | | 1,144,350 |
(Montgomery County Cmnty. College Proj.) Series 2008: | | | | |
5% 5/1/27 (FSA Insured) | | 1,775,000 | | 1,961,286 |
5% 5/1/28 (FSA Insured) | | 1,000,000 | | 1,100,460 |
Municipal Bonds - continued |
| Principal Amount | | Value |
Pennsylvania - continued |
Unionville-Chadds Ford School District Gen. Oblig. Series 2009 A, 5% 6/1/32 | | $ 3,000,000 | | $ 3,462,630 |
Univ. of Pittsburgh Commonwealth Sys. of Higher Ed. (Univ. Cap. Proj.): | | | | |
Series 2000 B, 5.25% 9/15/34 | | 2,000,000 | | 2,271,160 |
Series 2000 C, 5% 9/15/35 | | 2,000,000 | | 2,217,420 |
Series 2007 B, 5.25% 9/15/28 | | 2,500,000 | | 2,910,675 |
Series 2009 A, 5% 9/15/16 | | 1,150,000 | | 1,346,225 |
Series 2009 B: | | | | |
5% 9/15/28 | | 2,000,000 | | 2,283,860 |
5.5% 9/15/24 | | 5,250,000 | | 6,348,248 |
West Shore Area Auth. Hosp. Series 2011 B, 5.75% 1/1/41 | | 1,500,000 | | 1,687,905 |
Westmoreland County Gen. Oblig. Series 1992, 0% 8/1/15 (Escrowed to Maturity) | | 4,290,000 | | 4,164,346 |
Westmoreland County Indl. Dev. Auth. Rev. (Excela Health Proj.) Series 2010 A, 5% 7/1/25 | | 4,365,000 | | 4,688,752 |
Westmoreland County Muni. Auth. Muni. Svc. Rev. Series 2001 A: | | | | |
0% 8/15/19 (Nat'l. Pub. Fin. Guarantee Corp. Insured) | | 5,000,000 | | 4,163,850 |
0% 8/15/20 (Nat'l. Pub. Fin. Guarantee Corp. Insured) | | 2,500,000 | | 2,000,025 |
0% 8/15/22 (Nat'l. Pub. Fin. Guarantee Corp. Insured) | | 6,550,000 | | 4,813,464 |
Wilson School District Series 2007, 5.25% 6/1/25 (XL Cap. Assurance, Inc. Insured) | | 5,740,000 | | 6,365,086 |
York City Swr. Auth. Swr. Rev. Series 1990, 0% 12/1/12 (Nat'l. Pub. Fin. Guarantee Corp. Insured) | | 3,235,000 | | 3,211,158 |
| | 421,867,434 |
Puerto Rico - 0.8% |
Puerto Rico Elec. Pwr. Auth. Pwr. Rev.: | | | | |
Series II, 5.375% 7/1/16 | | 1,000,000 | | 1,010,000 |
Series QQ, 5.25% 7/1/13 (XL Cap. Assurance, Inc. Insured) | | 500,000 | | 521,060 |
Municipal Bonds - continued |
| Principal Amount | | Value |
Puerto Rico - continued |
Puerto Rico Sales Tax Fing. Corp. Sales Tax Rev. Series 2011 C: | | | | |
0% 8/1/39 | | $ 8,200,000 | | $ 1,819,170 |
0% 8/1/41 | | 1,200,000 | | 233,532 |
| | 3,583,762 |
TOTAL INVESTMENT PORTFOLIO - 94.5% (Cost $405,694,205) | 433,843,475 |
NET OTHER ASSETS (LIABILITIES) - 5.5% | | 25,424,568 |
NET ASSETS - 100% | $ 459,268,043 |
Legend |
(a) Coupon rates for floating and adjustable rate securities reflect the rates in effect at period end. |
(b) Private activity obligations whose interest is subject to the federal alternative minimum tax for individuals. |
Other Information |
All investments are categorized as Level 2 under the Fair Value Hierarchy. The inputs or methodology used for valuing securities may not be an indication of the risk associated with investing in those securities. For more information on valuation inputs, please refer to the Security Valuation section in the accompanying Notes to Financial Statements. |
The distribution of municipal securities by revenue source, as a percentage of total net assets, is as follows (Unaudited): |
General Obligations | 32.7% |
Health Care | 17.3% |
Education | 11.9% |
Transportation | 9.7% |
Electric Utilities | 7.6% |
Water & Sewer | 7.2% |
Other | 5.5% |
Others* (Individually Less Than 5%) | 8.1% |
| 100.0% |
* Includes net other assets |
See accompanying notes which are an integral part of the financial statements.
Semiannual Report
Fidelity Pennsylvania Municipal Income Fund
Statement of Assets and Liabilities
| June 30, 2012 (Unaudited) |
Assets | | |
Investment in securities, at value - See accompanying schedule: Unaffiliated issuers (cost $405,694,205) | | $ 433,843,475 |
Cash | | 19,917,774 |
Receivable for fund shares sold | | 923,838 |
Interest receivable | | 5,388,188 |
Other receivables | | 4,033 |
Total assets | | 460,077,308 |
| | |
Liabilities | | |
Payable for fund shares redeemed | $ 107,816 | |
Distributions payable | 426,500 | |
Accrued management fee | 138,768 | |
Transfer agent fee payable | 83,174 | |
Other affiliated payables | 29,348 | |
Other payables and accrued expenses | 23,659 | |
Total liabilities | | 809,265 |
| | |
Net Assets | | $ 459,268,043 |
Net Assets consist of: | | |
Paid in capital | | $ 430,220,846 |
Undistributed net investment income | | 53,547 |
Accumulated undistributed net realized gain (loss) on investments | | 844,380 |
Net unrealized appreciation (depreciation) on investments | | 28,149,270 |
Net Assets, for 40,547,896 shares outstanding | | $ 459,268,043 |
Net Asset Value, offering price and redemption price per share ($459,268,043 ÷ 40,547,896 shares) | | $ 11.33 |
See accompanying notes which are an integral part of the financial statements.
Semiannual Report
Fidelity Pennsylvania Municipal Income Fund
Financial Statements - continued
Statement of Operations
Six months ended June 30, 2012 (Unaudited) |
Investment Income | | |
Interest | | $ 8,845,576 |
| | |
Expenses | | |
Management fee | $ 808,474 | |
Transfer agent fees | 166,917 | |
Accounting fees and expenses | 57,279 | |
Custodian fees and expenses | 2,669 | |
Independent trustees' compensation | 788 | |
Registration fees | 20,947 | |
Audit | 23,120 | |
Legal | 2,916 | |
Miscellaneous | 1,730 | |
Total expenses before reductions | 1,084,840 | |
Expense reductions | (3,853) | 1,080,987 |
Net investment income (loss) | | 7,764,589 |
Realized and Unrealized Gain (Loss) Net realized gain (loss) on: | | |
Investment securities: | | |
Unaffiliated issuers | | 1,218,498 |
Change in net unrealized appreciation (depreciation) on investment securities | | 7,519,896 |
Net gain (loss) | | 8,738,394 |
Net increase (decrease) in net assets resulting from operations | | $ 16,502,983 |
See accompanying notes which are an integral part of the financial statements.
Semiannual Report
Statement of Changes in Net Assets
| Six months ended June 30, 2012
(Unaudited) | Year ended
December 31, 2011 |
Increase (Decrease) in Net Assets | | |
Operations | | |
Net investment income (loss) | $ 7,764,589 | $ 15,776,914 |
Net realized gain (loss) | 1,218,498 | (233,547) |
Change in net unrealized appreciation (depreciation) | 7,519,896 | 21,854,173 |
Net increase (decrease) in net assets resulting
from operations | 16,502,983 | 37,397,540 |
Distributions to shareholders from net investment income | (7,717,388) | (15,776,599) |
Share transactions
Proceeds from sales of shares | 63,924,639 | 76,315,039 |
Reinvestment of distributions | 5,041,121 | 9,732,684 |
Cost of shares redeemed | (43,177,027) | (113,940,721) |
Net increase (decrease) in net assets resulting from share transactions | 25,788,733 | (27,892,998) |
Redemption fees | 1,129 | 3,483 |
Total increase (decrease) in net assets | 34,575,457 | (6,268,574) |
| | |
Net Assets | | |
Beginning of period | 424,692,586 | 430,961,160 |
End of period (including undistributed net investment income of $53,547 and undistributed net investment income of $6,346, respectively) | $ 459,268,043 | $ 424,692,586 |
Other Information Shares | | |
Sold | 5,663,109 | 7,114,011 |
Issued in reinvestment of distributions | 445,625 | 904,776 |
Redeemed | (3,830,799) | (10,739,144) |
Net increase (decrease) | 2,277,935 | (2,720,357) |
See accompanying notes which are an integral part of the financial statements.
Semiannual Report
Financial Highlights
| Six months ended June 30, 2012 | Years ended December 31, |
| (Unaudited) | 2011 | 2010 | 2009 | 2008 | 2007 |
Selected Per-Share Data | | | | | |
Net asset value, beginning of period | $ 11.10 | $ 10.51 | $ 10.78 | $ 10.21 | $ 10.73 | $ 10.78 |
Income from Investment Operations | | | | | | |
Net investment income (loss) D | .198 | .415 | .418 | .407 | .416 | .419 |
Net realized and unrealized gain (loss) | .229 | .590 | (.197) | .569 | (.497) | (.005) |
Total from investment operations | .427 | 1.005 | .221 | .976 | (.081) | .414 |
Distributions from net investment income | (.197) | (.415) | (.418) | (.407) | (.416) | (.419) |
Distributions from net realized gain | - | - | (.073) | - | (.023) | (.045) |
Total distributions | (.197) | (.415) | (.491) | (.407) | (.439) | (.464) |
Redemption fees added to paid in capital D | - F | - F | - F | .001 | - F | - F |
Net asset value, end of period | $ 11.33 | $ 11.10 | $ 10.51 | $ 10.78 | $ 10.21 | $ 10.73 |
Total Return B,C | 3.86% | 9.76% | 2.02% | 9.70% | (.77)% | 3.94% |
Ratios to Average Net Assets E | | | | | |
Expenses before reductions | .49% A | .50% | .50% | .51% | .50% | .50% |
Expenses net of fee waivers, if any | .49% A | .50% | .50% | .51% | .50% | .50% |
Expenses net of all reductions | .49% A | .50% | .50% | .51% | .46% | .46% |
Net investment income (loss) | 3.53% A | 3.87% | 3.85% | 3.84% | 3.96% | 3.92% |
Supplemental Data | | | | | | |
Net assets, end of period (000 omitted) | $ 459,268 | $ 424,693 | $ 430,961 | $ 428,569 | $ 326,566 | $ 315,463 |
Portfolio turnover rate | 20% A | 12% | 19% | 8% | 17% | 19% |
A Annualized
B Total returns for periods of less than one year are not annualized.
C Total returns would have been lower if certain expenses had not been reduced during the applicable periods shown.
D Calculated based on average shares outstanding during the period.
E Expense ratios reflect operating expenses of the Fund. Expenses before reductions do not reflect amounts reimbursed by the investment adviser or reductions from expense offset arrangements and do not represent the amount paid by the Fund during periods when reimbursements or reductions occur. Expenses net of fee waivers reflect expenses after reimbursement by the investment adviser but prior to reductions from expense offset arrangements. Expenses net of all reductions represent the net expenses paid by the Fund.
F Amount represents less than $.001 per share.
See accompanying notes which are an integral part of the financial statements.
Semiannual Report
Fidelity Pennsylvania Municipal Money Market Fund
Investment Changes/Performance (Unaudited)
Effective Maturity Diversification |
Days | % of fund's investments 6/30/12 | % of fund's investments 12/31/11 | % of fund's
investments
6/30/11 |
1 - 7 | 87.5 | 86.3 | 82.3 |
8 - 30 | 1.6 | 0.6 | 3.5 |
31 - 60 | 3.1 | 4.2 | 3.6 |
61 - 90 | 0.7 | 1.0 | 3.1 |
91 - 180 | 0.7 | 4.3 | 2.2 |
> 180 | 6.4 | 3.6 | 5.4 |
Effective maturity is determined in accordance with the requirements of Rule 2a-7 under the Investment Company Act of 1940. |
Weighted Average Maturity |
| 6/30/12 | 12/31/11 | 6/30/11 |
Fidelity Pennsylvania Municipal Money Market Fund | 28 Days | 22 Days | 26 Days |
Pennsylvania Tax-Free Money Market Funds Average* | 30 Days | 25 Days | 26 Days |
This is a weighted average of all the maturities of the securities held in a fund. Weighted Average Maturity (WAM) can be used as a measure of sensitivity to interest rate changes and market changes. Generally, the longer the maturity, the greater the sensitivity to such changes. WAM is based on the dollar-weighted average length of time until principal payments must be paid. Depending on the types of securities held in a fund, certain maturity shortening devices (e.g., demand features, interest rate resets, and call options) may be taken into account when calculating the WAM. |
Weighted Average Life |
| 6/30/12 | 12/31/11 | 6/30/11 |
Fidelity Pennsylvania Municipal Money Market Fund | 28 Days | 22 Days | 29 Days |
Weighted Average Life (WAL) is the weighted average of the life of the securities held in a fund or portfolio and can be used as a measure of sensitivity to changes in liquidity and/or credit risk. Generally, the higher the value, the greater the sensitivity. WAL is based on the dollar-weighted average length of time until principal payments must be paid, taking into account any call options exercised by the issuer and any permissible maturity shortening features other than interest rate resets. The difference between WAM and WAL is that WAM takes into account interest rate resets and WAL does not. WAL for money market funds is not the same as WAL of a mortgage- or asset-backed security. |
Asset Allocation (% of fund's net assets) |
As of June 30, 2012 | As of December 31, 2011 |
| Variable Rate
Demand Notes
(VRDNs) 73.9% | | | Variable Rate
Demand Notes
(VRDNs) 80.9% | |
 | Other
Municipal Debt 17.6% | |  | Other
Municipal Debt 0.0% | |
 | Commercial
Paper (including
CP Mode) 0.0% | |  | Commercial
Paper (including
CP Mode) 4.5% | |
 | Investment
Companies 10.4% | | | Investment
Companies 0.0% | |
| Tender Bonds 0.0% | |  | Tender Bonds 1.1% | |
 | Municipal Notes 0.0% | | | Municipal Notes 2.3% | |
| Fidelity Municipal
Cash Central Fund 0.0% | |  | Fidelity Municipal
Cash Central Fund 0.9% | |
| Other Investments 0.0% | | | Other Investments 8.8% | |
| Net
Other Assets
(Liabilities)** (1.9)% | | | Net
Other Assets
(Liabilities) 1.5% | |

* Source: iMoneyNet, Inc.
** Net Other Assets are not included in the pie chart.
Current and Historical Seven-Day Yields
| 6/30/12 | 3/31/12 | 1/2/12 | 10/3/11 | 6/27/11 |
Fidelity Pennsylvania Municipal Money Market Fund | 0.01% | 0.01% | 0.01% | 0.01% | 0.01% |
Yield refers to the income paid by the fund over a given period. Yields for money market funds are usually for seven-day periods, as they are here, though they are expressed as annual percentage rates. Past performance is no guarantee of future results. Yield will vary and it's possible to lose money investing in the Fund. A portion of the fund's expenses was reimbursed and/or waived. Absent such reimbursements and/or waivers the yield for the period ending June 30, 2012, the most recent period shown in the table, would have been -0.29%.
Semiannual Report
Fidelity Pennsylvania Municipal Money Market Fund
Investments June 30, 2012 (Unaudited)
Showing Percentage of Net Assets
Variable Rate Demand Note - 73.9% |
| Principal Amount | | Value |
Alabama - 0.1% |
Decatur Indl. Dev. Board Exempt Facilities Rev. (Nucor Steel Decatur LLC Proj.) Series 2003 A, 0.24% 7/6/12, VRDN (a)(d) | $ 400,000 | | $ 400,000 |
District Of Columbia - 0.1% |
District of Columbia Rev. (American Psychological Assoc. Proj.) Series 2003, 0.4% 7/6/12, LOC Bank of America NA, VRDN (a) | 1,000,000 | | 1,000,000 |
Florida - 0.5% |
Collier County Hsg. Fin. Auth. Multi-family Rev. (George Washington Carver Apts. Proj.) Series 2005, 0.3% 7/6/12, LOC PNC Bank NA, VRDN (a)(d) | 3,280,000 | | 3,280,000 |
Georgia - 0.3% |
Coweta County Dev. Auth. Rev. (W. Y. Industries, Inc. Proj.) Series 2007, 0.33% 7/6/12, LOC Wells Fargo Bank NA, VRDN (a)(d) | 1,890,000 | | 1,890,000 |
Iowa - 0.5% |
Iowa Fin. Auth. Poll. Cont. Facility Rev. (MidAmerican Energy Proj.) Series 2008 B, 0.18% 7/6/12, VRDN (a) | 3,200,000 | | 3,200,000 |
New Jersey - 0.1% |
Salem County Poll. Cont. Fin. Auth. Rev. (Pub. Svc. Elec. and Gas Co. Proj.) Series 2012 A, 0.45% 7/6/12, VRDN (a)(d) | 500,000 | | 500,000 |
North Carolina - 0.0% |
Parson County Indl. Facilities and Poll. Cont. Fing. Auth. (CertainTeed Gypsum NC, Inc. Proj.) Series 2010, 0.62% 7/6/12, LOC Cr. Industriel et Commercial, VRDN (a) | 300,000 | | 300,000 |
Pennsylvania - 71.4% |
Allegheny County Series C-58 A, 0.18% 7/6/12, LOC JPMorgan Chase Bank, VRDN (a) | 7,845,000 | | 7,845,000 |
Allegheny County Hosp. Dev. Auth. Rev.: | | | |
(Children's Institute Pittsburgh Proj.) Series 2005 A, 0.17% 7/6/12, LOC PNC Bank NA, VRDN (a) | 3,190,000 | | 3,190,000 |
(Jefferson Reg'l. Med. Ctr.) Series 2010 A, 0.17% 7/6/12, LOC PNC Bank NA, VRDN (a) | 8,640,000 | | 8,640,000 |
(South Hills Health Sys. Proj.) Series 2000 A, 0.17% 7/6/12, LOC PNC Bank NA, VRDN (a) | 4,600,000 | | 4,600,000 |
(UPMC Health Sys. Proj.) Series 2010 B2, 0.16% 7/6/12, LOC Deutsche Bank AG New York Branch, VRDN (a) | 6,900,000 | | 6,900,000 |
Allegheny County Indl. Dev. Auth. Rev.: | | | |
(Doren, Inc. Proj.) Series 1997 C, 0.36% 7/6/12, LOC PNC Bank NA, VRDN (a)(d) | 300,000 | | 300,000 |
(R.I. Lampus Co. Proj.) Series 1997 A, 0.36% 7/6/12, LOC PNC Bank NA, VRDN (a)(d) | 710,000 | | 710,000 |
Variable Rate Demand Note - continued |
| Principal Amount | | Value |
Pennsylvania - continued |
Allegheny County Indl. Dev. Auth. Rev.: - continued | | | |
(The Neighborhood Academy Proj.) 0.17% 7/6/12, LOC PNC Bank NA, VRDN (a) | $ 4,500,000 | | $ 4,500,000 |
(The Watson Institute Friendship Academy Proj.) Series 2010, 0.17% 7/6/12, LOC PNC Bank NA, VRDN (a) | 3,750,000 | | 3,750,000 |
(Union Elec. Steel Co. Proj.) Series 1996 A, 0.24% 7/6/12, LOC PNC Bank NA, VRDN (a)(d) | 3,120,000 | | 3,120,000 |
(United Jewish Federation Proj.) Series 1996 A, 0.17% 7/6/12, LOC PNC Bank NA, VRDN (a) | 400,000 | | 400,000 |
Beaver County Indl. Dev. Auth. Poll. Cont. Rev. Series 2005 A, 0.19% 7/6/12, LOC Bank of Nova Scotia New York Branch, VRDN (a) | 6,700,000 | | 6,700,000 |
Berks County Indl. Dev. Auth. Rev. (Kutztown Univ. Foundation, Inc. Proj.) Series 2004, 0.18% 7/6/12, LOC Wells Fargo Bank NA, VRDN (a) | 6,740,000 | | 6,740,000 |
Berks County Muni. Auth. Rev. Participating VRDN Series Putters 3779 Z, 0.18% 7/6/12 (Liquidity Facility JPMorgan Chase Bank) (a)(e) | 2,750,000 | | 2,750,000 |
Bucks County Indl. Dev. Auth. Rev.: | | | |
(Lutheran Cmnty. at Telford Healthcare Ctr., Inc. Proj.) Series 2007 B, 0.24% 7/6/12, LOC Citizens Bank of Pennsylvania, VRDN (a) | 3,650,000 | | 3,650,000 |
(Snowball Real Estate LP Proj.) 0.38% 7/6/12, LOC Wells Fargo Bank NA, VRDN (a)(d) | 1,395,000 | | 1,395,000 |
Butler County Gen. Auth. Rev. (Erie School District Proj.) Series 2011, 0.17% 7/6/12, LOC PNC Bank NA, VRDN (a) | 5,400,000 | | 5,400,000 |
Chester County Indl. Dev. Auth. Student Hsg. Rev. (West Chester Univ. Proj.): | | | |
Series 2008 A1, 0.25% 7/6/12, LOC Citizens Bank of Pennsylvania, VRDN (a) | 20,370,000 | | 20,370,000 |
Series 2008 A2, 0.18% 7/6/12, LOC TD Banknorth, NA, VRDN (a) | 13,900,000 | | 13,900,000 |
Chester County Intermediate Unit Rev. Series 2003, 0.18% 7/6/12, LOC PNC Bank NA, VRDN (a) | 2,055,000 | | 2,055,000 |
Crawford County Indl. Dev. Auth. College Rev. (Allegheny College Proj.) Series 2009 B, 0.17% 7/6/12, LOC PNC Bank NA, VRDN (a) | 2,000,000 | | 2,000,000 |
Cumberland County Muni. Auth. Rev. (Messiah Village Proj.) Series 2008 B, 0.28% 7/6/12, LOC Citizens Bank of Pennsylvania, VRDN (a) | 8,000,000 | | 8,000,000 |
Delaware County Auth. Rev. (White Horse Village Proj.): | | | |
Series 2006 A, 0.19% 7/2/12, LOC Citizens Bank of Pennsylvania, VRDN (a) | 4,715,000 | | 4,715,000 |
Variable Rate Demand Note - continued |
| Principal Amount | | Value |
Pennsylvania - continued |
Delaware County Auth. Rev. (White Horse Village Proj.): - continued | | | |
Series 2008, 0.19% 7/2/12, LOC Citizens Bank of Pennsylvania, VRDN (a) | $ 2,310,000 | | $ 2,310,000 |
Delaware County Indl. Dev. Auth. Rev. (The Agnes Irwin School Proj.) Series 2003, 0.27% 7/6/12, LOC Citizens Bank of Pennsylvania, VRDN (a) | 7,835,000 | | 7,835,000 |
Erie County Hosp. Auth. Rev. (Saint Vincent Health Ctr. Proj.) Series 2010 B, 0.18% 7/6/12, LOC Manufacturers & Traders Trust Co., VRDN (a) | 13,100,000 | | 13,100,000 |
Geisinger Auth. Health Sys. Rev. Participating VRDN: | | | |
Series Putters 3446, 0.18% 7/6/12 (Liquidity Facility JPMorgan Chase Bank) (a)(e) | 6,600,000 | | 6,600,000 |
Series Putters 3915 Z, 0.18% 7/6/12 (Liquidity Facility JPMorgan Chase Bank) (a)(e) | 5,000,000 | | 5,000,000 |
Series WF 11 69C, 0.19% 7/6/12 (Liquidity Facility Wells Fargo Bank NA) (a)(e) | 1,600,000 | | 1,600,000 |
Haverford Township School District Series 2009, 0.18% 7/6/12, LOC TD Banknorth, NA, VRDN (a) | 5,675,000 | | 5,675,000 |
Lehigh County Gen. Purp. Auth. (Muhlenberg College Proj.) Series 2008, 0.3% 7/6/12, LOC Bank of America NA, VRDN (a) | 9,100,000 | | 9,100,000 |
Lower Merion School District Series 2009 B, 0.16% 7/6/12, LOC U.S. Bank NA, Cincinnati, VRDN (a) | 3,700,000 | | 3,700,000 |
Montgomery County Redev. Auth. Multi-family Hsg. Rev. (Kingswood Apts. Proj.) Series 2001 A, 0.18% 7/6/12, LOC Fannie Mae, VRDN (a) | 1,950,000 | | 1,950,000 |
Moon Indl. Dev. Auth. Commercial Dev. Rev. (One Thorn Run Ctr. Proj.) Series 1995 A, 0.24% 7/6/12, LOC PNC Bank NA, VRDN (a)(d) | 2,530,000 | | 2,530,000 |
Northampton Indl. Dev. Auth. Rev. (Ultra-Poly Corp./Portland Ind. Park Proj.) Series 1997, 0.3% 7/6/12, LOC PNC Bank NA, VRDN (a)(d) | 1,082,000 | | 1,082,000 |
Northeastern Pennsylvania Hosp. and Ed. Auth. Rev. (The Commonwealth Med. College Proj.) Series 2009, 0.15% 7/6/12, LOC PNC Bank NA, VRDN (a) | 6,000,000 | | 6,000,000 |
Pennsylvania Econ. Dev. Fing. Auth. Indl. Dev. Rev.: | | | |
(Leidy's, Inc. Proj.) Series 1995 D7, 0.24% 7/6/12, LOC PNC Bank NA, VRDN (a)(d) | 500,000 | | 500,000 |
(Westrum Harleysville II, LP Proj.) Series 2005, 0.2% 7/6/12, LOC Fed. Home Ln. Bank Pittsburgh, VRDN (a)(d) | 10,575,000 | | 10,575,000 |
Series 1999 C4, 0.36% 7/6/12, LOC PNC Bank NA, VRDN (a)(d) | 300,000 | | 300,000 |
Series 2002 B5, 0.24% 7/6/12, LOC PNC Bank NA, VRDN (a)(d) | 5,000,000 | | 5,000,000 |
Variable Rate Demand Note - continued |
| Principal Amount | | Value |
Pennsylvania - continued |
Pennsylvania Econ. Dev. Fing. Auth. Indl. Dev. Rev.: - continued | | | |
Series 2004 D2, 0.24% 7/6/12, LOC PNC Bank NA, VRDN (a)(d) | $ 1,000,000 | | $ 1,000,000 |
Pennsylvania Econ. Dev. Fing. Auth. Manufacturing Facility Rev. (Dodge Realty Partners Proj.) Series 2007, 0.28% 7/6/12, LOC Citibank NA, VRDN (a)(d) | 6,300,000 | | 6,300,000 |
Pennsylvania Gen. Oblig. Participating VRDN: | | | |
Series Putters 3350, 0.18% 7/6/12 (Liquidity Facility JPMorgan Chase Bank) (a)(e) | 4,540,000 | | 4,540,000 |
Series Putters 3352Z, 0.18% 7/6/12 (Liquidity Facility JPMorgan Chase Bank) (a)(e) | 4,435,000 | | 4,435,000 |
Series Putters 4014, 0.18% 7/6/12 (Liquidity Facility JPMorgan Chase Bank) (a)(e) | 3,000,000 | | 3,000,000 |
Series Putters 4201, 0.18% 7/2/12 (Liquidity Facility JPMorgan Chase Bank) (a)(e) | 2,000,000 | | 2,000,000 |
Series RBC O 34, 0.18% 7/6/12 (Liquidity Facility Royal Bank of Canada) (a)(e) | 5,000,000 | | 5,000,000 |
Series ROC II R 11505, 0.18% 7/6/12 (Liquidity Facility Citibank NA) (a)(e) | 11,000,000 | | 11,000,000 |
Series ROC II R 14002, 0.19% 7/6/12 (Liquidity Facility Citibank NA) (a)(e) | 7,800,000 | | 7,800,000 |
Series WF 11 121C, 0.19% 7/6/12 (Liquidity Facility Wells Fargo Bank NA) (a)(e) | 13,400,000 | | 13,400,000 |
Pennsylvania Higher Edl. Facilities Auth. Rev.: | | | |
(Holy Family Univ. Proj.) Series 2008, 0.18% 7/6/12, LOC TD Banknorth, NA, VRDN (a) | 4,640,000 | | 4,640,000 |
(King's College Proj.) Series 2002 J3, 0.17% 7/6/12, LOC PNC Bank NA, VRDN (a) | 125,000 | | 125,000 |
(La Salle Univ. Proj.) Series 2007 B, 0.22% 7/6/12, LOC Citizens Bank of Pennsylvania, VRDN (a) | 3,900,000 | | 3,900,000 |
Participating VRDN: | | | |
ROC II R 11721, 0.19% 7/6/12 (Liquidity Facility Citibank NA) (a)(e) | 7,500,000 | | 7,500,000 |
Series MS 3252, 0.27% 7/6/12 (Liquidity Facility Morgan Stanley Bank, West Valley City Utah) (a)(e) | 5,840,000 | | 5,840,000 |
Series Putters 3583Z, 0.18% 7/6/12 (Liquidity Facility JPMorgan Chase Bank) (a)(e) | 6,060,000 | | 6,060,000 |
Series WF 11 26C, 0.19% 7/6/12 (Liquidity Facility Wells Fargo Bank NA) (a)(e) | 3,000,000 | | 3,000,000 |
Pennsylvania Hsg. Fin. Agcy. Single Family Mtg. Rev. Participating VRDN: | | | |
Series Putters 3786 Z, 0.27% 7/6/12 (Liquidity Facility JPMorgan Chase Bank) (a)(d)(e) | 4,935,000 | | 4,935,000 |
Variable Rate Demand Note - continued |
| Principal Amount | | Value |
Pennsylvania - continued |
Pennsylvania Hsg. Fin. Agcy. Single Family Mtg. Rev. Participating VRDN: - continued | | | |
Series Putters 3950, 0.18% 7/6/12 (Liquidity Facility JPMorgan Chase Bank) (a)(e) | $ 3,000,000 | | $ 3,000,000 |
Series Putters 4109, 0.28% 7/2/12 (Liquidity Facility JPMorgan Chase Bank) (a)(d)(e) | 6,800,000 | | 6,800,000 |
Pennsylvania Intergovernmental Coop. Auth. Spl. Tax Rev. Participating VRDN Series Putters 3481, 0.18% 7/6/12 (Liquidity Facility JPMorgan Chase Bank) (a)(e) | 5,035,000 | | 5,035,000 |
Pennsylvania State Pub. School Participating VRDN Series Solar 06 161, 0.16% 7/6/12 (Liquidity Facility U.S. Bank NA, Cincinnati) (a)(e) | 3,975,000 | | 3,975,000 |
Pennsylvania Tpk. Commission Tpk. Rev.: | | | |
Series 2008 B1, 0.16% 7/6/12, LOC Barclays Bank PLC, VRDN (a) | 19,775,000 | | 19,775,000 |
Series 2008 C, 0.16% 7/6/12, LOC Barclays Bank PLC, VRDN (a) | 13,500,000 | | 13,500,000 |
Philadelphia Auth. for Indl. Dev. Rev.: | | | |
(Spl. People in Northeast, Inc. Proj.) Series 2006, 0.22% 7/6/12, LOC Citizens Bank of Pennsylvania, VRDN (a) | 7,540,000 | | 7,540,000 |
(The Franklin Institute Proj.) Series 2006, 0.3% 7/6/12, LOC Bank of America NA, VRDN (a) | 9,200,000 | | 9,200,000 |
(William Penn Charter School Proj.) Series 2008, 0.17% 7/6/12, LOC PNC Bank NA, VRDN (a) | 410,000 | | 410,000 |
Philadelphia Auth. Indl. Dev. Lease Rev. Series 2007 B1, 0.15% 7/6/12, LOC JPMorgan Chase Bank, VRDN (a) | 7,800,000 | | 7,800,000 |
Philadelphia Gas Works Rev. (1998 Gen. Ordinance Proj.): | | | |
Eighth Series D, 0.24% 7/6/12, LOC Bank of America NA, VRDN (a) | 24,400,000 | | 24,400,000 |
Fifth Series A2, 0.17% 7/6/12, LOC JPMorgan Chase Bank, VRDN (a) | 4,000,000 | | 4,000,000 |
Philadelphia Hospitals & Higher Ed. Facilities Auth. Health Systems Rev. Participating VRDN Series ROC II R 11867, 0.18% 7/6/12 (Liquidity Facility Citibank NA) (a)(e) | 5,500,000 | | 5,500,000 |
Philadelphia Hospitals & Higher Ed. Facilities Auth. Hosp. Rev. Participating VRDN Series Putters 3975, 0.18% 7/6/12 (Liquidity Facility JPMorgan Chase Bank) (a)(e) | 3,665,000 | | 3,665,000 |
Pittsburgh Wtr. & Swr. Auth. Wtr. & Swr. Sys. Rev. Series 2008 B2, 0.17% 7/6/12, LOC PNC Bank NA, VRDN (a) | 1,000,000 | | 1,000,000 |
RBC Muni. Products, Inc. Trust Participating VRDN: | | | |
Series RBC E 22, 0.18% 7/6/12 (Liquidity Facility Royal Bank of Canada) (a)(e) | 6,600,000 | | 6,600,000 |
Series RBC E 28, 0.18% 7/6/12 (Liquidity Facility Royal Bank of Canada) (a)(e) | 6,900,000 | | 6,900,000 |
Variable Rate Demand Note - continued |
| Principal Amount | | Value |
Pennsylvania - continued |
RBC Muni. Products, Inc. Trust Participating VRDN: - continued | | | |
Series RBC E 29, 0.18% 7/6/12 (Liquidity Facility Royal Bank of Canada) (a)(e) | $ 6,500,000 | | $ 6,500,000 |
Series RBC E 30, 0.18% 7/6/12 (Liquidity Facility Royal Bank of Canada) (a)(e) | 10,000,000 | | 10,000,000 |
Ridley School District Series 2009, 0.18% 7/6/12, LOC TD Banknorth, NA, VRDN (a) | 6,520,000 | | 6,520,000 |
Schuylkill County Indl. Dev. Auth. Rev. (KP Tamaqua LP Proj.) Series 2007, 0.28% 7/6/12, LOC Citizens Bank of Pennsylvania, VRDN (a)(d) | 2,005,000 | | 2,005,000 |
Somerset County Gen. Oblig. Series 2009 A, 0.17% 7/6/12, LOC PNC Bank NA, VRDN (a) | 3,475,000 | | 3,475,000 |
Washington County Hosp. Auth. Rev. (Washington Hosp. Proj.) Series 2007 B, 0.16% 7/6/12, LOC PNC Bank NA, LOC Wells Fargo Bank NA, VRDN (a) | 9,200,000 | | 9,200,000 |
Wilkens Area Indl. Dev. Auth. Rev. (Fairview Extended Care Proj.) Series B, 0.45% 7/6/12, LOC Bank of America NA, VRDN (a) | 5,465,000 | | 5,465,000 |
| | 471,227,000 |
South Carolina - 0.1% |
Oconee County Poll. Cont. Rev. (Duke Energy Corp. Proj.) Series 1999 B, 0.25% 7/2/12, VRDN (a)(d) | 500,000 | | 500,000 |
Texas - 0.7% |
Harris County Cultural Ed. Facilities Fin. Corp. Rev. (YMCA of the Greater Houston Area Proj.) Series 2008 C, 0.4% 7/2/12, LOC Bank of America NA, VRDN (a) | 1,000,000 | | 1,000,000 |
North Texas Tollway Auth. Rev. Series 2011 A, 0.29% 7/6/12, LOC Morgan Stanley Bank, West Valley City Utah, VRDN (a) | 3,800,000 | | 3,800,000 |
| | 4,800,000 |
Virginia - 0.1% |
Virginia Hsg. Dev. Auth. Commonwealth Mtg. Rev. Participating VRDN Series BA 1047, 0.33% 7/6/12 (Liquidity Facility Bank of America NA) (a)(d)(e) | 1,000,000 | | 1,000,000 |
TOTAL VARIABLE RATE DEMAND NOTE (Cost $488,097,000) |
488,097,000
|
Other Municipal Debt - 17.6% |
| Principal Amount | | Value |
Kentucky - 0.2% |
Trimble County Poll. Cont. Rev. Bonds (Louisville Gas & Elec. Co. Proj.) Series 2001 B, 0.45% tender 7/12/12, CP mode (d) | $ 1,100,000 | | $ 1,100,000 |
Massachusetts - 0.2% |
Massachusetts Indl. Fin. Agcy. Poll. Cont. Rev. Bonds (New England Pwr. Co. Proj.) Series 1993 A, 0.42% tender 7/26/12, CP mode | 1,200,000 | | 1,200,000 |
New Hampshire - 0.3% |
New Hampshire Bus. Fin. Auth. Poll. Cont. Rev. Bonds: | | | |
(New England Pwr. Co. Proj.) Series 1990 A, 0.5% tender 7/25/12, CP mode (d) | 1,300,000 | | 1,300,000 |
Series 1990 B, 0.55% tender 8/10/12, CP mode | 800,000 | | 800,000 |
| | 2,100,000 |
Pennsylvania - 16.9% |
Allegheny County Hosp. Dev. Auth. Rev. Bonds Series 2011 A, 2% 10/15/12 | 1,505,000 | | 1,512,093 |
Franklin County Indl. Dev. Auth. Bonds (The Chambersburg Hosp. Proj.) Series 2010, 3% 7/1/12 | 1,000,000 | | 1,000,000 |
Pennsylvania Gen. Oblig. Bonds: | | | |
First Series 2003, 5% 1/1/13 | 1,950,000 | | 1,997,192 |
First Series 2004, 5.25% 2/1/13 | 4,500,000 | | 4,632,617 |
First Series 2006, 5% 10/1/12 | 1,000,000 | | 1,012,067 |
First Series 2008, 5% 5/15/13 | 3,350,000 | | 3,490,203 |
First Series 2009, 5% 3/15/13 | 1,000,000 | | 1,033,799 |
Fourth Series 2004, 5% 7/1/13 | 3,190,000 | | 3,342,630 |
Second Series 2003, 5% 7/1/12 | 3,450,000 | | 3,450,000 |
Second Series 2004, 5.5% 6/1/13 | 1,000,000 | | 1,048,423 |
Second Series 2008, 5% 2/15/13 | 1,000,000 | | 1,029,895 |
Second Series 2009, 4% 7/1/12 | 1,000,000 | | 1,000,000 |
Series 2002, 5.5% 2/1/13 | 3,950,000 | | 4,072,230 |
Series 2004, 5.25% 7/1/13 | 1,000,000 | | 1,050,465 |
Series 2009, 5% 7/1/13 | 2,925,000 | | 3,064,956 |
Series 2010 A: | | | |
5% 7/15/12 | 7,000,000 | | 7,012,765 |
5% 5/1/13 | 10,380,000 | | 10,794,320 |
Third Series 2004, 5% 9/1/12 | 2,175,000 | | 2,192,443 |
Pennsylvania Higher Edl. Facilities Auth. College & Univ. Revs. Bonds Series 2002, 5.25% 12/1/12 | 2,000,000 | | 2,041,574 |
Pennsylvania Infrastructure Invt. Auth. Rev. Series 2010 A, 0.28% 7/2/12, LOC Bank of America NA, CP | 20,000,000 | | 20,000,000 |
Other Municipal Debt - continued |
| Principal Amount | | Value |
Pennsylvania - continued |
Philadelphia Hospitals & Higher Ed. Facilities Auth. Health Systems Rev. Bonds (Jefferson Health Sys. Proj.) Series 2010 B, 4% 5/15/13 | $ 1,000,000 | | $ 1,031,450 |
Univ. of Pittsburgh Commonwealth Sys. of Higher Ed.: | | | |
BAN Series 2012, 2% 7/2/13 | 6,700,000 | | 6,820,062 |
Bonds: | | | |
(Higher Ed. Proj.) 0.2% tender 8/2/12, CP mode | 10,805,000 | | 10,805,000 |
(Univ. Cap. Proj.): | | | |
Series 2005 B, 0.17% tender 7/2/12, CP mode | 6,700,000 | | 6,700,000 |
Series 2012 C, 0.19% tender 8/1/12, CP mode | 9,000,000 | | 9,000,000 |
Series B, 5% 9/15/12 | 2,500,000 | | 2,525,151 |
| | 111,659,335 |
TOTAL OTHER MUNICIPAL DEBT (Cost $116,059,335) |
116,059,335
|
Investment Company - 10.4% |
| Shares | | |
Fidelity Municipal Cash Central Fund, 0.21% (b)(c) | 68,550,000 | |
68,550,000
|
TOTAL INVESTMENT PORTFOLIO - 101.9% (Cost $672,706,335) | 672,706,335 |
NET OTHER ASSETS (LIABILITIES) - (1.9)% | (12,654,512) |
NET ASSETS - 100% | $ 660,051,823 |
Security Type Abbreviations |
BAN | - | BOND ANTICIPATION NOTE |
CP | - | COMMERCIAL PAPER |
VRDN | - | VARIABLE RATE DEMAND NOTE (A debt instrument that is payable upon demand, either daily, weekly or monthly) |
Legend |
(a) Coupon rates for floating and adjustable rate securities reflect the rates in effect at period end. |
(b) Information in this report regarding holdings by state and security types does not reflect the holdings of the Fidelity Municipal Cash Central Fund. |
(c) Affiliated fund that is available only to investment companies and other accounts managed by Fidelity Investments. The rate quoted is the annualized seven-day yield of the fund at period end. A complete unaudited listing of the fund's holdings as of its most recent quarter end is available upon request. In addition, each Fidelity Central Fund's financial statements are available on the SEC's website or upon request. |
(d) Private activity obligations whose interest is subject to the federal alternative minimum tax for individuals. |
(e) Provides evidence of ownership in one or more underlying municipal bonds. |
Affiliated Central Funds |
Information regarding fiscal year to date income earned by the Fund from investments in Fidelity Central Funds is as follows: |
Fund | Income earned |
Fidelity Municipal Cash Central Fund | $ 22,592 |
Other Information |
The date shown for securities represents the date when principal payments must be paid, taking into account any call options exercised by the issuer and any permissible maturity shortening features other than interest rate resets. |
All investments are categorized as Level 2 under the Fair Value Hierarchy. The inputs or methodology used for valuing securities may not be an indication of the risk associated with investing in those securities. For more information on valuation inputs, please refer to the Security Valuation section in the accompanying Notes to Financial Statements. |
See accompanying notes which are an integral part of the financial statements.
Semiannual Report
Fidelity Pennsylvania Municipal Money Market Fund
Statement of Assets and Liabilities
| June 30, 2012 (Unaudited) |
| | |
Assets | | |
Investment in securities, at value - See accompanying schedule: Unaffiliated issuers (cost $604,156,335) | $ 604,156,335 | |
Fidelity Central Funds (cost $68,550,000) | 68,550,000 | |
Total Investments (cost $672,706,335) | | $ 672,706,335 |
Cash | | 1,128,144 |
Receivable for fund shares sold | | 4,147,863 |
Interest receivable | | 1,086,576 |
Distributions receivable from Fidelity Central Funds | | 4,835 |
Other receivables | | 44 |
Total assets | | 679,073,797 |
| | |
Liabilities | | |
Payable for investments purchased | $ 10,850,179 | |
Payable for fund shares redeemed | 8,062,562 | |
Distributions payable | 107 | |
Accrued management fee | 108,893 | |
Other affiliated payables | 233 | |
Total liabilities | | 19,021,974 |
| | |
Net Assets | | $ 660,051,823 |
Net Assets consist of: | | |
Paid in capital | | $ 660,034,871 |
Distributions in excess of net investment income | | (37) |
Accumulated undistributed net realized gain (loss) on investments | | 16,989 |
Net Assets, for 659,888,400 shares outstanding | | $ 660,051,823 |
Net Asset Value, offering price and redemption price per share ($660,051,823 ÷ 659,888,400 shares) | | $ 1.00 |
See accompanying notes which are an integral part of the financial statements.
Semiannual Report
Fidelity Pennsylvania Municipal Money Market Fund
Financial Statements - continued
Statement of Operations
Six months ended June 30, 2012 (Unaudited) |
| | |
Investment Income | | |
Interest | | $ 626,230 |
Income from Fidelity Central Funds | | 22,592 |
Total income | | 648,822 |
| | |
Expenses | | |
Management fee | $ 1,687,423 | |
Independent trustees' compensation | 1,185 | |
Total expenses before reductions | 1,688,608 | |
Expense reductions | (1,073,401) | 615,207 |
Net investment income (loss) | | 33,615 |
Realized and Unrealized Gain (Loss) Net realized gain (loss) on: | | |
Investment securities: | | |
Unaffiliated issuers | | 31,813 |
Net increase in net assets resulting from operations | | $ 65,428 |
See accompanying notes which are an integral part of the financial statements.
Semiannual Report
Statement of Changes in Net Assets
| Six months ended June 30, 2012
(Unaudited) | Year ended
December 31,
2011 |
Increase (Decrease) in Net Assets | | |
Operations | | |
Net investment income (loss) | $ 33,615 | $ 66,169 |
Net realized gain (loss) | 31,813 | 14,020 |
Net increase in net assets resulting
from operations | 65,428 | 80,189 |
Distributions to shareholders from net investment income | (33,652) | (66,105) |
Share transactions at net asset value of $1.00 per share
Proceeds from sales of shares | 894,698,808 | 1,803,354,473 |
Reinvestment of distributions | 33,087 | 65,495 |
Cost of shares redeemed | (920,873,455) | (1,788,062,125) |
Net increase (decrease) in net assets and shares resulting from share transactions | (26,141,560) | 15,357,843 |
Total increase (decrease) in net assets | (26,109,784) | 15,371,927 |
| | |
Net Assets | | |
Beginning of period | 686,161,607 | 670,789,680 |
End of period (including distributions in excess of net investment income of $37 and distributions in excess of net investment income of $0, respectively) | $ 660,051,823 | $ 686,161,607 |
See accompanying notes which are an integral part of the financial statements.
Semiannual Report
Financial Highlights
| Six months ended
June 30,2012 | Years ended December 31, |
| (Unaudited) | 2011 | 2010 | 2009 | 2008 | 2007 |
Selected Per-Share Data | | | | | |
Net asset value, beginning of period | $ 1.00 | $ 1.00 | $ 1.00 | $ 1.00 | $ 1.00 | $ 1.00 |
Income from Investment Operations | | | | | | |
Net investment income (loss) | - F | - F | - F | .001 | .018 | .032 |
Net realized and unrealized gain (loss) F | - | - | - | - | - | - |
Total from investment operations | - F | - F | - F | .001 | .018 | .032 |
Distributions from net investment income | - F | - F | - F | (.001) | (.018) | (.032) |
Distributions from net realized gain | - | - | - | - | - F | - |
Total distributions | - F | - F | - F | (.001) | (.018) | (.032) |
Net asset value, end of period | $ 1.00 | $ 1.00 | $ 1.00 | $ 1.00 | $ 1.00 | $ 1.00 |
Total Return B, C | -% | .01% | .01% | .09% | 1.85% | 3.25% |
Ratios to Average Net Assets D, E | | | | | |
Expenses before reductions | .50% A | .50% | .50% | .53% | .51% | .50% |
Expenses net of fee waivers, if any | .18% A | .22% | .30% | .49% | .51% | .50% |
Expenses net of all reductions | .18% A | .22% | .30% | .49% | .46% | .40% |
Net investment income (loss) | .01% A | .01% | .01% | .09% | 1.82% | 3.20% |
Supplemental Data | | | | | | |
Net assets, end of period (000 omitted) | $ 660,052 | $ 686,162 | $ 670,790 | $ 678,148 | $ 848,937 | $ 720,414 |
A Annualized
B Total returns for periods of less than one year are not annualized.
C Total returns would have been lower if certain expenses had not been reduced during the applicable periods shown.
D Fees and expenses of any underlying Fidelity Central Funds are not included in the Fund's expense ratio. The Fund indirectly bears its proportionate share of the expenses of any underlying Fidelity Central Funds.
E Expense ratios reflect operating expenses of the Fund. Expenses before reductions do not reflect amounts reimbursed or waived or reductions from expense offset arrangements and do not represent the amount paid by the Fund during periods when reimbursements, waivers or reductions occur. Expenses net of fee waivers reflect expenses after reimbursement and waivers but prior to reductions from expense offset arrangements. Expenses net of all reductions represent the net expenses paid by the Fund.
F Amount represents less than $.001 per share.
See accompanying notes which are an integral part of the financial statements.
Semiannual Report
Notes to Financial Statements
For the period ended June 30, 2012 (Unaudited)
1. Organization.
Fidelity® Pennsylvania Municipal Income Fund (the Income Fund) is a fund of Fidelity Municipal Trust. Fidelity Pennsylvania Municipal Money Market Fund (the Money Market Fund) is a fund of Fidelity Municipal Trust II. Each Trust is registered under the Investment Company Act of 1940, as amended (the 1940 Act), as an open-end management investment company. Fidelity Municipal Trust and Fidelity Municipal Trust II (the Trusts) are organized as a Massachusetts business trust and a Delaware statutory trust, respectively. Each Fund is authorized to issue an unlimited number of shares. Each Fund may be affected by economic and political developments in the state of Pennsylvania.
2. Investments in Fidelity Central Funds.
The Funds may invest in Fidelity Central Funds, which are open-end investment companies available only to other investment companies and accounts managed by Fidelity Management & Research Company (FMR) and its affiliates. The Funds' Schedules of Investments list each of the Fidelity Central Funds held as of period end, if any, as an investment of each Fund, but do not include the underlying holdings of each Fidelity Central Fund. As an Investing Fund, each Fund indirectly bears its proportionate share of the expenses of the underlying Fidelity Central Funds.
The Money Market Central Funds seek preservation of capital and current income and are managed by Fidelity Investments Money Management, Inc. (FIMM), an affiliate of FMR.
A complete unaudited list of holdings for each Fidelity Central Fund is available upon request or at the Securities and Exchange Commission (the SEC) web site at www.sec.gov. In addition, the financial statements of the Fidelity Central Funds are available on the SEC web site or upon request.
3. Significant Accounting Policies.
The financial statements have been prepared in conformity with accounting principles generally accepted in the United States of America (GAAP), which require management to make certain estimates and assumptions at the date of the financial statements. Actual results could differ from those estimates. Subsequent events, if any, through the date that the financial statements were issued have been evaluated in the preparation of the financial statements. The following summarizes the significant accounting policies of the Funds:
Security Valuation. Investments are valued as of 4:00 p.m. Eastern time on the last calendar day of the period. In accordance with valuation policies and procedures approved by the Board of Trustees (the Board), the Income Fund attempts to obtain prices from one or more third party pricing vendor or broker to value their investments. When current market prices, quotations or rates are not readily available or reliable, securities
Semiannual Report
Notes to Financial Statements (Unaudited) - continued
3. Significant Accounting Policies - continued
Security Valuation - continued
will be fair valued in good faith by the FMR Fair Value Committee (the Committee), in accordance with procedures adopted by the Board. Factors used in determining fair value vary by security type and may include market or security specific events, changes in interest rates and credit quality. The frequency with which these procedures are used cannot be predicted and they may be utilized to a significant extent. The Committee oversees the Income Fund's valuation policies and procedures and is responsible for approving and reporting to the Board all fair value determinations.
Each Fund categorizes the inputs to valuation techniques used to value their investments into a disclosure hierarchy consisting of three levels as shown below:
Level 1 - quoted prices in active markets for identical investments
Level 2 - other significant observable inputs (including quoted prices for similar investments, interest rates, prepayment speeds, etc.)
Level 3 - unobservable inputs (including the Fund's own assumptions based on the best information available)
Valuation techniques used to value each Fund's investments by major category are as follows:
For the Income Fund, debt securities, including restricted securities, are valued based on evaluated prices received from third party pricing vendors or from brokers who make markets in such securities. For municipal securities, pricing vendors utilize matrix pricing which considers yield or price of bonds of comparable quality, coupon, maturity and type as well as broker-supplied prices and are generally categorized as Level 2 in the hierarchy. When independent prices are unavailable or unreliable, debt securities may be valued utilizing pricing methodologies which consider similar factors that would be used by third party pricing vendors. These are generally categorized as Level 2 in the hierarchy but may be Level 3 depending on the circumstances.
For the Money Market Fund, as permitted by compliance with certain conditions under Rule 2a-7 of the 1940 Act, securities are valued at amortized cost, which approximates fair value. The amortized cost of an instrument is determined by valuing it at its original cost and thereafter amortizing any discount or premium from its face value at a constant rate until maturity. Securities held by a money market fund are generally high quality and liquid; however, they are reflected as Level 2 because the inputs used to determine fair value are not quoted prices in an active market.
For the Income Fund, changes in valuation techniques may result in transfers in or out of an assigned level within the disclosure hierarchy.
Semiannual Report
3. Significant Accounting Policies - continued
Investment Transactions and Income. For financial reporting purposes, the Funds' investment holdings and NAV include trades executed through the end of the last business day of the period. The NAV per share for processing shareholder transactions is calculated as of the close of business of the New York Stock Exchange (NYSE), normally 4:00 p.m. Eastern time and includes trades executed through the end of the prior business day for the Income Fund and trades executed through the end of the current business day for the Money Market Fund. Gains and losses on securities sold are determined on the basis of identified cost. Interest income and distributions from the Fidelity Central Funds are accrued as earned. Interest income includes coupon interest and amortization of premium and accretion of discount on debt securities.
Expenses. Expenses directly attributable to a fund are charged to that fund. Expenses attributable to more than one fund are allocated among the respective funds on the basis of relative net assets or other appropriate methods. Expense estimates are accrued in the period to which they relate and adjustments are made when actual amounts are known.
Income Tax Information and Distributions to Shareholders. Each year, each Fund intends to qualify as a regulated investment company under Subchapter M of the Internal Revenue Code, including distributing substantially all of its taxable income and realized gains. As a result, no provision for income taxes is required. Each Fund files a U.S. federal tax return, in addition to state and local tax returns as required. A fund's federal income tax returns are subject to examination by the Internal Revenue Service (IRS) for a period of three fiscal years after they are filed. State and local tax returns may be subject to examination for an additional fiscal year depending on the jurisdiction.
Dividends are declared and recorded daily and paid monthly from net investment income. Distributions from realized gains, if any, are declared and recorded on the ex-dividend date. Income and capital gain distributions are determined in accordance with income tax regulations, which may differ from GAAP. In addition, the Money Market Fund claimed a portion of the payment made to redeeming shareholders as distribution for income tax purposes.
Capital accounts within the financial statements are adjusted for permanent book-tax differences. These adjustments have no impact on net assets or the results of operations. Temporary book-tax differences will reverse in a subsequent period.
Book-tax differences are primarily due to market discount, deferred trustees compensation, capital loss carryforwards and losses deferred due to wash sales, futures transactions, and excise tax regulations.
Semiannual Report
Notes to Financial Statements (Unaudited) - continued
3. Significant Accounting Policies - continued
Income Tax Information and Distributions to Shareholders - continued
The Funds purchase municipal securities whose interest, in the opinion of the issuer, is free from federal income tax. There is no assurance that the IRS will agree with this opinion. In the event the IRS determines that the issuer does not comply with relevant tax requirements, interest payments from a security could become federally taxable, possibly retroactively to the date the security was issued.
The federal tax cost of investment securities and unrealized appreciation (depreciation) as of period end were as follows for each Fund:
| Tax
cost | Gross
unrealized
appreciation | Gross
unrealized
depreciation | Net unrealized appreciation
(depreciation)
on securities and
other investments |
Fidelity Pennsylvania Municipal Income Fund | $ 405,694,205 | $ 28,358,755 | $ (209,485) | $ 28,149,270 |
Fidelity Pennsylvania Municipal Money Market Fund | 672,706,335 | - | - | - |
Capital loss carryforwards are only available to offset future capital gains of the Funds to the extent provided by regulations and may be limited. Under the Regulated Investment Company Modernization Act of 2010 (the Act), the Funds are permitted to carry forward capital losses incurred in taxable years beginning after December 22, 2010 for an unlimited period and such capital losses are required to be used prior to any losses that expire. At December 31, 2011, capital loss carryforwards were as follows:
| Fiscal year of expiration |
| 2017 | 2018 | Total with expiration |
Fidelity Pennsylvania Municipal Money Market Fund | $ (11,336) | $ (1,789) | $ (13,125) |
| No expiration |
| Short-term | Long-term | Total capital loss
carryfoward |
Fidelity Pennsylvania Municipal Income Fund | $ (374,119) | $ - | $ (374,119) |
Fidelity Pennsylvania Municipal Money Market Fund | - | (4,998) | (18,123) |
Semiannual Report
3. Significant Accounting Policies - continued
Short-Term Trading (Redemption) Fees. Shares held by investors in the Income Fund less than 30 days are subject to a redemption fee equal to ..50% of the net asset value of shares redeemed. All redemption fees, which reduce the proceeds of the shareholder redemption, are retained by the Fund and accounted for as an addition to paid in capital.
4. Purchases and Sales of Investments.
Purchases and sales of securities, other than short-term securities, for the Income Fund aggregated $52,961,333 and $42,705,263, respectively.
5. Fees and Other Transactions with Affiliates.
Management Fee. FMR and its affiliates provide the Income Fund with investment management related services for which the Fund pays a monthly management fee. The management fee is the sum of an individual fund fee rate that is based on an annual rate of .25% of the Fund's average net assets and an annualized group fee rate that averaged .12% during the period. The group fee rate is based upon the average net assets of all the mutual funds advised by FMR. The group fee rate decreases as assets under management increase and increases as assets under management decrease. For the period, the total annualized management fee rate was.37% of the Fund's average net assets.
FMR and its affiliates provide the Money Market Fund with investment management related services for which the Fund pays a monthly management fee that is based on an annual rate of .50% of the Fund's average net assets. FMR pays all other expenses, except the compensation of the independent Trustees and certain exceptions such as interest expense, including commitment fees. The management fee paid to FMR by the Fund is reduced by an amount equal to the fees and expenses paid by the Fund to the independent Trustees.
Transfer Agent and Accounting Fees. Citibank, N.A. (Citibank) is the custodian, transfer agent and servicing agent for the Funds. Citibank has entered into a sub-arrangement with Fidelity Investments Institutional Operations Company, Inc. (FIIOC), an affiliate of FMR, under which FIIOC performs the activities associated with the Funds' transfer agency, dividend disbursing and shareholder servicing functions. Under the terms of the management fee contract, FMR pays transfer agent fees on behalf of the Money Market Fund. The Income Fund pays account fees and asset-based fees that vary according to account size and type of account. FIIOC pays for typesetting, printing and mailing of shareholder reports, except proxy statements. For the period, the Income Fund's transfer agent fees were equivalent to the following annualized rates expressed as a percentage of average net assets:
Semiannual Report
Notes to Financial Statements (Unaudited) - continued
5. Fees and Other Transactions with Affiliates - continued
Transfer Agent and Accounting Fees - continued
Fidelity Pennsylvania Municipal Income Fund | .08% |
Citibank also has a sub-arrangement with Fidelity Service Company, Inc. (FSC), an affiliate of FMR, under which FSC maintains the Fund's accounting records. The fee is based on the level of average net assets for the month.
6. Committed Line of Credit.
The Income Fund participates with other funds managed by FMR or an affiliate in a $4.25 billion credit facility (the "line of credit") to be utilized for temporary or emergency purposes to fund shareholder redemptions or for other short-term liquidity purposes. The participating funds have agreed to pay commitment fees on their pro-rata portion of the line of credit, which are reflected in Miscellaneous expenses on the Statement of Operations, and are as follows:
Fidelity Pennsylvania Municipal Income Fund | $ 640 |
During the period, there were no borrowings on this line of credit.
7. Expense Reductions.
FMR or its affiliates voluntarily agreed to waive certain fees for the Money Market Fund in order to maintain a minimum annualized yield of .01%. Such arrangements may be discontinued by FMR at any time. For the period, the amount of the waiver was $1,073,186.
Through arrangements with the Income Fund's custodian, credits realized as a result of uninvested cash balances were used to reduce fund expenses. These expense reductions are noted in the table below.
| Custody
expense
reduction | Transfer Agent
expense
reduction | Accounting
expense
reduction |
Fidelity Pennsylvania Municipal Income Fund | $ 1,985 | $ 1,864 | $ 4 |
In addition, through an arrangement with Money Market Fund's custodian, $215 of credits realized as a result of uninvested cash balances were used to reduce the Fund's management fee.
Semiannual Report
8. Other.
The Funds' organizational documents provide former and current trustees and officers with a limited indemnification against liabilities arising in connection with the performance of their duties to the Funds. In the normal course of business, the Funds may also enter into contracts that provide general indemnifications. The Funds' maximum exposure under these arrangements is unknown as this would be dependent on future claims that may be made against the Funds. The risk of material loss from such claims is considered remote.
Semiannual Report
Investment Adviser
Fidelity Management & Research Company
Boston, MA
Investment Sub-Advisers
Fidelity Management & Research
(U.K.) Inc.
Fidelity Investments Money
Management, Inc.
Fidelity Management & Research
(Japan) Inc.
Fidelity Management & Research
(Hong Kong) Limited
General Distributor
Fidelity Distributors Corporation
Smithfield, RI
Transfer and Service Agents
Citibank, N.A.
New York, NY
Fidelity Investments Institutional
Operations Company, Inc.
Boston, MA
Fidelity Service Company, Inc.
Boston, MA
Custodian
Citibank, N.A.
New York, NY
The Fidelity Telephone Connection
Mutual Fund 24-Hour Service
Exchanges/Redemptions
and Account Assistance 1-800-544-6666
Product Information 1-800-544-6666
Retirement Accounts 1-800-544-4774 (8 a.m. - 9 p.m.)
TDD Service 1-800-544-0118
for the deaf and hearing impaired
(9 a.m. - 9 p.m. Eastern time)
Fidelity Automated Service
Telephone (FAST®) 1-800-544-5555
Automated line for quickest service
PFR-USAN-0812
1.787788.109
(Fidelity Investment logo)(registered trademark)
Corporate Headquarters
82 Devonshire St., Boston, MA 02109
www.fidelity.com
Fidelity®
Short-Intermediate
Municipal Income Fund
Semiannual Report
June 30, 2012
(Fidelity Cover Art)
Contents
Shareholder Expense Example | (Click Here) | An example of shareholder expenses. |
Investment Changes | (Click Here) | A summary of major shifts in the fund's investments over the past six months. |
Investments | (Click Here) | A complete list of the fund's investments with their market values. |
Financial Statements | (Click Here) | Statements of assets and liabilities, operations, and changes in net assets, as well as financial highlights. |
Notes | (Click Here) | Notes to the financial statements. |
To view a fund's proxy voting guidelines and proxy voting record for the 12-month period ended June 30, visit http://www.fidelity.com/proxyvotingresults or visit the Securities and Exchange Commission's (SEC) web site at http://www.sec.gov. You may also call 1-800-544-8544 to request a free copy of the proxy voting guidelines.
Standard & Poor's, S&P and S&P 500 are registered service marks of The McGraw-Hill Companies, Inc. and have been licensed for use by Fidelity Distributors Corporation.
Other third party marks appearing herein are the property of their respective owners.
All other marks appearing herein are registered or unregistered trademarks or service marks of FMR LLC or an affiliated company. © 2012 FMR LLC. All rights reserved.
This report and the financial statements contained herein are submitted for the general information of the shareholders of the fund. This report is not authorized for distribution to prospective investors in the fund unless preceded or accompanied by an effective prospectus.
A fund files its complete schedule of portfolio holdings with the SEC for the first and third quarters of each fiscal year on Form N-Q. Forms N-Q are available on the SEC's web site at http://www.sec.gov. A fund's Forms N-Q may be reviewed and copied at the SEC's Public Reference Room in Washington, DC. Information regarding the operation of the SEC's Public Reference Room may be obtained by calling 1-800-SEC-0330. For a complete list of a fund's portfolio holdings, view the most recent holdings listing, semiannual report, or annual report on Fidelity's web site at http://www.fidelity.com, http://www.advisor.fidelity.com, or http://www.401k.com, as applicable.
NOT FDIC INSURED • MAY LOSE VALUE • NO BANK GUARANTEE
Neither the fund nor Fidelity Distributors Corporation is a bank.
Semiannual Report
Shareholder Expense Example
As a shareholder of the Fund, you incur two types of costs: (1) transaction costs, including sales charges (loads) on purchase payments or redemption proceeds, redemption fees and (2) ongoing costs, including management fees, distribution and/or service (12b-1) fees and other Fund expenses. This Example is intended to help you understand your ongoing costs (in dollars) of investing in the Fund and to compare these costs with the ongoing costs of investing in other mutual funds.
The Example is based on an investment of $1,000 invested at the beginning of the period and held for the entire period (January 1, 2012 to June 30, 2012).
Actual Expenses
The first line of the accompanying table for each class of the Fund provides information about actual account values and actual expenses. You may use the information in this line, together with the amount you invested, to estimate the expenses that you paid over the period. Simply divide your account value by $1,000.00 (for example, an $8,600 account value divided by $1,000.00 = 8.6), then multiply the result by the number in the first line for a class of the Fund under the heading entitled "Expenses Paid During Period" to estimate the expenses you paid on your account during this period. A small balance maintenance fee of $12.00 that is charged once a year may apply for certain accounts with a value of less than $2,000. This fee is not included in the table below. If it was, the estimate of expenses you paid during the period would be higher, and your ending account value lower, by this amount. In addition, the Fund, as a shareholder in the underlying Fidelity Central Funds, will indirectly bear its pro-rata share of the fees and expenses incurred by the underlying Fidelity Central Funds. These fees and expenses are not included in the Fund's annualized expense ratio used to calculate the expense estimate in the table below.
Hypothetical Example for Comparison Purposes
The second line of the accompanying table for each class of the Fund provides information about hypothetical account values and hypothetical expenses based on a Class' actual expense ratio and an assumed rate of return of 5% per year before expenses, which is not the Class' actual return. The hypothetical account values and expenses may not be used to estimate the actual ending account balance or expenses you paid for the period. You may use this information to compare the ongoing costs of investing in the Fund and other funds. To do so, compare this 5% hypothetical example with the 5% hypothetical examples that appear in the shareholder reports of the other funds. A small balance maintenance fee of $12.00 that is charged once a year may apply for certain accounts with a value of less than $2,000. This fee is not included in the table below. If it was, the estimate of expenses you paid during the period would be higher, and your ending account value lower, by this amount. In addition, the Fund, as a shareholder in the underlying Fidelity Central Funds, will indirectly bear its pro-rata share of the fees and expenses incurred by the underlying Fidelity Central Funds. These fees and expenses are not included in the Fund's annualized expense ratio used to calculate the expense estimate in the table below.
Please note that the expenses shown in the table are meant to highlight your ongoing costs only and do not reflect any transaction costs. Therefore, the second line of the table is useful in comparing ongoing costs only, and will not help you determine the relative total costs of owning different funds. In addition, if these transactional costs were included, your costs would have been higher.
Semiannual Report
Shareholder Expense Example - continued
| Annualized
Expense Ratio | Beginning
Account Value
January 1, 2012 | Ending
Account Value
June 30, 2012 | Expenses Paid
During Period*
January 1, 2012
to June 30, 2012 |
Class A | .80% | | | |
Actual | | $ 1,000.00 | $ 1,010.80 | $ 4.00 |
HypotheticalA | | $ 1,000.00 | $ 1,020.89 | $ 4.02 |
Class T | .77% | | | |
Actual | | $ 1,000.00 | $ 1,011.00 | $ 3.85 |
HypotheticalA | | $ 1,000.00 | $ 1,021.03 | $ 3.87 |
Class B | 1.45% | | | |
Actual | | $ 1,000.00 | $ 1,008.50 | $ 7.24 |
HypotheticalA | | $ 1,000.00 | $ 1,017.65 | $ 7.27 |
Class C | 1.54% | | | |
Actual | | $ 1,000.00 | $ 1,007.10 | $ 7.69 |
HypotheticalA | | $ 1,000.00 | $ 1,017.21 | $ 7.72 |
Short-Intermediate Municipal Income | .48% | | | |
Actual | | $ 1,000.00 | $ 1,013.40 | $ 2.40 |
HypotheticalA | | $ 1,000.00 | $ 1,022.48 | $ 2.41 |
Institutional Class | .53% | | | |
Actual | | $ 1,000.00 | $ 1,013.10 | $ 2.65 |
HypotheticalA | | $ 1,000.00 | $ 1,022.23 | $ 2.66 |
A 5% return per year before expenses
* Expenses are equal to each Class' annualized expense ratio, multiplied by the average account value over the period, multiplied by 182/366 (to reflect the one-half year period).
Semiannual Report
Investment Changes (Unaudited)
Top Five States as of June 30, 2012 |
| % of fund's
net assets | % of fund's net assets
6 months ago |
New York | 12.6 | 13.3 |
California | 11.4 | 10.6 |
Florida | 8.3 | 7.0 |
Illinois | 7.4 | 7.5 |
Texas | 5.5 | 5.7 |
Top Five Sectors as of June 30, 2012 |
| % of fund's
net assets | % of fund's net assets
6 months ago |
General Obligations | 32.1 | 34.0 |
Electric Utilities | 12.8 | 13.4 |
Special Tax | 11.1 | 10.5 |
Health Care | 8.6 | 9.8 |
Water & Sewer | 5.7 | 4.1 |
Weighted Average Maturity as of June 30, 2012 |
| | 6 months ago |
Years | 3.2 | 3.3 |
This is a weighted average of all the maturities of the securities held in a fund. Weighted Average Maturity (WAM) can be used as a measure of sensitivity to interest rate changes and market changes. Generally, the longer the maturity, the greater the sensitivity to such changes. WAM is based on the dollar-weighted average length of time until principal payments must be paid. Depending on the types of securities held in a fund, certain maturity shortening devices (e.g., demand features, interest rate resets, and call options) may be taken into account when calculating the WAM. |
Duration as of June 30, 2012 |
| | 6 months ago |
Years | 2.8 | 2.8 |
Duration estimates how much a bond fund's price will change with a change in comparable interest rates. If rates rise 1%, for example, a fund with a 5-year duration is likely to lose about 5% of its value. Other factors also can influence a bond fund's performance and share price. Accordingly, a bond fund's actual performance may differ from this example. Duration takes into account any call or put option embedded in the bonds. |
Quality Diversification (% of fund's net assets) |
As of June 30, 2012 | As of December 31, 2011 |
 | AAA 8.5% | |  | AAA 6.4% | |
 | AA,A 69.7% | | | AA,A 71.5% | |
 | BBB 4.2% | | | BBB 5.5% | |
 | BB and Below 0.1% | | | BB and Below 0.1% | |
 | Not Rated 1.6% | | | Not Rated 2.1% | |
 | Short-Term
Investments and
Net Other Assets 15.9% | | | Short-Term
Investments and
Net Other Assets 14.4% | |
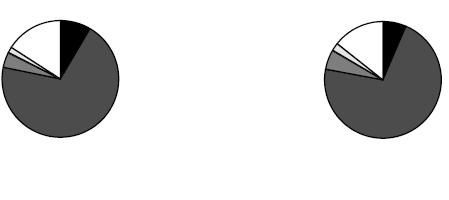
We have used ratings from Moody's Investors Service, Inc. Where Moody's® ratings are not available, we have used S&P® ratings. All ratings are as of the date indicated and do not reflect subsequent changes. |
Semiannual Report
Investments June 30, 2012 (Unaudited)
Showing Percentage of Net Assets
Municipal Bonds - 83.7% |
| Principal
Amount (000s) | | Value (000s) |
Alabama - 0.2% |
Jefferson County Swr. Rev. Series 2002 B, 5% 2/1/41 (Pre-Refunded to 8/1/12 @ 100) | | $ 2,070 | | $ 2,077 |
Mobile Indl. Dev. Board Poll. Cont. Rev. Bonds Series 2007 B, 4.875%, tender 3/19/13 (b) | | 2,615 | | 2,693 |
Pell City Spl. Care Facilities Rev. (Noland Health Svcs., Inc. Proj.) Series 2007 A, 5% 12/1/12 (Escrowed to Maturity) | | 750 | | 765 |
Univ. of Alabama at Birmingham Hosp. Rev. Series 2008 A, 5% 9/1/13 | | 1,175 | | 1,231 |
| | 6,766 |
Arizona - 3.4% |
Arizona Ctfs. of Partnership Series 2010 A: | | | | |
5% 10/1/14 (FSA Insured) | | 5,000 | | 5,415 |
5% 10/1/16 (FSA Insured) | | 13,000 | | 14,816 |
Arizona Health Facilities Auth. Rev. (Banner Health Sys. Proj.): | | | | |
Series 2008 A, 5% 1/1/13 | | 2,000 | | 2,045 |
Series 2008 D: | | | | |
5% 1/1/13 | | 3,250 | | 3,324 |
5% 1/1/14 | | 2,000 | | 2,130 |
Arizona School Facilities Board Ctfs. of Prtn.: | | | | |
Series 2004 B, 5.25% 9/1/15 (FSA Insured) | | 6,470 | | 6,985 |
Series 2005 A1, 5% 9/1/14 (Nat'l. Pub. Fin. Guarantee Corp. Insured) | | 2,000 | | 2,176 |
Series 2005 A2, 5% 9/1/16 (Nat'l. Pub. Fin. Guarantee Corp. Insured) | | 11,000 | | 12,171 |
Series 2008: | | | | |
5.5% 9/1/13 | | 18,780 | | 19,874 |
5.5% 9/1/16 | | 1,385 | | 1,603 |
Series A, 5% 9/1/12 (Nat'l. Pub. Fin. Guarantee Corp. Insured) | | 3,280 | | 3,304 |
Arizona Wtr. Infrastructure Fin. Auth. Rev. Series 2009 A: | | | | |
5% 10/1/18 | | 1,000 | | 1,225 |
5% 10/1/20 | | 5,180 | | 6,328 |
Coconino County Poll. Cont. Corp. Rev. Bonds (Arizona Pub. Svc. Co. Navajo Proj.) Series 2009 A, 5.5%, tender 6/1/14 (b) | | 6,000 | | 6,481 |
Maricopa County Poll. Cont. Rev. Bonds (Arizona Pub. Svc. Co. Palo Verde Proj.) Series 2009 A, 6%, tender 5/1/14 (b) | | 4,800 | | 5,211 |
Municipal Bonds - continued |
| Principal
Amount (000s) | | Value (000s) |
Arizona - continued |
Mesa Hwy. Proj. Advancement Series 2011 A: | | | | |
5% 7/1/17 | | $ 12,085 | | $ 13,429 |
5% 7/1/18 | | 5,200 | | 5,801 |
Navajo County Poll. Cont. Corp. Rev. Bonds (Arizona Pub. Svc. Co. Cholla Proj.) Series 2009 A, 1.25%, tender 5/30/14 (b) | | 2,800 | | 2,801 |
Phoenix Civic Impt. Corp. Excise Tax Rev. Series 2003 A, 5% 7/1/12 (Nat'l. Pub. Fin. Guarantee Corp. Insured) | | 750 | | 750 |
Phoenix Civic Impt. Corp. Wtr. Sys. Rev.: | | | | |
Series 2009 A, 5% 7/1/15 | | 5,835 | | 6,589 |
Series 2009 B, 5% 7/1/16 | | 5,090 | | 5,943 |
Pima County Swr. Sys. Rev. Series 2011 B, 5% 7/1/19 | | 3,225 | | 3,844 |
Tucson Gen. Oblig. Series 2005, 5% 7/1/16 (Nat'l. Pub. Fin. Guarantee Corp. Insured) | | 1,250 | | 1,404 |
Tucson Wtr. Rev. Series 2001 A, 5% 7/1/15 (Nat'l. Pub. Fin. Guarantee Corp. Insured) | | 1,645 | | 1,726 |
Univ. Med. Ctr. Corp. Hosp. Rev. Series 2011: | | | | |
5% 7/1/16 | | 3,055 | | 3,405 |
5% 7/1/17 | | 3,315 | | 3,735 |
5% 7/1/18 | | 3,365 | | 3,810 |
| | 146,325 |
California - 11.3% |
California Dept. of Wtr. Resources (Central Valley Proj.) Series AM, 5% 12/1/13 (a) | | 3,000 | | 3,095 |
California Dept. of Wtr. Resources Pwr. Supply Rev.: | | | | |
Series 2010 L, 5% 5/1/17 | | 12,000 | | 14,310 |
Series 2010 M, 5% 5/1/16 | | 8,000 | | 9,305 |
California Econ. Recovery: | | | | |
Bonds Series B, 5%, tender 7/1/14 (b) | | 5,000 | | 5,407 |
Series 2004 A, 5.25% 7/1/12 | | 6,010 | | 6,010 |
Series 2009 A: | | | | |
5% 7/1/15 | | 3,660 | | 3,971 |
5% 7/1/15 (Pre-Refunded to 7/1/14 @ 100) | | 2,540 | | 2,774 |
5.25% 7/1/13 (Escrowed to Maturity) | | 1,185 | | 1,243 |
5.25% 7/1/13 (Nat'l. Pub. Fin. Guarantee Corp. Insured) | | 1,255 | | 1,317 |
5.25% 7/1/14 | | 1,780 | | 1,948 |
5.25% 7/1/14 (Escrowed to Maturity) | | 520 | | 571 |
California Gen. Oblig.: | | | | |
5% 9/1/12 | | 1,700 | | 1,712 |
5% 10/1/12 | | 12,600 | | 12,739 |
5% 11/1/13 | | 9,060 | | 9,602 |
Municipal Bonds - continued |
| Principal
Amount (000s) | | Value (000s) |
California - continued |
California Gen. Oblig.: - continued | | | | |
5% 9/1/18 | | $ 7,500 | | $ 8,879 |
5% 9/1/19 | | 20,000 | | 23,878 |
5% 9/1/20 | | 20,000 | | 23,912 |
California Health Facilities Fing. Auth. Rev.: | | | | |
(Catholic Healthcare West Proj.) Series 2008 H, 5.125% 7/1/22 | | 2,495 | | 2,738 |
(Children's Hosp. of Orange County Proj.) Series 2009 A, 5% 11/1/13 | | 1,100 | | 1,152 |
(Sutter Health Proj.) Series 2008 A, 5% 8/15/12 | | 1,325 | | 1,332 |
Bonds: | | | | |
(Catholic Healthcare West Proj.): | | | | |
Series 2009 D, 5%, tender 7/1/14 (b) | | 2,900 | | 3,123 |
Series 2009 F, 5%, tender 7/1/14 (b) | | 3,200 | | 3,446 |
(St. Joseph Health Sys. Proj.) Series 2009 C, 5%, tender 10/16/14 (b) | | 4,300 | | 4,669 |
California Poll. Cont. Fing. Auth. Ctfs. of Prtn. (San Diego Gas & Elec. Co. Proj.) 5.9% 6/1/14 (Nat'l. Pub. Fin. Guarantee Corp. Insured) | | 34,000 | | 37,164 |
California Poll. Cont. Fing. Auth. Solid Waste Disp. Rev. Bonds (Waste Mgmt., Inc. Proj.) Series 2003 A, 5%, tender 5/1/13 (b)(e) | | 2,300 | | 2,375 |
California Pub. Works Board Lease Rev.: | | | | |
(Dept. of Corrections & Rehab. Proj.) Series 2011 C, 5% 10/1/18 | | 1,750 | | 2,050 |
(Univ. Proj.) Series 2011 B: | | | | |
5% 10/1/18 | | 2,740 | | 3,185 |
5% 10/1/19 | | 1,490 | | 1,726 |
(Various Cap. Projects) Series 2011 A: | | | | |
5% 10/1/18 | | 6,475 | | 7,584 |
5% 10/1/19 | | 5,000 | | 5,787 |
5% 10/1/20 | | 2,525 | | 2,931 |
(Various Cap. Projs.) Series 2012 A, 5% 4/1/21 | | 1,000 | | 1,152 |
(Various Judicial Council Projects) Series 2011 D, 5% 12/1/19 | | 4,100 | | 4,768 |
Series 2009 J, 5% 11/1/17 | | 2,300 | | 2,657 |
Series 2010 A: | | | | |
5% 3/1/16 | | 2,000 | | 2,236 |
5% 3/1/17 | | 5,405 | | 6,156 |
California State Univ. Rev. Series 2007 C, 5% 11/1/13 (FSA Insured) | | 1,335 | | 1,418 |
Municipal Bonds - continued |
| Principal
Amount (000s) | | Value (000s) |
California - continued |
California Statewide Cmntys. Dev. Auth. Rev.: | | | | |
(State of California Proposition 1A Receivables Prog.) Series 2009: | | | | |
4% 6/15/13 | | $ 1,000 | | $ 1,034 |
5% 6/15/13 | | 16,650 | | 17,381 |
Bonds: | | | | |
Series 2002 C, 5%, tender 5/1/17 (b) | | 4,000 | | 4,657 |
Series 2009 E2, 5%, tender 5/1/17 (b) | | 2,000 | | 2,328 |
East Bay Muni. Util. District Wtr. Sys. Rev. Bonds Series 2011 A2, 0.53%, tender 7/1/14 (b) | | 56,000 | | 56,033 |
Golden State Tobacco Securitization Corp. Tobacco Settlement Rev. Series 2003 B: | | | | |
5.5% 6/1/43 (Pre-Refunded to 6/1/13 @ 100) | | 2,000 | | 2,095 |
5.625% 6/1/38 (Pre-Refunded to 6/1/13 @ 100) | | 3,030 | | 3,177 |
Los Angeles County Metropolitan Trans. Auth. Sales Tax Rev.: | | | | |
Series 2009 A, 5% 7/1/13 | | 4,155 | | 4,351 |
Series 2009 B, 5% 7/1/17 | | 12,905 | | 15,495 |
Los Angeles County Pub. Works Fing. Auth. Lease Rev. Series 2010 A, 5% 8/1/17 | | 5,000 | | 5,738 |
Los Angeles Gen. Oblig. Series 2011 B, 5% 9/1/18 | | 20,960 | | 25,354 |
Los Angeles Muni. Impt. Corp. Lease Rev. Series 2012 C: | | | | |
4.625% 3/1/18 | | 1,500 | | 1,702 |
5% 3/1/19 | | 2,935 | | 3,396 |
Los Angeles Unified School District Series 2009 KRY, 5% 7/1/13 | | 10,740 | | 11,243 |
Los Angeles Unified School District Ctfs. of Prtn. (Multiple Properties Proj.) Series 2010 A: | | | | |
5% 12/1/16 | | 2,025 | | 2,328 |
5% 12/1/17 | | 9,790 | | 11,369 |
Los Angeles Wastewtr. Sys. Rev. Series 2009 A, 5% 6/1/15 | | 12,240 | | 13,812 |
Monterey County Pub. Impt. Corp. Ctfs. of Prtn. (Refing. Proj.) Series 2009, 5% 8/1/17 (FSA Insured) | | 2,130 | | 2,468 |
Newport Beach Rev. Bonds (Hoag Memorial Hosp. Presbyterian Proj.) Series 2009 E, 5%, tender 2/7/13 (b) | | 2,500 | | 2,564 |
Northern California Pwr. Agcy. Rev.: | | | | |
(Geothermal #3 Proj.) Series 2009 A: | | | | |
5% 7/1/13 | | 1,020 | | 1,065 |
5% 7/1/14 | | 1,120 | | 1,214 |
5% 7/1/15 | | 2,170 | | 2,430 |
Municipal Bonds - continued |
| Principal
Amount (000s) | | Value (000s) |
California - continued |
Northern California Pwr. Agcy. Rev.: - continued | | | | |
(Hydroelectric #1 Proj.) Series 2010 A: | | | | |
4% 7/1/15 | | $ 2,000 | | $ 2,181 |
5% 7/1/18 | | 2,000 | | 2,386 |
Poway Unified School District Pub. Fing. Auth. Lease Rev. Bonds Series 2008 B, 0%, tender 12/1/14 (FSA Insured) (b) | | 7,115 | | 6,875 |
Riverside County Asset Leasing Rev. (Riverside Cap. Proj.) Series 2012 A: | | | | |
4% 6/1/17 (a) | | 1,750 | | 1,932 |
5% 6/1/17 (a) | | 3,700 | | 4,257 |
5% 6/1/18 (a) | | 6,470 | | 7,491 |
Sacramento Muni. Util. District Elec. Rev. Series 2011 X, 5% 8/15/21 | | 4,000 | | 4,828 |
Sacramento Pwr. Auth. Cogeneration Proj. Rev. Series 2005 A, 5% 7/1/18 (AMBAC Insured) | | 2,890 | | 3,084 |
San Bernardino County Ctfs. of Prtn. (Arrowhead Proj.) Series 2009 A: | | | | |
5% 8/1/16 | | 5,450 | | 6,014 |
5% 8/1/18 | | 8,000 | | 8,995 |
San Diego Cmnty. College District Series 2007, 0% 8/1/16 (FSA Insured) | | 1,160 | | 1,113 |
San Diego Pub. Facilities Fing. Auth. Swr. Rev.: | | | | |
Series 2009 A: | | | | |
5% 5/15/13 | | 5,415 | | 5,635 |
5% 5/15/15 | | 1,845 | | 2,070 |
Series 2009 B, 5% 5/15/14 | | 7,000 | | 7,591 |
| | 484,008 |
Colorado - 0.2% |
Colorado Health Facilities Auth. Rev.: | | | | |
(Adventist Health Sys./Sunbelt Proj.) Series 2006 F: | | | | |
5% 11/15/12 | | 380 | | 386 |
5% 11/15/12 (Escrowed to Maturity) | | 845 | | 860 |
Bonds (Catholic Health Initiatives Proj.) Series 2008 C4, 4%, tender 11/12/15 (b) | | 4,200 | | 4,626 |
Univ. of Colorado Enterprise Sys. Rev. Series 2009 A, 5% 6/1/17 | | 500 | | 593 |
| | 6,465 |
Connecticut - 1.6% |
Connecticut Dev. Auth. Poll. Cont. Rev. Bonds Series 2011 A, 1.55%, tender 4/1/15 (b)(e) | | 4,300 | | 4,318 |
Municipal Bonds - continued |
| Principal
Amount (000s) | | Value (000s) |
Connecticut - continued |
Connecticut Gen. Oblig. (Econ. Recovery Proj.) Series 2009 A, 5% 1/1/15 | | $ 29,500 | | $ 32,702 |
Connecticut Health & Ed. Rev.: | | | | |
Bonds (Ascension Health Cr. Group Proj.) Series 1998 B, 1.55%, tender 2/1/17 (b) | | 2,700 | | 2,719 |
Series D, 4% 7/1/14 | | 1,000 | | 1,058 |
Connecticut Spl. Tax Oblig. Trans. Infrastructure Rev.: | | | | |
Series 1998 A, 5.5% 10/1/13 (Nat'l. Pub. Fin. Guarantee Corp. Insured) | | 4,300 | | 4,577 |
Series 2009 1: | | | | |
5% 2/1/14 | | 2,500 | | 2,677 |
5% 2/1/15 | | 11,995 | | 13,327 |
Series 2011 A, 5% 12/1/18 | | 5,575 | | 6,800 |
Hartford Gen. Oblig. Series A, 5% 8/15/12 (Assured Guaranty Corp. Insured) | | 1,000 | | 1,005 |
| | 69,183 |
District Of Columbia - 0.5% |
District of Columbia Gen. Oblig. Series 2007 B, 5% 6/1/16 (AMBAC Insured) | | 3,555 | | 4,094 |
District of Columbia Income Tax Rev. Series 2009 C, 5% 12/1/13 | | 5,500 | | 5,860 |
District of Columbia Rev. (Medlantic/Helix Proj.) Series 1998 C, 5% 8/15/15 (FSA Insured) | | 1,500 | | 1,636 |
District of Columbia Univ. Rev. Bonds (Georgetown Univ. Proj.) Series 2001 B, 4.7%, tender 4/1/18 (b) | | 8,500 | | 9,591 |
| | 21,181 |
Florida - 8.3% |
Alachua County Health Facilities Auth. Health Facilities Rev. (Shands Teaching Hospitals & Clinics, Inc. Proj.) Series 2010 B: | | | | |
5% 12/1/14 | | 4,000 | | 4,275 |
5% 12/1/15 | | 4,395 | | 4,794 |
Broward County Arpt. Sys. Rev. Series 2012 P1, 3% 10/1/13 (e) | | 4,000 | | 4,114 |
Broward County School Board Ctfs. of Prtn.: | | | | |
Series 2008 A, 5% 7/1/15 (FSA Insured) | | 5,495 | | 6,081 |
Series 2012 A: | | | | |
5% 7/1/19 | | 7,000 | | 8,165 |
5% 7/1/20 | | 15,070 | | 17,569 |
Citizens Property Ins. Corp.: | | | | |
Series 2010 A1, 5% 6/1/15 (FSA Insured) | | 14,000 | | 15,409 |
Municipal Bonds - continued |
| Principal
Amount (000s) | | Value (000s) |
Florida - continued |
Citizens Property Ins. Corp.: - continued | | | | |
Series 2010 A3, 1.93% 6/1/13 (b) | | $ 47,300 | | $ 47,694 |
Clay County Infrastructure Sales Surtax Rev. 5% 10/1/15 (Assured Guaranty Corp. Insured) | | 7,745 | | 8,516 |
Clearwater Wtr. and Swr. Rev.: | | | | |
Series 2009 B, 5% 12/1/14 | | 2,000 | | 2,191 |
Series 2011: | | | | |
4% 12/1/16 | | 1,265 | | 1,414 |
5% 12/1/17 | | 1,685 | | 1,974 |
5% 12/1/18 | | 685 | | 814 |
5% 12/1/19 | | 1,820 | | 2,180 |
5% 12/1/20 | | 1,000 | | 1,202 |
Collier County Indl. Dev. Auth. Healthcare Facilities Rev. (NCH Healthcare Sys. Proj.) Series 2011: | | | | |
5% 10/1/14 | | 1,355 | | 1,462 |
5% 10/1/16 | | 1,530 | | 1,724 |
5% 10/1/17 | | 1,455 | | 1,659 |
Escambia City Health Facilities Auth. Rev. (Ascension Health Cr. Group Proj.) Series 2003 A, 5.25% 11/15/13 | | 4,265 | | 4,545 |
Escambia County Solid Waste Disp. Rev. Bonds (Gulf Pwr. Co. Proj.) Series 2009, 1.35%, tender 6/2/15 (b) | | 1,900 | | 1,905 |
Florida Board of Ed. Series 2005 B, 5% 1/1/18 | | 21,080 | | 23,386 |
Florida Board of Ed. Lottery Rev. Series 2011 A, 5% 7/1/20 | | 8,600 | | 10,489 |
Florida Board of Ed. Pub. Ed. Cap. Outlay: | | | | |
Series 2009 C, 5% 6/1/20 | | 3,625 | | 4,455 |
Series 2009 D, 5.5% 6/1/16 | | 7,910 | | 9,370 |
Florida Gen. Oblig. (Dept. of Trans. Right-of-Way and Bridge Construction Proj.) Series 2005 B, 6.375% 7/1/13 | | 8,020 | | 8,505 |
Florida Hurricane Catastrophe Fund Fin. Corp. Rev. Series 2010 A, 5% 7/1/15 | | 20,000 | | 22,262 |
Greater Orlando Aviation Auth. Arpt. Facilities Rev. Series 2011 C: | | | | |
5% 10/1/19 | | 1,705 | | 2,052 |
5% 10/1/20 | | 1,000 | | 1,209 |
Highlands County Health Facilities Auth. Rev.: | | | | |
(Adventist Health Sys./Sunbelt, Inc. Prog.) Series 2009 E, 5% 11/15/15 | | 2,345 | | 2,633 |
Bonds (Adventist Health Sys./Sunbelt, Inc. Prog.): | | | | |
Series 2002, 3.95%, tender 9/1/12 (b) | | 16,650 | | 16,740 |
Series 2008 A, 6.1%, tender 11/14/13 (b) | | 1,000 | | 1,070 |
Municipal Bonds - continued |
| Principal
Amount (000s) | | Value (000s) |
Florida - continued |
Hillsborough County Indl. Dev. (H Lee Moffitt Cancer Ctr. Proj.) Series 2007 A, 5% 7/1/12 | | $ 1,310 | | $ 1,310 |
Hillsborough County Indl. Dev. Auth. Poll. Cont. Rev. Bonds (Tampa Elec. Co. Proj.) Series 2007 B, 5.15%, tender 9/1/13 (b) | | 1,750 | | 1,835 |
Indian River County Wtr. & Swr. Rev.: | | | | |
5% 9/1/15 | | 1,000 | | 1,116 |
5% 9/1/17 | | 1,000 | | 1,172 |
Jacksonville Elec. Auth. Elec. Sys. Rev. Series 2009 B, 5% 10/1/12 | | 7,350 | | 7,434 |
JEA Wtr. & Swr. Sys. Rev. Series 2010 D, 5% 10/1/21 | | 1,945 | | 2,357 |
Kissimmee Util. Auth. Elec. Sys. Rev.: | | | | |
Series 2003: | | | | |
5.25% 10/1/14 | | 775 | | 844 |
5.25% 10/1/15 | | 3,525 | | 3,958 |
Series 2011, 2% 10/1/12 | | 2,195 | | 2,204 |
Lakeland Hosp. Sys. Rev. Series 2011, 3% 11/15/12 | | 1,000 | | 1,005 |
Miami-Dade County Pub. Facilities Rev. (Jackson Health Sys. Proj.) Series 2005 B: | | | | |
5% 6/1/14 (Nat'l. Pub. Fin. Guarantee Corp. Insured) | | 4,790 | | 5,073 |
5% 6/1/19 (Nat'l. Pub. Fin. Guarantee Corp. Insured) | | 3,875 | | 4,188 |
Miami-Dade County Wtr. & Swr. Rev. Series 2008 A, 5% 10/1/14 (FSA Insured) | | 4,000 | | 4,365 |
North Brevard County Hosp. District Rev. (Parrish Med. Ctr. Proj.) Series 2008, 4.625% 10/1/12 | | 1,110 | | 1,119 |
Orange County Health Facilities Auth. (Orlando Health, Inc.) Series 2009: | | | | |
5% 10/1/15 | | 2,210 | | 2,443 |
5% 10/1/16 | | 1,000 | | 1,127 |
Orange County Health Facilities Auth. Rev.: | | | | |
(Adventist Health Sys. - Sunbelt Proj.) 5.625% 11/15/32 (Pre-Refunded to 11/15/12 @ 101) | | 2,500 | | 2,573 |
(Orlando Reg'l. Healthcare Sys. Proj.) Series 2008 A: | | | | |
5% 11/1/13 (FSA Insured) | | 1,000 | | 1,038 |
5% 11/1/15 (FSA Insured) | | 1,825 | | 2,027 |
Orlando & Orange County Expressway Auth. Rev. Series 2010 B, 5% 7/1/15 (FSA Insured) | | 1,430 | | 1,569 |
Orlando Utils. Commission Util. Sys. Rev.: | | | | |
Series 2009 C, 5% 10/1/17 | | 1,500 | | 1,786 |
Series 2010 C, 5% 10/1/17 | | 1,895 | | 2,256 |
Series 2011 B: | | | | |
5% 10/1/18 | | 2,250 | | 2,716 |
5% 10/1/19 | | 2,325 | | 2,842 |
Municipal Bonds - continued |
| Principal
Amount (000s) | | Value (000s) |
Florida - continued |
Pasco County Solid Waste Disp. & Resource Recovery Sys. Rev.: | | | | |
Series 2011: | | | | |
5% 10/1/17 (e) | | $ 4,465 | | $ 5,007 |
5% 10/1/19 (e) | | 2,025 | | 2,277 |
5% 10/1/18 (e) | | 2,745 | | 3,078 |
Polk County School District Sales Tax Rev. Series 2007, 5% 10/1/12 (FSA Insured) | | 6,080 | | 6,143 |
Sarasota County School Board Ctfs. of Prtn. (Master Lease Prog.): | | | | |
5% 7/1/13 | | 3,435 | | 3,589 |
5% 7/1/14 | | 2,000 | | 2,149 |
Tampa Bay Wtr. Reg'l. Wtr. Supply Auth. Util. Sys. Rev.: | | | | |
Series 2011 B, 5% 10/1/18 | | 4,700 | | 5,704 |
Series 2011, 5% 10/1/19 | | 5,590 | | 6,880 |
Tampa Health Sys. Rev. (Baycare Health Sys. Proj.) Series 2010: | | | | |
5% 11/15/16 | | 2,500 | | 2,896 |
5% 11/15/17 | | 1,500 | | 1,769 |
Tampa Solid Waste Sys. Rev. Series 2010: | | | | |
4% 10/1/14 (FSA Insured) (e) | | 3,000 | | 3,201 |
5% 10/1/15 (FSA Insured) (e) | | 2,920 | | 3,278 |
5% 10/1/16 (FSA Insured) (e) | | 6,000 | | 6,899 |
5% 10/1/17 (FSA Insured) (e) | | 5,000 | | 5,829 |
Titusville Wtr. & Swr. Rev. Series 2010, 5% 10/1/17 (Assured Guaranty Corp. Insured) | | 1,135 | | 1,318 |
| | 358,232 |
Georgia - 3.0% |
Appling County Dev. Auth. Poll. Cont. Rev. Bonds (Oglethorpe Pwr. Corp. Hatch Proj.) Series 2011 A, 2.5%, tender 3/1/13 (b) | | 5,000 | | 5,058 |
Atlanta Arpt. Rev. Series 2011 B, 5% 1/1/13 (e) | | 1,000 | | 1,021 |
Burke County Indl. Dev. Auth. Poll. Cont. Rev. Bonds: | | | | |
(Georgia Pwr. Co. Plant Vogtle Proj.): | | | | |
Fifth Series 1994, 2.3%, tender 4/1/14 (b) | | 8,000 | | 8,194 |
Fourth Series 1995: | | | | |
1.2%, tender 4/1/14 (b) | | 3,450 | | 3,474 |
1.2%, tender 4/1/14 (b) | | 4,800 | | 4,833 |
(Oglethorpe Pwr. Corp. Vogtle Proj.) Series 2011 A, 2.5%, tender 3/1/13 (b) | | 3,500 | | 3,541 |
Municipal Bonds - continued |
| Principal
Amount (000s) | | Value (000s) |
Georgia - continued |
Fulton County Facilities Corp. Ctfs. of Prtn. (Gen. Purp. Proj.) Series 2009: | | | | |
5% 11/1/12 | | $ 1,555 | | $ 1,577 |
5% 11/1/13 | | 7,550 | | 7,988 |
5% 11/1/14 | | 7,490 | | 8,098 |
Fulton County Wtr. & Swr. Rev. Series 2011: | | | | |
5% 1/1/19 | | 4,000 | | 4,821 |
5% 1/1/20 | | 4,000 | | 4,865 |
Main Street Natural Gas, Inc. Georgia Gas Proj. Rev. Series 2007 A, 5% 9/15/12 | | 1,195 | | 1,202 |
Monroe County Dev. Auth. Poll. Cont. Rev. Bonds: | | | | |
(Georgia Pwr. Co. Plant Scherer Proj.) First Series 1995, 0.8%, tender 7/1/14 (b) | | 17,900 | | 17,907 |
(Oglethorpe Pwr. Corp. Scherer Proj.) Series 2011 A, 2.5%, tender 3/1/13 (b) | | 11,500 | | 11,634 |
Muni. Elec. Auth. of Georgia: | | | | |
(Combined Cycle Proj.) Series A, 5% 11/1/18 | | 2,000 | | 2,383 |
(Proj. One): | | | | |
Series 2008 A: | | | | |
5% 1/1/13 | | 2,000 | | 2,044 |
5.25% 1/1/17 (Berkshire Hathaway Assurance Corp. Insured) | | 7,925 | | 9,305 |
Series 2008 D: | | | | |
5.75% 1/1/19 | | 14,890 | | 18,102 |
5.75% 1/1/20 | | 3,555 | | 4,317 |
Pub. Gas Partners, Inc. Rev. (Gas Supply Pool No. 1 Proj.) Series A, 5% 10/1/12 | | 1,000 | | 1,010 |
Richmond County Hosp. Auth. (Univ. Health Svcs., Inc. Proj.) Series 2009: | | | | |
5% 1/1/14 | | 1,305 | | 1,379 |
5% 1/1/15 | | 1,040 | | 1,126 |
5% 1/1/16 | | 2,415 | | 2,661 |
5% 1/1/18 | | 1,530 | | 1,716 |
| | 128,256 |
Hawaii - 0.7% |
Hawaii Arpts. Sys. Rev.: | | | | |
Series 2010 B, 5% 7/1/15 (e) | | 3,900 | | 4,340 |
Series 2011, 5% 7/1/19 (e) | | 4,000 | | 4,668 |
Hawaii Gen. Oblig.: | | | | |
Series DR: | | | | |
5% 6/1/16 | | 7,645 | | 8,884 |
5% 6/1/16 (Escrowed to Maturity) | | 2,895 | | 3,384 |
Municipal Bonds - continued |
| Principal
Amount (000s) | | Value (000s) |
Hawaii - continued |
Hawaii Gen. Oblig.: - continued | | | | |
Series DY: | | | | |
5% 2/1/15 | | $ 3,500 | | $ 3,894 |
5% 2/1/16 | | 4,000 | | 4,597 |
| | 29,767 |
Illinois - 7.4% |
Chicago Board of Ed. Series 2009 D: | | | | |
5% 12/1/17 (Assured Guaranty Corp. Insured) | | 4,115 | | 4,800 |
5% 12/1/18 (Assured Guaranty Corp. Insured) | | 2,335 | | 2,754 |
Chicago Gen. Oblig.: | | | | |
(City Colleges Proj.): | | | | |
Series 1999: | | | | |
0% 1/1/17 (Nat'l. Pub. Fin. Guarantee Corp. Insured) | | 7,200 | | 6,526 |
0% 1/1/18 (Nat'l. Pub. Fin. Guarantee Corp. Insured) | | 3,000 | | 2,608 |
0% 1/1/19 (Nat'l. Pub. Fin. Guarantee Corp. Insured) | | 9,805 | | 8,139 |
Series1999, 0% 1/1/20 (Nat'l. Pub. Fin. Guarantee Corp. Insured) | | 14,755 | | 11,616 |
Series 2012 B: | | | | |
5.125% 1/1/15 | | 995 | | 1,108 |
5.125% 1/1/15 (AMBAC Insured) | | 3,000 | | 3,269 |
Series A, 5% 1/1/17 (FSA Insured) | | 3,465 | | 3,920 |
Series B, 5% 1/1/17 (FSA Insured) | | 5,115 | | 5,792 |
Chicago Hsg. Auth. Rev. (Cap. Prog.) Series 2001, 5.5% 7/1/18 | | 2,850 | | 2,850 |
Chicago Midway Arpt. Rev. Bonds Series 2010 B, 5%, tender 1/1/15 (b) | | 5,000 | | 5,404 |
Chicago O'Hare Int'l. Arpt. Rev.: | | | | |
Series 2008 A, 5% 1/1/13 (FSA Insured) | | 4,000 | | 4,089 |
Series 2010 D, 5.25% 1/1/17 (e) | | 1,000 | | 1,155 |
Series 2010 E: | | | | |
5% 1/1/15 (e) | | 4,000 | | 4,382 |
5% 1/1/16 (e) | | 1,500 | | 1,688 |
Series 2011 B, 5% 1/1/18 | | 6,500 | | 7,564 |
Chicago Sales Tax Rev. Series 1998, 5.5% 1/1/16 (FGIC Insured) (FSA Insured) | | 1,710 | | 1,964 |
Chicago Transit Auth. Cap. Grant Receipts Rev.: | | | | |
(Fed. Transit Administration Section 5309 Proj.) Series 2008 A, 5% 6/1/13 | | 3,765 | | 3,900 |
5% 6/1/19 (Assured Guaranty Corp. Insured) | | 2,085 | | 2,329 |
Municipal Bonds - continued |
| Principal
Amount (000s) | | Value (000s) |
Illinois - continued |
Chicago Transit Auth. Cap. Grant Receipts Rev.: - continued | | | | |
5% 6/1/19 (Assured Guaranty Corp. Insured) (Pre-Refunded to 12/1/16 @ 100) | | $ 415 | | $ 492 |
Cook County Thorton Township High School District #205 5.5% 12/1/16 (Assured Guaranty Corp. Insured) | | 2,500 | | 2,935 |
Illinois Fin. Auth. Gas Supply Rev. Bonds (The Peoples Gas Lt. and Coke Co. Proj.): | | | | |
Series 2010 B, 2.625%, tender 8/1/15 (b) | | 9,500 | | 9,771 |
Series 2010, 2.125%, tender 7/1/14 (b) | | 11,500 | | 11,597 |
Illinois Fin. Auth. Hosp. Rev. (KishHealth Sys. Proj.) Series 2008, 5.25% 10/1/15 | | 2,220 | | 2,438 |
Illinois Fin. Auth. Rev.: | | | | |
(Advocate Health Care Proj.) Series 2010 D, 5% 4/1/15 | | 550 | | 611 |
(Northwest Cmnty. Hosp. Proj.) Series 2008 A: | | | | |
5% 7/1/12 | | 750 | | 750 |
5% 7/1/13 | | 415 | | 431 |
5% 7/1/15 | | 1,000 | | 1,100 |
(Palos Cmnty. Hosp. Proj.) Series 2010 C: | | | | |
5% 5/15/16 | | 2,060 | | 2,292 |
5% 5/15/17 | | 3,520 | | 3,958 |
(Provena Health Proj.) Series 2010 A: | | | | |
5% 5/1/13 | | 2,000 | | 2,069 |
5% 5/1/14 | | 2,000 | | 2,135 |
5.75% 5/1/19 | | 2,650 | | 3,141 |
(Rush Univ. Med. Ctr. Proj.) Series 2006 B: | | | | |
5% 11/1/15 (Nat'l. Pub. Fin. Guarantee Corp. Insured) | | 3,075 | | 3,380 |
5% 11/1/16 (Nat'l. Pub. Fin. Guarantee Corp. Insured) | | 1,700 | | 1,901 |
Bonds (Advocate Health Care Proj.) Series 2008 C B3, 4.375%, tender 7/1/14 (b) | | 4,000 | | 4,280 |
Illinois Gen. Oblig.: | | | | |
Series 1, 5.25% 8/1/12 (Escrowed to Maturity) | | 2,865 | | 2,876 |
Series 2002: | | | | |
5% 10/1/16 (Pre-Refunded to 10/1/12 @ 100) | | 3,515 | | 3,556 |
5.5% 8/1/15 (Nat'l. Pub. Fin. Guarantee Corp. Insured) | | 1,495 | | 1,657 |
Series 2003 A, 5.25% 10/1/13 (FSA Insured) | | 3,755 | | 3,973 |
Series 2004 B, 5% 3/1/14 | | 15,500 | | 16,462 |
Series 2004, 5% 11/1/16 | | 11,000 | | 12,360 |
Municipal Bonds - continued |
| Principal
Amount (000s) | | Value (000s) |
Illinois - continued |
Illinois Gen. Oblig.: - continued | | | | |
Series 2005: | | | | |
5% 4/1/13 (AMBAC Insured) | | $ 5,000 | | $ 5,161 |
5% 4/1/17 (AMBAC Insured) | | 8,050 | | 8,749 |
Series 2007 A, 5.5% 6/1/15 | | 1,000 | | 1,103 |
Series 2007 B, 5% 1/1/17 | | 9,835 | | 10,988 |
Series 2009 A, 3.5% 9/1/13 (Escrowed to Maturity) | | 3,000 | | 3,112 |
Series 2010: | | | | |
4% 1/1/13 | | 3,695 | | 3,756 |
5% 1/1/15 (FSA Insured) | | 20,000 | | 21,561 |
Series 2012: | | | | |
2% 2/1/13 | | 9,500 | | 9,575 |
3% 8/1/13 | | 4,800 | | 4,915 |
4% 3/1/14 | | 5,000 | | 5,229 |
5% 3/1/13 | | 5,000 | | 5,143 |
5% 3/1/19 | | 5,500 | | 6,209 |
Illinois Health Facilities Auth. Rev.: | | | | |
(Delnor-Cmnty. Hosp. Proj.) Series 2003 A: | | | | |
5% 5/15/15 (FSA Insured) | | 2,250 | | 2,467 |
5% 5/15/16 (FSA Insured) | | 2,325 | | 2,610 |
Series 2003 A, 5% 5/15/17 (FSA Insured) | | 2,150 | | 2,461 |
Illinois Sales Tax Rev.: | | | | |
Series 2009 B: | | | | |
4.5% 6/15/16 | | 5,000 | | 5,667 |
4.5% 6/15/17 | | 6,075 | | 6,990 |
Series 2010, 5% 6/15/15 | | 8,800 | | 9,865 |
Series 2011, 4% 6/15/13 | | 2,600 | | 2,688 |
Lake County Cmnty. Consolidated School District #73 Gen. Oblig.: | | | | |
0% 12/1/15 (Escrowed to Maturity) | | 580 | | 564 |
0% 12/1/15 (Nat'l. Pub. Fin. Guarantee Corp. Insured) | | 1,520 | | 1,412 |
Metropolitan Pier & Exposition: | | | | |
(McCormick Place Expansion Proj.) Series 1996 A, 0% 12/15/13 (Nat'l. Pub. Fin. Guarantee Corp. Insured) | | 2,725 | | 2,662 |
Series A, 0% 6/15/14 (Escrowed to Maturity) | | 8,625 | | 8,522 |
0% 6/15/14 (Nat'l. Pub. Fin. Guarantee Corp. Insured) | | 700 | | 673 |
Univ. of Illinois Rev. 0% 4/1/14 | | 2,350 | | 2,305 |
Will County Cmnty. Unit School District #365-U: | | | | |
0% 11/1/14 (Escrowed to Maturity) | | 1,025 | | 1,007 |
Municipal Bonds - continued |
| Principal
Amount (000s) | | Value (000s) |
Illinois - continued |
Will County Cmnty. Unit School District #365-U: - continued | | | | |
0% 11/1/14 (FSA Insured) | | $ 875 | | $ 849 |
0% 11/1/16 (Escrowed to Maturity) | | 740 | | 708 |
0% 11/1/16 (FSA Insured) | | 2,235 | | 2,064 |
| | 319,037 |
Indiana - 1.8% |
Indiana Fin. Auth. Health Sys. Rev. (Sisters of Saint Francis Health Svcs., Inc. Obligated Group Proj.) Series 2008 C, 5% 11/1/13 | | 3,000 | | 3,174 |
Indiana Fin. Auth. Hosp. Rev. (Parkview Health Sys. Oblig. Group Proj.) Series 2009 A: | | | | |
5% 5/1/14 | | 3,500 | | 3,742 |
5% 5/1/15 | | 6,420 | | 7,046 |
Indiana Fin. Auth. Rev.: | | | | |
(Trinity Health Cr. Group Proj.) Series 2009 A: | | | | |
5% 12/1/14 | | 1,250 | | 1,379 |
5% 12/1/15 | | 2,135 | | 2,423 |
(Wabash Valley Correctional Facilities Proj.) Series 2009 A, 5% 7/1/15 | | 8,025 | | 8,868 |
(Wabash Valley Correctional Facility Proj.) Series 2009 A, 5% 7/1/14 | | 2,500 | | 2,702 |
Series 2010 A, 5% 2/1/17 | | 2,800 | | 3,302 |
Indiana Health & Edl. Facilities Fing. Auth. Rev. Bonds (Ascension Health Sr. Cr. Group Proj.) Series 2006 B1, 4.1%, tender 11/3/16 (b) | | 4,000 | | 4,477 |
Indiana Health Facility Fing. Auth. Rev. Bonds (Ascension Health Cr. Group Proj.): | | | | |
Series 2001 A1, 1.5%, tender 8/1/14 (b) | | 3,400 | | 3,461 |
Series 2001 A2, 1.6%, tender 2/1/17 (b) | | 2,200 | | 2,200 |
Indiana Muni. Pwr. Agcy. Pwr. Supply Sys. Rev. Series 2011 A: | | | | |
5% 1/1/19 | | 1,470 | | 1,739 |
5% 1/1/20 | | 1,250 | | 1,486 |
Indianapolis Local Pub. Impt. Bond Bank (Wtrwks. Proj.): | | | | |
Series 2002 A, 5.5% 7/1/16 | | 5,000 | | 5,000 |
Series F, 5% 7/1/15 (Nat'l. Pub. Fin. Guarantee Corp. Insured) | | 515 | | 572 |
Indianapolis Thermal Energy Sys. Series 2010 B: | | | | |
5% 10/1/16 | | 5,000 | | 5,679 |
5% 10/1/17 | | 5,000 | | 5,788 |
Municipal Bonds - continued |
| Principal
Amount (000s) | | Value (000s) |
Indiana - continued |
Jasper County Indl. Poll. Ctl. Rev. (Northern Indiana Pub. Svc. Co. Proj.) Series 1988 B, 5.2% 6/1/13 (Nat'l. Pub. Fin. Guarantee Corp. Insured) | | $ 3,000 | | $ 3,107 |
Logansport High School Bldg. Corp. Series 2005, 5.25% 7/15/12 (Nat'l. Pub. Fin. Guarantee Corp. Insured) | | 1,075 | | 1,076 |
Muncie School Bldg. Corp. Series 2005, 5.25% 7/10/12 (Nat'l. Pub. Fin. Guarantee Corp. Insured) | | 1,585 | | 1,586 |
Purdue Univ. Rev.: | | | | |
(Student Facilities Sys. Proj.) Series 2009 B: | | | | |
4% 7/1/17 | | 500 | | 569 |
5% 7/1/15 | | 315 | | 354 |
5% 7/1/16 | | 500 | | 578 |
Series Z-1: | | | | |
5% 7/1/16 | | 1,215 | | 1,404 |
5% 7/1/17 | | 1,000 | | 1,181 |
5% 7/1/18 | | 1,500 | | 1,807 |
Univ. of Southern Indiana Rev. Series J: | | | | |
5% 10/1/14 (Assured Guaranty Corp. Insured) | | 1,985 | | 2,145 |
5% 10/1/15 (Assured Guaranty Corp. Insured) | | 1,000 | | 1,111 |
5% 10/1/16 (Assured Guaranty Corp. Insured) | | 1,165 | | 1,327 |
| | 79,283 |
Iowa - 0.0% |
Iowa Fin. Auth. Health Facilities Rev. Series 2005 A, 5% 2/15/16 (Assured Guaranty Corp. Insured) | | 1,700 | | 1,892 |
Kansas - 0.6% |
Kansas Dev. Fin. Agcy. (Adventist Health Sys./Sunbelt Obligated Group Proj.) Series 2009 D: | | | | |
5% 11/15/14 | | 575 | | 631 |
5% 11/15/15 | | 625 | | 703 |
5% 11/15/16 | | 875 | | 1,008 |
Kansas Dev. Fin. Auth. Health Facilities Rev. (Hays Med. Ctr. Proj.) Series 2005 L, 5.25% 11/15/12 | | 680 | | 690 |
Wichita Hosp. Facilities Rev.: | | | | |
(Via Christi Health Sys., Inc. Proj.) Series 2009 X, 5% 11/15/14 | | 2,000 | | 2,160 |
(Via Christi Health Sys., Inc. Proj.) Series 2009 III A: | | | | |
5% 11/15/14 | | 2,405 | | 2,598 |
5% 11/15/15 | | 6,245 | | 6,892 |
5% 11/15/16 | | 5,410 | | 6,113 |
Municipal Bonds - continued |
| Principal
Amount (000s) | | Value (000s) |
Kansas - continued |
Wichita Hosp. Facilities Rev.: - continued | | | | |
Series 2011 IV A: | | | | |
5% 11/15/18 | | $ 2,250 | | $ 2,599 |
5% 11/15/20 | | 2,745 | | 3,157 |
| | 26,551 |
Kentucky - 0.8% |
Ashland Med. Ctr. Rev. (Ashland Hosp. Corp. d/b/a/ King's Daughters Med. Ctr. Proj.) Series 2010 B: | | | | |
4% 2/1/14 | | 750 | | 783 |
4% 2/1/15 | | 1,495 | | 1,590 |
Jefferson County School District Fin. Corp. School Bldg. Rev. Series 2009 A, 5.25% 1/1/13 (FSA Insured) | | 2,170 | | 2,222 |
Kentucky Econ. Dev. Fin. Auth. Hosp. Rev. (Baptist Healthcare Sys. Proj.) Series A, 5% 8/15/15 | | 4,000 | | 4,432 |
Kentucky Econ. Dev. Fin. Auth. Rev. (Ashland Hosp. Corp. d/b/a/ King's Daughters Med. Ctr. Proj.) Series 2010 A, 4% 2/1/13 | | 500 | | 509 |
Kentucky State Property & Buildings Commission Rev. (#82 Proj.) 5.25% 10/1/17 (FSA Insured) | | 2,450 | | 2,918 |
Louisville/Jefferson County Metropolitan Govt. Poll. Cont. Rev. Bonds (Louisville Gas and Electronic Co. Proj.): | | | | |
Series 2003 A, 1.65%, tender 4/3/17 (b) | | 6,000 | | 6,000 |
Series 2005 A, 5.75%, tender 12/2/13 (b) | | 6,000 | | 6,415 |
Series 2007 B, 1.6%, tender 6/1/17 (b) | | 8,000 | | 7,985 |
| | 32,854 |
Louisiana - 0.2% |
Louisiana Pub. Facilities Auth. Rev.: | | | | |
(Christus Health Proj.) Series 2009 A: | | | | |
5% 7/1/13 | | 3,500 | | 3,638 |
5% 7/1/16 | | 2,000 | | 2,249 |
(Entergy Gulf States Louisiana LLC Proj.) Series 2010 B, 2.875% 11/1/15 | | 3,000 | | 3,071 |
Reg'l. Transit Auth. Louisiana Sales Tax Rev. 4% 12/1/16 (FSA Insured) | | 1,000 | | 1,108 |
| | 10,066 |
Maryland - 1.2% |
Maryland Gen. Oblig. Second Series B, 5.25% 8/15/16 | | 16,100 | | 19,128 |
Municipal Bonds - continued |
| Principal
Amount (000s) | | Value (000s) |
Maryland - continued |
Maryland Health & Higher Edl. Facilities Auth. Rev.: | | | | |
(Univ. of Maryland Med. Sys. Proj.) Series 2008 F: | | | | |
5% 7/1/13 | | $ 2,400 | | $ 2,492 |
5% 7/1/14 | | 3,500 | | 3,736 |
Bonds (Johns Hopkins Health Sys. Obligated Group Proj.) Series 2008 B, 5%, tender 5/15/15 (b) | | 2,225 | | 2,494 |
Montgomery County Gen. Oblig.: | | | | |
(Dept. of Liquor Cont. Proj.) Series 2009 A, 5% 4/1/15 | | 1,725 | | 1,923 |
Series 2011 A, 5% 7/1/20 | | 16,000 | | 19,691 |
| | 49,464 |
Massachusetts - 1.9% |
Braintree Gen. Oblig. Series 2009: | | | | |
5% 5/15/14 | | 1,000 | | 1,084 |
5% 5/15/16 | | 4,400 | | 5,136 |
Massachusetts Bay Trans. Auth. Sales Tax Rev. Series 2006 B, 5.25% 7/1/18 | | 2,300 | | 2,823 |
Massachusetts Dept. of Trans. Metropolitan Hwy. Sys. Rev. Series 2010 B, 5% 1/1/15 | | 12,400 | | 13,549 |
Massachusetts Dev. Fin. Agcy. Rev.: | | | | |
(Boston College Proj.): | | | | |
Series Q1: | | | | |
4% 7/1/15 | | 1,500 | | 1,636 |
4% 7/1/16 | | 1,000 | | 1,124 |
5% 7/1/13 | | 1,000 | | 1,046 |
Series Q2: | | | | |
4% 7/1/15 | | 1,170 | | 1,276 |
4% 7/1/16 | | 1,000 | | 1,124 |
5% 7/1/13 | | 1,100 | | 1,151 |
5% 7/1/14 | | 1,080 | | 1,169 |
5% 7/1/17 | | 1,370 | | 1,630 |
(Tufts Med. Ctr. Proj.) Series I: | | | | |
5% 1/1/14 | | 1,550 | | 1,630 |
5% 1/1/16 | | 1,300 | | 1,429 |
Massachusetts Gen. Oblig.: | | | | |
Series 2002 C: | | | | |
5% 11/1/21 (Pre-Refunded to 11/1/12 @ 100) | | 8,100 | | 8,226 |
5.25% 11/1/30 (Pre-Refunded to 11/1/12 @ 100) | | 2,495 | | 2,536 |
Series 2004 B, 5.25% 8/1/20 | | 12,700 | | 16,011 |
Massachusetts Health & Edl. Facilities Auth. Rev. Bonds (Baystate Health Sys. Proj.) Series 2009 K, 5%, tender 7/1/13 (b) | | 7,000 | | 7,253 |
Municipal Bonds - continued |
| Principal
Amount (000s) | | Value (000s) |
Massachusetts - continued |
Massachusetts Spl. Oblig. Rev. (Fed. Hwy. Grant Anticipation Note Prog.) Series 2003 A: | | | | |
5% 12/15/12 (FSA Insured) | | $ 3,300 | | $ 3,371 |
5% 12/15/13 (FSA Insured) | | 4,325 | | 4,615 |
Medford Gen. Oblig. Series 2011 B, 4% 3/1/19 | | 3,570 | | 4,010 |
| | 81,829 |
Michigan - 2.3% |
Big Rapids Pub. School District: | | | | |
5% 5/1/13 (Assured Guaranty Corp. Insured) | | 1,195 | | 1,240 |
5% 5/1/14 (Assured Guaranty Corp. Insured) | | 1,190 | | 1,281 |
Chelsea School District 5% 5/1/13 (Nat'l. Pub. Fin. Guarantee Corp. Insured) | | 1,750 | | 1,816 |
Detroit School District Series 2012 A: | | | | |
5% 5/1/19 | | 2,000 | | 2,328 |
5% 5/1/20 | | 2,000 | | 2,327 |
5% 5/1/21 | | 1,810 | | 2,113 |
Detroit Swr. Disp. Rev. Series 2006 D, 0.914% 7/1/32 (b) | | 4,075 | | 3,069 |
Grand Rapids Cmnty. College 5% 5/1/13 (FSA Insured) | | 1,305 | | 1,354 |
Grand Valley Michigan State Univ. Rev. Series 2009, 5% 12/1/16 | | 1,320 | | 1,513 |
Kalamazoo Pub. Schools 5% 5/1/13 (Assured Guaranty Corp. Insured) | | 2,940 | | 3,050 |
Kent Hosp. Fin. Auth. Hosp. Facilities Rev.: | | | | |
(Spectrum Health Sys. Proj.) Series 2011 A: | | | | |
5% 11/15/18 | | 1,250 | | 1,455 |
5% 11/15/19 | | 1,000 | | 1,166 |
Bonds (Spectrum Health Sys. Proj.) Series 2008 A, 5.25%, tender 1/15/14 (b) | | 2,200 | | 2,325 |
Michigan Gen. Oblig. (Envir. Protection Prog.) Series 1992, 6.25% 11/1/12 | | 675 | | 688 |
Michigan Hosp. Fin. Auth. Rev.: | | | | |
(McLaren Health Care Corp. Proj.) Series 2008 A, 5.25% 5/15/14 | | 4,160 | | 4,496 |
Bonds (Ascension Health Cr. Group Proj.) Series 1999 B3, 2%, tender 8/1/14 (b) | | 11,000 | | 11,312 |
Michigan Muni. Bond Auth. Rev.: | | | | |
(Clean Wtr. Pooled Proj.) Series 2010: | | | | |
5% 10/1/14 | | 6,045 | | 6,654 |
5% 10/1/15 | | 1,750 | | 1,992 |
5% 10/1/15 | | 3,250 | | 3,700 |
Municipal Bonds - continued |
| Principal
Amount (000s) | | Value (000s) |
Michigan - continued |
Michigan Muni. Bond Auth. Rev.: - continued | | | | |
(Local Govt. Ln. Prog.) Series 2009 C: | | | | |
5% 5/1/13 | | $ 1,645 | | $ 1,705 |
5% 5/1/14 | | 2,140 | | 2,303 |
5% 5/1/15 | | 1,845 | | 2,034 |
5% 5/1/16 | | 1,865 | | 2,113 |
Royal Oak Hosp. Fin. Auth. Hosp. Rev. (William Beaumont Hosp. Oblig. Group Proj.) Series 2009 W, 5% 8/1/15 | | 2,070 | | 2,232 |
Wayne County Arpt. Auth. Rev.: | | | | |
Series 2010 A, 5% 12/1/18 (e) | | 1,400 | | 1,558 |
Series 2011 A, 5% 12/1/19 (e) | | 22,700 | | 25,359 |
West Bloomfield School District 5% 5/1/15 (Assured Guaranty Corp. Insured) | | 1,400 | | 1,553 |
Western Michigan Univ. Rev.: | | | | |
5.25% 11/15/14 (Assured Guaranty Corp. Insured) | | 2,135 | | 2,345 |
5.25% 11/15/15 (Assured Guaranty Corp. Insured) | | 3,275 | | 3,713 |
| | 98,794 |
Minnesota - 0.3% |
Minneapolis & Saint Paul Metropolitan Arpts. Commission Arpt. Rev. Series 2008 A, 5% 1/1/13 (e) | | 1,000 | | 1,022 |
Minnesota 911 Rev. (Pub. Safety Radio Communications Sys. Proj.) Series 2009, 5% 6/1/14 (Assured Guaranty Corp. Insured) | | 2,225 | | 2,416 |
Minnesota Agric. & Econ. Dev. Board Rev. (Essentia Health Obligated Group Proj.) Series 2008 C1: | | | | |
5% 2/15/15 (Assured Guaranty Corp. Insured) | | 1,335 | | 1,459 |
5% 2/15/16 (Assured Guaranty Corp. Insured) | | 565 | | 634 |
Northern Muni. Pwr. Agcy. Elec. Sys. Rev. Series 2009 A, 5% 1/1/15 (Assured Guaranty Corp. Insured) | | 1,000 | | 1,102 |
Southern Minnesota Muni. Pwr. Agcy. Pwr. Supply Sys. Rev. Series 2009 A, 5% 1/1/16 | | 1,000 | | 1,141 |
Tobacco Securitization Auth. Series 2011 B, 5% 3/1/19 | | 5,900 | | 6,811 |
| | 14,585 |
Mississippi - 0.1% |
Mississippi Hsg. Fin. Corp. Single Family Mtg. Rev. Series 1983, 0% 6/1/15 (Escrowed to Maturity) | | 4,000 | | 3,917 |
Missouri - 0.0% |
Saint Louis Arpt. Rev. Series 2011 B, 3% 7/1/12 | | 1,000 | | 1,000 |
Municipal Bonds - continued |
| Principal
Amount (000s) | | Value (000s) |
Nebraska - 0.2% |
Nebraska Pub. Pwr. District Rev. Series C: | | | | |
4% 1/1/15 | | $ 2,360 | | $ 2,554 |
4% 1/1/16 | | 2,195 | | 2,431 |
Univ. of Nebraska Facilities Corp. Lease Rental Rev. (UNMC Health Professions Futures Proj.) Series 2009, 5% 8/15/13 | | 4,000 | | 4,208 |
| | 9,193 |
Nevada - 1.5% |
Clark County Arpt. Rev.: | | | | |
Series 2008 E: | | | | |
5% 7/1/14 | | 2,905 | | 3,127 |
5% 7/1/15 | | 3,500 | | 3,898 |
Series A1, 5% 7/1/12 (AMBAC Insured) (e) | | 2,000 | | 2,000 |
Clark County Fuel Tax Series 2008, 5% 6/1/13 (Escrowed to Maturity) | | 5,815 | | 6,065 |
Clark County School District: | | | | |
Series 1998, 5.5% 6/15/13 (FSA Insured) | | 5,000 | | 5,236 |
Series 2005 A, 5% 6/15/16 (Nat'l. Pub. Fin. Guarantee Corp. Insured) | | 21,215 | | 23,857 |
Nevada Dept. of Bus. & Industry (Waste Mgmt., Inc. Proj.) Series 2001, 2.75% 10/1/14 (e) | | 3,000 | | 3,104 |
Nevada Gen. Oblig.: | | | | |
Series 2010 C, 5% 6/1/19 | | 12,140 | | 14,617 |
Series 2012 B, 5% 8/1/20 | | 2,230 | | 2,706 |
| | 64,610 |
New Hampshire - 0.2% |
New Hampshire Health & Ed. Facilities Auth. Rev. Series 2011, 3% 10/1/12 | | 1,050 | | 1,055 |
New Hampshire Tpk. Sys. Rev. Series 2012 B: | | | | |
5% 2/1/17 (a) | | 3,000 | | 3,398 |
5% 2/1/18 (a) | | 2,500 | | 2,871 |
| | 7,324 |
New Jersey - 2.6% |
New Jersey Ctfs. of Prtn.: | | | | |
Series 2008 A, 5% 6/15/15 | | 750 | | 831 |
Series 2009 A: | | | | |
5% 6/15/15 | | 11,285 | | 12,501 |
5% 6/15/16 | | 6,500 | | 7,368 |
Municipal Bonds - continued |
| Principal
Amount (000s) | | Value (000s) |
New Jersey - continued |
New Jersey Econ. Dev. Auth. School Facilities Construction Rev.: | | | | |
Bonds Series 2008 J4, 5%, tender 9/1/14 (FSA Insured) (b) | | $ 7,000 | | $ 7,586 |
Series 2001 A, 5.5% 6/15/13 (Escrowed to Maturity) | | 1,090 | | 1,144 |
Series 2005 K, 5.25% 12/15/14 (FGIC Insured) (Nat'l. Pub. Fin. Guarantee Corp. Insured) | | 1,790 | | 1,978 |
Series 2005 O, 5% 3/1/20 (Pre-Refunded to 3/1/15 @ 100) | | 6,350 | | 7,106 |
Series 2008 W, 5% 3/1/15 | | 10,400 | | 11,511 |
Series 2009 BB, 5% 9/1/15 | | 3,390 | | 3,812 |
Series 2011 EE, 5% 9/1/20 | | 5,000 | | 5,970 |
Series 2012: | | | | |
5% 6/15/13 | | 2,000 | | 2,082 |
5% 6/15/18 | | 10,600 | | 11,993 |
New Jersey Gen. Oblig. Series H, 5.25% 7/1/15 (FSA Insured) | | 5,000 | | 5,678 |
New Jersey Higher Ed. Student Assistance Auth. Student Ln. Rev. Series 2010 1A, 5% 12/1/15 | | 4,500 | | 5,011 |
New Jersey Tpk. Auth. Tpk. Rev.: | | | | |
Bonds Series 2012 A, 0.93%, tender 12/22/14 (b) | | 15,400 | | 15,450 |
Series 1991 C, 6.5% 1/1/16 (Escrowed to Maturity) | | 3,315 | | 3,734 |
New Jersey Trans. Trust Fund Auth.: | | | | |
Series 2003 A, 5.5% 12/15/16 (FSA Insured) | | 5,000 | | 5,911 |
Series 2003 B. 5.25% 12/15/19 | | 3,000 | | 3,660 |
| | 113,326 |
New Mexico - 1.1% |
Farmington Poll. Cont. Rev. Bonds (Southern California Edison Co. Four Corners Proj.) Series 2005 B, 2.875%, tender 4/1/15 (b) | | 22,100 | | 22,924 |
New Mexico Edl. Assistance Foundation: | | | | |
Series 2009 B, 4% 9/1/16 | | 7,000 | | 7,714 |
Series 2010 A1: | | | | |
4% 12/1/15 | | 3,700 | | 4,033 |
4% 12/1/16 | | 6,750 | | 7,479 |
Rio Rancho Wtr. & Wastewtr. Sys. Rev. Series 2009, 5% 5/15/17 (FSA Insured) | | 4,480 | | 5,281 |
| | 47,431 |
New York - 12.3% |
Albany Indl. Dev. Agcy. Civic Facility Rev. (St. Peters Hosp. Proj.) Series 2008 A, 5.5% 11/15/12 | | 1,000 | | 1,019 |
Municipal Bonds - continued |
| Principal
Amount (000s) | | Value (000s) |
New York - continued |
Dutchess County Local Dev. Corp. Rev. (Health Quest Systems, Inc. Proj.) Series 2010 A: | | | | |
5% 7/1/18 (Assured Guaranty Corp. Insured) (FSA Insured) | | $ 1,100 | | $ 1,268 |
5% 7/1/19 (Assured Guaranty Corp. Insured) (FSA Insured) | | 640 | | 740 |
Long Island Pwr. Auth. Elec. Sys. Rev.: | | | | |
Series 2003 B, 5.25% 6/1/14 | | 2,000 | | 2,173 |
Series 2010 A, 5% 5/1/15 | | 5,000 | | 5,566 |
Metropolitan Trans. Auth. Svc. Contract Rev. Series 2002 A, 5.5% 7/1/17 | | 5,000 | | 6,038 |
New York City Gen. Oblig.: | | | | |
Series 1997 H, 6% 8/1/12 (Nat'l. Pub. Fin. Guarantee Corp. Insured) | | 1,000 | | 1,004 |
Series 2005 D, 5% 8/1/12 (Escrowed to Maturity) | | 4,925 | | 4,942 |
Series 2005 F1, 5% 9/1/15 | | 3,560 | | 4,031 |
Series 2008 E, 5% 8/1/12 | | 5,000 | | 5,017 |
Series 2009 C: | | | | |
5% 8/1/13 | | 6,445 | | 6,772 |
5% 8/1/13 (Escrowed to Maturity) | | 555 | | 583 |
Series B, 5% 8/1/14 | | 10,000 | | 10,937 |
Series C: | | | | |
5% 8/1/12 | | 14,450 | | 14,500 |
5% 8/1/12 (Escrowed to Maturity) | | 5,320 | | 5,338 |
Series G: | | | | |
5.625% 8/1/13 (Nat'l. Pub. Fin. Guarantee Corp. Insured) | | 3,805 | | 3,820 |
5.625% 8/1/13 (Pre-Refunded to 8/1/12 @ 100) | | 1,270 | | 1,275 |
Series K: | | | | |
5% 8/1/12 | | 2,335 | | 2,343 |
5% 8/1/12 (Escrowed to Maturity) | | 2,025 | | 2,032 |
New York City Transitional Fin. Auth. Rev.: | | | | |
Series 2003 B, 5% 2/1/20 | | 3,000 | | 3,693 |
Series 2010 B: | | | | |
5% 11/1/17 | | 30,000 | | 36,152 |
5% 11/1/20 | | 5,950 | | 7,269 |
Series 2010 D: | | | | |
5% 11/1/15 | | 8,300 | | 9,491 |
5% 11/1/17 | | 10,115 | | 12,189 |
Series 2012 A: | | | | |
5% 11/1/17 | | 7,000 | | 8,436 |
5% 11/1/20 | | 4,500 | | 5,585 |
Municipal Bonds - continued |
| Principal
Amount (000s) | | Value (000s) |
New York - continued |
New York City Transitional Fin. Auth. Rev.: - continued | | | | |
Series E, 4% 11/1/12 | | $ 6,790 | | $ 6,874 |
New York City Trust Cultural Resources Rev. Bonds (The Juilliard School Proj.) Series 2009 B, 2.75%, tender 7/1/12 (b) | | 5,500 | | 5,500 |
New York Dorm. Auth. Mental Health Svcs. Facilities Impt. Rev.: | | | | |
(State Univ. Proj.) Series 2012 A, 5% 5/15/20 | | 4,000 | | 4,875 |
Series 2012 A, 4% 5/15/20 | | 8,000 | | 9,140 |
New York Dorm. Auth. Personal Income Tax Rev.: | | | | |
(Ed. Proj.) Series 2009 A: | | | | |
5% 3/15/13 | | 3,545 | | 3,663 |
5% 3/15/14 | | 3,745 | | 4,038 |
5% 3/15/15 | | 4,000 | | 4,469 |
Series 2009 D: | | | | |
5% 6/15/14 | | 9,890 | | 10,772 |
5% 6/15/15 | | 16,075 | | 18,121 |
5% 6/15/16 | | 9,330 | | 10,876 |
Series 2010 A, 5% 2/15/14 (Escrowed to Maturity) | | 10 | | 11 |
Series A: | | | | |
5% 2/15/14 | | 9,840 | | 10,571 |
5% 2/15/15 | | 8,775 | | 9,774 |
5% 2/15/15 (Escrowed to Maturity) | | 5 | | 6 |
New York Dorm. Auth. Revs.: | | | | |
(City Univ. Sys. Consolidation Proj.) Series A: | | | | |
5.75% 7/1/13 | | 1,980 | | 2,024 |
5.75% 7/1/13 (AMBAC Insured) | | 570 | | 583 |
(Mental Health Svcs. Facilities Proj.): | | | | |
Series 2008 D: | | | | |
5% 2/15/14 | | 7,295 | | 7,814 |
5% 8/15/14 | | 7,755 | | 8,465 |
Series 2009 A1, 5% 2/15/15 | | 9,000 | | 9,980 |
(New York Univ. Hosp. Ctr. Proj.) Series 2011 A, 5% 7/1/18 | | 3,240 | | 3,887 |
(St. Lawrence Univ.) Series 2008, 5% 7/1/14 | | 3,700 | | 3,983 |
Series 2008 B, 5% 7/1/15 | | 30,000 | | 33,752 |
Series 2008 D, 5.25% 8/15/17 (FSA Insured) | | 7,000 | | 8,382 |
Series 2009 A: | | | | |
5% 7/1/15 | | 12,850 | | 14,457 |
5% 7/1/16 | | 8,390 | | 9,703 |
New York Local Govt. Assistance Corp. Series 2003 A, 5% 4/1/18 | | 12,400 | | 14,998 |
Municipal Bonds - continued |
| Principal
Amount (000s) | | Value (000s) |
New York - continued |
New York Metropolitan Trans. Auth. Dedicated Tax Fund Rev. Series B: | | | | |
5% 11/15/14 | | $ 1,350 | | $ 1,491 |
5% 11/15/15 | | 2,325 | | 2,654 |
New York Metropolitan Trans. Auth. Rev.: | | | | |
Bonds Series 2008 B2, 5%, tender 11/15/12 (b) | | 7,300 | | 7,416 |
Series 2003 B: | | | | |
5.25% 11/15/17 (Nat'l. Pub. Fin. Guarantee Corp. Insured) | | 1,040 | | 1,103 |
5.25% 11/15/19 (Nat'l. Pub. Fin. Guarantee Corp. Insured) | | 5,200 | | 6,324 |
Series 2010 B2, 4% 11/15/14 | | 2,830 | | 3,050 |
New York State Dorm. Auth. Lease Rev. Bonds Series 2003 B, 5.25%, tender 7/1/13 (b) | | 3,000 | | 3,140 |
New York State Energy Research & Dev. Auth. Facilities Rev. Bonds (Consolidated Edison Co. of New York, Inc. Proj.) Series 2010 A, 1.45%, tender 11/1/12 (b)(e) | | 26,400 | | 26,461 |
New York Thruway Auth. Second Gen. Hwy. & Bridge Trust Fund: | | | | |
Series 2008 A, 5% 4/1/13 | | 2,600 | | 2,691 |
Series 2010 A, 5% 4/1/17 | | 1,000 | | 1,181 |
Series 2011 A1: | | | | |
5% 4/1/17 | | 1,500 | | 1,771 |
5% 4/1/18 | | 3,500 | | 4,201 |
New York Urban Dev. Corp. Rev.: | | | | |
Series 2009 C: | | | | |
5% 12/15/15 | | 6,500 | | 7,452 |
5% 12/15/16 | | 17,000 | | 20,103 |
Series 2011 A, 5% 3/15/21 | | 18,425 | | 22,667 |
Niagara County Indl. Dev. Agcy. Solid Waste Disp. Rev. Bonds Series 2001 C, 5.625%, tender 11/15/14 (b)(e) | | 2,450 | | 2,469 |
Tobacco Settlement Asset Securitization Corp. Series 2002-1, 5.5% 7/15/24 (Pre-Refunded to 7/15/12 @ 100) | | 5,475 | | 5,483 |
Tobacco Settlement Fing. Corp. Series 2011, 5% 6/1/16 | | 20,000 | | 23,023 |
Triborough Bridge & Tunnel Auth. Revs. Series Y, 5.5% 1/1/17 (Escrowed to Maturity) | | 6,470 | | 7,186 |
| | 528,797 |
Municipal Bonds - continued |
| Principal
Amount (000s) | | Value (000s) |
New York & New Jersey - 0.1% |
Port Auth. of New York & New Jersey 124th Series, 5% 8/1/13 (Nat'l. Pub. Fin. Guarantee Corp. Insured) (e) | | $ 1,200 | | $ 1,204 |
Port Auth. of New York & New Jersey Spl. Oblig. Rev. (JFK Int'l. Air Term. Spl. Proj.) Series 6, 6.25% 12/1/13 (Nat'l. Pub. Fin. Guarantee Corp. Insured) (e) | | 4,100 | | 4,319 |
| | 5,523 |
Non State Specific - 0.0% |
Washington DC Metropolitan Transit Auth. Rev. Series 2009 A, 5% 7/1/14 | | 1,000 | | 1,082 |
North Carolina - 1.2% |
Dare County Ctfs. of Prtn. Series 2012 B: | | | | |
4% 6/1/17 | | 1,000 | | 1,127 |
4% 6/1/18 | | 1,280 | | 1,459 |
4% 6/1/20 | | 1,000 | | 1,149 |
5% 6/1/19 | | 1,305 | | 1,581 |
Mecklenburg County Pub. Facilities Corp. Series 2009: | | | | |
5% 3/1/16 | | 5,870 | | 6,768 |
5% 3/1/18 | | 1,500 | | 1,813 |
Nash Health Care Sys. Health Care Facilities Rev. Series 2003: | | | | |
5% 11/1/13 (FSA Insured) | | 1,500 | | 1,580 |
5% 11/1/15 (FSA Insured) | | 1,600 | | 1,745 |
North Carolina Eastern Muni. Pwr. Agcy. Pwr. Sys. Rev.: | | | | |
Series 2008 A, 5% 1/1/13 | | 2,200 | | 2,249 |
Series 2010 A: | | | | |
5% 1/1/15 | | 4,000 | | 4,399 |
5% 1/1/16 | | 6,035 | | 6,852 |
Series 2012 D, 5% 1/1/14 (a) | | 3,000 | | 3,155 |
North Carolina Grant Anticipation Rev. Series 2009, 5% 3/1/15 | | 1,250 | | 1,392 |
North Carolina Med. Care Commission Hosp. Rev. (North Carolina Baptist Hosp. Proj.) Series 2010: | | | | |
5% 6/1/15 | | 1,500 | | 1,682 |
5% 6/1/16 | | 1,000 | | 1,155 |
5% 6/1/17 | | 3,220 | | 3,793 |
5% 6/1/18 | | 3,820 | | 4,549 |
Municipal Bonds - continued |
| Principal
Amount (000s) | | Value (000s) |
North Carolina - continued |
North Carolina Muni. Pwr. Agcy. #1 Catawba Elec. Rev.: | | | | |
Series 1998 A, 5.5% 1/1/15 (Nat'l. Pub. Fin. Guarantee Corp. Insured) | | $ 3,675 | | $ 4,099 |
Series 2008 A, 5.25% 1/1/20 | | 2,000 | | 2,351 |
| | 52,898 |
North Dakota - 0.0% |
Grand Forks Health Care Sys. Rev. (Altru Health Sys. Proj.) Series 2005, 5% 12/1/15 (Assured Guaranty Corp. Insured) | | 1,825 | | 2,025 |
Ohio - 2.6% |
Buckeye Tobacco Settlement Fing. Auth. Series 2007 A1: | | | | |
5% 6/1/16 | | 3,035 | | 3,248 |
5% 6/1/17 | | 3,500 | | 3,754 |
Cincinnati City School District 5.25% 12/1/18 (Nat'l. Pub. Fin. Guarantee Corp. Insured) | | 3,555 | | 4,342 |
Columbus City School District (School Facilities Construction and Impt. Proj.) Series 2009 B, 4% 12/1/16 | | 1,000 | | 1,134 |
Hamilton County Student Hsg. Rev. (Stratford Heights Proj.) Series 2010: | | | | |
5% 6/1/15 (FSA Insured) | | 760 | | 829 |
5% 6/1/16 (FSA Insured) | | 1,105 | | 1,240 |
5% 6/1/17 (FSA Insured) | | 1,160 | | 1,319 |
Ohio Air Quality Dev. Auth. Rev. Bonds: | | | | |
(FirstEnergy Corp. Proj.) Series 2009 D, 4.75%, tender 8/1/12 (b) | | 5,400 | | 5,418 |
(FirstEnergy Nuclear Generation Corp. Proj.) Series 2008 C, 7.25%, tender 11/1/12 (b)(e) | | 9,000 | | 9,201 |
(Ohio Pwr. Co. Proj.) Series 2010 A, 3.25%, tender 6/2/14 (b) | | 5,500 | | 5,696 |
Ohio Bldg. Auth.: | | | | |
(Administrative Bldg. Fund Proj.): | | | | |
Series 2009 B: | | | | |
5% 10/1/14 | | 5,955 | | 6,510 |
5% 10/1/15 | | 6,505 | | 7,350 |
Series 2010 C: | | | | |
4% 10/1/15 | | 3,200 | | 3,514 |
5% 10/1/16 | | 1,250 | | 1,455 |
(Adult Correctional Bldg. Fund Proj.): | | | | |
Series 2009 B: | | | | |
5% 10/1/14 | | 2,055 | | 2,247 |
5% 10/1/15 | | 4,535 | | 5,124 |
Municipal Bonds - continued |
| Principal
Amount (000s) | | Value (000s) |
Ohio - continued |
Ohio Bldg. Auth.: - continued | | | | |
(Adult Correctional Bldg. Fund Proj.): | | | | |
Series 2010 A, 5% 10/1/15 | | $ 1,185 | | $ 1,339 |
Ohio Gen. Oblig.: | | | | |
(Common Schools Proj.) Series 2010 A, 5% 9/15/17 | | 2,600 | | 3,108 |
(Higher Ed. Proj.): | | | | |
Series 2005 C, 5% 8/1/13 | | 4,495 | | 4,720 |
Series 2010 A, 5% 8/1/17 | | 3,290 | | 3,921 |
Series 2011 A, 5% 8/1/17 | | 3,070 | | 3,659 |
Ohio Higher Edl. Facility Commission Rev.: | | | | |
(Cleveland Clinic Foundation Proj.) Series 2008 A, 5% 1/1/15 | | 2,000 | | 2,212 |
(Univ. Hosp. Health Sys. Proj.) Series 2010 A: | | | | |
5% 1/15/15 | | 500 | | 545 |
5% 1/15/17 | | 1,000 | | 1,135 |
Ohio State Univ. Gen. Receipts Series 2010 A, 5% 12/1/16 | | 5,000 | | 5,895 |
Ohio Wtr. Dev. Auth. Poll. Cont. Facilities Rev. Bonds: | | | | |
(First Energy Nuclear Generation Corp. Proj.) Series 2005 B, 3.375%, tender 7/1/15 (b) | | 5,000 | | 5,162 |
(FirstEnergy Corp. Proj.) Series 2009 A, 5.875%, tender 6/1/16 (b) | | 10,225 | | 11,509 |
Ross County Hosp. Facilities Rev. (Adena Health Sys. Proj.) Series 2008: | | | | |
5% 12/1/12 | | 1,950 | | 1,981 |
5% 12/1/13 | | 875 | | 923 |
5% 12/1/14 | | 2,275 | | 2,474 |
| | 110,964 |
Oklahoma - 0.3% |
Oklahoma Dev. Fin. Auth. (Pub. Svc. Co. of Oklahoma Proj.) Series 2009, 5.25% 6/1/14 | | 2,700 | | 2,895 |
Oklahoma Dev. Fin. Auth. Health Sys. Rev. (Integris Baptist Med. Ctr. Proj.) Series 2008 B, 5% 8/15/14 | | 1,660 | | 1,804 |
Tulsa County Indl. Auth. Edl. Facilities Lease Rev. (Jenks Pub. Schools Proj.) Series 2009, 5.5% 9/1/18 | | 5,215 | | 6,403 |
| | 11,102 |
Oregon - 0.3% |
Clackamas County Hosp. Facility Auth. Bonds (Legacy Health Sys. Proj.) Series 2009 C, 5%, tender 7/15/14 (b) | | 2,500 | | 2,684 |
Municipal Bonds - continued |
| Principal
Amount (000s) | | Value (000s) |
Oregon - continued |
Gilliam County Solid Waste Disp. Rev. Bonds (Waste Mgmt., Inc. Proj.) Series 2000 A, 3.5%, tender 5/1/13 (b)(e) | | $ 5,300 | | $ 5,408 |
Oregon Facilities Auth. Rev. (Legacy Health Sys. Proj.) Series 2009 A: | | | | |
5% 3/15/13 | | 1,000 | | 1,032 |
5% 3/15/14 | | 595 | | 635 |
5% 3/15/15 | | 2,500 | | 2,754 |
5% 3/15/16 | | 1,750 | | 1,982 |
| | 14,495 |
Pennsylvania - 4.2% |
Allegheny County Arpt. Auth. Rev. Series A: | | | | |
5% 1/1/14 (FSA Insured) (e) | | 1,350 | | 1,408 |
5% 1/1/15 (FSA Insured) (e) | | 1,000 | | 1,066 |
5% 1/1/16 (FSA Insured) (e) | | 1,000 | | 1,083 |
Allegheny County Hosp. Dev. Auth. Rev.: | | | | |
(Pittsburgh Med. Ctr. Proj.): | | | | |
Series 2008 A, 5% 9/1/12 | | 6,615 | | 6,663 |
Series 2008 B, 5% 6/15/14 | | 1,385 | | 1,498 |
(Univ. of Pittsburgh Med. Ctr. Proj.) Series 2009 A: | | | | |
4% 8/15/15 | | 1,385 | | 1,510 |
5% 8/15/14 | | 1,955 | | 2,128 |
Beaver County Indl. Dev. Auth. Poll. Cont. Rev. Bonds (FirstEnergy Nuclear Generation Corp. Proj.) Series 2005 A, 3.375%, tender 7/1/15 (b) | | 2,000 | | 2,065 |
Franklin County Indl. Dev. Auth. (The Chambersburg Hosp. Proj.) Series 2010: | | | | |
5% 7/1/16 | | 1,000 | | 1,113 |
5% 7/1/17 | | 1,255 | | 1,404 |
Montgomery County Indl. Dev. Series 2012 A, 3% 10/1/13 | | 1,650 | | 1,702 |
Montgomery County Higher Ed. & Health Auth. Hosp. Rev. (Abington Memorial Hosp. Proj.) Series 2009 A, 5% 6/1/17 | | 2,200 | | 2,484 |
Pennsylvania Econ. Dev. Auth. Governmental Lease (Forum Place Proj.) Series 2012: | | | | |
5% 3/1/18 | | 2,455 | | 2,838 |
5% 3/1/19 | | 2,310 | | 2,688 |
5% 3/1/20 | | 2,140 | | 2,502 |
Pennsylvania Gen. Oblig. Series 2011, 5% 7/1/21 | | 1,900 | | 2,381 |
Municipal Bonds - continued |
| Principal
Amount (000s) | | Value (000s) |
Pennsylvania - continued |
Pennsylvania Intergovernmental Coop. Auth. Spl. Tax Rev. (City of Philadelphia Fdg. Prog.) Series 2009, 5% 6/15/15 | | $ 10,600 | | $ 11,919 |
Pennsylvania Tpk. Commission Tpk. Rev. Series 2009 B, 5% 12/1/17 | | 12,500 | | 14,799 |
Philadelphia Gas Works Rev. (1998 Gen. Ordinance Proj.): | | | | |
Eighth Series A, 5% 8/1/15 | | 2,100 | | 2,335 |
Seventh Series, 5% 10/1/12 (AMBAC Insured) | | 1,000 | | 1,011 |
Philadelphia Gen. Oblig.: | | | | |
Series 2007 A, 5% 8/1/12 (FSA Insured) | | 5,000 | | 5,016 |
Series 2008 A: | | | | |
5% 12/15/14 (FSA Insured) | | 5,370 | | 5,875 |
5% 12/15/15 (FSA Insured) | | 5,000 | | 5,618 |
5% 12/15/16 (FSA Insured) | | 7,275 | | 8,383 |
Series 2011: | | | | |
4% 8/1/12 | | 4,325 | | 4,335 |
5.25% 8/1/17 | | 6,165 | | 7,095 |
5.25% 8/1/18 | | 5,515 | | 6,378 |
Philadelphia School District Series 2010 C, 5% 9/1/16 | | 13,610 | | 15,230 |
Philadelphia Wtr. & Wastewtr. Rev. Series 2010 A: | | | | |
5% 6/15/15 | | 15,000 | | 16,635 |
5% 6/15/16 | | 6,000 | | 6,843 |
Pittsburgh & Allegheny County Sports & Exhibition Auth. Series 2010: | | | | |
5% 2/1/15 (FSA Insured) | | 4,580 | | 4,962 |
5% 2/1/16 (FSA Insured) | | 5,620 | | 6,239 |
Pittsburgh School District: | | | | |
Series 2009 A: | | | | |
3% 9/1/12 (Assured Guaranty Corp. Insured) | | 1,300 | | 1,305 |
3% 9/1/14 (Assured Guaranty Corp. Insured) | | 1,640 | | 1,719 |
Series 2010 A: | | | | |
4% 9/1/15 (FSA Insured) | | 1,450 | | 1,584 |
5% 9/1/16 (FSA Insured) | | 1,685 | | 1,944 |
Saint Mary Hosp. Auth. Health Sys. Rev. (Catholic Health East Proj.) Series 2010 B: | | | | |
5% 11/15/13 | | 2,465 | | 2,600 |
5% 11/15/14 | | 4,690 | | 5,101 |
5% 11/15/15 | | 2,420 | | 2,707 |
Southeastern Pennsylvania Trans. Auth. Rev. Series 2011: | | | | |
5% 6/1/18 | | 1,000 | | 1,175 |
Municipal Bonds - continued |
| Principal
Amount (000s) | | Value (000s) |
Pennsylvania - continued |
Southeastern Pennsylvania Trans. Auth. Rev. Series 2011: - continued | | | | |
5% 6/1/19 | | $ 200 | | $ 237 |
Unionville-Chadds Ford School District Gen. Oblig. Series 2009, 5% 6/1/20 | | 1,190 | | 1,457 |
Westmoreland County Muni. Auth. Muni. Svc. Rev. Series K, 0% 7/1/12 (Escrowed to Maturity) | | 2,355 | | 2,355 |
| | 179,390 |
Puerto Rico - 0.4% |
Puerto Rico Commonwealth Aqueduct & Swr. Auth. Series 2012 A, 5% 7/1/21 | | 6,000 | | 6,506 |
Puerto Rico Govt. Dev. Bank Series 2006 B, 5% 12/1/12 | | 1,000 | | 1,017 |
Puerto Rico Infrastructure Fin. Bonds (Port Auth. Proj.) Series 2011 C, 2.75%, tender 6/15/13 (b)(e) | | 9,600 | | 9,630 |
| | 17,153 |
Rhode Island - 0.3% |
Rhode Island & Providence Plantations Series 2010 A, 5% 10/1/12 | | 2,250 | | 2,276 |
Rhode Island Econ. Dev. Corp. Rev. (Dept. of Trans. Proj.) Series 2009 A: | | | | |
5% 6/15/15 (Assured Guaranty Corp. Insured) | | 2,010 | | 2,237 |
5% 6/15/16 (Assured Guaranty Corp. Insured) | | 6,625 | | 7,592 |
| | 12,105 |
South Carolina - 0.5% |
Lexington County Health Svcs. District, Inc. Hosp. Rev. Series 2011: | | | | |
3% 11/1/12 | | 1,400 | | 1,410 |
5% 11/1/19 | | 1,190 | | 1,398 |
South Carolina Pub. Svc. Auth. (Santee Cooper) Rev. Oblig.: | | | | |
Series 2012 B: | | | | |
5% 12/1/17 | | 2,000 | | 2,391 |
5% 12/1/20 | | 1,000 | | 1,235 |
Series 2012 C: | | | | |
5% 12/1/13 (a) | | 2,400 | | 2,519 |
5% 12/1/17 (a) | | 10,535 | | 12,394 |
| | 21,347 |
Municipal Bonds - continued |
| Principal
Amount (000s) | | Value (000s) |
South Dakota - 0.2% |
South Dakota Health & Edl. Facilities Auth. Rev.: | | | | |
(Reg'l. Health Proj.) Series 2010: | | | | |
5% 9/1/14 | | $ 625 | | $ 673 |
5% 9/1/15 | | 680 | | 746 |
5% 9/1/16 | | 500 | | 562 |
5% 9/1/17 | | 490 | | 559 |
Series 2011: | | | | |
5% 9/1/17 | | 1,100 | | 1,256 |
5% 9/1/18 | | 1,200 | | 1,372 |
5% 9/1/19 | | 1,255 | | 1,435 |
| | 6,603 |
Tennessee - 0.4% |
Jackson Hosp. Rev. (Jackson-Madison County Gen. Hosp. Proj.) Series 2008, 5% 4/1/13 | | 1,000 | | 1,030 |
Memphis Elec. Sys. Rev. 5% 12/1/14 | | 5,000 | | 5,498 |
Memphis-Shelby County Arpt. Auth. Arpt. Rev. Series 2010 B, 5% 7/1/16 (e) | | 1,730 | | 1,933 |
Metropolitan Nashville Arpt. Auth. Rev. Series 2010 A: | | | | |
5% 7/1/16 | | 1,815 | | 2,046 |
5% 7/1/17 | | 1,100 | | 1,260 |
Shelby County Health Edl. & Hsg. Facilities Board Rev. Series 2004 A, 5% 9/1/15 | | 3,125 | | 3,499 |
| | 15,266 |
Texas - 5.5% |
Austin Cmnty. College District Pub. Facilities Lease Rev. (Round Rock Campus Proj.) Series 2008, 5.25% 8/1/15 | | 2,585 | | 2,906 |
Austin Convention Enterprises, Inc. (Convention Ctr. Proj.): | | | | |
Series 2006 A, 6% 1/1/14 | | 1,420 | | 1,488 |
Series 2006 B, 6% 1/1/13 | | 1,270 | | 1,293 |
Austin Elec. Util. Sys. Rev.: | | | | |
Series A, 5% 11/15/15 | | 1,000 | | 1,133 |
0% 5/15/18 (Nat'l. Pub. Fin. Guarantee Corp. Insured) | | 4,500 | | 3,906 |
Austin Independent School District Series 2004, 5% 8/1/17 | | 1,450 | | 1,740 |
Austin Wtr. & Wastewtr. Sys. Rev. Series 2009 A, 5% 11/15/15 | | 2,250 | | 2,566 |
Brownsville Util. Sys. Rev. Series 2008 A, 5% 9/1/15 (FSA Insured) | | 2,665 | | 2,994 |
Municipal Bonds - continued |
| Principal
Amount (000s) | | Value (000s) |
Texas - continued |
Carroll Independent School District Series 2009 C, 5.25% 2/15/19 | | $ 1,000 | | $ 1,242 |
Corpus Christi Independent School District 4% 8/15/14 | | 10,140 | | 10,860 |
Dallas Fort Worth Int'l. Arpt. Rev. Series 2009 A: | | | | |
5% 11/1/14 | | 2,500 | | 2,740 |
5% 11/1/15 | | 5,000 | | 5,648 |
Dallas Wtrwks. & Swr. Sys. Rev. Series 2011, 5% 10/1/18 | | 1,600 | | 1,963 |
Fort Worth Independent School District Series 2009, 5% 2/15/16 | | 3,690 | | 4,259 |
Frisco Gen. Oblig. Series 2004, 5.25% 2/15/14 (Nat'l. Pub. Fin. Guarantee Corp. Insured) | | 1,380 | | 1,489 |
Grapevine Gen. Oblig.: | | | | |
Series 2009 A, 5% 2/15/15 | | 2,215 | | 2,462 |
Series 2009, 5% 2/15/16 | | 1,375 | | 1,582 |
Harris County Cultural Ed. Facilities Fin. Corp. Thermal Util. Rev. (TECO Proj.) Series 2009 A: | | | | |
5% 11/15/12 | | 1,000 | | 1,017 |
5% 11/15/14 | | 1,000 | | 1,090 |
5% 11/15/16 | | 500 | | 576 |
Harris County Gen. Oblig. (Road Proj.) Series 2008 B: | | | | |
5% 8/15/13 | | 1,000 | | 1,052 |
5% 8/15/14 | | 1,075 | | 1,174 |
Houston Arpt. Sys. Rev.: | | | | |
Series 2011 A, 5% 7/1/17 (e) | | 7,380 | | 8,529 |
Series 2011 B, 3% 7/1/12 | | 1,540 | | 1,540 |
Series A: | | | | |
5% 7/1/15 | | 2,070 | | 2,315 |
5% 7/1/16 | | 1,080 | | 1,243 |
Houston Gen. Oblig.: | | | | |
Series 2004 A, 5.25% 3/1/14 (Nat'l. Pub. Fin. Guarantee Corp. Insured) | | 2,855 | | 3,084 |
Series A, 5% 3/1/13 (Nat'l. Pub. Fin. Guarantee Corp. Insured) | | 7,500 | | 7,734 |
Houston Independent School District: | | | | |
Bonds Series 2012: | | | | |
1.5%, tender 6/1/13 (b) | | 8,745 | | 8,829 |
2%, tender 6/1/14 (b) | | 5,850 | | 5,996 |
Series 2005 A, 0% 2/15/16 | | 4,500 | | 4,363 |
Humble Independent School District Series 2009, 4% 2/15/13 | | 400 | | 409 |
Keller Independent School District 5% 2/15/14 | | 3,750 | | 4,026 |
Municipal Bonds - continued |
| Principal
Amount (000s) | | Value (000s) |
Texas - continued |
Klein Independent School District Series 2009 A, 5% 8/1/16 | | $ 2,195 | | $ 2,570 |
Leander Independent School District Series 2001, 6% 8/15/14 (Escrowed to Maturity) | | 1,850 | | 2,071 |
Lewisville Independent School District Series 2009, 5% 8/15/17 | | 1,170 | | 1,398 |
Lone Star College Sys. Gen. Oblig. Series 2010 A, 5% 8/15/22 | | 2,500 | | 2,512 |
Lower Colorado River Auth. Rev.: | | | | |
Series 2010, 5% 5/15/17 | | 2,805 | | 3,297 |
5% 5/15/15 | | 2,120 | | 2,375 |
5% 5/15/15 (Escrowed to Maturity) | | 5 | | 6 |
5% 5/15/16 | | 2,355 | | 2,716 |
5% 5/15/16 (Escrowed to Maturity) | | 5 | | 6 |
Lower Colorado River Auth. Transmission Contract Rev. (LCRA Transmission Svcs. Corp. Proj.) Series 2010, 5% 5/15/18 | | 3,140 | | 3,739 |
Lubbock Gen. Oblig. Series 2005, 5% 2/15/13 (Nat'l. Pub. Fin. Guarantee Corp. Insured) | | 1,850 | | 1,904 |
Lubbock Health Facilities Dev. Corp. Rev. (St. Joseph Health Sys. Proj.) Series 2008 B: | | | | |
5% 7/1/17 | | 2,800 | | 3,242 |
5% 7/1/18 | | 3,030 | | 3,544 |
Mansfield Independent School District Series 2009, 4% 2/15/17 | | 1,840 | | 2,077 |
North Texas Tollway Auth. Rev.: | | | | |
Bonds Series 2008 H2, 5%, tender 1/1/13 (b) | | 5,000 | | 5,117 |
Series 2010 B1, 3.2% 1/1/13 | | 2,275 | | 2,303 |
Northside Independent School District Bonds 1.5%, tender 8/1/12 (b) | | 12,500 | | 12,510 |
San Antonio Wtr. Sys. Rev. Series 2012: | | | | |
4% 5/15/19 | | 1,500 | | 1,741 |
5% 5/15/20 | | 6,000 | | 7,396 |
5% 5/15/21 | | 5,000 | | 6,185 |
San Jacinto Cmnty. College District Series 2009: | | | | |
5% 2/15/15 | | 2,220 | | 2,454 |
5% 2/15/15 (Escrowed to Maturity) | | 280 | | 313 |
5% 2/15/16 | | 2,000 | | 2,276 |
Southwest Higher Ed. Auth. Rev. (Southern Methodist Univ. Proj.) Series 2009, 5% 10/1/16 | | 5,795 | | 6,721 |
Tarrant County Cultural Ed. Facilities Fin. Corp. Hosp. Rev. (Baylor Health Care Sys. Proj.) Series 2009, 5% 11/15/12 | | 1,950 | | 1,982 |
Municipal Bonds - continued |
| Principal
Amount (000s) | | Value (000s) |
Texas - continued |
Tarrant County Cultural Ed. Facilities Fin. Corp. Rev. (Christus Health Proj.) Series 2008 A, 5.75% 7/1/18 (Assured Guaranty Corp. Insured) | | $ 4,685 | | $ 5,094 |
Texas Gen. Oblig.: | | | | |
Series 2011 B, 2% 8/1/12 (e) | | 3,365 | | 3,369 |
Series B, 0% 10/1/13 | | 6,500 | | 6,425 |
Texas Muni. Pwr. Agcy. Rev. Series 2010: | | | | |
4% 9/1/14 | | 1,000 | | 1,061 |
5% 9/1/15 | | 835 | | 933 |
5% 9/1/16 | | 750 | | 860 |
Texas Pub. Fin. Auth. Rev. Series 2010 A, 5% 1/1/16 | | 7,865 | | 9,032 |
Tomball Independent School District 5% 2/15/17 (Assured Guaranty Corp. Insured) | | 1,105 | | 1,292 |
Trinity River Auth. Reg'l. Wastewtr. Sys. Rev. Series 2008, 5% 8/1/13 | | 6,135 | | 6,444 |
Univ. of North Texas Univ. Rev. Series A, 5% 4/15/14 | | 1,000 | | 1,080 |
Univ. of Texas Board of Regents Sys. Rev.: | | | | |
Series 2003 B, 5% 8/15/33 (Pre-Refunded to 8/15/13 @ 100) | | 15,000 | | 15,773 |
Series 2010 B, 5% 8/15/21 | | 1,800 | | 2,265 |
| | 237,331 |
Utah - 0.2% |
Salt Lake County Wtr. Conservancy District Rev. Series A: | | | | |
0% 10/1/12 (AMBAC Insured) | | 3,800 | | 3,787 |
0% 10/1/13 (AMBAC Insured) | | 3,760 | | 3,685 |
| | 7,472 |
Vermont - 0.1% |
Vermont Edl. & Health Bldg. Fin. Agcy. Rev. (Fletcher Allen Health Care Proj.) Series 2004 B, 5% 12/1/15 (FSA Insured) | | 2,225 | | 2,421 |
Virgin Islands - 0.1% |
Virgin Islands Pub. Fin. Auth. Series 2009 B, 5% 10/1/15 | | 5,000 | | 5,425 |
Virginia - 0.4% |
Amelia County Indl. Dev. Auth. Solid Waste Disp. Rev. Bonds (Waste Mgmt., Inc. Proj.) 3.375%, tender 4/1/13 (b)(e) | | 5,900 | | 6,002 |
Chesapeake Econ. Dev. Auth. Poll. Cont. Rev. Bonds (Elec. & Pwr. Co. Proj.) Series 2008 A, 3.6%, tender 2/1/13 (b) | | 1,800 | | 1,832 |
Municipal Bonds - continued |
| Principal
Amount (000s) | | Value (000s) |
Virginia - continued |
Louisa Indl. Dev. Auth. Poll. Cont. Rev. Bonds (Virginia Elec. & Pwr. Co. Proj.) Series 2008 B, 5.375%, tender 12/2/13 (b) | | $ 8,000 | | $ 8,549 |
York County Econ. Dev. Auth. Poll. Cont. Rev. Bonds (Virginia Elec. and Pwr. Co. Proj.) Series 2009 A, 4.05%, tender 5/1/14 (b) | | 1,800 | | 1,887 |
| | 18,270 |
Washington - 1.8% |
Energy Northwest Elec. Rev.: | | | | |
(#3 Proj.) Series 2009 A, 5% 7/1/14 | | 4,000 | | 4,366 |
Series 2012 A, 5% 7/1/19 | | 30,000 | | 36,853 |
Grant County Pub. Util. District #2 Series 2012 A: | | | | |
5% 1/1/20 | | 1,375 | | 1,652 |
5% 1/1/21 | | 1,865 | | 2,247 |
King County Highline School District # 401 Series 2009: | | | | |
5% 12/1/16 | | 6,350 | | 7,463 |
5% 12/1/17 | | 2,950 | | 3,509 |
Port of Seattle Passenger Facilities Charge Rev. Series 2010 B, 5% 12/1/16 (e) | | 2,500 | | 2,817 |
Port of Seattle Rev.: | | | | |
Series 2001 D, 5.75% 11/1/15 (Pre-Refunded to 11/1/12 @ 100) (e) | | 3,640 | | 3,701 |
Series 2010 C: | | | | |
5% 2/1/16��(e) | | 2,000 | | 2,244 |
5% 2/1/17 (e) | | 2,500 | | 2,850 |
Seattle Muni. Lt. & Pwr. Rev. Series 2010 B, 5% 2/1/17 | | 2,000 | | 2,357 |
Spokane County Wastewtr. Sys. Rev. Series 2009 A, 5% 12/1/15 | | 1,710 | | 1,952 |
Washington Health Care Facilities Auth. Rev. (MultiCare Health Sys. Proj.) Series 2010 A: | | | | |
5% 8/15/13 | | 2,000 | | 2,087 |
5% 8/15/14 | | 2,000 | | 2,153 |
| | 76,251 |
West Virginia - 0.3% |
West Virginia Econ. Dev. Auth. Solid Waste Disp. Facilities Rev. Bonds Series 2011 A, 2%, tender 8/1/12 (b)(e) | | 13,000 | | 13,008 |
Wisconsin - 1.1% |
Milwaukee County Arpt. Rev. Series 2010 B, 5% 12/1/15 (e) | | 1,720 | | 1,897 |
Municipal Bonds - continued |
| Principal
Amount (000s) | | Value (000s) |
Wisconsin - continued |
Wisconsin Gen. Oblig.: | | | | |
Series 2005 1, 5% 5/1/15 (Nat'l. Pub. Fin. Guarantee Corp. Insured) | | $ 6,325 | | $ 7,106 |
Series 2009 C, 4% 5/1/14 | | 3,365 | | 3,583 |
Series 2010 1: | | | | |
5% 5/1/14 | | 5,750 | | 6,228 |
5% 5/1/15 | | 8,005 | | 8,994 |
5% 5/1/16 | | 10,000 | | 11,590 |
Wisconsin Health & Edl. Facilities Auth. Rev.: | | | | |
(Agnesian HealthCare, Inc. Proj.) Series 2010, 5% 7/1/16 | | 1,175 | | 1,304 |
(Aurora Health Care, Inc. Proj.) Series 2010 A, 5% 4/15/17 | | 1,500 | | 1,707 |
(Marshfield Clinic Proj.) Series 2006 A, 5% 2/15/13 | | 875 | | 899 |
(Thedacare, Inc. Proj.) Series 2010: | | | | |
4% 12/15/13 | | 1,035 | | 1,079 |
5% 12/15/15 | | 1,105 | | 1,236 |
5% 12/15/16 | | 1,440 | | 1,637 |
5% 12/15/17 | | 1,540 | | 1,773 |
| | 49,033 |
TOTAL MUNICIPAL BONDS (Cost $3,451,990) |
3,599,300
|
Municipal Notes - 0.4% |
| | | |
California - 0.1% |
California School Cash Reserve Prog. Auth. TRAN Series 2012 X, 2.5% 1/31/13 | 4,000 | | 4,029 |
New York - 0.3% |
Suffolk County Gen. Oblig. TAN Series 2012 II, 2% 7/12/12 | 11,800 | | 11,806 |
TOTAL MUNICIPAL NOTES (Cost $15,827) |
15,835
|
Money Market Funds - 7.8% |
| Shares | | Value (000s) |
Fidelity Municipal Cash Central Fund, 0.21% (c)(d)
(Cost $338,204) | 338,203,900 | | $ 338,204 |
TOTAL INVESTMENT PORTFOLIO - 91.9% (Cost $3,806,021) | | 3,953,339 |
NET OTHER ASSETS (LIABILITIES) - 8.1% | | 348,599 |
NET ASSETS - 100% | $ 4,301,938 |
Security Type Abbreviations |
TAN | - | TAX ANTICIPATION NOTE |
TRAN | - | TAX AND REVENUE ANTICIPATION NOTE |
Legend |
(a) Security or a portion of the security purchased on a delayed delivery or when-issued basis. |
(b) Coupon rates for floating and adjustable rate securities reflect the rates in effect at period end. |
(c) Information in this report regarding holdings by state and security types does not reflect the holdings of the Fidelity Municipal Cash Central Fund. |
(d) Affiliated fund that is available only to investment companies and other accounts managed by Fidelity Investments. The rate quoted is the annualized seven-day yield of the fund at period end. A complete unaudited listing of the fund's holdings as of its most recent quarter end is available upon request. In addition, each Fidelity Central Fund's financial statements are available on the SEC's website or upon request. |
(e) Private activity obligations whose interest is subject to the federal alternative minimum tax for individuals. |
Affiliated Central Funds |
Information regarding fiscal year to date income earned by the Fund from investments in Fidelity Central Funds is as follows: |
Fund | Income earned
(Amounts in thousands) |
Fidelity Municipal Cash Central Fund | $ 280 |
Other Information |
The following is a summary of the inputs used, as of June 30, 2012, involving the Fund's assets and liabilities carried at fair value. The inputs or methodology used for valuing securities may not be an indication of the risk associated with investing in those securities. For more information on valuation inputs, and their aggregation into the levels used in the table below, please refer to the Security Valuation section in the accompanying Notes to Financial Statements. |
Valuation Inputs at Reporting Date: |
Description
(Amounts in thousands) | Total | Level 1 | Level 2 | Level 3 |
Investments in Securities: | | | | |
Municipal Securities | $ 3,615,135 | $ - | $ 3,615,135 | $ - |
Money Market Funds | 338,204 | 338,204 | - | - |
Total Investments in Securities: | $ 3,953,339 | $ 338,204 | $ 3,615,135 | $ - |
The distribution of municipal securities by revenue source, as a percentage of total net assets, is as follows (Unaudited): |
General Obligations | 32.1% |
Electric Utilities | 12.8% |
Special Tax | 11.1% |
Health Care | 8.6% |
Water & Sewer | 5.7% |
Transportation | 5.2% |
Others (Individually Less Than 5%) | 8.6% |
Short-Term Investments and Net Other Assets | 15.9% |
| 100.0% |
See accompanying notes which are an integral part of the financial statements.
Semiannual Report
Statement of Assets and Liabilities
Amounts in thousands (except per-share amounts) | June 30, 2012 (Unaudited) |
| | |
Assets | | |
Investment in securities, at value - See accompanying schedule: Unaffiliated issuers (cost $3,467,817) | $ 3,615,135 | |
Fidelity Central Funds (cost $338,204) | 338,204 | |
Total Investments (cost $3,806,021) | | $ 3,953,339 |
Cash | | 350,577 |
Receivable for fund shares sold | | 5,368 |
Interest receivable | | 40,213 |
Distributions receivable from Fidelity Central Funds | | 58 |
Other receivables | | 79 |
Total assets | | 4,349,634 |
| | |
Liabilities | | |
Payable for investments purchased on a delayed delivery basis | $ 40,825 | |
Payable for fund shares redeemed | 2,478 | |
Distributions payable | 1,663 | |
Accrued management fee | 1,305 | |
Distribution and service plan fees payable | 155 | |
Other affiliated payables | 1,194 | |
Other payables and accrued expenses | 76 | |
Total liabilities | | 47,696 |
| | |
Net Assets | | $ 4,301,938 |
Net Assets consist of: | | |
Paid in capital | | $ 4,151,057 |
Undistributed net investment income | | 245 |
Accumulated undistributed net realized gain (loss) on investments | | 3,318 |
Net unrealized appreciation (depreciation) on investments | | 147,318 |
Net Assets | | $ 4,301,938 |
See accompanying notes which are an integral part of the financial statements.
Semiannual Report
Statement of Assets and Liabilities - continued
Amounts in thousands (except per-share amounts) | June 30, 2012 (Unaudited) |
| | |
Calculation of Maximum Offering Price Class A:
Net Asset Value and redemption price per share ($365,613 ÷ 33,625 shares) | | $ 10.87 |
| | |
Maximum offering price per share (100/97.25 of $10.87) | | $ 11.18 |
Class T:
Net Asset Value and redemption price per share ($25,579 ÷ 2,357 shares) | | $ 10.85 |
| | |
Maximum offering price per share (100/97.25 of $10.85) | | $ 11.16 |
Class B:
Net Asset Value and offering price per share ($1,456 ÷ 134 shares)A | | $ 10.87 |
| | |
Class C:
Net Asset Value and offering price per share ($88,394 ÷ 8,144 shares)A | | $ 10.85 |
| | |
| | |
Short-Intermediate Municipal Income:
Net Asset Value, offering price and redemption price per share ($3,623,040 ÷ 333,766 shares) | | $ 10.86 |
| | |
Institutional Class:
Net Asset Value, offering price and redemption price per share ($197,856 ÷ 18,218 shares) | | $ 10.86 |
A Redemption price per share is equal to net asset value less any applicable contingent deferred sales charge.
See accompanying notes which are an integral part of the financial statements.
Semiannual Report
Financial Statements - continued
Statement of Operations
Amounts in thousands | Six months ended June 30, 2012 (Unaudited) |
| | |
Investment Income | | |
Interest | | $ 49,992 |
Income from Fidelity Central Funds | | 280 |
Total income | | 50,272 |
| | |
Expenses | | |
Management fee | $ 7,806 | |
Transfer agent fees | 2,075 | |
Distribution and service plan fees | 919 | |
Accounting fees and expenses | 315 | |
Custodian fees and expenses | 22 | |
Independent trustees' compensation | 7 | |
Registration fees | 154 | |
Audit | 26 | |
Legal | 5 | |
Miscellaneous | 22 | |
Total expenses before reductions | 11,351 | |
Expense reductions | (130) | 11,221 |
Net investment income (loss) | | 39,051 |
Realized and Unrealized Gain (Loss) Net realized gain (loss) on: | | |
Investment securities: | | |
Unaffiliated issuers | | 3,318 |
Change in net unrealized appreciation (depreciation) on investment securities | | 10,912 |
Net gain (loss) | | 14,230 |
Net increase (decrease) in net assets resulting from operations | | $ 53,281 |
See accompanying notes which are an integral part of the financial statements.
Semiannual Report
Statement of Changes in Net Assets
Amounts in thousands | Six months ended
June 30, 2012
(Unaudited) | Year ended
December 31,
2011 |
Increase (Decrease) in Net Assets | | |
Operations | | |
Net investment income (loss) | $ 39,051 | $ 80,340 |
Net realized gain (loss) | 3,318 | 2,116 |
Change in net unrealized appreciation (depreciation) | 10,912 | 76,652 |
Net increase (decrease) in net assets resulting
from operations | 53,281 | 159,108 |
Distributions to shareholders from net investment income | (35,890) | (83,163) |
Distributions to shareholders from net realized gain | - | (2,965) |
Total distributions | (35,890) | (86,128) |
Share transactions - net increase (decrease) | 167,121 | 142,426 |
Redemption fees | 27 | 46 |
Total increase (decrease) in net assets | 184,539 | 215,452 |
| | |
Net Assets | | |
Beginning of period | 4,117,399 | 3,901,947 |
End of period (including undistributed net investment income of $245 and distributions in excess of net investment income of $2,916, respectively) | $ 4,301,938 | $ 4,117,399 |
See accompanying notes which are an integral part of the financial statements.
Semiannual Report
Financial Highlights - Class A
| Six months ended
June 30, 2012 | Years ended December 31, |
| (Unaudited) | 2011 | 2010 | 2009 | 2008 | 2007 |
Selected Per-Share Data | | | | | |
Net asset value, beginning of period | $ 10.83 | $ 10.62 | $ 10.64 | $ 10.35 | $ 10.33 | $ 10.21 |
Income from Investment Operations | | | | | | |
Net investment income (loss) E | .085 | .198 | .209 | .254 | .298 | .302 |
Net realized and unrealized gain (loss) | .032 | .225 | (.016) | .294 | .021 | .118 |
Total from investment operations | .117 | .423 | .193 | .548 | .319 | .420 |
Distributions from net investment income | (.077) | (.205) | (.209) | (.258) | (.300) | (.300) |
Distributions from net realized gain | - | (.008) | (.004) | - | - | - |
Total distributions | (.077) | (.213) | (.213) | (.258) | (.300) | (.300) |
Redemption fees added to paid in capital E | - I | - I | - I | - I | .001 | - I |
Net asset value, end of period | $ 10.87 | $ 10.83 | $ 10.62 | $ 10.64 | $ 10.35 | $ 10.33 |
Total Return B, C, D | 1.08% | 4.03% | 1.81% | 5.34% | 3.13% | 4.19% |
Ratios to Average Net Assets F, H | | | | | |
Expenses before reductions | .80% A | .77% | .78% | .79% | .75% | .71% |
Expenses net of fee waivers, if any | .80% A | .77% | .78% | .78% | .75% | .71% |
Expenses net of all reductions | .79% A | .77% | .77% | .78% | .72% | .64% |
Net investment income (loss) | 1.58% A | 1.85% | 1.95% | 2.41% | 2.90% | 2.95% |
Supplemental Data | | | | | |
Net assets, end of period (in millions) | $ 366 | $ 336 | $ 200 | $ 169 | $ 58 | $ 12 |
Portfolio turnover rate G | 24% A | 22% | 15% | 8% | 20% | 23% |
A Annualized
B Total returns for periods of less than one year are not annualized.
C Total returns would have been lower if certain expenses had not been reduced during the applicable periods shown.
D Total returns do not include the effect of the sales charges.
E Calculated based on average shares outstanding during the period.
F Fees and expenses of any underlying Fidelity Central Funds are not included in the Fund's expense ratio. The Fund indirectly bears its proportionate share of the expenses of any underlying Fidelity Central Funds.
G Amount does not include the portfolio activity of any underlying Fidelity Central Funds.
H Expense ratios reflect operating expenses of the class. Expenses before reductions do not reflect amounts reimbursed by the investment adviser or reductions from brokerage service arrangements or reductions from other expense offset arrangements and do not represent the amount paid by the class during periods when reimbursements or reductions occur. Expenses net of fee waivers reflect expenses after reimbursement by the investment adviser but prior to reductions from brokerage service arrangements or other expense offset arrangements. Expenses net of all reductions represent the net expenses paid by the class.
I Amount represents less than $.001 per share.
See accompanying notes which are an integral part of the financial statements.
Semiannual Report
Financial Highlights - Class T
| Six months ended
June 30, 2012 | Years ended December 31, |
| (Unaudited) | 2011 | 2010 | 2009 | 2008 | 2007 |
Selected Per-Share Data | | | | | |
Net asset value, beginning of period | $ 10.81 | $ 10.60 | $ 10.63 | $ 10.34 | $ 10.31 | $ 10.19 |
Income from Investment Operations | | | | | | |
Net investment income (loss) E | .086 | .199 | .211 | .255 | .300 | .297 |
Net realized and unrealized gain (loss) | .032 | .226 | (.026) | .294 | .029 | .120 |
Total from investment operations | .118 | .425 | .185 | .549 | .329 | .417 |
Distributions from net investment income | (.078) | (.207) | (.211) | (.259) | (.300) | (.297) |
Distributions from net realized gain | - | (.008) | (.004) | - | - | - |
Total distributions | (.078) | (.215) | (.215) | (.259) | (.300) | (.297) |
Redemption fees added to paid in capital E | - I | - I | - I | - I | .001 | - I |
Net asset value, end of period | $ 10.85 | $ 10.81 | $ 10.60 | $ 10.63 | $ 10.34 | $ 10.31 |
Total Return B, C, D | 1.10% | 4.05% | 1.74% | 5.36% | 3.24% | 4.17% |
Ratios to Average Net Assets F, H | | | | | |
Expenses before reductions | .77% A | .76% | .76% | .77% | .74% | .74% |
Expenses net of fee waivers, if any | .77% A | .76% | .76% | .77% | .74% | .74% |
Expenses net of all reductions | .77% A | .76% | .75% | .77% | .72% | .69% |
Net investment income (loss) | 1.60% A | 1.86% | 1.97% | 2.42% | 2.90% | 2.91% |
Supplemental Data | | | | | |
Net assets, end of period (in millions) | $ 26 | $ 26 | $ 24 | $ 23 | $ 15 | $ 10 |
Portfolio turnover rate G | 24% A | 22% | 15% | 8% | 20% | 23% |
A Annualized
B Total returns for periods of less than one year are not annualized.
C Total returns would have been lower if certain expenses had not been reduced during the applicable periods shown.
D Total returns do not include the effect of the sales charges.
E Calculated based on average shares outstanding during the period.
F Fees and expenses of any underlying Fidelity Central Funds are not included in the Fund's expense ratio. The Fund indirectly bears its proportionate share of the expenses of any underlying Fidelity Central Funds.
G Amount does not include the portfolio activity of any underlying Fidelity Central Funds.
H Expense ratios reflect operating expenses of the class. Expenses before reductions do not reflect amounts reimbursed by the investment adviser or reductions from brokerage service arrangements or reductions from other expense offset arrangements and do not represent the amount paid by the class during periods when reimbursements or reductions occur. Expenses net of fee waivers reflect expenses after reimbursement by the investment adviser but prior to reductions from brokerage service arrangements or other expense offset arrangements. Expenses net of all reductions represent the net expenses paid by the class.
I Amount represents less than $.001 per share.
See accompanying notes which are an integral part of the financial statements.
Semiannual Report
Financial Highlights - Class B
| Six months ended
June 30, 2012 | Years ended December 31, |
| (Unaudited) | 2011 | 2010 | 2009 | 2008 | 2007 |
Selected Per-Share Data | | | | | |
Net asset value, beginning of period | $ 10.82 | $ 10.61 | $ 10.64 | $ 10.35 | $ 10.32 | $ 10.20 |
Income from Investment Operations | | | | | | |
Net investment income (loss) E | .050 | .128 | .139 | .186 | .230 | .228 |
Net realized and unrealized gain (loss) | .042 | .226 | (.026) | .293 | .029 | .121 |
Total from investment operations | .092 | .354 | .113 | .479 | .259 | .349 |
Distributions from net investment income | (.042) | (.136) | (.139) | (.189) | (.230) | (.229) |
Distributions from net realized gain | - | (.008) | (.004) | - | - | - |
Total distributions | (.042) | (.144) | (.143) | (.189) | (.230) | (.229) |
Redemption fees added to paid in capital E | - I | - I | - I | - I | .001 | - I |
Net asset value, end of period | $ 10.87 | $ 10.82 | $ 10.61 | $ 10.64 | $ 10.35 | $ 10.32 |
Total Return B, C, D | .85% | 3.36% | 1.06% | 4.66% | 2.54% | 3.47% |
Ratios to Average Net Assets F, H | | | | | |
Expenses before reductions | 1.45% A | 1.43% | 1.44% | 1.46% | 1.43% | 1.41% |
Expenses net of fee waivers, if any | 1.45% A | 1.42% | 1.43% | 1.43% | 1.43% | 1.41% |
Expenses net of all reductions | 1.44% A | 1.42% | 1.42% | 1.43% | 1.40% | 1.36% |
Net investment income (loss) | .92% A | 1.19% | 1.30% | 1.77% | 2.22% | 2.23% |
Supplemental Data | | | | | |
Net assets, end of period (in millions) | $ 1 | $ 2 | $ 2 | $ 3 | $ 2 | $ 1 |
Portfolio turnover rate G | 24% A | 22% | 15% | 8% | 20% | 23% |
A Annualized
B Total returns for periods of less than one year are not annualized.
C Total returns would have been lower if certain expenses had not been reduced during the applicable periods shown.
D Total returns do not include the effect of the contingent deferred sales charge.
E Calculated based on average shares outstanding during the period.
F Fees and expenses of any underlying Fidelity Central Funds are not included in the Fund's expense ratio. The Fund indirectly bears its proportionate share of the expenses of any underlying Fidelity Central Funds.
G Amount does not include the portfolio activity of any underlying Fidelity Central Funds.
H Expense ratios reflect operating expenses of the class. Expenses before reductions do not reflect amounts reimbursed by the investment adviser or reductions from brokerage service arrangements or reductions from other expense offset arrangements and do not represent the amount paid by the class during periods when reimbursements or reductions occur. Expenses net of fee waivers reflect expenses after reimbursement by the investment adviser but prior to reductions from brokerage service arrangements or other expense offset arrangements. Expenses net of all reductions represent the net expenses paid by the class.
I Amount represents less than $.001 per share.
See accompanying notes which are an integral part of the financial statements.
Semiannual Report
Financial Highlights - Class C
| Six months ended June 30, 2012 | Years ended December 31, |
| (Unaudited) | 2011 | 2010 | 2009 | 2008 | 2007 |
Selected Per-Share Data | | | | | |
Net asset value, beginning of period | $ 10.81 | $ 10.60 | $ 10.63 | $ 10.33 | $ 10.31 | $ 10.19 |
Income from Investment Operations | | | | | | |
Net investment income (loss) E | .045 | .117 | .129 | .175 | .220 | .219 |
Net realized and unrealized gain (loss) | .032 | .226 | (.026) | .303 | .020 | .120 |
Total from investment operations | .077 | .343 | .103 | .478 | .240 | .339 |
Distributions from net investment income | (.037) | (.125) | (.129) | (.178) | (.221) | (.219) |
Distributions from net realized gain | - | (.008) | (.004) | - | - | - |
Total distributions | (.037) | (.133) | (.133) | (.178) | (.221) | (.219) |
Redemption fees added to paid in capital E | - I | - I | - I | - I | .001 | - I |
Net asset value, end of period | $ 10.85 | $ 10.81 | $ 10.60 | $ 10.63 | $ 10.33 | $ 10.31 |
Total Return B, C, D | .71% | 3.25% | .96% | 4.66% | 2.35% | 3.37% |
Ratios to Average Net Assets F, H | | | | | |
Expenses before reductions | 1.54% A | 1.53% | 1.52% | 1.53% | 1.50% | 1.51% |
Expenses net of fee waivers, if any | 1.54% A | 1.53% | 1.52% | 1.53% | 1.50% | 1.51% |
Expenses net of all reductions | 1.54% A | 1.52% | 1.52% | 1.53% | 1.48% | 1.45% |
Net investment income (loss) | .83% A | 1.09% | 1.20% | 1.67% | 2.14% | 2.14% |
Supplemental Data | | | | | |
Net assets, end of period (in millions) | $ 88 | $ 79 | $ 77 | $ 56 | $ 20 | $ 6 |
Portfolio turnover rate G | 24% A | 22% | 15% | 8% | 20% | 23% |
A Annualized
B Total returns for periods of less than one year are not annualized.
C Total returns would have been lower if certain expenses had not been reduced during the applicable periods shown.
D Total returns do not include the effect of the contingent deferred sales charge.
E Calculated based on average shares outstanding during the period.
F Fees and expenses of any underlying Fidelity Central Funds are not included in the Fund's expense ratio. The Fund indirectly bears its proportionate share of the expenses of any underlying Fidelity Central Funds.
G Amount does not include the portfolio activity of any underlying Fidelity Central Funds.
H Expense ratios reflect operating expenses of the class. Expenses before reductions do not reflect amounts reimbursed by the investment adviser or reductions from brokerage service arrangements or reductions from other expense offset arrangements and do not represent the amount paid by the class during periods when reimbursements or reductions occur. Expenses net of fee waivers reflect expenses after reimbursement by the investment adviser but prior to reductions from brokerage service arrangements or other expense offset arrangements. Expenses net of all reductions represent the net expenses paid by the class.
I Amount represents less than $.001 per share.
See accompanying notes which are an integral part of the financial statements.
Semiannual Report
Financial Highlights - Short-Intermediate Municipal Income
| Six months ended
June 30, 2012 | Years ended December 31, |
| (Unaudited) | 2011 | 2010 | 2009 | 2008 | 2007 |
Selected Per-Share Data | | | | | |
Net asset value, beginning of period | $ 10.81 | $ 10.60 | $ 10.63 | $ 10.34 | $ 10.31 | $ 10.19 |
Income from Investment Operations | | | | | | |
Net investment income (loss) D | .102 | .228 | .240 | .284 | .326 | .323 |
Net realized and unrealized gain (loss) | .042 | .227 | (.026) | .293 | .029 | .120 |
Total from investment operations | .144 | .455 | .214 | .577 | .355 | .443 |
Distributions from net investment income | (.094) | (.237) | (.240) | (.287) | (.326) | (.323) |
Distributions from net realized gain | - | (.008) | (.004) | - | - | - |
Total distributions | (.094) | (.245) | (.244) | (.287) | (.326) | (.323) |
Redemption fees added to paid in capital D | - H | - H | - H | - H | .001 | - H |
Net asset value, end of period | $ 10.86 | $ 10.81 | $ 10.60 | $ 10.63 | $ 10.34 | $ 10.31 |
Total Return B, C | 1.34% | 4.34% | 2.02% | 5.64% | 3.50% | 4.43% |
Ratios to Average Net Assets E, G | | | | | |
Expenses before reductions | .48% A | .48% | .48% | .50% | .49% | .49% |
Expenses net of fee waivers, if any | .48% A | .48% | .48% | .50% | .49% | .49% |
Expenses net of all reductions | .48% A | .48% | .48% | .50% | .47% | .43% |
Net investment income (loss) | 1.89% A | 2.14% | 2.24% | 2.69% | 3.15% | 3.17% |
Supplemental Data | | | | | |
Net assets, end of period (in millions) | $ 3,623 | $ 3,523 | $ 3,456 | $ 3,153 | $ 1,870 | $ 1,650 |
Portfolio turnover rate F | 24% A | 22% | 15% | 8% | 20% | 23% |
A Annualized
B Total returns for periods of less than one year are not annualized.
C Total returns would have been lower if certain expenses had not been reduced during the applicable periods shown.
D Calculated based on average shares outstanding during the period.
E Fees and expenses of any underlying Fidelity Central Funds are not included in the Fund's expense ratio. The Fund indirectly bears its proportionate share of the expenses of any underlying Fidelity Central Funds.
F Amount does not include the portfolio activity of any underlying Fidelity Central Funds.
G Expense ratios reflect operating expenses of the class. Expenses before reductions do not reflect amounts reimbursed by the investment adviser or reductions from brokerage service arrangements or reductions from other expense offset arrangements and do not represent the amount paid by the class during periods when reimbursements or reductions occur. Expenses net of fee waivers reflect expenses after reimbursement by the investment adviser but prior to reductions from brokerage service arrangements or other expense offset arrangements. Expenses net of all reductions represent the net expenses paid by the class.
H Amount represents less than $.001 per share.
See accompanying notes which are an integral part of the financial statements.
Semiannual Report
Financial Highlights - Institutional Class
| Six months ended
June 30, 2012 | Years ended December 31, |
| (Unaudited) | 2011 | 2010 | 2009 | 2008 | 2007 |
Selected Per-Share Data | | | | | |
Net asset value, beginning of period | $ 10.81 | $ 10.61 | $ 10.63 | $ 10.34 | $ 10.32 | $ 10.20 |
Income from Investment Operations | | | | | | |
Net investment income (loss) D | .099 | .224 | .235 | .281 | .321 | .320 |
Net realized and unrealized gain (loss) | .042 | .216 | (.015) | .293 | .022 | .120 |
Total from investment operations | .141 | .440 | .220 | .574 | .343 | .440 |
Distributions from net investment income | (.091) | (.232) | (.236) | (.284) | (.324) | (.320) |
Distributions from net realized gain | - | (.008) | (.004) | - | - | - |
Total distributions | (.091) | (.240) | (.240) | (.284) | (.324) | (.320) |
Redemption fees added to paid in capital D | - H | - H | - H | - H | .001 | - H |
Net asset value, end of period | $ 10.86 | $ 10.81 | $ 10.61 | $ 10.63 | $ 10.34 | $ 10.32 |
Total Return B, C | 1.31% | 4.19% | 2.07% | 5.61% | 3.38% | 4.39% |
Ratios to Average Net Assets E, G | | | | | |
Expenses before reductions | .53% A | .52% | .53% | .55% | .51% | .52% |
Expenses net of fee waivers, if any | .53% A | .52% | .53% | .53% | .51% | .52% |
Expenses net of all reductions | .53% A | .52% | .52% | .53% | .49% | .45% |
Net investment income (loss) | 1.84% A | 2.09% | 2.20% | 2.66% | 3.13% | 3.14% |
Supplemental Data | | | | | |
Net assets, end of period (in millions) | $ 198 | $ 152 | $ 142 | $ 92 | $ 32 | $ 5 |
Portfolio turnover rate F | 24% A | 22% | 15% | 8% | 20% | 23% |
A Annualized
B Total returns for periods of less than one year are not annualized.
C Total returns would have been lower if certain expenses had not been reduced during the applicable periods shown.
D Calculated based on average shares outstanding during the period.
E Fees and expenses of any underlying Fidelity Central Funds are not included in the Fund's expense ratio. The Fund indirectly bears its proportionate share of the expenses of any underlying Fidelity Central Funds.
F Amount does not include the portfolio activity of any underlying Fidelity Central Funds.
G Expense ratios reflect operating expenses of the class. Expenses before reductions do not reflect amounts reimbursed by the investment adviser or reductions from brokerage service arrangements or reductions from other expense offset arrangements and do not represent the amount paid by the class during periods when reimbursements or reductions occur. Expenses net of fee waivers reflect expenses after reimbursement by the investment adviser but prior to reductions from brokerage service arrangements or other expense offset arrangements. Expenses net of all reductions represent the net expenses paid by the class.
H Amount represents less than $.001 per share.
See accompanying notes which are an integral part of the financial statements.
Semiannual Report
Notes to Financial Statements
For the period ended June 30, 2012 (Unaudited)
(Amounts in thousands except percentages)
1. Organization.
Fidelity® Short-Intermediate Municipal Income Fund (the Fund) is a fund of Fidelity Municipal Trust (the Trust) and is authorized to issue an unlimited number of shares. The Trust is registered under the Investment Company Act of 1940, as amended (the 1940 Act), as an open-end management investment company organized as a Massachusetts business trust. The Fund offers Class A, Class T, Class C, Short-Intermediate Municipal Income and Institutional Class shares, each of which, along with Class B shares, has equal rights as to assets and voting privileges. Effective after the close of business on September 1, 2010, Class B shares were closed to new accounts and additional purchases, except for exchanges and reinvestments. Each class has exclusive voting rights with respect to matters that affect that class. Class B shares will automatically convert to Class A shares after a holding period of four years from the initial date of purchase. Investment income, realized and unrealized capital gains and losses, the common expenses of the Fund, and certain fund-level expense reductions, if any, are allocated on a pro-rata basis to each class based on the relative net assets of each class to the total net assets of the Fund. Each class differs with respect to transfer agent and distribution and service plan fees incurred. Certain expense reductions may also differ by class.
2. Investments in Fidelity Central Funds.
The Fund invests in Fidelity Central Funds, which are open-end investment companies available only to other investment companies and accounts managed by Fidelity Management & Research Company (FMR) and its affiliates. The Fund's Schedule of Investments lists each of the Fidelity Central Funds held as of period end, if any, as an investment of the Fund, but does not include the underlying holdings of each Fidelity Central Fund. As an Investing Fund, the Fund indirectly bears its proportionate share of the expenses of the underlying Fidelity Central Funds.
The Money Market Central Funds seek preservation of capital and current income and are managed by Fidelity Investments Money Management, Inc. (FIMM), an affiliate of FMR.
A complete unaudited list of holdings for each Fidelity Central Fund is available upon request or at the Securities and Exchange Commission (the SEC) web site at www.sec.gov. In addition, the financial statements of the Fidelity Central Funds are available on the SEC web site or upon request.
3. Significant Accounting Policies.
The financial statements have been prepared in conformity with accounting principles generally accepted in the United States of America (GAAP), which require management to make certain estimates and assumptions at the date of the financial statements.
Semiannual Report
Notes to Financial Statements (Unaudited) - continued
(Amounts in thousands except percentages)
3. Significant Accounting Policies - continued
Actual results could differ from those estimates. Subsequent events, if any, through the date that the financial statements were issued have been evaluated in the preparation of the financial statements. The following summarizes the significant accounting policies of the Fund:
Security Valuation. Investments are valued as of 4:00 p.m. Eastern time on the last calendar day of the period. In accordance with valuation policies and procedures approved by the Board of Trustees (the Board), the Fund attempts to obtain prices from one or more third party pricing vendor or broker to value its investments. When current market prices, quotations or rates are not readily available or reliable, securities will be fair valued in good faith by the FMR Fair Value Committee (the Committee), in accordance with procedures adopted by the Board. Factors used in determining fair value vary by security type and may include market or security specific events, changes in interest rates and credit quality. The frequency with which these procedures are used cannot be predicted and they may be utilized to a significant extent. The Committee oversees the Fund's valuation policies and procedures and is responsible for approving and reporting to the Board all fair value determinations.
The Fund categorizes the inputs to valuation techniques used to value its investments into a disclosure hierarchy consisting of three levels as shown below:
Level 1 - quoted prices in active markets for identical investments
Level 2 - other significant observable inputs (including quoted prices for similar investments, interest rates, prepayment speeds, etc.)
Level 3 - unobservable inputs (including the Fund's own assumptions based on the best information available)
Valuation techniques used to value the Fund's investments by major category are as follows:
Debt securities, including restricted securities, are valued based on evaluated prices received from third party pricing vendors or from brokers who make markets in such securities. For municipal securities, pricing vendors utilize matrix pricing which considers yield or price of bonds of comparable quality, coupon, maturity and type as well as broker-supplied prices and are generally categorized as Level 2 in the hierarchy. When independent prices are unavailable or unreliable, debt securities may be valued utilizing pricing methodologies which consider similar factors that would be used by third party pricing vendors. These are generally categorized as Level 2 in the hierarchy but may be Level 3 depending on the circumstances.
Semiannual Report
3. Significant Accounting Policies - continued
Security Valuation - continued
Investments in open-end mutual funds, including the Fidelity Central Funds, are valued at their closing net asset value each business day and are categorized as Level 1 in the hierarchy.
Changes in valuation techniques may result in transfers in or out of an assigned level within the disclosure hierarchy. The aggregate value of investments by input level, as of June 30, 2012 for the Fund's investments, is included at the end of Fund's Schedule of Investments.
Investment Transactions and Income. For financial reporting purposes, the Fund's investment holdings and NAV include trades executed through the end of the last business day of the period. The NAV per share for processing shareholder transactions is calculated as of the close of business of the New York Stock Exchange (NYSE), normally 4:00 p.m. Eastern time and includes trades executed through the end of the prior business day. Gains and losses on securities sold are determined on the basis of identified cost. Interest income and distributions from the Fidelity Central Funds are accrued as earned. Interest income includes coupon interest and amortization of premium and accretion of discount on debt securities.
Expenses. Expenses directly attributable to a fund are charged to that fund. Expenses attributable to more than one fund are allocated among the respective funds on the basis of relative net assets or other appropriate methods. Expense estimates are accrued in the period to which they relate and adjustments are made when actual amounts are known.
Income Tax Information and Distributions to Shareholders. Each year, the Fund intends to qualify as a regulated investment company under Subchapter M of the Internal Revenue Code, including distributing substantially all of its taxable income and realized gains. As a result, no provision for income taxes is required. The Fund files a U.S. federal tax return, in addition to state and local tax returns as required. A fund's federal income tax returns are subject to examination by the Internal Revenue Service (IRS) for a period of three fiscal years after they are filed. State and local tax returns may be subject to examination for an additional fiscal year depending on the jurisdiction.
Dividends are declared and recorded daily and paid monthly from net investment income. Distributions from realized gains, if any, are declared and recorded on the ex-dividend date. Income dividends and capital gain distributions are declared separately for each class. Income and capital gain distributions are determined in accordance with income tax regulations, which may differ from GAAP.
Semiannual Report
Notes to Financial Statements (Unaudited) - continued
(Amounts in thousands except percentages)
3. Significant Accounting Policies - continued
Income Tax Information and Distributions to Shareholders - continued
Capital accounts within the financial statements are adjusted for permanent book-tax differences. These adjustments have no impact on net assets or the results of operations. Temporary book-tax differences will reverse in a subsequent period.
Book-tax differences are primarily due to market discount and deferred trustees compensation.
The Fund purchases municipal securities whose interest, in the opinion of the issuer, is free from federal income tax. There is no assurance that the IRS will agree with this opinion. In the event the IRS determines that the issuer does not comply with relevant tax requirements, interest payments from a security could become federally taxable, possibly retroactively to the date the security was issued.
The federal tax cost of investment securities and unrealized appreciation (depreciation) as of period end were as follows:
Gross unrealized appreciation | $ 149,454 |
Gross unrealized depreciation | (2,136) |
Net unrealized appreciation (depreciation) on securities and other investments | $ 147,318 |
| |
Tax cost | $ 3,806,021 |
Short-Term Trading (Redemption) Fees. Shares held by investors in the Fund less than 30 days are subject to a redemption fee equal to .50% of the net asset value of shares redeemed. All redemption fees, which reduce the proceeds of the shareholder redemption, are retained by the Fund and accounted for as an addition to paid in capital.
4. Operating Policies.
Delayed Delivery Transactions and When-Issued Securities. During the period, the Fund transacted in securities on a delayed delivery or when-issued basis. Payment and delivery may take place after the customary settlement period for that security. The price of the underlying securities and the date when the securities will be delivered and paid for are fixed at the time the transaction is negotiated. The securities purchased on a delayed delivery or when-issued basis are identified as such in the Fund's Schedule of Investments. The Fund may receive compensation for interest forgone in the purchase of a delayed delivery or when-issued security. With respect to purchase commitments, the Fund identifies securities as segregated in its records with a value at least equal to the amount of the commitment. Losses may arise due to changes in the value of the
Semiannual Report
4. Operating Policies - continued
Delayed Delivery Transactions and When-Issued Securities - continued
underlying securities or if the counterparty does not perform under the contract's terms, or if the issuer does not issue the securities due to political, economic, or other factors.
5. Purchases and Sales of Investments.
Purchases and sales of securities, other than short-term securities, aggregated $497,798 and $427,553, respectively.
6. Fees and Other Transactions with Affiliates.
Management Fee. FMR and its affiliates provide the Fund with investment management related services for which the Fund pays a monthly management fee. The management fee is the sum of an individual fund fee rate that is based on an annual rate of .25% of the Fund's average net assets and an annualized group fee rate that averaged .12% during the period. The group fee rate is based upon the average net assets of all the mutual funds advised by FMR. The group fee rate decreases as assets under management increase and increases as assets under management decrease. For the period, the total annualized management fee rate was .37% of the Fund's average net assets.
Distribution and Service Plan Fees. In accordance with Rule 12b-1 of the 1940 Act, the Fund has adopted separate Distribution and Service Plans for each class of shares. Certain classes pay Fidelity Distributors Corporation (FDC), an affiliate of FMR, separate Distribution and Service Fees, each of which is based on an annual percentage of each class' average net assets. In addition, FDC may pay financial intermediaries for selling shares of the Fund and providing shareholder support services. For the period, the Distribution and Service Fee rates, total fees and amounts retained by FDC were as follows:
| Distribution
Fee | Service
Fee | Total Fees | Retained
by FDC |
Class A | -% | .25% | $ 456 | $ 29 |
Class T | -% | .25% | 34 | 1 |
Class B | .65% | .25% | 7 | 5 |
Class C | .75% | .25% | 422 | 139 |
| | | $ 919 | $ 174 |
Sales Load. FDC may receive a front-end sales charge of up to 2.75% for selling Class A shares and Class T shares, some of which is paid to financial intermediaries for selling shares of the Fund. Depending on the holding period, FDC may receive contingent deferred sales charges levied on Class A, Class T, Class B, and Class C redemptions. The deferred sales charges range from 3.00% to 1.00% for Class B shares, 1.00% for Class C
Semiannual Report
Notes to Financial Statements (Unaudited) - continued
(Amounts in thousands except percentages)
6. Fees and Other Transactions with Affiliates - continued
Sales Load - continued
shares, .75% or .50% for certain purchases of Class A shares and .25% for certain purchases of Class T shares.
For the period, sales charge amounts retained by FDC were as follows:
| Retained
by FDC |
Class A | $ 23 |
Class T | 5 |
Class B* | 1 |
Class C* | 11 |
| $ 40 |
* When Class B and Class C shares are initially sold, FDC pays commissions from its own resources to financial intermediaries through which the sales are made.
Transfer Agent and Accounting Fees. Citibank, N.A. (Citibank) is the custodian, transfer agent, and servicing agent for the Fund's Class A, Class T, Class B, Class C, Short-Intermediate Municipal Income and Institutional Class shares. Citibank has entered into a sub-arrangement with Fidelity Investments Institutional Operations Company, Inc. (FIIOC), an affiliate of FMR, with respect to all classes of the Fund, to perform the transfer agency, dividend disbursing, and shareholder servicing functions. FIIOC receives account fees and asset-based fees that vary according to the account size and type of account of the shareholders of the respective classes of the Fund. All fees are paid to FIIOC by Citibank, which is reimbursed by each class for such payments. FIIOC pays for typesetting, printing and mailing of shareholder reports, except proxy statements. For the period, transfer agent fees for each class were as follows:
| Amount | % of
Average
Net Assets* |
Class A | $ 276 | .15 |
Class T | 17 | .13 |
Class B | 1 | .15 |
Class C | 61 | .14 |
Short-Intermediate Municipal Income | 1,599 | .09 |
Institutional Class | 121 | .14 |
| $ 2,075 | |
* Annualized
Citibank also has a sub-arrangement with Fidelity Service Company, Inc. (FSC), an affiliate of FMR, under which FSC maintains the Fund's accounting records. The fee is based on the level of average net assets for the month.
Semiannual Report
7. Committed Line of Credit.
The Fund participates with other funds managed by FMR or an affiliate in a $4.25 billion credit facility (the "line of credit") to be utilized for temporary or emergency purposes to fund shareholder redemptions or for other short-term liquidity purposes. The Fund has agreed to pay commitment fees on its pro-rata portion of the line of credit, which amounted to $6 and is reflected in Miscellaneous expenses on the Statement of Operations. During the period, there were no borrowings on this line of credit.
8. Expense Reductions.
Through arrangements with the Fund's custodian, credits realized as a result of uninvested cash balances were used to reduce the Fund's expenses. During the period, these credits reduced the Fund's custody and accounting expenses by $22 and $108, respectively.
9. Distributions to Shareholders.
Distributions to shareholders of each class were as follows:
| Six months ended
June 30,
2012 | Year ended
December 31,
2011 |
From net investment income | | |
Class A | $ 2,581 | $ 4,211 |
Class T | 194 | 467 |
Class B | 6 | 27 |
Class C | 284 | 838 |
Short-Intermediate Municipal Income | 31,361 | 74,599 |
Institutional Class | 1,464 | 3,021 |
Total | $ 35,890 | $ 83,163 |
From net realized gain | | |
Class A | $ - | $ 216 |
Class T | - | 19 |
Class B | - | 1 |
Class C | - | 57 |
Short-Intermediate Municipal Income | - | 2,565 |
Institutional Class | - | 107 |
Total | $ - | $ 2,965 |
Semiannual Report
Notes to Financial Statements (Unaudited) - continued
(Amounts in thousands except percentages)
10. Share Transactions.
Transactions for each class of shares were as follows:
| Shares | Dollars |
| Six months ended
June 30,
2012 | Year ended
December 31,
2011 | Six months ended
June 30,
2012 | Year ended
December 31,
2011 |
Class A | | | | |
Shares sold | 14,034 | 22,096 | $ 152,609 | $ 237,519 |
Reinvestment of distributions | 191 | 303 | 2,077 | 3,252 |
Shares redeemed | (11,623) | (10,223) | (126,290) | (109,361) |
Net increase (decrease) | 2,602 | 12,176 | $ 28,396 | $ 131,410 |
Class T | | | | |
Shares sold | 349 | 881 | $ 3,775 | $ 9,442 |
Reinvestment of distributions | 15 | 35 | 159 | 373 |
Shares redeemed | (439) | (774) | (4,761) | (8,240) |
Net increase (decrease) | (75) | 142 | $ (827) | $ 1,575 |
Class B | | | | |
Shares sold | 15 | 27 | $ 171 | $ 297 |
Reinvestment of distributions | 1 | 2 | 4 | 19 |
Shares redeemed | (31) | (114) | (341) | (1,225) |
Net increase (decrease) | (15) | (85) | $ (166) | $ (909) |
Class C | | | | |
Shares sold | 1,738 | 2,509 | $ 18,857 | $ 26,904 |
Reinvestment of distributions | 20 | 62 | 219 | 661 |
Shares redeemed | (889) | (2,549) | (9,639) | (27,188) |
Net increase (decrease) | 869 | 22 | $ 9,437 | $ 377 |
Short-Intermediate Municipal Income | | | | |
Shares sold | 51,847 | 106,091 | $ 562,542 | $ 1,133,522 |
Reinvestment of distributions | 2,085 | 5,180 | 22,636 | 55,411 |
Shares redeemed | (46,093) | (111,332) | (500,105) | (1,186,447) |
Net increase (decrease) | 7,839 | (61) | $ 85,073 | $ 2,486 |
Institutional Class | | | | |
Shares sold | 8,229 | 8,223 | $ 89,360 | $ 87,964 |
Reinvestment of distributions | 69 | 115 | 754 | 1,228 |
Shares redeemed | (4,137) | (7,651) | (44,906) | (81,705) |
Net increase (decrease) | 4,161 | 687 | $ 45,208 | $ 7,487 |
11. Other.
The Fund's organizational documents provide former and current trustees and officers with a limited indemnification against liabilities arising in connection with the performance of their duties to the Fund. In the normal course of business, the Fund may also enter into contracts that provide general indemnifications. The Fund's maximum
Semiannual Report
11. Other - continued
exposure under these arrangements is unknown as this would be dependent on future claims that may be made against the Fund. The risk of material loss from such claims is considered remote.
Semiannual Report
Investment Adviser
Fidelity Management & Research Company
Boston, MA
Investment Sub-Adviser
Fidelity Investments Money
Management, Inc.
Fidelity Management & Research
(U.K.) Inc.
Fidelity Management & Research
(Hong Kong) Limited
Fidelity Management & Research
(Japan) Inc.
General Distributor
Fidelity Distributors Corporation
Smithfield, RI
Transfer and Service Agents
Citibank, N.A.
New York, NY
Fidelity Investments Institutional
Operations Company, Inc.
Boston, MA
Fidelity Service Company, Inc.
Boston, MA
Custodian
Citibank, N.A.
New York, NY
The Fidelity Telephone Connection
Mutual Fund 24-Hour Service
Exchanges/Redemptions
and Account Assistance 1-800-544-6666
Product Information 1-800-544-6666
Retirement Accounts 1-800-544-4774
(8 a.m. - 9 p.m.)
TDD Service 1-800-544-0118
for the deaf and hearing impaired
(9 a.m. - 9 p.m. Eastern time)
Fidelity Automated Service
Telephone (FAST®) 1-800-544-5555
Automated line for quickest service
STM-USAN-0812
1.787790.109
(Fidelity Investment logo)(registered trademark)
Corporate Headquarters
82 Devonshire St., Boston, MA 02109
www.fidelity.com
(Fidelity Investment logo)(registered trademark)
Fidelity Advisor®
Short-Intermediate
Municipal Income
Fund - Class A, Class T, Class B
and Class C
Semiannual Report
June 30, 2012
(Fidelity Cover Art)
Class A, Class T, Class B,
and Class C are classes of
Fidelity® Short-Intermediate
Municipal Income Fund
Contents
Shareholder Expense Example | (Click Here) | An example of shareholder expenses. |
Investment Changes | (Click Here) | A summary of major shifts in the fund's investments over the past six months. |
Investments | (Click Here) | A complete list of the fund's investments with their market values. |
Financial Statements | (Click Here) | Statements of assets and liabilities, operations, and changes in net assets, as well as financial highlights. |
Notes | (Click Here) | Notes to the financial statements. |
To view a fund's proxy voting guidelines and proxy voting record for the 12-month period ended June 30, visit http://www.fidelity.com/proxyvotingresults or visit the Securities and Exchange Commission's (SEC) web site at http://www.sec.gov. You may also call 1-877-208-0098 to request a free copy of the proxy voting guidelines.
Standard & Poor's, S&P and S&P 500 are registered service marks of The McGraw-Hill Companies, Inc. and have been licensed for use by Fidelity Distributors Corporation.
Other third party marks appearing herein are the property of their respective owners.
All other marks appearing herein are registered or unregistered trademarks or service marks of FMR LLC or an affiliated company. © 2012 FMR LLC. All rights reserved.
This report and the financial statements contained herein are submitted for the general information of the shareholders of the fund. This report is not authorized for distribution to prospective investors in the fund unless preceded or accompanied by an effective prospectus.
A fund files its complete schedule of portfolio holdings with the SEC for the first and third quarters of each fiscal year on Form N-Q. Forms N-Q are available on the SEC's web site at http://www.sec.gov. A fund's Forms N-Q may be reviewed and copied at the SEC's Public Reference Room in Washington, DC. Information regarding the operation of the SEC's Public Reference Room may be obtained by calling 1-800-SEC-0330. For a complete list of a fund's portfolio holdings, view the most recent holdings listing, semiannual report, or annual report on Fidelity's web site at http://www.fidelity.com, http://www.advisor.fidelity.com, or www.401k.com as applicable.
NOT FDIC INSURED • MAY LOSE VALUE • NO BANK GUARANTEE
Neither the fund nor Fidelity Distributors Corporation is a bank.
Semiannual Report
Shareholder Expense Example
As a shareholder of the Fund, you incur two types of costs: (1) transaction costs, including sales charges (loads) on purchase payments or redemption proceeds, redemption fees and (2) ongoing costs, including management fees, distribution and/or service (12b-1) fees and other Fund expenses. This Example is intended to help you understand your ongoing costs (in dollars) of investing in the Fund and to compare these costs with the ongoing costs of investing in other mutual funds.
The Example is based on an investment of $1,000 invested at the beginning of the period and held for the entire period (January 1, 2012 to June 30, 2012).
Actual Expenses
The first line of the accompanying table for each class of the Fund provides information about actual account values and actual expenses. You may use the information in this line, together with the amount you invested, to estimate the expenses that you paid over the period. Simply divide your account value by $1,000.00 (for example, an $8,600 account value divided by $1,000.00 = 8.6), then multiply the result by the number in the first line for a class of the Fund under the heading entitled "Expenses Paid During Period" to estimate the expenses you paid on your account during this period. A small balance maintenance fee of $12.00 that is charged once a year may apply for certain accounts with a value of less than $2,000. This fee is not included in the table below. If it was, the estimate of expenses you paid during the period would be higher, and your ending account value lower, by this amount. In addition, the Fund, as a shareholder in the underlying Fidelity Central Funds, will indirectly bear its pro-rata share of the fees and expenses incurred by the underlying Fidelity Central Funds. These fees and expenses are not included in the Fund's annualized expense ratio used to calculate the expense estimate in the table below.
Hypothetical Example for Comparison Purposes
The second line of the accompanying table for each class of the Fund provides information about hypothetical account values and hypothetical expenses based on a Class' actual expense ratio and an assumed rate of return of 5% per year before expenses, which is not the Class' actual return. The hypothetical account values and expenses may not be used to estimate the actual ending account balance or expenses you paid for the period. You may use this information to compare the ongoing costs of investing in the Fund and other funds. To do so, compare this 5% hypothetical example with the 5% hypothetical examples that appear in the shareholder reports of the other funds. A small balance maintenance fee of $12.00 that is charged once a year may apply for certain accounts with a value of less than $2,000. This fee is not included in the table below. If it was, the estimate of expenses you paid during the period would be higher, and your ending account value lower, by this amount. In addition, the Fund, as a shareholder in the underlying Fidelity Central Funds, will indirectly bear its pro-rata share of the fees and expenses incurred by the underlying Fidelity Central Funds. These fees and expenses are not included in the Fund's annualized expense ratio used to calculate the expense estimate in the table below.
Please note that the expenses shown in the table are meant to highlight your ongoing costs only and do not reflect any transaction costs. Therefore, the second line of the table is useful in comparing ongoing costs only, and will not help you determine the relative total costs of owning different funds. In addition, if these transactional costs were included, your costs would have been higher.
Semiannual Report
Shareholder Expense Example - continued
| Annualized
Expense Ratio | Beginning
Account Value
January 1, 2012 | Ending
Account Value
June 30, 2012 | Expenses Paid
During Period*
January 1, 2012
to June 30, 2012 |
Class A | .80% | | | |
Actual | | $ 1,000.00 | $ 1,010.80 | $ 4.00 |
HypotheticalA | | $ 1,000.00 | $ 1,020.89 | $ 4.02 |
Class T | .77% | | | |
Actual | | $ 1,000.00 | $ 1,011.00 | $ 3.85 |
HypotheticalA | | $ 1,000.00 | $ 1,021.03 | $ 3.87 |
Class B | 1.45% | | | |
Actual | | $ 1,000.00 | $ 1,008.50 | $ 7.24 |
HypotheticalA | | $ 1,000.00 | $ 1,017.65 | $ 7.27 |
Class C | 1.54% | | | |
Actual | | $ 1,000.00 | $ 1,007.10 | $ 7.69 |
HypotheticalA | | $ 1,000.00 | $ 1,017.21 | $ 7.72 |
Short-Intermediate Municipal Income | .48% | | | |
Actual | | $ 1,000.00 | $ 1,013.40 | $ 2.40 |
HypotheticalA | | $ 1,000.00 | $ 1,022.48 | $ 2.41 |
Institutional Class | .53% | | | |
Actual | | $ 1,000.00 | $ 1,013.10 | $ 2.65 |
HypotheticalA | | $ 1,000.00 | $ 1,022.23 | $ 2.66 |
A 5% return per year before expenses
* Expenses are equal to each Class' annualized expense ratio, multiplied by the average account value over the period, multiplied by 182/366 (to reflect the one-half year period).
Semiannual Report
Investment Changes (Unaudited)
Top Five States as of June 30, 2012 |
| % of fund's
net assets | % of fund's net assets
6 months ago |
New York | 12.6 | 13.3 |
California | 11.4 | 10.6 |
Florida | 8.3 | 7.0 |
Illinois | 7.4 | 7.5 |
Texas | 5.5 | 5.7 |
Top Five Sectors as of June 30, 2012 |
| % of fund's
net assets | % of fund's net assets
6 months ago |
General Obligations | 32.1 | 34.0 |
Electric Utilities | 12.8 | 13.4 |
Special Tax | 11.1 | 10.5 |
Health Care | 8.6 | 9.8 |
Water & Sewer | 5.7 | 4.1 |
Weighted Average Maturity as of June 30, 2012 |
| | 6 months ago |
Years | 3.2 | 3.3 |
This is a weighted average of all the maturities of the securities held in a fund. Weighted Average Maturity (WAM) can be used as a measure of sensitivity to interest rate changes and market changes. Generally, the longer the maturity, the greater the sensitivity to such changes. WAM is based on the dollar-weighted average length of time until principal payments must be paid. Depending on the types of securities held in a fund, certain maturity shortening devices (e.g., demand features, interest rate resets, and call options) may be taken into account when calculating the WAM. |
Duration as of June 30, 2012 |
| | 6 months ago |
Years | 2.8 | 2.8 |
Duration estimates how much a bond fund's price will change with a change in comparable interest rates. If rates rise 1%, for example, a fund with a 5-year duration is likely to lose about 5% of its value. Other factors also can influence a bond fund's performance and share price. Accordingly, a bond fund's actual performance may differ from this example. Duration takes into account any call or put option embedded in the bonds. |
Quality Diversification (% of fund's net assets) |
As of June 30, 2012 | As of December 31, 2011 |
 | AAA 8.5% | |  | AAA 6.4% | |
 | AA,A 69.7% | | | AA,A 71.5% | |
 | BBB 4.2% | | | BBB 5.5% | |
 | BB and Below 0.1% | | | BB and Below 0.1% | |
 | Not Rated 1.6% | | | Not Rated 2.1% | |
 | Short-Term
Investments and
Net Other Assets 15.9% | | | Short-Term
Investments and
Net Other Assets 14.4% | |
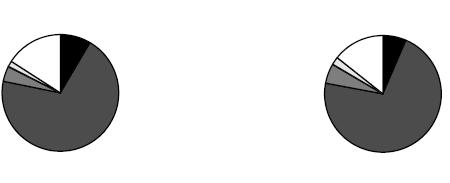
We have used ratings from Moody's Investors Service, Inc. Where Moody's® ratings are not available, we have used S&P® ratings. All ratings are as of the date indicated and do not reflect subsequent changes. |
Semiannual Report
Investments June 30, 2012 (Unaudited)
Showing Percentage of Net Assets
Municipal Bonds - 83.7% |
| Principal
Amount (000s) | | Value (000s) |
Alabama - 0.2% |
Jefferson County Swr. Rev. Series 2002 B, 5% 2/1/41 (Pre-Refunded to 8/1/12 @ 100) | | $ 2,070 | | $ 2,077 |
Mobile Indl. Dev. Board Poll. Cont. Rev. Bonds Series 2007 B, 4.875%, tender 3/19/13 (b) | | 2,615 | | 2,693 |
Pell City Spl. Care Facilities Rev. (Noland Health Svcs., Inc. Proj.) Series 2007 A, 5% 12/1/12 (Escrowed to Maturity) | | 750 | | 765 |
Univ. of Alabama at Birmingham Hosp. Rev. Series 2008 A, 5% 9/1/13 | | 1,175 | | 1,231 |
| | 6,766 |
Arizona - 3.4% |
Arizona Ctfs. of Partnership Series 2010 A: | | | | |
5% 10/1/14 (FSA Insured) | | 5,000 | | 5,415 |
5% 10/1/16 (FSA Insured) | | 13,000 | | 14,816 |
Arizona Health Facilities Auth. Rev. (Banner Health Sys. Proj.): | | | | |
Series 2008 A, 5% 1/1/13 | | 2,000 | | 2,045 |
Series 2008 D: | | | | |
5% 1/1/13 | | 3,250 | | 3,324 |
5% 1/1/14 | | 2,000 | | 2,130 |
Arizona School Facilities Board Ctfs. of Prtn.: | | | | |
Series 2004 B, 5.25% 9/1/15 (FSA Insured) | | 6,470 | | 6,985 |
Series 2005 A1, 5% 9/1/14 (Nat'l. Pub. Fin. Guarantee Corp. Insured) | | 2,000 | | 2,176 |
Series 2005 A2, 5% 9/1/16 (Nat'l. Pub. Fin. Guarantee Corp. Insured) | | 11,000 | | 12,171 |
Series 2008: | | | | |
5.5% 9/1/13 | | 18,780 | | 19,874 |
5.5% 9/1/16 | | 1,385 | | 1,603 |
Series A, 5% 9/1/12 (Nat'l. Pub. Fin. Guarantee Corp. Insured) | | 3,280 | | 3,304 |
Arizona Wtr. Infrastructure Fin. Auth. Rev. Series 2009 A: | | | | |
5% 10/1/18 | | 1,000 | | 1,225 |
5% 10/1/20 | | 5,180 | | 6,328 |
Coconino County Poll. Cont. Corp. Rev. Bonds (Arizona Pub. Svc. Co. Navajo Proj.) Series 2009 A, 5.5%, tender 6/1/14 (b) | | 6,000 | | 6,481 |
Maricopa County Poll. Cont. Rev. Bonds (Arizona Pub. Svc. Co. Palo Verde Proj.) Series 2009 A, 6%, tender 5/1/14 (b) | | 4,800 | | 5,211 |
Municipal Bonds - continued |
| Principal
Amount (000s) | | Value (000s) |
Arizona - continued |
Mesa Hwy. Proj. Advancement Series 2011 A: | | | | |
5% 7/1/17 | | $ 12,085 | | $ 13,429 |
5% 7/1/18 | | 5,200 | | 5,801 |
Navajo County Poll. Cont. Corp. Rev. Bonds (Arizona Pub. Svc. Co. Cholla Proj.) Series 2009 A, 1.25%, tender 5/30/14 (b) | | 2,800 | | 2,801 |
Phoenix Civic Impt. Corp. Excise Tax Rev. Series 2003 A, 5% 7/1/12 (Nat'l. Pub. Fin. Guarantee Corp. Insured) | | 750 | | 750 |
Phoenix Civic Impt. Corp. Wtr. Sys. Rev.: | | | | |
Series 2009 A, 5% 7/1/15 | | 5,835 | | 6,589 |
Series 2009 B, 5% 7/1/16 | | 5,090 | | 5,943 |
Pima County Swr. Sys. Rev. Series 2011 B, 5% 7/1/19 | | 3,225 | | 3,844 |
Tucson Gen. Oblig. Series 2005, 5% 7/1/16 (Nat'l. Pub. Fin. Guarantee Corp. Insured) | | 1,250 | | 1,404 |
Tucson Wtr. Rev. Series 2001 A, 5% 7/1/15 (Nat'l. Pub. Fin. Guarantee Corp. Insured) | | 1,645 | | 1,726 |
Univ. Med. Ctr. Corp. Hosp. Rev. Series 2011: | | | | |
5% 7/1/16 | | 3,055 | | 3,405 |
5% 7/1/17 | | 3,315 | | 3,735 |
5% 7/1/18 | | 3,365 | | 3,810 |
| | 146,325 |
California - 11.3% |
California Dept. of Wtr. Resources (Central Valley Proj.) Series AM, 5% 12/1/13 (a) | | 3,000 | | 3,095 |
California Dept. of Wtr. Resources Pwr. Supply Rev.: | | | | |
Series 2010 L, 5% 5/1/17 | | 12,000 | | 14,310 |
Series 2010 M, 5% 5/1/16 | | 8,000 | | 9,305 |
California Econ. Recovery: | | | | |
Bonds Series B, 5%, tender 7/1/14 (b) | | 5,000 | | 5,407 |
Series 2004 A, 5.25% 7/1/12 | | 6,010 | | 6,010 |
Series 2009 A: | | | | |
5% 7/1/15 | | 3,660 | | 3,971 |
5% 7/1/15 (Pre-Refunded to 7/1/14 @ 100) | | 2,540 | | 2,774 |
5.25% 7/1/13 (Escrowed to Maturity) | | 1,185 | | 1,243 |
5.25% 7/1/13 (Nat'l. Pub. Fin. Guarantee Corp. Insured) | | 1,255 | | 1,317 |
5.25% 7/1/14 | | 1,780 | | 1,948 |
5.25% 7/1/14 (Escrowed to Maturity) | | 520 | | 571 |
California Gen. Oblig.: | | | | |
5% 9/1/12 | | 1,700 | | 1,712 |
5% 10/1/12 | | 12,600 | | 12,739 |
5% 11/1/13 | | 9,060 | | 9,602 |
Municipal Bonds - continued |
| Principal
Amount (000s) | | Value (000s) |
California - continued |
California Gen. Oblig.: - continued | | | | |
5% 9/1/18 | | $ 7,500 | | $ 8,879 |
5% 9/1/19 | | 20,000 | | 23,878 |
5% 9/1/20 | | 20,000 | | 23,912 |
California Health Facilities Fing. Auth. Rev.: | | | | |
(Catholic Healthcare West Proj.) Series 2008 H, 5.125% 7/1/22 | | 2,495 | | 2,738 |
(Children's Hosp. of Orange County Proj.) Series 2009 A, 5% 11/1/13 | | 1,100 | | 1,152 |
(Sutter Health Proj.) Series 2008 A, 5% 8/15/12 | | 1,325 | | 1,332 |
Bonds: | | | | |
(Catholic Healthcare West Proj.): | | | | |
Series 2009 D, 5%, tender 7/1/14 (b) | | 2,900 | | 3,123 |
Series 2009 F, 5%, tender 7/1/14 (b) | | 3,200 | | 3,446 |
(St. Joseph Health Sys. Proj.) Series 2009 C, 5%, tender 10/16/14 (b) | | 4,300 | | 4,669 |
California Poll. Cont. Fing. Auth. Ctfs. of Prtn. (San Diego Gas & Elec. Co. Proj.) 5.9% 6/1/14 (Nat'l. Pub. Fin. Guarantee Corp. Insured) | | 34,000 | | 37,164 |
California Poll. Cont. Fing. Auth. Solid Waste Disp. Rev. Bonds (Waste Mgmt., Inc. Proj.) Series 2003 A, 5%, tender 5/1/13 (b)(e) | | 2,300 | | 2,375 |
California Pub. Works Board Lease Rev.: | | | | |
(Dept. of Corrections & Rehab. Proj.) Series 2011 C, 5% 10/1/18 | | 1,750 | | 2,050 |
(Univ. Proj.) Series 2011 B: | | | | |
5% 10/1/18 | | 2,740 | | 3,185 |
5% 10/1/19 | | 1,490 | | 1,726 |
(Various Cap. Projects) Series 2011 A: | | | | |
5% 10/1/18 | | 6,475 | | 7,584 |
5% 10/1/19 | | 5,000 | | 5,787 |
5% 10/1/20 | | 2,525 | | 2,931 |
(Various Cap. Projs.) Series 2012 A, 5% 4/1/21 | | 1,000 | | 1,152 |
(Various Judicial Council Projects) Series 2011 D, 5% 12/1/19 | | 4,100 | | 4,768 |
Series 2009 J, 5% 11/1/17 | | 2,300 | | 2,657 |
Series 2010 A: | | | | |
5% 3/1/16 | | 2,000 | | 2,236 |
5% 3/1/17 | | 5,405 | | 6,156 |
California State Univ. Rev. Series 2007 C, 5% 11/1/13 (FSA Insured) | | 1,335 | | 1,418 |
Municipal Bonds - continued |
| Principal
Amount (000s) | | Value (000s) |
California - continued |
California Statewide Cmntys. Dev. Auth. Rev.: | | | | |
(State of California Proposition 1A Receivables Prog.) Series 2009: | | | | |
4% 6/15/13 | | $ 1,000 | | $ 1,034 |
5% 6/15/13 | | 16,650 | | 17,381 |
Bonds: | | | | |
Series 2002 C, 5%, tender 5/1/17 (b) | | 4,000 | | 4,657 |
Series 2009 E2, 5%, tender 5/1/17 (b) | | 2,000 | | 2,328 |
East Bay Muni. Util. District Wtr. Sys. Rev. Bonds Series 2011 A2, 0.53%, tender 7/1/14 (b) | | 56,000 | | 56,033 |
Golden State Tobacco Securitization Corp. Tobacco Settlement Rev. Series 2003 B: | | | | |
5.5% 6/1/43 (Pre-Refunded to 6/1/13 @ 100) | | 2,000 | | 2,095 |
5.625% 6/1/38 (Pre-Refunded to 6/1/13 @ 100) | | 3,030 | | 3,177 |
Los Angeles County Metropolitan Trans. Auth. Sales Tax Rev.: | | | | |
Series 2009 A, 5% 7/1/13 | | 4,155 | | 4,351 |
Series 2009 B, 5% 7/1/17 | | 12,905 | | 15,495 |
Los Angeles County Pub. Works Fing. Auth. Lease Rev. Series 2010 A, 5% 8/1/17 | | 5,000 | | 5,738 |
Los Angeles Gen. Oblig. Series 2011 B, 5% 9/1/18 | | 20,960 | | 25,354 |
Los Angeles Muni. Impt. Corp. Lease Rev. Series 2012 C: | | | | |
4.625% 3/1/18 | | 1,500 | | 1,702 |
5% 3/1/19 | | 2,935 | | 3,396 |
Los Angeles Unified School District Series 2009 KRY, 5% 7/1/13 | | 10,740 | | 11,243 |
Los Angeles Unified School District Ctfs. of Prtn. (Multiple Properties Proj.) Series 2010 A: | | | | |
5% 12/1/16 | | 2,025 | | 2,328 |
5% 12/1/17 | | 9,790 | | 11,369 |
Los Angeles Wastewtr. Sys. Rev. Series 2009 A, 5% 6/1/15 | | 12,240 | | 13,812 |
Monterey County Pub. Impt. Corp. Ctfs. of Prtn. (Refing. Proj.) Series 2009, 5% 8/1/17 (FSA Insured) | | 2,130 | | 2,468 |
Newport Beach Rev. Bonds (Hoag Memorial Hosp. Presbyterian Proj.) Series 2009 E, 5%, tender 2/7/13 (b) | | 2,500 | | 2,564 |
Northern California Pwr. Agcy. Rev.: | | | | |
(Geothermal #3 Proj.) Series 2009 A: | | | | |
5% 7/1/13 | | 1,020 | | 1,065 |
5% 7/1/14 | | 1,120 | | 1,214 |
5% 7/1/15 | | 2,170 | | 2,430 |
Municipal Bonds - continued |
| Principal
Amount (000s) | | Value (000s) |
California - continued |
Northern California Pwr. Agcy. Rev.: - continued | | | | |
(Hydroelectric #1 Proj.) Series 2010 A: | | | | |
4% 7/1/15 | | $ 2,000 | | $ 2,181 |
5% 7/1/18 | | 2,000 | | 2,386 |
Poway Unified School District Pub. Fing. Auth. Lease Rev. Bonds Series 2008 B, 0%, tender 12/1/14 (FSA Insured) (b) | | 7,115 | | 6,875 |
Riverside County Asset Leasing Rev. (Riverside Cap. Proj.) Series 2012 A: | | | | |
4% 6/1/17 (a) | | 1,750 | | 1,932 |
5% 6/1/17 (a) | | 3,700 | | 4,257 |
5% 6/1/18 (a) | | 6,470 | | 7,491 |
Sacramento Muni. Util. District Elec. Rev. Series 2011 X, 5% 8/15/21 | | 4,000 | | 4,828 |
Sacramento Pwr. Auth. Cogeneration Proj. Rev. Series 2005 A, 5% 7/1/18 (AMBAC Insured) | | 2,890 | | 3,084 |
San Bernardino County Ctfs. of Prtn. (Arrowhead Proj.) Series 2009 A: | | | | |
5% 8/1/16 | | 5,450 | | 6,014 |
5% 8/1/18 | | 8,000 | | 8,995 |
San Diego Cmnty. College District Series 2007, 0% 8/1/16 (FSA Insured) | | 1,160 | | 1,113 |
San Diego Pub. Facilities Fing. Auth. Swr. Rev.: | | | | |
Series 2009 A: | | | | |
5% 5/15/13 | | 5,415 | | 5,635 |
5% 5/15/15 | | 1,845 | | 2,070 |
Series 2009 B, 5% 5/15/14 | | 7,000 | | 7,591 |
| | 484,008 |
Colorado - 0.2% |
Colorado Health Facilities Auth. Rev.: | | | | |
(Adventist Health Sys./Sunbelt Proj.) Series 2006 F: | | | | |
5% 11/15/12 | | 380 | | 386 |
5% 11/15/12 (Escrowed to Maturity) | | 845 | | 860 |
Bonds (Catholic Health Initiatives Proj.) Series 2008 C4, 4%, tender 11/12/15 (b) | | 4,200 | | 4,626 |
Univ. of Colorado Enterprise Sys. Rev. Series 2009 A, 5% 6/1/17 | | 500 | | 593 |
| | 6,465 |
Connecticut - 1.6% |
Connecticut Dev. Auth. Poll. Cont. Rev. Bonds Series 2011 A, 1.55%, tender 4/1/15 (b)(e) | | 4,300 | | 4,318 |
Municipal Bonds - continued |
| Principal
Amount (000s) | | Value (000s) |
Connecticut - continued |
Connecticut Gen. Oblig. (Econ. Recovery Proj.) Series 2009 A, 5% 1/1/15 | | $ 29,500 | | $ 32,702 |
Connecticut Health & Ed. Rev.: | | | | |
Bonds (Ascension Health Cr. Group Proj.) Series 1998 B, 1.55%, tender 2/1/17 (b) | | 2,700 | | 2,719 |
Series D, 4% 7/1/14 | | 1,000 | | 1,058 |
Connecticut Spl. Tax Oblig. Trans. Infrastructure Rev.: | | | | |
Series 1998 A, 5.5% 10/1/13 (Nat'l. Pub. Fin. Guarantee Corp. Insured) | | 4,300 | | 4,577 |
Series 2009 1: | | | | |
5% 2/1/14 | | 2,500 | | 2,677 |
5% 2/1/15 | | 11,995 | | 13,327 |
Series 2011 A, 5% 12/1/18 | | 5,575 | | 6,800 |
Hartford Gen. Oblig. Series A, 5% 8/15/12 (Assured Guaranty Corp. Insured) | | 1,000 | | 1,005 |
| | 69,183 |
District Of Columbia - 0.5% |
District of Columbia Gen. Oblig. Series 2007 B, 5% 6/1/16 (AMBAC Insured) | | 3,555 | | 4,094 |
District of Columbia Income Tax Rev. Series 2009 C, 5% 12/1/13 | | 5,500 | | 5,860 |
District of Columbia Rev. (Medlantic/Helix Proj.) Series 1998 C, 5% 8/15/15 (FSA Insured) | | 1,500 | | 1,636 |
District of Columbia Univ. Rev. Bonds (Georgetown Univ. Proj.) Series 2001 B, 4.7%, tender 4/1/18 (b) | | 8,500 | | 9,591 |
| | 21,181 |
Florida - 8.3% |
Alachua County Health Facilities Auth. Health Facilities Rev. (Shands Teaching Hospitals & Clinics, Inc. Proj.) Series 2010 B: | | | | |
5% 12/1/14 | | 4,000 | | 4,275 |
5% 12/1/15 | | 4,395 | | 4,794 |
Broward County Arpt. Sys. Rev. Series 2012 P1, 3% 10/1/13 (e) | | 4,000 | | 4,114 |
Broward County School Board Ctfs. of Prtn.: | | | | |
Series 2008 A, 5% 7/1/15 (FSA Insured) | | 5,495 | | 6,081 |
Series 2012 A: | | | | |
5% 7/1/19 | | 7,000 | | 8,165 |
5% 7/1/20 | | 15,070 | | 17,569 |
Citizens Property Ins. Corp.: | | | | |
Series 2010 A1, 5% 6/1/15 (FSA Insured) | | 14,000 | | 15,409 |
Municipal Bonds - continued |
| Principal
Amount (000s) | | Value (000s) |
Florida - continued |
Citizens Property Ins. Corp.: - continued | | | | |
Series 2010 A3, 1.93% 6/1/13 (b) | | $ 47,300 | | $ 47,694 |
Clay County Infrastructure Sales Surtax Rev. 5% 10/1/15 (Assured Guaranty Corp. Insured) | | 7,745 | | 8,516 |
Clearwater Wtr. and Swr. Rev.: | | | | |
Series 2009 B, 5% 12/1/14 | | 2,000 | | 2,191 |
Series 2011: | | | | |
4% 12/1/16 | | 1,265 | | 1,414 |
5% 12/1/17 | | 1,685 | | 1,974 |
5% 12/1/18 | | 685 | | 814 |
5% 12/1/19 | | 1,820 | | 2,180 |
5% 12/1/20 | | 1,000 | | 1,202 |
Collier County Indl. Dev. Auth. Healthcare Facilities Rev. (NCH Healthcare Sys. Proj.) Series 2011: | | | | |
5% 10/1/14 | | 1,355 | | 1,462 |
5% 10/1/16 | | 1,530 | | 1,724 |
5% 10/1/17 | | 1,455 | | 1,659 |
Escambia City Health Facilities Auth. Rev. (Ascension Health Cr. Group Proj.) Series 2003 A, 5.25% 11/15/13 | | 4,265 | | 4,545 |
Escambia County Solid Waste Disp. Rev. Bonds (Gulf Pwr. Co. Proj.) Series 2009, 1.35%, tender 6/2/15 (b) | | 1,900 | | 1,905 |
Florida Board of Ed. Series 2005 B, 5% 1/1/18 | | 21,080 | | 23,386 |
Florida Board of Ed. Lottery Rev. Series 2011 A, 5% 7/1/20 | | 8,600 | | 10,489 |
Florida Board of Ed. Pub. Ed. Cap. Outlay: | | | | |
Series 2009 C, 5% 6/1/20 | | 3,625 | | 4,455 |
Series 2009 D, 5.5% 6/1/16 | | 7,910 | | 9,370 |
Florida Gen. Oblig. (Dept. of Trans. Right-of-Way and Bridge Construction Proj.) Series 2005 B, 6.375% 7/1/13 | | 8,020 | | 8,505 |
Florida Hurricane Catastrophe Fund Fin. Corp. Rev. Series 2010 A, 5% 7/1/15 | | 20,000 | | 22,262 |
Greater Orlando Aviation Auth. Arpt. Facilities Rev. Series 2011 C: | | | | |
5% 10/1/19 | | 1,705 | | 2,052 |
5% 10/1/20 | | 1,000 | | 1,209 |
Highlands County Health Facilities Auth. Rev.: | | | | |
(Adventist Health Sys./Sunbelt, Inc. Prog.) Series 2009 E, 5% 11/15/15 | | 2,345 | | 2,633 |
Bonds (Adventist Health Sys./Sunbelt, Inc. Prog.): | | | | |
Series 2002, 3.95%, tender 9/1/12 (b) | | 16,650 | | 16,740 |
Series 2008 A, 6.1%, tender 11/14/13 (b) | | 1,000 | | 1,070 |
Municipal Bonds - continued |
| Principal
Amount (000s) | | Value (000s) |
Florida - continued |
Hillsborough County Indl. Dev. (H Lee Moffitt Cancer Ctr. Proj.) Series 2007 A, 5% 7/1/12 | | $ 1,310 | | $ 1,310 |
Hillsborough County Indl. Dev. Auth. Poll. Cont. Rev. Bonds (Tampa Elec. Co. Proj.) Series 2007 B, 5.15%, tender 9/1/13 (b) | | 1,750 | | 1,835 |
Indian River County Wtr. & Swr. Rev.: | | | | |
5% 9/1/15 | | 1,000 | | 1,116 |
5% 9/1/17 | | 1,000 | | 1,172 |
Jacksonville Elec. Auth. Elec. Sys. Rev. Series 2009 B, 5% 10/1/12 | | 7,350 | | 7,434 |
JEA Wtr. & Swr. Sys. Rev. Series 2010 D, 5% 10/1/21 | | 1,945 | | 2,357 |
Kissimmee Util. Auth. Elec. Sys. Rev.: | | | | |
Series 2003: | | | | |
5.25% 10/1/14 | | 775 | | 844 |
5.25% 10/1/15 | | 3,525 | | 3,958 |
Series 2011, 2% 10/1/12 | | 2,195 | | 2,204 |
Lakeland Hosp. Sys. Rev. Series 2011, 3% 11/15/12 | | 1,000 | | 1,005 |
Miami-Dade County Pub. Facilities Rev. (Jackson Health Sys. Proj.) Series 2005 B: | | | | |
5% 6/1/14 (Nat'l. Pub. Fin. Guarantee Corp. Insured) | | 4,790 | | 5,073 |
5% 6/1/19 (Nat'l. Pub. Fin. Guarantee Corp. Insured) | | 3,875 | | 4,188 |
Miami-Dade County Wtr. & Swr. Rev. Series 2008 A, 5% 10/1/14 (FSA Insured) | | 4,000 | | 4,365 |
North Brevard County Hosp. District Rev. (Parrish Med. Ctr. Proj.) Series 2008, 4.625% 10/1/12 | | 1,110 | | 1,119 |
Orange County Health Facilities Auth. (Orlando Health, Inc.) Series 2009: | | | | |
5% 10/1/15 | | 2,210 | | 2,443 |
5% 10/1/16 | | 1,000 | | 1,127 |
Orange County Health Facilities Auth. Rev.: | | | | |
(Adventist Health Sys. - Sunbelt Proj.) 5.625% 11/15/32 (Pre-Refunded to 11/15/12 @ 101) | | 2,500 | | 2,573 |
(Orlando Reg'l. Healthcare Sys. Proj.) Series 2008 A: | | | | |
5% 11/1/13 (FSA Insured) | | 1,000 | | 1,038 |
5% 11/1/15 (FSA Insured) | | 1,825 | | 2,027 |
Orlando & Orange County Expressway Auth. Rev. Series 2010 B, 5% 7/1/15 (FSA Insured) | | 1,430 | | 1,569 |
Orlando Utils. Commission Util. Sys. Rev.: | | | | |
Series 2009 C, 5% 10/1/17 | | 1,500 | | 1,786 |
Series 2010 C, 5% 10/1/17 | | 1,895 | | 2,256 |
Series 2011 B: | | | | |
5% 10/1/18 | | 2,250 | | 2,716 |
5% 10/1/19 | | 2,325 | | 2,842 |
Municipal Bonds - continued |
| Principal
Amount (000s) | | Value (000s) |
Florida - continued |
Pasco County Solid Waste Disp. & Resource Recovery Sys. Rev.: | | | | |
Series 2011: | | | | |
5% 10/1/17 (e) | | $ 4,465 | | $ 5,007 |
5% 10/1/19 (e) | | 2,025 | | 2,277 |
5% 10/1/18 (e) | | 2,745 | | 3,078 |
Polk County School District Sales Tax Rev. Series 2007, 5% 10/1/12 (FSA Insured) | | 6,080 | | 6,143 |
Sarasota County School Board Ctfs. of Prtn. (Master Lease Prog.): | | | | |
5% 7/1/13 | | 3,435 | | 3,589 |
5% 7/1/14 | | 2,000 | | 2,149 |
Tampa Bay Wtr. Reg'l. Wtr. Supply Auth. Util. Sys. Rev.: | | | | |
Series 2011 B, 5% 10/1/18 | | 4,700 | | 5,704 |
Series 2011, 5% 10/1/19 | | 5,590 | | 6,880 |
Tampa Health Sys. Rev. (Baycare Health Sys. Proj.) Series 2010: | | | | |
5% 11/15/16 | | 2,500 | | 2,896 |
5% 11/15/17 | | 1,500 | | 1,769 |
Tampa Solid Waste Sys. Rev. Series 2010: | | | | |
4% 10/1/14 (FSA Insured) (e) | | 3,000 | | 3,201 |
5% 10/1/15 (FSA Insured) (e) | | 2,920 | | 3,278 |
5% 10/1/16 (FSA Insured) (e) | | 6,000 | | 6,899 |
5% 10/1/17 (FSA Insured) (e) | | 5,000 | | 5,829 |
Titusville Wtr. & Swr. Rev. Series 2010, 5% 10/1/17 (Assured Guaranty Corp. Insured) | | 1,135 | | 1,318 |
| | 358,232 |
Georgia - 3.0% |
Appling County Dev. Auth. Poll. Cont. Rev. Bonds (Oglethorpe Pwr. Corp. Hatch Proj.) Series 2011 A, 2.5%, tender 3/1/13 (b) | | 5,000 | | 5,058 |
Atlanta Arpt. Rev. Series 2011 B, 5% 1/1/13 (e) | | 1,000 | | 1,021 |
Burke County Indl. Dev. Auth. Poll. Cont. Rev. Bonds: | | | | |
(Georgia Pwr. Co. Plant Vogtle Proj.): | | | | |
Fifth Series 1994, 2.3%, tender 4/1/14 (b) | | 8,000 | | 8,194 |
Fourth Series 1995: | | | | |
1.2%, tender 4/1/14 (b) | | 3,450 | | 3,474 |
1.2%, tender 4/1/14 (b) | | 4,800 | | 4,833 |
(Oglethorpe Pwr. Corp. Vogtle Proj.) Series 2011 A, 2.5%, tender 3/1/13 (b) | | 3,500 | | 3,541 |
Municipal Bonds - continued |
| Principal
Amount (000s) | | Value (000s) |
Georgia - continued |
Fulton County Facilities Corp. Ctfs. of Prtn. (Gen. Purp. Proj.) Series 2009: | | | | |
5% 11/1/12 | | $ 1,555 | | $ 1,577 |
5% 11/1/13 | | 7,550 | | 7,988 |
5% 11/1/14 | | 7,490 | | 8,098 |
Fulton County Wtr. & Swr. Rev. Series 2011: | | | | |
5% 1/1/19 | | 4,000 | | 4,821 |
5% 1/1/20 | | 4,000 | | 4,865 |
Main Street Natural Gas, Inc. Georgia Gas Proj. Rev. Series 2007 A, 5% 9/15/12 | | 1,195 | | 1,202 |
Monroe County Dev. Auth. Poll. Cont. Rev. Bonds: | | | | |
(Georgia Pwr. Co. Plant Scherer Proj.) First Series 1995, 0.8%, tender 7/1/14 (b) | | 17,900 | | 17,907 |
(Oglethorpe Pwr. Corp. Scherer Proj.) Series 2011 A, 2.5%, tender 3/1/13 (b) | | 11,500 | | 11,634 |
Muni. Elec. Auth. of Georgia: | | | | |
(Combined Cycle Proj.) Series A, 5% 11/1/18 | | 2,000 | | 2,383 |
(Proj. One): | | | | |
Series 2008 A: | | | | |
5% 1/1/13 | | 2,000 | | 2,044 |
5.25% 1/1/17 (Berkshire Hathaway Assurance Corp. Insured) | | 7,925 | | 9,305 |
Series 2008 D: | | | | |
5.75% 1/1/19 | | 14,890 | | 18,102 |
5.75% 1/1/20 | | 3,555 | | 4,317 |
Pub. Gas Partners, Inc. Rev. (Gas Supply Pool No. 1 Proj.) Series A, 5% 10/1/12 | | 1,000 | | 1,010 |
Richmond County Hosp. Auth. (Univ. Health Svcs., Inc. Proj.) Series 2009: | | | | |
5% 1/1/14 | | 1,305 | | 1,379 |
5% 1/1/15 | | 1,040 | | 1,126 |
5% 1/1/16 | | 2,415 | | 2,661 |
5% 1/1/18 | | 1,530 | | 1,716 |
| | 128,256 |
Hawaii - 0.7% |
Hawaii Arpts. Sys. Rev.: | | | | |
Series 2010 B, 5% 7/1/15 (e) | | 3,900 | | 4,340 |
Series 2011, 5% 7/1/19 (e) | | 4,000 | | 4,668 |
Hawaii Gen. Oblig.: | | | | |
Series DR: | | | | |
5% 6/1/16 | | 7,645 | | 8,884 |
5% 6/1/16 (Escrowed to Maturity) | | 2,895 | | 3,384 |
Municipal Bonds - continued |
| Principal
Amount (000s) | | Value (000s) |
Hawaii - continued |
Hawaii Gen. Oblig.: - continued | | | | |
Series DY: | | | | |
5% 2/1/15 | | $ 3,500 | | $ 3,894 |
5% 2/1/16 | | 4,000 | | 4,597 |
| | 29,767 |
Illinois - 7.4% |
Chicago Board of Ed. Series 2009 D: | | | | |
5% 12/1/17 (Assured Guaranty Corp. Insured) | | 4,115 | | 4,800 |
5% 12/1/18 (Assured Guaranty Corp. Insured) | | 2,335 | | 2,754 |
Chicago Gen. Oblig.: | | | | |
(City Colleges Proj.): | | | | |
Series 1999: | | | | |
0% 1/1/17 (Nat'l. Pub. Fin. Guarantee Corp. Insured) | | 7,200 | | 6,526 |
0% 1/1/18 (Nat'l. Pub. Fin. Guarantee Corp. Insured) | | 3,000 | | 2,608 |
0% 1/1/19 (Nat'l. Pub. Fin. Guarantee Corp. Insured) | | 9,805 | | 8,139 |
Series1999, 0% 1/1/20 (Nat'l. Pub. Fin. Guarantee Corp. Insured) | | 14,755 | | 11,616 |
Series 2012 B: | | | | |
5.125% 1/1/15 | | 995 | | 1,108 |
5.125% 1/1/15 (AMBAC Insured) | | 3,000 | | 3,269 |
Series A, 5% 1/1/17 (FSA Insured) | | 3,465 | | 3,920 |
Series B, 5% 1/1/17 (FSA Insured) | | 5,115 | | 5,792 |
Chicago Hsg. Auth. Rev. (Cap. Prog.) Series 2001, 5.5% 7/1/18 | | 2,850 | | 2,850 |
Chicago Midway Arpt. Rev. Bonds Series 2010 B, 5%, tender 1/1/15 (b) | | 5,000 | | 5,404 |
Chicago O'Hare Int'l. Arpt. Rev.: | | | | |
Series 2008 A, 5% 1/1/13 (FSA Insured) | | 4,000 | | 4,089 |
Series 2010 D, 5.25% 1/1/17 (e) | | 1,000 | | 1,155 |
Series 2010 E: | | | | |
5% 1/1/15 (e) | | 4,000 | | 4,382 |
5% 1/1/16 (e) | | 1,500 | | 1,688 |
Series 2011 B, 5% 1/1/18 | | 6,500 | | 7,564 |
Chicago Sales Tax Rev. Series 1998, 5.5% 1/1/16 (FGIC Insured) (FSA Insured) | | 1,710 | | 1,964 |
Chicago Transit Auth. Cap. Grant Receipts Rev.: | | | | |
(Fed. Transit Administration Section 5309 Proj.) Series 2008 A, 5% 6/1/13 | | 3,765 | | 3,900 |
5% 6/1/19 (Assured Guaranty Corp. Insured) | | 2,085 | | 2,329 |
Municipal Bonds - continued |
| Principal
Amount (000s) | | Value (000s) |
Illinois - continued |
Chicago Transit Auth. Cap. Grant Receipts Rev.: - continued | | | | |
5% 6/1/19 (Assured Guaranty Corp. Insured) (Pre-Refunded to 12/1/16 @ 100) | | $ 415 | | $ 492 |
Cook County Thorton Township High School District #205 5.5% 12/1/16 (Assured Guaranty Corp. Insured) | | 2,500 | | 2,935 |
Illinois Fin. Auth. Gas Supply Rev. Bonds (The Peoples Gas Lt. and Coke Co. Proj.): | | | | |
Series 2010 B, 2.625%, tender 8/1/15 (b) | | 9,500 | | 9,771 |
Series 2010, 2.125%, tender 7/1/14 (b) | | 11,500 | | 11,597 |
Illinois Fin. Auth. Hosp. Rev. (KishHealth Sys. Proj.) Series 2008, 5.25% 10/1/15 | | 2,220 | | 2,438 |
Illinois Fin. Auth. Rev.: | | | | |
(Advocate Health Care Proj.) Series 2010 D, 5% 4/1/15 | | 550 | | 611 |
(Northwest Cmnty. Hosp. Proj.) Series 2008 A: | | | | |
5% 7/1/12 | | 750 | | 750 |
5% 7/1/13 | | 415 | | 431 |
5% 7/1/15 | | 1,000 | | 1,100 |
(Palos Cmnty. Hosp. Proj.) Series 2010 C: | | | | |
5% 5/15/16 | | 2,060 | | 2,292 |
5% 5/15/17 | | 3,520 | | 3,958 |
(Provena Health Proj.) Series 2010 A: | | | | |
5% 5/1/13 | | 2,000 | | 2,069 |
5% 5/1/14 | | 2,000 | | 2,135 |
5.75% 5/1/19 | | 2,650 | | 3,141 |
(Rush Univ. Med. Ctr. Proj.) Series 2006 B: | | | | |
5% 11/1/15 (Nat'l. Pub. Fin. Guarantee Corp. Insured) | | 3,075 | | 3,380 |
5% 11/1/16 (Nat'l. Pub. Fin. Guarantee Corp. Insured) | | 1,700 | | 1,901 |
Bonds (Advocate Health Care Proj.) Series 2008 C B3, 4.375%, tender 7/1/14 (b) | | 4,000 | | 4,280 |
Illinois Gen. Oblig.: | | | | |
Series 1, 5.25% 8/1/12 (Escrowed to Maturity) | | 2,865 | | 2,876 |
Series 2002: | | | | |
5% 10/1/16 (Pre-Refunded to 10/1/12 @ 100) | | 3,515 | | 3,556 |
5.5% 8/1/15 (Nat'l. Pub. Fin. Guarantee Corp. Insured) | | 1,495 | | 1,657 |
Series 2003 A, 5.25% 10/1/13 (FSA Insured) | | 3,755 | | 3,973 |
Series 2004 B, 5% 3/1/14 | | 15,500 | | 16,462 |
Series 2004, 5% 11/1/16 | | 11,000 | | 12,360 |
Municipal Bonds - continued |
| Principal
Amount (000s) | | Value (000s) |
Illinois - continued |
Illinois Gen. Oblig.: - continued | | | | |
Series 2005: | | | | |
5% 4/1/13 (AMBAC Insured) | | $ 5,000 | | $ 5,161 |
5% 4/1/17 (AMBAC Insured) | | 8,050 | | 8,749 |
Series 2007 A, 5.5% 6/1/15 | | 1,000 | | 1,103 |
Series 2007 B, 5% 1/1/17 | | 9,835 | | 10,988 |
Series 2009 A, 3.5% 9/1/13 (Escrowed to Maturity) | | 3,000 | | 3,112 |
Series 2010: | | | | |
4% 1/1/13 | | 3,695 | | 3,756 |
5% 1/1/15 (FSA Insured) | | 20,000 | | 21,561 |
Series 2012: | | | | |
2% 2/1/13 | | 9,500 | | 9,575 |
3% 8/1/13 | | 4,800 | | 4,915 |
4% 3/1/14 | | 5,000 | | 5,229 |
5% 3/1/13 | | 5,000 | | 5,143 |
5% 3/1/19 | | 5,500 | | 6,209 |
Illinois Health Facilities Auth. Rev.: | | | | |
(Delnor-Cmnty. Hosp. Proj.) Series 2003 A: | | | | |
5% 5/15/15 (FSA Insured) | | 2,250 | | 2,467 |
5% 5/15/16 (FSA Insured) | | 2,325 | | 2,610 |
Series 2003 A, 5% 5/15/17 (FSA Insured) | | 2,150 | | 2,461 |
Illinois Sales Tax Rev.: | | | | |
Series 2009 B: | | | | |
4.5% 6/15/16 | | 5,000 | | 5,667 |
4.5% 6/15/17 | | 6,075 | | 6,990 |
Series 2010, 5% 6/15/15 | | 8,800 | | 9,865 |
Series 2011, 4% 6/15/13 | | 2,600 | | 2,688 |
Lake County Cmnty. Consolidated School District #73 Gen. Oblig.: | | | | |
0% 12/1/15 (Escrowed to Maturity) | | 580 | | 564 |
0% 12/1/15 (Nat'l. Pub. Fin. Guarantee Corp. Insured) | | 1,520 | | 1,412 |
Metropolitan Pier & Exposition: | | | | |
(McCormick Place Expansion Proj.) Series 1996 A, 0% 12/15/13 (Nat'l. Pub. Fin. Guarantee Corp. Insured) | | 2,725 | | 2,662 |
Series A, 0% 6/15/14 (Escrowed to Maturity) | | 8,625 | | 8,522 |
0% 6/15/14 (Nat'l. Pub. Fin. Guarantee Corp. Insured) | | 700 | | 673 |
Univ. of Illinois Rev. 0% 4/1/14 | | 2,350 | | 2,305 |
Will County Cmnty. Unit School District #365-U: | | | | |
0% 11/1/14 (Escrowed to Maturity) | | 1,025 | | 1,007 |
Municipal Bonds - continued |
| Principal
Amount (000s) | | Value (000s) |
Illinois - continued |
Will County Cmnty. Unit School District #365-U: - continued | | | | |
0% 11/1/14 (FSA Insured) | | $ 875 | | $ 849 |
0% 11/1/16 (Escrowed to Maturity) | | 740 | | 708 |
0% 11/1/16 (FSA Insured) | | 2,235 | | 2,064 |
| | 319,037 |
Indiana - 1.8% |
Indiana Fin. Auth. Health Sys. Rev. (Sisters of Saint Francis Health Svcs., Inc. Obligated Group Proj.) Series 2008 C, 5% 11/1/13 | | 3,000 | | 3,174 |
Indiana Fin. Auth. Hosp. Rev. (Parkview Health Sys. Oblig. Group Proj.) Series 2009 A: | | | | |
5% 5/1/14 | | 3,500 | | 3,742 |
5% 5/1/15 | | 6,420 | | 7,046 |
Indiana Fin. Auth. Rev.: | | | | |
(Trinity Health Cr. Group Proj.) Series 2009 A: | | | | |
5% 12/1/14 | | 1,250 | | 1,379 |
5% 12/1/15 | | 2,135 | | 2,423 |
(Wabash Valley Correctional Facilities Proj.) Series 2009 A, 5% 7/1/15 | | 8,025 | | 8,868 |
(Wabash Valley Correctional Facility Proj.) Series 2009 A, 5% 7/1/14 | | 2,500 | | 2,702 |
Series 2010 A, 5% 2/1/17 | | 2,800 | | 3,302 |
Indiana Health & Edl. Facilities Fing. Auth. Rev. Bonds (Ascension Health Sr. Cr. Group Proj.) Series 2006 B1, 4.1%, tender 11/3/16 (b) | | 4,000 | | 4,477 |
Indiana Health Facility Fing. Auth. Rev. Bonds (Ascension Health Cr. Group Proj.): | | | | |
Series 2001 A1, 1.5%, tender 8/1/14 (b) | | 3,400 | | 3,461 |
Series 2001 A2, 1.6%, tender 2/1/17 (b) | | 2,200 | | 2,200 |
Indiana Muni. Pwr. Agcy. Pwr. Supply Sys. Rev. Series 2011 A: | | | | |
5% 1/1/19 | | 1,470 | | 1,739 |
5% 1/1/20 | | 1,250 | | 1,486 |
Indianapolis Local Pub. Impt. Bond Bank (Wtrwks. Proj.): | | | | |
Series 2002 A, 5.5% 7/1/16 | | 5,000 | | 5,000 |
Series F, 5% 7/1/15 (Nat'l. Pub. Fin. Guarantee Corp. Insured) | | 515 | | 572 |
Indianapolis Thermal Energy Sys. Series 2010 B: | | | | |
5% 10/1/16 | | 5,000 | | 5,679 |
5% 10/1/17 | | 5,000 | | 5,788 |
Municipal Bonds - continued |
| Principal
Amount (000s) | | Value (000s) |
Indiana - continued |
Jasper County Indl. Poll. Ctl. Rev. (Northern Indiana Pub. Svc. Co. Proj.) Series 1988 B, 5.2% 6/1/13 (Nat'l. Pub. Fin. Guarantee Corp. Insured) | | $ 3,000 | | $ 3,107 |
Logansport High School Bldg. Corp. Series 2005, 5.25% 7/15/12 (Nat'l. Pub. Fin. Guarantee Corp. Insured) | | 1,075 | | 1,076 |
Muncie School Bldg. Corp. Series 2005, 5.25% 7/10/12 (Nat'l. Pub. Fin. Guarantee Corp. Insured) | | 1,585 | | 1,586 |
Purdue Univ. Rev.: | | | | |
(Student Facilities Sys. Proj.) Series 2009 B: | | | | |
4% 7/1/17 | | 500 | | 569 |
5% 7/1/15 | | 315 | | 354 |
5% 7/1/16 | | 500 | | 578 |
Series Z-1: | | | | |
5% 7/1/16 | | 1,215 | | 1,404 |
5% 7/1/17 | | 1,000 | | 1,181 |
5% 7/1/18 | | 1,500 | | 1,807 |
Univ. of Southern Indiana Rev. Series J: | | | | |
5% 10/1/14 (Assured Guaranty Corp. Insured) | | 1,985 | | 2,145 |
5% 10/1/15 (Assured Guaranty Corp. Insured) | | 1,000 | | 1,111 |
5% 10/1/16 (Assured Guaranty Corp. Insured) | | 1,165 | | 1,327 |
| | 79,283 |
Iowa - 0.0% |
Iowa Fin. Auth. Health Facilities Rev. Series 2005 A, 5% 2/15/16 (Assured Guaranty Corp. Insured) | | 1,700 | | 1,892 |
Kansas - 0.6% |
Kansas Dev. Fin. Agcy. (Adventist Health Sys./Sunbelt Obligated Group Proj.) Series 2009 D: | | | | |
5% 11/15/14 | | 575 | | 631 |
5% 11/15/15 | | 625 | | 703 |
5% 11/15/16 | | 875 | | 1,008 |
Kansas Dev. Fin. Auth. Health Facilities Rev. (Hays Med. Ctr. Proj.) Series 2005 L, 5.25% 11/15/12 | | 680 | | 690 |
Wichita Hosp. Facilities Rev.: | | | | |
(Via Christi Health Sys., Inc. Proj.) Series 2009 X, 5% 11/15/14 | | 2,000 | | 2,160 |
(Via Christi Health Sys., Inc. Proj.) Series 2009 III A: | | | | |
5% 11/15/14 | | 2,405 | | 2,598 |
5% 11/15/15 | | 6,245 | | 6,892 |
5% 11/15/16 | | 5,410 | | 6,113 |
Municipal Bonds - continued |
| Principal
Amount (000s) | | Value (000s) |
Kansas - continued |
Wichita Hosp. Facilities Rev.: - continued | | | | |
Series 2011 IV A: | | | | |
5% 11/15/18 | | $ 2,250 | | $ 2,599 |
5% 11/15/20 | | 2,745 | | 3,157 |
| | 26,551 |
Kentucky - 0.8% |
Ashland Med. Ctr. Rev. (Ashland Hosp. Corp. d/b/a/ King's Daughters Med. Ctr. Proj.) Series 2010 B: | | | | |
4% 2/1/14 | | 750 | | 783 |
4% 2/1/15 | | 1,495 | | 1,590 |
Jefferson County School District Fin. Corp. School Bldg. Rev. Series 2009 A, 5.25% 1/1/13 (FSA Insured) | | 2,170 | | 2,222 |
Kentucky Econ. Dev. Fin. Auth. Hosp. Rev. (Baptist Healthcare Sys. Proj.) Series A, 5% 8/15/15 | | 4,000 | | 4,432 |
Kentucky Econ. Dev. Fin. Auth. Rev. (Ashland Hosp. Corp. d/b/a/ King's Daughters Med. Ctr. Proj.) Series 2010 A, 4% 2/1/13 | | 500 | | 509 |
Kentucky State Property & Buildings Commission Rev. (#82 Proj.) 5.25% 10/1/17 (FSA Insured) | | 2,450 | | 2,918 |
Louisville/Jefferson County Metropolitan Govt. Poll. Cont. Rev. Bonds (Louisville Gas and Electronic Co. Proj.): | | | | |
Series 2003 A, 1.65%, tender 4/3/17 (b) | | 6,000 | | 6,000 |
Series 2005 A, 5.75%, tender 12/2/13 (b) | | 6,000 | | 6,415 |
Series 2007 B, 1.6%, tender 6/1/17 (b) | | 8,000 | | 7,985 |
| | 32,854 |
Louisiana - 0.2% |
Louisiana Pub. Facilities Auth. Rev.: | | | | |
(Christus Health Proj.) Series 2009 A: | | | | |
5% 7/1/13 | | 3,500 | | 3,638 |
5% 7/1/16 | | 2,000 | | 2,249 |
(Entergy Gulf States Louisiana LLC Proj.) Series 2010 B, 2.875% 11/1/15 | | 3,000 | | 3,071 |
Reg'l. Transit Auth. Louisiana Sales Tax Rev. 4% 12/1/16 (FSA Insured) | | 1,000 | | 1,108 |
| | 10,066 |
Maryland - 1.2% |
Maryland Gen. Oblig. Second Series B, 5.25% 8/15/16 | | 16,100 | | 19,128 |
Municipal Bonds - continued |
| Principal
Amount (000s) | | Value (000s) |
Maryland - continued |
Maryland Health & Higher Edl. Facilities Auth. Rev.: | | | | |
(Univ. of Maryland Med. Sys. Proj.) Series 2008 F: | | | | |
5% 7/1/13 | | $ 2,400 | | $ 2,492 |
5% 7/1/14 | | 3,500 | | 3,736 |
Bonds (Johns Hopkins Health Sys. Obligated Group Proj.) Series 2008 B, 5%, tender 5/15/15 (b) | | 2,225 | | 2,494 |
Montgomery County Gen. Oblig.: | | | | |
(Dept. of Liquor Cont. Proj.) Series 2009 A, 5% 4/1/15 | | 1,725 | | 1,923 |
Series 2011 A, 5% 7/1/20 | | 16,000 | | 19,691 |
| | 49,464 |
Massachusetts - 1.9% |
Braintree Gen. Oblig. Series 2009: | | | | |
5% 5/15/14 | | 1,000 | | 1,084 |
5% 5/15/16 | | 4,400 | | 5,136 |
Massachusetts Bay Trans. Auth. Sales Tax Rev. Series 2006 B, 5.25% 7/1/18 | | 2,300 | | 2,823 |
Massachusetts Dept. of Trans. Metropolitan Hwy. Sys. Rev. Series 2010 B, 5% 1/1/15 | | 12,400 | | 13,549 |
Massachusetts Dev. Fin. Agcy. Rev.: | | | | |
(Boston College Proj.): | | | | |
Series Q1: | | | | |
4% 7/1/15 | | 1,500 | | 1,636 |
4% 7/1/16 | | 1,000 | | 1,124 |
5% 7/1/13 | | 1,000 | | 1,046 |
Series Q2: | | | | |
4% 7/1/15 | | 1,170 | | 1,276 |
4% 7/1/16 | | 1,000 | | 1,124 |
5% 7/1/13 | | 1,100 | | 1,151 |
5% 7/1/14 | | 1,080 | | 1,169 |
5% 7/1/17 | | 1,370 | | 1,630 |
(Tufts Med. Ctr. Proj.) Series I: | | | | |
5% 1/1/14 | | 1,550 | | 1,630 |
5% 1/1/16 | | 1,300 | | 1,429 |
Massachusetts Gen. Oblig.: | | | | |
Series 2002 C: | | | | |
5% 11/1/21 (Pre-Refunded to 11/1/12 @ 100) | | 8,100 | | 8,226 |
5.25% 11/1/30 (Pre-Refunded to 11/1/12 @ 100) | | 2,495 | | 2,536 |
Series 2004 B, 5.25% 8/1/20 | | 12,700 | | 16,011 |
Massachusetts Health & Edl. Facilities Auth. Rev. Bonds (Baystate Health Sys. Proj.) Series 2009 K, 5%, tender 7/1/13 (b) | | 7,000 | | 7,253 |
Municipal Bonds - continued |
| Principal
Amount (000s) | | Value (000s) |
Massachusetts - continued |
Massachusetts Spl. Oblig. Rev. (Fed. Hwy. Grant Anticipation Note Prog.) Series 2003 A: | | | | |
5% 12/15/12 (FSA Insured) | | $ 3,300 | | $ 3,371 |
5% 12/15/13 (FSA Insured) | | 4,325 | | 4,615 |
Medford Gen. Oblig. Series 2011 B, 4% 3/1/19 | | 3,570 | | 4,010 |
| | 81,829 |
Michigan - 2.3% |
Big Rapids Pub. School District: | | | | |
5% 5/1/13 (Assured Guaranty Corp. Insured) | | 1,195 | | 1,240 |
5% 5/1/14 (Assured Guaranty Corp. Insured) | | 1,190 | | 1,281 |
Chelsea School District 5% 5/1/13 (Nat'l. Pub. Fin. Guarantee Corp. Insured) | | 1,750 | | 1,816 |
Detroit School District Series 2012 A: | | | | |
5% 5/1/19 | | 2,000 | | 2,328 |
5% 5/1/20 | | 2,000 | | 2,327 |
5% 5/1/21 | | 1,810 | | 2,113 |
Detroit Swr. Disp. Rev. Series 2006 D, 0.914% 7/1/32 (b) | | 4,075 | | 3,069 |
Grand Rapids Cmnty. College 5% 5/1/13 (FSA Insured) | | 1,305 | | 1,354 |
Grand Valley Michigan State Univ. Rev. Series 2009, 5% 12/1/16 | | 1,320 | | 1,513 |
Kalamazoo Pub. Schools 5% 5/1/13 (Assured Guaranty Corp. Insured) | | 2,940 | | 3,050 |
Kent Hosp. Fin. Auth. Hosp. Facilities Rev.: | | | | |
(Spectrum Health Sys. Proj.) Series 2011 A: | | | | |
5% 11/15/18 | | 1,250 | | 1,455 |
5% 11/15/19 | | 1,000 | | 1,166 |
Bonds (Spectrum Health Sys. Proj.) Series 2008 A, 5.25%, tender 1/15/14 (b) | | 2,200 | | 2,325 |
Michigan Gen. Oblig. (Envir. Protection Prog.) Series 1992, 6.25% 11/1/12 | | 675 | | 688 |
Michigan Hosp. Fin. Auth. Rev.: | | | | |
(McLaren Health Care Corp. Proj.) Series 2008 A, 5.25% 5/15/14 | | 4,160 | | 4,496 |
Bonds (Ascension Health Cr. Group Proj.) Series 1999 B3, 2%, tender 8/1/14 (b) | | 11,000 | | 11,312 |
Michigan Muni. Bond Auth. Rev.: | | | | |
(Clean Wtr. Pooled Proj.) Series 2010: | | | | |
5% 10/1/14 | | 6,045 | | 6,654 |
5% 10/1/15 | | 1,750 | | 1,992 |
5% 10/1/15 | | 3,250 | | 3,700 |
Municipal Bonds - continued |
| Principal
Amount (000s) | | Value (000s) |
Michigan - continued |
Michigan Muni. Bond Auth. Rev.: - continued | | | | |
(Local Govt. Ln. Prog.) Series 2009 C: | | | | |
5% 5/1/13 | | $ 1,645 | | $ 1,705 |
5% 5/1/14 | | 2,140 | | 2,303 |
5% 5/1/15 | | 1,845 | | 2,034 |
5% 5/1/16 | | 1,865 | | 2,113 |
Royal Oak Hosp. Fin. Auth. Hosp. Rev. (William Beaumont Hosp. Oblig. Group Proj.) Series 2009 W, 5% 8/1/15 | | 2,070 | | 2,232 |
Wayne County Arpt. Auth. Rev.: | | | | |
Series 2010 A, 5% 12/1/18 (e) | | 1,400 | | 1,558 |
Series 2011 A, 5% 12/1/19 (e) | | 22,700 | | 25,359 |
West Bloomfield School District 5% 5/1/15 (Assured Guaranty Corp. Insured) | | 1,400 | | 1,553 |
Western Michigan Univ. Rev.: | | | | |
5.25% 11/15/14 (Assured Guaranty Corp. Insured) | | 2,135 | | 2,345 |
5.25% 11/15/15 (Assured Guaranty Corp. Insured) | | 3,275 | | 3,713 |
| | 98,794 |
Minnesota - 0.3% |
Minneapolis & Saint Paul Metropolitan Arpts. Commission Arpt. Rev. Series 2008 A, 5% 1/1/13 (e) | | 1,000 | | 1,022 |
Minnesota 911 Rev. (Pub. Safety Radio Communications Sys. Proj.) Series 2009, 5% 6/1/14 (Assured Guaranty Corp. Insured) | | 2,225 | | 2,416 |
Minnesota Agric. & Econ. Dev. Board Rev. (Essentia Health Obligated Group Proj.) Series 2008 C1: | | | | |
5% 2/15/15 (Assured Guaranty Corp. Insured) | | 1,335 | | 1,459 |
5% 2/15/16 (Assured Guaranty Corp. Insured) | | 565 | | 634 |
Northern Muni. Pwr. Agcy. Elec. Sys. Rev. Series 2009 A, 5% 1/1/15 (Assured Guaranty Corp. Insured) | | 1,000 | | 1,102 |
Southern Minnesota Muni. Pwr. Agcy. Pwr. Supply Sys. Rev. Series 2009 A, 5% 1/1/16 | | 1,000 | | 1,141 |
Tobacco Securitization Auth. Series 2011 B, 5% 3/1/19 | | 5,900 | | 6,811 |
| | 14,585 |
Mississippi - 0.1% |
Mississippi Hsg. Fin. Corp. Single Family Mtg. Rev. Series 1983, 0% 6/1/15 (Escrowed to Maturity) | | 4,000 | | 3,917 |
Missouri - 0.0% |
Saint Louis Arpt. Rev. Series 2011 B, 3% 7/1/12 | | 1,000 | | 1,000 |
Municipal Bonds - continued |
| Principal
Amount (000s) | | Value (000s) |
Nebraska - 0.2% |
Nebraska Pub. Pwr. District Rev. Series C: | | | | |
4% 1/1/15 | | $ 2,360 | | $ 2,554 |
4% 1/1/16 | | 2,195 | | 2,431 |
Univ. of Nebraska Facilities Corp. Lease Rental Rev. (UNMC Health Professions Futures Proj.) Series 2009, 5% 8/15/13 | | 4,000 | | 4,208 |
| | 9,193 |
Nevada - 1.5% |
Clark County Arpt. Rev.: | | | | |
Series 2008 E: | | | | |
5% 7/1/14 | | 2,905 | | 3,127 |
5% 7/1/15 | | 3,500 | | 3,898 |
Series A1, 5% 7/1/12 (AMBAC Insured) (e) | | 2,000 | | 2,000 |
Clark County Fuel Tax Series 2008, 5% 6/1/13 (Escrowed to Maturity) | | 5,815 | | 6,065 |
Clark County School District: | | | | |
Series 1998, 5.5% 6/15/13 (FSA Insured) | | 5,000 | | 5,236 |
Series 2005 A, 5% 6/15/16 (Nat'l. Pub. Fin. Guarantee Corp. Insured) | | 21,215 | | 23,857 |
Nevada Dept. of Bus. & Industry (Waste Mgmt., Inc. Proj.) Series 2001, 2.75% 10/1/14 (e) | | 3,000 | | 3,104 |
Nevada Gen. Oblig.: | | | | |
Series 2010 C, 5% 6/1/19 | | 12,140 | | 14,617 |
Series 2012 B, 5% 8/1/20 | | 2,230 | | 2,706 |
| | 64,610 |
New Hampshire - 0.2% |
New Hampshire Health & Ed. Facilities Auth. Rev. Series 2011, 3% 10/1/12 | | 1,050 | | 1,055 |
New Hampshire Tpk. Sys. Rev. Series 2012 B: | | | | |
5% 2/1/17 (a) | | 3,000 | | 3,398 |
5% 2/1/18 (a) | | 2,500 | | 2,871 |
| | 7,324 |
New Jersey - 2.6% |
New Jersey Ctfs. of Prtn.: | | | | |
Series 2008 A, 5% 6/15/15 | | 750 | | 831 |
Series 2009 A: | | | | |
5% 6/15/15 | | 11,285 | | 12,501 |
5% 6/15/16 | | 6,500 | | 7,368 |
Municipal Bonds - continued |
| Principal
Amount (000s) | | Value (000s) |
New Jersey - continued |
New Jersey Econ. Dev. Auth. School Facilities Construction Rev.: | | | | |
Bonds Series 2008 J4, 5%, tender 9/1/14 (FSA Insured) (b) | | $ 7,000 | | $ 7,586 |
Series 2001 A, 5.5% 6/15/13 (Escrowed to Maturity) | | 1,090 | | 1,144 |
Series 2005 K, 5.25% 12/15/14 (FGIC Insured) (Nat'l. Pub. Fin. Guarantee Corp. Insured) | | 1,790 | | 1,978 |
Series 2005 O, 5% 3/1/20 (Pre-Refunded to 3/1/15 @ 100) | | 6,350 | | 7,106 |
Series 2008 W, 5% 3/1/15 | | 10,400 | | 11,511 |
Series 2009 BB, 5% 9/1/15 | | 3,390 | | 3,812 |
Series 2011 EE, 5% 9/1/20 | | 5,000 | | 5,970 |
Series 2012: | | | | |
5% 6/15/13 | | 2,000 | | 2,082 |
5% 6/15/18 | | 10,600 | | 11,993 |
New Jersey Gen. Oblig. Series H, 5.25% 7/1/15 (FSA Insured) | | 5,000 | | 5,678 |
New Jersey Higher Ed. Student Assistance Auth. Student Ln. Rev. Series 2010 1A, 5% 12/1/15 | | 4,500 | | 5,011 |
New Jersey Tpk. Auth. Tpk. Rev.: | | | | |
Bonds Series 2012 A, 0.93%, tender 12/22/14 (b) | | 15,400 | | 15,450 |
Series 1991 C, 6.5% 1/1/16 (Escrowed to Maturity) | | 3,315 | | 3,734 |
New Jersey Trans. Trust Fund Auth.: | | | | |
Series 2003 A, 5.5% 12/15/16 (FSA Insured) | | 5,000 | | 5,911 |
Series 2003 B. 5.25% 12/15/19 | | 3,000 | | 3,660 |
| | 113,326 |
New Mexico - 1.1% |
Farmington Poll. Cont. Rev. Bonds (Southern California Edison Co. Four Corners Proj.) Series 2005 B, 2.875%, tender 4/1/15 (b) | | 22,100 | | 22,924 |
New Mexico Edl. Assistance Foundation: | | | | |
Series 2009 B, 4% 9/1/16 | | 7,000 | | 7,714 |
Series 2010 A1: | | | | |
4% 12/1/15 | | 3,700 | | 4,033 |
4% 12/1/16 | | 6,750 | | 7,479 |
Rio Rancho Wtr. & Wastewtr. Sys. Rev. Series 2009, 5% 5/15/17 (FSA Insured) | | 4,480 | | 5,281 |
| | 47,431 |
New York - 12.3% |
Albany Indl. Dev. Agcy. Civic Facility Rev. (St. Peters Hosp. Proj.) Series 2008 A, 5.5% 11/15/12 | | 1,000 | | 1,019 |
Municipal Bonds - continued |
| Principal
Amount (000s) | | Value (000s) |
New York - continued |
Dutchess County Local Dev. Corp. Rev. (Health Quest Systems, Inc. Proj.) Series 2010 A: | | | | |
5% 7/1/18 (Assured Guaranty Corp. Insured) (FSA Insured) | | $ 1,100 | | $ 1,268 |
5% 7/1/19 (Assured Guaranty Corp. Insured) (FSA Insured) | | 640 | | 740 |
Long Island Pwr. Auth. Elec. Sys. Rev.: | | | | |
Series 2003 B, 5.25% 6/1/14 | | 2,000 | | 2,173 |
Series 2010 A, 5% 5/1/15 | | 5,000 | | 5,566 |
Metropolitan Trans. Auth. Svc. Contract Rev. Series 2002 A, 5.5% 7/1/17 | | 5,000 | | 6,038 |
New York City Gen. Oblig.: | | | | |
Series 1997 H, 6% 8/1/12 (Nat'l. Pub. Fin. Guarantee Corp. Insured) | | 1,000 | | 1,004 |
Series 2005 D, 5% 8/1/12 (Escrowed to Maturity) | | 4,925 | | 4,942 |
Series 2005 F1, 5% 9/1/15 | | 3,560 | | 4,031 |
Series 2008 E, 5% 8/1/12 | | 5,000 | | 5,017 |
Series 2009 C: | | | | |
5% 8/1/13 | | 6,445 | | 6,772 |
5% 8/1/13 (Escrowed to Maturity) | | 555 | | 583 |
Series B, 5% 8/1/14 | | 10,000 | | 10,937 |
Series C: | | | | |
5% 8/1/12 | | 14,450 | | 14,500 |
5% 8/1/12 (Escrowed to Maturity) | | 5,320 | | 5,338 |
Series G: | | | | |
5.625% 8/1/13 (Nat'l. Pub. Fin. Guarantee Corp. Insured) | | 3,805 | | 3,820 |
5.625% 8/1/13 (Pre-Refunded to 8/1/12 @ 100) | | 1,270 | | 1,275 |
Series K: | | | | |
5% 8/1/12 | | 2,335 | | 2,343 |
5% 8/1/12 (Escrowed to Maturity) | | 2,025 | | 2,032 |
New York City Transitional Fin. Auth. Rev.: | | | | |
Series 2003 B, 5% 2/1/20 | | 3,000 | | 3,693 |
Series 2010 B: | | | | |
5% 11/1/17 | | 30,000 | | 36,152 |
5% 11/1/20 | | 5,950 | | 7,269 |
Series 2010 D: | | | | |
5% 11/1/15 | | 8,300 | | 9,491 |
5% 11/1/17 | | 10,115 | | 12,189 |
Series 2012 A: | | | | |
5% 11/1/17 | | 7,000 | | 8,436 |
5% 11/1/20 | | 4,500 | | 5,585 |
Municipal Bonds - continued |
| Principal
Amount (000s) | | Value (000s) |
New York - continued |
New York City Transitional Fin. Auth. Rev.: - continued | | | | |
Series E, 4% 11/1/12 | | $ 6,790 | | $ 6,874 |
New York City Trust Cultural Resources Rev. Bonds (The Juilliard School Proj.) Series 2009 B, 2.75%, tender 7/1/12 (b) | | 5,500 | | 5,500 |
New York Dorm. Auth. Mental Health Svcs. Facilities Impt. Rev.: | | | | |
(State Univ. Proj.) Series 2012 A, 5% 5/15/20 | | 4,000 | | 4,875 |
Series 2012 A, 4% 5/15/20 | | 8,000 | | 9,140 |
New York Dorm. Auth. Personal Income Tax Rev.: | | | | |
(Ed. Proj.) Series 2009 A: | | | | |
5% 3/15/13 | | 3,545 | | 3,663 |
5% 3/15/14 | | 3,745 | | 4,038 |
5% 3/15/15 | | 4,000 | | 4,469 |
Series 2009 D: | | | | |
5% 6/15/14 | | 9,890 | | 10,772 |
5% 6/15/15 | | 16,075 | | 18,121 |
5% 6/15/16 | | 9,330 | | 10,876 |
Series 2010 A, 5% 2/15/14 (Escrowed to Maturity) | | 10 | | 11 |
Series A: | | | | |
5% 2/15/14 | | 9,840 | | 10,571 |
5% 2/15/15 | | 8,775 | | 9,774 |
5% 2/15/15 (Escrowed to Maturity) | | 5 | | 6 |
New York Dorm. Auth. Revs.: | | | | |
(City Univ. Sys. Consolidation Proj.) Series A: | | | | |
5.75% 7/1/13 | | 1,980 | | 2,024 |
5.75% 7/1/13 (AMBAC Insured) | | 570 | | 583 |
(Mental Health Svcs. Facilities Proj.): | | | | |
Series 2008 D: | | | | |
5% 2/15/14 | | 7,295 | | 7,814 |
5% 8/15/14 | | 7,755 | | 8,465 |
Series 2009 A1, 5% 2/15/15 | | 9,000 | | 9,980 |
(New York Univ. Hosp. Ctr. Proj.) Series 2011 A, 5% 7/1/18 | | 3,240 | | 3,887 |
(St. Lawrence Univ.) Series 2008, 5% 7/1/14 | | 3,700 | | 3,983 |
Series 2008 B, 5% 7/1/15 | | 30,000 | | 33,752 |
Series 2008 D, 5.25% 8/15/17 (FSA Insured) | | 7,000 | | 8,382 |
Series 2009 A: | | | | |
5% 7/1/15 | | 12,850 | | 14,457 |
5% 7/1/16 | | 8,390 | | 9,703 |
New York Local Govt. Assistance Corp. Series 2003 A, 5% 4/1/18 | | 12,400 | | 14,998 |
Municipal Bonds - continued |
| Principal
Amount (000s) | | Value (000s) |
New York - continued |
New York Metropolitan Trans. Auth. Dedicated Tax Fund Rev. Series B: | | | | |
5% 11/15/14 | | $ 1,350 | | $ 1,491 |
5% 11/15/15 | | 2,325 | | 2,654 |
New York Metropolitan Trans. Auth. Rev.: | | | | |
Bonds Series 2008 B2, 5%, tender 11/15/12 (b) | | 7,300 | | 7,416 |
Series 2003 B: | | | | |
5.25% 11/15/17 (Nat'l. Pub. Fin. Guarantee Corp. Insured) | | 1,040 | | 1,103 |
5.25% 11/15/19 (Nat'l. Pub. Fin. Guarantee Corp. Insured) | | 5,200 | | 6,324 |
Series 2010 B2, 4% 11/15/14 | | 2,830 | | 3,050 |
New York State Dorm. Auth. Lease Rev. Bonds Series 2003 B, 5.25%, tender 7/1/13 (b) | | 3,000 | | 3,140 |
New York State Energy Research & Dev. Auth. Facilities Rev. Bonds (Consolidated Edison Co. of New York, Inc. Proj.) Series 2010 A, 1.45%, tender 11/1/12 (b)(e) | | 26,400 | | 26,461 |
New York Thruway Auth. Second Gen. Hwy. & Bridge Trust Fund: | | | | |
Series 2008 A, 5% 4/1/13 | | 2,600 | | 2,691 |
Series 2010 A, 5% 4/1/17 | | 1,000 | | 1,181 |
Series 2011 A1: | | | | |
5% 4/1/17 | | 1,500 | | 1,771 |
5% 4/1/18 | | 3,500 | | 4,201 |
New York Urban Dev. Corp. Rev.: | | | | |
Series 2009 C: | | | | |
5% 12/15/15 | | 6,500 | | 7,452 |
5% 12/15/16 | | 17,000 | | 20,103 |
Series 2011 A, 5% 3/15/21 | | 18,425 | | 22,667 |
Niagara County Indl. Dev. Agcy. Solid Waste Disp. Rev. Bonds Series 2001 C, 5.625%, tender 11/15/14 (b)(e) | | 2,450 | | 2,469 |
Tobacco Settlement Asset Securitization Corp. Series 2002-1, 5.5% 7/15/24 (Pre-Refunded to 7/15/12 @ 100) | | 5,475 | | 5,483 |
Tobacco Settlement Fing. Corp. Series 2011, 5% 6/1/16 | | 20,000 | | 23,023 |
Triborough Bridge & Tunnel Auth. Revs. Series Y, 5.5% 1/1/17 (Escrowed to Maturity) | | 6,470 | | 7,186 |
| | 528,797 |
Municipal Bonds - continued |
| Principal
Amount (000s) | | Value (000s) |
New York & New Jersey - 0.1% |
Port Auth. of New York & New Jersey 124th Series, 5% 8/1/13 (Nat'l. Pub. Fin. Guarantee Corp. Insured) (e) | | $ 1,200 | | $ 1,204 |
Port Auth. of New York & New Jersey Spl. Oblig. Rev. (JFK Int'l. Air Term. Spl. Proj.) Series 6, 6.25% 12/1/13 (Nat'l. Pub. Fin. Guarantee Corp. Insured) (e) | | 4,100 | | 4,319 |
| | 5,523 |
Non State Specific - 0.0% |
Washington DC Metropolitan Transit Auth. Rev. Series 2009 A, 5% 7/1/14 | | 1,000 | | 1,082 |
North Carolina - 1.2% |
Dare County Ctfs. of Prtn. Series 2012 B: | | | | |
4% 6/1/17 | | 1,000 | | 1,127 |
4% 6/1/18 | | 1,280 | | 1,459 |
4% 6/1/20 | | 1,000 | | 1,149 |
5% 6/1/19 | | 1,305 | | 1,581 |
Mecklenburg County Pub. Facilities Corp. Series 2009: | | | | |
5% 3/1/16 | | 5,870 | | 6,768 |
5% 3/1/18 | | 1,500 | | 1,813 |
Nash Health Care Sys. Health Care Facilities Rev. Series 2003: | | | | |
5% 11/1/13 (FSA Insured) | | 1,500 | | 1,580 |
5% 11/1/15 (FSA Insured) | | 1,600 | | 1,745 |
North Carolina Eastern Muni. Pwr. Agcy. Pwr. Sys. Rev.: | | | | |
Series 2008 A, 5% 1/1/13 | | 2,200 | | 2,249 |
Series 2010 A: | | | | |
5% 1/1/15 | | 4,000 | | 4,399 |
5% 1/1/16 | | 6,035 | | 6,852 |
Series 2012 D, 5% 1/1/14 (a) | | 3,000 | | 3,155 |
North Carolina Grant Anticipation Rev. Series 2009, 5% 3/1/15 | | 1,250 | | 1,392 |
North Carolina Med. Care Commission Hosp. Rev. (North Carolina Baptist Hosp. Proj.) Series 2010: | | | | |
5% 6/1/15 | | 1,500 | | 1,682 |
5% 6/1/16 | | 1,000 | | 1,155 |
5% 6/1/17 | | 3,220 | | 3,793 |
5% 6/1/18 | | 3,820 | | 4,549 |
Municipal Bonds - continued |
| Principal
Amount (000s) | | Value (000s) |
North Carolina - continued |
North Carolina Muni. Pwr. Agcy. #1 Catawba Elec. Rev.: | | | | |
Series 1998 A, 5.5% 1/1/15 (Nat'l. Pub. Fin. Guarantee Corp. Insured) | | $ 3,675 | | $ 4,099 |
Series 2008 A, 5.25% 1/1/20 | | 2,000 | | 2,351 |
| | 52,898 |
North Dakota - 0.0% |
Grand Forks Health Care Sys. Rev. (Altru Health Sys. Proj.) Series 2005, 5% 12/1/15 (Assured Guaranty Corp. Insured) | | 1,825 | | 2,025 |
Ohio - 2.6% |
Buckeye Tobacco Settlement Fing. Auth. Series 2007 A1: | | | | |
5% 6/1/16 | | 3,035 | | 3,248 |
5% 6/1/17 | | 3,500 | | 3,754 |
Cincinnati City School District 5.25% 12/1/18 (Nat'l. Pub. Fin. Guarantee Corp. Insured) | | 3,555 | | 4,342 |
Columbus City School District (School Facilities Construction and Impt. Proj.) Series 2009 B, 4% 12/1/16 | | 1,000 | | 1,134 |
Hamilton County Student Hsg. Rev. (Stratford Heights Proj.) Series 2010: | | | | |
5% 6/1/15 (FSA Insured) | | 760 | | 829 |
5% 6/1/16 (FSA Insured) | | 1,105 | | 1,240 |
5% 6/1/17 (FSA Insured) | | 1,160 | | 1,319 |
Ohio Air Quality Dev. Auth. Rev. Bonds: | | | | |
(FirstEnergy Corp. Proj.) Series 2009 D, 4.75%, tender 8/1/12 (b) | | 5,400 | | 5,418 |
(FirstEnergy Nuclear Generation Corp. Proj.) Series 2008 C, 7.25%, tender 11/1/12 (b)(e) | | 9,000 | | 9,201 |
(Ohio Pwr. Co. Proj.) Series 2010 A, 3.25%, tender 6/2/14 (b) | | 5,500 | | 5,696 |
Ohio Bldg. Auth.: | | | | |
(Administrative Bldg. Fund Proj.): | | | | |
Series 2009 B: | | | | |
5% 10/1/14 | | 5,955 | | 6,510 |
5% 10/1/15 | | 6,505 | | 7,350 |
Series 2010 C: | | | | |
4% 10/1/15 | | 3,200 | | 3,514 |
5% 10/1/16 | | 1,250 | | 1,455 |
(Adult Correctional Bldg. Fund Proj.): | | | | |
Series 2009 B: | | | | |
5% 10/1/14 | | 2,055 | | 2,247 |
5% 10/1/15 | | 4,535 | | 5,124 |
Municipal Bonds - continued |
| Principal
Amount (000s) | | Value (000s) |
Ohio - continued |
Ohio Bldg. Auth.: - continued | | | | |
(Adult Correctional Bldg. Fund Proj.): | | | | |
Series 2010 A, 5% 10/1/15 | | $ 1,185 | | $ 1,339 |
Ohio Gen. Oblig.: | | | | |
(Common Schools Proj.) Series 2010 A, 5% 9/15/17 | | 2,600 | | 3,108 |
(Higher Ed. Proj.): | | | | |
Series 2005 C, 5% 8/1/13 | | 4,495 | | 4,720 |
Series 2010 A, 5% 8/1/17 | | 3,290 | | 3,921 |
Series 2011 A, 5% 8/1/17 | | 3,070 | | 3,659 |
Ohio Higher Edl. Facility Commission Rev.: | | | | |
(Cleveland Clinic Foundation Proj.) Series 2008 A, 5% 1/1/15 | | 2,000 | | 2,212 |
(Univ. Hosp. Health Sys. Proj.) Series 2010 A: | | | | |
5% 1/15/15 | | 500 | | 545 |
5% 1/15/17 | | 1,000 | | 1,135 |
Ohio State Univ. Gen. Receipts Series 2010 A, 5% 12/1/16 | | 5,000 | | 5,895 |
Ohio Wtr. Dev. Auth. Poll. Cont. Facilities Rev. Bonds: | | | | |
(First Energy Nuclear Generation Corp. Proj.) Series 2005 B, 3.375%, tender 7/1/15 (b) | | 5,000 | | 5,162 |
(FirstEnergy Corp. Proj.) Series 2009 A, 5.875%, tender 6/1/16 (b) | | 10,225 | | 11,509 |
Ross County Hosp. Facilities Rev. (Adena Health Sys. Proj.) Series 2008: | | | | |
5% 12/1/12 | | 1,950 | | 1,981 |
5% 12/1/13 | | 875 | | 923 |
5% 12/1/14 | | 2,275 | | 2,474 |
| | 110,964 |
Oklahoma - 0.3% |
Oklahoma Dev. Fin. Auth. (Pub. Svc. Co. of Oklahoma Proj.) Series 2009, 5.25% 6/1/14 | | 2,700 | | 2,895 |
Oklahoma Dev. Fin. Auth. Health Sys. Rev. (Integris Baptist Med. Ctr. Proj.) Series 2008 B, 5% 8/15/14 | | 1,660 | | 1,804 |
Tulsa County Indl. Auth. Edl. Facilities Lease Rev. (Jenks Pub. Schools Proj.) Series 2009, 5.5% 9/1/18 | | 5,215 | | 6,403 |
| | 11,102 |
Oregon - 0.3% |
Clackamas County Hosp. Facility Auth. Bonds (Legacy Health Sys. Proj.) Series 2009 C, 5%, tender 7/15/14 (b) | | 2,500 | | 2,684 |
Municipal Bonds - continued |
| Principal
Amount (000s) | | Value (000s) |
Oregon - continued |
Gilliam County Solid Waste Disp. Rev. Bonds (Waste Mgmt., Inc. Proj.) Series 2000 A, 3.5%, tender 5/1/13 (b)(e) | | $ 5,300 | | $ 5,408 |
Oregon Facilities Auth. Rev. (Legacy Health Sys. Proj.) Series 2009 A: | | | | |
5% 3/15/13 | | 1,000 | | 1,032 |
5% 3/15/14 | | 595 | | 635 |
5% 3/15/15 | | 2,500 | | 2,754 |
5% 3/15/16 | | 1,750 | | 1,982 |
| | 14,495 |
Pennsylvania - 4.2% |
Allegheny County Arpt. Auth. Rev. Series A: | | | | |
5% 1/1/14 (FSA Insured) (e) | | 1,350 | | 1,408 |
5% 1/1/15 (FSA Insured) (e) | | 1,000 | | 1,066 |
5% 1/1/16 (FSA Insured) (e) | | 1,000 | | 1,083 |
Allegheny County Hosp. Dev. Auth. Rev.: | | | | |
(Pittsburgh Med. Ctr. Proj.): | | | | |
Series 2008 A, 5% 9/1/12 | | 6,615 | | 6,663 |
Series 2008 B, 5% 6/15/14 | | 1,385 | | 1,498 |
(Univ. of Pittsburgh Med. Ctr. Proj.) Series 2009 A: | | | | |
4% 8/15/15 | | 1,385 | | 1,510 |
5% 8/15/14 | | 1,955 | | 2,128 |
Beaver County Indl. Dev. Auth. Poll. Cont. Rev. Bonds (FirstEnergy Nuclear Generation Corp. Proj.) Series 2005 A, 3.375%, tender 7/1/15 (b) | | 2,000 | | 2,065 |
Franklin County Indl. Dev. Auth. (The Chambersburg Hosp. Proj.) Series 2010: | | | | |
5% 7/1/16 | | 1,000 | | 1,113 |
5% 7/1/17 | | 1,255 | | 1,404 |
Montgomery County Indl. Dev. Series 2012 A, 3% 10/1/13 | | 1,650 | | 1,702 |
Montgomery County Higher Ed. & Health Auth. Hosp. Rev. (Abington Memorial Hosp. Proj.) Series 2009 A, 5% 6/1/17 | | 2,200 | | 2,484 |
Pennsylvania Econ. Dev. Auth. Governmental Lease (Forum Place Proj.) Series 2012: | | | | |
5% 3/1/18 | | 2,455 | | 2,838 |
5% 3/1/19 | | 2,310 | | 2,688 |
5% 3/1/20 | | 2,140 | | 2,502 |
Pennsylvania Gen. Oblig. Series 2011, 5% 7/1/21 | | 1,900 | | 2,381 |
Municipal Bonds - continued |
| Principal
Amount (000s) | | Value (000s) |
Pennsylvania - continued |
Pennsylvania Intergovernmental Coop. Auth. Spl. Tax Rev. (City of Philadelphia Fdg. Prog.) Series 2009, 5% 6/15/15 | | $ 10,600 | | $ 11,919 |
Pennsylvania Tpk. Commission Tpk. Rev. Series 2009 B, 5% 12/1/17 | | 12,500 | | 14,799 |
Philadelphia Gas Works Rev. (1998 Gen. Ordinance Proj.): | | | | |
Eighth Series A, 5% 8/1/15 | | 2,100 | | 2,335 |
Seventh Series, 5% 10/1/12 (AMBAC Insured) | | 1,000 | | 1,011 |
Philadelphia Gen. Oblig.: | | | | |
Series 2007 A, 5% 8/1/12 (FSA Insured) | | 5,000 | | 5,016 |
Series 2008 A: | | | | |
5% 12/15/14 (FSA Insured) | | 5,370 | | 5,875 |
5% 12/15/15 (FSA Insured) | | 5,000 | | 5,618 |
5% 12/15/16 (FSA Insured) | | 7,275 | | 8,383 |
Series 2011: | | | | |
4% 8/1/12 | | 4,325 | | 4,335 |
5.25% 8/1/17 | | 6,165 | | 7,095 |
5.25% 8/1/18 | | 5,515 | | 6,378 |
Philadelphia School District Series 2010 C, 5% 9/1/16 | | 13,610 | | 15,230 |
Philadelphia Wtr. & Wastewtr. Rev. Series 2010 A: | | | | |
5% 6/15/15 | | 15,000 | | 16,635 |
5% 6/15/16 | | 6,000 | | 6,843 |
Pittsburgh & Allegheny County Sports & Exhibition Auth. Series 2010: | | | | |
5% 2/1/15 (FSA Insured) | | 4,580 | | 4,962 |
5% 2/1/16 (FSA Insured) | | 5,620 | | 6,239 |
Pittsburgh School District: | | | | |
Series 2009 A: | | | | |
3% 9/1/12 (Assured Guaranty Corp. Insured) | | 1,300 | | 1,305 |
3% 9/1/14 (Assured Guaranty Corp. Insured) | | 1,640 | | 1,719 |
Series 2010 A: | | | | |
4% 9/1/15 (FSA Insured) | | 1,450 | | 1,584 |
5% 9/1/16 (FSA Insured) | | 1,685 | | 1,944 |
Saint Mary Hosp. Auth. Health Sys. Rev. (Catholic Health East Proj.) Series 2010 B: | | | | |
5% 11/15/13 | | 2,465 | | 2,600 |
5% 11/15/14 | | 4,690 | | 5,101 |
5% 11/15/15 | | 2,420 | | 2,707 |
Southeastern Pennsylvania Trans. Auth. Rev. Series 2011: | | | | |
5% 6/1/18 | | 1,000 | | 1,175 |
Municipal Bonds - continued |
| Principal
Amount (000s) | | Value (000s) |
Pennsylvania - continued |
Southeastern Pennsylvania Trans. Auth. Rev. Series 2011: - continued | | | | |
5% 6/1/19 | | $ 200 | | $ 237 |
Unionville-Chadds Ford School District Gen. Oblig. Series 2009, 5% 6/1/20 | | 1,190 | | 1,457 |
Westmoreland County Muni. Auth. Muni. Svc. Rev. Series K, 0% 7/1/12 (Escrowed to Maturity) | | 2,355 | | 2,355 |
| | 179,390 |
Puerto Rico - 0.4% |
Puerto Rico Commonwealth Aqueduct & Swr. Auth. Series 2012 A, 5% 7/1/21 | | 6,000 | | 6,506 |
Puerto Rico Govt. Dev. Bank Series 2006 B, 5% 12/1/12 | | 1,000 | | 1,017 |
Puerto Rico Infrastructure Fin. Bonds (Port Auth. Proj.) Series 2011 C, 2.75%, tender 6/15/13 (b)(e) | | 9,600 | | 9,630 |
| | 17,153 |
Rhode Island - 0.3% |
Rhode Island & Providence Plantations Series 2010 A, 5% 10/1/12 | | 2,250 | | 2,276 |
Rhode Island Econ. Dev. Corp. Rev. (Dept. of Trans. Proj.) Series 2009 A: | | | | |
5% 6/15/15 (Assured Guaranty Corp. Insured) | | 2,010 | | 2,237 |
5% 6/15/16 (Assured Guaranty Corp. Insured) | | 6,625 | | 7,592 |
| | 12,105 |
South Carolina - 0.5% |
Lexington County Health Svcs. District, Inc. Hosp. Rev. Series 2011: | | | | |
3% 11/1/12 | | 1,400 | | 1,410 |
5% 11/1/19 | | 1,190 | | 1,398 |
South Carolina Pub. Svc. Auth. (Santee Cooper) Rev. Oblig.: | | | | |
Series 2012 B: | | | | |
5% 12/1/17 | | 2,000 | | 2,391 |
5% 12/1/20 | | 1,000 | | 1,235 |
Series 2012 C: | | | | |
5% 12/1/13 (a) | | 2,400 | | 2,519 |
5% 12/1/17 (a) | | 10,535 | | 12,394 |
| | 21,347 |
Municipal Bonds - continued |
| Principal
Amount (000s) | | Value (000s) |
South Dakota - 0.2% |
South Dakota Health & Edl. Facilities Auth. Rev.: | | | | |
(Reg'l. Health Proj.) Series 2010: | | | | |
5% 9/1/14 | | $ 625 | | $ 673 |
5% 9/1/15 | | 680 | | 746 |
5% 9/1/16 | | 500 | | 562 |
5% 9/1/17 | | 490 | | 559 |
Series 2011: | | | | |
5% 9/1/17 | | 1,100 | | 1,256 |
5% 9/1/18 | | 1,200 | | 1,372 |
5% 9/1/19 | | 1,255 | | 1,435 |
| | 6,603 |
Tennessee - 0.4% |
Jackson Hosp. Rev. (Jackson-Madison County Gen. Hosp. Proj.) Series 2008, 5% 4/1/13 | | 1,000 | | 1,030 |
Memphis Elec. Sys. Rev. 5% 12/1/14 | | 5,000 | | 5,498 |
Memphis-Shelby County Arpt. Auth. Arpt. Rev. Series 2010 B, 5% 7/1/16 (e) | | 1,730 | | 1,933 |
Metropolitan Nashville Arpt. Auth. Rev. Series 2010 A: | | | | |
5% 7/1/16 | | 1,815 | | 2,046 |
5% 7/1/17 | | 1,100 | | 1,260 |
Shelby County Health Edl. & Hsg. Facilities Board Rev. Series 2004 A, 5% 9/1/15 | | 3,125 | | 3,499 |
| | 15,266 |
Texas - 5.5% |
Austin Cmnty. College District Pub. Facilities Lease Rev. (Round Rock Campus Proj.) Series 2008, 5.25% 8/1/15 | | 2,585 | | 2,906 |
Austin Convention Enterprises, Inc. (Convention Ctr. Proj.): | | | | |
Series 2006 A, 6% 1/1/14 | | 1,420 | | 1,488 |
Series 2006 B, 6% 1/1/13 | | 1,270 | | 1,293 |
Austin Elec. Util. Sys. Rev.: | | | | |
Series A, 5% 11/15/15 | | 1,000 | | 1,133 |
0% 5/15/18 (Nat'l. Pub. Fin. Guarantee Corp. Insured) | | 4,500 | | 3,906 |
Austin Independent School District Series 2004, 5% 8/1/17 | | 1,450 | | 1,740 |
Austin Wtr. & Wastewtr. Sys. Rev. Series 2009 A, 5% 11/15/15 | | 2,250 | | 2,566 |
Brownsville Util. Sys. Rev. Series 2008 A, 5% 9/1/15 (FSA Insured) | | 2,665 | | 2,994 |
Municipal Bonds - continued |
| Principal
Amount (000s) | | Value (000s) |
Texas - continued |
Carroll Independent School District Series 2009 C, 5.25% 2/15/19 | | $ 1,000 | | $ 1,242 |
Corpus Christi Independent School District 4% 8/15/14 | | 10,140 | | 10,860 |
Dallas Fort Worth Int'l. Arpt. Rev. Series 2009 A: | | | | |
5% 11/1/14 | | 2,500 | | 2,740 |
5% 11/1/15 | | 5,000 | | 5,648 |
Dallas Wtrwks. & Swr. Sys. Rev. Series 2011, 5% 10/1/18 | | 1,600 | | 1,963 |
Fort Worth Independent School District Series 2009, 5% 2/15/16 | | 3,690 | | 4,259 |
Frisco Gen. Oblig. Series 2004, 5.25% 2/15/14 (Nat'l. Pub. Fin. Guarantee Corp. Insured) | | 1,380 | | 1,489 |
Grapevine Gen. Oblig.: | | | | |
Series 2009 A, 5% 2/15/15 | | 2,215 | | 2,462 |
Series 2009, 5% 2/15/16 | | 1,375 | | 1,582 |
Harris County Cultural Ed. Facilities Fin. Corp. Thermal Util. Rev. (TECO Proj.) Series 2009 A: | | | | |
5% 11/15/12 | | 1,000 | | 1,017 |
5% 11/15/14 | | 1,000 | | 1,090 |
5% 11/15/16 | | 500 | | 576 |
Harris County Gen. Oblig. (Road Proj.) Series 2008 B: | | | | |
5% 8/15/13 | | 1,000 | | 1,052 |
5% 8/15/14 | | 1,075 | | 1,174 |
Houston Arpt. Sys. Rev.: | | | | |
Series 2011 A, 5% 7/1/17 (e) | | 7,380 | | 8,529 |
Series 2011 B, 3% 7/1/12 | | 1,540 | | 1,540 |
Series A: | | | | |
5% 7/1/15 | | 2,070 | | 2,315 |
5% 7/1/16 | | 1,080 | | 1,243 |
Houston Gen. Oblig.: | | | | |
Series 2004 A, 5.25% 3/1/14 (Nat'l. Pub. Fin. Guarantee Corp. Insured) | | 2,855 | | 3,084 |
Series A, 5% 3/1/13 (Nat'l. Pub. Fin. Guarantee Corp. Insured) | | 7,500 | | 7,734 |
Houston Independent School District: | | | | |
Bonds Series 2012: | | | | |
1.5%, tender 6/1/13 (b) | | 8,745 | | 8,829 |
2%, tender 6/1/14 (b) | | 5,850 | | 5,996 |
Series 2005 A, 0% 2/15/16 | | 4,500 | | 4,363 |
Humble Independent School District Series 2009, 4% 2/15/13 | | 400 | | 409 |
Keller Independent School District 5% 2/15/14 | | 3,750 | | 4,026 |
Municipal Bonds - continued |
| Principal
Amount (000s) | | Value (000s) |
Texas - continued |
Klein Independent School District Series 2009 A, 5% 8/1/16 | | $ 2,195 | | $ 2,570 |
Leander Independent School District Series 2001, 6% 8/15/14 (Escrowed to Maturity) | | 1,850 | | 2,071 |
Lewisville Independent School District Series 2009, 5% 8/15/17 | | 1,170 | | 1,398 |
Lone Star College Sys. Gen. Oblig. Series 2010 A, 5% 8/15/22 | | 2,500 | | 2,512 |
Lower Colorado River Auth. Rev.: | | | | |
Series 2010, 5% 5/15/17 | | 2,805 | | 3,297 |
5% 5/15/15 | | 2,120 | | 2,375 |
5% 5/15/15 (Escrowed to Maturity) | | 5 | | 6 |
5% 5/15/16 | | 2,355 | | 2,716 |
5% 5/15/16 (Escrowed to Maturity) | | 5 | | 6 |
Lower Colorado River Auth. Transmission Contract Rev. (LCRA Transmission Svcs. Corp. Proj.) Series 2010, 5% 5/15/18 | | 3,140 | | 3,739 |
Lubbock Gen. Oblig. Series 2005, 5% 2/15/13 (Nat'l. Pub. Fin. Guarantee Corp. Insured) | | 1,850 | | 1,904 |
Lubbock Health Facilities Dev. Corp. Rev. (St. Joseph Health Sys. Proj.) Series 2008 B: | | | | |
5% 7/1/17 | | 2,800 | | 3,242 |
5% 7/1/18 | | 3,030 | | 3,544 |
Mansfield Independent School District Series 2009, 4% 2/15/17 | | 1,840 | | 2,077 |
North Texas Tollway Auth. Rev.: | | | | |
Bonds Series 2008 H2, 5%, tender 1/1/13 (b) | | 5,000 | | 5,117 |
Series 2010 B1, 3.2% 1/1/13 | | 2,275 | | 2,303 |
Northside Independent School District Bonds 1.5%, tender 8/1/12 (b) | | 12,500 | | 12,510 |
San Antonio Wtr. Sys. Rev. Series 2012: | | | | |
4% 5/15/19 | | 1,500 | | 1,741 |
5% 5/15/20 | | 6,000 | | 7,396 |
5% 5/15/21 | | 5,000 | | 6,185 |
San Jacinto Cmnty. College District Series 2009: | | | | |
5% 2/15/15 | | 2,220 | | 2,454 |
5% 2/15/15 (Escrowed to Maturity) | | 280 | | 313 |
5% 2/15/16 | | 2,000 | | 2,276 |
Southwest Higher Ed. Auth. Rev. (Southern Methodist Univ. Proj.) Series 2009, 5% 10/1/16 | | 5,795 | | 6,721 |
Tarrant County Cultural Ed. Facilities Fin. Corp. Hosp. Rev. (Baylor Health Care Sys. Proj.) Series 2009, 5% 11/15/12 | | 1,950 | | 1,982 |
Municipal Bonds - continued |
| Principal
Amount (000s) | | Value (000s) |
Texas - continued |
Tarrant County Cultural Ed. Facilities Fin. Corp. Rev. (Christus Health Proj.) Series 2008 A, 5.75% 7/1/18 (Assured Guaranty Corp. Insured) | | $ 4,685 | | $ 5,094 |
Texas Gen. Oblig.: | | | | |
Series 2011 B, 2% 8/1/12 (e) | | 3,365 | | 3,369 |
Series B, 0% 10/1/13 | | 6,500 | | 6,425 |
Texas Muni. Pwr. Agcy. Rev. Series 2010: | | | | |
4% 9/1/14 | | 1,000 | | 1,061 |
5% 9/1/15 | | 835 | | 933 |
5% 9/1/16 | | 750 | | 860 |
Texas Pub. Fin. Auth. Rev. Series 2010 A, 5% 1/1/16 | | 7,865 | | 9,032 |
Tomball Independent School District 5% 2/15/17 (Assured Guaranty Corp. Insured) | | 1,105 | | 1,292 |
Trinity River Auth. Reg'l. Wastewtr. Sys. Rev. Series 2008, 5% 8/1/13 | | 6,135 | | 6,444 |
Univ. of North Texas Univ. Rev. Series A, 5% 4/15/14 | | 1,000 | | 1,080 |
Univ. of Texas Board of Regents Sys. Rev.: | | | | |
Series 2003 B, 5% 8/15/33 (Pre-Refunded to 8/15/13 @ 100) | | 15,000 | | 15,773 |
Series 2010 B, 5% 8/15/21 | | 1,800 | | 2,265 |
| | 237,331 |
Utah - 0.2% |
Salt Lake County Wtr. Conservancy District Rev. Series A: | | | | |
0% 10/1/12 (AMBAC Insured) | | 3,800 | | 3,787 |
0% 10/1/13 (AMBAC Insured) | | 3,760 | | 3,685 |
| | 7,472 |
Vermont - 0.1% |
Vermont Edl. & Health Bldg. Fin. Agcy. Rev. (Fletcher Allen Health Care Proj.) Series 2004 B, 5% 12/1/15 (FSA Insured) | | 2,225 | | 2,421 |
Virgin Islands - 0.1% |
Virgin Islands Pub. Fin. Auth. Series 2009 B, 5% 10/1/15 | | 5,000 | | 5,425 |
Virginia - 0.4% |
Amelia County Indl. Dev. Auth. Solid Waste Disp. Rev. Bonds (Waste Mgmt., Inc. Proj.) 3.375%, tender 4/1/13 (b)(e) | | 5,900 | | 6,002 |
Chesapeake Econ. Dev. Auth. Poll. Cont. Rev. Bonds (Elec. & Pwr. Co. Proj.) Series 2008 A, 3.6%, tender 2/1/13 (b) | | 1,800 | | 1,832 |
Municipal Bonds - continued |
| Principal
Amount (000s) | | Value (000s) |
Virginia - continued |
Louisa Indl. Dev. Auth. Poll. Cont. Rev. Bonds (Virginia Elec. & Pwr. Co. Proj.) Series 2008 B, 5.375%, tender 12/2/13 (b) | | $ 8,000 | | $ 8,549 |
York County Econ. Dev. Auth. Poll. Cont. Rev. Bonds (Virginia Elec. and Pwr. Co. Proj.) Series 2009 A, 4.05%, tender 5/1/14 (b) | | 1,800 | | 1,887 |
| | 18,270 |
Washington - 1.8% |
Energy Northwest Elec. Rev.: | | | | |
(#3 Proj.) Series 2009 A, 5% 7/1/14 | | 4,000 | | 4,366 |
Series 2012 A, 5% 7/1/19 | | 30,000 | | 36,853 |
Grant County Pub. Util. District #2 Series 2012 A: | | | | |
5% 1/1/20 | | 1,375 | | 1,652 |
5% 1/1/21 | | 1,865 | | 2,247 |
King County Highline School District # 401 Series 2009: | | | | |
5% 12/1/16 | | 6,350 | | 7,463 |
5% 12/1/17 | | 2,950 | | 3,509 |
Port of Seattle Passenger Facilities Charge Rev. Series 2010 B, 5% 12/1/16 (e) | | 2,500 | | 2,817 |
Port of Seattle Rev.: | | | | |
Series 2001 D, 5.75% 11/1/15 (Pre-Refunded to 11/1/12 @ 100) (e) | | 3,640 | | 3,701 |
Series 2010 C: | | | | |
5% 2/1/16 (e) | | 2,000 | | 2,244 |
5% 2/1/17 (e) | | 2,500 | | 2,850 |
Seattle Muni. Lt. & Pwr. Rev. Series 2010 B, 5% 2/1/17 | | 2,000 | | 2,357 |
Spokane County Wastewtr. Sys. Rev. Series 2009 A, 5% 12/1/15 | | 1,710 | | 1,952 |
Washington Health Care Facilities Auth. Rev. (MultiCare Health Sys. Proj.) Series 2010 A: | | | | |
5% 8/15/13 | | 2,000 | | 2,087 |
5% 8/15/14 | | 2,000 | | 2,153 |
| | 76,251 |
West Virginia - 0.3% |
West Virginia Econ. Dev. Auth. Solid Waste Disp. Facilities Rev. Bonds Series 2011 A, 2%, tender 8/1/12 (b)(e) | | 13,000 | | 13,008 |
Wisconsin - 1.1% |
Milwaukee County Arpt. Rev. Series 2010 B, 5% 12/1/15 (e) | | 1,720 | | 1,897 |
Municipal Bonds - continued |
| Principal
Amount (000s) | | Value (000s) |
Wisconsin - continued |
Wisconsin Gen. Oblig.: | | | | |
Series 2005 1, 5% 5/1/15 (Nat'l. Pub. Fin. Guarantee Corp. Insured) | | $ 6,325 | | $ 7,106 |
Series 2009 C, 4% 5/1/14 | | 3,365 | | 3,583 |
Series 2010 1: | | | | |
5% 5/1/14 | | 5,750 | | 6,228 |
5% 5/1/15 | | 8,005 | | 8,994 |
5% 5/1/16 | | 10,000 | | 11,590 |
Wisconsin Health & Edl. Facilities Auth. Rev.: | | | | |
(Agnesian HealthCare, Inc. Proj.) Series 2010, 5% 7/1/16 | | 1,175 | | 1,304 |
(Aurora Health Care, Inc. Proj.) Series 2010 A, 5% 4/15/17 | | 1,500 | | 1,707 |
(Marshfield Clinic Proj.) Series 2006 A, 5% 2/15/13 | | 875 | | 899 |
(Thedacare, Inc. Proj.) Series 2010: | | | | |
4% 12/15/13 | | 1,035 | | 1,079 |
5% 12/15/15 | | 1,105 | | 1,236 |
5% 12/15/16 | | 1,440 | | 1,637 |
5% 12/15/17 | | 1,540 | | 1,773 |
| | 49,033 |
TOTAL MUNICIPAL BONDS (Cost $3,451,990) |
3,599,300
|
Municipal Notes - 0.4% |
| | | |
California - 0.1% |
California School Cash Reserve Prog. Auth. TRAN Series 2012 X, 2.5% 1/31/13 | 4,000 | | 4,029 |
New York - 0.3% |
Suffolk County Gen. Oblig. TAN Series 2012 II, 2% 7/12/12 | 11,800 | | 11,806 |
TOTAL MUNICIPAL NOTES (Cost $15,827) |
15,835
|
Money Market Funds - 7.8% |
| Shares | | Value (000s) |
Fidelity Municipal Cash Central Fund, 0.21% (c)(d)
(Cost $338,204) | 338,203,900 | | $ 338,204 |
TOTAL INVESTMENT PORTFOLIO - 91.9% (Cost $3,806,021) | | 3,953,339 |
NET OTHER ASSETS (LIABILITIES) - 8.1% | | 348,599 |
NET ASSETS - 100% | $ 4,301,938 |
Security Type Abbreviations |
TAN | - | TAX ANTICIPATION NOTE |
TRAN | - | TAX AND REVENUE ANTICIPATION NOTE |
Legend |
(a) Security or a portion of the security purchased on a delayed delivery or when-issued basis. |
(b) Coupon rates for floating and adjustable rate securities reflect the rates in effect at period end. |
(c) Information in this report regarding holdings by state and security types does not reflect the holdings of the Fidelity Municipal Cash Central Fund. |
(d) Affiliated fund that is available only to investment companies and other accounts managed by Fidelity Investments. The rate quoted is the annualized seven-day yield of the fund at period end. A complete unaudited listing of the fund's holdings as of its most recent quarter end is available upon request. In addition, each Fidelity Central Fund's financial statements are available on the SEC's website or upon request. |
(e) Private activity obligations whose interest is subject to the federal alternative minimum tax for individuals. |
Affiliated Central Funds |
Information regarding fiscal year to date income earned by the Fund from investments in Fidelity Central Funds is as follows: |
Fund | Income earned
(Amounts in thousands) |
Fidelity Municipal Cash Central Fund | $ 280 |
Other Information |
The following is a summary of the inputs used, as of June 30, 2012, involving the Fund's assets and liabilities carried at fair value. The inputs or methodology used for valuing securities may not be an indication of the risk associated with investing in those securities. For more information on valuation inputs, and their aggregation into the levels used in the table below, please refer to the Security Valuation section in the accompanying Notes to Financial Statements. |
Valuation Inputs at Reporting Date: |
Description
(Amounts in thousands) | Total | Level 1 | Level 2 | Level 3 |
Investments in Securities: | | | | |
Municipal Securities | $ 3,615,135 | $ - | $ 3,615,135 | $ - |
Money Market Funds | 338,204 | 338,204 | - | - |
Total Investments in Securities: | $ 3,953,339 | $ 338,204 | $ 3,615,135 | $ - |
The distribution of municipal securities by revenue source, as a percentage of total net assets, is as follows (Unaudited): |
General Obligations | 32.1% |
Electric Utilities | 12.8% |
Special Tax | 11.1% |
Health Care | 8.6% |
Water & Sewer | 5.7% |
Transportation | 5.2% |
Others (Individually Less Than 5%) | 8.6% |
Short-Term Investments and Net Other Assets | 15.9% |
| 100.0% |
See accompanying notes which are an integral part of the financial statements.
Semiannual Report
Statement of Assets and Liabilities
Amounts in thousands (except per-share amounts) | June 30, 2012 (Unaudited) |
| | |
Assets | | |
Investment in securities, at value - See accompanying schedule: Unaffiliated issuers (cost $3,467,817) | $ 3,615,135 | |
Fidelity Central Funds (cost $338,204) | 338,204 | |
Total Investments (cost $3,806,021) | | $ 3,953,339 |
Cash | | 350,577 |
Receivable for fund shares sold | | 5,368 |
Interest receivable | | 40,213 |
Distributions receivable from Fidelity Central Funds | | 58 |
Other receivables | | 79 |
Total assets | | 4,349,634 |
| | |
Liabilities | | |
Payable for investments purchased on a delayed delivery basis | $ 40,825 | |
Payable for fund shares redeemed | 2,478 | |
Distributions payable | 1,663 | |
Accrued management fee | 1,305 | |
Distribution and service plan fees payable | 155 | |
Other affiliated payables | 1,194 | |
Other payables and accrued expenses | 76 | |
Total liabilities | | 47,696 |
| | |
Net Assets | | $ 4,301,938 |
Net Assets consist of: | | |
Paid in capital | | $ 4,151,057 |
Undistributed net investment income | | 245 |
Accumulated undistributed net realized gain (loss) on investments | | 3,318 |
Net unrealized appreciation (depreciation) on investments | | 147,318 |
Net Assets | | $ 4,301,938 |
See accompanying notes which are an integral part of the financial statements.
Semiannual Report
Statement of Assets and Liabilities - continued
Amounts in thousands (except per-share amounts) | June 30, 2012 (Unaudited) |
| | |
Calculation of Maximum Offering Price Class A:
Net Asset Value and redemption price per share ($365,613 ÷ 33,625 shares) | | $ 10.87 |
| | |
Maximum offering price per share (100/97.25 of $10.87) | | $ 11.18 |
Class T:
Net Asset Value and redemption price per share ($25,579 ÷ 2,357 shares) | | $ 10.85 |
| | |
Maximum offering price per share (100/97.25 of $10.85) | | $ 11.16 |
Class B:
Net Asset Value and offering price per share ($1,456 ÷ 134 shares)A | | $ 10.87 |
| | |
Class C:
Net Asset Value and offering price per share ($88,394 ÷ 8,144 shares)A | | $ 10.85 |
| | |
| | |
Short-Intermediate Municipal Income:
Net Asset Value, offering price and redemption price per share ($3,623,040 ÷ 333,766 shares) | | $ 10.86 |
| | |
Institutional Class:
Net Asset Value, offering price and redemption price per share ($197,856 ÷ 18,218 shares) | | $ 10.86 |
A Redemption price per share is equal to net asset value less any applicable contingent deferred sales charge.
See accompanying notes which are an integral part of the financial statements.
Semiannual Report
Financial Statements - continued
Statement of Operations
Amounts in thousands | Six months ended June 30, 2012 (Unaudited) |
| | |
Investment Income | | |
Interest | | $ 49,992 |
Income from Fidelity Central Funds | | 280 |
Total income | | 50,272 |
| | |
Expenses | | |
Management fee | $ 7,806 | |
Transfer agent fees | 2,075 | |
Distribution and service plan fees | 919 | |
Accounting fees and expenses | 315 | |
Custodian fees and expenses | 22 | |
Independent trustees' compensation | 7 | |
Registration fees | 154 | |
Audit | 26 | |
Legal | 5 | |
Miscellaneous | 22 | |
Total expenses before reductions | 11,351 | |
Expense reductions | (130) | 11,221 |
Net investment income (loss) | | 39,051 |
Realized and Unrealized Gain (Loss) Net realized gain (loss) on: | | |
Investment securities: | | |
Unaffiliated issuers | | 3,318 |
Change in net unrealized appreciation (depreciation) on investment securities | | 10,912 |
Net gain (loss) | | 14,230 |
Net increase (decrease) in net assets resulting from operations | | $ 53,281 |
See accompanying notes which are an integral part of the financial statements.
Semiannual Report
Statement of Changes in Net Assets
Amounts in thousands | Six months ended
June 30, 2012
(Unaudited) | Year ended
December 31,
2011 |
Increase (Decrease) in Net Assets | | |
Operations | | |
Net investment income (loss) | $ 39,051 | $ 80,340 |
Net realized gain (loss) | 3,318 | 2,116 |
Change in net unrealized appreciation (depreciation) | 10,912 | 76,652 |
Net increase (decrease) in net assets resulting
from operations | 53,281 | 159,108 |
Distributions to shareholders from net investment income | (35,890) | (83,163) |
Distributions to shareholders from net realized gain | - | (2,965) |
Total distributions | (35,890) | (86,128) |
Share transactions - net increase (decrease) | 167,121 | 142,426 |
Redemption fees | 27 | 46 |
Total increase (decrease) in net assets | 184,539 | 215,452 |
| | |
Net Assets | | |
Beginning of period | 4,117,399 | 3,901,947 |
End of period (including undistributed net investment income of $245 and distributions in excess of net investment income of $2,916, respectively) | $ 4,301,938 | $ 4,117,399 |
See accompanying notes which are an integral part of the financial statements.
Semiannual Report
Financial Highlights - Class A
| Six months ended
June 30, 2012 | Years ended December 31, |
| (Unaudited) | 2011 | 2010 | 2009 | 2008 | 2007 |
Selected Per-Share Data | | | | | |
Net asset value, beginning of period | $ 10.83 | $ 10.62 | $ 10.64 | $ 10.35 | $ 10.33 | $ 10.21 |
Income from Investment Operations | | | | | | |
Net investment income (loss) E | .085 | .198 | .209 | .254 | .298 | .302 |
Net realized and unrealized gain (loss) | .032 | .225 | (.016) | .294 | .021 | .118 |
Total from investment operations | .117 | .423 | .193 | .548 | .319 | .420 |
Distributions from net investment income | (.077) | (.205) | (.209) | (.258) | (.300) | (.300) |
Distributions from net realized gain | - | (.008) | (.004) | - | - | - |
Total distributions | (.077) | (.213) | (.213) | (.258) | (.300) | (.300) |
Redemption fees added to paid in capital E | - I | - I | - I | - I | .001 | - I |
Net asset value, end of period | $ 10.87 | $ 10.83 | $ 10.62 | $ 10.64 | $ 10.35 | $ 10.33 |
Total Return B, C, D | 1.08% | 4.03% | 1.81% | 5.34% | 3.13% | 4.19% |
Ratios to Average Net Assets F, H | | | | | |
Expenses before reductions | .80% A | .77% | .78% | .79% | .75% | .71% |
Expenses net of fee waivers, if any | .80% A | .77% | .78% | .78% | .75% | .71% |
Expenses net of all reductions | .79% A | .77% | .77% | .78% | .72% | .64% |
Net investment income (loss) | 1.58% A | 1.85% | 1.95% | 2.41% | 2.90% | 2.95% |
Supplemental Data | | | | | |
Net assets, end of period (in millions) | $ 366 | $ 336 | $ 200 | $ 169 | $ 58 | $ 12 |
Portfolio turnover rate G | 24% A | 22% | 15% | 8% | 20% | 23% |
A Annualized
B Total returns for periods of less than one year are not annualized.
C Total returns would have been lower if certain expenses had not been reduced during the applicable periods shown.
D Total returns do not include the effect of the sales charges.
E Calculated based on average shares outstanding during the period.
F Fees and expenses of any underlying Fidelity Central Funds are not included in the Fund's expense ratio. The Fund indirectly bears its proportionate share of the expenses of any underlying Fidelity Central Funds.
G Amount does not include the portfolio activity of any underlying Fidelity Central Funds.
H Expense ratios reflect operating expenses of the class. Expenses before reductions do not reflect amounts reimbursed by the investment adviser or reductions from brokerage service arrangements or reductions from other expense offset arrangements and do not represent the amount paid by the class during periods when reimbursements or reductions occur. Expenses net of fee waivers reflect expenses after reimbursement by the investment adviser but prior to reductions from brokerage service arrangements or other expense offset arrangements. Expenses net of all reductions represent the net expenses paid by the class.
I Amount represents less than $.001 per share.
See accompanying notes which are an integral part of the financial statements.
Semiannual Report
Financial Highlights - Class T
| Six months ended
June 30, 2012 | Years ended December 31, |
| (Unaudited) | 2011 | 2010 | 2009 | 2008 | 2007 |
Selected Per-Share Data | | | | | |
Net asset value, beginning of period | $ 10.81 | $ 10.60 | $ 10.63 | $ 10.34 | $ 10.31 | $ 10.19 |
Income from Investment Operations | | | | | | |
Net investment income (loss) E | .086 | .199 | .211 | .255 | .300 | .297 |
Net realized and unrealized gain (loss) | .032 | .226 | (.026) | .294 | .029 | .120 |
Total from investment operations | .118 | .425 | .185 | .549 | .329 | .417 |
Distributions from net investment income | (.078) | (.207) | (.211) | (.259) | (.300) | (.297) |
Distributions from net realized gain | - | (.008) | (.004) | - | - | - |
Total distributions | (.078) | (.215) | (.215) | (.259) | (.300) | (.297) |
Redemption fees added to paid in capital E | - I | - I | - I | - I | .001 | - I |
Net asset value, end of period | $ 10.85 | $ 10.81 | $ 10.60 | $ 10.63 | $ 10.34 | $ 10.31 |
Total Return B, C, D | 1.10% | 4.05% | 1.74% | 5.36% | 3.24% | 4.17% |
Ratios to Average Net Assets F, H | | | | | |
Expenses before reductions | .77% A | .76% | .76% | .77% | .74% | .74% |
Expenses net of fee waivers, if any | .77% A | .76% | .76% | .77% | .74% | .74% |
Expenses net of all reductions | .77% A | .76% | .75% | .77% | .72% | .69% |
Net investment income (loss) | 1.60% A | 1.86% | 1.97% | 2.42% | 2.90% | 2.91% |
Supplemental Data | | | | | |
Net assets, end of period (in millions) | $ 26 | $ 26 | $ 24 | $ 23 | $ 15 | $ 10 |
Portfolio turnover rate G | 24% A | 22% | 15% | 8% | 20% | 23% |
A Annualized
B Total returns for periods of less than one year are not annualized.
C Total returns would have been lower if certain expenses had not been reduced during the applicable periods shown.
D Total returns do not include the effect of the sales charges.
E Calculated based on average shares outstanding during the period.
F Fees and expenses of any underlying Fidelity Central Funds are not included in the Fund's expense ratio. The Fund indirectly bears its proportionate share of the expenses of any underlying Fidelity Central Funds.
G Amount does not include the portfolio activity of any underlying Fidelity Central Funds.
H Expense ratios reflect operating expenses of the class. Expenses before reductions do not reflect amounts reimbursed by the investment adviser or reductions from brokerage service arrangements or reductions from other expense offset arrangements and do not represent the amount paid by the class during periods when reimbursements or reductions occur. Expenses net of fee waivers reflect expenses after reimbursement by the investment adviser but prior to reductions from brokerage service arrangements or other expense offset arrangements. Expenses net of all reductions represent the net expenses paid by the class.
I Amount represents less than $.001 per share.
See accompanying notes which are an integral part of the financial statements.
Semiannual Report
Financial Highlights - Class B
| Six months ended
June 30, 2012 | Years ended December 31, |
| (Unaudited) | 2011 | 2010 | 2009 | 2008 | 2007 |
Selected Per-Share Data | | | | | |
Net asset value, beginning of period | $ 10.82 | $ 10.61 | $ 10.64 | $ 10.35 | $ 10.32 | $ 10.20 |
Income from Investment Operations | | | | | | |
Net investment income (loss) E | .050 | .128 | .139 | .186 | .230 | .228 |
Net realized and unrealized gain (loss) | .042 | .226 | (.026) | .293 | .029 | .121 |
Total from investment operations | .092 | .354 | .113 | .479 | .259 | .349 |
Distributions from net investment income | (.042) | (.136) | (.139) | (.189) | (.230) | (.229) |
Distributions from net realized gain | - | (.008) | (.004) | - | - | - |
Total distributions | (.042) | (.144) | (.143) | (.189) | (.230) | (.229) |
Redemption fees added to paid in capital E | - I | - I | - I | - I | .001 | - I |
Net asset value, end of period | $ 10.87 | $ 10.82 | $ 10.61 | $ 10.64 | $ 10.35 | $ 10.32 |
Total Return B, C, D | .85% | 3.36% | 1.06% | 4.66% | 2.54% | 3.47% |
Ratios to Average Net Assets F, H | | | | | |
Expenses before reductions | 1.45% A | 1.43% | 1.44% | 1.46% | 1.43% | 1.41% |
Expenses net of fee waivers, if any | 1.45% A | 1.42% | 1.43% | 1.43% | 1.43% | 1.41% |
Expenses net of all reductions | 1.44% A | 1.42% | 1.42% | 1.43% | 1.40% | 1.36% |
Net investment income (loss) | .92% A | 1.19% | 1.30% | 1.77% | 2.22% | 2.23% |
Supplemental Data | | | | | |
Net assets, end of period (in millions) | $ 1 | $ 2 | $ 2 | $ 3 | $ 2 | $ 1 |
Portfolio turnover rate G | 24% A | 22% | 15% | 8% | 20% | 23% |
A Annualized
B Total returns for periods of less than one year are not annualized.
C Total returns would have been lower if certain expenses had not been reduced during the applicable periods shown.
D Total returns do not include the effect of the contingent deferred sales charge.
E Calculated based on average shares outstanding during the period.
F Fees and expenses of any underlying Fidelity Central Funds are not included in the Fund's expense ratio. The Fund indirectly bears its proportionate share of the expenses of any underlying Fidelity Central Funds.
G Amount does not include the portfolio activity of any underlying Fidelity Central Funds.
H Expense ratios reflect operating expenses of the class. Expenses before reductions do not reflect amounts reimbursed by the investment adviser or reductions from brokerage service arrangements or reductions from other expense offset arrangements and do not represent the amount paid by the class during periods when reimbursements or reductions occur. Expenses net of fee waivers reflect expenses after reimbursement by the investment adviser but prior to reductions from brokerage service arrangements or other expense offset arrangements. Expenses net of all reductions represent the net expenses paid by the class.
I Amount represents less than $.001 per share.
See accompanying notes which are an integral part of the financial statements.
Semiannual Report
Financial Highlights - Class C
| Six months ended June 30, 2012 | Years ended December 31, |
| (Unaudited) | 2011 | 2010 | 2009 | 2008 | 2007 |
Selected Per-Share Data | | | | | |
Net asset value, beginning of period | $ 10.81 | $ 10.60 | $ 10.63 | $ 10.33 | $ 10.31 | $ 10.19 |
Income from Investment Operations | | | | | | |
Net investment income (loss) E | .045 | .117 | .129 | .175 | .220 | .219 |
Net realized and unrealized gain (loss) | .032 | .226 | (.026) | .303 | .020 | .120 |
Total from investment operations | .077 | .343 | .103 | .478 | .240 | .339 |
Distributions from net investment income | (.037) | (.125) | (.129) | (.178) | (.221) | (.219) |
Distributions from net realized gain | - | (.008) | (.004) | - | - | - |
Total distributions | (.037) | (.133) | (.133) | (.178) | (.221) | (.219) |
Redemption fees added to paid in capital E | - I | - I | - I | - I | .001 | - I |
Net asset value, end of period | $ 10.85 | $ 10.81 | $ 10.60 | $ 10.63 | $ 10.33 | $ 10.31 |
Total Return B, C, D | .71% | 3.25% | .96% | 4.66% | 2.35% | 3.37% |
Ratios to Average Net Assets F, H | | | | | |
Expenses before reductions | 1.54% A | 1.53% | 1.52% | 1.53% | 1.50% | 1.51% |
Expenses net of fee waivers, if any | 1.54% A | 1.53% | 1.52% | 1.53% | 1.50% | 1.51% |
Expenses net of all reductions | 1.54% A | 1.52% | 1.52% | 1.53% | 1.48% | 1.45% |
Net investment income (loss) | .83% A | 1.09% | 1.20% | 1.67% | 2.14% | 2.14% |
Supplemental Data | | | | | |
Net assets, end of period (in millions) | $ 88 | $ 79 | $ 77 | $ 56 | $ 20 | $ 6 |
Portfolio turnover rate G | 24% A | 22% | 15% | 8% | 20% | 23% |
A Annualized
B Total returns for periods of less than one year are not annualized.
C Total returns would have been lower if certain expenses had not been reduced during the applicable periods shown.
D Total returns do not include the effect of the contingent deferred sales charge.
E Calculated based on average shares outstanding during the period.
F Fees and expenses of any underlying Fidelity Central Funds are not included in the Fund's expense ratio. The Fund indirectly bears its proportionate share of the expenses of any underlying Fidelity Central Funds.
G Amount does not include the portfolio activity of any underlying Fidelity Central Funds.
H Expense ratios reflect operating expenses of the class. Expenses before reductions do not reflect amounts reimbursed by the investment adviser or reductions from brokerage service arrangements or reductions from other expense offset arrangements and do not represent the amount paid by the class during periods when reimbursements or reductions occur. Expenses net of fee waivers reflect expenses after reimbursement by the investment adviser but prior to reductions from brokerage service arrangements or other expense offset arrangements. Expenses net of all reductions represent the net expenses paid by the class.
I Amount represents less than $.001 per share.
See accompanying notes which are an integral part of the financial statements.
Semiannual Report
Financial Highlights - Short-Intermediate Municipal Income
| Six months ended
June 30, 2012 | Years ended December 31, |
| (Unaudited) | 2011 | 2010 | 2009 | 2008 | 2007 |
Selected Per-Share Data | | | | | |
Net asset value, beginning of period | $ 10.81 | $ 10.60 | $ 10.63 | $ 10.34 | $ 10.31 | $ 10.19 |
Income from Investment Operations | | | | | | |
Net investment income (loss) D | .102 | .228 | .240 | .284 | .326 | .323 |
Net realized and unrealized gain (loss) | .042 | .227 | (.026) | .293 | .029 | .120 |
Total from investment operations | .144 | .455 | .214 | .577 | .355 | .443 |
Distributions from net investment income | (.094) | (.237) | (.240) | (.287) | (.326) | (.323) |
Distributions from net realized gain | - | (.008) | (.004) | - | - | - |
Total distributions | (.094) | (.245) | (.244) | (.287) | (.326) | (.323) |
Redemption fees added to paid in capital D | - H | - H | - H | - H | .001 | - H |
Net asset value, end of period | $ 10.86 | $ 10.81 | $ 10.60 | $ 10.63 | $ 10.34 | $ 10.31 |
Total Return B, C | 1.34% | 4.34% | 2.02% | 5.64% | 3.50% | 4.43% |
Ratios to Average Net Assets E, G | | | | | |
Expenses before reductions | .48% A | .48% | .48% | .50% | .49% | .49% |
Expenses net of fee waivers, if any | .48% A | .48% | .48% | .50% | .49% | .49% |
Expenses net of all reductions | .48% A | .48% | .48% | .50% | .47% | .43% |
Net investment income (loss) | 1.89% A | 2.14% | 2.24% | 2.69% | 3.15% | 3.17% |
Supplemental Data | | | | | |
Net assets, end of period (in millions) | $ 3,623 | $ 3,523 | $ 3,456 | $ 3,153 | $ 1,870 | $ 1,650 |
Portfolio turnover rate F | 24% A | 22% | 15% | 8% | 20% | 23% |
A Annualized
B Total returns for periods of less than one year are not annualized.
C Total returns would have been lower if certain expenses had not been reduced during the applicable periods shown.
D Calculated based on average shares outstanding during the period.
E Fees and expenses of any underlying Fidelity Central Funds are not included in the Fund's expense ratio. The Fund indirectly bears its proportionate share of the expenses of any underlying Fidelity Central Funds.
F Amount does not include the portfolio activity of any underlying Fidelity Central Funds.
G Expense ratios reflect operating expenses of the class. Expenses before reductions do not reflect amounts reimbursed by the investment adviser or reductions from brokerage service arrangements or reductions from other expense offset arrangements and do not represent the amount paid by the class during periods when reimbursements or reductions occur. Expenses net of fee waivers reflect expenses after reimbursement by the investment adviser but prior to reductions from brokerage service arrangements or other expense offset arrangements. Expenses net of all reductions represent the net expenses paid by the class.
H Amount represents less than $.001 per share.
See accompanying notes which are an integral part of the financial statements.
Semiannual Report
Financial Highlights - Institutional Class
| Six months ended
June 30, 2012 | Years ended December 31, |
| (Unaudited) | 2011 | 2010 | 2009 | 2008 | 2007 |
Selected Per-Share Data | | | | | |
Net asset value, beginning of period | $ 10.81 | $ 10.61 | $ 10.63 | $ 10.34 | $ 10.32 | $ 10.20 |
Income from Investment Operations | | | | | | |
Net investment income (loss) D | .099 | .224 | .235 | .281 | .321 | .320 |
Net realized and unrealized gain (loss) | .042 | .216 | (.015) | .293 | .022 | .120 |
Total from investment operations | .141 | .440 | .220 | .574 | .343 | .440 |
Distributions from net investment income | (.091) | (.232) | (.236) | (.284) | (.324) | (.320) |
Distributions from net realized gain | - | (.008) | (.004) | - | - | - |
Total distributions | (.091) | (.240) | (.240) | (.284) | (.324) | (.320) |
Redemption fees added to paid in capital D | - H | - H | - H | - H | .001 | - H |
Net asset value, end of period | $ 10.86 | $ 10.81 | $ 10.61 | $ 10.63 | $ 10.34 | $ 10.32 |
Total Return B, C | 1.31% | 4.19% | 2.07% | 5.61% | 3.38% | 4.39% |
Ratios to Average Net Assets E, G | | | | | |
Expenses before reductions | .53% A | .52% | .53% | .55% | .51% | .52% |
Expenses net of fee waivers, if any | .53% A | .52% | .53% | .53% | .51% | .52% |
Expenses net of all reductions | .53% A | .52% | .52% | .53% | .49% | .45% |
Net investment income (loss) | 1.84% A | 2.09% | 2.20% | 2.66% | 3.13% | 3.14% |
Supplemental Data | | | | | |
Net assets, end of period (in millions) | $ 198 | $ 152 | $ 142 | $ 92 | $ 32 | $ 5 |
Portfolio turnover rate F | 24% A | 22% | 15% | 8% | 20% | 23% |
A Annualized
B Total returns for periods of less than one year are not annualized.
C Total returns would have been lower if certain expenses had not been reduced during the applicable periods shown.
D Calculated based on average shares outstanding during the period.
E Fees and expenses of any underlying Fidelity Central Funds are not included in the Fund's expense ratio. The Fund indirectly bears its proportionate share of the expenses of any underlying Fidelity Central Funds.
F Amount does not include the portfolio activity of any underlying Fidelity Central Funds.
G Expense ratios reflect operating expenses of the class. Expenses before reductions do not reflect amounts reimbursed by the investment adviser or reductions from brokerage service arrangements or reductions from other expense offset arrangements and do not represent the amount paid by the class during periods when reimbursements or reductions occur. Expenses net of fee waivers reflect expenses after reimbursement by the investment adviser but prior to reductions from brokerage service arrangements or other expense offset arrangements. Expenses net of all reductions represent the net expenses paid by the class.
H Amount represents less than $.001 per share.
See accompanying notes which are an integral part of the financial statements.
Semiannual Report
Notes to Financial Statements
For the period ended June 30, 2012 (Unaudited)
(Amounts in thousands except percentages)
1. Organization.
Fidelity® Short-Intermediate Municipal Income Fund (the Fund) is a fund of Fidelity Municipal Trust (the Trust) and is authorized to issue an unlimited number of shares. The Trust is registered under the Investment Company Act of 1940, as amended (the 1940 Act), as an open-end management investment company organized as a Massachusetts business trust. The Fund offers Class A, Class T, Class C, Short-Intermediate Municipal Income and Institutional Class shares, each of which, along with Class B shares, has equal rights as to assets and voting privileges. Effective after the close of business on September 1, 2010, Class B shares were closed to new accounts and additional purchases, except for exchanges and reinvestments. Each class has exclusive voting rights with respect to matters that affect that class. Class B shares will automatically convert to Class A shares after a holding period of four years from the initial date of purchase. Investment income, realized and unrealized capital gains and losses, the common expenses of the Fund, and certain fund-level expense reductions, if any, are allocated on a pro-rata basis to each class based on the relative net assets of each class to the total net assets of the Fund. Each class differs with respect to transfer agent and distribution and service plan fees incurred. Certain expense reductions may also differ by class.
2. Investments in Fidelity Central Funds.
The Fund invests in Fidelity Central Funds, which are open-end investment companies available only to other investment companies and accounts managed by Fidelity Management & Research Company (FMR) and its affiliates. The Fund's Schedule of Investments lists each of the Fidelity Central Funds held as of period end, if any, as an investment of the Fund, but does not include the underlying holdings of each Fidelity Central Fund. As an Investing Fund, the Fund indirectly bears its proportionate share of the expenses of the underlying Fidelity Central Funds.
The Money Market Central Funds seek preservation of capital and current income and are managed by Fidelity Investments Money Management, Inc. (FIMM), an affiliate of FMR.
A complete unaudited list of holdings for each Fidelity Central Fund is available upon request or at the Securities and Exchange Commission (the SEC) web site at www.sec.gov. In addition, the financial statements of the Fidelity Central Funds are available on the SEC web site or upon request.
3. Significant Accounting Policies.
The financial statements have been prepared in conformity with accounting principles generally accepted in the United States of America (GAAP), which require management to make certain estimates and assumptions at the date of the financial statements.
Semiannual Report
Notes to Financial Statements (Unaudited) - continued
(Amounts in thousands except percentages)
3. Significant Accounting Policies - continued
Actual results could differ from those estimates. Subsequent events, if any, through the date that the financial statements were issued have been evaluated in the preparation of the financial statements. The following summarizes the significant accounting policies of the Fund:
Security Valuation. Investments are valued as of 4:00 p.m. Eastern time on the last calendar day of the period. In accordance with valuation policies and procedures approved by the Board of Trustees (the Board), the Fund attempts to obtain prices from one or more third party pricing vendor or broker to value its investments. When current market prices, quotations or rates are not readily available or reliable, securities will be fair valued in good faith by the FMR Fair Value Committee (the Committee), in accordance with procedures adopted by the Board. Factors used in determining fair value vary by security type and may include market or security specific events, changes in interest rates and credit quality. The frequency with which these procedures are used cannot be predicted and they may be utilized to a significant extent. The Committee oversees the Fund's valuation policies and procedures and is responsible for approving and reporting to the Board all fair value determinations.
The Fund categorizes the inputs to valuation techniques used to value its investments into a disclosure hierarchy consisting of three levels as shown below:
Level 1 - quoted prices in active markets for identical investments
Level 2 - other significant observable inputs (including quoted prices for similar investments, interest rates, prepayment speeds, etc.)
Level 3 - unobservable inputs (including the Fund's own assumptions based on the best information available)
Valuation techniques used to value the Fund's investments by major category are as follows:
Debt securities, including restricted securities, are valued based on evaluated prices received from third party pricing vendors or from brokers who make markets in such securities. For municipal securities, pricing vendors utilize matrix pricing which considers yield or price of bonds of comparable quality, coupon, maturity and type as well as broker-supplied prices and are generally categorized as Level 2 in the hierarchy. When independent prices are unavailable or unreliable, debt securities may be valued utilizing pricing methodologies which consider similar factors that would be used by third party pricing vendors. These are generally categorized as Level 2 in the hierarchy but may be Level 3 depending on the circumstances.
Semiannual Report
3. Significant Accounting Policies - continued
Security Valuation - continued
Investments in open-end mutual funds, including the Fidelity Central Funds, are valued at their closing net asset value each business day and are categorized as Level 1 in the hierarchy.
Changes in valuation techniques may result in transfers in or out of an assigned level within the disclosure hierarchy. The aggregate value of investments by input level, as of June 30, 2012 for the Fund's investments, is included at the end of Fund's Schedule of Investments.
Investment Transactions and Income. For financial reporting purposes, the Fund's investment holdings and NAV include trades executed through the end of the last business day of the period. The NAV per share for processing shareholder transactions is calculated as of the close of business of the New York Stock Exchange (NYSE), normally 4:00 p.m. Eastern time and includes trades executed through the end of the prior business day. Gains and losses on securities sold are determined on the basis of identified cost. Interest income and distributions from the Fidelity Central Funds are accrued as earned. Interest income includes coupon interest and amortization of premium and accretion of discount on debt securities.
Expenses. Expenses directly attributable to a fund are charged to that fund. Expenses attributable to more than one fund are allocated among the respective funds on the basis of relative net assets or other appropriate methods. Expense estimates are accrued in the period to which they relate and adjustments are made when actual amounts are known.
Income Tax Information and Distributions to Shareholders. Each year, the Fund intends to qualify as a regulated investment company under Subchapter M of the Internal Revenue Code, including distributing substantially all of its taxable income and realized gains. As a result, no provision for income taxes is required. The Fund files a U.S. federal tax return, in addition to state and local tax returns as required. A fund's federal income tax returns are subject to examination by the Internal Revenue Service (IRS) for a period of three fiscal years after they are filed. State and local tax returns may be subject to examination for an additional fiscal year depending on the jurisdiction.
Dividends are declared and recorded daily and paid monthly from net investment income. Distributions from realized gains, if any, are declared and recorded on the ex-dividend date. Income dividends and capital gain distributions are declared separately for each class. Income and capital gain distributions are determined in accordance with income tax regulations, which may differ from GAAP.
Semiannual Report
Notes to Financial Statements (Unaudited) - continued
(Amounts in thousands except percentages)
3. Significant Accounting Policies - continued
Income Tax Information and Distributions to Shareholders - continued
Capital accounts within the financial statements are adjusted for permanent book-tax differences. These adjustments have no impact on net assets or the results of operations. Temporary book-tax differences will reverse in a subsequent period.
Book-tax differences are primarily due to market discount and deferred trustees compensation.
The Fund purchases municipal securities whose interest, in the opinion of the issuer, is free from federal income tax. There is no assurance that the IRS will agree with this opinion. In the event the IRS determines that the issuer does not comply with relevant tax requirements, interest payments from a security could become federally taxable, possibly retroactively to the date the security was issued.
The federal tax cost of investment securities and unrealized appreciation (depreciation) as of period end were as follows:
Gross unrealized appreciation | $ 149,454 |
Gross unrealized depreciation | (2,136) |
Net unrealized appreciation (depreciation) on securities and other investments | $ 147,318 |
| |
Tax cost | $ 3,806,021 |
Short-Term Trading (Redemption) Fees. Shares held by investors in the Fund less than 30 days are subject to a redemption fee equal to .50% of the net asset value of shares redeemed. All redemption fees, which reduce the proceeds of the shareholder redemption, are retained by the Fund and accounted for as an addition to paid in capital.
4. Operating Policies.
Delayed Delivery Transactions and When-Issued Securities. During the period, the Fund transacted in securities on a delayed delivery or when-issued basis. Payment and delivery may take place after the customary settlement period for that security. The price of the underlying securities and the date when the securities will be delivered and paid for are fixed at the time the transaction is negotiated. The securities purchased on a delayed delivery or when-issued basis are identified as such in the Fund's Schedule of Investments. The Fund may receive compensation for interest forgone in the purchase of a delayed delivery or when-issued security. With respect to purchase commitments, the Fund identifies securities as segregated in its records with a value at least equal to the amount of the commitment. Losses may arise due to changes in the value of the
Semiannual Report
4. Operating Policies - continued
Delayed Delivery Transactions and When-Issued Securities - continued
underlying securities or if the counterparty does not perform under the contract's terms, or if the issuer does not issue the securities due to political, economic, or other factors.
5. Purchases and Sales of Investments.
Purchases and sales of securities, other than short-term securities, aggregated $497,798 and $427,553, respectively.
6. Fees and Other Transactions with Affiliates.
Management Fee. FMR and its affiliates provide the Fund with investment management related services for which the Fund pays a monthly management fee. The management fee is the sum of an individual fund fee rate that is based on an annual rate of .25% of the Fund's average net assets and an annualized group fee rate that averaged .12% during the period. The group fee rate is based upon the average net assets of all the mutual funds advised by FMR. The group fee rate decreases as assets under management increase and increases as assets under management decrease. For the period, the total annualized management fee rate was .37% of the Fund's average net assets.
Distribution and Service Plan Fees. In accordance with Rule 12b-1 of the 1940 Act, the Fund has adopted separate Distribution and Service Plans for each class of shares. Certain classes pay Fidelity Distributors Corporation (FDC), an affiliate of FMR, separate Distribution and Service Fees, each of which is based on an annual percentage of each class' average net assets. In addition, FDC may pay financial intermediaries for selling shares of the Fund and providing shareholder support services. For the period, the Distribution and Service Fee rates, total fees and amounts retained by FDC were as follows:
| Distribution
Fee | Service
Fee | Total Fees | Retained
by FDC |
Class A | -% | .25% | $ 456 | $ 29 |
Class T | -% | .25% | 34 | 1 |
Class B | .65% | .25% | 7 | 5 |
Class C | .75% | .25% | 422 | 139 |
| | | $ 919 | $ 174 |
Sales Load. FDC may receive a front-end sales charge of up to 2.75% for selling Class A shares and Class T shares, some of which is paid to financial intermediaries for selling shares of the Fund. Depending on the holding period, FDC may receive contingent deferred sales charges levied on Class A, Class T, Class B, and Class C redemptions. The deferred sales charges range from 3.00% to 1.00% for Class B shares, 1.00% for Class C
Semiannual Report
Notes to Financial Statements (Unaudited) - continued
(Amounts in thousands except percentages)
6. Fees and Other Transactions with Affiliates - continued
Sales Load - continued
shares, .75% or .50% for certain purchases of Class A shares and .25% for certain purchases of Class T shares.
For the period, sales charge amounts retained by FDC were as follows:
| Retained
by FDC |
Class A | $ 23 |
Class T | 5 |
Class B* | 1 |
Class C* | 11 |
| $ 40 |
* When Class B and Class C shares are initially sold, FDC pays commissions from its own resources to financial intermediaries through which the sales are made.
Transfer Agent and Accounting Fees. Citibank, N.A. (Citibank) is the custodian, transfer agent, and servicing agent for the Fund's Class A, Class T, Class B, Class C, Short-Intermediate Municipal Income and Institutional Class shares. Citibank has entered into a sub-arrangement with Fidelity Investments Institutional Operations Company, Inc. (FIIOC), an affiliate of FMR, with respect to all classes of the Fund, to perform the transfer agency, dividend disbursing, and shareholder servicing functions. FIIOC receives account fees and asset-based fees that vary according to the account size and type of account of the shareholders of the respective classes of the Fund. All fees are paid to FIIOC by Citibank, which is reimbursed by each class for such payments. FIIOC pays for typesetting, printing and mailing of shareholder reports, except proxy statements. For the period, transfer agent fees for each class were as follows:
| Amount | % of
Average
Net Assets* |
Class A | $ 276 | .15 |
Class T | 17 | .13 |
Class B | 1 | .15 |
Class C | 61 | .14 |
Short-Intermediate Municipal Income | 1,599 | .09 |
Institutional Class | 121 | .14 |
| $ 2,075 | |
* Annualized
Citibank also has a sub-arrangement with Fidelity Service Company, Inc. (FSC), an affiliate of FMR, under which FSC maintains the Fund's accounting records. The fee is based on the level of average net assets for the month.
Semiannual Report
7. Committed Line of Credit.
The Fund participates with other funds managed by FMR or an affiliate in a $4.25 billion credit facility (the "line of credit") to be utilized for temporary or emergency purposes to fund shareholder redemptions or for other short-term liquidity purposes. The Fund has agreed to pay commitment fees on its pro-rata portion of the line of credit, which amounted to $6 and is reflected in Miscellaneous expenses on the Statement of Operations. During the period, there were no borrowings on this line of credit.
8. Expense Reductions.
Through arrangements with the Fund's custodian, credits realized as a result of uninvested cash balances were used to reduce the Fund's expenses. During the period, these credits reduced the Fund's custody and accounting expenses by $22 and $108, respectively.
9. Distributions to Shareholders.
Distributions to shareholders of each class were as follows:
| Six months ended
June 30,
2012 | Year ended
December 31,
2011 |
From net investment income | | |
Class A | $ 2,581 | $ 4,211 |
Class T | 194 | 467 |
Class B | 6 | 27 |
Class C | 284 | 838 |
Short-Intermediate Municipal Income | 31,361 | 74,599 |
Institutional Class | 1,464 | 3,021 |
Total | $ 35,890 | $ 83,163 |
From net realized gain | | |
Class A | $ - | $ 216 |
Class T | - | 19 |
Class B | - | 1 |
Class C | - | 57 |
Short-Intermediate Municipal Income | - | 2,565 |
Institutional Class | - | 107 |
Total | $ - | $ 2,965 |
Semiannual Report
Notes to Financial Statements (Unaudited) - continued
(Amounts in thousands except percentages)
10. Share Transactions.
Transactions for each class of shares were as follows:
| Shares | Dollars |
| Six months ended
June 30,
2012 | Year ended
December 31,
2011 | Six months ended
June 30,
2012 | Year ended
December 31,
2011 |
Class A | | | | |
Shares sold | 14,034 | 22,096 | $ 152,609 | $ 237,519 |
Reinvestment of distributions | 191 | 303 | 2,077 | 3,252 |
Shares redeemed | (11,623) | (10,223) | (126,290) | (109,361) |
Net increase (decrease) | 2,602 | 12,176 | $ 28,396 | $ 131,410 |
Class T | | | | |
Shares sold | 349 | 881 | $ 3,775 | $ 9,442 |
Reinvestment of distributions | 15 | 35 | 159 | 373 |
Shares redeemed | (439) | (774) | (4,761) | (8,240) |
Net increase (decrease) | (75) | 142 | $ (827) | $ 1,575 |
Class B | | | | |
Shares sold | 15 | 27 | $ 171 | $ 297 |
Reinvestment of distributions | 1 | 2 | 4 | 19 |
Shares redeemed | (31) | (114) | (341) | (1,225) |
Net increase (decrease) | (15) | (85) | $ (166) | $ (909) |
Class C | | | | |
Shares sold | 1,738 | 2,509 | $ 18,857 | $ 26,904 |
Reinvestment of distributions | 20 | 62 | 219 | 661 |
Shares redeemed | (889) | (2,549) | (9,639) | (27,188) |
Net increase (decrease) | 869 | 22 | $ 9,437 | $ 377 |
Short-Intermediate Municipal Income | | | | |
Shares sold | 51,847 | 106,091 | $ 562,542 | $ 1,133,522 |
Reinvestment of distributions | 2,085 | 5,180 | 22,636 | 55,411 |
Shares redeemed | (46,093) | (111,332) | (500,105) | (1,186,447) |
Net increase (decrease) | 7,839 | (61) | $ 85,073 | $ 2,486 |
Institutional Class | | | | |
Shares sold | 8,229 | 8,223 | $ 89,360 | $ 87,964 |
Reinvestment of distributions | 69 | 115 | 754 | 1,228 |
Shares redeemed | (4,137) | (7,651) | (44,906) | (81,705) |
Net increase (decrease) | 4,161 | 687 | $ 45,208 | $ 7,487 |
11. Other.
The Fund's organizational documents provide former and current trustees and officers with a limited indemnification against liabilities arising in connection with the performance of their duties to the Fund. In the normal course of business, the Fund may also enter into contracts that provide general indemnifications. The Fund's maximum
Semiannual Report
11. Other - continued
exposure under these arrangements is unknown as this would be dependent on future claims that may be made against the Fund. The risk of material loss from such claims is considered remote.
Semiannual Report
Investment Adviser
Fidelity Management & Research Company
Boston, MA
Investment Sub-Advisers
Fidelity Investments Money
Management, Inc.
Fidelity Management & Research
(U.K.) Inc.
Fidelity Management & Research
(Hong Kong) Limited
Fidelity Management & Research
(Japan) Inc.
General Distributor
Fidelity Distributors Corporation
Smithfield, RI
Transfer and Service Agents
Citibank, N.A.
New York, NY
Fidelity Investments Institutional
Operations Company, Inc.
Boston, MA
Custodian
Citibank, N.A.
New York, NY
ASTM-USAN-0812
1.803547.108
(Fidelity Investment logo)(registered trademark)
(Fidelity Investment logo)(registered trademark)
Fidelity Advisor®
Short-Intermediate
Municipal Income
Fund - Institutional Class
Semiannual Report
June 30, 2012
(Fidelity Cover Art)
Institutional Class is a class of
Fidelity® Short-Intermediate
Municipal Income Fund
Contents
Shareholder Expense Example | (Click Here) | An example of shareholder expenses. |
Investment Changes | (Click Here) | A summary of major shifts in the fund's investments over the past six months. |
Investments | (Click Here) | A complete list of the fund's investments with their market values. |
Financial Statements | (Click Here) | Statements of assets and liabilities, operations, and changes in net assets, as well as financial highlights. |
Notes | (Click Here) | Notes to the financial statements. |
To view a fund's proxy voting guidelines and proxy voting record for the 12-month period ended June 30, visit http://www.fidelity.com/proxyvotingresults or visit the Securities and Exchange Commission's (SEC) web site at http://www.sec.gov. You may also call 1-877-208-0098 to request a free copy of the proxy voting guidelines.
Standard & Poor's, S&P and S&P 500 are registered service marks of The McGraw-Hill Companies, Inc. and have been licensed for use by Fidelity Distributors Corporation.
Other third party marks appearing herein are the property of their respective owners.
All other marks appearing herein are registered or unregistered trademarks or service marks of FMR LLC or an affiliated company. © 2012 FMR LLC. All rights reserved.
This report and the financial statements contained herein are submitted for the general information of the shareholders of the fund. This report is not authorized for distribution to prospective investors in the fund unless preceded or accompanied by an effective prospectus.
A fund files its complete schedule of portfolio holdings with the SEC for the first and third quarters of each fiscal year on Form N-Q. Forms N-Q are available on the SEC's web site at http://www.sec.gov. A fund's Forms N-Q may be reviewed and copied at the SEC's Public Reference Room in Washington, DC. Information regarding the operation of the SEC's Public Reference Room may be obtained by calling 1-800-SEC-0330. For a complete list of a fund's portfolio holdings, view the most recent holdings listing, semiannual report, or annual report on Fidelity's web site at http://www.fidelity.com, http://www.advisor.fidelity.com, or http://www.401k.com as applicable.
NOT FDIC INSURED • MAY LOSE VALUE • NO BANK GUARANTEE
Neither the fund nor Fidelity Distributors Corporation is a bank.
Semiannual Report
Shareholder Expense Example
As a shareholder of the Fund, you incur two types of costs: (1) transaction costs, including sales charges (loads) on purchase payments or redemption proceeds, redemption fees and (2) ongoing costs, including management fees, distribution and/or service (12b-1) fees and other Fund expenses. This Example is intended to help you understand your ongoing costs (in dollars) of investing in the Fund and to compare these costs with the ongoing costs of investing in other mutual funds.
The Example is based on an investment of $1,000 invested at the beginning of the period and held for the entire period (January 1, 2012 to June 30, 2012).
Actual Expenses
The first line of the accompanying table for each class of the Fund provides information about actual account values and actual expenses. You may use the information in this line, together with the amount you invested, to estimate the expenses that you paid over the period. Simply divide your account value by $1,000.00 (for example, an $8,600 account value divided by $1,000.00 = 8.6), then multiply the result by the number in the first line for a class of the Fund under the heading entitled "Expenses Paid During Period" to estimate the expenses you paid on your account during this period. A small balance maintenance fee of $12.00 that is charged once a year may apply for certain accounts with a value of less than $2,000. This fee is not included in the table below. If it was, the estimate of expenses you paid during the period would be higher, and your ending account value lower, by this amount. In addition, the Fund, as a shareholder in the underlying Fidelity Central Funds, will indirectly bear its pro-rata share of the fees and expenses incurred by the underlying Fidelity Central Funds. These fees and expenses are not included in the Fund's annualized expense ratio used to calculate the expense estimate in the table below.
Hypothetical Example for Comparison Purposes
The second line of the accompanying table for each class of the Fund provides information about hypothetical account values and hypothetical expenses based on a Class' actual expense ratio and an assumed rate of return of 5% per year before expenses, which is not the Class' actual return. The hypothetical account values and expenses may not be used to estimate the actual ending account balance or expenses you paid for the period. You may use this information to compare the ongoing costs of investing in the Fund and other funds. To do so, compare this 5% hypothetical example with the 5% hypothetical examples that appear in the shareholder reports of the other funds. A small balance maintenance fee of $12.00 that is charged once a year may apply for certain accounts with a value of less than $2,000. This fee is not included in the table below. If it was, the estimate of expenses you paid during the period would be higher, and your ending account value lower, by this amount. In addition, the Fund, as a shareholder in the underlying Fidelity Central Funds, will indirectly bear its pro-rata share of the fees and expenses incurred by the underlying Fidelity Central Funds. These fees and expenses are not included in the Fund's annualized expense ratio used to calculate the expense estimate in the table below.
Please note that the expenses shown in the table are meant to highlight your ongoing costs only and do not reflect any transaction costs. Therefore, the second line of the table is useful in comparing ongoing costs only, and will not help you determine the relative total costs of owning different funds. In addition, if these transactional costs were included, your costs would have been higher.
Semiannual Report
Shareholder Expense Example - continued
| Annualized
Expense Ratio | Beginning
Account Value
January 1, 2012 | Ending
Account Value
June 30, 2012 | Expenses Paid
During Period*
January 1, 2012
to June 30, 2012 |
Class A | .80% | | | |
Actual | | $ 1,000.00 | $ 1,010.80 | $ 4.00 |
HypotheticalA | | $ 1,000.00 | $ 1,020.89 | $ 4.02 |
Class T | .77% | | | |
Actual | | $ 1,000.00 | $ 1,011.00 | $ 3.85 |
HypotheticalA | | $ 1,000.00 | $ 1,021.03 | $ 3.87 |
Class B | 1.45% | | | |
Actual | | $ 1,000.00 | $ 1,008.50 | $ 7.24 |
HypotheticalA | | $ 1,000.00 | $ 1,017.65 | $ 7.27 |
Class C | 1.54% | | | |
Actual | | $ 1,000.00 | $ 1,007.10 | $ 7.69 |
HypotheticalA | | $ 1,000.00 | $ 1,017.21 | $ 7.72 |
Short-Intermediate Municipal Income | .48% | | | |
Actual | | $ 1,000.00 | $ 1,013.40 | $ 2.40 |
HypotheticalA | | $ 1,000.00 | $ 1,022.48 | $ 2.41 |
Institutional Class | .53% | | | |
Actual | | $ 1,000.00 | $ 1,013.10 | $ 2.65 |
HypotheticalA | | $ 1,000.00 | $ 1,022.23 | $ 2.66 |
A 5% return per year before expenses
* Expenses are equal to each Class' annualized expense ratio, multiplied by the average account value over the period, multiplied by 182/366 (to reflect the one-half year period).
Semiannual Report
Investment Changes (Unaudited)
Top Five States as of June 30, 2012 |
| % of fund's
net assets | % of fund's net assets
6 months ago |
New York | 12.6 | 13.3 |
California | 11.4 | 10.6 |
Florida | 8.3 | 7.0 |
Illinois | 7.4 | 7.5 |
Texas | 5.5 | 5.7 |
Top Five Sectors as of June 30, 2012 |
| % of fund's
net assets | % of fund's net assets
6 months ago |
General Obligations | 32.1 | 34.0 |
Electric Utilities | 12.8 | 13.4 |
Special Tax | 11.1 | 10.5 |
Health Care | 8.6 | 9.8 |
Water & Sewer | 5.7 | 4.1 |
Weighted Average Maturity as of June 30, 2012 |
| | 6 months ago |
Years | 3.2 | 3.3 |
This is a weighted average of all the maturities of the securities held in a fund. Weighted Average Maturity (WAM) can be used as a measure of sensitivity to interest rate changes and market changes. Generally, the longer the maturity, the greater the sensitivity to such changes. WAM is based on the dollar-weighted average length of time until principal payments must be paid. Depending on the types of securities held in a fund, certain maturity shortening devices (e.g., demand features, interest rate resets, and call options) may be taken into account when calculating the WAM. |
Duration as of June 30, 2012 |
| | 6 months ago |
Years | 2.8 | 2.8 |
Duration estimates how much a bond fund's price will change with a change in comparable interest rates. If rates rise 1%, for example, a fund with a 5-year duration is likely to lose about 5% of its value. Other factors also can influence a bond fund's performance and share price. Accordingly, a bond fund's actual performance may differ from this example. Duration takes into account any call or put option embedded in the bonds. |
Quality Diversification (% of fund's net assets) |
As of June 30, 2012 | As of December 31, 2011 |
 | AAA 8.5% | |  | AAA 6.4% | |
 | AA,A 69.7% | | | AA,A 71.5% | |
 | BBB 4.2% | | | BBB 5.5% | |
 | BB and Below 0.1% | | | BB and Below 0.1% | |
 | Not Rated 1.6% | | | Not Rated 2.1% | |
 | Short-Term
Investments and
Net Other Assets 15.9% | | | Short-Term
Investments and
Net Other Assets 14.4% | |
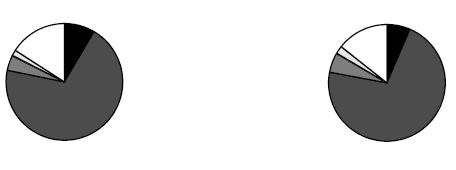
We have used ratings from Moody's Investors Service, Inc. Where Moody's® ratings are not available, we have used S&P® ratings. All ratings are as of the date indicated and do not reflect subsequent changes. |
Semiannual Report
Investments June 30, 2012 (Unaudited)
Showing Percentage of Net Assets
Municipal Bonds - 83.7% |
| Principal
Amount (000s) | | Value (000s) |
Alabama - 0.2% |
Jefferson County Swr. Rev. Series 2002 B, 5% 2/1/41 (Pre-Refunded to 8/1/12 @ 100) | | $ 2,070 | | $ 2,077 |
Mobile Indl. Dev. Board Poll. Cont. Rev. Bonds Series 2007 B, 4.875%, tender 3/19/13 (b) | | 2,615 | | 2,693 |
Pell City Spl. Care Facilities Rev. (Noland Health Svcs., Inc. Proj.) Series 2007 A, 5% 12/1/12 (Escrowed to Maturity) | | 750 | | 765 |
Univ. of Alabama at Birmingham Hosp. Rev. Series 2008 A, 5% 9/1/13 | | 1,175 | | 1,231 |
| | 6,766 |
Arizona - 3.4% |
Arizona Ctfs. of Partnership Series 2010 A: | | | | |
5% 10/1/14 (FSA Insured) | | 5,000 | | 5,415 |
5% 10/1/16 (FSA Insured) | | 13,000 | | 14,816 |
Arizona Health Facilities Auth. Rev. (Banner Health Sys. Proj.): | | | | |
Series 2008 A, 5% 1/1/13 | | 2,000 | | 2,045 |
Series 2008 D: | | | | |
5% 1/1/13 | | 3,250 | | 3,324 |
5% 1/1/14 | | 2,000 | | 2,130 |
Arizona School Facilities Board Ctfs. of Prtn.: | | | | |
Series 2004 B, 5.25% 9/1/15 (FSA Insured) | | 6,470 | | 6,985 |
Series 2005 A1, 5% 9/1/14 (Nat'l. Pub. Fin. Guarantee Corp. Insured) | | 2,000 | | 2,176 |
Series 2005 A2, 5% 9/1/16 (Nat'l. Pub. Fin. Guarantee Corp. Insured) | | 11,000 | | 12,171 |
Series 2008: | | | | |
5.5% 9/1/13 | | 18,780 | | 19,874 |
5.5% 9/1/16 | | 1,385 | | 1,603 |
Series A, 5% 9/1/12 (Nat'l. Pub. Fin. Guarantee Corp. Insured) | | 3,280 | | 3,304 |
Arizona Wtr. Infrastructure Fin. Auth. Rev. Series 2009 A: | | | | |
5% 10/1/18 | | 1,000 | | 1,225 |
5% 10/1/20 | | 5,180 | | 6,328 |
Coconino County Poll. Cont. Corp. Rev. Bonds (Arizona Pub. Svc. Co. Navajo Proj.) Series 2009 A, 5.5%, tender 6/1/14 (b) | | 6,000 | | 6,481 |
Maricopa County Poll. Cont. Rev. Bonds (Arizona Pub. Svc. Co. Palo Verde Proj.) Series 2009 A, 6%, tender 5/1/14 (b) | | 4,800 | | 5,211 |
Municipal Bonds - continued |
| Principal
Amount (000s) | | Value (000s) |
Arizona - continued |
Mesa Hwy. Proj. Advancement Series 2011 A: | | | | |
5% 7/1/17 | | $ 12,085 | | $ 13,429 |
5% 7/1/18 | | 5,200 | | 5,801 |
Navajo County Poll. Cont. Corp. Rev. Bonds (Arizona Pub. Svc. Co. Cholla Proj.) Series 2009 A, 1.25%, tender 5/30/14 (b) | | 2,800 | | 2,801 |
Phoenix Civic Impt. Corp. Excise Tax Rev. Series 2003 A, 5% 7/1/12 (Nat'l. Pub. Fin. Guarantee Corp. Insured) | | 750 | | 750 |
Phoenix Civic Impt. Corp. Wtr. Sys. Rev.: | | | | |
Series 2009 A, 5% 7/1/15 | | 5,835 | | 6,589 |
Series 2009 B, 5% 7/1/16 | | 5,090 | | 5,943 |
Pima County Swr. Sys. Rev. Series 2011 B, 5% 7/1/19 | | 3,225 | | 3,844 |
Tucson Gen. Oblig. Series 2005, 5% 7/1/16 (Nat'l. Pub. Fin. Guarantee Corp. Insured) | | 1,250 | | 1,404 |
Tucson Wtr. Rev. Series 2001 A, 5% 7/1/15 (Nat'l. Pub. Fin. Guarantee Corp. Insured) | | 1,645 | | 1,726 |
Univ. Med. Ctr. Corp. Hosp. Rev. Series 2011: | | | | |
5% 7/1/16 | | 3,055 | | 3,405 |
5% 7/1/17 | | 3,315 | | 3,735 |
5% 7/1/18 | | 3,365 | | 3,810 |
| | 146,325 |
California - 11.3% |
California Dept. of Wtr. Resources (Central Valley Proj.) Series AM, 5% 12/1/13 (a) | | 3,000 | | 3,095 |
California Dept. of Wtr. Resources Pwr. Supply Rev.: | | | | |
Series 2010 L, 5% 5/1/17 | | 12,000 | | 14,310 |
Series 2010 M, 5% 5/1/16 | | 8,000 | | 9,305 |
California Econ. Recovery: | | | | |
Bonds Series B, 5%, tender 7/1/14 (b) | | 5,000 | | 5,407 |
Series 2004 A, 5.25% 7/1/12 | | 6,010 | | 6,010 |
Series 2009 A: | | | | |
5% 7/1/15 | | 3,660 | | 3,971 |
5% 7/1/15 (Pre-Refunded to 7/1/14 @ 100) | | 2,540 | | 2,774 |
5.25% 7/1/13 (Escrowed to Maturity) | | 1,185 | | 1,243 |
5.25% 7/1/13 (Nat'l. Pub. Fin. Guarantee Corp. Insured) | | 1,255 | | 1,317 |
5.25% 7/1/14 | | 1,780 | | 1,948 |
5.25% 7/1/14 (Escrowed to Maturity) | | 520 | | 571 |
California Gen. Oblig.: | | | | |
5% 9/1/12 | | 1,700 | | 1,712 |
5% 10/1/12 | | 12,600 | | 12,739 |
5% 11/1/13 | | 9,060 | | 9,602 |
Municipal Bonds - continued |
| Principal
Amount (000s) | | Value (000s) |
California - continued |
California Gen. Oblig.: - continued | | | | |
5% 9/1/18 | | $ 7,500 | | $ 8,879 |
5% 9/1/19 | | 20,000 | | 23,878 |
5% 9/1/20 | | 20,000 | | 23,912 |
California Health Facilities Fing. Auth. Rev.: | | | | |
(Catholic Healthcare West Proj.) Series 2008 H, 5.125% 7/1/22 | | 2,495 | | 2,738 |
(Children's Hosp. of Orange County Proj.) Series 2009 A, 5% 11/1/13 | | 1,100 | | 1,152 |
(Sutter Health Proj.) Series 2008 A, 5% 8/15/12 | | 1,325 | | 1,332 |
Bonds: | | | | |
(Catholic Healthcare West Proj.): | | | | |
Series 2009 D, 5%, tender 7/1/14 (b) | | 2,900 | | 3,123 |
Series 2009 F, 5%, tender 7/1/14 (b) | | 3,200 | | 3,446 |
(St. Joseph Health Sys. Proj.) Series 2009 C, 5%, tender 10/16/14 (b) | | 4,300 | | 4,669 |
California Poll. Cont. Fing. Auth. Ctfs. of Prtn. (San Diego Gas & Elec. Co. Proj.) 5.9% 6/1/14 (Nat'l. Pub. Fin. Guarantee Corp. Insured) | | 34,000 | | 37,164 |
California Poll. Cont. Fing. Auth. Solid Waste Disp. Rev. Bonds (Waste Mgmt., Inc. Proj.) Series 2003 A, 5%, tender 5/1/13 (b)(e) | | 2,300 | | 2,375 |
California Pub. Works Board Lease Rev.: | | | | |
(Dept. of Corrections & Rehab. Proj.) Series 2011 C, 5% 10/1/18 | | 1,750 | | 2,050 |
(Univ. Proj.) Series 2011 B: | | | | |
5% 10/1/18 | | 2,740 | | 3,185 |
5% 10/1/19 | | 1,490 | | 1,726 |
(Various Cap. Projects) Series 2011 A: | | | | |
5% 10/1/18 | | 6,475 | | 7,584 |
5% 10/1/19 | | 5,000 | | 5,787 |
5% 10/1/20 | | 2,525 | | 2,931 |
(Various Cap. Projs.) Series 2012 A, 5% 4/1/21 | | 1,000 | | 1,152 |
(Various Judicial Council Projects) Series 2011 D, 5% 12/1/19 | | 4,100 | | 4,768 |
Series 2009 J, 5% 11/1/17 | | 2,300 | | 2,657 |
Series 2010 A: | | | | |
5% 3/1/16 | | 2,000 | | 2,236 |
5% 3/1/17 | | 5,405 | | 6,156 |
California State Univ. Rev. Series 2007 C, 5% 11/1/13 (FSA Insured) | | 1,335 | | 1,418 |
Municipal Bonds - continued |
| Principal
Amount (000s) | | Value (000s) |
California - continued |
California Statewide Cmntys. Dev. Auth. Rev.: | | | | |
(State of California Proposition 1A Receivables Prog.) Series 2009: | | | | |
4% 6/15/13 | | $ 1,000 | | $ 1,034 |
5% 6/15/13 | | 16,650 | | 17,381 |
Bonds: | | | | |
Series 2002 C, 5%, tender 5/1/17 (b) | | 4,000 | | 4,657 |
Series 2009 E2, 5%, tender 5/1/17 (b) | | 2,000 | | 2,328 |
East Bay Muni. Util. District Wtr. Sys. Rev. Bonds Series 2011 A2, 0.53%, tender 7/1/14 (b) | | 56,000 | | 56,033 |
Golden State Tobacco Securitization Corp. Tobacco Settlement Rev. Series 2003 B: | | | | |
5.5% 6/1/43 (Pre-Refunded to 6/1/13 @ 100) | | 2,000 | | 2,095 |
5.625% 6/1/38 (Pre-Refunded to 6/1/13 @ 100) | | 3,030 | | 3,177 |
Los Angeles County Metropolitan Trans. Auth. Sales Tax Rev.: | | | | |
Series 2009 A, 5% 7/1/13 | | 4,155 | | 4,351 |
Series 2009 B, 5% 7/1/17 | | 12,905 | | 15,495 |
Los Angeles County Pub. Works Fing. Auth. Lease Rev. Series 2010 A, 5% 8/1/17 | | 5,000 | | 5,738 |
Los Angeles Gen. Oblig. Series 2011 B, 5% 9/1/18 | | 20,960 | | 25,354 |
Los Angeles Muni. Impt. Corp. Lease Rev. Series 2012 C: | | | | |
4.625% 3/1/18 | | 1,500 | | 1,702 |
5% 3/1/19 | | 2,935 | | 3,396 |
Los Angeles Unified School District Series 2009 KRY, 5% 7/1/13 | | 10,740 | | 11,243 |
Los Angeles Unified School District Ctfs. of Prtn. (Multiple Properties Proj.) Series 2010 A: | | | | |
5% 12/1/16 | | 2,025 | | 2,328 |
5% 12/1/17 | | 9,790 | | 11,369 |
Los Angeles Wastewtr. Sys. Rev. Series 2009 A, 5% 6/1/15 | | 12,240 | | 13,812 |
Monterey County Pub. Impt. Corp. Ctfs. of Prtn. (Refing. Proj.) Series 2009, 5% 8/1/17 (FSA Insured) | | 2,130 | | 2,468 |
Newport Beach Rev. Bonds (Hoag Memorial Hosp. Presbyterian Proj.) Series 2009 E, 5%, tender 2/7/13 (b) | | 2,500 | | 2,564 |
Northern California Pwr. Agcy. Rev.: | | | | |
(Geothermal #3 Proj.) Series 2009 A: | | | | |
5% 7/1/13 | | 1,020 | | 1,065 |
5% 7/1/14 | | 1,120 | | 1,214 |
5% 7/1/15 | | 2,170 | | 2,430 |
Municipal Bonds - continued |
| Principal
Amount (000s) | | Value (000s) |
California - continued |
Northern California Pwr. Agcy. Rev.: - continued | | | | |
(Hydroelectric #1 Proj.) Series 2010 A: | | | | |
4% 7/1/15 | | $ 2,000 | | $ 2,181 |
5% 7/1/18 | | 2,000 | | 2,386 |
Poway Unified School District Pub. Fing. Auth. Lease Rev. Bonds Series 2008 B, 0%, tender 12/1/14 (FSA Insured) (b) | | 7,115 | | 6,875 |
Riverside County Asset Leasing Rev. (Riverside Cap. Proj.) Series 2012 A: | | | | |
4% 6/1/17 (a) | | 1,750 | | 1,932 |
5% 6/1/17 (a) | | 3,700 | | 4,257 |
5% 6/1/18 (a) | | 6,470 | | 7,491 |
Sacramento Muni. Util. District Elec. Rev. Series 2011 X, 5% 8/15/21 | | 4,000 | | 4,828 |
Sacramento Pwr. Auth. Cogeneration Proj. Rev. Series 2005 A, 5% 7/1/18 (AMBAC Insured) | | 2,890 | | 3,084 |
San Bernardino County Ctfs. of Prtn. (Arrowhead Proj.) Series 2009 A: | | | | |
5% 8/1/16 | | 5,450 | | 6,014 |
5% 8/1/18 | | 8,000 | | 8,995 |
San Diego Cmnty. College District Series 2007, 0% 8/1/16 (FSA Insured) | | 1,160 | | 1,113 |
San Diego Pub. Facilities Fing. Auth. Swr. Rev.: | | | | |
Series 2009 A: | | | | |
5% 5/15/13 | | 5,415 | | 5,635 |
5% 5/15/15 | | 1,845 | | 2,070 |
Series 2009 B, 5% 5/15/14 | | 7,000 | | 7,591 |
| | 484,008 |
Colorado - 0.2% |
Colorado Health Facilities Auth. Rev.: | | | | |
(Adventist Health Sys./Sunbelt Proj.) Series 2006 F: | | | | |
5% 11/15/12 | | 380 | | 386 |
5% 11/15/12 (Escrowed to Maturity) | | 845 | | 860 |
Bonds (Catholic Health Initiatives Proj.) Series 2008 C4, 4%, tender 11/12/15 (b) | | 4,200 | | 4,626 |
Univ. of Colorado Enterprise Sys. Rev. Series 2009 A, 5% 6/1/17 | | 500 | | 593 |
| | 6,465 |
Connecticut - 1.6% |
Connecticut Dev. Auth. Poll. Cont. Rev. Bonds Series 2011 A, 1.55%, tender 4/1/15 (b)(e) | | 4,300 | | 4,318 |
Municipal Bonds - continued |
| Principal
Amount (000s) | | Value (000s) |
Connecticut - continued |
Connecticut Gen. Oblig. (Econ. Recovery Proj.) Series 2009 A, 5% 1/1/15 | | $ 29,500 | | $ 32,702 |
Connecticut Health & Ed. Rev.: | | | | |
Bonds (Ascension Health Cr. Group Proj.) Series 1998 B, 1.55%, tender 2/1/17 (b) | | 2,700 | | 2,719 |
Series D, 4% 7/1/14 | | 1,000 | | 1,058 |
Connecticut Spl. Tax Oblig. Trans. Infrastructure Rev.: | | | | |
Series 1998 A, 5.5% 10/1/13 (Nat'l. Pub. Fin. Guarantee Corp. Insured) | | 4,300 | | 4,577 |
Series 2009 1: | | | | |
5% 2/1/14 | | 2,500 | | 2,677 |
5% 2/1/15 | | 11,995 | | 13,327 |
Series 2011 A, 5% 12/1/18 | | 5,575 | | 6,800 |
Hartford Gen. Oblig. Series A, 5% 8/15/12 (Assured Guaranty Corp. Insured) | | 1,000 | | 1,005 |
| | 69,183 |
District Of Columbia - 0.5% |
District of Columbia Gen. Oblig. Series 2007 B, 5% 6/1/16 (AMBAC Insured) | | 3,555 | | 4,094 |
District of Columbia Income Tax Rev. Series 2009 C, 5% 12/1/13 | | 5,500 | | 5,860 |
District of Columbia Rev. (Medlantic/Helix Proj.) Series 1998 C, 5% 8/15/15 (FSA Insured) | | 1,500 | | 1,636 |
District of Columbia Univ. Rev. Bonds (Georgetown Univ. Proj.) Series 2001 B, 4.7%, tender 4/1/18 (b) | | 8,500 | | 9,591 |
| | 21,181 |
Florida - 8.3% |
Alachua County Health Facilities Auth. Health Facilities Rev. (Shands Teaching Hospitals & Clinics, Inc. Proj.) Series 2010 B: | | | | |
5% 12/1/14 | | 4,000 | | 4,275 |
5% 12/1/15 | | 4,395 | | 4,794 |
Broward County Arpt. Sys. Rev. Series 2012 P1, 3% 10/1/13 (e) | | 4,000 | | 4,114 |
Broward County School Board Ctfs. of Prtn.: | | | | |
Series 2008 A, 5% 7/1/15 (FSA Insured) | | 5,495 | | 6,081 |
Series 2012 A: | | | | |
5% 7/1/19 | | 7,000 | | 8,165 |
5% 7/1/20 | | 15,070 | | 17,569 |
Citizens Property Ins. Corp.: | | | | |
Series 2010 A1, 5% 6/1/15 (FSA Insured) | | 14,000 | | 15,409 |
Municipal Bonds - continued |
| Principal
Amount (000s) | | Value (000s) |
Florida - continued |
Citizens Property Ins. Corp.: - continued | | | | |
Series 2010 A3, 1.93% 6/1/13 (b) | | $ 47,300 | | $ 47,694 |
Clay County Infrastructure Sales Surtax Rev. 5% 10/1/15 (Assured Guaranty Corp. Insured) | | 7,745 | | 8,516 |
Clearwater Wtr. and Swr. Rev.: | | | | |
Series 2009 B, 5% 12/1/14 | | 2,000 | | 2,191 |
Series 2011: | | | | |
4% 12/1/16 | | 1,265 | | 1,414 |
5% 12/1/17 | | 1,685 | | 1,974 |
5% 12/1/18 | | 685 | | 814 |
5% 12/1/19 | | 1,820 | | 2,180 |
5% 12/1/20 | | 1,000 | | 1,202 |
Collier County Indl. Dev. Auth. Healthcare Facilities Rev. (NCH Healthcare Sys. Proj.) Series 2011: | | | | |
5% 10/1/14 | | 1,355 | | 1,462 |
5% 10/1/16 | | 1,530 | | 1,724 |
5% 10/1/17 | | 1,455 | | 1,659 |
Escambia City Health Facilities Auth. Rev. (Ascension Health Cr. Group Proj.) Series 2003 A, 5.25% 11/15/13 | | 4,265 | | 4,545 |
Escambia County Solid Waste Disp. Rev. Bonds (Gulf Pwr. Co. Proj.) Series 2009, 1.35%, tender 6/2/15 (b) | | 1,900 | | 1,905 |
Florida Board of Ed. Series 2005 B, 5% 1/1/18 | | 21,080 | | 23,386 |
Florida Board of Ed. Lottery Rev. Series 2011 A, 5% 7/1/20 | | 8,600 | | 10,489 |
Florida Board of Ed. Pub. Ed. Cap. Outlay: | | | | |
Series 2009 C, 5% 6/1/20 | | 3,625 | | 4,455 |
Series 2009 D, 5.5% 6/1/16 | | 7,910 | | 9,370 |
Florida Gen. Oblig. (Dept. of Trans. Right-of-Way and Bridge Construction Proj.) Series 2005 B, 6.375% 7/1/13 | | 8,020 | | 8,505 |
Florida Hurricane Catastrophe Fund Fin. Corp. Rev. Series 2010 A, 5% 7/1/15 | | 20,000 | | 22,262 |
Greater Orlando Aviation Auth. Arpt. Facilities Rev. Series 2011 C: | | | | |
5% 10/1/19 | | 1,705 | | 2,052 |
5% 10/1/20 | | 1,000 | | 1,209 |
Highlands County Health Facilities Auth. Rev.: | | | | |
(Adventist Health Sys./Sunbelt, Inc. Prog.) Series 2009 E, 5% 11/15/15 | | 2,345 | | 2,633 |
Bonds (Adventist Health Sys./Sunbelt, Inc. Prog.): | | | | |
Series 2002, 3.95%, tender 9/1/12 (b) | | 16,650 | | 16,740 |
Series 2008 A, 6.1%, tender 11/14/13 (b) | | 1,000 | | 1,070 |
Municipal Bonds - continued |
| Principal
Amount (000s) | | Value (000s) |
Florida - continued |
Hillsborough County Indl. Dev. (H Lee Moffitt Cancer Ctr. Proj.) Series 2007 A, 5% 7/1/12 | | $ 1,310 | | $ 1,310 |
Hillsborough County Indl. Dev. Auth. Poll. Cont. Rev. Bonds (Tampa Elec. Co. Proj.) Series 2007 B, 5.15%, tender 9/1/13 (b) | | 1,750 | | 1,835 |
Indian River County Wtr. & Swr. Rev.: | | | | |
5% 9/1/15 | | 1,000 | | 1,116 |
5% 9/1/17 | | 1,000 | | 1,172 |
Jacksonville Elec. Auth. Elec. Sys. Rev. Series 2009 B, 5% 10/1/12 | | 7,350 | | 7,434 |
JEA Wtr. & Swr. Sys. Rev. Series 2010 D, 5% 10/1/21 | | 1,945 | | 2,357 |
Kissimmee Util. Auth. Elec. Sys. Rev.: | | | | |
Series 2003: | | | | |
5.25% 10/1/14 | | 775 | | 844 |
5.25% 10/1/15 | | 3,525 | | 3,958 |
Series 2011, 2% 10/1/12 | | 2,195 | | 2,204 |
Lakeland Hosp. Sys. Rev. Series 2011, 3% 11/15/12 | | 1,000 | | 1,005 |
Miami-Dade County Pub. Facilities Rev. (Jackson Health Sys. Proj.) Series 2005 B: | | | | |
5% 6/1/14 (Nat'l. Pub. Fin. Guarantee Corp. Insured) | | 4,790 | | 5,073 |
5% 6/1/19 (Nat'l. Pub. Fin. Guarantee Corp. Insured) | | 3,875 | | 4,188 |
Miami-Dade County Wtr. & Swr. Rev. Series 2008 A, 5% 10/1/14 (FSA Insured) | | 4,000 | | 4,365 |
North Brevard County Hosp. District Rev. (Parrish Med. Ctr. Proj.) Series 2008, 4.625% 10/1/12 | | 1,110 | | 1,119 |
Orange County Health Facilities Auth. (Orlando Health, Inc.) Series 2009: | | | | |
5% 10/1/15 | | 2,210 | | 2,443 |
5% 10/1/16 | | 1,000 | | 1,127 |
Orange County Health Facilities Auth. Rev.: | | | | |
(Adventist Health Sys. - Sunbelt Proj.) 5.625% 11/15/32 (Pre-Refunded to 11/15/12 @ 101) | | 2,500 | | 2,573 |
(Orlando Reg'l. Healthcare Sys. Proj.) Series 2008 A: | | | | |
5% 11/1/13 (FSA Insured) | | 1,000 | | 1,038 |
5% 11/1/15 (FSA Insured) | | 1,825 | | 2,027 |
Orlando & Orange County Expressway Auth. Rev. Series 2010 B, 5% 7/1/15 (FSA Insured) | | 1,430 | | 1,569 |
Orlando Utils. Commission Util. Sys. Rev.: | | | | |
Series 2009 C, 5% 10/1/17 | | 1,500 | | 1,786 |
Series 2010 C, 5% 10/1/17 | | 1,895 | | 2,256 |
Series 2011 B: | | | | |
5% 10/1/18 | | 2,250 | | 2,716 |
5% 10/1/19 | | 2,325 | | 2,842 |
Municipal Bonds - continued |
| Principal
Amount (000s) | | Value (000s) |
Florida - continued |
Pasco County Solid Waste Disp. & Resource Recovery Sys. Rev.: | | | | |
Series 2011: | | | | |
5% 10/1/17 (e) | | $ 4,465 | | $ 5,007 |
5% 10/1/19 (e) | | 2,025 | | 2,277 |
5% 10/1/18 (e) | | 2,745 | | 3,078 |
Polk County School District Sales Tax Rev. Series 2007, 5% 10/1/12 (FSA Insured) | | 6,080 | | 6,143 |
Sarasota County School Board Ctfs. of Prtn. (Master Lease Prog.): | | | | |
5% 7/1/13 | | 3,435 | | 3,589 |
5% 7/1/14 | | 2,000 | | 2,149 |
Tampa Bay Wtr. Reg'l. Wtr. Supply Auth. Util. Sys. Rev.: | | | | |
Series 2011 B, 5% 10/1/18 | | 4,700 | | 5,704 |
Series 2011, 5% 10/1/19 | | 5,590 | | 6,880 |
Tampa Health Sys. Rev. (Baycare Health Sys. Proj.) Series 2010: | | | | |
5% 11/15/16 | | 2,500 | | 2,896 |
5% 11/15/17 | | 1,500 | | 1,769 |
Tampa Solid Waste Sys. Rev. Series 2010: | | | | |
4% 10/1/14 (FSA Insured) (e) | | 3,000 | | 3,201 |
5% 10/1/15 (FSA Insured) (e) | | 2,920 | | 3,278 |
5% 10/1/16 (FSA Insured) (e) | | 6,000 | | 6,899 |
5% 10/1/17 (FSA Insured) (e) | | 5,000 | | 5,829 |
Titusville Wtr. & Swr. Rev. Series 2010, 5% 10/1/17 (Assured Guaranty Corp. Insured) | | 1,135 | | 1,318 |
| | 358,232 |
Georgia - 3.0% |
Appling County Dev. Auth. Poll. Cont. Rev. Bonds (Oglethorpe Pwr. Corp. Hatch Proj.) Series 2011 A, 2.5%, tender 3/1/13 (b) | | 5,000 | | 5,058 |
Atlanta Arpt. Rev. Series 2011 B, 5% 1/1/13 (e) | | 1,000 | | 1,021 |
Burke County Indl. Dev. Auth. Poll. Cont. Rev. Bonds: | | | | |
(Georgia Pwr. Co. Plant Vogtle Proj.): | | | | |
Fifth Series 1994, 2.3%, tender 4/1/14 (b) | | 8,000 | | 8,194 |
Fourth Series 1995: | | | | |
1.2%, tender 4/1/14 (b) | | 3,450 | | 3,474 |
1.2%, tender 4/1/14 (b) | | 4,800 | | 4,833 |
(Oglethorpe Pwr. Corp. Vogtle Proj.) Series 2011 A, 2.5%, tender 3/1/13 (b) | | 3,500 | | 3,541 |
Municipal Bonds - continued |
| Principal
Amount (000s) | | Value (000s) |
Georgia - continued |
Fulton County Facilities Corp. Ctfs. of Prtn. (Gen. Purp. Proj.) Series 2009: | | | | |
5% 11/1/12 | | $ 1,555 | | $ 1,577 |
5% 11/1/13 | | 7,550 | | 7,988 |
5% 11/1/14 | | 7,490 | | 8,098 |
Fulton County Wtr. & Swr. Rev. Series 2011: | | | | |
5% 1/1/19 | | 4,000 | | 4,821 |
5% 1/1/20 | | 4,000 | | 4,865 |
Main Street Natural Gas, Inc. Georgia Gas Proj. Rev. Series 2007 A, 5% 9/15/12 | | 1,195 | | 1,202 |
Monroe County Dev. Auth. Poll. Cont. Rev. Bonds: | | | | |
(Georgia Pwr. Co. Plant Scherer Proj.) First Series 1995, 0.8%, tender 7/1/14 (b) | | 17,900 | | 17,907 |
(Oglethorpe Pwr. Corp. Scherer Proj.) Series 2011 A, 2.5%, tender 3/1/13 (b) | | 11,500 | | 11,634 |
Muni. Elec. Auth. of Georgia: | | | | |
(Combined Cycle Proj.) Series A, 5% 11/1/18 | | 2,000 | | 2,383 |
(Proj. One): | | | | |
Series 2008 A: | | | | |
5% 1/1/13 | | 2,000 | | 2,044 |
5.25% 1/1/17 (Berkshire Hathaway Assurance Corp. Insured) | | 7,925 | | 9,305 |
Series 2008 D: | | | | |
5.75% 1/1/19 | | 14,890 | | 18,102 |
5.75% 1/1/20 | | 3,555 | | 4,317 |
Pub. Gas Partners, Inc. Rev. (Gas Supply Pool No. 1 Proj.) Series A, 5% 10/1/12 | | 1,000 | | 1,010 |
Richmond County Hosp. Auth. (Univ. Health Svcs., Inc. Proj.) Series 2009: | | | | |
5% 1/1/14 | | 1,305 | | 1,379 |
5% 1/1/15 | | 1,040 | | 1,126 |
5% 1/1/16 | | 2,415 | | 2,661 |
5% 1/1/18 | | 1,530 | | 1,716 |
| | 128,256 |
Hawaii - 0.7% |
Hawaii Arpts. Sys. Rev.: | | | | |
Series 2010 B, 5% 7/1/15 (e) | | 3,900 | | 4,340 |
Series 2011, 5% 7/1/19 (e) | | 4,000 | | 4,668 |
Hawaii Gen. Oblig.: | | | | |
Series DR: | | | | |
5% 6/1/16 | | 7,645 | | 8,884 |
5% 6/1/16 (Escrowed to Maturity) | | 2,895 | | 3,384 |
Municipal Bonds - continued |
| Principal
Amount (000s) | | Value (000s) |
Hawaii - continued |
Hawaii Gen. Oblig.: - continued | | | | |
Series DY: | | | | |
5% 2/1/15 | | $ 3,500 | | $ 3,894 |
5% 2/1/16 | | 4,000 | | 4,597 |
| | 29,767 |
Illinois - 7.4% |
Chicago Board of Ed. Series 2009 D: | | | | |
5% 12/1/17 (Assured Guaranty Corp. Insured) | | 4,115 | | 4,800 |
5% 12/1/18 (Assured Guaranty Corp. Insured) | | 2,335 | | 2,754 |
Chicago Gen. Oblig.: | | | | |
(City Colleges Proj.): | | | | |
Series 1999: | | | | |
0% 1/1/17 (Nat'l. Pub. Fin. Guarantee Corp. Insured) | | 7,200 | | 6,526 |
0% 1/1/18 (Nat'l. Pub. Fin. Guarantee Corp. Insured) | | 3,000 | | 2,608 |
0% 1/1/19 (Nat'l. Pub. Fin. Guarantee Corp. Insured) | | 9,805 | | 8,139 |
Series1999, 0% 1/1/20 (Nat'l. Pub. Fin. Guarantee Corp. Insured) | | 14,755 | | 11,616 |
Series 2012 B: | | | | |
5.125% 1/1/15 | | 995 | | 1,108 |
5.125% 1/1/15 (AMBAC Insured) | | 3,000 | | 3,269 |
Series A, 5% 1/1/17 (FSA Insured) | | 3,465 | | 3,920 |
Series B, 5% 1/1/17 (FSA Insured) | | 5,115 | | 5,792 |
Chicago Hsg. Auth. Rev. (Cap. Prog.) Series 2001, 5.5% 7/1/18 | | 2,850 | | 2,850 |
Chicago Midway Arpt. Rev. Bonds Series 2010 B, 5%, tender 1/1/15 (b) | | 5,000 | | 5,404 |
Chicago O'Hare Int'l. Arpt. Rev.: | | | | |
Series 2008 A, 5% 1/1/13 (FSA Insured) | | 4,000 | | 4,089 |
Series 2010 D, 5.25% 1/1/17 (e) | | 1,000 | | 1,155 |
Series 2010 E: | | | | |
5% 1/1/15 (e) | | 4,000 | | 4,382 |
5% 1/1/16 (e) | | 1,500 | | 1,688 |
Series 2011 B, 5% 1/1/18 | | 6,500 | | 7,564 |
Chicago Sales Tax Rev. Series 1998, 5.5% 1/1/16 (FGIC Insured) (FSA Insured) | | 1,710 | | 1,964 |
Chicago Transit Auth. Cap. Grant Receipts Rev.: | | | | |
(Fed. Transit Administration Section 5309 Proj.) Series 2008 A, 5% 6/1/13 | | 3,765 | | 3,900 |
5% 6/1/19 (Assured Guaranty Corp. Insured) | | 2,085 | | 2,329 |
Municipal Bonds - continued |
| Principal
Amount (000s) | | Value (000s) |
Illinois - continued |
Chicago Transit Auth. Cap. Grant Receipts Rev.: - continued | | | | |
5% 6/1/19 (Assured Guaranty Corp. Insured) (Pre-Refunded to 12/1/16 @ 100) | | $ 415 | | $ 492 |
Cook County Thorton Township High School District #205 5.5% 12/1/16 (Assured Guaranty Corp. Insured) | | 2,500 | | 2,935 |
Illinois Fin. Auth. Gas Supply Rev. Bonds (The Peoples Gas Lt. and Coke Co. Proj.): | | | | |
Series 2010 B, 2.625%, tender 8/1/15 (b) | | 9,500 | | 9,771 |
Series 2010, 2.125%, tender 7/1/14 (b) | | 11,500 | | 11,597 |
Illinois Fin. Auth. Hosp. Rev. (KishHealth Sys. Proj.) Series 2008, 5.25% 10/1/15 | | 2,220 | | 2,438 |
Illinois Fin. Auth. Rev.: | | | | |
(Advocate Health Care Proj.) Series 2010 D, 5% 4/1/15 | | 550 | | 611 |
(Northwest Cmnty. Hosp. Proj.) Series 2008 A: | | | | |
5% 7/1/12 | | 750 | | 750 |
5% 7/1/13 | | 415 | | 431 |
5% 7/1/15 | | 1,000 | | 1,100 |
(Palos Cmnty. Hosp. Proj.) Series 2010 C: | | | | |
5% 5/15/16 | | 2,060 | | 2,292 |
5% 5/15/17 | | 3,520 | | 3,958 |
(Provena Health Proj.) Series 2010 A: | | | | |
5% 5/1/13 | | 2,000 | | 2,069 |
5% 5/1/14 | | 2,000 | | 2,135 |
5.75% 5/1/19 | | 2,650 | | 3,141 |
(Rush Univ. Med. Ctr. Proj.) Series 2006 B: | | | | |
5% 11/1/15 (Nat'l. Pub. Fin. Guarantee Corp. Insured) | | 3,075 | | 3,380 |
5% 11/1/16 (Nat'l. Pub. Fin. Guarantee Corp. Insured) | | 1,700 | | 1,901 |
Bonds (Advocate Health Care Proj.) Series 2008 C B3, 4.375%, tender 7/1/14 (b) | | 4,000 | | 4,280 |
Illinois Gen. Oblig.: | | | | |
Series 1, 5.25% 8/1/12 (Escrowed to Maturity) | | 2,865 | | 2,876 |
Series 2002: | | | | |
5% 10/1/16 (Pre-Refunded to 10/1/12 @ 100) | | 3,515 | | 3,556 |
5.5% 8/1/15 (Nat'l. Pub. Fin. Guarantee Corp. Insured) | | 1,495 | | 1,657 |
Series 2003 A, 5.25% 10/1/13 (FSA Insured) | | 3,755 | | 3,973 |
Series 2004 B, 5% 3/1/14 | | 15,500 | | 16,462 |
Series 2004, 5% 11/1/16 | | 11,000 | | 12,360 |
Municipal Bonds - continued |
| Principal
Amount (000s) | | Value (000s) |
Illinois - continued |
Illinois Gen. Oblig.: - continued | | | | |
Series 2005: | | | | |
5% 4/1/13 (AMBAC Insured) | | $ 5,000 | | $ 5,161 |
5% 4/1/17 (AMBAC Insured) | | 8,050 | | 8,749 |
Series 2007 A, 5.5% 6/1/15 | | 1,000 | | 1,103 |
Series 2007 B, 5% 1/1/17 | | 9,835 | | 10,988 |
Series 2009 A, 3.5% 9/1/13 (Escrowed to Maturity) | | 3,000 | | 3,112 |
Series 2010: | | | | |
4% 1/1/13 | | 3,695 | | 3,756 |
5% 1/1/15 (FSA Insured) | | 20,000 | | 21,561 |
Series 2012: | | | | |
2% 2/1/13 | | 9,500 | | 9,575 |
3% 8/1/13 | | 4,800 | | 4,915 |
4% 3/1/14 | | 5,000 | | 5,229 |
5% 3/1/13 | | 5,000 | | 5,143 |
5% 3/1/19 | | 5,500 | | 6,209 |
Illinois Health Facilities Auth. Rev.: | | | | |
(Delnor-Cmnty. Hosp. Proj.) Series 2003 A: | | | | |
5% 5/15/15 (FSA Insured) | | 2,250 | | 2,467 |
5% 5/15/16 (FSA Insured) | | 2,325 | | 2,610 |
Series 2003 A, 5% 5/15/17 (FSA Insured) | | 2,150 | | 2,461 |
Illinois Sales Tax Rev.: | | | | |
Series 2009 B: | | | | |
4.5% 6/15/16 | | 5,000 | | 5,667 |
4.5% 6/15/17 | | 6,075 | | 6,990 |
Series 2010, 5% 6/15/15 | | 8,800 | | 9,865 |
Series 2011, 4% 6/15/13 | | 2,600 | | 2,688 |
Lake County Cmnty. Consolidated School District #73 Gen. Oblig.: | | | | |
0% 12/1/15 (Escrowed to Maturity) | | 580 | | 564 |
0% 12/1/15 (Nat'l. Pub. Fin. Guarantee Corp. Insured) | | 1,520 | | 1,412 |
Metropolitan Pier & Exposition: | | | | |
(McCormick Place Expansion Proj.) Series 1996 A, 0% 12/15/13 (Nat'l. Pub. Fin. Guarantee Corp. Insured) | | 2,725 | | 2,662 |
Series A, 0% 6/15/14 (Escrowed to Maturity) | | 8,625 | | 8,522 |
0% 6/15/14 (Nat'l. Pub. Fin. Guarantee Corp. Insured) | | 700 | | 673 |
Univ. of Illinois Rev. 0% 4/1/14 | | 2,350 | | 2,305 |
Will County Cmnty. Unit School District #365-U: | | | | |
0% 11/1/14 (Escrowed to Maturity) | | 1,025 | | 1,007 |
Municipal Bonds - continued |
| Principal
Amount (000s) | | Value (000s) |
Illinois - continued |
Will County Cmnty. Unit School District #365-U: - continued | | | | |
0% 11/1/14 (FSA Insured) | | $ 875 | | $ 849 |
0% 11/1/16 (Escrowed to Maturity) | | 740 | | 708 |
0% 11/1/16 (FSA Insured) | | 2,235 | | 2,064 |
| | 319,037 |
Indiana - 1.8% |
Indiana Fin. Auth. Health Sys. Rev. (Sisters of Saint Francis Health Svcs., Inc. Obligated Group Proj.) Series 2008 C, 5% 11/1/13 | | 3,000 | | 3,174 |
Indiana Fin. Auth. Hosp. Rev. (Parkview Health Sys. Oblig. Group Proj.) Series 2009 A: | | | | |
5% 5/1/14 | | 3,500 | | 3,742 |
5% 5/1/15 | | 6,420 | | 7,046 |
Indiana Fin. Auth. Rev.: | | | | |
(Trinity Health Cr. Group Proj.) Series 2009 A: | | | | |
5% 12/1/14 | | 1,250 | | 1,379 |
5% 12/1/15 | | 2,135 | | 2,423 |
(Wabash Valley Correctional Facilities Proj.) Series 2009 A, 5% 7/1/15 | | 8,025 | | 8,868 |
(Wabash Valley Correctional Facility Proj.) Series 2009 A, 5% 7/1/14 | | 2,500 | | 2,702 |
Series 2010 A, 5% 2/1/17 | | 2,800 | | 3,302 |
Indiana Health & Edl. Facilities Fing. Auth. Rev. Bonds (Ascension Health Sr. Cr. Group Proj.) Series 2006 B1, 4.1%, tender 11/3/16 (b) | | 4,000 | | 4,477 |
Indiana Health Facility Fing. Auth. Rev. Bonds (Ascension Health Cr. Group Proj.): | | | | |
Series 2001 A1, 1.5%, tender 8/1/14 (b) | | 3,400 | | 3,461 |
Series 2001 A2, 1.6%, tender 2/1/17 (b) | | 2,200 | | 2,200 |
Indiana Muni. Pwr. Agcy. Pwr. Supply Sys. Rev. Series 2011 A: | | | | |
5% 1/1/19 | | 1,470 | | 1,739 |
5% 1/1/20 | | 1,250 | | 1,486 |
Indianapolis Local Pub. Impt. Bond Bank (Wtrwks. Proj.): | | | | |
Series 2002 A, 5.5% 7/1/16 | | 5,000 | | 5,000 |
Series F, 5% 7/1/15 (Nat'l. Pub. Fin. Guarantee Corp. Insured) | | 515 | | 572 |
Indianapolis Thermal Energy Sys. Series 2010 B: | | | | |
5% 10/1/16 | | 5,000 | | 5,679 |
5% 10/1/17 | | 5,000 | | 5,788 |
Municipal Bonds - continued |
| Principal
Amount (000s) | | Value (000s) |
Indiana - continued |
Jasper County Indl. Poll. Ctl. Rev. (Northern Indiana Pub. Svc. Co. Proj.) Series 1988 B, 5.2% 6/1/13 (Nat'l. Pub. Fin. Guarantee Corp. Insured) | | $ 3,000 | | $ 3,107 |
Logansport High School Bldg. Corp. Series 2005, 5.25% 7/15/12 (Nat'l. Pub. Fin. Guarantee Corp. Insured) | | 1,075 | | 1,076 |
Muncie School Bldg. Corp. Series 2005, 5.25% 7/10/12 (Nat'l. Pub. Fin. Guarantee Corp. Insured) | | 1,585 | | 1,586 |
Purdue Univ. Rev.: | | | | |
(Student Facilities Sys. Proj.) Series 2009 B: | | | | |
4% 7/1/17 | | 500 | | 569 |
5% 7/1/15 | | 315 | | 354 |
5% 7/1/16 | | 500 | | 578 |
Series Z-1: | | | | |
5% 7/1/16 | | 1,215 | | 1,404 |
5% 7/1/17 | | 1,000 | | 1,181 |
5% 7/1/18 | | 1,500 | | 1,807 |
Univ. of Southern Indiana Rev. Series J: | | | | |
5% 10/1/14 (Assured Guaranty Corp. Insured) | | 1,985 | | 2,145 |
5% 10/1/15 (Assured Guaranty Corp. Insured) | | 1,000 | | 1,111 |
5% 10/1/16 (Assured Guaranty Corp. Insured) | | 1,165 | | 1,327 |
| | 79,283 |
Iowa - 0.0% |
Iowa Fin. Auth. Health Facilities Rev. Series 2005 A, 5% 2/15/16 (Assured Guaranty Corp. Insured) | | 1,700 | | 1,892 |
Kansas - 0.6% |
Kansas Dev. Fin. Agcy. (Adventist Health Sys./Sunbelt Obligated Group Proj.) Series 2009 D: | | | | |
5% 11/15/14 | | 575 | | 631 |
5% 11/15/15 | | 625 | | 703 |
5% 11/15/16 | | 875 | | 1,008 |
Kansas Dev. Fin. Auth. Health Facilities Rev. (Hays Med. Ctr. Proj.) Series 2005 L, 5.25% 11/15/12 | | 680 | | 690 |
Wichita Hosp. Facilities Rev.: | | | | |
(Via Christi Health Sys., Inc. Proj.) Series 2009 X, 5% 11/15/14 | | 2,000 | | 2,160 |
(Via Christi Health Sys., Inc. Proj.) Series 2009 III A: | | | | |
5% 11/15/14 | | 2,405 | | 2,598 |
5% 11/15/15 | | 6,245 | | 6,892 |
5% 11/15/16 | | 5,410 | | 6,113 |
Municipal Bonds - continued |
| Principal
Amount (000s) | | Value (000s) |
Kansas - continued |
Wichita Hosp. Facilities Rev.: - continued | | | | |
Series 2011 IV A: | | | | |
5% 11/15/18 | | $ 2,250 | | $ 2,599 |
5% 11/15/20 | | 2,745 | | 3,157 |
| | 26,551 |
Kentucky - 0.8% |
Ashland Med. Ctr. Rev. (Ashland Hosp. Corp. d/b/a/ King's Daughters Med. Ctr. Proj.) Series 2010 B: | | | | |
4% 2/1/14 | | 750 | | 783 |
4% 2/1/15 | | 1,495 | | 1,590 |
Jefferson County School District Fin. Corp. School Bldg. Rev. Series 2009 A, 5.25% 1/1/13 (FSA Insured) | | 2,170 | | 2,222 |
Kentucky Econ. Dev. Fin. Auth. Hosp. Rev. (Baptist Healthcare Sys. Proj.) Series A, 5% 8/15/15 | | 4,000 | | 4,432 |
Kentucky Econ. Dev. Fin. Auth. Rev. (Ashland Hosp. Corp. d/b/a/ King's Daughters Med. Ctr. Proj.) Series 2010 A, 4% 2/1/13 | | 500 | | 509 |
Kentucky State Property & Buildings Commission Rev. (#82 Proj.) 5.25% 10/1/17 (FSA Insured) | | 2,450 | | 2,918 |
Louisville/Jefferson County Metropolitan Govt. Poll. Cont. Rev. Bonds (Louisville Gas and Electronic Co. Proj.): | | | | |
Series 2003 A, 1.65%, tender 4/3/17 (b) | | 6,000 | | 6,000 |
Series 2005 A, 5.75%, tender 12/2/13 (b) | | 6,000 | | 6,415 |
Series 2007 B, 1.6%, tender 6/1/17 (b) | | 8,000 | | 7,985 |
| | 32,854 |
Louisiana - 0.2% |
Louisiana Pub. Facilities Auth. Rev.: | | | | |
(Christus Health Proj.) Series 2009 A: | | | | |
5% 7/1/13 | | 3,500 | | 3,638 |
5% 7/1/16 | | 2,000 | | 2,249 |
(Entergy Gulf States Louisiana LLC Proj.) Series 2010 B, 2.875% 11/1/15 | | 3,000 | | 3,071 |
Reg'l. Transit Auth. Louisiana Sales Tax Rev. 4% 12/1/16 (FSA Insured) | | 1,000 | | 1,108 |
| | 10,066 |
Maryland - 1.2% |
Maryland Gen. Oblig. Second Series B, 5.25% 8/15/16 | | 16,100 | | 19,128 |
Municipal Bonds - continued |
| Principal
Amount (000s) | | Value (000s) |
Maryland - continued |
Maryland Health & Higher Edl. Facilities Auth. Rev.: | | | | |
(Univ. of Maryland Med. Sys. Proj.) Series 2008 F: | | | | |
5% 7/1/13 | | $ 2,400 | | $ 2,492 |
5% 7/1/14 | | 3,500 | | 3,736 |
Bonds (Johns Hopkins Health Sys. Obligated Group Proj.) Series 2008 B, 5%, tender 5/15/15 (b) | | 2,225 | | 2,494 |
Montgomery County Gen. Oblig.: | | | | |
(Dept. of Liquor Cont. Proj.) Series 2009 A, 5% 4/1/15 | | 1,725 | | 1,923 |
Series 2011 A, 5% 7/1/20 | | 16,000 | | 19,691 |
| | 49,464 |
Massachusetts - 1.9% |
Braintree Gen. Oblig. Series 2009: | | | | |
5% 5/15/14 | | 1,000 | | 1,084 |
5% 5/15/16 | | 4,400 | | 5,136 |
Massachusetts Bay Trans. Auth. Sales Tax Rev. Series 2006 B, 5.25% 7/1/18 | | 2,300 | | 2,823 |
Massachusetts Dept. of Trans. Metropolitan Hwy. Sys. Rev. Series 2010 B, 5% 1/1/15 | | 12,400 | | 13,549 |
Massachusetts Dev. Fin. Agcy. Rev.: | | | | |
(Boston College Proj.): | | | | |
Series Q1: | | | | |
4% 7/1/15 | | 1,500 | | 1,636 |
4% 7/1/16 | | 1,000 | | 1,124 |
5% 7/1/13 | | 1,000 | | 1,046 |
Series Q2: | | | | |
4% 7/1/15 | | 1,170 | | 1,276 |
4% 7/1/16 | | 1,000 | | 1,124 |
5% 7/1/13 | | 1,100 | | 1,151 |
5% 7/1/14 | | 1,080 | | 1,169 |
5% 7/1/17 | | 1,370 | | 1,630 |
(Tufts Med. Ctr. Proj.) Series I: | | | | |
5% 1/1/14 | | 1,550 | | 1,630 |
5% 1/1/16 | | 1,300 | | 1,429 |
Massachusetts Gen. Oblig.: | | | | |
Series 2002 C: | | | | |
5% 11/1/21 (Pre-Refunded to 11/1/12 @ 100) | | 8,100 | | 8,226 |
5.25% 11/1/30 (Pre-Refunded to 11/1/12 @ 100) | | 2,495 | | 2,536 |
Series 2004 B, 5.25% 8/1/20 | | 12,700 | | 16,011 |
Massachusetts Health & Edl. Facilities Auth. Rev. Bonds (Baystate Health Sys. Proj.) Series 2009 K, 5%, tender 7/1/13 (b) | | 7,000 | | 7,253 |
Municipal Bonds - continued |
| Principal
Amount (000s) | | Value (000s) |
Massachusetts - continued |
Massachusetts Spl. Oblig. Rev. (Fed. Hwy. Grant Anticipation Note Prog.) Series 2003 A: | | | | |
5% 12/15/12 (FSA Insured) | | $ 3,300 | | $ 3,371 |
5% 12/15/13 (FSA Insured) | | 4,325 | | 4,615 |
Medford Gen. Oblig. Series 2011 B, 4% 3/1/19 | | 3,570 | | 4,010 |
| | 81,829 |
Michigan - 2.3% |
Big Rapids Pub. School District: | | | | |
5% 5/1/13 (Assured Guaranty Corp. Insured) | | 1,195 | | 1,240 |
5% 5/1/14 (Assured Guaranty Corp. Insured) | | 1,190 | | 1,281 |
Chelsea School District 5% 5/1/13 (Nat'l. Pub. Fin. Guarantee Corp. Insured) | | 1,750 | | 1,816 |
Detroit School District Series 2012 A: | | | | |
5% 5/1/19 | | 2,000 | | 2,328 |
5% 5/1/20 | | 2,000 | | 2,327 |
5% 5/1/21 | | 1,810 | | 2,113 |
Detroit Swr. Disp. Rev. Series 2006 D, 0.914% 7/1/32 (b) | | 4,075 | | 3,069 |
Grand Rapids Cmnty. College 5% 5/1/13 (FSA Insured) | | 1,305 | | 1,354 |
Grand Valley Michigan State Univ. Rev. Series 2009, 5% 12/1/16 | | 1,320 | | 1,513 |
Kalamazoo Pub. Schools 5% 5/1/13 (Assured Guaranty Corp. Insured) | | 2,940 | | 3,050 |
Kent Hosp. Fin. Auth. Hosp. Facilities Rev.: | | | | |
(Spectrum Health Sys. Proj.) Series 2011 A: | | | | |
5% 11/15/18 | | 1,250 | | 1,455 |
5% 11/15/19 | | 1,000 | | 1,166 |
Bonds (Spectrum Health Sys. Proj.) Series 2008 A, 5.25%, tender 1/15/14 (b) | | 2,200 | | 2,325 |
Michigan Gen. Oblig. (Envir. Protection Prog.) Series 1992, 6.25% 11/1/12 | | 675 | | 688 |
Michigan Hosp. Fin. Auth. Rev.: | | | | |
(McLaren Health Care Corp. Proj.) Series 2008 A, 5.25% 5/15/14 | | 4,160 | | 4,496 |
Bonds (Ascension Health Cr. Group Proj.) Series 1999 B3, 2%, tender 8/1/14 (b) | | 11,000 | | 11,312 |
Michigan Muni. Bond Auth. Rev.: | | | | |
(Clean Wtr. Pooled Proj.) Series 2010: | | | | |
5% 10/1/14 | | 6,045 | | 6,654 |
5% 10/1/15 | | 1,750 | | 1,992 |
5% 10/1/15 | | 3,250 | | 3,700 |
Municipal Bonds - continued |
| Principal
Amount (000s) | | Value (000s) |
Michigan - continued |
Michigan Muni. Bond Auth. Rev.: - continued | | | | |
(Local Govt. Ln. Prog.) Series 2009 C: | | | | |
5% 5/1/13 | | $ 1,645 | | $ 1,705 |
5% 5/1/14 | | 2,140 | | 2,303 |
5% 5/1/15 | | 1,845 | | 2,034 |
5% 5/1/16 | | 1,865 | | 2,113 |
Royal Oak Hosp. Fin. Auth. Hosp. Rev. (William Beaumont Hosp. Oblig. Group Proj.) Series 2009 W, 5% 8/1/15 | | 2,070 | | 2,232 |
Wayne County Arpt. Auth. Rev.: | | | | |
Series 2010 A, 5% 12/1/18 (e) | | 1,400 | | 1,558 |
Series 2011 A, 5% 12/1/19 (e) | | 22,700 | | 25,359 |
West Bloomfield School District 5% 5/1/15 (Assured Guaranty Corp. Insured) | | 1,400 | | 1,553 |
Western Michigan Univ. Rev.: | | | | |
5.25% 11/15/14 (Assured Guaranty Corp. Insured) | | 2,135 | | 2,345 |
5.25% 11/15/15 (Assured Guaranty Corp. Insured) | | 3,275 | | 3,713 |
| | 98,794 |
Minnesota - 0.3% |
Minneapolis & Saint Paul Metropolitan Arpts. Commission Arpt. Rev. Series 2008 A, 5% 1/1/13 (e) | | 1,000 | | 1,022 |
Minnesota 911 Rev. (Pub. Safety Radio Communications Sys. Proj.) Series 2009, 5% 6/1/14 (Assured Guaranty Corp. Insured) | | 2,225 | | 2,416 |
Minnesota Agric. & Econ. Dev. Board Rev. (Essentia Health Obligated Group Proj.) Series 2008 C1: | | | | |
5% 2/15/15 (Assured Guaranty Corp. Insured) | | 1,335 | | 1,459 |
5% 2/15/16 (Assured Guaranty Corp. Insured) | | 565 | | 634 |
Northern Muni. Pwr. Agcy. Elec. Sys. Rev. Series 2009 A, 5% 1/1/15 (Assured Guaranty Corp. Insured) | | 1,000 | | 1,102 |
Southern Minnesota Muni. Pwr. Agcy. Pwr. Supply Sys. Rev. Series 2009 A, 5% 1/1/16 | | 1,000 | | 1,141 |
Tobacco Securitization Auth. Series 2011 B, 5% 3/1/19 | | 5,900 | | 6,811 |
| | 14,585 |
Mississippi - 0.1% |
Mississippi Hsg. Fin. Corp. Single Family Mtg. Rev. Series 1983, 0% 6/1/15 (Escrowed to Maturity) | | 4,000 | | 3,917 |
Missouri - 0.0% |
Saint Louis Arpt. Rev. Series 2011 B, 3% 7/1/12 | | 1,000 | | 1,000 |
Municipal Bonds - continued |
| Principal
Amount (000s) | | Value (000s) |
Nebraska - 0.2% |
Nebraska Pub. Pwr. District Rev. Series C: | | | | |
4% 1/1/15 | | $ 2,360 | | $ 2,554 |
4% 1/1/16 | | 2,195 | | 2,431 |
Univ. of Nebraska Facilities Corp. Lease Rental Rev. (UNMC Health Professions Futures Proj.) Series 2009, 5% 8/15/13 | | 4,000 | | 4,208 |
| | 9,193 |
Nevada - 1.5% |
Clark County Arpt. Rev.: | | | | |
Series 2008 E: | | | | |
5% 7/1/14 | | 2,905 | | 3,127 |
5% 7/1/15 | | 3,500 | | 3,898 |
Series A1, 5% 7/1/12 (AMBAC Insured) (e) | | 2,000 | | 2,000 |
Clark County Fuel Tax Series 2008, 5% 6/1/13 (Escrowed to Maturity) | | 5,815 | | 6,065 |
Clark County School District: | | | | |
Series 1998, 5.5% 6/15/13 (FSA Insured) | | 5,000 | | 5,236 |
Series 2005 A, 5% 6/15/16 (Nat'l. Pub. Fin. Guarantee Corp. Insured) | | 21,215 | | 23,857 |
Nevada Dept. of Bus. & Industry (Waste Mgmt., Inc. Proj.) Series 2001, 2.75% 10/1/14 (e) | | 3,000 | | 3,104 |
Nevada Gen. Oblig.: | | | | |
Series 2010 C, 5% 6/1/19 | | 12,140 | | 14,617 |
Series 2012 B, 5% 8/1/20 | | 2,230 | | 2,706 |
| | 64,610 |
New Hampshire - 0.2% |
New Hampshire Health & Ed. Facilities Auth. Rev. Series 2011, 3% 10/1/12 | | 1,050 | | 1,055 |
New Hampshire Tpk. Sys. Rev. Series 2012 B: | | | | |
5% 2/1/17 (a) | | 3,000 | | 3,398 |
5% 2/1/18 (a) | | 2,500 | | 2,871 |
| | 7,324 |
New Jersey - 2.6% |
New Jersey Ctfs. of Prtn.: | | | | |
Series 2008 A, 5% 6/15/15 | | 750 | | 831 |
Series 2009 A: | | | | |
5% 6/15/15 | | 11,285 | | 12,501 |
5% 6/15/16 | | 6,500 | | 7,368 |
Municipal Bonds - continued |
| Principal
Amount (000s) | | Value (000s) |
New Jersey - continued |
New Jersey Econ. Dev. Auth. School Facilities Construction Rev.: | | | | |
Bonds Series 2008 J4, 5%, tender 9/1/14 (FSA Insured) (b) | | $ 7,000 | | $ 7,586 |
Series 2001 A, 5.5% 6/15/13 (Escrowed to Maturity) | | 1,090 | | 1,144 |
Series 2005 K, 5.25% 12/15/14 (FGIC Insured) (Nat'l. Pub. Fin. Guarantee Corp. Insured) | | 1,790 | | 1,978 |
Series 2005 O, 5% 3/1/20 (Pre-Refunded to 3/1/15 @ 100) | | 6,350 | | 7,106 |
Series 2008 W, 5% 3/1/15 | | 10,400 | | 11,511 |
Series 2009 BB, 5% 9/1/15 | | 3,390 | | 3,812 |
Series 2011 EE, 5% 9/1/20 | | 5,000 | | 5,970 |
Series 2012: | | | | |
5% 6/15/13 | | 2,000 | | 2,082 |
5% 6/15/18 | | 10,600 | | 11,993 |
New Jersey Gen. Oblig. Series H, 5.25% 7/1/15 (FSA Insured) | | 5,000 | | 5,678 |
New Jersey Higher Ed. Student Assistance Auth. Student Ln. Rev. Series 2010 1A, 5% 12/1/15 | | 4,500 | | 5,011 |
New Jersey Tpk. Auth. Tpk. Rev.: | | | | |
Bonds Series 2012 A, 0.93%, tender 12/22/14 (b) | | 15,400 | | 15,450 |
Series 1991 C, 6.5% 1/1/16 (Escrowed to Maturity) | | 3,315 | | 3,734 |
New Jersey Trans. Trust Fund Auth.: | | | | |
Series 2003 A, 5.5% 12/15/16 (FSA Insured) | | 5,000 | | 5,911 |
Series 2003 B. 5.25% 12/15/19 | | 3,000 | | 3,660 |
| | 113,326 |
New Mexico - 1.1% |
Farmington Poll. Cont. Rev. Bonds (Southern California Edison Co. Four Corners Proj.) Series 2005 B, 2.875%, tender 4/1/15 (b) | | 22,100 | | 22,924 |
New Mexico Edl. Assistance Foundation: | | | | |
Series 2009 B, 4% 9/1/16 | | 7,000 | | 7,714 |
Series 2010 A1: | | | | |
4% 12/1/15 | | 3,700 | | 4,033 |
4% 12/1/16 | | 6,750 | | 7,479 |
Rio Rancho Wtr. & Wastewtr. Sys. Rev. Series 2009, 5% 5/15/17 (FSA Insured) | | 4,480 | | 5,281 |
| | 47,431 |
New York - 12.3% |
Albany Indl. Dev. Agcy. Civic Facility Rev. (St. Peters Hosp. Proj.) Series 2008 A, 5.5% 11/15/12 | | 1,000 | | 1,019 |
Municipal Bonds - continued |
| Principal
Amount (000s) | | Value (000s) |
New York - continued |
Dutchess County Local Dev. Corp. Rev. (Health Quest Systems, Inc. Proj.) Series 2010 A: | | | | |
5% 7/1/18 (Assured Guaranty Corp. Insured) (FSA Insured) | | $ 1,100 | | $ 1,268 |
5% 7/1/19 (Assured Guaranty Corp. Insured) (FSA Insured) | | 640 | | 740 |
Long Island Pwr. Auth. Elec. Sys. Rev.: | | | | |
Series 2003 B, 5.25% 6/1/14 | | 2,000 | | 2,173 |
Series 2010 A, 5% 5/1/15 | | 5,000 | | 5,566 |
Metropolitan Trans. Auth. Svc. Contract Rev. Series 2002 A, 5.5% 7/1/17 | | 5,000 | | 6,038 |
New York City Gen. Oblig.: | | | | |
Series 1997 H, 6% 8/1/12 (Nat'l. Pub. Fin. Guarantee Corp. Insured) | | 1,000 | | 1,004 |
Series 2005 D, 5% 8/1/12 (Escrowed to Maturity) | | 4,925 | | 4,942 |
Series 2005 F1, 5% 9/1/15 | | 3,560 | | 4,031 |
Series 2008 E, 5% 8/1/12 | | 5,000 | | 5,017 |
Series 2009 C: | | | | |
5% 8/1/13 | | 6,445 | | 6,772 |
5% 8/1/13 (Escrowed to Maturity) | | 555 | | 583 |
Series B, 5% 8/1/14 | | 10,000 | | 10,937 |
Series C: | | | | |
5% 8/1/12 | | 14,450 | | 14,500 |
5% 8/1/12 (Escrowed to Maturity) | | 5,320 | | 5,338 |
Series G: | | | | |
5.625% 8/1/13 (Nat'l. Pub. Fin. Guarantee Corp. Insured) | | 3,805 | | 3,820 |
5.625% 8/1/13 (Pre-Refunded to 8/1/12 @ 100) | | 1,270 | | 1,275 |
Series K: | | | | |
5% 8/1/12 | | 2,335 | | 2,343 |
5% 8/1/12 (Escrowed to Maturity) | | 2,025 | | 2,032 |
New York City Transitional Fin. Auth. Rev.: | | | | |
Series 2003 B, 5% 2/1/20 | | 3,000 | | 3,693 |
Series 2010 B: | | | | |
5% 11/1/17 | | 30,000 | | 36,152 |
5% 11/1/20 | | 5,950 | | 7,269 |
Series 2010 D: | | | | |
5% 11/1/15 | | 8,300 | | 9,491 |
5% 11/1/17 | | 10,115 | | 12,189 |
Series 2012 A: | | | | |
5% 11/1/17 | | 7,000 | | 8,436 |
5% 11/1/20 | | 4,500 | | 5,585 |
Municipal Bonds - continued |
| Principal
Amount (000s) | | Value (000s) |
New York - continued |
New York City Transitional Fin. Auth. Rev.: - continued | | | | |
Series E, 4% 11/1/12 | | $ 6,790 | | $ 6,874 |
New York City Trust Cultural Resources Rev. Bonds (The Juilliard School Proj.) Series 2009 B, 2.75%, tender 7/1/12 (b) | | 5,500 | | 5,500 |
New York Dorm. Auth. Mental Health Svcs. Facilities Impt. Rev.: | | | | |
(State Univ. Proj.) Series 2012 A, 5% 5/15/20 | | 4,000 | | 4,875 |
Series 2012 A, 4% 5/15/20 | | 8,000 | | 9,140 |
New York Dorm. Auth. Personal Income Tax Rev.: | | | | |
(Ed. Proj.) Series 2009 A: | | | | |
5% 3/15/13 | | 3,545 | | 3,663 |
5% 3/15/14 | | 3,745 | | 4,038 |
5% 3/15/15 | | 4,000 | | 4,469 |
Series 2009 D: | | | | |
5% 6/15/14 | | 9,890 | | 10,772 |
5% 6/15/15 | | 16,075 | | 18,121 |
5% 6/15/16 | | 9,330 | | 10,876 |
Series 2010 A, 5% 2/15/14 (Escrowed to Maturity) | | 10 | | 11 |
Series A: | | | | |
5% 2/15/14 | | 9,840 | | 10,571 |
5% 2/15/15 | | 8,775 | | 9,774 |
5% 2/15/15 (Escrowed to Maturity) | | 5 | | 6 |
New York Dorm. Auth. Revs.: | | | | |
(City Univ. Sys. Consolidation Proj.) Series A: | | | | |
5.75% 7/1/13 | | 1,980 | | 2,024 |
5.75% 7/1/13 (AMBAC Insured) | | 570 | | 583 |
(Mental Health Svcs. Facilities Proj.): | | | | |
Series 2008 D: | | | | |
5% 2/15/14 | | 7,295 | | 7,814 |
5% 8/15/14 | | 7,755 | | 8,465 |
Series 2009 A1, 5% 2/15/15 | | 9,000 | | 9,980 |
(New York Univ. Hosp. Ctr. Proj.) Series 2011 A, 5% 7/1/18 | | 3,240 | | 3,887 |
(St. Lawrence Univ.) Series 2008, 5% 7/1/14 | | 3,700 | | 3,983 |
Series 2008 B, 5% 7/1/15 | | 30,000 | | 33,752 |
Series 2008 D, 5.25% 8/15/17 (FSA Insured) | | 7,000 | | 8,382 |
Series 2009 A: | | | | |
5% 7/1/15 | | 12,850 | | 14,457 |
5% 7/1/16 | | 8,390 | | 9,703 |
New York Local Govt. Assistance Corp. Series 2003 A, 5% 4/1/18 | | 12,400 | | 14,998 |
Municipal Bonds - continued |
| Principal
Amount (000s) | | Value (000s) |
New York - continued |
New York Metropolitan Trans. Auth. Dedicated Tax Fund Rev. Series B: | | | | |
5% 11/15/14 | | $ 1,350 | | $ 1,491 |
5% 11/15/15 | | 2,325 | | 2,654 |
New York Metropolitan Trans. Auth. Rev.: | | | | |
Bonds Series 2008 B2, 5%, tender 11/15/12 (b) | | 7,300 | | 7,416 |
Series 2003 B: | | | | |
5.25% 11/15/17 (Nat'l. Pub. Fin. Guarantee Corp. Insured) | | 1,040 | | 1,103 |
5.25% 11/15/19 (Nat'l. Pub. Fin. Guarantee Corp. Insured) | | 5,200 | | 6,324 |
Series 2010 B2, 4% 11/15/14 | | 2,830 | | 3,050 |
New York State Dorm. Auth. Lease Rev. Bonds Series 2003 B, 5.25%, tender 7/1/13 (b) | | 3,000 | | 3,140 |
New York State Energy Research & Dev. Auth. Facilities Rev. Bonds (Consolidated Edison Co. of New York, Inc. Proj.) Series 2010 A, 1.45%, tender 11/1/12 (b)(e) | | 26,400 | | 26,461 |
New York Thruway Auth. Second Gen. Hwy. & Bridge Trust Fund: | | | | |
Series 2008 A, 5% 4/1/13 | | 2,600 | | 2,691 |
Series 2010 A, 5% 4/1/17 | | 1,000 | | 1,181 |
Series 2011 A1: | | | | |
5% 4/1/17 | | 1,500 | | 1,771 |
5% 4/1/18 | | 3,500 | | 4,201 |
New York Urban Dev. Corp. Rev.: | | | | |
Series 2009 C: | | | | |
5% 12/15/15 | | 6,500 | | 7,452 |
5% 12/15/16 | | 17,000 | | 20,103 |
Series 2011 A, 5% 3/15/21 | | 18,425 | | 22,667 |
Niagara County Indl. Dev. Agcy. Solid Waste Disp. Rev. Bonds Series 2001 C, 5.625%, tender 11/15/14 (b)(e) | | 2,450 | | 2,469 |
Tobacco Settlement Asset Securitization Corp. Series 2002-1, 5.5% 7/15/24 (Pre-Refunded to 7/15/12 @ 100) | | 5,475 | | 5,483 |
Tobacco Settlement Fing. Corp. Series 2011, 5% 6/1/16 | | 20,000 | | 23,023 |
Triborough Bridge & Tunnel Auth. Revs. Series Y, 5.5% 1/1/17 (Escrowed to Maturity) | | 6,470 | | 7,186 |
| | 528,797 |
Municipal Bonds - continued |
| Principal
Amount (000s) | | Value (000s) |
New York & New Jersey - 0.1% |
Port Auth. of New York & New Jersey 124th Series, 5% 8/1/13 (Nat'l. Pub. Fin. Guarantee Corp. Insured) (e) | | $ 1,200 | | $ 1,204 |
Port Auth. of New York & New Jersey Spl. Oblig. Rev. (JFK Int'l. Air Term. Spl. Proj.) Series 6, 6.25% 12/1/13 (Nat'l. Pub. Fin. Guarantee Corp. Insured) (e) | | 4,100 | | 4,319 |
| | 5,523 |
Non State Specific - 0.0% |
Washington DC Metropolitan Transit Auth. Rev. Series 2009 A, 5% 7/1/14 | | 1,000 | | 1,082 |
North Carolina - 1.2% |
Dare County Ctfs. of Prtn. Series 2012 B: | | | | |
4% 6/1/17 | | 1,000 | | 1,127 |
4% 6/1/18 | | 1,280 | | 1,459 |
4% 6/1/20 | | 1,000 | | 1,149 |
5% 6/1/19 | | 1,305 | | 1,581 |
Mecklenburg County Pub. Facilities Corp. Series 2009: | | | | |
5% 3/1/16 | | 5,870 | | 6,768 |
5% 3/1/18 | | 1,500 | | 1,813 |
Nash Health Care Sys. Health Care Facilities Rev. Series 2003: | | | | |
5% 11/1/13 (FSA Insured) | | 1,500 | | 1,580 |
5% 11/1/15 (FSA Insured) | | 1,600 | | 1,745 |
North Carolina Eastern Muni. Pwr. Agcy. Pwr. Sys. Rev.: | | | | |
Series 2008 A, 5% 1/1/13 | | 2,200 | | 2,249 |
Series 2010 A: | | | | |
5% 1/1/15 | | 4,000 | | 4,399 |
5% 1/1/16 | | 6,035 | | 6,852 |
Series 2012 D, 5% 1/1/14 (a) | | 3,000 | | 3,155 |
North Carolina Grant Anticipation Rev. Series 2009, 5% 3/1/15 | | 1,250 | | 1,392 |
North Carolina Med. Care Commission Hosp. Rev. (North Carolina Baptist Hosp. Proj.) Series 2010: | | | | |
5% 6/1/15 | | 1,500 | | 1,682 |
5% 6/1/16 | | 1,000 | | 1,155 |
5% 6/1/17 | | 3,220 | | 3,793 |
5% 6/1/18 | | 3,820 | | 4,549 |
Municipal Bonds - continued |
| Principal
Amount (000s) | | Value (000s) |
North Carolina - continued |
North Carolina Muni. Pwr. Agcy. #1 Catawba Elec. Rev.: | | | | |
Series 1998 A, 5.5% 1/1/15 (Nat'l. Pub. Fin. Guarantee Corp. Insured) | | $ 3,675 | | $ 4,099 |
Series 2008 A, 5.25% 1/1/20 | | 2,000 | | 2,351 |
| | 52,898 |
North Dakota - 0.0% |
Grand Forks Health Care Sys. Rev. (Altru Health Sys. Proj.) Series 2005, 5% 12/1/15 (Assured Guaranty Corp. Insured) | | 1,825 | | 2,025 |
Ohio - 2.6% |
Buckeye Tobacco Settlement Fing. Auth. Series 2007 A1: | | | | |
5% 6/1/16 | | 3,035 | | 3,248 |
5% 6/1/17 | | 3,500 | | 3,754 |
Cincinnati City School District 5.25% 12/1/18 (Nat'l. Pub. Fin. Guarantee Corp. Insured) | | 3,555 | | 4,342 |
Columbus City School District (School Facilities Construction and Impt. Proj.) Series 2009 B, 4% 12/1/16 | | 1,000 | | 1,134 |
Hamilton County Student Hsg. Rev. (Stratford Heights Proj.) Series 2010: | | | | |
5% 6/1/15 (FSA Insured) | | 760 | | 829 |
5% 6/1/16 (FSA Insured) | | 1,105 | | 1,240 |
5% 6/1/17 (FSA Insured) | | 1,160 | | 1,319 |
Ohio Air Quality Dev. Auth. Rev. Bonds: | | | | |
(FirstEnergy Corp. Proj.) Series 2009 D, 4.75%, tender 8/1/12 (b) | | 5,400 | | 5,418 |
(FirstEnergy Nuclear Generation Corp. Proj.) Series 2008 C, 7.25%, tender 11/1/12 (b)(e) | | 9,000 | | 9,201 |
(Ohio Pwr. Co. Proj.) Series 2010 A, 3.25%, tender 6/2/14 (b) | | 5,500 | | 5,696 |
Ohio Bldg. Auth.: | | | | |
(Administrative Bldg. Fund Proj.): | | | | |
Series 2009 B: | | | | |
5% 10/1/14 | | 5,955 | | 6,510 |
5% 10/1/15 | | 6,505 | | 7,350 |
Series 2010 C: | | | | |
4% 10/1/15 | | 3,200 | | 3,514 |
5% 10/1/16 | | 1,250 | | 1,455 |
(Adult Correctional Bldg. Fund Proj.): | | | | |
Series 2009 B: | | | | |
5% 10/1/14 | | 2,055 | | 2,247 |
5% 10/1/15 | | 4,535 | | 5,124 |
Municipal Bonds - continued |
| Principal
Amount (000s) | | Value (000s) |
Ohio - continued |
Ohio Bldg. Auth.: - continued | | | | |
(Adult Correctional Bldg. Fund Proj.): | | | | |
Series 2010 A, 5% 10/1/15 | | $ 1,185 | | $ 1,339 |
Ohio Gen. Oblig.: | | | | |
(Common Schools Proj.) Series 2010 A, 5% 9/15/17 | | 2,600 | | 3,108 |
(Higher Ed. Proj.): | | | | |
Series 2005 C, 5% 8/1/13 | | 4,495 | | 4,720 |
Series 2010 A, 5% 8/1/17 | | 3,290 | | 3,921 |
Series 2011 A, 5% 8/1/17 | | 3,070 | | 3,659 |
Ohio Higher Edl. Facility Commission Rev.: | | | | |
(Cleveland Clinic Foundation Proj.) Series 2008 A, 5% 1/1/15 | | 2,000 | | 2,212 |
(Univ. Hosp. Health Sys. Proj.) Series 2010 A: | | | | |
5% 1/15/15 | | 500 | | 545 |
5% 1/15/17 | | 1,000 | | 1,135 |
Ohio State Univ. Gen. Receipts Series 2010 A, 5% 12/1/16 | | 5,000 | | 5,895 |
Ohio Wtr. Dev. Auth. Poll. Cont. Facilities Rev. Bonds: | | | | |
(First Energy Nuclear Generation Corp. Proj.) Series 2005 B, 3.375%, tender 7/1/15 (b) | | 5,000 | | 5,162 |
(FirstEnergy Corp. Proj.) Series 2009 A, 5.875%, tender 6/1/16 (b) | | 10,225 | | 11,509 |
Ross County Hosp. Facilities Rev. (Adena Health Sys. Proj.) Series 2008: | | | | |
5% 12/1/12 | | 1,950 | | 1,981 |
5% 12/1/13 | | 875 | | 923 |
5% 12/1/14 | | 2,275 | | 2,474 |
| | 110,964 |
Oklahoma - 0.3% |
Oklahoma Dev. Fin. Auth. (Pub. Svc. Co. of Oklahoma Proj.) Series 2009, 5.25% 6/1/14 | | 2,700 | | 2,895 |
Oklahoma Dev. Fin. Auth. Health Sys. Rev. (Integris Baptist Med. Ctr. Proj.) Series 2008 B, 5% 8/15/14 | | 1,660 | | 1,804 |
Tulsa County Indl. Auth. Edl. Facilities Lease Rev. (Jenks Pub. Schools Proj.) Series 2009, 5.5% 9/1/18 | | 5,215 | | 6,403 |
| | 11,102 |
Oregon - 0.3% |
Clackamas County Hosp. Facility Auth. Bonds (Legacy Health Sys. Proj.) Series 2009 C, 5%, tender 7/15/14 (b) | | 2,500 | | 2,684 |
Municipal Bonds - continued |
| Principal
Amount (000s) | | Value (000s) |
Oregon - continued |
Gilliam County Solid Waste Disp. Rev. Bonds (Waste Mgmt., Inc. Proj.) Series 2000 A, 3.5%, tender 5/1/13 (b)(e) | | $ 5,300 | | $ 5,408 |
Oregon Facilities Auth. Rev. (Legacy Health Sys. Proj.) Series 2009 A: | | | | |
5% 3/15/13 | | 1,000 | | 1,032 |
5% 3/15/14 | | 595 | | 635 |
5% 3/15/15 | | 2,500 | | 2,754 |
5% 3/15/16 | | 1,750 | | 1,982 |
| | 14,495 |
Pennsylvania - 4.2% |
Allegheny County Arpt. Auth. Rev. Series A: | | | | |
5% 1/1/14 (FSA Insured) (e) | | 1,350 | | 1,408 |
5% 1/1/15 (FSA Insured) (e) | | 1,000 | | 1,066 |
5% 1/1/16 (FSA Insured) (e) | | 1,000 | | 1,083 |
Allegheny County Hosp. Dev. Auth. Rev.: | | | | |
(Pittsburgh Med. Ctr. Proj.): | | | | |
Series 2008 A, 5% 9/1/12 | | 6,615 | | 6,663 |
Series 2008 B, 5% 6/15/14 | | 1,385 | | 1,498 |
(Univ. of Pittsburgh Med. Ctr. Proj.) Series 2009 A: | | | | |
4% 8/15/15 | | 1,385 | | 1,510 |
5% 8/15/14 | | 1,955 | | 2,128 |
Beaver County Indl. Dev. Auth. Poll. Cont. Rev. Bonds (FirstEnergy Nuclear Generation Corp. Proj.) Series 2005 A, 3.375%, tender 7/1/15 (b) | | 2,000 | | 2,065 |
Franklin County Indl. Dev. Auth. (The Chambersburg Hosp. Proj.) Series 2010: | | | | |
5% 7/1/16 | | 1,000 | | 1,113 |
5% 7/1/17 | | 1,255 | | 1,404 |
Montgomery County Indl. Dev. Series 2012 A, 3% 10/1/13 | | 1,650 | | 1,702 |
Montgomery County Higher Ed. & Health Auth. Hosp. Rev. (Abington Memorial Hosp. Proj.) Series 2009 A, 5% 6/1/17 | | 2,200 | | 2,484 |
Pennsylvania Econ. Dev. Auth. Governmental Lease (Forum Place Proj.) Series 2012: | | | | |
5% 3/1/18 | | 2,455 | | 2,838 |
5% 3/1/19 | | 2,310 | | 2,688 |
5% 3/1/20 | | 2,140 | | 2,502 |
Pennsylvania Gen. Oblig. Series 2011, 5% 7/1/21 | | 1,900 | | 2,381 |
Municipal Bonds - continued |
| Principal
Amount (000s) | | Value (000s) |
Pennsylvania - continued |
Pennsylvania Intergovernmental Coop. Auth. Spl. Tax Rev. (City of Philadelphia Fdg. Prog.) Series 2009, 5% 6/15/15 | | $ 10,600 | | $ 11,919 |
Pennsylvania Tpk. Commission Tpk. Rev. Series 2009 B, 5% 12/1/17 | | 12,500 | | 14,799 |
Philadelphia Gas Works Rev. (1998 Gen. Ordinance Proj.): | | | | |
Eighth Series A, 5% 8/1/15 | | 2,100 | | 2,335 |
Seventh Series, 5% 10/1/12 (AMBAC Insured) | | 1,000 | | 1,011 |
Philadelphia Gen. Oblig.: | | | | |
Series 2007 A, 5% 8/1/12 (FSA Insured) | | 5,000 | | 5,016 |
Series 2008 A: | | | | |
5% 12/15/14 (FSA Insured) | | 5,370 | | 5,875 |
5% 12/15/15 (FSA Insured) | | 5,000 | | 5,618 |
5% 12/15/16 (FSA Insured) | | 7,275 | | 8,383 |
Series 2011: | | | | |
4% 8/1/12 | | 4,325 | | 4,335 |
5.25% 8/1/17 | | 6,165 | | 7,095 |
5.25% 8/1/18 | | 5,515 | | 6,378 |
Philadelphia School District Series 2010 C, 5% 9/1/16 | | 13,610 | | 15,230 |
Philadelphia Wtr. & Wastewtr. Rev. Series 2010 A: | | | | |
5% 6/15/15 | | 15,000 | | 16,635 |
5% 6/15/16 | | 6,000 | | 6,843 |
Pittsburgh & Allegheny County Sports & Exhibition Auth. Series 2010: | | | | |
5% 2/1/15 (FSA Insured) | | 4,580 | | 4,962 |
5% 2/1/16 (FSA Insured) | | 5,620 | | 6,239 |
Pittsburgh School District: | | | | |
Series 2009 A: | | | | |
3% 9/1/12 (Assured Guaranty Corp. Insured) | | 1,300 | | 1,305 |
3% 9/1/14 (Assured Guaranty Corp. Insured) | | 1,640 | | 1,719 |
Series 2010 A: | | | | |
4% 9/1/15 (FSA Insured) | | 1,450 | | 1,584 |
5% 9/1/16 (FSA Insured) | | 1,685 | | 1,944 |
Saint Mary Hosp. Auth. Health Sys. Rev. (Catholic Health East Proj.) Series 2010 B: | | | | |
5% 11/15/13 | | 2,465 | | 2,600 |
5% 11/15/14 | | 4,690 | | 5,101 |
5% 11/15/15 | | 2,420 | | 2,707 |
Southeastern Pennsylvania Trans. Auth. Rev. Series 2011: | | | | |
5% 6/1/18 | | 1,000 | | 1,175 |
Municipal Bonds - continued |
| Principal
Amount (000s) | | Value (000s) |
Pennsylvania - continued |
Southeastern Pennsylvania Trans. Auth. Rev. Series 2011: - continued | | | | |
5% 6/1/19 | | $ 200 | | $ 237 |
Unionville-Chadds Ford School District Gen. Oblig. Series 2009, 5% 6/1/20 | | 1,190 | | 1,457 |
Westmoreland County Muni. Auth. Muni. Svc. Rev. Series K, 0% 7/1/12 (Escrowed to Maturity) | | 2,355 | | 2,355 |
| | 179,390 |
Puerto Rico - 0.4% |
Puerto Rico Commonwealth Aqueduct & Swr. Auth. Series 2012 A, 5% 7/1/21 | | 6,000 | | 6,506 |
Puerto Rico Govt. Dev. Bank Series 2006 B, 5% 12/1/12 | | 1,000 | | 1,017 |
Puerto Rico Infrastructure Fin. Bonds (Port Auth. Proj.) Series 2011 C, 2.75%, tender 6/15/13 (b)(e) | | 9,600 | | 9,630 |
| | 17,153 |
Rhode Island - 0.3% |
Rhode Island & Providence Plantations Series 2010 A, 5% 10/1/12 | | 2,250 | | 2,276 |
Rhode Island Econ. Dev. Corp. Rev. (Dept. of Trans. Proj.) Series 2009 A: | | | | |
5% 6/15/15 (Assured Guaranty Corp. Insured) | | 2,010 | | 2,237 |
5% 6/15/16 (Assured Guaranty Corp. Insured) | | 6,625 | | 7,592 |
| | 12,105 |
South Carolina - 0.5% |
Lexington County Health Svcs. District, Inc. Hosp. Rev. Series 2011: | | | | |
3% 11/1/12 | | 1,400 | | 1,410 |
5% 11/1/19 | | 1,190 | | 1,398 |
South Carolina Pub. Svc. Auth. (Santee Cooper) Rev. Oblig.: | | | | |
Series 2012 B: | | | | |
5% 12/1/17 | | 2,000 | | 2,391 |
5% 12/1/20 | | 1,000 | | 1,235 |
Series 2012 C: | | | | |
5% 12/1/13 (a) | | 2,400 | | 2,519 |
5% 12/1/17 (a) | | 10,535 | | 12,394 |
| | 21,347 |
Municipal Bonds - continued |
| Principal
Amount (000s) | | Value (000s) |
South Dakota - 0.2% |
South Dakota Health & Edl. Facilities Auth. Rev.: | | | | |
(Reg'l. Health Proj.) Series 2010: | | | | |
5% 9/1/14 | | $ 625 | | $ 673 |
5% 9/1/15 | | 680 | | 746 |
5% 9/1/16 | | 500 | | 562 |
5% 9/1/17 | | 490 | | 559 |
Series 2011: | | | | |
5% 9/1/17 | | 1,100 | | 1,256 |
5% 9/1/18 | | 1,200 | | 1,372 |
5% 9/1/19 | | 1,255 | | 1,435 |
| | 6,603 |
Tennessee - 0.4% |
Jackson Hosp. Rev. (Jackson-Madison County Gen. Hosp. Proj.) Series 2008, 5% 4/1/13 | | 1,000 | | 1,030 |
Memphis Elec. Sys. Rev. 5% 12/1/14 | | 5,000 | | 5,498 |
Memphis-Shelby County Arpt. Auth. Arpt. Rev. Series 2010 B, 5% 7/1/16 (e) | | 1,730 | | 1,933 |
Metropolitan Nashville Arpt. Auth. Rev. Series 2010 A: | | | | |
5% 7/1/16 | | 1,815 | | 2,046 |
5% 7/1/17 | | 1,100 | | 1,260 |
Shelby County Health Edl. & Hsg. Facilities Board Rev. Series 2004 A, 5% 9/1/15 | | 3,125 | | 3,499 |
| | 15,266 |
Texas - 5.5% |
Austin Cmnty. College District Pub. Facilities Lease Rev. (Round Rock Campus Proj.) Series 2008, 5.25% 8/1/15 | | 2,585 | | 2,906 |
Austin Convention Enterprises, Inc. (Convention Ctr. Proj.): | | | | |
Series 2006 A, 6% 1/1/14 | | 1,420 | | 1,488 |
Series 2006 B, 6% 1/1/13 | | 1,270 | | 1,293 |
Austin Elec. Util. Sys. Rev.: | | | | |
Series A, 5% 11/15/15 | | 1,000 | | 1,133 |
0% 5/15/18 (Nat'l. Pub. Fin. Guarantee Corp. Insured) | | 4,500 | | 3,906 |
Austin Independent School District Series 2004, 5% 8/1/17 | | 1,450 | | 1,740 |
Austin Wtr. & Wastewtr. Sys. Rev. Series 2009 A, 5% 11/15/15 | | 2,250 | | 2,566 |
Brownsville Util. Sys. Rev. Series 2008 A, 5% 9/1/15 (FSA Insured) | | 2,665 | | 2,994 |
Municipal Bonds - continued |
| Principal
Amount (000s) | | Value (000s) |
Texas - continued |
Carroll Independent School District Series 2009 C, 5.25% 2/15/19 | | $ 1,000 | | $ 1,242 |
Corpus Christi Independent School District 4% 8/15/14 | | 10,140 | | 10,860 |
Dallas Fort Worth Int'l. Arpt. Rev. Series 2009 A: | | | | |
5% 11/1/14 | | 2,500 | | 2,740 |
5% 11/1/15 | | 5,000 | | 5,648 |
Dallas Wtrwks. & Swr. Sys. Rev. Series 2011, 5% 10/1/18 | | 1,600 | | 1,963 |
Fort Worth Independent School District Series 2009, 5% 2/15/16 | | 3,690 | | 4,259 |
Frisco Gen. Oblig. Series 2004, 5.25% 2/15/14 (Nat'l. Pub. Fin. Guarantee Corp. Insured) | | 1,380 | | 1,489 |
Grapevine Gen. Oblig.: | | | | |
Series 2009 A, 5% 2/15/15 | | 2,215 | | 2,462 |
Series 2009, 5% 2/15/16 | | 1,375 | | 1,582 |
Harris County Cultural Ed. Facilities Fin. Corp. Thermal Util. Rev. (TECO Proj.) Series 2009 A: | | | | |
5% 11/15/12 | | 1,000 | | 1,017 |
5% 11/15/14 | | 1,000 | | 1,090 |
5% 11/15/16 | | 500 | | 576 |
Harris County Gen. Oblig. (Road Proj.) Series 2008 B: | | | | |
5% 8/15/13 | | 1,000 | | 1,052 |
5% 8/15/14 | | 1,075 | | 1,174 |
Houston Arpt. Sys. Rev.: | | | | |
Series 2011 A, 5% 7/1/17 (e) | | 7,380 | | 8,529 |
Series 2011 B, 3% 7/1/12 | | 1,540 | | 1,540 |
Series A: | | | | |
5% 7/1/15 | | 2,070 | | 2,315 |
5% 7/1/16 | | 1,080 | | 1,243 |
Houston Gen. Oblig.: | | | | |
Series 2004 A, 5.25% 3/1/14 (Nat'l. Pub. Fin. Guarantee Corp. Insured) | | 2,855 | | 3,084 |
Series A, 5% 3/1/13 (Nat'l. Pub. Fin. Guarantee Corp. Insured) | | 7,500 | | 7,734 |
Houston Independent School District: | | | | |
Bonds Series 2012: | | | | |
1.5%, tender 6/1/13 (b) | | 8,745 | | 8,829 |
2%, tender 6/1/14 (b) | | 5,850 | | 5,996 |
Series 2005 A, 0% 2/15/16 | | 4,500 | | 4,363 |
Humble Independent School District Series 2009, 4% 2/15/13 | | 400 | | 409 |
Keller Independent School District 5% 2/15/14 | | 3,750 | | 4,026 |
Municipal Bonds - continued |
| Principal
Amount (000s) | | Value (000s) |
Texas - continued |
Klein Independent School District Series 2009 A, 5% 8/1/16 | | $ 2,195 | | $ 2,570 |
Leander Independent School District Series 2001, 6% 8/15/14 (Escrowed to Maturity) | | 1,850 | | 2,071 |
Lewisville Independent School District Series 2009, 5% 8/15/17 | | 1,170 | | 1,398 |
Lone Star College Sys. Gen. Oblig. Series 2010 A, 5% 8/15/22 | | 2,500 | | 2,512 |
Lower Colorado River Auth. Rev.: | | | | |
Series 2010, 5% 5/15/17 | | 2,805 | | 3,297 |
5% 5/15/15 | | 2,120 | | 2,375 |
5% 5/15/15 (Escrowed to Maturity) | | 5 | | 6 |
5% 5/15/16 | | 2,355 | | 2,716 |
5% 5/15/16 (Escrowed to Maturity) | | 5 | | 6 |
Lower Colorado River Auth. Transmission Contract Rev. (LCRA Transmission Svcs. Corp. Proj.) Series 2010, 5% 5/15/18 | | 3,140 | | 3,739 |
Lubbock Gen. Oblig. Series 2005, 5% 2/15/13 (Nat'l. Pub. Fin. Guarantee Corp. Insured) | | 1,850 | | 1,904 |
Lubbock Health Facilities Dev. Corp. Rev. (St. Joseph Health Sys. Proj.) Series 2008 B: | | | | |
5% 7/1/17 | | 2,800 | | 3,242 |
5% 7/1/18 | | 3,030 | | 3,544 |
Mansfield Independent School District Series 2009, 4% 2/15/17 | | 1,840 | | 2,077 |
North Texas Tollway Auth. Rev.: | | | | |
Bonds Series 2008 H2, 5%, tender 1/1/13 (b) | | 5,000 | | 5,117 |
Series 2010 B1, 3.2% 1/1/13 | | 2,275 | | 2,303 |
Northside Independent School District Bonds 1.5%, tender 8/1/12 (b) | | 12,500 | | 12,510 |
San Antonio Wtr. Sys. Rev. Series 2012: | | | | |
4% 5/15/19 | | 1,500 | | 1,741 |
5% 5/15/20 | | 6,000 | | 7,396 |
5% 5/15/21 | | 5,000 | | 6,185 |
San Jacinto Cmnty. College District Series 2009: | | | | |
5% 2/15/15 | | 2,220 | | 2,454 |
5% 2/15/15 (Escrowed to Maturity) | | 280 | | 313 |
5% 2/15/16 | | 2,000 | | 2,276 |
Southwest Higher Ed. Auth. Rev. (Southern Methodist Univ. Proj.) Series 2009, 5% 10/1/16 | | 5,795 | | 6,721 |
Tarrant County Cultural Ed. Facilities Fin. Corp. Hosp. Rev. (Baylor Health Care Sys. Proj.) Series 2009, 5% 11/15/12 | | 1,950 | | 1,982 |
Municipal Bonds - continued |
| Principal
Amount (000s) | | Value (000s) |
Texas - continued |
Tarrant County Cultural Ed. Facilities Fin. Corp. Rev. (Christus Health Proj.) Series 2008 A, 5.75% 7/1/18 (Assured Guaranty Corp. Insured) | | $ 4,685 | | $ 5,094 |
Texas Gen. Oblig.: | | | | |
Series 2011 B, 2% 8/1/12 (e) | | 3,365 | | 3,369 |
Series B, 0% 10/1/13 | | 6,500 | | 6,425 |
Texas Muni. Pwr. Agcy. Rev. Series 2010: | | | | |
4% 9/1/14 | | 1,000 | | 1,061 |
5% 9/1/15 | | 835 | | 933 |
5% 9/1/16 | | 750 | | 860 |
Texas Pub. Fin. Auth. Rev. Series 2010 A, 5% 1/1/16 | | 7,865 | | 9,032 |
Tomball Independent School District 5% 2/15/17 (Assured Guaranty Corp. Insured) | | 1,105 | | 1,292 |
Trinity River Auth. Reg'l. Wastewtr. Sys. Rev. Series 2008, 5% 8/1/13 | | 6,135 | | 6,444 |
Univ. of North Texas Univ. Rev. Series A, 5% 4/15/14 | | 1,000 | | 1,080 |
Univ. of Texas Board of Regents Sys. Rev.: | | | | |
Series 2003 B, 5% 8/15/33 (Pre-Refunded to 8/15/13 @ 100) | | 15,000 | | 15,773 |
Series 2010 B, 5% 8/15/21 | | 1,800 | | 2,265 |
| | 237,331 |
Utah - 0.2% |
Salt Lake County Wtr. Conservancy District Rev. Series A: | | | | |
0% 10/1/12 (AMBAC Insured) | | 3,800 | | 3,787 |
0% 10/1/13 (AMBAC Insured) | | 3,760 | | 3,685 |
| | 7,472 |
Vermont - 0.1% |
Vermont Edl. & Health Bldg. Fin. Agcy. Rev. (Fletcher Allen Health Care Proj.) Series 2004 B, 5% 12/1/15 (FSA Insured) | | 2,225 | | 2,421 |
Virgin Islands - 0.1% |
Virgin Islands Pub. Fin. Auth. Series 2009 B, 5% 10/1/15 | | 5,000 | | 5,425 |
Virginia - 0.4% |
Amelia County Indl. Dev. Auth. Solid Waste Disp. Rev. Bonds (Waste Mgmt., Inc. Proj.) 3.375%, tender 4/1/13 (b)(e) | | 5,900 | | 6,002 |
Chesapeake Econ. Dev. Auth. Poll. Cont. Rev. Bonds (Elec. & Pwr. Co. Proj.) Series 2008 A, 3.6%, tender 2/1/13 (b) | | 1,800 | | 1,832 |
Municipal Bonds - continued |
| Principal
Amount (000s) | | Value (000s) |
Virginia - continued |
Louisa Indl. Dev. Auth. Poll. Cont. Rev. Bonds (Virginia Elec. & Pwr. Co. Proj.) Series 2008 B, 5.375%, tender 12/2/13 (b) | | $ 8,000 | | $ 8,549 |
York County Econ. Dev. Auth. Poll. Cont. Rev. Bonds (Virginia Elec. and Pwr. Co. Proj.) Series 2009 A, 4.05%, tender 5/1/14 (b) | | 1,800 | | 1,887 |
| | 18,270 |
Washington - 1.8% |
Energy Northwest Elec. Rev.: | | | | |
(#3 Proj.) Series 2009 A, 5% 7/1/14 | | 4,000 | | 4,366 |
Series 2012 A, 5% 7/1/19 | | 30,000 | | 36,853 |
Grant County Pub. Util. District #2 Series 2012 A: | | | | |
5% 1/1/20 | | 1,375 | | 1,652 |
5% 1/1/21 | | 1,865 | | 2,247 |
King County Highline School District # 401 Series 2009: | | | | |
5% 12/1/16 | | 6,350 | | 7,463 |
5% 12/1/17 | | 2,950 | | 3,509 |
Port of Seattle Passenger Facilities Charge Rev. Series 2010 B, 5% 12/1/16 (e) | | 2,500 | | 2,817 |
Port of Seattle Rev.: | | | | |
Series 2001 D, 5.75% 11/1/15 (Pre-Refunded to 11/1/12 @ 100) (e) | | 3,640 | | 3,701 |
Series 2010 C: | | | | |
5% 2/1/16 (e) | | 2,000 | | 2,244 |
5% 2/1/17 (e) | | 2,500 | | 2,850 |
Seattle Muni. Lt. & Pwr. Rev. Series 2010 B, 5% 2/1/17 | | 2,000 | | 2,357 |
Spokane County Wastewtr. Sys. Rev. Series 2009 A, 5% 12/1/15 | | 1,710 | | 1,952 |
Washington Health Care Facilities Auth. Rev. (MultiCare Health Sys. Proj.) Series 2010 A: | | | | |
5% 8/15/13 | | 2,000 | | 2,087 |
5% 8/15/14 | | 2,000 | | 2,153 |
| | 76,251 |
West Virginia - 0.3% |
West Virginia Econ. Dev. Auth. Solid Waste Disp. Facilities Rev. Bonds Series 2011 A, 2%, tender 8/1/12 (b)(e) | | 13,000 | | 13,008 |
Wisconsin - 1.1% |
Milwaukee County Arpt. Rev. Series 2010 B, 5% 12/1/15 (e) | | 1,720 | | 1,897 |
Municipal Bonds - continued |
| Principal
Amount (000s) | | Value (000s) |
Wisconsin - continued |
Wisconsin Gen. Oblig.: | | | | |
Series 2005 1, 5% 5/1/15 (Nat'l. Pub. Fin. Guarantee Corp. Insured) | | $ 6,325 | | $ 7,106 |
Series 2009 C, 4% 5/1/14 | | 3,365 | | 3,583 |
Series 2010 1: | | | | |
5% 5/1/14 | | 5,750 | | 6,228 |
5% 5/1/15 | | 8,005 | | 8,994 |
5% 5/1/16 | | 10,000 | | 11,590 |
Wisconsin Health & Edl. Facilities Auth. Rev.: | | | | |
(Agnesian HealthCare, Inc. Proj.) Series 2010, 5% 7/1/16 | | 1,175 | | 1,304 |
(Aurora Health Care, Inc. Proj.) Series 2010 A, 5% 4/15/17 | | 1,500 | | 1,707 |
(Marshfield Clinic Proj.) Series 2006 A, 5% 2/15/13 | | 875 | | 899 |
(Thedacare, Inc. Proj.) Series 2010: | | | | |
4% 12/15/13 | | 1,035 | | 1,079 |
5% 12/15/15 | | 1,105 | | 1,236 |
5% 12/15/16 | | 1,440 | | 1,637 |
5% 12/15/17 | | 1,540 | | 1,773 |
| | 49,033 |
TOTAL MUNICIPAL BONDS (Cost $3,451,990) |
3,599,300
|
Municipal Notes - 0.4% |
| | | |
California - 0.1% |
California School Cash Reserve Prog. Auth. TRAN Series 2012 X, 2.5% 1/31/13 | 4,000 | | 4,029 |
New York - 0.3% |
Suffolk County Gen. Oblig. TAN Series 2012 II, 2% 7/12/12 | 11,800 | | 11,806 |
TOTAL MUNICIPAL NOTES (Cost $15,827) |
15,835
|
Money Market Funds - 7.8% |
| Shares | | Value (000s) |
Fidelity Municipal Cash Central Fund, 0.21% (c)(d)
(Cost $338,204) | 338,203,900 | | $ 338,204 |
TOTAL INVESTMENT PORTFOLIO - 91.9% (Cost $3,806,021) | | 3,953,339 |
NET OTHER ASSETS (LIABILITIES) - 8.1% | | 348,599 |
NET ASSETS - 100% | $ 4,301,938 |
Security Type Abbreviations |
TAN | - | TAX ANTICIPATION NOTE |
TRAN | - | TAX AND REVENUE ANTICIPATION NOTE |
Legend |
(a) Security or a portion of the security purchased on a delayed delivery or when-issued basis. |
(b) Coupon rates for floating and adjustable rate securities reflect the rates in effect at period end. |
(c) Information in this report regarding holdings by state and security types does not reflect the holdings of the Fidelity Municipal Cash Central Fund. |
(d) Affiliated fund that is available only to investment companies and other accounts managed by Fidelity Investments. The rate quoted is the annualized seven-day yield of the fund at period end. A complete unaudited listing of the fund's holdings as of its most recent quarter end is available upon request. In addition, each Fidelity Central Fund's financial statements are available on the SEC's website or upon request. |
(e) Private activity obligations whose interest is subject to the federal alternative minimum tax for individuals. |
Affiliated Central Funds |
Information regarding fiscal year to date income earned by the Fund from investments in Fidelity Central Funds is as follows: |
Fund | Income earned
(Amounts in thousands) |
Fidelity Municipal Cash Central Fund | $ 280 |
Other Information |
The following is a summary of the inputs used, as of June 30, 2012, involving the Fund's assets and liabilities carried at fair value. The inputs or methodology used for valuing securities may not be an indication of the risk associated with investing in those securities. For more information on valuation inputs, and their aggregation into the levels used in the table below, please refer to the Security Valuation section in the accompanying Notes to Financial Statements. |
Valuation Inputs at Reporting Date: |
Description
(Amounts in thousands) | Total | Level 1 | Level 2 | Level 3 |
Investments in Securities: | | | | |
Municipal Securities | $ 3,615,135 | $ - | $ 3,615,135 | $ - |
Money Market Funds | 338,204 | 338,204 | - | - |
Total Investments in Securities: | $ 3,953,339 | $ 338,204 | $ 3,615,135 | $ - |
The distribution of municipal securities by revenue source, as a percentage of total net assets, is as follows (Unaudited): |
General Obligations | 32.1% |
Electric Utilities | 12.8% |
Special Tax | 11.1% |
Health Care | 8.6% |
Water & Sewer | 5.7% |
Transportation | 5.2% |
Others (Individually Less Than 5%) | 8.6% |
Short-Term Investments and Net Other Assets | 15.9% |
| 100.0% |
See accompanying notes which are an integral part of the financial statements.
Semiannual Report
Statement of Assets and Liabilities
Amounts in thousands (except per-share amounts) | June 30, 2012 (Unaudited) |
| | |
Assets | | |
Investment in securities, at value - See accompanying schedule: Unaffiliated issuers (cost $3,467,817) | $ 3,615,135 | |
Fidelity Central Funds (cost $338,204) | 338,204 | |
Total Investments (cost $3,806,021) | | $ 3,953,339 |
Cash | | 350,577 |
Receivable for fund shares sold | | 5,368 |
Interest receivable | | 40,213 |
Distributions receivable from Fidelity Central Funds | | 58 |
Other receivables | | 79 |
Total assets | | 4,349,634 |
| | |
Liabilities | | |
Payable for investments purchased on a delayed delivery basis | $ 40,825 | |
Payable for fund shares redeemed | 2,478 | |
Distributions payable | 1,663 | |
Accrued management fee | 1,305 | |
Distribution and service plan fees payable | 155 | |
Other affiliated payables | 1,194 | |
Other payables and accrued expenses | 76 | |
Total liabilities | | 47,696 |
| | |
Net Assets | | $ 4,301,938 |
Net Assets consist of: | | |
Paid in capital | | $ 4,151,057 |
Undistributed net investment income | | 245 |
Accumulated undistributed net realized gain (loss) on investments | | 3,318 |
Net unrealized appreciation (depreciation) on investments | | 147,318 |
Net Assets | | $ 4,301,938 |
See accompanying notes which are an integral part of the financial statements.
Semiannual Report
Statement of Assets and Liabilities - continued
Amounts in thousands (except per-share amounts) | June 30, 2012 (Unaudited) |
| | |
Calculation of Maximum Offering Price Class A:
Net Asset Value and redemption price per share ($365,613 ÷ 33,625 shares) | | $ 10.87 |
| | |
Maximum offering price per share (100/97.25 of $10.87) | | $ 11.18 |
Class T:
Net Asset Value and redemption price per share ($25,579 ÷ 2,357 shares) | | $ 10.85 |
| | |
Maximum offering price per share (100/97.25 of $10.85) | | $ 11.16 |
Class B:
Net Asset Value and offering price per share ($1,456 ÷ 134 shares)A | | $ 10.87 |
| | |
Class C:
Net Asset Value and offering price per share ($88,394 ÷ 8,144 shares)A | | $ 10.85 |
| | |
| | |
Short-Intermediate Municipal Income:
Net Asset Value, offering price and redemption price per share ($3,623,040 ÷ 333,766 shares) | | $ 10.86 |
| | |
Institutional Class:
Net Asset Value, offering price and redemption price per share ($197,856 ÷ 18,218 shares) | | $ 10.86 |
A Redemption price per share is equal to net asset value less any applicable contingent deferred sales charge.
See accompanying notes which are an integral part of the financial statements.
Semiannual Report
Financial Statements - continued
Statement of Operations
Amounts in thousands Six months ended June 30, 2012 (Unaudited) |
| | |
Investment Income | | |
Interest | | $ 49,992 |
Income from Fidelity Central Funds | | 280 |
Total income | | 50,272 |
| | |
Expenses | | |
Management fee | $ 7,806 | |
Transfer agent fees | 2,075 | |
Distribution and service plan fees | 919 | |
Accounting fees and expenses | 315 | |
Custodian fees and expenses | 22 | |
Independent trustees' compensation | 7 | |
Registration fees | 154 | |
Audit | 26 | |
Legal | 5 | |
Miscellaneous | 22 | |
Total expenses before reductions | 11,351 | |
Expense reductions | (130) | 11,221 |
Net investment income (loss) | | 39,051 |
Realized and Unrealized Gain (Loss) Net realized gain (loss) on: | | |
Investment securities: | | |
Unaffiliated issuers | | 3,318 |
Change in net unrealized appreciation (depreciation) on investment securities | | 10,912 |
Net gain (loss) | | 14,230 |
Net increase (decrease) in net assets resulting from operations | | $ 53,281 |
See accompanying notes which are an integral part of the financial statements.
Semiannual Report
Statement of Changes in Net Assets
Amounts in thousands | Six months ended
June 30, 2012
(Unaudited) | Year ended
December 31,
2011 |
Increase (Decrease) in Net Assets | | |
Operations | | |
Net investment income (loss) | $ 39,051 | $ 80,340 |
Net realized gain (loss) | 3,318 | 2,116 |
Change in net unrealized appreciation (depreciation) | 10,912 | 76,652 |
Net increase (decrease) in net assets resulting
from operations | 53,281 | 159,108 |
Distributions to shareholders from net investment income | (35,890) | (83,163) |
Distributions to shareholders from net realized gain | - | (2,965) |
Total distributions | (35,890) | (86,128) |
Share transactions - net increase (decrease) | 167,121 | 142,426 |
Redemption fees | 27 | 46 |
Total increase (decrease) in net assets | 184,539 | 215,452 |
| | |
Net Assets | | |
Beginning of period | 4,117,399 | 3,901,947 |
End of period (including undistributed net investment income of $245 and distributions in excess of net investment income of $2,916, respectively) | $ 4,301,938 | $ 4,117,399 |
See accompanying notes which are an integral part of the financial statements.
Semiannual Report
Financial Highlights - Class A
| Six months ended
June 30, 2012 | Years ended December 31, |
| (Unaudited) | 2011 | 2010 | 2009 | 2008 | 2007 |
Selected Per-Share Data | | | | | |
Net asset value, beginning of period | $ 10.83 | $ 10.62 | $ 10.64 | $ 10.35 | $ 10.33 | $ 10.21 |
Income from Investment Operations | | | | | | |
Net investment income (loss) E | .085 | .198 | .209 | .254 | .298 | .302 |
Net realized and unrealized gain (loss) | .032 | .225 | (.016) | .294 | .021 | .118 |
Total from investment operations | .117 | .423 | .193 | .548 | .319 | .420 |
Distributions from net investment income | (.077) | (.205) | (.209) | (.258) | (.300) | (.300) |
Distributions from net realized gain | - | (.008) | (.004) | - | - | - |
Total distributions | (.077) | (.213) | (.213) | (.258) | (.300) | (.300) |
Redemption fees added to paid in capital E | - I | - I | - I | - I | .001 | - I |
Net asset value, end of period | $ 10.87 | $ 10.83 | $ 10.62 | $ 10.64 | $ 10.35 | $ 10.33 |
Total Return B, C, D | 1.08% | 4.03% | 1.81% | 5.34% | 3.13% | 4.19% |
Ratios to Average Net Assets F, H | | | | | |
Expenses before reductions | .80% A | .77% | .78% | .79% | .75% | .71% |
Expenses net of fee waivers, if any | .80% A | .77% | .78% | .78% | .75% | .71% |
Expenses net of all reductions | .79% A | .77% | .77% | .78% | .72% | .64% |
Net investment income (loss) | 1.58% A | 1.85% | 1.95% | 2.41% | 2.90% | 2.95% |
Supplemental Data | | | | | |
Net assets, end of period (in millions) | $ 366 | $ 336 | $ 200 | $ 169 | $ 58 | $ 12 |
Portfolio turnover rate G | 24% A | 22% | 15% | 8% | 20% | 23% |
A Annualized
B Total returns for periods of less than one year are not annualized.
C Total returns would have been lower if certain expenses had not been reduced during the applicable periods shown.
D Total returns do not include the effect of the sales charges.
E Calculated based on average shares outstanding during the period.
F Fees and expenses of any underlying Fidelity Central Funds are not included in the Fund's expense ratio. The Fund indirectly bears its proportionate share of the expenses of any underlying Fidelity Central Funds.
G Amount does not include the portfolio activity of any underlying Fidelity Central Funds.
H Expense ratios reflect operating expenses of the class. Expenses before reductions do not reflect amounts reimbursed by the investment adviser or reductions from brokerage service arrangements or reductions from other expense offset arrangements and do not represent the amount paid by the class during periods when reimbursements or reductions occur. Expenses net of fee waivers reflect expenses after reimbursement by the investment adviser but prior to reductions from brokerage service arrangements or other expense offset arrangements. Expenses net of all reductions represent the net expenses paid by the class.
I Amount represents less than $.001 per share.
See accompanying notes which are an integral part of the financial statements.
Semiannual Report
Financial Highlights - Class T
| Six months ended
June 30, 2012 | Years ended December 31, |
| (Unaudited) | 2011 | 2010 | 2009 | 2008 | 2007 |
Selected Per-Share Data | | | | | |
Net asset value, beginning of period | $ 10.81 | $ 10.60 | $ 10.63 | $ 10.34 | $ 10.31 | $ 10.19 |
Income from Investment Operations | | | | | | |
Net investment income (loss) E | .086 | .199 | .211 | .255 | .300 | .297 |
Net realized and unrealized gain (loss) | .032 | .226 | (.026) | .294 | .029 | .120 |
Total from investment operations | .118 | .425 | .185 | .549 | .329 | .417 |
Distributions from net investment income | (.078) | (.207) | (.211) | (.259) | (.300) | (.297) |
Distributions from net realized gain | - | (.008) | (.004) | - | - | - |
Total distributions | (.078) | (.215) | (.215) | (.259) | (.300) | (.297) |
Redemption fees added to paid in capital E | - I | - I | - I | - I | .001 | - I |
Net asset value, end of period | $ 10.85 | $ 10.81 | $ 10.60 | $ 10.63 | $ 10.34 | $ 10.31 |
Total Return B, C, D | 1.10% | 4.05% | 1.74% | 5.36% | 3.24% | 4.17% |
Ratios to Average Net Assets F, H | | | | | |
Expenses before reductions | .77% A | .76% | .76% | .77% | .74% | .74% |
Expenses net of fee waivers, if any | .77% A | .76% | .76% | .77% | .74% | .74% |
Expenses net of all reductions | .77% A | .76% | .75% | .77% | .72% | .69% |
Net investment income (loss) | 1.60% A | 1.86% | 1.97% | 2.42% | 2.90% | 2.91% |
Supplemental Data | | | | | |
Net assets, end of period (in millions) | $ 26 | $ 26 | $ 24 | $ 23 | $ 15 | $ 10 |
Portfolio turnover rate G | 24% A | 22% | 15% | 8% | 20% | 23% |
A Annualized
B Total returns for periods of less than one year are not annualized.
C Total returns would have been lower if certain expenses had not been reduced during the applicable periods shown.
D Total returns do not include the effect of the sales charges.
E Calculated based on average shares outstanding during the period.
F Fees and expenses of any underlying Fidelity Central Funds are not included in the Fund's expense ratio. The Fund indirectly bears its proportionate share of the expenses of any underlying Fidelity Central Funds.
G Amount does not include the portfolio activity of any underlying Fidelity Central Funds.
H Expense ratios reflect operating expenses of the class. Expenses before reductions do not reflect amounts reimbursed by the investment adviser or reductions from brokerage service arrangements or reductions from other expense offset arrangements and do not represent the amount paid by the class during periods when reimbursements or reductions occur. Expenses net of fee waivers reflect expenses after reimbursement by the investment adviser but prior to reductions from brokerage service arrangements or other expense offset arrangements. Expenses net of all reductions represent the net expenses paid by the class.
I Amount represents less than $.001 per share.
See accompanying notes which are an integral part of the financial statements.
Semiannual Report
Financial Highlights - Class B
| Six months ended
June 30, 2012 | Years ended December 31, |
| (Unaudited) | 2011 | 2010 | 2009 | 2008 | 2007 |
Selected Per-Share Data | | | | | |
Net asset value, beginning of period | $ 10.82 | $ 10.61 | $ 10.64 | $ 10.35 | $ 10.32 | $ 10.20 |
Income from Investment Operations | | | | | | |
Net investment income (loss) E | .050 | .128 | .139 | .186 | .230 | .228 |
Net realized and unrealized gain (loss) | .042 | .226 | (.026) | .293 | .029 | .121 |
Total from investment operations | .092 | .354 | .113 | .479 | .259 | .349 |
Distributions from net investment income | (.042) | (.136) | (.139) | (.189) | (.230) | (.229) |
Distributions from net realized gain | - | (.008) | (.004) | - | - | - |
Total distributions | (.042) | (.144) | (.143) | (.189) | (.230) | (.229) |
Redemption fees added to paid in capital E | - I | - I | - I | - I | .001 | - I |
Net asset value, end of period | $ 10.87 | $ 10.82 | $ 10.61 | $ 10.64 | $ 10.35 | $ 10.32 |
Total Return B, C, D | .85% | 3.36% | 1.06% | 4.66% | 2.54% | 3.47% |
Ratios to Average Net Assets F, H | | | | | |
Expenses before reductions | 1.45% A | 1.43% | 1.44% | 1.46% | 1.43% | 1.41% |
Expenses net of fee waivers, if any | 1.45% A | 1.42% | 1.43% | 1.43% | 1.43% | 1.41% |
Expenses net of all reductions | 1.44% A | 1.42% | 1.42% | 1.43% | 1.40% | 1.36% |
Net investment income (loss) | .92% A | 1.19% | 1.30% | 1.77% | 2.22% | 2.23% |
Supplemental Data | | | | | |
Net assets, end of period (in millions) | $ 1 | $ 2 | $ 2 | $ 3 | $ 2 | $ 1 |
Portfolio turnover rate G | 24% A | 22% | 15% | 8% | 20% | 23% |
A Annualized
B Total returns for periods of less than one year are not annualized.
C Total returns would have been lower if certain expenses had not been reduced during the applicable periods shown.
D Total returns do not include the effect of the contingent deferred sales charge.
E Calculated based on average shares outstanding during the period.
F Fees and expenses of any underlying Fidelity Central Funds are not included in the Fund's expense ratio. The Fund indirectly bears its proportionate share of the expenses of any underlying Fidelity Central Funds.
G Amount does not include the portfolio activity of any underlying Fidelity Central Funds.
H Expense ratios reflect operating expenses of the class. Expenses before reductions do not reflect amounts reimbursed by the investment adviser or reductions from brokerage service arrangements or reductions from other expense offset arrangements and do not represent the amount paid by the class during periods when reimbursements or reductions occur. Expenses net of fee waivers reflect expenses after reimbursement by the investment adviser but prior to reductions from brokerage service arrangements or other expense offset arrangements. Expenses net of all reductions represent the net expenses paid by the class.
I Amount represents less than $.001 per share.
See accompanying notes which are an integral part of the financial statements.
Semiannual Report
Financial Highlights - Class C
| Six months ended June 30, 2012 | Years ended December 31, |
| (Unaudited) | 2011 | 2010 | 2009 | 2008 | 2007 |
Selected Per-Share Data | | | | | |
Net asset value, beginning of period | $ 10.81 | $ 10.60 | $ 10.63 | $ 10.33 | $ 10.31 | $ 10.19 |
Income from Investment Operations | | | | | | |
Net investment income (loss) E | .045 | .117 | .129 | .175 | .220 | .219 |
Net realized and unrealized gain (loss) | .032 | .226 | (.026) | .303 | .020 | .120 |
Total from investment operations | .077 | .343 | .103 | .478 | .240 | .339 |
Distributions from net investment income | (.037) | (.125) | (.129) | (.178) | (.221) | (.219) |
Distributions from net realized gain | - | (.008) | (.004) | - | - | - |
Total distributions | (.037) | (.133) | (.133) | (.178) | (.221) | (.219) |
Redemption fees added to paid in capital E | - I | - I | - I | - I | .001 | - I |
Net asset value, end of period | $ 10.85 | $ 10.81 | $ 10.60 | $ 10.63 | $ 10.33 | $ 10.31 |
Total Return B, C, D | .71% | 3.25% | .96% | 4.66% | 2.35% | 3.37% |
Ratios to Average Net Assets F, H | | | | | |
Expenses before reductions | 1.54% A | 1.53% | 1.52% | 1.53% | 1.50% | 1.51% |
Expenses net of fee waivers, if any | 1.54% A | 1.53% | 1.52% | 1.53% | 1.50% | 1.51% |
Expenses net of all reductions | 1.54% A | 1.52% | 1.52% | 1.53% | 1.48% | 1.45% |
Net investment income (loss) | .83% A | 1.09% | 1.20% | 1.67% | 2.14% | 2.14% |
Supplemental Data | | | | | |
Net assets, end of period (in millions) | $ 88 | $ 79 | $ 77 | $ 56 | $ 20 | $ 6 |
Portfolio turnover rate G | 24% A | 22% | 15% | 8% | 20% | 23% |
A Annualized
B Total returns for periods of less than one year are not annualized.
C Total returns would have been lower if certain expenses had not been reduced during the applicable periods shown.
D Total returns do not include the effect of the contingent deferred sales charge.
E Calculated based on average shares outstanding during the period.
F Fees and expenses of any underlying Fidelity Central Funds are not included in the Fund's expense ratio. The Fund indirectly bears its proportionate share of the expenses of any underlying Fidelity Central Funds.
G Amount does not include the portfolio activity of any underlying Fidelity Central Funds.
H Expense ratios reflect operating expenses of the class. Expenses before reductions do not reflect amounts reimbursed by the investment adviser or reductions from brokerage service arrangements or reductions from other expense offset arrangements and do not represent the amount paid by the class during periods when reimbursements or reductions occur. Expenses net of fee waivers reflect expenses after reimbursement by the investment adviser but prior to reductions from brokerage service arrangements or other expense offset arrangements. Expenses net of all reductions represent the net expenses paid by the class.
I Amount represents less than $.001 per share.
See accompanying notes which are an integral part of the financial statements.
Semiannual Report
Financial Highlights - Short-Intermediate Municipal Income
| Six months ended
June 30, 2012 | Years ended December 31, |
| (Unaudited) | 2011 | 2010 | 2009 | 2008 | 2007 |
Selected Per-Share Data | | | | | |
Net asset value, beginning of period | $ 10.81 | $ 10.60 | $ 10.63 | $ 10.34 | $ 10.31 | $ 10.19 |
Income from Investment Operations | | | | | | |
Net investment income (loss) D | .102 | .228 | .240 | .284 | .326 | .323 |
Net realized and unrealized gain (loss) | .042 | .227 | (.026) | .293 | .029 | .120 |
Total from investment operations | .144 | .455 | .214 | .577 | .355 | .443 |
Distributions from net investment income | (.094) | (.237) | (.240) | (.287) | (.326) | (.323) |
Distributions from net realized gain | - | (.008) | (.004) | - | - | - |
Total distributions | (.094) | (.245) | (.244) | (.287) | (.326) | (.323) |
Redemption fees added to paid in capital D | - H | - H | - H | - H | .001 | - H |
Net asset value, end of period | $ 10.86 | $ 10.81 | $ 10.60 | $ 10.63 | $ 10.34 | $ 10.31 |
Total Return B, C | 1.34% | 4.34% | 2.02% | 5.64% | 3.50% | 4.43% |
Ratios to Average Net Assets E, G | | | | | |
Expenses before reductions | .48% A | .48% | .48% | .50% | .49% | .49% |
Expenses net of fee waivers, if any | .48% A | .48% | .48% | .50% | .49% | .49% |
Expenses net of all reductions | .48% A | .48% | .48% | .50% | .47% | .43% |
Net investment income (loss) | 1.89% A | 2.14% | 2.24% | 2.69% | 3.15% | 3.17% |
Supplemental Data | | | | | |
Net assets, end of period (in millions) | $ 3,623 | $ 3,523 | $ 3,456 | $ 3,153 | $ 1,870 | $ 1,650 |
Portfolio turnover rate F | 24% A | 22% | 15% | 8% | 20% | 23% |
A Annualized
B Total returns for periods of less than one year are not annualized.
C Total returns would have been lower if certain expenses had not been reduced during the applicable periods shown.
D Calculated based on average shares outstanding during the period.
E Fees and expenses of any underlying Fidelity Central Funds are not included in the Fund's expense ratio. The Fund indirectly bears its proportionate share of the expenses of any underlying Fidelity Central Funds.
F Amount does not include the portfolio activity of any underlying Fidelity Central Funds.
G Expense ratios reflect operating expenses of the class. Expenses before reductions do not reflect amounts reimbursed by the investment adviser or reductions from brokerage service arrangements or reductions from other expense offset arrangements and do not represent the amount paid by the class during periods when reimbursements or reductions occur. Expenses net of fee waivers reflect expenses after reimbursement by the investment adviser but prior to reductions from brokerage service arrangements or other expense offset arrangements. Expenses net of all reductions represent the net expenses paid by the class.
H Amount represents less than $.001 per share.
See accompanying notes which are an integral part of the financial statements.
Semiannual Report
Financial Highlights - Institutional Class
| Six months ended
June 30, 2012 | Years ended December 31, |
| (Unaudited) | 2011 | 2010 | 2009 | 2008 | 2007 |
Selected Per-Share Data | | | | | |
Net asset value, beginning of period | $ 10.81 | $ 10.61 | $ 10.63 | $ 10.34 | $ 10.32 | $ 10.20 |
Income from Investment Operations | | | | | | |
Net investment income (loss) D | .099 | .224 | .235 | .281 | .321 | .320 |
Net realized and unrealized gain (loss) | .042 | .216 | (.015) | .293 | .022 | .120 |
Total from investment operations | .141 | .440 | .220 | .574 | .343 | .440 |
Distributions from net investment income | (.091) | (.232) | (.236) | (.284) | (.324) | (.320) |
Distributions from net realized gain | - | (.008) | (.004) | - | - | - |
Total distributions | (.091) | (.240) | (.240) | (.284) | (.324) | (.320) |
Redemption fees added to paid in capital D | - H | - H | - H | - H | .001 | - H |
Net asset value, end of period | $ 10.86 | $ 10.81 | $ 10.61 | $ 10.63 | $ 10.34 | $ 10.32 |
Total Return B, C | 1.31% | 4.19% | 2.07% | 5.61% | 3.38% | 4.39% |
Ratios to Average Net Assets E, G | | | | | |
Expenses before reductions | .53% A | .52% | .53% | .55% | .51% | .52% |
Expenses net of fee waivers, if any | .53% A | .52% | .53% | .53% | .51% | .52% |
Expenses net of all reductions | .53% A | .52% | .52% | .53% | .49% | .45% |
Net investment income (loss) | 1.84% A | 2.09% | 2.20% | 2.66% | 3.13% | 3.14% |
Supplemental Data | | | | | |
Net assets, end of period (in millions) | $ 198 | $ 152 | $ 142 | $ 92 | $ 32 | $ 5 |
Portfolio turnover rate F | 24% A | 22% | 15% | 8% | 20% | 23% |
A Annualized
B Total returns for periods of less than one year are not annualized.
C Total returns would have been lower if certain expenses had not been reduced during the applicable periods shown.
D Calculated based on average shares outstanding during the period.
E Fees and expenses of any underlying Fidelity Central Funds are not included in the Fund's expense ratio. The Fund indirectly bears its proportionate share of the expenses of any underlying Fidelity Central Funds.
F Amount does not include the portfolio activity of any underlying Fidelity Central Funds.
G Expense ratios reflect operating expenses of the class. Expenses before reductions do not reflect amounts reimbursed by the investment adviser or reductions from brokerage service arrangements or reductions from other expense offset arrangements and do not represent the amount paid by the class during periods when reimbursements or reductions occur. Expenses net of fee waivers reflect expenses after reimbursement by the investment adviser but prior to reductions from brokerage service arrangements or other expense offset arrangements. Expenses net of all reductions represent the net expenses paid by the class.
H Amount represents less than $.001 per share.
See accompanying notes which are an integral part of the financial statements.
Semiannual Report
Notes to Financial Statements
For the period ended June 30, 2012 (Unaudited)
(Amounts in thousands except percentages)
1. Organization.
Fidelity® Short-Intermediate Municipal Income Fund (the Fund) is a fund of Fidelity Municipal Trust (the Trust) and is authorized to issue an unlimited number of shares. The Trust is registered under the Investment Company Act of 1940, as amended (the 1940 Act), as an open-end management investment company organized as a Massachusetts business trust. The Fund offers Class A, Class T, Class C, Short-Intermediate Municipal Income and Institutional Class shares, each of which, along with Class B shares, has equal rights as to assets and voting privileges. Effective after the close of business on September 1, 2010, Class B shares were closed to new accounts and additional purchases, except for exchanges and reinvestments. Each class has exclusive voting rights with respect to matters that affect that class. Class B shares will automatically convert to Class A shares after a holding period of four years from the initial date of purchase. Investment income, realized and unrealized capital gains and losses, the common expenses of the Fund, and certain fund-level expense reductions, if any, are allocated on a pro-rata basis to each class based on the relative net assets of each class to the total net assets of the Fund. Each class differs with respect to transfer agent and distribution and service plan fees incurred. Certain expense reductions may also differ by class.
2. Investments in Fidelity Central Funds.
The Fund invests in Fidelity Central Funds, which are open-end investment companies available only to other investment companies and accounts managed by Fidelity Management & Research Company (FMR) and its affiliates. The Fund's Schedule of Investments lists each of the Fidelity Central Funds held as of period end, if any, as an investment of the Fund, but does not include the underlying holdings of each Fidelity Central Fund. As an Investing Fund, the Fund indirectly bears its proportionate share of the expenses of the underlying Fidelity Central Funds.
The Money Market Central Funds seek preservation of capital and current income and are managed by Fidelity Investments Money Management, Inc. (FIMM), an affiliate of FMR.
A complete unaudited list of holdings for each Fidelity Central Fund is available upon request or at the Securities and Exchange Commission (the SEC) web site at www.sec.gov. In addition, the financial statements of the Fidelity Central Funds are available on the SEC web site or upon request.
3. Significant Accounting Policies.
The financial statements have been prepared in conformity with accounting principles generally accepted in the United States of America (GAAP), which require management to make certain estimates and assumptions at the date of the financial statements.
Semiannual Report
Notes to Financial Statements (Unaudited) - continued
(Amounts in thousands except percentages)
3. Significant Accounting Policies - continued
Actual results could differ from those estimates. Subsequent events, if any, through the date that the financial statements were issued have been evaluated in the preparation of the financial statements. The following summarizes the significant accounting policies of the Fund:
Security Valuation. Investments are valued as of 4:00 p.m. Eastern time on the last calendar day of the period. In accordance with valuation policies and procedures approved by the Board of Trustees (the Board), the Fund attempts to obtain prices from one or more third party pricing vendor or broker to value its investments. When current market prices, quotations or rates are not readily available or reliable, securities will be fair valued in good faith by the FMR Fair Value Committee (the Committee), in accordance with procedures adopted by the Board. Factors used in determining fair value vary by security type and may include market or security specific events, changes in interest rates and credit quality. The frequency with which these procedures are used cannot be predicted and they may be utilized to a significant extent. The Committee oversees the Fund's valuation policies and procedures and is responsible for approving and reporting to the Board all fair value determinations.
The Fund categorizes the inputs to valuation techniques used to value its investments into a disclosure hierarchy consisting of three levels as shown below:
Level 1 - quoted prices in active markets for identical investments
Level 2 - other significant observable inputs (including quoted prices for similar investments, interest rates, prepayment speeds, etc.)
Level 3 - unobservable inputs (including the Fund's own assumptions based on the best information available)
Valuation techniques used to value the Fund's investments by major category are as follows:
Debt securities, including restricted securities, are valued based on evaluated prices received from third party pricing vendors or from brokers who make markets in such securities. For municipal securities, pricing vendors utilize matrix pricing which considers yield or price of bonds of comparable quality, coupon, maturity and type as well as broker-supplied prices and are generally categorized as Level 2 in the hierarchy. When independent prices are unavailable or unreliable, debt securities may be valued utilizing pricing methodologies which consider similar factors that would be used by third party pricing vendors. These are generally categorized as Level 2 in the hierarchy but may be Level 3 depending on the circumstances.
Semiannual Report
3. Significant Accounting Policies - continued
Security Valuation - continued
Investments in open-end mutual funds, including the Fidelity Central Funds, are valued at their closing net asset value each business day and are categorized as Level 1 in the hierarchy.
Changes in valuation techniques may result in transfers in or out of an assigned level within the disclosure hierarchy. The aggregate value of investments by input level, as of June 30, 2012 for the Fund's investments, is included at the end of Fund's Schedule of Investments.
Investment Transactions and Income. For financial reporting purposes, the Fund's investment holdings and NAV include trades executed through the end of the last business day of the period. The NAV per share for processing shareholder transactions is calculated as of the close of business of the New York Stock Exchange (NYSE), normally 4:00 p.m. Eastern time and includes trades executed through the end of the prior business day. Gains and losses on securities sold are determined on the basis of identified cost. Interest income and distributions from the Fidelity Central Funds are accrued as earned. Interest income includes coupon interest and amortization of premium and accretion of discount on debt securities.
Expenses. Expenses directly attributable to a fund are charged to that fund. Expenses attributable to more than one fund are allocated among the respective funds on the basis of relative net assets or other appropriate methods. Expense estimates are accrued in the period to which they relate and adjustments are made when actual amounts are known.
Income Tax Information and Distributions to Shareholders. Each year, the Fund intends to qualify as a regulated investment company under Subchapter M of the Internal Revenue Code, including distributing substantially all of its taxable income and realized gains. As a result, no provision for income taxes is required. The Fund files a U.S. federal tax return, in addition to state and local tax returns as required. A fund's federal income tax returns are subject to examination by the Internal Revenue Service (IRS) for a period of three fiscal years after they are filed. State and local tax returns may be subject to examination for an additional fiscal year depending on the jurisdiction.
Dividends are declared and recorded daily and paid monthly from net investment income. Distributions from realized gains, if any, are declared and recorded on the ex-dividend date. Income dividends and capital gain distributions are declared separately for each class. Income and capital gain distributions are determined in accordance with income tax regulations, which may differ from GAAP.
Semiannual Report
Notes to Financial Statements (Unaudited) - continued
(Amounts in thousands except percentages)
3. Significant Accounting Policies - continued
Income Tax Information and Distributions to Shareholders - continued
Capital accounts within the financial statements are adjusted for permanent book-tax differences. These adjustments have no impact on net assets or the results of operations. Temporary book-tax differences will reverse in a subsequent period.
Book-tax differences are primarily due to market discount and deferred trustees compensation.
The Fund purchases municipal securities whose interest, in the opinion of the issuer, is free from federal income tax. There is no assurance that the IRS will agree with this opinion. In the event the IRS determines that the issuer does not comply with relevant tax requirements, interest payments from a security could become federally taxable, possibly retroactively to the date the security was issued.
The federal tax cost of investment securities and unrealized appreciation (depreciation) as of period end were as follows:
Gross unrealized appreciation | $ 149,454 |
Gross unrealized depreciation | (2,136) |
Net unrealized appreciation (depreciation) on securities and other investments | $ 147,318 |
| |
Tax cost | $ 3,806,021 |
Short-Term Trading (Redemption) Fees. Shares held by investors in the Fund less than 30 days are subject to a redemption fee equal to .50% of the net asset value of shares redeemed. All redemption fees, which reduce the proceeds of the shareholder redemption, are retained by the Fund and accounted for as an addition to paid in capital.
4. Operating Policies.
Delayed Delivery Transactions and When-Issued Securities. During the period, the Fund transacted in securities on a delayed delivery or when-issued basis. Payment and delivery may take place after the customary settlement period for that security. The price of the underlying securities and the date when the securities will be delivered and paid for are fixed at the time the transaction is negotiated. The securities purchased on a delayed delivery or when-issued basis are identified as such in the Fund's Schedule of Investments. The Fund may receive compensation for interest forgone in the purchase of a delayed delivery or when-issued security. With respect to purchase commitments, the Fund identifies securities as segregated in its records with a value at least equal to the amount of the commitment. Losses may arise due to changes in the value of the
Semiannual Report
4. Operating Policies - continued
Delayed Delivery Transactions and When-Issued Securities - continued
underlying securities or if the counterparty does not perform under the contract's terms, or if the issuer does not issue the securities due to political, economic, or other factors.
5. Purchases and Sales of Investments.
Purchases and sales of securities, other than short-term securities, aggregated $497,798 and $427,553, respectively.
6. Fees and Other Transactions with Affiliates.
Management Fee. FMR and its affiliates provide the Fund with investment management related services for which the Fund pays a monthly management fee. The management fee is the sum of an individual fund fee rate that is based on an annual rate of .25% of the Fund's average net assets and an annualized group fee rate that averaged .12% during the period. The group fee rate is based upon the average net assets of all the mutual funds advised by FMR. The group fee rate decreases as assets under management increase and increases as assets under management decrease. For the period, the total annualized management fee rate was .37% of the Fund's average net assets.
Distribution and Service Plan Fees. In accordance with Rule 12b-1 of the 1940 Act, the Fund has adopted separate Distribution and Service Plans for each class of shares. Certain classes pay Fidelity Distributors Corporation (FDC), an affiliate of FMR, separate Distribution and Service Fees, each of which is based on an annual percentage of each class' average net assets. In addition, FDC may pay financial intermediaries for selling shares of the Fund and providing shareholder support services. For the period, the Distribution and Service Fee rates, total fees and amounts retained by FDC were as follows:
| Distribution
Fee | Service
Fee | Total Fees | Retained
by FDC |
Class A | -% | .25% | $ 456 | $ 29 |
Class T | -% | .25% | 34 | 1 |
Class B | .65% | .25% | 7 | 5 |
Class C | .75% | .25% | 422 | 139 |
| | | $ 919 | $ 174 |
Sales Load. FDC may receive a front-end sales charge of up to 2.75% for selling Class A shares and Class T shares, some of which is paid to financial intermediaries for selling shares of the Fund. Depending on the holding period, FDC may receive contingent deferred sales charges levied on Class A, Class T, Class B, and Class C redemptions. The deferred sales charges range from 3.00% to 1.00% for Class B shares, 1.00% for Class C
Semiannual Report
Notes to Financial Statements (Unaudited) - continued
(Amounts in thousands except percentages)
6. Fees and Other Transactions with Affiliates - continued
Sales Load - continued
shares, .75% or .50% for certain purchases of Class A shares and .25% for certain purchases of Class T shares.
For the period, sales charge amounts retained by FDC were as follows:
| Retained
by FDC |
Class A | $ 23 |
Class T | 5 |
Class B* | 1 |
Class C* | 11 |
| $ 40 |
* When Class B and Class C shares are initially sold, FDC pays commissions from its own resources to financial intermediaries through which the sales are made.
Transfer Agent and Accounting Fees. Citibank, N.A. (Citibank) is the custodian, transfer agent, and servicing agent for the Fund's Class A, Class T, Class B, Class C, Short-Intermediate Municipal Income and Institutional Class shares. Citibank has entered into a sub-arrangement with Fidelity Investments Institutional Operations Company, Inc. (FIIOC), an affiliate of FMR, with respect to all classes of the Fund, to perform the transfer agency, dividend disbursing, and shareholder servicing functions. FIIOC receives account fees and asset-based fees that vary according to the account size and type of account of the shareholders of the respective classes of the Fund. All fees are paid to FIIOC by Citibank, which is reimbursed by each class for such payments. FIIOC pays for typesetting, printing and mailing of shareholder reports, except proxy statements. For the period, transfer agent fees for each class were as follows:
| Amount | % of
Average
Net Assets* |
Class A | $ 276 | .15 |
Class T | 17 | .13 |
Class B | 1 | .15 |
Class C | 61 | .14 |
Short-Intermediate Municipal Income | 1,599 | .09 |
Institutional Class | 121 | .14 |
| $ 2,075 | |
* Annualized
Citibank also has a sub-arrangement with Fidelity Service Company, Inc. (FSC), an affiliate of FMR, under which FSC maintains the Fund's accounting records. The fee is based on the level of average net assets for the month.
Semiannual Report
7. Committed Line of Credit.
The Fund participates with other funds managed by FMR or an affiliate in a $4.25 billion credit facility (the "line of credit") to be utilized for temporary or emergency purposes to fund shareholder redemptions or for other short-term liquidity purposes. The Fund has agreed to pay commitment fees on its pro-rata portion of the line of credit, which amounted to $6 and is reflected in Miscellaneous expenses on the Statement of Operations. During the period, there were no borrowings on this line of credit.
8. Expense Reductions.
Through arrangements with the Fund's custodian, credits realized as a result of uninvested cash balances were used to reduce the Fund's expenses. During the period, these credits reduced the Fund's custody and accounting expenses by $22 and $108, respectively.
9. Distributions to Shareholders.
Distributions to shareholders of each class were as follows:
| Six months ended
June 30,
2012 | Year ended
December 31,
2011 |
From net investment income | | |
Class A | $ 2,581 | $ 4,211 |
Class T | 194 | 467 |
Class B | 6 | 27 |
Class C | 284 | 838 |
Short-Intermediate Municipal Income | 31,361 | 74,599 |
Institutional Class | 1,464 | 3,021 |
Total | $ 35,890 | $ 83,163 |
From net realized gain | | |
Class A | $ - | $ 216 |
Class T | - | 19 |
Class B | - | 1 |
Class C | - | 57 |
Short-Intermediate Municipal Income | - | 2,565 |
Institutional Class | - | 107 |
Total | $ - | $ 2,965 |
Semiannual Report
Notes to Financial Statements (Unaudited) - continued
(Amounts in thousands except percentages)
10. Share Transactions.
Transactions for each class of shares were as follows:
| Shares | Dollars |
| Six months ended
June 30,
2012 | Year ended
December 31,
2011 | Six months ended
June 30,
2012 | Year ended
December 31,
2011 |
Class A | | | | |
Shares sold | 14,034 | 22,096 | $ 152,609 | $ 237,519 |
Reinvestment of distributions | 191 | 303 | 2,077 | 3,252 |
Shares redeemed | (11,623) | (10,223) | (126,290) | (109,361) |
Net increase (decrease) | 2,602 | 12,176 | $ 28,396 | $ 131,410 |
Class T | | | | |
Shares sold | 349 | 881 | $ 3,775 | $ 9,442 |
Reinvestment of distributions | 15 | 35 | 159 | 373 |
Shares redeemed | (439) | (774) | (4,761) | (8,240) |
Net increase (decrease) | (75) | 142 | $ (827) | $ 1,575 |
Class B | | | | |
Shares sold | 15 | 27 | $ 171 | $ 297 |
Reinvestment of distributions | 1 | 2 | 4 | 19 |
Shares redeemed | (31) | (114) | (341) | (1,225) |
Net increase (decrease) | (15) | (85) | $ (166) | $ (909) |
Class C | | | | |
Shares sold | 1,738 | 2,509 | $ 18,857 | $ 26,904 |
Reinvestment of distributions | 20 | 62 | 219 | 661 |
Shares redeemed | (889) | (2,549) | (9,639) | (27,188) |
Net increase (decrease) | 869 | 22 | $ 9,437 | $ 377 |
Short-Intermediate Municipal Income | | | | |
Shares sold | 51,847 | 106,091 | $ 562,542 | $ 1,133,522 |
Reinvestment of distributions | 2,085 | 5,180 | 22,636 | 55,411 |
Shares redeemed | (46,093) | (111,332) | (500,105) | (1,186,447) |
Net increase (decrease) | 7,839 | (61) | $ 85,073 | $ 2,486 |
Institutional Class | | | | |
Shares sold | 8,229 | 8,223 | $ 89,360 | $ 87,964 |
Reinvestment of distributions | 69 | 115 | 754 | 1,228 |
Shares redeemed | (4,137) | (7,651) | (44,906) | (81,705) |
Net increase (decrease) | 4,161 | 687 | $ 45,208 | $ 7,487 |
11. Other.
The Fund's organizational documents provide former and current trustees and officers with a limited indemnification against liabilities arising in connection with the performance of their duties to the Fund. In the normal course of business, the Fund may also enter into contracts that provide general indemnifications. The Fund's maximum
Semiannual Report
11. Other - continued
exposure under these arrangements is unknown as this would be dependent on future claims that may be made against the Fund. The risk of material loss from such claims is considered remote.
Semiannual Report
Investment Adviser
Fidelity Management & Research Company
Boston, MA
Investment Sub-Advisers
Fidelity Investments Money
Management, Inc.
Fidelity Management & Research
(U.K.) Inc.
Fidelity Management & Research
(Hong Kong) Limited
Fidelity Management & Research
(Japan) Inc.
General Distributor
Fidelity Distributors Corporation
Smithfield, RI
Transfer and Service Agents
Citibank, N.A.
New York, NY
Fidelity Investments Institutional
Operations Company, Inc.
Boston, MA
Custodian
Citibank, N.A.
New York, NY
(Fidelity Investment logo)(registered trademark)
ASTMI-USAN-0812
1.803550.108
Item 2. Code of Ethics
Not applicable.
Item 3. Audit Committee Financial Expert
Not applicable.
Item 4. Principal Accountant Fees and Services
Not applicable.
Item 5. Audit Committee of Listed Registrants
Not applicable.
Item 6. Investments
(a) Not applicable.
(b) Not applicable
Item 7. Disclosure of Proxy Voting Policies and Procedures for Closed-End Management Investment Companies
Not applicable.
Item 8. Portfolio Managers of Closed-End Management Investment Companies
Not applicable.
Item 9. Purchase of Equity Securities by Closed-End Management Investment Company and Affiliated Purchasers
Not applicable.
Item 10. Submission of Matters to a Vote of Security Holders
There were no material changes to the procedures by which shareholders may recommend nominees to the Fidelity Municipal Trust's Board of Trustees.
Item 11. Controls and Procedures
(a)(i) The President and Treasurer and the Chief Financial Officer have concluded that the Fidelity Municipal Trust's (the "Trust") disclosure controls and procedures (as defined in Rule 30a-3(c) under the Investment Company Act) provide reasonable assurances that material information relating to the Trust is made known to them by the appropriate persons, based on their evaluation of these controls and procedures as of a date within 90 days of the filing date of this report.
(a)(ii) There was no change in the Trust's internal control over financial reporting (as defined in Rule 30a-3(d) under the Investment Company Act) that occurred during the second fiscal quarter of the period covered by this report that has materially affected, or is reasonably likely to materially affect, the Trust's internal control over financial reporting.
Item 12. Exhibits
(a) | (1) | Not applicable. |
(a) | (2) | Certification pursuant to Rule 30a-2(a) under the Investment Company Act of 1940 (17 CFR 270.30a-2(a)) is filed and attached hereto as Exhibit 99.CERT. |
(a) | (3) | Not applicable. |
(b) | | Certification pursuant to Rule 30a-2(b) under the Investment Company Act of 1940 (17 CFR 270.30a-2(b)) is furnished and attached hereto as Exhibit 99.906CERT. |
SIGNATURES
Pursuant to the requirements of the Securities Exchange Act of 1934 and the Investment Company Act of 1940, the registrant has duly caused this report to be signed on its behalf by the undersigned, thereunto duly authorized.
Fidelity Municipal Trust
By: | /s/John R. Hebble |
| John R. Hebble |
| President and Treasurer |
| |
Date: | August 21, 2012 |
Pursuant to the requirements of the Securities Exchange Act of 1934 and the Investment Company Act of 1940, this report has been signed below by the following persons on behalf of the registrant and in the capacities and on the dates indicated.
By: | /s/John R. Hebble |
| John R. Hebble |
| President and Treasurer |
| |
Date: | August 21, 2012 |
By: | /s/Christine Reynolds |
| Christine Reynolds |
| Chief Financial Officer |
| |
Date: | August 21, 2012 |