UNITED STATES
SECURITIES AND EXCHANGE COMMISSION
Washington, D.C. 20549
FORM N-CSR
CERTIFIED SHAREHOLDER REPORT OF REGISTERED
MANAGEMENT INVESTMENT COMPANIES
Investment Company Act file number 811-02628
Fidelity Municipal Trust
(Exact name of registrant as specified in charter)
82 Devonshire St., Boston, Massachusetts 02109
(Address of principal executive offices) (Zip code)
Eric D. Roiter, Secretary
82 Devonshire St.
Boston, Massachusetts 02109
(Name and address of agent for service)
Registrant's telephone number, including area code: 617-563-7000
Date of fiscal year end: | December 31 |
| |
Date of reporting period: | December 31, 2005 |
Item 1. Reports to Stockholders
Fidelity®
Michigan Municipal Income
Fund
(formerly Spartan® Michigan
Municipal Income Fund)
and
Fidelity
Michigan Municipal Money
Market Fund
|
Annual Report
December 31, 2005
|


| Contents | | | | |
| |
| |
| Chairman’s Message | | 4 | | Ned Johnson’s message to shareholders |
| Performance | | 5 | | How the fund has done over time. |
| Management’s | | 6 | | The manager’s review of fund performance, |
| Discussion | | | | strategy and outlook. |
| Shareholder Expense | | 7 | | An example of shareholder expenses. |
| Example | | | | |
| Fidelity Michigan Municipal Income Fund |
| Investment Changes | | 9 | | A summary of major shifts in the fund’s |
| | | | | investments over the past six months. |
| Investments | | 10 | | A complete list of the fund’s investments with |
| | | | | their market values. |
| Financial Statements | | 21 | | Statements of assets and liabilities, operations, |
| | | | | and changes in net assets, |
| | | | | as well as financial highlights. |
| Fidelity Michigan Municipal Money Market Fund |
| Investment Changes/ | | 25 | | A summary of major shifts in the fund’s investments |
| Performance | | | | over the past six months and one year. |
| Investments | | 26 | | A complete list of the fund’s investments. |
| Financial Statements | | 34 | | Statements of assets and liabilities, operations, |
| | | | | and changes in net assets, |
| | | | | as well as financial highlights. |
| Notes | | 38 | | Notes to the Financial Statements |
| Report of Independent | | 44 | | |
| Registered Public | | | | |
| Accounting Firm | | | | |
| Trustees and Officers | | 45 | | |
| Distributions | | 57 | | |
| Proxy Voting Results | | 58 | | |
| | To view a fund’s proxy voting guidelines and proxy voting record for the 12 month period ended
June 30, visit www.fidelity.com/proxyvotingresults or visit the Securities and Exchange Commis
sion’s (SEC) web site at www.sec.gov. You may also call 1-800-544-8544 to request a free copy of
the proxy voting guidelines.
Standard & Poor’s, S&P and S&P 500 are registered service marks of The McGraw Hill Companies, Inc.
and have been licensed for use by Fidelity Distributors Corporation.
Other third party marks appearing herein are the property of their respective owners.
All other marks appearing herein are registered or unregistered trademarks or service marks of FMR
Corp. or an affiliated company.
|
Annual Report 2
This report and the financial statements contained herein are submitted for the general
information of the shareholders of the funds. This report is not authorized for distribution to
prospective investors in the funds unless preceded or accompanied by an effective prospectus.
A fund files its complete schedule of portfolio holdings with the SEC for the first and third
quarters of each fiscal year on Form N Q. Forms N Q are available on the SEC’s web site at
http://www.sec.gov. A fund’s Forms N Q may be reviewed and copied at the SEC’s Public Reference
Room in Washington, DC. Information regarding the operation of the SEC’s Public Reference
Room may be obtained by calling 1-800-SEC-0330. For a complete list of a fund’s portfolio
holdings, view the most recent quarterly holdings report, semiannual report, or annual report
on Fidelity’s web site at http://www.fidelity.com/holdings.
NOT FDIC INSURED · MAY LOSE VALUE · NO BANK GUARANTEE
Neither the funds nor Fidelity Distributors Corporation is a bank.
|
3 Annual Report
Chairman’s Message
(photograph of Edward C. Johnson 3d)
Dear Shareholder:
During the past year or so, much has been reported about the mutual fund industry, and much of it has been more critical than I believe is warranted. Allegations that some companies have been less than forthright with their shareholders have cast a shadow on the entire industry. I continue to find these reports disturbing, and assert that they do not create an accurate picture of the industry overall. Therefore, I would like to remind every one where Fidelity stands on these issues. I will say two things specifically regarding allegations that some mutual fund companies were in violation of the Securities and Exchange Commission’s forward pricing rules or were involved in so called “market timing” activities.
First, Fidelity has no agreements that permit customers who buy fund shares after 4 p.m. to obtain the 4 p.m. price. This is not a new policy. This is not to say that some one could not deceive the company through fraudulent acts. However, we are extremely diligent in preventing fraud from occurring in this manner and in every other. But I underscore again that Fidelity has no so called “agreements” that sanction illegal practices.
Second, Fidelity continues to stand on record, as we have for years, in opposition to predatory short term trading that adversely affects shareholders in a mutual fund. Back in the 1980s, we initiated a fee which is returned to the fund and, therefore, to investors to discourage this activity. Further, we took the lead several years ago in developing a Fair Value Pricing Policy to prevent market timing on foreign securities in our funds. I am confident we will find other ways to make it more difficult for predatory traders to operate. However, this will only be achieved through close cooperation among regulators, legislators and the industry.
Yes, there have been unfortunate instances of unethical and illegal activity within the mutual fund industry from time to time. That is true of any industry. When this occurs, confessed or convicted offenders should be dealt with appropriately. But we are still concerned about the risk of over regulation and the quick application of simplistic solutions to intricate problems. Every system can be improved, and we support and applaud well thought out improvements by regulators, legislators and industry representatives that achieve the common goal of building and protecting the value of investors’ holdings.
For nearly 60 years, Fidelity has worked very hard to improve its products and service to justify your trust. When our family founded this company in 1946, we had only a few hundred customers. Today, we serve more than 18 million customers including individual investors and participants in retirement plans across America.
Let me close by saying that we do not take your trust in us for granted, and we realize that we must always work to improve all aspects of our service to you. In turn, we urge you to continue your active participation with your financial matters, so that your interests can be well served.
Best regards,
/s/ Edward C. Johnson 3d
Edward C. Johnson 3d
Annual Report 4
Fidelity Michigan Municipal Income Fund
Performance: The Bottom Line
Average annual total return reflects the change in the value of an investment, assuming reinvestment of the fund’s dividend income and capital gains (the profits earned upon the sale of securities that have grown in value) and assuming a constant rate of per formance each year. The $10,000 table and the fund’s returns do not reflect the deduc tion of taxes that a shareholder would pay on fund distributions or the redemption of fund shares. During periods of reimbursement by Fidelity, a fund’s total return will be greater than it would be had the reimbursement not occurred. How a fund did yesterday is no guarantee of how it will do tomorrow.
| Average Annual Total Returns | | | | | | |
| Periods ended December 31, 2005 | | Past 1 | | Past 5 | | Past 10 |
| | | year | | years | | years |
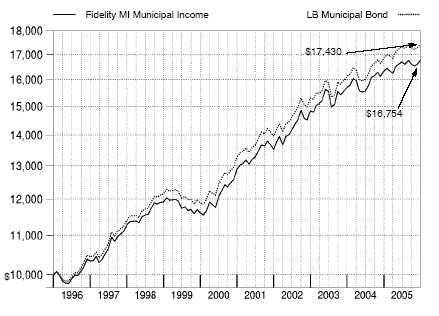
| Fidelity® MI Municipal Income Fund | | 2.67% | | 5.37% | | 5.30% |
| |
| |
| $10,000 Over 10 Years | | | | | | |
Let’s say hypothetically that $10,000 was invested in Fidelity® Michigan Municipal Income Fund on December 31, 1995. The chart shows how the value of your investment would have changed, and also shows how the Lehman Brothers Municipal Bond Index performed over the same period.
Management’s Discussion of Fund Performance
Comments from Douglas McGinley, Portfolio Manager of Fidelity® Michigan Municipal Income Fund
For the third consecutive year, the municipal bond market outperformed taxable bonds. The Lehman Brothers® Municipal Bond Index rose 3.51% for the year ending December 31, 2005. The taxable bond market, as measured by the Lehman Brothers Aggregate Bond Index, advanced 2.43% . Muni bonds were attractively valued relative to Treasuries, particu larly as tax free bond yields drew closer to those of high quality government bonds. Subse quently, the tax advantage of munis was compelling to such atypical investors in the asset class as hedge funds, corporations and taxable bond investors. The strong demand helped offset heavy issuance, particularly at the longer term end of the spectrum. The Federal Reserve Board raised short term interest rates eight times during the year, but long term rates remained persistently low, making the cost of borrowing more affordable for muni issuers. Still, absolute returns finished well below their historical averages. In addition to the rate hikes, surging energy prices pushed inflation higher, a condition further exacer bated by the damage to energy production facilities caused by Hurricane Katrina.
For the 12 months ending December 31, 2005, the fund returned 2.67% . During the same period, the LipperSM Michigan Municipal Debt Funds Average gained 2.38% and the Lehman Brothers Michigan Enhanced Municipal Bond Index rose 3.24% . Against a back drop of rising short term interest rates, Michigan’s municipal bond market performed in line with the national muni market, helped by robust demand for tax free investments plus higher revenues and stable credit ratings for many Michigan issuers. I believe the fund outpaced its Lipper peer group average because it likely had a larger stake than many of its competitors in bonds that were prerefunded during the period, a process that boosts the bonds’ prices. My decision to maintain a slight overweighting relative to the index in lower quality investment grade bonds also helped because they consistently outpaced higher quality securities throughout the year. However, I suspect the fund had less invested than many of its competitors in below investment grade securities, which may have hurt relative performance given that those securities were some of the market’s best performers. Another detractor from the fund’s performance relative to the index and also, I suspect, the Lipper average was my focus on intermediate maturity securities in a year when longer term securities performed better.
The views expressed in this statement reflect those of the portfolio manager only through the end of the period of the report as stated on the cover and do not necessarily represent the views of Fidelity or any other person in the Fidelity organization. Any such views are subject to change at any time based upon market or other conditions and Fidelity disclaims any responsibility to update such views. These views may not be relied on as investment advice and, because investment decisions for a Fidelity fund are based on numerous factors, may not be relied on as an indication of trading intent on behalf of any Fidelity fund.
Shareholder Expense Example
As a shareholder of a Fund, you incur two types of costs: (1) transaction costs, and (2) ongoing costs, including management fees and other Fund expenses. This Example is intended to help you understand your ongoing costs (in dollars) of investing in the Funds and to compare these costs with the ongoing costs of investing in other mutual funds. The Example is based on an investment of $1,000 invested at the beginning of the period and held for the entire period (July 1, 2005 to December 31, 2005).
The first line of the table below for each fund provides information about actual account values and actual expenses. You may use the information in this line, together with the amount you invested, to estimate the expenses that you paid over the period. Simply divide your account value by $1,000.00 (for example, an $8,600 account value divided by $1,000.00 = 8.6), then multiply the result by the number in the first line for a fund under the heading entitled “Expenses Paid During Period” to estimate the expenses you paid on your account during this period. A small balance maintenance fee of $12.00 that is charged once a year may apply for certain accounts with a value of less than $2,000. This fee is not included in the table below. If it was, the estimate of expenses you paid during the period would be higher, and your ending account value lower, by this amount.
Hypothetical Example for Comparison Purposes
The second line of the table below for each fund provides information about hypothetical account values and hypothetical expenses based on a fund’s actual expense ratio and an assumed rate of return of 5% per year before expenses, which is not the Fund’s actual return. The hypothetical account values and expenses may not be used to estimate the actual ending account balance or expenses you paid for the period. You may use this information to compare the ongoing costs of investing in the Fund and other funds. To do so, compare this 5% hypothetical example with the 5% hypothetical examples that appear in the shareholder reports of the other funds. A small balance maintenance fee of $12.00 that is charged once a year may apply for certain accounts with a value of less than $2,000. This fee is not included in the table below. If it was, the estimate of expenses you paid during the period would be higher, and your ending account value lower, by this amount. Please note that the expenses shown in the table are meant to highlight your ongoing costs only and do not reflect any transaction costs. Therefore, the second line of the table is useful in comparing ongoing costs only, and will not help you determine the relative total costs of owning different funds.
7 Annual Report
| Shareholder Expense Example continued | | |
| |
| |
| | | | | | | | | | | Expenses Paid |
| | | | | | | | | | | During Period* |
| | | | | Beginning | | Ending | | July 1, 2005 |
| | | | | Account Value | | Account Value | | to December 31, |
| | | | | July 1, 2005 | | December 31, 2005 | | 2005 |
| Fidelity Michigan Municipal | | | | | | | | | | |
| Income Fund | | | | | | | | | | |
| Actual | | | $ | 1,000.00 | | $ | | 1,003.20 | $ | 2.47 |
| HypotheticalA | | | $ | 1,000.00 | | $ | | 1,022.74 | $ | 2.50 |
| Fidelity Michigan Municipal | | | | | | | | | | |
| Money Market Fund | | | | | | | | | | |
| Actual | | | $ | 1,000.00 | | $ | | 1,011.10 | $ | 2.79 |
| HypotheticalA | | | $ | 1,000.00 | | $ | | 1,022.43 | $ | 2.80 |
| |
| |
| A 5% return per year before expenses | | | | | | |
* Expenses are equal to each Fund’s annualized expense ratio (shown in the table below); multiplied by the average account value over the period, multiplied by 184/365 (to reflect the one half year period).
| | | Annualized |
| | | Expense Ratio |
| Fidelity Michigan Municipal Income Fund | | 49% |
| Fidelity Michigan Municipal Money Market Fund | | 55% |
| Fidelity Michigan Municipal Income Fund | | | | |
| Investment Changes | | | | |
| |
| Top Five Sectors as of December 31, 2005 | | |
| | | % of fund’s | | % of fund’s net assets |
| | | net assets | | 6 months ago |
| General Obligations | | 45.5 | | 45.6 |
| Escrowed/Pre Refunded | | 19.2 | | 18.9 |
| Water & Sewer | | 12.8 | | 12.0 |
| Health Care | | 7.3 | | 7.3 |
| Special Tax | | 5.5 | | 4.0 |
Average Years to Maturity as of December 31, 2005 | | |
| | | | | 6 months ago |
| Years | | 11.1 | | 10.9 |
Average years to maturity is based on the average time remaining to the stated maturity date of each bond, weighted by the market value of each bond.
| Duration as of December 31, 2005 | | | | |
| | | | | | | 6 months ago |
| Years | | | | 6.1 | | 6.1 |
Duration shows how much a bond fund’s price fluctuates with changes in comparable interest rates. If rates rise 1%, for example, a fund with a five year duration is likely to lose about 5% of its value. Other factors also can influence a bond fund’s performance and share price. Accordingly, a bond fund’s actual performance may differ from this example.
We have used ratings from Moody’s® Investors Services, Inc. Where Moody’s ratings are not available, we have used S&P® ratings. Percentages are adjusted for the effect of futures contracts, if applicable.
9 Annual Report
| Fidelity Michigan Municipal Income Fund | | | | | | |
| Investments December 31, 2005 | | |
| Showing Percentage of Net Assets | | | | | | | | |
| |
| Municipal Bonds 98.1% | | | | | | | | |
| | | | | | | Principal | | Value (Note 1) |
| | | | | | | Amount | | |
| Guam 0.1% | | | | | | | | |
| Guam Wtrwks. Auth. Wtr. and Wastewtr. Sys. Rev. | | | | | | |
| 5.875% 7/1/35 | | | | | $ | 525,000 | | $ 550,767 |
| Michigan – 97.2% | | | | | | | | |
| Anchor Bay School District 2000 School Bldg. & Site | | | | | | |
| Series III, 5.25% 5/1/31 (b) | | | | | | 9,300,000 | | 9,810,291 |
| Ann Arbor Bldg. Auth. Series 2005 A: | | | | | | | | |
| 5% 3/1/17 (MBIA Insured) | | | | | | 1,405,000 | | 1,501,748 |
| 5% 3/1/18 (MBIA Insured) | | | | | | 1,440,000 | | 1,539,158 |
| Ann Arbor Econ. Dev. Corp. Ltd. Oblig. Rev. (Glacier | | | | | | |
| Hills, Inc. Proj.) 8.375% 1/15/19 (Escrowed to | | | | | | |
| Maturity) (e) | | | | | | 3,016,000 | | 3,854,931 |
| Bay City Gen. Oblig. 0% 6/1/15 (AMBAC Insured) | | | | 1,725,000 | | 1,157,199 |
| Birmingham County School District Series II, 5.25% | | | | | | |
| 11/1/19 (Pre-Refunded to 11/1/10 @ 100) (e) | | | | 1,200,000 | | 1,294,032 |
| Brighton Area School District Livingston County Series II, | | | | | | |
| 0% 5/1/15 (AMBAC Insured) | | | | | | 10,000,000 | | 6,732,100 |
| Byron Ctr. Pub. Schools 5.5% 5/1/16 | | | | | | 1,055,000 | | 1,143,820 |
| Caladonia Cmnty. Schools Counties of Kent, Allegan and | | | | | | |
| Barry: | | | | | | | | |
| 5.25% 5/1/17 | | | | | | 1,370,000 | | 1,484,929 |
| 5.25% 5/1/18 | | | | | | 1,100,000 | | 1,189,364 |
| Carman-Ainsworth Cmnty. School District: | | | | | | | | |
| 5% 5/1/14 (FSA Insured) | | | | | | 1,765,000 | | 1,921,379 |
| 5% 5/1/16 (FSA Insured) | | | | | | 1,000,000 | | 1,077,930 |
| 5% 5/1/17 (FSA Insured) | | | | | | 2,065,000 | | 2,217,604 |
| 5.5% 5/1/14 (Pre-Refunded to 5/1/12 @ 100) (e) | | | | 1,755,000 | | 1,946,137 |
| 5.5% 5/1/15 (Pre-Refunded to 5/1/12 @ 100) (e) | | | | 1,850,000 | | 2,051,484 |
| 5.5% 5/1/17 (Pre-Refunded to 5/1/12 @ 100) (e) | | | | 2,060,000 | | 2,284,355 |
| 5.5% 5/1/18 (Pre-Refunded to 5/1/12 @ 100) (e) | | | | 2,175,000 | | 2,411,879 |
| Carrier Creek Drainage District #326 5% 6/1/16 | | | | | | |
| (AMBAC Insured) | | | | | | 1,620,000 | | 1,747,202 |
| Charles Stewart Mott Cmnty. College 5% 5/1/17 (MBIA | | | | | | |
| Insured) | | | | | | 1,675,000 | | 1,798,783 |
| Chippewa Valley Schools: | | | | | | | | |
| Series I, 5.375% 5/1/17 (Pre-Refunded to 5/1/11 @ | | | | | | |
| 100) (e) | | | | | | 1,000,000 | | 1,090,790 |
| 5.5% 5/1/17 (Pre-Refunded to 5/1/12 @ 100) (e) | | | | 1,125,000 | | 1,247,524 |
| Clarkston Cmnty. Schools: | | | | | | | | |
| 5.25% 5/1/29 | | | | | | 5,000,000 | | 5,347,200 |
| 5.375% 5/1/21 | | | | | | 1,950,000 | | 2,140,671 |
| 5.375% 5/1/22 | | | | | | 1,150,000 | | 1,262,447 |
| Comstock Park Pub. Schools 5% 5/1/16 (FSA Insured) . | | | | 1,000,000 | | 1,077,120 |
| |
| See accompanying notes which are an integral part of the financial statements. | | |
| |
| Annual Report | | 10 | | | | | | |
| Municipal Bonds continued | | | | | | | | |
| | | | | | | Principal | | Value (Note 1) |
| | | | | | | Amount | | |
| Michigan – continued | | | | | | | | |
| Constantine Pub. Schools: | | | | | | | | |
| 5% 5/1/25 | | | | | $ | 560,000 | | $ 584,612 |
| 5% 5/1/25 (Pre-Refunded to 11/1/12 @ 100) (e) | | | | | | 1,690,000 | | 1,827,667 |
| 5.5% 5/1/18 (Pre-Refunded to 11/1/12 @ 100) (e) | | . | | | | 1,220,000 | | 1,355,932 |
| 5.5% 5/1/19 (Pre-Refunded to 11/1/12 @ 100) (e) | | . | | | | 1,245,000 | | 1,383,718 |
| 5.5% 5/1/20 (Pre-Refunded to 11/1/12 @ 100) (e) | | . | | | | 1,245,000 | | 1,383,718 |
| 5.5% 5/1/21 (Pre-Refunded to 11/1/12 @ 100) (e) | | . | | | | 1,250,000 | | 1,389,275 |
| Crawford AuSable School District (School Bldg. & Site | | | | | | | | |
| Proj.) Series 2001, 5.625% 5/1/18 (Pre-Refunded to | | | | | | | | |
| 5/1/11 @ 100) (e) | | | | | | 1,100,000 | | 1,210,308 |
| Detroit City School District: | | | | | | | | |
| Series 2005 A, 5.25% 5/1/30 (FSA Insured) | | | | | | 5,000,000 | | 5,679,100 |
| Series A: | | | | | | | | |
| 5.5% 5/1/11 (FSA Insured) | | | | | | 2,000,000 | | 2,193,620 |
| 5.5% 5/1/16 (Pre-Refunded to 5/1/12 @ 100) (e) . | | | | 1,500,000 | | 1,658,895 |
| 5.5% 5/1/17 (Pre-Refunded to 5/1/13 @ 100) (e) . | | | | 3,015,000 | | 3,360,157 |
| 5.5% 5/1/18 (Pre-Refunded to 5/1/12 @ 100) (e) . | | | | 1,000,000 | | 1,105,930 |
| 5.5% 5/1/18 (Pre-Refunded to 5/1/13 @ 100) (e) . | | | | 2,000,000 | | 2,228,960 |
| 5.5% 5/1/20 (Pre-Refunded to 5/1/12 @ 100) (e) . | | | | 3,050,000 | | 3,373,087 |
| Series B, 5.25% 5/1/15 (FGIC Insured) | | | | | | 3,085,000 | | 3,356,079 |
| Detroit Convention Facilities Rev. (Cobo Hall Expansion | | | | | | | | |
| Proj.): | | | | | | | | |
| 5% 9/30/11 (MBIA Insured) | | | | | | 3,000,000 | | 3,225,420 |
| 5% 9/30/12 (MBIA Insured) | | | | | | 3,000,000 | | 3,245,340 |
| Detroit Gen. Oblig.: | | | | | | | | |
| (Distributable State Aid Proj.) 5.25% 5/1/09 (AMBAC | | | | | | |
| Insured) | | | | | | 4,525,000 | | 4,800,301 |
| Series 2003 A, 5% 4/1/11 (XL Cap. Assurance, Inc. | | | | | | | | |
| Insured) | | | | | | 1,430,000 | | 1,525,438 |
| Series 2005 B, 5% 4/1/13 (FSA Insured) | | | | | | 1,830,000 | | 1,961,742 |
| Series 2005 C, 5% 4/1/13 (FSA Insured) | | | | | | 1,985,000 | | 2,127,900 |
| Series B1, 5% 4/1/13 (AMBAC Insured) | | | | | | 2,000,000 | | 2,163,680 |
| 5.5% 4/1/17 (Pre-Refunded to 4/1/11 @ 100) (e) | | | | | | 2,615,000 | | 2,864,523 |
| 5.5% 4/1/19 (Pre-Refunded to 4/1/11 @ 100) (e) | | | | | | 1,500,000 | | 1,643,130 |
| 5.5% 4/1/20 (Pre-Refunded to 4/1/11 @ 100) (e) | | | | | | 1,250,000 | | 1,369,275 |
| Detroit Swr. Disp. Rev.: | | | | | | | | |
| Series 2001 D1, 5.5%, tender 7/1/08 (MBIA | | | | | | | | |
| Insured) (c) | | | | | | 10,000,000 | | 10,475,100 |
| Series A: | | | | | | | | |
| 0% 7/1/14 (FGIC Insured) | | | | | | 6,730,000 | | 4,713,423 |
| 5.125% 7/1/31 (FGIC Insured) | | | | | | 8,020,000 | | 8,344,409 |
See accompanying notes which are an integral part of the financial statements.
11 Annual Report
| Fidelity Michigan Municipal Income Fund | | | | | | | | |
| Investments continued | | | | | | | | | | |
| |
| Municipal Bonds continued | | | | | | | | | | |
| | | | | | | Principal | | Value (Note 1) |
| | | | | | | Amount | | | | |
| Michigan – continued | | | | | | | | | | |
| Detroit Wtr. Supply Sys. Rev.: | | | | | | | | | | |
| Series 2001 A, 5.25% 7/1/33 (FGIC Insured) | | | | | $ | 6,390,000 | | $ | | 6,725,411 |
| Series A: | | | | | | | | | | |
| 5.5% 7/1/15 (Pre-Refunded to 1/1/10 @ 101) (e) . | | | | 3,675,000 | | | | 3,987,008 |
| 5.75% 7/1/11 (MBIA Insured) | | | | | | 3,050,000 | | | | 3,383,579 |
| Series B: | | | | | | | | | | |
| 5.25% 7/1/17 (MBIA Insured) | | | | | | 2,760,000 | | | | 2,992,502 |
| 5.5% 7/1/33 (FGIC Insured) | | | | | | 10,000,000 | | | | 10,792,600 |
| 6.5% 7/1/15 (FGIC Insured) | | | | | | 6,025,000 | | | | 7,225,662 |
| Dexter Cmnty. Schools 5% 5/1/18 (Liquidity Facility | | | | | | | | | | |
| Sumitomo Bank Lease Fin., Inc. (SBLF)) | | | | | | 1,955,000 | | | | 2,072,828 |
| Dundee Cmnty. School District: | | | | | | | | | | |
| Series 2000, 5.375% 5/1/27 (Pre-Refunded to | | | | | | | | | | |
| 5/1/10 @ 100) (e) | | | | | | 1,195,000 | | | | 1,289,560 |
| 5.375% 5/1/19 (Pre-Refunded to 5/1/10 @ 100) (e) | | | | 1,000,000 | | | | 1,079,130 |
| East China School District 5.5% 5/1/17 (Pre-Refunded | | | | | | | | | | |
| to 11/1/11 @ 100) (e) | | | | | | 1,775,000 | | | | 1,955,518 |
| East Grand Rapids Pub. School District: | | | | | | | | | | |
| 5% 5/1/16 (FSA Insured) | | | | | | 1,425,000 | | | | 1,524,950 |
| 5% 5/1/17 (FSA Insured) | | | | | | 1,985,000 | | | | 2,118,432 |
| 5.5% 5/1/17 | | | | | | 1,690,000 | | | | 1,817,882 |
| East Lansing School District Gen. Oblig. Series B, 5% | | | | | | | | | | |
| 5/1/30 (MBIA Insured) | | | | | | 3,530,000 | | | | 3,701,346 |
| Eastern Michigan Univ. Revs. Series 2000 B: | | | | | | | | | | |
| 5.5% 6/1/20 (FGIC Insured) | | | | | | 2,230,000 | | | | 2,386,100 |
| 5.625% 6/1/30 (FGIC Insured) | | | | | | 1,250,000 | | | | 1,345,363 |
| Farmington Pub. School District 5% 5/1/18 (FSA | | | | | | | | | | |
| Insured) | | | | | | 4,500,000 | | | | 4,807,305 |
| Fenton Area Pub. Schools 5% 5/1/14 (FGIC Insured) | | | | | | 1,775,000 | | | | 1,925,662 |
| Ferris State Univ. Rev.: | | | | | | | | | | |
| 5% 10/1/16 (MBIA Insured) | | | | | | 1,255,000 | | | | 1,342,888 |
| 5% 10/1/17 (MBIA Insured) | | | | | | 1,320,000 | | | | 1,407,437 |
| Flushing Cmnty. Schools: | | | | | | | | | | |
| 5.25% 5/1/17 (Pre-Refunded to 5/1/13 @ 100) (e) | | . | | | | 1,000,000 | | | | 1,101,940 |
| 5.25% 5/1/18 (Pre-Refunded to 5/1/13 @ 100) (e) | | . | | | | 1,030,000 | | | | 1,134,998 |
| Fraser Pub. School District: | | | | | | | | | | |
| 5% 5/1/16 (FSA Insured) | | | | | | 1,055,000 | | | | 1,133,819 |
| 5% 5/1/17 (FSA Insured) | | | | | | 1,615,000 | | | | 1,734,349 |
| Garden City School District: | | | | | | | | | | |
| 5% 5/1/14 (FSA Insured) | | | | | | 1,210,000 | | | | 1,312,705 |
| 5% 5/1/17 (FSA Insured) | | | | | | 1,390,000 | | | | 1,487,147 |
See accompanying notes which are an integral part of the financial statements.
| Municipal Bonds continued | | | | | | | | | | |
| | | | | | | Principal | | Value (Note 1) |
| | | | | | | Amount | | | | |
| Michigan – continued | | | | | | | | | | |
| Genesee County Gen. Oblig. Series A: | | | | | | | | | | |
| 5% 5/1/17 (MBIA Insured) | | | | | $ | 1,355,000 | | $ | | 1,444,295 |
| 5% 5/1/18 (MBIA Insured) | | | | | | 1,505,000 | | | | 1,598,190 |
| Gibraltar School District: | | | | | | | | | | |
| 5% 5/1/16 (FSA Insured) | | | | | | 1,230,000 | | | | 1,315,965 |
| 5% 5/1/17 (FSA Insured) | | | | | | 1,230,000 | | | | 1,311,057 |
| 5.5% 5/1/18 (Pre-Refunded to 11/1/12 @ 100) (e) | | . | | | | 1,200,000 | | | | 1,333,704 |
| 5.5% 5/1/21 (Pre-Refunded to 11/1/12 @ 100) (e) | | . | | | | 1,200,000 | | | | 1,333,704 |
| Grand Blanc Cmnty. Schools 5.5% 5/1/13 (FGIC | | | | | | | | | | |
| Insured) | | | | | | 1,000,000 | | | | 1,093,450 |
| Grand Rapids Downtown Dev. Auth. Tax Increment Rev. | | | | | | | | | | |
| 0% 6/1/11 (MBIA Insured) | | | | | | 3,160,000 | | | | 2,565,920 |
| Grand Rapids San. Swr. Sys. Rev. 5% 1/1/34 (MBIA | | | | | | | | | | |
| Insured) | | | | | | 3,000,000 | | | | 3,150,270 |
| Grand Rapids Wtr. Supply Sys. 5.75% 1/1/11 (FGIC | | | | | | | | | | |
| Insured) | | | | | | 2,020,000 | | | | 2,227,373 |
| Hamilton Cmnty. Schools District 5% 5/1/24 (FGIC | | | | | | | | | | |
| Insured) | | | | | | 1,500,000 | | | | 1,531,530 |
| Haslett Pub. Schools 5% 5/1/16 (MBIA Insured) | | | | | | 1,100,000 | | | | 1,176,879 |
| Howell Pub. Schools 0% 5/1/10 (AMBAC Insured) | | | | | | 1,130,000 | | | | 960,319 |
| Hudsonville Pub. Schools 5% 5/1/16 (FSA Insured) | | | | | | 1,000,000 | | | | 1,069,890 |
| Huron School District 5.625% 5/1/16 (Pre-Refunded to | | | | | | | | | | |
| 5/1/11 @ 100) (e) | | | | | | 1,050,000 | | | | 1,157,972 |
| Huron Valley School District: | | | | | | | | | | |
| 0% 5/1/10 (FGIC Insured) | | | | | | 2,500,000 | | | | 2,124,600 |
| 0% 5/1/11 (FGIC Insured) | | | | | | 5,830,000 | | | | 4,751,625 |
| 0% 5/1/12 (FGIC Insured) | | | | | | 1,420,000 | | | | 1,103,411 |
| 5.25% 5/1/16 | | | | | | 2,450,000 | | | | 2,665,282 |
| Kent Hosp. Fin. Auth. Hosp. Facilities Rev.: | | | | | | | | | | |
| (Butterworth Hosp. Proj.) Series A, 7.25% 1/15/13 | | | | | | 3,685,000 | | | | 4,167,219 |
| (Spectrum Health Proj.) Series A: | | | | | | | | | | |
| 5.375% 1/15/11 | | | | | | 2,420,000 | | | | 2,527,061 |
| 5.375% 1/15/12 | | | | | | 2,505,000 | | | | 2,622,610 |
| L’Anse Creuse Pub. Schools: | | | | | | | | | | |
| 5.375% 5/1/18 | | | | | | 1,000,000 | | | | 1,096,330 |
| 5.375% 5/1/20 | | | | | | 1,000,000 | | | | 1,097,590 |
| Lake Orion Cmnty. School District: | | | | | | | | | | |
| Series B, 5.25% 5/1/25 (Liquidity Facility Sumitomo | | | | | | | | | | |
| Bank Lease Fin., Inc. (SBLF)) | | | | | | 3,000,000 | | | | 3,158,280 |
| 5.25% 5/1/27 (Liquidity Facility Sumitomo Bank Lease | | | | | | | | |
| Fin., Inc. (SBLF)) | | | | | | 1,150,000 | | | | 1,221,611 |
| Lansing Bldg. Auth. Rev. 0% 6/1/12 (AMBAC Insured) | | . | | | | 3,000,000 | | | | 2,323,410 |
See accompanying notes which are an integral part of the financial statements.
13 Annual Report
| Fidelity Michigan Municipal Income Fund | | | | | | |
| Investments continued | | | | | | |
| |
| Municipal Bonds continued | | | | | | |
| | | | | Principal | | Value (Note 1) |
| | | | | Amount | | |
| Michigan – continued | | | | | | |
| Lawton Cmnty. Schools 5.5% 5/1/19 (Pre-Refunded to | | | | | | |
| 11/1/11 @ 100) (e) | | | $ | 1,050,000 | | $ 1,156,785 |
| Livonia Muni. Bldg. Auth. 5% 5/1/17 (FGIC Insured) | | | | 1,100,000 | | 1,141,437 |
| Livonia Pub. School District Series II, 0% 5/1/21 (FGIC | | | | | | |
| Insured) (Pre-Refunded to 5/1/07 @ 39.31) | | | | 8,480,000 | | 3,179,915 |
| Michigan Bldg. Auth. Rev. (Facilities Prog.): | | | | | | |
| Series II, 5% 10/15/33 (AMBAC Insured) | | | | 3,000,000 | | 3,141,600 |
| Series III, 5% 10/15/10 (MBIA Insured) | | | | 1,000,000 | | 1,068,590 |
| Michigan Comprehensive Trans. Rev. Series B: | | | | | | |
| 5.25% 5/15/11 (FSA Insured) | | | | 1,475,000 | | 1,600,862 |
| 5.25% 5/15/16 (Pre-Refunded to 5/15/12 @ | | | | | | |
| 100) (e) | | | | 3,850,000 | | 4,205,817 |
| Michigan Ctfs. of Prtn. 5.75% 6/1/17 (Pre-Refunded to | | | | | | |
| 6/1/10 @ 100) (e) | | | | 3,000,000 | | 3,283,530 |
| Michigan Gen. Oblig. (Envir. Protection Prog.) 6.25% | | | | | | |
| 11/1/12 | | | | 2,665,000 | | 2,982,988 |
| Michigan Higher Ed. Student Ln. Auth. Rev. Series XII W, | | | | | | |
| 4.875% 9/1/10 (AMBAC Insured) (d) | | | | 3,000,000 | | 3,096,180 |
| Michigan Hosp. Fin. Auth. Hosp. Rev.: | | | | | | |
| (Ascension Health Cr. Group Proj.) Series A: | | | | | | |
| 5%, tender 4/1/11 (c) | | | | 2,035,000 | | 2,157,833 |
| 6% 11/15/19 (Pre-Refunded to 11/15/09 @ | | | | | | |
| 101) (e) | | | | 10,645,000 | | 11,699,056 |
| (Crittenton Hosp. Proj.) Series A: | | | | | | |
| 5.5% 3/1/13 | | | | 455,000 | | 487,473 |
| 5.5% 3/1/14 | | | | 1,300,000 | | 1,389,141 |
| 5.5% 3/1/15 | | | | 1,985,000 | | 2,118,908 |
| (Genesys Reg’l. Med. Hosp. Proj.) Series A, 5.3% | | | | | | |
| 10/1/11 (Escrowed to Maturity) (e) | | | | 1,000,000 | | 1,040,200 |
| (Henry Ford Health Sys. Proj.): | | | | | | |
| Series 2003 A, 5.5% 3/1/14 | | | | 2,000,000 | | 2,164,280 |
| Series A, 6% 11/15/19 | | | | 1,945,000 | | 2,079,302 |
| 6% 9/1/12 (AMBAC Insured) | | | | 1,500,000 | | 1,695,195 |
| (Mercy Health Svcs. Proj.): | | | | | | |
| Series 1996 R, 5.375% 8/15/26 (Escrowed to | | | | | | |
| Maturity) (e) | | | | 2,500,000 | | 2,540,575 |
| Series Q: | | | | | | |
| 5.25% 8/15/10 (Escrowed to Maturity) (e) | | | | 2,195,000 | | 2,235,300 |
| 5.375% 8/15/26 (Escrowed to Maturity) (e) | | | | 2,450,000 | | 2,489,764 |
| 6% 8/15/08 (Escrowed to Maturity) (e) | | | | 1,130,000 | | 1,158,781 |
| 6% 8/15/10 (Escrowed to Maturity) (e) | | | | 1,265,000 | | 1,299,016 |
| Series R, 5.375% 8/15/16 (Escrowed to | | | | | | |
| Maturity) (e) | | | | 2,500,000 | | 2,542,100 |
See accompanying notes which are an integral part of the financial statements.
| Municipal Bonds continued | | | | | | |
| | | | | Principal | | Value (Note 1) |
| | | | | Amount | | |
| Michigan – continued | | | | | | |
| Michigan Hosp. Fin. Auth. Hosp. Rev.: – continued | | | | | | |
| (MidMichigan Health Obligated Group Prog.) Series | | | | | | |
| 2002 A, 5.5% 4/15/18 (AMBAC Insured) | | | $ | 2,000,000 | | $ 2,169,580 |
| (Oakwood Obligated Group Proj.) 5.5% 11/1/11 | | | | 3,000,000 | | 3,234,720 |
| (Saint John Hosp. & Med. Ctr. Proj.) Series A, 6% | | | | | | |
| 5/15/09 (Escrowed to Maturity) (e) | | | | 1,710,000 | | 1,843,243 |
| (Sisters of Mercy Health Corp. Proj.) Series P, 5.375% | | | | | | |
| 8/15/14 (Escrowed to Maturity) (e) | | | | 570,000 | | 595,696 |
| (Sparrow Hosp. Obligated Group Proj.): | | | | | | |
| 5.5% 11/15/21 | | | | 1,435,000 | | 1,535,249 |
| 5.625% 11/15/31 | | | | 4,500,000 | | 4,746,825 |
| (Trinity Health Sys. Proj.) Series 2000 A, 6% 12/1/27 | | | | 1,535,000 | | 1,683,818 |
| Michigan Muni. Bond Auth. Rev.: | | | | | | |
| (Detroit School District Proj.) Series B, 5% 6/1/12 | | | | | | |
| (FSA Insured) | | | | 7,300,000 | | 7,827,936 |
| (Local Govt. Ln. Prog.): | | | | | | |
| Series A: | | | | | | |
| 0% 12/1/07 (FGIC Insured) | | | | 5,340,000 | | 5,003,046 |
| 4.75% 12/1/09 (FGIC Insured) | | | | 6,000,000 | | 6,005,760 |
| Series CA, 0% 6/15/13 (FSA Insured) | | | | 3,850,000 | | 2,835,718 |
| Series G, 0% 5/1/19 (AMBAC Insured) | | | | 1,865,000 | | 1,029,536 |
| 7.5% 11/1/09 (AMBAC Insured) | | | | 20,000 | | 20,051 |
| Series C, 5% 5/1/11 | | | | 2,085,000 | | 2,232,430 |
| 5% 10/1/23 | | | | 5,000,000 | | 5,253,850 |
| 5.375% 10/1/19 | | | | 1,980,000 | | 2,169,922 |
| Michigan Strategic Fund Exempt Facilities Rev. (Waste | | | | | | |
| Mgmt., Inc. Proj.) 3.75%, tender 8/1/07 (c)(d) | | | | 3,000,000 | | 2,989,980 |
| Michigan Strategic Fund Ltd. Oblig. Rev. (Detroit Edison | | | | | | |
| Co. Proj.): | | | | | | |
| Series A, 5.55% 9/1/29 (MBIA Insured) (d) | | | | 1,000,000 | | 1,058,580 |
| Series BB: | | | | | | |
| 7% 7/15/08 (MBIA Insured) | | | | 2,200,000 | | 2,390,806 |
| 7% 5/1/21 (AMBAC Insured) | | | | 8,520,000 | | 11,081,453 |
| Michigan Trunk Line: | | | | | | |
| Series A: | | | | | | |
| 0% 10/1/11 (AMBAC Insured) | | | | 3,630,000 | | 2,905,016 |
| 5.5% 11/1/16 | | | | 3,000,000 | | 3,400,440 |
| Series B, 5% 9/1/15 (FSA Insured) | | | | 5,000,000 | | 5,434,550 |
| 5.25% 10/1/16 (FSA Insured) | | | | 3,000,000 | | 3,256,290 |
| Mona Shores School District 6.75% 5/1/10 (FGIC | | | | | | |
| Insured) | | | | 2,220,000 | | 2,506,935 |
See accompanying notes which are an integral part of the financial statements.
15 Annual Report
| Fidelity Michigan Municipal Income Fund | | | | | | |
| Investments continued | | | | | | |
| |
| Municipal Bonds continued | | | | | | |
| | | | | Principal | | Value (Note 1) |
| | | | | Amount | | |
| Michigan – continued | | | | | | |
| Montague Pub. School District: | | | | | | |
| 5.5% 5/1/16 | | | $ | 1,005,000 | | $ 1,089,058 |
| 5.5% 5/1/17 | | | | 1,005,000 | | 1,087,430 |
| 5.5% 5/1/19 | | | | 1,090,000 | | 1,175,870 |
| Morenci Area Schools 5.25% 5/1/21 (MBIA Insured) | | | | 1,410,000 | | 1,510,773 |
| Mount Clemens Cmnty. School District: | | | | | | |
| 0% 5/1/17 | | | | 5,000,000 | | 2,414,800 |
| 5.5% 5/1/16 (Pre-Refunded to 11/1/11 @ 100) (e) . | | | | 1,000,000 | | 1,101,700 |
| Muskegon Heights Wtr. Sys. Rev. Series 2000 A: | | | | | | |
| 5.625% 11/1/20 (Pre-Refunded to 11/1/10 @ | | | | | | |
| 100) (e) | | | | 2,075,000 | | 2,271,876 |
| 5.625% 11/1/30 (Pre-Refunded to 11/1/10 @ | | | | | | |
| 100) (e) | | | | 1,550,000 | | 1,697,064 |
| New Haven Cmnty. Schools 5.25% 5/1/18 | | | | 1,175,000 | | 1,268,424 |
| Northville Pub. Schools: | | | | | | |
| Series II: | | | | | | |
| 5% 5/1/15 (FSA Insured) | | | | 1,525,000 | | 1,641,388 |
| 5% 5/1/16 (FSA Insured) | | | | 1,475,000 | | 1,578,088 |
| 5% 5/1/17 (FSA Insured) | | | | 3,675,000 | | 3,934,455 |
| Northwestern Michigan Cmnty. College Impt.: | | | | | | |
| 5.5% 4/1/14 (FGIC Insured) | | | | 285,000 | | 304,386 |
| 5.5% 4/1/15 (FGIC Insured) | | | | 170,000 | | 181,317 |
| Northwestern Michigan College Gen. Oblig. 5% 4/1/14 | | | | | | |
| (AMBAC Insured) | | | | 2,000,000 | | 2,171,240 |
| Oakland Univ. Rev. 5% 5/15/12 (AMBAC Insured) | | | | 1,020,000 | | 1,099,295 |
| Okemos Pub. School District: | | | | | | |
| 0% 5/1/12 (MBIA Insured) | | | | 2,500,000 | | 1,942,625 |
| 0% 5/1/13 (MBIA Insured) | | | | 1,700,000 | | 1,258,425 |
| Ovid-Elsie Area Schools Counties of Clinton, Shawassee, | | | | | | |
| Saginaw and Gratiot 5% 5/1/18 (Pre-Refunded to | | | | | | |
| 11/1/12 @ 100) (e) | | | | 1,515,000 | | 1,638,412 |
| Petoskey Pub. School District: | | | | | | |
| 5% 5/1/14 (MBIA Insured) | | | | 1,430,000 | | 1,546,073 |
| 5% 5/1/16 (MBIA Insured) | | | | 1,945,000 | | 2,096,574 |
| Plainwell Cmnty. School District: | | | | | | |
| 5% 5/1/15 (FSA Insured) | | | | 1,030,000 | | 1,116,942 |
| 5% 5/1/16 (FSA Insured) | | | | 1,025,000 | | 1,109,030 |
| 5.5% 5/1/14 | | | | 1,000,000 | | 1,104,420 |
| 5.5% 5/1/16 (Pre-Refunded to 11/1/12 @ 100) (e) . | | | | 1,000,000 | | 1,108,230 |
| Port Huron Area School District County of Saint Clair: | | | | | | |
| 0% 5/1/08 (Liquidity Facility Michigan School Bond | | | | | | |
| Ln. Fund) | | | | 1,975,000 | | 1,817,119 |
See accompanying notes which are an integral part of the financial statements.
| Municipal Bonds continued | | | | | | |
| | | | | Principal | | Value (Note 1) |
| | | | | Amount | | |
| Michigan – continued | | | | | | |
| Port Huron Area School District County of Saint Clair: - | | | | | | |
| continued | | | | | | |
| 5.25% 5/1/16 | | | $ | 1,175,000 | | $ 1,279,422 |
| 5.25% 5/1/17 | | | | 2,125,000 | | 2,305,859 |
| 5.25% 5/1/18 | | | | 2,175,000 | | 2,347,934 |
| Riverview Cmnty. School District: | | | | | | |
| 5% 5/1/14 | | | | 905,000 | | 979,129 |
| 5% 5/1/15 | | | | 955,000 | | 1,028,993 |
| 5% 5/1/17 | | | | 1,000,000 | | 1,068,680 |
| 5% 5/1/18 | | | | 1,000,000 | | 1,065,040 |
| Rochester Cmnty. School District: | | | | | | |
| Series II, 5.5% 5/1/16 | | | | 1,125,000 | | 1,239,413 |
| 5% 5/1/19 (MBIA Insured) | | | | 1,000,000 | | 1,094,850 |
| Royal Oak Hosp. Fin. Auth. Hosp. Rev. (William | | | | | | |
| Beaumont Hosp. Proj.): | | | | | | |
| Series M, 5.25% 11/15/31 (MBIA Insured) | | | | 2,000,000 | | 2,084,780 |
| 5.5% 1/1/14 | | | | 4,000,000 | | 4,089,840 |
| Saint Clair County Gen. Oblig.: | | | | | | |
| 5% 4/1/17 (AMBAC Insured) | | | | 1,380,000 | | 1,471,977 |
| 5% 4/1/19 (AMBAC Insured) | | | | 1,475,000 | | 1,570,108 |
| Saint Joseph School District 5.5% 5/1/18 (Pre-Refunded | | | | | | |
| to 11/1/11 @ 100) (e) | | | | 1,065,000 | | 1,173,311 |
| South Haven Pub. Schools: | | | | | | |
| 5% 5/1/21 (FSA Insured) | | | | 1,450,000 | | 1,526,125 |
| 5% 5/1/22 (FSA Insured) | | | | 1,350,000 | | 1,419,998 |
| South Lyon Cmnty. Schools (School Bldg. and Site Prog.) | | | | | | |
| 5.25% 5/1/15 (FGIC Insured) | | | | 1,000,000 | | 1,088,250 |
| South Redford School District 5% 5/1/16 (MBIA Insured) | | | | 1,125,000 | | 1,208,138 |
| Southfield Library Bldg. Auth. 5.5% 5/1/21 (Pre-Re- | | | | | | |
| funded to 5/1/10 @ 100) (e) | | | | 1,425,000 | | 1,544,871 |
| Southfield Pub. Schools: | | | | | | |
| Series A: | | | | | | |
| 5.25% 5/1/17 (Liquidity Facility Sumitomo Bank | | | | | | |
| Lease Fin., Inc. (SBLF)) | | | | 1,025,000 | | 1,110,987 |
| 5.25% 5/1/18 (Liquidity Facility Sumitomo Bank | | | | | | |
| Lease Fin., Inc. (SBLF)) | | | | 1,025,000 | | 1,108,271 |
| 5.25% 5/1/19 (Liquidity Facility Sumitomo Bank | | | | | | |
| Lease Fin., Inc. (SBLF)) | | | | 1,025,000 | | 1,107,595 |
| 5.25% 5/1/20 (Liquidity Facility Sumitomo Bank | | | | | | |
| Lease Fin., Inc. (SBLF)) | | | | 1,025,000 | | 1,106,928 |
| Series B: | | | | | | |
| 5.125% 5/1/16 (FSA Insured) | | | | 2,780,000 | | 3,009,600 |
See accompanying notes which are an integral part of the financial statements.
17 Annual Report
| Fidelity Michigan Municipal Income Fund | | | | | | |
| Investments continued | | | | | | | | |
| |
| Municipal Bonds continued | | | | | | | | |
| | | | | | | Principal | | Value (Note 1) |
| | | | | | | Amount | | |
| Michigan – continued | | | | | | | | |
| Southfield Pub. Schools: – continued | | | | | | | | |
| Series B: | | | | | | | | |
| 5.25% 5/1/25 (FSA Insured) | | | | | $ | 6,500,000 | | $ 6,988,995 |
| Stockbridge Cmnty. Schools 5.625% 5/1/26 (Pre-Re- | | | | | | | | |
| funded to 5/1/10 @ 100) (e) | | | | | | 1,435,000 | | 1,562,859 |
| Taylor City Bldg. Auth. County of Wayne Bldg. Auth. | | | | | | | | |
| Pub. Facilities 5% 10/1/21 (MBIA Insured) | | | | | | 1,735,000 | | 1,830,477 |
| Tecumseh Pub. Schools 5.5% 5/1/30 (Pre-Refunded to | | | | | | | | |
| 5/1/10 @ 100) (e) | | | | | | 1,250,000 | | 1,355,150 |
| Troy School District: | | | | | | | | |
| 5% 5/1/13 (MBIA Insured) (a) | | | | | | 1,000,000 | | 1,062,510 |
| 5% 5/1/15 | | | | | | 2,135,000 | | 2,300,420 |
| 5% 5/1/15 (MBIA Insured) (a) | | | | | | 1,000,000 | | 1,065,970 |
| 5% 5/1/16 (MBIA Insured) (a) | | | | | | 1,000,000 | | 1,065,250 |
| Utica Cmnty. Schools: | | | | | | | | |
| 5% 5/1/17 | | | | | | 3,000,000 | | 3,199,650 |
| 5.25% 5/1/15 | | | | | | 725,000 | | 792,577 |
| 5.375% 5/1/16 | | | | | | 2,250,000 | | 2,480,580 |
| 5.5% 5/1/17 | | | | | | 1,000,000 | | 1,109,740 |
| Warren Consolidated School District 5.375% 5/1/16 | | | | | | | | |
| (FSA Insured) | | | | | | 2,350,000 | | 2,547,941 |
| Waverly Cmnty. School District: | | | | | | | | |
| 5% 5/1/11 (FSA Insured) | | | | | | 1,000,000 | | 1,072,720 |
| 5% 5/1/17 (FSA Insured) | | | | | | 3,090,000 | | 3,305,960 |
| 5.75% 5/1/14 (Pre-Refunded to 5/1/10 @ 100) (e) | | . | | | | 1,000,000 | | 1,094,090 |
| 5.75% 5/1/16 (Pre-Refunded to 5/1/10 @ 100) (e) | | . | | | | 1,000,000 | | 1,094,090 |
| Wayne Charter County Arpt. Rev. (Detroit Metropolitan | | | | | | | | |
| Wayne County Arpt. Proj.) Series A, 5.25% 12/1/12 | | | | | | | | |
| (MBIA Insured) (d) | | | | | | 2,500,000 | | 2,621,850 |
| Wayne Charter County Gen. Oblig. Series 2001 A, | | | | | | | | |
| 5.5% 12/1/17 (MBIA Insured) | | | | | | 1,000,000 | | 1,078,420 |
| West Ottawa Pub. School District 5.25% 5/1/10 (FGIC | | | | | | | | |
| Insured) | | | | | | 850,000 | | 870,341 |
| Whitehall District Schools 5.5% 5/1/15 | | | | | | 1,000,000 | | 1,101,700 |
| Williamston Cmnty. Schools Gen. Oblig. 5% 5/1/18 | | | | | | | | |
| (FGIC Insured) | | | | | | 1,000,000 | | 1,069,890 |
| Willow Run Cmnty. Schools County of Washtenaw: | | | | | | | | |
| 5% 5/1/17 (FSA Insured) | | | | | | 1,875,000 | | 2,006,044 |
| 5.5% 5/1/16 (Pre-Refunded to 5/1/11 @ 100) (e) | | | | | | 1,630,000 | | 1,787,800 |
| Woodhaven-Brownstown School District County of | | | | | | | | |
| Wayne: | | | | | | | | |
| 5.375% 5/1/16 | | | | | | 1,710,000 | | 1,869,047 |
| 5.375% 5/1/18 (FSA Insured) | | | | | | 1,875,000 | | 2,032,913 |
See accompanying notes which are an integral part of the financial statements.
| Municipal Bonds continued | | | | | | |
| | | | | Principal | | Value (Note 1) |
| | | | | Amount | | |
| Michigan – continued | | | | | | |
| Wyandotte City School District 5.375% 5/1/20 (Pre-Re- | | | | |
| funded to 5/1/12 @ 100) (e) | | | | $ 1,050,000 | | $ 1,156,985 |
| Wyandotte Elec. Rev.: | | | | | | |
| 5.375% 10/1/14 (MBIA Insured) | | | | 3,485,000 | | 3,688,559 |
| 5.375% 10/1/15 (MBIA Insured) | | | | 1,670,000 | | 1,767,545 |
| Wyoming Sewage Disp. Sys. Rev. 5% 6/1/30 (MBIA | | | | |
| Insured) | | | | 4,000,000 | | 4,195,640 |
| Zeeland Pub. Schools: | | | | | | |
| 5% 5/1/16 (FGIC Insured) | | | | 2,035,000 | | 2,191,939 |
| 5% 5/1/17 (FGIC Insured) | | | | 1,500,000 | | 1,610,850 |
| 5.25% 5/1/16 (MBIA Insured) | | | | 1,050,000 | | 1,145,960 |
| | | | | | | 549,382,117 |
| |
| Puerto Rico 0.8% | | | | | | |
| Puerto Rico Commonwealth Hwy. & Trans. Auth. Hwy. | | | | |
| Rev. Series 1996 Y, 5% 7/1/36 (MBIA Insured) | | 2,500,000 | | 2,631,375 |
| Puerto Rico Commonwealth Infrastructure Fing. Auth. | | | | |
| Series 2000 A, 5.5% 10/1/32 (Escrowed to | | | | |
| Maturity) (e) | | | | 850,000 | | 922,752 |
| Puerto Rico Elec. Pwr. Auth. Pwr. Rev. Series QQ, 5.5% | | | | |
| 7/1/18 (XL Cap. Assurance, Inc. Insured) | | 1,000,000 | | 1,139,970 |
| | | | | | | 4,694,097 |
| |
| TOTAL INVESTMENT PORTFOLIO 98.1% | | | | |
| (Cost $536,782,178) | | | | | | 554,626,981 |
| |
| |
| NET OTHER ASSETS – 1.9% | | | | | | 10,857,135 |
| NET ASSETS 100% | | | | | | $ 565,484,116 |
| |
| |
| Futures Contracts | | | | | | |
| | | Expiration | | Underlying | | Unrealized |
| | | Date | | Face Amount | | Appreciation/ |
| | | | | at Value | | (Depreciation) |
| Sold | | | | | | |
| |
| Treasury Contracts | | | | | | |
| 60 U.S. Treasury 10-Year Bond Contracts | | March 2006 | | $ 6,564,375 | | $ (67,273) |
| |
| The face value of futures sold as a percentage of net assets | | 1.2% | | |
See accompanying notes which are an integral part of the financial statements.
19 Annual Report
Fidelity Michigan Municipal Income Fund
Investments continued
Legend
(a) Security or a portion of the security
purchased on a delayed delivery or
when-issued basis.
(b) Security or a portion of the security was
pledged to cover margin requirements
for futures contracts. At the period end,
the value of securities pledged
amounted to $2,848,149.
(c) The coupon rate shown on floating or
adjustable rate securities represents the
rate at period end.
(d) Private activity obligations whose
interest is subject to the federal
alternative minimum tax for individuals.
(e) Security collateralized by an amount
sufficient to pay interest and principal.
|
Other Information
The distribution of municipal securities by revenue source, as a percentage of total net assets, is as follows:
| General Obligations | | 45.5% |
| Escrowed/Pre Refunded | | 19.2% |
| Water & Sewer | | 12.8% |
| Health Care | | 7.3% |
| Special Tax | | 5.5% |
| Others* (individually less than 5%) | | 9.7% |
| | | 100.0% |
| |
| *Includes net other assets | | |
See accompanying notes which are an integral part of the financial statements.
Annual Report 20
| Fidelity Michigan Municipal Income Fund | | | | | | |
| Financial Statements | | | | | | | | |
| |
| Statement of Assets and Liabilities | | | | | | | | |
| | | | | | | December 31, 2005 |
| |
| Assets | | | | | | | | |
| Investment in securities, at value See accompanying | | | | | | | | |
| schedule: | | | | | | | | |
| Unaffiliated issuers (cost $536,782,178) | | | | | | $ | | 554,626,981 |
| Cash | | | | | | | | 7,669,536 |
| Receivable for fund shares sold | | | | | | | | 2,233,524 |
| Interest receivable | | | | | | | | 5,884,887 |
| Receivable for daily variation on futures contracts | | | | | | | | 10,311 |
| Prepaid expenses | | | | | | | | 2,832 |
| Other receivables | | | | | | | | 38,162 |
| Total assets | | | | | | | | 570,466,233 |
| |
| Liabilities | | | | | | | | |
| Payable for investments purchased | | | | | | | | |
| Regular delivery | | $ | | 131,509 | | | | |
| Delayed delivery | | | | 3,210,450 | | | | |
| Payable for fund shares redeemed | | | | 729,628 | | | | |
| Distributions payable | | | | 635,705 | | | | |
| Accrued management fee | | | | 174,811 | | | | |
| Other affiliated payables | | | | 50,221 | | | | |
| Other payables and accrued expenses | | | | 49,793 | | | | |
| Total liabilities | | | | | | | | 4,982,117 |
| |
| Net Assets | | | | | | $ | | 565,484,116 |
| Net Assets consist of: | | | | | | | | |
| Paid in capital | | | | | | $ | | 547,110,711 |
| Undistributed net investment income | | | | | | | | 260,167 |
| Accumulated undistributed net realized gain (loss) on | | | | | | | | |
| investments | | | | | | | | 335,708 |
| Net unrealized appreciation (depreciation) on | | | | | | | | |
| investments | | | | | | | | 17,777,530 |
| Net Assets, for 47,760,771 shares outstanding | | | | | | $ | | 565,484,116 |
| Net Asset Value, offering price and redemption price per | | | | | | |
| share ($565,484,116 ÷ 47,760,771 shares) | | | | | | $ | | 11.84 |
See accompanying notes which are an integral part of the financial statements.
21 Annual Report
| Fidelity Michigan Municipal Income Fund | | | | |
| Financial Statements continued | | | | |
| |
| Statement of Operations | | | | | | |
| | | | | Year ended December 31, 2005 |
| |
| Investment Income | | | | | | |
| Interest | | | | | | $ 25,034,316 |
| |
| Expenses | | | | | | |
| Management fee | | $ | | 2,132,610 | | |
| Transfer agent fees | | | | 452,005 | | |
| Accounting fees and expenses | | | | 135,672 | | |
| Independent trustees’ compensation | | | | 2,614 | | |
| Custodian fees and expenses | | | | 9,211 | | |
| Registration fees | | | | 21,626 | | |
| Audit | | | | 48,375 | | |
| Legal | | | | 7,453 | | |
| Miscellaneous | | | | 13,999 | | |
| Total expenses before reductions | | | | 2,823,565 | | |
| Expense reductions | | | | (274,420) | | 2,549,145 |
| |
| Net investment income | | | | | | 22,485,171 |
| Realized and Unrealized Gain (Loss) | | | | |
| Net realized gain (loss) on: | | | | | | |
| Investment securities: | | | | | | |
| Unaffiliated issuers | | | | 4,358,475 | | |
| Futures contracts | | | | 197,831 | | |
| Total net realized gain (loss) | | | | | | 4,556,306 |
| Change in net unrealized appreciation (depreciation) on: | | | | |
| Investment securities | | | | (11,901,502) | | |
| Futures contracts | | | | (67,273) | | |
| Total change in net unrealized appreciation | | | | |
| (depreciation) | | | | | | (11,968,775) |
| Net gain (loss) | | | | | | (7,412,469) |
| Net increase (decrease) in net assets resulting from | | | | |
| operations | | | | | | $ 15,072,702 |
See accompanying notes which are an integral part of the financial statements.
| Statement of Changes in Net Assets | | | | | | | | |
| | | | | Year ended | | | | Year ended |
| | | | | December 31, | | | | December 31, |
| | | | | 2005 | | | | 2004 |
| Increase (Decrease) in Net Assets | | | | | | | | |
| Operations | | | | | | | | |
| Net investment income | | $ | | 22,485,171 | | $ | | 22,584,939 |
| Net realized gain (loss) | | | | 4,556,306 | | | | 6,019,576 |
| Change in net unrealized appreciation (depreciation) . | | | | (11,968,775) | | | | (7,701,308) |
| Net increase (decrease) in net assets resulting | | | | | | | | |
| from operations | | | | 15,072,702 | | | | 20,903,207 |
| Distributions to shareholders from net investment income . | | | | (22,452,478) | | | | (22,507,564) |
| Distributions to shareholders from net realized gain | | | | (5,430,741) | | | | (3,899,782) |
| Total distributions | | | | (27,883,219) | | | | (26,407,346) |
| Share transactions | | | | | | | | |
| Proceeds from sales of shares | | | | 91,467,289 | | | | 72,884,467 |
| Reinvestment of distributions | | | | 18,797,338 | | | | 18,252,560 |
| Cost of shares redeemed | | | | (91,856,609) | | | | (87,145,890) |
| Net increase (decrease) in net assets resulting from | | | | | | | | |
| share transactions | | | | 18,408,018 | | | | 3,991,137 |
| Redemption fees | | | | 3,250 | | | | 2,127 |
| Total increase (decrease) in net assets | | | | 5,600,751 | | | | (1,510,875) |
| |
| Net Assets | | | | | | | | |
| Beginning of period | | | | 559,883,365 | | | | 561,394,240 |
| End of period (including undistributed net investment | | | | | | | | |
| income of $260,167 and undistributed net invest- | | | | | | | | |
| ment income of $106,864, respectively) | | $ | | 565,484,116 | | $ | | 559,883,365 |
| |
| Other Information | | | | | | | | |
| Shares | | | | | | | | |
| Sold | | | | 7,616,556 | | | | 5,988,507 |
| Issued in reinvestment of distributions | | | | 1,570,055 | | | | 1,506,099 |
| Redeemed | | | | (7,675,047) | | | | (7,198,143) |
| Net increase (decrease) | | | | 1,511,564 | | | | 296,463 |
See accompanying notes which are an integral part of the financial statements.
23 Annual Report
| Financial Highlights | | | | | | | | | | | | |
| |
| Years ended December 31, | | 2005 | | 2004 | | 2003 | | | | 2002 | | 2001 |
| Selected Per Share Data | | | | | | | | | | | | |
| Net asset value, beginning of period | | $ 12.11 | | $ 12.22 | | $ 12.04 | | | | $ 11.47 | | $ 11.48 |
| Income from Investment Operations | | | | | | | | | | | | |
| Net investment incomeB | | 472 | | .491 | | .513 | | | | .532 | | .552D |
| Net realized and unrealized gain | | | | | | | | | | | | |
| (loss) | | (.155) | | (.026) | | .180 | | | | .568 | | (.010)D |
| Total from investment operations | | 317 | | .465 | | .693 | | | | 1.100 | | .542 |
| Distributions from net investment | | | | | | | | | | | | |
| income | | (.472) | | (.490) | | (.513) | | | | (.530) | | (.552) |
| Distributions from net realized gain . | | (.115) | | (.085) | | — | | | | — | | — |
| Total distributions | | (.587) | | (.575) | | (.513) | | | | (.530) | | (.552) |
| Redemption fees added to paid in | | | | | | | | | | | | |
| capitalB,E | | — | | — | | — | | | | — | | — |
| Net asset value, end of period | | $ 11.84 | | $ 12.11 | | $ 12.22 | | | | $ 12.04 | | $ 11.47 |
| Total ReturnA | | 2.67% | | 3.90% | | 5.87% | | | | 9.78% | | 4.77% |
| Ratios to Average Net AssetsC | | | | | | | | | | | | |
| Expenses before reductions | | 49% | | .50% | | .50% | | | | .50% | | .50% |
| Expenses net of fee waivers, if any | | .49% | | .50% | | .50% | | | | .50% | | .50% |
| Expenses net of all reductions | | 45% | | .48% | | .49% | | | | .48% | | .44% |
| Net investment income | | 3.94% | | 4.05% | | 4.22% | | | | 4.51% | | 4.76%D |
| Supplemental Data | | | | | | | | | | | | |
| Net assets, end of period | | | | | | | | | | | | |
| (000 omitted) | | $565,484 | | $559,883 | | $561,394 | | | | | | $572,242 | | $505,534 |
| Portfolio turnover rate | | 23% | | 12% | | 23% | | | | 17% | | 19% |
A Total returns would have been lower had certain expenses not been reduced during the periods shown.
B Calculated based on average shares outstanding during the period.
C Expense ratios reflect operating expenses of the fund. Expenses before reductions do not reflect amounts reimbursed by the investment adviser or
expense offset arrangements and do not represent the amount paid by the fund during periods when reimbursements or reductions occur. Ex
penses net of fee waivers reflect expenses after reimbursement by the investment adviser but prior to reductions from expense offset arrange
ments. Expenses net of all reductions represent the net expenses paid by the fund.
D Effective January 1, 2001, the fund adopted the provisions of the AICPA Audit and Accounting Guide for Investment Companies and began
amortizing premium and discount on all debt securities. Per share data and ratios for periods prior to adoption have not been restated to reflect
this change.
E Amount represents less than $.001 per share.
|
See accompanying notes which are an integral part of the financial statements.
| Fidelity Michigan Municipal Money Market Fund | | | | |
| Investment Changes/Performance |
| |
| Maturity Diversification | | | | | | |
| Days | | % of fund’s | | % of fund’s | | % of fund’s |
| | | investments | | investments | | investments |
| | | 12/31/05 | | 6/30/05 | | 12/31/04 |
| 0 – 30 | | 92.8 | | 90.7 | | 92.5 |
| 31 – 90 | | 0.0 | | 2.2 | | 0.9 |
| 91 – 180 | | 3.3 | | 3.6 | | 2.7 |
| 181 – 397 | | 3.9 | | 3.5 | | 3.9 |
| Weighted Average Maturity | | | | | | |
| | | 12/31/05 | | 6/30/05 | | 12/31/04 |
| Fidelity Michigan Municipal Money | | | | | | |
| Market Fund | | 19 Days | | 21 Days | | 21 Days |
| All Tax Free Money Market Funds | | | | | | |
| Average* | | 29 Days | | 24 Days | | 33 Days |
| Current and Historical Seven Day Yields | | | | | | |
| | | 1/2/06 | | 10/3/05 | | 6/27/05 | | 3/28/05 | | 1/3/05 |
| Fidelity Michigan Munici | | | | | | | | | | |
| pal Money Market Fund | | 2.93% | | 2.22% | | 2.01% | | 1.59% | | 1.42% |
| If Fidelity had not reimbursed | | | | | | | | | | |
| certain fund expenses | | 2.90% | | 2.21% | | 1.99% | | 1.50% | | — |
Yield refers to the income paid by the fund over a given period. Yields for money market funds are usually for seven day periods, as they are here, though they are expressed as annual percentage rates. Past performance is no guarantee of future results. Yield will vary and it is possible to lose money by investing in the fund.
*Source: iMoneyNet, Inc.
25 Annual Report
| Fidelity Michigan Municipal Money Market Fund | | |
| Investments December 31, 2005 | | |
| Showing Percentage of Net Assets | | | | | | |
| |
| Municipal Securities 95.7% | | | | | | |
| | | | | Principal | | Value (Note 1) |
| | | | | Amount | | |
| Michigan – 93.6% | | | | | | |
| Allen Park Pub. School District Participating VRDN Series ROC | | | | |
| II R4007, 3.56% (Liquidity Facility Citigroup Global Markets | | | | |
| Hldgs., Inc.) (b)(e) | | | $ | 5,120,000 | | $ 5,120,000 |
| Charlotte Hosp. Fin. Auth. Ltd. Oblig. Rev. (Hayes Green | | | | |
| Beach Proj.) 3.56%, LOC Fifth Third Bank, Cincinnati, | | | | |
| VRDN (b) | | | | 13,675,000 | | 13,675,000 |
| Clarkston Cmnty. Schools Participating VRDN Series ROC II | | | | |
| R4519, 3.56% (Liquidity Facility Citigroup Global Markets | | | | |
| Hldgs., Inc.) (b)(e) | | | | 6,100,000 | | 6,100,000 |
| Clinton Econ. Dev. Corp. Rev. (Clinton Area Care Ctr. Proj.) | | | | |
| 3.56%, LOC Northern Trust Co., Chicago, VRDN (b) | | 4,935,000 | | 4,935,000 |
| Comstock Park Pub. Schools Participating VRDN Series ROC II | | | | |
| ® 2178, 3.56% (Liquidity Facility Citigroup Global Markets | | | | |
| Hldgs., Inc.) (b)(e) | | | | 1,330,000 | | 1,330,000 |
| Delta County Econ. Dev. Corp. Envir. Impt. Rev. Participating | | | | |
| VRDN Series PT 2371, 3.58% (Liquidity Facility Merrill Lynch | | | | |
| & Co., Inc.) (b)(e) | | | | 3,100,000 | | 3,100,000 |
| Detroit City School District Participating VRDN: | | | | |
| ROC II R1033, 3.56% (Liquidity Facility Citigroup Global | | | | |
| Markets Hldgs., Inc.) (b)(e) | | | | 3,655,000 | | 3,655,000 |
| Series AAB 04 39, 3.54% (Liquidity Facility ABN AMRO | | | | |
| Bank NV) (b)(e) | | | | 5,800,000 | | 5,800,000 |
| Series EGL 7050072, 3.56% (Liquidity Facility Citibank | | | | |
| NA) (b)(e) | | | | 2,000,000 | | 2,000,000 |
| Series MACN 05 R, 3.55% (Liquidity Facility Bank of | | | | |
| America NA) (b)(e) | | | | 8,495,000 | | 8,495,000 |
| Series PA 997, 3.54% (Liquidity Facility Merrill Lynch & Co., | | | | |
| Inc.) (b)(e) | | | | 8,840,000 | | 8,840,000 |
| Series PT 2158, 3.54% (Liquidity Facility Merrill Lynch & Co., | | | | |
| Inc.) (b)(e) | | | | 1,000,000 | | 1,000,000 |
| Series ROC II R4004, 3.56% (Liquidity Facility Citigroup | | | | |
| Global Markets Hldgs., Inc.) (b)(e) | | | | 5,750,000 | | 5,750,000 |
| Detroit Econ. Dev. Corp. Resource Recovery Rev.: | | | | |
| Bonds Series A, 4% 5/1/06 (AMBAC Insured) (c) | | 2,500,000 | | 2,510,550 |
| Participating VRDN Series Merlots 01 A90, 3.59% (Liquidity | | | | |
| Facility Wachovia Bank NA) (b)(c)(e) | | | | 2,500,000 | | 2,500,000 |
| Detroit Gen. Oblig. RAN 4% 4/3/06 | | | | 5,000,000 | | 5,016,922 |
| Detroit Swr. Disp. Rev. Participating VRDN: | | | | |
| Series AAB 05 3, 3.54% (Liquidity Facility ABN-AMRO Bank | | | | |
| NV) (b)(e) | | | | 6,500,000 | | 6,500,000 |
| Series Macon 02 G, 3.59% (Liquidity Facility Bank of | | | | |
| America NA) (b)(e) | | | | 8,520,000 | | 8,520,000 |
| Series Merlots 00 I, 3.54% (Liquidity Facility Wachovia Bank | | | | |
| NA) (b)(e) | | | | 9,300,000 | | 9,300,000 |
See accompanying notes which are an integral part of the financial statements. | | |
| |
| Annual Report | | 26 | | | | |
| Municipal Securities continued | | | | |
| | | Principal | | Value (Note 1) |
| | | Amount | | |
| Michigan – continued | | | | |
| Detroit Swr. Disp. Rev. Participating VRDN: – continued | | | | |
| Series Merlots 01 A103, 3.54% (Liquidity Facility Wachovia | | | | |
| Bank NA) (b)(e) | | $ 9,995,000 | | $ 9,995,000 |
| Series Merlots 01 A112, 3.54% (Liquidity Facility Wachovia | | | | |
| Bank NA) (b)(e) | | 3,555,000 | | 3,555,000 |
| Series PA 1183, 3.54% (Liquidity Facility Merrill Lynch & | | | | |
| Co., Inc.) (b)(e) | | 6,000,000 | | 6,000,000 |
| Series ROC II R4014, 3.56% (Liquidity Facility Citigroup | | | | |
| Global Markets Hldgs., Inc.) (b)(e) | | 2,070,000 | | 2,070,000 |
| Series SGB 47, 3.56% (Liquidity Facility Societe | | | | |
| Generale) (b)(e) | | 5,800,000 | | 5,800,000 |
| Detroit Wtr. Supply Sys. Rev. Participating VRDN: | | | | |
| Series Merlots 00 D, 3.54% (Liquidity Facility Wachovia | | | | |
| Bank NA) (b)(e) | | 4,500,000 | | 4,500,000 |
| Series PT 2587, 3.54% (Liquidity Facility Dexia Cr. Local de | | | | |
| France) (b)(e) | | 3,265,000 | | 3,265,000 |
| Series Putters 783, 3.55% (Liquidity Facility JPMorgan Chase | | | | |
| Bank) (b)(e) | | 1,565,000 | | 1,565,000 |
| Detroit Wtr. Sys. Rev. Participating VRDN Series EGL 99 2202, | | | | |
| 3.56% (Liquidity Facility Citibank NA, New York) (b)(e) | | 8,200,000 | | 8,200,000 |
| East Lansing School District Gen. Oblig. Participating VRDN | | | | |
| Series SGA 114, 3.6% (Liquidity Facility Societe | | | | |
| Generale) (b)(e) | | 6,000,000 | | 6,000,000 |
| Ecorse Pub. School District Participating VRDN Series ROC II | | | | |
| R7520, 3.56% (Liquidity Facility Citibank NA) (b)(e) | | 2,995,000 | | 2,995,000 |
| Fitzgerald Pub. School District Participating VRDN Series | | | | |
| Putters 561, 3.55% (Liquidity Facility JPMorgan Chase | | | | |
| Bank) (b)(e) | | 5,000,000 | | 5,000,000 |
| Genesee County Econ. Dev. Corp. (Creative Foam Corp. Proj.) | | | | |
| Series 1994, 3.68%, LOC JPMorgan Chase Bank, | | | | |
| VRDN (b)(c) | | 500,000 | | 500,000 |
| Grand Rapids Econ. Dev. Corp. (Cornerstone Univ. Proj.) | | | | |
| 3.56%, LOC Nat’l. City Bank, VRDN (b) | | 1,800,000 | | 1,800,000 |
| Grand Rapids San. Swr. Sys. Rev. Impt. Participating VRDN | | | | |
| Series EGL 98 2201, 3.56% (Liquidity Facility Citibank | | | | |
| NA) (b)(e) | | 7,940,000 | | 7,940,000 |
| Hartland Consolidated School District Participating VRDN | | | | |
| Series MSTC 01 127 Class A, 3.6% (Liquidity Facility Bear | | | | |
| Stearns Companies, Inc.) (b)(e) | | 6,655,000 | | 6,655,000 |
| Holland Charter Township Econ. Dev. Corp. Rev. (Chicago | | | | |
| Mission Proj.) 3.62%, LOC Comerica Bank, Detroit, | | | | |
| VRDN (b)(c) | | 2,335,000 | | 2,335,000 |
| Hudsonville Pub. Schools Participating VRDN Series PT 2797, | | | | |
| 3.54% (Liquidity Facility Merrill Lynch & Co., Inc.) (b)(e) | | 5,985,000 | | 5,985,000 |
See accompanying notes which are an integral part of the financial statements.
27 Annual Report
| Fidelity Michigan Municipal Money Market Fund | | |
| Investments continued | | | | | | |
| |
| Municipal Securities continued | | | | |
| | | | | Principal | | Value (Note 1) |
| | | | | Amount | | |
| Michigan – continued | | | | | | |
| Jackson Pub. Schools RAN Series 2005 B, 3.75% 5/24/06, | | | | |
| LOC Comerica Bank, Detroit | | | | $ 3,000,000 | | $ 3,009,015 |
| Kent County Bldg. Auth. Participating VRDN Series PT 3243, | | | | |
| 3.54% (Liquidity Facility Merrill Lynch & Co., Inc.) (b)(e) | | 5,920,000 | | 5,920,000 |
| Kent Hosp. Fin. Auth. Health Care Rev. Bonds (Butterworth | | | | |
| health Sys. Obligated Group Proj.) Series 1996 A, 6.125% | | | | |
| 1/15/21 (Pre-Refunded to 1/15/06 @ 102) (d) | | 2,000,000 | | 2,042,487 |
| Lakeview School District Calhoun County Participating VRDN | | | | |
| Series PT 1624, 3.54% (Liquidity Facility Merrill Lynch & Co., | | | | |
| Inc.) (b)(e) | | | | 7,190,000 | | 7,190,000 |
| Macomb County Hosp. Fin. Auth. Rev. (Mount Clemens Gen. | | | | |
| Hosp. Proj.) Series 2003 A1, 3.7%, LOC Comerica Bank, | | | | |
| Detroit, VRDN (b) | | | | 20,130,000 | | 20,130,000 |
| Michigan Bldg. Auth. Rev. Participating VRDN: | | | | |
| Series AAB 03 35, 3.54% (Liquidity Facility ABN AMRO | | | | |
| Bank NV) (b)(e) | | | | 3,000,000 | | 3,000,000 |
| Series EGL 01 2202, 3.56% (Liquidity Facility Citibank NA, | | | | |
| New York) (b)(e) | | | | 3,000,000 | | 3,000,000 |
| Series MS 00 481X, 3.55% (Liquidity Facility Morgan | | | | |
| Stanley) (b)(e) | | | | 2,670,000 | | 2,670,000 |
| Series ROC II R2064, 3.56% (Liquidity Facility Citigroup | | | | |
| Global Markets Hldgs., Inc.) (b)(e) | | | | 2,740,000 | | 2,740,000 |
| Series ROC II R4057, 3.56% (Liquidity Facility Citigroup | | | | |
| Global Markets Hldgs., Inc.) (b)(e) | | | | 2,200,000 | | 2,200,000 |
| Series ROC II R4551, 3.56% (Liquidity Facility Citigroup | | | | |
| Global Markets Hldgs., Inc.) (b)(e) | | | | 5,180,000 | | 5,180,000 |
| Michigan Gen. Oblig.: | | | | | | |
| Bonds (Multi-Modal School Ln. Prog.) Series 2005 C, 3.15% | | | | |
| tender 4/4/06 (Liquidity Facility DEPFA BANK PLC), CP | | | | |
| mode | | | | 6,500,000 | | 6,500,000 |
| Participating VRDN Series PT 2021, 3.54% (Liquidity Facility | | | | |
| Merrill Lynch & Co., Inc.) (b)(e) | | | | 4,415,000 | | 4,415,000 |
| Michigan Higher Ed. Student Ln. Auth. Rev.: | | | | |
| Participating VRDN: | | | | | | |
| Series LB 05 L20, 3.63% (Liquidity Facility Lehman | | | | |
| Brothers Hldgs., Inc.) (b)(c)(e) | | | | 6,475,000 | | 6,475,000 |
| Series PA 1064, 3.59% (Liquidity Facility Merrill Lynch & | | | | |
| Co., Inc.) (b)(c)(e) | | | | 7,420,000 | | 7,420,000 |
| Series XII B, 3.54% (AMBAC Insured), VRDN (b)(c) | | 2,400,000 | | 2,400,000 |
| Michigan Hosp. Fin. Auth. Hosp. Rev.: | | | | | | |
| (Ascension Health Cr. Group Proj.) Series B, 3.49%, | | | | |
| VRDN (b) | | | | 5,000,000 | | 5,000,000 |
| (Health Care Equip. Ln. Prog.): | | | | | | |
| Series B, 3.56%, LOC Standard Fed. Bank, VRDN (b) | | 2,600,000 | | 2,600,000 |
See accompanying notes which are an integral part of the financial statements. | | |
| |
| Annual Report | | 28 | | | | |
| Municipal Securities continued | | | | |
| | | Principal | | Value (Note 1) |
| | | Amount | | |
| Michigan – continued | | | | |
| Michigan Hosp. Fin. Auth. Hosp. Rev.: – continued | | | | |
| (Health Care Equip. Ln. Prog.): | | | | |
| Series C, 3.56%, LOC Fifth Third Bank, Cincinnati, | | | | |
| VRDN (b) | | $ 7,500,000 | | $ 7,500,000 |
| Michigan Hosp. Fin. Auth. Rev. Series B, 3.56%, LOC | | | | |
| Standard Fed. Bank, VRDN (b) | | 3,600,000 | | 3,600,000 |
| Michigan Hsg. Dev. Auth. Multi-family Hsg. Rev. (Hunt Club | | | | |
| Apts. Proj.) 3.55%, LOC Fannie Mae, VRDN (b)(c) | | 5,595,000 | | 5,595,000 |
| Michigan Hsg. Dev. Auth. Rental Hsg. Rev.: | | | | |
| Series 2000 A, 3.59% (MBIA Insured), VRDN (b)(c) | | 1,700,000 | | 1,700,000 |
| Series 2004 A, 3.53% (FGIC Insured), VRDN (b)(c) | | 4,900,000 | | 4,900,000 |
| Michigan Hsg. Dev. Auth. Single Family Mtg. Rev.: | | | | |
| Series 1999 B2, 3.6% (MBIA Insured), VRDN (b)(c) | | 4,100,000 | | 4,100,000 |
| Series 2002 A, 3.6% (MBIA Insured), VRDN (b)(c) | | 5,000,000 | | 5,000,000 |
| Michigan Muni. Bond Auth. Rev.: | | | | |
| Participating VRDN: | | | | |
| Series EGL 00 2201, 3.56% (Liquidity Facility Citibank | | | | |
| NA, New York) (b)(e) | | 3,500,000 | | 3,500,000 |
| Series MS 718, 3.55% (Liquidity Facility Morgan | | | | |
| Stanley) (b)(e) | | 19,184,500 | | 19,184,500 |
| Series MSTC 02 204, 3.6% (Liquidity Facility Bear Stearns | | | | |
| Companies, Inc.) (b)(e) | | 10,395,000 | | 10,395,000 |
| Series PT 3061, 3.54% (Liquidity Facility Merrill Lynch & | | | | |
| Co., Inc.) (b)(e) | | 6,250,000 | | 6,250,000 |
| Series ROC II R 339, 3.56% (Liquidity Facility Citibank | | | | |
| NA) (b)(e) | | 8,115,000 | | 8,115,000 |
| Series Stars 141, 3.54% (Liquidity Facility BNP Paribas | | | | |
| SA) (b)(e) | | 4,635,000 | | 4,635,000 |
| RAN Series C, 4.25% 8/18/06, LOC JPMorgan Chase Bank | | 15,000,000 | | 15,111,354 |
| TAN Series 2005 B1, 4% 8/18/06 | | 6,500,000 | | 6,544,778 |
| Michigan Strategic Fund Indl. Dev. Rev. (Althaus Family | | | | |
| Investors II Proj.) Series 1997, 3.81%, LOC Huntington Nat’l. | | | | |
| Bank, Columbus, VRDN (b) | | 1,895,000 | | 1,895,000 |
| Michigan Strategic Fund Ltd. Oblig. Rev.: | | | | |
| Bonds (Dow Chemical Co. Proj.) Series 2003 A1, 3.55% | | | | |
| tender 1/4/06, CP mode (c) | | 5,900,000 | | 5,900,000 |
| Participating VRDN Series Putters 858Z, 3.58% (Liquidity | | | | |
| Facility JPMorgan Chase Bank) (b)(c)(e) | | 12,170,000 | | 12,170,000 |
| (BC&C Proj.) 3.68%, LOC Comerica Bank, Detroit, | | | | |
| VRDN (b)(c) | | 1,405,000 | | 1,405,000 |
| (Biewer of Lansing LLC Proj.) Series 1999, 3.66%, LOC | | | | |
| Standard Fed. Bank, VRDN (b)(c) | | 1,060,000 | | 1,060,000 |
| (Bosal Ind. Proj.) Series 1998, 3.65%, LOC Bank of New | | | | |
| York, New York, VRDN (b)(c) | | 7,500,000 | | 7,500,000 |
See accompanying notes which are an integral part of the financial statements.
29 Annual Report
| Fidelity Michigan Municipal Money Market Fund | | |
| Investments continued | | | | |
| |
| Municipal Securities continued | | | | |
| | | Principal | | Value (Note 1) |
| | | Amount | | |
| Michigan – continued | | | | |
| Michigan Strategic Fund Ltd. Oblig. Rev.: – continued | | |
| (CJS Properties LLC Proj.) 3.68%, LOC JPMorgan Chase | | |
| Bank, VRDN (b)(c) | | $ 1,800,000 | | $ 1,800,000 |
| (Conti Properties LLC Proj.) Series 1997, 3.68%, LOC | | |
| Comerica Bank, Detroit, VRDN (b)(c) | | 2,380,000 | | 2,380,000 |
| (Creative Foam Corp. Proj.) 3.68%, LOC JPMorgan Chase | | |
| Bank, VRDN (b)(c) | | 800,000 | | 800,000 |
| (Doss Ind. Dev. Co. Proj.) 3.68%, LOC JPMorgan Chase | | |
| Bank, VRDN (b)(c) | | 1,800,000 | | 1,800,000 |
| (Fintex LLC Proj.) Series 2000, 3.68%, LOC Comerica Bank, | | |
| Detroit, VRDN (b)(c) | | 1,705,000 | | 1,705,000 |
| (Future Fence Co. Proj.) 3.68%, LOC Comerica Bank, | | |
| Detroit, VRDN (b)(c) | | 2,330,000 | | 2,330,000 |
| (Holland Home Oblig. Group Proj.) 3.58%, LOC Huntington | | |
| Nat’l. Bank, Columbus, VRDN (b) | | 1,000,000 | | 1,000,000 |
| (Holland Plastics Corp. Proj.) 3.59%, LOC Lasalle Bank NA, | | |
| VRDN (b)(c) | | 4,000,000 | | 4,000,000 |
| (John H. Dekker & Sons Proj.) Series 1998, 3.68%, LOC | | |
| Standard Fed. Bank, VRDN (b)(c) | | 1,015,000 | | 1,015,000 |
| (K&M Engineering, Inc. Proj.) 3.68%, LOC Comerica Bank, | | |
| Detroit, VRDN (b)(c) | | 1,580,000 | | 1,580,000 |
| (Louisiana-Pacific Corp. Proj.) Series 1991, 3.52%, LOC | | |
| Wachovia Bank NA, VRDN (b) | | 2,300,000 | | 2,300,000 |
| (LPB LLC Proj.) 3.68%, LOC Comerica Bank, Detroit, | | |
| VRDN (b)(c) | | 2,500,000 | | 2,500,000 |
| (Majestic Ind., Inc. Proj.) 3.68%, LOC Comerica Bank, | | |
| Detroit, VRDN (b)(c) | | 2,275,000 | | 2,275,000 |
| (Mans Proj.) Series 1998, 3.68%, LOC Comerica Bank, | | |
| Detroit, VRDN (b)(c) | | 1,380,000 | | 1,380,000 |
| (Mid-American Products, Inc. Proj.) Series 1998 3.59%, LOC | | |
| Comerica Bank, Detroit, VRDN (b)(c) | | 1,345,000 | | 1,345,000 |
| (PBL Enterprises, Inc. Proj.) Series 1997, 3.68%, LOC | | |
| Comerica Bank, Detroit, VRDN (b)(c) | | 1,960,000 | | 1,960,000 |
| (Pioneer Laboratories, Inc. Proj.) 3.63%, LOC JPMorgan | | |
| Chase Bank, VRDN (b)(c) | | 2,200,000 | | 2,200,000 |
| (S&S LLC Proj.) Series 2000, 3.63%, LOC Standard Fed. | | |
| Bank, VRDN (b)(c) | | 2,325,000 | | 2,325,000 |
| (SBC Ventures LLC Proj.) 3.68%, LOC Comerica Bank, | | |
| Detroit, VRDN (b)(c) | | 4,000,000 | | 4,000,000 |
| (TEI Invts. LLC Proj.) Series 1997, 3.68%, LOC Comerica | | |
| Bank, Detroit, VRDN (b)(c) | | 600,000 | | 600,000 |
| (Temperance Enterprise Proj.) Series 1996, 3.65%, LOC | | |
| Nat’l. City Bank, VRDN (b)(c) | | 1,840,000 | | 1,840,000 |
| |
| See accompanying notes which are an integral part of the financial statements. | | |
| |
| Annual Report | | 30 | | |
| Municipal Securities continued | | | | |
| | | Principal | | Value (Note 1) |
| | | Amount | | |
| Michigan – continued | | | | |
| Michigan Strategic Fund Ltd. Oblig. Rev.: – continued | | | | |
| (The Monarch Press, Inc. Proj.) Series 2000, 3.68%, LOC | | | | |
| Comerica Bank, Detroit, VRDN (b)(c) | | $ 1,535,000 | | $ 1,535,000 |
| (The Spiratex Co. Proj.) Series 1994, 3.68%, LOC JPMorgan | | | | |
| Chase Bank, VRDN (b)(c) | | 800,000 | | 800,000 |
| (Trilan LLC Proj.) 3.68%, LOC JPMorgan Chase Bank, | | | | |
| VRDN (b)(c) | | 3,600,000 | | 3,600,000 |
| (Unified-Boring Co., Inc. Proj.) Series 1992, 3.79%, LOC | | | | |
| Comerica Bank, Detroit, VRDN (b)(c) | | 400,000 | | 400,000 |
| (W.H. Porter, Inc. Proj.) Series 2001, 3.68%, LOC Comerica | | | | |
| Bank, Detroit, VRDN (b)(c) | | 3,330,000 | | 3,330,000 |
| (Windcrest Properties LLC Proj.) 3.53%, LOC Comerica | | | | |
| Bank, Detroit, VRDN (b)(c) | | 3,900,000 | | 3,900,000 |
| (YMCA Metropolitan Detroit Proj.) Series 2001, 3.56%, LOC | | | | |
| JPMorgan Chase Bank, VRDN (b) | | 12,465,000 | | 12,465,000 |
| Michigan Strategic Fund Rev. (Rest Haven Christian Services | | | | |
| Proj.) Series A, 3.56%, LOC KBC Bank NV, VRDN (b) | | 3,195,000 | | 3,195,000 |
| Michigan Strategic Fund Solid Waste Disp. Rev.: | | | | |
| Participating VRDN Series LB 05 F11, 3.71% (Lehman | | | | |
| Brothers Hldgs., Inc. Guaranteed) (Liquidity Facility | | | | |
| Lehman Brothers Hldgs., Inc.) (b)(c)(e) | | 5,000,000 | | 5,000,000 |
| (Grayling Gen. Station Proj.) Series 1990, 3.58%, LOC | | | | |
| Barclays Bank PLC, VRDN (b)(c) | | 6,466,000 | | 6,466,000 |
| Michigan Trunk Line Participating VRDN: | | | | |
| Series EGL 7050042 Class A, 3.56% (Liquidity Facility | | | | |
| Citibank NA) (b)(e) | | 3,000,000 | | 3,000,000 |
| Series IXIS 05 13, 3.56% (Liquidity Facility CDC Fin.-CDC | | | | |
| IXIS) (b)(e) | | 6,010,000 | | 6,010,000 |
| Michigan Trunk Line Fund Participating VRDN Series Clipper | | | | |
| 05 27, 3.63% (Liquidity Facility State Street Bank & Trust | | | | |
| Co., Boston) (b)(e) | | 6,500,000 | | 6,500,000 |
| Oakland County Econ. Dev. Corp. Ltd. Oblig. Rev. (Osmic, Inc. | | | | |
| Proj.) Series 2001 A, 3.65%, LOC JPMorgan Chase Bank, | | | | |
| VRDN (b)(c) | | 6,300,000 | | 6,300,000 |
| Rockford Pub. Schools Participating VRDN Series MS 01 589, | | | | |
| 3.55% (Liquidity Facility Morgan Stanley) (b)(e) | | 2,135,000 | | 2,135,000 |
| Saint Clair County Econ. Dev. Corp. Poll. Cont. Rev. | | | | |
| Participating VRDN Series MS 00 282, 3.55% (Liquidity | | | | |
| Facility Morgan Stanley) (b)(e) | | 11,895,000 | | 11,895,000 |
| Sanilac County Econ. Dev. Corp. (Marlette Cmnty. Hosp. Proj.) | | | | |
| Series 2001, 3.56%, LOC JPMorgan Chase Bank, VRDN (b) | | 12,245,000 | | 12,245,000 |
| Univ. of Michigan Univ. Revs. Series 2004 F, 3.16% 4/13/06, | | | | |
| CP | | 4,795,000 | | 4,795,000 |
See accompanying notes which are an integral part of the financial statements.
31 Annual Report
| Fidelity Michigan Municipal Money Market Fund | | |
| Investments continued | | | | | | |
| |
| Municipal Securities continued | | | | |
| | | | | Principal | | Value (Note 1) |
| | | | | Amount | | |
| Michigan – continued | | | | | | |
| Van Buren Township Local Dev. Fin. Auth. Participating VRDN | | | | |
| Series ROC 4518, 3.56% (Liquidity Facility Citigroup Global | | | | |
| Markets Hldgs., Inc.) (b)(e) | | | | $ 7,665,000 | | $ 7,665,000 |
| Waterford Econ. Dev. Corp. Ltd. Oblig. Rev. (Canterbury | | | | |
| Health Care, Inc. Proj.) 3.59%, LOC KBC Bank NV, | | | | |
| VRDN (b) | | | | 6,600,000 | | 6,600,000 |
| Wayne Charter County Arpt. Rev. Participating VRDN Series | | | | |
| MT 123, 3.44% (Liquidity Facility Svenska Handelsbanken | | | | |
| AB) (b)(c)(e) | | | | 7,870,000 | | 7,870,000 |
| Wayne County Arpt. Auth. Rev. Participating VRDN: | | | | |
| Series EGL 720050029, 3.6% (Liquidity Facility Citibank | | | | |
| NA) (b)(c)(e) | | | | 12,400,000 | | 12,400,000 |
| Series EGL 720053029, 3.6% (Liquidity Facility Citibank | | | | |
| NA) (b)(c)(e) | | | | 6,600,000 | | 6,600,000 |
| Series MACN 05 T, 3.59% (Liquidity Facility Bank of | | | | |
| America NA) (b)(c)(e) | | | | 3,640,000 | | 3,640,000 |
| Series MT 115, 3.59% (Liquidity Facility Svenska | | | | |
| Handelsbanken AB) (b)(c)(e) | | | | 6,100,000 | | 6,100,000 |
| Series MT 203, 3.59% (Liquidity Facility Merrill Lynch & Co., | | | | |
| Inc.) (b)(c)(e) | | | | 6,500,000 | | 6,500,000 |
| Series Putters 1081Z, 3.58% (Liquidity Facility JPMorgan | | | | |
| Chase Bank) (b)(c)(e) | | | | 2,750,000 | | 2,750,000 |
| Series Putters 836, 3.58% (Liquidity Facility JPMorgan Chase | | | | |
| & Co.) (b)(c)(e) | | | | 6,085,000 | | 6,085,000 |
| Series ROC II R442, 3.6% (Liquidity Facility Citibank | | | | |
| NA) (b)(c)(e) | | �� | | 6,795,000 | | 6,795,000 |
| Wayne-Westland Cmnty. Schools Participating VRDN Series | | | | |
| MS 98 56, 3.55% (Liquidity Facility Morgan Stanley) (b)(e) . | | 7,465,000 | | 7,465,000 |
| Whitmore Lake Pub. School District Participating VRDN Series | | | | |
| ROC II R4515, 3.56% (Liquidity Facility Citigroup Global | | | | |
| Markets Hldgs., Inc.) (b)(e) | | | | 3,875,000 | | 3,875,000 |
| Zeeland Hosp. Fin. Auth. Rev. (Zeeland Cmnty. Hosp. Proj.) | | | | |
| 3.68%, LOC Huntington Nat’l. Bank, Columbus, VRDN (b) | | 15,410,000 | | 15,410,000 |
| | | | | | | 650,720,606 |
| |
| New York – 0.8% | | | | | | |
| Bank of New York Muni. Ctfs. trust various states Participating | | | | |
| VRDN Series BNY 02 3, 3.6% (Liquidity Facility Bank of | | | | |
| New York, New York) (b)(c)(e) | | | | 5,500,000 | | 5,500,000 |
| |
| |
| |
| |
| See accompanying notes which are an integral part of the financial statements. | | |
| |
| Annual Report | | 32 | | | | |
| Municipal Securities continued | | | | |
| | | | | Principal | | Value (Note 1) |
| | | | | Amount | | |
| Puerto Rico 1.3% | | | | | | |
| Puerto Rico Commonwealth Gen. Oblig. TRAN 4.5% | | | | |
| 7/28/06, LOC Bank of Nova Scotia, New York Agcy., LOC | | | | |
| BNP Paribas SA | | | | $ 4,600,000 | | $ 4,632,785 |
| Puerto Rico Govt. Dev. Bank 2.85% 1/30/06, LOC Societe | | | | |
| Generale, CP (a) | | | | 4,400,000 | | 4,400,000 |
| | | | | | | 9,032,785 |
| |
| TOTAL INVESTMENT PORTFOLIO 95.7% | | | | |
| (Cost $665,253,391) | | | | | | 665,253,391 |
| |
| |
| NET OTHER ASSETS – 4.3% | | | | | | 29,797,494 |
| NET ASSETS 100% | | | | | | $ 695,050,885 |
| Security Type Abbreviations |
| CP | | — | | COMMERCIAL PAPER |
| RAN | | — | | REVENUE ANTICIPATION |
| | | | | NOTE |
| TAN | | — | | TAX ANTICIPATION NOTE |
| TRAN | | — | | TAX AND REVENUE |
| | | | | ANTICIPATION NOTE |
| VRDN | | — | | VARIABLE RATE DEMAND |
| | | | | NOTE |
Legend
(a) Security exempt from registration under
Rule 144A of the Securities Act of 1933.
These securities may be resold in
transactions exempt from registration,
normally to qualified institutional buyers.
At the period end, the value of these
securities amounted to $4,400,000 or
0.6% of net assets.
|
(b) The coupon rate shown on floating or
adjustable rate securities represents the
rate at period end.
(c) Private activity obligations whose
interest is subject to the federal
alternative minimum tax for individuals.
(d) Security collateralized by an amount
sufficient to pay interest and principal.
(e) Provides evidence of ownership in one
or more underlying municipal bonds.
|
Affiliated Central Funds
Information regarding income received by the fund from the affiliated Central funds during the period is as follows:
| Fund | | | | Income received |
| Fidelity Municipal Cash Central Fund | | | $ | 114,761 |
See accompanying notes which are an integral part of the financial statements.
33 Annual Report
| Fidelity Michigan Municipal Money Market Fund | | | | |
| |
| Financial Statements | | | | | | | | |
| |
| Statement of Assets and Liabilities | | | | | | | | |
| | | | | | | December 31, 2005 |
| |
| Assets | | | | | | | | |
| Investment in securities, at value | | | | | | | | |
| See accompanying schedule: | | | | | | | | |
| Unaffiliated issuers (cost $665,253,391) | | | | | | $ | | 665,253,391 |
| Cash | | | | | | | | 16,636,150 |
| Receivable for investments sold | | | | | | | | 11,840,030 |
| Receivable for fund shares sold | | | | | | | | 10,624,641 |
| Interest receivable | | | | | | | | 4,004,355 |
| Prepaid expenses | | | | | | | | 3,166 |
| Receivable from investment adviser for expense | | | | | | | | |
| reductions | | | | | | | | 4,054 |
| Other receivables | | | | | | | | 62,135 |
| Total assets | | | | | | | | 708,427,922 |
| |
| Liabilities | | | | | | | | |
| Payable for fund shares redeemed | | $ | | 13,014,584 | | | | |
| Distributions payable | | | | 20,894 | | | | |
| Accrued management fee | | | | 206,807 | | | | |
| Other affiliated payables | | | | 93,402 | | | | |
| Other payables and accrued expenses | | | | 41,350 | | | | |
| Total liabilities | | | | | | | | 13,377,037 |
| |
| Net Assets | | | | | | $ | | 695,050,885 |
| Net Assets consist of: | | | | | | | | |
| Paid in capital | | | | | | $ | | 695,025,571 |
| Undistributed net investment income | | | | | | | | 25,314 |
| Net Assets, for 694,511,650 shares outstanding | | | | | | $ | | 695,050,885 |
| Net Asset Value, offering price and redemption price per | | | | | | |
| share ($695,050,885 ÷ 694,511,650 shares) | | | | | | $ | | 1.00 |
See accompanying notes which are an integral part of the financial statements.
| Statement of Operations | | | | | | |
| | | | | Year ended December 31, 2005 |
| |
| Investment Income | | | | | | |
| Interest | | | | $ | | 15,233,331 |
| Income from affiliated Central Funds | | | | | | 114,761 |
| Total income | | | | | | 15,348,092 |
| |
| Expenses | | | | | | |
| Management fee | | $ | | 2,364,634 | | |
| Transfer agent fees | | | | 994,215 | | |
| Accounting fees and expenses | | | | 84,999 | | |
| Independent trustees’ compensation | | | | 2,817 | | |
| Custodian fees and expenses | | | | 10,916 | | |
| Registration fees | | | | 39,338 | | |
| Audit | | | | 42,462 | | |
| Legal | | | | 8,279 | | |
| Miscellaneous | | | | 4,678 | | |
| Total expenses before reductions | | | | 3,552,338 | | |
| Expense reductions | | | | (660,312) | | 2,892,026 |
| |
| Net investment income | | | | | | 12,456,066 |
| Realized and Unrealized Gain (Loss) | | | | | | |
| Net realized gain (loss) on: | | | | | | |
| Investment securities: | | | | | | |
| Unaffiliated issuers | | | | | | 75,234 |
| Net increase in net assets resulting from operations | | | | $ | | 12,531,300 |
See accompanying notes which are an integral part of the financial statements.
35 Annual Report
| Fidelity Michigan Municipal Money Market Fund | | |
| Financial Statements continued | | | | |
| |
| Statement of Changes in Net Assets | | | | |
| | | Year ended | | Year ended |
| | | December 31, | | December 31, |
| | | 2005 | | 2004 |
| Increase (Decrease) in Net Assets | | | | |
| Operations | | | | |
| Net investment income | | $ 12,456,066 | | $ 4,246,350 |
| Net realized gain (loss) | | 75,234 | | 149,538 |
| Net increase in net assets resulting | | | | |
| from operations | | 12,531,300 | | 4,395,888 |
| Distributions to shareholders from net investment income . | | (12,429,383) | | (4,272,226) |
| Distributions to shareholders from net realized gain | | (64,798) | | — |
| Total distributions | | (12,494,181) | | (4,272,226) |
| Share transactions at net asset value of $1.00 per share | | | | |
| Proceeds from sales of shares | | 1,770,447,671 | | 1,467,990,554 |
| Reinvestment of distributions | | 12,318,803 | | 4,200,190 |
| Cost of shares redeemed | | (1,695,873,909) | | (1,452,485,643) |
| Net increase (decrease) in net assets and shares re- | | | | |
| sulting from share transactions | | 86,892,565 | | 19,705,101 |
| Total increase (decrease) in net assets | | 86,929,684 | | 19,828,763 |
| |
| Net Assets | | | | |
| Beginning of period | | 608,121,201 | | 588,292,438 |
| End of period (including undistributed net investment | | | | |
| income of $25,314 and undistributed net investment | | | | |
| income of $5,885, respectively) | | $ 695,050,885 | | $ 608,121,201 |
See accompanying notes which are an integral part of the financial statements.
| Financial Highlights | | | | | | | | | | |
| |
| Years ended December 31, | | 2005 | | 2004 | | 2003 | | 2002 | | 2001 |
| Selected Per Share Data | | | | | | | | | | |
| Net asset value, beginning of | | | | | | | | | | |
| period | | $ 1.00 | | $ 1.00 | | $ 1.00 | | $ 1.00 | | $ 1.00 |
| Income from Investment | | | | | | | | | | |
| Operations | | | | | | | | | | |
| Net investment income | | 020 | | .007 | | .006 | | .010 | | .023 |
| Net realized and unrealized | | | | | | | | | | |
| gain (loss)C | | — | | — | | — | | — | | — |
| Total from investment operations | | .020 | | .007 | | .006 | | .010 | | .023 |
| Distributions from net investment | | | | | | | | | | |
| income | | (.020) | | (.007) | | (.006) | | (.010) | | (.023) |
| Distributions from net realized | | | | | | | | | | |
| gain | | —C | | — | | —C | | — | | — |
| Total distributions | | (.020) | | (.007) | | (.006) | | (.010) | | (.023) |
| Net asset value, end of period | | $ 1.00 | | $ 1.00 | | $ 1.00 | | $ 1.00 | | $ 1.00 |
| Total ReturnA | | 1.99% | | .73% | | .63% | | 1.03% | | 2.35% |
| Ratios to Average Net AssetsB | | | | | | | | | | |
| Expenses before reductions | | 56% | | .57% | | .56% | | .56% | | .56% |
| Expenses net of fee waivers, if | | | | | | | | | | |
| any | | 55% | | .57% | | .56% | | .56% | | .56% |
| Expenses net of all reductions | | 46% | | .55% | | .55% | | .52% | | .52% |
| Net investment income | | 1.97% | | .72% | | .61% | | 1.02% | | 2.32% |
| Supplemental Data | | | | | | | | | | |
| Net assets, end of period | | | | | | | | | | |
| (000 omitted) | | $695,051 | | $608,121 | | $588,292 | | $568,762 | | $542,017 |
A Total returns would have been lower had certain expenses not been reduced during the periods shown.
B Expense ratios reflect operating expenses of the fund. Expenses before reductions do not reflect amounts reimbursed by the investment adviser or
expense offset arrangements and do not represent the amount paid by the fund during periods when reimbursements or reductions occur. Ex
penses net of fee waivers reflect expenses after reimbursement by the investment adviser but prior to reductions from expense offset arrange
ments. Expenses net of all reductions represent the net expenses paid by the fund.
C Amount represents less than $.001 per share.
|
See accompanying notes which are an integral part of the financial statements.
37 Annual Report
Notes to Financial Statements
For the period ended December 31, 2005
|
1. Significant Accounting Policies.
Fidelity Michigan Municipal Income Fund (the income fund) is a fund of Fidelity Municipal Trust. On July 21, 2005, the Board of Trustees approved a change in the name of Spartan Michigan Municipal Income Fund to Fidelity Michigan Municipal Income Fund effective August 15, 2005. Fidelity Michigan Municipal Money Market Fund (the money market fund) is a fund of Fidelity Municipal Trust II. Each trust is registered under the Investment Company Act of 1940, as amended (the 1940 Act), as an open end management investment company. Fidelity Municipal Trust and Fidelity Municipal Trust II (the trusts) are organized as a Massachusetts business trust and a Delaware statutory trust, respectively. The income fund is a non diversified fund. Each fund is authorized to issue an unlimited number of shares. Each fund may be affected by economic and political developments in the state of Michigan. Certain funds may invest in affiliated money market central funds (Money Market Central Funds), which are open end investment companies available to investment companies and other accounts managed by Fidelity Management & Research Company (FMR) and its affiliates. The financial statements have been prepared in conformity with accounting principles generally accepted in the United States of America, which require management to make certain estimates and assumptions at the date of the financial statements. The following summa rizes the significant accounting policies of the income fund and the money market fund:
Security Valuation. Investments are valued and net asset value per share is calculated (NAV calculation) as of the close of business of the New York Stock Exchange, normally 4:00 p.m. Eastern time. Wherever possible, each fund uses independent pricing services approved by the Board of Trustees to value their investments. For the income fund, debt securities, including restricted securities, for which quotes are readily available, are valued by independent pricing services or by dealers who make markets in such securi ties. Pricing services consider yield or price of bonds of comparable quality, coupon, maturity and type as well as dealer supplied prices. When current market prices or quotations are not readily available or do not accurately reflect fair value, valuations may be determined in accordance with procedures adopted by the Board of Trustees. The frequency of when fair value pricing is used is unpredictable. The value of securities used for NAV calculation under fair value pricing may differ from published prices for the same securities. Investments in open end mutual funds are valued at their closing net asset value each business day. Short term securities with remaining maturities of sixty days or less for which quotations are not readily available are valued at amortized cost, which approximates value.
As permitted by compliance with certain conditions under Rule 2a 7 of the 1940 Act, securities owned by the money market funds are valued at amortized cost which approximates value.
1. Significant Accounting Policies continued
Investment Transactions and Income. Security transactions are accounted for as of trade date. Gains and losses on securities sold are determined on the basis of identified cost. Interest income is accrued as earned. Interest income includes coupon interest and amortization of premium and accretion of discount on debt securities.
Expenses. Most expenses of each trust can be directly attributed to a fund. Expenses which cannot be directly attributed are apportioned among each fund in the trust.
Income Tax Information and Distributions to Shareholders. Each year, each fund intends to qualify as a regulated investment company by distributing all of its taxable income and realized gains under Subchapter M of the Internal Revenue Code. As a result, no provision for income taxes is required in the accompanying financial statements.
Dividends are declared daily and paid monthly from net investment income. Distribu tions from realized gains, if any, are recorded on the ex dividend date. Income and capital gain distributions are determined in accordance with income tax regulations, which may differ from generally accepted accounting principles. In addition, certain funds will claim a portion of the payment made to redeeming shareholders as a distribu tion for income tax purposes.
Capital accounts within the financial statements are adjusted for permanent book tax differences. These adjustments have no impact on net assets or the results of operations. Temporary book tax differences will reverse in a subsequent period.
Book tax differences are primarily due to market discount, deferred trustees compensa tion, and losses deferred due to futures transactions.
The funds purchase municipal securities whose interest, in the opinion of the issuer, is free from federal income tax. There is no assurance that the Internal Revenue Service (IRS) will agree with this opinion. In the event the IRS determines that the issuer does not comply with relevant tax requirements, interest payments from a security could become federally taxable, possibly retroactively to the date the security was issued.
The tax basis components of distributable earnings and the federal tax cost as of period end were as follows for each fund:
| | | Cost for Federal | | | | | | | | Net Unrealized |
| | | Income Tax | | | | Unrealized | | Unrealized | | Appreciation/ |
| | | Purposes | | | | Appreciation | | Depreciation | | (Depreciation) |
| Fidelity Michigan Municipal | | | | | | | | | | |
| Income Fund | | $ 536,816,534 | | | | $ 20,036,067 | | $ (2,225,620) | | $ 17,810,447 |
| Fidelity Michigan Municipal | | | | | | | | | | |
| Money Market Fund | | 665,253,391 | | | | — | | — | | — |
39 Annual Report
| Notes to Financial Statements continued |
1. Significant Accounting Policies continued |
Income Tax Information and Distributions to Shareholders continued
| | | | | | | | | | | | | Undistributed |
| | | | | | | | | Undistributed | | | | Long-term |
| | | | | | | | | Ordinary Income | | | | Capital Gain |
| Fidelity Michigan Municipal Income Fund | | $ | | 78,328 | | | $ | 147,154 |
| Fidelity Michigan Municipal Money Market Fund | | | | 26,077 | | | | — |
| |
| The tax character of distributions paid was as follows: | | | | |
| |
| | | | | December 31, 2005 |
| | | | | Tax-exempt | | | | Long-term | | | | |
| | | | | Income | | | | Capital Gains | | | | Total |
| Fidelity Michigan Municipal | | | | | | | | | | | | |
| Income Fund | | $ | | 22,452,478 | | $ | | 5,430,741 | | $ | | 27,883,219 |
| Fidelity Michigan Municipal | | | | | | | | | | | | |
| Money Market Fund | | | | 12,429,383 | | | | 64,798 | | | | 12,494,181 |
| |
| | | | | December 31, 2004 |
| | | | | Tax-exempt | | | | Long-term | | | | |
| | | | | Income | | | | Capital Gains | | | | Total |
| Fidelity Michigan Municipal | | | | | | | | | | | | |
| Income Fund | | $ | | 22,507,564 | | $ | | 3,899,782 | | $ | | 26,407,346 |
| Fidelity Michigan Municipal | | | | | | | | | | | | |
| Money Market Fund | | | | 4,063,386 | | | | 208,840 | | | | 4,272,226 |
Short Term Trading (Redemption) Fees. Shares held in the income fund less than 30 days are subject to a redemption fee equal to .50% of the proceeds of the redeemed shares. All redemption fees, including any estimated redemption fees paid by FMR, are retained by the fund and accounted for as an addition to paid in capital.
Delayed Delivery Transactions and When Issued Securities. Certain funds may purchase or sell securities on a delayed delivery or when issued basis. Payment and delivery may take place after the customary settlement period for that security. The price of the underlying securities and the date when the securities will be delivered and paid for are fixed at the time the transaction is negotiated. During the time a delayed delivery sell is outstanding, the contract is marked to market daily and equivalent deliverable securities are held for the transaction. The value of the securities purchased on a delayed delivery or when issued basis are identified as such in each applicable fund’s Schedule of Investments. Certain funds may receive compensation for interest forgone
2. Operating Policies continued
| | |
| Delayed Delivery Transactions and When Issued Securities continued |
in the purchase of a delayed delivery or when issued security. With respect to purchase commitments, each applicable fund identifies securities as segregated in its records with a value at least equal to the amount of the commitment. Losses may arise due to changes in the value of the underlying securities or if the counterparty does not perform under the contract’s terms, or if the issuer does not issue the securities due to political, eco nomic, or other factors.
Futures Contracts. The income fund may use futures contracts to manage its exposure to the bond market and to fluctuations in interest rates. Buying futures tends to increase a fund’s exposure to the underlying instrument, while selling futures tends to decrease a fund’s exposure to the underlying instrument or hedge other fund investments. Futures contracts involve, to varying degrees, risk of loss in excess of any futures variation margin reflected in the Statement of Assets and Liabilities. The underlying face amount at value of any open futures contracts at period end is shown in the Schedule of Investments under the caption “Futures Contracts.” This amount reflects each contract’s exposure to the underlying instrument at period end. Losses may arise from changes in the value of the underlying instruments or if the counterparties do not perform under the contract’s terms. Gains (losses) are realized upon the expiration or closing of the futures contract. Futures contracts are valued at the settlement price established each day by the board of trade or exchange on which they are traded.
Restricted Securities. Certain funds may invest in securities that are subject to legal or contractual restrictions on resale. These securities generally may be resold in transac tions exempt from registration or to the public if the securities are registered. Disposal of these securities may involve time consuming negotiations and expense, and prompt sale at an acceptable price may be difficult. Information regarding restricted securities is included at the end of each applicable fund’s Schedule of Investments.
3. Purchases and Sales of Investments.
Purchases and sales of securities, other than short term securities and U.S. government securities, for the income fund aggregated $141,310,142 and $127,548,037, respectively.
41 Annual Report
Notes to Financial Statements continued
|
| 4. Fees and Other Transactions with Affiliates. |
Management Fee. FMR and its affiliates provide the funds with investment manage ment related services for which the funds pay a monthly management fee. The manage ment fee is the sum of an individual fund fee rate and a group fee rate. The individual fund fee rate is applied to each fund’s average net assets. The group fee rate is based upon the average net assets of all the mutual funds advised by FMR. The group fee rate decreases as assets under management increase and increases as assets under manage ment decrease. For the period, each fund’s annual management fee rate expressed as a percentage of each fund’s average net assets was as follows:
| | | Individual | | | | |
| | | Rate | | Group Rate | | Total |
| Fidelity Michigan Municipal Income Fund | | .25% | | .12% | | .37% |
| Fidelity Michigan Municipal Money Market Fund | | .25% | | .12% | | .37% |
Transfer Agent and Accounting Fees. Citibank, N.A. (Citibank) is the custodian, transfer agent and shareholder servicing agent for the funds. Citibank has entered into a sub arrangement with Fidelity Service Company, Inc. (FSC), an affiliate of FMR, under which FSC performs the activities associated with the funds’ transfer and shareholder servicing agent and accounting functions. The funds pay account fees and asset based fees that vary according to account size and type of account. FSC pays for typesetting, printing and mailing of shareholder reports, except proxy statements. The accounting fee is based on the level of average net assets for the month. For the period, the transfer agent fees were equivalent to the following annual rates expressed as a percentage of average net assets:
| Fidelity Michigan Municipal Income Fund | | .08% | | |
| Fidelity Michigan Municipal Money Market Fund | | .16% | | |
Affiliated Central Funds. Certain funds may invest in Money Market Central Funds which seek preservation of capital and current income and are managed by Fidelity Investments Money Management, Inc. (FIMM), an affiliate of FMR. The Central Funds do not pay a management fee.
5. Committed Line of Credit.
|
The income fund participates with other funds managed by FMR in a $4.2 billion credit facility (the “line of credit”) to be utilized for temporary or emergency purposes to fund shareholder redemptions or for other short term liquidity purposes. The participating funds have agreed to pay commitment fees on their pro rata portion of the line of credit. During the period, there were no borrowings on this line of credit.
Effective February 1, 2005, FMR voluntarily agreed to reimburse funds to the extent annual operating expenses exceeded certain levels of average net assets as noted in the table below. Some expenses, for example interest expense, are excluded from this reimbursement.
The following funds were in reimbursement during the period:
| | | Expense | | | | Reimbursement |
| | | Limitations | | | | from adviser |
| |
| |
| Fidelity Michigan Municipal Money Market Fund | | 55% | | | $ | 66,513 |
In addition, through arrangements with each applicable fund’s custodian and transfer agent, credits realized as a result of uninvested cash balances were used to reduce each applicable fund’s expenses. All of the applicable expense reductions are noted in the table below.
| | | | | | | | | Transfer |
| | | | | Custody | | | | Agent |
| | | | | expense | | | | expense |
| | | | | reduction | | | | reduction |
| |
| Fidelity Michigan Municipal Income Fund | | | $ | 9,179 | | | $ | 265,241 |
| Fidelity Michigan Municipal Money Market Fund | | | | 10,922 | | | | 582,877 |
| |
| |
| 7. Other. | | | | | | | | |
The funds’ organizational documents provide former and current trustees and officers with a limited indemnification against liabilities arising in connection with the perfor mance of their duties to the funds. In the normal course of business, the funds may also enter into contracts that provide general indemnifications. The funds’ maximum expo sure under these arrangements is unknown as this would be dependent on future claims that may be made against the funds. The risk of material loss from such claims is considered remote.
43 Annual Report
Report of Independent Registered Public Accounting Firm
To the Trustees of Fidelity Municipal Trust and Fidelity Municipal Trust II and the Shareholders of Fidelity Michigan Municipal Income Fund (formerly Spar tan Michigan Municipal Income Fund) and Fidelity Michigan Municipal Money Market Fund:
In our opinion, the accompanying statements of assets and liabilities, including the schedules of investments, and the related statements of operations and of changes in net assets and the financial highlights present fairly, in all material respects, the financial position of Fidelity Michigan Municipal Income Fund (formerly Spartan Michigan Munici pal Income Fund) (a fund of Fidelity Municipal Trust) and Fidelity Michigan Municipal Money Market Fund (a fund of Fidelity Municipal Trust II) at December 31, 2005 and the results of their operations, the changes in their net assets and the financial highlights for the periods indicated, in conformity with accounting principles generally accepted in the United States of America. These financial statements and financial highlights (hereafter referred to as “financial statements”) are the responsibility of the Fidelity Municipal Trust’s and Fidelity Municipal Trust II’s management; our responsibility is to express an opinion on these financial statements based on our audits. We conducted our audits of these financial statements in accordance with the standards of the Public Company Accounting Oversight Board (United States). Those standards require that we plan and perform the audit to obtain reasonable assurance about whether the financial statements are free of material misstatement. An audit includes examining, on a test basis, evidence supporting the amounts and disclosures in the financial statements, assessing the ac counting principles used and significant estimates made by management, and evaluating the overall financial statement presentation. We believe that our audits, which included confirmation of securities at December 31, 2005 by correspondence with the custodian and brokers, provide a reasonable basis for our opinion.
/s/ PricewaterhouseCoopers LLP
PricewaterhouseCoopers LLP
Boston, Massachusetts
February 9, 2006
|
Trustees and Officers
The Trustees, Member of the Advisory Board, and executive officers of the trusts and funds, as applicable, are listed below. The Board of Trustees governs each fund and is responsible for protecting the interests of shareholders. The Trustees are experienced executives who meet periodically throughout the year to oversee each fund’s activities, review contractual arrangements with companies that provide services to each fund, and review each fund’s performance. Except for William O. McCoy and Albert R. Gamper, Jr., each of the Trustees oversees 326 funds advised by FMR or an affiliate. Mr. McCoy oversees 328 funds advised by FMR or an affiliate. Mr. Gamper oversees 235 funds advised by FMR or an affiliate.
The Trustees hold office without limit in time except that (a) any Trustee may resign; (b) any Trustee may be removed by written instrument, signed by at least two thirds of the number of Trustees prior to such removal; (c) any Trustee who requests to be retired or who has become incapacitated by illness or injury may be retired by written instru ment signed by a majority of the other Trustees; and (d) any Trustee may be removed at any special meeting of shareholders by a two thirds vote of the outstanding voting securities of the trust. Each Trustee who is not an interested person (as defined in the 1940 Act) (Independent Trustee), shall retire not later than the last day of the calendar year in which his or her 72nd birthday occurs. The Independent Trustees may waive this mandatory retirement age policy with respect to individual Trustees. The executive officers and Advisory Board Member hold office without limit in time, except that any officer and Advisory Board Member may resign or may be removed by a vote of a majority of the Trustees at any regular meeting or any special meeting of the Trustees. Except as indicated, each individual has held the office shown or other offices in the same company for the past five years.
The funds’ statement of additional information (SAI) includes more information about the Trustees. To request a free copy, call Fidelity at 1-800-544-8544.
Correspondence intended for each Trustee who is an interested person may be sent to Fidelity Investments, 82 Devonshire Street, Boston, Massachusetts 02109.
| | Name, Age; Principal Occupation
Edward C. Johnson 3d (75)
|
Year of Election or Appointment: 1984 or 1991
Trustee of Fidelity Municipal Trust (1984) and Fidelity Municipal Trust II (1991). Mr. Johnson is Chairman of the Board of Trustees. Mr. Johnson serves as Chief Executive Officer, Chairman, and a Director of FMR Corp.; a Director and Chairman of the Board and of the Executive Committee of FMR; Chairman and a Director of Fidelity Management & Research (Far East) Inc.; Chairman and a Director of Fidelity Investments Money Management, Inc.; and Chairman (2001 present) and a Director (2000 present) of FMR Co., Inc.
45 Annual Report
Trustees and Officers - continued
| | Name, Age; Principal Occupation
Stephen P. Jonas (52)
|
Year of Election or Appointment: 2005
Mr. Jonas is Senior Vice President of Michigan Municipal Income (2005 present) and Michigan Municipal Money Market (2005 present). He also serves as Senior Vice President of other Fidelity funds (2005 present). Mr. Jonas is Executive Director of FMR (2005 pres ent). Previously, Mr. Jonas served as President of Fidelity Enterprise Op erations and Risk Services (2004 2005), Chief Administrative Officer (2002 2004), and Chief Financial Officer of FMR Co. (1998 2000). Mr. Jonas has been with Fidelity Investments since 1987 and has held vari ous financial and management positions including Chief Financial Officer of FMR. In addition, he serves on the Boards of Boston Ballet (2003 present) and Simmons College (2003 present).
Year of Election or Appointment: 2003
Mr. Reynolds is a Director (2003 present) and Chief Operating Officer (2002 present) of FMR Corp. He also serves on the Board at Fidelity Investments Canada, Ltd. (2000 present). Previously, Mr. Reynolds served as President of Fidelity Investments Institutional Retirement Group (1996 2000).
* Trustees have been determined to be “Interested Trustees” by virtue of, among other things, their affiliation with the trust or various entities under common control with FMR.
Correspondence intended for each Independent Trustee (that is, the Trustees other than the Interested Trustees) may be sent to Fidelity Investments, P.O. Box 55235, Boston, Massachusetts 02205 5235.
| | Name, Age; Principal Occupation
Dennis J. Dirks (57)
|
Year of Election or Appointment: 2005
Prior to his retirement in May 2003, Mr. Dirks was Chief Operating Officer and a member of the Board of The Depository Trust & Clearing Corporation (DTCC) (1999 2003). He also served as President, Chief Operating Officer, and Board member of The Depository Trust Company (DTC) (1999 2003) and President and Board member of the National Securities Clearing Corporation (NSCC) (1999 2003). In addition, Mr. Dirks served as Chief Executive Officer and Board member of the Government Securities Clearing Corporation (2001 2003) and Chief Executive Officer and Board member of the Mortgage Backed Securities Clearing Corporation (2001 2003). Mr. Dirks also serves as a Trustee of Manhattan College (2005 present).
| | Albert R. Gamper, Jr. (63)
|
Year of Election or Appointment: 2006
Mr. Gamper also serves as a Trustee (2006 present) or Member of the Advisory Board (2005 present) of other investment companies advised by FMR. Prior to his retirement in December 2004, Mr. Gamper served as Chairman of the Board of CIT Group Inc. (commercial finance). During his tenure with CIT Group Inc. Mr. Gamper served in numerous senior management positions, including Chairman (1987 1989; 1999 2001; 2002 2004), Chief Executive Officer (1987 2004), and President (1989 2002). He currently serves as a member of the Board of Directors of Public Service Enterprise Group (utilities, 2001 present), Chairman of the Board of Governors, Rutgers University (2004 present), and Chairman of the Board of Saint Barnabas Health Care System.
47 Annual Report
Trustees and Officers - continued
| | Name, Age; Principal Occupation
Robert M. Gates (62)
|
Year of Election or Appointment: 1997
Dr. Gates is Chairman of the Independent Trustees (2006 present). Dr. Gates is President of Texas A&M University (2002 present). He was Director of the Central Intelligence Agency (CIA) from 1991 to 1993. From 1989 to 1991, Dr. Gates served as Assistant to the President of the United States and Deputy National Security Advisor. Dr. Gates is a Director of NACCO Industries, Inc. (mining and manufacturing), Parker Drilling Co., Inc. (drilling and rental tools for the energy industry, 2001 present), and Brinker International (restaurant management, 2003 present). Previously, Dr. Gates served as a Director of LucasVarity PLC (automotive components and diesel engines), a Director of TRW Inc. (automotive, space, defense, and information technology), and Dean of the George Bush School of Government and Public Service at Texas A&M University (1999 2001). Dr. Gates also is a Trustee of the Forum for International Policy.
Year of Election or Appointment: 2004
Dr. Heilmeier is Chairman Emeritus of Telcordia Technologies (commu nication software and systems), where prior to his retirement, he served as company Chairman and Chief Executive Officer. He currently serves on the Boards of Directors of The Mitre Corporation (systems engineer ing and information technology support for the government), and HRL Laboratories (private research and development, 2004 present). He is Chairman of the General Motors Science & Technology Advisory Board and a Life Fellow of the Institute of Electrical and Electronics Engineers (IEEE) (2000 present). Dr. Heilmeier is a member of the Defense Science Board and the National Security Agency Advisory Board. He is also a member of the National Academy of Engineering, the American Academy of Arts and Sciences, and the Board of Overseers of the School of Engineering and Applied Science of the University of Pennsylvania. Previously, Dr. Heilmeier served as a Director of TRW Inc. (automotive, space, defense, and information technology, 1992 2002), Compaq (1994 2002), Automatic Data Processing, Inc. (ADP) (technology based business outsourcing, 1995 2002), INET Technologies Inc. (telecommu nications network surveillance, 2001 2004), and Teletech Holdings (customer management services). He is the recipient of the 2005 Kyoto Prize in Advanced Technology for his invention of the liquid display.
Name, Age; Principal Occupation
Marie L. Knowles (59)
|
Year of Election or Appointment: 2001
Prior to Ms. Knowles’ retirement in June 2000, she served as Executive Vice President and Chief Financial Officer of Atlantic Richfield Company (ARCO) (diversified energy, 1996 2000). From 1993 to 1996, she was a Senior Vice President of ARCO and President of ARCO Transportation Company. She served as a Director of ARCO from 1996 to 1998. She currently serves as a Director of Phelps Dodge Corporation (copper mining and manufacturing) and McKesson Corporation (healthcare ser vice, 2002 present). Ms. Knowles is a Trustee of the Brookings Institution and the Catalina Island Conservancy and also serves as a member of the Advisory Board for the School of Engineering of the University of Southern California.
Year of Election or Appointment: 2000
Mr. Lautenbach has been a partner of Clayton, Dubilier & Rice, Inc. (private equity investment firm) since September 1998. Previously, Mr. Lautenbach was with the International Business Machines Corpora tion (IBM) from 1968 until his retirement in 1998. Mr. Lautenbach serves as a Director of Italtel Holding S.p.A. (telecommunications (Milan, Italy), 2004 present) and Eaton Corporation (diversified industrial) as well as the Philharmonic Center for the Arts in Naples, Florida. He also is a member of the Board of Trustees of Fairfield University (2005 present), as well as a member of the Council on Foreign Relations.
Year of Election or Appointment: 1997
Prior to his retirement in December 1994, Mr. McCoy was Vice Chair man of the Board of BellSouth Corporation (telecommunications) and President of BellSouth Enterprises. He is currently a Director of Liberty Corporation (holding company), Duke Realty Corporation (real estate), and Progress Energy, Inc. (electric utility). He is also a partner of Frank lin Street Partners (private investment management firm) and a member of the Research Triangle Foundation Board. In addition, Mr. McCoy served as the Interim Chancellor (1999 2000) and a member of the Board of Visitors for the University of North Carolina at Chapel Hill and currently serves on the Board of Directors of the University of North Carolina Health Care System and the Board of Visitors of the Kenan Flagler Business School (University of North Carolina at Chapel Hill). He also served as Vice President of Finance for the University of North Carolina (16 school system).
49 Annual Report
Trustees and Officers - continued
| | Name, Age; Principal Occupation
Cornelia M. Small (61)
|
Year of Election or Appointment: 2005
Ms. Small is a member (2000 present) and Chairperson (2002 present) of the Investment Committee, and a member (2002 present) of the Board of Trustees of Smith College. Previously, she served as Chief Investment Officer (1999 2000), Director of Global Equity Investments (1996 1999), and a member of the Board of Directors of Scudder, Stevens & Clark (1990 1997) and Scudder Kemper Investments (1997 1998). In addition, Ms. Small served as Co Chair (2000 2003) of the Annual Fund for the Fletcher School of Law and Diplomacy.
| | William S. Stavropoulos (66)
|
Year of Election or Appointment: 2001 or 2002
Trustee of Fidelity Municipal Trust II (2001) and Fidelity Municipal Trust (2002). Mr. Stavropoulos is Chairman of the Board (2000 present) and a Member of the Board of Directors of The Dow Chemical Company. Since joining The Dow Chemical Company in 1967, Mr. Stavropoulos served in numerous senior management positions, including President (1993 2000; 2002 2003), CEO (1995 2000; 2002 2004), and Chairman of the Executive Committee (2000 2004). Currently, he is a Director of NCR Corporation (data warehousing and technology solu tions), BellSouth Corporation (telecommunications), Chemical Financial Corporation, Maersk Inc. (industrial conglomerate, 2002 present), and Metalmark Capital (private equity investment firm, 2005 present). He also serves as a member of the Board of Trustees of the American Enter prise Institute for Public Policy Research. In addition, Mr. Stavropoulos is a member of The Business Council, J.P. Morgan International Council and the University of Notre Dame Advisory Council for the College of Science.
Year of Election or Appointment: 2005
Prior to his retirement in 2001, Mr. Wolfe was Chairman and Chief Executive Officer of Hershey Foods Corporation (1993 2001). He cur rently serves as a member of the boards of Adelphia Communications Corporation (2003 present), Bausch & Lomb, Inc., and Revlon Inc. (2004 present).
Advisory Board Member and Executive Officers:
Correspondence intended for each executive officer and Mr. Lynch may be sent to Fidelity Investments, 82 Devonshire Street, Boston, Massachusetts 02109.
| | Name, Age; Principal Occupation
Peter S. Lynch (61)
|
Year of Election or Appointment: 2003
Member of the Advisory Board of Fidelity Municipal Trust and Fidelity Municipal Trust II. Vice Chairman and a Director of FMR, and Vice Chairman (2001 present) and a Director (2000 present) of FMR Co., Inc. Previously, Mr. Lynch served as a Trustee of the Fidelity funds (1990 2003). In addition, he serves as a Trustee of Boston College, Massachusetts Eye & Ear Infirmary, Historic Deerfield, John F. Kennedy Library, and the Museum of Fine Arts of Boston.
Year of Election or Appointment: 2005
Vice President of Michigan Municipal Money Market. Mr. Morrison also serves as Vice President of Fidelity’s Money Market Funds (2005 present) and certain Asset Allocation Funds (2002 present). Previously, he served as Vice President of Fidelity’s Bond Funds (2002 2005) and certain Balanced Funds (2002 2005). He served as Vice President (2002 2005) and Bond Group Leader (2002 2005) of Fidelity Investments Fixed Income Division. Mr. Morrison is also Vice President of FIMM
(2002 present) and FMR (2002 present). Mr. Morrison joined Fidelity Investments in 1987 as a Corporate Bond Analyst in the Fixed Income Research Division.
Year of Election or Appointment: 2005
Vice President of Michigan Municipal Income and Michigan Municipal Money Market. Mr. Donovan also serves as Vice President of Fidelity’s High Income Funds (2005 present), Fidelity’s Fixed Income Funds (2005 present), certain Asset Allocation Funds (2005 present), and certain Balanced Funds (2005 present). Mr. Donovan also serves as Executive Vice President of FMR (2005 present) and FMRC (2005 present). Previously, Mr. Donovan served as Vice President and Director of Fidelity’s International Equity Trading group (1998 2005).
51 Annual Report
Trustees and Officers - continued
| | Name, Age; Principal Occupation
David L. Murphy (57)
|
Year of Election or Appointment: 2002 or 2005
Vice President of Michigan Municipal Income (2005 present) and Michi gan Municipal Money Market (2002 present). Mr. Murphy also serves as Vice President of Fidelity’s Money Market Funds (2002 present), Fidelity’s Investment Grade Bond Funds (2005 present), and Fidelity’s Balanced Funds (2005 present). He serves as Senior Vice President (2000 present) and Head (2004 present) of the Fidelity Investments Fixed Income Division. Mr. Murphy is also a Senior Vice President of FIMM (2003 present) and a Vice President of FMR (2000 present). Previously, Mr. Murphy served as Money Market Group Leader (2002 2004), Bond Group Leader (2000 2002), and Vice President of Fidelity’s Taxable Bond Funds (2000 2002) and Fidelity’s Municipal Bond Funds (2001 2002). Mr. Murphy joined Fidelity Investments in 1989 as a portfolio manager in the Bond Group.
Year of Election or Appointment: 2005
Vice President of Michigan Municipal Income. Mr. Silvia also serves as Vice President of Fidelity’s Bond Funds (2005 present), certain Balanced Funds (2005 present), certain Asset Allocation Funds (2005 present), and Senior Vice President and Bond Group Leader of the Fidelity Investments Fixed Income Division (2005 present). Previously, Mr. Silvia served as Director of Fidelity’s Taxable Bond portfolio managers (2002 2004) and a portfolio manager in the Bond Group (1997 2004).
Year of Election or Appointment: 2004
Vice President of Michigan Municipal Money Market. Mr. Widrig also serves as Vice President of other funds advised by FMR. Prior to assuming his current responsibilities, Mr. Widrig worked as an analyst and manager.
Year of Election or Appointment: 2004
Vice President of Michigan Municipal Income. Mr. McGinley also serves as Vice President of other funds advised by FMR. Prior to assuming his current responsibilities, Mr. McGinley worked as an analyst and manager.
Name, Age; Principal Occupation
Eric D. Roiter (57)
|
Year of Election or Appointment: 1998
Secretary of Michigan Municipal Income and Michigan Municipal Money Market. He also serves as Secretary of other Fidelity funds; Vice President, General Counsel, and Secretary of FMR Co., Inc. (2001 present) and FMR; Assistant Secretary of Fidelity Management & Research (U.K.) Inc. (2001 present), Fidelity Management & Research (Far East) Inc. (2001 present), and Fidelity Investments Money Manage ment, Inc. (2001 present). Mr. Roiter is an Adjunct Member, Faculty of Law, at Boston College Law School (2003 present). Previously, Mr. Roiter served as Vice President and Secretary of Fidelity Distribu tors Corporation (FDC) (1998 2005).
Year of Election or Appointment: 2003
Assistant Secretary of Michigan Municipal Income and Michigan Municipal Money Market. Mr. Fross also serves as Assistant Secretary of other Fidelity funds (2003 present), Vice President and Secretary of FDC (2005 present), and is an employee of FMR.
Year of Election or Appointment: 2004
President, Treasurer, and Anti Money Laundering (AML) officer of Michigan Municipal Income and Michigan Municipal Money Market. Ms. Reynolds also serves as President, Treasurer, and AML officer of other Fidelity funds (2004) and is a Vice President (2003) and an employee (2002) of FMR. Before joining Fidelity Investments, Ms. Reynolds worked at PricewaterhouseCoopers LLP (PwC) (1980 2002), where she was most recently an audit partner with PwC’s investment management practice.
Year of Election or Appointment: 2005
Chief Financial Officer of Michigan Municipal Income and Michigan Municipal Money Market. Mr. Murphy also serves as Chief Financial Officer of other Fidelity funds (2005 present). He also serves as Senior Vice President of Fidelity Pricing and Cash Management Services Group (FPCMS).
53 Annual Report
Trustees and Officers - continued
| | Name, Age; Principal Occupation
Kenneth A. Rathgeber (58)
|
Year of Election or Appointment: 2004
Chief Compliance Officer of Michigan Municipal Income and Michigan Municipal Money Market. Mr. Rathgeber also serves as Chief Compliance Officer of other Fidelity funds (2004) and Executive Vice President of Risk Oversight for Fidelity Investments (2002). Previously, he served as Executive Vice President and Chief Operating Officer for Fidelity Invest ments Institutional Services Company, Inc. (1998 2002).
Year of Election or Appointment: 2003
Deputy Treasurer of Michigan Municipal Income and Michigan Munici pal Money Market. Mr. Hebble also serves as Deputy Treasurer of other Fidelity funds (2003), and is an employee of FMR. Before joining Fidelity Investments, Mr. Hebble worked at Deutsche Asset Management where he served as Director of Fund Accounting (2002 2003) and Assistant Treasurer of the Scudder Funds (1998 2003).
Year of Election or Appointment: 2005
Deputy Treasurer of Michigan Municipal Income and Michigan Munici pal Money Market. Mr. Mehrmann also serves as Deputy Treasurer of other Fidelity funds (2005 present) and is an employee of FMR. Previously, Mr. Mehrmann served as Vice President of Fidelity Invest ments Institutional Services Group (FIIS)/Fidelity Investments Institutional Operations Corporation, Inc. (FIIOC) Client Services (1998 2004).
| | Kimberley H. Monasterio (42)
|
Year of Election or Appointment: 2004
Deputy Treasurer of Michigan Municipal Income and Michigan Munici pal Money Market. Ms. Monasterio also serves as Deputy Treasurer of other Fidelity funds (2004) and is an employee of FMR (2004). Before joining Fidelity Investments, Ms. Monasterio served as Treasurer (2000 2004) and Chief Financial Officer (2002 2004) of the Franklin Templeton Funds and Senior Vice President of Franklin Templeton Services, LLC (2000 2004).
Name, Age; Principal Occupation
Kenneth B. Robins (36)
|
Year of Election or Appointment: 2005
Deputy Treasurer of Michigan Municipal Income and Michigan Municipal Money Market. Mr. Robins also serves as Deputy Treasurer of other Fidelity funds (2005 present) and is an employee of FMR (2004 present). Before joining Fidelity Investments, Mr. Robins worked at KPMG LLP, where he was a partner in KPMG’s department of profes sional practice (2002 2004) and a Senior Manager (1999 2000). In addition, Mr. Robins served as Assistant Chief Accountant, United States Securities and Exchange Commission (2000 2002).
Year of Election or Appointment: 2005
Assistant Treasurer of Michigan Municipal Income and Michigan Municipal Money Market. Mr. Byrnes also serves as Assistant Treasurer of other Fidelity funds (2005 present) and is an employee of FMR (2005 present). Previously, Mr. Byrnes served as Vice President of FPCMS (2003 2005). Before joining Fidelity Investments, Mr. Byrnes worked at Deutsche Asset Management where he served as Vice President of the Investment Operations Group (2000 2003).
Year of Election or Appointment: 1986 or 1990
Assistant Treasurer of Michigan Municipal Income (1986) and Michigan Municipal Money Market (1990). Mr. Costello also serves as Assistant Treasurer of other Fidelity funds and is an employee of FMR.
Year of Election or Appointment: 2004
Assistant Treasurer of Michigan Municipal Income and Michigan Municipal Money Market. Mr. Lydecker also serves as Assistant Treasurer of other Fidelity funds (2004) and is an employee of FMR.
Year of Election or Appointment: 2002
Assistant Treasurer of Michigan Municipal Income and Michigan Municipal Money Market. Mr. Osterheld also serves as Assistant Treasurer of other Fidelity funds (2002) and is an employee of FMR.
55 Annual Report
Trustees and Officers - continued
| | Name, Age; Principal Occupation
Gary W. Ryan (47)
|
Year of Election or Appointment: 2005
Assistant Treasurer of Michigan Municipal Income and Michigan Municipal Money Market. Mr. Ryan also serves as Assistant Treasurer of other Fidelity funds (2005 present) and is an employee of FMR (2005 present). Previously, Mr. Ryan served as Vice President of Fund Reporting in FPCMS (1999 2005).
Year of Election or Appointment: 2005
Assistant Treasurer of Michigan Municipal Income and Michigan Municipal Money Market. Mr. Schiavone also serves as Assistant Treasurer of other Fidelity funds (2005 present) and is an employee of FMR (2005 present). Before joining Fidelity Investments, Mr. Schiavone worked at Deutsche Asset Management, where he most recently served as Assistant Treasurer (2003 2005) of the Scudder Funds and Vice President and Head of Fund Reporting (1996 2003).
The Board of Trustees of Fidelity Michigan Municipal Income Fund voted to pay to shareholders of record at the opening of business on record date, the following distributions per share derived from capital gains realized from sales of portfolio securities:
| | | | | | | Capital |
| Fund | | Pay Date | | Record Date | | Gains |
| Fidelity Michigan Municipal Income Fund | | 02/06/06 | | 02/03/06 | | $.005 |
The funds hereby designate as capital gain dividends the amounts noted below for the taxable year ended December 31, 2005, or if subsequently determined to be different, the net capital gain of such year.
| Fund | | |
| Fidelity Michigan Municipal Income Fund | | $4,507,915 |
| Fidelity Michigan Municipal Money Market Fund | | $69,088 |
During fiscal year ended 2005, 100% and 100% of Fidelity Michigan Municipal Income Fund and Fidelity Michigan Municipal Money Market Fund’s income dividends were free from federal income tax, and 2.11% and 28.57% of Fidelity Michigan Municipal Income Fund and Fidelity Michigan Municipal Money Market Fund’s income dividends were subject to the federal alternative minimum tax.
The fund will notify shareholders in January 2006 of amounts for use in preparing 2005 income tax returns.
57 Annual Report
Proxy Voting Results
A special meeting of Fidelity Michigan Municipal Money Market Fund’s shareholders was held on January 18, 2006. The results of votes taken among shareholders on the proposal before them are reported below. Each vote reported represents one dollar of net asset value held on the record date for the meeting.
| PROPOSAL 1 | | | | |
| To elect a Board of Trustees.A | | |
| | | # of | | % of |
| | | Votes | | Votes |
| |
| Dennis J. Dirks | | | | |
| Affirmative | | 667,201,902.33 | | 95.261 |
| Withheld | | 33,193,298.35 | | 4.739 |
| TOTAL | | 700,395,200.68 | | 100.000 |
| Albert R. Gamper, Jr. | | |
| Affirmative | | 667,477,031.41 | | 95.300 |
| Withheld | | 32,918,169.27 | | 4.700 |
| TOTAL | | 700,395,200.68 | | 100.000 |
| Robert M. Gates | | | | |
| Affirmative | | 666,308,716.35 | | 95.133 |
| Withheld | | 34,086,484.33 | | 4.867 |
| TOTAL | | 700,395,200.68 | | 100.000 |
| George H. Heilmeier | | |
| Affirmative | | 664,652,778.09 | | 94.897 |
| Withheld | | 35,742,422.59 | | 5.103 |
| TOTAL | | 700,395,200.68 | | 100.000 |
| Abigail P. Johnson | | |
| Affirmative | | 664,170,496.79 | | 94.828 |
| Withheld | | 36,224,703.89 | | 5.172 |
| TOTAL | | 700,395,200.68 | | 100.000 |
| Edward C. Johnson 3d | | |
| Affirmative | | 663,788,907.22 | | 94.773 |
| Withheld | | 36,606,293.46 | | 5.227 |
| TOTAL | | 700,395,200.68 | | 100.000 |
| Stephen P. Jonas | | | | |
| Affirmative | | 667,006,752.59 | | 95.233 |
| Withheld | | 33,388,448.09 | | 4.767 |
| TOTAL | | 700,395,200.68 | | 100.000 |
| | | # of | | % of |
| | | Votes | | Votes |
| |
| Marie L. Knowles | | |
| Affirmative | | 666,373,338.05 | | 95.142 |
| Withheld | | 34,021,862.63 | | 4.858 |
| TOTAL | | 700,395,200.68 | | 100.000 |
| |
| Ned C. Lautenbach | | |
| Affirmative | | 666,334,938.56 | | 95.137 |
| Withheld | | 34,060,262.12 | | 4.863 |
| TOTAL | | 700,395,200.68 | | 100.000 |
| |
| William O. McCoy | | |
| Affirmative | | 665,764,692.27 | | 95.056 |
| Withheld | | 34,630,508.41 | | 4.944 |
| TOTAL | | 700,395,200.68 | | 100.000 |
| |
| Robert L. Reynolds | | |
| Affirmative | | 667,335,421.55 | | 95.280 |
| Withheld | | 33,059,779.13 | | 4.720 |
| TOTAL | | 700,395,200.68 | | 100.000 |
| |
| Cornelia M. Small | | |
| Affirmative | | 667,579,724.56 | | 95.315 |
| Withheld | | 32,815,476.12 | | 4.685 |
| TOTAL | | 700,395,200.68 | | 100.000 |
| |
| William S. Stavropoulos | | |
| Affirmative | | 665,215,267.33 | | 94.977 |
| Withheld | | 35,179,933.35 | | 5.023 |
| TOTAL | | 700,395,200.68 | | 100.000 |
| |
| Kenneth L. Wolfe | | | | |
| Affirmative | | 666,060,714.08 | | 95.098 |
| Withheld | | 34,334,486.60 | | 4.902 |
| TOTAL | | 700,395,200.68 | | 100.000 |
A Denotes trust-wide proposal and voting results.
Annual Report 58
A special meeting of Fidelity Michigan Municipal Income Fund’s shareholders was held on January 18, 2006. The results of votes taken among shareholders on the proposal before them are reported below. Each vote reported represents one dollar of net asset value held on the record date for the meeting.
| PROPOSAL 1 | | | | |
| To elect a Board of Trustees.A | | |
| | | # of | | % of |
| | | Votes | | Votes |
| |
| Dennis J. Dirks | | | | |
| Affirmative | | 4,012,578,790.76 | | 95.238 |
| Withheld | | 200,653,306.55 | | 4.762 |
| TOTAL | | 4,213,232,097.31 | | 100.000 |
| Albert R. Gamper, Jr. | | |
| Affirmative | | 4,015,643,707.84 | | 95.310 |
| Withheld | | 197,588,389.47 | | 4.690 |
| TOTAL | | 4,213,232,097.31 | | 100.000 |
| Robert M. Gates | | |
| Affirmative | | 4,004,345,809.00 | | 95.042 |
| Withheld | | 208,886,288.31 | | 4.958 |
| TOTAL | | 4,213,232,097.31 | | 100.000 |
| George H. Heilmeier | | |
| Affirmative | | 4,008,127,523.93 | | 95.132 |
| Withheld | | 205,104,573.38 | | 4.868 |
| TOTAL | | 4,213,232,097.31 | | 100.000 |
| Abigail P. Johnson | | |
| Affirmative | | 3,993,175,527.66 | | 94.777 |
| Withheld | | 220,056,569.65 | | 5.223 |
| TOTAL | | 4,213,232,097.31 | | 100.000 |
| Edward C. Johnson 3d | | |
| Affirmative | | 3,987,333,615.26 | | 94.638 |
| Withheld | | 225,898,482.05 | | 5.362 |
| TOTAL | | 4,213,232,097.31 | | 100.000 |
| Stephen P. Jonas | | |
| Affirmative | | 4,010,007,680.52 | | 95.177 |
| Withheld | | 203,224,416.79 | | 4.823 |
| TOTAL | | 4,213,232,097.31 | | 100.000 |
| | | # of | | % of |
| | | Votes | | Votes |
| |
| Marie L. Knowles | | |
| Affirmative | | 4,010,231,303.96 | | 95.182 |
| Withheld | | 203,000,793.35 | | 4.818 |
| TOTAL | | 4,213,232,097.31 | | 100.000 |
| |
| Ned C. Lautenbach | | |
| Affirmative | | 4,009,136,177.44 | | 95.156 |
| Withheld | | 204,095,919.87 | | 4.844 |
| TOTAL | | 4,213,232,097.31 | | 100.000 |
| |
| William O. McCoy | | |
| Affirmative | | 4,001,996,735.35 | | 94.986 |
| Withheld | | 211,235,361.96 | | 5.014 |
| TOTAL | | 4,213,232,097.31 | | 100.000 |
| |
| Robert L. Reynolds | | |
| Affirmative | | 4,010,560,206.65 | | 95.190 |
| Withheld | | 202,671,890.66 | | 4.810 |
| TOTAL | | 4,213,232,097.31 | | 100.000 |
| |
| Cornelia M. Small | | |
| Affirmative | | 4,011,161,760.21 | | 95.204 |
| Withheld | | 202,070,337.10 | | 4.796 |
| TOTAL | | 4,213,232,097.31 | | 100.000 |
| |
| William S. Stavropoulos | | |
| Affirmative | | 4,001,217,912.57 | | 94.968 |
| Withheld | | 212,014,184.74 | | 5.032 |
| TOTAL | | 4,213,232,097.31 | | 100.000 |
| |
| Kenneth L. Wolfe | | |
| Affirmative | | 4,011,439,868.05 | | 95.211 |
| Withheld | | 201,792,229.26 | | 4.789 |
| TOTAL | | 4,213,232,097.31 | | 100.000 |
A Denotes trust-wide proposal and voting results.
59 Annual Report
Investment Adviser
Fidelity Management & Research Company
Boston, MA
Investment Sub Advisers
Fidelity Investments Money
Management, Inc.
Fidelity International Investment Advisors
Fidelity International Investment Advisors
(U.K.) Limited
General Distributor
Fidelity Distributors Corporation
Boston, MA
Transfer and Service Agents
Citibank, N.A.
New York, NY
and
Fidelity Service Company, Inc.
Boston, MA
Custodian
Citibank, N.A.
New York, NY
|
| The Fidelity Telephone Connection |
| Mutual Fund 24-Hour Service |
| Exchanges/Redemptions | | |
| and Account Assistance | | 1-800-544-6666 |
| Product Information | | 1-800-544-6666 |
| Retirement Accounts | | 1-800-544-4774 |
| (8 a.m. - 9 p.m.) | | |
| TDD Service | | 1-800-544-0118 |
| for the deaf and hearing impaired |
| (9 a.m. - 9 p.m. Eastern time) |
| Fidelity Automated Service | | |
| Telephone (FAST® ) (automated phone logo) | | 1-800-544-5555 |
| (automated phone logo) Automated line for quickest service |
MIR-UANN-0206
1.787737.102
|

Fidelity®
Minnesota Municipal Income
Fund
(formerly Spartan® Minnesota Municipal
Income Fund)
|
| | Annual Report
December 31, 2005
|


| Contents | | | | |
| |
| Chairman’s Message | | 4 | | Ned Johnson’s message to shareholders. |
| Performance | | 5 | | How the fund has done over time. |
| Management’s Discussion | | 6 | | The manager’s review of fund |
| | | | | performance, strategy and outlook. |
| Shareholder Expense | | 7 | | An example of shareholder expenses. |
| Example | | | | |
| Investment Changes | | 9 | | A summary of major shifts in the fund’s |
| | | | | investments over the past six months. |
| Investments | | 10 | | A complete list of the fund’s investments |
| | | | | with their market values. |
| Financial Statements | | 17 | | Statements of assets and liabilities, |
| | | | | operations, and changes in net assets, |
| | | | | as well as financial highlights. |
| Notes | | 21 | | Notes to the financial statements. |
| Report of Independent | | 25 | | |
| Registered Public | | | | |
| Accounting Firm | | | | |
| Trustees and Officers | | 26 | | |
| Distributions | | 37 | | |
| Proxy Voting Results | | 38 | | |
To view a fund’s proxy voting guidelines and proxy voting record for the 12 month period ended
June 30, visit www.fidelity.com/proxyvotingresults or visit the Securities and Exchange Commis
sion’s (SEC) web site at www.sec.gov. You may also call 1-800-544-8544 to request a free copy of
the proxy voting guidelines.
Standard & Poor’s, S&P and S&P 500 are registered service marks of The McGraw Hill Companies, Inc.
and have been licensed for use by Fidelity Distributors Corporation.
Other third party marks appearing herein are the property of their respective owners.
All other marks appearing herein are registered or unregistered trademarks or service marks
of FMR Corp. or an affiliated company.
|
This report and the financial statements contained herein are submitted for the general in-
formation of the shareholders of the fund. This report is not authorized for distribution to pro-
spective investors in the fund unless preceded or accompanied by an effective prospectus.
A fund files its complete schedule of portfolio holdings with the SEC for the first and third
quarters of each fiscal year on Form N Q. Forms N Q are available on the SEC’s web site at
http://www.sec.gov. A fund’s Forms N Q may be reviewed and copied at the SEC’s Public Reference
Room in Washington, DC. Information regarding the operation of the SEC’s Public Reference
Room may be obtained by calling 1-800-SEC-0330. For a complete list of a fund’s portfolio
holdings, view the most recent quarterly holdings report, semiannual report, or annual report
on Fidelity’s web site at http://www.fidelity.com/holdings.
NOT FDIC INSURED · MAY LOSE VALUE · NO BANK GUARANTEE
Neither the fund nor Fidelity Distributors Corporation is a bank.
|
3 Annual Report
Chairman’s Message
(photograph of Edward C. Johnson 3d)
Dear Shareholder:
During the past year or so, much has been reported about the mutual fund industry, and much of it has been more critical than I believe is warranted. Allegations that some companies have been less than forthright with their shareholders have cast a shadow on the entire industry. I continue to find these reports disturbing, and assert that they do not create an accurate picture of the industry overall. Therefore, I would like to remind every one where Fidelity stands on these issues. I will say two things specifically regarding allegations that some mutual fund companies were in violation of the Securities and Exchange Commission’s forward pricing rules or were involved in so called “market timing” activities.
First, Fidelity has no agreements that permit customers who buy fund shares after 4 p.m. to obtain the 4 p.m. price. This is not a new policy. This is not to say that some one could not deceive the company through fraudulent acts. However, we are extremely diligent in preventing fraud from occurring in this manner and in every other. But I underscore again that Fidelity has no so called “agreements” that sanction illegal practices.
Second, Fidelity continues to stand on record, as we have for years, in opposition to predatory short term trading that adversely affects shareholders in a mutual fund. Back in the 1980s, we initiated a fee which is returned to the fund and, therefore, to investors to discourage this activity. Further, we took the lead several years ago in developing a Fair Value Pricing Policy to prevent market timing on foreign securities in our funds. I am confident we will find other ways to make it more difficult for predatory traders to operate. However, this will only be achieved through close cooperation among regulators, legislators and the industry.
Yes, there have been unfortunate instances of unethical and illegal activity within the mutual fund industry from time to time. That is true of any industry. When this occurs, confessed or convicted offenders should be dealt with appropriately. But we are still concerned about the risk of over regulation and the quick application of simplistic solutions to intricate problems. Every system can be improved, and we support and applaud well thought out improvements by regulators, legislators and industry representatives that achieve the common goal of building and protecting the value of investors’ holdings.
For nearly 60 years, Fidelity has worked very hard to improve its products and service to justify your trust. When our family founded this company in 1946, we had only a few hundred customers. Today, we serve more than 18 million customers including individual investors and participants in retirement plans across America.
Let me close by saying that we do not take your trust in us for granted, and we realize that we must always work to improve all aspects of our service to you. In turn, we urge you to continue your active participation with your financial matters, so that your interests can be well served.
Best regards,
/s/ Edward C. Johnson 3d
Edward C. Johnson 3d
Annual Report 4
Performance: The Bottom Line
Average annual total return reflects the change in the value of an investment, assuming reinvestment of the fund’s dividend income and capital gains (the profits earned upon the sale of securities that have grown in value) and assuming a constant rate of perfor mance each year. The $10,000 table and the fund’s returns do not reflect the deduction of taxes that a shareholder would pay on fund distributions or the redemption of fund shares. During periods of reimbursement by Fidelity, a fund’s total return will be greater than it would be had the reimbursement not occurred. How a fund did yesterday is no guarantee of how it will do tomorrow.
| Average Annual Total Returns | | | | | | |
| Periods ended December 31, 2005 | | Past 1 | | Past 5 | | Past 10 |
| | | year | | years | | years |
| Fidelity® MN Municipal Income Fund | | 2.61% | | 4.98% | | 5.07% |
| |
| $10,000 Over 10 Years | | | | | | |
Let’s say hypothetically that $10,000 was invested in Fidelity® Minnesota Municipal Income Fund on December 31, 1995. The chart shows how the value of your investment would have changed, and also shows how the Lehman Brothers® Municipal Bond Index performed over the same period.
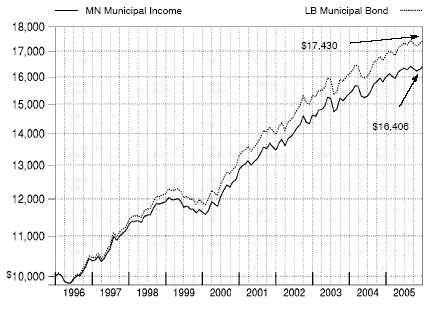
5 Annual Report
5
Management’s Discussion of Fund Performance
Comments from Christine Thompson, Portfolio Manager of Fidelity® Minnesota Municipal Income Fund
For the third consecutive year, the municipal bond market outperformed taxable bonds. The Lehman Brothers® Municipal Bond Index rose 3.51% for the year ending December 31, 2005. The taxable bond market, as measured by the Lehman Brothers Aggregate Bond Index, advanced 2.43% . Muni bonds were attractively valued relative to Treasuries, particularly as tax free bond yields drew closer to those of high quality government bonds. Subsequently, the tax advantage of munis was compelling to such atypical investors in the asset class as hedge funds, corporations and taxable bond investors. The strong demand helped offset heavy issuance, particularly at the longer term end of the spectrum. The Federal Reserve Board raised short term interest rates eight times during the year, but long term rates remained persistently low, making the cost of borrowing more affordable for muni issuers. Still, absolute returns finished well below their historical averages. In addition to the rate hikes, surging energy prices pushed inflation higher, a condition further exacerbated by the damage to energy production facilities caused by Hurricane Katrina.
For the 12 months ending December 31, 2005, the fund returned 2.61% . During the same period, the LipperSM Minnesota Municipal Debt Funds Average was up 3.01% and the Lehman Brothers Minnesota Enhanced Municipal Bond Index gained 3.16% . The fund’s underweighting relative to the index and likely its competitors in lower quality securities in general, and below investment grade securities in particular, caused it to underperform. Low quality securities, bolstered by robust investor demand, handily out paced the higher quality securities I emphasized during the period. My viewpoint was that lower quality securities were unappealing from a valuation standpoint and that investors were getting paid too little in the way of incremental yield to take on the added credit risk that accompanies lower quality bonds. That said, the fund did own some lower quality securities that performed well, particularly in the health care sector. The fund also benefited from its comparatively large stake in bonds that were prerefunded during the period, a process that boosts the bonds’ prices. Prerefunding involves issuers refinancing outstanding debt by issuing new debt and using the proceeds to purchase U.S. government securities to back the refinanced bonds to a date prior to their maturity, typically the bonds’ first call date.
The views expressed in this statement reflect those of the portfolio manager only through the end of the period of the report as stated on the cover and do not necessarily represent the views of Fidelity or any other person in the Fidelity organization. Any such views are subject to change at any time based upon market or other conditions and Fidelity disclaims any responsibility to update such views. These views may not be relied on as investment advice and, because investment decisions for a Fidelity fund are based on numerous factors, may not be relied on as an indication of trading intent on behalf of any Fidelity fund.
Shareholder Expense Example
As a shareholder of the Fund, you incur two types of costs: (1) transaction costs, including redemption fees, and (2) ongoing costs, including management fees and other Fund expenses. This Example is intended to help you understand your ongoing costs (in dollars) of investing in the Fund and to compare these costs with the ongoing costs of investing in other mutual funds.
The Example is based on an investment of $1,000 invested at the beginning of the period and held for the entire period (July 1, 2005 to December 31, 2005).
The first line of the table below provides information about actual account values and actual expenses. You may use the information in this line, together with the amount you invested, to estimate the expenses that you paid over the period. Simply divide your account value by $1,000.00 (for example, an $8,600 account value divided by $1,000.00 = 8.6), then multiply the result by the number in the first line under the heading entitled “Expenses Paid During Period” to estimate the expenses you paid on your account during this period. A small balance maintenance fee of $12.00 that is charged once a year may apply for certain accounts with a value of less than $2,000. This fee is not included in the table below. If it was, the estimate of expenses you paid during the period would be higher, and your ending account value lower, by this amount.
Hypothetical Example for Comparison Purposes
The second line of the table below provides information about hypothetical account values and hypothetical expenses based on the Fund’s actual expense ratio and an assumed rate of return of 5% per year before expenses, which is not the Fund’s actual return. The hypothetical account values and expenses may not be used to estimate the actual ending account balance or expenses you paid for the period. You may use this information to compare the ongoing costs of investing in the Fund and other funds. To do so, compare this 5% hypothetical example with the 5% hypothetical examples that appear in the share holder reports of the other funds. A small balance maintenance fee of $12.00 that is charged once a year may apply for certain accounts with a value of less than $2,000. This fee is not included in the table below. If it was, the estimate of expenses you paid during the period would be higher, and your ending account value lower, by this amount.
Please note that the expenses shown in the table are meant to highlight your ongoing costs only and do not reflect any transaction costs. Therefore, the second line of the table is useful in comparing ongoing costs only, and will not help you determine the relative total costs of owning different funds. In addition, if these transactional costs were included, your costs would have been higher.
7 Annual Report
| Shareholder Expense Example continued | | |
| |
| |
| |
| | | | | | | | | | | Expenses Paid |
| | | | | | | | | | | During Period* |
| | | | | Beginning | | Ending | | July 1, 2005 |
| | | | | Account Value | | Account Value | | to December 31, |
| | | | | July 1, 2005 | | December 31, 2005 | | 2005 |
| Actual | | | $ | 1,000.00 | | $ | | 1,004.00 | | $ | | 2.53 |
| Hypothetical (5% return per year | | | | | | | | | | |
| before expenses) | | | $ | 1,000.00 | | $ | | 1,022.68 | | $ | | 2.55 |
* Expenses are equal to the Fund’s annualized expense ratio of .50%; multiplied by the average account value over the period, multiplied by 184/365 (to reflect the one half year period).
| Investment Changes | | | | |
| |
| Top Five Sectors as of December 31, 2005 | | |
| | | % of fund’s | | % of fund’s net assets |
| | | net assets | | 6 months ago |
| General Obligations | | 38.7 | | 44.8 |
| Health Care | | 15.2 | | 13.2 |
| Electric Utilities | | 14.9 | | 15.7 |
| Escrowed/Pre Refunded | | 14.7 | | 12.2 |
| Transportation | | 7.0 | | 5.9 |
Average Years to Maturity as of December 31, 2005 | | |
| | | | | 6 months ago |
| Years | | 12.4 | | 12.7 |
Average years to maturity is based on the average time remaining to the stated maturity date of each bond, weighted by the market value of each bond.
| Duration as of December 31, 2005 | | | | |
| | | | | | | 6 months ago |
| Years | | | | 5.7 | | 6.0 |
Duration shows how much a bond fund’s price fluctuates with changes in comparable interest rates. If rates rise 1%, for example, a fund with a five year duration is likely to lose about 5% of its value. Other factors also can influence a bond fund’s performance and share price. Accordingly, a bond fund’s actual performance may differ from this example.
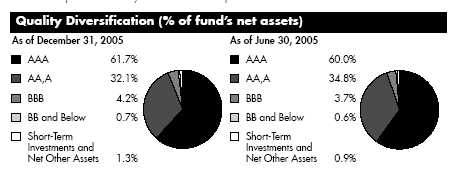
We have used ratings from Moody’s® Investors Services, Inc. Where Moody’s ratings are not available, we have used S&P® ratings.
9 Annual Report
| Investments December 31, 2005 | | | | |
| Showing Percentage of Net Assets | | | | | | | | |
| |
| Municipal Bonds 98.7% | | | | | | | | |
| | | | | Principal | | | | Value |
| | | | | Amount | | | | (Note 1) |
| Guam 0.1% | | | | | | | | |
| Guam Wtrwks. Auth. Wtr. and Wastewtr. Sys. Rev. 5.875% | | | | | | |
| 7/1/35 | | | $ | 375,000 | | $ | | 393,405 |
| Minnesota – 94.3% | | | | | | | | |
| Anoka-Hennepin Independent School District #11: | | | | | | |
| Series 2004 B, 5% 2/1/20 | | | | 1,880,000 | | | | 1,987,668 |
| Series A, 5.75% 2/1/20 (Pre-Refunded to 2/1/10 @ | | | | | | |
| 100) (b) | | | | 3,950,000 | | | | 4,273,308 |
| Brainerd Independent School District #181 Series A: | | | | | | |
| 5.375% 2/1/16 (FGIC Insured) | | | | 3,885,000 | | | | 4,249,607 |
| 5.375% 2/1/17 (FGIC Insured) | | | | 4,705,000 | | | | 5,129,391 |
| 5.375% 2/1/19 (FGIC Insured) | | | | 2,700,000 | | | | 2,930,472 |
| Brooklyn Ctr. Independent School District #286 5.1% 2/1/31 | | | | | | |
| (FGIC Insured) | | | | 6,000,000 | | | | 6,250,680 |
| Cambridge Independant School District #911 Gen. Oblig. | | | | | | |
| (Minnesota School District Prog.) Series C, 5% 4/1/14 | | | | | | |
| (MBIA Insured) | | | | 1,200,000 | | | | 1,302,744 |
| Centennial Independent School District #12: | | | | | | |
| Series 1996 A, 5.625% 2/1/16 | | | | 1,000,000 | | | | 1,041,680 |
| Series A, 5% 2/1/19 (FSA Insured) | | | | 580,000 | | | | 611,297 |
| Chaska Elec. Rev. (Generating Facilities Proj.) Series A: | | | | | | |
| 5.25% 10/1/20 | | | | 2,000,000 | | | | 2,143,160 |
| 5.25% 10/1/25 | | | | 1,215,000 | | | | 1,290,063 |
| Duluth Econ. Dev. Auth. Health Care Facilities Rev. (Benedictine | | | | | | |
| Health Sys. St. Mary’s) 5.25% 2/15/28 | | | | 2,350,000 | | | | 2,431,404 |
| Elk River Independent School District #728 Series A, 5% | | | | | | |
| 2/1/17 (FGIC Insured) | | | | 2,000,000 | | | | 2,149,880 |
| Hastings Independent School District #200 Series A, 5% | | | | | | |
| 2/1/22 (Pre-Refunded to 2/1/08 @ 100) (b) | | 4,750,000 | | | | 4,899,768 |
| Hopkins Independent School District #270: | | | | | | |
| 5% 2/1/16 (FGIC Insured) | | | | 1,350,000 | | | | 1,433,309 |
| 5.125% 2/1/17 (FGIC Insured) | | | | 1,015,000 | | | | 1,083,888 |
| Jackson County Central Independent School District #2895 5% | | | | | | |
| 2/1/21 (FSA Insured) | | | | 1,220,000 | | | | 1,281,134 |
| Lake Superior Independent School District #381 Series A: | | | | | | |
| 5% 4/1/15 (FSA Insured) | | | | 1,970,000 | | | | 2,113,121 |
| 5% 4/1/16 (FSA Insured) | | | | 2,065,000 | | | | 2,213,659 |
| 5% 4/1/17 (FSA Insured) | | | | 2,165,000 | | | | 2,312,415 |
| 5% 4/1/18 (FSA Insured) | | | | 1,260,000 | | | | 1,342,517 |
| Lakeville Independent School District #194 Series A, 5% | | | | | | |
| 2/1/22 (FGIC Insured) | | | | 1,000,000 | | | | 1,056,000 |
| Mankato Independent School District #77 Series A, 5% | | | | | | |
| 2/1/12 (FSA Insured) | | | | 1,605,000 | | | | 1,678,316 |
| |
| See accompanying notes which are an integral part of the financial statements. | | | | |
| |
| Annual Report | | 10 | | | | | | |
| Municipal Bonds continued | | | | | | | | |
| | | | | Principal | | | | Value |
| | | | | Amount | | | | (Note 1) |
| Minnesota – continued | | | | | | | | |
| Maple Grove Gen. Oblig. Impt. Series A, 5.2% 2/1/17 (Pre- | | | | | | | | |
| Refunded to 2/1/07 @ 100) (b) | | | $ | 1,120,000 | | $ | | 1,141,851 |
| Minneapolis & Saint Paul Hsg. & Redev. Auth. Health Care | | | | | | | | |
| Sys. Rev.: | | | | | | | | |
| (Health Partners Oblig. Group Proj.): | | | | | | | | |
| 5.875% 12/1/29 | | | | 800,000 | | | | 850,032 |
| 6% 12/1/19 | | | | 2,915,000 | | | | 3,229,587 |
| (Healthspan Corp. Proj.) Series A, 4.75% 11/15/18 | | | | | | | | |
| (AMBAC Insured) | | | | 4,500,000 | | | | 4,505,040 |
| Minneapolis & Saint Paul Metropolitan Arpts. Commission | | | | | | | | |
| Series 13, 5.25% 1/1/11 (a) | | | | 2,840,000 | | | | 2,979,870 |
| Minneapolis & Saint Paul Metropolitan Arpts. Commission | | | | | | | | |
| Arpt. Rev.: | | | | | | | | |
| Series 1999 A, 5.125% 1/1/31 (FGIC Insured) | | | | 3,375,000 | | | | 3,491,640 |
| Series 2001 C: | | | | | | | | |
| 5.25% 1/1/32 (FGIC Insured) | | | | 2,020,000 | | | | 2,117,344 |
| 5.5% 1/1/16 (FGIC Insured) | | | | 2,500,000 | | | | 2,705,650 |
| Series A: | | | | | | | | |
| 5% 1/1/19 (AMBAC Insured) | | | | 4,000,000 | | | | 4,150,840 |
| 5% 1/1/35 (AMBAC Insured) | | | | 5,500,000 | | | | 5,705,590 |
| Series B: | | | | | | | | |
| 5.25% 1/1/11 (AMBAC Insured) (a) | | | | 3,475,000 | | | | 3,608,996 |
| 5.4% 1/1/09 (FGIC Insured) (a) | | | | 1,375,000 | | | | 1,441,756 |
| 5.625% 1/1/13 (FGIC Insured) (a) | | | | 1,000,000 | | | | 1,064,710 |
| Minneapolis Art Ctr. Facilities Rev. (Walker Art Ctr. Proj.) | | | | | | | | |
| 5.125% 7/1/21 | | | | 1,250,000 | | | | 1,308,025 |
| Minneapolis Cmnty. Dev. Agcy. Tax Increment Rev.: | | | | | | | | |
| 0% 9/1/07 (MBIA Insured) | | | | 2,860,000 | | | | 2,705,188 |
| 0% 9/1/08 (MBIA Insured) | | | | 4,600,000 | | | | 4,179,790 |
| Minneapolis Gen. Oblig. (Sports Arena Proj.) 5.125% | | | | | | | | |
| 10/1/20 | | | | 2,565,000 | | | | 2,662,855 |
| Minneapolis Health Care Sys. Rev.: | | | | | | | | |
| (Allina Health Sys. Proj.) Series 2002 A, 6% 11/15/18 | | | | 2,655,000 | | | | 2,953,873 |
| (Health Care Sys. Proj.): | | | | | | | | |
| Series B, 5% 5/15/09 (MBIA Insured) | | | | 3,180,000 | | | | 3,335,025 |
| Series D, 5% 11/15/34 (AMBAC Insured) | | | | 1,500,000 | | | | 1,568,850 |
| Minneapolis Rev. (Univ. of Minnesota Gateway Proj.) | | | | | | | | |
| Series 1997 A, 5.25% 12/1/24 | | | | 1,900,000 | | | | 1,943,795 |
| Minneapolis Spl. School District #1: | | | | | | | | |
| Series A, 5% 2/1/17 (FSA Insured) | | | | 2,000,000 | | | | 2,142,460 |
| 5% 2/1/15 (MBIA Insured) | | | | 1,020,000 | | | | 1,089,207 |
See accompanying notes which are an integral part of the financial statements.
11 Annual Report
| Investments continued | | | | | | |
| |
| |
| Municipal Bonds continued | | | | | | |
| | | Principal | | | | Value |
| | | Amount | | | | (Note 1) |
| Minnesota – continued | | | | | | |
| Minneapolis Spl. School District #1 Ctfs. of Prtn.: | | | | | | |
| Series B, 5% 2/1/13 (Pre-Refunded to 2/1/07 @ 100) (b) . | $ | 2,575,000 | | $ | | 2,619,857 |
| 5.5% 2/1/21 (MBIA Insured) (Pre-Refunded to 2/1/09 @ | | | | | | |
| 100) (b) | | 1,305,000 | | | | 1,382,700 |
| Minnesota Agric. & Econ. Dev. Board Rev. (Health Care Sys. | | | | | | |
| Proj.) Series A: | | | | | | |
| 6.375% 11/15/29 | | 90,000 | | | | 100,306 |
| 6.375% 11/15/29 (Pre-Refunded to 11/15/10 @ 101) (b) | | 2,940,000 | | | | 3,336,694 |
| Minnesota Gen. Oblig.: | | | | | | |
| (Duluth Arpt. Proj.) Series B, 6.25% 8/1/14 (a) | | 900,000 | | | | 902,259 |
| 5% 8/1/16 | | 3,500,000 | | | | 3,740,030 |
| 5% 8/1/18 | | 10,775,000 | | | | 11,545,300 |
| 5.2% 5/1/07 | | 1,340,000 | | | | 1,348,161 |
| 5.25% 8/1/13 | | 755,000 | | | | 805,260 |
| 5.5% 6/1/17 | | 2,150,000 | | | | 2,310,433 |
| Minnesota Higher Ed. Facilities Auth. Rev.: | | | | | | |
| (Hamline Univ. Proj.) Series 5B, 5.95% 10/1/19 | | 600,000 | | | | 635,724 |
| (Saint John’s Univ. Proj.): | | | | | | |
| Series 4L, 5.4% 10/1/22 (Pre-Refunded to 10/1/07 @ | | | | | | |
| 100) (b) | | 3,500,000 | | | | 3,623,025 |
| 5% 10/1/08 | | 1,000,000 | | | | 1,036,410 |
| (Saint Thomas Univ. Proj.) Series 4M, 5.35% 4/1/17 | | 1,500,000 | | | | 1,538,235 |
| (Trustees of the Hamline Univ. of Minnesota Proj.) Series 41, | | | | | | |
| 6% 10/1/12 | | 440,000 | | | | 448,026 |
| Minnesota Muni. Pwr. Agcy. Elec. Rev. 5.25% 10/1/21 | | 2,500,000 | | | | 2,670,775 |
| Minnesota Pub. Facilities Auth. Wtr. Poll. Cont. Rev. 5% | | | | | | |
| 3/1/16 | | 295,000 | | | | 300,425 |
| Minnesota Retirement Sys. Bldg. Rev.: | | | | | | |
| 5.55% 6/1/14 | | 590,000 | | | | 636,710 |
| 5.6% 6/1/15 | | 590,000 | | | | 638,657 |
| 5.65% 6/1/16 | | 625,000 | | | | 677,538 |
| 5.7% 6/1/17 | | 900,000 | | | | 977,472 |
| 5.75% 6/1/18 | | 975,000 | | | | 1,060,907 |
| 5.75% 6/1/19 | | 1,050,000 | | | | 1,142,064 |
| 5.8% 6/1/20 | | 1,000,000 | | | | 1,089,700 |
| 5.875% 6/1/22 | | 2,425,000 | | | | 2,648,852 |
| Minnesota State Colleges & Univs. Board of Tustees Rev. | | | | | | |
| Series A, 5% 10/1/18 (MBIA Insured) | | 1,465,000 | | | | 1,568,693 |
| Mounds View Independent School District #621 | | | | | | |
| Series 2000 A, 5.375% 2/1/24 (Pre-Refunded to 2/1/11 @ | | | | | | |
| 100) (b) | | 3,000,000 | | | | 3,233,820 |
See accompanying notes which are an integral part of the financial statements.
| Municipal Bonds continued | | | | | | | | |
| | | | | Principal | | | | Value |
| | | | | Amount | | | | (Note 1) |
| Minnesota – continued | | | | | | | | |
| Northeast Metropolitan Intermediate School District #916 Ctfs. | | | | | | | | |
| of Prtn. 5% 1/1/13 | | | $ | 1,000,000 | | $ | | 1,053,590 |
| Northern Muni. Pwr. Agcy. Elec. Sys. Rev.: | | | | | | | | |
| 5.25% 1/1/13 (FSA Insured) | | | | 1,500,000 | | | | 1,601,355 |
| 5.375% 1/1/14 (FSA Insured) | | | | 8,500,000 | | | | 9,116,845 |
| Osseo Independent School District #279: | | | | | | | | |
| (School Bldg. Proj.): | | | | | | | | |
| Series 2000 A, 5.25% 2/1/21 | | | | 2,625,000 | | | | 2,805,023 |
| Series A: | | | | | | | | |
| 5.75% 2/1/11 | | | | 2,420,000 | | | | 2,636,590 |
| 5.75% 2/1/12 | | | | 3,100,000 | | | | 3,377,450 |
| Series A, 5.25% 2/1/14 (FSA Insured) | | | | 2,705,000 | | | | 2,934,141 |
| Series B, 5% 2/1/13 | | | | 2,000,000 | | | | 2,101,260 |
| Owatonna Pub. Utils. Commission Pub. Utils. Rev.: | | | | | | | | |
| 5% 1/1/11 (AMBAC Insured) | | | | 720,000 | | | | 769,385 |
| 5% 1/1/13 (AMBAC Insured) | | | | 800,000 | | | | 863,016 |
| 5% 1/1/15 (AMBAC Insured) | | | | 715,000 | | | | 767,224 |
| Prior Lake Ind. School District #719 Series 2000, 5.5% | | | | | | | | |
| 2/1/15 (FSA Insured) | | | | 1,500,000 | | | | 1,607,595 |
| Ramsey County Gen. Oblig. Series A, 5% 2/1/18 | | | | 1,530,000 | | | | 1,639,946 |
| Robbinsdale Independent School District #281: | | | | | | | | |
| 5% 2/1/16 (FSA Insured) | | | | 3,425,000 | | | | 3,636,357 |
| 5% 2/1/17 (FSA Insured) | | | | 2,535,000 | | | | 2,682,993 |
| 5% 2/1/18 (FSA Insured) | | | | 2,520,000 | | | | 2,661,548 |
| Rochester Health Care Facilities Rev.: | | | | | | | | |
| (Mayo Foundation Proj.) Series A, 5.5% 11/15/27 | | | | 4,750,000 | | | | 4,999,280 |
| (Mayo Foundation/Mayo Med. Ctr. Proj.) Series I: | | | | | | | | |
| 5.875% 11/15/08 | | | | 1,000,000 | | | | 1,067,730 |
| 5.9% 11/15/09 | | | | 1,000,000 | | | | 1,087,430 |
| Roseville Independent School District #623 (School District Cr. | | | | | | | | |
| Enhancement Prog.) Series A, 5% 2/1/15 (FSA Insured) | | | | 1,015,000 | | | | 1,075,971 |
| Saint Cloud Health Care Rev. (Saint Cloud Hosp. Group Oblig. | | | | | | | | |
| Proj.) Series A: | | | | | | | | |
| 5.75% 5/1/26 (FSA Insured) | | | | 7,020,000 | | | | 7,634,812 |
| 5.875% 5/1/30 (FSA Insured) | | | | 4,000,000 | | | | 4,371,760 |
| 6.25% 5/1/20 (FSA Insured) | | | | 2,760,000 | | | | 3,065,642 |
| Saint Cloud Hosp. Facilities Rev. (Saint Cloud Hosp. Proj.) | | | | | | | | |
| Series B, 5% 7/1/20 (AMBAC Insured) | | | | 1,000,000 | | | | 1,015,660 |
| Saint Louis Park Health Care Facilities Rev. (Park Nicollet | | | | | | | | |
| Health Services Proj.) Series B, 5.5% 7/1/25 | | | | 2,000,000 | | | | 2,134,000 |
See accompanying notes which are an integral part of the financial statements.
13 Annual Report
| Investments continued | | | | | | | | |
| |
| |
| Municipal Bonds continued | | | | | | | | |
| | | | | Principal | | | | Value |
| | | | | Amount | | | | (Note 1) |
| Minnesota – continued | | | | | | | | |
| Saint Louis Park Independent School District #283: | | | | | | | | |
| 5.65% 2/1/16 (Pre-Refunded to 2/1/09 @ 100) (b) | | | $ | 2,630,000 | | $ | | 2,798,004 |
| 5.75% 2/1/20 (Pre-Refunded to 2/1/09 @ 100) (b) | | | | 3,765,000 | | | | 4,016,389 |
| Saint Michael Independent School District #885 5% 2/1/27 | | | | | | | | |
| (FSA Insured) | | | | 7,000,000 | | | | 7,289,590 |
| Saint Paul Hsg. & Redev. Auth. Health Care Facilities Rev. | | | | | | | | |
| (Regions Hosp. Proj.) 5.3% 5/15/28 | | | | 1,250,000 | | | | 1,270,663 |
| Saint Paul Hsg. & Redev. Auth. Hosp. Rev. (Healtheast Proj.) | | | | | | | | |
| 6% 11/15/30 | | | | 2,000,000 | | | | 2,121,840 |
| Saint Paul Independent School District #625: | | | | | | | | |
| Series 2000 A, 5.5% 2/1/21 | | | | 1,060,000 | | | | 1,148,574 |
| Series A, 5% 2/1/17 (FSA Insured) | | | | 220,000 | | | | 234,685 |
| Series B: | | | | | | | | |
| 5% 2/1/16 (FSA Insured) | | | | 1,025,000 | | | | 1,110,424 |
| 5% 2/1/17 (FSA Insured) | | | | 1,300,000 | | | | 1,402,167 |
| 5% 2/1/18 (FSA Insured) | | | | 395,000 | | | | 420,363 |
| Series C, 5% 2/1/21 | | | | 1,000,000 | | | | 1,056,720 |
| Saint Paul Port Auth. Energy Park Tax Increment Rev. 5% | | | | | | | | |
| 2/1/08 (Escrowed to Maturity) (b) | | | | 2,500,000 | | | | 2,587,950 |
| Saint Paul Port Auth. Lease Rev.: | | | | | | | | |
| (HealthEast Midway Campus Proj.) Series 2003 A, 5.75% | | | | | | | | |
| 5/1/25 | | | | 2,000,000 | | | | 2,032,380 |
| Series 2003 11, 5.25% 12/1/20 | | | | 3,000,000 | | | | 3,243,450 |
| Series 2003 12, 5.25% 12/1/18 | | | | 3,685,000 | | | | 4,004,821 |
| Shakopee Health Care Facilities Rev. (Saint Francis Reg’l. Med. | | | | | | | | |
| Ctr. Proj.) 5.25% 9/1/34 | | | | 2,500,000 | | | | 2,568,050 |
| South Washington County Independent School District #833 | | | | | | | | |
| Series A: | | | | | | | | |
| 5.4% 2/1/15 (Pre-Refunded to 2/1/10 @ 100) (b) | | | | 3,925,000 | | | | 4,194,569 |
| 5.5% 2/1/19 (Pre-Refunded to 2/1/10 @ 100) (b) | | | | 1,000,000 | | | | 1,072,440 |
| Southern Minnesota Muni. Pwr. Agcy. Pwr. Supply Sys. Rev.: | | | | | | | | |
| Series 1994 A, 0% 1/1/21 (MBIA Insured) | | | | 14,670,000 | | | | 7,463,216 |
| Series 2002 A: | | | | | | | | |
| 5% 1/1/10 (AMBAC Insured) | | | | 1,620,000 | | | | 1,713,442 |
| 5% 1/1/12 (AMBAC Insured) | | | | 2,660,000 | | | | 2,854,552 |
| Series A: | | | | | | | | |
| 0% 1/1/19 (MBIA Insured) | | | | 5,210,000 | | | | 2,930,260 |
| 5.25% 1/1/15 (AMBAC Insured) | | | | 1,000,000 | | | | 1,105,520 |
| 5.25% 1/1/16 (AMBAC Insured) | | | | 3,360,000 | | | | 3,729,365 |
| Spring Lake Park Ind. School District #16 Series B: | | | | | | | | |
| 5% 2/1/15 (MBIA Insured) | | | | 2,085,000 | | | | 2,233,494 |
See accompanying notes which are an integral part of the financial statements.
| Municipal Bonds continued | | | | | | |
| | | | | Principal | | Value |
| | | | | Amount | | (Note 1) |
| Minnesota – continued | | | | | | |
| Spring Lake Park Ind. School District #16 Series B: - continued | | | | | | |
| 5% 2/1/16 (MBIA Insured) | | | $ | 2,230,000 | | $ 2,387,393 |
| 5% 2/1/17 (MBIA Insured) | | | | 2,400,000 | | 2,560,200 |
| Suburban Hennepin Reg’l. Park District 5% 2/1/12 | | | | 1,000,000 | | 1,043,600 |
| Virginia Hsg. & Redev. Auth. Health Care Facility Lease Rev. | | | | | | |
| 5.25% 10/1/25 | | | | 440,000 | | 451,092 |
| Washington County Gen. Oblig. 5.5% 2/1/21 (Pre-Refunded | | | | | | |
| to 2/1/10 @ 100) (b) | | | | 1,450,000 | | 1,555,038 |
| Watertown Independent School District #111 Series A, 5% | | | | | | |
| 2/1/22 (FSA Insured) | | | | 1,495,000 | | 1,590,844 |
| Wayzata Ind. School District #284 Series B, 5% 2/1/16 | | | | | | |
| (FSA Insured) | | | | 1,005,000 | | 1,088,757 |
| Western Minnesota Muni. Pwr. Agcy. Pwr. Supply Rev. | | | | | | |
| Series A: | | | | | | |
| 5% 1/1/30 (MBIA Insured) | | | | 3,000,000 | | 3,125,610 |
| 5.4% 1/1/09 (AMBAC Insured) | | | | 4,325,000 | | 4,420,193 |
| 5.5% 1/1/11 (AMBAC Insured) | | | | 1,000,000 | | 1,022,100 |
| 5.5% 1/1/12 (AMBAC Insured) | | | | 1,000,000 | | 1,022,100 |
| 6.375% 1/1/16 (Escrowed to Maturity) (b) | | | | 1,415,000 | | 1,581,107 |
| Willmar Independent School District #347 Series A, 5% | | | | | | |
| 2/1/11 (MBIA Insured) | | | | 2,000,000 | | 2,140,180 |
| | | | | | | 323,403,233 |
| |
| Puerto Rico 4.3% | | | | | | |
| Puerto Rico Commonwealth Hwy. & Trans. Auth. Hwy. Rev. | | | | | | |
| Series Y, 5.5% 7/1/36 (FSA Insured) | | | | 2,680,000 | | 2,982,733 |
| Puerto Rico Commonwealth Hwy. & Trans. Auth. Trans. Rev. | | | | | | |
| Series D, 5.25% 7/1/38 (Pre-Refunded to 7/1/12 @ | | | | | | |
| 100) (b) | | | | 2,500,000 | | 2,721,725 |
| Puerto Rico Commonwealth Infrastructure Fing. Auth. | | | | | | |
| Series 2000 A: | | | | | | |
| 5.5% 10/1/32 (Escrowed to Maturity) (b) | | | | 3,495,000 | | 3,794,137 |
See accompanying notes which are an integral part of the financial statements.
15 Annual Report
| Investments continued | | | | | | |
| |
| |
| Municipal Bonds continued | | | | | | |
| | | | | Principal | | Value |
| | | | | Amount | | (Note 1) |
| Puerto Rico continued | | | | | | |
| Puerto Rico Commonwealth Infrastructure Fing. Auth. | | | | | | |
| Series 2000 A: – continued | | | | | | |
| 5.5% 10/1/40 (Escrowed to Maturity) (b) | | | $ | 1,250,000 | | $ 1,348,488 |
| Puerto Rico Elec. Pwr. Auth. Pwr. Rev. Series HH, 5.25% | | | | | | |
| 7/1/29 (FSA Insured) | | | | 3,700,000 | | 3,964,994 |
| | | | | | | 14,812,077 |
| |
| |
| TOTAL INVESTMENT PORTFOLIO 98.7% | | | | | | |
| (Cost $326,645,280) | | | | | | 338,608,715 |
| |
| NET OTHER ASSETS – 1.3% | | | | | | 4,407,531 |
| NET ASSETS 100% | | | | | | $ 343,016,246 |
Legend
(a) Private activity obligations whose
interest is subject to the federal
alternative minimum tax for individuals.
(b) Security collateralized by an amount
sufficient to pay interest and principal.
|
Other Information
The distribution of municipal securities by revenue source, as a percentage of total net assets, is as follows:
| General Obligations | | 38.7% |
| Health Care | | 15.2% |
| Electric Utilities | | 14.9% |
| Escrowed/Pre Refunded | | 14.7% |
| Transportation | | 7.0% |
| Others* (individually less than 5%) | | 9.5% |
| | | 100.0% |
| *Includes net other assets | | |
See accompanying notes which are an integral part of the financial statements.
Annual Report 16
| Financial Statements | | | | | | | | |
| |
| |
| Statement of Assets and Liabilities | | | | | | | | |
| | | | | | | December 31, 2005 |
| |
| Assets | | | | | | | | |
| Investment in securities, at value See accompanying | | | | | | | | |
| schedule: | | | | | | | | |
| Unaffiliated issuers (cost $326,645,280) | | | | | | $ | | 338,608,715 |
| Cash | | | | | | | | 2,573,431 |
| Receivable for fund shares sold | | | | | | | | 81,716 |
| Interest receivable | | | | | | | | 5,522,817 |
| Prepaid expenses | | | | | | | | 1,731 |
| Other receivables | | | | | | | | 5,764 |
| Total assets | | | | | | | | 346,794,174 |
| |
| Liabilities | | | | | | | | |
| Payable for investments purchased | | $ | | 2,673,719 | | | | |
| Payable for fund shares redeemed | | | | 592,670 | | | | |
| Distributions payable | | | | 326,123 | | | | |
| Accrued management fee | | | | 106,867 | | | | |
| Other affiliated payables | | | | 31,388 | | | | |
| Other payables and accrued expenses | | | | 47,161 | | | | |
| Total liabilities | | | | | | | | 3,777,928 |
| |
| Net Assets | | | | | | $ | | 343,016,246 |
| Net Assets consist of: | | | | | | | | |
| Paid in capital | | | | | | $ | | 331,070,800 |
| Undistributed net investment income | | | | | | | | 81,719 |
| Accumulated undistributed net realized gain (loss) on | | | | | | | | |
| investments | | | | | | | | (99,708) |
| Net unrealized appreciation (depreciation) on | | | | | | | | |
| investments | | | | | | | | 11,963,435 |
| Net Assets, for 30,046,601 shares outstanding | | | | | | $ | | 343,016,246 |
| Net Asset Value, offering price and redemption price per | | | | | | |
| share ($343,016,246 ÷ 30,046,601 shares) | | | | | | $ | | 11.42 |
See accompanying notes which are an integral part of the financial statements.
17 Annual Report
| Financial Statements continued | | | | |
| |
| |
| Statement of Operations | | | | | | |
| | | | | Year ended December 31, 2005 |
| |
| Investment Income | | | | | | |
| Interest | | | | $ | | 15,811,440 |
| |
| Expenses | | | | | | |
| Management fee | | $ | | 1,320,924 | | |
| Transfer agent fees | | | | 282,354 | | |
| Accounting fees and expenses | | | | 88,439 | | |
| Independent trustees’ compensation | | | | 1,624 | | |
| Custodian fees and expenses | | | | 5,861 | | |
| Registration fees | | | | 25,953 | | |
| Audit | | | | 47,240 | | |
| Legal | | | | 7,853 | | |
| Miscellaneous | | | | 10,156 | | |
| Total expenses before reductions | | | | 1,790,404 | | |
| Expense reductions | | | | (86,107) | | 1,704,297 |
| |
| Net investment income | | | | | | 14,107,143 |
| Realized and Unrealized Gain (Loss) | | | | |
| Net realized gain (loss) on: | | | | | | |
| Investment securities: | | | | | | |
| Unaffiliated issuers | | | | | | 1,314,751 |
| Change in net unrealized appreciation (depreciation) on | | | | |
| investment securities | | | | | | (6,375,155) |
| Net gain (loss) | | | | | | (5,060,404) |
| Net increase (decrease) in net assets resulting from | | | | |
| operations | | | | $ | | 9,046,739 |
See accompanying notes which are an integral part of the financial statements.
| Statement of Changes in Net Assets | | | | | | | | |
| | | | | Year ended | | | | Year ended |
| | | | | December 31, | | | | December 31, |
| | | | | 2005 | | | | 2004 |
| Increase (Decrease) in Net Assets | | | | | | | | |
| Operations | | | | | | | | |
| Net investment income | | $ | | 14,107,143 | | $ | | 13,743,859 |
| Net realized gain (loss) | | | | 1,314,751 | | | | 902,606 |
| Change in net unrealized appreciation (depreciation) . | | | | (6,375,155) | | | | (1,632,305) |
| Net increase (decrease) in net assets resulting | | | | | | | | |
| from operations | | | | 9,046,739 | | | | 13,014,160 |
| Distributions to shareholders from net investment income . | | | | (14,107,348) | | | | (13,769,100) |
| Distributions to shareholders from net realized gain | | | | (1,151,446) | | | | (1,709,461) |
| Total distributions | | | | (15,258,794) | | | | (15,478,561) |
| Share transactions | | | | | | | | |
| Proceeds from sales of shares | | | | 47,316,112 | | | | 59,618,414 |
| Reinvestment of distributions | | | | 10,864,679 | | | | 11,248,140 |
| Cost of shares redeemed | | | | (64,418,207) | | | | (56,824,374) |
| Net increase (decrease) in net assets resulting from | | | | | | | | |
| share transactions | | | | (6,237,416) | | | | 14,042,180 |
| Redemption fees | | | | 4,497 | | | | 3,041 |
| Total increase (decrease) in net assets | | | | (12,444,974) | | | | 11,580,820 |
| |
| Net Assets | | | | | | | | |
| Beginning of period | | | | 355,461,220 | | | | 343,880,400 |
| End of period (including undistributed net investment | | | | | | | | |
| income of $81,719 and undistributed net investment | | | | | | | | |
| income of $93,606, respectively) | | $ | | 343,016,246 | | $ | | 355,461,220 |
| |
| Other Information | | | | | | | | |
| Shares | | | | | | | | |
| Sold | | | | 4,095,080 | | | | 5,142,342 |
| Issued in reinvestment of distributions | | | | 942,835 | | | | 970,372 |
| Redeemed | | | | (5,592,973) | | | | (4,926,194) |
| Net increase (decrease) | | | | (555,058) | | | | 1,186,520 |
See accompanying notes which are an integral part of the financial statements.
19 Annual Report
| Financial Highlights | | | | | | | | | | |
| |
| Years ended December 31, | | 2005 | | 2004 | | 2003 | | 2002 | | 2001 |
| Selected Per Share Data | | | | | | | | | | |
| Net asset value, | | | | | | | | | | |
| beginning of period | | $ 11.62 | | $ 11.69 | | $ 11.62 | | $ 11.19 | | $ 11.20 |
| Income from Investment | | | | | | | | | | |
| Operations | | | | | | | | | | |
| Net investment incomeB | | 460 | | .458 | | .467 | | .509 | | .529D |
| Net realized and unrealized | | | | | | | | | | |
| gain (loss) | | (.162) | | (.012) | | .133 | | .431 | | (.016)D |
| Total from investment operations | | .298 | | .446 | | .600 | | .940 | | .513 |
| Distributions from net investment | | | | | | | | | | |
| income | | (.460) | | (.459) | | (.464) | | (.510) | | (.523) |
| Distributions from net realized | | | | | | | | | | |
| gain | | (.038) | | (.057) | | (.066) | | — | | — |
| Total distributions | | (.498) | | (.516) | | (.530) | | (.510) | | (.523) |
| Redemption fees added to | | | | | | | | | | |
| paid in capitalB,E | | — | | — | | — | | — | | — |
| Net asset value, end of period | | $ 11.42 | | $ 11.62 | | $ 11.69 | | $ 11.62 | | $ 11.19 |
| Total ReturnA | | 2.61% | | 3.92% | | 5.27% | | 8.57% | | 4.64% |
| Ratios to Average Net AssetsC | | | | | | | | | | |
| Expenses before reductions | | 51% | | .51% | | .51% | | .51% | | .51% |
| Expenses net of fee waivers, | | | | | | | | | | |
| if any | | 51% | | .51% | | .51% | | .51% | | .51% |
| Expenses net of all reductions | | 48% | | .49% | | .49% | | .49% | | .46% |
| Net investment income | | 3.99% | | 3.95% | | 4.00% | | 4.45% | | 4.69%D |
| Supplemental Data | | | | | | | | | | |
| Net assets, end of period | | | | | | | | | | |
| (000 omitted) | | $343,016 | | $355,461 | | $343,880 | | $344,435 | | $316,371 |
| Portfolio turnover rate | | 15% | | 12% | | 15% | | 25% | | 7% |
A Total returns would have been lower had certain expenses not been reduced during the periods shown.
B Calculated based on average shares outstanding during the period.
C Expense ratios reflect operating expenses of the fund. Expenses before reductions do not reflect amounts reimbursed by the investment adviser or
expense offset arrangements and do not represent the amount paid by the fund during periods when reimbursements or reductions occur.
Expenses net of fee waivers reflect expenses after reimbursement by the investment adviser but prior to reductions from expense offset arrange
ments. Expenses net of all reductions represent the net expenses paid by the fund.
D Effective January 1, 2001, the fund adopted the provisions of the AICPA Audit and Accounting Guide for Investment Companies and began
amortizing premium and discount on all debt securities. Per share data and ratios for periods prior to adoption have not been restated to reflect
this change.
E Amount represents less than $.001 per share.
|
See accompanying notes which are an integral part of the financial statements.
Notes to Financial Statements
For the period ended December 31, 2005
|
1. Significant Accounting Policies.
Fidelity Minnesota Municipal Income Fund (the fund) is a non diversified fund of Fidelity Municipal Trust (the trust) and is authorized to issue an unlimited number of shares. On July 21, 2005, the Board of Trustees approved a change in the name of Spartan Minnesota Municipal Income Fund to Fidelity Minnesota Municipal Income Fund effective August 15, 2005. The trust is registered under the Investment Company Act of 1940, as amended (the 1940 Act), as an open end management investment company organized as a Massachusetts business trust. The fund may be affected by economic and political developments in the state of Minnesota. The financial statements have been prepared in conformity with accounting principles generally accepted in the United States of America, which require management to make certain estimates and assumptions at the date of the financial statements. The following summarizes the significant accounting policies of the fund:
Security Valuation. Investments are valued and net asset value per share is calculated (NAV calculation) as of the close of business of the New York Stock Exchange, normally 4:00 p.m. Eastern time. Wherever possible, the fund uses independent pricing services approved by the Board of Trustees to value its investments. Debt securities, including restricted securities, for which quotes are readily available, are valued by independent pricing services or by dealers who make markets in such securities. Pricing services consider yield or price of bonds of comparable quality, coupon, maturity and type as well as dealer supplied prices. When current market prices or quotations are not readily available or do not accurately reflect fair value, valuations may be determined in accordance with procedures adopted by the Board of Trustees. The frequency of when fair value pricing is used is unpredictable. The value of securities used for NAV calculation under fair value pricing may differ from published prices for the same securities. Investments in open end mutual funds are valued at their closing net asset value each business day. Short term securities with remaining maturities of sixty days or less for which quotations are not readily available are valued at amortized cost, which approximates value.
Investment Transactions and Income. Security transactions are accounted for as of trade date. Gains and losses on securities sold are determined on the basis of identified cost. Interest income is accrued as earned. Interest income includes coupon interest and amortization of premium and accretion of discount on debt securities.
Expenses. Most expenses of the trust can be directly attributed to a fund. Expenses which cannot be directly attributed are apportioned among each fund in the trust.
Income Tax Information and Distributions to Shareholders. Each year, the fund intends to qualify as a regulated investment company by distributing all of its taxable income and realized gains under Subchapter M of the Internal Revenue Code. As a result, no provision for income taxes is required in the accompanying financial statements.
21 Annual Report
| Notes to Financial Statements continued | | |
1. Significant Accounting Policies continued | | |
Income Tax Information and Distributions to Shareholders continued |
Dividends are declared daily and paid monthly from net investment income. Distribu tions from realized gains, if any, are recorded on the ex dividend date. Income and capital gain distributions are determined in accordance with income tax regulations, which may differ from generally accepted accounting principles. In addition, the fund will claim a portion of the payment made to redeeming shareholders as a distribution for income tax purposes.
Capital accounts within the financial statements are adjusted for permanent book tax differences. These adjustments have no impact on net assets or the results of operations. Temporary book tax differences will reverse in a subsequent period.
Book tax differences are primarily due to market discount, deferred trustees compensa tion and losses deferred due to futures transactions.
The fund purchases municipal securities whose interest, in the opinion of the issuer, is free from federal income tax. There is no assurance that the Internal Revenue Service (IRS) will agree with this opinion. In the event the IRS determines that the issuer does not comply with relevant tax requirements, interest payments from a security could become federally taxable, possibly retroactively to the date the security was issued.
The tax basis components of distributable earnings and the federal tax cost as of period end were as follows:
| Unrealized appreciation | | | | | | $ | | 12,640,517 |
| Unrealized depreciation | | | | | | | | (792,763) |
| Net unrealized appreciation (depreciation) | | | | | | | | 11,847,754 |
| Undistributed long term capital gain | | | | | | | | 11,818 |
| |
| Cost for federal income tax purposes | | | | | | $ | | 326,760,961 |
| |
| The tax character of distributions paid was as follows: | | | | |
| |
| | | | | December 31, 2005 | | | | December 31, 2004 |
| Tax exempt Income | | $ | | 14,107,348 | | $ | | 13,769,100 |
| Long term Capital Gains | | | | 1,151,446 | | | | 1,709,461 |
| Total | | $ | | 15,258,794 | | $ | | 15,478,561 |
Short Term Trading (Redemption) Fees. Shares held in the fund less than 30 days are subject to a redemption fee equal to .50% of the proceeds of the redeemed shares. All redemption fees, including any estimated redemption fees paid by Fidelity Management & Research Company (FMR), are retained by the fund and accounted for as an addition to paid in capital.
2. Purchases and Sales of Investments.
Purchases and sales of securities, other than short term securities and U.S. government securities, aggregated $53,338,975 and $60,538,366, respectively.
3. Fees and Other Transactions with Affiliates.
Management Fee. FMR and its affiliates provide the fund with investment management related services for which the fund pays a monthly management fee. The management fee is the sum of an individual fund fee rate that is based on an annual rate of .25% of the fund’s average net assets and a group fee rate that averaged .12% during the period. The group fee rate is based upon the average net assets of all the mutual funds advised by FMR. The group fee rate decreases as assets under management increase and increases as assets under management decrease. For the period, the total annual management fee rate was .37% of the fund’s average net assets.
Transfer Agent and Accounting Fees. Citibank, N.A. (Citibank) is the custodian, transfer agent and shareholder servicing agent for the fund. Citibank has entered into a sub arrangement with Fidelity Service Company, Inc. (FSC), an affiliate of FMR, under which FSC performs the activities associated with the fund’s transfer and shareholder servicing agent and accounting functions. The fund pays account fees and asset based fees that vary according to account size and type of account. FSC pays for typesetting, printing and mailing of shareholder reports, except proxy statements. The accounting fee is based on the level of average net assets for the month. For the period, the transfer agent fees were equivalent to an annual rate of .08% of average net assets.
4. Committed Line of Credit.
|
The fund participates with other funds managed by FMR in a $4.2 billion credit facility (the “line of credit”) to be utilized for temporary or emergency purposes to fund share holder redemptions or for other short term liquidity purposes. The fund has agreed to pay commitment fees on its pro rata portion of the line of credit. During the period, there were no borrowings on this line of credit.
Through arrangements with the fund’s custodian and transfer agent, credits realized as a result of uninvested cash balances were used to reduce the fund’s expenses. During the period, these credits reduced the fund’s custody and transfer agent expenses by $5,861 and $80,246, respectively.
23 Annual Report
| Notes to Financial Statements continued |
6. Other. | | |
The fund’s organizational documents provide former and current trustees and officers with a limited indemnification against liabilities arising in connection with the perfor mance of their duties to the fund. In the normal course of business, the fund may also enter into contracts that provide general indemnifications. The fund’s maximum exposure under these arrangements is unknown as this would be dependent on future claims that may be made against the fund. The risk of material loss from such claims is considered remote.
Report of Independent Registered Public Accounting Firm
To the Trustees of Fidelity Municipal Trust and the Shareholders of Fidelity Minnesota Municipal Income Fund (formerly Spartan Minnesota Municipal Income Fund):
In our opinion, the accompanying statement of assets and liabilities, including the sched ule of investments, and the related statements of operations and of changes in net assets and the financial highlights present fairly, in all material respects, the financial position of Fidelity Minnesota Municipal Income Fund (formerly Spartan Minnesota Municipal Income Fund) (a fund of Fidelity Municipal Trust) at December 31, 2005 and the results of its operations, the changes in its net assets and the financial highlights for the periods indicated, in conformity with accounting principles generally accepted in the United States of America. These financial statements and financial highlights (hereafter referred to as “financial statements”) are the responsibility of the Fidelity Minnesota Municipal Income Fund’s management; our responsibility is to express an opinion on these financial statements based on our audits. We conducted our audits of these financial statements in accordance with the standards of the Public Company Accounting Oversight Board (United States). Those standards require that we plan and perform the audit to obtain reasonable assurance about whether the financial statements are free of material mis statement. An audit includes examining, on a test basis, evidence supporting the amounts and disclosures in the financial statements, assessing the accounting principles used and significant estimates made by management, and evaluating the overall financial statement presentation. We believe that our audits, which included confirmation of securities at December 31, 2005 by correspondence with the custodian and brokers, provide a reason able basis for our opinion.
/s/ PricewaterhouseCoopers LLP
PricewaterhouseCoopers LLP
Boston, Massachusetts
February 9, 2006
|
25 Annual Report
Trustees and Officers
The Trustees, Member of the Advisory Board, and executive officers of the trust and fund, as applicable, are listed below. The Board of Trustees governs the fund and is responsible for protecting the interests of shareholders. The Trustees are experienced executives who meet periodically throughout the year to oversee the fund’s activities, review contractual arrangements with companies that provide services to the fund, and review the fund’s performance. Except for William O. McCoy and Albert R. Gamper, Jr., each of the Trustees oversees 326 funds advised by FMR or an affiliate. Mr. McCoy oversees 328 funds advised by FMR or an affiliate. Mr. Gamper oversees 235 funds advised by FMR or an affiliate.
The Trustees hold office without limit in time except that (a) any Trustee may resign; (b) any Trustee may be removed by written instrument, signed by at least two thirds of the number of Trustees prior to such removal; (c) any Trustee who requests to be retired or who has become incapacitated by illness or injury may be retired by written instru ment signed by a majority of the other Trustees; and (d) any Trustee may be removed at any special meeting of shareholders by a two thirds vote of the outstanding voting securities of the trust. Each Trustee who is not an interested person (as defined in the 1940 Act) (Independent Trustee), shall retire not later than the last day of the calendar year in which his or her 72nd birthday occurs. The Independent Trustees may waive this mandatory retirement age policy with respect to individual Trustees. The executive officers and Advisory Board Member hold office without limit in time, except that any officer and Advisory Board Member may resign or may be removed by a vote of a majority of the Trustees at any regular meeting or any special meeting of the Trustees. Except as indicated, each individual has held the office shown or other offices in the same company for the past five years.
The fund’s Statement of Additional Information (SAI) includes more information about the Trustees. To request a free copy, call Fidelity at 1-800-544-8544.
Correspondence intended for each Trustee who is an interested person may be sent to Fidelity Investments, 82 Devonshire Street, Boston, Massachusetts 02109.
| | Name, Age; Principal Occupation
Edward C. Johnson 3d (75)
|
Year of Election or Appointment: 1984
Mr. Johnson is Chairman of the Board of Trustees. Mr. Johnson serves as Chief Executive Officer, Chairman, and a Director of FMR Corp.; a Director and Chairman of the Board and of the Executive Committee of FMR; Chairman and a Director of Fidelity Management & Research (Far East) Inc.; Chairman and a Director of Fidelity Investments Money Management, Inc.; and Chairman (2001 present) and a Director (2000 present) of FMR Co., Inc.
| | Name, Age; Principal Occupation
Stephen P. Jonas (52)
|
Year of Election or Appointment: 2005
Mr. Jonas is Senior Vice President of Minnesota Municipal Income (2005 present). He also serves as Senior Vice President of other Fidelity funds (2005 present). Mr. Jonas is Executive Director of FMR
(2005 present). Previously, Mr. Jonas served as President of Fidelity Enterprise Operations and Risk Services (2004 2005), Chief Adminis trative Officer (2002 2004), and Chief Financial Officer of FMR Co. (1998 2000). Mr. Jonas has been with Fidelity Investments since 1987 and has held various financial and management positions including Chief Financial Officer of FMR. In addition, he serves on the Boards of Boston Ballet (2003 present) and Simmons College (2003 present).
Year of Election or Appointment: 2003
Mr. Reynolds is a Director (2003 present) and Chief Operating Officer (2002 present) of FMR Corp. He also serves on the Board at Fidelity Investments Canada, Ltd. (2000 present). Previously, Mr. Reynolds served as President of Fidelity Investments Institutional Retirement Group (1996 2000).
* Trustees have been determined to be “Interested Trustees” by virtue of, among other things, their affiliation with the trust or various entities under common control with FMR.
27 Annual Report
Trustees and Officers - continued
Independent Trustees:
Correspondence intended for each Independent Trustee (that is, the Trustees other than the Interested Trustees) may be sent to Fidelity Investments, P.O. Box 55235, Boston, Massachusetts 02205 5235.
| | Name, Age; Principal Occupation
Dennis J. Dirks (57)
|
Year of Election or Appointment: 2005
Prior to his retirement in May 2003, Mr. Dirks was Chief Operating Officer and a member of the Board of The Depository Trust & Clearing Corporation (DTCC) (1999 2003). He also served as President, Chief Operating Officer, and Board member of The Depository Trust Company (DTC) (1999 2003) and President and Board member of the National Securities Clearing Corporation (NSCC) (1999 2003). In addition, Mr. Dirks served as Chief Executive Officer and Board member of the Government Securities Clearing Corporation (2001 2003) and Chief Executive Officer and Board member of the Mortgage Backed Securities Clearing Corporation (2001 2003). Mr. Dirks also serves as a Trustee of Manhattan College (2005 present).
| | Albert R. Gamper, Jr. (63)
|
Year of Election or Appointment: 2006
Mr. Gamper also serves as a Trustee (2006 present) or Member of the Advisory Board (2005 present) of other investment companies advised by FMR. Prior to his retirement in December 2004, Mr. Gamper served as Chairman of the Board of CIT Group Inc. (commercial finance). During his tenure with CIT Group Inc. Mr. Gamper served in numerous senior management positions, including Chairman (1987 1989; 1999 2001; 2002 2004), Chief Executive Officer (1987 2004), and President (1989 2002). He currently serves as a member of the Board of Directors of Public Service Enterprise Group (utilities, 2001 present), Chairman of the Board of Governors, Rutgers University (2004 present), and Chairman of the Board of Saint Barnabas Health Care System.
Name, Age; Principal Occupation
Robert M. Gates (62)
|
Year of Election or Appointment: 1997
Dr. Gates is Chairman of the Independent Trustees (2006 present). Dr. Gates is President of Texas A&M University (2002 present). He was Director of the Central Intelligence Agency (CIA) from 1991 to 1993. From 1989 to 1991, Dr. Gates served as Assistant to the President of the United States and Deputy National Security Advisor. Dr. Gates is a Director of NACCO Industries, Inc. (mining and manufacturing), Parker Drilling Co., Inc. (drilling and rental tools for the energy industry, 2001 present), and Brinker International (restaurant management, 2003 present). Previously, Dr. Gates served as a Director of LucasVarity PLC (automotive components and diesel engines), a Director of TRW Inc. (automotive, space, defense, and information technology), and Dean of the George Bush School of Government and Public Service at Texas A&M University (1999 2001). Dr. Gates also is a Trustee of the Forum for International Policy.
Year of Election or Appointment: 2004
Dr. Heilmeier is Chairman Emeritus of Telcordia Technologies (commu nication software and systems), where prior to his retirement, he served as company Chairman and Chief Executive Officer. He currently serves on the Boards of Directors of The Mitre Corporation (systems engineer ing and information technology support for the government), and HRL Laboratories (private research and development, 2004 present). He is Chairman of the General Motors Science & Technology Advisory Board and a Life Fellow of the Institute of Electrical and Electronics Engineers (IEEE) (2000 present). Dr. Heilmeier is a member of the Defense Science Board and the National Security Agency Advisory Board. He is also a member of the National Academy of Engineering, the American Academy of Arts and Sciences, and the Board of Overseers of the School of Engineering and Applied Science of the University of Pennsylvania. Previously, Dr. Heilmeier served as a Director of TRW Inc. (automotive, space, defense, and information technology, 1992 2002), Compaq (1994 2002), Automatic Data Processing, Inc. (ADP) (technology based business outsourcing, 1995 2002), INET Technologies Inc. (telecommu nications network surveillance, 2001 2004), and Teletech Holdings (customer management services). He is the recipient of the 2005 Kyoto Prize in Advanced Technology for his invention of the liquid display.
29 Annual Report
Trustees and Officers - continued
| | Name, Age; Principal Occupation
Marie L. Knowles (59)
|
Year of Election or Appointment: 2001
Prior to Ms. Knowles’ retirement in June 2000, she served as Executive Vice President and Chief Financial Officer of Atlantic Richfield Company (ARCO) (diversified energy, 1996 2000). From 1993 to 1996, she was a Senior Vice President of ARCO and President of ARCO Transportation Company. She served as a Director of ARCO from 1996 to 1998. She currently serves as a Director of Phelps Dodge Corporation (copper mining and manufacturing) and McKesson Corporation (healthcare ser vice, 2002 present). Ms. Knowles is a Trustee of the Brookings Institution and the Catalina Island Conservancy and also serves as a member of the Advisory Board for the School of Engineering of the University of Southern California.
Year of Election or Appointment: 2000
Mr. Lautenbach has been a partner of Clayton, Dubilier & Rice, Inc. (private equity investment firm) since September 1998. Previously, Mr. Lautenbach was with the International Business Machines Corpora tion (IBM) from 1968 until his retirement in 1998. Mr. Lautenbach serves as a Director of Italtel Holding S.p.A. (telecommunications (Milan, Italy), 2004 present) and Eaton Corporation (diversified industrial) as well as the Philharmonic Center for the Arts in Naples, Florida. He also is a member of the Board of Trustees of Fairfield University (2005 present), as well as a member of the Council on Foreign Relations.
Year of Election or Appointment: 1997
Prior to his retirement in December 1994, Mr. McCoy was Vice Chair man of the Board of BellSouth Corporation (telecommunications) and President of BellSouth Enterprises. He is currently a Director of Liberty Corporation (holding company), Duke Realty Corporation (real estate), and Progress Energy, Inc. (electric utility). He is also a partner of Frank lin Street Partners (private investment management firm) and a member of the Research Triangle Foundation Board. In addition, Mr. McCoy served as the Interim Chancellor (1999 2000) and a member of the Board of Visitors for the University of North Carolina at Chapel Hill and currently serves on the Board of Directors of the University of North Carolina Health Care System and the Board of Visitors of the Kenan Flagler Business School (University of North Carolina at Chapel Hill). He also served as Vice President of Finance for the University of North Carolina (16 school system).
Name, Age; Principal Occupation
Cornelia M. Small (61)
|
Year of Election or Appointment: 2005
Ms. Small is a member (2000 present) and Chairperson (2002 present) of the Investment Committee, and a member (2002 present) of the Board of Trustees of Smith College. Previously, she served as Chief Investment Officer (1999 2000), Director of Global Equity Investments (1996 1999), and a member of the Board of Directors of Scudder, Stevens & Clark (1990 1997) and Scudder Kemper Investments (1997 1998). In addition, Ms. Small served as Co Chair (2000 2003) of the Annual Fund for the Fletcher School of Law and Diplomacy.
William S. Stavropoulos (66)
|
Year of Election or Appointment: 2002
Mr. Stavropoulos is Chairman of the Board (2000 present) and a Member of the Board of Directors of The Dow Chemical Company. Since joining The Dow Chemical Company in 1967, Mr. Stavropoulos served in numerous senior management positions, including President (1993 2000; 2002 2003), CEO (1995 2000; 2002 2004), and Chair man of the Executive Committee (2000 2004). Currently, he is a Direc tor of NCR Corporation (data warehousing and technology solutions), BellSouth Corporation (telecommunications), Chemical Financial Corpo ration, Maersk Inc. (industrial conglomerate, 2002 present), and Metal mark Capital (private equity investment firm, 2005 present). He also serves as a member of the Board of Trustees of the American Enterprise Institute for Public Policy Research. In addition, Mr. Stavropoulos is a member of The Business Council, J.P. Morgan International Council and the University of Notre Dame Advisory Council for the College of Science.
Year of Election or Appointment: 2005
Prior to his retirement in 2001, Mr. Wolfe was Chairman and Chief Executive Officer of Hershey Foods Corporation (1993 2001). He currently serves as a member of the boards of Adelphia Communications Corporation (2003 present), Bausch & Lomb, Inc., and Revlon Inc. (2004 present).
31 Annual Report
Trustees and Officers - continued
Advisory Board Member and Executive Officers:
Correspondence intended for each executive officer and Mr. Lynch may be sent to Fidelity Investments, 82 Devonshire Street, Boston, Massachusetts 02109.
| | Name, Age; Principal Occupation
Peter S. Lynch (61)
|
Year of Election or Appointment: 2003
Member of the Advisory Board of Fidelity Municipal Trust. Vice Chair man and a Director of FMR, and Vice Chairman (2001 present) and a Director (2000 present) of FMR Co., Inc. Previously, Mr. Lynch served as a Trustee of the Fidelity funds (1990 2003). In addition, he serves as a Trustee of Boston College, Massachusetts Eye & Ear Infirmary, Historic Deerfield, John F. Kennedy Library, and the Museum of Fine Arts of Boston.
Year of Election or Appointment: 2005
Vice President of Minnesota Municipal Income. Mr. Donovan also serves as Vice President of Fidelity’s High Income Funds (2005 present), Fidelity’s Fixed Income Funds (2005 present), certain Asset Allocation Funds (2005 present), and certain Balanced Funds (2005 present). Mr. Donovan also serves as Executive Vice President of FMR
(2005 present) and FMRC (2005 present). Previously, Mr. Donovan served as Vice President and Director of Fidelity’s International Equity Trading group (1998 2005).
Year of Election or Appointment: 2005
Vice President of Minnesota Municipal Income. Mr. Murphy also serves as Vice President of Fidelity’s Money Market Funds (2002 present), certain Asset Allocation Funds (2003 present), Fidelity’s Investment Grade Bond Funds (2005 present), and Fidelity’s Balanced Funds (2005 present). He serves as Senior Vice President (2000 present) and Head (2004 present) of the Fidelity Investments Fixed Income Division. Mr. Murphy is also a Senior Vice President of FIMM (2003 present) and a Vice President of FMR (2000 present). Previously, Mr. Murphy served as Money Market Group Leader (2002 2004), Bond Group Leader (2000 2002), and Vice President of Fidelity’s Taxable Bond Funds (2000 2002) and Fidelity’s Municipal Bond Funds (2001 2002). Mr. Murphy joined Fidelity Investments in 1989 as a portfolio manager in the Bond Group.
Name, Age; Principal Occupation
Thomas J. Silvia (44)
|
Year of Election or Appointment: 2005
Vice President of Minnesota Municipal Income. Mr. Silvia also serves as Vice President of Fidelity’s Bond Funds (2005 present) and Senior Vice President and Bond Group Leader of the Fidelity Investments Fixed Income Division (2005 present). Previously, Mr. Silvia served as Director of Fidelity’s Taxable Bond portfolio managers (2002 2004) and a portfolio manager in the Bond Group (1997 2004).
Year of Election or Appointment: 1998
Vice President of Minnesota Municipal Income. Ms. Thompson is also Vice President of other funds advised by FMR. Prior to assuming her current responsibilities, Ms. Thompson worked as an analyst and manager.
Year of Election or Appointment: 1998
Secretary of Minnesota Municipal Income. He also serves as Secretary of other Fidelity funds; Vice President, General Counsel, and Secretary of FMR Co., Inc. (2001 present) and FMR; Assistant Secretary of Fidelity Management & Research (U.K.) Inc. (2001 present), Fidelity Manage ment & Research (Far East) Inc. (2001 present), and Fidelity Investments Money Management, Inc. (2001 present). Mr. Roiter is an Adjunct Member, Faculty of Law, at Boston College Law School (2003 present). Previously, Mr. Roiter served as Vice President and Secretary of Fidelity Distributors Corporation (FDC) (1998 2005).
Year of Election or Appointment: 2003
Assistant Secretary of Minnesota Municipal Income. Mr. Fross also serves as Assistant Secretary of other Fidelity funds (2003 present), Vice President and Secretary of FDC (2005 present), and is an employee of FMR.
Year of Election or Appointment: 2004
President, Treasurer, and Anti Money Laundering (AML) officer of Minnesota Municipal Income. Ms. Reynolds also serves as President, Treasurer, and AML officer of other Fidelity funds (2004) and is a Vice President (2003) and an employee (2002) of FMR. Before joining Fidelity Investments, Ms. Reynolds worked at PricewaterhouseCoopers LLP (PwC) (1980 2002), where she was most recently an audit partner with PwC’s investment management practice.
33 Annual Report
Trustees and Officers - continued
| | Name, Age; Principal Occupation
Paul M. Murphy (58)
|
Year of Election or Appointment: 2005
Chief Financial Officer of Minnesota Municipal Income. Mr. Murphy also serves as Chief Financial Officer of other Fidelity funds (2005 present). He also serves as Senior Vice President of Fidelity Pricing and Cash Management Services Group (FPCMS).
| | Kenneth A. Rathgeber (58)
|
Year of Election or Appointment: 2004
Chief Compliance Officer of Minnesota Municipal Income. Mr. Rathgeber also serves as Chief Compliance Officer of other Fidelity funds (2004) and Executive Vice President of Risk Oversight for Fidelity Investments (2002). Previously, he served as Executive Vice President and Chief Operating Officer for Fidelity Investments Institutional Services Company, Inc. (1998 2002).
Year of Election or Appointment: 2003
Deputy Treasurer of Minnesota Municipal Income. Mr. Hebble also serves as Deputy Treasurer of other Fidelity funds (2003), and is an employee of FMR. Before joining Fidelity Investments, Mr. Hebble worked at Deutsche Asset Management where he served as Director of Fund Accounting (2002 2003) and Assistant Treasurer of the Scudder Funds (1998 2003).
Year of Election or Appointment: 2005
Deputy Treasurer of Minnesota Municipal Income. Mr. Mehrmann also serves as Deputy Treasurer of other Fidelity funds (2005 present) and is an employee of FMR. Previously, Mr. Mehrmann served as Vice Presi dent of Fidelity Investments Institutional Services Group (FIIS)/Fidelity Investments Institutional Operations Corporation, Inc. (FIIOC) Client Services (1998 2004).
| | Kimberley H. Monasterio (42)
|
Year of Election or Appointment: 2004
Deputy Treasurer of Minnesota Municipal Income. Ms. Monasterio also serves as Deputy Treasurer of other Fidelity funds (2004) and is an employee of FMR (2004). Before joining Fidelity Investments, Ms. Monasterio served as Treasurer (2000 2004) and Chief Financial Officer (2002 2004) of the Franklin Templeton Funds and Senior Vice President of Franklin Templeton Services, LLC (2000 2004).
Name, Age; Principal Occupation
Kenneth B. Robins (36)
|
Year of Election or Appointment: 2005
Deputy Treasurer of Minnesota Municipal Income. Mr. Robins also serves as Deputy Treasurer of other Fidelity funds (2005 present) and is an employee of FMR (2004 present). Before joining Fidelity Investments, Mr. Robins worked at KPMG LLP, where he was a partner in KPMG’s department of professional practice (2002 2004) and a Senior Man ager (1999 2000). In addition, Mr. Robins served as Assistant Chief Accountant, United States Securities and Exchange Commission (2000 2002).
Year of Election or Appointment: 2005
Assistant Treasurer of Minnesota Municipal Income. Mr. Byrnes also serves as Assistant Treasurer of other Fidelity funds (2005 present) and is an employee of FMR (2005 present). Previously, Mr. Byrnes served as Vice President of FPCMS (2003 2005). Before joining Fidelity Invest ments, Mr. Byrnes worked at Deutsche Asset Management where he served as Vice President of the Investment Operations Group (2000 2003).
Year of Election or Appointment: 1986
Assistant Treasurer of Minnesota Municipal Income. Mr. Costello also serves as Assistant Treasurer of other Fidelity funds and is an employee of FMR.
Year of Election or Appointment: 2004
Assistant Treasurer of Minnesota Municipal Income. Mr. Lydecker also serves as Assistant Treasurer of other Fidelity funds (2004) and is an employee of FMR.
Year of Election or Appointment: 2002
Assistant Treasurer of Minnesota Municipal Income. Mr. Osterheld also serves as Assistant Treasurer of other Fidelity funds (2002) and is an employee of FMR.
Year of Election or Appointment: 2005
Assistant Treasurer of Minnesota Municipal Income. Mr. Ryan also serves as Assistant Treasurer of other Fidelity funds (2005 present) and is an employee of FMR (2005 present). Previously, Mr. Ryan served as Vice President of Fund Reporting in FPCMS (1999 2005).
35 Annual Report
Trustees and Officers - continued
| | Name, Age; Principal Occupation
Salvatore Schiavone (40)
|
Year of Election or Appointment: 2005
Assistant Treasurer of Minnesota Municipal Income. Mr. Schiavone also serves as Assistant Treasurer of other Fidelity funds (2005 present) and is an employee of FMR (2005 present). Before joining Fidelity Investments, Mr. Schiavone worked at Deutsche Asset Management, where he most recently served as Assistant Treasurer (2003 2005) of the Scudder Funds and Vice President and Head of Fund Reporting (1996 2003).
The fund hereby designates as a capital gain dividend with respect to the taxable year ended December 31, 2005, $1,165,931, or, if subsequently determined to be different, the net capital gain of such year.
During fiscal year ended 2005, 100% of the fund’s income dividends was free from federal income tax, and 3.52% of the fund’s income dividends was subject to the federal alternative minimum tax.
The fund will notify shareholders in January 2006 of amounts for use in preparing 2005 income tax returns.
37 Annual Report
Proxy Voting Results
A special meeting of the fund’s shareholders was held on January 18, 2006. The results of votes taken among shareholders on the proposal before them are reported below. Each vote reported represents one dollar of net asset value held on the record date for the meeting.
| PROPOSAL 1 | | | | |
| To elect a Board of Trustees.A | | |
| | | # of | | % of |
| | | Votes | | Votes |
| |
| Dennis J. Dirks | | | | |
| Affirmative | | 4,012,578,790.76 | | 95.238 |
| Withheld | | 200,653,306.55 | | 4.762 |
| TOTAL | | 4,213,232,097.31 | | 100.000 |
| Albert R. Gamper, Jr. | | |
| Affirmative | | 4,015,643,707.84 | | 95.310 |
| Withheld | | 197,588,389.47 | | 4.690 |
| TOTAL | | 4,213,232,097.31 | | 100.000 |
| Robert M. Gates | | |
| Affirmative | | 4,004,345,809.00 | | 95.042 |
| Withheld | | 208,886,288.31 | | 4.958 |
| TOTAL | | 4,213,232,097.31 | | 100.000 |
| George H. Heilmeier | | |
| Affirmative | | 4,008,127,523.93 | | 95.132 |
| Withheld | | 205,104,573.38 | | 4.868 |
| TOTAL | | 4,213,232,097.31 | | 100.000 |
| Abigail P. Johnson | | |
| Affirmative | | 3,993,175,527.66 | | 94.777 |
| Withheld | | 220,056,569.65 | | 5.223 |
| TOTAL | | 4,213,232,097.31 | | 100.000 |
| Edward C. Johnson 3d | | |
| Affirmative | | 3,987,333,615.26 | | 94.638 |
| Withheld | | 225,898,482.05 | | 5.362 |
| TOTAL | | 4,213,232,097.31 | | 100.000 |
| Stephen P. Jonas | | |
| Affirmative | | 4,010,007,680.52 | | 95.177 |
| Withheld | | 203,224,416.79 | | 4.823 |
| TOTAL | | 4,213,232,097.31 | | 100.000 |
| | | # of | | % of |
| | | Votes | | Votes |
| |
| Marie L. Knowles | | |
| Affirmative | | 4,010,231,303.96 | | 95.182 |
| Withheld | | 203,000,793.35 | | 4.818 |
| TOTAL | | 4,213,232,097.31 | | 100.000 |
| |
| Ned C. Lautenbach | | |
| Affirmative | | 4,009,136,177.44 | | 95.156 |
| Withheld | | 204,095,919.87 | | 4.844 |
| TOTAL | | 4,213,232,097.31 | | 100.000 |
| |
| William O. McCoy | | |
| Affirmative | | 4,001,996,735.35 | | 94.986 |
| Withheld | | 211,235,361.96 | | 5.014 |
| TOTAL | | 4,213,232,097.31 | | 100.000 |
| |
| Robert L. Reynolds | | |
| Affirmative | | 4,010,560,206.65 | | 95.190 |
| Withheld | | 202,671,890.66 | | 4.810 |
| TOTAL | | 4,213,232,097.31 | | 100.000 |
| |
| Cornelia M. Small | | |
| Affirmative | | 4,011,161,760.21 | | 95.204 |
| Withheld | | 202,070,337.10 | | 4.796 |
| TOTAL | | 4,213,232,097.31 | | 100.000 |
| |
| William S. Stavropoulos | | |
| Affirmative | | 4,001,217,912.57 | | 94.968 |
| Withheld | | 212,014,184.74 | | 5.032 |
| TOTAL | | 4,213,232,097.31 | | 100.000 |
| |
| Kenneth L. Wolfe | | |
| Affirmative | | 4,011,439,868.05 | | 95.211 |
| Withheld | | 201,792,229.26 | | 4.789 |
| TOTAL | | 4,213,232,097.31 | | 100.000 |
A Denotes trust-wide proposal and voting results.
Annual Report 38
Managing Your Investments
Fidelity offers several ways to conveniently manage your personal investments via your telephone or PC. You can access your account information, conduct trades and research your investments 24 hours a day.
By Phone
Fidelity Automated Service Telephone provides a single toll free number to access account balances, positions, quotes and trading. It’s easy to navigate the service, and on your first call, the system will help you create a personal identification number (PIN) for security.


By PC
Fidelity’s web site on the Internet provides a wide range of information, including daily financial news, fund performance, interactive planning tools and news about Fidelity products and services.

* When you call the quotes line, please remember that a fund’s yield and return will vary and, except for money market funds, share price will also vary. This means that you may have a gain or loss when you sell your shares. There is no assurance that money market funds will be able to maintain a stable $1 share price; an investment in a money market fund is not insured or guar anteed by the U.S. government. Total returns are historical and include changes in share price, reinvestment of dividends and capital gains, and the effects of any sales charges.
39 Annual Report
Investment Adviser
Fidelity Management & Research Company
Boston, MA
Investment Sub Adviser
Fidelity Investments Money
Management Inc.
Fidelity International
Investment Advisors
Fidelity International
Investment Advisors (U.K.) Limited
General Distributor
Fidelity Distributors Corporation
Boston, MA
Transfer and Service Agents
Citibank, N.A.
New York, NY
Fidelity Service Company, Inc.
Boston, MA
Custodian
Citibank, N.A.
New York, NY
|
| The Fidelity Telephone Connection |
| Mutual Fund 24-Hour Service |
| Exchanges/Redemptions | | |
| and Account Assistance | | 1-800-544-6666 |
| Product Information | | 1-800-544-6666 |
| Retirement Accounts | | 1-800-544-4774 |
| (8 a.m. - 9 p.m.) | | |
| TDD Service | | 1-800-544-0118 |
| for the deaf and hearing impaired |
| (9 a.m. - 9 p.m. Eastern time) |
| Fidelity Automated Service | | |
| Telephone (FAST®) (automated phone logo) | | 1-800-544-5555 |
| (automated phone logo) Automated line for quickest service |
MNF UANN-0206
1.787738.102
|

| | Fidelity®
Municipal Income
Fund
(formerly Spartan® Municipal Income Fund)
|
| | Annual Report
December 31, 2005
|


| Contents | | | | |
| |
| Chairman’s Message | | 4 | | Ned Johnson’s message to shareholders. |
| Performance | | 5 | | How the fund has done over time. |
| Management’s Discussion | | 6 | | The manager’s review of fund |
| | | | | performance, strategy and outlook. |
| Shareholder Expense | | 7 | | An example of shareholder expenses. |
| Example | | | | |
| Investment Changes | | 9 | | A summary of major shifts in the fund’s |
| | | | | investments over the past six months. |
| Investments | | 10 | | A complete list of the fund’s investments |
| | | | | with their market values. |
| Financial Statements | | 51 | | Statements of assets and liabilities, |
| | | | | operations, and changes in net assets, |
| | | | | as well as financial highlights. |
| Notes | | 55 | | Notes to the financial statements. |
| Report of Independent | | 59 | | |
| Registered Public | | | | |
| Accounting Firm | | | | |
| Trustees and Officers | | 60 | | |
| Distributions | | 71 | | |
| Proxy Voting Results | | 72 | | |
To view a fund’s proxy voting guidelines and proxy voting record for the 12 month period ended
June 30, visit www.fidelity.com/proxyvotingresults or visit the Securities and Exchange Commis
sion’s (SEC) web site at www.sec.gov. You may also call 1-800-544-8544 to request a free copy of
the proxy voting guidelines.
Standard & Poor’s, S&P and S&P 500 are registered service marks of The McGraw Hill Companies, Inc.
and have been licensed for use by Fidelity Distributors Corporation.
Other third party marks appearing herein are the property of their respective owners.
All other marks appearing herein are registered or unregistered trademarks or service marks
of FMR Corp. or an affiliated company.
|
This report and the financial statements contained herein are submitted for the general information
of the shareholders of the fund. This report is not authorized for distribution to prospective investors
in the fund unless preceded or accompanied by an effective prospectus.
A fund files its complete schedule of portfolio holdings with the SEC for the first and third
quarters of each fiscal year on Form N Q. Forms N Q are available on the SEC’s web site at
http://www.sec.gov. A fund’s Forms N Q may be reviewed and copied at the SEC’s Public Reference
Room in Washington, DC. Information regarding the operation of the SEC’s Public Reference
Room may be obtained by calling 1-800-SEC-0330. For a complete list of a fund’s portfolio
holdings, view the most recent quarterly holdings report, semiannual report, or annual report
on Fidelity’s web site at http://www.fidelity.com/holdings.
NOT FDIC INSURED · MAY LOSE VALUE · NO BANK GUARANTEE
Neither the fund nor Fidelity Distributors Corporation is a bank.
|
3 Annual Report
Chairman’s Message
(photograph of Edward C. Johnson 3d)
Dear Shareholder:
During the past year or so, much has been reported about the mutual fund industry, and much of it has been more critical than I believe is warranted. Allegations that some companies have been less than forthright with their shareholders have cast a shadow on the entire industry. I continue to find these reports disturbing, and assert that they do not create an accurate picture of the industry overall. Therefore, I would like to remind every one where Fidelity stands on these issues. I will say two things specifically regarding allegations that some mutual fund companies were in violation of the Securities and Exchange Commission’s forward pricing rules or were involved in so called “market timing” activities.
First, Fidelity has no agreements that permit customers who buy fund shares after 4 p.m. to obtain the 4 p.m. price. This is not a new policy. This is not to say that some one could not deceive the company through fraudulent acts. However, we are extremely diligent in preventing fraud from occurring in this manner and in every other. But I underscore again that Fidelity has no so called “agreements” that sanction illegal practices.
Second, Fidelity continues to stand on record, as we have for years, in opposition to predatory short term trading that adversely affects shareholders in a mutual fund. Back in the 1980s, we initiated a fee which is returned to the fund and, therefore, to investors to discourage this activity. Further, we took the lead several years ago in developing a Fair Value Pricing Policy to prevent market timing on foreign securities in our funds. I am confident we will find other ways to make it more difficult for predatory traders to operate. However, this will only be achieved through close cooperation among regulators, legislators and the industry.
Yes, there have been unfortunate instances of unethical and illegal activity within the mutual fund industry from time to time. That is true of any industry. When this occurs, confessed or convicted offenders should be dealt with appropriately. But we are still concerned about the risk of over regulation and the quick application of simplistic solutions to intricate problems. Every system can be improved, and we support and applaud well thought out improvements by regulators, legislators and industry representatives that achieve the common goal of building and protecting the value of investors’ holdings.
For nearly 60 years, Fidelity has worked very hard to improve its products and service to justify your trust. When our family founded this company in 1946, we had only a few hundred customers. Today, we serve more than 18 million customers including individual investors and participants in retirement plans across America.
Let me close by saying that we do not take your trust in us for granted, and we realize that we must always work to improve all aspects of our service to you. In turn, we urge you to continue your active participation with your financial matters, so that your interests can be well served.
Best regards,
/s/ Edward C. Johnson 3d
Edward C. Johnson 3d
Annual Report 4
Performance: The Bottom Line
Average annual total return reflects the change in the value of an investment, assuming reinvestment of the fund’s dividend income and capital gains (the profits earned upon the sale of securities that have grown in value) and assuming a constant rate of perfor mance each year. The $10,000 table and the fund’s returns do not reflect the deduction of taxes that a shareholder would pay on fund distributions or the redemption of fund shares. During periods of reimbursement by Fidelity, a fund’s total return will be greater than it would be had the reimbursement not occurred. How a fund did yesterday is no guarantee of how it will do tomorrow.
| Average Annual Total Returns | | | | | | |
| Periods ended December 31, 2005 | | Past 1 | | Past 5 | | Past 10 |
| | | year | | years | | years |
| Fidelity® Municipal Income Fund | | 3.66% | | 5.91% | | 5.90% |
| |
| $10,000 Over 10 Years | | | | | | |
Let’s say, hypothetically, that $10,000 was invested in Fidelity® Municipal Income Fund on December 31, 1995. The chart shows how the value of your investment would have changed, and also shows how the Lehman Brothers® Municipal Bond Index performed over the same period.
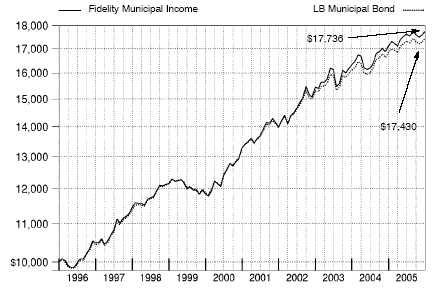
5 Annual Report
5
Management’s Discussion of Fund Performance
Comments from Christine Thompson, Portfolio Manager of Fidelity® Municipal Income Fund
For the third consecutive year, the municipal bond market outperformed taxable bonds. The Lehman Brothers® Municipal Bond Index rose 3.51% for the year ending December 31, 2005. The taxable bond market, as measured by the Lehman Brothers Aggregate Bond Index, advanced 2.43% . Muni bonds were attractively valued relative to Treasuries, particularly as tax free bond yields drew closer to those of high quality government bonds. Subsequently, the tax advantage of munis was compelling to such atypical investors in the asset class as hedge funds, corporations and taxable bond investors. The strong demand helped offset heavy issuance, particularly at the longer term end of the spectrum. The Federal Reserve Board raised short term interest rates eight times during the year, but long term rates remained persistently low, making the cost of borrowing more affordable for muni issuers. Still, absolute returns finished well below their historical averages. In addition to the rate hikes, surging energy prices pushed inflation higher, a condition further exacerbated by the damage to energy production facilities caused by Hurricane Katrina.
For the 12 months ending December 31, 2005, the fund returned 3.66% . During the same period, the LipperSM General Municipal Debt Funds Average was up 3.00% and the Lehman Brothers 3 Plus Year Municipal Bond Index gained 3.76% . I suspect that the fund’s outper formance of its peer group average was driven by its comparatively large stake in bonds that were prerefunded during the period. This process involves issuers refinancing outstanding debt by issuing new debt and using the proceeds to purchase U.S. government securities to back the refinanced bonds to a date prior to their maturity, typically the bonds’ first call date. As a result of that government backing, the bonds generally enjoy price increases. We also had generally favorable sector selection, particularly the fund’s emphasis on lower rated hospital and electric utility bonds. Security selection within those two sectors benefited returns as well. Detracting from performance was the fund’s under weighting relative to the index and likely its competitors — in tobacco bonds, which were far and away the muni market’s best performing sector during the period. Also hurting performance was my decision to concentrate holdings in high quality bonds, which trailed lower quality securities during the period.
The views expressed in this statement reflect those of the portfolio manager only through the end of the period of the report as stated on the cover and do not necessarily represent the views of Fidelity or any other person in the Fidelity organization. Any such views are subject to change at any time based upon market or other conditions and Fidelity disclaims any responsibility to update such views. These views may not be relied on as investment advice and, because investment decisions for a Fidelity fund are based on numerous factors, may not be relied on as an indication of trading intent on behalf of any Fidelity fund.
Shareholder Expense Example
As a shareholder of the Fund, you incur two types of costs: (1) transaction costs, including redemption fees, and (2) ongoing costs, including management fees and other Fund expenses. This Example is intended to help you understand your ongoing costs (in dollars) of investing in the Fund and to compare these costs with the ongoing costs of investing in other mutual funds.
The Example is based on an investment of $1,000 invested at the beginning of the period and held for the entire period (July 1, 2005 to December 31, 2005).
The first line of the table below provides information about actual account values and actual expenses. You may use the information in this line, together with the amount you invested, to estimate the expenses that you paid over the period. Simply divide your account value by $1,000.00 (for example, an $8,600 account value divided by $1,000.00 = 8.6), then multiply the result by the number in the first line under the heading entitled “Expenses Paid During Period” to estimate the expenses you paid on your account during this period. A small balance maintenance fee of $12.00 that is charged once a year may apply for certain accounts with a value of less than $2,000. This fee is not included in the table below. If it was, the estimate of expenses you paid during the period would be higher, and your ending account value lower, by this amount.
Hypothetical Example for Comparison Purposes
The second line of the table below provides information about hypothetical account values and hypothetical expenses based on the Fund’s actual expense ratio and an assumed rate of return of 5% per year before expenses, which is not the Fund’s actual return. The hypothetical account values and expenses may not be used to estimate the actual ending account balance or expenses you paid for the period. You may use this information to compare the ongoing costs of investing in the Fund and other funds. To do so, compare this 5% hypothetical example with the 5% hypothetical examples that appear in the share holder reports of the other funds. A small balance maintenance fee of $12.00 that is charged once a year may apply for certain accounts with a value of less than $2,000. This fee is not included in the table below. If it was, the estimate of expenses you paid during the period would be higher, and your ending account value lower, by this amount.
Please note that the expenses shown in the table are meant to highlight your ongoing costs only and do not reflect any transaction costs. Therefore, the second line of the table is useful in comparing ongoing costs only, and will not help you determine the relative total costs of owning different funds. In addition, if these transactional costs were included, your costs would have been higher.
7 Annual Report
| Shareholder Expense Example continued | | |
| |
| |
| |
| | | | | | | | | | | Expenses Paid |
| | | | | | | | | | | During Period* |
| | | | | Beginning | | Ending | | July 1, 2005 |
| | | | | Account Value | | Account Value | | to December 31, |
| | | | | July 1, 2005 | | December 31, 2005 | | 2005 |
| Actual | | | $ | 1,000.00 | | $ | | 1,006.40 | | $ | | 2.38 |
| Hypothetical (5% return per year | | | | | | | | | | |
| before expenses) | | | $ | 1,000.00 | | $ | | 1,022.84 | | $ | | 2.40 |
* Expenses are equal to the Fund’s annualized expense ratio of .47%; multiplied by the average account value over the period, multiplied by 184/365 (to reflect the one half year period).
| Investment Changes | | | | |
| |
| Top Five States as of December 31, 2005 | | | | |
| | | % of fund’s | | % of fund’s net assets |
| | | net assets | | 6 months ago |
| Texas | | 13.7 | | 13.0 |
| Illinois | | 13.2 | | 14.3 |
| California | | 10.5 | | 10.1 |
| New York | | 10.0 | | 9.9 |
| Massachusetts | | 7.8 | | 6.5 |
Top Five Sectors as of December 31, 2005 | | |
| | | % of fund’s | | % of fund’s net assets |
| | | net assets | | 6 months ago |
| General Obligations | | 33.0 | | 33.3 |
| Electric Utilities | | 12.5 | | 14.7 |
| Escrowed/Pre Refunded | | 11.1 | | 10.2 |
| Water & Sewer | | 9.9 | | 10.5 |
| Transportation | | 9.9 | | 9.0 |
Average Years to Maturity as of December 31, 2005 | | |
| | | | | 6 months ago |
| Years | | 15.4 | | 15.8 |
Average years to maturity is based on the average time remaining to the stated maturity date of each bond, weighted by the market value of each bond.
| Duration as of December 31, 2005 | | | | |
| | | | | | | 6 months ago |
| Years | | | | 6.6 | | 6.8 |
Duration shows how much a bond fund’s price fluctuates with changes in comparable interest rates. If rates rise 1%, for example, a fund with a five year duration is likely to lose about 5% of its value. Other factors also can influence a bond fund’s performance and share price. Accordingly, a bond fund’s actual performance may differ from this example.
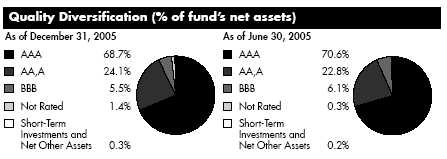
We have used ratings from Moody’s® Investors Services, Inc. Where Moody’s ratings are not available, we have used S&P® ratings.
9 Annual Report
Investments December 31, 2005
Showing Percentage of Net Assets
Municipal Bonds 99.7%
| | | Principal | | Value (Note 1) |
| | | Amount (000s) | | (000s) |
| Alabama – 0.2% | | | | | | | | |
| Alabama Pub. School & College Auth. Rev. Series 1999 C, | | | | | | | | |
| 5.75% 7/1/18 | | $ | | 2,000 | | $ | | 2,171 |
| Birmingham Baptist Med. Ctrs. Spl. Care Facilities Fing. Auth. | | | | | | | | |
| Rev. (Baptist Health Sys., Inc. Proj.) Series A, 5% 11/15/09 | | | | 2,700 | | | | 2,799 |
| Birmingham Wtrwks. & Swr. Board Wtr. & Swr. Rev. Series B, | | | | | | | | |
| 5% 1/1/43 (MBIA Insured) | | | | 2,500 | | | | 2,553 |
| Jefferson County Ltd. Oblig. School Warrants Series A, 5.5% | | | | | | | | |
| 1/1/22 | | | | 2,900 | | | | 3,129 |
| Jefferson County Swr. Rev. Series 1997 D, 5.7% 2/1/18 | | | | | | �� | | |
| (Pre-Refunded to 2/1/07 @ 101) (g) | | | | 100 | | | | 104 |
| | | | | | | | | 10,756 |
| |
| Arizona – 1.3% | | | | | | | | |
| Arizona School Facilities Board Ctfs. of Prtn.: | | | | | | | | |
| Series B, 5.25% 9/1/19 (Pre-Refunded to 9/1/14 @ | | | | | | | | |
| 100) (g) | | | | 2,535 | | | | 2,812 |
| Series C: | | | | | | | | |
| 5% 9/1/14 (FSA Insured) | | | | 2,000 | | | | 2,166 |
| 5% 9/1/15 (FSA Insured) | | | | 1,815 | | | | 1,959 |
| Arizona Student Ln. Acquisition Auth. Student Ln. Rev. Sr. | | | | | | | | |
| Series A1, 5.9% 5/1/24 (f) | | | | 2,000 | | | | 2,122 |
| Chandler Indl. Dev. Auth. Indl. Dev. Rev. (Intel Corp. Proj.) | | | | | | | | |
| 4.375%, tender 12/1/10 (c)(f) | | | | 5,500 | | | | 5,630 |
| Maricopa County Hosp. Rev. (Sun Health Corp. Proj.) 5.65% | | | | | | | | |
| 4/1/06 | | | | 3,625 | | | | 3,641 |
| Maricopa County Indl. Dev. Auth. Hosp. Facilities Rev. | | | | | | | | |
| (Samaritan Health Svcs. Proj.) Series A, 7% 12/1/16 | | | | | | | | |
| (Escrowed to Maturity) (g) | | | | 2,000 | | | | 2,482 |
| Phoenix Civic Impt. Corp. Excise Tax Rev. (Civic Plaza | | | | | | | | |
| Expansion Proj.) Series A: | | | | | | | | |
| 5% 7/1/30 (FGIC Insured) | | | | 5,525 | | | | 5,802 |
| 5% 7/1/41 (FGIC Insured) | | | | 7,000 | | | | 7,306 |
| Phoenix Civic Impt. Corp. Wtr. Sys. Rev.: | | | | | | | | |
| 5% 7/1/20 (MBIA Insured) | | | | 5,000 | | | | 5,347 |
| 5% 7/1/29 (MBIA Insured) | | | | 2,000 | | | | 2,102 |
| Salt River Proj. Agric. Impt. & Pwr. District Elec. Sys. Rev. | | | | | | | | |
| Series 2005 A: | | | | | | | | |
| 4.75% 1/1/35 | | | | 2,000 | | | | 2,035 |
| 5% 1/1/35 | | | | 7,000 | | | | 7,348 |
| Scottsdale Indl. Dev. Auth. Hosp. Rev. (Scottsdale Health Care | | | | | | | | |
| Proj.) 5.8% 12/1/31 | | | | 3,250 | | | | 3,483 |
| Tucson Gen. Oblig. Series 2002, 5% 7/1/10 | | | | 2,645 | | | | 2,807 |
See accompanying notes which are an integral part of the financial statements.
| Municipal Bonds continued | | | | | | | | |
| | | Principal | | Value (Note 1) |
| | | Amount (000s) | | (000s) |
| Arizona – continued | | | | | | | | |
| Univ. of Arizona Univ. Revs. Series 2005 A: | | | | | | | | |
| 5% 6/1/18 (AMBAC Insured) | | $ | | 1,225 | | $ | | 1,317 |
| 5% 6/1/31 (AMBAC Insured) | | | | 2,000 | | | | 2,096 |
| | | | | | | | | 60,455 |
| |
| Arkansas – 0.2% | | | | | | | | |
| Little Rock School District Series 2001 C, 5.25% 2/1/33 | | | | | | | | |
| (FSA Insured) | | | | 6,500 | | | | 6,788 |
| North Little Rock Elec. Rev. Series A, 6.5% 7/1/10 | | | | | | | | |
| (MBIA Insured) | | | | 3,840 | | | | 4,113 |
| | | | | | | | | 10,901 |
| |
| California – 10.5% | | | | | | | | |
| ABC Unified School District 0% 8/1/28 (FGIC Insured) | | | | 3,925 | | | | 1,319 |
| Cabrillo Unified School District Series A, 0% 8/1/20 | | | | | | | | |
| (AMBAC Insured) | | | | 4,275 | | | | 2,210 |
| California Dept. of Wtr. Resources Pwr. Supply Rev.: | | | | | | | | |
| Series 2002 A, 5.125% 5/1/18 (Pre-Refunded to 5/1/12 @ | | | | | | | | |
| 101) (g) | | | | 7,500 | | | | 8,241 |
| Series A: | | | | | | | | |
| 5.5% 5/1/15 (AMBAC Insured) | | | | 8,800 | | | | 9,745 |
| 6% 5/1/14 (MBIA Insured) | | | | 3,500 | | | | 3,990 |
| California Econ. Recovery Series A, 5.25% 7/1/13 | | | | | | | | |
| (MBIA Insured) | | | | 7,600 | | | | 8,401 |
| California Edl. Facilities Auth. Rev. (Loyola Marymount Univ. | | | | | | | | |
| Proj.): | | | | | | | | |
| 0% 10/1/16 (MBIA Insured) | | | | 2,140 | | | | 1,351 |
| 0% 10/1/17 (MBIA Insured) | | | | 2,050 | | | | 1,227 |
| 0% 10/1/18 (MBIA Insured) | | | | 1,675 | | | | 954 |
| 0% 10/1/22 (MBIA Insured) | | | | 5,000 | | | | 2,313 |
| California Gen. Oblig.: | | | | | | | | |
| Series 1999, 5.75% 12/1/12 (FGIC Insured) | | | | 5,000 | | | | 5,495 |
| Series 2005, 5.75% 12/1/24 | | | | 1,360 | | | | 1,489 |
| 5% 2/1/11 | | | | 8,000 | | | | 8,500 |
| 5.125% 9/1/12 | | | | 2,000 | | | | 2,122 |
| 5.25% 2/1/11 | | | | 1,000 | | | | 1,074 |
| 5.25% 3/1/12 | | | | 2,300 | | | | 2,491 |
| 5.25% 3/1/13 | | | | 3,530 | | | | 3,857 |
| 5.25% 2/1/14 | | | | 7,600 | | | | 8,246 |
| 5.25% 2/1/15 | | | | 18,300 | | | | 19,893 |
| 5.25% 2/1/16 | | | | 4,300 | | | | 4,657 |
| 5.25% 2/1/19 | | | | 5,620 | | | | 6,033 |
See accompanying notes which are an integral part of the financial statements.
11 Annual Report
| Investments continued | | | | | | | | |
| |
| |
| Municipal Bonds continued | | | | | | | | |
| | | Principal | | Value (Note 1) |
| | | Amount (000s) | | (000s) |
| California – continued | | | | | | | | |
| California Gen. Oblig.: – continued | | | | | | | | |
| 5.25% 2/1/20 | | $ | | 2,000 | | $ | | 2,143 |
| 5.25% 2/1/24 | | | | 4,000 | | | | 4,262 |
| 5.25% 2/1/28 | | | | 8,500 | | | | 9,011 |
| 5.25% 11/1/28 | | | | 4,485 | | | | 4,762 |
| 5.25% 2/1/33 | | | | 2,000 | | | | 2,107 |
| 5.5% 2/1/12 | | | | 8,000 | | | | 8,763 |
| 5.5% 3/1/12 | | | | 2,000 | | | | 2,169 |
| 5.5% 4/1/30 | | | | 3,800 | | | | 4,149 |
| 5.5% 11/1/33 | | | | 27,300 | | | | 29,910 |
| 5.625% 5/1/20 | | | | 4,200 | | | | 4,558 |
| California Health Facilities Fing. Auth. Rev. (Cedars-Sinai Med. | | | | | | | | |
| Ctr. Proj.): | | | | | | | | |
| 5% 11/15/09 | | | | 2,000 | | | | 2,106 |
| 5% 11/15/13 | | | | 1,000 | | | | 1,070 |
| California Hsg. Fin. Agcy. Home Mtg. Rev.: | | | | | | | | |
| Series 1983 A, 0% 2/1/15 (MBIA Insured) | | | | 187 | | | | 90 |
| Series G, 5.9% 2/1/09 (MBIA Insured) (f) | | | | 690 | | | | 699 |
| California Poll. Cont. Fing. Auth. Ctfs. of Prtn. (Pacific Gas & | | | | | | | | |
| Elec. Co. Proj.) Series 2004 B, 3.5%, tender 6/1/07 | | | | | | | | |
| (FGIC Insured) (c)(f) | | | | 8,800 | | | | 8,806 |
| California Poll. Cont. Fing. Auth. Solid Waste Disp. Rev. (Waste | | | | | | | | |
| Mgmt., Inc. Proj.) Series A1, 4.7%, tender 4/1/12 (c)(f) | | | | 1,000 | | | | 1,015 |
| California Pub. Works Board Lease Rev.: | | | | | | | | |
| (Various California State Univ. Projs.) Series A, 5.25% | | | | | | | | |
| 12/1/13 | | | | 5,000 | | | | 5,006 |
| Series 2005 A, 5.25% 6/1/30 | | | | 14,000 | | | | 14,775 |
| Series 2005 H: | | | | | | | | |
| 5% 6/1/16 | | | | 6,000 | | | | 6,408 |
| 5% 6/1/17 | | | | 5,000 | | | | 5,320 |
| 5% 6/1/18 | | | | 10,300 | | | | 10,918 |
| Series 2005 J, 5% 1/1/17 | | | | 6,000 | | | | 6,403 |
| Series B: | | | | | | | | |
| 5.25% 11/1/24 (XL Cap. Assurance, Inc. Insured) | | | | 1,575 | | | | 1,710 |
| 5.25% 11/1/26 (XL Cap. Assurance, Inc. Insured) | | | | 2,860 | | | | 3,095 |
| California Statewide Cmntys. Dev. Auth. Rev.: | | | | | | | | |
| (Kaiser Fund Hosp./Health Place, Inc. Proj.) Series 2002 C, | | | | | | | | |
| 3.85%, tender 6/1/12 (c) | | | | 3,500 | | | | 3,472 |
| (Kaiser Permanente Health Sys. Proj.) Series 2004 G, 2.3%, | | | | | | | | |
| tender 5/1/07 (c) | | | | 4,000 | | | | 3,945 |
| Compton Cmnty. Redev. Agcy. (Tax Allocation-Compton Redev. | | | | | | | | |
| Proj.) Series A, 6.5% 8/1/13 (FSA Insured) | | | | 4,000 | | | | 4,091 |
See accompanying notes which are an integral part of the financial statements.
| Municipal Bonds continued | | | | | | | | |
| | | Principal | | Value (Note 1) |
| | | Amount (000s) | | (000s) |
| California – continued | | | | | | | | |
| Encinitas Union School District 0% 8/1/20 (MBIA Insured) | | $ | | 3,500 | | $ | | 1,809 |
| Foothill/Eastern Trans. Corridor Agcy. Toll Road Rev.: | | | | | | | | |
| Series A, 5% 1/1/35 (MBIA Insured) | | | | 5,070 | | | | 5,180 |
| 0% 1/15/27 (a) | | | | 2,500 | | | | 2,158 |
| 5% 1/15/16 (MBIA Insured) | | | | 2,800 | | | | 2,965 |
| 5.75% 1/15/40 | | | | 6,300 | | | | 6,402 |
| Golden State Tobacco Securitization Corp.: | | | | | | | | |
| Series 2003 A1: | | | | | | | | |
| 5% 6/1/21 | | | | 1,210 | | | | 1,221 |
| 6.75% 6/1/39 | | | | 8,800 | | | | 9,842 |
| Series 2003 B: | | | | | | | | |
| 5% 6/1/10 (Escrowed to Maturity) (g) | | | | 2,000 | | | | 2,124 |
| 5% 6/1/12 (Escrowed to Maturity) (g) | | | | 2,255 | | | | 2,421 |
| Series A: | | | | | | | | |
| 5% 6/1/35 (FGIC Insured) | | | | 5,000 | | | | 5,191 |
| 5% 6/1/45 | | | | 15,400 | | | | 15,495 |
| 5% 6/1/45 (FGIC Insured) | | | | 9,000 | | | | 9,266 |
| Los Angeles Cmnty. Redev. Agcy. Lease Rev. (Vermont | | | | | | | | |
| Manchester Social Services Proj.): | | | | | | | | |
| 5% 9/1/18 (AMBAC Insured) | | | | 1,000 | | | | 1,071 |
| 5% 9/1/19 (AMBAC Insured) | | | | 2,545 | | | | 2,716 |
| Los Angeles Dept. of Wtr. & Pwr. Wtrwks. Rev.: | | | | | | | | |
| Series 2001 A, 5.125% 7/1/41 | | | | 5,000 | | | | 5,150 |
| Series A, 5.125% 7/1/41 (MBIA Insured) | | | | 9,985 | | | | 10,359 |
| Los Angeles Unified School District: | | | | | | | | |
| Series A: | | | | | | | | |
| 5.375% 7/1/17 (MBIA Insured) | | | | 9,400 | | | | 10,389 |
| 5.375% 7/1/18 (MBIA Insured) | | | | 14,600 | | | | 16,086 |
| 5.5% 7/1/15 (MBIA Insured) | | | | 6,140 | | | | 6,908 |
| Series F, 5% 7/1/18 (FSA Insured) | | | | 10,000 | | | | 10,675 |
| Modesto Irrigation District Elec. Rev. Series A, 9.625% 1/1/11 | | | | | | | | |
| (Escrowed to Maturity) (g) | | | | 3,090 | | | | 3,564 |
| Mojave Wtr. Agcy. Impt. District M Gen. Oblig. (Morongo | | | | | | | | |
| Basin Pipeline Proj.) 5% 9/1/14 (AMBAC Insured) (b) | | | | 2,130 | | | | 2,270 |
| Monrovia Unified School District Series B, 0% 8/1/29 | | | | | | | | |
| (FGIC Insured) | | | | 4,525 | | | | 1,442 |
| North City West School Facilities Fing. Auth. Spl. Tax: | | | | | | | | |
| Series C, 5% 9/1/10 (AMBAC Insured) (b) | | | | 1,000 | | | | 1,049 |
| Subseries C: | | | | | | | | |
| 5% 9/1/13 (AMBAC Insured) (b) | | | | 2,250 | | | | 2,389 |
| 5% 9/1/19 (AMBAC Insured) (b) | | | | 3,015 | | | | 3,223 |
See accompanying notes which are an integral part of the financial statements.
13 Annual Report
| Investments continued | | | | | | | | |
| |
| |
| Municipal Bonds continued | | | | | | | | |
| | | Principal | | Value (Note 1) |
| | | Amount (000s) | | (000s) |
| California – continued | | | | | | | | |
| Placer County Wtr. Agcy. Rev. (Middle Fork Proj.) Series A, | | | | | | | | |
| 3.75% 7/1/12 | | $ | | 5,130 | | $ | | 5,181 |
| San Diego Unified School District (Election of 1998 Proj.) | | | | | | | | |
| Series E2: | | | | | | | | |
| 5.5% 7/1/25 (FSA Insured) | | | | 10,000 | | | | 11,689 |
| 5.5% 7/1/26 (FSA Insured) | | | | 6,700 | | | | 7,848 |
| San Francisco City & County Arpts. Commission Int’l. Arpt. | | | | | | | | |
| Rev.: | | | | | | | | |
| Second Series 10A, 5.55% 5/1/14 (MBIA Insured) (f) | | | | 5,875 | | | | 6,028 |
| Second Series 27A, 5.5% 5/1/09 (MBIA Insured) (f) | | | | 4,330 | | | | 4,577 |
| San Joaquin Hills Trans. Corridor Agcy. Toll Road Rev. | | | | | | | | |
| Series A: | | | | | | | | |
| 0% 1/15/12 (MBIA Insured) | | | | 9,900 | | | | 7,844 |
| 0% 1/15/34 (MBIA Insured) | | | | 10,000 | | | | 2,478 |
| 5.25% 1/15/30 (MBIA Insured) | | | | 3,600 | | | | 3,729 |
| San Mateo County Cmnty. College District Series A, 0% | | | | | | | | |
| 9/1/26 (FGIC Insured) | | | | 5,430 | | | | 2,034 |
| Torrance Ctfs. of Prtn. (Refing. & Pub. Impt. Proj.) Series B, | | | | | | | | |
| 5.25% 6/1/34 (AMBAC Insured) | | | | 4,475 | | | | 4,772 |
| Univ. of California Revs. (UCLA Med. Ctr. Proj.): | | | | | | | | |
| Series A: | | | | | | | | |
| 5.5% 5/15/15 (AMBAC Insured) | | | | 2,990 | | | | 3,311 |
| 5.5% 5/15/16 (AMBAC Insured) | | | | 3,155 | | | | 3,480 |
| 5.5% 5/15/17 (AMBAC Insured) | | | | 3,325 | | | | 3,668 |
| 5.5% 5/15/19 (AMBAC Insured) | | | | 3,700 | | | | 4,057 |
| 5.5% 5/15/22 (AMBAC Insured) | | | | 1,000 | | | | 1,093 |
| 5.5% 5/15/23 (AMBAC Insured) | | | | 1,025 | | | | 1,118 |
| Series B: | | | | | | | | |
| 5.5% 5/15/15 (AMBAC Insured) | | | | 5,105 | | | | 5,729 |
| 5.5% 5/15/16 (AMBAC Insured) | | | | 6,500 | | | | 7,260 |
| 5.5% 5/15/17 (AMBAC Insured) | | | | 6,860 | | | | 7,662 |
| Val Verde Unified School District Ctfs. of Prtn. Series B, 5% | | | | | | | | |
| 1/1/30 (FGIC Insured) | | | | 2,200 | | | | 2,292 |
| | | | | | | | | 491,586 |
| |
| Colorado – 1.9% | | | | | | | | |
| Colorado Ctfs. of Prtn. (UCDHSC Fitzsimons Academic Proj.) | | | | | | | | |
| Series B, 5% 11/1/17 (MBIA Insured) | | | | 2,475 | | | | 2,653 |
See accompanying notes which are an integral part of the financial statements.
| Municipal Bonds continued | | | | | | | | |
| | | Principal | | Value (Note 1) |
| | | Amount (000s) | | (000s) |
| Colorado – continued | | | | | | | | |
| Colorado Health Facilities Auth. Rev. Series 2001: | | | | | | | | |
| 6.5% 11/15/31 (Pre-Refunded to 11/15/11 @ 101) (g) | | $ | | 5,040 | | $ | | 5,847 |
| 6.625% 11/15/26 (Pre-Refunded to 11/15/11 @ 101) (g) | | | | 2,700 | | | | 3,150 |
| Colorado Springs Arpt. Rev. Series C: | | | | | | | | |
| 0% 1/1/09 (MBIA Insured) | | | | 1,655 | | | | 1,479 |
| 0% 1/1/10 (MBIA Insured) | | | | 1,500 | | | | 1,287 |
| Colorado Wtr. Resources and Pwr. Dev. Auth. Wtr. Resources | | | | | | | | |
| Rev. (Parker Wtr. and Sanitation District Proj.) Series D, | | | | | | | | |
| 5.25% 9/1/43 (MBIA Insured) | | | | 33,385 | | | | 35,482 |
| Dawson Ridge Metropolitan District # 1 Series 1992 A, 0% | | | | | | | | |
| 10/1/22 (Escrowed to Maturity) (g) | | | | 32,490 | | | | 14,815 |
| Denver Health & Hosp. Auth. Health Care Rev. Series A, 6.25% | | | | | | | | |
| 12/1/33 | | | | 2,000 | | | | 2,147 |
| Douglas and Elbert Counties School District #RE1: | | | | | | | | |
| 5.75% 12/15/20 (FGIC Insured) | | | | 1,500 | | | | 1,710 |
| 5.75% 12/15/22 (FGIC Insured) | | | | 1,000 | | | | 1,139 |
| E 470 Pub. Hwy. Auth. Rev.: | | | | | | | | |
| Series 2000 A, 5.75% 9/1/29 (MBIA Insured) | | | | 10,000 | | | | 11,028 |
| Series B, 0% 9/1/15 (MBIA Insured) | | | | 3,600 | | | | 2,378 |
| Longmont Sales & Use Tax Rev. 5.7% 11/15/18 (FGIC | | | | | | | | |
| Insured) | | | | 2,280 | | | | 2,491 |
| Northwest Pkwy Pub. Hwy. Auth. Sr. Series A: | | | | | | | | |
| 5.5% 6/15/15 (AMBAC Insured) | | | | 1,000 | | | | 1,095 |
| 5.5% 6/15/19 (AMBAC Insured) | | | | 1,000 | | | | 1,089 |
| | | | | | | | | 87,790 |
| |
| District Of Columbia – 1.2% | | | | | | | | |
| District of Columbia Gen. Oblig.: | | | | | | | | |
| Series 1998 A, 5.25% 6/1/27 (MBIA Insured) | | | | 17,330 | | | | 18,113 |
| Series B, 0% 6/1/12 (MBIA Insured) | | | | 8,800 | | | | 6,777 |
| District of Columbia Rev.: | | | | | | | | |
| (George Washington Univ. Proj.) Series A, 5.75% 9/15/20 | | | | | | | | |
| (MBIA Insured) | | | | 12,600 | | | | 13,671 |
| (Georgetown Univ. Proj.) Series A: | | | | | | | | |
| 5.95% 4/1/14 (MBIA Insured) | | | | 2,000 | | | | 2,139 |
| 6% 4/1/18 (MBIA Insured) | | | | 13,835 | | | | 14,810 |
| | | | | | | | | 55,510 |
| |
| Florida – 1.9% | | | | | | | | |
| Boynton Beach Util. Sys. Rev. 5.5% 11/1/19 (FGIC Insured) | | | | 3,300 | | | | 3,810 |
See accompanying notes which are an integral part of the financial statements.
15 Annual Report
| Investments continued | | | | | | | | |
| |
| |
| Municipal Bonds continued | | | | | | | | |
| | | Principal | | Value (Note 1) |
| | | Amount (000s) | | (000s) |
| Florida – continued | | | | | | | | |
| Florida Board of Ed. Cap. Outlay Series B, 5.5% 6/1/15 | | | | | | | | |
| (FGIC Insured) | | $ | | 3,655 | | $ | | 4,038 |
| Highlands County Health Facilities Auth. Rev. (Adventist Health | | | | | | | | |
| Sys./Sunbelt Obligated Group Proj.): | | | | | | | | |
| Series A, 5% 11/15/17 | | | | 1,200 | | | | 1,258 |
| 3.95%, tender 9/1/12 (c) | | | | 9,300 | | | | 9,257 |
| 5%, tender 11/16/09 (c) | | | | 12,500 | | | | 13,034 |
| 5.25% 11/15/12 | | | | 3,935 | | | | 4,105 |
| 5.25% 11/15/13 | | | | 3,140 | | | | 3,267 |
| Jacksonville Elec. Auth. Rev.: | | | | | | | | |
| (Saint Johns River Proj.) Series 13 Issue 2, 5.375% 10/1/16 | | | | | | | | |
| (MBIA Insured) | | | | 4,535 | | | | 4,600 |
| (Third Installment Proj.) Series 73, 6.8% 7/1/12 (Escrowed | | | | | | | | |
| to Maturity) (g) | | | | 2,210 | | | | 2,441 |
| Jacksonville Port Auth. Rev.: | | | | | | | | |
| 5.5% 11/1/06 (MBIA Insured) (f) | | | | 1,460 | | | | 1,486 |
| 5.75% 11/1/09 (MBIA Insured) (f) | | | | 1,000 | | | | 1,037 |
| Miami-Dade County Aviation Rev. (Miami Int’l. Arpt. Proj.) | | | | | | | | |
| Series A, 5% 10/1/37 (XL Cap. Assurance, Inc. Insured) (f) . | | | | 5,750 | | | | 5,852 |
| Miami-Dade County Edl. Facilities Auth. Rev. 5.75% 4/1/29 | | | | | | | | |
| (AMBAC Insured) | | | | 5,000 | | | | 5,441 |
| Miami-Dade County School Board Ctfs. of Prtn. 5%, tender | | | | | | | | |
| 5/1/11 (MBIA Insured) (c) | | | | 3,600 | | | | 3,835 |
| Orange County Health Facilities Auth. Rev. (Adventist Health | | | | | | | | |
| Sys./Sunbelt Obligated Group Proj.) 5.625% 11/15/32 | | | | 2,000 | | | | 2,134 |
| Pasco County Solid Waste Disp. & Resource Recovery Sys. | | | | | | | | |
| Rev.: | | | | | | | | |
| 6% 4/1/08 (AMBAC Insured) (f) | | | | 5,000 | | | | 5,228 |
| 6% 4/1/09 (AMBAC Insured) (f) | | | | 8,090 | | | | 8,609 |
| Seminole County School Board Ctfs. of Prtn. Series A: | | | | | | | | |
| 5% 7/1/16 (MBIA Insured) | | | | 1,645 | | | | 1,781 |
| 5% 7/1/20 (MBIA Insured) | | | | 1,745 | | | | 1,848 |
| South Broward Hosp. District Rev. 5.625% 5/1/32 | | | | | | | | |
| (MBIA Insured) | | | | 2,630 | | | | 2,890 |
| Tampa Wtr. & Swr. Rev. 6% 10/1/17 (FSA Insured) | | | | 1,000 | | | | 1,189 |
| Univ. of Central Florida Athletics Assoc., Inc. Ctfs. of Prtn. | | | | | | | | |
| Series A, 5% 10/1/35 (FGIC Insured) | | | | 1,000 | | | | 1,035 |
| | | | | | | | | 88,175 |
See accompanying notes which are an integral part of the financial statements.
| Municipal Bonds continued | | | | | | | | |
| | | Principal | | Value (Note 1) |
| | | Amount (000s) | | (000s) |
| Georgia – 3.2% | | | | | | | | |
| Atlanta & Fulton County Resource Auth. Rev. (Downtown Area | | | | | | | | |
| Pub. Impt. Proj.) Series A, 5.375% 12/1/21 (MBIA Insured) | | $ | | 6,000 | | $ | | 6,288 |
| Atlanta Wtr. & Wastewtr. Rev.: | | | | | | | | |
| 5% 11/1/37 (FSA Insured) | | | | 38,795 | | | | 40,249 |
| 5% 11/1/43 (FSA Insured) | | | | 74,700 | | | | 76,729 |
| Augusta Wtr. & Swr. Rev. 5.25% 10/1/39 (FSA Insured) | | | | 12,100 | | | | 12,929 |
| College Park Bus. & Indl. Dev. Auth. Civic Ctr. Proj. Rev. | | | | | | | | |
| Series 2000, 5.75% 9/1/20 (Pre-Refunded to 9/1/10 @ | | | | | | | | |
| 102) (g) | | | | 5,800 | | | | 6,476 |
| Fulton County Wtr. & Swr. Rev. 6.375% 1/1/14 (FGIC Insured) | | | | 140 | | | | 159 |
| Gainesville & Hall County Hosp. Auth. Rev. Anticipation Ctfs. | | | | | | | | |
| (Northeast Georgia Health Sys., Inc. Proj.) 5.5% 5/15/31 | | | | 4,500 | | | | 4,669 |
| Richmond County Dev. Auth. Rev.: | | | | | | | | |
| (Southern Care Corp. Facility Proj.) Series A, 0% 12/1/21 | | | | | | | | |
| (Escrowed to Maturity) (g) | | | | 5,590 | | | | 2,675 |
| Series C, 0% 12/1/21 (Escrowed to Maturity) (g) | | | | 2,200 | | | | 1,053 |
| | | | | | | | | 151,227 |
| |
| Hawaii – 0.4% | | | | | | | | |
| Hawaii Arpts. Sys. Rev.: | | | | | | | | |
| Series 2000 A, 5.75% 7/1/21 (FGIC Insured) | | | | 2,640 | | | | 2,877 |
| Series 2000 B, 8% 7/1/11 (FGIC Insured) (f) | | | | 9,250 | | | | 11,027 |
| Hawaii Gen. Oblig. Series CU, 5.75% 10/1/12 | | | | | | | | |
| (MBIA Insured) | | | | 2,130 | | | | 2,333 |
| Honolulu City and County Wastewtr. Sys. Sr. Series 2001 5.5% | | | | | | | | |
| 7/1/18 (AMBAC Insured) | | | | 1,090 | | | | 1,179 |
| | | | | | | | | 17,416 |
| |
| Illinois – 13.2% | | | | | | | | |
| Chicago Board of Ed.: | | | | | | | | |
| (Westinghouse High School Proj.) Series C: | | | | | | | | |
| 5.25% 12/1/19 (MBIA Insured) | | | | 1,000 | | | | 1,095 |
| 5.25% 12/1/20 (MBIA Insured) | | | | 4,500 | | | | 4,952 |
| 5.5% 12/1/23 (MBIA Insured) | | | | 1,000 | | | | 1,110 |
| Series A: | | | | | | | | |
| 0% 12/1/16 (FGIC Insured) | | | | 3,200 | | | | 1,995 |
| 5.5% 12/1/27 (AMBAC Insured) | | | | 4,000 | | | | 4,658 |
| Chicago Gen. Oblig.: | | | | | | | | |
| (City Colleges Proj.): | | | | | | | | |
| 0% 1/1/14 (FGIC Insured) | | | | 17,000 | | | | 12,244 |
See accompanying notes which are an integral part of the financial statements.
17 Annual Report
| Investments continued | | | | | | | | |
| |
| |
| Municipal Bonds continued | | | | | | | | |
| | | Principal | | Value (Note 1) |
| | | Amount (000s) | | (000s) |
| Illinois – continued | | | | | | | | |
| Chicago Gen. Oblig.: – continued | | | | | | | | |
| (City Colleges Proj.): | | | | | | | | |
| 0% 1/1/15 (FGIC Insured) | | $ | | 20,000 | | $ | | 13,680 |
| 0% 1/1/26 (FGIC Insured) | | | | 16,000 | | | | 6,322 |
| 0% 1/1/30 (FGIC Insured) | | | | 18,670 | | | | 5,928 |
| (Neighborhoods Alive 21 Prog.) 5% 1/1/28 | | | | | | | | |
| (AMBAC Insured) | | | | 2,000 | | | | 2,080 |
| Series 2000 D, 5.5% 1/1/35 (FGIC Insured) | | | | 15,000 | | | | 16,047 |
| Series A: | | | | | | | | |
| 5% 1/1/41 (Pre-Refunded to 1/1/15 @ 100) (g) | | | | 1,300 | | | | 1,385 |
| 5% 1/1/42 (AMBAC Insured) | | | | 18,955 | | | | 19,451 |
| 5.25% 1/1/22 (MBIA Insured) | | | | 2,085 | | | | 2,231 |
| 5.25% 1/1/33 (MBIA Insured) | | | | 8,300 | | | | 8,686 |
| 5.5% 1/1/38 (MBIA Insured) | | | | 21,290 | | | | 22,866 |
| 5.5% 1/1/38 (Pre-Refunded to 1/1/11 @ 101) (g) | | | | 210 | | | | 231 |
| Series C, 5.7% 1/1/30 (FGIC Insured) | | | | 5,760 | | | | 6,281 |
| 5.5% 1/1/40 (FGIC Insured) | | | | 5,515 | | | | 5,898 |
| Chicago Midway Arpt. Rev.: | | | | | | | | |
| Series A, 5.5% 1/1/29 (MBIA Insured) | | | | 24,825 | | | | 25,511 |
| Series B: | | | | | | | | |
| 5.25% 1/1/13 (MBIA Insured) (f) | | | | 2,910 | | | | 2,979 |
| 5.25% 1/1/14 (MBIA Insured) (f) | | | | 3,060 | | | | 3,132 |
| 6% 1/1/08 (MBIA Insured) (f) | | | | 2,170 | | | | 2,244 |
| 6% 1/1/10 (MBIA Insured) (f) | | | | 2,435 | | | | 2,512 |
| 6.125% 1/1/11 (MBIA Insured) (f) | | | | 2,580 | | | | 2,664 |
| Chicago Motor Fuel Tax Rev. Series A, 5.25% 1/1/19 | | | | | | | | |
| (AMBAC Insured) | | | | 1,780 | | | | 1,920 |
| Chicago O’Hare Int’l. Arpt. Rev.: | | | | | | | | |
| Series 1999, 5.5% 1/1/11 (AMBAC Insured) (f) | | | | 10,000 | | | | 10,706 |
| Series A: | | | | | | | | |
| 5.5% 1/1/16 (AMBAC Insured) (f) | | | | 10,770 | | | | 11,167 |
| 5.5% 1/1/16 (Pre-Refunded to 1/1/07 @ 102) (f)(g) | | | | 1,230 | | | | 1,279 |
| 5.6% 1/1/10 (AMBAC Insured) | | | | 4,500 | | | | 4,600 |
| 6.25% 1/1/09 (AMBAC Insured) (f) | | | | 6,040 | | | | 6,319 |
| Series B: | | | | | | | | |
| 5.25% 1/1/14 (FGIC Insured) | | | | 2,000 | | | | 2,188 |
| 5.75% 1/1/30 (AMBAC Insured) | | | | 13,420 | | | | 14,627 |
| Chicago Park District: | | | | | | | | |
| Series 2001 A: | | | | | | | | |
| 5.5% 1/1/19 (FGIC Insured) | | | | 3,100 | | | | 3,340 |
| 5.5% 1/1/20 (FGIC Insured) | | | | 3,200 | | | | 3,444 |
See accompanying notes which are an integral part of the financial statements.
| Municipal Bonds continued | | | | | | | | |
| | | Principal | | Value (Note 1) |
| | | Amount (000s) | | (000s) |
| Illinois – continued | | | | | | | | |
| Chicago Park District: – continued | | | | | | | | |
| Series A: | | | | | | | | |
| 5.25% 1/1/18 (FGIC Insured) | | $ | | 4,690 | | $ | | 5,072 |
| 5.25% 1/1/19 (FGIC Insured) | | | | 3,000 | | | | 3,237 |
| 5.25% 1/1/20 (FGIC Insured) | | | | 2,195 | | | | 2,362 |
| Chicago Pub. Bldg. Commission Bldg. Rev. (Chicago Transit | | | | | | | | |
| Auth. Proj.) 5.25% 3/1/16 (AMBAC Insured) | | | | 3,600 | | | | 3,908 |
| Chicago Spl. Trans. Rev. Series 2001: | | | | | | | | |
| 5.25% 1/1/31 (Pre-Refunded to 1/1/27 @ 100) (g) | | | | 11,670 | | | | 12,405 |
| 5.5% 1/1/17 (Escrowed to Maturity) (g) | | | | 1,135 | | | | 1,233 |
| Chicago Transit Auth. Cap. Grant Receipts Rev. | | | | | | | | |
| (Douglas Branch Proj.) Series 2003 B, 5% 6/1/07 (AMBAC | | | | | | | | |
| Insured) | | | | 4,830 | | | | 4,858 |
| Chicago Wtr. Rev. 0% 11/1/16 (AMBAC Insured) | | | | 7,555 | | | | 4,727 |
| Cicero Gen. Oblig. 5.25% 12/1/26 (MBIA Insured) | | | | 3,010 | | | | 3,224 |
| Cook County Gen. Oblig. Series C: | | | | | | | | |
| 5% 11/15/25 (AMBAC Insured) | | | | 8,400 | | | | 8,726 |
| 5.5% 11/15/26 (AMBAC Insured) | | | | 5,120 | | | | 5,564 |
| DuPage County Forest Preserve District Rev. 0% 11/1/17 | | | | 6,665 | | | | 3,970 |
| Evanston Gen. Oblig. Series C: | | | | | | | | |
| 5.25% 1/1/16 | | | | 1,000 | | | | 1,079 |
| 5.25% 1/1/22 | | | | 2,000 | | | | 2,147 |
| Franklin Park Village Cook County Gen. Oblig. Series B: | | | | | | | | |
| 5% 7/1/17 (AMBAC Insured) | | | | 1,380 | | | | 1,471 |
| 5% 7/1/18 (AMBAC Insured) | | | | 1,450 | | | | 1,540 |
| Granite City Solid Waste Disp. Rev. (Waste Mgmt., Inc. Proj.) | | | | | | | | |
| 3.85%, tender 5/1/08 (c)(f) | | | | 5,600 | | | | 5,576 |
| Hodgkins Tax Increment Rev. 5% 1/1/11 | | | | 2,075 | | | | 2,163 |
| Illinois Dedicated Tax Rev. Series B, 0% 12/15/18 | | | | | | | | |
| (AMBAC Insured) | | | | 4,500 | | | | 2,539 |
| Illinois Dev. Fin. Auth. Retirement 0% 7/15/23 (Escrowed to | | | | | | | | |
| Maturity) (g) | | | | 5,050 | | | | 2,196 |
| Illinois Dev. Fin. Auth. Rev.: | | | | | | | | |
| (DePaul Univ. Proj.) Series 2004 C, 5.625% 10/1/17 | | | | 2,800 | | | | 3,059 |
| (Revolving Fund-Master Trust Prog.): | | | | | | | | |
| 5.5% 9/1/18 | | | | 5,365 | | | | 5,887 |
| 5.5% 9/1/19 | | | | 4,405 | | | | 4,836 |
| Illinois Edl. Facilities Auth. Revs.: | | | | | | | | |
| (Northwestern Univ. Proj.) 5% 12/1/38 | | | | 23,250 | | | | 23,968 |
See accompanying notes which are an integral part of the financial statements.
19 Annual Report
| Investments continued | | | | | | | | |
| |
| |
| Municipal Bonds continued | | | | | | | | |
| | | Principal | | Value (Note 1) |
| | | Amount (000s) | | (000s) |
| Illinois – continued | | | | | | | | |
| Illinois Edl. Facilities Auth. Revs.: – continued | | | | | | | | |
| (Univ. of Chicago Proj.): | | | | | | | | |
| Series 2004 B1, 3.45%, tender 7/1/08 (c) | | $ | | 3,350 | | $ | | 3,348 |
| Series 2005 A: | | | | | | | | |
| 5.25% 7/1/41 | | | | 755 | | | | 796 |
| 5.25% 7/1/41 (Pre-Refunded to 7/1/11 @ 101) (g) | | | | 305 | | | | 334 |
| Series A, 5.125% 7/1/38 | | | | 1,585 | | | | 1,627 |
| Illinois Fin. Auth. Gas Supply Rev. (Peoples Gas Lt. and Coke Co. | | | | | | | | |
| Proj.) Series A, 4.3%, tender 6/1/16 (AMBAC Insured) (c) | | | | 3,600 | | | | 3,660 |
| Illinois Gen. Oblig.: | | | | | | | | |
| First Series: | | | | | | | | |
| 5.25% 12/1/17 (FSA Insured) | | | | 2,260 | | | | 2,452 |
| 5.25% 12/1/20 (FSA Insured) | | | | 2,000 | | | | 2,162 |
| 5.375% 12/1/14 (FSA Insured) | | | | 5,000 | | | | 5,474 |
| 5.375% 7/1/15 (MBIA Insured) | | | | 3,700 | | | | 4,035 |
| 5.5% 4/1/16 (FSA Insured) | | | | 1,300 | | | | 1,428 |
| 5.5% 8/1/16 (MBIA Insured) | | | | 13,000 | | | | 14,290 |
| 5.5% 8/1/17 (MBIA Insured) | | | | 7,500 | | | | 8,235 |
| 5.5% 2/1/18 (FGIC Insured) | | | | 1,000 | | | | 1,090 |
| 5.5% 8/1/18 (MBIA Insured) | | | | 5,000 | | | | 5,484 |
| 5.75% 12/1/18 (MBIA Insured) | | | | 1,200 | | | | 1,309 |
| 5.5% 4/1/17 (MBIA Insured) | | | | 7,065 | | | | 7,565 |
| 5.6% 4/1/21 (MBIA Insured) | | | | 7,500 | | | | 8,030 |
| 5.7% 4/1/16 (MBIA Insured) | | | | 7,350 | | | | 7,951 |
| Illinois Health Facilities Auth. Rev.: | | | | | | | | |
| (Condell Med. Ctr. Proj.): | | | | | | | | |
| 6.5% 5/15/30 | | | | 9,000 | | | | 9,599 |
| 7% 5/15/22 | | | | 5,000 | | | | 5,518 |
| (Lake Forest Hosp. Proj.): | | | | | | | | |
| Series A, 6.25% 7/1/22 | | | | 4,200 | | | | 4,620 |
| 6% 7/1/33 | | | | 3,775 | | | | 4,035 |
| (Lutheran Gen. Health Care Sys. Proj.) Series C: | | | | | | | | |
| 6% 4/1/18 | | | | 3,000 | | | | 3,390 |
| 7% 4/1/14 | | | | 1,500 | | | | 1,774 |
| (Riverside Health Sys. Proj.) 6.85% 11/15/29 (Pre-Refunded | | | | | | | | |
| to 11/15/10 @ 101) (g) | | | | 5,025 | | | | 5,809 |
| (Swedish American Hosp. Proj.) 6.875% 11/15/30 | | | | | | | | |
| (Pre-Refunded to 5/15/10 @ 101) (g) | | | | 6,970 | | | | 7,876 |
| 6.75% 2/15/15 | | | | 1,000 | | | | 1,117 |
| Illinois Reg’l. Trans. Auth. Series A, 8% 6/1/17 | | | | | | | | |
| (AMBAC Insured) | | | | 4,500 | | | | 6,046 |
| Illinois Sales Tax Rev. 6% 6/15/20 | | | | 4,600 | | | | 5,042 |
See accompanying notes which are an integral part of the financial statements.
| Municipal Bonds continued | | | | | | | | |
| | | Principal | | Value (Note 1) |
| | | Amount (000s) | | (000s) |
| Illinois – continued | | | | | | | | |
| Kane & DeKalb Counties Cmnty. Unit School District #302 | | | | | | | | |
| 5.8% 2/1/22 (FGIC Insured) | | $ | | 3,795 | | $ | | 4,293 |
| Lake County Cmnty. High School District #117, Antioch | | | | | | | | |
| Series B, 0% 12/1/18 (FGIC Insured) | | | | 7,240 | | | | 4,092 |
| Lake County Warren Township High School District #121, | | | | | | | | |
| Gurnee Series C: | | | | | | | | |
| 5.5% 3/1/24 (AMBAC Insured) | | | | 2,945 | | | | 3,256 |
| 5.625% 3/1/21 (AMBAC Insured) | | | | 2,505 | | | | 2,813 |
| 5.75% 3/1/19 (AMBAC Insured) | | | | 2,240 | | | | 2,557 |
| Metropolitan Pier & Exposition Auth. Dedicated State Tax Rev.: | | | | | | | | |
| (McCormick Place Expansion Proj.): | | | | | | | | |
| Series 2002 A: | | | | | | | | |
| 0% 12/15/32 (MBIA Insured) | | | | 15,000 | | | | 4,157 |
| 5.75% 6/15/41 (MBIA Insured) | | | | 26,420 | | | | 29,149 |
| Series 2002 B, 0% 6/15/20 (MBIA Insured) (a) | | | | 2,000 | | | | 1,575 |
| Series A: | | | | | | | | |
| 0% 6/15/08 (MBIA Insured) | | | | 3,820 | | | | 3,507 |
| 0% 6/15/11 (Escrowed to Maturity) (g) | | | | 6,000 | | | | 4,870 |
| 0% 6/15/15 (FGIC Insured) | | | | 15,000 | | | | 10,092 |
| 0% 6/15/19 (FGIC Insured) | | | | 3,225 | | | | 1,780 |
| 0% 6/15/19 (MBIA Insured) | | | | 2,870 | | | | 1,584 |
| 0% 6/15/20 (FGIC Insured) | | | | 3,460 | | | | 1,824 |
| 0% 6/15/34 (MBIA Insured) | | | | 2,625 | | | | 675 |
| 5.25% 12/15/10 (AMBAC Insured) | | | | 12,950 | | | | 13,312 |
| 6.65% 6/15/12 (FGIC Insured) | | | | 250 | | | | 250 |
| Series 2002: | | | | | | | | |
| 0% 6/15/10 (Escrowed to Maturity) (g) | | | | 16,640 | | | | 14,126 |
| 0% 6/15/13 (Escrowed to Maturity) (g) | | | | 4,155 | | | | 3,087 |
| 0% 6/15/13 (FGIC Insured) | | | | 5,575 | | | | 4,121 |
| Moline Gen. Oblig. Series A, 5.5% 2/1/17 (FGIC Insured) | | | | 1,000 | | | | 1,093 |
| Univ. of Illinois Auxiliary Facilities Sys. Rev.: | | | | | | | | |
| Series A, 0% 4/1/21 (MBIA Insured) | | | | 4,965 | | | | 2,486 |
| 0% 4/1/17 (MBIA Insured) | | | | 16,270 | | | | 9,965 |
| 0% 4/1/20 (MBIA Insured) | | | | 8,000 | | | | 4,216 |
| Will County Cmnty. Unit School District #365, Valley View 0% | | | | | | | | |
| 11/1/17 (FSA Insured) | | | | 3,200 | | | | 1,906 |
| | | | | | | | | 616,401 |
See accompanying notes which are an integral part of the financial statements.
21 Annual Report
| Investments continued | | | | | | | | |
| |
| |
| Municipal Bonds continued | | | | | | | | |
| | | Principal | | Value (Note 1) |
| | | Amount (000s) | | (000s) |
| Indiana – 2.0% | | | | | | | | |
| Anderson School Bldg. Corp.: | | | | | | | | |
| 5.5% 7/15/18 (FSA Insured) | | $ | | 1,780 | | $ | | 1,970 |
| 5.5% 7/15/19 (FSA Insured) | | | | 1,855 | | | | 2,049 |
| 5.5% 7/15/24 (FSA Insured) | | | | 1,460 | | | | 1,603 |
| 5.5% 1/15/28 (FSA Insured) | | | | 2,500 | | | | 2,737 |
| Avon 2000 Cmnty. School Bldg. Corp. 5% 7/15/17 (FSA | | | | | | | | |
| Insured) | | | | 2,835 | | | | 3,032 |
| Clark-Pleasant 2004 School Bldg. Corp.: | | | | | | | | |
| 5.25% 7/15/23 (FSA Insured) | | | | 1,545 | | | | 1,654 |
| 5.25% 7/15/25 (FSA Insured) | | | | 1,720 | | | | 1,830 |
| Crown Point Multi-School Bldg. Corp. 0% 1/15/21 | | | | | | | | |
| (MBIA Insured) | | | | 7,480 | | | | 3,754 |
| Franklin Township Independent School Bldg. Corp., Marion | | | | | | | | |
| County: | | | | | | | | |
| 5% 7/15/24 (MBIA Insured) | | | | 1,365 | | | | 1,425 |
| 5.25% 7/15/17 (MBIA Insured) | | | | 1,885 | | | | 2,061 |
| GCS School Bldg. Corp. One 5% 7/15/22 (FSA Insured) | | | | 1,545 | | | | 1,629 |
| Hamilton Southeastern Cumberland Campus School Bldg. | | | | | | | | |
| Corp. 5.125% 1/15/23 (AMBAC Insured) | | | | 1,250 | | | | 1,315 |
| Hammond School Bldg. Corp. 5% 7/15/16 (MBIA Insured) | | | | 1,845 | | | | 1,985 |
| Indiana Bond Bank Series B: | | | | | | | | |
| 5% 2/1/19 (MBIA Insured) | | | | 1,940 | | | | 2,056 |
| 5% 2/1/20 (MBIA Insured) | | | | 1,635 | | | | 1,728 |
| Indiana Dev. Fin. Auth. Rev. 5.95% 8/1/30 (f) | | | | 7,350 | | | | 7,654 |
| Indiana Dev. Fin. Auth. Solid Waste Disp. Rev. (Waste Mgmt., | | | | | | | | |
| Inc. Proj.) 4.7%, tender 10/1/15 (c)(f) | | | | 3,000 | | | | 3,009 |
| Indiana Health Facilities Fing. Auth. Hosp. Rev.: | | | | | | | | |
| (Columbus Reg’l. Hosp. Proj.) 7% 8/15/15 (FSA Insured) | | | | 2,500 | | | | 2,947 |
| 5.5% 2/15/30 (Pre-Refunded to 8/15/10 @ 101.5) (g) | | | | 5,295 | | | | 5,829 |
| Indiana Trans. Fin. Auth. Hwy.: | | | | | | | | |
| Series 1993 A, 0% 6/1/18 (AMBAC Insured) | | | | 1,700 | | | | 985 |
| Series A, 0% 6/1/16 (AMBAC Insured) | | | | 6,470 | | | | 4,139 |
| Indianapolis Arpt. Auth. Rev. Series A, 5.6% 7/1/15 | | | | | | | | |
| (FGIC Insured) | | | | 1,000 | | | | 1,030 |
| Indianapolis Local Pub. Impt. Bond Bank (Wtrwks. Proj.) | | | | | | | | |
| Series 2002 A, 5.5% 1/1/18 (MBIA Insured) | | | | 1,250 | | | | 1,363 |
| Muncie School Bldg. Corp.: | | | | | | | | |
| 5.25% 1/10/14 (MBIA Insured) | | | | 1,215 | | | | 1,335 |
| 5.25% 7/10/14 (MBIA Insured) | | | | 1,760 | | | | 1,936 |
See accompanying notes which are an integral part of the financial statements.
| Municipal Bonds continued | | | | | | | | |
| | | Principal | | Value (Note 1) |
| | | Amount (000s) | | (000s) |
| Indiana – continued | | | | | | | | |
| Petersburg Poll. Cont. Rev.: | | | | | | | | |
| (Indianapolis Pwr. & Lt. Co. Proj.) 5.9% 12/1/24 (f) | | $ | | 10,000 | | $ | | 10,519 |
| 5.95% 12/1/29 (f) | | | | 2,000 | | | | 2,098 |
| Portage Township Multi-School Bldg. Corp.: | | | | | | | | |
| 5.25% 7/15/17 (MBIA Insured) | | | | 1,375 | | | | 1,498 |
| 5.25% 7/15/22 (MBIA Insured) | | | | 1,785 | | | | 1,931 |
| 5.25% 7/15/24 (MBIA Insured) | | | | 1,975 | | | | 2,124 |
| 5.25% 7/15/25 (MBIA Insured) | | | | 2,085 | | | | 2,238 |
| 5.25% 1/15/29 (MBIA Insured) | | | | 1,265 | | | | 1,353 |
| South Harrison School Bldg. Corp. Series A: | | | | | | | | |
| 5.25% 7/15/22 (FSA Insured) | | | | 2,820 | | | | 3,063 |
| 5.5% 7/15/21 (FSA Insured) | | | | 2,675 | | | | 2,972 |
| Southmont School Bldg. Corp. 5% 7/15/15 | | | | | | | | |
| (FGIC Insured) | | | | 2,000 | | | | 2,130 |
| Westfield Washington Multi-School Bldg. Corp. Series A: | | | | | | | | |
| 5% 7/15/15 (FSA Insured) | | | | 1,360 | | | | 1,470 |
| 5% 7/15/18 (FSA Insured) | | | | 1,500 | | | | 1,594 |
| | | | | | | | | 94,045 |
| |
| Iowa 0.7% | | | | | | | | |
| Iowa Fin. Auth. Hosp. Facilities Rev.: | | | | | | | | |
| 5.875% 2/15/30 (Pre-Refunded to 2/15/10 @ 101) (g) | | | | 15,000 | | | | 16,549 |
| 6.625% 2/15/12 (Pre-Refunded to 2/15/10 @ 101) (g) | | | | 2,000 | | | | 2,260 |
| 6.75% 2/15/13 (Pre-Refunded to 2/15/10 @ 101) (g) | | | | 1,000 | | | | 1,135 |
| 6.75% 2/15/14 (Pre-Refunded to 2/15/10 @ 101) (g) | | | | 1,280 | | | | 1,452 |
| 6.75% 2/15/15 (Pre-Refunded to 2/15/10 @ 101) (g) | | | | 1,000 | | | | 1,135 |
| 6.75% 2/15/17 (Pre-Refunded to 2/15/10 @ 101) (g) | | | | 1,000 | | | | 1,135 |
| Tobacco Settlement Auth. Tobacco Settlement Rev. 5.3% | | | | | | | | |
| 6/1/25 (Pre-Refunded to 6/1/11 @ 101) (g) | | | | 10,000 | | | | 10,805 |
| | | | | | | | | 34,471 |
| |
| Kansas 0.4% | | | | | | | | |
| Burlington Envir. Impt. Rev. (Kansas City Pwr. & Lt. Co. Proj.) | | | | | | | | |
| Series A, 4.75%, tender 10/1/07 (c) | | | | 7,800 | | | | 7,923 |
| Kansas Dev. Fin. Auth. Health Facilities Rev. (Sisters of Charity | | | | | | | | |
| of Leavenworth Health Svcs. Corp. Proj.) Series J, 6.25% | | | | | | | | |
| 12/1/28 | | | | 4,500 | | | | 4,945 |
See accompanying notes which are an integral part of the financial statements.
23 Annual Report
| Investments continued | | | | | | | | |
| |
| |
| Municipal Bonds continued | | | | | | | | |
| | | Principal | | Value (Note 1) |
| | | Amount (000s) | | (000s) |
| Kansas – continued | | | | | | | | |
| Topeka Combined Util. Impt. Rev. Series 2005 A: | | | | | | | | |
| 6% 8/1/20 (XL Cap. Assurance, Inc. Insured) | | $ | | 1,200 | | $ | | 1,409 |
| 6% 8/1/25 (XL Cap. Assurance, Inc. Insured) | | | | 1,100 | | | | 1,277 |
| 6% 8/1/27 (XL Cap. Assurance, Inc. Insured) | | | | 1,235 | | | | 1,429 |
| | | | | | | | | 16,983 |
| |
| Kentucky 2.2% | | | | | | | | |
| Jefferson County Cap. Projs. Corp. Rev. (Lease Prog.) Series A, | | | | | | | | |
| 0% 8/15/11 | | | | 5,250 | | | | 4,162 |
| Louisville & Jefferson County Metropolitan Swr. District Swr. & | | | | | | | | |
| Drain Sys. Rev. Series A: | | | | | | | | |
| 5.25% 5/15/37 (FGIC Insured) | | | | 15,750 | | | | 16,947 |
| 5.75% 5/15/33 (FGIC Insured) | | | | 65,000 | | | | 70,485 |
| Louisville & Jefferson County Reg’l. Arpt. Auth. Arpt. Sys. Rev. | | | | | | | | |
| Series 2001 A: | | | | | | | | |
| 5.25% 7/1/09 (FSA Insured) (f) | | | | 1,545 | | | | 1,622 |
| 5.5% 7/1/10 (FSA Insured) (f) | | | | 3,800 | | | | 4,061 |
| Owensboro Elec. Lt. & Pwr. Rev. Series B, 0% 1/1/10 | | | | | | | | |
| (AMBAC Insured) | | | | 7,440 | | | | 6,410 |
| | | | | | | | | 103,687 |
| |
| Louisiana – 0.7% | | | | | | | | |
| Louisiana Gas & Fuel Tax Rev. Series A, 5.375% 6/1/20 | | | | | | | | |
| (AMBAC Insured) | | | | 3,000 | | | | 3,191 |
| Monroe-West Monroe Pub. Trust Fing. Auth. Mtg. Rev. | | | | | | | | |
| Series C, 0% 8/20/14 | | | | 8,625 | | | | 5,753 |
| New Orleans Gen. Oblig.: | | | | | | | | |
| 0% 9/1/09 (AMBAC Insured) | | | | 16,500 | | | | 14,379 |
| 0% 9/1/11 (AMBAC Insured) | | | | 3,080 | | | | 2,446 |
| 0% 9/1/13 (AMBAC Insured) | | | | 3,350 | | | | 2,422 |
| 0% 9/1/14 (AMBAC Insured) | | | | 3,165 | | | | 2,172 |
| | | | | | | | | 30,363 |
| |
| Maine – 0.1% | | | | | | | | |
| Maine Tpk. Auth. Tpk. Rev. 5.25% 7/1/30 (FSA Insured) | | | | 3,000 | | | | 3,205 |
| Maryland 0.3% | | | | | | | | |
| Maryland Health & Higher Edl. Facilities Auth. Rev.: | | | | | | | | |
| (Good Samaritan Hosp. Proj.): | | | | | | | | |
| 5.75% 7/1/13 (Escrowed to Maturity) (g) | | | | 1,605 | | | | 1,778 |
See accompanying notes which are an integral part of the financial statements.
| Municipal Bonds continued | | | | | | | | |
| | | Principal | | Value (Note 1) |
| | | Amount (000s) | | (000s) |
| Maryland – continued | | | | | | | | |
| Maryland Health & Higher Edl. Facilities Auth. Rev.: - | | | | | | | | |
| continued | | | | | | | | |
| (Good Samaritan Hosp. Proj.): | | | | | | | | |
| 5.75% 7/1/13 (Escrowed to Maturity) (g) | | $ | | 995 | | $ | | 1,102 |
| (Univ. of Maryland Med. Sys. Proj.) 6.75% 7/1/30 | | | | | | | | |
| (Pre-Refunded to 7/1/10 @ 101) (g) | | | | 10,415 | | | | 11,890 |
| | | | | | | | | 14,770 |
| |
| Massachusetts 7.8% | | | | | | | | |
| Massachusetts Bay Trans. Auth.: | | | | | | | | |
| Series 2000 A, 5.25% 7/1/30 | | | | 1,465 | | | | 1,540 |
| Series A: | | | | | | | | |
| 5% 7/1/31 | | | | 11,000 | | | | 11,516 |
| 5.75% 3/1/26 | | | | 17,795 | | | | 19,240 |
| Series B, 6.2% 3/1/16 | | | | 3,800 | | | | 4,412 |
| Massachusetts Ed. Ln. Auth. Ed. Ln. Rev.: | | | | | | | | |
| Series A Issue E, 4.9% 7/1/13 (AMBAC Insured) (f) | | | | 3,210 | | | | 3,281 |
| Series B Issue E: | | | | | | | | |
| 5.85% 7/1/06 (AMBAC Insured) (f) | | | | 725 | | | | 729 |
| 5.95% 7/1/07 (AMBAC Insured) (f) | | | | 780 | | | | 786 |
| 6.05% 7/1/08 (AMBAC Insured) (f) | | | | 800 | | | | 807 |
| 6.15% 7/1/10 (AMBAC Insured) (f) | | | | 320 | | | | 323 |
| 6.25% 7/1/11 (AMBAC Insured) (f) | | | | 200 | | | | 202 |
| 6.3% 7/1/12 (AMBAC Insured) (f) | | | | 195 | | | | 197 |
| Massachusetts Fed. Hwy. Series 2000 A: | | | | | | | | |
| 5.75% 6/15/11 | | | | 10,000 | | | | 10,928 |
| 5.75% 6/15/12 | | | | 5,000 | | | | 5,440 |
| 5.75% 6/15/13 | | | | 5,000 | | | | 5,459 |
| Massachusetts Gen. Oblig.: | | | | | | | | |
| Series 2005 A: | | | | | | | | |
| 5% 3/1/21 (FSA Insured) | | | | 20,000 | | | | 21,299 |
| 5% 3/1/22 | | | | 6,500 | | | | 6,876 |
| Series 2005 C, 5.25% 9/1/23 | | | | 19,745 | | | | 21,425 |
| Series D: | | | | | | | | |
| 5% 10/1/23 (Pre-Refunded to 10/1/13 @ 100) (g) | | | | 4,200 | | | | 4,526 |
| 5.25% 10/1/20 (Pre-Refunded to 10/1/13 @ 100) (g) | | | | 14,000 | | | | 15,320 |
| 5.25% 10/1/21 (Pre-Refunded to 10/1/13 @ 100) (g) | | | | 9,000 | | | | 9,848 |
| Massachusetts Health & Edl. Facilities Auth. Rev.: | | | | | | | | |
| (Blood Research Institute Proj.) Series A, 6.5% 2/1/22 | | | | 3,975 | | | | 3,986 |
| (Massachusetts Gen. Hosp. Proj.) Series F, 6.25% 7/1/12 | | | | | | | | |
| (AMBAC Insured) | | | | 2,000 | | | | 2,168 |
See accompanying notes which are an integral part of the financial statements.
25 Annual Report
| Investments continued | | | | | | | | |
| |
| |
| Municipal Bonds continued | | | | | | | | |
| | | Principal | | Value (Note 1) |
| | | Amount (000s) | | (000s) |
| Massachusetts continued | | | | | | | | |
| Massachusetts Health & Edl. Facilities Auth. Rev.: - continued | | | | | | | | |
| (New England Med. Ctr. Hosp. Proj.) Series G, 5.375% | | | | | | | | |
| 7/1/24 (MBIA Insured) | | $ | | 3,800 | | $ | | 3,849 |
| (South Shore Hosp. Proj.) Series F, 5.75% 7/1/29 | | | | 11,930 | | | | 12,639 |
| (Tufts Univ. Proj.) Series I, 5.5% 2/15/36 | | | | 10,000 | | | | 10,677 |
| (Wellesley College Proj.) Series F, 5.125% 7/1/39 | | | | 5,705 | | | | 5,901 |
| Massachusetts Indl. Fin. Agcy. Resource Recovery Rev. (Ogden | | | | | | | | |
| Haverhill Proj.) Series 1992 A, 4.95% 12/1/06 | | | | 2,000 | | | | 2,019 |
| Massachusetts Indl. Fin. Agcy. Rev. (Massachusetts Biomedical | | | | | | | | |
| Research Corp. Proj.) Series A2: | | | | | | | | |
| 0% 8/1/08 | | | | 5,000 | | | | 4,542 |
| 0% 8/1/09 | | | | 21,800 | | | | 18,977 |
| 0% 8/1/10 | | | | 2,000 | | | | 1,664 |
| Massachusetts Muni. Wholesale Elec. Co. Pwr. Supply Sys. Rev. | | | | | | | | |
| Series A, 5% 7/1/10 (Escrowed to Maturity) (g) | | | | 3,010 | | | | 3,061 |
| Massachusetts Port Auth. Spl. Facilities Rev. (Delta Air Lines, | | | | | | | | |
| Inc. Proj.) Series A: | | | | | | | | |
| 5.5% 1/1/12 (AMBAC Insured) (f) | | | | 2,000 | | | | 2,128 |
| 5.5% 1/1/14 (AMBAC Insured) (f) | | | | 2,540 | | | | 2,691 |
| Massachusetts School Bldg. Auth. Dedicated Sales Tax Rev. | | | | | | | | |
| Series A: | | | | | | | | |
| 5% 8/15/23 (FSA Insured) | | | | 29,965 | | | | 31,722 |
| 5% 8/15/26 (FSA Insured) | | | | 10,000 | | | | 10,546 |
| 5% 8/15/30 (FSA Insured) | | | | 30,000 | | | | 31,493 |
| Massachusetts Tpk. Auth. Metropolitan Hwy. Sys. Rev.: | | | | | | | | |
| Series 1999 A, 5.25% 1/1/29 (AMBAC Insured) | | | | 14,400 | | | | 15,084 |
| Sr. Series A, 5.125% 1/1/23 (MBIA Insured) | | | | 7,950 | | | | 8,222 |
| Massachusetts Tpk. Auth. Western Tpk. Rev. Series A, 5.55% | | | | | | | | |
| 1/1/17 (MBIA Insured) | | | | 13,215 | | | | 13,939 |
| Massachusetts Wtr. Poll. Abatement Trust Wtr. Poll. Abatement | | | | | | | | |
| Rev. (MWRA Ln. Prog.) Series A, 5.25% 8/1/13 | | | | 90 | | | | 95 |
| Massachusetts Wtr. Resources Auth. Series A, 5.75% 8/1/39 | | | | | | | | |
| (Pre-Refunded to 8/1/10 @ 101) (g) | | | | 19,300 | | | | 21,224 |
| Route 3 North Trans. Impt. Assoc. Lease Rev. 5.75% 6/15/16 | | | | | | | | |
| (MBIA Insured) | | | | 4,850 | | | | 5,277 |
| Springfield Gen. Oblig. 5% 8/1/19 (MBIA Insured) | | | | 7,015 | | | | 7,493 |
| | | | | | | | | 363,551 |
See accompanying notes which are an integral part of the financial statements.
| Municipal Bonds continued | | | | | | | | |
| | | Principal | | Value (Note 1) |
| | | Amount (000s) | | (000s) |
| Michigan – 1.2% | | | | | | | | |
| Carman-Ainsworth Cmnty. School District 5% 5/1/18 | | | | | | | | |
| (FSA Insured) | | $ | | 2,175 | | $ | | 2,327 |
| Clarkston Cmnty. Schools: | | | | | | | | |
| 5.25% 5/1/29 | | | | 3,600 | | | | 3,850 |
| 5.375% 5/1/20 | | | | 1,775 | | | | 1,953 |
| Detroit Wtr. Supply Sys. Rev. Series 2001 A, 5.25% 7/1/33 | | | | | | | | |
| (FGIC Insured) | | | | 4,520 | | | | 4,757 |
| Ferris State Univ. Rev. 5% 10/1/20 (MBIA Insured) | | | | 3,165 | | | | 3,344 |
| Fowlerville Cmnty. School District 5.25% 5/1/17 (FGIC | | | | | | | | |
| Insured) | | | | 1,425 | | | | 1,551 |
| Lake Orion Cmnty. School District Series B, 5.25% 5/1/25 | | | | | | | | |
| (Liquidity Facility Sumitomo Bank Lease Fin., Inc. (SBLF)) | | | | 2,000 | | | | 2,106 |
| Michigan Ctfs. of Prtn. 5.75% 6/1/17 (Pre-Refunded to | | | | | | | | |
| 6/1/10 @ 100) (g) | | | | 1,460 | | | | 1,598 |
| Michigan Hosp. Fin. Auth. Hosp. Rev.: | | | | | | | | |
| (Mercy Health Svcs. Proj.): | | | | | | | | |
| Series Q, 5.375% 8/15/26 (Escrowed to Maturity) (g) | | | | 4,750 | | | | 4,827 |
| Series W, 5.25% 8/15/27 (Escrowed to Maturity) (g) | | | | 4,000 | | | | 4,086 |
| Series X: | | | | | | | | |
| 6% 8/15/34 (MBIA Insured) | | | | 7,145 | | | | 7,821 |
| 6% 8/15/34 (Pre-Refunded to 8/15/09 @ 101) (g) | | | | 3,530 | | | | 3,864 |
| (Sisters of Mercy Health Corp. Proj.) Series P, 5.375% | | | | | | | | |
| 8/15/14 (Escrowed to Maturity) (g) | | | | 420 | | | | 439 |
| (Trinity Health Sys. Proj.) Series 2000 A, 6% 12/1/27 | | | | 2,000 | | | | 2,194 |
| Royal Oak Hosp. Fin. Auth. Hosp. Rev. (William Beaumont | | | | | | | | |
| Hosp. Proj.): | | | | | | | | |
| Series M, 5.25% 11/15/31 (MBIA Insured) | | | | 7,000 | | | | 7,297 |
| 5.5% 1/1/14 | | | | 3,695 | | | | 3,778 |
| 6.25% 1/1/09 | | | | 400 | | | | 429 |
| Troy School District 5% 5/1/17 (MBIA Insured) (b) | | | | 2,000 | | | | 2,122 |
| | | | | | | | | 58,343 |
| |
| Minnesota 1.0% | | | | | | | | |
| Minneapolis & Saint Paul Hsg. & Redev. Auth. Health Care | | | | | | | | |
| Sys. Rev.: | | | | | | | | |
| (Health Partners Oblig. Group Proj.) 6% 12/1/18 | | | | 1,000 | | | | 1,109 |
| (Healthspan Corp. Proj.) Series A, 4.75% 11/15/18 | | | | | | | | |
| (AMBAC Insured) | | | | 9,700 | | | | 9,711 |
See accompanying notes which are an integral part of the financial statements.
27 Annual Report
| Investments continued | | | | | | | | |
| |
| |
| Municipal Bonds continued | | | | | | | | |
| | | Principal | | Value (Note 1) |
| | | Amount (000s) | | (000s) |
| Minnesota – continued | | | | | | | | |
| Minneapolis Health Care Sys. Rev. (Allina Health Sys. Proj.) | | | | | | | | |
| Series 2002 A, 6% 11/15/23 | | $ | | 6,000 | | $ | | 6,615 |
| Minnesota Agric. & Econ. Dev. Board Rev. (Health Care Sys. | | | | | | | | |
| Proj.) Series A: | | | | | | | | |
| 6.375% 11/15/29 | | | | 375 | | | | 418 |
| 6.375% 11/15/29 (Pre-Refunded to 11/15/10 @ 101) (g) | | | | 11,625 | | | | 13,194 |
| Saint Cloud Health Care Rev. (Saint Cloud Hosp. Group Oblig. | | | | | | | | |
| Proj.) Series A, 5.875% 5/1/30 (FSA Insured) | | | | 8,500 | | | | 9,290 |
| Saint Paul Hsg. & Redev. Auth. Hosp. Rev. (Healtheast Proj.) | | | | | | | | |
| 6% 11/15/30 | | | | 2,000 | | | | 2,122 |
| Saint Paul Port Auth. Lease Rev. Series 2003 11: | | | | | | | | |
| 5.25% 12/1/18 | | | | 1,710 | | | | 1,858 |
| 5.25% 12/1/19 | | | | 2,850 | | | | 3,089 |
| Waconia Independent School District #110 Series A, 5% | | | | | | | | |
| 2/1/15 (FSA Insured) | | | | 1,155 | | | | 1,224 |
| | | | | | | | | 48,630 |
| |
| Mississippi – 0.1% | | | | | | | | |
| Hinds County Rev. (Mississippi Methodist Hosp. & | | | | | | | | |
| Rehabilitation Proj.) 5.6% 5/1/12 (AMBAC Insured) | | | | 4,000 | | | | 4,204 |
| Missouri – 0.2% | | | | | | | | |
| Missouri Dev. Fin. Board Infrastructure Facilities Rev. (City of | | | | | | | | |
| Branson-Branson Landing Proj.) Series 2005 A, 6% 6/1/20 | | | | 2,125 | | | | 2,445 |
| Missouri Envir. Impt. & Energy Resources Auth. Wtr. Poll. Cont. | | | | | | | | |
| & Drinking Wtr. Rev. (State Revolving Fund Prog.): | | | | | | | | |
| Series 2002 B, 5.5% 7/1/17 | | | | 1,780 | | | | 1,972 |
| Series 2003 A: | | | | | | | | |
| 5.125% 1/1/19 | | | | 5,000 | | | | 5,353 |
| 5.25% 1/1/18 | | | | 1,280 | | | | 1,383 |
| Missouri Hsg. Dev. Commission Single Family Mtg. Rev. | | | | | | | | |
| Series C, 5.5% 3/1/16 (f) | | | | 140 | | | | 140 |
| | | | | | | | | 11,293 |
| |
| Montana 0.4% | | | | | | | | |
| Forsyth Poll. Cont. Rev. (Portland Gen. Elec. Co. Projs.) | | | | | | | | |
| Series A, 5.2%, tender 5/1/09 (c) | | | | 7,700 | | | | 7,991 |
| Montana Board of Invt. (Payroll Tax Workers Compensation | | | | | | | | |
| Prog.): | | | | | | | | |
| Series 1996: | | | | | | | | |
| 6.875% 6/1/20 (Escrowed to Maturity) (g) | | | | 1,255 | | | | 1,356 |
See accompanying notes which are an integral part of the financial statements.
| Municipal Bonds continued | | | | | | | | |
| | | Principal | | Value (Note 1) |
| | | Amount (000s) | | (000s) |
| Montana – continued | | | | | | | | |
| Montana Board of Invt. (Payroll Tax Workers Compensation | | | | | | | | |
| Prog.): – continued | | | | | | | | |
| Series 1996: | | | | | | | | |
| 6.875% 6/1/20 (Escrowed to Maturity) (g) | | $ | | 3,870 | | $ | | 4,181 |
| 6.875% 6/1/20 (Escrowed to Maturity) (g) | | | | 2,005 | | | | 2,166 |
| Montana Board of Regents Higher Ed. Rev. (Montana State | | | | | | | | |
| Univ. Proj.) 5% 11/15/34 (AMBAC Insured) | | | | 2,000 | | | | 2,089 |
| | | | | | | | | 17,783 |
| |
| Nevada 1.1% | | | | | | | | |
| Clark County Arpt. Rev. Series C: | | | | | | | | |
| 5.375% 7/1/17 (AMBAC Insured) (f) | | | | 4,310 | | | | 4,595 |
| 5.375% 7/1/19 (AMBAC Insured) (f) | | | | 1,100 | | | | 1,169 |
| 5.375% 7/1/21 (AMBAC Insured) (f) | | | | 1,600 | | | | 1,694 |
| Clark County Gen. Oblig.: | | | | | | | | |
| Series 2000, 5.5% 7/1/30 (MBIA Insured) | | | | 4,500 | | | | 4,784 |
| 5.5% 7/1/21 (MBIA Insured) | | | | 1,100 | | | | 1,176 |
| Henderson Health Care Facility Rev. (Catholic Healthcare West | | | | | | | | |
| Proj.) Series 2005 B, 5% 7/1/08 | | | | 2,700 | | | | 2,791 |
| Las Vegas Valley Wtr. District Series B, 5.25% 6/1/17 | | | | | | | | |
| (MBIA Insured) | | | | 6,285 | | | | 6,778 |
| Truckee Meadows Wtr. Auth. Wtr. Rev. 5.25% 7/1/34 | | | | | | | | |
| (FSA Insured) | | | | 18,855 | | | | 19,694 |
| Washoe County Gen. Oblig. (Reno Sparks Proj.) Series B: | | | | | | | | |
| 0% 7/1/12 (FSA Insured) | | | | 4,605 | | | | 3,541 |
| 0% 7/1/13 (FSA Insured) | | | | 4,590 | | | | 3,372 |
| 0% 7/1/14 (FSA Insured) | | | | 3,000 | | | | 2,101 |
| | | | | | | | | 51,695 |
| |
| New Hampshire – 0.2% | | | | | | | | |
| Nashua Gen. Oblig. 5.25% 9/15/18 | | | | 1,000 | | | | 1,078 |
| New Hampshire Bus. Fin. Auth. Poll. Cont. Rev. (United | | | | | | | | |
| Illumination Co.) Series A, 3.65%, tender 2/1/10 | | | | | | | | |
| (AMBAC Insured) (c)(f) | | | | 6,100 | | | | 6,032 |
| New Hampshire Tpk. Sys. Rev. 5% 5/1/09 (AMBAC | | | | | | | | |
| Insured) (b) | | | | 2,000 | | | | 2,076 |
| | | | | | | | | 9,186 |
| |
| New Jersey – 1.8% | | | | | | | | |
| Evesham Township Muni. Utils. Auth. Rev. Series 2003 A, | | | | | | | | |
| 5.125% 7/1/14 (AMBAC Insured) | | | | 2,440 | | | | 2,629 |
| New Jersey Econ. Dev. Auth. Rev.: | | | | | | | | |
| Series 2005 K, 5.5% 12/15/19 (AMBAC Insured) | | | | 9,500 | | | | 10,945 |
See accompanying notes which are an integral part of the financial statements.
29 Annual Report
| Investments continued | | | | | | | | |
| |
| |
| Municipal Bonds continued | | | | | | | | |
| | | Principal | | Value (Note 1) |
| | | Amount (000s) | | (000s) |
| New Jersey – continued | | | | | | | | |
| New Jersey Econ. Dev. Auth. Rev.: – continued | | | | | | | | |
| Series 2005 O: | | | | | | | | |
| 5.125% 3/1/30 | | $ | | 5,000 | | $ | | 5,232 |
| 5.25% 3/1/23 | | | | 4,500 | | | | 4,817 |
| 5.25% 3/1/26 | | | | 5,000 | | | | 5,325 |
| Series O, 5.25% 3/1/21 (MBIA Insured) | | | | 2,800 | | | | 3,044 |
| New Jersey Health Care Facilities Fing. Auth. Rev. (Christ | | | | | | | | |
| Hosp. Group Issue Proj.) 7% 7/1/06 (Escrowed to | | | | | | | | |
| Maturity) (g) | | | | 845 | | | | 860 |
| New Jersey Tpk. Auth. Tpk. Rev. Series 2004 A, 3.15%, tender | | | | | | | | |
| 1/1/10 (AMBAC Insured) (c) | | | | 6,300 | | | | 6,214 |
| New Jersey Trans. Trust Fund Auth. Series B, 5.5% 12/15/21 | | | | | | | | |
| (MBIA Insured) | | | | 5,000 | | | | 5,743 |
| North Hudson Swr. Auth. Swr. Rev. Series A: | | | | | | | | |
| 5.25% 8/1/18 (FGIC Insured) | | | | 3,235 | | | | 3,521 |
| 5.25% 8/1/19 (FGIC Insured) | | | | 2,735 | | | | 2,955 |
| Ocean County Utils. Auth. Wastewtr. Rev. 5.25% 1/1/07 | | | | 1,265 | | | | 1,275 |
| Tobacco Settlement Fing. Corp.: | | | | | | | | |
| 4.375% 6/1/19 | | | | 3,170 | | | | 3,167 |
| 5.75% 6/1/32 | | | | 8,905 | | | | 9,236 |
| 6.125% 6/1/24 | | | | 8,500 | | | | 9,234 |
| 6.125% 6/1/42 | | | | 4,500 | | | | 4,713 |
| Union County Impt. Auth. (Juvenile Detention Ctr. Facility Proj.) | | | | | | | | |
| 5.5% 5/1/28 (FGIC Insured) | | | | 5,560 | | | | 6,149 |
| Warren County Poll. Cont. Fing. Auth. Resource Recovery Rev. | | | | | | | | |
| 6.55% 12/1/06 (MBIA Insured) | | | | 1,000 | | | | 1,002 |
| | | | | | | | | 86,061 |
| |
| New Mexico – 0.5% | | | | | | | | |
| Albuquerque Arpt. Rev.: | | | | | | | | |
| 6.5% 7/1/08 (AMBAC Insured) (f) | | | | 1,500 | | | | 1,597 |
| 6.7% 7/1/18 (AMBAC Insured) (f) | | | | 2,500 | | | | 2,654 |
| 6.75% 7/1/09 (AMBAC Insured) (f) | | | | 1,150 | | | | 1,259 |
| 6.75% 7/1/10 (AMBAC Insured) (f) | | | | 1,700 | | | | 1,889 |
| 6.75% 7/1/12 (AMBAC Insured) (f) | | | | 1,935 | | | | 2,220 |
| New Mexico Edl. Assistance Foundation Sr. Series A3, 4.95% | | | | | | | | |
| 3/1/09 (f) | | | | 5,000 | | | | 5,171 |
| Univ. of New Mexico Univ. Revs. Series A, 6% 6/1/21 | | | | 5,340 | | | | 6,319 |
| | | | | | | | | 21,109 |
See accompanying notes which are an integral part of the financial statements.
| Municipal Bonds continued | | | | | | | | |
| | | Principal | | Value (Note 1) |
| | | Amount (000s) | | (000s) |
| New York – 10.0% | | | | | | | | |
| Erie County Indl. Dev. Agcy. School Facility Rev. (Buffalo City | | | | | | | | |
| School District Proj.): | | | | | | | | |
| 5.75% 5/1/14 (FSA Insured) | | $ | | 3,500 | | $ | | 3,937 |
| 5.75% 5/1/15 (FSA Insured) | | | | 7,870 | | | | 8,832 |
| 5.75% 5/1/16 (FSA Insured) | | | | 7,120 | | | | 8,102 |
| 5.75% 5/1/18 (FSA Insured) | | | | 3,460 | | | | 3,832 |
| 5.75% 5/1/18 (FSA Insured) | | | | 9,220 | | | | 10,478 |
| 5.75% 5/1/20 (FSA Insured) | | | | 8,000 | | | | 9,067 |
| 5.75% 5/1/21 (FSA Insured) | | | | 1,575 | | | | 1,737 |
| 5.75% 5/1/21 (FSA Insured) | | | | 3,845 | | | | 4,355 |
| 5.75% 5/1/22 (FSA Insured) | | | | 1,000 | | | | 1,135 |
| 5.75% 5/1/23 (FSA Insured) | | | | 1,750 | | | | 1,927 |
| 5.75% 5/1/24 (FSA Insured) | | | | 3,000 | | | | 3,391 |
| 5.75% 5/1/25 (FSA Insured) | | | | 3,400 | | | | 3,835 |
| 5.75% 5/1/26 (FSA Insured) | | | | 5,200 | | | | 5,862 |
| Metropolitan Trans. Auth. Dedicated Tax Fund Series A, 5.5% | | | | | | | | |
| 11/15/26 (FSA Insured) | | | | 2,200 | | | | 2,407 |
| Metropolitan Trans. Auth. Rev. Series F, 5.25% 11/15/27 | | | | | | | | |
| (MBIA Insured) | | | | 3,400 | | | | 3,646 |
| Metropolitan Trans. Auth. Svc. Contract Rev.: | | | | | | | | |
| Series 2002 A, 5.75% 7/1/31 (AMBAC Insured) | | | | 3,800 | | | | 4,188 |
| Series A, 5.5% 1/1/20 (MBIA Insured) | | | | 4,200 | | | | 4,602 |
| Series B, 5.5% 7/1/19 (MBIA Insured) | | | | 2,000 | | | | 2,193 |
| Series O, 5.75% 7/1/13 (Escrowed to Maturity) (g) | | | | 14,250 | | | | 15,619 |
| Nassau County Gen. Oblig. Series Z, 5% 9/1/11 | | | | | | | | |
| (FGIC Insured) | | | | 2,300 | | | | 2,437 |
| New York City Gen. Oblig.: | | | | | | | | |
| Series 2000 A, 6.5% 5/15/11 | | | | 5,345 | | | | 5,990 |
| Series 2002 C, 5.5% 8/1/13 | | | | 5,000 | | | | 5,474 |
| Series 2003 A, 5.5% 8/1/20 (MBIA Insured) | | | | 8,000 | | | | 8,843 |
| Series 2003 I, 5.75% 3/1/16 | | | | 5,500 | | | | 6,086 |
| Series 2005 G: | | | | | | | | |
| 5% 8/1/14 | | | | 2,400 | | | | 2,567 |
| 5% 8/1/15 | | | | 1,500 | | | | 1,606 |
| 5.25% 8/1/16 | | | | 3,525 | | | | 3,848 |
| Series 2005 J, 5% 3/1/20 | | | | 14,035 | | | | 14,739 |
| Series A, 5.25% 11/1/14 (MBIA Insured) | | | | 1,850 | | | | 2,009 |
| Series B, 5.75% 8/1/14 | | | | 2,000 | | | | 2,209 |
| Series C: | | | | | | | | |
| 5.75% 3/15/27 (FSA Insured) | | | | 1,240 | | | | 1,364 |
| 5.75% 3/15/27 (Pre-Refunded to 3/15/12 @ 100) (g) | | | | 2,760 | | | | 3,101 |
See accompanying notes which are an integral part of the financial statements.
31 Annual Report
| Investments continued | | | | | | | | |
| |
| |
| Municipal Bonds continued | | | | | | | | |
| | | Principal | | Value (Note 1) |
| | | Amount (000s) | | (000s) |
| New York – continued | | | | | | | | |
| New York City Gen. Oblig.: – continued | | | | | | | | |
| Series E, 6% 8/1/11 | | $ | | 165 | | $ | | 170 |
| Series G, 5.25% 8/1/14 (AMBAC Insured) | | | | 2,500 | | | | 2,692 |
| Subseries 2005 F1: | | | | | | | | |
| 5% 9/1/15 | | | | 4,000 | | | | 4,284 |
| 5.25% 9/1/14 | | | | 5,060 | | | | 5,507 |
| New York City Indl. Dev. Agcy. Indl. Dev. Rev. (Japan Airlines | | | | | | | | |
| Co. Ltd. Proj.) Series 1991, 6% 11/1/15 (FSA Insured) (f) | | | | 1,385 | | | | 1,435 |
| New York City Indl. Dev. Agcy. Spl. Facilities Rev. (Term. One | | | | | | | | |
| Group Assoc. Proj.): | | | | | | | | |
| 5% 1/1/09 (f) | | | | 3,100 | | | | 3,190 |
| 6% 1/1/08 (f) | | | | 500 | | | | 501 |
| New York City Muni. Wtr. Fin. Auth. Wtr. & Swr. Sys. Rev.: | | | | | | | | |
| Series 2002 A, 5.125% 6/15/34 (FSA Insured) | | | | 3,300 | | | | 3,471 |
| Series A: | | | | | | | | |
| 5.125% 6/15/34 (MBIA Insured) | | | | 13,800 | | | | 14,514 |
| 6% 6/15/28 (Pre-Refunded to 6/15/12 @ 100) (g) | | | | 12,500 | | | | 14,135 |
| Series B, 5.125% 6/15/31 | | | | 10,545 | | | | 10,999 |
| Series G, 5.125% 6/15/32 | | | | 2,000 | | | | 2,079 |
| New York City Transitional Fin. Auth. Rev. Series A, 5.75% | | | | | | | | |
| 2/15/16 | | | | 130 | | | | 141 |
| New York City Trust Cultural Resources Rev. (Museum of | | | | | | | | |
| Modern Art Proj.) Series 2001 D, 5.125% 7/1/31 | | | | | | | | |
| (AMBAC Insured) | | | | 6,000 | | | | 6,305 |
| New York Local Govt. Assistance Corp. Series C, 5.5% 4/1/17 | | | | 22,015 | | | | 24,611 |
| New York State Dorm. Auth. Revs.: | | | | | | | | |
| (City Univ. Sys. Consolidation Proj.): | | | | | | | | |
| Series A: | | | | | | | | |
| 5.75% 7/1/09 | | | | 4,370 | | | | 4,643 |
| 5.75% 7/1/13 | | | | 8,750 | | | | 9,623 |
| Series C, 7.5% 7/1/10 (FGIC Insured) | | | | 21,250 | | | | 23,205 |
| (Long Island Jewish Med. Ctr. Proj.) 5.25% 7/1/11 | | | | | | | | |
| (MBIA Insured) | | | | 3,770 | | | | 3,981 |
| (State Univ. Edl. Facilities Proj.) Series A, 5.875% 5/15/17 | | | | | | | | |
| (FGIC Insured) | | | | 6,865 | | | | 8,044 |
| (Suffolk County Judicial Facilities Proj.) Series A, 9.5% | | | | | | | | |
| 4/15/14 | | | | 690 | | | | 946 |
| Series 2002 A, 5.75% 10/1/17 (MBIA Insured) | | | | 3,000 | | | | 3,337 |
See accompanying notes which are an integral part of the financial statements.
| Municipal Bonds continued | | | | | | | | |
| | | Principal | | Value (Note 1) |
| | | Amount (000s) | | (000s) |
| New York – continued | | | | | | | | |
| New York State Envir. Facilities Corp. Clean Wtr. & Drinking | | | | | | | | |
| Wtr. Rev. Series F: | | | | | | | | |
| 4.875% 6/15/18 | | $ | | 4,205 | | $ | | 4,343 |
| 4.875% 6/15/20 | | | | 8,500 | | | | 8,759 |
| 5% 6/15/15 | | | | 3,015 | | | | 3,151 |
| New York State Med. Care Facilities Fin. Agcy. Rev. | | | | | | | | |
| (Homeowner Mtg. Prog.) Series E, 6.2% 2/15/15 | | | | 1,325 | | | | 1,356 |
| New York State Thruway Auth. Gen. Rev. Series 2005 G, | | | | | | | | |
| 5.25% 1/1/27 (FSA Insured) | | | | 12,500 | | | | 13,590 |
| New York State Thruway Auth. Svc. Contract Rev. 5.5% | | | | | | | | |
| 4/1/16 | | | | 2,350 | | | | 2,556 |
| New York State Urban Dev. Corp. Rev. Series 2004 A2, 5.5% | | | | | | | | |
| 3/15/21 (MBIA Insured) | | | | 14,360 | | | | 16,563 |
| New York Transitional Fin. Auth. Rev.: | | | | | | | | |
| Series 2003 D, 5% 2/1/31 | | | | 3,500 | | | | 3,620 |
| Series 2004 C, 5% 2/1/33 (FGIC Insured) | | | | 5,000 | | | | 5,212 |
| Series B, 5.25% 8/1/19 | | | | 2,000 | | | | 2,170 |
| Niagara Falls City Niagara County Pub. Impt. (Pub. Impt. Proj.) | | | | | | | | |
| 7.5% 3/1/18 (MBIA Insured) | | | | 500 | | | | 673 |
| Sales Tax Asset Receivables Corp. Series A, 5.25% 10/15/27 | | | | | | | | |
| (AMBAC Insured) | | | | 10,500 | | | | 11,374 |
| Tobacco Settlement Fing. Corp.: | | | | | | | | |
| Series A1: | | | | | | | | |
| 5.25% 6/1/21 (AMBAC Insured) | | | | 5,645 | | | | 6,056 |
| 5.25% 6/1/22 (AMBAC Insured) | | | | 3,850 | | | | 4,120 |
| 5.5% 6/1/15 | | | | 33,500 | | | | 35,943 |
| Series C1: | | | | | | | | |
| 5.5% 6/1/14 | | | | 7,300 | | | | 7,745 |
| 5.5% 6/1/20 | | | | 2,200 | | | | 2,407 |
| Triborough Bridge & Tunnel Auth. (Convention Ctr. Proj.) | | | | | | | | |
| Series E, 7.25% 1/1/10 (XL Cap. Assurance, Inc. Insured) | | | | 7,350 | | | | 7,862 |
| Triborough Bridge & Tunnel Auth. Revs.: | | | | | | | | |
| Series 2005 A, 5.125% 1/1/22 | | | | 4,000 | | | | 4,235 |
| Series A, 5% 1/1/32 (MBIA Insured) | | | | 470 | | | | 487 |
| Series B: | | | | | | | | |
| 5.2% 1/1/27 (Pre-Refunded to 1/1/22 @ 100) (g) | | | | 2,000 | | | | 2,266 |
| 5.5% 1/1/30 (Pre-Refunded to 1/1/22 @ 100) (g) | | | | 4,000 | | | | 4,619 |
| Series SR, 5.5% 1/1/12 (Escrowed to Maturity) (g) | | | | 9,860 | | | | 10,573 |
| | | | | | | | | 466,911 |
See accompanying notes which are an integral part of the financial statements.
33 Annual Report
| Investments continued | | | | | | | | | | |
| |
| |
| Municipal Bonds continued | | | | | | | | | | |
| | | | | Principal | | Value (Note 1) |
| | | | | Amount (000s) | | (000s) |
| New York & New Jersey – 0.3% | | | | | | | | | | |
| Port Auth. of New York & New Jersey 124th Series, 5% | | | | | | | | |
| 8/1/13 (FGIC Insured) (f) | | | | $ | | 3,400 | | $ | | 3,520 |
| Port Auth. of New York & New Jersey Spl. Oblig. Rev. | | | | | | | | |
| (JFK Int’l. Air Term. Spl. Proj.) Series 6, 6.25% 12/1/13 | | | | | | | | |
| (MBIA Insured) (f) | | | | | | 10,275 | | | | 11,554 |
| | | | | | | | | | | 15,074 |
| |
| North Carolina – 4.9% | | | | | | | | | | |
| Catawba County Ctfs. of Prtn. (Pub. School and Cmnty. College | | | | | | | | |
| Proj.) 5.25% 6/1/20 (MBIA Insured) | | | | | | 1,800 | | | | 1,950 |
| Dare County Ctfs. of Prtn.: | | | | | | | | | | |
| 5.25% 6/1/17 (AMBAC Insured) | | | | | | 1,620 | | | | 1,758 |
| 5.25% 6/1/18 (AMBAC Insured) | | | | | | 1,620 | | | | 1,751 |
| 5.25% 6/1/19 (AMBAC Insured) | | | | | | 1,540 | | | | 1,667 |
| 5.25% 6/1/22 (AMBAC Insured) | | | | | | 1,620 | | | | 1,744 |
| 5.25% 6/1/23 (AMBAC Insured) | | | | | | 1,620 | | | | 1,733 |
| North Carolina Cap. Facilities Fin. Agcy. Rev. (Duke Univ. | | | | | | | | |
| Proj.) Series A: | | | | | | | | | | |
| 5.125% 10/1/41 | | | | | | 6,380 | | | | 6,638 |
| 5.125% 7/1/42 | | | | | | 34,200 | | | | 35,691 |
| 5.25% 7/1/42 | | | | | | 9,805 | | | | 10,333 |
| North Carolina Ctfs. of Prtn. (Repair and Renovation Proj.) | | | | | | | | |
| Series B, 5.25% 6/1/17 | | | | | | 3,600 | | | | 3,924 |
| North Carolina Eastern Muni. Pwr. Agcy. Pwr. Sys. Rev.: | | | | | | | | |
| Series A: | | | | | | | | | | |
| 5.5% 1/1/11 | | | | | | 8,700 | | | | 9,330 |
| 5.75% 1/1/26 | | | | | | 4,000 | | | | 4,225 |
| Series B: | | | | | | | | | | |
| 5.875% 1/1/21 (Pre-Refunded to 1/1/07 @ 102) (g) | | | | 22,725 | | | | 23,741 |
| 7% 1/1/08 | | | | | | 9,985 | | | | 10,586 |
| 7.25% 1/1/07 | | | | | | 8,375 | | | | 8,652 |
| Series C: | | | | | | | | | | |
| 5.25% 1/1/09 | | | | | | 2,500 | | | | 2,607 |
| 5.5% 1/1/07 | | | | | | 5,950 | | | | 6,054 |
| 7% 1/1/07 | | | | | | 15,715 | | | | 16,217 |
| Series D: | | | | | | | | | | |
| 5.375% 1/1/10 | | | | | | 4,500 | | | | 4,760 |
| 6.7% 1/1/19 | | | | | | 5,000 | | | | 5,534 |
| 6.75% 1/1/26 | | | | | | 7,000 | | | | 7,747 |
| North Carolina Infrastructure Fin. Corp. Ctfs. of Prtn. (North | | | | | | | | |
| Carolina Correctional Facilities Proj.) Series A: | | | | | | | | |
| 5% 2/1/19 | | | | | | 2,945 | | | | 3,123 |
| |
| See accompanying notes which are an integral part of the financial statements. | | | | |
| |
| Annual Report | | 34 | | | | | | | | |
| Municipal Bonds continued | | | | | | | | |
| | | Principal | | Value (Note 1) |
| | | Amount (000s) | | (000s) |
| North Carolina – continued | | | | | | | | |
| North Carolina Infrastructure Fin. Corp. Ctfs. of Prtn. (North | | | | | | | | |
| Carolina Correctional Facilities Proj.) Series A: – continued | | | | | | | | |
| 5% 2/1/20 | | $ | | 1,500 | | $ | | 1,587 |
| North Carolina Muni. Pwr. Agcy. #1 Catawba Elec. Rev.: | | | | | | | | |
| Series 1992, 7.25% 1/1/07 | | | | 5,200 | | | | 5,391 |
| Series 1999 B, 6.375% 1/1/08 | | | | 7,000 | | | | 7,359 |
| Series A: | | | | | | | | |
| 5.125% 1/1/15 (MBIA Insured) | | | | 6,860 | | | | 7,099 |
| 5.125% 1/1/17 (MBIA Insured) | | | | 15,350 | | | | 15,873 |
| 5.125% 1/1/17 (MBIA Insured) | | | | 16,000 | | | | 16,734 |
| Univ. of North Carolina at Chapel Hill Rev. Series A, 5% | | | | | | | | |
| 12/1/34 | | | | 5,000 | | | | 5,255 |
| | | | | | | | | 229,063 |
| |
| North Dakota 0.6% | | | | | | | | |
| Mercer County Poll. Cont. Rev. (Antelope Valley Station/Basin | | | | | | | | |
| Elec. Pwr. Coop. Proj.) 7.2% 6/30/13 (AMBAC Insured) | | | | 26,000 | | | | 30,358 |
| Ohio – 0.9% | | | | | | | | |
| Franklin County Hosp. Rev. 5.5% 5/1/28 (AMBAC Insured) | | | | 4,265 | | | | 4,713 |
| Lakewood Hosp. Impt. Rev. (Lakewood Hosp. Assoc. Proj.) | | | | | | | | |
| 5.5% 2/15/08 | | | | 1,225 | | | | 1,267 |
| Montgomery County Rev. (Catholic Health Initiatives Proj.) | | | | | | | | |
| Series A: | | | | | | | | |
| 6% 12/1/19 | | | | 4,905 | | | | 5,448 |
| 6% 12/1/19 (Escrowed to Maturity) (g) | | | | 5,095 | | | | 5,635 |
| 6% 12/1/26 (Escrowed to Maturity) (g) | | | | 10,000 | | | | 10,995 |
| Ohio Solid Waste Rev. (Waste Mgmt., Inc. Proj.) 4.85%, tender | | | | | | | | |
| 11/1/07 (c)(f) | | | | 5,000 | | | | 5,074 |
| Richland County Hosp. Facilities (MedCentral Health Sys. Proj.) | | | | | | | | |
| Series B, 6.375% 11/15/30 | | | | 3,000 | | | | 3,236 |
| Univ. of Cincinnati Ctfs. of Prtn. 5.125% 6/1/28 (MBIA | | | | | | | | |
| Insured) | | | | 3,750 | | | | 3,882 |
| | | | | | | | | 40,250 |
| |
| Oklahoma – 1.1% | | | | | | | | |
| Cherokee County Econ. Dev. Auth. Series A, 0% 11/1/11 | | | | | | | | |
| (Escrowed to Maturity) (g) | | | | 2,080 | | | | 1,647 |
| Oklahoma City Pub. Property Auth. Hotel Tax Rev.: | | | | | | | | |
| 5.5% 10/1/22 (FGIC Insured) | | | | 2,845 | | | | 3,148 |
| 5.5% 10/1/23 (FGIC Insured) | | | | 3,005 | | | | 3,314 |
See accompanying notes which are an integral part of the financial statements.
35 Annual Report
| Investments continued | | | | | | | | |
| |
| |
| Municipal Bonds continued | | | | | | | | |
| | | Principal | | Value (Note 1) |
| | | Amount (000s) | | (000s) |
| Oklahoma – continued | | | | | | | | |
| Oklahoma City Pub. Property Auth. Hotel Tax Rev.: - continued | | | | | | | | |
| 5.5% 10/1/24 (FGIC Insured) | | $ | | 3,175 | | $ | | 3,491 |
| Oklahoma Dev. Fin. Auth. Rev. (Saint John Health Sys. Proj.) | | | | | | | | |
| 6% 2/15/29 | | | | 15,000 | | | | 16,203 |
| Oklahoma Industries Auth. Rev. (Health Sys. Oblig. Group | | | | | | | | |
| Proj.) Series A: | | | | | | | | |
| 5.75% 8/15/29 (MBIA Insured) | | | | 11,420 | | | | 12,216 |
| 5.75% 8/15/29 (Pre-Refunded to 8/15/09 @ 101) (g) | | | | 8,330 | | | | 9,078 |
| | | | | | | | | 49,097 |
| |
| Oregon – 0.4% | | | | | | | | |
| Clackamas County School District #62C, Oregon City Series | | | | | | | | |
| 2004: | | | | | | | | |
| 5% 6/15/18 (FSA Insured) | | | | 1,325 | | | | 1,415 |
| 5% 6/15/19 (FSA Insured) | | | | 3,395 | | | | 3,611 |
| Clackamus County School District #7J: | | | | | | | | |
| 5.25% 6/1/23 (FSA Insured) | | | | 2,000 | | | | 2,263 |
| 5.25% 6/1/24 (FSA Insured) | | | | 2,605 | | | | 2,957 |
| Port Morrow Poll. Cont. Rev. (Pacific Northwest Proj.) Series A: | | | | | | | | |
| 8% 7/15/06 | | | | 385 | | | | 394 |
| 8% 7/15/07 | | | | 430 | | | | 442 |
| 8% 7/15/08 | | | | 480 | | | | 493 |
| 8% 7/15/09 | | | | 540 | | | | 555 |
| 8% 7/15/10 | | | | 605 | | | | 622 |
| 8% 7/15/11 | | | | 385 | | | | 396 |
| Washington County School District #15: | | | | | | | | |
| 5.5% 6/15/20 (FSA Insured) | | | | 1,770 | | | | 2,023 |
| 5.5% 6/15/21 (FSA Insured) | | | | 1,060 | | | | 1,211 |
| Yamhill County School District #029J Newberg 5.5% 6/15/20 | | | | | | | | |
| (FGIC Insured) | | | | 1,000 | | | | 1,149 |
| | | | | | | | | 17,531 |
| |
| Pennsylvania – 1.6% | | | | | | | | |
| Allegheny County Arpt. Rev. (Pittsburgh Int’l. Arpt. Proj.) | | | | | | | | |
| Series A1, 5.75% 1/1/07 (MBIA Insured) (f) | | | | 6,500 | | | | 6,640 |
| Annville-Cleona School District: | | | | | | | | |
| 5.5% 3/1/24 (FSA Insured) | | | | 1,350 | | | | 1,494 |
| 5.5% 3/1/25 (FSA Insured) | | | | 1,400 | | | | 1,546 |
| Canon McMillan School District Series 2001 B, 5.75% | | | | | | | | |
| 12/1/33 (FGIC Insured) | | | | 3,000 | | | | 3,275 |
See accompanying notes which are an integral part of the financial statements.
| Municipal Bonds continued | | | | | | | | |
| | | Principal | | Value (Note 1) |
| | | Amount (000s) | | (000s) |
| Pennsylvania – continued | | | | | | | | |
| Chester County Health & Ed. Facilities Auth. Health Sys. Rev. | | | | | | | | |
| (Jefferson Health Sys. Proj.) Series B, 5.25% 5/15/22 | | | | | | | | |
| (AMBAC Insured) | | $ | | 4,400 | | $ | | 4,568 |
| Montgomery County Higher Ed. & Health Auth. Hosp. Rev. | | | | | | | | |
| (Abington Memorial Hosp. Proj.) Series A: | | | | | | | | |
| 6% 6/1/22 (AMBAC Insured) | | | | 2,000 | | | | 2,395 |
| 6.1% 6/1/12 (AMBAC Insured) | | | | 3,000 | | | | 3,394 |
| 6.125% 6/1/14 (AMBAC Insured) | | | | 5,230 | | | | 6,057 |
| Northumberland County Auth. Commonwealth Lease Rev. | | | | | | | | |
| (State Correctional Facilities Proj.) 0% 10/15/13 (Escrowed | | | | | | | | |
| to Maturity) (g) | | | | 11,455 | | | | 8,399 |
| Pennsylvania Convention Ctr. Auth. Rev. Series A, 6.7% | | | | | | | | |
| 9/1/16 (Escrowed to Maturity) (g) | | | | 2,000 | | | | 2,351 |
| Pennsylvania Econ. Dev. Fing. Auth. Exempt Facilities Rev.: | | | | | | | | |
| (Amtrak Proj.) Series 2001 A, 6.375% 11/1/41 (f) | | | | 8,700 | | | | 9,332 |
| (Shippingport Proj.) Series A, 4.35%, tender 6/1/10 (c)(f) | | | | 3,100 | | | | 3,046 |
| Pennsylvania Econ. Dev. Fing. Auth. Solid Waste Disp. Rev. | | | | | | | | |
| (Waste Mgmt., Inc. Proj.) Series 2004 A, 3.95%, tender | | | | | | | | |
| 11/1/09 (c)(f) | | | | 5,000 | | | | 4,968 |
| Pennsylvania Higher Edl. Facilities Auth. Rev. (Univ. of | | | | | | | | |
| Pennsylvania Health Systems Proj.) Series A, 5% 8/15/16 | | | | | | | | |
| (AMBAC Insured) | | | | 3,600 | | | | 3,858 |
| Pennsylvania Hsg. Fin. Agcy.: | | | | | | | | |
| Series 54A, 5.375% 10/1/28 (f) | | | | 330 | | | | 331 |
| Series C, 8.1% 7/1/13 | | | | 555 | | | | 558 |
| Philadelphia Arpt. Rev. Series 1998, 5.375% 6/15/10 | | | | | | | | |
| (FGIC Insured) (f) | | | | 4,425 | | | | 4,681 |
| Philadelphia Gen. Oblig. Series 2003 A: | | | | | | | | |
| 5% 2/15/10 (XL Cap. Assurance, Inc. Insured) | | | | 2,000 | | | | 2,114 |
| 5% 2/15/12 (XL Cap. Assurance, Inc. Insured) | | | | 1,000 | | | | 1,075 |
| Philadelphia Redev. Auth. Rev. (Philadelphia Neighborhood | | | | | | | | |
| Transformation Initiative Proj.) Series 2005 C, 5% 4/15/31 | | | | | | | | |
| (FGIC Insured) | | | | 3,000 | | | | 3,140 |
| West Allegheny School District Series B, 5.25% 2/1/14 | | | | | | | | |
| (FGIC Insured) | | | | 2,010 | | | | 2,221 |
| | | | | | | | | 75,443 |
| |
| Puerto Rico 0.4% | | | | | | | | |
| Puerto Rico Commonwealth Hwy. & Trans. Auth. Trans. Rev.: | | | | | | | | |
| Series 1998, 5.75% 7/1/22 (CIFG North America Insured) | | | | 2,300 | | | | 2,566 |
See accompanying notes which are an integral part of the financial statements.
37 Annual Report
| Investments continued | | | | | | | | |
| |
| |
| Municipal Bonds continued | | | | | | | | |
| | | Principal | | Value (Note 1) |
| | | Amount (000s) | | (000s) |
| Puerto Rico continued | | | | | | | | |
| Puerto Rico Commonwealth Hwy. & Trans. Auth. Trans. Rev.: – | | | | | | | | |
| continued | | | | | | | | |
| 5.75% 7/1/19 (FGIC Insured) | | $ | | 3,240 | | $ | | 3,635 |
| Puerto Rico Commonwealth Infrastructure Fing. Auth.: | | | | | | | | |
| Series 2000 A: | | | | | | | | |
| 5.5% 10/1/32 (Escrowed to Maturity) (g) | | | | 6,515 | | | | 7,073 |
| 5.5% 10/1/40 (Escrowed to Maturity) (g) | | | | 1,100 | | | | 1,187 |
| Series C, 5.5% 7/1/21 (FGIC Insured) | | | | 3,000 | | | | 3,467 |
| | | | | | | | | 17,928 |
| |
| Rhode Island – 0.2% | | | | | | | | |
| Rhode Island Health & Edl. Bldg. Corp. Rev. (Univ. of Rhode | | | | | | | | |
| Island Univ. Revs. Proj.) Series A: | | | | | | | | |
| 5.25% 9/15/15 (AMBAC Insured) | | | | 1,725 | | | | 1,886 |
| 5.25% 9/15/16 (AMBAC Insured) | | | | 1,815 | | | | 1,987 |
| 5.25% 9/15/18 (AMBAC Insured) | | | | 1,005 | | | | 1,090 |
| 5.5% 9/15/24 (AMBAC Insured) | | | | 2,000 | | | | 2,197 |
| | | | | | | | | 7,160 |
| |
| South Carolina – 0.9% | | | | | | | | |
| Charleston County Gen. Oblig. 6% 6/1/13 (Pre-Refunded to | | | | | | | | |
| 6/1/06 @ 100) (g) | | | | 2,500 | | | | 2,528 |
| Lexington County Health Svcs. District, Inc. Hosp. Rev. 6% | | | | | | | | |
| 11/1/18 | | | | 3,500 | | | | 3,909 |
| Lexington One School Facilities Corp. Rev. (Lexington County | | | | | | | | |
| School District No. 1 Proj.) 5.25% 12/1/18 | | | | 1,540 | | | | 1,645 |
| Piedmont Muni. Pwr. Agcy. Elec. Rev. Series B, 5.25% 1/1/11 | | | | | | | | |
| (MBIA Insured) | | | | 8,625 | | | | 8,906 |
| Richland County Hosp. Facilities Rev. (Cmnty. Provider Pooled | | | | | | | | |
| Ln. Prog.) Series A, 7.125% 7/1/17 (Escrowed to | | | | | | | | |
| Maturity) (g) | | | | 1,500 | | | | 1,765 |
| Rock Hill Util. Sys. Rev. Series 2003 A: | | | | | | | | |
| 5.375% 1/1/17 (FSA Insured) | | | | 2,100 | | | | 2,289 |
| 5.375% 1/1/23 (FSA Insured) | | | | 1,025 | | | | 1,108 |
| South Carolina Jobs Econ. Dev. Auth. Hosp. Facilities Rev. | | | | | | | | |
| (Palmetto Health Alliance Proj.) Series A, 7.375% 12/15/21 | | | | | | | | |
| (Pre-Refunded to 12/15/10 @ 102) (g) | | | | 4,000 | | | | 4,731 |
| South Carolina Ports Auth. Ports Rev. 5.5% 7/1/08 | | | | | | | | |
| (FSA Insured) (f) | | | | 3,515 | | | | 3,686 |
| South Carolina Pub. Svc. Auth. Rev.: | | | | | | | | |
| (Santee Cooper Proj.) Series 2005 B, 5% 1/1/18 | | | | | | | | |
| (MBIA Insured) | | | | 2,200 | | | | 2,382 |
| Series 2005 B, 5% 1/1/19 (MBIA Insured) | | | | 2,500 | | | | 2,683 |
See accompanying notes which are an integral part of the financial statements.
| Municipal Bonds continued | | | | | | | | |
| | | Principal | | Value (Note 1) |
| | | Amount (000s) | | (000s) |
| South Carolina – continued | | | | | | | | |
| South Carolina Pub. Svc. Auth. Rev.: – continued | | | | | | | | |
| Series A, 5.5% 1/1/15 (FGIC Insured) | | $ | | 5,000 | | $ | | 5,658 |
| York County Wtr. & Swr. Rev. 5.25% 12/1/30 (MBIA Insured) | | | | 1,120 | | | | 1,187 |
| | | | | | | | | 42,477 |
| |
| South Dakota 0.0% | | | | | | | | |
| South Dakota Lease Rev. Series A, 6.625% 9/1/12 | | | | | | | | |
| (FSA Insured) | | | | 1,000 | | | | 1,167 |
| Tennessee – 1.0% | | | | | | | | |
| Knox County Health Edl. & Hsg. Facilities Board Hosp. | | | | | | | | |
| Facilities Rev. (Fort Sanders Alliance Proj.) Series C: | | | | | | | | |
| 5.25% 1/1/15 (MBIA Insured) | | | | 3,300 | | | | 3,619 |
| 5.75% 1/1/14 (MBIA Insured) | | | | 2,000 | | | | 2,262 |
| 7.25% 1/1/10 (MBIA Insured) | | | | 2,660 | | | | 3,018 |
| Memphis-Shelby County Arpt. Auth. Arpt. Rev.: | | | | | | | | |
| Series A: | | | | | | | | |
| 6.25% 2/15/09 (MBIA Insured) (f) | | | | 1,500 | | | | 1,613 |
| 6.25% 2/15/10 (MBIA Insured) (f) | | | | 1,000 | | | | 1,094 |
| 6.25% 2/15/11 (MBIA Insured) (f) | | | | 1,415 | | | | 1,570 |
| Series B, 6.5% 2/15/09 (MBIA Insured) (f) | | | | 500 | | | | 541 |
| Metropolitan Govt. Nashville & Davidson County Health & Edl. | | | | | | | | |
| Facilities Board Rev. (Ascension Health Cr. Group Proj.) | | | | | | | | |
| Series A, 6% 11/15/30 (AMBAC Insured) (Pre-Refunded to | | | | | | | | |
| 11/15/09 @ 101) (g) | | | | 1,630 | | | | 1,794 |
| Metropolitan Govt. Nashville & Davidson County Wtr. & Swr. | | | | | | | | |
| Sys. Rev. 7.7% 1/1/12 (FGIC Insured) | | | | 5,600 | | | | 6,505 |
| Shelby County Health Edl. & Hsg. Facility Board Hosp. Rev. | | | | | | | | |
| (Methodist Hosp. Proj.) 6.5% 9/1/26 (Pre-Refunded to | | | | | | | | |
| 9/1/12 @ 100) (g) | | | | 22,500 | | | | 26,258 |
| | | | | | | | | 48,274 |
| |
| Texas 13.7% | | | | | | | | |
| Abilene Independent School District: | | | | | | | | |
| 5% 2/15/16 | | | | 2,035 | | | | 2,186 |
| 5% 2/15/18 | | | | 2,000 | | | | 2,132 |
| 5% 2/15/23 | | | | 3,205 | | | | 3,377 |
| Aledo Independent School District Series A, 5.125% | | | | | | | | |
| 2/15/33 | | | | 2,775 | | | | 2,903 |
| Argyle Independent School District 5.25% 8/15/40 | | | | | | | | |
| (FSA Insured) | | | | 1,745 | | | | 1,854 |
| Arlington Gen. Oblig. 5% 8/15/18 (FGIC Insured) | | | | 1,215 | | | | 1,288 |
See accompanying notes which are an integral part of the financial statements.
39 Annual Report
| Investments continued | | | | | | | | |
| |
| |
| Municipal Bonds continued | | | | | | | | |
| | | Principal | | Value (Note 1) |
| | | Amount (000s) | | (000s) |
| Texas continued | | | | | | | | |
| Austin Independent School District: | | | | | | | | |
| 5.25% 8/1/10 (b) | | $ | | 5,245 | | $ | | 5,553 |
| 5.25% 8/1/11 (b) | | | | 2,000 | | | | 2,133 |
| 5.25% 8/1/15 (b) | | | | 2,000 | | | | 2,166 |
| Austin Util. Sys. Rev.: | | | | | | | | |
| 0% 5/15/10 (MBIA Insured) | | | | 7,970 | | | | 6,772 |
| 0% 5/15/17 (FGIC Insured) | | | | 4,700 | | | | 2,870 |
| 0% 5/15/18 (FGIC Insured) | | | | 5,000 | | | | 2,899 |
| Austin Wtr. & Wastewtr. Sys. Rev.: | | | | | | | | |
| 5% 11/15/12 (MBIA Insured) (b) | | | | 2,375 | | | | 2,512 |
| 5% 11/15/15 (MBIA Insured) (b) | | | | 1,250 | | | | 1,327 |
| Bexar Metropolitan Wtr. District Wtrwks. Sys. Rev. 5.375% | | | | | | | | |
| 5/1/20 (FSA Insured) | | | | 1,660 | | | | 1,792 |
| Birdville Independent School District: | | | | | | | | |
| 0% 2/15/11 | | | | 8,665 | | | | 7,116 |
| 0% 2/15/13 | | | | 13,690 | | | | 10,258 |
| Boerne Independent School District 5.25% 2/1/35 | | | | 11,000 | | | | 11,604 |
| Brazos River Auth. Poll. Cont. Rev. (Texas Utils. Elec. Co. Proj.) | | | | | | | | |
| Series 1995 B, 5.05%, tender 6/19/06 (c)(f) | | | | 4,815 | | | | 4,834 |
| Brownsville Util. Sys. Rev. Series A, 5% 9/1/31 | | | | | | | | |
| (AMBAC Insured) | | | | 5,000 | | | | 5,182 |
| Canyon Independent School District Series A, 5.5% 2/15/21 . | | | | 1,855 | | | | 2,027 |
| Cedar Hill Independent School District 0% 8/15/09 | | | | 1,575 | | | | 1,360 |
| Clint Independent School District: | | | | | | | | |
| 5.5% 8/15/19 | | | | 1,055 | | | | 1,155 |
| 5.5% 8/15/20 | | | | 1,110 | | | | 1,213 |
| 5.5% 8/15/21 | | | | 1,175 | | | | 1,284 |
| Conroe Independent School District: | | | | | | | | |
| Series B, 0% 2/15/10 | | | | 2,805 | | | | 2,403 |
| 0% 2/15/11 | | | | 1,500 | | | | 1,232 |
| Corpus Christi Util. Sys. Rev.: | | | | | | | | |
| 5.25% 7/15/18 (FSA Insured) | | | | 3,305 | | | | 3,639 |
| 5.25% 7/15/19 (FSA Insured) | | | | 4,000 | | | | 4,392 |
| Corsicana Independent School District 5.125% 2/15/34 | | | | 3,250 | | | | 3,413 |
| Cypress-Fairbanks Independent School District: | | | | | | | | |
| Series A: | | | | | | | | |
| 0% 2/15/12 | | | | 20,900 | | | | 16,397 |
| 0% 2/15/13 | | | | 6,425 | | | | 4,814 |
| 0% 2/15/14 | | | | 11,475 | | | | 8,198 |
| 0% 2/15/16 | | | | 9,700 | | | | 6,272 |
| 5.75% 2/15/19 | | | | 4,400 | | | | 4,844 |
See accompanying notes which are an integral part of the financial statements.
| Municipal Bonds continued | | | | | | | | |
| | | Principal | | Value (Note 1) |
| | | Amount (000s) | | (000s) |
| Texas continued | | | | | | | | |
| Cypress-Fairbanks Independent School District: - continued | | | | | | | | |
| 5.75% 2/15/21 | | $ | | 1,000 | | $ | | 1,099 |
| Denton County Lewisville Independent School District | | | | | | | | |
| Series 2004, 5% 8/15/16 | | | | 3,465 | | | | 3,670 |
| Duncanville Independent School District: | | | | | | | | |
| 5.65% 2/15/28 | | | | 30 | | | | 33 |
| 5.65% 2/15/28 (Pre-Refunded to 2/15/13 @ 100) (g) | | | | 5,520 | | | | 6,187 |
| Fort Worth Wtr. & Swr. Rev. 5% 2/15/16 (FSA Insured) | | | | 6,000 | | | | 6,412 |
| Frisco Independent School District: | | | | | | | | |
| Series C: | | | | | | | | |
| 5% 8/15/22 | | | | 2,000 | | | | 2,117 |
| 5% 8/15/26 | | | | 3,765 | | | | 3,949 |
| 5.375% 8/15/17 | | | | 2,715 | | | | 2,950 |
| Garland Independent School District Series A, 4% 2/15/17 | | | | 5,000 | | | | 4,964 |
| Garland Wtr. & Swr. Rev. 5.25% 3/1/23 | | | | | | | | |
| (AMBAC Insured) | | | | 1,315 | | | | 1,400 |
| Guadalupe-Blanco River Auth. Contract Rev. | | | | | | | | |
| (Western Canyon Reg’l. Wtr. Supply Proj.): | | | | | | | | |
| 5.25% 4/15/15 (MBIA Insured) | | | | 1,570 | | | | 1,706 |
| 5.25% 4/15/16 (MBIA Insured) | | | | 1,680 | | | | 1,818 |
| 5.25% 4/15/17 (MBIA Insured) | | | | 2,295 | | | | 2,477 |
| 5.25% 4/15/18 (MBIA Insured) | | | | 1,915 | | | | 2,058 |
| 5.25% 4/15/19 (MBIA Insured) | | | | 1,000 | | | | 1,077 |
| 5.25% 4/15/20 (MBIA Insured) | | | | 1,565 | | | | 1,680 |
| Harlandale Independent School District: | | | | | | | | |
| Series 2005, 5.7% 8/15/30 | | | | 100 | | | | 108 |
| 5.5% 8/15/35 | | | | 45 | | | | 48 |
| 6% 8/15/16 | | | | 35 | | | | 39 |
| Harris County Gen. Oblig.: | | | | | | | | |
| Series A, 5.25% 8/15/35 (FSA Insured) | | | | 11,400 | | | | 11,887 |
| 0% 10/1/13 (MBIA Insured) | | | | 5,550 | | | | 4,054 |
| 0% 10/1/14 (MBIA Insured) | | | | 11,000 | | | | 7,663 |
| 0% 8/15/25 (MBIA Insured) | | | | 3,000 | | | | 1,197 |
| 0% 8/15/28 (MBIA Insured) | | | | 5,000 | | | | 1,688 |
| Harris County Health Facilities Dev. Corp. Rev. (Saint Luke’s | | | | | | | | |
| Episcopal Hosp. Proj.) Series 2001 A: | | | | | | | | |
| 5.375% 2/15/26 (Pre-Refunded to 8/15/11 @ 100) (g) | | | | 3,000 | | | | 3,265 |
| 5.625% 2/15/13 (Pre-Refunded to 8/15/11 @ 100) (g) | | | | 4,625 | | | | 5,092 |
See accompanying notes which are an integral part of the financial statements.
41 Annual Report
| Investments continued | | | | | | | | |
| |
| |
| Municipal Bonds continued | | | | | | | | |
| | | Principal | | Value (Note 1) |
| | | Amount (000s) | | (000s) |
| Texas continued | | | | | | | | |
| Harris County Hosp. District Mtg. Rev.: | | | | | | | | |
| 7.4% 2/15/10 (AMBAC Insured) | | $ | | 1,340 | | $ | | 1,441 |
| 7.4% 2/15/10 (Escrowed to Maturity) (g) | | | | 695 | | | | 731 |
| Houston Area Wtr. Corp. Contract Rev. (Northeast Wtr. | | | | | | | | |
| Purification Proj.) 5.5% 3/1/15 (FGIC Insured) | | | | 1,985 | | | | 2,173 |
| Houston Arpt. Sys. Rev.: | | | | | | | | |
| Series A: | | | | | | | | |
| 5.625% 7/1/20 (FSA Insured) (f) | | | | 2,000 | | | | 2,145 |
| 5.625% 7/1/21 (FSA Insured) (f) | | | | 3,350 | | | | 3,591 |
| 6% 7/1/08 (FGIC Insured) (f) | | | | 1,000 | | | | 1,055 |
| Series B, 5.5% 7/1/30 (FSA Insured) | | | | 10,645 | | | | 11,372 |
| Houston Independent School District: | | | | | | | | |
| Series A, 0% 8/15/11 | | | | 6,400 | | | | 5,139 |
| 0% 8/15/13 | | | | 9,835 | | | | 7,200 |
| Humble Independent School District: | | | | | | | | |
| Series 2005 B, 5.25% 2/15/22 (FGIC Insured) | | | | 1,995 | | | | 2,157 |
| 0% 2/15/16 | | | | 3,000 | | | | 1,949 |
| 0% 2/15/17 | | | | 3,480 | | | | 2,150 |
| Hurst Euless Bedford Independent School District: | | | | | | | | |
| 0% 8/15/11 | | | | 3,620 | | | | 2,907 |
| 0% 8/15/12 | | | | 5,105 | | | | 3,916 |
| 0% 8/15/13 | | | | 3,610 | | | | 2,643 |
| Katy Independent School District: | | | | | | | | |
| Series A, 5% 2/15/16 | | | | 2,500 | | | | 2,658 |
| 0% 8/15/11 | | | | 4,170 | | | | 3,348 |
| Keller Independent School District: | | | | | | | | |
| Series 1996 A, 0% 8/15/17 | | | | 2,000 | | | | 1,200 |
| Series A, 5.125% 8/15/25 | | | | 1,975 | | | | 1,992 |
| Kennedale Independent School District 5.5% 2/15/29 | | | | 3,335 | | | | 3,642 |
| Killeen Independent School District: | | | | | | | | |
| 5.25% 2/15/17 | | | | 2,105 | | | | 2,260 |
| 5.25% 2/15/18 | | | | 1,325 | | | | 1,420 |
| La Joya Independent School District 5.25% 2/15/23 | | | | 2,940 | | | | 3,159 |
| Little Elm Independent School District 5.5% 8/15/21 | | | | 2,540 | | | | 2,746 |
| Lower Colorado River Auth. Rev.: | | | | | | | | |
| 5.25% 1/1/15 (Escrowed to Maturity) (g) | | | | 6,260 | | | | 6,921 |
| 5.25% 5/15/18 (AMBAC Insured) | | | | 2,020 | | | | 2,173 |
See accompanying notes which are an integral part of the financial statements.
| Municipal Bonds continued | | | | | | | | |
| | | Principal | | Value (Note 1) |
| | | Amount (000s) | | (000s) |
| Texas continued | | | | | | | | |
| Lower Colorado River Auth. Transmission Contract Rev. (LCRA | | | | | | | | |
| Transmission Services Corp. Proj.) Series C: | | | | | | | | |
| 5.25% 5/15/18 (AMBAC Insured) | | $ | | 1,000 | | $ | | 1,087 |
| 5.25% 5/15/19 (AMBAC Insured) | | | | 1,000 | | | | 1,086 |
| 5.25% 5/15/20 (AMBAC Insured) | | | | 2,000 | | | | 2,169 |
| Lubbock Gen. Oblig. (Wtrwks. Sys. Surplus Proj.) 5% 2/15/17 | | | | | | | | |
| (FSA Insured) | | | | 2,270 | | | | 2,419 |
| Mansfield Independent School District 5.5% 2/15/18 | | | | 3,855 | | | | 4,205 |
| Mesquite Independent School District: | | | | | | | | |
| 3.65%, tender 12/1/08 (Liquidity Facility JPMorgan Chase | | | | | | | | |
| Bank) (c) | | | | 6,400 | | | | 6,400 |
| 5.375% 8/15/11 | | | | 395 | | | | 413 |
| 5.375% 8/15/11 (Pre-Refunded to 8/15/08 @ 100) (g) | | | | 990 | | | | 1,040 |
| Midlothian Independent School District 0% 2/15/10 | | | | 1,525 | | | | 1,306 |
| Midway Independent School District 0% 8/15/19 | | | | 3,600 | | | | 1,949 |
| Montgomery County Gen. Oblig. Series A: | | | | | | | | |
| 5.625% 3/1/20 (g) | | | | 3,305 | | | | 3,669 |
| 5.625% 3/1/20 (FSA Insured) | | | | 495 | | | | 543 |
| Navasota Independent School District: | | | | | | | | |
| 5.25% 8/15/34 (FGIC Insured) | | | | 2,275 | | | | 2,422 |
| 5.5% 8/15/25 (FGIC Insured) | | | | 1,675 | | | | 1,846 |
| North Central Health Facilities Dev. Corp. Rev. Series 1997 B, | | | | | | | | |
| 5.75% 2/15/14 (MBIA Insured) | | | | 5,215 | | | | 5,888 |
| North East Texas Independent School District 5% 8/1/33 | | | | 8,200 | | | | 8,489 |
| Northside Independent School District 5.5% 2/15/12 | | | | 3,715 | | | | 4,045 |
| Pflugerville Gen. Oblig. 5.5% 8/1/22 (AMBAC Insured) | | | | 1,000 | | | | 1,096 |
| Prosper Independent School District 5.75% 8/15/29 | | | | 1,250 | | | | 1,379 |
| Robstown Independent School District 5.25% 2/15/29 | | | | 3,165 | | | | 3,369 |
| Rockwall Independent School District: | | | | | | | | |
| 5.375% 2/15/19 | | | | 1,450 | | | | 1,564 |
| 5.375% 2/15/20 | | | | 1,230 | | | | 1,328 |
| 5.375% 2/15/21 | | | | 1,560 | | | | 1,680 |
| 5.625% 2/15/12 | | | | 4,090 | | | | 4,477 |
| 5.625% 2/15/13 | | | | 1,190 | | | | 1,301 |
| 5.625% 2/15/14 | | | | 1,160 | | | | 1,268 |
| Round Rock Independent School District 0% 8/15/11 | | | | | | | | |
| (MBIA Insured) | | | | 4,300 | �� | | | 3,462 |
| Sabine River Auth. Poll. Cont. Rev. (Texas Utils. Elec. Co. Proj.) | | | | | | | | |
| Series B, 5.75%, tender 11/1/11 (c)(f) | | | | 16,000 | | | | 16,831 |
See accompanying notes which are an integral part of the financial statements.
43 Annual Report
| Investments continued | | | | | | | | |
| |
| |
| Municipal Bonds continued | | | | | | | | |
| | | Principal | | Value (Note 1) |
| | | Amount (000s) | | (000s) |
| Texas continued | | | | | | | | |
| San Antonio Elec. & Gas Systems Rev.: | | | | | | | | |
| Series B: | | | | | | | | |
| 0% 2/1/10 (Escrowed to Maturity) (g) | | $ | | 19,000 | | $ | | 16,282 |
| 0% 2/1/12 (Escrowed to Maturity) (g) | | | | 7,000 | | | | 5,518 |
| 3.55%, tender 12/1/07 (c) | | | | 7,500 | | | | 7,503 |
| 5.375% 2/1/18 (Pre-Refunded to 2/1/12 @ 100) (g) | | | | 5,000 | | | | 5,449 |
| 5.375% 2/1/19 (Pre-Refunded to 2/1/12 @ 100) (g) | | | | 6,000 | | | | 6,539 |
| San Antonio Gen. Oblig.: | | | | | | | | |
| 5.5% 2/1/15 | | | | 1,975 | | | | 2,158 |
| 5.5% 2/1/15 (Pre-Refunded to 2/1/12 @ 100) (g) | | | | 25 | | | | 28 |
| San Antonio Wtr. Sys. Rev.: | | | | | | | | |
| 5.875% 5/15/19 (Pre-Refunded to 11/15/09 @ 100) (g) | | | | 3,000 | | | | 3,263 |
| 6.5% 5/15/10 (Escrowed to Maturity) (g) | | | | 440 | | | | 494 |
| San Marcos Consolidated Independent School District: | | | | | | | | |
| 5% 8/1/15 | | | | 1,200 | | | | 1,294 |
| 5% 8/1/17 | | | | 1,175 | | | | 1,257 |
| 5% 8/1/19 | | | | 1,450 | | | | 1,542 |
| 5% 8/1/22 | | | | 1,680 | | | | 1,776 |
| 5% 8/1/23 | | | | 1,760 | | | | 1,857 |
| 5.625% 8/1/26 | | | | 2,210 | | | | 2,467 |
| Snyder Independent School District: | | | | | | | | |
| 5.25% 2/15/21 (AMBAC Insured) | | | | 1,035 | | | | 1,130 |
| 5.25% 2/15/22 (AMBAC Insured) | | | | 1,090 | | | | 1,187 |
| 5.25% 2/15/30 (AMBAC Insured) | | | | 1,750 | | | | 1,863 |
| Socorro Independent School District 5.375% 8/15/18 | | | | 1,090 | | | | 1,175 |
| South San Antonio Independent School District 5% 8/15/17 | | | | 1,025 | | | | 1,085 |
| Southlake Gen. Oblig. Series 2000 D, 5.75% 2/15/21 | | | | | | | | |
| (AMBAC Insured) | | | | 2,345 | | | | 2,508 |
| Southwest Higher Ed. Auth. Rev. (Southern Methodist Univ. | | | | | | | | |
| Proj.) 5.5% 10/1/17 (AMBAC Insured) | | | | 3,825 | | | | 4,201 |
| Spring Branch Independent School District: | | | | | | | | |
| Series 2001, 5.375% 2/1/13 | | | | 3,130 | | | | 3,384 |
| 5.375% 2/1/18 | | | | 3,600 | | | | 3,864 |
| Tarrant County Health Facilities Dev. Corp. Hosp. Rev. 5.375% | | | | | | | | |
| 11/15/20 | | | | 5,750 | | | | 5,943 |
| Texas Gen. Oblig.: | | | | | | | | |
| (College Student Ln. Prog.) 5% 8/1/12 (f) | | | | 6,655 | | | | 6,912 |
| 5.75% 8/1/26 | | | | 5,000 | | | | 5,472 |
| Texas Muni. Pwr. Agcy. Rev. 0% 9/1/16 (MBIA Insured) | | | | 5,365 | | | | 3,395 |
See accompanying notes which are an integral part of the financial statements.
| Municipal Bonds continued | | | | | | | | |
| | | Principal | | Value (Note 1) |
| | | Amount (000s) | | (000s) |
| Texas continued | | | | | | | | |
| Texas Pub. Fin. Auth. Bldg. Rev.: | | | | | | | | |
| Series 1990: | | | | | | | | |
| 0% 2/1/12 (MBIA Insured) | | $ | | 4,400 | | $ | | 3,468 |
| 0% 2/1/14 (MBIA Insured) | | | | 6,900 | | | | 4,957 |
| 0% 2/1/09 (MBIA Insured) | | | | 2,000 | | | | 1,789 |
| Texas Pub. Fin. Auth. Rev. (Stephen F. Austin State Univ. Proj.) | | | | | | | | |
| 5% 10/15/13 (MBIA Insured) | | | | 1,625 | | | | 1,755 |
| Texas Tpk. Auth. Central Tpk. Sys. Rev.: | | | | | | | | |
| 5.5% 8/15/39 (AMBAC Insured) | | | | 37,550 | | | | 40,318 |
| 5.75% 8/15/38 (AMBAC Insured) | | | | 27,550 | | | | 30,376 |
| Texas Tpk. Auth. Dallas North Tollway Rev.: | | | | | | | | |
| 0% 1/1/10 (Escrowed to Maturity) (g) | | | | 3,000 | | | | 2,588 |
| 5.25% 1/1/23 (FGIC Insured) | | | | 18,775 | | | | 19,163 |
| Texas Wtr. Dev. Board Rev. Series B: | | | | | | | | |
| 5.375% 7/15/16 | | | | 5,000 | | | | 5,334 |
| 5.625% 7/15/21 | | | | 5,900 | | | | 6,330 |
| Trinity River Auth. Rev. (Tarrant County Wtr. Proj.): | | | | | | | | |
| 5% 2/1/17 (MBIA Insured) | | | | 4,930 | | | | 5,303 |
| 5.5% 2/1/19 (Pre-Refunded to 2/1/13 @ 100) (g) | | | | 1,665 | | | | 1,850 |
| Tyler Health Facilities Dev. Corp. Hosp. Rev. (Mother Frances | | | | | | | | |
| Hosp. Reg’l. Health Care Ctr. Proj.): | | | | | | | | |
| 5.75% 7/1/27 | | | | 1,000 | | | | 1,038 |
| 6% 7/1/31 | | | | 6,225 | | | | 6,531 |
| Weatherford Independent School District: | | | | | | | | |
| Series 2000, 0% 2/15/25 (Pre-Refunded to 2/15/10 @ | | | | | | | | |
| 36.782) (g) | | | | 6,155 | | | | 1,944 |
| 0% 2/15/22 (Pre-Refunded to 2/15/10 @ 45.084) (g) | | | | 2,980 | | | | 1,154 |
| 0% 2/15/26 (Pre-Refunded to 2/15/10 @ 34.41) (g) | | | | 2,985 | | | | 882 |
| 0% 2/15/33 | | | | 6,985 | | | | 1,821 |
| White Settlement Independent School District: | | | | | | | | |
| 5.75% 8/15/30 | | | | 2,890 | | | | 3,192 |
| 5.75% 8/15/34 | | | | 3,000 | | | | 3,299 |
| Wichita Falls Wtr. & Swr. Rev. Series 2001, 5.375% 8/1/24 | | | | | | | | |
| (AMBAC Insured) | | | | 3,000 | | | | 3,193 |
| Williamson County Gen. Oblig.: | | | | | | | | |
| 5.5% 2/15/18 (FSA Insured) | | | | 60 | | | | 65 |
| 5.5% 2/15/20 (FSA Insured) | | | | 65 | | | | 70 |
| 5.5% 2/15/20 (Pre-Refunded to 2/15/11 @ 100) (g) | | | | 4,455 | | | | 4,860 |
| | | | | | | | | 641,684 |
See accompanying notes which are an integral part of the financial statements.
45 Annual Report
| Investments continued | | | | | | | | |
| |
| |
| Municipal Bonds continued | | | | | | | | |
| | | Principal | | Value (Note 1) |
| | | Amount (000s) | | (000s) |
| Utah 2.0% | | | | | | | | |
| Intermountain Pwr. Agcy. Pwr. Supply Rev.: | | | | | | | | |
| Series A: | | | | | | | | |
| 6% 7/1/16 (AMBAC Insured) | | $ | | 5,640 | | $ | | 5,956 |
| 6% 7/1/16 (Escrowed to Maturity) (g) | | | | 9,205 | | | | 9,607 |
| Series B: | | | | | | | | |
| 5.75% 7/1/16 (MBIA Insured) | | | | 11,230 | | | | 11,818 |
| 6% 7/1/16 (MBIA Insured) | | | | 29,500 | | | | 30,463 |
| Series D, 5% 7/1/21 (MBIA Insured) | | | | 12,100 | | | | 12,412 |
| Salt Lake City Hosp. Rev. (Intermountain Health Care Hosp., Inc. | | | | | | | | |
| Proj.) Series A, 8.125% 5/15/15 (Escrowed to Maturity) (g) | | | | 2,975 | | | | 3,613 |
| Salt Lake County Hosp. Rev. (IHC Health Svcs., Inc. Proj.) 5.5% | | | | | | | | |
| 5/15/11 (AMBAC Insured) | | | | 9,000 | | | | 9,808 |
| Utah Associated Muni. Pwr. Sys. Rev. (Payson Pwr. Proj.) | | | | | | | | |
| Series A: | | | | | | | | |
| 5.25% 4/1/16 (FSA Insured) | | | | 3,590 | | | | 3,881 |
| 5.25% 4/1/17 (FSA Insured) | | | | 4,335 | | | | 4,675 |
| | | | | | | | | 92,233 |
| |
| Vermont – 0.3% | | | | | | | | |
| Vermont Edl. & Health Bldgs. Fing. Agcy. Rev. (Fletcher Allen | | | | | | | | |
| Health Care, Inc. Proj.): | | | | | | | | |
| Series 2000 A, 6.125% 12/1/27 (AMBAC Insured) | | | | 8,600 | | | | 9,554 |
| Series A, 5.75% 12/1/18 (AMBAC Insured) | | | | 3,100 | | | | 3,401 |
| | | | | | | | | 12,955 |
| |
| Virginia – 0.2% | | | | | | | | |
| Amelia County Indl. Dev. Auth. Solid Waste Disp. Rev. (Waste | | | | | | | | |
| Mgmt., Inc. Proj.) 4.05%, tender 4/1/08 (c)(f) | | | | 2,200 | | | | 2,200 |
| Peninsula Ports Auth. Hosp. Facilities Rev. (Whittaker Memorial | | | | | | | | |
| Hosp. Proj.) 8.7% 8/1/23 | | | | 1,460 | | | | 1,679 |
| Virginia Beach Dev. Auth. Hosp. Facilities Rev. (Virginia Beach | | | | | | | | |
| Gen. Hosp. Proj.): | | | | | | | | |
| 6% 2/15/12 (AMBAC Insured) | | | | 2,150 | | | | 2,422 |
| 6% 2/15/13 (AMBAC Insured) | | | | 1,460 | | | | 1,663 |
| Virginia Hsg. Dev. Auth. Multi-family Hsg. Rev. Series I, 5.95% | | | | | | | | |
| 5/1/09 (f) | | | | 1,890 | | | | 1,944 |
| | | | | | | | | 9,908 |
| |
| Washington 5.5% | | | | | | | | |
| Chelan County Pub. Util. District #1 Columbia River-Rock | | | | | | | | |
| Island Hydro-Elec. Sys. Rev. Series A: | | | | | | | | |
| 0% 6/1/17 (MBIA Insured) | | | | 7,200 | | | | 4,310 |
| 0% 6/1/29 (MBIA Insured) | | | | 14,995 | | | | 4,753 |
See accompanying notes which are an integral part of the financial statements.
| Municipal Bonds continued | | | | | | | | |
| | | Principal | | Value (Note 1) |
| | | Amount (000s) | | (000s) |
| Washington – continued | | | | | | | | |
| Chelan County Pub. Util. District #1 Rev. Series 2005 A, | | | | | | | | |
| 5.125%, tender 7/1/15 (FGIC Insured) (c)(f) | | $ | | 2,430 | | $ | | 2,573 |
| Chelan County School District #246, Wenatchee 5.5% | | | | | | | | |
| 12/1/19 (FSA Insured) | | | | 3,535 | | | | 3,857 |
| Clark County School District #37, Vancouver Series C, 0% | | | | | | | | |
| 12/1/19 (FGIC Insured) | | | | 2,000 | | | | 1,070 |
| Douglas County Pub. Util. District #1 Wells Hydroelectric Rev. | | | | | | | | |
| Series A, 8.75% 9/1/18 | | | | 2,790 | | | | 3,050 |
| Energy Northwest Elec. Rev. (#3 Proj.) Series B, 6% 7/1/16 | | | | | | | | |
| (AMBAC Insured) | | | | 28,000 | | | | 31,616 |
| Grant County Pub. Util. District #2 Wanapum Hydro Elec. Rev. | | | | | | | | |
| Series B: | | | | | | | | |
| 5.25% 1/1/18 (FGIC Insured) (f) | | | | 1,590 | | | | 1,691 |
| 5.25% 1/1/20 (FGIC Insured) (f) | | | | 1,760 | | | | 1,854 |
| 5.25% 1/1/23 (FGIC Insured) (f) | | | | 2,055 | | | | 2,145 |
| King County Swr. Rev. Series B, 5.125% 1/1/33 | | | | | | | | |
| (FSA Insured) | | | | 22,390 | | | | 23,213 |
| Mead School District #354, Spokane County 5.375% 12/1/19 | | | | | | | | |
| (FSA Insured) | | | | 2,575 | | | | 2,822 |
| Pierce County School District #10 Tacoma Series A, 5% | | | | | | | | |
| 12/1/18 (FSA Insured) | | | | 4,000 | | | | 4,294 |
| Port of Seattle Rev.: | | | | | | | | |
| Series B: | | | | | | | | |
| 5.5% 9/1/09 (FGIC Insured) (f) | | | | 3,800 | | | | 3,889 |
| 5.6% 9/1/10 (FGIC Insured) (f) | | | | 4,005 | | | | 4,101 |
| Series D: | | | | | | | | |
| 5.75% 11/1/13 (FGIC Insured) (f) | | | | 1,500 | | | | 1,649 |
| 5.75% 11/1/14 (FGIC Insured) (f) | | | | 3,055 | | | | 3,352 |
| 5.75% 11/1/16 (FGIC Insured) (f) | | | | 2,250 | | | | 2,459 |
| Seattle Wtr. Sys. Rev. Series B, 5.75% 7/1/23 | | | | | | | | |
| (FGIC Insured) | | | | 3,175 | | | | 3,423 |
| Snohomish County Pub. Hosp. District #2 (Stevens Health Care | | | | | | | | |
| Proj.) 4.5% 12/1/11 (FGIC Insured) | | | | 1,155 | | | | 1,204 |
| Snohomish County School District #2, Everett 5.5% 12/1/16 | | | | | | | | |
| (FSA Insured) | | | | 1,475 | | | | 1,617 |
| Snohomish County School District #4, Lake Stevens 5.125% | | | | | | | | |
| 12/1/19 (FGIC Insured) | | | | 1,875 | | | | 2,024 |
| Spokane Pub. Facilities District Hotel/Motel Tax & Sales/Use | | | | | | | | |
| Tax Rev. 5.75% 12/1/19 (MBIA Insured) | | | | 2,000 | | | | 2,276 |
See accompanying notes which are an integral part of the financial statements.
47 Annual Report
| Investments continued | | | | | | | | |
| |
| |
| Municipal Bonds continued | | | | | | | | |
| | | Principal | | Value (Note 1) |
| | | Amount (000s) | | (000s) |
| Washington – continued | | | | | | | | |
| Thurston & Pierce Counties Cmnty. Schools 5.25% 12/1/17 | | | | | | | | |
| (FSA Insured) | | $ | | 2,000 | | $ | | 2,160 |
| Washington Gen. Oblig.: | | | | | | | | |
| Series 2001 C, 5.25% 1/1/16 | | | | 7,070 | | | | 7,585 |
| Series C, 5.25% 1/1/26 (FSA Insured) | | | | 15,800 | | | | 16,766 |
| Series R 97A: | | | | | | | | |
| 0% 7/1/17 | | | | 7,015 | | | | 4,146 |
| 0% 7/1/19 (MBIA Insured) | | | | 9,100 | | | | 4,960 |
| Washington Health Care Facilities Auth. Rev. | | | | | | | | |
| (Providence Health Systems Proj.) Series A, 5.5% 10/1/12 | | | | | | | | |
| (MBIA Insured) | | | | 5,455 | | | | 5,900 |
| Washington Pub. Pwr. Supply Sys. Nuclear Proj. #1 Rev.: | | | | | | | | |
| (Bonneville Pwr. Administration Proj.) Series B, 7% 7/1/08 . | | | | 1,000 | | | | 1,083 |
| Series A: | | | | | | | | |
| 5.75% 7/1/10 (MBIA Insured) | | | | 5,000 | | | | 5,156 |
| 7% 7/1/08 | | | | 310 | | | | 336 |
| Series B, 5.125% 7/1/13 | | | | 14,600 | | | | 15,234 |
| Washington Pub. Pwr. Supply Sys. Nuclear Proj. #2 Rev.: | | | | | | | | |
| Series A: | | | | | | | | |
| 0% 7/1/11 (Escrowed to Maturity) (g) | | | | 1,350 | | | | 1,089 |
| 5.125% 7/1/11 (FSA Insured) | | | | 10,420 | | | | 10,872 |
| 5.4% 7/1/12 | | | | 56,550 | | | | 61,846 |
| Washington Pub. Pwr. Supply Sys. Nuclear Proj. #3 Rev.: | | | | | | | | |
| Series A, 0% 7/1/12 (MBIA Insured) | | | | 4,000 | | | | 3,049 |
| 0% 7/1/10 (MBIA Insured) | | | | 2,800 | | | | 2,364 |
| | | | | | | | | 255,788 |
| |
| West Virginia – 0.1% | | | | | | | | |
| West Virginia Wtr. Dev. Auth. Infrastructure Rev. Series A, | | | | | | | | |
| 5.625% 10/1/26 (FSA Insured) | | | | 5,000 | | | | 5,393 |
| Wisconsin – 0.8% | | | | | | | | |
| Badger Tobacco Asset Securitization Corp. 6.125% | | | | | | | | |
| 6/1/27 | | | | 5,870 | | | | 6,181 |
| Douglas County Gen. Oblig. 5.5% 2/1/19 (FGIC Insured) | | | | 1,035 | | | | 1,125 |
| Evansville Cmnty. School District 5% 4/1/15 (FSA Insured) | | | | 2,200 | | | | 2,384 |
| Wisconsin Gen. Oblig. Series 1: | | | | | | | | |
| 5.25% 5/1/12 (MBIA Insured) (b) | | | | 4,000 | | | | 4,358 |
| 5.25% 5/1/13 (MBIA Insured) (b) | | | | 2,000 | | | | 2,193 |
See accompanying notes which are an integral part of the financial statements.
| Municipal Bonds continued | | | | | | | | | | | | |
| | | | | Principal | | | | Value (Note 1) |
| | | | | Amount (000s) | | | | (000s) |
| Wisconsin – continued | | | | | | | | | | | | |
| Wisconsin Health & Edl. Facilities Auth. Rev. (Wheaton | | | | | | | | | | |
| Franciscan Svcs., Inc. Proj.): | | | | | | | | | | | | |
| Series A: | | | | | | | | | | | | |
| 5.5% 8/15/15 | | | | $ | | 1,480 | | | | $ | | 1,591 |
| 5.5% 8/15/16 | | | | | | 1,545 | | | | | | 1,657 |
| 5.75% 8/15/30 | | | | | | 14,250 | | | | | | 15,151 |
| 6.25% 8/15/22 | | | | | | 4,300 | | | | | | 4,716 |
| | | | | | | | | | | | | 39,356 |
| |
| Wyoming – 0.1% | | | | | | | | | | | | |
| Gillette Spl. Purp. Wtr. & Swr. Utils. Sys. Rev. 7.7% 12/1/10 | | | | | | | | | | |
| (Escrowed to Maturity) (g) | | | | | | 4,960 | | | | | | 5,761 |
| TOTAL MUNICIPAL BONDS | | | | | | | | | | | | |
| (Cost $4,475,925) | | | | | | | | | | 4,663,407 |
| |
| Money Market Funds 0.0% | | | | | | | | | | | | |
| | | | | | | Shares | | | | | | |
| Fidelity Municipal Cash Central Fund, 3.53% (d)(e) | | | | | | | | | | |
| (Cost $139) | | | | | | 138,900 | | | | | | 139 |
| |
| TOTAL INVESTMENT PORTFOLIO 99.7% | | | | | | | | | | |
| (Cost $4,476,064) | | | | | | | | | | 4,663,546 |
| |
| NET OTHER ASSETS – 0.3% | | | | | | | | | | | | 12,659 |
| NET ASSETS 100% | | | | | | | | | | $ | | 4,676,205 |
Legend
(a) Debt obligation initially issued in zero
coupon form which converts to coupon
form at a specified rate and date. The
rate shown is the rate at period end.
(b) Security or a portion of the security
purchased on a delayed delivery or
when-issued basis.
(c) The coupon rate shown on floating or
adjustable rate securities represents the
rate at period end.
|
(d) Information in this report regarding
holdings by state and security types
does not reflect the holdings of the
Fidelity Municipal Cash Central Fund.
(e) Affiliated fund that is available only to
investment companies and other
accounts managed by Fidelity
Investments. The rate quoted is the
annualized seven-day yield of the fund
at period end. A complete unaudited
listing of the fund’s holdings as of its
most recent quarter end is available
upon request.
|
See accompanying notes which are an integral part of the financial statements.
49 Annual Report
Investments continued
(f) Private activity obligations whose
interest is subject to the federal
alternative minimum tax for individuals.
(g) Security collateralized by an amount
sufficient to pay interest and principal.
|
Affiliated Central Funds
Information regarding income received by the fund from the affiliated Central funds during the period is as follows:
| Fund | | Income received |
| | | (Amounts in thousands) |
| Fidelity Municipal Cash Central Fund | | $ | | 59 |
Other Information
The distribution of municipal securities by revenue source, as a percentage of total net assets, is as follows:
| General Obligations | | 33.0% |
| Electric Utilities | | 12.5% |
| Escrowed/Pre Refunded | | 11.1% |
| Water & Sewer | | 9.9% |
| Transportation | | 9.9% |
| Health Care | | 8.9% |
| Special Tax | | 7.7% |
| Others* (individually less than 5%) | | 7.0% |
| | | 100.0% |
| * Includes net other assets | | |
See accompanying notes which are an integral part of the financial statements.
Annual Report 50
| Financial Statements | | | | | | | | |
| |
| |
| Statement of Assets and Liabilities | | | | | | | | |
| Amounts in thousands (except per share amount) | | | | | | December 31, 2005 |
| |
| Assets | | | | | | | | |
| Investment in securities, at value | | | | | | | | |
| See accompanying schedule: | | | | | | | | |
| Unaffiliated issuers (cost $4,475,925) | | $ | | 4,663,407 | | | | |
| Affiliated Central Funds (cost $139) | | | | 139 | | | | |
| Total Investments (cost $4,476,064) | | | | | | $ | | 4,663,546 |
| Cash | | | | | | | | 15,915 |
| Receivable for fund shares sold | | | | | | | | 1,585 |
| Interest receivable | | | | | | | | 65,749 |
| Prepaid expenses | | | | | | | | 23 |
| Other affiliated receivables | | | | | | | | 1 |
| Other receivables | | | | | | | | 65 |
| Total assets | | | | | | | | 4,746,884 |
| |
| Liabilities | | | | | | | | |
| Payable for investments purchased | | | | | | | | |
| Regular delivery | | $ | | 23,238 | | | | |
| Delayed delivery | | | | 33,306 | | | | |
| Payable for fund shares redeemed | | | | 6,677 | | | | |
| Distributions payable | | | | 5,500 | | | | |
| Accrued management fee | | | | 1,451 | | | | |
| Other affiliated payables | | | | 378 | | | | |
| Other payables and accrued expenses | | | | 129 | | | | |
| Total liabilities | | | | | | | | 70,679 |
| |
| Net Assets | | | | | | $ | | 4,676,205 |
| Net Assets consist of: | | | | | | | | |
| Paid in capital | | | | | | $ | | 4,477,694 |
| Undistributed net investment income | | | | | | | | 2,276 |
| Accumulated undistributed net realized gain (loss) on | | | | | | | | |
| investments | | | | | | | | 8,753 |
| Net unrealized appreciation (depreciation) on | | | | | | | | |
| investments | | | | | | | | 187,482 |
| Net Assets, for 364,639 shares outstanding | | | | | | $ | | 4,676,205 |
| Net Asset Value, offering price and redemption price per | | | | | | | | |
| share ($4,676,205 ÷ 364,639 shares) | | | | | | $ | | 12.82 |
See accompanying notes which are an integral part of the financial statements.
51 Annual Report
| Financial Statements continued | | | | |
| |
| |
| Statement of Operations | | | | | | |
| Amounts in thousands | | | | Year ended December 31, 2005 |
| |
| Investment Income | | | | | | |
| Interest | | | | $ | | 218,823 |
| Income from affiliated Central Funds | | | | | | 59 |
| Total income | | | | | | 218,882 |
| |
| Expenses | | | | | | |
| Management fee | | $ | | 17,502 | | |
| Transfer agent fees | | | | 3,626 | | |
| Accounting fees and expenses | | | | 622 | | |
| Independent trustees’ compensation | | | | 22 | | |
| Custodian fees and expenses | | | | 72 | | |
| Registration fees | | | | 95 | | |
| Audit | | | | 84 | | |
| Legal | | | | 18 | | |
| Miscellaneous | | | | 109 | | |
| Total expenses before reductions | | | | 22,150 | | |
| Expense reductions | | | | (851) | | 21,299 |
| |
| Net investment income | | | | | | 197,583 |
| Realized and Unrealized Gain (Loss) | | | | |
| Net realized gain (loss) on: | | | | | | |
| Investment securities: | | | | | | |
| Unaffiliated issuers | | | | | | 68,032 |
| Change in net unrealized appreciation (depreciation) on | | | | |
| investment securities | | | | | | (95,214) |
| Net gain (loss) | | | | | | (27,182) |
| Net increase (decrease) in net assets resulting from | | | | |
| operations | | | | $ | | 170,401 |
See accompanying notes which are an integral part of the financial statements.
| Statement of Changes in Net Assets | | | | | | | | |
| | | | | Year ended | | | | Year ended |
| | | | | December 31, | | | | December 31, |
| Amounts in thousands | | | | 2005 | | | | 2004 |
| Increase (Decrease) in Net Assets | | | | | | | | |
| Operations | | | | | | | | |
| Net investment income | | $ | | 197,583 | | $ | | 205,280 |
| Net realized gain (loss) | | | | 68,032 | | | | 59,068 |
| Change in net unrealized appreciation (depreciation) . | | (95,214) | | | | (57,021) |
| Net increase (decrease) in net assets resulting | | | | | | | | |
| from operations | | | | 170,401 | | | | 207,327 |
| Distributions to shareholders from net investment income | | . | | (196,839) | | | | (205,071) |
| Distributions to shareholders from net realized gain | | | | (69,217) | | | | (44,159) |
| Total distributions | | | | (266,056) | | | | (249,230) |
| Share transactions | | | | | | | | |
| Proceeds from sales of shares | | | | 594,138 | | | | 596,717 |
| Reinvestment of distributions | | | | 179,128 | | | | 167,758 |
| Cost of shares redeemed | | | | (631,498) | | | | (876,891) |
| Net increase (decrease) in net assets resulting from | | | | | | | | |
| share transactions | | | | 141,768 | | | | (112,416) |
| Redemption fees | | | | 29 | | | | 39 |
| Total increase (decrease) in net assets | | | | 46,142 | | | | (154,280) |
| |
| Net Assets | | | | | | | | |
| Beginning of period | | | | 4,630,063 | | | | 4,784,343 |
| End of period (including undistributed net investment | | | | | | | | |
| income of $2,276 and undistributed net investment | | | | | | | | |
| income of $1,539, respectively) | | $ | | 4,676,205 | | $ | | 4,630,063 |
| |
| Other Information | | | | | | | | |
| Shares | | | | | | | | |
| Sold | | | | 45,559 | | | | 45,363 |
| Issued in reinvestment of distributions | | | | 13,796 | | | | 12,826 |
| Redeemed | | | | (48,528) | | | | (67,381) |
| Net increase (decrease) | | | | 10,827 | | | | (9,192) |
See accompanying notes which are an integral part of the financial statements.
53 Annual Report
| Financial Highlights | | | | | | | | | | | | | | | | | | | | |
| |
| Years ended December 31, | | | | 2005 | | | | 2004 | | | | 2003 | | | | 2002 | | | | 2001 |
| Selected Per Share Data | | | | | | | | | | | | | | | | | | | | |
| Net asset value, | | | | | | | | | | | | | | | | | | | | |
| beginning of period | | $ | | 13.09 | | $ | | 13.18 | | $ | | 13.22 | | $ | | 12.68 | | $ | | 12.70 |
| Income from Investment | | | | | | | | | | | | | | | | | | | | |
| Operations | | | | | | | | | | | | | | | | | | | | |
| Net investment incomeB | | | | 549 | | | | .571 | | | | .585 | | | | .603 | | | | .617D |
| Net realized and unrealized | | | | | | | | | | | | | | | | | | | | |
| gain (loss) | | | | (.080) | | | | .035 | | | | .162 | | | | .697 | | | | .011D |
| Total from investment operations | | | | .469 | | | | .606 | | | | .747 | | | | 1.300 | | | | .628 |
| Distributions from net investment | | | | | | | | | | | | | | | | | | | | |
| income | | | | (.547) | | | | (.571) | | | | (.585) | | | | (.600) | | | | (.613) |
| Distributions from net realized | | | | | | | | | | | | | | | | | | | | |
| gain | | | | (.192) | | | | (.125) | | | | (.202) | | | | (.160) | | | | (.035) |
| Total distributions | | | | (.739) | | | | (.696) | | | | (.787) | | | | (.760) | | | | (.648) |
| Redemption fees added to paid | | | | | | | | | | | | | | | | | | | | |
| in capitalB,E | | | | — | | | | — | | | | — | | | | — | | | | — |
| Net asset value, end of period | | $ | | 12.82 | | $ | | 13.09 | | $ | | 13.18 | | $ | | 13.22 | | $ | | 12.68 |
| Total ReturnA | | | | 3.66% | | | | 4.73% | | | | 5.80% | | | | 10.48% | | | | 5.00% |
| Ratios to Average Net AssetsC | | | | | | | | | | | | | | | | | | | | |
| Expenses before reductions | | | | 47% | | | | .47% | | | | .48% | | | | .48% | | | | .47% |
| Expenses net of fee waivers, | | | | | | | | | | | | | | | | | | | | |
| if any | | | | 47% | | | | .47% | | | | .48% | | | | .48% | | | | .47% |
| Expenses net of all reductions | | | | 45% | | | | .47% | | | | .47% | | | | .46% | | | | .43% |
| Net investment income | | | | 4.22% | | | | 4.36% | | | | 4.42% | | | | 4.62% | | | | 4.80%D |
| Supplemental Data | | | | | | | | | | | | | | | | | | | | |
| Net assets, end of period | | | | | | | | | | | | | | | | | | | | |
| (in millions) | | $ | | 4,676 | | $ | | 4,630 | | $ | | 4,784 | | $ | | 4,801 | | $ | | 4,527 |
| Portfolio turnover rate | | | | 25% | | | | 20% | | | | 23% | | | | 23% | | | | 27% |
A Total returns would have been lower had certain expenses not been reduced during the periods shown.
B Calculated based on average shares outstanding during the period.
C Expense ratios reflect operating expenses of the fund. Expenses before reductions do not reflect amounts reimbursed by the investment adviser
or expense offset arrangements and do not represent the amount paid by the fund during periods when reimbursements or reductions occur.
Expenses net of fee waivers reflect expenses after reimbursement by the investment adviser but prior to reductions from expense offset arrange
ments. Expenses net of all reductions represent the net expenses paid by the fund.
D Effective January 1, 2001, the fund adopted the provisions of the AICPA Audit and Accounting Guide for Investment Companies and began
amortizing premium and discount on all debt securities. Per share data and ratios for periods prior to adoption have not been restated to reflect
this change.
E Amount represents less than $.001 per share.
|
See accompanying notes which are an integral part of the financial statements.
Notes to Financial Statements
For the period ended December 31, 2005
(Amounts in thousands except ratios)
|
1. Significant Accounting Policies.
Fidelity Municipal Income Fund (the fund) is a fund of Fidelity Municipal Trust (the trust) and is authorized to issue an unlimited number of shares. On July 21, 2005, the Board of Trustees approved a change in the name of Spartan Municipal Income Fund to Fidelity Municipal Income Fund effective August 15, 2005. The trust is registered under the Investment Company Act of 1940, as amended (the 1940 Act), as an open end management investment company organized as a Massachusetts business trust. The fund may invest in affiliated money market central funds (Money Market Central Funds), which are open end investment companies available to investment companies and other accounts managed by Fidelity Management & Research Company (FMR) and its affili ates. The financial statements have been prepared in conformity with accounting principles generally accepted in the United States of America, which require manage ment to make certain estimates and assumptions at the date of the financial statements. The following summarizes the significant accounting policies of the fund:
Security Valuation. Investments are valued and net asset value per share is calculated (NAV calculation) as of the close of business of the New York Stock Exchange, normally 4:00 p.m. Eastern time. Wherever possible, the fund uses independent pricing services approved by the Board of Trustees to value its investments. Debt securities, including restricted securities, for which quotes are readily available, are valued by independent pricing services or by dealers who make markets in such securities. Pricing services consider yield or price of bonds of comparable quality, coupon, maturity and type as well as dealer supplied prices. When current market prices or quotations are not readily available or do not accurately reflect fair value, valuations may be determined in accor dance with procedures adopted by the Board of Trustees. The frequency of when fair value pricing is used is unpredictable. The value of securities used for NAV calculation under fair value pricing may differ from published prices for the same securities. Investments in open end mutual funds are valued at their closing net asset value each business day. Short term securities with remaining maturities of sixty days or less for which quotations are not readily available are valued at amortized cost, which approximates value.
Investment Transactions and Income. Security transactions are accounted for as of trade date. Gains and losses on securities sold are determined on the basis of identified cost. Interest income is accrued as earned. Interest income includes coupon interest and amortization of premium and accretion of discount on debt securities.
Expenses. Most expenses of the trust can be directly attributed to a fund. Expenses which cannot be directly attributed are apportioned among each fund in the trust.
Income Tax Information and Distributions to Shareholders. Each year, the fund intends to qualify as a regulated investment company by distributing all of its taxable income and realized gains under Subchapter M of the Internal Revenue Code. As a result, no provision for income taxes is required in the accompanying financial statements.
55 Annual Report
| Notes to Financial Statements continued | | |
(Amounts in thousands except ratios)
| | | | |
| 1. Significant Accounting Policies continued | | |
Income Tax Information and Distributions to Shareholders continued |
Dividends are declared daily and paid monthly from net investment income. Distribu tions from realized gains, if any, are recorded on the ex dividend date. Income and capital gain distributions are determined in accordance with income tax regulations, which may differ from generally accepted accounting principles. In addition, the fund will claim a portion of the payment made to redeeming shareholders as a distribution for income tax purposes.
Capital accounts within the financial statements are adjusted for permanent book tax differences. These adjustments have no impact on net assets or the results of operations. Temporary book tax differences will reverse in a subsequent period.
Book tax differences are primarily due to market discount and losses deferred due to futures transactions.
The fund purchases municipal securities whose interest, in the opinion of the issuer, is free from federal income tax. There is no assurance that the Internal Revenue Service (IRS) will agree with this opinion. In the event the IRS determines that the issuer does not comply with relevant tax requirements, interest payments from a security could become federally taxable, possibly retroactively to the date the security was issued.
The tax basis components of distributable earnings and the federal tax cost as of period end were as follows:
| Unrealized appreciation | | $ | | 196,952 | | | | |
| Unrealized depreciation | | | | (9,773) | | | | |
| Net unrealized appreciation (depreciation) | | | | 187,179 | | | | |
| Undistributed long term capital gain | | | | 7,434 | | | | |
| |
| Cost for federal income tax purposes | | $ | | 4,476,367 | | | | |
| |
| The tax character of distributions paid was as follows: | | | | |
| |
| | | | | December 31, 2005 | | | | December 31, 2004 |
| Tax exempt Income | | $ | | 196,839 | | $ | | 205,071 |
| Ordinary Income | | | | 5,428 | | | | — |
| Long term Capital Gains | | | | 63,789 | | | | 44,159 |
| Total | | $ | | 266,056 | | $ | | 249,230 |
Short Term Trading (Redemption) Fees. Shares held in the fund less than 30 days are subject to a redemption fee equal to .50% of the proceeds of the redeemed shares. All redemption fees, including any estimated redemption fees paid by FMR, are retained by the fund and accounted for as an addition to paid in capital.
Delayed Delivery Transactions and When Issued Securities. The fund may purchase or sell securities on a delayed delivery or when issued basis. Payment and delivery may take place after the customary settlement period for that security. The price of the underlying securities and the date when the securities will be delivered and paid for are fixed at the time the transaction is negotiated. During the time a delayed delivery sell is outstanding, the contract is marked to market daily and equivalent deliverable securities are held for the transaction. The value of the securities purchased on a delayed delivery or when issued basis are identified as such in the fund’s Schedule of Investments. The fund may receive compensation for interest forgone in the purchase of a delayed delivery or when issued security. With respect to purchase commitments, the fund identifies securities as segregated in its records with a value at least equal to the amount of the commitment. Losses may arise due to changes in the value of the underly ing securities or if the counterparty does not perform under the contract’s terms, or if the issuer does not issue the securities due to political, economic, or other factors.
3. Purchases and Sales of Investments.
Purchases and sales of securities, other than short term securities and U.S. government securities, aggregated $1,208,244 and $1,147,438, respectively.
4. Fees and Other Transactions with Affiliates.
Management Fee. FMR and its affiliates provide the fund with investment manage ment related services for which the fund pays a monthly management fee. The manage ment fee is the sum of an individual fund fee rate that is based on an annual rate of .25% of the fund’s average net assets and a group fee rate that averaged .12% during the period. The group fee rate is based upon the average net assets of all the mutual funds advised by FMR. The group fee rate decreases as assets under management increase and increases as assets under management decrease. For the period, the total annual management fee rate was ..37% of the fund’s average net assets.
Transfer Agent and Accounting Fees. Citibank, N.A. (Citibank) is the custodian, transfer agent and shareholder servicing agent for the fund. Citibank has entered into a sub arrangement with Fidelity Service Company, Inc. (FSC), an affiliate of FMR, under which FSC performs the activities associated with the fund’s transfer and shareholder servicing agent and accounting functions. The fund pays account fees and asset based fees that vary according to account size and type of account. FSC pays for typesetting, printing and mailing of shareholder reports, except proxy statements. The accounting fee is based on the level of average net assets for the month. For the period, the transfer agent fees were equivalent to an annual rate of .08% of average net assets.
57 Annual Report
| Notes to Financial Statements continued | | |
| (Amounts in thousands except ratios) | | |
| |
| 4. Fees and Other Transactions with Affiliates continued |
Affiliated Central Funds. The fund may invest in Money Market Central Funds which seek preservation of capital and current income and are managed by Fidelity Investments Money Management, Inc. (FIMM), an affiliate of FMR. The Money Market Central Funds do not pay a management fee.
5. Committed Line of Credit.
|
The fund participates with other funds managed by FMR in a $4.2 billion credit facility (the “line of credit”) to be utilized for temporary or emergency purposes to fund share holder redemptions or for other short term liquidity purposes. The fund has agreed to pay commitment fees on its pro rata portion of the line of credit. During the period, there were no borrowings on this line of credit.
Through arrangements with the fund’s custodian and transfer agent, credits realized as a result of uninvested cash balances were used to reduce the fund’s expenses. During the period, these credits reduced the fund’s custody and transfer agent expenses by $69 and $782, respectively.
The fund’s organizational documents provide former and current trustees and officers with a limited indemnification against liabilities arising in connection with the perfor mance of their duties to the fund. In the normal course of business, the fund may also enter into contracts that provide general indemnifications. The fund’s maximum expo sure under these arrangements is unknown as this would be dependent on future claims that may be made against the fund. The risk of material loss from such claims is considered remote.
Report of Independent Registered Public Accounting Firm
To the Trustees of Fidelity Municipal Trust and the Shareholders of Fidelity Municipal Income Fund (formerly Spartan Municipal Income Fund):
In our opinion, the accompanying statement of assets and liabilities, including the schedule of investments, and the related statements of operations and of changes in net assets and the financial highlights present fairly, in all material respects, the financial position of Fidelity Municipal Income Fund (formerly Spartan Municipal Income Fund) (a fund of Fidelity Municipal Trust) at December 31, 2005 and the results of its operations, the changes in its net assets and the financial highlights for the periods indicated, in conformity with accounting principles generally accepted in the United States of America. These financial statements and financial highlights (hereafter referred to as “financial statements”) are the responsibility of the Fidelity Municipal Income Fund’s management; our responsibility is to express an opinion on these financial statements based on our audits. We conducted our audits of these financial statements in accordance with the standards of the Public Company Accounting Oversight Board (United States). Those standards require that we plan and perform the audit to obtain reasonable assurance about whether the financial statements are free of material misstatement. An audit includes examining, on a test basis, evidence supporting the amounts and disclosures in the financial statements, assessing the accounting principles used and significant estimates made by management, and evaluating the overall financial statement presentation. We believe that our audits, which included confirmation of securities at December 31, 2005 by correspon dence with the custodian and brokers, provide a reasonable basis for our opinion.
/s/ PricewaterhouseCoopers LLP
PricewaterhouseCoopers LLP
Boston, Massachusetts
February 9, 2006
|
59 Annual Report
Trustees and Officers
The Trustees, Member of the Advisory Board, and executive officers of the trust and fund, as applicable, are listed below. The Board of Trustees governs the fund and is responsible for protecting the interests of shareholders. The Trustees are experienced executives who meet periodically throughout the year to oversee the fund’s activities, review contractual arrangements with companies that provide services to the fund, and review the fund’s performance. Except for William O. McCoy and Albert R. Gamper, Jr., each of the Trustees oversees 326 funds advised by FMR or an affiliate. Mr. McCoy oversees 328 funds advised by FMR or an affiliate. Mr. Gamper oversees 235 funds advised by FMR or an affiliate.
The Trustees hold office without limit in time except that (a) any Trustee may resign; (b) any Trustee may be removed by written instrument, signed by at least two thirds of the number of Trustees prior to such removal; (c) any Trustee who requests to be retired or who has become incapacitated by illness or injury may be retired by written instru ment signed by a majority of the other Trustees; and (d) any Trustee may be removed at any special meeting of shareholders by a two thirds vote of the outstanding voting securities of the trust. Each Trustee who is not an interested person (as defined in the 1940 Act) (Independent Trustee), shall retire not later than the last day of the calendar year in which his or her 72nd birthday occurs. The Independent Trustees may waive this mandatory retirement age policy with respect to individual Trustees. The executive officers and Advisory Board Member hold office without limit in time, except that any officer and Advisory Board Member may resign or may be removed by a vote of a majority of the Trustees at any regular meeting or any special meeting of the Trustees. Except as indicated, each individual has held the office shown or other offices in the same company for the past five years.
The fund’s Statement of Additional Information (SAI) includes more information about the Trustees. To request a free copy, call Fidelity at 1-800-544-8544.
Correspondence intended for each Trustee who is an interested person may be sent to Fidelity Investments, 82 Devonshire Street, Boston, Massachusetts 02109.
| | Name, Age; Principal Occupation
Edward C. Johnson 3d (75)
|
Year of Election or Appointment: 1984
Mr. Johnson is Chairman of the Board of Trustees. Mr. Johnson serves as Chief Executive Officer, Chairman, and a Director of FMR Corp.; a Director and Chairman of the Board and of the Executive Committee of FMR; Chairman and a Director of Fidelity Management & Research (Far East) Inc.; Chairman and a Director of Fidelity Investments Money Management, Inc.; and Chairman (2001 present) and a Director (2000 present) of FMR Co., Inc.
| | Name, Age; Principal Occupation
Stephen P. Jonas (52)
|
Year of Election or Appointment: 2005
Mr. Jonas is Senior Vice President of Municipal Income (2005 present). He also serves as Senior Vice President of other Fidelity funds (2005 present). Mr. Jonas is Executive Director of FMR (2005 present). Previously, Mr. Jonas served as President of Fidelity Enterprise Opera tions and Risk Services (2004 2005), Chief Administrative Officer (2002 2004), and Chief Financial Officer of FMR Co. (1998 2000). Mr. Jonas has been with Fidelity Investments since 1987 and has held various financial and management positions including Chief Financial Officer of FMR. In addition, he serves on the Boards of Boston Ballet (2003 present) and Simmons College (2003 present).
Year of Election or Appointment: 2003
Mr. Reynolds is a Director (2003 present) and Chief Operating Officer (2002 present) of FMR Corp. He also serves on the Board at Fidelity Investments Canada, Ltd. (2000 present). Previously, Mr. Reynolds served as President of Fidelity Investments Institutional Retirement Group (1996 2000).
* Trustees have been determined to be “Interested Trustees” by virtue of, among other things, their affiliation with the trust or various entities under common control with FMR.
61 Annual Report
Trustees and Officers - continued
Independent Trustees:
Correspondence intended for each Independent Trustee (that is, the Trustees other than the Interested Trustees) may be sent to Fidelity Investments, P.O. Box 55235, Boston, Massachusetts 02205 5235.
| | Name, Age; Principal Occupation
Dennis J. Dirks (57)
|
Year of Election or Appointment: 2005
Prior to his retirement in May 2003, Mr. Dirks was Chief Operating Officer and a member of the Board of The Depository Trust & Clearing Corporation (DTCC) (1999 2003). He also served as President, Chief Operating Officer, and Board member of The Depository Trust Company (DTC) (1999 2003) and President and Board member of the National Securities Clearing Corporation (NSCC) (1999 2003). In addi tion, Mr. Dirks served as Chief Executive Officer and Board member of the Government Securities Clearing Corporation (2001 2003) and Chief Executive Officer and Board member of the Mortgage Backed Securities Clearing Corporation (2001 2003). Mr. Dirks also serves as a Trustee of Manhattan College (2005 present).
| | Albert R. Gamper, Jr. (63)
|
Year of Election or Appointment: 2006
Mr. Gamper also serves as a Trustee (2006 present) or Member of the Advisory Board (2005 present) of other investment companies advised by FMR. Prior to his retirement in December 2004, Mr. Gamper served as Chairman of the Board of CIT Group Inc. (commercial finance). During his tenure with CIT Group Inc. Mr. Gamper served in numerous senior management positions, including Chairman (1987 1989; 1999 2001; 2002 2004), Chief Executive Officer (1987 2004), and President (1989 2002). He currently serves as a member of the Board of Directors of Public Service Enterprise Group (utilities, 2001 present), Chairman of the Board of Governors, Rutgers University (2004 present), and Chairman of the Board of Saint Barnabas Health Care System.
Name, Age; Principal Occupation
Robert M. Gates (62)
|
Year of Election or Appointment: 1997
Dr. Gates is Chairman of the Independent Trustees (2006 present). Dr. Gates is President of Texas A&M University (2002 present). He was Director of the Central Intelligence Agency (CIA) from 1991 to 1993. From 1989 to 1991, Dr. Gates served as Assistant to the President of the United States and Deputy National Security Advisor. Dr. Gates is a Director of NACCO Industries, Inc. (mining and manufacturing), Parker Drilling Co., Inc. (drilling and rental tools for the energy industry, 2001 present), and Brinker International (restaurant management, 2003 present). Previously, Dr. Gates served as a Director of LucasVarity PLC (automotive components and diesel engines), a Director of TRW Inc. (automotive, space, defense, and information technology), and Dean of the George Bush School of Government and Public Service at Texas A&M University (1999 2001). Dr. Gates also is a Trustee of the Forum for International Policy.
Year of Election or Appointment: 2004
Dr. Heilmeier is Chairman Emeritus of Telcordia Technologies (commu nication software and systems), where prior to his retirement, he served as company Chairman and Chief Executive Officer. He currently serves on the Boards of Directors of The Mitre Corporation (systems engineer ing and information technology support for the government), and HRL Laboratories (private research and development, 2004 present). He is Chairman of the General Motors Science & Technology Advisory Board and a Life Fellow of the Institute of Electrical and Electronics Engineers (IEEE) (2000 present). Dr. Heilmeier is a member of the Defense Science Board and the National Security Agency Advisory Board. He is also a member of the National Academy of Engineering, the American Academy of Arts and Sciences, and the Board of Overseers of the School of Engineering and Applied Science of the University of Pennsylvania. Previously, Dr. Heilmeier served as a Director of TRW Inc. (automotive, space, defense, and information technology, 1992 2002), Compaq (1994 2002), Automatic Data Processing, Inc. (ADP) (technology based business outsourcing, 1995 2002), INET Technol ogies Inc. (telecommunications network surveillance, 2001 2004), and Teletech Holdings (customer management services). He is the recipient of the 2005 Kyoto Prize in Advanced Technology for his invention of the liquid display.
63 Annual Report
Trustees and Officers - continued
| | Name, Age; Principal Occupation
Marie L. Knowles (59)
|
Year of Election or Appointment: 2001
Prior to Ms. Knowles’ retirement in June 2000, she served as Executive Vice President and Chief Financial Officer of Atlantic Richfield Company (ARCO) (diversified energy, 1996 2000). From 1993 to 1996, she was a Senior Vice President of ARCO and President of ARCO Transportation Company. She served as a Director of ARCO from 1996 to 1998. She currently serves as a Director of Phelps Dodge Corporation (copper mining and manufacturing) and McKesson Corporation (healthcare service, 2002 present). Ms. Knowles is a Trustee of the Brookings Institu tion and the Catalina Island Conservancy and also serves as a member of the Advisory Board for the School of Engineering of the University of Southern California.
Year of Election or Appointment: 2000
Mr. Lautenbach has been a partner of Clayton, Dubilier & Rice, Inc. (private equity investment firm) since September 1998. Previously, Mr. Lautenbach was with the International Business Machines Corpora tion (IBM) from 1968 until his retirement in 1998. Mr. Lautenbach serves as a Director of Italtel Holding S.p.A. (telecommunications (Milan, Italy), 2004 present) and Eaton Corporation (diversified industrial) as well as the Philharmonic Center for the Arts in Naples, Florida. He also is a member of the Board of Trustees of Fairfield University (2005 present), as well as a member of the Council on Foreign Relations.
Year of Election or Appointment: 1997
Prior to his retirement in December 1994, Mr. McCoy was Vice Chair man of the Board of BellSouth Corporation (telecommunications) and President of BellSouth Enterprises. He is currently a Director of Liberty Corporation (holding company), Duke Realty Corporation (real estate), and Progress Energy, Inc. (electric utility). He is also a partner of Frank lin Street Partners (private investment management firm) and a member of the Research Triangle Foundation Board. In addition, Mr. McCoy served as the Interim Chancellor (1999 2000) and a member of the Board of Visitors for the University of North Carolina at Chapel Hill and currently serves on the Board of Directors of the University of North Carolina Health Care System and the Board of Visitors of the Kenan Flagler Business School (University of North Carolina at Chapel Hill). He also served as Vice President of Finance for the University of North Carolina (16 school system).
Name, Age; Principal Occupation
Cornelia M. Small (61)
|
Year of Election or Appointment: 2005
Ms. Small is a member (2000 present) and Chairperson (2002 present) of the Investment Committee, and a member (2002 present) of the Board of Trustees of Smith College. Previously, she served as Chief Investment Officer (1999 2000), Director of Global Equity Investments (1996 1999), and a member of the Board of Directors of Scudder, Stevens & Clark (1990 1997) and Scudder Kemper Investments (1997 1998). In addition, Ms. Small served as Co Chair (2000 2003) of the Annual Fund for the Fletcher School of Law and Diplomacy.
William S. Stavropoulos (66)
|
Year of Election or Appointment: 2002
Mr. Stavropoulos is Chairman of the Board (2000 present) and a Member of the Board of Directors of The Dow Chemical Company. Since joining The Dow Chemical Company in 1967, Mr. Stavropoulos served in numerous senior management positions, including President (1993 2000; 2002 2003), CEO (1995 2000; 2002 2004), and Chair man of the Executive Committee (2000 2004). Currently, he is a Direc tor of NCR Corporation (data warehousing and technology solutions), BellSouth Corporation (telecommunications), Chemical Financial Corpo ration, Maersk Inc. (industrial conglomerate, 2002 present), and Metal mark Capital (private equity investment firm, 2005 present). He also serves as a member of the Board of Trustees of the American Enterprise Institute for Public Policy Research. In addition, Mr. Stavropoulos is a member of The Business Council, J.P. Morgan International Council and the University of Notre Dame Advisory Council for the College of Science.
Year of Election or Appointment: 2005
Prior to his retirement in 2001, Mr. Wolfe was Chairman and Chief Executive Officer of Hershey Foods Corporation (1993 2001). He cur rently serves as a member of the boards of Adelphia Communications Corporation (2003 present), Bausch & Lomb, Inc., and Revlon Inc. (2004 present).
65 Annual Report
Trustees and Officers - continued
Advisory Board Member and Executive Officers:
Correspondence intended for each executive officer and Mr. Lynch may be sent to Fidelity Investments, 82 Devonshire Street, Boston, Massachusetts 02109.
| | Name, Age; Principal Occupation
Peter S. Lynch (61)
|
Year of Election or Appointment: 2003
Member of the Advisory Board of Fidelity Municipal Trust. Vice Chair man and a Director of FMR, and Vice Chairman (2001 present) and a Director (2000 present) of FMR Co., Inc. Previously, Mr. Lynch served as a Trustee of the Fidelity funds (1990 2003). In addition, he serves as a Trustee of Boston College, Massachusetts Eye & Ear Infirmary, Historic Deerfield, John F. Kennedy Library, and the Museum of Fine Arts of Boston.
Year of Election or Appointment: 2005
Vice President of Municipal Income. Mr. Donovan also serves as Vice President of Fidelity’s High Income Funds (2005 present), Fidelity’s Fixed Income Funds (2005 present), certain Asset Allocation Funds (2005 present), and certain Balanced Funds (2005 present). Mr. Donovan also serves as Executive Vice President of FMR (2005 present) and FMRC (2005 present). Previously, Mr. Donovan served as Vice President and Director of Fidelity’s International Equity Trading group (1998 2005).
Year of Election or Appointment: 2005
Vice President of Municipal Income. Mr. Murphy also serves as Vice President of Fidelity’s Money Market Funds (2002 present), certain Asset Allocation Funds (2003 present), Fidelity’s Investment Grade Bond Funds (2005 present), and Fidelity’s Balanced Funds (2005 present). He serves as Senior Vice President (2000 present) and Head (2004 present) of the Fidelity Investments Fixed Income Division. Mr. Murphy is also a Senior Vice President of FIMM (2003 present) and a Vice President of FMR (2000 present). Previously, Mr. Murphy served as Money Market Group Leader (2002 2004), Bond Group Leader (2000 2002), and Vice President of Fidelity’s Taxable Bond Funds (2000 2002) and Fidelity’s Municipal Bond Funds (2001 2002). Mr. Murphy joined Fidelity Invest ments in 1989 as a portfolio manager in the Bond Group.
Name, Age; Principal Occupation
Thomas J. Silvia (44)
|
Year of Election or Appointment: 2005
Vice President of Municipal Income. Mr. Silvia also serves as Vice Presi dent of Fidelity’s Bond Funds (2005 present), certain Balanced Funds (2005 present), certain Asset Allocation Funds (2005 present), and Senior Vice President and Bond Group Leader of the Fidelity Investments Fixed Income Division (2005 present). Previously, Mr. Silvia served as Director of Fidelity’s Taxable Bond portfolio managers (2002 2004) and a portfolio manager in the Bond Group (1997 2004).
Christine J. Thompson (47)
|
Year of Election or Appointment: 2002
Vice President of Municipal Income. Ms. Thompson also serves as Vice President of other funds advised by FMR. Prior to assuming her current responsibilities, Ms. Thompson worked as an analyst and manager.
Year of Election or Appointment: 1998
Secretary of Municipal Income. He also serves as Secretary of other Fidelity funds; Vice President, General Counsel, and Secretary of FMR Co., Inc. (2001 present) and FMR; Assistant Secretary of Fidelity Man agement & Research (U.K.) Inc. (2001 present), Fidelity Management & Research (Far East) Inc. (2001 present), and Fidelity Investments Money Management, Inc. (2001 present). Mr. Roiter is an Adjunct Member, Faculty of Law, at Boston College Law School (2003 present). Previously, Mr. Roiter served as Vice President and Secretary of Fidelity Distributors Corporation (FDC) (1998 2005).
Year of Election or Appointment: 2003
Assistant Secretary of Municipal Income. Mr. Fross also serves as Assis tant Secretary of other Fidelity funds (2003 present), Vice President and Secretary of FDC (2005 present), and is an employee of FMR.
Year of Election or Appointment: 2004
President, Treasurer, and Anti Money Laundering (AML) officer of Municipal Income. Ms. Reynolds also serves as President, Treasurer, and AML officer of other Fidelity funds (2004) and is a Vice President (2003) and an employee (2002) of FMR. Before joining Fidelity Invest ments, Ms. Reynolds worked at PricewaterhouseCoopers LLP (PwC) (1980 2002), where she was most recently an audit partner with PwC’s investment management practice.
67 Annual Report
Trustees and Officers - continued
| | Name, Age; Principal Occupation
Paul M. Murphy (58)
|
Year of Election or Appointment: 2005
Chief Financial Officer of Municipal Income. Mr. Murphy also serves as Chief Financial Officer of other Fidelity funds (2005 present). He also serves as Senior Vice President of Fidelity Pricing and Cash Manage ment Services Group (FPCMS).
| | Kenneth A. Rathgeber (58)
|
Year of Election or Appointment: 2004
Chief Compliance Officer of Municipal Income. Mr. Rathgeber also serves as Chief Compliance Officer of other Fidelity funds (2004) and Executive Vice President of Risk Oversight for Fidelity Investments (2002). Previously, he served as Executive Vice President and Chief Operating Officer for Fidelity Investments Institutional Services Company, Inc. (1998 2002).
Year of Election or Appointment: 2003
Deputy Treasurer of Municipal Income. Mr. Hebble also serves as Deputy Treasurer of other Fidelity funds (2003), and is an employee of FMR. Before joining Fidelity Investments, Mr. Hebble worked at Deutsche Asset Management where he served as Director of Fund Accounting (2002 2003) and Assistant Treasurer of the Scudder Funds (1998 2003).
Year of Election or Appointment: 2005
Deputy Treasurer of Municipal Income. Mr. Mehrmann also serves as Deputy Treasurer of other Fidelity funds (2005 present) and is an employee of FMR. Previously, Mr. Mehrmann served as Vice President of Fidelity Investments Institutional Services Group (FIIS)/Fidelity Investments Institutional Operations Corporation, Inc. (FIIOC) Client Services (1998 2004).
| | Kimberley H. Monasterio (42)
|
Year of Election or Appointment: 2004
Deputy Treasurer of Municipal Income. Ms. Monasterio also serves as Deputy Treasurer of other Fidelity funds (2004) and is an employee of FMR (2004). Before joining Fidelity Investments, Ms. Monasterio served as Treasurer (2000 2004) and Chief Financial Officer (2002 2004) of the Franklin Templeton Funds and Senior Vice President of Franklin Templeton Services, LLC (2000 2004).
Name, Age; Principal Occupation
Kenneth B. Robins (36)
|
Year of Election or Appointment: 2005
Deputy Treasurer of Municipal Income. Mr. Robins also serves as Deputy Treasurer of other Fidelity funds (2005 present) and is an employee of FMR (2004 present). Before joining Fidelity Investments, Mr. Robins worked at KPMG LLP, where he was a partner in KPMG’s department of professional practice (2002 2004) and a Senior Manager (1999 2000). In addition, Mr. Robins served as Assistant Chief Accountant, United States Securities and Exchange Commission (2000 2002).
Year of Election or Appointment: 2005
Assistant Treasurer of Municipal Income. Mr. Byrnes also serves as Assistant Treasurer of other Fidelity funds (2005 present) and is an employee of FMR (2005 present). Previously, Mr. Byrnes served as Vice President of FPCMS (2003 2005). Before joining Fidelity Investments, Mr. Byrnes worked at Deutsche Asset Management where he served as Vice President of the Investment Operations Group (2000 2003).
Year of Election or Appointment: 1986
Assistant Treasurer of Municipal Income. Mr. Costello also serves as Assistant Treasurer of other Fidelity funds and is an employee of FMR.
Year of Election or Appointment: 2004
Assistant Treasurer of Municipal Income. Mr. Lydecker also serves as Assistant Treasurer of other Fidelity funds (2004) and is an employee of FMR.
Year of Election or Appointment: 2002
Assistant Treasurer of Municipal Income. Mr. Osterheld also serves as Assistant Treasurer of other Fidelity funds (2002) and is an employee of FMR.
Year of Election or Appointment: 2005
Assistant Treasurer of Municipal Income. Mr. Ryan also serves as Assis tant Treasurer of other Fidelity funds (2005 present) and is an employee of FMR (2005 present). Previously, Mr. Ryan served as Vice President of Fund Reporting in FPCMS (1999 2005).
69 Annual Report
Trustees and Officers - continued
| | Name, Age; Principal Occupation
Salvatore Schiavone (40)
|
Year of Election or Appointment: 2005
Assistant Treasurer of Municipal Income. Mr. Schiavone also serves as Assistant Treasurer of other Fidelity funds (2005 present) and is an employee of FMR (2005 present). Before joining Fidelity Investments, Mr. Schiavone worked at Deutsche Asset Management, where he most recently served as Assistant Treasurer (2003 2005) of the Scudder Funds and Vice President and Head of Fund Reporting (1996 2003).
The Board of Trustees of Fidelity Municipal Income Fund voted to pay on February 6, 2006, to shareholders of record at the opening of business on February 3, 2006, a distribution of $.02 per share derived from capital gains realized from sales of portfolio securities.
The fund hereby designates as a capital gain dividend with respect to the taxable year ended December 31, 2005, $57,911,374, or, if subsequently determined to be different, the net capital gain of such year.
During fiscal year ended 2005, 100% of the fund’s income dividends was free from federal income tax, and 6.65% of the fund’s income dividends was subject to the federal alternative minimum tax.
The fund will notify shareholders in January 2006 of amounts for use in preparing 2005 income tax returns.
71 Annual Report
Proxy Voting Results
A special meeting of the fund’s shareholders was held on January 18, 2006. The results of votes taken among shareholders on the proposal before them are reported below. Each vote reported represents one dollar of net asset value held on the record date for the meeting.
| PROPOSAL 1 | | | | |
| To elect a Board of Trustees.A | | |
| | | # of | | % of |
| | | Votes | | Votes |
| |
| Dennis J. Dirks | | | | |
| Affirmative | | 4,012,578,790.76 | | 95.238 |
| Withheld | | 200,653,306.55 | | 4.762 |
| TOTAL | | 4,213,232,097.31 | | 100.000 |
| Albert R. Gamper, Jr. | | |
| Affirmative | | 4,015,643,707.84 | | 95.310 |
| Withheld | | 197,588,389.47 | | 4.690 |
| TOTAL | | 4,213,232,097.31 | | 100.000 |
| Robert M. Gates | | |
| Affirmative | | 4,004,345,809.00 | | 95.042 |
| Withheld | | 208,886,288.31 | | 4.958 |
| TOTAL | | 4,213,232,097.31 | | 100.000 |
| George H. Heilmeier | | |
| Affirmative | | 4,008,127,523.93 | | 95.132 |
| Withheld | | 205,104,573.38 | | 4.868 |
| TOTAL | | 4,213,232,097.31 | | 100.000 |
| Abigail P. Johnson | | |
| Affirmative | | 3,993,175,527.66 | | 94.777 |
| Withheld | | 220,056,569.65 | | 5.223 |
| TOTAL | | 4,213,232,097.31 | | 100.000 |
| Edward C. Johnson 3d | | |
| Affirmative | | 3,987,333,615.26 | | 94.638 |
| Withheld | | 225,898,482.05 | | 5.362 |
| TOTAL | | 4,213,232,097.31 | | 100.000 |
| Stephen P. Jonas | | |
| Affirmative | | 4,010,007,680.52 | | 95.177 |
| Withheld | | 203,224,416.79 | | 4.823 |
| TOTAL | | 4,213,232,097.31 | | 100.000 |
| | | # of | | % of |
| | | Votes | | Votes |
| |
| Marie L. Knowles | | |
| Affirmative | | 4,010,231,303.96 | | 95.182 |
| Withheld | | 203,000,793.35 | | 4.818 |
| TOTAL | | 4,213,232,097.31 | | 100.000 |
| |
| Ned C. Lautenbach | | |
| Affirmative | | 4,009,136,177.44 | | 95.156 |
| Withheld | | 204,095,919.87 | | 4.844 |
| TOTAL | | 4,213,232,097.31 | | 100.000 |
| |
| William O. McCoy | | |
| Affirmative | | 4,001,996,735.35 | | 94.986 |
| Withheld | | 211,235,361.96 | | 5.014 |
| TOTAL | | 4,213,232,097.31 | | 100.000 |
| |
| Robert L. Reynolds | | |
| Affirmative | | 4,010,560,206.65 | | 95.190 |
| Withheld | | 202,671,890.66 | | 4.810 |
| TOTAL | | 4,213,232,097.31 | | 100.000 |
| |
| Cornelia M. Small | | |
| Affirmative | | 4,011,161,760.21 | | 95.204 |
| Withheld | | 202,070,337.10 | | 4.796 |
| TOTAL | | 4,213,232,097.31 | | 100.000 |
| |
| William S. Stavropoulos | | |
| Affirmative | | 4,001,217,912.57 | | 94.968 |
| Withheld | | 212,014,184.74 | | 5.032 |
| TOTAL | | 4,213,232,097.31 | | 100.000 |
| |
| Kenneth L. Wolfe | | |
| Affirmative | | 4,011,439,868.05 | | 95.211 |
| Withheld | | 201,792,229.26 | | 4.789 |
| TOTAL | | 4,213,232,097.31 | | 100.000 |
A Denotes trust-wide proposal and voting results.
Annual Report 72
Managing Your Investments
Fidelity offers several ways to conveniently manage your personal investments via your telephone or PC. You can access your account information, conduct trades and research your investments 24 hours a day.
By Phone
Fidelity Automated Service Telephone provides a single toll free number to access account balances, positions, quotes and trading. It’s easy to navigate the service, and on your first call, the system will help you create a personal identification number (PIN) for security.


By PC
Fidelity’s web site on the Internet provides a wide range of information, including daily financial news, fund performance, interactive planning tools and news about Fidelity products and services.

* When you call the quotes line, please remember that a fund’s yield and return will vary and, except for money market funds, share price will also vary. This means that you may have a gain or loss when you sell your shares. There is no assurance that money market funds will be able to maintain a stable $1 share price; an investment in a money market fund is not insured or guar anteed by the U.S. government. Total returns are historical and include changes in share price, reinvestment of dividends and capital gains, and the effects of any sales charges.
73 Annual Report
To Visit Fidelity
For directions and hours,
please call 1-800-544-9797.
Arizona
7001 West Ray Road
Chandler, AZ
7373 N. Scottsdale Road
Scottsdale, AZ
California
815 East Birch Street
Brea, CA
1411 Chapin Avenue
Burlingame, CA
851 East Hamilton Avenue
Campbell, CA
19200 Von Karman Avenue
Irvine, CA
601 Larkspur Landing Circle
Larkspur, CA
10100 Santa Monica Blvd.
Los Angeles, CA
27101 Puerta Real
Mission Viejo, CA
73 575 El Paseo
Palm Desert, CA
251 University Avenue
Palo Alto, CA
123 South Lake Avenue
Pasadena, CA
16995 Bernardo Ctr. Drive
Rancho Bernardo, CA
1740 Arden Way
Sacramento, CA
7676 Hazard Center Drive
San Diego, CA
8 Montgomery Street
San Francisco, CA
3793 State Street
Santa Barbara, CA
21701 Hawthorne Boulevard
Torrance, CA
2001 North Main Street
Walnut Creek, CA
6300 Canoga Avenue
Woodland Hills, CA
|
Colorado
1625 Broadway
Denver, CO
9185 East Westview Road
Littleton, CO
Connecticut
48 West Putnam Avenue
Greenwich, CT
265 Church Street
New Haven, CT
300 Atlantic Street
Stamford, CT
29 South Main Street
West Hartford, CT
Delaware
222 Delaware Avenue
Wilmington, DE
Florida
4400 N. Federal Highway
Boca Raton, FL
121 Alhambra Plaza
Coral Gables, FL
2948 N. Federal Highway
Ft. Lauderdale, FL
1907 West State Road 434
Longwood, FL
8880 Tamiami Trail, North
Naples, FL
3550 Tamiami Trail, South
Sarasota, FL
1502 N. Westshore Blvd.
Tampa, FL
2465 State Road 7
Wellington, FL
3501 PGA Boulevard
West Palm Beach, FL
Georgia
3445 Peachtree Road, N.E.
Atlanta, GA
1000 Abernathy Road
Atlanta, GA
Illinois
One North LaSalle Street
Chicago, IL
875 North Michigan Ave.
Chicago, IL
1415 West 22nd Street
Oak Brook, IL
|
1700 East Golf Road
Schaumburg, IL
3232 Lake Avenue
Wilmette, IL
Indiana
4729 East 82nd Street
Indianapolis, IN
Kansas
5400 College Boulevard
Overland Park, KS
Maine
Three Canal Plaza
Portland, ME
Maryland
7315 Wisconsin Avenue
Bethesda, MD
One W. Pennsylvania Ave.
Towson, MD
Massachusetts
801 Boylston Street
Boston, MA
155 Congress Street
Boston, MA
300 Granite Street
Braintree, MA
44 Mall Road
Burlington, MA
405 Cochituate Road
Framingham, MA
416 Belmont Street
Worcester, MA
Michigan
500 E. Eisenhower Pkwy.
Ann Arbor, MI
280 Old N. Woodward Ave.
Birmingham, MI
43420 Grand River Avenue
Novi, MI
29155 Northwestern Hwy.
Southfield, MI
Minnesota
7600 France Avenue South
Edina, MN
Missouri
8885 Ladue Road
Ladue, MO
|
Annual Report 74
Nevada
2225 Village Walk Drive
Henderson, NV
New Jersey
150 Essex Street
Millburn, NJ
56 South Street
Morristown, NJ
396 Route 17, North
Paramus, NJ
3518 Route 1 North
Princeton, NJ
530 Highway 35
Shrewsbury, NJ
New York
1055 Franklin Avenue
Garden City, NY
37 West Jericho Turnpike
Huntington Station, NY
1271 Avenue of the Americas
New York, NY
61 Broadway
New York, NY
350 Park Avenue
New York, NY
200 Fifth Avenue
New York, NY
733 Third Avenue
New York, NY
11 Penn Plaza
New York, NY
2070 Broadway
New York, NY
1075 Northern Blvd.
Roslyn, NY
North Carolina
4611 Sharon Road
Charlotte, NC
Ohio
3805 Edwards Road
Cincinnati, OH
1324 Polaris Parkway
Columbus, OH
28699 Chagrin Boulevard
Woodmere Village, OH
Oregon
16850 SW 72nd Avenue
Tigard, OR
|
Pennsylvania
600 West DeKalb Pike
King of Prussia, PA
1735 Market Street
Philadelphia, PA
12001 Perry Highway
Wexford, PA
Rhode Island
47 Providence Place
Providence, RI
Tennessee
6150 Poplar Avenue
Memphis, TN
Texas
10000 Research Boulevard
Austin, TX
4001 Northwest Parkway
Dallas, TX
12532 Memorial Drive
Houston, TX
2701 Drexel Drive
Houston, TX
6500 N. MacArthur Blvd.
Irving, TX
6005 West Park Boulevard
Plano, TX
14100 San Pedro
San Antonio, TX
1576 East Southlake Blvd.
Southlake, TX
19740 IH 45 North
Spring, TX
Utah
215 South State Street
Salt Lake City, UT
Virginia
1861 International Drive
McLean, VA
Washington
411 108th Avenue, N.E.
Bellevue, WA
1518 6th Avenue
Seattle, WA
Washington, DC
1900 K Street, N.W.
Washington, DC
Wisconsin
595 North Barker Road
Brookfield, WI
|
Fidelity Brokerage Services, Inc., 100 Summer St., Boston, MA 02110 Member NYSE/SIPC
75 Annual Report
75
To Write Fidelity
We’ll give your correspondence immediate attention and send you written confirmation upon completion of your request.

| | (such as changing name, address, bank, etc.)
Fidelity Investments
P.O. Box 770001
Cincinnati, OH 45277-0002
|

| | Buying shares
Fidelity Investments
P.O. Box 770001
Cincinnati, OH 45277-0003
Overnight Express
Fidelity Investments
Attn: Distribution Services
100 Crosby Parkway KC1H
Covington, KY 41015
Selling shares
Fidelity Investments
P.O. Box 770001
Cincinnati, OH 45277-0035
Overnight Express
Fidelity Investments
Attn: Distribution Services
100 Crosby Parkway KC1H
Covington, KY 41015
General Correspondence
Fidelity Investments
P.O. Box 500
Merrimack, NH 03054-0500
|

Buying shares
Fidelity Investments
P.O. Box 770001
Cincinnati, OH 45277-0003
Selling shares
Fidelity Investments
P.O. Box 770001
Cincinnati, OH 45277-0035
Overnight Express
Fidelity Investments
Attn: Distribution Services
100 Crosby Parkway KC1H
Covington, KY 41015
General Correspondence
Fidelity Investments
P.O. Box 500
Merrimack, NH 03054-0500
|
Annual Report 76
77 Annual Report
79 Annual Report
Investment Adviser
Fidelity Management & Research
Company
Boston, MA
Investment Sub Adviser
Fidelity Investments Money
Management, Inc.
Fidelity International Investment Advisors
Fidelity International Investment Advisors
(U.K.) Limited
General Distributor
Fidelity Distributors Corporation
Boston, MA
Transfer and Service Agents
Citibank N.A.
New York NY
Fidelity Service Company, Inc.
Boston, MA
Custodian
Citibank N.A.
New York NY
|
| The Fidelity Telephone Connection |
| Mutual Fund 24-Hour Service |
| Exchanges/Redemptions | | |
| and Account Assistance | | 1-800-544-6666 |
| Product Information | | 1-800-544-6666 |
| Retirement Accounts | | 1-800-544-4774 |
| (8 a.m. - 9 p.m.) | | |
| TDD Service | | 1-800-544-0118 |
| for the deaf and hearing impaired |
| (9 a.m. - 9 p.m. Eastern time) |
| Fidelity Automated Service | | |
| Telephone(FAST® ) (automated phone logo) | | 1-800-544-5555 |
| (automated phone logo) Automated line for quickest service |
HIY UANN-0206
1.787741.102
|

Fidelity®
Ohio Municipal Income Fund
(formerly Spartan® Ohio
Municipal Income Fund)
and
Fidelity
Ohio Municipal Money Market
Fund
|
| | Annual Report
December 31, 2005
|


| Contents | | | | |
| |
| |
| Chairman’s Message | | 4 | | Ned Johnson’s message to shareholders |
| Performance | | 5 | | How the fund has done over time. |
| Management’s | | 6 | | The manager’s review of fund performance, |
| Discussion | | | | strategy and outlook. |
| Shareholder Expense | | 7 | | An example of shareholder expenses. |
| Example | | | | |
| Fidelity Ohio Municipal Income Fund |
| Investment Changes | | 9 | | A summary of major shifts in the fund’s |
| | | | | investments over the past six months. |
| Investments | | 10 | | A complete list of the fund’s investments with |
| | | | | their market values. |
| Financial Statements | | 18 | | Statements of assets and liabilities, |
| | | | | operations, and changes in net assets, |
| | | | | as well as financial highlights. |
| Fidelity Ohio Municipal Money Market Fund |
| Investment Changes/ | | 22 | | A summary of major shifts in the fund’s |
| Performance | | | | investments over the past six months and one |
| | | | | year and performance information. |
| Investments | | 23 | | A complete list of the fund’s investments. |
| Financial Statements | | 33 | | Statements of assets and liabilities, |
| | | | | operations, and changes in net assets, |
| | | | | as well as financial highlights. |
| Notes | | 37 | | Notes to the Financial Statements |
| Report of | | 43 | | |
| Independent | | | | |
| Registered Public | | | | |
| Accounting Firm | | | | |
| Trustees and Officers | | 44 | | |
| Distributions | | 56 | | |
| Proxy Voting Results | | 57 | | |
| | To view a fund’s proxy voting guidelines and proxy voting record for the 12 month period ended
June 30, visit www.fidelity.com/proxyvotingresults or visit the Securities and Exchange Commis
sion’s (SEC) web site at www.sec.gov. You may also call 1-800-544-8544 to request a free copy of
the proxy voting guidelines.
Standard & Poor’s, S&P and S&P 500 are registered service marks of The McGraw Hill Companies, Inc.
and have been licensed for use by Fidelity Distributors Corporation.
Other third party marks appearing herein are the property of their respective owners.
All other marks appearing herein are registered or unregistered trademarks or service marks
of FMR Corp. or an affiliated company.
|
Annual Report 2
This report and the financial statements contained herein are submitted for the general
information of the shareholders of the funds. This report is not authorized for distribution to
prospective investors in the funds unless preceded or accompanied by an effective prospectus.
A fund files its complete schedule of portfolio holdings with the SEC for the first and third
quarters of each fiscal year on Form N Q. Forms N Q are available on the SEC’s web site at
http://www.sec.gov. A fund’s Forms N Q may be reviewed and copied at the SEC’s Public Reference
Room in Washington, DC. Information regarding the operation of the SEC’s Public Reference
Room may be obtained by calling 1-800-SEC-0330. For a complete list of a fund’s portfolio
holdings, view the most recent quarterly holdings report, semiannual report, or annual report
on Fidelity’s web site at http://www.fidelity.com/holdings.
NOT FDIC INSURED · MAY LOSE VALUE · NO BANK GUARANTEE
Neither the funds nor Fidelity Distributors Corporation is a bank.
|
3 Annual Report
Chairman’s Message
(photograph of Edward C. Johnson)
Dear Shareholder:
During the past year or so, much has been reported about the mutual fund industry, and much of it has been more critical than I believe is warranted. Allegations that some companies have been less than forthright with their shareholders have cast a shadow on the entire industry. I continue to find these reports disturbing, and assert that they do not create an accurate picture of the industry overall. Therefore, I would like to remind every one where Fidelity stands on these issues. I will say two things specifically regarding allegations that some mutual fund companies were in violation of the Securities and Exchange Commission’s forward pricing rules or were involved in so called “market timing” activities.
First, Fidelity has no agreements that permit customers who buy fund shares after 4 p.m. to obtain the 4 p.m. price. This is not a new policy. This is not to say that some one could not deceive the company through fraudulent acts. However, we are extremely diligent in preventing fraud from occurring in this manner and in every other. But I underscore again that Fidelity has no so called “agreements” that sanction illegal practices.
Second, Fidelity continues to stand on record, as we have for years, in opposition to predatory short term trading that adversely affects shareholders in a mutual fund. Back in the 1980s, we initiated a fee which is returned to the fund and, therefore, to investors to discourage this activity. Further, we took the lead several years ago in developing a Fair Value Pricing Policy to prevent market timing on foreign securities in our funds. I am confident we will find other ways to make it more difficult for predatory traders to operate. However, this will only be achieved through close cooperation among regulators, legislators and the industry.
Yes, there have been unfortunate instances of unethical and illegal activity within the mutual fund industry from time to time. That is true of any industry. When this occurs, confessed or convicted offenders should be dealt with appropriately. But we are still concerned about the risk of over regulation and the quick application of simplistic solutions to intricate problems. Every system can be improved, and we support and applaud well thought out improvements by regulators, legislators and industry representatives that achieve the common goal of building and protecting the value of investors’ holdings.
For nearly 60 years, Fidelity has worked very hard to improve its products and service to justify your trust. When our family founded this company in 1946, we had only a few hundred customers. Today, we serve more than 18 million customers including individual investors and participants in retirement plans across America.
Let me close by saying that we do not take your trust in us for granted, and we realize that we must always work to improve all aspects of our service to you. In turn, we urge you to continue your active participation with your financial matters, so that your interests can be well served.
Best regards,
/s/ Edward C. Johnson 3d
Edward C. Johnson 3d
Annual Report 4
Fidelity Ohio Municipal Income Fund
Performance: The Bottom Line
Average annual total return reflects the change in the value of an investment, assuming reinvestment of the fund’s dividend income and capital gains (the profits earned upon the sale of securities that have grown in value) and assuming a constant rate of per formance each year. The $10,000 table and the fund’s returns do not reflect the deduc tion of taxes that a shareholder would pay on fund distributions or the redemption of fund shares. During periods of reimbursement by Fidelity, a fund’s total return will be greater than it would be had the reimbursement not occurred. How a fund did yesterday is no guarantee of how it will do tomorrow.
| Average Annual Total Returns | | | | | | |
| Periods ended December 31, 2005 | | Past 1 | | Past 5 | | Past 10 |
| | | year | | years | | years |
| Fidelity® OH Municipal Income Fund | | 2.90% | | 5.47% | | 5.44% |
| |
| |
| $10,000 Over 10 Years | | | | | | |
Let’s say hypothetically that $10,000 was invested in Fidelity® Ohio Municipal Income Fund on December 31, 1995. The chart shows how the value of your investment would have changed, and also shows how the Lehman Brothers® Municipal Bond Index performed over the same period.
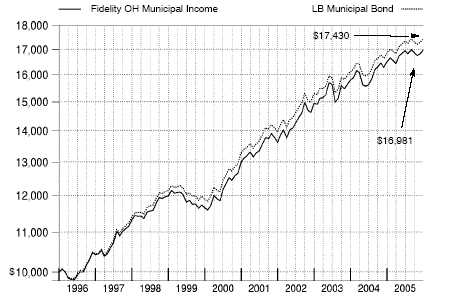
5 Annual Report
5
Fidelity Ohio Municipal Income Fund
Management’s Discussion of Fund Performance
Comments from Douglas McGinley, Portfolio Manager of Fidelity® Ohio Municipal Income Fund
For the third consecutive year, the municipal bond market outperformed taxable bonds. The Lehman Brothers® Municipal Bond Index rose 3.51% for the year ending December 31, 2005. The taxable bond market, as measured by the Lehman Brothers Aggregate Bond Index, advanced 2.43% . Muni bonds were attractively valued relative to Treasuries, partic ularly as tax free bond yields drew closer to those of high quality government bonds. Subsequently, the tax advantage of munis was compelling to such atypical investors in the asset class as hedge funds, corporations and taxable bond investors. The strong demand helped offset heavy issuance, particularly at the longer term end of the spectrum. The Federal Reserve Board raised short term interest rates eight times during the year, but long term rates remained persistently low, making the cost of borrowing more affordable for muni issuers. Still, absolute returns finished well below their historical averages. In addition to the rate hikes, surging energy prices pushed inflation higher, a condition further exacerbated by the damage to energy production facilities caused by Hurricane Katrina.
For the 12 months ending December 31, 2005, the fund returned 2.90% . During the same period, the LipperSM Ohio Municipal Debt Funds Average gained 2.47% and the Lehman Brothers Ohio 4 Plus Year Enhanced Municipal Bond Index rose 3.52% . Against a backdrop of rising short term interest rates, Ohio’s municipal bond market performed in line with the national muni market, helped by robust demand for tax free investments plus higher revenues and improved credit profiles for many Ohio issuers. I believe the fund outpaced its Lipper peer group average because it likely had a larger stake than many of its competitors in bonds that were prerefunded during the period, a process that boosts the bonds’ prices. My decision to maintain a slight overweighting relative to the index in lower quality investment grade bonds also helped because they consistently outpaced higher quality securities throughout the year. However, I suspect the fund had less invested than many of its competitors in below investment grade securities, which may have hurt relative perfor mance given that those securities were some of the market’s best performers. Another detractor from the fund’s performance relative to the Lehman Brothers index and also, I suspect, the Lipper average was my focus on intermediate maturity securities in a year when longer term securities performed better.
The views expressed in this statement reflect those of the portfolio manager only through the end of the period of the report as stated on the cover and do not necessarily represent the views of Fidelity or any other person in the Fidelity organization. Any such views are subject to change at any time based upon market or other conditions and Fidelity disclaims any responsibility to update such views. These views may not be relied on as investment advice and, because investment decisions for a Fidelity fund are based on numerous factors, may not be relied on as an indication of trading intent on behalf of any Fidelity fund.
Shareholder Expense Example
As a shareholder of a Fund, you incur two types of costs: (1) transaction costs, including redemption fees, and (2) ongoing costs, including management fees and other Fund expenses. This Example is intended to help you understand your ongoing costs (in dollars) of investing in the Funds and to compare these costs with the ongoing costs of investing in other mutual funds.
The Example is based on an investment of $1,000 invested at the beginning of the period and held for the entire period (July 1, 2005 to December 31, 2005).
The first line of the table below for each fund provides information about actual account values and actual expenses. You may use the information in this line, together with the amount you invested, to estimate the expenses that you paid over the period. Simply divide your account value by $1,000.00 (for example, an $8,600 account value divided by $1,000.00 = 8.6), then multiply the result by the number in the first line for a fund under the heading entitled “Expenses Paid During Period” to estimate the expenses you paid on your account during this period. A small balance maintenance fee of $12.00 that is charged once a year may apply for certain accounts with a value of less than $2,000. This fee is not included in the table below. If it was, the estimate of expenses you paid during the period would be higher, and your ending account value lower, by this amount.
Hypothetical Example for Comparison Purposes
The second line of the table below for each fund provides information about hypothetical account values and hypothetical expenses based on a fund’s actual expense ratio and an assumed rate of return of 5% per year before expenses, which is not the Fund’s actual return. The hypothetical account values and expenses may not be used to estimate the actual ending account balance or expenses you paid for the period. You may use this information to compare the ongoing costs of investing in the Fund and other funds. To do so, compare this 5% hypothetical example with the 5% hypothetical examples that appear in the shareholder reports of the other funds. A small balance maintenance fee of $12.00 that is charged once a year may apply for certain accounts with a value of less than $2,000. This fee is not included in the table below. If it was, the estimate of expenses you paid during the period would be higher, and your ending account value lower, by this amount. Please note that the expenses shown in the table are meant to highlight your ongoing costs only and do not reflect any transaction costs. Therefore, the second line of the table is useful in comparing ongoing costs only, and will not help you determine the relative total costs of owning different funds. In addition, if these transactional costs were included, your costs would have been higher.
7 Annual Report
| Shareholder Expense Example continued | | |
| |
| |
| | | | | | | | | | | Expenses Paid |
| | | | | | | | | | | During Period* |
| | | | | Beginning | | Ending | | July 1, 2005 |
| | | | | Account Value | | Account Value | | to December 31, |
| | | | | July 1, 2005 | | December 31, 2005 | | 2005 |
| Fidelity Ohio Municipal Income | | | | | | | | | | |
| Fund | | | | | | | | | | |
| Actual | | | $ | 1,000.00 | | $ | | 1,002.00 | | $ | | 2.47 |
| HypotheticalA | | | $ | 1,000.00 | | $ | | 1,022.74 | | $ | | 2.50 |
| Fidelity Ohio Municipal Money | | | | | | | | | | |
| Market Fund | | | | | | | | | | |
| Actual | | | $ | 1,000.00 | | $ | | 1,011.10 | | $ | | 2.69 |
| HypotheticalA | | | $ | 1,000.00 | | $ | | 1,022.53 | | $ | | 2.70 |
| |
| A 5% return per year before expenses | | | | | | |
* Expenses are equal to each Fund’s annualized expense ratio (shown in the table below); multiplied by the average account value over the period, multiplied by 184/365 (to reflect the one half year period).
| | | Annualized |
| | | Expense Ratio |
| Fidelity Ohio Municipal Income Fund | | 49% |
| Fidelity Ohio Municipal Money Market Fund | | 53% |
| Fidelity Ohio Municipal Income Fund | | | | |
| Investment Changes | | | | |
| |
| Top Five Sectors as of December 31, 2005 | | |
| | | % of fund’s | | % of fund’s net assets |
| | | net assets | | 6 months ago |
| General Obligations | | 42.3 | | 40.6 |
| Water & Sewer | | 13.0 | | 10.8 |
| Education | | 11.8 | | 12.7 |
| Escrowed/Pre Refunded | | 10.0 | | 10.6 |
| Health Care | | 7.4 | | 7.2 |
Average Years to Maturity as of December 31, 2005 | | |
| | | | | 6 months ago |
| Years | | 13.2 | | 13.1 |
Average years to maturity is based on the average time remaining to the stated maturity date of each bond, weighted by the market value of each bond.
| Duration as of December 31, 2005 | | | | |
| | | | | | | 6 months ago |
| Years | | | | 6.6 | | 6.7 |
Duration shows how much a bond fund’s price fluctuates with changes in comparable interest rates. If rates rise 1%, for example, a fund with a five year duration is likely to lose about 5% of its value. Other factors also can influence a bond fund’s performance and share price. Accordingly, a bond fund’s actual performance may differ from this example.
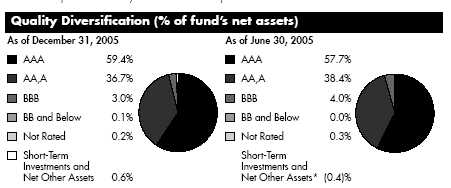
We have used ratings from Moody’s® Investors Services, Inc. Where Moody’s ratings are not available, we have used S&P® ratings.
* Short Term Investments and Net Other Assets are not included in the pie chart.
9 Annual Report
| Fidelity Ohio Municipal Income Fund | | | | | | |
| Investments December 31, 2005 | | | | |
| Showing Percentage of Net Assets | | | | | | | | |
| |
| Municipal Bonds 99.4% | | | | | | | | |
| | | | | Principal | | | | Value |
| | | | | Amount | | | | (Note 1) |
| Guam 0.1% | | | | | | | | |
| Guam Wtrwks. Auth. Wtr. and Wastewtr. Sys. Rev. 5.875% | | | | | | |
| 7/1/35 | | $ | | 400,000 | | $ | | 419,632 |
| Ohio – 96.3% | | | | | | | | |
| Adams County Valley Local School District (Adams & Highland | | | | | | |
| County Proj.) 5.25% 12/1/21 (MBIA Insured) | | 2,000,000 | | | | 2,044,060 |
| Akron City Nontax Rev. Econ. Dev. Series 1997, 6% 12/1/12 | | | | | | |
| (MBIA Insured) | | | | 1,250,000 | | | | 1,426,188 |
| Akron Ctfs. of Prtn. 5% 12/1/15 | | | | 1,475,000 | | | | 1,594,431 |
| Akron Gen. Oblig. 5.5% 12/1/21 (Pre-Refunded to 12/1/10 | | | | | | |
| @ 101) (c) | | | | 2,000,000 | | | | 2,198,520 |
| Akron Wtrwks. Rev. 5.25% 12/1/19 (MBIA Insured) | | 1,630,000 | | | | 1,765,111 |
| Avon Lake City School District 5% 12/1/14 | | | | | | |
| (MBIA Insured) | | | | 1,205,000 | | | | 1,315,245 |
| Brookville Local School District 5.25% 12/1/20 | | | | | | |
| (FSA Insured) | | | | 1,875,000 | | | | 2,036,419 |
| Buckeye Valley Local School District Delaware County Series A, | | | | | | |
| 6.85% 12/1/15 (MBIA Insured) | | | | 2,500,000 | | | | 2,925,725 |
| Butler County Gen. Oblig. 5.25% 12/1/16 (MBIA Insured) | | 1,820,000 | | | | 1,987,003 |
| Butler County Sales Tax (Govt. Svcs. Ctr. Proj.) Series A, 5% | | | | | | |
| 12/15/16 (AMBAC Insured) | | | | 2,455,000 | | | | 2,637,799 |
| Butler County Trans. Impt. District Series 1997 A, 6% 4/1/10 | | | | | | |
| (FSA Insured) | | | | 2,325,000 | | | | 2,495,655 |
| Canal Winchester Local School District 5% 12/1/18 (MBIA | | | | | | |
| Insured) | | | | 2,035,000 | | | | 2,193,099 |
| Chagrin Falls Exempted Village School District 5.25% 12/1/19 | | | | | | |
| (MBIA Insured) | | | | 1,915,000 | | | | 2,082,314 |
| Cincinnati City School District: | | | | | | | | |
| 5.25% 6/1/16 (FSA Insured) | | | | 1,500,000 | | | | 1,632,870 |
| 5.25% 12/1/17 (FSA Insured) | | | | 2,000,000 | | | | 2,169,340 |
| Cincinnati Gen. Oblig. 5.375% 12/1/20 | | | | 2,000,000 | | | | 2,163,880 |
| Cincinnati Student Ln. Fdg. Corp. Student Ln. Rev. | | | | | | |
| Series A, 7.25% 2/1/08 (b) | | | | 4,000,000 | | | | 4,012,880 |
| Cincinnati Wtr. Sys. Rev. Series 2001, 5.5% 12/1/17 | | 2,000,000 | | | | 2,175,860 |
| Cleveland Arpt. Sys. Rev. Series A, 5.5% 1/1/08 | | | | | | |
| (FSA Insured) (b) | | | | 1,500,000 | | | | 1,554,510 |
| Cleveland Gen. Oblig. 5.25% 12/1/17 (Pre-Refunded to | | | | | | |
| 12/1/10 @ 101) (c) | | | | 1,355,000 | | | | 1,474,335 |
| Cleveland Muni. School District: | | | | | | | | |
| 5.25% 12/1/17 (FSA Insured) | | | | 2,215,000 | | | | 2,414,217 |
| 5.25% 12/1/19 (FSA Insured) | | | | 1,045,000 | | | | 1,140,544 |
| |
| |
| |
| See accompanying notes which are an integral part of the financial statements. | | | | |
| |
| Annual Report | | 10 | | | | | | |
| Municipal Bonds continued | | | | | | | | |
| | | | | Principal | | | | Value |
| | | | | Amount | | | | (Note 1) |
| Ohio – continued | | | | | | | | |
| Cleveland Pub. Pwr. Sys. Rev. (First Mtg. Prog.) Series A: | | | | | | | | |
| 0% 11/15/10 (MBIA Insured) | | $ | | 2,685,000 | | $ | | 2,223,234 |
| 0% 11/15/11 (MBIA Insured) | | | | 2,685,000 | | | | 2,125,124 |
| Cleveland State Univ. Gen. Receipts Series 2003 A, 5% | | | | | | | | |
| 6/1/18 (FGIC Insured) | | | | 2,490,000 | | | | 2,633,424 |
| Cleveland Wtrwks. Rev.: | | | | | | | | |
| (First Mtg. Prog.): | | | | | | | | |
| Series G, 5.5% 1/1/13 (MBIA Insured) | | | | 2,450,000 | | | | 2,656,143 |
| Series H, 5.75% 1/1/16 (MBIA Insured) | | | | 45,000 | | | | 46,003 |
| Series I: | | | | | | | | |
| 5% 1/1/28 (FSA Insured) | | | | 25,000 | | | | 25,709 |
| 5% 1/1/28 (Pre-Refunded to 1/1/08 @ 101) (c) | | | | 25,000 | | | | 26,056 |
| Columbus City School District 5.25% 12/1/25 | | | | | | | | |
| (FSA Insured) | | | | 3,780,000 | | | | 4,066,373 |
| Cuyahoga County Gen. Oblig.: | | | | | | | | |
| Series A: | | | | | | | | |
| 0% 10/1/09 (MBIA Insured) | | | | 4,200,000 | | | | 3,661,980 |
| 0% 10/1/11 (MBIA Insured) | | | | 2,400,000 | | | | 1,920,672 |
| 0% 10/1/12 (MBIA Insured) | | | | 1,505,000 | | | | 1,152,454 |
| 5% 12/1/19 | | | | 3,000,000 | | | | 3,270,570 |
| 5.75% 12/1/12 (Pre-Refunded to 12/1/10 @ 100) (c) | | | | 1,950,000 | | | | 2,144,279 |
| 5.75% 12/1/13 (Pre-Refunded to 12/1/10 @ 100) (c) | | | | 2,210,000 | | | | 2,430,182 |
| 5.75% 12/1/14 (Pre-Refunded to 12/1/10 @ 100) (c) | | | | 1,460,000 | | | | 1,605,460 |
| Erie County Gen. Oblig. 5.5% 12/1/18 (FSA Insured) | | | | 1,265,000 | | | | 1,400,229 |
| Fairborn City School District (School Impt. Proj.) 5.75% | | | | | | | | |
| 12/1/26 (FSA Insured) | | | | 2,200,000 | | | | 2,418,922 |
| Fairfield City School District 7.45% 12/1/14 | | | | | | | | |
| (FGIC Insured) | | | | 1,000,000 | | | | 1,223,940 |
| Fairless Local School District 5% 12/1/32 | | | | | | | | |
| (FSA Insured) | | | | 3,300,000 | | | | 3,446,916 |
| Fairview Park City School District Gen. Oblig. 5% 12/1/33 | | | | | | | | |
| (MBIA Insured) | | | | 4,350,000 | | | | 4,532,048 |
| Fairview Park Gen. Oblig. 5% 12/1/30 (MBIA Insured) | | | | 3,750,000 | | | | 3,931,988 |
| Franklin County Convention Facilities Auth. Tax & Lease Rev. | | | | | | | | |
| 5.25% 12/1/19 (AMBAC Insured) | | | | 4,000,000 | | | | 4,306,440 |
| Franklin County Hosp. Rev.: | | | | | | | | |
| (Holy Cross Health Sys. Corp. Proj.) 5.875% 6/1/21 | | | | 1,000,000 | | | | 1,030,300 |
| 5.5% 5/1/13 (AMBAC Insured) | | | | 1,130,000 | | | | 1,248,797 |
| Franklin County Rev. (OCLC Online Computer Library Ctr., Inc. | | | | | | | | |
| Proj.) 5% 4/15/12 | | | | 2,505,000 | | | | 2,629,924 |
See accompanying notes which are an integral part of the financial statements.
11 Annual Report
| Fidelity Ohio Municipal Income Fund | | | | | | | | |
| Investments continued | | | | | | | | |
| |
| Municipal Bonds continued | | | | | | | | |
| | | | | Principal | | | | Value |
| | | | | Amount | | | | (Note 1) |
| Ohio – continued | | | | | | | | |
| Gallia County Hosp. Facilities Rev. (Holzer Med. Ctr. Proj.) | | | | | | | | |
| 5.125% 10/1/13 (AMBAC Insured) | | $ | | 3,000,000 | | $ | | 3,148,560 |
| Greene County Swr. Sys. Rev. 0% 12/1/09 (AMBAC Insured) . | | | | 775,000 | | | | 671,352 |
| Hamilton County Convention Facilities Auth. Rev.: | | | | | | | | |
| 5% 12/1/17 (FGIC Insured) | | | | 1,985,000 | | | | 2,126,908 |
| 5% 12/1/18 (FGIC Insured) | | | | 1,075,000 | | | | 1,147,896 |
| 5% 12/1/19 (FGIC Insured) | | | | 2,190,000 | | | | 2,336,883 |
| 5% 12/1/19 (FGIC Insured) | | | | 1,130,000 | | | | 1,205,789 |
| Hamilton County Hosp. Facilities Rev. (Childrens Hosp. Med. | | | | | | | | |
| Ctr. Proj.) Series J: | | | | | | | | |
| 5.25% 5/15/15 (FGIC Insured) | | | | 1,835,000 | | | | 2,000,645 |
| 5.25% 5/15/17 (FGIC Insured) | | | | 2,585,000 | | | | 2,797,306 |
| 5.25% 5/15/18 (FGIC Insured) | | | | 2,720,000 | | | | 2,931,398 |
| Hamilton County Sales Tax Series B, 5.25% 12/1/32 | | | | | | | | |
| (AMBAC Insured) | | | | 4,750,000 | | | | 5,012,485 |
| Hamilton Wtrwks. Rev. 5% 10/15/16 (MBIA Insured) | | | | 1,000,000 | | | | 1,070,130 |
| Hilliard Gen. Oblig. 5% 12/1/18 (MBIA Insured) | | | | 1,000,000 | | | | 1,069,260 |
| Hilliard School District 0% 12/1/11 (FGIC Insured) | | | | 3,720,000 | | | | 2,956,135 |
| Huber Heights Wtr. Sys. Rev. 5% 12/1/30 (MBIA Insured) | | | | 2,285,000 | | | | 2,401,535 |
| Kent City School District Series 2004, 5% 12/1/20 (FGIC | | | | | | | | |
| Insured) | | | | 1,400,000 | | | | 1,488,858 |
| Kings Local School District: | | | | | | | | |
| 5% 12/1/19 (MBIA Insured) | | | | 1,365,000 | | | | 1,461,833 |
| 6.1% 12/1/25 (Pre-Refunded to 12/1/10 @ 101) (c) | | | | 6,800,000 | | | | 7,657,548 |
| Lakewood City School District 5.25% 12/1/15 | | | | | | | | |
| (FSA Insured) | | | | 1,000,000 | | | | 1,103,080 |
| Lakewood Hosp. Impt. Rev. (Lakewood Hosp. Assoc. Proj.): | | | | | | | | |
| 5.5% 2/15/10 | | | | 1,000,000 | | | | 1,056,300 |
| 5.5% 2/15/11 | | | | 1,875,000 | | | | 1,996,631 |
| 5.5% 2/15/12 | | | | 1,000,000 | | | | 1,073,840 |
| Licking Heights Local School District: | | | | | | | | |
| (Facilities Construction & Impt. Proj.) Series A, 5% 12/1/32 | | | | | | | | |
| (MBIA Insured) | | | | 2,640,000 | | | | 2,756,688 |
| 5.25% 12/1/23 (FGIC Insured) | | | | 2,660,000 | | | | 2,875,540 |
| Lorain County 5.5% 12/1/22 (FGIC Insured) | | | | 2,985,000 | | | | 3,260,247 |
| Lucas County Hosp. Rev. (Promedia Health Care Oblig. Group | | | | | | | | |
| Proj.): | | | | | | | | |
| 5.375% 11/15/23 (AMBAC Insured) | | | | 5,000,000 | | | | 5,312,200 |
| 5.625% 11/15/12 (AMBAC Insured) | | | | 2,000,000 | | | | 2,168,900 |
| 5.625% 11/15/13 (AMBAC Insured) | | | | 1,200,000 | | | | 1,294,560 |
See accompanying notes which are an integral part of the financial statements.
| Municipal Bonds continued | | | | | | | | |
| | | | | Principal | | | | Value |
| | | | | Amount | | | | (Note 1) |
| Ohio – continued | | | | | | | | |
| Marion County Hosp. Impt. Rev. (Cmnty. Hosp. Proj.) 6.1% | | | | | | | | |
| 5/15/06 | | $ | | 1,000,000 | | $ | | 1,009,820 |
| Marysville Exempted Village School District 5% 12/1/29 | | | | | | | | |
| (FSA Insured) | | | | 4,000,000 | | | | 4,217,160 |
| Medina City School District 5.25% 12/1/28 | | | | | | | | |
| (Pre-Refunded to 12/1/09 @ 100) (c) | | | | 6,175,000 | | | | 6,593,974 |
| Middletown City School District: | | | | | | | | |
| 5% 12/1/17 (FGIC Insured) | | | | 1,175,000 | | | | 1,247,380 |
| 5% 12/1/19 (FGIC Insured) | | | | 1,110,000 | | | | 1,180,685 |
| Milford Exempt Villlage School District 5.125% 12/1/30 | | | | | | | | |
| (FSA Insured) | | | | 5,335,000 | | | | 5,559,337 |
| Montgomery County Gen. Oblig. 5.5% 12/1/25 | | | | 2,235,000 | | | | 2,416,862 |
| Montgomery County Rev. (Catholic Health Initiatives Proj.) | | | | | | | | |
| Series A: | | | | | | | | |
| 6% 12/1/19 | | | | 1,470,000 | | | | 1,632,670 |
| 6% 12/1/19 (Escrowed to Maturity) (c) | | | | 1,530,000 | | | | 1,692,104 |
| 6% 12/1/26 (Escrowed to Maturity) (c) | | | | 3,000,000 | | | | 3,298,500 |
| Montgomery County Wtr. Sys. Rev. Series 2002, 5.375% | | | | | | | | |
| 11/15/16 (AMBAC Insured) | | | | 2,200,000 | | | | 2,394,964 |
| Ohio Air Quality Dev. Auth. Rev.: | | | | | | | | |
| (Ohio Edison Co. Proj.) Series A, 3.25%, tender 2/1/08 | | | | | | | | |
| (AMBAC Insured) (a) | | | | 2,000,000 | | | | 1,984,140 |
| Series 2002 A, 3.5%, tender 1/1/06 (a) | | | | 3,000,000 | | | | 3,000,000 |
| Ohio Bldg. Auth.: | | | | | | | | |
| (Administration Bldg. Fund Prog.) Series A: | | | | | | | | |
| 4.75% 10/1/17 | | | | 1,000,000 | | | | 1,027,500 |
| 5% 4/1/11 (FSA Insured) | | | | 1,425,000 | | | | 1,527,130 |
| (Adult Correctional Bldg. Fund Prog.) Series 2001 A, 5.5% | | | | | | | | |
| 10/1/12 (FSA Insured) | | | | 1,000,000 | | | | 1,093,320 |
| (Juvenile Correctional Bldg. Fund Prog.): | | | | | | | | |
| Series A, 5.5% 4/1/12 | | | | 2,960,000 | | | | 3,221,753 |
| 5% 4/1/17 (MBIA Insured) | | | | 2,485,000 | | | | 2,634,895 |
| (Sports Facilities Bldg. Fund Prog.) Series 1999 A, 5.25% | | | | | | | | |
| 10/1/12 | | | | 2,940,000 | | | | 3,127,954 |
| Ohio Gen. Oblig.: | | | | | | | | |
| (College Savings Prog.): | | | | | | | | |
| 0% 8/1/09 | | | | 2,290,000 | | | | 2,003,979 |
| 0% 8/1/10 | | | | 2,000,000 | | | | 1,676,220 |
| 0% 8/1/14 | | | | 1,375,000 | | | | 958,018 |
| (Higher Ed. Cap. Facilities Proj.) Series A, 5.375% | | | | | | | | |
| 8/1/16 | | | | 5,980,000 | | | | 6,506,539 |
See accompanying notes which are an integral part of the financial statements.
13 Annual Report
| Fidelity Ohio Municipal Income Fund | | | | | | | | |
| Investments continued | | | | | | | | |
| |
| Municipal Bonds continued | | | | | | | | |
| | | | | Principal | | | | Value |
| | | | | Amount | | | | (Note 1) |
| Ohio – continued | | | | | | | | |
| Ohio Gen. Oblig.: – continued | | | | | | | | |
| (Mental Health Cap. Facilities Proj.): | | | | | | | | |
| Series IIA, 5.25% 6/1/17 | | $ | | 2,670,000 | | $ | | 2,872,466 |
| Series IIB, 5.5% 6/1/15 | | | | 2,265,000 | | | | 2,450,322 |
| Series 2001 IIA, 5.5% 12/1/13 | | | | 2,020,000 | | | | 2,197,740 |
| Series 2002 B, 5.25% 11/1/20 | | | | 2,520,000 | | | | 2,739,215 |
| Series A, 5.5% 9/15/16 | | | | 11,060,000 | | | | 12,152,388 |
| Ohio Higher Edl. Facility Commission Rev.: | | | | | | | | |
| (Case Western Reserve Univ. 2002 Proj.): | | | | | | | | |
| Series B: | | | | | | | | |
| 5.5% 10/1/21 | | | | 2,000,000 | | | | 2,199,100 |
| 6.5% 10/1/20 | | | | 2,335,000 | | | | 2,868,758 |
| Series C, 5.125% 10/1/17 | | | | 2,985,000 | | | | 3,094,072 |
| 6.125% 10/1/15 | | | | 2,000,000 | | | | 2,341,640 |
| 6.25% 10/1/16 | | | | 2,500,000 | | | | 2,986,975 |
| (Denison Univ. Proj.) 5.5% 11/1/14 | | | | 1,000,000 | | | | 1,094,380 |
| (Univ. of Dayton Proj.): | | | | | | | | |
| 5% 12/1/17 (AMBAC Insured) | | | | 2,170,000 | | | | 2,332,837 |
| 5.5% 12/1/20 (AMBAC Insured) | | | | 1,300,000 | | | | 1,411,254 |
| Ohio Hsg. Fin. Agcy. Mtg. Rev. (Residential Proj.): | | | | | | | | |
| Series B2, 5.375% 9/1/19 (b) | | | | 255,000 | | | | 255,497 |
| Series C, 4.9% 9/1/26 (b) | | | | 160,000 | | | | 160,874 |
| Ohio Muni. Elec. Gen. Agcy. (Belleville Hydroelectric Proj.) | | | | | | | | |
| 5% 2/15/17 (AMBAC Insured) | | | | 1,215,000 | | | | 1,299,272 |
| Ohio Poll. Cont. Rev. (Standard Oil Co. Proj.) 6.75% 12/1/15 . | | | | 3,100,000 | | | | 3,791,455 |
| Ohio Pub. Facilities Commission Rev. (Mental Health Cap. | | | | | | | | |
| Facilities Proj.) Series 2000 IIA, 5.375% 6/1/14 | | | | 2,200,000 | | | | 2,354,000 |
| Ohio Solid Waste Rev. (Waste Mgmt., Inc. Proj.) 4.85%, | | | | | | | | |
| tender 11/1/07 (a)(b) | | | | 3,000,000 | | | | 3,044,220 |
| Ohio State Univ. Gen. Receipts: | | | | | | | | |
| Series 2002 A, 5.125% 12/1/31 | | | | 5,000,000 | | | | 5,302,250 |
| Series B, 5.25% 6/1/16 | | | | 5,000,000 | | | | 5,430,350 |
| Ohio Tpk. Commission Tpk. Rev. 5.5% 2/15/26 | | | | 3,700,000 | | | | 3,971,765 |
| Ohio Univ. Gen. Receipts Athens 5% 12/1/18 (MBIA Insured) | | | | 1,980,000 | | | | 2,106,997 |
| Ohio Wtr. Dev. Auth. Rev.: | | | | | | | | |
| (Drinking Wtr. Fund Prog.): | | | | | | | | |
| Series 2002, 5.5% 12/1/21 (Pre-Refunded to | | | | | | | | |
| 12/1/12 @ 100) (c) | | | | 4,040,000 | | | | 4,495,025 |
| Series 2005: | | | | | | | | |
| 5.25% 6/1/18 | | | | 2,610,000 | | | | 2,929,229 |
| 5.25% 12/1/18 | | | | 2,610,000 | | | | 2,939,095 |
See accompanying notes which are an integral part of the financial statements.
| Municipal Bonds continued | | | | | | | | |
| | | | | | | Principal | | | | Value |
| | | | | | | Amount | | | | (Note 1) |
| Ohio – continued | | | | | | | | | | |
| Ohio Wtr. Dev. Auth. Rev.: continued | | | | | | | | |
| (Fresh Wtr. Impt. Proj.): | | | | | | | | | | |
| Series B, 5.5% 6/1/16 (FSA Insured) | | $ | | 1,560,000 | | $ | | 1,766,045 |
| 5% 12/1/34 | | | | | | 5,250,000 | | | | 5,469,135 |
| 5.25% 12/1/15 | | | | | | 2,200,000 | | | | 2,432,012 |
| 5.5% 6/1/17 | | | | | | 3,960,000 | | | | 4,519,073 |
| (Pure Wtr. Proj.): | | | | | | | | | | |
| Series I, 6% 12/1/16 (Escrowed to Maturity) (c) | | | | 1,685,000 | | | | 1,912,795 |
| 5.5% 12/1/18 (AMBAC Insured) | | | | 240,000 | | | | 240,310 |
| 5% 12/1/17 | | | | | | 3,765,000 | | | | 4,045,304 |
| 5.25% 6/1/13 (MBIA Insured) | | | | 1,295,000 | | | | 1,423,063 |
| 5.25% 12/1/13 (MBIA Insured) | | | | 1,305,000 | | | | 1,437,810 |
| 5.25% 6/1/14 (MBIA Insured) | | | | 1,250,000 | | | | 1,379,325 |
| 5.25% 12/1/14 (MBIA Insured) | | | | 1,260,000 | | | | 1,393,888 |
| 5.25% 12/1/15 (MBIA Insured) | | | | 1,180,000 | | | | 1,308,785 |
| 5.25% 6/1/17 (MBIA Insured) | | | | 1,160,000 | | | | 1,292,832 |
| Ohio Wtr. Dev. Auth. Solid Waste Disp. Rev. (North Star BHP | | | | | | | | |
| Steel/Cargill Proj.) 6.3% 9/1/20 (b) | | | | 6,350,000 | | | | 6,511,290 |
| Ohio Wtr. Dev. Auth. Wtr. Poll. Cont. Rev.: | | | | | | | | |
| (Ohio Edison Co. Proj.) Series A, 3.35%, tender 6/1/06 (a) | | | | 3,000,000 | | | | 2,988,480 |
| 5% 6/1/18 | | | | | | 2,000,000 | | | | 2,141,500 |
| 5.25% 12/1/19 | | | | | | 1,975,000 | | | | 2,231,770 |
| Olentangy Local School District (School Facilities Construction | | | | | | | | |
| & Impt. Proj.) Series A: | | | | | | | | | | |
| 5.25% 12/1/17 | | | | | | 1,335,000 | | | | 1,455,791 |
| 5.5% 12/1/15 (FGIC Insured) | | | | 1,055,000 | | | | 1,187,698 |
| Otsego Local School District Wood, Henry & Lucas Counties | | | | | | | | |
| 5.375% 12/1/32 (FSA Insured) | | | | 1,000,000 | | | | 1,091,170 |
| Penta Career Ctr. Ctfs. of Prtn.: | | | | | | | | |
| (Ohio School Facilities Proj.) 5.25% 4/1/17 (FGIC Insured) . | | | | 1,755,000 | | | | 1,903,736 |
| (Wood, Lucas, Sandusky, Fulton, Ottawa, Henry and | | | | | | | | |
| Hancock Counties, Ohio School Facilities Proj.) 5.25% | | | | | | | | |
| 4/1/19 (FGIC Insured) | | | | 1,940,000 | | | | 2,105,831 |
| Pickerington Local School District 5.25% 12/1/20 | | | | | | | | |
| (FGIC Insured) | | | | | | 5,000,000 | | | | 5,374,650 |
| Plain Local School District 6% 12/1/25 (FGIC Insured) | | | | 990,000 | | | | 1,100,078 |
| Richland County Hosp. Facilities (MedCentral Health Sys. Proj.) | | | | | | | | |
| Series B: | | | | | | | | | | |
| 6.375% 11/15/22 | | | | | | 1,500,000 | | | | 1,632,180 |
| 6.375% 11/15/30 | | | | | | 1,000,000 | | | | 1,078,590 |
| RiverSouth Auth. Rev. Series 2005 A, 5.25% 12/1/15 | | | | 1,000,000 | | | | 1,102,230 |
See accompanying notes which are an integral part of the financial statements.
15 Annual Report
| Fidelity Ohio Municipal Income Fund | | | | | | |
| Investments continued | | | | | | |
| |
| Municipal Bonds continued | | | | | | |
| | | | | Principal | | Value |
| | | | | Amount | | (Note 1) |
| Ohio – continued | | | | | | |
| Rocky River Gen. Oblig. 5% 12/1/19 (AMBAC Insured) | | $ | | 2,125,000 | | $ 2,266,398 |
| Scioto County Marine Term. Facilities Rev. (Norfolk Southern | | | | | | |
| Corp. Proj.) 5.3% 8/15/13 | | | | 3,000,000 | | 3,073,140 |
| Sharonville Gen. Oblig. 5.25% 6/1/16 (FGIC Insured) | | | | 1,410,000 | | 1,531,359 |
| Springboro Cmnty. City School District 5.25% 12/1/21 | | | | | | |
| (MBIA Insured) | | | | 3,440,000 | | 3,728,926 |
| Sugarcreek Local School District 5.25% 12/1/22 | | | | | | |
| (MBIA Insured) | | | | 1,800,000 | | 1,937,232 |
| Summit County Gen. Oblig.: | | | | | | |
| 5.25% 12/1/20 | | | | 1,645,000 | | 1,812,412 |
| 5.25% 12/1/21 | | | | 1,740,000 | | 1,915,827 |
| Swanton Local School District 5.25% 12/1/21 (FGIC Insured) . | | 3,415,000 | | 3,662,588 |
| Tallmadge School District Gen. Oblig. 5% 12/1/31 | | | | | | |
| (FSA Insured) | | | | 4,000,000 | | 4,189,360 |
| Toledo Wtrwks. Rev.: | | | | | | |
| 5% 11/15/16 (AMBAC Insured) | | | | 1,110,000 | | 1,188,821 |
| 5% 11/15/30 (MBIA Insured) | | | | 3,500,000 | | 3,663,520 |
| Univ. of Akron Gen. Receipts Series B, 5% 1/1/27 | | | | | | |
| (FGIC Insured) | | | | 1,405,000 | | 1,469,925 |
| Univ. of Cincinnati Ctfs. of Prtn.: | | | | | | |
| 5.5% 6/1/11 (MBIA Insured) | | | | 1,045,000 | | 1,138,099 |
| 5.5% 6/1/12 (MBIA Insured) | | | | 1,315,000 | | 1,428,445 |
| 5.5% 6/1/15 (MBIA Insured) | | | | 1,000,000 | | 1,083,770 |
| Univ. of Cincinnati Gen. Receipts Series 2004 A: | | | | | | |
| 5% 6/1/18 (AMBAC Insured) | | | | 1,445,000 | | 1,542,985 |
| 5% 6/1/19 (AMBAC Insured) | | | | 1,520,000 | | 1,619,727 |
| Warren County Gen. Oblig.: | | | | | | |
| 6.1% 12/1/12 | | | | 500,000 | | 543,490 |
| 6.65% 12/1/11 | | | | 330,000 | | 360,994 |
| West Muskingum Local School District School Facilities | | | | | | |
| Construction and Impt. 5% 12/1/30 (FGIC Insured) | | | | 1,000,000 | | 1,042,370 |
| Wright State Univ. Gen. Receipts: | | | | | | |
| 5% 5/1/17 (MBIA Insured) | | | | 1,375,000 | | 1,472,446 |
| 5% 5/1/18 (MBIA Insured) | | | | 1,440,000 | | 1,536,797 |
| 5% 5/1/19 (MBIA Insured) | | | | 1,515,000 | | 1,615,732 |
| | | | | | | 409,155,493 |
| |
| Puerto Rico 2.9% | | | | | | |
| Puerto Rico Commonwealth Hwy. & Trans. Auth. Hwy. Rev. | | | | | | |
| Series Y, 5.5% 7/1/36 (FSA Insured) | | | | 1,000,000 | | 1,112,960 |
| Puerto Rico Commonwealth Hwy. & Trans. Auth. Trans. Rev. | | | | | | |
| Series E, 5.5% 7/1/22 (FSA Insured) | | | | 1,500,000 | | 1,738,110 |
See accompanying notes which are an integral part of the financial statements.
| Municipal Bonds continued | | | | | | |
| | | | | Principal | | Value |
| | | | | Amount | | (Note 1) |
| Puerto Rico continued | | | | | | |
| Puerto Rico Commonwealth Infrastructure Fing. Auth. | | | | | | |
| Series 2000 A: | | | | | | |
| 5.5% 10/1/32 (Escrowed to Maturity) (c) | | $ | | 1,510,000 | | $ 1,639,241 |
| 5.5% 10/1/40 (Escrowed to Maturity) (c) | | | | 4,930,000 | | 5,318,435 |
| Puerto Rico Elec. Pwr. Auth. Pwr. Rev.: | | | | | | |
| Series HH, 5.25% 7/1/29 (FSA Insured) | | | | 800,000 | | 857,296 |
| Series QQ, 5.5% 7/1/17 (XL Cap. Assurance, Inc. Insured) | | | | 1,300,000 | | 1,476,917 |
| | | | | | | 12,142,959 |
| |
| Virgin Islands – 0.1% | | | | | | |
| Virgin Islands Pub. Fin. Auth. Rev. Series A, 5% 10/1/09 | | | | 500,000 | | 519,465 |
| |
| TOTAL INVESTMENT PORTFOLIO 99.4% | | | | | | |
| (Cost $407,417,362) | | | | | | 422,237,549 |
| |
| NET OTHER ASSETS – 0.6% | | | | | | 2,611,604 |
| NET ASSETS 100% | | | | | | $ 424,849,153 |
Legend
(a) The coupon rate shown on floating or
adjustable rate securities represents the
rate at period end.
(b) Private activity obligations whose
interest is subject to the federal
alternative minimum tax for individuals.
(c) Security collateralized by an amount
sufficient to pay interest and principal.
|
Other Information
The distribution of municipal securities by revenue source, as a percentage of total net assets, is as follows:
| General Obligations | | 42.3% |
| Water & Sewer | | 13.0% |
| Education | | 11.8% |
| Escrowed/Pre Refunded | | 10.0% |
| Health Care | | 7.4% |
| Others* (individually less than 5%) | | 15.5% |
| | | 100.0% |
| *Includes net other assets | | |
See accompanying notes which are an integral part of the financial statements.
17 Annual Report
| Fidelity Ohio Municipal Income Fund | | | | | | | | |
| |
| Financial Statements | | | | | | | | |
| |
| Statement of Assets and Liabilities | | | | | | | | |
| | | | | | | December 31, 2005 |
| |
| Assets | | | | | | | | |
| Investment in securities, at value | | | | | | | | |
| See accompanying schedule: | | | | | | | | |
| Unaffiliated issuers (cost $407,417,362) | | | | | | $ | | 422,237,549 |
| Cash | | | | | | | | 2,181,322 |
| Receivable for fund shares sold | | | | | | | | 70,459 |
| Interest receivable | | | | | | | | 3,162,844 |
| Prepaid expenses | | | | | | | | 2,113 |
| Other receivables | | | | | | | | 17,439 |
| Total assets | | | | | | | | 427,671,726 |
| |
| Liabilities | | | | | | | | |
| Payable for investments purchased | | $ | | 1,492,778 | | | | |
| Payable for fund shares redeemed | | | | 691,466 | | | | |
| Distributions payable | | | | 420,170 | | | | |
| Accrued management fee | | | | 132,114 | | | | |
| Other affiliated payables | | | | 38,092 | | | | |
| Other payables and accrued expenses | | | | 47,953 | | | | |
| Total liabilities | | | | | | | | 2,822,573 |
| |
| Net Assets | | | | | | $ | | 424,849,153 |
| Net Assets consist of: | | | | | | | | |
| Paid in capital | | | | | | $ | | 409,685,591 |
| Undistributed net investment income | | | | | | | | 64,436 |
| Accumulated undistributed net realized gain (loss) on | | | | | | | | |
| investments | | | | | | | | 278,939 |
| Net unrealized appreciation (depreciation) on | | | | | | | | |
| investments | | | | | | | | 14,820,187 |
| Net Assets, for 36,440,876 shares outstanding | | | | | | $ | | 424,849,153 |
| Net Asset Value, offering price and redemption price per | | | | | | |
| share ($424,849,153 ÷ 36,440,876 shares) | | | | | | $ | | 11.66 |
See accompanying notes which are an integral part of the financial statements.
| Statement of Operations | | | | | | |
| | | | | Year ended December 31, 2005 |
| |
| Investment Income | | | | | | |
| Interest | | | | | | $ 19,134,824 |
| |
| Expenses | | | | | | |
| Management fee | | $ | | 1,598,884 | | |
| Transfer agent fees | | | | 331,749 | | |
| Accounting fees and expenses | | | | 107,052 | | |
| Independent trustees’ compensation | | | | 1,976 | | |
| Custodian fees and expenses | | | | 7,082 | | |
| Registration fees | | | | 20,908 | | |
| Audit | | | | 47,625 | | |
| Legal | | | | 3,902 | | |
| Miscellaneous | | | | 11,390 | | |
| Total expenses before reductions | | | | 2,130,568 | | |
| Expense reductions | | | | (123,410) | | 2,007,158 |
| |
| Net investment income | | | | | | 17,127,666 |
| Realized and Unrealized Gain (Loss) | | | | | | |
| Net realized gain (loss) on: | | | | | | |
| Investment securities: | | | | | | |
| Unaffiliated issuers | | | | 6,684,235 | | |
| Futures contracts | | | | 18,997 | | |
| Total net realized gain (loss) | | | | | | 6,703,232 |
| Change in net unrealized appreciation (depreciation) on | | | | |
| investment securities | | | | | | (11,621,333) |
| Net gain (loss) | | | | | | (4,918,101) |
| Net increase (decrease) in net assets resulting from | | | | | | |
| operations | | | | | | $ 12,209,565 |
See accompanying notes which are an integral part of the financial statements.
19 Annual Report
| Fidelity Ohio Municipal Income Fund | | | | | | | | |
| Financial Statements continued | | | | | | | | |
| |
| Statement of Changes in Net Assets | | | | | | | | |
| | | | | Year ended | | | | Year ended |
| | | | | December 31, | | | | December 31, |
| | | | | 2005 | | | | 2004 |
| Increase (Decrease) in Net Assets | | | | | | | | |
| Operations | | | | | | | | |
| Net investment income | | $ | | 17,127,666 | | $ | | 17,450,563 |
| Net realized gain (loss) | | | | 6,703,232 | | | | 5,347,550 |
| Change in net unrealized appreciation (depreciation) . | | | | (11,621,333) | | | | (4,790,968) |
| Net increase (decrease) in net assets resulting | | | | | | | | |
| from operations | | | | 12,209,565 | | | | 18,007,145 |
| Distributions to shareholders from net investment income . | | | | (17,117,253) | | | | (17,502,945) |
| Distributions to shareholders from net realized gain | | | | (6,682,810) | | | | (5,096,645) |
| Total distributions | | | | (23,800,063) | | | | (22,599,590) |
| Share transactions | | | | | | | | |
| Proceeds from sales of shares | | | | 51,253,642 | | | | 45,167,492 |
| Reinvestment of distributions | | | | 17,268,216 | | | | 16,402,646 |
| Cost of shares redeemed | | | | (55,685,453) | | | | (64,421,289) |
| Net increase (decrease) in net assets resulting from | | | | | | | | |
| share transactions | | | | 12,836,405 | | | | (2,851,151) |
| Redemption fees | | | | 5,873 | | | | 2,423 |
| Total increase (decrease) in net assets | | | | 1,251,780 | | | | (7,441,173) |
| |
| Net Assets | | | | | | | | |
| Beginning of period | | | | 423,597,373 | | | | 431,038,546 |
| End of period (including undistributed net investment | | | | | | | | |
| income of $64,436 and distributions in excess of net | | | | | | | | |
| investment income of $48,762, respectively) | | $ | | 424,849,153 | | $ | | 423,597,373 |
| |
| Other Information | | | | | | | | |
| Shares | | | | | | | | |
| Sold | | | | 4,303,543 | | | | 3,749,160 |
| Issued in reinvestment of distributions | | | | 1,460,402 | | | | 1,368,296 |
| Redeemed | | | | (4,689,736) | | | | (5,378,568) |
| Net increase (decrease) | | | | 1,074,209 | | | | (261,112) |
See accompanying notes which are an integral part of the financial statements.
| Financial Highlights | | | | | | | | | | | | |
| |
| Years ended December 31, | | 2005 | | 2004 | | 2003 | | | | 2002 | | 2001 |
| Selected Per Share Data | | | | | | | | | | | | |
| Net asset value, | | | | | | | | | | | | |
| beginning of period | | $ 11.98 | | $ 12.10 | | $ 12.03 | | | | $11.54 | | $ 11.54 |
| Income from Investment | | | | | | | | | | | | |
| Operations | | | | | | | | | | | | |
| Net investment incomeB | | 476 | | .496 | | .507 | | | | .527 | | .542D |
| Net realized and unrealized | | | | | | | | | | | | |
| gain (loss) | | (.135) | | .026 | | .166 | | | | .568 | | (.002)D |
| Total from investment operations | | .341 | | .522 | | .673 | | | | 1.095 | | .540 |
| Distributions from net investment | | | | | | | | | | | | |
| income | | (.476) | | (.497) | | (.508) | | | | (.525) | | (.540) |
| Distributions from net realized | | | | | | | | | | | | |
| gain | | (.185) | | (.145) | | (.095) | | | | (.080) | | — |
| Total distributions | | (.661) | | (.642) | | (.603) | | | | (.605) | | (.540) |
| Redemption fees added to | | | | | | | | | | | | |
| paid in capitalB,E | | — | | — | | — | | | | — | | — |
| Net asset value, end of period | | $ 11.66 | | $ 11.98 | | $ 12.10 | | | | $ 12.03 | | $ 11.54 |
| Total ReturnA | | 2.90% | | 4.44% | | 5.72% | | | | 9.68% | | 4.73% |
| Ratios to Average Net AssetsC | | | | | | | | | | | | |
| Expenses before reductions | | 50% | | .50% | | .51% | | | | .51% | | .51% |
| Expenses net of fee waivers, | | | | | | | | | | | | |
| if any | | 50% | | .50% | | .51% | | | | .51% | | .51% |
| Expenses net of all reductions | | 47% | | .49% | | .50% | | | | .49% | | .46% |
| Net investment income | | 4.00% | | 4.13% | | 4.20% | | | | 4.45% | | 4.64%D |
| Supplemental Data | | | | | | | | | | | | |
| Net assets, end of period | | | | | | | | | | | | |
| (000 omitted) | | $424,849 | | $423,597 | | $431,039 | | $435,057 | | $399,353 |
| Portfolio turnover rate | | 23% | | 26% | | 22% | | | | 19% | | 17% |
A Total returns would have been lower had certain expenses not been reduced during the periods shown.
B Calculated based on average shares outstanding during the period.
C Expense ratios reflect operating expenses of the fund. Expenses before reductions do not reflect amounts reimbursed by the investment adviser or
expense offset arrangements and do not represent the amount paid by the fund during periods when reimbursements or reductions occur. Ex
penses net of fee waivers reflect expenses after reimbursement by the investment adviser but prior to reductions from expense offset arrange
ments. Expenses net of all reductions represent the net expenses paid by the fund.
D Effective January 1, 2001, the fund adopted the provisions of the AICPA Audit and Accounting Guide for Investment Companies and began
amortizing premium and discount on all debt securities. Per share data and ratios for periods prior to adoption have not been restated to reflect
this change.
E Amount represents less than $.001 per share.
|
See accompanying notes which are an integral part of the financial statements.
21 Annual Report
| Fidelity Ohio Municipal Money Market Fund | | | | |
| Investment Changes/Performance |
| |
| Maturity Diversification | | | | | | |
| Days | | % of fund’s | | % of fund’s | | % of fund’s |
| | | investments | | investments | | investments |
| | | 12/31/05 | | 6/30/05 | | 12/31/04 |
| 0 – 30 | | 80.6 | | 77.7 | | 85.4 |
| 31 – 90 | | 6.8 | | 7.7 | | 5.0 |
| 91 – 180 | | 6.4 | | 5.6 | | 2.5 |
| 181 – 397 | | 6.2 | | 9.0 | | 7.1 |
| Weighted Average Maturity | | | | | | |
| | | 12/31/05 | | 6/30/05 | | 12/31/04 |
| Fidelity Ohio Municipal Money | | | | | | |
| Market Fund | | 37 Days | | 44 Days | | 34 Days |
| Ohio Tax Free Money Market | | | | | | |
| Funds Average* | | 39 Days | | 34 Days | | 42 Days |

| Current and Historical Seven Day Yields | | | | | | |
| | | 1/2/06 | | 10/3/05 | | 6/27/05 | | 3/28/05 | | 1/3/05 |
| Fidelity Ohio Municipal | | | | | | | | | | |
| Money Market Fund | | 2.93% | | 2.25% | | 2.04% | | 1.61% | | 1.46% |
Yield refers to the income paid by the fund over a given period. Yields for money market funds are usually for seven day periods, as they are here, though they are expressed as annual percentage rates. Past performance is no guarantee of future results. Yield will vary and it is possible to lose money by investing in the fund.
*Source: iMoneyNet, Inc.
Annual Report 22
| Fidelity Ohio Municipal Money Market Fund | | | | |
| Investments December 31, 2005 |
| Showing Percentage of Net Assets | | | | |
Municipal Securities 96.3% | | | | |
| | | Principal | | Value |
| | | Amount | | (Note 1) |
| Georgia – 0.7% | | | | |
| Columbus Wtr. & Swr. Rev. Participating VRDN | | | | |
| Series PT 2516, 3.55% (Liquidity Facility Merrill Lynch & Co., | | | | |
| Inc.) (b)(d) | | $ 5,160,000 | | $ 5,160,000 |
| Ohio – 93.9% | | | | |
| Akron Income Tax Rev. Participating VRDN: | | | | |
| Series ROC II R2137, 3.55% (Liquidity Facility Citigroup | | | | |
| Global Markets Hldgs., Inc.) (b)(d) | | 3,175,000 | | 3,175,000 |
| Series ROC II R259, 3.55% (Liquidity Facility Citibank | | | | |
| NA) (b)(d) | | 2,255,000 | | 2,255,000 |
| American Muni. Pwr. Bonds (Omega Joint Venture 6 Proj.) | | | | |
| 2.88%, tender 2/15/06 (b) | | 9,045,000 | | 9,045,000 |
| Ashtabula County Indl. Dev. Rev. (Plasticolors, Inc. Proj.) | | | | |
| Series 1996 A, 3.66%, LOC Key Bank NA, VRDN (b)(c) | | 1,710,000 | | 1,710,000 |
| Bellefontaine Hosp. Facilities Rev. (Mary Rutan Hosp. Proj.) | | | | |
| 3.55%, LOC Nat’l. City Bank, VRDN (b) | | 7,700,000 | | 7,700,000 |
| Butler County Gen. Oblig. BAN 3.75% 6/8/06 | | 4,025,000 | | 4,038,523 |
| Butler County Wtrwks. Rev. Participating VRDN Series ROC II | | | | |
| R2207, 3.55% (Liquidity Facility Citigroup Global Markets | | | | |
| Hldgs., Inc.) (b)(d) | | 2,550,000 | | 2,550,000 |
| Cambridge Hosp. Facilities Rev. (Southeastern Reg’l. Med. Ctr. | | | | |
| Proj.) 3.2%, LOC Nat’l. City Bank, VRDN (b) | | 3,950,000 | | 3,950,000 |
| Cincinnati City School District Participating VRDN Series EGL | | | | |
| 04 34, 3.55% (Liquidity Facility Citibank NA) (b)(d) | | 1,295,000 | | 1,295,000 |
| Cincinnati Student Ln. Fdg. Corp. Student Ln. Rev.: | | | | |
| Series 1998 A1, 3.56% (Liquidity Facility Sallie Mae), | | | | |
| VRDN (b)(c) | | 7,700,000 | | 7,700,000 |
| Series 1998 A2, 3.56% (Liquidity Facility Sallie Mae), | | | | |
| VRDN (b)(c) | | 19,800,000 | | 19,800,000 |
| Cincinnati Technical & Cmnty. College Gen. Receipts | | | | |
| Participating VRDN: | | | | |
| Series PT 02 1587, 3.54% (Liquidity Facility Merrill Lynch & | | | | |
| Co., Inc.) (b)(d) | | 6,460,000 | | 6,460,000 |
| Series PT 1615, 3.54% (Liquidity Facility Merrill Lynch & Co., | | | | |
| Inc.) (b)(d) | | 5,670,000 | | 5,670,000 |
| Cincinnati Wtr. Sys. Rev. Participating VRDN Series ROC II | | | | |
| R7528, 3.55% (Liquidity Facility Citibank NA) (b)(d) | | 2,635,000 | | 2,635,000 |
| Clermont County Indl. Dev. Rev. (American Micro Products | | | | |
| Proj.) 3.66%, LOC Key Bank NA, VRDN (b)(c) | | 1,510,000 | | 1,510,000 |
| Cleveland Arpt. Sys. Rev. Participating VRDN: | | | | |
| Series PT 799, 3.59% (Liquidity Facility Merrill Lynch & Co., | | | | |
| Inc.) (b)(c)(d) | | 1,500,000 | | 1,500,000 |
| Series Stars 81, 3.59% (Liquidity Facility BNP Paribas | | | | |
| SA) (b)(c)(d) | | 5,585,000 | | 5,585,000 |
| |
| See accompanying notes which are an integral part of the financial statements. | | |
| |
| 23 | | | | Annual Report |
| Fidelity Ohio Municipal Money Market Fund | | | | | | |
| Investments continued | | | | | | | | |
| |
| Municipal Securities continued | | | | | | |
| | | | | Principal | | | | Value |
| | | | | Amount | | | | (Note 1) |
| Ohio – continued | | | | | | | | |
| Cleveland Gen. Oblig. Participating VRDN Series PT 2032, | | | | | | |
| 3.54% (Liquidity Facility Merrill Lynch & Co., Inc.) (b)(d) | | $ 3,030,000 | | $ | | 3,030,000 |
| Cleveland Muni. School District BAN 3.75% 7/27/06 | | 7,900,000 | | | | 7,920,272 |
| Cleveland-Cuyahoga County Port Auth. Rev. (Carnegie/96th | | | | | | |
| Research Bldg., LLC Proj.) Series 2003, 3.58%, LOC Fifth | | | | | | |
| Third Bank, Cincinnati, VRDN (b) | | | | 2,000,000 | | | | 2,000,000 |
| Columbus City School District Participating VRDN | | | | | | |
| Series PT 2278, 3.54% (Liquidity Facility Merrill Lynch & Co., | | | | | | |
| Inc.) (b)(d) | | | | 2,730,000 | | | | 2,730,000 |
| Cuyahoga County Arpt. Facilities Rev. (Corporate | | | | | | |
| Wings-Cleveland LLC Proj.) 3.65%, LOC Nat’l. City Bank, | | | | | | |
| VRDN (b)(c) | | | | 3,710,000 | | | | 3,710,000 |
| Cuyahoga County Civic Facilities Rev. (Fairfax Dev. Corp. | | | | | | |
| Proj.) 3.59%, LOC Key Bank NA, VRDN (b) | | 4,390,000 | | | | 4,390,000 |
| Cuyahoga County Health Care Facilities Rev. (Althenheim | | | | | | |
| Proj.) 3.56%, LOC U.S. Bank NA, Minnesota, VRDN (b) | | 6,230,000 | | | | 6,230,000 |
| Cuyahoga County Indl. Dev. Rev.: | | | | | | | | |
| (Progressive Plastics, Inc. Proj.) 3.68%, LOC JPMorgan | | | | | | |
| Chase Bank, VRDN (b)(c) | | | | 1,215,000 | | | | 1,215,000 |
| (Pubco Corp. Proj.) Series 2001, 3.65%, LOC Nat’l. City | | | | | | |
| Bank, VRDN (b)(c) | | | | 2,650,000 | | | | 2,650,000 |
| (The Great Lakes Brewing Co. Proj.) Series 1997, 3.81%, | | | | | | |
| LOC Huntington Nat’l. Bank, Columbus, VRDN (b)(c) | | 3,790,000 | | | | 3,790,000 |
| Cuyahoga County Rev. (Cleveland Clinic Health Sys. Obligated | | | | | | |
| Group Prog.) Subseries B3, 3.75%, VRDN (b) | | 2,600,000 | | | | 2,600,000 |
| Darke County Health Care Facilities Rev. (Brethren Retirement | | | | | | |
| Cmnty. Proj.) 3.59%, LOC Fifth Third Bank, Cincinnati, | | | | | | |
| VRDN (b) | | | | 7,015,000 | | | | 7,015,000 |
| Dayton School District Participating VRDN Series SG 173, | | | | | | |
| 3.54% (Liquidity Facility Societe Generale) (b)(d) | | 12,030,000 | | | | 12,030,000 |
| Delaware County Health Care Facilities (Willow Brook | | | | | | |
| Christian Cmnty. Proj.) Series 1999, 3.65%, LOC Huntington | | | | | | |
| Nat’l. Bank, Columbus, VRDN (b) | | | | 3,725,000 | | | | 3,725,000 |
| Delaware Gen. Oblig. BAN 4.5% 12/14/06 | | 7,800,000 | | | | 7,878,825 |
| Elyria Gen. Oblig. BAN 4% 10/18/06 | | | | 2,550,000 | | | | 2,566,694 |
| Erie County Gen. Oblig. BAN: | | | | | | | | |
| 3.25% 4/12/06 | | | | 8,000,000 | | | | 8,008,589 |
| 3.25% 4/12/06 | | | | 5,000,000 | | | | 5,005,368 |
| Erie County Multi-family Hsg. Rev. (Providence Residential | | | | | | |
| Cmnty. Corp. Proj.) Series 1999 A, 3.56%, LOC JPMorgan | | | | | | |
| Chase Bank, VRDN (b) | | | | 8,800,000 | | | | 8,800,000 |
| Franklin County Multi-family Rev.: | | | | | | | | |
| (Golf Pointe Apts. Proj.) Series 2000 A, 3.54%, LOC Lasalle | | | | | | |
| Bank NA, VRDN (b)(c) | | | | 6,690,000 | | | | 6,690,000 |
See accompanying notes which are an integral part of the financial statements. | | | | |
| |
| Annual Report | | 24 | | | | | | |
| Municipal Securities continued | | | | | | |
| | | Principal | | | | Value |
| | | Amount | | | | (Note 1) |
| Ohio – continued | | | | | | |
| Franklin County Multi-family Rev.: – continued | | | | | | |
| (Hanover Ridge Apts. Proj. 3.6%, LOC Fannie Mae, | | | | | | |
| VRDN (b)(c) | | $ 4,350,000 | | $ | | 4,350,000 |
| Geauga County Health Care Facilities Rev. (Montefiore Hsg. | | | | | | |
| Corp. Proj.) Series 2001, 3.59%, LOC Key Bank NA, | | | | | | |
| VRDN (b) | | 5,580,000 | | | | 5,580,000 |
| Grove City Gen. Oblig. BAN 3.75% 6/22/06 | | 9,790,000 | | | | 9,835,349 |
| Hamilton County Health Care Facilities Rev. 3.58%, LOC Fifth | | | | | | |
| Third Bank, Cincinnati, VRDN (b) | | 4,040,000 | | | | 4,040,000 |
| Hamilton Gen. Oblig. BAN: | | | | | | |
| 3.5% 3/28/06 | | 9,800,000 | | | | 9,821,371 |
| 3.75% 6/1/06 | | 3,400,000 | | | | 3,410,240 |
| Jackson Local School District Stark & Summit Counties | | | | | | |
| Participating VRDN Series PT 2334, 3.54% (Liquidity Facility | | | | | | |
| Merrill Lynch & Co., Inc.) (b)(d) | | 3,985,000 | | | | 3,985,000 |
| Kettering Indl. Dev. Rev. (Millat Industries Corp. Proj.) 3.65%, | | | | | | |
| LOC Nat’l. City Bank, VRDN (b)(c) | | 3,120,000 | | | | 3,120,000 |
| Lake County Indl. Dev. Rev.: | | | | | | |
| (American Bus. Co. Proj.) 3.81%, LOC Huntington Nat’l. | | | | | | |
| Bank, Columbus, VRDN (b)(c) | | 860,000 | | | | 860,000 |
| (Norshar Co. Proj.) 3.68%, LOC JPMorgan Chase Bank, | | | | | | |
| VRDN (b)(c) | | 2,825,000 | | | | 2,825,000 |
| Lima Hosp. Rev. (Lima Memorial Hosp. Proj.) 3.65%, LOC | | | | | | |
| JPMorgan Chase Bank, VRDN (b) | | 2,300,000 | | | | 2,300,000 |
| Lucas County Multi-family Rev. (Lakewoods Proj.) 3.66%, LOC | | | | | | |
| Key Bank NA, VRDN (b)(c) | | 4,000,000 | | | | 4,000,000 |
| Marysville Wastewtr. Treatment Sys. Rev. BAN 4.5% | | | | | | |
| 12/21/06 | | 8,000,000 | | | | 8,084,026 |
| Medina County Indl. Dev. Rev.: | | | | | | |
| (Firedex, Inc. Proj.) Series 1997, 3.66%, LOC Key Bank NA, | | | | | | |
| VRDN (b)(c) | | 835,000 | | | | 835,000 |
| (Rembond Proj.) Series 1996, 3.68%, LOC JPMorgan Chase | | | | | | |
| Bank, VRDN (b)(c) | | 1,650,000 | | | | 1,650,000 |
| Montgomery County Gen. Oblig. Participating VRDN Series | | | | | | |
| ROC II R7513, 3.55% (Liquidity Facility Citibank NA) (b)(d) . | | 7,830,000 | | | | 7,830,000 |
| Montgomery County Health Care Facilities Rev.: | | | | | | |
| (Eastway Corp. & Property Resource Proj.) Series 1997, | | | | | | |
| 3.81%, LOC Huntington Nat’l. Bank, Columbus, | | | | | | |
| VRDN (b)(c) | | 2,570,000 | | | | 2,570,000 |
| (Kettering Affiliated Proj.) 3.65%, LOC JPMorgan Chase | | | | | | |
| Bank, VRDN (b) | | 2,400,000 | | | | 2,400,000 |
| Montgomery County Multi-family Hsg. Dev. Rev. (Pedcor | | | | | | |
| Invts.-Lyons Gate Proj.) 3.57%, LOC Fed. Home Ln. Bank, | | | | | | |
| Cincinnati, VRDN (b)(c) | | 4,306,000 | | | | 4,306,000 |
See accompanying notes which are an integral part of the financial statements.
25 Annual Report
| Fidelity Ohio Municipal Money Market Fund | | | | | | |
| Investments continued | | | | | | |
| |
| Municipal Securities continued | | | | | | |
| | | Principal | | | | Value |
| | | Amount | | | | (Note 1) |
| Ohio – continued | | | | | | |
| North Ridgeville Gen. Oblig. BAN 4% 9/21/06 | | $ 3,000,000 | | $ | | 3,012,624 |
| Ohio Air Quality Dev. Auth. Rev.: | | | | | | |
| Participating VRDN: | | | | | | |
| Series MS 1223, 3.55% (Liquidity Facility Morgan | | | | | | |
| Stanley) (b)(d) | | 8,300,000 | | | | 8,300,000 |
| Series PA 769R, 3.54% (Liquidity Facility Merrill Lynch & | | | | | | |
| Co., Inc.) (b)(d) | | 8,680,000 | | | | 8,680,000 |
| (AK Steel Corp. Proj.) Series A, 3.6%, LOC ABN AMRO | | | | | | |
| Bank NV, VRDN (b)(c) | | 14,500,000 | | | | 14,500,000 |
| (Cincinnati Gas & Elec. Co. Proj.) Series A: | | | | | | |
| 3.67%, VRDN (b) | | 7,600,000 | | | | 7,600,000 |
| 3.75%, LOC Cr. Lyonnais SA, VRDN (b)(c) | | 12,100,000 | | | | 12,100,000 |
| Ohio Bldg. Auth. Participating VRDN: | | | | | | |
| Series Putters 790, 3.55% (Liquidity Facility JPMorgan Chase | | | | | | |
| Bank) (b)(d) | | 3,190,000 | | | | 3,190,000 |
| Series Putters 793, 3.55% (Liquidity Facility JPMorgan Chase | | | | | | |
| & Co.) (b)(d) | | 2,075,000 | | | | 2,075,000 |
| Ohio Gen. Oblig. Participating VRDN: | | | | | | |
| Series PT 2046, 3.54% (Liquidity Facility Merrill Lynch & Co., | | | | | | |
| Inc.) (b)(d) | | 4,280,000 | | | | 4,280,000 |
| Series PT 2139, 3.54% (Liquidity Facility Merrill Lynch & Co., | | | | | | |
| Inc.) (b)(d) | | 4,295,000 | | | | 4,295,000 |
| Series PT 2200, 3.54% (Liquidity Facility Merrill Lynch & Co., | | | | | | |
| Inc.) (b)(d) | | 15,790,000 | | | | 15,790,000 |
| Series ROC II R479, 3.55% (Liquidity Facility Citibank | | | | | | |
| NA) (b)(d) | | 8,465,000 | | | | 8,465,000 |
| Series ROC II R7508, 3.55% (Liquidity Facility Citibank | | | | | | |
| NA) (b)(d) | | 11,210,000 | | | | 11,210,000 |
| Ohio Higher Edl. Facility Commission Rev.: | | | | | | |
| Participating VRDN: | | | | | | |
| Series EGL 7053020, 3.56% (Liquidity Facility Citibank | | | | | | |
| NA) (b)(d) | | 7,900,000 | | | | 7,900,000 |
| Series MS 98 116, 3.55% (Liquidity Facility Morgan | | | | | | |
| Stanley) (b)(d) | | 10,120,000 | | | | 10,120,000 |
| (Ashland Univ. Proj.) 3.56%, LOC Key Bank NA, VRDN (b) . | | 11,450,000 | | | | 11,450,000 |
| (Cleveland Institute of Music Proj.) 3.56%, LOC Nat’l. City | | | | | | |
| Bank, VRDN (b) | | 7,000,000 | | | | 7,000,000 |
| (Pooled Fing. Prog.): | | | | | | |
| Series 1996, 3.61%, LOC Fifth Third Bank, Cincinnati, | | | | | | |
| VRDN (b) | | 2,790,000 | | | | 2,790,000 |
| Series 1997, 3.61%, LOC Fifth Third Bank, Cincinnati, | | | | | | |
| VRDN (b) | | 4,600,000 | | | | 4,600,000 |
See accompanying notes which are an integral part of the financial statements.
| Municipal Securities continued | | | | |
| | | Principal | | Value |
| | | Amount | | (Note 1) |
| Ohio – continued | | | | |
| Ohio Higher Edl. Facility Commission Rev.: – continued | | | | |
| (Pooled Fing. Prog.): | | | | |
| Series 1998, 3.61%, LOC Fifth Third Bank, Cincinnati, | | | | |
| VRDN (b) | | $ 9,450,000 | | $ 9,450,000 |
| Series 1999, 3.61%, LOC Fifth Third Bank, Cincinnati, | | | | |
| VRDN (b) | | 8,200,000 | | 8,200,000 |
| Series 2005 A, 3.53%, LOC Fifth Third Bank, Cincinnati, | | | | |
| VRDN (b) | | 8,130,000 | | 8,130,000 |
| 3.1% 3/9/06 (Liquidity Facility JPMorgan Chase Bank), CP . | | 5,000,000 | | 5,000,000 |
| 3.15% 2/9/06 (Liquidity Facility JPMorgan Chase Bank), CP | | 7,000,000 | | 7,000,000 |
| Ohio Hsg. Fin. Agcy. Mtg. Rev.: | | | | |
| Bonds Series Merlots 00 A1, 3.32%, tender 11/7/06 | | | | |
| (Liquidity Facility Wachovia Bank NA) (b)(c)(d)(e) | | 4,260,000 | | 4,260,000 |
| Participating VRDN: | | | | |
| Series BA 01 I, 3.63% (Liquidity Facility Bank of America | | | | |
| NA) (b)(c)(d) | | 3,450,000 | | 3,450,000 |
| Series BA 98 B, 3.66% (Liquidity Facility Bank of America | | | | |
| NA) (b)(c)(d) | | 14,695,000 | | 14,695,000 |
| Series BA 98 Q, 3.66% (Liquidity Facility Bank of America | | | | |
| NA) (b)(c)(d) | | 4,600,000 | | 4,600,000 |
| Series LB 03 L46J, 3.63% (Liquidity Facility Lehman | | | | |
| Brothers Hldgs., Inc.) (b)(c)(d) | | 6,025,000 | | 6,025,000 |
| Series Merlots 01 A78, 3.59% (Liquidity Facility Wachovia | | | | |
| Bank NA) (b)(c)(d) | | 1,715,000 | | 1,715,000 |
| Series Merlots 02 A34, 3.59% (Liquidity Facility Wachovia | | | | |
| Bank NA) (b)(c)(d) | | 1,555,000 | | 1,555,000 |
| Series Merlots 05 A16, 3.59% (Liquidity Facility Wachovia | | | | |
| Bank NA) (b)(c)(d) | | 4,845,000 | | 4,845,000 |
| Series PT 1334, 3.59% (Liquidity Facility Merrill Lynch & | | | | |
| Co., Inc.) (b)(c)(d) | | 4,800,000 | | 4,800,000 |
| Series PT 228, 3.59% (Liquidity Facility Merrill Lynch & | | | | |
| Co., Inc.) (b)(c)(d) | | 3,515,000 | | 3,515,000 |
| Series PT 241, 3.59% (Liquidity Facility Merrill Lynch & | | | | |
| Co., Inc.) (b)(c)(d) | | 2,360,000 | | 2,360,000 |
| Series PT 567, 3.59% (Liquidity Facility Merrill Lynch & | | | | |
| Co., Inc.) (b)(c)(d) | | 2,350,000 | | 2,350,000 |
| Series PT 582, 3.59% (Liquidity Facility Svenska | | | | |
| Handelsbanken AB) (b)(c)(d) | | 2,300,000 | | 2,300,000 |
| Series B, 3.6% (Liquidity Facility Fed. Home Ln. Bank, | | | | |
| Cincinnati), VRDN (b)(c) | | 11,990,000 | | 11,990,000 |
| Series F, 3.55% (Liquidity Facility Fed. Home Ln. Bank, | | | | |
| Cincinnati), VRDN (b)(c) | | 6,400,000 | | 6,400,000 |
| |
| |
| See accompanying notes which are an integral part of the financial statements. | | |
| |
| 27 | | | | Annual Report |
| Fidelity Ohio Municipal Money Market Fund | | | | | | |
| Investments continued | | | | | | |
| |
| Municipal Securities continued | | | | | | |
| | | Principal | | | | Value |
| | | Amount | | | | (Note 1) |
| Ohio – continued | | | | | | |
| Ohio Hsg. Fin. Agcy. Multi-family Hsg. Rev.: | | | | | | |
| (Club at Spring Valley Apts. Proj.) Series 1996 A, 3.58%, | | | | | | |
| LOC Key Bank NA, VRDN (b)(c) | | $ 5,700,000 | | $ | | 5,700,000 |
| (Pedcor Invts. Willow Lake Apts. Proj.): | | | | | | |
| Series A, 3.6%, LOC Fed. Home Ln. Bank, Indianapolis, | | | | | | |
| VRDN (b)(c) | | 2,835,000 | | | | 2,835,000 |
| Series B, 3.7%, LOC Fed. Home Ln. Bank, Indianapolis, | | | | | | |
| VRDN (b)(c) | | 475,000 | | | | 475,000 |
| Series C, 3.7%, LOC Fed. Home Ln. Bank, Indianapolis, | | | | | | |
| VRDN (b)(c) | | 555,000 | | | | 555,000 |
| Series D, 3.7%, LOC Fed. Home Ln. Bank, Indianapolis, | | | | | | |
| VRDN (b)(c) | | 555,000 | | | | 555,000 |
| (Pine Crossing Apts. Proj.) 3.54%, LOC Lasalle Bank NA, | | | | | | |
| VRDN (b)(c) | | 5,670,000 | | | | 5,670,000 |
| (Shannon Glenn Apts. Proj.) 3.6%, LOC Fannie Mae, | | | | | | |
| VRDN (b)(c) | | 11,800,000 | | | | 11,800,000 |
| (Wingate at Belle Meadows Proj.) 3.6%, LOC Fed. Home Ln. | | | | | | |
| Bank, Cincinnati, VRDN (b)(c) | | 8,750,000 | | | | 8,750,000 |
| Ohio Indl. Dev. Rev.: | | | | | | |
| (K&S Realty Proj.) Series 1989 I, 3.59%, LOC Nat’l. City | | | | | | |
| Bank, VRDN (b)(c) | | 85,000 | | | | 85,000 |
| (K&S Realty/Starr Fabricating, Inc. Proj.) Series 1989 III, | | | | | | |
| 3.59%, LOC Nat’l. City Bank, VRDN (b)(c) | | 110,000 | | | | 110,000 |
| Ohio Solid Waste Rev.: | | | | | | |
| (BP Amoco Chemical Co. Proj.) 3.85% (BP PLC Guaranteed), | | | | | | |
| VRDN (b)(c) | | 6,300,000 | | | | 6,300,000 |
| (BP Exploration & Oil, Inc. Proj.) Series 2000, 3.85% (BP | | | | | | |
| PLC Guaranteed), VRDN (b)(c) | | 3,000,000 | | | | 3,000,000 |
| (BP Products NA, Inc. Proj.) Series B, 3.85% (BP PLC | | | | | | |
| Guaranteed), VRDN (b)(c) | | 2,115,000 | | | | 2,115,000 |
| (Republic Svcs., Inc. Proj.) 3.85%, VRDN (b)(c) | | 7,700,000 | | | | 7,700,000 |
| Ohio State Univ. Gen. Receipts Rev. Bonds Series 2003 C, | | | | | | |
| 3.1% tender 3/9/06, CP mode | | 10,000,000 | | | | 10,000,000 |
| Ohio Wtr. Dev. Auth. (Waste Mgmt., Inc. Proj.) Series B, 3.6%, | | | | | | |
| LOC Fleet Bank NA, VRDN (b)(c) | | 4,700,000 | | | | 4,700,000 |
| Ohio Wtr. Dev. Auth. Poll. Cont. Facilities Rev.: | | | | | | |
| Participating VRDN Series Putters 558, 3.55% (Liquidity | | | | | | |
| Facility JPMorgan Chase & Co.) (b)(d) | | 4,565,000 | | | | 4,565,000 |
| (Cleveland Elec. Illuminating Co. Proj.) Series A, 3.67%, | | | | | | |
| LOC Barclays Bank PLC, VRDN (b)(c) | | 6,000,000 | | | | 6,000,000 |
| (Toledo Edison Co. Proj.) Series A, 3.62%, LOC Barclays | | | | | | |
| Bank PLC, VRDN (b)(c) | | 3,800,000 | | | | 3,800,000 |
See accompanying notes which are an integral part of the financial statements.
| Municipal Securities continued | | | | | | |
| | | Principal | | | | Value |
| | | Amount | | | | (Note 1) |
| Ohio – continued | | | | | | |
| Ohio Wtr. Dev. Auth. Solid Waste Disp. Rev. (Timken Co. Proj.) | | | | | | |
| Series 1997, 3.62%, LOC Wachovia Bank NA, VRDN (b)(c) | | $24,000,000 | | $ | | 24,000,000 |
| Pepper Pike Gen. Oblig. BAN 3% 6/22/06 | | 1,373,000 | | | | 1,374,259 |
| Perrysburg Gen. Oblig. BAN: | | | | | | |
| 3.65% 11/9/06 | | 1,500,000 | | | | 1,504,963 |
| 3.65% 11/9/06 | | 2,600,000 | | | | 2,608,602 |
| 3.75% 5/25/06 | | 4,033,000 | | | | 4,046,913 |
| 3.75% 8/10/06 | | 4,465,000 | | | | 4,487,311 |
| Port of Greater Cincinnati Dev. Auth. Rev. (Nat’l. Underground | | | | | | |
| Railroad Freedom Ctr., Inc. Proj.) Series 2003 A, 3.58%, | | | | | | |
| LOC JPMorgan Chase Bank, LOC Fifth Third Bank, | | | | | | |
| Cincinnati, VRDN (b) | | 6,500,000 | | | | 6,500,000 |
| Portage County Indl. Dev. Rev. (Mantaline Corp. Proj.) 3.65%, | | | | | | |
| LOC Nat’l. City Bank, VRDN (b)(c) | | 2,195,000 | | | | 2,195,000 |
| Richland County Health Care Facilities Rev. (Mansfield | | | | | | |
| Memorial Homes Proj.) Series 2002, 3.61%, LOC Key Bank | | | | | | |
| NA, VRDN (b) | | 4,700,000 | | | | 4,700,000 |
| Richland County Indl. Dev. Rev. (Sabin Robbins Paper Co. | | | | | | |
| Proj.) Series 1997, 3.64%, LOC Standard Fed. Bank, | | | | | | |
| VRDN (b)(c) | | 1,600,000 | | | | 1,600,000 |
| Rickenbacker Port Auth. Indl. Dev. (Micro Industries Corp. | | | | | | |
| Proj.) Series 2000, 3.68%, LOC JPMorgan Chase Bank, | | | | | | |
| VRDN (b)(c) | | 2,425,000 | | | | 2,425,000 |
| Sandy Valley Loc School District BAN 4.25% 6/21/06 | | 6,610,000 | | | | 6,639,582 |
| Stark County Indl. Dev. Rev. (H-P Products, Inc. Proj.) 3.66%, | | | | | | |
| LOC Key Bank NA, VRDN (b)(c) | | 2,190,000 | | | | 2,190,000 |
| Stow Gen. Oblig. BAN 3.5% 5/11/06 | | 7,500,000 | | | | 7,517,657 |
| Summit County Civic Facilities Rev. (YMCA of Akron Proj.) | | | | | | |
| 3.59%, LOC Key Bank NA, VRDN (b) | | 4,920,000 | | | | 4,920,000 |
| Summit County Indl. Dev. Rev.: | | | | | | |
| (Commercial Alloys Corp. Proj.): | | | | | | |
| 3.7%, LOC Nat’l. City Bank, VRDN (b)(c) | | 1,500,000 | | | | 1,500,000 |
| 3.76%, LOC Nat’l. City Bank, VRDN (b)(c) | | 2,295,000 | | | | 2,295,000 |
| (Kaiser Dev. Proj.) 3.68%, LOC Nat’l. City Bank, VRDN (b)(c) | | 615,000 | | | | 615,000 |
| (Keltec, Inc. Proj.) Series 1987, 3.68%, LOC Nat’l. City | | | | | | |
| Bank, VRDN (b)(c) | | 115,000 | | | | 115,000 |
| (Mannix Co. Proj.) Series 1987, 3.68%, LOC JPMorgan | | | | | | |
| Chase Bank, VRDN (b)(c) | | 620,000 | | | | 620,000 |
| (Sigma Properties Proj.) Series 2000 B, 3.7%, LOC Nat’l. | | | | | | |
| City Bank, VRDN (b)(c) | | 1,740,000 | | | | 1,740,000 |
| (Summit Plastic Co. Proj.) 3.7%, LOC Nat’l. City Bank, | | | | | | |
| VRDN (b)(c) | | 825,000 | | | | 825,000 |
| (Triumph Hldgs. Proj.) 3.75%, LOC Nat’l. City Bank, | | | | | | |
| VRDN (b)(c) | | 1,260,000 | | | | 1,260,000 |
See accompanying notes which are an integral part of the financial statements.
29 Annual Report
| Fidelity Ohio Municipal Money Market Fund | | | | | | |
| Investments continued | | | | | | |
| |
| Municipal Securities continued | | | | | | |
| | | Principal | | | | Value |
| | | Amount | | | | (Note 1) |
| Ohio – continued | | | | | | |
| Tallmadge Gen. Oblig. BAN 3.25% 3/13/06 | | $ 1,950,000 | | $ | | 1,952,586 |
| Toledo City School District Participating VRDN | | | | | | |
| Series Putters 655, 3.55% (Liquidity Facility JPMorgan Chase | | | | | | |
| Bank) (b)(d) | | 1,695,000 | | | | 1,695,000 |
| Toledo-Lucas County Port Auth. Rev. (P&G Industries Proj.) | | | | | | |
| 3.65%, LOC Nat’l. City Bank, VRDN (b)(c) | | 1,725,000 | | | | 1,725,000 |
| Tuscarawas County Hosp. Facilities Rev. Participating VRDN | | | | | | |
| Series MT 103, 3.58% (Liquidity Facility Merrill Lynch & Co., | | | | | | |
| Inc.) (b)(d) | | 3,050,000 | | | | 3,050,000 |
| Univ. of Cincinnati Gen. Receipts BAN Series 2005 C, 4% | | | | | | |
| 3/28/06 | | 9,460,000 | | | | 9,488,196 |
| Upper Arlington City School District Participating VRDN | | | | | | |
| Series PT 2513, 3.54% (Liquidity Facility Merrill Lynch & Co., | | | | | | |
| Inc.) (b)(d) | | 5,980,000 | | | | 5,980,000 |
| Village of Indian Hill Econ. Dev. Rev. (Cincinnati Country Day | | | | | | |
| School Proj.) Series 1999, 3.6%, LOC Nat’l. City Bank, | | | | | | |
| VRDN (b) | | 5,545,000 | | | | 5,545,000 |
| Warren County Health Care Facilities Rev. (Otterbein Homes | | | | | | |
| Proj.) Series 1998 B, 3.57%, LOC Fifth Third Bank, | | | | | | |
| Cincinnati, VRDN (b) | | 11,704,000 | | | | 11,704,000 |
| Wood County Indl. Dev. Rev.: | | | | | | |
| (CMC Group Proj.) Series 2001, 3.65%, LOC Nat’l. City | | | | | | |
| Bank, VRDN (b)(c) | | 2,070,000 | | | | 2,070,000 |
| (Dowa THT America, Inc. Proj.) Series 1999, 3.65%, LOC | | | | | | |
| Comerica Bank, Detroit, VRDN (b)(c) | | 3,800,000 | | | | 3,800,000 |
| Zanesville-Muskingum Port Auth. Indl. Dev. Rev. (Almana II LLC | | | | | | |
| Proj.) Series 2000, 3.8%, LOC JPMorgan Chase Bank, | | | | | | |
| VRDN (b)(c) | | 5,300,000 | | | | 5,300,000 |
| | | | | | | 753,066,950 |
| |
| Puerto Rico 1.7% | | | | | | |
| Puerto Rico Commonwealth Gen. Oblig. TRAN 4.5% | | | | | | |
| 7/28/06, LOC Bank of Nova Scotia, New York Agcy., LOC | | | | | | |
| BNP Paribas SA | | 5,500,000 | | | | 5,539,200 |
See accompanying notes which are an integral part of the financial statements.
| Municipal Securities continued | | | | |
| | | Principal | | Value |
| | | Amount | | (Note 1) |
| Puerto Rico continued | | | | |
| Puerto Rico Commonwealth Infrastructure Fing. Auth. | | | | |
| Participating VRDN Series TOC 05 Z6, 3.59% (Liquidity | | | | |
| Facility Goldman Sachs Group, Inc.) (b)(d) | | $ 3,045,000 | | $ 3,045,000 |
| Puerto Rico Govt. Dev. Bank 2.85% 1/30/06, LOC Societe | | | | |
| Generale, CP (a) | | 5,100,000 | | 5,100,000 |
| | | | | 13,684,200 |
| |
| |
| TOTAL INVESTMENT PORTFOLIO 96.3% | | | | |
| (Cost $771,911,150) | | | | 771,911,150 |
| |
| NET OTHER ASSETS – 3.7% | | | | 29,993,627 |
| NET ASSETS 100% | | $ 801,904,777 |
| Security Type Abbreviations |
| BAN | | — | | BOND ANTICIPATION NOTE |
| CP | | — | | COMMERCIAL PAPER |
| TRAN | | — | | TAX AND REVENUE |
| | | | ANTICIPATION NOTE | | |
| VRDN | | — | | VARIABLE RATE DEMAND NOTE |
Legend
(a) Security exempt from registration under
Rule 144A of the Securities Act of 1933.
These securities may be resold in
transactions exempt from registration,
normally to qualified institutional buyers.
At the period end, the value of these
securities amounted to $5,100,000 or
0.6% of net assets.
(b) The coupon rate shown on floating or
adjustable rate securities represents the
rate at period end.
(c) Private activity obligations whose
interest is subject to the federal
alternative minimum tax for individuals.
|
(d) Provides evidence of ownership in one
or more underlying municipal bonds.
(e) Restricted securities – Investment in
securities not registered under the
Securities Act of 1933 (excluding 144A
issues). At the end of the period, the
value of restricted securities (excluding
144A issues) amounted to $4,260,000
or 0.5% of net assets.
|
Additional information on each holding is as follows:
| | | Acquisition | | |
| Security | | Date | | Cost |
| Ohio Hsg. Fin. | | | | |
| Agcy. Mtg. Rev. | | | | |
| Bonds Series | | | | |
| Merlots 00 A1, | | | | |
| 3.32%, tender | | | | |
| 11/7/06 | | | | |
| (Liquidity Facility | | | | |
| Wachovia Bank | | | | |
| NA) | | 11/12/03 | | $ 4,260,000 |
See accompanying notes which are an integral part of the financial statements.
31 Annual Report
Fidelity Ohio Municipal Money Market Fund
Investments continued
|
Affiliated Central Funds
Information regarding income received by the fund from the affiliated Central funds during the period is as follows:
| Fund | | | | Income received |
| Fidelity Municipal Cash Central Fund | | | $ | 92,195 |
See accompanying notes which are an integral part of the financial statements.
Annual Report 32
| Fidelity Ohio Municipal Money Market Fund | | | | | | |
| |
| Financial Statements | | | | | | | | |
| |
| Statement of Assets and Liabilities | | | | | | | | |
| | | | | | | December 31, 2005 |
| |
| Assets | | | | | | | | |
| Investment in securities, at value | | | | | | | | |
| See accompanying schedule: | | | | | | | | |
| Unaffiliated issuers (cost $771,911,150) | | | | | | $ | | 771,911,150 |
| Cash | | | | | | | | 24,150,948 |
| Receivable for fund shares sold | | | | | | | | 14,628,043 |
| Interest receivable | | | | | | | | 4,825,122 |
| Prepaid expenses | | | | | | | | 3,671 |
| Other receivables | | | | | | | | 97,010 |
| Total assets | | | | | | | | 815,615,944 |
| |
| Liabilities | | | | | | | | |
| Payable for investments purchased | | $ | | 140,014 | | | | |
| Payable for fund shares redeemed | | | | 13,162,506 | | | | |
| Distributions payable | | | | 32,271 | | | | |
| Accrued management fee | | | | 245,072 | | | | |
| Other affiliated payables | | | | 96,646 | | | | |
| Other payables and accrued expenses | | | | 34,658 | | | | |
| Total liabilities | | | | | | | | 13,711,167 |
| |
| Net Assets | | | | | | $ | | 801,904,777 |
| Net Assets consist of: | | | | | | | | |
| Paid in capital | | | | | | $ | | 801,803,753 |
| Undistributed net investment income | | | | | | | | 75,163 |
| Accumulated undistributed net realized gain (loss) on | | | | | | | | |
| investments | | | | | | | | 25,861 |
| Net Assets, for 801,822,605 shares outstanding | | | | | | $ | | 801,904,777 |
| Net Asset Value, offering price and redemption price per | | | | | | |
| share ($801,904,777 ÷ 801,822,605 shares) | | | | | | $ | | 1.00 |
See accompanying notes which are an integral part of the financial statements.
33 Annual Report
| Fidelity Ohio Municipal Money Market Fund | | | | |
| Financial Statements continued | | | | |
| |
| Statement of Operations | | | | | | |
| | | | | Year ended December 31, 2005 |
| |
| Investment Income | | | | | | |
| Interest | | | | $ | | 18,147,652 |
| Income from affiliated Central Funds | | | | | | 92,195 |
| Total income | | | | | | 18,239,847 |
| |
| Expenses | | | | | | |
| Management fee | | $ | | 2,834,767 | | |
| Transfer agent fees | | | | 1,038,876 | | |
| Accounting fees and expenses | | | | 94,440 | | |
| Independent trustees’ compensation | | | | 3,398 | | |
| Custodian fees and expenses | | | | 12,754 | | |
| Registration fees | | | | 35,031 | | |
| Audit | | | | 38,859 | | |
| Legal | | | | 6,341 | | |
| Miscellaneous | | | | 5,488 | | |
| Total expenses before reductions | | | | 4,069,954 | | |
| Expense reductions | | | | (824,953) | | 3,245,001 |
| |
| Net investment income | | | | | | 14,994,846 |
| Realized and Unrealized Gain (Loss) | | | | |
| Net realized gain (loss) on: | | | | | | |
| Investment securities: | | | | | | |
| Unaffiliated issuers | | | | | | 51,221 |
| Net increase in net assets resulting from operations | | $ | | 15,046,067 |
See accompanying notes which are an integral part of the financial statements.
| Statement of Changes in Net Assets | | | | |
| | | Year ended | | Year ended |
| | | December 31, | | December 31, |
| | | 2005 | | 2004 |
| Increase (Decrease) in Net Assets | | | | |
| Operations | | | | |
| Net investment income | | $ 14,994,846 | | $ 5,364,905 |
| Net realized gain (loss) | | 51,221 | | (25,360) |
| Net increase in net assets resulting | | | | |
| from operations | | 15,046,067 | | 5,339,545 |
| Distributions to shareholders from net investment income . | | (14,990,504) | | (5,369,246) |
| Share transactions at net asset value of $1.00 per share | | | | |
| Proceeds from sales of shares | | 1,997,767,736 | | 1,700,320,832 |
| Reinvestment of distributions | | 14,776,226 | | 5,288,351 |
| Cost of shares redeemed | | (1,980,752,974) | | (1,623,280,855) |
| Net increase (decrease) in net assets and shares | | | | |
| resulting from share transactions | | 31,790,988 | | 82,328,328 |
| Total increase (decrease) in net assets | | 31,846,551 | | 82,298,627 |
| |
| Net Assets | | | | |
| Beginning of period | | 770,058,226 | | 687,759,599 |
| End of period (including undistributed net investment | | | | |
| income of $75,163 and undistributed net investment | | | | |
| income of $70,820, respectively) | | $ 801,904,777 | | $ 770,058,226 |
See accompanying notes which are an integral part of the financial statements.
35 Annual Report
| Financial Highlights | | | | | | | | | | | | | | | | | | | | |
| |
| Years ended December 31, | | | | 2005 | | | | 2004 | | | | 2003 | | | | 2002 | | | | 2001 |
| Selected Per Share Data | | | | | | | | | | | | | | | | | | | | |
| Net asset value, | | | | | | | | | | | | | | | | | | | | |
| beginning of period | | | | $ 1.00 | | | | 1.00 | | | | $ 1.00 | | | | $ 1.00 | | | | $ 1.00 |
| Income from Investment | | | | | | | | | | | | | | | | | | | | |
| Operations | | | | | | | | | | | | | | | | | | | | |
| Net investment income | | | | 020 | | | | .008 | | | | .006 | | | | .011 | | | | .025 |
| Distributions from net investment | | | | | | | | | | | | | | | | | | | | |
| income | | | | (.020) | | | | (.008) | | | | (.006) | | | | (.011) | | | | (.025) |
| Net asset value, end of period | | | | $ 1.00 | | | | $ 1.00 | | | | $ 1.00 | | | | $ 1.00 | | | | $ 1.00 |
| Total ReturnA | | | | 1.99% | | | | .76% | | | | .64% | | | | 1.13% | | | | 2.52% |
| Ratios to Average Net AssetsB | | | | | | | | | | | | | | | | | | | | |
| Expenses before reductions | | | | 54% | | | | .54% | | | | .54% | | | | .54% | | | | .55% |
| Expenses net of fee waivers, | | | | | | | | | | | | | | | | | | | | |
| if any | | | | 54% | | | | .54% | | | | .54% | | | | .54% | | | | .55% |
| Expenses net of all reductions | | | | 43% | | | | .53% | | | | .53% | | | | .51% | | | | .51% |
| Net investment income | | | | 1.98% | | | | .77% | | | | .64% | | | | 1.12% | | | | 2.47% |
| Supplemental Data | | | | | | | | | | | | | | | | | | | | |
| Net assets, end of period | | | | | | | | | | | | | | | | | | | | |
| (000 omitted) | | $801,905 | | $770,058 | | $687,760 | | $652,072 | | $622,602 |
A Total returns would have been lower had certain expenses not been reduced during the periods shown.
B Expense ratios reflect operating expenses of the fund. Expenses before reductions do not reflect amounts reimbursed by the investment adviser or
expense offset arrangements and do not represent the amount paid by the fund during periods when reimbursements or reductions occur.
Expenses net of fee waivers reflect expenses after reimbursement by the investment adviser but prior to reductions from expense offset arrange
ments. Expenses net of all reductions represent the net expenses paid by the fund.
|
See accompanying notes which are an integral part of the financial statements.
Notes to Financial Statements
For the period ended December 31, 2005
|
1. Significant Accounting Policies.
Fidelity Ohio Municipal Income Fund (the income fund) is a fund of Fidelity Municipal Trust. Fidelity Ohio Municipal Money Market Fund (the money market fund) is a fund of Fidelity Municipal Trust II. On July 21, 2005, the Board of Trustees approved a change in the name of Spartan Ohio Municipal Income Fund to Fidelity Ohio Municipal Income Fund effective August 15, 2005. Each trust is registered under the Investment Company Act of 1940, as amended (the 1940 Act), as an open end management investment company. Fidelity Municipal Trust and Fidelity Municipal Trust II (the trusts) are organized as a Massachusetts business trust and a Delaware statutory trust, respectively. Each fund is authorized to issue an unlimited number of shares. Each fund may be affected by economic and political developments in the state of Ohio. Certain funds may invest in affiliated money market central funds (Money Market Central Funds) which are open end investment companies available to investment companies and other accounts managed by Fidelity Management & Research Company (FMR) and its affili ates. The financial statements have been prepared in conformity with accounting principles generally accepted in the United States of America, which require manage ment to make certain estimates and assumptions at the date of the financial statements. The following summarizes the significant accounting policies of the income fund and the money market fund:
Security Valuation. Investments are valued and net asset value per share is calculated (NAV calculation) as of the close of business of the New York Stock Exchange, normally 4:00 p.m. Eastern time. Wherever possible, each fund uses independent pricing services approved by the Board of Trustees to value their investments. For the income fund, debt securities, including restricted securities, for which quotes are readily available, are valued by independent pricing services or by dealers who make markets in such securi ties. Pricing services consider yield or price of bonds of comparable quality, coupon, maturity and type as well as dealer supplied prices. When current market prices or quotations are not readily available or do not accurately reflect fair value, valuations may be determined in accordance with procedures adopted by the Board of Trustees. The frequency of when fair value pricing is used is unpredictable. The value of securities used for NAV calculation under fair value pricing may differ from published prices for the same securities. Investments in open end mutual funds are valued at their closing net asset value each business day. Short term securities with remaining maturities of sixty days or less for which quotations are not readily available are valued at amortized cost, which approximates value.
As permitted by compliance with certain conditions under Rule 2a 7 of the 1940 Act, securities owned by the money market fund are valued at amortized cost which approximates value.
37 Annual Report
| Notes to Financial Statements continued |
1. Significant Accounting Policies continued |
Investment Transactions and Income. Security transactions are accounted for as of trade date. Gains and losses on securities sold are determined on the basis of identified cost. Interest income is accrued as earned. Interest income includes coupon interest and amortization of premium and accretion of discount on debt securities.
Expenses. Most expenses of each trust can be directly attributed to a fund. Expenses which cannot be directly attributed are apportioned among each fund in the trust.
Income Tax Information and Distributions to Shareholders. Each year, each fund intends to qualify as a regulated investment company by distributing all of its taxable income and realized gains under Subchapter M of the Internal Revenue Code. As a result, no provision for income taxes is required in the accompanying financial statements.
Dividends are declared daily and paid monthly from net investment income. Distribu tions from realized gains, if any, are recorded on the ex dividend date. Income and capital gain distributions are determined in accordance with income tax regulations, which may differ from generally accepted accounting principles. In addition, certain funds will claim a portion of the payment made to redeeming shareholders as a distribu tion for income tax purposes.
Capital accounts within the financial statements are adjusted for permanent book tax differences. These adjustments have no impact on net assets or the results of operations. Temporary book tax differences will reverse in a subsequent period.
Book tax differences are primarily due to futures transactions, market discount, deferred trustees compensation, capital loss carryforwards, and losses deferred due to futures transactions.
The funds purchase municipal securities whose interest, in the opinion of the issuer, is free from federal income tax. There is no assurance that the Internal Revenue Service (IRS) will agree with this opinion. In the event the IRS determines that the issuer does not comply with relevant tax requirements, interest payments from a security could become federally taxable, possibly retroactively to the date the security was issued.
| 1. Significant Accounting Policies continued | | |
Income Tax Information and Distributions to Shareholders continued |
The tax basis components of distributable earnings and the federal tax cost as of period end were as follows for each fund:
| | | Cost for | | | | | | | | | | Net Unrealized |
| | | Federal Income | | | | Unrealized | | Unrealized | | | | Appreciation/ |
| | | Tax Purposes | | | | Appreciation | | Depreciation | | | | (Depreciation) |
| Fidelity Ohio Municipal | | | | | | | | | | | | |
| Income Fund | | $ | | 407,729,677 | | | | $ | | 15,635,299 | | $ | | (1,127,427) | | | | $ | | 14,507,872 |
| Fidelity Ohio Municipal Money | | | | | | | | | | | | |
| Market Fund | | 771,911,150 | | | | — | | — | | | | — |
| |
| | | | | | | Undistributed | | Undistributed | | | | |
| | | | | | | Ordinary | | Long-term | | | | Capital Loss |
| | | | | | | Income | | Capital Gain | | | | Carryforward |
| Fidelity Ohio Municipal Income Fund | | | | | | $ | | — | | $ | | 170,648 | | | | $ | | — |
| Fidelity Ohio Municipal Money Market Fund | | | | | | | | 76,201 | | | | 5,878 | | | | | | — |
| |
| The tax character of distributions paid was as follows: | | | | | | |
| |
| December 31, 2005 | | | | | | | | | | | | |
| | | Tax-exempt | | | | Ordinary | | Long-term | | | | |
| | | Income | | | | Income | | Capital Gains | | | | Total |
| Fidelity Ohio Municipal Income | | | | | | | | | | | | |
| Fund | | $ | | 17,117,253 | | | | $ | | — | | $ | | 6,682,810 | | | | $ | | 23,800,063 |
| Fidelity Ohio Municipal Money | | | | | | | | | | | | |
| Market Fund | | | | 14,990,504 | | | | | | — | | | | — | | | | | | 14,990,504 |
| |
| December 31, 2004 | | | | | | | | | | | | |
| | | Tax-exempt | | | | Ordinary | | Long-term | | | | |
| | | Income | | | | Income | | Capital Gains | | | | Total |
| Fidelity Ohio Municipal Income | | | | | | | | | | | | |
| Fund | | $ | | 17,922,650 | | | | $ | | — | | $ | | 4,676,940 | | | | $ | | 22,599,590 |
| Fidelity Ohio Municipal Money | | | | | | | | | | | | |
| Market Fund | | | | 5,369,246 | | | | | | — | | | | — | | | | | | 5,369,246 |
Short Term Trading (Redemption) Fees. Shares held in the income fund less than 30 days are subject to a redemption fee equal to .50% of the proceeds of the redeemed shares. All redemption fees, including any estimated redemption fees paid by FMR, are retained by the fund and accounted for as an addition to paid in capital.
39 Annual Report
| Notes to Financial Statements continued |
2. Operating Policies. | | |
Futures Contracts. The income fund may use futures contracts to manage its exposure to the bond market and to fluctuations in interest rates. Buying futures tends to increase a fund’s exposure to the underlying instrument, while selling futures tends to decrease a fund’s exposure to the underlying instrument or hedge other fund investments. Losses may arise from changes in the value of the underlying instruments or if the counterpar ties do not perform under the contract’s terms. Gains (losses) are realized upon the expiration or closing of the futures contracts. Futures contracts are valued at the settle ment price established each day by the board of trade or exchange on which they are traded.
Restricted Securities. Certain funds may invest in securities that are subject to legal or contractual restrictions on resale. These securities generally may be resold in transac tions exempt from registration or to the public if the securities are registered. Disposal of these securities may involve time consuming negotiations and expense, and prompt sale at an acceptable price may be difficult. Information regarding restricted securities is included at the end of each applicable fund’s Schedule of Investments.
3. Purchases and Sales of Investments.
Purchases and sales of securities, other than short term securities and U.S. government securities, for the income fund aggregated $101,907,055 and $95,384,268, respectively.
4. Fees and Other Transactions with Affiliates.
Management Fee. FMR and its affiliates provide the funds with investment manage ment related services for which the funds pay a monthly management fee. The manage ment fee is the sum of an individual fund fee rate and a group fee rate. The individual fund fee rate is applied to each fund’s average net assets. The group fee rate is based upon the average net assets of all the mutual funds advised by FMR. The group fee rate decreases as assets under management increase and increases as assets under manage ment decrease. For the period, each fund’s annual management fee rate expressed as a percentage of each fund’s average net assets was as follows:
| | | Individual | | Group | | |
| | | Rate | | Rate | | Total |
| Fidelity Ohio Municipal Income Fund | | .25% | | .12% | | .37% |
| Fidelity Ohio Municipal Money Market Fund | | .25% | | .12% | | .37% |
4. Fees and Other Transactions with Affiliates continued
Transfer Agent and Accounting Fees. Citibank, N.A. (Citibank) is the custodian, transfer agent and shareholder servicing agent for the funds. Citibank has entered into a sub arrangement with Fidelity Service Company, Inc. (FSC), an affiliate of FMR, under which FSC performs the activities associated with the funds’ transfer and shareholder servicing agent and accounting functions. The funds pay account fees and asset based fees that vary according to account size and type of account. FSC pays for typesetting, printing and mailing of shareholder reports, except proxy statements. The accounting fee is based on the level of average net assets for the month. For the period, the transfer agent fees were equivalent to the following annual rates expressed as a percentage of average net assets:
| Fidelity Ohio Municipal Income Fund | | .08% | | |
| Fidelity Ohio Municipal Money Market Fund | | .14% | | |
Affiliated Central Funds. Certain funds may invest in Money Market Central Funds which seek preservation of capital and current income and are managed by Fidelity Investments Money Management, Inc. (FIMM) an affiliate of FMR. The Money Market Central Funds do not pay a management fee.
5. Committed Line of Credit.
|
The income fund participates with other funds managed by FMR in a $4.2 billion credit facility (the “line of credit”) to be utilized for temporary or emergency purposes to fund shareholder redemptions or for other short term liquidity purposes. The participating funds have agreed to pay commitment fees on their pro rata portion of the line of credit. During the period, there were no borrowings on this line of credit.
Through arrangements with each applicable fund’s custodian and transfer agent, credits realized as a result of uninvested cash balances were used to reduce each applicable fund’s expenses. All of the applicable expense reductions are noted in the table below.
| | | | | | | Transfer | | | | |
| | | | | Custody | | Agent | | | | Accounting |
| | | | | expense | | expense | | | | expense |
| | | | | reduction | | reduction | | | | reduction |
| |
| Fidelity Ohio Municipal Income Fund | | | $ | 7,033 | | $ | | 116,377 | | | $ | — |
| Fidelity Ohio Municipal Money Market Fund | | | | 12,623 | | | | 795,214 | | | | 17,116 |
41 Annual Report
| Notes to Financial Statements continued |
7. Other. | | |
The funds’ organizational documents provide former and current trustees and officers with a limited indemnification against liabilities arising in connection with the perfor mance of their duties to the funds. In the normal course of business, the funds may also enter into contracts that provide general indemnifications. The funds’ maximum exposure under these arrangements is unknown as this would be dependent on future claims that may be made against the funds. The risk of material loss from such claims is considered remote.
Report of Independent Registered Public Accounting Firm
To the Trustees of Fidelity Municipal Trust and Fidelity Municipal Trust II and the Shareholders of Fidelity Ohio Municipal Income Fund (formerly Spartan Ohio Municipal Income Fund) and Fidelity Ohio Municipal Money Market Fund:
In our opinion, the accompanying statements of assets and liabilities, including the schedules of investments, and the related statements of operations and of changes in net assets and the financial highlights present fairly, in all material respects, the financial position of Fidelity Ohio Municipal Income Fund (formerly Spartan Ohio Municipal Income Fund) (a fund of Fidelity Municipal Trust) and Fidelity Ohio Municipal Money Market Fund (a fund of Fidelity Municipal Trust II) at December 31, 2005 and the results of their operations, the changes in their net assets and the financial highlights for the periods indicated, in conformity with accounting principles generally accepted in the United States of America. These financial statements and financial highlights (hereafter referred to as “financial statements”) are the responsibility of the Fidelity Municipal Trust’s and Fidelity Municipal Trust II’s management; our responsibility is to express an opinion on these financial statements based on our audits. We conducted our audits of these financial statements in accordance with the standards of the Public Company Accounting Oversight Board (United States). Those standards require that we plan and perform the audit to obtain reasonable assurance about whether the financial statements are free of material misstatement. An audit includes examining, on a test basis, evidence supporting the amounts and disclosures in the financial statements, assessing the ac counting principles used and significant estimates made by management, and evaluating the overall financial statement presentation. We believe that our audits, which included confirmation of securities at December 31, 2005 by correspondence with the custodian and brokers, provide a reasonable basis for our opinion.
/s/ PricewaterhouseCoopers LLP
PricewaterhouseCoopers LLP
Boston, Massachusetts
February 9, 2006
|
43 Annual Report
Trustees and Officers
The Trustees, Member of the Advisory Board, and executive officers of the trusts and funds, as applicable, are listed below. The Board of Trustees governs each fund and is responsible for protecting the interests of shareholders. The Trustees are experienced executives who meet periodically throughout the year to oversee each fund’s activities, review contractual arrangements with companies that provide services to each fund, and review each fund’s performance. Except for William O. McCoy and Albert R. Gamper, Jr., each of the Trustees oversees 326 funds advised by FMR or an affiliate. Mr. McCoy oversees 328 funds advised by FMR or an affiliate. Mr. Gamper oversees 235 funds advised by FMR or an affiliate.
The Trustees hold office without limit in time except that (a) any Trustee may resign; (b) any Trustee may be removed by written instrument, signed by at least two thirds of the number of Trustees prior to such removal; (c) any Trustee who requests to be retired or who has become incapacitated by illness or injury may be retired by written instru ment signed by a majority of the other Trustees; and (d) any Trustee may be removed at any special meeting of shareholders by a two thirds vote of the outstanding voting securities of the trust. Each Trustee who is not an interested person (as defined in the 1940 Act) (Independent Trustee), shall retire not later than the last day of the calendar year in which his or her 72nd birthday occurs. The Independent Trustees may waive this mandatory retirement age policy with respect to individual Trustees. The executive officers and Advisory Board Member hold office without limit in time, except that any officer and Advisory Board Member may resign or may be removed by a vote of a majority of the Trustees at any regular meeting or any special meeting of the Trustees. Except as indicated, each individual has held the office shown or other offices in the same company for the past five years.
The funds’ Statement of Additional Information (SAI) includes more information about the Trustees. To request a free copy, call Fidelity at 1-800-544-8544.
Correspondence intended for each Trustee who is an interested person may be sent to Fidelity Investments, 82 Devonshire Street, Boston, Massachusetts 02109.
| | Name, Age; Principal Occupation
Edward C. Johnson 3d (75)
|
Year of Election or Appointment: 1984 or 1991
Trustee of Fidelity Municipal Trust (1984) and Fidelity Municipal Trust II (1991). Mr. Johnson is Chairman of the Board of Trustees. Mr. Johnson serves as Chief Executive Officer, Chairman, and a Director of FMR Corp.; a Director and Chairman of the Board and of the Executive Committee of FMR; Chairman and a Director of Fidelity Management & Research (Far East) Inc.; Chairman and a Director of Fidelity Investments Money Management, Inc.; and Chairman (2001 present) and a Director (2000 present) of FMR Co., Inc.
| | Name, Age; Principal Occupation
Stephen P. Jonas (52)
|
Year of Election or Appointment: 2005
Mr. Jonas is Senior Vice President of Ohio Municipal Money Market (2005 present) and Ohio Municipal Income (2005 present). He also serves as Senior Vice President of other Fidelity funds (2005 present). Mr. Jonas is Executive Director of FMR (2005 present). Previously, Mr. Jonas served as President of Fidelity Enterprise Operations and Risk Services (2004 2005), Chief Administrative Officer (2002 2004), and Chief Financial Officer of FMR Co. (1998 2000). Mr. Jonas has been with Fidelity Investments since 1987 and has held various financial and management positions including Chief Financial Officer of FMR. In addition, he serves on the Boards of Boston Ballet (2003 present) and Simmons College (2003 present).
Year of Election or Appointment: 2003
Mr. Reynolds is a Director (2003 present) and Chief Operating Officer (2002 present) of FMR Corp. He also serves on the Board at Fidelity Investments Canada, Ltd. (2000 present). Previously, Mr. Reynolds served as President of Fidelity Investments Institutional Retirement Group (1996 2000).
* Trustees have been determined to be “Interested Trustees” by virtue of, among other things, their affiliation with the trusts or various entities under common control with FMR.
45 Annual Report
Trustees and Officers - continued
Independent Trustees:
Correspondence intended for each Independent Trustee (that is, the Trustees other than the Interested Trustees) may be sent to Fidelity Investments, P.O. Box 55235, Boston, Massachusetts 02205 5235.
| | Name, Age; Principal Occupation
Dennis J. Dirks (57)
|
Year of Election or Appointment: 2005
Prior to his retirement in May 2003, Mr. Dirks was Chief Operating Officer and a member of the Board of The Depository Trust & Clearing Corporation (DTCC) (1999 2003). He also served as President, Chief Operating Officer, and Board member of The Depository Trust Company (DTC) (1999 2003) and President and Board member of the National Securities Clearing Corporation (NSCC) (1999 2003). In addition, Mr. Dirks served as Chief Executive Officer and Board member of the Government Securities Clearing Corporation (2001 2003) and Chief Executive Officer and Board member of the Mortgage Backed Securities Clearing Corporation (2001 2003). Mr. Dirks also serves as a Trustee of Manhattan College (2005 present).
| | Albert R. Gamper, Jr. (63)
|
Year of Election or Appointment: 2006
Mr. Gamper also serves as a Trustee (2006 present) or Member of the Advisory Board (2005 present) of other investment companies advised by FMR. Prior to his retirement in December 2004, Mr. Gamper served as Chairman of the Board of CIT Group Inc. (commercial finance). During his tenure with CIT Group Inc. Mr. Gamper served in numerous senior management positions, including Chairman (1987 1989; 1999 2001; 2002 2004), Chief Executive Officer (1987 2004), and President (1989 2002). He currently serves as a member of the Board of Directors of Public Service Enterprise Group (utilities, 2001 present), Chairman of the Board of Governors, Rutgers University (2004 present), and Chairman of the Board of Saint Barnabas Health Care System.
Name, Age; Principal Occupation
Robert M. Gates (62)
|
Year of Election or Appointment: 1997
Dr. Gates is Chairman of the Independent Trustees (2006 present). Dr. Gates is President of Texas A&M University (2002 present). He was Director of the Central Intelligence Agency (CIA) from 1991 to 1993. From 1989 to 1991, Dr. Gates served as Assistant to the President of the United States and Deputy National Security Advisor. Dr. Gates is a Director of NACCO Industries, Inc. (mining and manufacturing), Parker Drilling Co., Inc. (drilling and rental tools for the energy industry, 2001 present), and Brinker International (restaurant management, 2003 present). Previously, Dr. Gates served as a Director of LucasVarity PLC (automotive components and diesel engines), a Director of TRW Inc. (automotive, space, defense, and information technology), and Dean of the George Bush School of Government and Public Service at Texas A&M University (1999 2001). Dr. Gates also is a Trustee of the Forum for International Policy.
Year of Election or Appointment: 2004
Dr. Heilmeier is Chairman Emeritus of Telcordia Technologies (commu nication software and systems), where prior to his retirement, he served as company Chairman and Chief Executive Officer. He currently serves on the Boards of Directors of The Mitre Corporation (systems engineer ing and information technology support for the government), and HRL Laboratories (private research and development, 2004 present). He is Chairman of the General Motors Science & Technology Advisory Board and a Life Fellow of the Institute of Electrical and Electronics Engineers (IEEE) (2000 present). Dr. Heilmeier is a member of the Defense Science Board and the National Security Agency Advisory Board. He is also a member of the National Academy of Engineering, the American Academy of Arts and Sciences, and the Board of Overseers of the School of Engineering and Applied Science of the University of Pennsylvania. Previously, Dr. Heilmeier served as a Director of TRW Inc. (automotive, space, defense, and information technology, 1992 2002), Compaq (1994 2002), Automatic Data Processing, Inc. (ADP) (technology based business outsourcing, 1995 2002), INET Technologies Inc. (telecommu nications network surveillance, 2001 2004), and Teletech Holdings (cus tomer management services). He is the recipient of the 2005 Kyoto Prize in Advanced Technology for his invention of the liquid display.
47 Annual Report
Trustees and Officers - continued
| | Name, Age; Principal Occupation
Marie L. Knowles (59)
|
Year of Election or Appointment: 2001
Prior to Ms. Knowles’ retirement in June 2000, she served as Executive Vice President and Chief Financial Officer of Atlantic Richfield Company (ARCO) (diversified energy, 1996 2000). From 1993 to 1996, she was a Senior Vice President of ARCO and President of ARCO Transportation Company. She served as a Director of ARCO from 1996 to 1998. She currently serves as a Director of Phelps Dodge Corporation (copper mining and manufacturing) and McKesson Corporation (healthcare ser vice, 2002 present). Ms. Knowles is a Trustee of the Brookings Institution and the Catalina Island Conservancy and also serves as a member of the Advisory Board for the School of Engineering of the University of Southern California.
Year of Election or Appointment: 2000
Mr. Lautenbach has been a partner of Clayton, Dubilier & Rice, Inc. (private equity investment firm) since September 1998. Previously, Mr. Lautenbach was with the International Business Machines Corpora tion (IBM) from 1968 until his retirement in 1998. Mr. Lautenbach serves as a Director of Italtel Holding S.p.A. (telecommunications (Milan, Italy), 2004 present) and Eaton Corporation (diversified industrial) as well as the Philharmonic Center for the Arts in Naples, Florida. He also is a member of the Board of Trustees of Fairfield University (2005 present), as well as a member of the Council on Foreign Relations.
Year of Election or Appointment: 1997
Prior to his retirement in December 1994, Mr. McCoy was Vice Chair man of the Board of BellSouth Corporation (telecommunications) and President of BellSouth Enterprises. He is currently a Director of Liberty Corporation (holding company), Duke Realty Corporation (real estate), and Progress Energy, Inc. (electric utility). He is also a partner of Frank lin Street Partners (private investment management firm) and a member of the Research Triangle Foundation Board. In addition, Mr. McCoy served as the Interim Chancellor (1999 2000) and a member of the Board of Visitors for the University of North Carolina at Chapel Hill and currently serves on the Board of Directors of the University of North Carolina Health Care System and the Board of Visitors of the Kenan Flagler Business School (University of North Carolina at Chapel Hill). He also served as Vice President of Finance for the University of North Carolina (16 school system).
Name, Age; Principal Occupation
Cornelia M. Small (61)
|
Year of Election or Appointment: 2005
Ms. Small is a member (2000 present) and Chairperson (2002 present) of the Investment Committee, and a member (2002 present) of the Board of Trustees of Smith College. Previously, she served as Chief Investment Officer (1999 2000), Director of Global Equity Investments (1996 1999), and a member of the Board of Directors of Scudder, Stevens & Clark (1990 1997) and Scudder Kemper Investments (1997 1998). In addition, Ms. Small served as Co Chair (2000 2003) of the Annual Fund for the Fletcher School of Law and Diplomacy.
William S. Stavropoulos (66)
|
Year of Election or Appointment: 2001
Mr. Stavropoulos is Chairman of the Board (2000 present) and a Member of the Board of Directors of The Dow Chemical Company. Since joining The Dow Chemical Company in 1967, Mr. Stavropoulos served in numerous senior management positions, including President (1993 2000; 2002 2003), CEO (1995 2000; 2002 2004), and Chair man of the Executive Committee (2000 2004). Currently, he is a Direc tor of NCR Corporation (data warehousing and technology solutions), BellSouth Corporation (telecommunications), Chemical Financial Corpo ration, Maersk Inc. (industrial conglomerate, 2002 present), and Metal mark Capital (private equity investment firm, 2005 present). He also serves as a member of the Board of Trustees of the American Enterprise Institute for Public Policy Research. In addition, Mr. Stavropoulos is a member of The Business Council, J.P. Morgan International Council and the University of Notre Dame Advisory Council for the College of Science.
Year of Election or Appointment: 2005
Prior to his retirement in 2001, Mr. Wolfe was Chairman and Chief Executive Officer of Hershey Foods Corporation (1993 2001). He cur rently serves as a member of the boards of Adelphia Communications Corporation (2003 present), Bausch & Lomb, Inc., and Revlon Inc. (2004 present).
49 Annual Report
Trustees and Officers - continued
Advisory Board Member and Executive Officers:
Correspondence intended for each executive officer and Mr. Lynch may be sent to Fidelity Investments, 82 Devonshire Street, Boston, Massachusetts 02109.
| | Name, Age; Principal Occupation
Peter S. Lynch (61)
|
Year of Election or Appointment: 2003
Member of the Advisory Board of Fidelity Municipal Trust and Fidelity Municipal Trust II. Vice Chairman and a Director of FMR, and Vice Chairman (2001 present) and a Director (2000 present) of FMR Co., Inc. Previously, Mr. Lynch served as a Trustee of the Fidelity funds (1990 2003). In addition, he serves as a Trustee of Boston College, Massachusetts Eye & Ear Infirmary, Historic Deerfield, John F. Kennedy Library, and the Museum of Fine Arts of Boston.
Year of Election or Appointment: 2005
Vice President of Ohio Municipal Money Market and Ohio Municipal Income. Mr. Donovan also serves as Vice President of Fidelity’s High Income Funds (2005 present), Fidelity’s Fixed Income Funds (2005 present), certain Asset Allocation Funds (2005 present), and certain Balanced Funds (2005 present). Mr. Donovan also serves as Executive Vice President of FMR (2005 present) and FMRC (2005 present). Previously, Mr. Donovan served as Vice President and Director of Fidelity’s Interna tional Equity Trading group (1998 2005).
Year of Election or Appointment: 2005
Vice President of Ohio Municipal Money Market. Mr. Morrison also serves as Vice President of Fidelity’s Money Market Funds (2005 present) and certain Asset Allocation Funds (2002 present). Previously, he served as Vice President of Fidelity’s Bond Funds (2002 2005) and certain Balanced Funds (2002 2005). He served as Vice President (2002 2005) and Bond Group Leader (2002 2005) of Fidelity Invest ments Fixed Income Division. Mr. Morrison is also Vice President of FIMM (2002 present) and FMR (2002 present). Mr. Morrison joined Fidelity Investments in 1987 as a Corporate Bond Analyst in the Fixed Income Research Division.
Name, Age; Principal Occupation
David L. Murphy (57)
|
Year of Election or Appointment: 2002 or 2005
Vice President of Ohio Municipal Money Market (2002) and Ohio Municipal Income(2005). Mr. Murphy also serves as Vice President of Fidelity’s Money Market Funds (2002 present), certain Asset Allocation Funds (2003 present), Fidelity’s Investment Grade Bond Funds (2005 present), and Fidelity’s Balanced Funds (2005 present). He serves as Senior Vice President (2000 present) and Head (2004 present) of the Fidelity Investments Fixed Income Division. Mr. Murphy is also a Senior Vice President of FIMM (2003 present) and a Vice President of FMR (2000 present). Previously, Mr. Murphy served as Money Market Group Leader (2002 2004), Bond Group Leader (2000 2002), and Vice President of Fidelity’s Taxable Bond Funds (2000 2002) and Fidelity’s Municipal Bond Funds (2001 2002). Mr. Murphy joined Fidelity Invest ments in 1989 as a portfolio manager in the Bond Group.
Year of Election or Appointment: 2005
Vice President of Ohio Municipal Income. Mr. Silvia also serves as Vice President of Fidelity’s Bond Funds (2005 present), certain Balanced Funds (2005 present), certain Asset Allocation Funds (2005 present), and Senior Vice President and Bond Group Leader of the Fidelity Investments Fixed Income Division (2005 present). Previously, Mr. Silvia served as Director of Fidelity’s Taxable Bond portfolio managers (2002 2004) and a portfolio manager in the Bond Group (1997 2004).
Year of Election or Appointment: 2004
Vice President of Ohio Municipal Money Market. Mr. Marchese also serves as Vice President of other funds advised by FMR. Prior to assum ing his current responsibilities, Mr. Marchese worked as a legal analyst and portfolio manager.
Year of Election or Appointment: 2004
Vice President of Ohio Municipal Income. Mr. McGinley also serves as Vice President of other funds advised by FMR. Prior to assuming his cur rent responsibilities, Mr. McGinley worked as an analyst and manager.
51 Annual Report
Trustees and Officers - continued
| | Name, Age; Principal Occupation
Eric D. Roiter (57)
|
Year of Election or Appointment: 1998
Secretary of Ohio Municipal Money Market and Ohio Municipal Income. He also serves as Secretary of other Fidelity funds; Vice President, General Counsel, and Secretary of FMR Co., Inc. (2001 present) and FMR; Assistant Secretary of Fidelity Management & Research (U.K.) Inc. (2001 present), Fidelity Management & Research (Far East) Inc. (2001 present), and Fidelity Investments Money Management, Inc. (2001 present). Mr. Roiter is an Adjunct Member, Faculty of Law, at Boston College Law School (2003 present). Previously, Mr. Roiter served as Vice President and Secretary of Fidelity Distributors Corporation (FDC) (1998 2005).
Year of Election or Appointment: 2003
Assistant Secretary of Ohio Municipal Money Market and Ohio Municipal Income. Mr. Fross also serves as Assistant Secretary of other Fidelity funds (2003 present), Vice President and Secretary of FDC (2005 present), and is an employee of FMR.
Year of Election or Appointment: 2004
President, Treasurer, and Anti Money Laundering (AML) officer of Ohio Municipal Money Market and Ohio Municipal Income. Ms. Reynolds also serves as President, Treasurer, and AML officer of other Fidelity funds (2004) and is a Vice President (2003) and an employee (2002) of FMR. Before joining Fidelity Investments, Ms. Reynolds worked at PricewaterhouseCoopers LLP (PwC) (1980 2002), where she was most recently an audit partner with PwC’s investment management practice.
Name, Age; Principal Occupation
Paul M. Murphy (58)
|
Year of Election or Appointment: 2005
Chief Financial Officer of Ohio Municipal Money Market and Ohio Municipal Income. Mr. Murphy also serves as Chief Financial Officer of other Fidelity funds (2005 present). He also serves as Senior Vice President of Fidelity Pricing and Cash Management Services Group (FPCMS).
Kenneth A. Rathgeber (58)
|
Year of Election or Appointment: 2004
Chief Compliance Officer of Ohio Municipal Money Market and Ohio Municipal Income. Mr. Rathgeber also serves as Chief Compliance Offi cer of other Fidelity funds (2004) and Executive Vice President of Risk Oversight for Fidelity Investments (2002). Previously, he served as Executive Vice President and Chief Operating Officer for Fidelity Invest ments Institutional Services Company, Inc. (1998 2002).
Year of Election or Appointment: 2003
Deputy Treasurer of Ohio Municipal Money Market and Ohio Municipal Income. Mr. Hebble also serves as Deputy Treasurer of other Fidelity funds (2003), and is an employee of FMR. Before joining Fidelity Investments, Mr. Hebble worked at Deutsche Asset Management where he served as Director of Fund Accounting (2002 2003) and Assistant Treasurer of the Scudder Funds (1998 2003).
Year of Election or Appointment: 2005
Deputy Treasurer of Ohio Municipal Money Market and Ohio Munici pal Income. Mr. Mehrmann also serves as Deputy Treasurer of other Fidelity funds (2005 present) and is an employee of FMR. Previously, Mr. Mehrmann served as Vice President of Fidelity Investments Institu tional Services Group (FIIS)/Fidelity Investments Institutional Operations Corporation, Inc. (FIIOC) Client Services (1998 2004).
Kimberley H. Monasterio (42)
|
Year of Election or Appointment: 2004
Deputy Treasurer of Ohio Municipal Money Market and Ohio Municipal Income. Ms. Monasterio also serves as Deputy Treasurer of other Fidelity funds (2004) and is an employee of FMR (2004). Before joining Fidelity Investments, Ms. Monasterio served as Treasurer (2000 2004) and Chief Financial Officer (2002 2004) of the Franklin Templeton Funds and Senior Vice President of Franklin Templeton Services, LLC
(2000 2004).
53 Annual Report
Trustees and Officers - continued
| | Name, Age; Principal Occupation
Kenneth B. Robins (36)
|
Year of Election or Appointment: 2005
Deputy Treasurer of Ohio Municipal Money Market and Ohio Municipal Income. Mr. Robins also serves as Deputy Treasurer of other Fidelity funds (2005 present) and is an employee of FMR (2004 present). Before joining Fidelity Investments, Mr. Robins worked at KPMG LLP, where he was a partner in KPMG’s department of professional practice (2002 2004) and a Senior Manager (1999 2000). In addition, Mr. Robins served as Assistant Chief Accountant, United States Securities and Exchange Commission (2000 2002).
Year of Election or Appointment: 2005
Assistant Treasurer of Ohio Municipal Money Market and Ohio Municipal Income. Mr. Byrnes also serves as Assistant Treasurer of other Fidelity funds (2005 present) and is an employee of FMR (2005 present). Previously, Mr. Byrnes served as Vice President of FPCMS (2003 2005). Before joining Fidelity Investments, Mr. Byrnes worked at Deutsche Asset Management where he served as Vice President of the Investment Operations Group (2000 2003).
Year of Election or Appointment: 1986 or 1989
Assistant Treasurer of Ohio Municipal Money Market (1989) and Ohio Municipal Income (1986). Mr. Costello also serves as Assistant Treasurer of other Fidelity funds and is an employee of FMR.
Year of Election or Appointment: 2004
Assistant Treasurer of Ohio Municipal Money Market and Ohio Municipal Income. Mr. Lydecker also serves as Assistant Treasurer of other Fidelity funds (2004) and is an employee of FMR.
Year of Election or Appointment: 2002
Assistant Treasurer of Ohio Municipal Money Market and Ohio Municipal Income. Mr. Osterheld also serves as Assistant Treasurer of other Fidelity funds (2002) and is an employee of FMR.
Year of Election or Appointment: 2005
Assistant Treasurer of Ohio Municipal Money Market and Ohio Municipal Income. Mr. Ryan also serves as Assistant Treasurer of other Fidelity funds (2005 present) and is an employee of FMR (2005 present). Previously, Mr. Ryan served as Vice President of Fund Reporting in FPCMS (1999 2005).
Name, Age; Principal Occupation
Salvatore Schiavone (40)
|
Year of Election or Appointment: 2005
Assistant Treasurer of Ohio Municipal Money Market and Ohio Municipal Income. Mr. Schiavone also serves as Assistant Treasurer of other Fidelity funds (2005 present) and is an employee of FMR (2005 present). Before joining Fidelity Investments, Mr. Schiavone worked at Deutsche Asset Management, where he most recently served as Assistant Treasurer (2003 2005) of the Scudder Funds and Vice President and Head of Fund Reporting (1996 2003).
55 Annual Report
The Board of Trustees of Fidelity Ohio Municipal Income Fund voted to pay on February 6, 2006, to shareholders of record at the opening of business on February 3, 2006, a distribution of $.01 per share derived from capital gains realized from sales of portfolio securities.
The funds hereby designate as capital gain dividend the amounts noted below for the taxable year ended 2005, or, if subsequently determined to be different, the net capital gain of such year.
| Fund | | December 31, 2005 |
| Fidelity Ohio Municipal Income Fund | | $ | | 6,598,981 |
| Fidelity Ohio Municipal Money Market Fund | | $ | | 25,859 |
During fiscal year ended 2005, 100% of the Fidelity Ohio Municipal Income Fund and Fidelity Ohio Municipal Money Market Fund’s income dividends was free from federal income tax, and 4.95% and 44.96% of Fidelity Ohio Municipal Income Fund and Fidelity Ohio Municipal Money Market Fund’s income dividends were subject to the federal alternative minimum tax.
The fund will notify shareholders in January 2006 of amounts for use in preparing 2005 income tax returns.
Proxy Voting Results
A special meeting of Fidelity Ohio Municipal Money Market Fund’s shareholders was held on January 18, 2006. The results of votes taken among shareholders on the proposal before them are reported below. Each vote reported represents one dollar of net asset value held on the record date for the meeting.
| PROPOSAL 1 | | | | |
| To elect a Board of Trustees.A | | |
| | | # of | | % of |
| | | Votes | | Votes |
| |
| Dennis J. Dirks | | | | |
| Affirmative | | 667,201,902.33 | | 95.261 |
| Withheld | | 33,193,298.35 | | 4.739 |
| TOTAL | | 700,395,200.68 | | 100.000 |
| Albert R. Gamper, Jr. | | |
| Affirmative | | 667,477,031.41 | | 95.300 |
| Withheld | | 32,918,169.27 | | 4.700 |
| TOTAL | | 700,395,200.68 | | 100.000 |
| Robert M. Gates | | | | |
| Affirmative | | 666,308,716.35 | | 95.133 |
| Withheld | | 34,086,484.33 | | 4.867 |
| TOTAL | | 700,395,200.68 | | 100.000 |
| George H. Heilmeier | | |
| Affirmative | | 664,652,778.09 | | 94.897 |
| Withheld | | 35,742,422.59 | | 5.103 |
| TOTAL | | 700,395,200.68 | | 100.000 |
| Abigail P. Johnson | | |
| Affirmative | | 664,170,496.79 | | 94.828 |
| Withheld | | 36,224,703.89 | | 5.172 |
| TOTAL | | 700,395,200.68 | | 100.000 |
| Edward C. Johnson 3d | | |
| Affirmative | | 663,788,907.22 | | 94.773 |
| Withheld | | 36,606,293.46 | | 5.227 |
| TOTAL | | 700,395,200.68 | | 100.000 |
| Stephen P. Jonas | | | | |
| Affirmative | | 667,006,752.59 | | 95.233 |
| Withheld | | 33,388,448.09 | | 4.767 |
| TOTAL | | 700,395,200.68 | | 100.000 |
| | | # of | | % of |
| | | Votes | | Votes |
| |
| Marie L. Knowles | | |
| Affirmative | | 666,373,338.05 | | 95.142 |
| Withheld | | 34,021,862.63 | | 4.858 |
| TOTAL | | 700,395,200.68 | | 100.000 |
| |
| Ned C. Lautenbach | | |
| Affirmative | | 666,334,938.56 | | 95.137 |
| Withheld | | 34,060,262.12 | | 4.863 |
| TOTAL | | 700,395,200.68 | | 100.000 |
| |
| William O. McCoy | | |
| Affirmative | | 665,764,692.27 | | 95.056 |
| Withheld | | 34,630,508.41 | | 4.944 |
| TOTAL | | 700,395,200.68 | | 100.000 |
| |
| Robert L. Reynolds | | |
| Affirmative | | 667,335,421.55 | | 95.280 |
| Withheld | | 33,059,779.13 | | 4.720 |
| TOTAL | | 700,395,200.68 | | 100.000 |
| |
| Cornelia M. Small | | |
| Affirmative | | 667,579,724.56 | | 95.315 |
| Withheld | | 32,815,476.12 | | 4.685 |
| TOTAL | | 700,395,200.68 | | 100.000 |
| |
| William S. Stavropoulos | | |
| Affirmative | | 665,215,267.33 | | 94.977 |
| Withheld | | 35,179,933.35 | | 5.023 |
| TOTAL | | 700,395,200.68 | | 100.000 |
| |
| Kenneth L. Wolfe | | | | |
| Affirmative | | 666,060,714.08 | | 95.098 |
| Withheld | | 34,334,486.60 | | 4.902 |
| TOTAL | | 700,395,200.68 | | 100.000 |
A Denotes trust-wide proposal and voting results.
57 Annual Report
Proxy Voting Results - continued
A special meeting of Fidelity Ohio Municipal Income Fund’s shareholders was held on January 18, 2006. The results of votes taken among shareholders on the proposal before them are reported below. Each vote reported represents one dollar of net asset value held on the record date for the meeting.
| PROPOSAL 1 | | | | |
| To elect a Board of Trustees.A | | |
| | | # of | | % of |
| | | Votes | | Votes |
| |
| Dennis J. Dirks | | | | |
| Affirmative | | 4,012,578,790.76 | | 95.238 |
| Withheld | | 200,653,306.55 | | 4.762 |
| TOTAL | | 4,213,232,097.31 | | 100.000 |
| Albert R. Gamper, Jr. | | |
| Affirmative | | 4,015,643,707.84 | | 95.310 |
| Withheld | | 197,588,389.47 | | 4.690 |
| TOTAL | | 4,213,232,097.31 | | 100.000 |
| Robert M. Gates | | |
| Affirmative | | 4,004,345,809.00 | | 95.042 |
| Withheld | | 208,886,288.31 | | 4.958 |
| TOTAL | | 4,213,232,097.31 | | 100.000 |
| George H. Heilmeier | | |
| Affirmative | | 4,008,127,523.93 | | 95.132 |
| Withheld | | 205,104,573.38 | | 4.868 |
| TOTAL | | 4,213,232,097.31 | | 100.000 |
| Abigail P. Johnson | | |
| Affirmative | | 3,993,175,527.66 | | 94.777 |
| Withheld | | 220,056,569.65 | | 5.223 |
| TOTAL | | 4,213,232,097.31 | | 100.000 |
| Edward C. Johnson 3d | | |
| Affirmative | | 3,987,333,615.26 | | 94.638 |
| Withheld | | 225,898,482.05 | | 5.362 |
| TOTAL | | 4,213,232,097.31 | | 100.000 |
| Stephen P. Jonas | | |
| Affirmative | | 4,010,007,680.52 | | 95.177 |
| Withheld | | 203,224,416.79 | | 4.823 |
| TOTAL | | 4,213,232,097.31 | | 100.000 |
| | | # of | | % of |
| | | Votes | | Votes |
| |
| Marie L. Knowles | | |
| Affirmative | | 4,010,231,303.96 | | 95.182 |
| Withheld | | 203,000,793.35 | | 4.818 |
| TOTAL | | 4,213,232,097.31 | | 100.000 |
| |
| Ned C. Lautenbach | | |
| Affirmative | | 4,009,136,177.44 | | 95.156 |
| Withheld | | 204,095,919.87 | | 4.844 |
| TOTAL | | 4,213,232,097.31 | | 100.000 |
| |
| William O. McCoy | | |
| Affirmative | | 4,001,996,735.35 | | 94.986 |
| Withheld | | 211,235,361.96 | | 5.014 |
| TOTAL | | 4,213,232,097.31 | | 100.000 |
| |
| Robert L. Reynolds | | |
| Affirmative | | 4,010,560,206.65 | | 95.190 |
| Withheld | | 202,671,890.66 | | 4.810 |
| TOTAL | | 4,213,232,097.31 | | 100.000 |
| |
| Cornelia M. Small | | |
| Affirmative | | 4,011,161,760.21 | | 95.204 |
| Withheld | | 202,070,337.10 | | 4.796 |
| TOTAL | | 4,213,232,097.31 | | 100.000 |
| |
| William S. Stavropoulos | | |
| Affirmative | | 4,001,217,912.57 | | 94.968 |
| Withheld | | 212,014,184.74 | | 5.032 |
| TOTAL | | 4,213,232,097.31 | | 100.000 |
| |
| Kenneth L. Wolfe | | |
| Affirmative | | 4,011,439,868.05 | | 95.211 |
| Withheld | | 201,792,229.26 | | 4.789 |
| TOTAL | | 4,213,232,097.31 | | 100.000 |
A Denotes trust-wide proposal and voting results.
Annual Report 58
Managing Your Investments
Fidelity offers several ways to conveniently manage your personal investments via your telephone or PC. You can access your account information, conduct trades and research your investments 24 hours a day.
By Phone
Fidelity Automated Service Telephone provides a single toll free number to access account balances, positions, quotes and trading. It’s easy to navigate the service, and on your first call, the system will help you create a personal identification number (PIN) for security.


By PC
Fidelity’s web site on the Internet provides a wide range of information, including daily financial news, fund performance, interactive planning tools and news about Fidelity products and services.

* When you call the quotes line, please remember that a fund’s yield and return will vary and, except for money market funds, share price will also vary. This means that you may have a gain or loss when you sell your shares. There is no assurance that money market funds will be able to maintain a stable $1 share price; an investment in a money market fund is not insured or guar anteed by the U.S. government. Total returns are historical and include changes in share price, reinvestment of dividends and capital gains, and the effects of any sales charges.
59 Annual Report
| | Investment Adviser
Fidelity Management & Research Company
Boston, MA
Investment Sub Advisers
Fidelity Investments Money
Management, Inc.
Fidelity International Investment Advisors
Fidelity International Investment Advisors
(U.K.) Limited
General Distributor
Fidelity Distributors Corporation
Boston, MA
Transfer and Service Agents
Citibank, N.A.
New York, NY
Fidelity Service Company, Inc.
Boston, MA
Custodian
Citibank, N.A.
New York, NY
|
| The Fidelity Telephone Connection |
| Mutual Fund 24-Hour Service |
| Exchanges/Redemptions | | |
| and Account Assistance | | 1-800-544-6666 |
| Product Information | | 1-800-544-6666 |
| Retirement Accounts | | 1-800-544-4774 |
| (8 a.m. - 9 p.m.) | | |
| TDD Service | | 1-800-544-0118 |
| for the deaf and hearing impaired |
| (9 a.m. - 9 p.m. Eastern time) |
| Fidelity Automated Service | | |
| Telephone (FAST® ) (automated phone logo) | | 1-800-544-5555 |
| (automated phone logo) Automated lines for quickest service |
OFF UANN-0206
1.787739.102
|

| | Fidelity®
Pennsylvania Municipal
Income Fund
(formerly Spartan® Pennsylvania
Municipal Income Fund)
and
Fidelity
Pennsylvania Municipal
Money Market Fund
|
| | Annual Report
December 31, 2005
|


| Contents | | | | |
| |
| |
| Chairman’s Message | | 4 | | Ned Johnson’s message to shareholders |
| Performance | | 5 | | How the fund has done over time. |
| Management’s | | 6 | | The manager’s review of fund performance, |
| Discussion | | | | strategy and outlook. |
| Shareholder Expense | | 7 | | An example of shareholder expenses. |
| Example | | | | |
| Fidelity Pennsylvania Municipal Income Fund |
| Investment Changes | | 9 | | A summary of major shifts in the fund’s |
| | | | | investments over the past six months. |
| Investments | | 10 | | A complete list of the fund’s investments with |
| | | | | their market values. |
| Financial Statements | | 18 | | Statements of assets and liabilities, |
| | | | | operations, and changes in net assets, |
| | | | | as well as financial highlights. |
| Fidelity Pennsylvania Municipal Money Market Fund |
| Investment Changes/ | | 22 | | A summary of major shifts in the fund’s |
| Performance | | | | investments over the past six months. |
| Investments | | 23 | | A complete list of the fund’s investments. |
| Financial Statements | | 30 | | Statements of assets and liabilities, |
| | | | | operations, and changes in net assets, |
| | | | | as well as financial highlights. |
| Notes | | 34 | | Notes to the Financial Statements |
| Report of | | 41 | | |
| Independent | | | | |
| Registered Public | | | | |
| Accounting Firm | | | | |
| Trustees and Officers | | 42 | | |
| Distributions | | 54 | | |
| Proxy Voting Results | | 55 | | |
To view a fund’s proxy voting guidelines and proxy voting record for the 12 month period ended
June 30, visit www.fidelity.com/proxyvotingresults or visit the Securities and Exchange Commis
sion’s (SEC) web site at www.sec.gov. You may also call 1-800-544-8544 to request a free copy of
the proxy voting guidelines.
Standard & Poor’s, S&P and S&P 500 are registered service marks of The McGraw Hill Companies, Inc.
and have been licensed for use by Fidelity Distributors Corporation.
Other third party marks appearing herein are the property of their respective owners.
All other marks appearing herein are registered or unregistered trademarks or service marks
of FMR Corp. or an affiliated company.
|
Annual Report 2
This report and the financial statements contained herein are submitted for the general in-
formation of the shareholders of the funds. This report is not authorized for distribution to
prospective investors in the funds unless preceded or accompanied by an effective prospectus.
A fund files its complete schedule of portfolio holdings with the SEC for the first and third
quarters of each fiscal year on Form N Q. Forms N Q are available on the SEC’s web site at
http://www.sec.gov. A fund’s Forms N Q may be reviewed and copied at the SEC’s Public Reference
Room in Washington, DC. Information regarding the operation of the SEC’s Public Reference
Room may be obtained by calling 1-800-SEC-0330. For a complete list of a fund’s portfolio
holdings, view the most recent quarterly holdings report, semiannual report, or annual report
on Fidelity’s web site at http://www.fidelity.com/holdings.
NOT FDIC INSURED · MAY LOSE VALUE · NO BANK GUARANTEE
Neither the funds nor Fidelity Distributors Corporation is a bank.
|
3 Annual Report
Chairman’s Message
(photograph of Edward C. Johnson 3d)
Dear Shareholder:
During the past year or so, much has been reported about the mutual fund industry, and much of it has been more critical than I believe is warranted. Allegations that some companies have been less than forthright with their shareholders have cast a shadow on the entire industry. I continue to find these reports disturbing, and assert that they do not create an accurate picture of the industry overall. Therefore, I would like to remind every one where Fidelity stands on these issues. I will say two things specifically regarding allegations that some mutual fund companies were in violation of the Securities and Exchange Commission’s forward pricing rules or were involved in so called “market timing” activities.
First, Fidelity has no agreements that permit customers who buy fund shares after 4 p.m. to obtain the 4 p.m. price. This is not a new policy. This is not to say that some one could not deceive the company through fraudulent acts. However, we are extremely diligent in preventing fraud from occurring in this manner and in every other. But I underscore again that Fidelity has no so called “agreements” that sanction illegal practices.
Second, Fidelity continues to stand on record, as we have for years, in opposition to predatory short term trading that adversely affects shareholders in a mutual fund. Back in the 1980s, we initiated a fee which is returned to the fund and, therefore, to investors to discourage this activity. Further, we took the lead several years ago in developing a Fair Value Pricing Policy to prevent market timing on foreign securities in our funds. I am confident we will find other ways to make it more difficult for predatory traders to operate. However, this will only be achieved through close cooperation among regulators, legislators and the industry.
Yes, there have been unfortunate instances of unethical and illegal activity within the mutual fund industry from time to time. That is true of any industry. When this occurs, confessed or convicted offenders should be dealt with appropriately. But we are still concerned about the risk of over regulation and the quick application of simplistic solutions to intricate problems. Every system can be improved, and we support and applaud well thought out improvements by regulators, legislators and industry representatives that achieve the common goal of building and protecting the value of investors’ holdings.
For nearly 60 years, Fidelity has worked very hard to improve its products and service to justify your trust. When our family founded this company in 1946, we had only a few hundred customers. Today, we serve more than 18 million customers including individual investors and participants in retirement plans across America.
Let me close by saying that we do not take your trust in us for granted, and we realize that we must always work to improve all aspects of our service to you. In turn, we urge you to continue your active participation with your financial matters, so that your interests can be well served.
Best regards,
/s/ Edward C. Johnson 3d
Edward C. Johnson 3d
Annual Report 4
Fidelity Pennsylvania Municipal Income Fund
Performance: The Bottom Line
Average annual total return reflects the change in the value of an investment, assuming reinvestment of the fund’s dividend income and capital gains (the profits earned upon the sale of securities that have grown in value) and assuming a constant rate of perfor mance each year. The $10,000 table and the fund’s returns do not reflect the deduction of taxes that a shareholder would pay on fund distributions or the redemption of fund shares. During periods of reimbursement by Fidelity, a fund’s total return will be greater than it would be had the reimbursement not occurred. How a fund did yesterday is no guarantee of how it will do tomorrow.
| Average Annual Total Returns | | | | | | |
| Periods ended December 31, 2005 | | Past 1 | | Past 5 | | Past 10 |
| | | year | | years | | years |
| Fidelity® PA Municipal Income Fund | | 2.70% | | 5.22% | | 5.26% |
| |
| |
| $10,000 Over 10 Years | | | | | | |
Let’s say hypothetically that $10,000 was invested in Fidelity® Pennsylvania Municipal Income Fund on December 31, 1995. The chart shows how the value of your investment would have changed, and also shows how the Lehman Brothers® Municipal Bond Index performed over the same period.
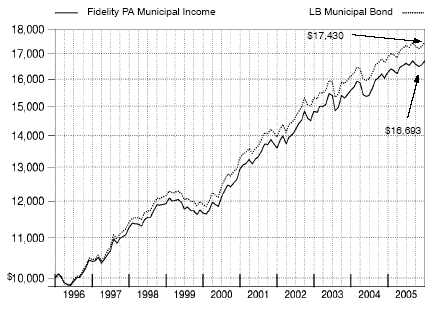
5 Annual Report
5
Fidelity Pennsylvania Municipal Income Fund
Management’s Discussion of Fund Performance
Comments from Mark Sommer, Portfolio Manager of Fidelity® Pennsylvania Municipal Income Fund
For the third consecutive year, the municipal bond market outperformed taxable bonds. The Lehman Brothers® Municipal Bond Index rose 3.51% for the year ending December 31, 2005. The taxable bond market, as measured by the Lehman Brothers Aggregate Bond Index, advanced 2.43% . Muni bonds were attractively valued relative to Treasuries, partic ularly as tax free bond yields drew closer to those of high quality government bonds. Sub sequently, the tax advantage of munis was compelling to such atypical investors in the asset class as hedge funds, corporations and taxable bond investors. The strong demand helped offset heavy issuance, particularly at the longer term end of the spectrum. The Federal Reserve Board raised short term interest rates eight times during the year, but long term rates remained persistently low, making the cost of borrowing more affordable for muni issuers. Still, absolute returns finished well below their historical averages. In addition to the rate hikes, surging energy prices pushed inflation higher, a condition further exacer bated by the damage to energy production facilities caused by Hurricane Katrina.
The fund returned 2.70% for the 12 months ending December 31, 2005. During the same period, the LipperSM Pennsylvania Municipal Debt Funds Average gained 3.11% and the Lehman Brothers Pennsylvania Enhanced Municipal Bond Index rose 3.31% . Pennsylvania’s municipal market was helped by improving creditworthiness for many issuers and per formed roughly in line with the national muni market. My focus on high quality securities caused the fund to lag the Lehman Brothers index and also, I suspect, the Lipper peer group average. Lower quality munis outpaced higher quality munis, buoyed by robust demand from investors seeking higher yields, particularly in the first half of the period. In contrast, the fund’s performance was aided by its comparatively large stake relative to the index in bonds that were prerefunded during the period, a process that helped boost the bonds’ returns. Throughout the year, I kept the fund’s interest rate sensitivity in line with the Pennsylvania market as a whole, as measured by the Lehman Brothers index. Not surprisingly, that strategy had no material impact on the fund’s performance relative to the index.
The views expressed in this statement reflect those of the portfolio manager only through the end of the period of the report as stated on the cover and do not necessarily represent the views of Fidelity or any other person in the Fidelity organization. Any such views are subject to change at any time based upon market or other conditions and Fidelity disclaims any responsibility to update such views. These views may not be relied on as investment advice and, because investment decisions for a Fidelity fund are based on numerous factors, may not be relied on as an indication of trading intent on behalf of any Fidelity fund.
Shareholder Expense Example
As a shareholder of a Fund, you incur two types of costs: (1) transaction costs, including redemption fees, and (2) ongoing costs, including management fees and other Fund expenses. This Example is intended to help you understand your ongoing costs (in dollars) of investing in the Funds and to compare these costs with the ongoing costs of investing in other mutual funds.
The Example is based on an investment of $1,000 invested at the beginning of the period and held for the entire period (July 1, 2005 to December 31, 2005).
The first line of the table below for each fund provides information about actual account values and actual expenses. You may use the information in this line, together with the amount you invested, to estimate the expenses that you paid over the period. Simply divide your account value by $1,000.00 (for example, an $8,600 account value divided by $1,000.00 = 8.6), then multiply the result by the number in the first line for a fund under the heading entitled “Expenses Paid During Period” to estimate the expenses you paid on your account during this period. A small balance maintenance fee of $12.00 that is charged once a year may apply for certain accounts with a value of less than $2,000. This fee is not included in the table below. If it was, the estimate of expenses you paid during the period would be higher, and your ending account value lower, by this amount.
Hypothetical Example for Comparison Purposes
The second line of the table below for each fund provides information about hypothetical account values and hypothetical expenses based on a fund’s actual expense ratio and an assumed rate of return of 5% per year before expenses, which is not the Fund’s actual return. The hypothetical account values and expenses may not be used to estimate the actual ending account balance or expenses you paid for the period. You may use this information to compare the ongoing costs of investing in the Fund and other funds. To do so, compare this 5% hypothetical example with the 5% hypothetical examples that appear in the shareholder reports of the other funds. A small balance maintenance fee of $12.00 that is charged once a year may apply for certain accounts with a value of less than $2,000. This fee is not included in the table below. If it was, the estimate of expenses you paid during the period would be higher, and your ending account value lower, by this amount. Please note that the expenses shown in the table are meant to highlight your ongoing costs only and do not reflect any transaction costs. Therefore, the second line of the table is useful in comparing ongoing costs only, and will not help you determine the relative total costs of owning different funds. In addition, if these transactional costs were included, your costs would have been higher.
7 Annual Report
| Shareholder Expense Example continued | | |
| |
| |
| | | | | | | | | | | Expenses Paid |
| | | | | | | | | | | During Period* |
| | | | | Beginning | | Ending | | July 1, 2005 |
| | | | | Account Value | | Account Value | | to December 31, |
| | | | | July 1, 2005 | | December 31, 2005 | | 2005 |
| Fidelity Pennsylvania Municipal | | | | | | | | | | |
| Income Fund | | | | | | | | | | |
| Actual | | $ | | 1,000.00 | | $ | | 1,004.80 | | $ | | 2.53 |
| HypotheticalA | | $ | | 1,000.00 | | $ | | 1,022.68 | | $ | | 2.55 |
| Fidelity Pennsylvania Municipal | | | | | | | | | | |
| Money Market Fund | | | | | | | | | | |
| Actual | | $ | | 1,000.00 | | $ | | 1,011.30 | | $ | | 2.53 |
| HypotheticalA | | $ | | 1,000.00 | | $ | | 1,022.68 | | $ | | 2.55 |
| |
| A 5% return per year before expenses | | | | | | |
* Expenses are equal to each Fund’s annualized expense ratio (shown in the table below); multiplied by the average account value over the period, multiplied by 184/365 (to reflect the one half year period).
| | | Annualized |
| | | Expense Ratio |
| Fidelity Pennsylvania Municipal Income Fund | | 50% |
| Fidelity Pennsylvania Municipal Money Market Fund | | 50% |
| Fidelity Pennsylvania Municipal Income Fund | | |
| Investment Changes | | | | |
| |
| Top Five Sectors as of December 31, 2005 | | |
| | | % of fund’s | | % of fund’s net assets |
| | | net assets | | 6 months ago |
| General Obligations | | 35.8 | | 30.0 |
| Escrowed/Pre Refunded | | 12.8 | | 16.9 |
| Education | | 11.3 | | 12.9 |
| Transportation | | 10.9 | | 13.3 |
| Water & Sewer | | 9.2 | | 9.6 |
Average Years to Maturity as of December 31, 2005 | | |
| | | | | 6 months ago |
| Years | | 12.2 | | 12.9 |
Average years to maturity is based on the average time remaining to the stated maturity date of each bond, weighted by the market value of each bond.
| Duration as of December 31, 2005 | | | | |
| | | | | | | 6 months ago |
| Years | | | | 6.1 | | 6.0 |
Duration shows how much a bond fund’s price fluctuates with changes in comparable interest rates. If rates rise 1%, for example, a fund with a five year duration is likely to lose about 5% of its value. Other factors also can influence a bond fund’s performance and share price. Accordingly, a bond fund’s actual performance may differ from this example.
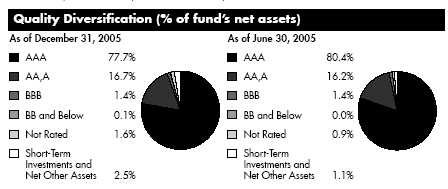
We have used ratings from Moody’s® Investors Services, Inc. Where Moody’s ratings are not available, we have used S&P® ratings.
9 Annual Report
| Fidelity Pennsylvania Municipal Income Fund | | | | | | |
| Investments December 31, 2005 | | | | |
| Showing Percentage of Net Assets | | | | | | | | |
| |
| Municipal Bonds 97.6% | | | | | | | | |
| | | | | Principal | | | | Value |
| | | | | Amount | | | | (Note 1) |
| Guam 0.1% | | | | | | | | |
| Guam Wtrwks. Auth. Wtr. and Wastewtr. Sys. Rev. 5.875% | | | | | | | | |
| 7/1/35 | | $ | | 275,000 | | $ | | 288,497 |
| New Jersey/Pennsylvania – 1.3% | | | | | | | | |
| Delaware River Joint Toll Bridge Commission Bridge Rev. 5.25% | | | | | | |
| 7/1/19 (Pre-Refunded to 7/1/13 @ 100) (d) | | | | 1,000,000 | | | | 1,098,520 |
| Delaware River Port Auth. Pennsylvania & New Jersey Rev.: | | | | | | | | |
| (Port District Proj.) Series A, 5.5% 1/1/18 (FSA Insured) | | | | 2,000,000 | | | | 2,187,300 |
| Series 1999, 6% 1/1/18 (FSA Insured) | | | | 700,000 | | | | 764,897 |
| | | | | | | | | 4,050,717 |
| |
| Pennsylvania – 92.9% | | | | | | | | |
| Allegheny County Arpt. Rev. (Pittsburgh Int’l. Arpt. Proj.): | | | | | | | | |
| Series A1: | | | | | | | | |
| 5.75% 1/1/07 (MBIA Insured) (c) | | | | 1,500,000 | | | | 1,532,220 |
| 5.75% 1/1/08 (MBIA Insured) (c) | | | | 1,000,000 | | | | 1,040,130 |
| 5.75% 1/1/11 (MBIA Insured) (c) | | | | 2,000,000 | | | | 2,141,920 |
| 5.75% 1/1/12 (MBIA Insured) (c) | | | | 3,000,000 | | | | 3,237,360 |
| 5.75% 1/1/14 (MBIA Insured) (c) | | | | 3,000,000 | | | | 3,268,200 |
| 5.75% 1/1/09 (MBIA Insured) (c) | | | | 3,000,000 | | | | 3,157,740 |
| Allegheny County Gen. Oblig. Series C55, 5.375% 11/1/15 | | | | | | |
| (MBIA Insured) | | | | 3,535,000 | | | | 3,864,427 |
| Allegheny County Higher Ed. Bldg. Auth. Univ. Rev.: | | | | | | | | |
| (Carnegie Mellon Univ. Proj.): | | | | | | | | |
| 5.125% 3/1/32 | | | | 1,700,000 | | | | 1,767,592 |
| 5.25% 3/1/32 | | | | 2,000,000 | | | | 2,103,900 |
| (Duquesne Univ. Proj.) 6.5% 3/1/10 (AMBAC Insured) | | | | 400,000 | | | | 446,012 |
| Allegheny County Hosp. Dev. Auth. Rev. | | | | | | | | |
| (Health Ctr.-UPMC Health Sys. Proj.) Series A: | | | | | | | | |
| 4.625% 8/1/12 (MBIA Insured) | | | | 1,000,000 | | | | 1,029,650 |
| 4.625% 8/1/14 (MBIA Insured) | | | | 3,560,000 | | | | 3,646,401 |
| 5.55% 4/1/12 (MBIA Insured) | | | | 2,845,000 | | | | 2,968,388 |
| Allegheny County Indl. Dev. Auth. Rev. (Watson Institute Ed. | | | | | | |
| Ctr. Proj.) 3.375%, tender 5/1/08, LOC PNC Bank NA, | | | | | | | | |
| Pittsburgh (b) | | | | 3,000,000 | | | | 2,975,760 |
| Allegheny County San. Auth. Swr. Rev.: | | | | | | | | |
| 0% 12/1/12 (Escrowed to Maturity) (d) | | | | 2,260,000 | | | | 1,718,730 |
| 5.5% 12/1/30 (MBIA Insured) | | | | 305,000 | | | | 328,445 |
| 5.5% 12/1/30 (Pre-Refunded to 12/1/10 @ 101) (d) | | | | 1,695,000 | | | | 1,847,211 |
| Annville-Cleona School District: | | | | | | | | |
| 6% 3/1/28 (FSA Insured) | | | | 1,500,000 | | | | 1,728,015 |
| 6% 3/1/31 (FSA Insured) | | | | 1,975,000 | | | | 2,273,581 |
See accompanying notes which are an integral part of the financial statements.
| Municipal Bonds continued | | | | | | | | |
| | | | | Principal | | | | Value |
| | | | | Amount | | | | (Note 1) |
| Pennsylvania – continued | | | | | | | | |
| Bristol Borough School District: | | | | | | | | |
| 5.25% 3/1/25 (FSA Insured) | | $ | | 2,400,000 | | $ | | 2,604,168 |
| 5.25% 3/1/31 (FSA Insured) | | | | 4,995,000 | | | | 5,354,190 |
| Bucks County Indl. Dev. Auth. Wtr. Facilities Rev. | | | | | | | | |
| (Pennsylvania Suburban Wtr. Co. Proj.) Series 2002, 5.55% | | | | | | | | |
| 9/1/32 (FGIC Insured) (c) | | | | 1,870,000 | | | | 1,982,686 |
| Butler Area School District: | | | | | | | | |
| Series A: | | | | | | | | |
| 0% 10/1/27 (FGIC Insured) | | | | 1,500,000 | | | | 536,040 |
| 0% 9/15/28 (FGIC Insured) | | | | 1,000,000 | | | | 339,290 |
| 0% 9/15/29 (FGIC Insured) | | | | 2,705,000 | | | | 871,064 |
| 0% 11/15/19 (Pre-Refunded to 11/15/07 @ 50.177) (d) | | | | 5,650,000 | | | | 2,660,190 |
| Canon McMillan School District: | | | | | | | | |
| Series 2001 B, 5.75% 12/1/33 (FGIC Insured) | | | | 8,995,000 | | | | 9,819,212 |
| Series 2002 B, 5.75% 12/1/35 (FGIC Insured) | | | | 2,500,000 | | | | 2,761,600 |
| Central York School District 5.5% 6/1/16 (FGIC Insured) | | | | 2,000,000 | | | | 2,192,820 |
| Chester County Health & Ed. Facilities Auth. Health Sys. Rev. | | | | | | | | |
| (Jefferson Health Sys. Proj.) Series B: | | | | | | | | |
| 5% 5/15/08 (AMBAC Insured) | | | | 600,000 | | | | 621,720 |
| 5.25% 5/15/22 (AMBAC Insured) | | | | 1,450,000 | | | | 1,505,245 |
| Cumberland County Muni. Auth. College Rev. (Dickerson | | | | | | | | |
| College Proj.) Series A, 5.5% 11/1/30 | | | | | | | | |
| (AMBAC Insured) | | | | 4,200,000 | | | | 4,486,860 |
| Delaware County Auth. College Rev. (Haverford College Proj.): | | | | | | | | |
| 5.75% 11/15/29 | | | | 5,000,000 | | | | 5,449,500 |
| 6% 11/15/30 | | | | 3,620,000 | | | | 4,012,299 |
| Delaware County Indl. Dev. Auth. Rev. | | | | | | | | |
| (Philadelphia Suburban Wtr. Co. Proj.) 6% 6/1/29 | | | | | | | | |
| (FGIC Insured) (c) | | | | 2,500,000 | | | | 2,704,375 |
| Delaware County Reg’l. Wtr. Quality Cont. Auth. Swr. Rev. | | | | | | | | |
| Series 2001, 5.25% 5/1/12 (FGIC Insured) | | | | 2,165,000 | | | | 2,353,377 |
| Erie School District 0% 9/1/30 (AMBAC Insured) | | | | 4,000,000 | | | | 1,221,360 |
| Erie County Gen. Oblig. Series 2005 A, 5.5% 9/1/21 | | | | | | | | |
| (FGIC Insured) | | | | 1,770,000 | | | | 2,047,430 |
| Harrisburg Auth. Dauphin County School Rev. (Harrisburg | | | | | | | | |
| School District Rfdg. Proj.) 5.5% 4/1/14 (FGIC Insured) | | | | 1,655,000 | | | | 1,815,651 |
| Harrisburg Auth. Rev. (Pooled Bond Prog.) Series I, 5.625% | | | | | | | | |
| 4/1/15 (Pre-Refunded to 4/1/06 @ 102) (d) | | | | 445,000 | | | | 456,321 |
| Harrisburg Auth. Wtr. Rev. 5.75% 7/15/12 (FGIC Insured) | | | | 1,115,000 | | | | 1,228,897 |
See accompanying notes which are an integral part of the financial statements.
11 Annual Report
| Fidelity Pennsylvania Municipal Income Fund | | | | | | | | |
| Investments continued | | | | | | | | |
| |
| Municipal Bonds continued | | | | | | | | |
| | | | | Principal | | | | Value |
| | | | | Amount | | | | (Note 1) |
| Pennsylvania – continued | | | | | | | | |
| Kennett Consolidated School District Series A, 5.25% 2/15/15 | | | | | | | | |
| (FGIC Insured) | | $ | | 1,310,000 | | $ | | 1,426,485 |
| Luzerne County Indl. Dev. Auth. Wtr. Facilities Rev. | | | | | | | | |
| (Pennsylvania-American Wtr. Co. Proj.) 3.6%, tender | | | | | | | | |
| 12/1/09 (AMBAC Insured) (b)(c) | | | | 2,000,000 | | | | 1,985,560 |
| Montgomery County Higher Ed. & Health Auth. Hosp. Rev. | | | | | | | | |
| (Abington Memorial Hosp. Proj.) Series A: | | | | | | | | |
| 6% 6/1/09 (AMBAC Insured) | | | | 2,365,000 | | | | 2,557,133 |
| 6% 6/1/16 (AMBAC Insured) | | | | 1,000,000 | | | | 1,160,510 |
| Montgomery County Higher Ed. & Health Auth. Rev. (Health | | | | | | | | |
| Care-Holy Redeemer Health Proj.) Series A, 5.5% 10/1/08 | | | | | | | | |
| (AMBAC Insured) | | | | 1,000,000 | | | | 1,044,200 |
| Muhlenberg School District Series AA, 5.375% 9/1/15 | | | | | | | | |
| (FGIC Insured) | | | | 1,055,000 | | | | 1,157,050 |
| Northumberland County Auth. Commonwealth Lease Rev. | | | | | | | | |
| (State Correctional Facilities Proj.) 0% 10/15/10 | | | | | | | | |
| (Escrowed to Maturity) (d) | | | | 1,000,000 | | | | 838,530 |
| Owen J. Roberts School District 5.5% 8/15/19 | | | | | | | | |
| (Pre-Refunded to 8/15/12 @ 100) (d) | | | | 1,525,000 | | | | 1,694,062 |
| Pennsbury School District 5.5% 1/15/17 (FGIC Insured) | | | | 2,160,000 | | | | 2,366,582 |
| Pennsylvania Econ. Dev. Fing. Auth. Exempt Facilities Rev.: | | | | | | | | |
| (Amtrak Proj.) Series 2001 A: | | | | | | | | |
| 6.25% 11/1/31 (c) | | | | 3,300,000 | | | | 3,528,525 |
| 6.375% 11/1/41 (c) | | | | 1,300,000 | | | | 1,394,393 |
| (Shippingport Proj.) Series A, 4.35%, tender | | | | | | | | |
| 6/1/10 (b)(c) | | | | 1,500,000 | | | | 1,473,690 |
| Pennsylvania Gen. Oblig.: | | | | | | | | |
| First Series: | | | | | | | | |
| 5% 7/1/19 | | | | 2,500,000 | | | | 2,687,600 |
| 5.25% 2/1/14 | | | | 125,000 | | | | 135,165 |
| 5.25% 2/1/18 (Pre-Refunded to 2/1/12 @ 100) (d) | | | | 1,250,000 | | | | 1,364,413 |
| Second Series: | | | | | | | | |
| 0% 7/1/07 (AMBAC Insured) | | | | 1,770,000 | | | | 1,681,624 |
| 5.25% 6/1/15 (FSA Insured) | | | | 3,350,000 | | | | 3,686,474 |
| 5.75% 10/1/16 (Pre-Refunded to | | | | | | | | |
| 10/1/09 @ 101) (d) | | | | 475,000 | | | | 518,919 |
| Pennsylvania Higher Edl. Facilities Auth. Rev.: | | | | | | | | |
| (Drexel Univ. Proj.): | | | | | | | | |
| Series A: | | | | | | | | |
| 5% 5/1/16 (MBIA Insured) | | | | 1,135,000 | | | | 1,228,047 |
| 5% 5/1/18 (MBIA Insured) | | | | 1,220,000 | | | | 1,310,158 |
See accompanying notes which are an integral part of the financial statements.
| Municipal Bonds continued | | | | | | | | |
| | | | | Principal | | | | Value |
| | | | | Amount | | | | (Note 1) |
| Pennsylvania – continued | | | | | | | | |
| Pennsylvania Higher Edl. Facilities Auth. Rev.: - continued | | | | | | | | |
| (Drexel Univ. Proj.): | | | | | | | | |
| 6% 5/1/24 (Pre-Refunded to 5/1/09 @ 100) (d) | | $ | | 4,075,000 | | $ | | 4,408,946 |
| 6% 5/1/29 (Pre-Refunded to 5/1/09 @ 100) (d) | | | | 3,470,000 | | | | 3,754,367 |
| (Lafayette College Proj.) 6% 5/1/30 | | | | 2,500,000 | | | | 2,730,700 |
| (Temple Univ. Proj.) 5.375% 7/15/19 (MBIA Insured) | | | | 1,000,000 | | | | 1,082,330 |
| (Univ. of Pennsylvania Health Systems Proj.) Series A, 5% | | | | | | | | |
| 8/15/17 (AMBAC Insured) | | | | 3,000,000 | | | | 3,202,740 |
| (UPMC Health Sys. Proj.): | | | | | | | | |
| Series 1999 A: | | | | | | | | |
| 5.25% 8/1/10 (FSA Insured) | | | | 1,000,000 | | | | 1,061,200 |
| 5.25% 8/1/11 (FSA Insured) | | | | 1,000,000 | | | | 1,068,480 |
| Series 2001 A: | | | | | | | | |
| 6% 1/15/22 | | | | 400,000 | | | | 439,384 |
| 6% 1/15/31 | | | | 1,000,000 | | | | 1,094,150 |
| Series 2000 S, 5.5% 6/15/15 (AMBAC Insured) | | | | 500,000 | | | | 538,275 |
| Pennsylvania Hsg. Fin. Agcy. Series 54A, 5.375% | | | | | | | | |
| 10/1/28 (c) | | | | 330,000 | | | | 330,561 |
| Pennsylvania Indl. Dev. Auth. Rev.: | | | | | | | | |
| 5.5% 7/1/16 (AMBAC Insured) | | | | 1,080,000 | | | | 1,193,821 |
| 7% 1/1/07 (AMBAC Insured) | | | | 1,000,000 | | | | 1,036,000 |
| Pennsylvania Pub. School Bldg. Auth. School Rev.: | | | | | | | | |
| (Northwestern School District Proj.) Series E, 5.75% | | | | | | | | |
| 1/15/19 (FGIC Insured) | | | | 500,000 | | | | 532,050 |
| (Philadelphia School District Proj.) 5% 6/1/33 | | | | | | | | |
| (FSA Insured) | | | | 3,085,000 | | | | 3,185,016 |
| Pennsylvania State Univ.: | | | | | | | | |
| 5% 9/1/29 | | | | 1,550,000 | | | | 1,633,654 |
| 5% 9/1/35 | | | | 4,485,000 | | | | 4,694,584 |
| Pennsylvania Tpk. Commission Registration Fee Rev. | | | | | | | | |
| Series 2001, 5.5% 7/15/33 (Pre-Refunded to 7/15/11 @ | | | | | | | | |
| 101) (d) | | | | 1,000,000 | | | | 1,106,910 |
| Pennsylvania Tpk. Commission Tpk. Rev. Series S, 5.625% | | | | | | | | |
| 6/1/12 (FGIC Insured) | | | | 2,000,000 | | | | 2,215,840 |
| Philadelphia Arpt. Rev.: | | | | | | | | |
| Series 1998, 5.375% 6/15/10 (FGIC Insured) (c) | | | | 2,000,000 | | | | 2,115,580 |
| 5.375% 6/15/11 (FGIC Insured) (c) | | | | 3,770,000 | | | | 3,988,773 |
| 6% 6/15/08 (FGIC Insured) (c) | | | | 3,000,000 | | | | 3,152,610 |
| Philadelphia Gas Works Rev.: | | | | | | | | |
| (1975 Gen. Ordinance Proj.) 17th Series: | | | | | | | | |
| 5% 7/1/07 (FSA Insured) | | | | 4,000,000 | | | | 4,088,040 |
| 5% 7/1/08 (FSA Insured) | | | | 1,000,000 | | | | 1,038,110 |
See accompanying notes which are an integral part of the financial statements.
13 Annual Report
| Fidelity Pennsylvania Municipal Income Fund | | | | | | | | |
| Investments continued | | | | | | | | | | |
| |
| Municipal Bonds continued | | | | | | | | | | |
| | | | | | | Principal | | | | Value |
| | | | | | | Amount | | | | (Note 1) |
| Pennsylvania – continued | | | | | | | | | | |
| Philadelphia Gas Works Rev.: – continued | | | | | | | | | | |
| (1998 Gen. Ordinance Proj.) 4th Series, 5.25% 8/1/17 | | | | | | | | | | |
| (FSA Insured) | | | | $ | | 2,290,000 | | $ | | 2,461,407 |
| Series A1, 5.25% 9/1/18 (Assured Guaranty Ltd. Insured) | | . | | | | 3,340,000 | | | | 3,569,592 |
| Third Series, 5% 8/1/06 (FSA Insured) | | | | | | 1,000,000 | | | | 1,009,480 |
| Philadelphia Gen. Oblig. 5.25% 9/15/12 (FSA Insured) | | | | | | 2,455,000 | | | | 2,635,590 |
| Philadelphia Hosp. & Higher Ed. Facilities Auth. Health Sys. | | | | | | | | | | |
| Rev. (Jefferson Health Sys. Proj.) Series A: | | | | | | | | | | |
| 5% 5/15/09 | | | | | | 1,000,000 | | | | 1,039,180 |
| 5.5% 5/15/08 | | | | | | 1,000,000 | | | | 1,043,280 |
| Philadelphia Hosps. & Higher Ed. Facilities Auth. Hosp. Rev. | | | | | | | | | | |
| (Jeanes Hosp. Proj.) 5.875% 7/1/17 (Pre-Refunded to | | | | | | | | | | |
| 7/1/07 @ 102) (d) | | | | | | 340,000 | | | | 359,349 |
| Philadelphia Muni. Auth. Rev.: | | | | | | | | | | |
| (Muni. Svcs. Bldg. Lease Prog.) 0% 3/15/11 (FSA Insured) | | . | | | | 1,000,000 | | | | 815,720 |
| Series B, 5.25% 11/15/11 (FSA Insured) | | | | | | 2,000,000 | | | | 2,168,480 |
| Philadelphia Redev. Auth. Rev. (Philadelphia Neighborhood | | | | | | | | | | |
| Transformation Initiative Proj.) Series 2005 C, 5% 4/15/31 | | | | | | | | | | |
| (FGIC Insured) | | | | | | 1,000,000 | | | | 1,046,790 |
| Philadelphia School District: | | | | | | | | | | |
| Series 2002 A, 5.5% 2/1/26 (Pre-Refunded to 2/1/12 @ | | | | | | | | | | |
| 100) (d) | | | | | | 3,565,000 | | | | 3,929,343 |
| Series 2004 D, 5.25% 6/1/34 (FGIC Insured) | | | | | | 2,785,000 | | | | 2,963,797 |
| Series 2005 D: | | | | | | | | | | |
| 5.5% 6/1/16 (FSA Insured) | | | | | | 2,030,000 | | | | 2,279,670 |
| 5.5% 6/1/17 (FSA Insured) | | | | | | 2,125,000 | | | | 2,395,853 |
| Series A, 5.75% 2/1/16 (Pre-Refunded to 2/1/11 @ | | | | | | | | | | |
| 100) (d) | | | | | | 500,000 | | | | 552,100 |
| Series B, 5.625% 8/1/15 (Pre-Refunded to 8/1/12 @ | | | | | | | | | | |
| 100) (d) | | | | | | 1,500,000 | | | | 1,671,675 |
| Series D, 5.125% 6/1/34 (FGIC Insured) | | | | | | 1,800,000 | | | | 1,897,254 |
| Philadelphia Wtr. & Wastewtr. Rev.: | | | | | | | | | | |
| Series 14, 0% 10/1/08 (MBIA Insured) | | | | | | 5,300,000 | | | | 4,793,638 |
| Series A: | | | | | | | | | | |
| 5% 11/1/31 (FGIC Insured) | | | | | | 1,075,000 | | | | 1,110,669 |
| 5.375% 11/1/19 (FGIC Insured) | | | | | | 3,000,000 | | | | 3,268,290 |
| Pittsburgh Gen. Oblig.: | | | | | | | | | | |
| Series 2003 A: | | | | | | | | | | |
| 5.5% 9/1/16 (AMBAC Insured) | | | | | | 5,000,000 | | | | 5,394,050 |
| 5.75% 9/1/22 (Pre-Refunded to 9/1/09 @ 100) (d) | | | | | | 800,000 | | | | 862,648 |
See accompanying notes which are an integral part of the financial statements.
| Municipal Bonds continued | | | | | | |
| | | | | Principal | | Value |
| | | | | Amount | | (Note 1) |
| Pennsylvania – continued | | | | | | |
| Pittsburgh Gen. Oblig.: – continued | | | | | | |
| Series 2003 D, 5% 9/1/06 (FGIC Insured) | | $ | | 250,000 | | $ 252,870 |
| Series A: | | | | | | |
| 5% 9/1/11 (MBIA Insured) | | | | 5,000,000 | | 5,331,350 |
| 6% 3/1/07 (MBIA Insured) | | | | 2,735,000 | | 2,816,011 |
| Pittsburgh School District: | | | | | | |
| Series A, 5% 9/1/08 (MBIA Insured) (a) | | | | 3,080,000 | | 3,172,338 |
| Series C: | | | | | | |
| 0% 8/1/07 (AMBAC Insured) | | | | 2,610,000 | | 2,472,584 |
| 0% 8/1/08 (AMBAC Insured) | | | | 2,000,000 | | 1,820,480 |
| Pittsburgh Wtr. & Swr. Auth. Wtr. & Swr. Sys. Rev. Series A, | | | | | | |
| 6.5% 9/1/13 (FGIC Insured) | | | | 10,000,000 | | 11,544,495 |
| Quaker Valley School District 5.5% 4/1/25 (Pre-Refunded to | | | | | | |
| 4/1/14 @ 100) (d) | | | | 1,020,000 | | 1,146,990 |
| Scranton-Lackawanna Health & Welfare Auth. Rev. (Cmnty. | | | | | | |
| Med. Ctr. Proj.) 5.5% 7/1/12 (MBIA Insured) | | | | 3,375,000 | | 3,558,870 |
| Spring-Ford Area School District: | | | | | | |
| 5.375% 4/1/16 (FSA Insured) | | | | 790,000 | | 858,943 |
| 5.375% 4/1/17 (FSA Insured) | | | | 830,000 | | 898,118 |
| 5.375% 4/1/18 (FSA Insured) | | | | 875,000 | | 946,313 |
| Upper Saint Clair Township School District 5.375% 7/15/16 | | | | | | |
| (FSA Insured) | | | | 1,855,000 | | 2,023,601 |
| West Allegheny School District Series B, 5.25% 2/1/12 | | | | | | |
| (FGIC Insured) | | | | 1,850,000 | | 2,018,276 |
| Westmoreland County Gen. Oblig.: | | | | | | |
| 0% 8/1/15 (Escrowed to Maturity) (d) | | | | 4,290,000 | | 2,889,916 |
| 0% 8/1/16 (Escrowed to Maturity) (d) | | | | 2,955,000 | | 1,888,511 |
| Westmoreland County Indl. Dev. Auth. Rev. (Nat’l. Waste & | | | | | | |
| Energy Corp./Valley Landfill Expansion Proj.) 5.1%, tender | | | | | | |
| 5/1/09 (b)(c) | | | | 2,700,000 | | 2,780,379 |
| Westmoreland County Muni. Auth. Muni. Svc. Rev.: | | | | | | |
| Series A: | | | | | | |
| 0% 8/15/19 (FGIC Insured) | | | | 5,000,000 | | 2,735,700 |
| 0% 8/15/20 (FGIC Insured) | | | | 2,500,000 | | 1,301,125 |
| Series C, 0% 8/15/17 (Escrowed to Maturity) (d) | | | | 2,500,000 | | 1,511,675 |
| York City Swr. Auth. Swr. Rev. 0% 12/1/12 (MBIA Insured) | | | | 3,235,000 | | 2,447,633 |
| York County School of Technology Auth. Lease Rev.: | | | | | | |
| 5.375% 2/15/18 (FGIC Insured) | | | | 1,000,000 | | 1,088,850 |
| 5.5% 2/15/23 (FGIC Insured) | | | | 1,070,000 | | 1,168,440 |
| | | | | | | 284,972,541 |
See accompanying notes which are an integral part of the financial statements.
15 Annual Report
| Fidelity Pennsylvania Municipal Income Fund | | | | |
| Investments continued | | | | | | |
| |
| Municipal Bonds continued | | | | | | |
| | | | | Principal | | Value |
| | | | | Amount | | (Note 1) |
| Puerto Rico 3.3% | | | | | | |
| Puerto Rico Commonwealth Hwy. & Trans. Auth. Hwy. Rev. | | | | | | |
| Series Y, 5.5% 7/1/36 (FSA Insured) | | $ | | 400,000 | | $ 445,184 |
| Puerto Rico Commonwealth Infrastructure Fing. Auth.: | | | | | | |
| Series 2000 A, 5.5% 10/1/32 (Escrowed to Maturity) (d) | | | | 2,455,000 | | 2,665,123 |
| Series C, 5.5% 7/1/25 (AMBAC Insured) | | | | 2,500,000 | | 2,918,600 |
| Puerto Rico Elec. Pwr. Auth. Pwr. Rev.: | | | | | | |
| Series II, 5.375% 7/1/16 (MBIA Insured) | | | | 1,000,000 | | 1,097,050 |
| Series QQ, 5.25% 7/1/13 (XL Cap. Assurance, Inc. Insured) | | 500,000 | | 548,915 |
| Puerto Rico Muni. Fin. Agcy. Series 2005 C, 5.25% 8/1/17 | | | | | | |
| (FSA Insured) | | | | 2,000,000 | | 2,237,600 |
| | | | | | | 9,912,472 |
| |
| TOTAL MUNICIPAL BONDS | | | | | | |
| (Cost $288,337,394) | | | | | | 299,224,227 |
| |
| Municipal Notes 0.6% | | | | | | |
| |
| Pennsylvania – 0.6% | | | | | | |
| Philadelphia Wtr. & Wastewtr. Rev. Participating VRDN | | | | | | |
| Series SG 158, 3.54% (Liquidity Facility Societe Generale) (b)(e) | | | | |
| (Cost $2,000,000) | | | | 2,000,000 | | 2,000,000 |
| |
| TOTAL INVESTMENT PORTFOLIO 98.2% | | | | | | |
| (Cost $290,337,394) | | | | | | 301,224,227 |
| |
| NET OTHER ASSETS – 1.8% | | | | | | 5,507,755 |
| NET ASSETS 100% | | | | | | $ 306,731,982 |
| Security Type Abbreviation |
| VRDN — VARIABLE RATE DEMAND NOTE |
Legend
(a) Security or a portion of the security
purchased on a delayed delivery or
when-issued basis.
(b) The coupon rate shown on floating or
adjustable rate securities represents the
rate at period end.
|
(c) Private activity obligations whose
interest is subject to the federal
alternative minimum tax for individuals.
(d) Security collateralized by an amount
sufficient to pay interest and principal.
(e) Provides evidence of ownership in one
or more underlying municipal bonds.
|
See accompanying notes which are an integral part of the financial statements.
Annual Report 16
Other Information
The distribution of municipal securities by revenue source, as a percentage of total net assets, is as follows:
| General Obligations | | 35.8% |
| Escrowed/Pre Refunded | | 12.8% |
| Education | | 11.3% |
| Transportation | | 10.9% |
| Water & Sewer | | 9.2% |
| Health Care | | 8.6% |
| Electric Utilities | | 6.2% |
| Others* (individually less than 5%) | | 5.2% |
| | | 100.0% |
| * Includes net other assets | | |
See accompanying notes which are an integral part of the financial statements.
17 Annual Report
| Fidelity Pennsylvania Municipal Income Fund | | | | | | |
| |
| Financial Statements | | | | | | | | |
| |
| Statement of Assets and Liabilities | | | | | | | | |
| | | | | | | December 31, 2005 |
| |
| Assets | | | | | | | | |
| Investment in securities, at value | | | | | | | | |
| See accompanying schedule: | | | | | | | | |
| Unaffiliated issuers (cost $290,337,394) | | | | | | $ | | 301,224,227 |
| Cash | | | | | | | | 5,687,002 |
| Receivable for fund shares sold | | | | | | | | 208,594 |
| Interest receivable | | | | | | | | 3,748,888 |
| Prepaid expenses | | | | | | | | 1,524 |
| Other receivables | | | | | | | | 26,414 |
| Total assets | | | | | | | | 310,896,649 |
| |
| Liabilities | | | | | | | | |
| Payable for investments purchased | | | | | | | | |
| Regular delivery | | $ | | 78,905 | | | | |
| Delayed delivery | | | | 3,179,700 | | | | |
| Payable for fund shares redeemed | | | | 422,188 | | | | |
| Distributions payable | | | | 316,614 | | | | |
| Accrued management fee | | | | 95,309 | | | | |
| Other affiliated payables | | | | 27,172 | | | | |
| Other payables and accrued expenses | | | | 44,779 | | | | |
| Total liabilities | | | | | | | | 4,164,667 |
| |
| Net Assets | | | | | | $ | | 306,731,982 |
| Net Assets consist of: | | | | | | | | |
| Paid in capital | | | | | | $ | | 296,617,830 |
| Undistributed net investment income | | | | | | | | 22,723 |
| Accumulated undistributed net realized gain (loss) on | | | | | | | | |
| investments | | | | | | | | (795,404) |
| Net unrealized appreciation (depreciation) on | | | | | | | | |
| investments | | | | | | | | 10,886,833 |
| Net Assets, for 28,408,435 shares outstanding | | | | | | $ | | 306,731,982 |
| Net Asset Value, offering price and redemption price per | | | | | | |
| share ($306,731,982 ÷ 28,408,435 shares) | | | | | | $ | | 10.80 |
See accompanying notes which are an integral part of the financial statements.
| Statement of Operations | | | | | | |
| | | | | Year ended December 31, 2005 |
| |
| Investment Income | | | | | | |
| Interest | | | | $ | | 13,764,630 |
| |
| Expenses | | | | | | |
| Management fee | | $ | | 1,149,402 | | |
| Transfer agent fees | | | | 234,699 | | |
| Accounting fees and expenses | | | | 76,959 | | |
| Independent trustees’ compensation | | | | 1,409 | | |
| Custodian fees and expenses | | | | 5,149 | | |
| Registration fees | | | | 20,702 | | |
| Audit | | | | 46,981 | | |
| Legal | | | | 4,922 | | |
| Miscellaneous | | | | 6,810 | | |
| Total expenses before reductions | | | | 1,547,033 | | |
| Expense reductions | | | | (150,270) | | 1,396,763 |
| |
| Net investment income | | | | | | 12,367,867 |
| Realized and Unrealized Gain (Loss) | | | | | | |
| Net realized gain (loss) on: | | | | | | |
| Investment securities: | | | | | | |
| Unaffiliated issuers | | | | 1,835,852 | | |
| Futures contracts | | | | 79,603 | | |
| Swap agreements | | | | 61,411 | | |
| Total net realized gain (loss) | | | | | | 1,976,866 |
| Change in net unrealized appreciation (depreciation) on: | | | | |
| Investment securities | | | | (6,350,581) | | |
| Swap agreements | | | | (5,042) | | |
| Total change in net unrealized appreciation | | | | | | |
| (depreciation) | | | | | | (6,355,623) |
| Net gain (loss) | | | | | | (4,378,757) |
| Net increase (decrease) in net assets resulting from | | | | | | |
| operations | | | | $ | | 7,989,110 |
See accompanying notes which are an integral part of the financial statements.
19 Annual Report
| Fidelity Pennsylvania Municipal Income Fund | | | | |
| Financial Statements continued | | | | | | | | |
| |
| Statement of Changes in Net Assets | | | | | | | | |
| | | | | Year ended | | | | Year ended |
| | | | | December 31, | | | | December 31, |
| | | | | 2005 | | | | 2004 |
| Increase (Decrease) in Net Assets | | | | | | | | |
| Operations | | | | | | | | |
| Net investment income | | $ | | 12,367,867 | | $ | | 11,953,364 |
| Net realized gain (loss) | | | | 1,976,866 | | | | 1,131,185 |
| Change in net unrealized appreciation (depreciation) . | | | | (6,355,623) | | | | (1,386,233) |
| Net increase (decrease) in net assets resulting | | | | | | | | |
| from operations | | | | 7,989,110 | | | | 11,698,316 |
| Distributions to shareholders from net investment income . | | | | (12,342,980) | | | | (11,909,386) |
| Distributions to shareholders from net realized gain | | | | (2,072,399) | | | | (1,280,619) |
| Total distributions | | | | (14,415,379) | | | | (13,190,005) |
| Share transactions | | | | | | | | |
| Proceeds from sales of shares | | | | 54,588,207 | | | | 41,546,733 |
| Reinvestment of distributions | | | | 10,204,264 | | | | 9,672,228 |
| Cost of shares redeemed | | | | (49,266,553) | | | | (44,125,799) |
| Net increase (decrease) in net assets resulting from | | | | | | | | |
| share transactions | | | | 15,525,918 | | | | 7,093,162 |
| Redemption fees | | | | 10,940 | | | | 1,146 |
| Total increase (decrease) in net assets | | | | 9,110,589 | | | | 5,602,619 |
| |
| Net Assets | | | | | | | | |
| Beginning of period | | | | 297,621,393 | | | | 292,018,774 |
| End of period (including undistributed net investment | | | | | | | | |
| income of $22,723 and distributions in excess of net | | | | | | | | |
| investment income of $2,166, respectively) | | $ | | 306,731,982 | | $ | | 297,621,393 |
| |
| Other Information | | | | | | | | |
| Shares | | | | | | | | |
| Sold | | | | 4,981,143 | | | | 3,770,208 |
| Issued in reinvestment of distributions | | | | 934,909 | | | | 881,647 |
| Redeemed | | | | (4,514,890) | | | | (4,041,514) |
| Net increase (decrease) | | | | 1,401,162 | | | | 610,341 |
See accompanying notes which are an integral part of the financial statements.
| Financial Highlights | | | | | | | | | | |
| |
| Years ended December 31, | | 2005 | | 2004 | | 2003 | | 2002 | | 2001 |
| Selected Per Share Data | | | | | | | | | | |
| Net asset value, | | | | | | | | | | |
| beginning of period | | $ 11.02 | | $ 11.06 | | $ 11.07 | | $ 10.64 | | $ 10.64 |
| Income from Investment | | | | | | | | | | |
| Operations | | | | | | | | | | |
| Net investment incomeB | | 440 | | .454 | | .463 | | .482 | | .494E |
| Net realized and unrealized | | | | | | | | | | |
| gain (loss) | | (.148) | | .006C | | .091 | | .471 | | .030E |
| Total from investment operations | | .292 | | .460 | | .554 | | .953 | | .524 |
| Distributions from net investment | | | | | | | | | | |
| income | | (.439) | | (.452) | | (.462) | | (.482) | | (.493) |
| Distributions from net realized | | | | | | | | | | |
| gain | | (.073) | | (.048) | | (.102) | | (.041) | | (.031) |
| Total distributions | | (.512) | | (.500) | | (.564) | | (.523) | | (.524) |
| Redemption fees added to paid in | | | | | | | | | | |
| capitalB,F | | — | | — | | — | | — | | — |
| Net asset value, end of period | | $ 10.80 | | $ 11.02 | | $ 11.06 | | $ 11.07 | | $ 10.64 |
| Total ReturnA | | 2.70% | | 4.28% | | 5.11% | | 9.14% | | 4.97% |
| Ratios to Average Net AssetsD | | | | | | | | | | |
| Expenses before reductions | | 50% | | .50% | | .51% | | .51% | | .51% |
| Expenses net of fee waivers, | | | | | | | | | | |
| if any | | 50% | | .50% | | .51% | | .51% | | .51% |
| Expenses net of all reductions | | 45% | | .49% | | .50% | | .49% | | .45% |
| Net investment income | | 4.02% | | 4.14% | | 4.18% | | 4.42% | | 4.59%E |
| Supplemental Data | | | | | | | | | | |
| Net assets, end of period | | | | | | | | | | |
| (000 omitted) | | $306,732 | | $297,621 | | $292,019 | | $300,026 | | $269,262 |
| Portfolio turnover rate | | 26% | | 14% | | 18% | | 9% | | 22% |
A Total returns would have been lower had certain expenses not been reduced during the periods shown.
B Calculated based on average shares outstanding during the period.
C The amount shown for a share outstanding does not correspond with the aggregate net gain (loss) on investments for the period due to the
timing of sales and repurchases of shares in relation to fluctuating market values of the investments of the fund.
D Expense ratios reflect operating expenses of the fund. Expenses before reductions do not reflect amounts reimbursed by the investment adviser
or expense offset arrangements and do not represent the amount paid by the fund during periods when reimbursements or reductions occur.
Expenses net of fee waivers reflect expenses after reimbursement by the investment adviser but prior to reductions from expense offset arrange
ments. Expenses net of all reductions represent the net expenses paid by the fund.
E Effective January 1, 2001, the fund adopted the provisions of the AICPA Audit and Accounting Guide for Investment Companies and began
amortizing premium and discount on all debt securities. Per share data and ratios for periods prior to adoption have not been restated to reflect
this change.
F Amount represents less than $.001 per share.
|
See accompanying notes which are an integral part of the financial statements.
21 Annual Report
| Fidelity Pennsylvania Municipal Money Market Fund | | |
| Investment Changes/Performance |
| |
| Maturity Diversification | | | | | | |
| Days | | % of fund’s | | % of fund’s | | % of fund’s |
| | | investments | | investments | | investments |
| | | 12/31/05 | | 6/30/05 | | 12/31/04 |
| 0 – 30 | | 88.4 | | 87.5 | | 87.7 |
| 31 – 90 | | 1.2 | | 1.8 | | 3.2 |
| 91 – 180 | | 5.6 | | 3.1 | | 1.4 |
| 181 – 397 | | 4.8 | | 7.6 | | 7.7 |
Weighted Average Maturity | | | | | | |
| | | 12/31/05 | | 6/30/05 | | 12/31/04 |
| Fidelity Pennsylvania Municipal Money | | | | | | |
| Market Fund | | 23 Days | | 33 Days | | 27 Days |
| Pennsylvania Tax Free Money Market | | | | | | |
| Funds Average* | | 27 Days | | 22 Days | | 32 Days |
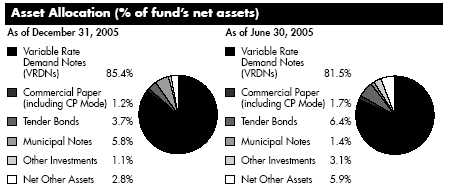
| Current and Historical Seven Day Yields | | | | | | |
| | | 1/2/06 | | 10/3/05 | | 6/27/05 | | 3/28/05 | | 1/3/05 |
| Fidelity Pennsylvania Municipal | | | | | | | | | | |
| Money Market Fund | | 2.98% | | 2.30% | | 2.05% | | 1.63% | | 1.49% |
Yield refers to the income paid by the fund over a given period. Yields for money market funds are usually for seven day periods, as they are here, though they are expressed as annual percentage rates. Past performance is no guarantee of future results. Yield will vary and it is possible to lose money by investing in the fund.
*Source: iMoneyNet, Inc.
Annual Report 22
| Fidelity Pennsylvania Municipal Money Market Fund | | |
| Investments December 31, 2005 |
| Showing Percentage of Net Assets | | | | | | |
| |
| Municipal Securities 97.2% | | | | | | |
| | | | | Principal | | Value |
| | | | | Amount | | (Note 1) |
| New Jersey/Pennsylvania – 1.8% | | | | | | |
| Delaware River Port Auth. Pennsylvania & New Jersey Rev. | | | | | | |
| Participating VRDN Series SGA 89, 3.73% (Liquidity Facility | | | | |
| Societe Generale) (b)(d) | | | $ | 7,500,000 | | $ 7,500,000 |
| Pennsylvania – 94.1% | | | | | | |
| Allegheny County Arpt. Rev. Participating VRDN Series PA | | | | | | |
| 567, 3.59% (Liquidity Facility Merrill Lynch & Co., | | | | | | |
| Inc.) (b)(c)(d) | | | | 2,000,000 | | 2,000,000 |
| Allegheny County Hosp. Dev. Auth. Rev. Bonds: | | | | | | |
| (South Hills Health Sys. Proj.): | | | | | | |
| Series 2000 A, 2.95%, tender 6/1/06, LOC PNC Bank | | | | |
| NA, Pittsburgh (b) | | | | 4,400,000 | | 4,400,000 |
| Series A, 2.93%, tender 5/1/06, LOC PNC Bank NA, | | | | | | |
| Pittsburgh (b) | | | | 6,315,000 | | 6,315,000 |
| Series PT 762, 2.85%, tender 6/15/06 (Liquidity Facility | | | | | | |
| Landesbank Hessen-Thuringen) (b)(d)(e) | | | | 5,340,000 | | 5,340,000 |
| Allegheny County Indl. Dev. Auth. Econ. Dev. Rev. (Glassport | | | | |
| Realty Ltd. Proj.) 3.8%, LOC Huntington Nat’l. Bank, | | | | | | |
| Columbus, VRDN (b)(c) | | | | 1,560,000 | | 1,560,000 |
| Allegheny County Indl. Dev. Auth. Rev.: | | | | | | |
| Participating VRDN Series Merlots A48, 3.54% (Liquidity | | | | | | |
| Facility Wachovia Bank NA) (b)(d) | | | | 3,000,000 | | 3,000,000 |
| (Doren, Inc. Proj.) Series 1997 C, 3.65%, LOC Nat’l. City | | | | |
| Bank, PA, VRDN (b)(c) | | | | 1,400,000 | | 1,400,000 |
| (R.I. Lampus Co. Proj.) Series 1997 A, 3.65%, LOC Nat’l. | | | | |
| City Bank, PA, VRDN (b)(c) | | | | 2,525,000 | | 2,525,000 |
| (Union Elec. Steel Co. Proj.) Series 1996 A, 3.6%, LOC PNC | | | | |
| Bank NA, Pittsburgh, VRDN (b)(c) | | | | 3,120,000 | | 3,120,000 |
| (UPMC Children’s Hosp. Proj.) Series 2004 A, 3.68%, | | | | | | |
| VRDN (b) | | | | 3,200,000 | | 3,200,000 |
| Beaver County Indl. Dev. Auth. Poll. Cont. Rev. Participating | | | | |
| VRDN Series EGL 95 3503, 3.55% (Liquidity Facility | | | | | | |
| Citibank NA, New York) (b)(d) | | | | 6,700,000 | | 6,700,000 |
| Berks County Indl. Dev. Auth. Rev. (Fleetwood Industries Bus. | | | | |
| Trust Proj.) 3.61%, LOC First Tennessee Bank NA, Memphis, | | | | |
| VRDN (b)(c) | | | | 2,440,000 | | 2,440,000 |
| Blair County Indl. Dev. Auth. Rev. (Homewood at Martinsburg | | | | |
| Proj.) 3.43%, LOC Manufacturers & Traders Trust Co., | | | | | | |
| VRDN (b) | | | | 3,200,000 | | 3,200,000 |
| Bucks County Indl. Dev. Auth. Rev.: | | | | | | |
| (Double H Plastics, Inc. Proj.) Series 1993, 3.62%, LOC | | | | | | |
| Wachovia Bank NA, VRDN (b)(c) | | | | 1,120,000 | | 1,120,000 |
| (Snowball Real Estate LP Proj.) 3.67%, LOC Wachovia Bank | | | | |
| NA, VRDN (b)(c) | | | | 2,240,000 | | 2,240,000 |
| |
| |
| See accompanying notes which are an integral part of the financial statements. | | |
| |
| 23 | | | | | | Annual Report |
| Fidelity Pennsylvania Municipal Money Market Fund | | | | |
| Investments continued | | | | | | |
| |
| Municipal Securities continued | | | | | | |
| | | Principal | | | | Value |
| | | Amount | | | | (Note 1) |
| Pennsylvania – continued | | | | | | |
| Butler County Indl. Dev. Auth. Rev. (Armco, Inc. Proj.) | | | | | | |
| Series 1996 A, 3.6%, LOC Fifth Third Bank, Cincinnati, | | | | | | |
| VRDN (b)(c) | | $ 1,500,000 | | $ | | 1,500,000 |
| Cambria County Ind. Dev. Auth. (Cambria Cogen Co. Proj.): | | | | | | |
| Series 1998 A1, 3.66%, LOC Bayerische Hypo-und | | | | | | |
| Vereinsbank AG, VRDN (b)(c) | | 5,825,000 | | | | 5,825,000 |
| Series 1998 A2, 3.65%, LOC Bayerische Hypo-und | | | | | | |
| Vereinsbank AG, VRDN (b)(c) | | 3,300,000 | | | | 3,300,000 |
| Central Bucks School District Series 2000 A, 3.56% | | | | | | |
| (FGIC Insured), VRDN (b) | | 4,125,000 | | | | 4,125,000 |
| Chester County Inter Unit 3.61%, LOC PNC Bank NA, | | | | | | |
| Pittsburgh, VRDN (b) | | 1,660,000 | | | | 1,660,000 |
| Delaware County Indl. Dev. Auth. Rev. Participating VRDN | | | | | | |
| Series PA 1295, 3.56% (Liquidity Facility Merrill Lynch & | | | | | | |
| Co., Inc.) (b)(c)(d) | | 2,250,000 | | | | 2,250,000 |
| Erie County Gen. Oblig. Participating VRDN Series PT 1961, | | | | | | |
| 3.54% (Liquidity Facility Merrill Lynch & Co., Inc.) (b)(d) | | 3,625,000 | | | | 3,625,000 |
| Harrisburg Auth. Wtr. Rev.: | | | | | | |
| Series 2002 B, 3.56% (FSA Insured), VRDN (b) | | 3,000,000 | | | | 3,000,000 |
| Series A, 3.56% (FGIC Insured), VRDN (b) | | 2,800,000 | | | | 2,800,000 |
| Hatfield Township Indl. Dev. Auth. Exempt Facilities Rev. | | | | | | |
| (Hatfield Quality Meats Proj.) 3.6%, LOC Bank of America | | | | | | |
| NA, VRDN (b)(c) | | 1,500,000 | | | | 1,500,000 |
| Lackawanna County Gen. Oblig. Series 2004 B, 3.53% | | | | | | |
| (FSA Insured), VRDN (b) | | 3,300,000 | | | | 3,300,000 |
| Lancaster Higher Ed. Auth. College Rev. (Franklin & Marshall | | | | | | |
| College Proj.) Series 1997, 3.61%, VRDN (b) | | 2,860,000 | | | | 2,860,000 |
| Lawrence County Indl. Dev. Auth. Indl. Dev. Rev. (Atlantic | | | | | | |
| States Materials Proj.) Series 1999, 3.62%, LOC Wachovia | | | | | | |
| Bank NA, VRDN (b)(c) | | 1,200,000 | | | | 1,200,000 |
| Luzerne County Indl. Dev. Auth. Wtr. Facilities Rev. | | | | | | |
| Participating VRDN Series MS 1170X, 3.57% (Liquidity | | | | | | |
| Facility Morgan Stanley) (b)(c)(d) | | 2,000,000 | | | | 2,000,000 |
| Lycoming County Indl. Dev. Auth. (FXD-Brodart Co. Proj.): | | | | | | |
| Series A, 3.66%, LOC Manufacturers & Traders Trust Co., | | | | | | |
| VRDN (b)(c) | | 1,905,000 | | | | 1,905,000 |
| Series C, 3.66%, LOC Manufacturers & Traders Trust Co., | | | | | | |
| VRDN (b)(c) | | 1,000,000 | | | | 1,000,000 |
| Northampton County Indl. Dev. Auth. Rev.: | | | | | | |
| Bonds (American Wtr. Cap. Corp. Proj.) Series 1991, 3.31% | | | | | | |
| tender 2/8/06, CP mode (c) | | 2,500,000 | | | | 2,500,000 |
| (Binney & Smith, Inc. Proj.) Series 1997 A, 3.57%, | | | | | | |
| LOC JPMorgan Chase Bank, VRDN (b)(c) | | 2,350,000 | | | | 2,350,000 |
See accompanying notes which are an integral part of the financial statements.
| Municipal Securities continued | | | | | | |
| | | Principal | | | | Value |
| | | Amount | | | | (Note 1) |
| Pennsylvania – continued | | | | | | |
| Northampton Indl. Dev. Auth. Rev. (Ultra-Poly Corp./Portland | | | | | | |
| Ind. Park Proj.) 3.6%, LOC PNC Bank NA, Pittsburgh, | | | | | | |
| VRDN (b)(c) | | $ 2,400,000 | | $ | | 2,400,000 |
| Pennsylvania Econ. Dev. Fing. Auth. Exempt Facilities Rev.: | | | | | | |
| (Amtrak Proj.) Series B, 3.6%, LOC JPMorgan Chase Bank, | | | | | | |
| VRDN (b)(c) | | 19,700,000 | | | | 19,700,000 |
| (Merck & Co. Proj.) Series 2000, 3.58%, VRDN (b)(c) | | 11,000,000 | | | | 11,000,000 |
| (York Wtr. Co. Proj.) Series B, 3.6% (XL Cap. Assurance, Inc. | | | | | | |
| Insured), VRDN (b)(c) | | 3,500,000 | | | | 3,500,000 |
| Pennsylvania Econ. Dev. Fing. Auth. Indl. Dev. Rev.: | | | | | | |
| Series 1996 A2, 3.6%, LOC PNC Bank NA, Pittsburgh, | | | | | | |
| VRDN (b)(c) | | 400,000 | | | | 400,000 |
| Series 1999 C4, 3.6%, LOC PNC Bank NA, Pittsburgh, | | | | | | |
| VRDN (b)(c) | | 800,000 | | | | 800,000 |
| Series 2002 B6, 3.6%, LOC PNC Bank NA, Pittsburgh, | | | | | | |
| VRDN (b)(c) | | 800,000 | | | | 800,000 |
| Series 2004 D2, 3.6%, LOC PNC Bank NA, Pittsburgh, | | | | | | |
| VRDN (b)(c) | | 2,800,000 | | | | 2,800,000 |
| Series 2004 D6, 3.6%, LOC PNC Bank NA, Pittsburgh, | | | | | | |
| VRDN (b)(c) | | 2,700,000 | | | | 2,700,000 |
| Series B3, 3.6%, LOC PNC Bank NA, Pittsburgh, | | | | | | |
| VRDN (b)(c) | | 1,400,000 | | | | 1,400,000 |
| Series B5, 3.6%, LOC PNC Bank NA, Pittsburgh, | | | | | | |
| VRDN (b)(c) | | 1,000,000 | | | | 1,000,000 |
| Pennsylvania Econ. Dev. Fing. Auth. Rev.: | | | | | | |
| (Westrum Hanover, LP Proj.) 3.57%, LOC Fed. Home Ln. | | | | | | |
| Bank Pittsburg, VRDN (b)(c) | | 2,900,000 | | | | 2,900,000 |
| (Westrum Harleysville II LP Proj.) 3.57%, LOC Fed. Home Ln. | | | | | | |
| Bank Pittsburg, VRDN (b)(c) | | 4,335,000 | | | | 4,335,000 |
| Pennsylvania Econ. Dev. Fing. Auth. Solid Waste Disp. Rev.: | | | | | | |
| Participating VRDN Series MT 47, 3.58% (Liquidity Facility | | | | | | |
| Lloyds TSB Bank PLC) (b)(c)(d) | | 4,500,000 | | | | 4,500,000 |
| (Waste Mgmt., Inc. Proj.) 3.78%, VRDN (b)(c) | | 4,200,000 | | | | 4,200,000 |
| Pennsylvania Econ. Dev. Fing. Auth. Wastewtr. Treatment Rev. | | | | | | |
| (Sunoco, Inc. (R&M) Proj.): | | | | | | |
| Series A, 3.605%, VRDN (b)(c) | | 1,600,000 | | | | 1,600,000 |
| Series B, 3.77% (Sunoco, Inc. Guaranteed), VRDN (b)(c) | | 1,600,000 | | | | 1,600,000 |
| Pennsylvania Gen. Oblig. Participating VRDN: | | | | | | |
| Series EGL 04 43 Class A, 3.55% (Liquidity Facility Citibank | | | | | | |
| NA) (b)(d) | | 10,250,000 | | | | 10,250,000 |
| Series Merlots 04 B15, 3.54% (Liquidity Facility Wachovia | | | | | | |
| Bank NA) (b)(d) | | 3,095,000 | | | | 3,095,000 |
See accompanying notes which are an integral part of the financial statements.
25 Annual Report
| Fidelity Pennsylvania Municipal Money Market Fund | | | | |
| Investments continued | | | | | | |
| |
| Municipal Securities continued | | | | | | |
| | | Principal | | | | Value |
| | | Amount | | | | (Note 1) |
| Pennsylvania – continued | | | | | | |
| Pennsylvania Gen. Oblig. Participating VRDN: – continued | | | | | | |
| Series MS 1193, 3.55% (Liquidity Facility Morgan | | | | | | |
| Stanley) (b)(d) | | $ 8,000,000 | | $ | | 8,000,000 |
| Pennsylvania Higher Ed. Assistance Agcy. Student Ln. Rev.: | | | | | | |
| Series 1988 C, 3.43%, LOC Sallie Mae, VRDN (b)(c) | | 1,500,000 | | | | 1,500,000 |
| Series 1988 E, 3.43%, LOC Sallie Mae, VRDN (b)(c) | | 14,000,000 | | | | 14,000,000 |
| Series 1997 A, 3.6% (AMBAC Insured), VRDN (b)(c) | | 2,900,000 | | | | 2,900,000 |
| Series 2000 A, 3.6% (AMBAC Insured), VRDN (b)(c) | | 4,000,000 | | | | 4,000,000 |
| Series 2001 B, 3.56% (FSA Insured), VRDN (b)(c) | | 800,000 | | | | 800,000 |
| Series 2002 B, 3.6% (FSA Insured), VRDN (b)(c) | | 2,800,000 | | | | 2,800,000 |
| Series A: | | | | | | |
| 3.6% (AMBAC Insured), VRDN (b)(c) | | 2,500,000 | | | | 2,500,000 |
| 3.6% (FSA Insured), VRDN (b)(c) | | 20,500,000 | | | | 20,500,000 |
| Series A1, 3.6% (AMBAC Insured), VRDN (b)(c) | | 5,600,000 | | | | 5,600,000 |
| Pennsylvania Higher Edl. Facilities Auth. (Washington & | | | | | | |
| Jefferson Dev. Corp. Proj.) Series A, 3.56%, LOC Unicredito | | | | | | |
| Italiano Spa, VRDN (b) | | 3,500,000 | | | | 3,500,000 |
| Pennsylvania Higher Edl. Facilities Auth. Hosp. Rev. | | | | | | |
| Participating VRDN Series MT 42, 3.57% (Liquidity Facility | | | | | | |
| Lloyds TSB Bank PLC) (b)(d) | | 3,290,000 | | | | 3,290,000 |
| Pennsylvania Higher Edl. Facilities Auth. Rev.: | | | | | | |
| Participating VRDN: | | | | | | |
| Series Merlots 05 D6, 3.54% (Liquidity Facility Wachovia | | | | | | |
| Bank NA) (b)(d) | | 4,400,000 | | | | 4,400,000 |
| Series TOC 05 P, 3.55% (Liquidity Facility Goldman Sachs | | | | | | |
| Group, Inc.) (b)(d) | | 2,000,000 | | | | 2,000,000 |
| �� (Mount Aloysius College Proj.) Series L3, 3.56%, LOC Allied | | | | | | |
| Irish Banks PLC, VRDN (b) | | 2,600,000 | | | | 2,600,000 |
| Pennsylvania Hsg. Fin. Agcy.: | | | | | | |
| Participating VRDN: | | | | | | |
| Series LB 04 L80, 3.63% (Liquidity Facility Lehman | | | | | | |
| Brothers Hldgs., Inc.) (b)(c)(d) | | 2,890,000 | | | | 2,890,000 |
| Series MT 163, 3.58% (Liquidity Facility Merrill Lynch & | | | | | | |
| Co., Inc.) (b)(c)(d) | | 3,600,000 | | | | 3,600,000 |
| Series PA 1235, 3.58% (Liquidity Facility Merrill Lynch & | | | | | | |
| Co., Inc.) (b)(c)(d) | | 1,675,000 | | | | 1,675,000 |
| Series PA 930, 3.56% (Liquidity Facility Merrill Lynch & | | | | | | |
| Co., Inc.) (b)(c)(d) | | 4,995,000 | | | | 4,995,000 |
| Series PT 2190, 3.58% (Liquidity Facility Merrill Lynch & | | | | | | |
| Co., Inc.) (b)(c)(d) | | 7,515,000 | | | | 7,515,000 |
| Series PT 890, 3.58% (Liquidity Facility Merrill Lynch & | | | | | | |
| Co., Inc.) (b)(c)(d) | | 1,315,000 | | | | 1,315,000 |
See accompanying notes which are an integral part of the financial statements.
| Municipal Securities continued | | | | | | |
| | | Principal | | | | Value |
| | | Amount | | | | (Note 1) |
| Pennsylvania – continued | | | | | | |
| Pennsylvania Hsg. Fin. Agcy.: – continued | | | | | | |
| Participating VRDN: | | | | | | |
| Series Putters 1213, 3.58% (Liquidity Facility JPMorgan | | | | | | |
| Chase & Co.) (b)(c)(d) | | $ 2,390,000 | | $ | | 2,390,000 |
| Series 2004 84D, 3.57% (Liquidity Facility Dexia Cr. Local | | | | | | |
| de France), VRDN (b)(c) | | 10,635,000 | | | | 10,635,000 |
| Series 2004 85C, 3.42% (Liquidity Facility Landesbank | | | | | | |
| Hessen-Thuringen), VRDN (b)(c) | | 5,645,000 | | | | 5,645,000 |
| Pennsylvania Pub. School Bldg. Auth. School Rev. Participating | | | | | | |
| VRDN: | | | | | | |
| Series MS 958, 3.55% (Liquidity Facility Morgan | | | | | | |
| Stanley) (b)(d) | | 3,710,000 | | | | 3,710,000 |
| Series Stars 124, 3.54% (Liquidity Facility BNP Paribas | | | | | | |
| SA) (b)(d) | | 8,990,000 | | | | 8,990,000 |
| Pennsylvania Tpk. Commission Oil Franchise Tax Rev. | | | | | | |
| Participating VRDN Series ROC II R1005, 3.55% (Liquidity | | | | | | |
| Facility Citigroup Global Markets Hldgs., Inc.) (b)(d) | | 995,000 | | | | 995,000 |
| Pennsylvania Tpk. Commission Tpk. Rev. Bonds Series AAB 04 | | | | | | |
| 9, 3.54%, tender 1/6/06 (Liquidity Facility ABN-AMRO | | | | | | |
| Bank NV) (b)(d) | | 3,100,000 | | | | 3,100,000 |
| Philadelphia Arpt. Rev.: | | | | | | |
| Participating VRDN: | | | | | | |
| Series PT 3077, 3.59% (Liquidity Facility Merrill Lynch & | | | | | | |
| Co., Inc.) (b)(c)(d) | | 1,000,000 | | | | 1,000,000 |
| Series SG 118, 3.59% (Liquidity Facility Societe | | | | | | |
| Generale) (b)(c)(d) | | 2,600,000 | | | | 2,600,000 |
| Series 2005 C, 3.63% (MBIA Insured), VRDN (b)(c) | | 5,000,000 | | | | 5,000,000 |
| Philadelphia Auth. for Indl. Dev. Arpt. Rev. Participating | | | | | | |
| VRDN: | | | | | | |
| Series PA 882, 3.59% (Liquidity Facility Merrill Lynch & Co., | | | | | | |
| Inc.) (b)(c)(d) | | 2,200,000 | | | | 2,200,000 |
| Series Putters 217, 3.58% (Liquidity Facility JPMorgan Chase | | | | | | |
| Bank) (b)(c)(d) | | 7,715,000 | | | | 7,715,000 |
| Philadelphia Gas Works Rev. Participating VRDN: | | | | | | |
| Series 1998 104, 3.55% (Liquidity Facility Morgan | | | | | | |
| Stanley) (b)(d) | | 2,195,000 | | | | 2,195,000 |
| Series MS 906, 3.55% (Liquidity Facility Morgan | | | | | | |
| Stanley) (b)(d) | | 3,000,000 | | | | 3,000,000 |
| Series Putters 384, 3.55% (Liquidity Facility JPMorgan Chase | | | | | | |
| Bank) (b)(d) | | 3,000,000 | | | | 3,000,000 |
| Philadelphia Gen. Oblig. TRAN Series A, 4% 6/30/06 | | 16,685,000 | | | | 16,760,468 |
| Philadelphia Hosp. & Higher Ed. Facilities Auth. Health Sys. Rev. | | | | | | |
| Bonds (Jefferson Health Sys. Proj.) Series A, 5.5% 5/15/06 | | 2,045,000 | | | | 2,064,088 |
See accompanying notes which are an integral part of the financial statements.
27 Annual Report
| Fidelity Pennsylvania Municipal Money Market Fund | | | | |
| Investments continued | | | | | | | | |
| |
| Municipal Securities continued | | | | | | |
| | | | | Principal | | | | Value |
| | | | | Amount | | | | (Note 1) |
| Pennsylvania – continued | | | | | | | | |
| Philadelphia Redev. Auth. Rev. Participating VRDN Series DB | | | | | | |
| 134, 3.56% (Liquidity Facility Deutsche Bank AG) (b)(c)(d) $ | | 3,500,000 | | $ | | 3,500,000 |
| Philadelphia School District Participating VRDN: | | | | | | |
| Series EGL 7050036, 3.55% (Liquidity Facility Citibank | | | | | | |
| NA) (b)(d) | | | | 3,800,000 | | | | 3,800,000 |
| Series EGL 7050039, 3.55% (Liquidity Facility Citibank | | | | | | |
| NA) (b)(d) | | | | 3,000,000 | | | | 3,000,000 |
| Philadelphia Wtr. & Wastewtr. Rev. Participating VRDN: | | | | | | |
| Series MS 773, 3.55% (Liquidity Facility Morgan | | | | | | |
| Stanley) (b)(d) | | | | 2,000,000 | | | | 2,000,000 |
| Series SG 158, 3.54% (Liquidity Facility Societe | | | | | | |
| Generale) (b)(d) | | | | 1,200,000 | | | | 1,200,000 |
| Pittsburgh Gen. Oblig. Bonds Series 1996 A, 6% 3/1/06 | | | | | | |
| (MBIA Insured) | | | | 2,540,000 | | | | 2,552,379 |
| Pittsburgh Urban Redev. Auth. Single Family Mortgage Rev. | | | | | | |
| Participating VRDN Series PT 996, 3.58% (Liquidity Facility | | | | | | |
| Merrill Lynch & Co., Inc.) (b)(c)(d) | | | | 7,905,000 | | | | 7,905,000 |
| Schuylkill County Indl. Dev. Auth. Resource Recovery Rev. | | | | | | |
| (Northeastern Pwr. Co. Proj.) Series 1997 B, 3.85%, LOC | | | | | | |
| Dexia Cr. Local de France, VRDN (b)(c) | | | | 4,995,000 | | | | 4,995,000 |
| Scranton-Lackawanna Health & Welfare Auth. Rev. | | | | | | |
| Participating VRDN Series Merlots 02 A18, 3.54% (Liquidity | | | | | | |
| Facility Wachovia Bank NA) (b)(d) | | | | 2,550,000 | | | | 2,550,000 |
| Southcentral Pennsylvania Gen. Auth. Rev. (Hanover Lutheran | | | | | | |
| Village Proj.) 3.56%, LOC Manufacturers & Traders Trust | | | | | | |
| Co., VRDN (b) | | | | 3,700,000 | | | | 3,700,000 |
| Southeastern Pennsylvania Transit Auth. Spl. Rev. Participating | | | | | | |
| VRDN Series BS 01 9016 Class A, 3.58% (Liquidity Facility | | | | | | |
| Bear Stearns Companies, Inc.) (b)(d) | | | | 5,500,000 | | | | 5,500,000 |
| Temple Univ. of the Commonwealth Sys. of Higher Ed. BAN 4% | | | | | | |
| 4/28/06 | | | | 5,000,000 | | | | 5,019,173 |
| | | | | | | | | 401,341,108 |
| |
| |
| |
| |
| See accompanying notes which are an integral part of the financial statements. | | | | |
| |
| Annual Report | | 28 | | | | | | |
| Municipal Securities continued | | | | |
| | | | | Principal | | Value |
| | | | | Amount | | (Note 1) |
| Puerto Rico 1.3% | | | | | | |
| Puerto Rico Commonwealth Gen. Oblig. TRAN 4.5% | | | | |
| 7/28/06, LOC Bank of Nova Scotia, New York Agcy., LOC | | | | |
| BNP Paribas SA | | | | $ 2,900,000 | | $ 2,920,669 |
| Puerto Rico Govt. Dev. Bank 2.85% 1/30/06, LOC Societe | | | | |
| Generale, CP (a) | | | | 2,600,000 | | 2,600,000 |
| | | | | | | 5,520,669 |
| |
| TOTAL INVESTMENT PORTFOLIO 97.2% | | | | |
| (Cost $414,361,777) | | | | | | 414,361,777 |
| |
| NET OTHER ASSETS – 2.8% | | | | | | 12,025,426 |
| NET ASSETS 100% | | | | | | $ 426,387,203 |
| Security Type Abbreviations |
| BAN | | — | | BOND ANTICIPATION NOTE |
| CP | | — | | COMMERCIAL PAPER |
| TRAN | | — | | TAX AND REVENUE |
| | | | ANTICIPATION NOTE | | |
| VRDN | | — | | VARIABLE RATE DEMAND NOTE |
Legend
(a) Security exempt from registration under
Rule 144A of the Securities Act of 1933.
These securities may be resold in
transactions exempt from registration,
normally to qualified institutional buyers.
At the period end, the value of these
securities amounted to $2,600,000 or
0.6% of net assets.
(b) The coupon rate shown on floating or
adjustable rate securities represents the
rate at period end.
(c) Private activity obligations whose
interest is subject to the federal
alternative minimum tax for individuals.
|
(d) Provides evidence of ownership in one
or more underlying municipal bonds.
(e) Restricted securities – Investment in
securities not registered under the
Securities Act of 1933 (excluding 144A
issues). At the end of the period, the
value of restricted securities (excluding
144A issues) amounted to $5,340,000
or 1.3% of net assets.
|
Additional information on each holding is as follows:
| | | Acquisition | | |
| Security | | Date | | Cost |
| Allegheny County | | | | |
| Hosp. Dev. Auth. | | | | |
| Rev. Bonds Series | | | | |
| PT 762, 2.85%, | | | | |
| tender 6/15/06 | | | | |
| (Liquidity Facility | | | | |
| Landesbank | | 9/4/03 | | |
| Hessen Thuringen) | | 3/9/05 | | $ 5,340,000 |
Affiliated Central Funds
Information regarding income received by the fund from the affiliated Central funds during the period is as follows:
| Fund | | | | Income received |
| Fidelity Municipal Cash Central Fund | | | $ | 18,706 |
See accompanying notes which are an integral part of the financial statements.
29 Annual Report
Fidelity Pennsylvania Municipal Money Market Fund
Financial Statements
| Statement of Assets and Liabilities | | | | | | | | |
| | | | | | | December 31, 2005 |
| |
| Assets | | | | | | | | |
| Investment in securities, at value | | | | | | | | |
| See accompanying schedule: | | | | | | | | |
| Unaffiliated issuers (cost $414,361,777) | | | | | | $ | | 414,361,777 |
| Cash | | | | | | | | 5,549,793 |
| Receivable for fund shares sold | | | | | | | | 7,333,203 |
| Interest receivable | | | | | | | | 2,726,037 |
| Other receivables | | | | | | | | 39,007 |
| Total assets | | | | | | | | 430,009,817 |
| |
| Liabilities | | | | | | | | |
| Payable for fund shares redeemed | | $ | | 3,430,990 | | | | |
| Distributions payable | | | | 18,651 | | | | |
| Accrued management fee | | | | 172,074 | | | | |
| Other affiliated payables | | | | 899 | | | | |
| Total liabilities | | | | | | | | 3,622,614 |
| |
| Net Assets | | | | | | $ | | 426,387,203 |
| Net Assets consist of: | | | | | | | | |
| Paid in capital | | | | | | $ | | 426,239,673 |
| Undistributed net investment income | | | | | | | | 78,415 |
| Accumulated undistributed net realized gain (loss) on | | | | | | | | |
| investments | | | | | | | | 69,115 |
| Net Assets, for 426,282,498 shares outstanding | | | | | | $ | | 426,387,203 |
| Net Asset Value, offering price and redemption price per | | | | | | |
| share ($426,387,203 ÷ 426,282,498 shares) | | | | | | $ | | 1.00 |
See accompanying notes which are an integral part of the financial statements.
| Statement of Operations | | | | | | |
| | | | | Year ended December 31, 2005 |
| |
| Investment Income | | | | | | |
| Interest | | | | $ | | 9,065,499 |
| Income from affiliated Central Funds | | | | | | 18,706 |
| Total income | | | | | | 9,084,205 |
| |
| Expenses | | | | | | |
| Management fee | | $ | | 1,862,949 | | |
| Independent trustees’ compensation | | | | 1,652 | | |
| Total expenses before reductions | | | | 1,864,601 | | |
| Expense reductions | | | | (328,257) | | 1,536,344 |
| |
| Net investment income | | | | | | 7,547,861 |
| Realized and Unrealized Gain (Loss) | | | | | | |
| Net realized gain (loss) on: | | | | | | |
| Investment securities: | | | | | | |
| Unaffiliated issuers | | | | | | 92,353 |
| Net increase in net assets resulting from operations | | | | $ | | 7,640,214 |
See accompanying notes which are an integral part of the financial statements.
31 Annual Report
| Fidelity Pennsylvania Municipal Money Market Fund | | | | |
| Financial Statements continued | | | | | | | | |
| |
| Statement of Changes in Net Assets | | | | | | | | |
| | | | | Year ended | | | | Year ended |
| | | | | December 31, | | | | December 31, |
| | | | | 2005 | | | | 2004 |
| Increase (Decrease) in Net Assets | | | | | | | | |
| Operations | | | | | | | | |
| Net investment income | | $ | | 7,547,861 | | $ | | 2,477,211 |
| Net realized gain (loss) | | | | 92,353 | | | | (23,237) |
| Net increase in net assets resulting | | | | | | | | |
| from operations | | | | 7,640,214 | | | | 2,453,974 |
| Distributions to shareholders from net investment income . | | | | (7,509,743) | | | | (2,515,303) |
| Share transactions at net asset value of $1.00 per share | | | | | | | | |
| Proceeds from sales of shares | | | | 968,684,411 | | | | 592,486,036 |
| Reinvestment of distributions | | | | 7,419,506 | | | | 2,473,422 |
| Cost of shares redeemed | | | | (881,682,805) | | | | (557,374,245) |
| Net increase (decrease) in net assets and shares re- | | | | | | | | |
| sulting from share transactions | | | | 94,421,112 | | | | 37,585,213 |
| Total increase (decrease) in net assets | | | | 94,551,583 | | | | 37,523,884 |
| |
| Net Assets | | | | | | | | |
| Beginning of period | | | | 331,835,620 | | | | 294,311,736 |
| End of period (including undistributed net investment | | | | | | | | |
| income of $78,415 and undistributed net investment | | | | | | | | |
| income of $40,289, respectively) | | $ | | 426,387,203 | | $ | | 331,835,620 |
See accompanying notes which are an integral part of the financial statements.
| Financial Highlights | | | | | | | | | | | | | | | | | | | | |
| |
| Years ended December 31, | | | | 2005 | | | | 2004 | | | | 2003 | | | | 2002 | | | | 2001 |
| Selected Per Share Data | | | | | | | | | | | | | | | | | | | | |
| Net asset value, | | | | | | | | | | | | | | | | | | | | |
| beginning of period | | $ | | 1.00 | | $ | | 1.00 | | $ | | 1.00 | | $ | | 1.00 | | $ | | 1.00 |
| Income from Investment | | | | | | | | | | | | | | | | | | | | |
| Operations | | | | | | | | | | | | | | | | | | | | |
| Net investment income | | | | 020 | | | | .008 | | | | .006 | | | | .011 | | | | .025 |
| Distributions from net investment | | | | | | | | | | | | | | | | | | | | |
| income | | | | (.020) | | | | (.008) | | | | (.006) | | | | (.011) | | | | (.025) |
| Net asset value, end of period | | $ | | 1.00 | | $ | | 1.00 | | $ | | 1.00 | | $ | | 1.00 | | $ | | 1.00 |
| Total ReturnA,B | | | | 2.02% | | | | .81% | | | | .65% | | | | 1.09% | | | | 2.50% |
| Ratios to Average Net AssetsC | | | | | | | | | | | | | | | | | | | | |
| Expenses before reductions | | | | 50% | | | | .50% | | | | .50% | | | | .50% | | | | .50% |
| Expenses net of fee waivers, | | | | | | | | | | | | | | | | | | | | |
| if any | | | | 50% | | | | .50% | | | | .50% | | | | .50% | | | | .50% |
| Expenses net of all reductions | | | | 41% | | | | .48% | | | | .49% | | | | .46% | | | | .47% |
| Net investment income | | | | 2.02% | | | | .80% | | | | .66% | | | | 1.09% | | | | 2.45% |
| Supplemental Data | | | | | | | | | | | | | | | | | | | | |
| Net assets, end of period | | | | | | | | | | | | | | | | | | | | |
| (000 omitted) | | $ | | 426,387 | | $ | | 331,836 | | $ | | 294,312 | | $ | | 278,322 | | $ | | 240,705 |
A Total returns would have been lower had certain expenses not been reduced during the periods shown.
B Total returns do not include the effect of the former account closeout fee.
C Expense ratios reflect operating expenses of the fund. Expenses before reductions do not reflect amounts reimbursed by the investment adviser
or expense offset arrangements and do not represent the amount paid by the fund during periods when reimbursements or reductions occur.
Expenses net of fee waivers reflect expenses after reimbursement by the investment adviser but prior to reductions from expense offset arrange
ments. Expenses net of all reductions represent the net expenses paid by the fund.
|
See accompanying notes which are an integral part of the financial statements.
33 Annual Report
Notes to Financial Statements
For the period ended December 31, 2005
|
1. Significant Accounting Policies.
Fidelity Pennsylvania Municipal Income Fund (the income fund) is a fund of Fidelity Municipal Trust. Fidelity Pennsylvania Municipal Money Market Fund (the money market fund) is a fund of Fidelity Municipal Trust II. On July 21, 2005, the Board of Trustees approved a change in the name of Spartan Pennsylvania Municipal Income Fund to Fidelity Pennsylvania Municipal Income Fund effective August 15, 2005. Each trust is registered under the Investment Company Act of 1940, as amended (the 1940 Act), as an open end management investment company. Fidelity Municipal Trust and Fidelity Municipal Trust II (the trusts) are organized as a Massachusetts business trust and a Delaware statutory trust, respectively. Effective January 18, 2006, the shareholders of the income fund approved to change the fund from diversified to non diversified. Each fund is authorized to issue an unlimited number of shares. Each fund may be affected by economic and political developments in the state of Pennsylvania. Certain funds may invest in affiliated money market central funds (Money Market Central Funds) which are open end investment companies available to investment companies and other accounts managed by Fidelity Management & Research Company (FMR) and its affiliates. The financial statements have been prepared in conformity with accounting principles generally accepted in the United States of America, which require management to make certain estimates and assumptions at the date of the financial statements. The following summarizes the significant accounting policies of the income fund and the money market fund:
Security Valuation. Investments are valued and net asset value per share is calculated (NAV calculation) as of the close of business of the New York Stock Exchange, normally 4:00 p.m. Eastern time. Wherever possible, each fund uses independent pricing services approved by the Board of Trustees to value their investments. For the income fund, debt securities, including restricted securities, for which quotes are readily available, are valued by independent pricing services or by dealers who make markets in such securi ties. Pricing services consider yield or price of bonds of comparable quality, coupon, maturity and type as well as dealer supplied prices. When current market prices or quotations are not readily available or do not accurately reflect fair value, valuations may be determined in accordance with procedures adopted by the Board of Trustees. The frequency of when fair value pricing is used is unpredictable. The value of securities used for NAV calculation under fair value pricing may differ from published prices for the same securities. Investments in open end mutual funds are valued at their closing net asset value each business day. Short term securities with remaining maturities of sixty days or less for which quotations are not readily available are valued at amortized cost, which approximates value.
| 1. Significant Accounting Policies continued |
Security Valuation - continued | | |
As permitted by compliance with certain conditions under Rule 2a 7 of the 1940 Act, securities owned by the money market funds are valued at amortized cost which approximates value.
Investment Transactions and Income. Security transactions are accounted for as of trade date. Gains and losses on securities sold are determined on the basis of identified cost. Interest income is accrued as earned. Interest income includes coupon interest and amortization of premium and accretion of discount on debt securities.
Expenses. Most expenses of each trust can be directly attributed to a fund. Expenses which cannot be directly attributed are apportioned among each fund in the trust.
Income Tax Information and Distributions to Shareholders. Each year, each fund intends to qualify as a regulated investment company by distributing all of its taxable income and realized gains under Subchapter M of the Internal Revenue Code. As a result, no provision for income taxes is required in the accompanying financial statements.
Dividends are declared daily and paid monthly from net investment income. Distribu tions from realized gains, if any, are recorded on the ex dividend date. Income and capital gain distributions are determined in accordance with income tax regulations, which may differ from generally accepted accounting principles. In addition, each fund will claim a portion of the payment made to redeeming shareholders as a distribution for income tax purposes.
Capital accounts within the financial statements are adjusted for permanent book tax differences. These adjustments have no impact on net assets or the results of operations. Temporary book tax differences will reverse in a subsequent period.
Book tax differences are primarily due to futures transactions, market discount, deferred trustees compensation and losses deferred due to futures transactions and excise tax regulations.
The funds purchase municipal securities whose interest, in the opinion of the issuer, is free from federal income tax. There is no assurance that the Internal Revenue Service (IRS) will agree with this opinion. In the event the IRS determines that the issuer does not comply with relevant tax requirements, interest payments from a security could become federally taxable, possibly retroactively to the date the security was issued.
35 Annual Report
| Notes to Financial Statements continued | | |
1. Significant Accounting Policies continued | | |
Income Tax Information and Distributions to Shareholders continued |
The tax basis components of distributable earnings and the federal tax cost as of period end were as follows for each fund:
| | | Cost for Federal | | | | | | | | Net Unrealized |
| | | Income Tax | | Unrealized | | Unrealized | | Appreciation/ |
| | | Purposes | | Appreciation | | Depreciation | | (Depreciation) |
| Fidelity Pennsylvania | | | | | | | | | | | | | | |
| Municipal Income Fund | | $ | 290,978,261 | | | $ | | 11,227,270 | | | | $ | | (981,304) | | $ | | 10,245,966 |
| Fidelity Pennsylvania | | | | | | | | | | | | | | |
| Municipal Money Market | | | | | | | | | | | | | | |
| Fund | | | 414,361,777 | | | — | | | | — | | | | — |
| |
| | | | | | | | | | | | | Undistributed |
| | | | | | | | | Undistributed | | Long-term |
| | | | | | | | | Ordinary Income | | Capital Gain |
| Fidelity Pennsylvania Municipal Income Fund | | | | | | | | | | | | $ | | 10,405 | | $ | | — |
| Fidelity Pennsylvania Municipal Money Market Fund | | | | | | | | | | | | 79,313 | | | | — |
| |
| The tax character of distributions paid was as follows: | | | | | | | | |
| |
| December 31, 2005 | | | | | | | | | | | | | | |
| | | Tax-exempt | | Ordinary | | | | Long-term | | | | |
| | | Income | | Income | | | | Capital Gains | | | | Total |
| Fidelity Pennsylvania | | | | | | | | | | | | | | |
| Municipal Income Fund | | $ | 12,342,980 | | | $ | | — | | | | $ | | 2,072,399 | | $ | | 14,415,379 |
| Fidelity Pennsylvania | | | | | | | | | | | | | | |
| Municipal Money | | | | | | | | | | | | | | |
| Market Fund | | | 7,509,743 | | | — | | | | — | | | | 7,509,743 |
| |
| December 31, 2004 | | | | | | | | | | | | | | |
| | | Tax-exempt | | Ordinary | | | | Long-term | | | | |
| | | Income | | Income | | | | Capital Gains | | | | Total |
| Fidelity Pennsylvania | | | | | | | | | | | | | | |
| Municipal Income Fund | | $ | 11,909,386 | | | $ | | 9,602 | | | | $ | | 1,271,017 | | $ | | 13,190,005 |
| Fidelity Pennsylvania | | | | | | | | | | | | | | |
| Municipal Money | | | | | | | | | | | | | | |
| Market Fund | | | 2,515,303 | | | — | | | | — | | | | 2,515,303 |
Short Term Trading (Redemption) Fees. Shares held in the income fund less than 30 days are subject to a redemption fee equal to .50% of the proceeds of the redeemed shares. All redemption fees, including any estimated redemption fees paid by FMR, are retained by the fund and accounted for as an addition to paid in capital.
Annual Report 36
Delayed Delivery Transactions and When Issued Securities. Certain funds may purchase or sell securities on a delayed delivery or when issued basis. Payment and delivery may take place after the customary settlement period for that security. The price of the underlying securities and the date when the securities will be delivered and paid for are fixed at the time the transaction is negotiated. During the time a delayed delivery sell is outstanding, the contract is marked to market daily and equivalent deliverable securities are held for the transaction. The value of the securities purchased on a delayed delivery or when issued basis are identified as such in each applicable fund’s Schedule of Investments. Certain funds may receive compensation for interest forgone in the purchase of a delayed delivery or when issued security. With respect to purchase commitments, each applicable fund identifies securities as segregated in its records with a value at least equal to the amount of the commitment. Losses may arise due to changes in the value of the underlying securities or if the counterparty does not perform under the contract’s terms, or if the issuer does not issue the securities due to political, economic, or other factors.
Futures Contracts. The income fund may use futures contracts to manage its exposure to the bond market and to fluctuations in interest rates. Buying futures tends to increase a fund’s exposure to the underlying instrument, while selling futures tends to decrease a fund’s exposure to the underlying instrument or hedge other fund investments. Upon entering into a futures contract, a fund is required to cover initial margin requirements by depositing collateral with a futures commission merchant. The initial margin may be in the form of cash or securities and is transferred to a segregated account on settlement date. Subsequent payments (“variation margin”) are made or received by a fund depend ing on the daily fluctuations in the value of the futures contract and are accounted for as unrealized gains or losses. Realized gains (losses) are recorded upon the expiration or closing of the futures contracts. Losses may arise from changes in the value of the underlying instruments or if the counterparties do not perform under the contract’s terms. Futures contracts are valued at the settlement price established each day by the board of trade or exchange on which they are traded.
Restricted Securities. Certain funds may invest in securities that are subject to legal or contractual restrictions on resale. These securities generally may be resold in transac tions exempt from registration or to the public if the securities are registered. Disposal of these securities may involve time consuming negotiations and expense, and prompt sale at an acceptable price may be difficult. Information regarding restricted securities is included at the end of each applicable fund’s Schedule of Investments.
Swap Agreements. The income fund may invest in swaps for the purpose of managing its exposure to interest rate, credit or market risk.
37 Annual Report
| Notes to Financial Statements continued |
2. Operating Policies continued |
Swap Agreements continued |
Interest rate swaps are agreements to exchange cash flows periodically based on a notional principal amount, for example, the exchange of fixed rate interest payments for floating rate interest payments. The primary risk associated with interest rate swaps is that unfavorable changes in the fluctuation of interest rates could adversely impact the fund.
Swaps are marked to market daily based on dealer supplied valuations and changes in value are recorded as unrealized appreciation (depreciation). Gains or losses are realized upon early termination of the swap agreement. Collateral, in the form of cash or securities, may be required to be held in segregated accounts with the fund’s custodian in compliance with swap contracts.
3. Purchases and Sales of Investments.
Purchases and sales of securities, other than short term securities and U.S. government securities, for the income fund aggregated $90,912,705 and $78,292,916, respectively.
4. Fees and Other Transactions with Affiliates.
Management Fee. FMR and its affiliates provide the income fund with investment management related services for which the fund pays a monthly management fee. The management fee is the sum of an individual fund fee rate that is based on an annual rate of .25% of the fund’s average net assets and a group fee rate that averaged .12% during the period. The group fee rate is based upon the average net assets of all the mutual funds advised by FMR. The group fee rate decreases as assets under management increase and increases as assets under management decrease. For the period, the total annual man agement fee rate was .37% of the fund’s average net assets.
FMR and its affiliates provide the money market fund with investment management related services for which the fund pays a monthly management fee that is based on an annual rate of .50% of the fund’s average net assets. FMR pays all other expenses, except the compensation of the independent Trustees and certain exceptions such as interest expense. The management fee paid to FMR by the fund is reduced by an amount equal to the fees and expenses paid by the fund to the independent Trustees.
Transfer Agent and Accounting Fees. Citibank, N.A. (Citibank) is the custodian, transfer agent and shareholder servicing agent for the income fund. Citibank has entered into a sub arrangement with Fidelity Service Company, Inc. (FSC), an affiliate of FMR, under which FSC performs the activities associated with the fund’s transfer and share holder servicing agent and accounting functions. The fund pays account fees and asset based fees that vary according to account size and type of account. FSC pays for typesetting,
| 4. Fees and Other Transactions with Affiliates continued |
Transfer Agent and Accounting Fees continued | | |
printing and mailing of shareholder reports, except proxy statements. The accounting fee is based on the level of average net assets for the month. For the period, the transfer agent fees were equivalent to the following annual rates expressed as a percentage of average net assets:
| Fidelity Pennsylvania Municipal Income Fund | | .08% |
Affiliated Central Funds. Certain funds may invest in Money Market Central Funds which seek preservation of capital and current income and are managed by Fidelity Investments Money Management, Inc. (FIMM) an affiliate of FMR.
The Money Market Central Funds do not pay a management fee.
5. Committed Line of Credit.
The income fund participates with other funds managed by FMR in a $4.2 billion credit facility (the “line of credit”) to be utilized for temporary or emergency purposes to fund shareholder redemptions or for other short term liquidity purposes. The participating funds have agreed to pay commitment fees on their pro rata portion of the line of credit. During the period, there were no borrowings on this line of credit.
6. Expense Reductions.
Through arrangements with the income fund’s custodian, credits realized as a result of uninvested cash balances were used to reduce fund expenses. These expense reductions are noted in the table below.
| | | | | | | | | Transfer | | | | |
| | | | | Custody | | | | Agent | | | | Accounting |
| | | | | expense | | | | expense | | | | expense |
| | | | | reduction | | | | reduction | | | | reduction |
| |
| Fidelity Pennsylvania Municipal | | | | | | | | | | | | |
| Income Fund | | | $ | 5,149 | | | $ | 145,121 | | | $ | — |
In addition, through an arrangement with the money market fund’s custodian and transfer agent, $328,257 of credits realized as a result of uninvested cash balances were used to reduce the fund’s management fee.
39 Annual Report
| Notes to Financial Statements continued |
7. Other. | | |
The funds’ organizational documents provide former and current trustees and officers with a limited indemnification against liabilities arising in connection with the perfor mance of their duties to the funds. In the normal course of business, the funds may also enter into contracts that provide general indemnifications. The funds’ maximum exposure under these arrangements is unknown as this would be dependent on future claims that may be made against the funds. The risk of material loss from such claims is considered remote.
Report of Independent Registered Public Accounting Firm
To the Trustees of Fidelity Municipal Trust and Fidelity Municipal Trust II and the Shareholders of Fidelity Pennsylvania Municipal Income Fund (formerly Spartan Pennsylvania Municipal Income Fund) and Fidelity Pennsylvania Municipal Money Market Fund:
In our opinion, the accompanying statements of assets and liabilities, including the schedules of investments, and the related statements of operations and of changes in net assets and the financial highlights present fairly, in all material respects, the financial position of Fidelity Pennsylvania Municipal Income Fund (formerly Spartan Pennsyl vania Municipal Income Fund) (a fund of Fidelity Municipal Trust) and Fidelity Pennsylvania Municipal Money Market Fund (a fund of Fidelity Municipal Trust II) at December 31, 2005 and the results of their operations, the changes in their net assets and the financial highlights for the periods indicated, in conformity with accounting principles generally accepted in the United States of America. These financial statements and financial highlights (hereafter referred to as “financial statements”) are the responsibility of the Fidelity Municipal Trust’s and Fidelity Municipal Trust II’s management; our responsibility is to express an opinion on these financial statements based on our audits. We conducted our audits of these financial statements in accordance with the standards of the Public Company Accounting Oversight Board (United States). Those standards require that we plan and perform the audit to obtain reasonable assurance about whether the financial statements are free of material misstatement. An audit includes examining, on a test basis, evidence supporting the amounts and disclosures in the financial state ments, assessing the accounting principles used and significant estimates made by management, and evaluating the overall financial statement presentation. We believe that our audits, which included confirmation of securities at December 31, 2005 by correspondence with the custodian and brokers, provide a reasonable basis for our opinion.
/s/ PricewaterhouseCoopers LLP
PricewaterhouseCoopers LLP
Boston, Massachusetts
February 7, 2006
|
41 Annual Report
Trustees and Officers
The Trustees, Member of the Advisory Board, and executive officers of the trusts and funds, as applicable, are listed below. The Board of Trustees governs each fund and is responsible for protecting the interests of shareholders. The Trustees are experienced executives who meet periodically throughout the year to oversee each fund’s activities, review contractual arrangements with companies that provide services to each fund, and review each fund’s performance. Except for William O. McCoy, and Albert R. Gamper, Jr., each of the Trustees oversees 326 funds advised by FMR or an affiliate. Mr. McCoy oversees 328 funds advised by FMR or an affiliate. Mr. Gamper oversees 235 funds advised by FMR or an affiliate.
The Trustees hold office without limit in time except that (a) any Trustee may resign; (b) any Trustee may be removed by written instrument, signed by at least two thirds of the number of Trustees prior to such removal; (c) any Trustee who requests to be retired or who has become incapacitated by illness or injury may be retired by written instru ment signed by a majority of the other Trustees; and (d) any Trustee may be removed at any special meeting of shareholders by a two thirds vote of the outstanding voting securities of the trust. Each Trustee who is not an interested person (as defined in the 1940 Act) (Independent Trustee), shall retire not later than the last day of the calendar year in which his or her 72nd birthday occurs. The Independent Trustees may waive this mandatory retirement age policy with respect to individual Trustees. The executive officers and Advisory Board Member hold office without limit in time, except that any officer and Advisory Board Member may resign or may be removed by a vote of a majority of the Trustees at any regular meeting or any special meeting of the Trustees. Except as indicated, each individual has held the office shown or other offices in the same company for the past five years.
The funds’ Statement of Additional Information (SAI) includes more information about the Trustees. To request a free copy, call Fidelity at 1-800-544-8544.
Correspondence intended for each Trustee who is an interested person may be sent to Fidelity Investments, 82 Devonshire Street, Boston, Massachusetts 02109.
| | Name, Age; Principal Occupation
Edward C. Johnson 3d (75)
|
Year of Election or Appointment: 1984 or 1991
Trustee of Fidelity Municipal Trust (1984) and Fidelity Municipal Trust II (1991). Mr. Johnson is Chairman of the Board of Trustees. Mr. Johnson serves as Chief Executive Officer, Chairman, and a Director of FMR Corp.; a Director and Chairman of the Board and of the Executive Committee of FMR; Chairman and a Director of Fidelity Management & Research (Far East) Inc.; Chairman and a Director of Fidelity Investments Money Management, Inc.; and Chairman (2001 present) and a Director (2000 present) of FMR Co., Inc.
| | Name, Age; Principal Occupation
Stephen P. Jonas (52)
|
Year of Election or Appointment: 2005
Mr. Jonas is Senior Vice President of Pennsylvania Municipal Money Market (2005 present) and Pennsylvania Municipal Income (2005 present). He also serves as Senior Vice President of other Fidelity funds (2005 present). Mr. Jonas is Executive Director of FMR (2005 present). Previously, Mr. Jonas served as President of Fidelity Enterprise Operations and Risk Services (2004 2005), Chief Adminis trative Officer (2002 2004), and Chief Financial Officer of FMR Co. (1998 2000). Mr. Jonas has been with Fidelity Investments since 1987 and has held various financial and management positions including Chief Financial Officer of FMR. In addition, he serves on the Boards of Boston Ballet (2003 present) and Simmons College (2003 present).
Year of Election or Appointment: 2003
Mr. Reynolds is a Director (2003 present) and Chief Operating Officer (2002 present) of FMR Corp. He also serves on the Board at Fidelity Investments Canada, Ltd. (2000 present). Previously, Mr. Reynolds served as President of Fidelity Investments Institutional Retirement Group (1996 2000).
* Trustees have been determined to be “Interested Trustees” by virtue of, among other things, their affiliation with the trusts or various entities under common control with FMR.
43 Annual Report
Trustees and Officers - continued
Independent Trustees:
Correspondence intended for each Independent Trustee (that is, the Trustees other than the Interested Trustees) may be sent to Fidelity Investments, P.O. Box 55235, Boston, Massachusetts 02205 5235.
| | Name, Age; Principal Occupation
Dennis J. Dirks (57)
|
Year of Election or Appointment: 2005
Prior to his retirement in May 2003, Mr. Dirks was Chief Operating Officer and a member of the Board of The Depository Trust & Clearing Corporation (DTCC) (1999 2003). He also served as President, Chief Operating Officer, and Board member of The Depository Trust Company (DTC) (1999 2003) and President and Board member of the National Securities Clearing Corporation (NSCC) (1999 2003). In addition, Mr. Dirks served as Chief Executive Officer and Board member of the Government Securities Clearing Corporation (2001 2003) and Chief Executive Officer and Board member of the Mortgage Backed Securities Clearing Corporation (2001 2003). Mr. Dirks also serves as a Trustee of Manhattan College (2005 present).
| | Albert R. Gamper, Jr. (63)
|
Year of Election or Appointment: 2006
Mr. Gamper also serves as a Trustee (2006 present) or Member of the Advisory Board (2005 present) of other investment companies advised by FMR. Prior to his retirement in December 2004, Mr. Gamper served as Chairman of the Board of CIT Group Inc. (commercial finance). During his tenure with CIT Group Inc. Mr. Gamper served in numerous senior management positions, including Chairman (1987 1989; 1999 2001; 2002 2004), Chief Executive Officer (1987 2004), and President (1989 2002). He currently serves as a member of the Board of Directors of Public Service Enterprise Group (utilities, 2001 present), Chairman of the Board of Governors, Rutgers University (2004 present), and Chairman of the Board of Saint Barnabas Health Care System.
Name, Age; Principal Occupation
Robert M. Gates (62)
|
Year of Election or Appointment: 1997
Dr. Gates is Chairman of the Independent Trustees (2006 present). Dr. Gates is President of Texas A&M University (2002 present). He was Director of the Central Intelligence Agency (CIA) from 1991 to 1993. From 1989 to 1991, Dr. Gates served as Assistant to the President of the United States and Deputy National Security Advisor. Dr. Gates is a Director of NACCO Industries, Inc. (mining and manufacturing), Parker Drilling Co., Inc. (drilling and rental tools for the energy industry, 2001 present), and Brinker International (restaurant management, 2003 present). Previously, Dr. Gates served as a Director of LucasVarity PLC (automotive components and diesel engines), a Director of TRW Inc. (automotive, space, defense, and information technology), and Dean of the George Bush School of Government and Public Service at Texas A&M University (1999 2001). Dr. Gates also is a Trustee of the Forum for International Policy.
Year of Election or Appointment: 2004
Dr. Heilmeier is Chairman Emeritus of Telcordia Technologies (commu nication software and systems), where prior to his retirement, he served as company Chairman and Chief Executive Officer. He currently serves on the Boards of Directors of The Mitre Corporation (systems engineer ing and information technology support for the government), and HRL Laboratories (private research and development, 2004 present). He is Chairman of the General Motors Science & Technology Advisory Board and a Life Fellow of the Institute of Electrical and Electronics Engineers (IEEE) (2000 present). Dr. Heilmeier is a member of the Defense Science Board and the National Security Agency Advisory Board. He is also a member of the National Academy of Engineering, the American Academy of Arts and Sciences, and the Board of Overseers of the School of Engineering and Applied Science of the University of Pennsylvania. Previously, Dr. Heilmeier served as a Director of TRW Inc. (automotive, space, defense, and information technology, 1992 2002), Compaq (1994 2002), Automatic Data Processing, Inc. (ADP) (technology based business outsourcing, 1995 2002), INET Technologies Inc. (telecommu nications network surveillance, 2001 2004), and Teletech Holdings (customer management services). He is the recipient of the 2005 Kyoto Prize in Advanced Technology for his invention of the liquid display.
45 Annual Report
Trustees and Officers - continued
| | Name, Age; Principal Occupation
Marie L. Knowles (59)
|
Year of Election or Appointment: 2001
Prior to Ms. Knowles’ retirement in June 2000, she served as Executive Vice President and Chief Financial Officer of Atlantic Richfield Company (ARCO) (diversified energy, 1996 2000). From 1993 to 1996, she was a Senior Vice President of ARCO and President of ARCO Transportation Company. She served as a Director of ARCO from 1996 to 1998. She currently serves as a Director of Phelps Dodge Corporation (copper mining and manufacturing) and McKesson Corporation (healthcare ser vice, 2002 present). Ms. Knowles is a Trustee of the Brookings Institution and the Catalina Island Conservancy and also serves as a member of the Advisory Board for the School of Engineering of the University of Southern California.
Year of Election or Appointment: 2000
Mr. Lautenbach has been a partner of Clayton, Dubilier & Rice, Inc. (private equity investment firm) since September 1998. Previously, Mr. Lautenbach was with the International Business Machines Corpora tion (IBM) from 1968 until his retirement in 1998. Mr. Lautenbach serves as a Director of Italtel Holding S.p.A. (telecommunications (Milan, Italy), 2004 present) and Eaton Corporation (diversified industrial) as well as the Philharmonic Center for the Arts in Naples, Florida. He also is a member of the Board of Trustees of Fairfield University (2005 present), as well as a member of the Council on Foreign Relations.
Year of Election or Appointment: 1997
Prior to his retirement in December 1994, Mr. McCoy was Vice Chair man of the Board of BellSouth Corporation (telecommunications) and President of BellSouth Enterprises. He is currently a Director of Liberty Corporation (holding company), Duke Realty Corporation (real estate), and Progress Energy, Inc. (electric utility). He is also a partner of Frank lin Street Partners (private investment management firm) and a member of the Research Triangle Foundation Board. In addition, Mr. McCoy served as the Interim Chancellor (1999 2000) and a member of the Board of Visitors for the University of North Carolina at Chapel Hill and currently serves on the Board of Directors of the University of North Carolina Health Care System and the Board of Visitors of the Kenan Flagler Business School (University of North Carolina at Chapel Hill). He also served as Vice President of Finance for the University of North Carolina (16 school system).
Name, Age; Principal Occupation
Cornelia M. Small (61)
|
Year of Election or Appointment: 2005
Ms. Small is a member (2000 present) and Chairperson (2002 present) of the Investment Committee, and a member (2002 present) of the Board of Trustees of Smith College. Previously, she served as Chief Investment Officer (1999 2000), Director of Global Equity Investments (1996 1999), and a member of the Board of Directors of Scudder, Stevens & Clark (1990 1997) and Scudder Kemper Investments (1997 1998). In addition, Ms. Small served as Co Chair (2000 2003) of the Annual Fund for the Fletcher School of Law and Diplomacy.
William S. Stavropoulos (66)
|
Year of Election or Appointment: 2001 or 2002
Trustee of Fidelity Municipal Trust (2002) and Fidelity Municipal Trust II (2001). Mr. Stavropoulos is Chairman of the Board (2000 present) and a Member of the Board of Directors of The Dow Chemical Company. Since joining The Dow Chemical Company in 1967, Mr. Stavropoulos served in numerous senior management positions, including President (1993 2000; 2002 2003), CEO (1995 2000; 2002 2004), and Chair man of the Executive Committee (2000 2004). Currently, he is a Direc tor of NCR Corporation (data warehousing and technology solutions), BellSouth Corporation (telecommunications), Chemical Financial Corpo ration, Maersk Inc. (industrial conglomerate, 2002 present), and Metal mark Capital (private equity investment firm, 2005 present). He also serves as a member of the Board of Trustees of the American Enterprise Institute for Public Policy Research. In addition, Mr. Stavropoulos is a member of The Business Council, J.P. Morgan International Council and the University of Notre Dame Advisory Council for the College of Science.
Year of Election or Appointment: 2005
Prior to his retirement in 2001, Mr. Wolfe was Chairman and Chief Executive Officer of Hershey Foods Corporation (1993 2001). He cur rently serves as a member of the boards of Adelphia Communications Corporation (2003 present), Bausch & Lomb, Inc., and Revlon Inc. (2004 present).
47 Annual Report
Trustees and Officers - continued
Advisory Board Member and Executive Officers:
Correspondence intended for each executive officer and Mr. Lynch may be sent to Fidelity Investments, 82 Devonshire Street, Boston, Massachusetts 02109.
| | Name, Age; Principal Occupation
Peter S. Lynch (61)
|
Year of Election or Appointment: 2003
Member of the Advisory Board of Fidelity Municipal Trust and Fidelity Municipal Trust II. Vice Chairman and a Director of FMR, and Vice Chairman (2001 present) and a Director (2000 present) of FMR Co., Inc. Previously, Mr. Lynch served as a Trustee of the Fidelity funds (1990 2003). In addition, he serves as a Trustee of Boston College, Massachusetts Eye & Ear Infirmary, Historic Deerfield, John F. Kennedy Library, and the Museum of Fine Arts of Boston.
Year of Election or Appointment: 2005
Vice President of Pennsylvania Municipal Money Market and Pennsylva nia Municipal Income. Mr. Donovan also serves as Vice President of Fidelity’s High Income Funds (2005 present), Fidelity’s Fixed Income Funds (2005 present), certain Asset Allocation Funds (2005 present), and certain Balanced Funds (2005 present). Mr. Donovan also serves as Executive Vice President of FMR (2005 present) and FMRC (2005 present). Previously, Mr. Donovan served as Vice President and Director of Fidelity’s International Equity Trading group (1998 2005).
Year of Election or Appointment: 2005
Vice President of Pennsylvania Municipal Money Market. Mr. Morrison also serves as Vice President of Fidelity’s Money Market Funds (2005 present) and certain Asset Allocation Funds (2002 present). Previously, he served as Vice President of Fidelity’s Bond Funds (2002 2005) and certain Balanced Funds (2002 2005). He served as Vice President (2002 2005) and Bond Group Leader (2002 2005) of Fidelity Investments Fixed Income Division. Mr. Morrison is also Vice Presi dent of FIMM (2002 present) and FMR (2002 present). Mr. Morrison joined Fidelity Investments in 1987 as a Corporate Bond Analyst in the Fixed Income Research Division.
Name, Age; Principal Occupation
David L. Murphy (57)
|
Year of Election or Appointment: 2002 or 2005
Vice President of Pennsylvania Municipal Money Market (2002) and Pennsylvania Municipal Income (2005). Mr. Murphy also serves as Vice President of Fidelity’s Money Market Funds (2002 present), certain Asset Allocation Funds (2003 present), Fidelity’s Investment Grade Bond Funds (2005 present), and Fidelity’s Balanced Funds (2005 present). He serves as Senior Vice President (2000 present) and Head (2004 present) of the Fidelity Investments Fixed Income Division. Mr. Murphy is also a Senior Vice President of FIMM (2003 present) and a Vice President of FMR (2000 present). Previously, Mr. Murphy served as Money Market Group Leader (2002 2004), Bond Group Leader (2000 2002), and Vice Presi dent of Fidelity’s Taxable Bond Funds (2000 2002) and Fidelity’s Munici pal Bond Funds (2001 2002). Mr. Murphy joined Fidelity Investments in 1989 as a portfolio manager in the Bond Group.
Year of Election or Appointment: 2005
Vice President of Pennsylvania Municipal Income. Mr. Silvia also serves as Vice President of Fidelity’s Bond Funds (2005 present), certain Bal anced Funds (2005 present), certain Asset Allocation Funds (2005 pres ent), and Senior Vice President and Bond Group Leader of the Fidelity Investments Fixed Income Division (2005 present). Previously, Mr. Silvia served as Director of Fidelity’s Taxable Bond portfolio managers (2002 2004) and a portfolio manager in the Bond Group (1997 2004).
Year of Election or Appointment: 2002
Vice President of Pennsylvania Municipal Income. Mr. Sommer also serves as Vice President of other funds advised by FMR. Prior to assuming his current responsibilities, Mr. Sommer worked as an analyst and manager.
49 Annual Report
Trustees and Officers - continued
| | Name, Age; Principal Occupation
Michael Widrig (42)
|
Year of Election or Appointment: 2003
Vice President of Pennsylvania Municipal Money Market. Mr. Widrig also serves as Vice President of other funds advised by FMR. Prior to assuming his current responsibilities, Mr. Widrig worked as an analyst and manager.
Year of Election or Appointment: 1998
Secretary of Pennsylvania Municipal Money Market and Pennsylvania Municipal Income. He also serves as Secretary of other Fidelity funds; Vice President, General Counsel, and Secretary of FMR Co., Inc. (2001 present) and FMR; Assistant Secretary of Fidelity Management & Research (U.K.) Inc. (2001 present), Fidelity Management & Research (Far East) Inc. (2001 present), and Fidelity Investments Money Manage ment, Inc. (2001 present). Mr. Roiter is an Adjunct Member, Faculty of Law, at Boston College Law School (2003 present). Previously, Mr. Roiter served as Vice President and Secretary of Fidelity Distributors Corporation (FDC) (1998 2005).
Year of Election or Appointment: 2003
Assistant Secretary of Pennsylvania Municipal Money Market and Penn sylvania Municipal Income. Mr. Fross also serves as Assistant Secretary of other Fidelity funds (2003 present), Vice President and Secretary of FDC (2005 present), and is an employee of FMR.
Year of Election or Appointment: 2004
President, Treasurer, and Anti Money Laundering (AML) officer of Penn sylvania Municipal Money Market and Pennsylvania Municipal Income. Ms. Reynolds also serves as President, Treasurer, and AML officer of other Fidelity funds (2004) and is a Vice President (2003) and an employee (2002) of FMR. Before joining Fidelity Investments, Ms. Reynolds worked at PricewaterhouseCoopers LLP (PwC) (1980 2002), where she was most recently an audit partner with PwC’s investment management practice.
Year of Election or Appointment: 2005
Chief Financial Officer of Pennsylvania Municipal Money Market and Pennsylvania Municipal Income. Mr. Murphy also serves as Chief Financial Officer of other Fidelity funds (2005 present). He also serves as Senior Vice President of Fidelity Pricing and Cash Management Services Group (FPCMS).
Name, Age; Principal Occupation
Kenneth A. Rathgeber (58)
|
Year of Election or Appointment: 2004
Chief Compliance Officer of Pennsylvania Municipal Money Market and Pennsylvania Municipal Income. Mr. Rathgeber also serves as Chief Compliance Officer of other Fidelity funds (2004) and Executive Vice President of Risk Oversight for Fidelity Investments (2002). Previously, he served as Executive Vice President and Chief Operating Officer for Fidelity Investments Institutional Services Company, Inc. (1998 2002).
Year of Election or Appointment: 2003
Deputy Treasurer of Pennsylvania Municipal Money Market and Pennsyl vania Municipal Income. Mr. Hebble also serves as Deputy Treasurer of other Fidelity funds (2003), and is an employee of FMR. Before joining Fidelity Investments, Mr. Hebble worked at Deutsche Asset Management where he served as Director of Fund Accounting (2002 2003) and Assistant Treasurer of the Scudder Funds (1998 2003).
Year of Election or Appointment: 2005
Deputy Treasurer of Pennsylvania Municipal Money Market and Pennsyl vania Municipal Income. Mr. Mehrmann also serves as Deputy Treasurer of other Fidelity funds (2005 present) and is an employee of FMR. Pre viously, Mr. Mehrmann served as Vice President of Fidelity Investments Institutional Services Group (FIIS)/Fidelity Investments Institutional Operations Corporation, Inc. (FIIOC) Client Services (1998 2004).
Kimberley H. Monasterio (42)
|
Year of Election or Appointment: 2004
Deputy Treasurer of Pennsylvania Municipal Money Market and Pennsyl vania Municipal Income. Ms. Monasterio also serves as Deputy Treasurer of other Fidelity funds (2004) and is an employee of FMR (2004). Before joining Fidelity Investments, Ms. Monasterio served as Treasurer (2000 2004) and Chief Financial Officer (2002 2004) of the Franklin Templeton Funds and Senior Vice President of Franklin Templeton Services, LLC (2000 2004).
51 Annual Report
Trustees and Officers - continued
| | Name, Age; Principal Occupation
Kenneth B. Robins (36)
|
Year of Election or Appointment: 2005
Deputy Treasurer of Pennsylvania Municipal Money Market and Penn sylvania Municipal Income. Mr. Robins also serves as Deputy Treasurer of other Fidelity funds (2005 present) and is an employee of FMR (2004 present). Before joining Fidelity Investments, Mr. Robins worked at KPMG LLP, where he was a partner in KPMG’s department of professional practice (2002 2004) and a Senior Manager (1999 2000). In addition, Mr. Robins served as Assistant Chief Accountant, United States Securities and Exchange Commission (2000 2002).
Year of Election or Appointment: 2005
Assistant Treasurer of Pennsylvania Municipal Money Market and Penn sylvania Municipal Income. Mr. Byrnes also serves as Assistant Treasurer of other Fidelity funds (2005 present) and is an employee of FMR (2005 present). Previously, Mr. Byrnes served as Vice President of FPCMS (2003 2005). Before joining Fidelity Investments, Mr. Byrnes worked at Deutsche Asset Management where he served as Vice President of the Investment Operations Group (2000 2003).
Year of Election or Appointment: 1986
Assistant Treasurer of Pennsylvania Municipal Money Market and Pennsylvania Municipal Income. Mr. Costello also serves as Assistant Treasurer of other Fidelity funds and is an employee of FMR.
Year of Election or Appointment: 2004
Assistant Treasurer of Pennsylvania Municipal Money Market and Pennsylvania Municipal Income. Mr. Lydecker also serves as Assistant Treasurer of other Fidelity funds (2004) and is an employee of FMR.
Year of Election or Appointment: 2002
Assistant Treasurer of Pennsylvania Municipal Money Market and Pennsylvania Municipal Income. Mr. Osterheld also serves as Assistant Treasurer of other Fidelity funds (2002) and is an employee of FMR.
Year of Election or Appointment: 2005
Assistant Treasurer of Pennsylvania Municipal Money Market and Pennsylvania Municipal Income. Mr. Ryan also serves as Assistant Treasurer of other Fidelity funds (2005 present) and is an employee of FMR (2005 present). Previously, Mr. Ryan served as Vice President of Fund Reporting in FPCMS (1999 2005).
Name, Age; Principal Occupation
Salvatore Schiavone (40)
|
Year of Election or Appointment: 2005
Assistant Treasurer of Pennsylvania Municipal Money Market and Pennsylvania Municipal Income. Mr. Schiavone also serves as Assistant Treasurer of other Fidelity funds (2005 present) and is an employee of FMR (2005 present). Before joining Fidelity Investments, Mr. Schiavone worked at Deutsche Asset Management, where he most recently served as Assistant Treasurer (2003 2005) of the Scudder Funds and Vice President and Head of Fund Reporting (1996 2003).
53 Annual Report
The funds hereby designate as capital gain dividends the amounts noted below for the taxable year indicated or for dividends for the taxable year ended 2005, if subse quently determined to be different, the net capital gain of such year.
| Fund | | December 31, 2005 |
| Fidelity Pennsylvania Municipal Income Fund | | $2,080,789 |
| Fidelity Pennsylvania Municipal Money Market Fund | | 69,115 |
During fiscal year ended 2005, 100% of each fund’s income dividends were free from federal income tax, and 13.39% and 59.51% of Fidelity Pennsylvania Municipal Income Fund and Fidelity Pennsylvania Municipal Money Market Fund’s income dividends were subject to the federal alternative minimum tax.
The fund will notify shareholders in January 2006 of amounts for use in preparing 2005 income tax returns.
Proxy Voting Results
A special meeting of Fidelity Pennsylvania Municipal Money Market Fund’s shareholders was held on January 18, 2006. The results of votes taken among shareholders on the proposal before them are reported below. Each vote reported represents one dollar of net asset value held on the record date for the meeting.
| PROPOSAL 1 | | | | |
| To elect a Board of Trustees.A | | |
| | | # of | | % of |
| | | Votes | | Votes |
| |
| Dennis J. Dirks | | | | |
| Affirmative | | 667,201,902.33 | | 95.261 |
| Withheld | | 33,193,298.35 | | 4.739 |
| TOTAL | | 700,395,200.68 | | 100.000 |
| Albert R. Gamper, Jr. | | |
| Affirmative | | 667,477,031.41 | | 95.300 |
| Withheld | | 32,918,169.27 | | 4.700 |
| TOTAL | | 700,395,200.68 | | 100.000 |
| Robert M. Gates | | | | |
| Affirmative | | 666,308,716.35 | | 95.133 |
| Withheld | | 34,086,484.33 | | 4.867 |
| TOTAL | | 700,395,200.68 | | 100.000 |
| George H. Heilmeier | | |
| Affirmative | | 664,652,778.09 | | 94.897 |
| Withheld | | 35,742,422.59 | | 5.103 |
| TOTAL | | 700,395,200.68 | | 100.000 |
| Abigail P. Johnson | | |
| Affirmative | | 664,170,496.79 | | 94.828 |
| Withheld | | 36,224,703.89 | | 5.172 |
| TOTAL | | 700,395,200.68 | | 100.000 |
| Edward C. Johnson 3d | | |
| Affirmative | | 663,788,907.22 | | 94.773 |
| Withheld | | 36,606,293.46 | | 5.227 |
| TOTAL | | 700,395,200.68 | | 100.000 |
| Stephen P. Jonas | | | | |
| Affirmative | | 667,006,752.59 | | 95.233 |
| Withheld | | 33,388,448.09 | | 4.767 |
| TOTAL | | 700,395,200.68 | | 100.000 |
| | | # of | | % of |
| | | Votes | | Votes |
| |
| Marie L. Knowles | | |
| Affirmative | | 666,373,338.05 | | 95.142 |
| Withheld | | 34,021,862.63 | | 4.858 |
| TOTAL | | 700,395,200.68 | | 100.000 |
| |
| Ned C. Lautenbach | | |
| Affirmative | | 666,334,938.56 | | 95.137 |
| Withheld | | 34,060,262.12 | | 4.863 |
| TOTAL | | 700,395,200.68 | | 100.000 |
| |
| William O. McCoy | | |
| Affirmative | | 665,764,692.27 | | 95.056 |
| Withheld | | 34,630,508.41 | | 4.944 |
| TOTAL | | 700,395,200.68 | | 100.000 |
| |
| Robert L. Reynolds | | |
| Affirmative | | 667,335,421.55 | | 95.280 |
| Withheld | | 33,059,779.13 | | 4.720 |
| TOTAL | | 700,395,200.68 | | 100.000 |
| |
| Cornelia M. Small | | |
| Affirmative | | 667,579,724.56 | | 95.315 |
| Withheld | | 32,815,476.12 | | 4.685 |
| TOTAL | | 700,395,200.68 | | 100.000 |
| |
| William S. Stavropoulos | | |
| Affirmative | | 665,215,267.33 | | 94.977 |
| Withheld | | 35,179,933.35 | | 5.023 |
| TOTAL | | 700,395,200.68 | | 100.000 |
| |
| Kenneth L. Wolfe | | | | |
| Affirmative | | 666,060,714.08 | | 95.098 |
| Withheld | | 34,334,486.60 | | 4.902 |
| TOTAL | | 700,395,200.68 | | 100.000 |
A Denotes trust-wide proposal and voting results.
55 Annual Report
Proxy Voting Results - continued
A special meeting of Fidelity Pennsylvania Municipal Income Fund’s shareholders was held on January 18, 2006. The results of votes taken among shareholders on the propos als before them are reported below. Each vote reported represents one dollar of net asset value held on the record date for the meeting.
| PROPOSAL 1 | | | | |
| To elect a Board of Trustees.A | | |
| | | # of | | % of |
| | | Votes | | Votes |
| |
| Dennis J. Dirks | | | | |
| Affirmative | | 4,012,578,790.76 | | 95.238 |
| Withheld | | 200,653,306.55 | | 4.762 |
| TOTAL | | 4,213,232,097.31 | | 100.000 |
| Albert R. Gamper, Jr. | | |
| Affirmative | | 4,015,643,707.84 | | 95.310 |
| Withheld | | 197,588,389.47 | | 4.690 |
| TOTAL | | 4,213,232,097.31 | | 100.000 |
| Robert M. Gates | | |
| Affirmative | | 4,004,345,809.00 | | 95.042 |
| Withheld | | 208,886,288.31 | | 4.958 |
| TOTAL | | 4,213,232,097.31 | | 100.000 |
| George H. Heilmeier | | |
| Affirmative | | 4,008,127,523.93 | | 95.132 |
| Withheld | | 205,104,573.38 | | 4.868 |
| TOTAL | | 4,213,232,097.31 | | 100.000 |
| Abigail P. Johnson | | |
| Affirmative | | 3,993,175,527.66 | | 94.777 |
| Withheld | | 220,056,569.65 | | 5.223 |
| TOTAL | | 4,213,232,097.31 | | 100.000 |
| Edward C. Johnson 3d | | |
| Affirmative | | 3,987,333,615.26 | | 94.638 |
| Withheld | | 225,898,482.05 | | 5.362 |
| TOTAL | | 4,213,232,097.31 | | 100.000 |
| Stephen P. Jonas | | |
| Affirmative | | 4,010,007,680.52 | | 95.177 |
| Withheld | | 203,224,416.79 | | 4.823 |
| TOTAL | | 4,213,232,097.31 | | 100.000 |
| | | # of | | % of |
| | | Votes | | Votes |
| |
| Marie L. Knowles | | |
| Affirmative | | 4,010,231,303.96 | | 95.182 |
| Withheld | | 203,000,793.35 | | 4.818 |
| TOTAL | | 4,213,232,097.31 | | 100.000 |
| |
| Ned C. Lautenbach | | |
| Affirmative | | 4,009,136,177.44 | | 95.156 |
| Withheld | | 204,095,919.87 | | 4.844 |
| TOTAL | | 4,213,232,097.31 | | 100.000 |
| |
| William O. McCoy | | |
| Affirmative | | 4,001,996,735.35�� | | 94.986 |
| Withheld | | 211,235,361.96 | | 5.014 |
| TOTAL | | 4,213,232,097.31 | | 100.000 |
| |
| Robert L. Reynolds | | |
| Affirmative | | 4,010,560,206.65 | | 95.190 |
| Withheld | | 202,671,890.66 | | 4.810 |
| TOTAL | | 4,213,232,097.31 | | 100.000 |
| |
| Cornelia M. Small | | |
| Affirmative | | 4,011,161,760.21 | | 95.204 |
| Withheld | | 202,070,337.10 | | 4.796 |
| TOTAL | | 4,213,232,097.31 | | 100.000 |
| |
| William S. Stavropoulos | | |
| Affirmative | | 4,001,217,912.57 | | 94.968 |
| Withheld | | 212,014,184.74 | | 5.032 |
| TOTAL | | 4,213,232,097.31 | | 100.000 |
| |
| Kenneth L. Wolfe | | |
| Affirmative | | 4,011,439,868.05 | | 95.211 |
| Withheld | | 201,792,229.26 | | 4.789 |
| TOTAL | | 4,213,232,097.31 | | 100.000 |
A Denotes trust-wide proposal and voting results.
Annual Report 56
| PROPOSAL 2 | | | | |
| To change Fidelity Pennsylvania |
| Municipal Income Fund from a diver- |
| sified to a non-diversified fund. | | |
| | | # of | | % of |
| | | Votes | | Votes |
| Affirmative | | 138,944,647.47 | | 74.679 |
| Against | | 29,304,872.03 | | 15.751 |
| Abstain | | 10,404,283.99 | | 5.592 |
| Broker | | | | |
| Non Votes . | | 7,402,189.22 | | 3.978 |
| TOTAL | | 186,055,992.71 | | 100.000 |
57 Annual Report
Managing Your Investments
Fidelity offers several ways to conveniently manage your personal investments via your telephone or PC. You can access your account information, conduct trades and research your investments 24 hours a day.
By Phone
Fidelity Automated Service Telephone provides a single toll free number to access account balances, positions, quotes and trading. It’s easy to navigate the service, and on your first call, the system will help you create a personal identification number (PIN) for security.


By PC
Fidelity’s web site on the Internet provides a wide range of information, including daily financial news, fund performance, interactive planning tools and news about Fidelity products and services.

* When you call the quotes line, please remember that a fund’s yield and return will vary and, except for money market funds, share price will also vary. This means that you may have a gain or loss when you sell your shares. There is no assurance that money market funds will be able to maintain a stable $1 share price; an investment in a money market fund is not insured or guar anteed by the U.S. government. Total returns are historical and include changes in share price, reinvestment of dividends and capital gains, and the effects of any sales charges.
Annual Report 58
To Write Fidelity
We’ll give your correspondence immediate attention and send you written confirmation upon completion of your request.

(such as changing name, address, bank, etc.)
Fidelity Investments
P.O. Box 770001
Cincinnati, OH 45277-0002
|

| | Buying shares
Fidelity Investments
P.O. Box 770001
Cincinnati, OH 45277-0003
Overnight Express
Fidelity Investments
Attn: Distribution Services
100 Crosby Parkway KC1H
Covington, KY 41015
Selling shares
Fidelity Investments
P.O. Box 770001
Cincinnati, OH 45277-0035
Overnight Express
Fidelity Investments
Attn: Distribution Services
100 Crosby Parkway KC1H
Covington, KY 41015
General Correspondence
Fidelity Investments
P.O. Box 500
Merrimack, NH 03054-0500
|

Buying shares
Fidelity Investments
P.O. Box 770001
Cincinnati, OH 45277-0003
Selling shares
Fidelity Investments
P.O. Box 770001
Cincinnati, OH 45277-0035
Overnight Express
Fidelity Investments
Attn: Distribution Services
100 Crosby Parkway KC1H
Covington, KY 41015
General Correspondence
Fidelity Investments
P.O. Box 500
Merrimack, NH 03054-0500
|
59 Annual Report
Investment Adviser
Fidelity Management & Research Company
Boston, MA
Sub-Adviser
Fidelity Investments Money
Management, Inc.
Fidelity International Investment
Advisors
Fidelity International Investment
Advisors (U.K.) Limited
General Distributor
Fidelity Distributors Corporation
Boston, MA
Transfer and Service Agents
Citibank, N.A.
New York, NY
Fidelity Service Company, Inc.
Boston, MA
Custodian
Citibank, N.A.
New York, NY
|
| The Fidelity Telephone Connection |
| Mutual Fund 24-Hour Service |
| Exchanges/Redemptions | | |
| and Account Assistance | | 1-800-544-6666 |
| Product Information | | 1-800-544-6666 |
| Retirement Accounts | | 1-800-544-4774 |
| (8 a.m. - 9 p.m.) | | |
| TDD Service | | 1-800-544-0118 |
| for the deaf and hearing impaired |
| (9 a.m. - 9 p.m. Eastern time) |
| Fidelity Automated Service | | |
| Telephone (FAST® ) (automated phone logo) | | 1-800-544-5555 |
| (automated phone logo) Automated line for quickest service |
PFR-UANN-0206
1.787740.102
|

Fidelity®
Short-Intermediate
Municipal Income Fund
(formerly Spartan® Short Intermediate
Municipal Income Fund)
|
| | Annual Report
December 31, 2005
|


| Contents | | | | |
| |
| Chairman’s Message | | 4 | | Ned Johnson’s message to shareholders. |
| Performance | | 5 | | How the fund has done over time. |
| Management’s Discussion | | 6 | | The manager’s review of fund |
| | | | | performance, strategy and outlook. |
| Shareholder Expense | | 7 | | An example of shareholder expenses. |
| Example | | | | |
| Investment Changes | | 9 | | A summary of major shifts in the fund’s |
| | | | | investments over the past six months. |
| Investments | | 10 | | A complete list of the fund’s investments |
| | | | | with their market values. |
| Financial Statements | | 34 | | Statements of assets and liabilities, |
| | | | | operations, and changes in net assets, |
| | | | | as well as financial highlights. |
| Notes | | 44 | | Notes to the financial statements. |
| Report of Independent | | 52 | | |
| Registered Public | | | | |
| Accounting Firm | | | | |
| Trustees and Officers | | 53 | | |
| Distributions | | 64 | | |
| Proxy Voting Results | | 65 | | |
To view a fund’s proxy voting guidelines and proxy voting record for the 12 month period ended
June 30, visit www.fidelity.com/proxyvotingresults or visit the Securities and Exchange Commis
sion’s (SEC) web site at www.sec.gov. You may also call 1-800-544-8544 to request a free copy of
the proxy voting guidelines.
Standard & Poor’s, S&P and S&P 500 are registered service marks of The McGraw Hill Companies, Inc.
and have been licensed for use by Fidelity Distributors Corporation.
Other third party marks appearing herein are the property of their respective owners.
All other marks appearing herein are registered or unregistered trademarks or service marks of FMR
Corp. or an affiliated company.
|
This report and the financial statements contained herein are submitted for the general
information of the shareholders of the fund. This report is not authorized for distribution to
prospective investors in the fund unless preceded or accompanied by an effective prospectus.
A fund files its complete schedule of portfolio holdings with the SEC for the first and third
quarters of each fiscal year on Form N Q. Forms N Q are available on the SEC’s web site at
http://www.sec.gov. A fund’s Forms N Q may be reviewed and copied at the SEC’s Public Reference
Room in Washington, DC. Information regarding the operation of the SEC’s Public Reference
Room may be obtained by calling 1-800-SEC-0330. For a complete list of a fund’s portfolio
holdings, view the most recent quarterly holdings report, semiannual report, or annual report
on Fidelity’s web site at http://www.fidelity.com/holdings.
NOT FDIC INSURED · MAY LOSE VALUE · NO BANK GUARANTEE
Neither the fund nor Fidelity Distributors Corporation is a bank.
|
3 Annual Report
Chairman’s Message
(photograph of Edward C. Johnson 3d)
Dear Shareholder:
During the past year or so, much has been reported about the mutual fund industry, and much of it has been more critical than I believe is warranted. Allegations that some companies have been less than forthright with their shareholders have cast a shadow on the entire industry. I continue to find these reports disturbing, and assert that they do not create an accurate picture of the industry overall. Therefore, I would like to remind every one where Fidelity stands on these issues. I will say two things specifically regarding allegations that some mutual fund companies were in violation of the Securities and Exchange Commission’s forward pricing rules or were involved in so called “market timing” activities.
First, Fidelity has no agreements that permit customers who buy fund shares after 4 p.m. to obtain the 4 p.m. price. This is not a new policy. This is not to say that some one could not deceive the company through fraudulent acts. However, we are extremely diligent in preventing fraud from occurring in this manner and in every other. But I underscore again that Fidelity has no so called “agreements” that sanction illegal practices.
Second, Fidelity continues to stand on record, as we have for years, in opposition to predatory short term trading that adversely affects shareholders in a mutual fund. Back in the 1980s, we initiated a fee which is returned to the fund and, therefore, to investors to discourage this activity. Further, we took the lead several years ago in developing a Fair Value Pricing Policy to prevent market timing on foreign securities in our funds. I am confi dent we will find other ways to make it more difficult for predatory traders to operate. However, this will only be achieved through close cooperation among regulators, legislators and the industry.
Yes, there have been unfortunate instances of unethical and illegal activity within the mutual fund industry from time to time. That is true of any industry. When this occurs, confessed or convicted offenders should be dealt with appropriately. But we are still concerned about the risk of over regulation and the quick application of simplistic solutions to intricate problems. Every system can be improved, and we support and applaud well thought out improvements by regulators, legislators and industry representatives that achieve the common goal of building and protecting the value of investors’ holdings.
For nearly 60 years, Fidelity has worked very hard to improve its products and service to justify your trust. When our family founded this company in 1946, we had only a few hundred customers. Today, we serve more than 18 million customers including individual investors and participants in retirement plans across America.
Let me close by saying that we do not take your trust in us for granted, and we realize that we must always work to improve all aspects of our service to you. In turn, we urge you to continue your active participation with your financial matters, so that your interests can be well served.
Best regards,
/s/ Edward C. Johnson 3d
Edward C. Johnson 3d
Annual Report 4
Performance: The Bottom Line
Average annual total return reflects the change in the value of an investment, assuming reinvestment of Short Intermediate Municipal Income’s dividend income and capital gains (the profits earned upon the sale of securities that have grown in value) and assuming a constant rate of performance each year. The $10,000 table and the fund’s returns do not reflect the deduction of taxes that a shareholder would pay on fund distributions or the redemption of fund shares. During periods of reimbursement by Fidelity, a fund’s total return will be greater than it would be had the reimbursement not oc curred. How a fund did yesterday is no guarantee of how it will do tomorrow.
| Average Annual Total Returns | | | | | | |
| Periods ended December 31, 2005 | | Past 1 | | Past 5 | | Past 10 |
| | | year | | years | | years |
| Short Intermediate Municipal Income | | 1.06% | | 3.59% | | 3.97% |
| |
| |
| $10,000 Over 10 Years | | | | | | |
Let’s say hypothetically that $10,000 was invested in Short Intermediate Municipal Income on December 31, 1995. The chart shows how the value of your investment would have changed, and also shows how the Lehman Brothers® Municipal Bond Index performed over the same period.
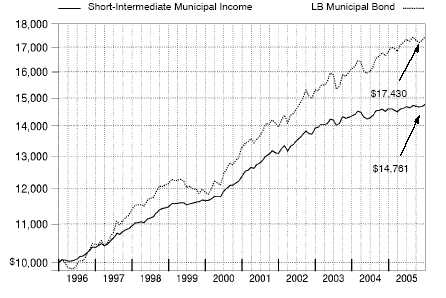
5 Annual Report
5
Management’s Discussion of Fund Performance
Comments from Mark Sommer, Portfolio Manager of Fidelity® Short Intermediate Municipal Income Fund
For the third consecutive year, the municipal bond market outperformed taxable bonds. The Lehman Brothers® Municipal Bond Index rose 3.51% for the year ending December 31, 2005. The taxable bond market, as measured by the Lehman Brothers Aggregate Bond Index, advanced 2.43% . Muni bonds were attractively valued relative to Treasuries, particularly as tax free bond yields drew closer to those of high quality government bonds. Consequently, the tax advantage of munis was compelling to such atypical investors in the asset class as hedge funds, corporations and taxable bond investors. The strong demand helped offset heavy issuance, particularly at the longer term end of the spectrum. The Federal Reserve Board raised short term interest rates eight times during the year, but long term rates remained persistently low, making the cost of borrowing more affordable for muni issuers. Still, absolute returns finished well below their historical averages. In addition to the rate hikes, surging energy prices pushed inflation higher, a condition further exacerbated by the damage to energy production facilities caused by Hurricane Katrina.
Short Intermediate Municipal Income returned 1.06% during the past year. By comparison, the LipperSM Short Intermediate Municipal Debt Funds Average also gained 1.06% and the Lehman Brothers 1 6 Year Municipal Bond Index returned 1.02% . The biggest contributor to the fund’s performance relative to the Lehman Brothers index was my focus throughout much of the period on bonds with maturities in the six to eight year range, which outper formed securities in the two to five year segment that dominates the Lehman Brothers index. Security selection also was a plus, with Fidelity’s municipal bond research team helping me to avoid deteriorating credits. In addition, performance was helped by an overweighting relative to the index in lower quality investment grade munis, because they dramatically outpaced higher quality securities amid strong investor demand. That said, I believe the fund had less exposure to lower quality securities than many of its competitors, which may have cost it some ground. Similarly, performance likely was hurt by my shying away from below investment grade munis and tobacco bonds, both of which were among the market’s best performing segments and where I suspect my competitors had more exposure. Throughout the period, I kept the fund’s overall interest rate sensitivity in line with the Lehman Brothers index. This strategy had no material impact on the fund’s performance relative to the index.
The views expressed in this statement reflect those of the portfolio manager only through the end of the period of the report as stated on the cover and do not necessarily represent the views of Fidelity or any other person in the Fidelity organization. Any such views are subject to change at any time based upon market or other conditions and Fidelity dis claims any responsibility to update such views. These views may not be relied on as investment advice and, because investment decisions for a Fidelity fund are based on numerous factors, may not be relied on as an indication of trading intent on behalf of any Fidelity fund.
Shareholder Expense Example
As a shareholder of the Fund, you incur two types of costs: (1) transaction costs, including sales charges (loads) on purchase payments or redemption proceeds, redemption fees, and (2) ongoing costs, including management fees, distribution and/or service (12b 1) fees and other Fund expenses. This Example is intended to help you understand your ongoing costs (in dollars) of investing in the Fund and to compare these costs with the ongoing costs of investing in other mutual funds.
The Example is based on an investment of $1,000 invested at the beginning of the period and held for the entire period (July 1, 2005 to December 31, 2005).
The first line of the table below for each class of the Fund provides information about actual account values and actual expenses. You may use the information in this line, together with the amount you invested, to estimate the expenses that you paid over the period. Simply divide your account value by $1,000.00 (for example, an $8,600 account value divided by $1,000.00 = 8.6), then multiply the result by the number in the first line for a class of the Fund under the heading entitled “Expenses Paid During Period” to estimate the expenses you paid on your account during this period.
Hypothetical Example for Comparison Purposes
The second line of the table below for each class of the Fund provides information about hypothetical account values and hypothetical expenses based on a Class’ actual expense ratio and an assumed rate of return of 5% per year before expenses, which is not the Class’ actual return. The hypothetical account values and expenses may not be used to estimate the actual ending account balance or expenses you paid for the period. You may use this information to compare the ongoing costs of investing in the Fund and other funds. To do so, compare this 5% hypothetical example with the 5% hypothetical examples that appear in the shareholder reports of the other funds.
Please note that the expenses shown in the table are meant to highlight your ongoing costs only and do not reflect any transaction costs. Therefore, the second line of the table is useful in comparing ongoing costs only, and will not help you determine the relative total costs of owning different funds. In addition, if these transactional costs were included, your costs would have been higher.
7 Annual Report
| Shareholder Expense Example continued | | | | |
| |
| |
| | | | | | | | | | | Expenses Paid |
| | | | | | | | | | | During Period* |
| | | | | Beginning | | Ending | | July 1, 2005 |
| | | | | Account Value | | Account Value | | to December 31, |
| | | | | July 1, 2005 | | December 31, 2005 | | 2005 |
| Class A | | | | | | | | | | | | |
| Actual | | | $ | 1,000.00 | | $ | | 1,003.60 | | $ | | 3.23 |
| HypotheticalA | | | $ | 1,000.00 | | $ | | 1,021.98 | | $ | | 3.26 |
| Class T | | | | | | | | | | | | |
| Actual | | | $ | 1,000.00 | | $ | | 1,003.10 | | $ | | 3.74 |
| HypotheticalA | | | $ | 1,000.00 | | $ | | 1,021.48 | | $ | | 3.77 |
| Class B | | | | | | | | | | | | |
| Actual | | | $ | 1,000.00 | | $ | | 999.80 | | $ | | 7.01 |
| HypotheticalA | | | $ | 1,000.00 | | $ | | 1,018.20 | | $ | | 7.07 |
| Class C | | | | | | | | | | | | |
| Actual | | | $ | 1,000.00 | | $ | | 999.20 | | $ | | 7.61 |
| HypotheticalA | | | $ | 1,000.00 | | $ | | 1,017.59 | | $ | | 7.68 |
| Short Intermediate Municipal | | | | | | | | | | | | |
| Income | | | | | | | | | | | | |
| Actual | | | $ | 1,000.00 | | $ | | 1,004.40 | | $ | | 2.43 |
| HypotheticalA | | | $ | 1,000.00 | | $ | | 1,022.79 | | $ | | 2.45 |
| Institutional Class | | | | | | | | | | | | |
| Actual | | | $ | 1,000.00 | | $ | | 1,004.40 | | $ | | 2.48 |
| HypotheticalA | | | $ | 1,000.00 | | $ | | 1,022.74 | | $ | | 2.50 |
A 5% return per year before expenses | | | | | | | | |
* Expenses are equal to each Class’ annualized expense ratio (shown in the table below); multiplied by the average account value over the period, multiplied by 184/365 (to reflect the one half year period).
| | | Annualized |
| | | Expense Ratio |
| Class A | | 64% |
| Class T | | 74% |
| Class B | | 1.39% |
| Class C | | 1.51% |
| Short Intermediate Municipal Income | | 48% |
| Institutional Class | | 49% |
| Investment Changes | | | | |
| |
| Top Five States as of December 31, 2005 | | | | |
| | | % of fund’s | | % of fund’s net assets |
| | | net assets | | 6 months ago |
| Texas | | 14.7 | | 14.4 |
| New York | | 11.8 | | 8.5 |
| Illinois | | 9.4 | | 9.3 |
| California | | 7.6 | | 8.1 |
| New Jersey | | 6.9 | | 4.5 |
Top Five Sectors as of December 31, 2005 | | |
| | | % of fund’s | | % of fund’s net assets |
| | | net assets | | 6 months ago |
| General Obligations | | 49.1 | | 45.1 |
| Electric Utilities | | 13.8 | | 14.0 |
| Escrowed/Pre Refunded | | 8.2 | | 8.1 |
| Transportation | | 6.7 | | 6.6 |
| Health Care | | 6.5 | | 5.9 |
Average Years to Maturity as of December 31, 2005 | | |
| | | | | 6 months ago |
| Years | | 3.5 | | 3.4 |
Average years to maturity is based on the average time remaining to the stated maturity date of each bond, weighted by the market value of each bond.
| Duration as of December 31, 2005 | | | | |
| | | | | | | 6 months ago |
| Years | | | | 3.0 | | 2.9 |
Duration shows how much a bond fund’s price fluctuates with changes in comparable interest rates. If rates rise 1%, for example, a fund with a five year duration is likely to lose about 5% of its value. Other factors also can influence a bond fund’s performance and share price. Accordingly, a bond fund’s actual performance may differ from this example.
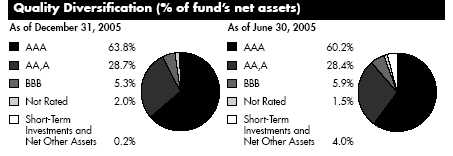
We have used ratings from Moody’s® Investors Services, Inc. Where Moody’s ratings are not available, we have used S&P® ratings.
9 Annual Report
Investments December 31, 2005
| Showing Percentage of Net Assets | | | | | | | | |
Municipal Bonds 99.8% | | | | | | | | |
| | | Principal | | Value (Note 1) |
| | | Amount (000s) | | (000s) |
| Alabama – 2.3% | | | | | | | | |
| Birmingham Baptist Med. Ctrs. Spl. Care Facilities Fing. | | | | | | | | |
| Auth. Rev. (Baptist Health Sys., Inc. Proj.) Series A, 5% | | | | | | | | |
| 11/15/09 | | $ | | 1,100 | | $ | | 1,140 |
| Huntsville Solid Waste Disp. Auth. & Resource Recovery | | | | | | | | |
| Rev.: | | | | | | | | |
| 5.25% 10/1/07 (MBIA Insured) (c) | | | | 1,750 | | | | 1,783 |
| 5.25% 10/1/08 (MBIA Insured) (c) | | | | 2,900 | | | | 2,998 |
| 5.75% 10/1/09 (MBIA Insured) (c) | | | | 4,000 | | | | 4,243 |
| Jefferson County Ltd. Oblig. School Warrants Series A, | | | | | | | | |
| 5% 1/1/07 | | | | 2,210 | | | | 2,244 |
| Jefferson County Swr. Rev.: | | | | | | | | |
| Series 1999 A, 5.75% 2/1/38 (Pre-Refunded to | | | | | | | | |
| 2/1/09 @ 101) (d) | | | | 5,000 | | | | 5,397 |
| Series A: | | | | | | | | |
| 5% 2/1/33 (Pre-Refunded to 2/1/09 @ 101) (d) | | | | 13,460 | | | | 14,176 |
| 5.5% 2/1/40 (Pre-Refunded to 2/1/11 @ 101) (d) | | | | 3,900 | | | | 4,294 |
| 5% 2/1/41 (Pre-Refunded to 8/1/12 @ 100) (d) | | | | 2,060 | | | | 2,215 |
| Mobile County Gen. Oblig. 5% 2/1/08 (MBIA Insured) . | | | | 1,475 | | | | 1,524 |
| | | | | | | | | 40,014 |
| |
| Alaska – 1.6% | | | | | | | | |
| Alaska Student Ln. Corp. Student Ln. Rev. Series A, | | | | | | | | |
| 5.85% 7/1/13 (AMBAC Insured) (c) | | | | 3,285 | | | | 3,544 |
| Anchorage Gen. Oblig. Series B, 5.75% 12/1/11 | | | | | | | | |
| (Pre-Refunded to 12/1/10 @ 100) (d) | | | | 2,500 | | | | 2,755 |
| North Slope Borough Gen. Oblig.: | | | | | | | | |
| Series 1996 B, 0% 6/30/07 (MBIA Insured) | | | | 3,100 | | | | 2,945 |
| Series A, 0% 6/30/07 (MBIA Insured) | | | | 5,000 | | | | 4,751 |
| Series B: | | | | | | | | |
| 0% 6/30/06 (MBIA Insured) | | | | 3,500 | | | | 3,444 |
| 0% 6/30/07 (MBIA Insured) | | | | 7,050 | | | | 6,699 |
| 0% 6/30/08 (MBIA Insured) | | | | 4,240 | | | | 3,891 |
| | | | | | | | | 28,029 |
| |
| Arizona – 1.5% | | | | | | | | |
| Arizona Ctfs. of Prtn. Series B, 5.5% 9/1/10 | | | | | | | | |
| (FSA Insured) | | | | 8,325 | | | | 9,016 |
| Arizona School Facilities Board Ctfs. of Prtn. Series C, | | | | | | | | |
| 5% 9/1/09 (FSA Insured) | | | | 1,115 | | | | 1,175 |
| Maricopa County Unified School District #48 Scottsdale | | | | | | | | |
| 7.4% 7/1/10 | | | | 3,750 | | | | 4,346 |
| Pima County Unified School District #1 Tucson 7.5% | | | | | | | | |
| 7/1/08 (FGIC Insured) | | | | 7,060 | | | | 7,749 |
See accompanying notes which are an integral part of the financial statements.
| Municipal Bonds continued | | | | | | | | |
| | | Principal | | Value (Note 1) |
| | | Amount (000s) | | (000s) |
| Arizona – continued | | | | | | | | |
| Tucson Wtr. Rev. Series A, 5% 7/1/11 (FGIC Insured) | | $ | | 1,500 | | $ | | 1,601 |
| Univ. of Arizona Ctfs. of Prtn. (Univ. of Arizona Parking | | | | | | | | |
| & Student Hsg. Proj.) Series A, 5% 6/1/09 (AMBAC | | | | | | | | |
| Insured) | | | | 2,000 | | | | 2,097 |
| | | | | | | | | 25,984 |
| |
| Arkansas – 0.3% | | | | | | | | |
| Arkansas Dev. Fin. Auth. Exempt Facilities Rev. (Waste | | | | | | | | |
| Mgmt. Proj.) 3.65%, tender 8/1/06 (b)(c) | | | | 1,000 | | | | 999 |
| Little Rock Gen. Oblig. 4% 4/1/07 (FSA Insured) | | | | 1,000 | | | | 1,009 |
| Rogers Sales & Use Tax Rev. Series A, 4.25% 9/1/07 | | | | | | | | |
| (FGIC Insured) | | | | 2,175 | | | | 2,208 |
| | | | | | | | | 4,216 |
| |
| California – 7.6% | | | | | | | | |
| California Dept. of Wtr. Resources Pwr. Supply Rev. | | | | | | | | |
| Series A: | | | | | | | | |
| 5.25% 5/1/07 (MBIA Insured) | | | | 27,455 | | | | 28,162 |
| 5.25% 5/1/12 (MBIA Insured) | | | | 6,000 | | | | 6,548 |
| California Econ. Recovery Series A, 5.25% 7/1/13 | | | | | | | | |
| (MBIA Insured) | | | | 2,900 | | | | 3,206 |
| California Gen. Oblig.: | | | | | | | | |
| 5% 2/1/09 | | | | 1,640 | | | | 1,713 |
| 5% 2/1/10 | | | | 2,000 | | | | 2,110 |
| 5.125% 9/1/12 | | | | 1,000 | | | | 1,061 |
| 5.25% 2/1/11 | | | | 5,775 | | | | 6,202 |
| 5.5% 3/1/11 (FGIC Insured) | | | | 3,210 | | | | 3,513 |
| 5.5% 3/1/11 (XL Cap. Assurance, Inc. Insured) | | | | 3,525 | | | | 3,850 |
| 5.75% 10/1/08 | | | | 1,085 | | | | 1,150 |
| 6.4% 9/1/08 | | | | 3,075 | | | | 3,301 |
| 6.5% 9/1/10 | | | | 1,740 | | | | 1,947 |
| 8% 11/1/07 (FGIC Insured) | | | | 4,670 | | | | 4,941 |
| California Health Facilities Fing. Auth. Rev. (Cedars-Sinai | | | | | | | | |
| Med. Ctr. Proj.) 5% 11/15/10 | | | | 1,000 | | | | 1,060 |
| California Poll. Cont. Fing. Auth. Ctfs. of Prtn. (Pacific | | | | | | | | |
| Gas & Elec. Co. Proj.) Series 2004 B, 3.5%, tender | | | | | | | | |
| 6/1/07 (FGIC Insured) (b)(c) | | | | 15,000 | | | | 15,010 |
| California Poll. Cont. Fing. Auth. Solid Waste Disp. Rev. | | | | | | | | |
| (Waste Mgmt., Inc. Proj.) Series A, 3.125%, tender | | | | | | | | |
| 5/1/06 (b)(c) | | | | 5,000 | | | | 4,988 |
| California Pub. Works Board Lease Rev.: | | | | | | | | |
| (California State Univ. Proj.) Series 1997 A, 5.5% | | | | | | | | |
| 10/1/07 | | | | 1,075 | | | | 1,110 |
See accompanying notes which are an integral part of the financial statements.
11 Annual Report
| Investments continued | | | | | | | | |
| |
| |
| Municipal Bonds continued | | | | | | | | |
| | | Principal | | Value (Note 1) |
| | | Amount (000s) | | (000s) |
| California – continued | | | | | | | | |
| California Pub. Works Board Lease Rev.: – continued | | | | | | | | |
| (Coalinga State Hosp. Proj.) Series 2004 A: | | | | | | | | |
| 5% 6/1/07 | | $ | | 4,000 | | $ | | 4,086 |
| 5% 6/1/08 | | | | 6,000 | | | | 6,210 |
| California Statewide Cmntys. Dev. Auth. Rev.: | | | | | | | | |
| (Kaiser Fund Hosp./Health Place, Inc. Proj.) | | | | | | | | |
| Series 2002 C, 3.85%, tender 6/1/12 (b) | | | | 1,400 | | | | 1,389 |
| (Kaiser Permanente Health Sys. Proj.): | | | | | | | | |
| Series 2001 A, 2.55%, tender 1/4/07 (b) | | | | 1,400 | | | | 1,388 |
| Series 2004 G, 2.3%, tender 5/1/07 (b) | | | | 8,000 | | | | 7,889 |
| Commerce Refuse To Energy Auth. Rev.: | | | | | | | | |
| 5% 7/1/07 (MBIA Insured) | | | | 1,770 | | | | 1,812 |
| 5.25% 7/1/08 (MBIA Insured) | | | | 855 | | | | 893 |
| North City West School Facilities Fing. Auth. Spl. Tax | | | | | | | | |
| Subseries C: | | | | | | | | |
| 5% 9/1/07 (AMBAC Insured) (a) | | | | 1,975 | | | | 2,012 |
| 5% 9/1/08 (AMBAC Insured) (a) | | | | 2,080 | | | | 2,143 |
| San Joaquin Hills Trans. Corridor Agcy. Toll Road Rev. | | | | | | | | |
| Series A, 0% 1/15/12 (MBIA Insured) | | | | 3,600 | | | | 2,852 |
| Univ. of California Revs. (UCLA Med. Ctr. Proj.) 4.55% | | | | | | | | |
| 12/1/09 (e) | | | | 8,955 | | | | 9,063 |
| | | | | | | | | 129,609 |
| |
| Colorado – 0.3% | | | | | | | | |
| E-470 Pub. Hwy. Auth. Rev. Series 2000 B: | | | | | | | | |
| 0% 9/1/06 (Escrowed to Maturity) (d) | | | | 2,200 | | | | 2,150 |
| 0% 9/1/07 (Escrowed to Maturity) (d) | | | | 3,200 | | | | 3,016 |
| | | | | | | | | 5,166 |
| |
| Connecticut – 0.6% | | | | | | | | |
| Connecticut Gen. Oblig.: | | | | | | | | |
| Series 2001 D, 5.125% 11/15/18 (Pre-Refunded to | | | | | | | | |
| 11/15/11 @ 100) (d) | | | | 5,000 | | | | 5,386 |
| Series 2002 C, 5% 12/15/08 | | | | 1,930 | | | | 2,020 |
| Connecticut Health & Edl. Facilities Auth. Rev. | | | | | | | | |
| (Connecticut Children’s Med. Ctr. Proj.) Series B: | | | | | | | | |
| 4% 7/1/07 (MBIA Insured) | | | | 1,275 | | | | 1,287 |
| 4.5% 7/1/08 (MBIA Insured) | | | | 1,045 | | | | 1,073 |
| 5% 7/1/09 (MBIA Insured) | | | | 1,000 | | | | 1,051 |
| | | | | | | | | 10,817 |
See accompanying notes which are an integral part of the financial statements.
| Municipal Bonds continued | | | | | | | | |
| | | Principal | | Value (Note 1) |
| | | Amount (000s) | | (000s) |
| District Of Columbia – 1.9% | | | | | | | | |
| District of Columbia Ctfs. of Prtn.: | | | | | | | | |
| (District’s Pub. Safety and Emergency Preparedness | | | | | | | | |
| Communications Ctr. and Related Technology Proj.) | | | | | | | | |
| Series 2003, 3% 1/1/06 (AMBAC Insured) | | $ | | 1,305 | | $ | | 1,305 |
| 5% 1/1/06 (AMBAC Insured) | | | | 1,000 | | | | 1,000 |
| 5% 1/1/07 (AMBAC Insured) | | | | 1,000 | | | | 1,016 |
| 5.25% 1/1/08 (AMBAC Insured) | | | | 935 | | | | 968 |
| District of Columbia Gen. Oblig.: | | | | | | | | |
| Series 1993 B2, 5.5% 6/1/07 (FSA Insured) | | | | 1,830 | | | | 1,885 |
| Series 2001 B, 5.5% 6/1/07 (FSA Insured) | | | | 1,345 | | | | 1,385 |
| Series A: | | | | | | | | |
| 5% 6/1/07 | | | | 2,810 | | | | 2,868 |
| 5.25% 6/1/09 (FSA Insured) | | | | 1,000 | | | | 1,057 |
| Series B, 0% 6/1/12 (MBIA Insured) | | | | 3,600 | | | | 2,772 |
| District of Columbia Rev. (Medstar Univ. Hosp. Proj.) | | | | | | | | |
| Series D, 6.875%, tender 2/16/07 (b)(d) | | | | 9,000 | | | | 9,354 |
| Metropolitan Washington Arpts. Auth. Gen. Arpt. Rev. | | | | | | | | |
| Series B, 5.5% 10/1/08 (FGIC Insured) (c) | | | | 6,460 | | | | 6,748 |
| Metropolitan Washington Arpts. Auth. Sys. Rev. Series D: | | | | | | | | |
| 4% 10/1/06 (FSA Insured) (c) | | | | 1,750 | | | | 1,756 |
| 4% 10/1/07 (FSA Insured) (c) | | | | 1,000 | | | | 1,007 |
| | | | | | | | | 33,121 |
| |
| Florida – 3.9% | | | | | | | | |
| Brevard County Util. Rev. 5% 3/1/06 (FGIC Insured) | | | | 530 | | | | 531 |
| Coral Gables Health Facilities Hosp. (Baptist Health | | | | | | | | |
| South Florida Obligated Group Proj.) 5% 8/15/06 | | | | 1,000 | | | | 1,010 |
| Florida Gen. Oblig. (Dept. of Trans. Right of Way Proj.) | | | | | | | | |
| Series B, 6.375% 7/1/08 | | | | 3,000 | | | | 3,214 |
| Highlands County Health Facilities Auth. Rev. (Adventist | | | | | | | | |
| Health Sys./Sunbelt Obligated Group Proj.): | | | | | | | | |
| Series A, 5% 11/15/10 | | | | 1,000 | | | | 1,052 |
| Series B, 5% 11/15/08 | | | | 800 | | | | 829 |
| 3.95%, tender 9/1/12 (b) | | | | 7,550 | | | | 7,515 |
| 5%, tender 11/16/09 (b) | | | | 4,700 | | | | 4,901 |
| Hillsborough County Indl. Dev. Auth. Poll. Cont. Rev. | | | | | | | | |
| (Tampa Elec. Co. Proj.): | | | | | | | | |
| 4%, tender 8/1/07 (b) | | | | 11,000 | | | | 11,001 |
| 4.25%, tender 8/1/07 (b)(c) | | | | 6,000 | | | | 6,001 |
| Lee Memorial Health Sys. Board of Directors Hosp. Rev. | | | | | | | | |
| Series A, 5.75% 4/1/12 (FSA Insured) | | | | 1,980 | | | | 2,201 |
See accompanying notes which are an integral part of the financial statements.
13 Annual Report
| Investments continued | | | | | | | | | | |
| |
| |
| Municipal Bonds continued | | | | | | | | | | |
| | | | | Principal | | Value (Note 1) |
| | | | | Amount (000s) | | (000s) |
| Florida – continued | | | | | | | | | | |
| Miami-Dade County Cap. Asset Acquisition | | | | | | | | |
| Fixed Rate Spl. Oblig. Series 2002 A, 5% 4/1/08 | | | | | | | | |
| (AMBAC Insured) | | | | $ | | 2,825 | | $ | | 2,928 |
| Miami-Dade County School Board Ctfs. of Prtn. 5%, | | | | | | | | |
| tender 5/1/11 (MBIA Insured) (b) | | | | | | 1,500 | | | | 1,598 |
| Orlando Utils. Commission Util. Sys. Rev. 5.25% 7/1/09 | | | | 6,000 | | | | 6,368 |
| Pasco County Solid Waste Disp. & Resource Recovery | | | | | | | | |
| Sys. Rev. 5.75% 4/1/06 (AMBAC Insured) (c) | | | | 1,500 | | | | 1,508 |
| Polk County Cap. Impt. Rev. Series 2004, 5.5%, tender | | | | | | | | |
| 12/1/10 (FSA Insured) (b) | | | | | | 9,000 | | | | 9,695 |
| Seminole County School Board Ctfs. of Prtn. | | | | | | | | |
| Series A, 4.5% 7/1/08 (MBIA Insured) | | | | | | 1,250 | | | | 1,285 |
| Univ. Athletic Assoc., Inc. Athletic Prog. Rev. | | | | | | | | |
| Series 2001: | | | | | | | | | | |
| 2.8%, tender 10/1/08, LOC SunTrust Banks of | | | | | | | | |
| Florida, Inc. (b) | | | | | | 2,000 | | | | 1,961 |
| 3%, tender 10/1/09, LOC SunTrust Banks, Inc. (b) | | | | 1,000 | | | | 978 |
| Volusia County School Board Ctfs. of Prtn. (School Board | | | | | | | | |
| of Volusia County Master Lease Prog.) 5% 8/1/08 | | | | | | | | |
| (FSA Insured) | | | | | | 1,625 | | | | 1,688 |
| | | | | | | | | | | 66,264 |
| |
| Georgia – 0.7% | | | | | | | | | | |
| Cobb County Dev. Auth. Solid Waste Disp. Rev. | | | | | | | | |
| (Georgia Waste Mgmt. Proj.) Series A, 3.65%, tender | | | | | | | | |
| 4/1/06 (b)(c) | | | | | | 1,000 | | | | 1,000 |
| Columbia County Gen. Oblig. 5% 1/1/09 | | | | | | | | |
| (FSA Insured) | | | | | | 1,505 | | | | 1,577 |
| Fulton DeKalb Hosp. Auth. Hosp. Rev. 5% 1/1/08 | | | | | | | | |
| (FSA Insured) | | | | | | 2,250 | | | | 2,318 |
| Georgia Muni. Elec. Auth. Pwr. Rev. Series 1992 B, | | | | | | | | |
| 8.25% 1/1/11 (MBIA Insured) | | | | | | 4,105 | | | | 4,953 |
| Gwinnett County Gen. Oblig. 4% 1/1/06 | | | | | | 1,035 | | | | 1,035 |
| Henry County Wtr. & Swr. Auth. Rev. 5% 2/1/08 | | | | | | | | |
| (MBIA Insured) | | | | | | 1,095 | | | | 1,133 |
| | | | | | | | | | | 12,016 |
| |
| Hawaii – 2.3% | | | | | | | | | | |
| Hawaii Arpts. Sys. Rev. Series 2000 B, 8% 7/1/10 | | | | | | | | |
| (FGIC Insured) (c) | | | | | | 3,850 | | | | 4,482 |
| Hawaii Gen. Oblig. Series CU: | | | | | | | | | | |
| 5.75% 10/1/11 (MBIA Insured) | | | | | | 3,040 | | | | 3,338 |
| |
| |
| See accompanying notes which are an integral part of the financial statements. | | | | |
| |
| Annual Report | | 14 | | | | | | | | |
| Municipal Bonds continued | | | | | | | | |
| | | Principal | | Value (Note 1) |
| | | Amount (000s) | | (000s) |
| Hawaii – continued | | | | | | | | |
| Hawaii Gen. Oblig. Series CU: – continued | | | | | | | | |
| 5.75% 10/1/11 (Pre-Refunded to 10/1/10 @ | | | | | | | | |
| 100) (d) | | $ | | 170 | | $ | | 187 |
| Honolulu City & County Gen. Oblig. Series B, 8% | | | | | | | | |
| 10/1/09 | | | | 26,940 | | | | 31,183 |
| | | | | | | | | 39,190 |
| |
| Illinois – 9.4% | | | | | | | | |
| Chicago Gen. Oblig.: | | | | | | | | |
| (Neighborhoods Alive 21 Prog.): | | | | | | | | |
| 5% 1/1/07 (MBIA Insured) | | | | 1,360 | | | | 1,382 |
| 5% 1/1/08 (MBIA Insured) | | | | 1,190 | | | | 1,227 |
| Series A, 5.25% 1/1/12 (FSA Insured) | | | | 1,000 | | | | 1,085 |
| Chicago Midway Arpt. Rev.: | | | | | | | | |
| Series 2001 B, 5% 1/1/07 (FSA Insured) | | | | 1,000 | | | | 1,015 |
| Series B: | | | | | | | | |
| 5% 1/1/10 (AMBAC Insured) | | | | 1,225 | | | | 1,292 |
| 5% 1/1/11 (AMBAC Insured) | | | | 3,625 | | | | 3,845 |
| Chicago O’Hare Int’l. Arpt. Rev.: | | | | | | | | |
| Series 2001 C, 5% 1/1/07 (AMBAC Insured) (c) | | | | 2,670 | | | | 2,708 |
| Series A: | | | | | | | | |
| 5% 1/1/12 (MBIA Insured) | | | | 1,135 | | | | 1,211 |
| 5.5% 1/1/08 (AMBAC Insured) | | | | 5,000 | | | | 5,109 |
| 5.5% 1/1/10 (AMBAC Insured) (c) | | | | 5,000 | | | | 5,318 |
| Chicago Park District: | | | | | | | | |
| Series B, 5% 1/1/11 (AMBAC Insured) | | | | 5,750 | | | | 6,123 |
| Series C, 5% 1/1/11 (AMBAC Insured) | | | | 2,515 | | | | 2,678 |
| Chicago School Fin. Auth. Series B, 5% 6/1/09 | | | | | | | | |
| (FSA Insured) | | | | 12,825 | | | | 13,458 |
| Chicago Tax Increment Rev. Series 2000 A, 0% | | | | | | | | |
| 12/1/08 (AMBAC Insured) | | | | 10,000 | | | | 9,041 |
| Chicago Transit Auth. Cap. Grant Receipts Rev.: | | | | | | | | |
| (Fed. Transit Administration Section 5307 Formula | | | | | | | | |
| Funds Proj.) Series A, 5.25% 6/1/10 (AMBAC | | | | | | | | |
| Insured) | | | | 4,785 | | | | 5,120 |
| Series A, 4.25% 6/1/08 (AMBAC Insured) | | | | 3,600 | | | | 3,614 |
| Chicago Wastewtr. Transmission Rev. 5.5% 1/1/09 | | | | | | | | |
| (FGIC Insured) | | | | 2,975 | | | | 3,151 |
| Cook County Cmnty. College District #508 Ctfs. of Prtn. | | | | | | | | |
| 8.75% 1/1/07 (FGIC Insured) | | | | 8,000 | | | | 8,419 |
| Du Page Wtr. Commission Wtr. Rev. 5% 5/1/08 | | | | | | | | |
| (AMBAC Insured) | | | | 4,525 | | | | 4,687 |
See accompanying notes which are an integral part of the financial statements.
15 Annual Report
| Investments continued | | | | | | | | |
| |
| |
| Municipal Bonds continued | | | | | | | | |
| | | Principal | | Value (Note 1) |
| | | Amount (000s) | | (000s) |
| Illinois – continued | | | | | | | | |
| Granite City Solid Waste Disp. Rev. (Waste Mgmt., Inc. | | | | | | | | |
| Proj.) 3.85%, tender 5/1/08 (b)(c) | | $ | | 2,200 | | $ | | 2,191 |
| Hodgkins Tax Increment Rev.: | | | | | | | | |
| 5% 1/1/07 | | | | 1,000 | | | | 1,013 |
| 5% 1/1/09 | | | | 1,805 | | | | 1,867 |
| Illinois Dev. Fin. Auth. Gas Supply Rev. (The Peoples Gas | | | | | | | | |
| Lt. & Coke Co. Proj.) Series 2003 B, 3.05%, tender | | | | | | | | |
| 2/1/08 (AMBAC Insured) (b) | | | | 6,100 | | | | 6,017 |
| Illinois Dev. Fin. Auth. Rev. (DePaul Univ. Proj.) Series | | | | | | | | |
| 2004 C, 5.5% 10/1/10 | | | | 1,900 | | | | 2,026 |
| Illinois Edl. Facilities Auth. Revs.: | | | | | | | | |
| (Art Institute of Chicago Proj.) Series 2003, 3.85%, | | | | | | | | |
| tender 3/1/11 (b) | | | | 12,800 | | | | 12,658 |
| (Univ. of Chicago Proj.): | | | | | | | | |
| Series 2004 B1, 3.45%, tender 7/1/08 (b) | | | | 6,100 | | | | 6,096 |
| Series A, 5.25% 7/1/41 (Pre-Refunded to 7/1/11 | | | | | | | | |
| @ 101) (d) | | | | 2,640 | | | | 2,881 |
| Series B: | | | | | | | | |
| 3.1%, tender 7/1/07 (b)(d) | | | | 5 | | | | 5 |
| 3.1%, tender 7/1/07 (b) | | | | 3,895 | | | | 3,858 |
| Illinois Fin. Auth. Rev. (DePaul Univ. Proj.): | | | | | | | | |
| 5% 10/1/06 | | | | 1,115 | | | | 1,125 |
| 5% 10/1/07 | | | | 1,225 | | | | 1,249 |
| 5% 10/1/08 | | | | 1,000 | | | | 1,035 |
| Illinois Gen. Oblig.: | | | | | | | | |
| First Series 2001, 5.25% 5/1/11 (FSA Insured) | | | | 1,475 | | | | 1,595 |
| First Series: | | | | | | | | |
| 5.25% 4/1/08 (MBIA Insured) | | | | 1,035 | | | | 1,078 |
| 5.5% 8/1/10 | | | | 1,415 | | | | 1,531 |
| 6% 1/1/11 (Pre-Refunded to 1/1/10 @ 100) (d) | | | | 7,075 | | | | 7,759 |
| Series A, 5% 10/1/09 | | | | 2,600 | | | | 2,739 |
| 5.75% 4/1/12 (Pre-Refunded to 4/1/10 @ 100) (d) . | | | | 1,000 | | | | 1,092 |
| Illinois Health Facilities Auth. Rev. (Condell Med. Ctr. | | | | | | | | |
| Proj.): | | | | | | | | |
| 5% 5/15/07 | | | | 500 | | | | 504 |
| 5% 5/15/08 | | | | 700 | | | | 715 |
| Kane & DeKalb Counties Cmnty. Unit School District | | | | | | | | |
| #301 0% 12/1/10 (AMBAC Insured) | | | | 2,000 | | | | 1,660 |
| Kane & DuPage Counties Cmnty. Unit School District | | | | | | | | |
| #303, Saint Charles Series A, 5.5% 1/1/12 | | | | | | | | |
| (FSA Insured) | | | | 2,270 | | | | 2,493 |
See accompanying notes which are an integral part of the financial statements.
| Municipal Bonds continued | | | | | | | | |
| | | Principal | | Value (Note 1) |
| | | Amount (000s) | | (000s) |
| Illinois – continued | | | | | | | | |
| Kane County School District #129, Aurora West Side | | | | | | | | |
| Series A, 5.75% 2/1/14 (Pre-Refunded to 2/1/12 @ | | | | | | | | |
| 100) (d) | | $ | | 1,600 | | $ | | 1,790 |
| Kane, McHenry, Cook & DeKalb Counties Cmnty. Unit | | | | | | | | |
| School District #300, Carpentersville 5.5% 12/1/13 | | | | | | | | |
| (Pre-Refunded to 12/1/11 @ 100) (d) | | | | 5,000 | | | | 5,515 |
| Lake County Cmnty. High School District #128, | | | | | | | | |
| Libertyville Series 2004, 5% 1/1/11 | | | | 2,365 | | | | 2,519 |
| Rosemont Gen. Oblig. Series 3: | | | | | | | | |
| 0% 12/1/07 (Escrowed to Maturity) (d) | | | | 2,375 | | | | 2,225 |
| 0% 12/1/07 (FGIC Insured) | | | | 625 | | | | 585 |
| Univ. of Illinois Auxiliary Facilities Sys. Rev. Series 2001 | | | | | | | | |
| A, 5% 4/1/08 (AMBAC Insured) | | | | 2,035 | | | | 2,105 |
| Univ. of Illinois Ctfs. of Prtn. (Util. Infrastructure Projs.) | | | | | | | | |
| 5% 8/15/11 (AMBAC Insured) | | | | 1,360 | | | | 1,451 |
| Will County School District #122 Series B: | | | | | | | | |
| 0% 11/1/08 (Escrowed to Maturity) (d) | | | | 220 | | | | 199 |
| 0% 11/1/08 (FSA Insured) | | | | 1,280 | | | | 1,159 |
| | | | | | | | | 161,218 |
| |
| Indiana – 3.7% | | | | | | | | |
| Carmel High School Bldg. Corp. 5% 1/10/11 | | | | | | | | |
| (FSA Insured) | | | | 1,000 | | | | 1,066 |
| Ctr. Grove 2000 Bldg. Corp.: | | | | | | | | |
| 5.5% 7/15/17 (Pre-Refunded to 7/15/11 @ 100) (d) | | | | 1,785 | | | | 1,961 |
| 5.5% 7/15/18 (Pre-Refunded to 7/15/11 @ 100) (d) | | | | 1,885 | | | | 2,071 |
| Hamilton Southeastern Consolidated School Bldg. Corp.: | | | | | | | | |
| Series A: | | | | | | | | |
| 5% 1/10/10 (FSA Insured) | | | | 1,750 | | | | 1,852 |
| 5.25% 7/10/11 (FSA Insured) | | | | 2,295 | | | | 2,483 |
| 5.25% 1/10/12 (FSA Insured) | | | | 1,355 | | | | 1,472 |
| 5% 1/15/10 (FSA Insured) | | | | 1,835 | | | | 1,942 |
| 5% 1/15/11 (FSA Insured) | | | | 1,910 | | | | 2,036 |
| 5% 1/15/12 (FSA Insured) | | | | 1,990 | | | | 2,135 |
| 5.5% 7/15/16 (Pre-Refunded to 7/15/11 @ 100) (d) | | | | 1,855 | | | | 2,038 |
| Indiana Health Facility Fing. Auth. Rev.: | | | | | | | | |
| (Ascension Health Cr. Group Prog.) Series 2002 F, | | | | | | | | |
| 5.5% 11/15/06 | | | | 1,000 | | | | 1,018 |
| (Ascension Health Cr. Group, Inc. Proj.) Series A, 5%, | | | | | | | | |
| tender 5/1/07 (b) | | | | 7,100 | | | | 7,241 |
| Indianapolis Local Pub. Impt. Bond Bank (Indianapolis | | | | | | | | |
| Arpt. Auth. Proj.) Series I: | | | | | | | | |
| 4% 1/1/06 (MBIA Insured) (c) | | | | 1,325 | | | | 1,325 |
See accompanying notes which are an integral part of the financial statements.
17 Annual Report
| Investments continued | | | | | | | | |
| |
| |
| Municipal Bonds continued | | | | | | | | |
| | | Principal | | Value (Note 1) |
| | | Amount (000s) | | (000s) |
| Indiana – continued | | | | | | | | |
| Indianapolis Local Pub. Impt. Bond Bank (Indianapolis | | | | | | | | |
| Arpt. Auth. Proj.) Series I: – continued | | | | | | | | |
| 5% 1/1/08 (MBIA Insured) (c) | | $ | | 1,550 | | $ | | 1,590 |
| Indianapolis Resource Recovery Rev. (Ogden Martin | | | | | | | | |
| Sys., Inc. Proj.) 6.75% 12/1/07 (AMBAC Insured) | | | | 3,000 | | | | 3,137 |
| Ivy Tech State College Series I, 5% 7/1/09 | | | | | | | | |
| (AMBAC Insured) | | | | 1,405 | | | | 1,478 |
| Logansport High School Bldg. Corp.: | | | | | | | | |
| 5.25% 1/15/11 (MBIA Insured) | | | | 1,000 | | | | 1,073 |
| 5.25% 7/15/11 (MBIA Insured) | | | | 1,020 | | | | 1,098 |
| 5.25% 1/15/12 (MBIA Insured) | | | | 1,045 | | | | 1,129 |
| 5.25% 7/15/12 (MBIA Insured) | | | | 1,075 | | | | 1,165 |
| Mount Vernon of Hancock County Multi-School Corp. | | | | | | | | |
| Series B: | | | | | | | | |
| 5.5% 7/15/16 (Pre-Refunded to 7/15/11 @ 100) (d) | | | | 1,605 | | | | 1,763 |
| 5.5% 7/15/17 (Pre-Refunded to 7/15/11 @ 100) (d) | | | | 1,695 | | | | 1,862 |
| Muncie School Bldg. Corp. 5.25% 7/10/12 | | | | | | | | |
| (MBIA Insured) | | | | 1,585 | | | | 1,727 |
| New Albany Floyd County Independent School Bldg. | | | | | | | | |
| Corp. 5% 1/15/11 (FSA Insured) | | | | 1,000 | | | | 1,066 |
| Rockport Poll. Cont. Rev. 4.9%, tender 6/1/07 (b) | | | | 4,000 | | | | 4,045 |
| Saint Joseph County Ind. Edl. Facilities Rev. (Univ. of | | | | | | | | |
| Notre Dame Du Lac Proj.) 2.5%, tender 12/3/07 (b) . | | | | 10,000 | | | | 9,791 |
| West Clark 2000 School Bldg. Corp.: | | | | | | | | |
| 5.25% 1/15/11 (MBIA Insured) | | | | 1,065 | | | | 1,145 |
| 5.25% 7/15/11 (MBIA Insured) | | | | 1,125 | | | | 1,214 |
| 5.25% 1/15/12 (MBIA Insured) | | | | 1,150 | | | | 1,246 |
| | | | | | | | | 63,169 |
| |
| Kansas 0.2% | | | | | | | | |
| Burlington Envir. Impt. Rev. (Kansas City Pwr. & Lt. Co. | | | | | | | | |
| Proj.) Series A, 4.75%, tender 10/1/07 (b) | | | | 2,400 | | | | 2,438 |
| Kansas Dev. Fin. Auth. Health Facilities Rev. (Hays Med. | | | | | | | | |
| Ctr. Proj.) Series 2005 L: | | | | | | | | |
| 5.25% 11/15/10 | | | | 545 | | | | 580 |
| 5.25% 11/15/12 | | | | 680 | | | | 728 |
| | | | | | | | | 3,746 |
| |
| Kentucky 0.7% | | | | | | | | |
| Kenton County Arpt. Board Arpt. Rev. Series B, 5% | | | | | | | | |
| 3/1/09 (MBIA Insured) (c) | | | | 1,185 | | | | 1,231 |
See accompanying notes which are an integral part of the financial statements.
| Municipal Bonds continued | | | | | | | | |
| | | Principal | | Value (Note 1) |
| | | Amount (000s) | | (000s) |
| Kentucky – continued | | | | | | | | |
| Owensboro Elec. Lt. & Pwr. Rev. Series B: | | | | | | | | |
| 0% 1/1/07 (AMBAC Insured) | | $ | | 10,000 | | $ | | 9,667 |
| 0% 1/1/09 (AMBAC Insured) | | | | 2,000 | | | | 1,795 |
| | | | | | | | | 12,693 |
| |
| Louisiana – 0.1% | | | | | | | | |
| East Baton Rouge Parish Pub. Impt. Sales Tax Rev. | | | | | | | | |
| Series B, 5% 2/1/12 (AMBAC Insured) | | | | 1,000 | | | | 1,068 |
| Maryland 0.1% | | | | | | | | |
| Prince Georges County Ctfs. of Prtn. (Equip. Acquisition | | | | | | | | |
| Prog.) 5.25% 5/15/10 (MBIA Insured) | | | | 1,535 | | | | 1,646 |
| Massachusetts 2.8% | | | | | | | | |
| Massachusetts Bay Trans. Auth. Series A, 7% 3/1/09 | | | | 6,880 | | | | 7,597 |
| Massachusetts Dev. Fin. Agcy. Rev. (Massachusetts | | | | | | | | |
| Biomedical Research Corp. Proj.) Series C: | | | | | | | | |
| 5.75% 8/1/06 | | | | 1,200 | | | | 1,214 |
| 5.875% 8/1/08 | | | | 1,630 | | | | 1,703 |
| Massachusetts Fed. Hwy.: | | | | | | | | |
| Series 2000 A, 5.75% 6/15/13 | | | | 3,000 | | | | 3,275 |
| Series B, 5.125% 12/15/14 (Pre-Refunded to | | | | | | | | |
| 12/15/08 @ 101) (d) | | | | 2,775 | | | | 2,924 |
| Massachusetts Gen. Oblig.: | | | | | | | | |
| Series 1999 C, 5.625% 9/1/12 (Pre-Refunded to | | | | | | | | |
| 9/1/09 @ 101) (d) | | | | 2,570 | | | | 2,778 |
| Series 2001 A, 5.5% 1/1/11 | | | | 5,000 | | | | 5,437 |
| Series 2003 A, 5.375% 8/1/08 | | | | 5,165 | | | | 5,414 |
| Series 2003 C, 5.5% 10/1/10 (MBIA Insured) | | | | 1,130 | | | | 1,228 |
| Series A, 4.5% 1/1/09 (Pre-Refunded to 1/1/08 @ | | | | | | | | |
| 101) (d) | | | | 2,055 | | | | 2,116 |
| Series C, 5.25% 11/1/30 (Pre-Refunded to 11/1/12 | | | | | | | | |
| @ 100) (d) | | | | 2,495 | | | | 2,704 |
| Massachusetts Health & Edl. Facilities Auth. Rev. | | | | | | | | |
| (Berkshire Health Sys., Inc. Proj.) Series F, 5% | | | | | | | | |
| 10/1/08 | | | | 2,720 | | | | 2,817 |
| Massachusetts Port Auth. Spl. Facilities Rev. | | | | | | | | |
| (Delta Air Lines, Inc. Proj.) Series A, 5.5% 1/1/12 | | | | | | | | |
| (AMBAC Insured) (c) | | | | 1,000 | | | | 1,064 |
| Springfield Gen. Oblig.: | | | | | | | | |
| 5% 1/15/06 (MBIA Insured) | | | | 1,000 | | | | 1,000 |
| 5.25% 8/1/12 (MBIA Insured) | | | | 6,000 | | | | 6,553 |
| | | | | | | | | 47,824 |
See accompanying notes which are an integral part of the financial statements.
19 Annual Report
| Investments continued | | | | | | | | |
| |
| |
| Municipal Bonds continued | | | | | | | | |
| | | Principal | | Value (Note 1) |
| | | Amount (000s) | | (000s) |
| Michigan – 3.3% | | | | | | | | |
| Chippewa Valley Schools 5% 5/1/08 | | $ | | 1,260 | | $ | | 1,306 |
| Detroit City School District Series A, 5.5% 5/1/11 | | | | | | | | |
| (FSA Insured) | | | | 1,200 | | | | 1,316 |
| Detroit Gen. Oblig.: | | | | | | | | |
| Series 2004 A, 5% 4/1/08 (FSA Insured) | | | | 7,275 | | | | 7,541 |
| Series A, 5% 4/1/07 (FSA Insured) | | | | 6,910 | | | | 7,053 |
| 5% 4/1/08 (MBIA Insured) | | | | 14,545 | | | | 15,077 |
| 5% 4/1/09 (MBIA Insured) | | | | 10,620 | | | | 11,170 |
| Detroit Swr. Disp. Rev. Series A, 5.75% 7/1/26 (Pre Re | | | | | | | | |
| funded to 1/1/10 @ 101) (d) | | | | 2,000 | | | | 2,180 |
| Greater Detroit Resource Recovery Auth. Rev. Series A, | | | | | | | | |
| 6.25% 12/13/07 (AMBAC Insured) | | | | 4,000 | | | | 4,216 |
| Hazel Park School District 5% 5/1/08 | | | | 1,275 | | | | 1,321 |
| Livonia Pub. School District Series II, 0% 5/1/21 | | | | | | | | |
| (FGIC Insured) (Pre-Refunded to 5/1/07 @ 39.31) | | | | 8,000 | | | | 3,000 |
| Troy School District 5% 5/1/11 (MBIA Insured) (a) | | | | 1,000 | | | | 1,054 |
| Wayne-Westland Cmnty. Schools 5% 5/1/10 | | | | | | | | |
| (FSA Insured) | | | | 1,225 | | | | 1,303 |
| | | | | | | | | 56,537 |
| |
| Minnesota 0.2% | | | | | | | | |
| Minneapolis & Saint Paul Hsg. & Redev. Auth. Health | | | | | | | | |
| Care Sys. Rev. (Health Partners Oblig. Group Proj.): | | | | | | | | |
| 5.25% 12/1/08 | | | | 1,200 | | | | 1,248 |
| 5.25% 12/1/10 | | | | 500 | | | | 530 |
| Saint Paul Port Auth. Lease Rev. (HealthEast Midway | | | | | | | | |
| Campus Proj.) Series 2003 A, 5% 5/1/10 | | | | 700 | | | | 696 |
| Waconia Independent School District #110 Series A, 5% | | | | | | | | |
| 2/1/11 (FSA Insured) | | | | 940 | | | | 1,006 |
| | | | | | | | | 3,480 |
| |
| Mississippi – 0.1% | | | | | | | | |
| Mississippi Higher Ed. Student Ln. Series 2000 B3, 5.3% | | | | | | | | |
| 9/1/08 (c) | | | | 1,190 | | | | 1,228 |
| Missouri – 0.3% | | | | | | | | |
| Kansas City School District Bldg. Corp. Rev.: | | | | | | | | |
| (School District Elementary School Proj.) Series B, 5% | | | | | | | | |
| 2/1/11 (FGIC Insured) | | | | 1,850 | | | | 1,979 |
| Series A, 5% 2/1/08 (FGIC Insured) | | | | 2,000 | | | | 2,068 |
| Saint Louis Muni. Fin. Corp. Leasehold Rev. | | | | | | | | |
| (Callahan Courthouse Proj.) Series A, 5.75% 2/15/14 | | | | | | | | |
| (FGIC Insured) | | | | 1,050 | | | | 1,171 |
| | | | | | | | | 5,218 |
See accompanying notes which are an integral part of the financial statements.
| Municipal Bonds continued | | | | | | | | |
| | | Principal | | Value (Note 1) |
| | | Amount (000s) | | (000s) |
| Montana 0.2% | | | | | | | | |
| Forsyth Poll. Cont. Rev. (Portland Gen. Elec. Co. Projs.) | | | | | | | | |
| Series A, 5.2%, tender 5/1/09 (b) | | $ | | 2,900 | | $ | | 3,010 |
| Nebraska – 1.9% | | | | | | | | |
| Lancaster County School District #1 (Lincoln Pub. Schools | | | | | | | | |
| Proj.) 4% 1/15/06 | | | | 1,000 | | | | 1,000 |
| Nebraska Pub. Pwr. District Rev. Series A: | | | | | | | | |
| 0% 1/1/06 (MBIA Insured) | | | | 24,465 | | | | 24,465 |
| 0% 1/1/07 (MBIA Insured) | | | | 4,000 | | | | 3,867 |
| Omaha Pub. Pwr. District Elec. Rev. Series B, 4.5% | | | | | | | | |
| 2/1/09 | | | | 3,500 | | | | 3,615 |
| | | | | | | | | 32,947 |
| |
| Nevada 2.0% | | | | | | | | |
| Clark County Arpt. Rev. Series C: | | | | | | | | |
| 5% 7/1/06 (AMBAC Insured) (c) | | | | 800 | | | | 806 |
| 5% 7/1/08 (AMBAC Insured) (c) | | | | 2,215 | | | | 2,283 |
| 5% 7/1/09 (AMBAC Insured) (c) | | | | 2,700 | | | | 2,803 |
| 5% 7/1/10 (AMBAC Insured) (c) | | | | 1,225 | | | | 1,279 |
| 5% 7/1/11 (AMBAC Insured) (c) | | | | 1,790 | | | | 1,877 |
| Clark County Hwy. Impt. Rev. (Motor Vehicle Fuel Tax) | | | | | | | | |
| 5% 7/1/11 (AMBAC Insured) | | | | 3,230 | | | | 3,455 |
| Clark County School District: | | | | | | | | |
| Series 2000 A, 5.75% 6/15/17 (Pre-Refunded to | | | | | | | | |
| 6/15/10 @ 100) (d) | | | | 1,600 | | | | 1,749 |
| Series C, 5% 6/15/10 (MBIA Insured) | | | | 1,075 | | | | 1,143 |
| Series D, 5% 6/15/09 (MBIA Insured) | | | | 13,890 | | | | 14,630 |
| Henderson Health Care Facility Rev. (Catholic Healthcare | | | | | | | | |
| West Proj.) Series 2005 B, 5% 7/1/08 | | | | 1,100 | | | | 1,137 |
| Lyon Co. School District Gen. Oblig.: | | | | | | | | |
| 5% 6/1/07 (a) | | | | 490 | | | | 498 |
| 5% 6/1/09 (a) | | | | 695 | | | | 723 |
| Washoe County School District Gen. Oblig. Series D, 5% | | | | | | | | |
| 6/1/10 (MBIA Insured) | | | | 2,410 | | | | 2,561 |
| | | | | | | | | 34,944 |
| |
| New Hampshire – 0.2% | | | | | | | | |
| New Hampshire Bus. Fin. Auth. Poll. Cont. Rev. | | | | | | | | |
| (United Illumination Co.) Series A, 3.65%, tender | | | | | | | | |
| 2/1/10 (AMBAC Insured) (b)(c) | | | | 2,500 | | | | 2,472 |
| New Hampshire Tpk. Sys. Rev. 5% 5/1/07 | | | | | | | | |
| (AMBAC Insured) (a) | | | | 1,500 | | | | 1,515 |
| | | | | | | | | 3,987 |
See accompanying notes which are an integral part of the financial statements.
21 Annual Report
| Investments continued | | | | | | | | |
| |
| |
| Municipal Bonds continued | | | | | | | | |
| | | Principal | | Value (Note 1) |
| | | Amount (000s) | | (000s) |
| New Jersey – 6.9% | | | | | | | | |
| Camden County Impt. Auth. Rev. (Cooper Health Sys. | | | | | | | | |
| Obligated Group Proj.) Series B, 5.25% 2/15/09 | | $ | | 1,250 | | $ | | 1,293 |
| Casino Reinvestment Dev. Auth. Hotel Room Fee Rev.: | | | | | | | | |
| 5% 1/1/08 (AMBAC Insured) | | | | 920 | | | | 947 |
| 5% 1/1/09 (AMBAC Insured) | | | | 1,000 | | | | 1,044 |
| Elizabeth Gen. Oblig. 5.25% 8/15/09 (MBIA Insured) . | | | | 1,225 | | | | 1,303 |
| Garden State Preservation Trust Open Space & | | | | | | | | |
| Farmland Preservation Series B: | | | | | | | | |
| 6.25% 11/1/09 (MBIA Insured) | | | | 4,000 | | | | 4,408 |
| 6.375% 11/1/11 (MBIA Insured) | | | | 7,470 | | | | 8,571 |
| New Jersey Econ. Dev. Auth. Rev. 5% 6/15/07 | | | | 7,500 | | | | 7,623 |
| New Jersey Gen. Oblig. Series 2005 N, 5% 7/15/08 | | | | | | | | |
| (FGIC Insured) | | | | 6,175 | | | | 6,423 |
| New Jersey Tpk. Auth. Tpk. Rev. Series 2004 A, 3.15%, | | | | | | | | |
| tender 1/1/10 (AMBAC Insured) (b) | | | | 9,150 | | | | 9,025 |
| New Jersey Trans. Trust Fund Auth.: | | | | | | | | |
| Series 2001 A, 5% 6/15/06 | | | | 355 | | | | 358 |
| Series A, 5.25% 12/15/08 (MBIA Insured) | | | | 13,500 | | | | 14,186 |
| Series B: | | | | | | | | |
| 5.25% 12/15/10 (FGIC Insured) | | | | 4,550 | | | | 4,896 |
| 5.25% 12/15/11 (FGIC Insured) | | | | 10,015 | | | | 10,864 |
| 5.25% 12/15/12 (FGIC Insured) | | | | 4,800 | | | | 5,243 |
| 6.5% 6/15/11 (MBIA Insured) | | | | 5,000 | | | | 5,685 |
| Series C, 5.5% 12/15/10 (FSA Insured) | | | | 25,000 | | | | 27,181 |
| New Jersey Transit Corp. Series 2000 B, 5.5% 2/1/08 | | | | | | | | |
| (AMBAC Insured) | | | | 1,000 | | | | 1,043 |
| New Jersey Transit Corp. Ctfs. of Prtn. Series A, 6% | | | | | | | | |
| 9/15/13 (Pre-Refunded to 9/15/09 @ 100) (d) | | | | 7,000 | | | | 7,614 |
| | | | | | | | | 117,707 |
| |
| New Jersey/Pennsylvania – 0.3% | | | | | | | | |
| Delaware River Joint Toll Bridge Commission Bridge Rev. | | | | | | | | |
| 5% 7/1/09 | | | | 5,170 | | | | 5,416 |
| New Mexico – 0.4% | | | | | | | | |
| Farmington Poll. Cont. Rev. (Pub. Svc. Co. of New | | | | | | | | |
| Mexico San Juan and Four Corners Projs.) | | | | | | | | |
| Series 2003 B, 2.1%, tender 4/1/06 (b) | | | | 7,000 | | | | 6,960 |
| New York – 11.8% | | | | | | | | |
| Grand Central District Mgmt. Assoc., Inc.: | | | | | | | | |
| 5% 1/1/10 | | | | 1,200 | | | | 1,264 |
| 5% 1/1/12 | | | | 1,175 | | | | 1,251 |
| Metropolitan Trans. Auth. Commuter Facilities Rev. Series A, | | | | | | | | |
| 5.375% 7/1/09 (Escrowed to Maturity) (d) | | | | 3,635 | | | | 3,882 |
See accompanying notes which are an integral part of the financial statements.
| Municipal Bonds continued | | | | | | | | |
| | | Principal | | Value (Note 1) |
| | | Amount (000s) | | (000s) |
| New York – continued | | | | | | | | |
| Metropolitan Trans. Auth. Rev. Series 2005 C: | | | | | | | | |
| 5% 11/15/10 | | $ | | 2,000 | | $ | | 2,121 |
| 5% 11/15/11 | | | | 2,750 | | | | 2,932 |
| Metropolitan Trans. Auth. Svc. Contract Rev. Series B, 5% | | | | | | | | |
| 1/1/06 | | | | 10,110 | | | | 10,110 |
| Nassau County Gen. Oblig. Series Z, 5% 9/1/11 | | | | | | | | |
| (FGIC Insured) | | | | 800 | | | | 848 |
| New York City Gen. Oblig.: | | | | | | | | |
| Series 1996 B, 6.5% 8/15/09 | | | | 3,425 | | | | 3,756 |
| Series 2000 A, 6.5% 5/15/11 | | | | 2,075 | | | | 2,325 |
| Series 2002 G, 5.5% 8/1/10 | | | | 2,720 | | | | 2,928 |
| Series 2004 G, 5% 8/1/09 | | | | 8,000 | | | | 8,380 |
| Series 2005 C, 5% 8/1/12 | | | | 19,770 | | | | 21,055 |
| Series 2005 D, 5% 8/1/12 | | | | 4,925 | | | | 5,245 |
| Series 2005 G, 5.625% 8/1/13 (MBIA Insured) | | | | 5,075 | | | | 5,618 |
| Series 2005 K: | | | | | | | | |
| 5% 8/1/11 | | | | 7,120 | | | | 7,553 |
| 5% 8/1/12 | | | | 4,360 | | | | 4,643 |
| Series 2005 O, 5% 6/1/12 | | | | 7,500 | | | | 7,998 |
| Series A, 5.25% 11/1/14 (MBIA Insured) | | | | 600 | | | | 651 |
| Series B, 5.75% 8/1/14 | | | | 1,000 | | | | 1,104 |
| Series E, 6% 8/1/11 | | | | 60 | | | | 62 |
| Series G, 5.25% 8/1/14 (AMBAC Insured) | | | | 1,000 | | | | 1,077 |
| Subseries 2005 F1, 5% 9/1/15 | | | | 3,560 | | | | 3,813 |
| New York City Indl. Dev. Agcy. Spl. Facilities Rev. (Term. | | | | | | | | |
| One Group Assoc. Proj.) 5% 1/1/07 (c) | | | | 1,700 | | | | 1,719 |
| New York City Muni. Wtr. Fin. Auth. Wtr. & Swr. Sys. | | | | | | | | |
| Rev. Series B, 5.875% 6/15/26 (Pre-Refunded to | | | | | | | | |
| 6/15/06 @ 101) (d) | | | | 7,320 | | | | 7,473 |
| New York City Transitional Fin. Auth. Rev. Series E: | | | | | | | | |
| 4.5% 2/1/07 | | | | 245 | | | | 248 |
| 4.5% 2/1/07 (Escrowed to Maturity) (d) | | | | 1,505 | | | | 1,525 |
| New York State Dorm. Auth. Revs.: | | | | | | | | |
| (City Univ. Sys. Consolidation Proj.): | | | | | | | | |
| Series 2000 A, 6.125% 7/1/12 (AMBAC Insured) . | | | | 5,540 | | | | 6,177 |
| Series A, 5.75% 7/1/13 | | | | 3,500 | | | | 3,849 |
| Series C, 7.5% 7/1/10 | | | | 3,100 | | | | 3,377 |
| Series 2003 A: | | | | | | | | |
| 5% 1/1/06 | | | | 1,250 | | | | 1,250 |
| 5% 3/15/08 | | | | 2,000 | | | | 2,070 |
| Series B, 5.25%, tender 5/15/12 (b) | | | | 13,000 | | | | 14,010 |
| 5.75% 7/1/13 (AMBAC Insured) | | | | 1,000 | | | | 1,103 |
See accompanying notes which are an integral part of the financial statements.
23 Annual Report
| Investments continued | | | | | | | | |
| |
| |
| Municipal Bonds continued | | | | | | | | |
| | | Principal | | Value (Note 1) |
| | | Amount (000s) | | (000s) |
| New York – continued | | | | | | | | |
| New York State Urban Dev. Corp. Rev. 5% 1/1/12 | | $ | | 5,000 | | $ | | 5,330 |
| New York Transitional Fin. Auth. Rev. Series 2003 E: | | | | | | | | |
| 4.5% 2/1/08 | | | | 1,500 | | | | 1,536 |
| 5% 2/1/09 | | | | 2,035 | | | | 2,132 |
| Tobacco Settlement Fing. Corp.: | | | | | | | | |
| Series 2004 B1, 5% 6/1/09 | | | | 3,800 | | | | 3,964 |
| Series A1: | | | | | | | | |
| 5.25% 6/1/12 | | | | 5,000 | | | | 5,041 |
| 5.25% 6/1/13 | | | | 17,500 | | | | 18,221 |
| Series B1: | | | | | | | | |
| 4% 6/1/07 | | | | 6,000 | | | | 6,047 |
| 5% 6/1/06 | | | | 17,815 | | | | 17,932 |
| | | | | | | | | 201,620 |
| |
| New York & New Jersey – 0.6% | | | | | | | | |
| Port Auth. of New York & New Jersey: | | | | | | | | |
| 124th Series, 5% 8/1/13 (FGIC Insured) (c) | | | | 1,200 | | | | 1,242 |
| 127th Series, 5% 12/15/08 (AMBAC Insured) (c) | | | | 3,510 | | | | 3,649 |
| Port Auth. of New York & New Jersey Spl. Oblig. Rev. | | | | | | | | |
| (JFK Int’l. Air Term. Spl. Proj.) Series 6, 6.25% | | | | | | | | |
| 12/1/13 (MBIA Insured) (c) | | | | 4,100 | | | | 4,610 |
| | | | | | | | | 9,501 |
| |
| North Carolina – 1.2% | | | | | | | | |
| Charlotte Ctfs. of Prtn. (FY 2004 Equip. Acquisition Proj.) | | | | | | | | |
| Series 2004 C, 4% 3/1/08 | | | | 4,940 | | | | 5,012 |
| North Carolina Eastern Muni. Pwr. Agcy. Pwr. Sys. Rev.: | | | | | | | | |
| Series 1993 B, 7% 1/1/08 (MBIA Insured) | | | | 1,500 | | | | 1,607 |
| Series A, 5.5% 1/1/10 | | | | 3,000 | | | | 3,187 |
| Series B, 6% 1/1/06 | | | | 6,170 | | | | 6,170 |
| Series C, 5% 1/1/08 | | | | 1,190 | | | | 1,221 |
| Series D, 5.375% 1/1/10 | | | | 3,715 | | | | 3,930 |
| | | | | | | | | 21,127 |
| |
| Ohio – 0.9% | | | | | | | | |
| Akron Ctfs. of Prtn. 5% 12/1/07 | | | | 2,350 | | | | 2,415 |
| Cleveland Pub. Pwr. Sys. Rev. (First Mtg. Prog.) | | | | | | | | |
| Series 1994 A, 0% 11/15/09 (MBIA Insured) | | | | 2,250 | | | | 1,949 |
| Franklin County Rev. (OCLC Online Computer Library | | | | | | | | |
| Ctr., Inc. Proj.) 5% 4/15/07 | | | | 1,960 | | | | 1,986 |
| Lakewood Hosp. Impt. Rev. (Lakewood Hosp. Assoc. | | | | | | | | |
| Proj.) 5.5% 2/15/07 | | | | 1,420 | | | | 1,447 |
See accompanying notes which are an integral part of the financial statements.
| Municipal Bonds continued | | | | | | | | |
| | | Principal | | Value (Note 1) |
| | | Amount (000s) | | (000s) |
| Ohio – continued | | | | | | | | |
| Ohio Air Quality Dev. Auth. Rev. Series 2002 A, 3.5%, | | | | | | | | |
| tender 1/1/06 (b) | | $ | | 1,000 | | $ | | 1,000 |
| Ohio Gen. Oblig.: | | | | | | | | |
| Series 2000 E, 5.5% 5/1/09 | | | | 1,905 | | | | 2,031 |
| Series 2003 D, 2.45%, tender 9/14/07 (b) | | | | 1,300 | | | | 1,277 |
| Ohio Univ. Gen. Receipts Athens 5% 12/1/07 | | | | | | | | |
| (FSA Insured) | | | | 1,285 | | | | 1,325 |
| Ohio Wtr. Dev. Auth. Wtr. Poll. Cont. Rev. (Ohio Edison | | | | | | | | |
| Co. Proj.) Series A, 3.35%, tender 6/1/06 (b) | | | | 1,800 | | | | 1,793 |
| | | | | | | | | 15,223 |
| |
| Oklahoma – 0.0% | | | | | | | | |
| Cherokee County Econ. Dev. Auth. Series A, 0% | | | | | | | | |
| 11/1/11 (Escrowed to Maturity) (d) | | | | 1,000 | | | | 792 |
| Oregon – 0.3% | | | | | | | | |
| Beaverton Wtr. Rev. Series B, 5% 6/1/10 (FSA Insured) . | | | | 1,210 | | | | 1,289 |
| Oregon Dept. Administrative Svcs. Ctfs. of Prtn. Series B: | | | | | | | | |
| 5% 5/1/09 (FSA Insured) | | | | 1,000 | | | | 1,050 |
| 5% 5/1/11 (FSA Insured) | | | | 1,000 | | | | 1,065 |
| Oregon Gen. Oblig. 8.25% 1/1/07 | | | | 1,000 | | | | 1,047 |
| | | | | | | | | 4,451 |
| |
| Pennsylvania – 4.5% | | | | | | | | |
| Allegheny County Arpt. Rev. (Pittsburgh Int’l. Arpt. Proj.) | | | | | | | | |
| Series A1, 5.75% 1/1/12 (MBIA Insured) (c) | | | | 1,300 | | | | 1,403 |
| Allegheny County Hosp. Dev. Auth. Rev. (Univ. of | | | | | | | | |
| Pittsburgh Med. Ctr. Proj.) Series B: | | | | | | | | |
| 5.5% 6/15/06 | | | | 3,065 | | | | 3,094 |
| 5.5% 6/15/07 | | | | 2,000 | | | | 2,057 |
| Allegheny County Indl. Dev. Auth. Rev. (Watson Institute | | | | | | | | |
| Ed. Ctr. Proj.) 3.375%, tender 5/1/08, LOC PNC | | | | | | | | |
| Bank NA, Pittsburgh (b) | | | | 4,500 | | | | 4,464 |
| Allegheny County San. Auth. Swr. Rev. 6% 12/1/11 | | | | | | | | |
| (MBIA Insured) | | | | 1,495 | | | | 1,676 |
| Hazleton Area School District 6.5% 3/1/06 | | | | | | | | |
| (FSA Insured) | | | | 1,155 | | | | 1,161 |
| Luzerne County Indl. Dev. Auth. Wtr. Facilities Rev. | | | | | | | | |
| (Pennsylvania-American Wtr. Co. Proj.) 3.6%, tender | | | | | | | | |
| 12/1/09 (AMBAC Insured) (b)(c) | | | | 10,000 | | | | 9,928 |
| Montgomery County Higher Ed. & Health Auth. Hosp. | | | | | | | | |
| Rev. (Abington Memorial Hosp. Proj.) Series A, 5% | | | | | | | | |
| 6/1/06 (AMBAC Insured) | | | | 3,750 | | | | 3,771 |
See accompanying notes which are an integral part of the financial statements.
25 Annual Report
| Investments continued | | | | | | | | |
| |
| |
| Municipal Bonds continued | | | | | | | | |
| | | Principal | | Value (Note 1) |
| | | Amount (000s) | | (000s) |
| Pennsylvania – continued | | | | | | | | |
| Pennsylvania Econ. Dev. Fing. Auth. Exempt Facilities | | | | | | | | |
| Rev. (Shippingport Proj.) Series A, 4.35%, tender | | | | | | | | |
| 6/1/10 (b)(c) | | $ | | 1,200 | | $ | | 1,179 |
| Pennsylvania Higher Edl. Facilities Auth. Rev.: | | | | | | | | |
| (Univ. of Pennsylvania Health Systems Proj.) Series A: | | | | | | | | |
| 4% 8/15/06 | | | | 1,405 | | | | 1,408 |
| 5% 8/15/07 | | | | 1,735 | | | | 1,769 |
| 5% 8/15/08 | | | | 2,000 | | | | 2,071 |
| (UPMC Health Sys. Proj.) Series 2001 A, 5.75% | | | | | | | | |
| 1/15/09 | | | | 1,750 | | | | 1,853 |
| Series B, 5.25% 9/1/08 | | | | 5,860 | | | | 6,137 |
| Pennsylvania Indl. Dev. Auth. Rev. 5.25% 7/1/10 | | | | | | | | |
| (AMBAC Insured) | | | | 2,750 | | | | 2,957 |
| Philadelphia Gas Works Rev. (1975 Gen. Ordinance | | | | | | | | |
| Proj.) 17th Series, 5% 7/1/08 (FSA Insured) | | | | 7,410 | | | | 7,692 |
| Philadelphia Muni. Auth. Rev.: | | | | | | | | |
| Series A: | | | | | | | | |
| 5% 5/15/07 (FSA Insured) | | | | 5,500 | | | | 5,620 |
| 5% 5/15/08 (FSA Insured) | | | | 5,000 | | | | 5,181 |
| Series B, 5.25% 11/15/11 (FSA Insured) | | | | 3,400 | | | | 3,686 |
| Philadelphia School District: | | | | | | | | |
| Series 2005 D, 5.25% 6/1/12 (FSA Insured) | | | | 1,465 | | | | 1,592 |
| Series B, 5% 4/1/11 (AMBAC Insured) | | | | 2,160 | | | | 2,309 |
| Pittsburgh Gen. Oblig. Series A, 6% 3/1/07 | | | | | | | | |
| (MBIA Insured) | | | | 2,000 | | | | 2,059 |
| Pittsburgh School District Series A, 5% 9/1/09 | | | | | | | | |
| (MBIA Insured) (a) | | | | 1,600 | | | | 1,668 |
| Westmoreland County Muni. Auth. Muni. Svc. Rev. | | | | | | | | |
| Series K, 0% 7/1/12 (Escrowed to Maturity) (d) | | | | 2,355 | | | | 1,827 |
| | | | | | | | | 76,562 |
| |
| Puerto Rico 0.1% | | | | | | | | |
| Puerto Rico Pub. Bldgs Auth. Rev. Series K, 4%, tender | | | | | | | | |
| 7/1/07 (MBIA Insured) (b) | | | | 1,000 | | | | 1,005 |
| Rhode Island – 0.4% | | | | | | | | |
| Providence Spl. Oblig. Series 2005 E: | | | | | | | | |
| 4% 6/1/08 (Radian Asset Assurance Ltd. Insured) | | | | 1,000 | | | | 1,009 |
| 5% 6/1/09 (Radian Asset Assurance Ltd. Insured) | | | | 1,315 | | | | 1,373 |
| 5% 6/1/10 (Radian Asset Assurance Ltd. Insured) | | | | 1,180 | | | | 1,239 |
See accompanying notes which are an integral part of the financial statements.
| Municipal Bonds continued | | | | | | | | |
| | | Principal | | Value (Note 1) |
| | | Amount (000s) | | (000s) |
| Rhode Island – continued | | | | | | | | |
| Rhode Island Health & Edl. Bldg. Corp. Rev. (Johnson & | | | | | | | | |
| Wales Univ. Proj.): | | | | | | | | |
| 5% 4/1/06 (XL Cap. Assurance, Inc. Insured) | | $ | | 2,225 | | $ | | 2,234 |
| 5% 4/1/08 (XL Cap. Assurance, Inc. Insured) | | | | 1,700 | | | | 1,760 |
| | | | | | | | | 7,615 |
| |
| South Carolina – 1.6% | | | | | | | | |
| Berkeley County School District 7% 4/1/07 | | | | 2,615 | | | | 2,733 |
| Charleston County Hosp. Facilities (Care Alliance Health | | | | | | | | |
| Services Proj.) Series A: | | | | | | | | |
| 5% 8/15/06 | | | | 1,000 | | | | 1,008 |
| 5% 8/15/07 | | | | 1,700 | | | | 1,735 |
| 5% 8/15/08 | | | | 1,690 | | | | 1,742 |
| Greenville County Pub. Facilities Corp. Certificate of | | | | | | | | |
| Prtn. (Courthouse and Detention Proj.) 5% 4/1/10 | | | | | | | | |
| (AMBAC Insured) | | | | 1,450 | | | | 1,544 |
| Piedmont Muni. Pwr. Agcy. Elec. Rev. 5.6% 1/1/09 | | | | | | | | |
| (MBIA Insured) | | | | 2,345 | | | | 2,501 |
| Rock Hill Util. Sys. Rev. Series 2003 A: | | | | | | | | |
| 5% 1/1/08 (FSA Insured) | | | | 1,850 | | | | 1,910 |
| 5% 1/1/09 (FSA Insured) | | | | 1,945 | | | | 2,041 |
| South Carolina Pub. Svc. Auth. Rev.: | | | | | | | | |
| Series 2005 B, 5% 1/1/10 (MBIA Insured) | | | | 3,000 | | | | 3,178 |
| Series A: | | | | | | | | |
| 5.5% 1/1/11 (MBIA Insured) | | | | 3,000 | | | | 3,243 |
| 5.5% 1/1/14 (FGIC Insured) | | | | 1,335 | | | | 1,502 |
| Series D, 5% 1/1/06 | | | | 2,750 | | | | 2,750 |
| Spartanburg County School District #5 Pub. Facilities | | | | | | | | |
| Corp. Ctfs. of Prtn. 5% 7/1/09 (FSA Insured) | | | | 1,000 | | | | 1,052 |
| | | | | | | | | 26,939 |
| |
| Tennessee – 0.9% | | | | | | | | |
| Elizabethton Health & Edl. Facilities Board Rev. (First | | | | | | | | |
| Mtg. Prog.) 6% 7/1/11 (MBIA Insured) | | | | 2,005 | | | | 2,233 |
| Maury County Gen. Oblig. Series 2004 B, 5% 4/1/10 | | | | | | | | |
| (MBIA Insured) | | | | 2,000 | | | | 2,125 |
| Memphis-Shelby County Arpt. Auth. Arpt. Rev. Series A: | | | | | | | | |
| 4.5% 9/1/08 (MBIA Insured) | | | | 1,620 | | | | 1,663 |
| 4.5% 9/1/09 (MBIA Insured) | | | | 1,685 | | | | 1,741 |
| Metropolitan Govt. Nashville & Series A, 5.25% | | | | | | | | |
| 10/15/09 | | | | 3,795 | | | | 4,039 |
See accompanying notes which are an integral part of the financial statements.
27 Annual Report
| Investments continued | | | | | | | | | | | | |
| |
| |
| Municipal Bonds continued | | | | | | | | | | | | |
| | | | | | | Principal | | Value (Note 1) |
| | | | | | | Amount (000s) | | (000s) |
| Tennessee – continued | | | | | | | | | | | | |
| Metropolitan Nashville Arpt. Auth. Rev. Series C, 5% | | | | | | | | | | |
| 7/1/06 (FGIC Insured) (c) | | | | | | $ | | 1,675 | | $ | | 1,687 |
| Shelby County Health Edl. & Hsg. Facility Board Hosp. | | | | | | | | | | |
| Rev. (Methodist Health Care Proj.) 5.5% 4/1/09 | | | | | | | | | | |
| (MBIA Insured) | | | | | | | | 1,200 | | | | 1,268 |
| | | | | | | | | | | | | 14,756 |
| |
| Texas 14.7% | | | | | | | | | | | | |
| Alief Independent School District Series 2004 B, 5% | | | | | | | | | | |
| 2/15/10 | | | | | | | | 1,500 | | | | 1,589 |
| Arlington Independent School District 5% 2/15/13 | | | | | | 2,500 | | | | 2,692 |
| Austin Independent School District 5% 8/1/07 (a) | | | | | | 3,605 | | | | 3,669 |
| Austin Util. Sys. Rev.: | | | | | | | | | | | | |
| Series 1992 A, 0% 11/15/09 (MBIA Insured) | | | | | | 5,130 | | | | 4,451 |
| Series A, 0% 11/15/10 (MBIA Insured) | | | | | | | | 5,300 | | | | 4,412 |
| Austin Wtr. & Wastewtr. Sys. Rev. 5% 11/15/07 | | | | | | | | | | |
| (MBIA Insured) (a) | | | | | | | | 3,295 | | | | 3,362 |
| Bexar County Series A: | | | | | | | | | | | | |
| 5% 6/15/09 (FSA Insured) | | | | | | | | 2,615 | | | | 2,751 |
| 5% 6/15/10 (FSA Insured) | | | | | | | | 1,000 | | | | 1,062 |
| Birdville Independent School District 5% 2/15/10 | | | | | | 1,300 | | | | 1,377 |
| Brazos River Auth. Poll. Cont. Rev. (Texas Utils. Elec. Co. | | | | | | | | |
| Proj.) Series 1995 B, 5.05%, tender 6/19/06 (b)(c) | | | | | | 6,255 | | | | 6,279 |
| Brownsville Independent School District 5% 8/15/11 | | | | | | 1,430 | | | | 1,528 |
| Bryan Wtrwks. & Swr. Sys. Rev. 5.5% 7/1/11 (FSA | | | | | | | | | | |
| Insured) | | | | | | | | 1,500 | | | | 1,642 |
| College Station Independent School District 5% 2/15/10 | | | | 1,000 | | | | 1,059 |
| Conroe Independent School District Lot B, 0% 2/15/08 | | . | | | | 3,000 | | | | 2,785 |
| Corpus Christi Gen. Oblig. 5% 3/1/07 (FSA Insured) | | | | | | 2,735 | | | | 2,787 |
| Corpus Christi Util. Sys. Rev.: | | | | | | | | | | | | |
| 5% 7/15/12 (FSA Insured) | | | | | | | | 1,000 | | | | 1,077 |
| 5% 7/15/13 (FSA Insured) | | | | | | | | 1,665 | | | | 1,800 |
| Cypress-Fairbanks Independent School District: | | �� | | | | | | | | |
| Series B, 0% 8/1/07 (AMBAC Insured) | | | | | | | | 10,000 | | | | 9,476 |
| 5% 2/15/08 | | | | | | | | 2,000 | | | | 2,067 |
| Dallas Independent School District Series 2005, 5.25% | | | | | | | | | | |
| 8/15/08 | | | | | | | | 2,000 | | | | 2,093 |
| Del Valle Independent School District 5.5% 2/1/09 | | | | | | 1,205 | | | | 1,279 |
| Denton County Gen. Oblig.: | | | | | | | | | | | | |
| 5% 7/15/11 (FSA Insured) | | | | | | | | 3,065 | | | | 3,272 |
| 5% 7/15/13 (FSA Insured) | | | | | | | | 1,200 | | | | 1,293 |
| El Paso Wtr. & Swr. Rev. 5% 3/1/08 (AMBAC Insured) | | . | | | | 2,770 | | | | 2,866 |
| |
| See accompanying notes which are an integral part of the financial statements. | | | | |
| |
| Annual Report | | 28 | | | | | | | | | | |
| Municipal Bonds continued | | | | | | | | | | |
| | | | | Principal | | Value (Note 1) |
| | | | | Amount (000s) | | (000s) |
| Texas continued | | | | | | | | | | |
| Fort Bend Independent School District 5%, tender | | | | | | | | | | |
| 8/15/09 (b) | | | | $ | | 5,000 | | $ | | 5,237 |
| Fort Worth Independent School District 5% 2/15/12 | | | | | | 1,500 | | | | 1,612 |
| Frisco Gen. Oblig. Series 2003 A: | | | | | | | | | | |
| 4% 2/15/08 (FSA Insured) | | | | | | 1,145 | | | | 1,161 |
| 5% 2/15/10 (FSA Insured) | | | | | | 1,710 | | | | 1,811 |
| Garland Independent School District 0% 2/15/07 | | | | | | 1,610 | | | | 1,550 |
| Harris County Gen. Oblig. Series A, 0% 8/15/07 | | | | | | | | | | |
| (FGIC Insured) | | | | | | 4,400 | | | | 4,164 |
| Harris County Health Facilities Dev. Corp. Rev. (Saint | | | | | | | | | | |
| Luke’s Episcopal Hosp. Proj.) Series 2001 A, 5.5% | | | | | | | | | | |
| 2/15/09 | | | | | | 3,710 | | | | 3,916 |
| Houston Cmnty. College Sys. Rev.: | | | | | | | | | | |
| 5.25% 4/15/11 (FSA Insured) | | | | | | 3,030 | | | | 3,277 |
| 5.25% 4/15/12 (FSA Insured) | | | | | | 2,000 | | | | 2,182 |
| Houston Util. Sys. Rev. Series A: | | | | | | | | | | |
| 5.25% 5/15/10 (MBIA Insured) | | | | | | 1,250 | | | | 1,340 |
| 5.25% 11/15/11 (FSA Insured) | | | | | | 4,430 | | | | 4,815 |
| Irving Independent School District 5.25% 2/15/13 | | | | | | 2,145 | | | | 2,343 |
| Katy Independent School District Series A, 5.25% | | | | | | | | | | |
| 2/15/12 | | | | | | 2,000 | | | | 2,176 |
| Killeen Independent School District 4% 2/15/08 | | | | | | 1,200 | | | | 1,216 |
| Klein Independent School District Series A, 5% 8/1/12 | | . | | | | 2,250 | | | | 2,415 |
| La Porte Independent School District 4% 2/15/08 | | | | | | 2,000 | | | | 2,026 |
| Lower Colorado River Auth. Rev.: | | | | | | | | | | |
| 0% 1/1/09 (Escrowed to Maturity) (d) | | | | | | 3,000 | | | | 2,695 |
| 5.25% 1/1/15 (Pre-Refunded to 1/1/11 @ 100) (d) | | . | | | | 5,000 | | | | 5,376 |
| Lubbock Gen. Oblig.: | | | | | | | | | | |
| (Wtrwks. Sys. Surplus Proj.) 5% 2/15/11 (FSA Insured) | | | | 2,465 | | | | 2,632 |
| 5% 2/15/09 (MBIA Insured) | | | | | | 1,615 | | | | 1,691 |
| 5% 2/15/10 (MBIA Insured) | | | | | | 1,845 | | | | 1,954 |
| Mesquite Independent School District: | | | | | | | | | | |
| Series A, 0% 8/15/06 | | | | | | 1,115 | | | | 1,093 |
| 3.65%, tender 12/1/08 (Liquidity Facility JPMorgan | | | | | | | | | | |
| Chase Bank) (b) | | | | | | 2,500 | | | | 2,500 |
| New Braunfels Independent School District 0% 2/1/07 | | . | | | | 2,000 | | | | 1,928 |
| North East Texas Independent School District 7% 2/1/11 | | | | | | | | |
| (Pre-Refunded to 2/1/10 @ 100) (d) | | | | | | 3,600 | | | | 4,076 |
| North Texas Tollway Auth. Dallas North Tollway Sys. Rev. | | | | | | | | |
| Series C: | | | | | | | | | | |
| 5% 1/1/09 (FSA Insured) | | | | | | 2,000 | | | | 2,093 |
| 5%, tender 7/1/08 (FSA Insured) (b) | | | | | | 2,650 | | | | 2,751 |
See accompanying notes which are an integral part of the financial statements.
29 Annual Report
| Investments continued | | | | | | | | |
| |
| |
| Municipal Bonds continued | | | | | | | | |
| | | Principal | | Value (Note 1) |
| | | Amount (000s) | | (000s) |
| Texas continued | | | | | | | | |
| Northside Independent School District Series B, 2.45%, | | | | | | | | |
| tender 8/1/06 (Liquidity Facility Dexia Cr. Local de | | | | | | | | |
| France) (b) | | $ | | 7,100 | | $ | | 7,066 |
| Port Houston Auth. Harris County 6% 10/1/06 | | | | | | | | |
| (FGIC Insured) (c) | | | | 2,000 | | | | 2,037 |
| Red River Ed. Fin. Corp. Ed. Rev. (Texas Christian Univ. | | | | | | | | |
| Proj.) 5% 3/15/12 (MBIA Insured) | | | | 2,625 | | | | 2,817 |
| Rockwall Independent School District: | | | | | | | | |
| 5% 2/15/08 | | | | 3,825 | | | | 3,952 |
| 5% 2/15/09 | | | | 4,690 | | | | 4,911 |
| San Angelo Wtrks & Swr. Sys. Impt. and Rfdg. Rev. 5% | | | | | | | | |
| 4/1/10 (FSA Insured) | | | | 1,630 | | | | 1,729 |
| San Antonio Elec. & Gas Systems Rev.: | | | | | | | | |
| Series 2000 A, 5.75% 2/1/15 (Pre-Refunded to | | | | | | | | |
| 2/1/10 @ 100) (d) | | | | 5,000 | | | | 5,425 |
| 3.55%, tender 12/1/07 (b) | | | | 6,700 | | | | 6,702 |
| 5.25% 2/1/08 | | | | 1,000 | | | | 1,038 |
| San Antonio Independent School District 7% 8/15/08 | | | | 5,000 | | | | 5,442 |
| San Antonio Muni. Drainage Util. Sys. Rev. 5.25% | | | | | | | | |
| 2/1/12 (MBIA Insured) | | | | 1,545 | | | | 1,681 |
| San Antonio Wtr. Sys. Rev. 5% 5/15/10 (FGIC Insured) | | | | 1,020 | | | | 1,083 |
| Socorro Independent School District 5% 8/15/09 | | | | 2,070 | | | | 2,179 |
| Spring Branch Independent School District Series 2001, | | | | | | | | |
| 5.375% 2/1/14 | | | | 2,790 | | | | 3,012 |
| Spring Independent School District 5% 2/15/08 | | | | 1,875 | | | | 1,937 |
| Texas Gen. Oblig.: | | | | | | | | |
| (College Student Ln. Prog.) 5% 8/1/11 (c) | | | | 3,000 | | | | 3,103 |
| Series 1992 A, 8% 10/1/07 | | | | 10,000 | | | | 10,785 |
| Series A, 6% 10/1/08 (MBIA Insured) | | | | 10,750 | | | | 11,495 |
| Series C, 0% 4/1/08 (Escrowed to Maturity) (d) | | | | 3,100 | | | | 2,866 |
| Texas Pub. Fin. Auth. Rev. (Bldg. and Procurement | | | | | | | | |
| Commission Projs.) Series A, 5% 2/1/10 | | | | | | | | |
| (AMBAC Insured) | | | | 1,055 | | | | 1,117 |
| Texas State Univ. Sys. Fing. Rev. 5% 3/15/13 | | | | | | | | |
| (FSA Insured) | | | | 2,000 | | | | 2,163 |
| Texas Tech Univ. Revs. Ninth Series, 5% 2/15/11 | | | | | | | | |
| (AMBAC Insured) | | | | 1,250 | | | | 1,335 |
| Travis County Gen. Oblig. 5.25% 3/1/12 | | | | 4,125 | | | | 4,481 |
| Tyler Health Facilities Dev. Corp. Hosp. Rev. (Mother | | | | | | | | |
| Frances Hosp. Reg’l. Health Care Ctr. Proj.): | | | | | | | | |
| 4.5% 7/1/06 | | | | 1,220 | | | | 1,224 |
| 5% 7/1/07 | | | | 1,000 | | | | 1,015 |
See accompanying notes which are an integral part of the financial statements.
| Municipal Bonds continued | | | | | | | | |
| | | Principal | | Value (Note 1) |
| | | Amount (000s) | | (000s) |
| Texas continued | | | | | | | | |
| Univ. of Texas Univ. Revs.: | | | | | | | | |
| (Fing. Sys. Proj.) Series A, 5.5% 8/15/09 | | $ | | 1,115 | | $ | | 1,192 |
| Series B: | | | | | | | | |
| 5% 8/15/09 | | | | 13,555 | | | | 14,262 |
| 5.25% 8/15/11 | | | | 5,025 | | | | 5,435 |
| Webb County Gen. Oblig. 5% 2/15/08 (FGIC Insured) . | | | | 1,170 | | | | 1,210 |
| Wichita Falls Independent School District 0% 2/1/10 | | | | 2,325 | | | | 1,995 |
| | | | | | | | | 251,387 |
| |
| Utah 0.6% | | | | | | | | |
| Salt Lake County Wtr. Conservancy District Rev. Series A: | | | | | | | | |
| 0% 10/1/11 (AMBAC Insured) | | | | 3,800 | | | | 3,024 |
| 0% 10/1/12 (AMBAC Insured) | | | | 3,800 | | | | 2,891 |
| 0% 10/1/13 (AMBAC Insured) | | | | 3,760 | | | | 2,730 |
| Utah Bldg. Ownership Auth. Lease Rev. (State Facilities | | | | | | | | |
| Master Lease Prog.) Series A, 5% 5/15/11 | | | | 1,700 | | | | 1,821 |
| | | | | | | | | 10,466 |
| |
| Virginia – 0.1% | | | | | | | | |
| Amelia County Indl. Dev. Auth. Solid Waste Disp. Rev. | | | | | | | | |
| (Waste Mgmt., Inc. Proj.) 4.05%, tender 4/1/08 (b)(c) | | | | 1,000 | | | | 1,000 |
| Washington 4.8% | | | | | | | | |
| Chelan County Pub. Util. District #1 Rev. Series B, 5% | | | | | | | | |
| 7/1/11 (FGIC Insured) | | | | 1,190 | | | | 1,273 |
| Clark County Pub. Util. District #1 Elec. Rev.: | | | | | | | | |
| Series B: | | | | | | | | |
| 5% 1/1/06 (FSA Insured) | | | | 1,375 | | | | 1,375 |
| 5.25% 1/1/08 (FSA Insured) | | | | 1,515 | | | | 1,569 |
| 5.25% 1/1/09 (FSA Insured) | | | | 1,595 | | | | 1,681 |
| 5% 1/1/11 (MBIA Insured) | | | | 1,680 | | | | 1,791 |
| 5.25% 1/1/11 (FSA Insured) | | | | 1,935 | | | | 2,085 |
| King & Snohomish Counties School District #417 | | | | | | | | |
| Northshore: | | | | | | | | |
| 5.5% 12/1/14 (Pre-Refunded to 6/1/12 @ 100) (d) . | | | | 6,300 | | | | 6,979 |
| 5.75% 12/1/15 (Pre-Refunded to 6/1/12 @ 100) (d) | | | | 2,500 | | | | 2,805 |
| King County School District #409, Tahoma 5% 6/1/11 | | | | | | | | |
| (FSA Insured) | | | | 1,740 | | | | 1,864 |
| King County Swr. Rev. Series B, 5.25% 1/1/08 | | | | | | | | |
| (FSA Insured) | | | | 3,500 | | | | 3,628 |
| Pierce County Gen. Oblig. 5.75% 8/1/13 | | | | | | | | |
| (Pre-Refunded to 8/1/10 @ 100) (d) | | | | 1,155 | | | | 1,265 |
| Pierce County School District #10 Tacoma Series A, 5% | | | | | | | | |
| 12/1/12 (FSA Insured) | | | | 4,175 | | | | 4,498 |
See accompanying notes which are an integral part of the financial statements. | | | | |
| |
| 31 | | | | | | Annual Report |
| Investments continued | | | | | | | | | | |
| |
| |
| Municipal Bonds continued | | | | | | | | | | |
| | | Principal | | | | Value (Note 1) |
| | | Amount (000s) | | | | (000s) |
| Washington – continued | | | | | | | | | | |
| Port of Seattle Rev. Series D, 5.75% 11/1/15 | | | | | | | | | | |
| (FGIC Insured) (c) | | $ | | 3,640 | | | | $ | | 3,990 |
| Seattle Muni. Lt. & Pwr. Rev. 5.25% 3/1/07 | | | | | | | | | | |
| (FSA Insured) | | | | 1,690 | | | | | | 1,726 |
| Snohomish County Pub. Hosp. District #2 (Stevens Health | | | | | | | | | | |
| Care Proj.) 4.5% 12/1/09 (FGIC Insured) | | | | 1,000 | | | | | | 1,036 |
| Snohomish County School District #2, Everett: | | | | | | | | | | |
| 5% 6/1/09 (FSA Insured) | | | | 1,045 | | | | | | 1,100 |
| 5% 6/1/10 (FSA Insured) | | | | 1,000 | | | | | | 1,063 |
| Vancouver Wtr. & Swr. Rev. 5.25% 6/1/11 | | | | | | | | | | |
| (FSA Insured) | | | | 1,000 | | | | | | 1,083 |
| Washington Gen. Oblig. Series A: | | | | | | | | | | |
| 4% 1/1/08 (MBIA Insured) | | | | 33,175 | | | | | | 33,592 |
| 5% 7/1/11 (FGIC Insured) | | | | 1,000 | | | | | | 1,070 |
| 5.5% 7/1/11 | | | | 3,500 | | | | | | 3,762 |
| Washington Pub. Pwr. Supply Sys. Nuclear Proj. #2 Rev. | | | | | | | | | | |
| Series A, 5.75% 7/1/08 | | | | 3,000 | | | | | | 3,165 |
| | | | | | | | | | | 82,400 |
| |
| Wisconsin – 1.5% | | | | | | | | | | |
| Milwaukee County Gen. Oblig. Series A, 0% 12/1/10 | | | | | | | | | | |
| (FGIC Insured) | | | | 3,370 | | | | | | 2,783 |
| Wisconsin Gen. Oblig. Series 1, 5% 5/1/10 | | | | | | | | | | |
| (MBIA Insured) (a) | | | | 2,500 | | | | | | 2,653 |
| Wisconsin Health & Edl. Facilities Auth. Rev.: | | | | | | | | | | |
| (Hosp. Sisters Svcs., Inc. Proj.) Series 2003 B, 4%, | | | | | | | | | | |
| tender 12/1/06 (FSA Insured) (b)�� | | | | 15,000 | | | | | | 15,083 |
| (Wheaton Franciscan Svcs., Inc. Proj.) Series A: | | | | | | | | | | |
| 5% 8/15/09 | | | | 1,000 | | | | | | 1,039 |
| 5% 8/15/10 | | | | 1,870 | | | | | | 1,946 |
| Wisconsin Trans. Rev. 5% 7/1/07 | | | | 1,500 | | | | | | 1,536 |
| | | | | | | | | | | 25,040 |
| |
| |
| TOTAL INVESTMENT PORTFOLIO 99.8% | | | | | | | | | | |
| (Cost $1,716,088) | | | | | | | | 1,707,108 |
| |
| NET OTHER ASSETS – 0.2% | | | | | | | | | | 3,162 |
| NET ASSETS 100% | | | | | | | | $ | | 1,710,270 |
See accompanying notes which are an integral part of the financial statements.
Legend
(a) Security or a portion of the security
purchased on a delayed delivery or
when-issued basis.
(b) The coupon rate shown on floating or
adjustable rate securities represents the
rate at period end.
(c) Private activity obligations whose
interest is subject to the federal
alternative minimum tax for individuals.
(d) Security collateralized by an amount
sufficient to pay interest and principal.
|
(e) Restricted securities – Investment in
securities not registered under the
Securities Act of 1933 (excluding 144A
issues). At the end of the period, the
value of restricted securities (excluding
144A issues) amounted to $9,063,000
or 0.5% of net assets.
|
Additional information on each holding is as follows:
| | | Acquisition | | Acquisition |
| Security | | Date | | Cost (000s) |
| Univ. of California | | | | | | |
| Revs. (UCLA Med. | | | | | | |
| Ctr. Proj.) 4.55% | | | | | | |
| 12/1/09 | | 3/6/02 | | $ | | 8,955 |
Affiliated Central Funds
Information regarding income received by the fund from the affiliated Central funds during the period is as follows:
| Fund | | Income received |
| | | (Amounts in Thousands) |
| Fidelity Municipal Cash Central Fund | | $ | | 238 |
Other Information
The distribution of municipal securities by revenue source, as a percentage of total net assets, is as follows:
| General Obligations | | 49.1% |
| Electric Utilities | | 13.8% |
| Escrowed/Pre Refunded | | 8.2% |
| Transportation | | 6.7% |
| Health Care | | 6.5% |
| Education | | 5.3% |
| Others* (individually less than 5%) | | 10.4% |
| | | 100.0% |
| *Includes net other assets | | |
Income Tax Information
At December 31, 2005, the fund had a capital loss carryforward of approximately $699,000 all of which will expire on December 31, 2013.
See accompanying notes which are an integral part of the financial statements.
33 Annual Report
| Financial Statements | | | | | | | | |
| |
| |
| Statement of Assets and Liabilities | | | | | | | | |
| Amounts in thousands (except per share amounts) | | | | | | December 31, 2005 |
| |
| Assets | | | | | | | | |
| Investment in securities, at value | | | | | | | | |
| See accompanying schedule: | | | | | | | | |
| Unaffiliated issuers (cost $1,716,088) | | | | | | $ | | 1,707,108 |
| Cash | | | | | | | | 6,150 |
| Receivable for fund shares sold | | | | | | | | 2,394 |
| Interest receivable | | | | | | | | 22,071 |
| Prepaid expenses | | | | | | | | 9 |
| Other receivables | | | | | | | | 56 |
| Total assets | | | | | | | | 1,737,788 |
| |
| Liabilities | | | | | | | | |
| Payable for investments purchased | | | | | | | | |
| Regular delivery | | $ | | 5 | | | | |
| Delayed delivery | | | | 19,326 | | | | |
| Payable for fund shares redeemed | | | | 6,201 | | | | |
| Distributions payable | | | | 1,209 | | | | |
| Accrued management fee | | | | 543 | | | | |
| Distribution fees payable | | | | 16 | | | | |
| Other affiliated payables | | | | 153 | | | | |
| Other payables and accrued expenses | | | | 65 | | | | |
| Total liabilities | | | | | | | | 27,518 |
| |
| Net Assets | | | | | | $ | | 1,710,270 |
| Net Assets consist of: | | | | | | | | |
| Paid in capital | | | | | | $ | | 1,721,093 |
| Distributions in excess of net investment income | | | | | | | | (3) |
| Accumulated undistributed net realized gain (loss) on | | | | | | | | |
| investments | | | | | | | | (1,840) |
| Net unrealized appreciation (depreciation) on | | | | | | | | |
| investments | | | | | | | | (8,980) |
| Net Assets | | | | | | $ | | 1,710,270 |
See accompanying notes which are an integral part of the financial statements.
| Statement of Assets and Liabilities continued | | | | |
| Amounts in thousands (except per share amounts) | | December 31, 2005 |
| |
| Calculation of Maximum Offering Price | | | | |
| Class A: | | | | |
| Net Asset Value and redemption price per share | | | | |
| ($14,402 ÷ 1,409.90 shares) | | $ | | 10.21 |
| |
| Maximum offering price per share (100/96.25 of $10.21) | | $ | | 10.61 |
| Class T: | | | | |
| Net Asset Value and redemption price per share | | | | |
| ($14,877 ÷ 1,458.63 shares) | | $ | | 10.20 |
| |
| Maximum offering price per share (100/97.25 of $10.20) | | $ | | 10.49 |
| Class B: | | | | |
| Net Asset Value and offering price per share | | | | |
| ($3,443 ÷ 337.18 shares)A | | $ | | 10.21 |
| |
| Class C: | | | | |
| Net Asset Value and offering price per share | | | | |
| ($10,240 ÷ 1,003.84 shares)A | | $ | | 10.20 |
| |
| Short Intermediate Municipal Income: | | | | |
| Net Asset Value, offering price and redemption price per | | | | |
| share ($1,664,683 ÷ 163,188.52 shares) | | $ | | 10.20 |
| |
| Institutional Class: | | | | |
| Net Asset Value, offering price and redemption price per | | | | |
| share ($2,625 ÷ 257.23 shares) | | $ | | 10.20 |
| |
| A Redemption price per share is equal to net asset value less any applicable contingent deferred sales charge. | | | | |
See accompanying notes which are an integral part of the financial statements.
35 Annual Report
| Financial Statements continued | | | | |
| |
| |
| Statement of Operations | | | | | | |
| Amounts in thousands | | | | Year ended December 31, 2005 |
| |
| Investment Income | | | | | | |
| Interest | | | | $ | | 59,148 |
| Income from affiliated Central Funds | | | | | | 238 |
| Total income | | | | | | 59,386 |
| |
| Expenses | | | | | | |
| Management fee | | $ | | 6,951 | | |
| Transfer agent fees | | | | 1,501 | | |
| Distribution fees | | | | 210 | | |
| Accounting fees and expenses | | | | 362 | | |
| Independent trustees’ compensation | | | | 8 | | |
| Custodian fees and expenses | | | | 29 | | |
| Registration fees | | | | 114 | | |
| Audit | | | | 55 | | |
| Legal | | | | 13 | | |
| Miscellaneous | | | | 39 | | |
| Total expenses before reductions | | | | 9,282 | | |
| Expense reductions | | | | (1,241) | | 8,041 |
| |
| Net investment income | | | | | | 51,345 |
| Realized and Unrealized Gain (Loss) | | | | |
| Net realized gain (loss) on: | | | | | | |
| Investment securities: | | | | | | |
| Unaffiliated issuers | | | | | | (1,840) |
| Change in net unrealized appreciation (depreciation) on | | | | |
| investment securities | | | | | | (29,976) |
| Net gain (loss) | | | | | | (31,816) |
| Net increase (decrease) in net assets resulting from | | | | |
| operations | | | | $ | | 19,529 |
See accompanying notes which are an integral part of the financial statements.
| Statement of Changes in Net Assets | | | | | | | | |
| | | | | Year ended | | | | Year ended |
| | | | | December 31, | | | | December 31, |
| Amounts in thousands | | | | 2005 | | | | 2004 |
| Increase (Decrease) in Net Assets | | | | | | | | |
| Operations | | | | | | | | |
| Net investment income | | | $ | 51,345 | | | $ | 47,437 |
| Net realized gain (loss) | | | | (1,840) | | | | 4,712 |
| Change in net unrealized appreciation (depreciation) . | | (29,976) | | | | (22,609) |
| Net increase (decrease) in net assets resulting | | | | | | | | |
| from operations | | | | 19,529 | | | | 29,540 |
| Distributions to shareholders from net investment income | | . | | (51,341) | | | | (47,598) |
| Distributions to shareholders from net realized gain | | | | (549) | | | | (3,486) |
| Total distributions | | | | (51,890) | | | | (51,084) |
| Share transactions - net increase (decrease) | | | | (147,427) | | | | 37,160 |
| Redemption fees | | | | 25 | | | | 65 |
| Total increase (decrease) in net assets | | | | (179,763) | | | | 15,681 |
| |
| Net Assets | | | | | | | | |
| Beginning of period | | | | 1,890,033 | | | | 1,874,352 |
| End of period (including distributions in excess of net | | | | | | | | |
| investment income of $3 and undistributed net | | | | | | | | |
| investment income of $190, respectively) | | | $ | 1,710,270 | | | $ | 1,890,033 |
See accompanying notes which are an integral part of the financial statements.
37 Annual Report
| Financial Highlights Class A | | | | | | | | | | | | |
| |
| Years ended December 31, | | | | 2005 | | | | 2004 | | | | 2003F |
| Selected Per Share Data | | | | | | | | | | | | |
| Net asset value, beginning of period | | | | $ 10.39 | | | | $ 10.50 | | | | $ 10.49 |
| Income from Investment Operations | | | | | | | | | | | | |
| Net investment incomeE | | | | 268 | | | | .250 | | | | .115 |
| Net realized and unrealized gain (loss) | | | | (.177) | | | | (.090) | | | | .071 |
| Total from investment operations | | | | 091 | | | | .160 | | | | .186 |
| Distributions from net investment income | | | | (.268) | | | | (.251) | | | | (.111) |
| Distributions from net realized gain | | | | (.003) | | | | (.019) | | | | (.065) |
| Total distributions | | | | (.271) | | | | (.270) | | | | (.176) |
| Redemption fees added to paid in capitalE,H | | | | — | | | | — | | | | — |
| Net asset value, end of period | | | | $ 10.21 | | | | $ 10.39 | | | | $ 10.50 |
| Total ReturnB,C,D | | | | 89% | | | | 1.55% | | | | 1.78% |
| Ratios to Average Net AssetsG | | | | | | | | | | | | |
| Expenses before reductions | | | | 65% | | | | .65% | | | | .65%A |
| Expenses net of fee waivers, if any | | | | 65% | | | | .65% | | | | .65%A |
| Expenses net of all reductions | | | | 58% | | | | .64% | | | | .64%A |
| Net investment income | | | | 2.61% | | | | 2.41% | | | | 2.52%A |
| Supplemental Data | | | | | | | | | | | | |
| Net assets, end of period (in millions) | | | | $ 14 | | | | $ 12 | | | | $ 9 |
| Portfolio turnover rate | | | | 27% | | | | 45% | | | | 34% |
A Annualized
B Total returns for periods of less than one year are not annualized.
C Total returns would have been lower had certain expenses not been reduced during the periods shown.
D Total returns do not include the effect of the sales charges.
E Calculated based on average shares outstanding during the period.
F For the period July 23, 2003 (commencement of sale of shares) to December 31, 2003.
G Expense ratios reflect operating expenses of the class. Expenses before reductions do not reflect amounts reimbursed by the investment adviser or
expense offset arrangements and do not represent the amount paid by the class during periods when reimbursements or reductions occur. Expense
ratios before reductions for start up periods may not be representative of longer term operating periods. Expenses net of fee waivers reflect
expenses after reimbursement by the investment adviser but prior to reductions from expense offset arrangements. Expenses net of all reductions
represent the net expenses paid by the class.
H Amount represents less than $.001 per share.
|
See accompanying notes which are an integral part of the financial statements.
| Financial Highlights Class T | | | | | | | | | | | | |
| |
| Years ended December 31, | | | | 2005 | | | | 2004 | | | | 2003F |
| Selected Per Share Data | | | | | | | | | | | | |
| Net asset value, beginning of period | | | | $ 10.37 | | | | $ 10.48 | | | | $ 10.49 |
| Income from Investment Operations | | | | | | | | | | | | |
| Net investment incomeE | | | | 257 | | | | .238 | | | | .110 |
| Net realized and unrealized gain (loss) | | | | (.167) | | | | (.089) | | | | .050 |
| Total from investment operations | | | | 090 | | | | .149 | | | | .160 |
| Distributions from net investment income | | | | (.257) | | | | (.240) | | | | (.105) |
| Distributions from net realized gain | | | | (.003) | | | | (.019) | | | | (.065) |
| Total distributions | | | | (.260) | | | | (.259) | | | | (.170) |
| Redemption fees added to paid in capitalE,H | | | | — | | | | — | | | | — |
| Net asset value, end of period | | | | $ 10.20 | | | | $ 10.37 | | | | $ 10.48 |
| Total ReturnB,C,D | | | | 88% | | | | 1.44% | | | | 1.54% |
| Ratios to Average Net AssetsG | | | | | | | | | | | | |
| Expenses before reductions | | | | 76% | | | | .76% | | | | .77%A |
| Expenses net of fee waivers, if any | | | | 76% | | | | .76% | | | | .77%A |
| Expenses net of all reductions | | | | 69% | | | | .75% | | | | .76%A |
| Net investment income | | | | 2.50% | | | | 2.30% | | | | 2.41%A |
| Supplemental Data | | | | | | | | | | | | |
| Net assets, end of period (in millions) | | | | $ 15 | | | | $ 20 | | | | $ 12 |
| Portfolio turnover rate | | | | 27% | | | | 45% | | | | 34% |
A Annualized
B Total returns for periods of less than one year are not annualized.
C Total returns would have been lower had certain expenses not been reduced during the periods shown.
D Total returns do not include the effect of the sales charges.
E Calculated based on average shares outstanding during the period.
F For the period July 23, 2003 (commencement of sale of shares) to December 31, 2003.
G Expense ratios reflect operating expenses of the class. Expenses before reductions do not reflect amounts reimbursed by the investment adviser or
expense offset arrangements and do not represent the amount paid by the class during periods when reimbursements or reductions occur. Expense
ratios before reductions for start up periods may not be representative of longer term operating periods. Expenses net of fee waivers reflect
expenses after reimbursement by the investment adviser but prior to reductions from expense offset arrangements. Expenses net of all reductions
represent the net expenses paid by the class.
H Amount represents less than $.001 per share.
|
See accompanying notes which are an integral part of the financial statements.
39 Annual Report
| Financial Highlights Class B | | | | | | | | | | | | |
| |
| Years ended December 31, | | | | 2005 | | | | 2004 | | | | 2003F |
| Selected Per Share Data | | | | | | | | | | | | |
| Net asset value, beginning of period | | | | $ 10.39 | | | | $ 10.49 | | | | $ 10.49 |
| Income from Investment Operations | | | | | | | | | | | | |
| Net investment incomeE | | | | 190 | | | | .172 | | | | .081 |
| Net realized and unrealized gain (loss) | | | | (.177) | | | | (.080) | | | | .059 |
| Total from investment operations | | | | 013 | | | | .092 | | | | .140 |
| Distributions from net investment income | | | | (.190) | | | | (.173) | | | | (.075) |
| Distributions from net realized gain | | | | (.003) | | | | (.019) | | | | (.065) |
| Total distributions | | | | (.193) | | | | (.192) | | | | (.140) |
| Redemption fees added to paid in capitalE,H | | | | — | | | | — | | | | — |
| Net asset value, end of period | | | | $ 10.21 | | | | $ 10.39 | | | | $ 10.49 |
| Total ReturnB,C,D | | | | 13% | | | | .89% | | | | 1.34% |
| Ratios to Average Net AssetsG | | | | | | | | | | | | |
| Expenses before reductions | | | | 1.41% | | | | 1.40% | | | | 1.40%A |
| Expenses net of fee waivers, if any | | | | 1.41% | | | | 1.40% | | | | 1.40%A |
| Expenses net of all reductions | | | | 1.34% | | | | 1.39% | | | | 1.39%A |
| Net investment income | | | | 1.85% | | | | 1.65% | | | | 1.78%A |
| Supplemental Data | | | | | | | | | | | | |
| Net assets, end of period (in millions) | | | | $ 3 | | | | $ 4 | | | | $ 2 |
| Portfolio turnover rate | | | | 27% | | | | 45% | | | | 34% |
A Annualized
B Total returns for periods of less than one year are not annualized.
C Total returns would have been lower had certain expenses not been reduced during the periods shown.
D Total returns do not include the effect of the contingent deferred sales charge.
E Calculated based on average shares outstanding during the period.
F For the period July 23, 2003 (commencement of sale of shares) to December 31, 2003.
G Expense ratios reflect operating expenses of the class. Expenses before reductions do not reflect amounts reimbursed by the investment adviser or
expense offset arrangements and do not represent the amount paid by the class during periods when reimbursements or reductions occur. Expense
ratios before reductions for start up periods may not be representative of longer term operating periods. Expenses net of fee waivers reflect
expenses after reimbursement by the investment adviser but prior to reductions from expense offset arrangements. Expenses net of all reductions
represent the net expenses paid by the class.
H Amount represents less than $.001 per share.
|
See accompanying notes which are an integral part of the financial statements.
| Financial Highlights Class C | | | | | | | | | | | | |
| |
| Years ended December 31, | | | | 2005 | | | | 2004 | | | | 2003F |
| Selected Per Share Data | | | | | | | | | | | | |
| Net asset value, beginning of period | | | | $ 10.38 | | | | $ 10.48 | | | | $ 10.49 |
| Income from Investment Operations | | | | | | | | | | | | |
| Net investment incomeE | | | | 178 | | | | .159 | | | | .077 |
| Net realized and unrealized gain (loss) | | | | (.176) | | | | (.080) | | | | .048 |
| Total from investment operations | | | | 002 | | | | .079 | | | | .125 |
| Distributions from net investment income | | | | (.179) | | | | (.160) | | | | (.070) |
| Distributions from net realized gain | | | | (.003) | | | | (.019) | | | | (.065) |
| Total distributions | | | | (.182) | | | | (.179) | | | | (.135) |
| Redemption fees added to paid in capitalE,H | | | | — | | | | — | | | | — |
| Net asset value, end of period | | | | $ 10.20 | | | | $ 10.38 | | | | $ 10.48 |
| Total ReturnB,C,D | | | | 02% | | | | .77% | | | | 1.20% |
| Ratios to Average Net AssetsG | | | | | | | | | | | | |
| Expenses before reductions | | | | 1.52% | | | | 1.52% | | | | 1.50%A |
| Expenses net of fee waivers, if any | | | | 1.52% | | | | 1.52% | | | | 1.50%A |
| Expenses net of all reductions | | | | 1.45% | | | | 1.51% | | | | 1.49%A |
| Net investment income | | | | 1.74% | | | | 1.53% | | | | 1.67%A |
| Supplemental Data | | | | | | | | | | | | |
| Net assets, end of period (in millions) | | | | $ 10 | | | | $ 11 | | | | $ 8 |
| Portfolio turnover rate | | | | 27% | | | | 45% | | | | 34% |
A Annualized
B Total returns for periods of less than one year are not annualized.
C Total returns would have been lower had certain expenses not been reduced during the periods shown.
D Total returns do not include the effect of the contingent deferred sales charge.
E Calculated based on average shares outstanding during the period.
F For the period July 23, 2003 (commencement of sale of shares) to December 31, 2003.
G Expense ratios reflect operating expenses of the class. Expenses before reductions do not reflect amounts reimbursed by the investment adviser or
expense offset arrangements and do not represent the amount paid by the class during periods when reimbursements or reductions occur. Expense
ratios before reductions for start up periods may not be representative of longer term operating periods. Expenses net of fee waivers reflect
expenses after reimbursement by the investment adviser but prior to reductions from expense offset arrangements. Expenses net of all reductions
represent the net expenses paid by the class.
H Amount represents less than $.001 per share.
|
See accompanying notes which are an integral part of the financial statements.
41 Annual Report
| Financial Highlights Short Intermediate Municipal Income | | | | |
| |
| Years ended December 31, | | | | 2005 | | | | 2004 | | | | 2003 | | | | 2002 | | | | 2001 |
| Selected Per Share Data | | | | | | | | | | | | | | | | | | | | |
| Net asset value, | | | | | | | | | | | | | | | | | | | | |
| beginning of period | | | | $ 10.38 | | | | $ 10.48 | | | | $ 10.52 | | | | $ 10.27 | | | | $ 10.12 |
| Income from Investment | | | | | | | | | | | | | | | | | | | | |
| Operations | | | | | | | | | | | | | | | | | | | | |
| Net investment incomeB | | | | 284 | | | | .268 | | | | .283 | | | | .336 | | | | .396D |
| Net realized and unrealized | | | | | | | | | | | | | | | | | | | | |
| gain (loss) | | | | (.177) | | | | (.080) | | | | .030 | | | | .317 | | | | .173D |
| Total from investment operations | | | | 107 | | | | .188 | | | | .313 | | | | .653 | | | | .569 |
| Distributions from net investment | | | | | | | | | | | | | | | | | | | | |
| income | | | | (.284) | | | | (.269) | | | | (.283) | | | | (.339) | | | | (.396) |
| Distributions from net realized | | | | | | | | | | | | | | | | | | | | |
| gain | | | | (.003) | | | | (.019) | | | | (.070) | | | | (.064) | | | | (.023) |
| Total distributions | | | | (.287) | | | | (.288) | | | | (.353) | | | | (.403) | | | | (.419) |
| Redemption fees added to paid | | | | | | | | | | | | | | | | | | | | |
| in capitalB,E | | | | — | | | | — | | | | — | | | | — | | | | — |
| Net asset value, end of period | | | | $ 10.20 | | | | $ 10.38 | | | | $ 10.48 | | | | $ 10.52 | | | | $ 10.27 |
| Total ReturnA | | | | 1.06% | | | | 1.82% | | | | 3.01% | | | | 6.47% | | | | 5.70% |
| Ratios to Average Net AssetsC | | | | | | | | | | | | | | | | | | | | |
| Expenses before reductions | | | | 49% | | | | .49% | | | | .49% | | | | .49% | | | | .49% |
| Expenses net of fee waivers, | | | | | | | | | | | | | | | | | | | | |
| if any | | | | 49% | | | | .48% | | | | .49% | | | | .49% | | | | .49% |
| Expenses net of all reductions | | | | 42% | | | | .47% | | | | .47% | | | | .45% | | | | .41% |
| Net investment income | | | | 2.77% | | | | 2.57% | | | | 2.69% | | | | 3.23% | | | | 3.85%D |
| Supplemental Data | | | | | | | | | | | | | | | | | | | | |
| Net assets, end of period | | | | | | | | | | | | | | | | | | | | |
| (in millions) | | | | $ 1,665 | | | | $ 1,841 | | | | $ 1,843 | | | | $ 1,683 | | | | $ 1,183 |
| Portfolio turnover rate | | | | 27% | | | | 45% | | | | 34% | | | | 38% | | | | 43% |
A Total returns would have been lower had certain expenses not been reduced during the periods shown.
B Calculated based on average shares outstanding during the period.
C Expense ratios reflect operating expenses of the class. Expenses before reductions do not reflect amounts reimbursed by the investment adviser or
expense offset arrangements and do not represent the amount paid by the class during periods when reimbursements or reductions occur. Ex
penses net of fee waivers reflect expenses after reimbursement by the investment adviser but prior to reductions from expense offset arrange
ments. Expenses net of all reductions represent the net expenses paid by the class.
D Effective January 1, 2001, the fund adopted the provisions of the AICPA Audit and Accounting Guide for Investment Companies and began
amortizing premium and discount on all debt securities. Per share data and ratios for periods prior to adoption have not been restated to reflect
this change.
E Amount represents less than $.001 per share.
|
See accompanying notes which are an integral part of the financial statements.
| Financial Highlights Institutional Class | | | | | | | | | | | | |
| |
| Years ended December 31, | | | | 2005 | | | | 2004 | | | | 2003E |
| Selected Per Share Data | | | | | | | | | | | | |
| Net asset value, beginning of period | | | | $ 10.38 | | | | $ 10.49 | | | | $ 10.49 |
| Income from Investment Operations | | | | | | | | | | | | |
| Net investment incomeD | | | | 283 | | | | .265 | | | | .125 |
| Net realized and unrealized gain (loss) | | | | (.176) | | | | (.088) | | | | .059 |
| Total from investment operations | | | | 107 | | | | .177 | | | | .184 |
| Distributions from net investment income | | | | (.284) | | | | (.268) | | | | (.119) |
| Distributions from net realized gain | | | | (.003) | | | | (.019) | | | | (.065) |
| Total distributions | | | | (.287) | | | | (.287) | | | | (.184) |
| Redemption fees added to paid in capitalD,G | | | | — | | | | — | | | | — |
| Net asset value, end of period | | | | $ 10.20 | | | | $ 10.38 | | | | $ 10.49 |
| Total ReturnB,C | | | | 1.05% | | | | 1.71% | | | | 1.77% |
| Ratios to Average Net AssetsF | | | | | | | | | | | | |
| Expenses before reductions | | | | 49% | | | | .49% | | | | .48%A |
| Expenses net of fee waivers, if any | | | | 49% | | | | .49% | | | | .48%A |
| Expenses net of all reductions | | | | 42% | | | | .48% | | | | .47%A |
| Net investment income | | | | 2.77% | | | | 2.57% | | | | 2.69%A |
| Supplemental Data | | | | | | | | | | | | |
| Net assets, end of period (000 omitted) | | | | $ 2,625 | | | | $ 1,253 | | | | $ 414 |
| Portfolio turnover rate | | | | 27% | | | | 45% | | | | 34% |
A Annualized
B Total returns for periods of less than one year are not annualized.
C Total returns would have been lower had certain expenses not been reduced during the periods shown.
D Calculated based on average shares outstanding during the period.
E For the period July 23, 2003 (commencement of sale of shares) to December 31, 2003.
F Expense ratios reflect operating expenses of the class. Expenses before reductions do not reflect amounts reimbursed by the investment adviser or
expense offset arrangements and do not represent the amount paid by the class during periods when reimbursements or reductions occur. Expense
ratios before reductions for start up periods may not be representative of longer term operating periods. Expenses net of fee waivers reflect
expenses after reimbursement by the investment adviser but prior to reductions from expense offset arrangements. Expenses net of all reductions
represent the net expenses paid by the class.
G Amount represents less than $.001 per share.
|
See accompanying notes which are an integral part of the financial statements.
43 Annual Report
Notes to Financial Statements
For the period ended December 31, 2005
(Amounts in thousands except ratios)
|
1. Significant Accounting Policies.
Fidelity Short Intermediate Municipal Income Fund (the fund) is a fund of Fidelity Municipal Trust (the trust) and is authorized to issue an unlimited number of shares. On July 21, 2005, the Board of Trustees approved a change in the name of Spartan Short Intermediate Municipal Income Fund to Fidelity Short Intermediate Municipal Income Fund effective August 15, 2005. The trust is registered under the Investment Company Act of 1940, as amended (the 1940 Act), as an open end management investment company organized as a Massachusetts business trust.
The fund offers Class A, Class T, Class B, Class C, Short Intermediate Municipal Income and Institutional Class shares, each of which has equal rights as to assets and voting privileges. Each class has exclusive voting rights with respect to matters that affect that class. Class B shares will automatically convert to Class A shares after a holding period of four years from the initial date of purchase. Investment income, realized and unrealized capital gains and losses, the common expenses of the fund, and certain fund level expense reductions, if any, are allocated on a pro rata basis to each class based on the relative net assets of each class to the total net assets of the fund. Each class differs with respect to transfer agent and distribution and service plan fees incurred. Certain ex pense reductions also differ by class.
The fund may invest in affiliated money market central funds (Money Market Central Funds), which are open end investment companies available to investment companies and other accounts managed by Fidelity Management & Research Company (FMR) and its affiliates. The financial statements have been prepared in conformity with accounting principles generally accepted in the United States of America, which require manage ment to make certain estimates and assumptions at the date of the financial statements. The following summarizes the significant accounting policies of the fund:
Security Valuation. Investments are valued and net asset value per share is calculated (NAV calculation) as of the close of business of the New York Stock Exchange, normally 4:00 p.m. Eastern time. Wherever possible, the fund uses independent pricing services approved by the Board of Trustees to value its investments. Debt securities, including restricted securities, for which quotes are readily available, are valued by independent pricing services or by dealers who make markets in such securities. Pricing services consider yield or price of bonds of comparable quality, coupon, maturity and type as well as dealer supplied prices. When current market prices or quotations are not readily available or do not accurately reflect fair value, valuations may be determined in accor dance with procedures adopted by the Board of Trustees. The frequency of when fair value pricing is used is unpredictable. The value of securities used for NAV calculation under fair value pricing may differ from published prices for the same securities.
| 1. Significant Accounting Policies continued |
Security Valuation continued | | |
Investments in open end mutual funds are valued at their closing net asset value each business day. Short term securities with remaining maturities of sixty days or less for which quotations are not readily available are valued at amortized cost, which approxi mates value.
Investment Transactions and Income. Security transactions are accounted for as of trade date. Gains and losses on securities sold are determined on the basis of identified cost. Interest income is accrued as earned. Interest income includes coupon interest and amortization of premium and accretion of discount on debt securities.
Expenses. Most expenses of the trust can be directly attributed to a fund. Expenses which cannot be directly attributed are apportioned among each fund in the trust.
Income Tax Information and Distributions to Shareholders. Each year, the fund intends to qualify as a regulated investment company by distributing all of its taxable income and realized gains under Subchapter M of the Internal Revenue Code. As a result, no provision for income taxes is required in the accompanying financial statements.
Dividends are declared daily and paid monthly from net investment income. Distribu tions from realized gains, if any, are recorded on the ex dividend date. Income dividends and capital gain distributions are declared separately for each class. Income and capital gain distributions are determined in accordance with income tax regulations, which may differ from generally accepted accounting principles. In addition, the fund will claim a portion of the payment made to redeeming shareholders as a distribution for income tax purposes.
Capital accounts within the financial statements are adjusted for permanent book tax differences. These adjustments have no impact on net assets or the results of operations. Temporary book tax differences will reverse in a subsequent period.
Book tax differences are primarily due to market discount, deferred trustees compensa tion, capital loss carryforwards and losses deferred due to excise tax regulations.
The fund purchases municipal securities whose interest, in the opinion of the issuer, is free from federal income tax. There is no assurance that the Internal Revenue Service (IRS) will agree with this opinion. In the event the IRS determines that the issuer does not comply with relevant tax requirements, interest payments from a security could become federally taxable, possibly retroactively to the date the security was issued.
45 Annual Report
| Notes to Financial Statements continued | | |
| (Amounts in thousands except ratios) | | | | |
1. Significant Accounting Policies continued | | |
Income Tax Information and Distributions to Shareholders continued |
The tax basis components of distributable earnings and the federal tax cost as of period end were as follows:
| Unrealized appreciation | | $ | | 6,805 | | | | |
| Unrealized depreciation | | | | (15,785) | | | | |
| Net unrealized appreciation (depreciation) | | | | (8,980) | | | | |
| Capital loss carryforward | | | | (699) | | | | |
| |
| Cost for federal income tax purposes | | $ | | 1,716,088 | | | | |
| |
| The tax character of distributions paid was as follows: | | | | |
| |
| | | | | December 31, 2005 | | | | December 31, 2004 |
| Tax exempt Income | | $ | | 51,341 | | $ | | 47,598 |
| Long term Capital Gains | | | | 549 | | | | 3,486 |
| Total | | $ | | 51,890 | | $ | | 51,084 |
Short Term Trading (Redemption) Fees. Shares held in the fund less than 30 days are subject to a redemption fee equal to .50% of the proceeds of the redeemed shares. All redemption fees, including any estimated redemption fees paid by FMR, are retained by the fund and accounted for as an addition to paid in capital.
Delayed Delivery Transactions and When Issued Securities. The fund may purchase or sell securities on a delayed delivery or when issued basis. Payment and delivery may take place after the customary settlement period for that security. The price of the underlying securities and the date when the securities will be delivered and paid for are fixed at the time the transaction is negotiated. During the time a delayed delivery sell is outstanding, the contract is marked to market daily and equivalent deliverable securities are held for the transaction. The value of the securities purchased on a delayed delivery or when issued basis are identified as such in the fund’s Schedule of Investments. The fund may receive compensation for interest forgone in the purchase of a delayed delivery or when issued security. With respect to purchase commitments, the fund identifies securities as segregated in its records with a value at least equal to the amount of the commitment. Losses may arise due to changes in the value of the underly ing securities or if the counterparty does not perform under the contract’s terms, or if the issuer does not issue the securities due to political, economic, or other factors.
2. Operating Policies continued
Restricted Securities. The fund may invest in securities that are subject to legal or contractual restrictions on resale. These securities generally may be resold in transac tions exempt from registration or to the public if the securities are registered. Disposal of these securities may involve time consuming negotiations and expense, and prompt sale at an acceptable price may be difficult. Information regarding restricted securities is included at the end of the fund’s Schedule of Investments.
3. Purchases and Sales of Investments.
Purchases and sales of securities, other than short term securities and U.S. government securities, aggregated $492,046 and $656,962, respectively.
4. Fees and Other Transactions with Affiliates.
Management Fee. FMR and its affiliates provide the fund with investment manage ment related services for which the fund pays a monthly management fee. The manage ment fee is the sum of an individual fund fee rate that is based on an annual rate of .25% of the fund’s average net assets and a group fee rate that averaged .12% during the period. The group fee rate is based upon the average net assets of all the mutual funds advised by FMR. The group fee rate decreases as assets under management increase and increases as assets under management decrease. For the period, the total annual man agement fee rate was ..37% of the fund’s average net assets.
Distribution and Service Plan. In accordance with Rule 12b 1 of the 1940 Act, the fund has adopted separate Distribution and Service Plans for each class of shares. Certain classes pay Fidelity Distributors Corporation (FDC), an affiliate of FMR, separate Distribu tion and Service Fees, each of which is based on an annual percentage of each class’ average net assets. In addition, FDC may pay financial intermediaries for selling shares of the fund and providing shareholder support services. For the period, the Distribution and Service Fee rates and the total amounts paid to and retained by FDC were as follows:
| | | Distribution | | Service | | | | Paid to | | | | Retained |
| | | Fee | | Fee | | | | FDC | | | | by FDC |
| Class A | | 0% | | .15% | | | $ | 18 | | | $ | — |
| Class T | | 0% | | .25% | | | | 47 | | | | 1 |
| Class B | | 65% | | .25% | | | | 33 | | | | 24 |
| Class C | | 75% | | .25% | | | | 112 | | | | 40 |
| | | | | | | | $ | 210 | | | $ | 65 |
Sales Load. FDC receives a front end sales charge of up to 3.75% for selling Class A shares, and 2.75% for selling Class T shares, some of which is paid to financial intermedi aries for selling shares of the fund. FDC receives the proceeds of contingent deferred sales charges levied on Class A, Class T, Class B, and Class C redemptions. These charges
47 Annual Report
| Notes to Financial Statements continued | | |
| (Amounts in thousands except ratios) | | |
4. Fees and Other Transactions with Affiliates continued |
Sales Load - continued | | |
depend on the holding period. The deferred sales charges range from 3% to 1% for Class B, 1% for Class C, and .25% for certain purchases of Class A and Class T shares.
| For the period, sales charge amounts retained by FDC were as follows: | | |
| |
| | | | | Retained |
| | | | | by FDC |
| Class A | | | $ | 7 |
| Class T | | | | 10 |
| Class B* | | | | 7 |
| Class C* | | | | 5 |
| | | | $ | 29 |
* When Class B and Class C shares are initially sold, FDC pays commissions from its own resources to financial intermediaries through which the sales are made.
Transfer Agent and Accounting Fees. Citibank, N.A. (Citibank) is the custodian, transfer agent, and shareholder servicing agent for the fund’s Class A, Class T, Class B, Class C, Short Intermediate Municipal Income and Institutional Class shares. Citibank has entered into a sub arrangement with Fidelity Investments Institutional Operations Company, Inc. (FIIOC), an affiliate of FMR, with respect to all classes of the fund, except for Short Intermediate Municipal Income, to perform the transfer, dividend disbursing, and shareholder servicing agent functions. Citibank has also entered into a sub arrange ment with Fidelity Service Company, Inc. (FSC), an affiliate of FMR, with respect to Short Intermediate Municipal Income, to perform the transfer, dividend disbursing, and shareholder servicing agent functions. FIIOC and FSC receive account fees and asset based fees that vary according to the account size and type of account of the shareholders of the respective classes of the fund. All fees are paid to FIIOC by Citibank, which is reimbursed by each class for such payments. FIIOC and FSC pay for typesetting, printing and mailing of shareholder reports, except proxy statements. For the period, each class paid the following transfer agent fees:
| | | | | | | | | % of |
| | | | | | | | | Average |
| | | | | | | Amount | | Net Assets |
| Class A | | | | | $ | 11 | | .09 |
| Class T | | | | | | 19 | | .10 |
| Class B | | | | | | 4 | | .10 |
| Class C | | | | | | 12 | | .11 |
| Short Intermediate Municipal Income | | | | | | 1,454 | | .08 |
| Institutional Class | | | | | | 1 | | .08 |
| | | | | | $ | 1,501 | | |
| |
| |
| |
| Annual Report | | 48 | | | | | | |
| 4. Fees and Other Transactions with Affiliates continued |
Transfer Agent and Accounting Fees continued | | |
Citibank also has a sub arrangement with FSC to maintain the fund’s accounting records. The fee is based on the level of average net assets for the month.
Affiliated Central Funds. The fund may invest in Money Market Central Funds which seek preservation of capital and current income and are managed by Fidelity Investments Money Management, Inc. (FIMM), an affiliate of FMR. The Money Market Central Funds do not pay a management fee.
5. Committed Line of Credit.
|
The fund participates with other funds managed by FMR in a $4.2 billion credit facility (the “line of credit”) to be utilized for temporary or emergency purposes to fund share holder redemptions or for other short term liquidity purposes. The fund has agreed to pay commitment fees on its pro rata portion of the line of credit. During the period, there were no borrowings on this line of credit.
Through arrangements with the fund’s custodian and each class’ transfer agent, credits realized as a result of uninvested cash balances were used to reduce the fund’s expenses. During the period, these credits reduced the fund’s custody and accounting expenses by $29 and $332, respectively. During the period, credits reduced each class’ transfer agent expense as noted in the table below.
| | | | | Transfer Agent |
| | | | | expense reduction |
| Class A | | | $ | 6 |
| Class T | | | | 9 |
| Class B | | | | 1 |
| Class C | | | | 5 |
| Short Intermediate Municipal Income | | | | 858 |
| Institutional Class | | | | 1 |
| | | | $ | 880 |
| |
| 7. Other. | | | | |
The fund’s organizational documents provide former and current trustees and officers with a limited indemnification against liabilities arising in connection with the performance of their duties to the fund. In the normal course of business, the fund may also enter into contracts that provide general indemnifications. The fund’s maximum exposure under these arrangements is unknown as this would be dependent on future claims that may be made against the fund. The risk of material loss from such claims is considered remote.
49 Annual Report
| Notes to Financial Statements continued |
| (Amounts in thousands except ratios) | | |
8. Distributions to Shareholders.
Distributions to shareholders of each class were as follows:
| | | | | | | | | Years ended December 31, |
| | | | | | | | | 2005 | | | | 2004 |
| From net investment income | | | | | | | | | | | | |
| Class A | | | | | | | $ | 313 | | | $ | 303 |
| Class T | | | | | | | | 465 | | | | 403 |
| Class B | | | | | | | | 68 | | | | 58 |
| Class C | | | | | | | | 195 | | | | 160 |
| Short Intermediate Municipal Income | | | | | | | | 50,256 | | | | 46,653 |
| Institutional Class | | | | | | | | 44 | | | | 21 |
| Total | | | | | | | $ | 51,341 | | | $ | 47,598 |
| From net realized gain | | | | | | | | | | | | |
| Class A | | | | | | | $ | 4 | | | $ | 23 |
| Class T | | | | | | | | 6 | | | | 36 |
| Class B | | | | | | | | 1 | | | | 7 |
| Class C | | | | | | | | 3 | | | | 20 |
| Short Intermediate Municipal Income | | | | | | | | 534 | | | | 3,398 |
| Institutional Class | | | | | | | | 1 | | | | 2 |
| Total | | | | | | | $ | 549 | | | $ | 3,486 |
| |
| 9. Share Transactions. | | | | | | | | | | | | |
| |
| Transactions for each class of shares were as follows: | | | | | | | | |
| |
| | | Shares | | | | Dollars |
| | | Years ended December 31, | | | | Years ended December 31, |
| | | 2005 | | 2004 | | | | 2005 | | | | 2004 |
| Class A | | | | | | | | | | | | |
| Shares sold | | 684 | | 1,095 | | | $ | 6,996 | | | $ | 11,465 |
| Reinvestment of distributions | | 23 | | 24 | | | | 238 | | | | 253 |
| Shares redeemed | | (498) | | (785) | | | | (5,104) | | | | (8,128) |
| Net increase (decrease) | | 209 | | 334 | | | $ | 2,130 | | | $ | 3,590 |
| Class T | | | | | | | | | | | | |
| Shares sold | | 517 | | 1,569 | | | $ | 5,299 | | | $ | 16,393 |
| Reinvestment of distributions | | 34 | | 30 | | | | 351 | | | | 309 |
| Shares redeemed | | (1,028) | | (818) | | | | (10,531) | | | | (8,551) |
| Net increase (decrease) | | (477) | | 781 | | | $ | (4,881) | | | $ | 8,151 |
| Class B | | | | | | | | | | | | |
| Shares sold | | 65 | | 214 | | | $ | 661 | | | $ | 2,231 |
| Reinvestment of distributions | | 4 | | 4 | | | | 44 | | | | 42 |
| Shares redeemed | | (100) | | (84) | | | | (1,025) | | | | (870) |
| Net increase (decrease) | | (31) | | 134 | | | $ | (320) | | | $ | 1,403 |
| |
| |
| Annual Report | | 50 | | | | | | | | | | |
| 9. Share Transactions - continued | | | | | | | | | | |
| |
| | | Shares | | | | Dollars |
| | | Years ended December 31, | | | | Years ended December 31, |
| | | 2005 | | 2004 | | | | 2005 | | | | 2004 |
| Class C | | | | | | | | | | | | |
| Shares sold | | 438 | | 658 | | | $ | 4,492 | | | $ | 6,848 |
| Reinvestment of distributions | | 11 | | 10 | | | | 116 | | | | 103 |
| Shares redeemed | | (541) | | (295) | | | | (5,552) | | | | (3,054) |
| Net increase (decrease) | | (92) | | 373 | | | $ | (944) | | | $ | 3,897 |
| Short Intermediate Municipal | | | | | | | | | | | | |
| Income | | | | | | | | | | | | |
| Shares sold | | 46,854 | | 75,115 | | | $ | 481,284 | | | $ | 784,282 |
| Reinvestment of distributions | | 3,476 | | 3,669 | | | | 35,648 | | | | 38,189 |
| Shares redeemed | | (64,556) | | (77,123) | | | | (661,741) | | | | (803,196) |
| Net increase (decrease) | | (14,226) | | 1,661 | | | $ | (144,809) | | | $ | 19,275 |
| Institutional Class | | | | | | | | | | | | |
| Shares sold | | 194 | | 110 | | | $ | 1,994 | | | $ | 1,153 |
| Reinvestment of distributions | | 2 | | 1 | | | | 18 | | | | 8 |
| Shares redeemed | | (60) | | (30) | | | | (615) | | | | (317) |
| Net increase (decrease) | | 136 | | 81 | | | $ | 1,397 | | | $ | 844 |
51 Annual Report
Report of Independent Registered Public Accounting Firm
To the Trustees of Fidelity Municipal Trust and the Shareholders of Fidelity Short Intermediate Municipal Income Fund (formerly Spartan Short Intermediate Municipal Income Fund):
In our opinion, the accompanying statement of assets and liabilities, including the schedule of investments, and the related statements of operations and of changes in net assets and the financial highlights present fairly, in all material respects, the financial position of Fidelity Short Intermediate Municipal Income Fund (formerly Spartan Short Intermediate Municipal Income Fund) (a fund of Fidelity Municipal Trust) at December 31, 2005 and the results of its operations, the changes in its net assets and the financial highlights for the periods indicated, in conformity with accounting principles generally accepted in the United States of America. These financial statements and financial highlights (hereafter referred to as “financial statements”) are the responsibility of the Fidelity Short Intermediate Municipal Income Fund’s management; our responsi bility is to express an opinion on these financial statements based on our audits. We conducted our audits of these financial statements in accordance with the standards of the Public Company Accounting Oversight Board (United States). Those standards require that we plan and perform the audit to obtain reasonable assurance about whether the financial statements are free of material misstatement. An audit includes examining, on a test basis, evidence supporting the amounts and disclosures in the financial state ments, assessing the accounting principles used and significant estimates made by management, and evaluating the overall financial statement presentation. We believe that our audits, which included confirmation of securities at December 31, 2005 by correspon dence with the custodian and brokers, provide a reasonable basis for our opinion.
/s/ PricewaterhouseCoopers LLP
PricewaterhouseCoopers LLP
Boston, Massachusetts
February 14, 2006
|
Trustees and Officers
The Trustees, Member of the Advisory Board, and executive officers of the trust and fund, as applicable, are listed below. The Board of Trustees governs the fund and is responsible for protecting the interests of shareholders. The Trustees are experienced executives who meet periodically throughout the year to oversee the fund’s activities, review contractual arrangements with companies that provide services to the fund, and review the fund’s performance. Except for William O. McCoy and Albert R. Gamper, Jr., each of the Trustees oversees 326 funds advised by FMR or an affiliate. Mr. McCoy oversees 328 funds advised by FMR or an affiliate. Mr. Gamper oversees 235 funds advised by FMR or an affiliate.
The Trustees hold office without limit in time except that (a) any Trustee may resign; (b) any Trustee may be removed by written instrument, signed by at least two thirds of the number of Trustees prior to such removal; (c) any Trustee who requests to be retired or who has become incapacitated by illness or injury may be retired by written instru ment signed by a majority of the other Trustees; and (d) any Trustee may be removed at any special meeting of shareholders by a two thirds vote of the outstanding voting securities of the trust. Each Trustee who is not an interested person (as defined in the 1940 Act) (Independent Trustee), shall retire not later than the last day of the calendar year in which his or her 72nd birthday occurs. The Independent Trustees may waive this mandatory retirement age policy with respect to individual Trustees. The executive officers and Advisory Board Member hold office without limit in time, except that any officer and Advisory Board Member may resign or may be removed by a vote of a majority of the Trustees at any regular meeting or any special meeting of the Trustees. Except as indicated, each individual has held the office shown or other offices in the same company for the past five years.
The fund’s Statement of Additional Information (SAI) includes more information about the Trustees. To request a free copy, call Fidelity at 1-800-544-8544.
Correspondence intended for each Trustee who is an interested person may be sent to Fidelity Investments, 82 Devonshire Street, Boston, Massachusetts 02109.
| | Name, Age; Principal Occupation
Edward C. Johnson 3d (75)
|
Year of Election or Appointment: 1984
Mr. Johnson is Chairman of the Board of Trustees. Mr. Johnson serves as Chief Executive Officer, Chairman, and a Director of FMR Corp.; a Director and Chairman of the Board and of the Executive Committee of FMR; Chairman and a Director of Fidelity Management & Research (Far East) Inc.; Chairman and a Director of Fidelity Investments Money Management, Inc.; and Chairman (2001 present) and a Director (2000 present) of FMR Co., Inc.
53 Annual Report
Trustees and Officers - continued
| | Name, Age; Principal Occupation
Stephen P. Jonas (52)
|
Year of Election or Appointment: 2005
Mr. Jonas is Senior Vice President of Short Intermediate Municipal Income (2005 present). He also serves as Senior Vice President of other Fidelity funds (2005 present). Mr. Jonas is Executive Director of FMR (2005 present). Previously, Mr. Jonas served as President of Fidelity Enterprise Operations and Risk Services (2004 2005), Chief Adminis trative Officer (2002 2004), and Chief Financial Officer of FMR Co. (1998 2000). Mr. Jonas has been with Fidelity Investments since 1987 and has held various financial and management positions including Chief Financial Officer of FMR. In addition, he serves on the Boards of Boston Ballet (2003 present) and Simmons College (2003 present).
Year of Election or Appointment: 2003
Mr. Reynolds is a Director (2003 present) and Chief Operating Officer (2002 present) of FMR Corp. He also serves on the Board at Fidelity Investments Canada, Ltd. (2000 present). Previously, Mr. Reynolds served as President of Fidelity Investments Institutional Retirement Group (1996 2000).
* Trustees have been determined to be “Interested Trustees” by virtue of, among other things, their affiliation with the trust or various entities under common control with FMR.
Correspondence intended for each Independent Trustee (that is, the Trustees other than the Interested Trustees) may be sent to Fidelity Investments, P.O. Box 55235, Boston, Massachusetts 02205 5235.
| | Name, Age; Principal Occupation
Dennis J. Dirks (57)
|
Year of Election or Appointment: 2005
Prior to his retirement in May 2003, Mr. Dirks was Chief Operating Officer and a member of the Board of The Depository Trust & Clearing Corporation (DTCC) (1999 2003). He also served as President, Chief Operating Officer, and Board member of The Depository Trust Company (DTC) (1999 2003) and President and Board member of the National Securities Clearing Corporation (NSCC) (1999 2003). In addition, Mr. Dirks served as Chief Executive Officer and Board member of the Government Securities Clearing Corporation (2001 2003) and Chief Executive Officer and Board member of the Mortgage Backed Securities Clearing Corporation (2001 2003). Mr. Dirks also serves as a Trustee of Manhattan College (2005 present).
| | Albert R. Gamper, Jr. (63)
|
Year of Election or Appointment: 2006
Mr. Gamper also serves as a Trustee (2006 present) or Member of the Advisory Board (2005 present) of other investment companies advised by FMR. Prior to his retirement in December 2004, Mr. Gamper served as Chairman of the Board of CIT Group Inc. (commercial finance). During his tenure with CIT Group Inc. Mr. Gamper served in numerous senior management positions, including Chairman (1987 1989; 1999 2001; 2002 2004), Chief Executive Officer (1987 2004), and President (1989 2002). He currently serves as a member of the Board of Directors of Public Service Enterprise Group (utilities, 2001 present), Chairman of the Board of Governors, Rutgers University (2004 present), and Chairman of the Board of Saint Barnabas Health Care System.
55 Annual Report
Trustees and Officers - continued
| | Name, Age; Principal Occupation
Robert M. Gates (62)
|
Year of Election or Appointment: 1997
Dr. Gates is Chairman of the Independent Trustees (2006 present). Dr. Gates is President of Texas A&M University (2002 present). He was Director of the Central Intelligence Agency (CIA) from 1991 to 1993. From 1989 to 1991, Dr. Gates served as Assistant to the President of the United States and Deputy National Security Advisor. Dr. Gates is a Director of NACCO Industries, Inc. (mining and manufacturing), Parker Drilling Co., Inc. (drilling and rental tools for the energy industry, 2001 present), and Brinker International (restaurant management, 2003 present). Previously, Dr. Gates served as a Director of LucasVarity PLC (automotive components and diesel engines), a Director of TRW Inc. (automotive, space, defense, and information technology), and Dean of the George Bush School of Government and Public Service at Texas A&M University (1999 2001). Dr. Gates also is a Trustee of the Forum for International Policy.
Year of Election or Appointment: 2004
Dr. Heilmeier is Chairman Emeritus of Telcordia Technologies (commu nication software and systems), where prior to his retirement, he served as company Chairman and Chief Executive Officer. He currently serves on the Boards of Directors of The Mitre Corporation (systems engineer ing and information technology support for the government), and HRL Laboratories (private research and development, 2004 present). He is Chairman of the General Motors Science & Technology Advisory Board and a Life Fellow of the Institute of Electrical and Electronics Engineers (IEEE) (2000 present). Dr. Heilmeier is a member of the Defense Science Board and the National Security Agency Advisory Board. He is also a member of the National Academy of Engineering, the American Academy of Arts and Sciences, and the Board of Overseers of the School of Engineering and Applied Science of the University of Pennsylvania. Previously, Dr. Heilmeier served as a Director of TRW Inc. (automotive, space, defense, and information technology, 1992 2002), Compaq (1994 2002), Automatic Data Processing, Inc. (ADP) (technology based business outsourcing, 1995 2002), INET Technologies Inc. (telecommu nications network surveillance, 2001 2004), and Teletech Holdings (customer management services). He is the recipient of the 2005 Kyoto Prize in Advanced Technology for his invention of the liquid display.
Name, Age; Principal Occupation
Marie L. Knowles (59)
|
Year of Election or Appointment: 2001
Prior to Ms. Knowles’ retirement in June 2000, she served as Executive Vice President and Chief Financial Officer of Atlantic Richfield Company (ARCO) (diversified energy, 1996 2000). From 1993 to 1996, she was a Senior Vice President of ARCO and President of ARCO Transportation Company. She served as a Director of ARCO from 1996 to 1998. She currently serves as a Director of Phelps Dodge Corporation (copper mining and manufacturing) and McKesson Corporation (healthcare ser vice, 2002 present). Ms. Knowles is a Trustee of the Brookings Institution and the Catalina Island Conservancy and also serves as a member of the Advisory Board for the School of Engineering of the University of Southern California.
Year of Election or Appointment: 2000
Mr. Lautenbach has been a partner of Clayton, Dubilier & Rice, Inc. (private equity investment firm) since September 1998. Previously, Mr. Lautenbach was with the International Business Machines Corpora tion (IBM) from 1968 until his retirement in 1998. Mr. Lautenbach serves as a Director of Italtel Holding S.p.A. (telecommunications (Milan, Italy), 2004 present) and Eaton Corporation (diversified industrial) as well as the Philharmonic Center for the Arts in Naples, Florida. He also is a member of the Board of Trustees of Fairfield University (2005 present), as well as a member of the Council on Foreign Relations.
Year of Election or Appointment: 1997
Prior to his retirement in December 1994, Mr. McCoy was Vice Chair man of the Board of BellSouth Corporation (telecommunications) and President of BellSouth Enterprises. He is currently a Director of Liberty Corporation (holding company), Duke Realty Corporation (real estate), and Progress Energy, Inc. (electric utility). He is also a partner of Frank lin Street Partners (private investment management firm) and a member of the Research Triangle Foundation Board. In addition, Mr. McCoy served as the Interim Chancellor (1999 2000) and a member of the Board of Visitors for the University of North Carolina at Chapel Hill and currently serves on the Board of Directors of the University of North Carolina Health Care System and the Board of Visitors of the Kenan Flagler Business School (University of North Carolina at Chapel Hill). He also served as Vice President of Finance for the University of North Carolina (16 school system).
57 Annual Report
Trustees and Officers - continued
| | Name, Age; Principal Occupation
Cornelia M. Small (61)
|
Year of Election or Appointment: 2005
Ms. Small is a member (2000 present) and Chairperson (2002 present) of the Investment Committee, and a member (2002 present) of the Board of Trustees of Smith College. Previously, she served as Chief Investment Officer (1999 2000), Director of Global Equity Investments (1996 1999), and a member of the Board of Directors of Scudder, Stevens & Clark (1990 1997) and Scudder Kemper Investments (1997 1998). In addition, Ms. Small served as Co Chair (2000 2003) of the Annual Fund for the Fletcher School of Law and Diplomacy.
| | William S. Stavropoulos (66)
|
Year of Election or Appointment: 2002
Mr. Stavropoulos is Chairman of the Board (2000 present) and a Member of the Board of Directors of The Dow Chemical Company. Since joining The Dow Chemical Company in 1967, Mr. Stavropoulos served in numerous senior management positions, including President (1993 2000; 2002 2003), CEO (1995 2000; 2002 2004), and Chair man of the Executive Committee (2000 2004). Currently, he is a Direc tor of NCR Corporation (data warehousing and technology solutions), BellSouth Corporation (telecommunications), Chemical Financial Corpo ration, Maersk Inc. (industrial conglomerate, 2002 present), and Metal mark Capital (private equity investment firm, 2005 present). He also serves as a member of the Board of Trustees of the American Enterprise Institute for Public Policy Research. In addition, Mr. Stavropoulos is a member of The Business Council, J.P. Morgan International Council and the University of Notre Dame Advisory Council for the College of Science.
Year of Election or Appointment: 2005
Prior to his retirement in 2001, Mr. Wolfe was Chairman and Chief Executive Officer of Hershey Foods Corporation (1993 2001). He cur rently serves as a member of the boards of Adelphia Communications Corporation (2003 present), Bausch & Lomb, Inc., and Revlon Inc. (2004 present).
Advisory Board Member and Executive Officers:
Correspondence intended for each executive officer and Mr. Lynch may be sent to Fidelity Investments, 82 Devonshire Street, Boston, Massachusetts 02109.
| | Name, Age; Principal Occupation
Peter S. Lynch (61)
|
Year of Election or Appointment: 2003
Member of the Advisory Board of Fidelity Municipal Trust. Vice Chair man and a Director of FMR, and Vice Chairman (2001 present) and a Director (2000 present) of FMR Co., Inc. Previously, Mr. Lynch served as a Trustee of the Fidelity funds (1990 2003). In addition, he serves as a Trustee of Boston College, Massachusetts Eye & Ear Infirmary, Historic Deerfield, John F. Kennedy Library, and the Museum of Fine Arts of Boston.
Year of Election or Appointment: 2005
Vice President of Short Intermediate Municipal Income. Mr. Donovan also serves as Vice President of Fidelity’s High Income Funds (2005 present), Fidelity’s Fixed Income Funds (2005 present), certain Asset Allocation Funds (2005 present), and certain Balanced Funds (2005 present). Mr. Donovan also serves as Executive Vice President of FMR (2005 present) and FMRC (2005 present). Previously, Mr. Donovan served as Vice President and Director of Fidelity’s International Equity Trading group (1998 2005).
Year of Election or Appointment: 2005
Vice President of Short Intermediate Municipal Income. Mr. Murphy also serves as Vice President of Fidelity’s Money Market Funds (2002 present), certain Asset Allocation Funds (2003 present), Fidelity’s Investment Grade Bond Funds (2005 present), and Fidelity’s Balanced Funds (2005 present). He serves as Senior Vice President (2000 present) and Head (2004 present) of the Fidelity Investments Fixed Income Division. Mr. Murphy is also a Senior Vice President of FIMM (2003 present) and a Vice President of FMR (2000 present). Previously, Mr. Murphy served as Money Market Group Leader (2002 2004), Bond Group Leader (2000 2002), and Vice President of Fidelity’s Taxable Bond Funds (2000 2002) and Fidelity’s Municipal Bond Funds (2001 2002). Mr. Murphy joined Fidelity Investments in 1989 as a portfolio manager in the Bond Group.
59 Annual Report
Trustees and Officers - continued
| | Name, Age; Principal Occupation
Thomas J. Silvia (44)
|
Year of Election or Appointment: 2005
Vice President of Short Intermediate Municipal Income. Mr. Silvia also serves as Vice President of Fidelity’s Bond Funds (2005 present), certain Balanced Funds (2005 present), certain Asset Allocation Funds (2005 present), and Senior Vice President and Bond Group Leader of the Fidelity Investments Fixed Income Division (2005 present). Previously, Mr. Silvia served as Director of Fidelity’s Taxable Bond portfolio managers (2002 2004) and a portfolio manager in the Bond Group (1997 2004).
Year of Election or Appointment: 2004
Vice President of Short Intermediate Municipal Income. Mr. Sommer also serves as Vice President of other funds advised by FMR. Prior to assuming his current responsibilities, Mr. Sommer worked as an analyst and manager.
Year of Election or Appointment: 1998
Secretary of Short Intermediate Municipal Income. He also serves as Secretary of other Fidelity funds; Vice President, General Counsel, and Secretary of FMR Co., Inc. (2001 present) and FMR; Assistant Secretary of Fidelity Management & Research (U.K.) Inc. (2001 present), Fidelity Management & Research (Far East) Inc. (2001 present), and Fidelity Invest ments Money Management, Inc. (2001 present). Mr. Roiter is an Adjunct Member, Faculty of Law, at Boston College Law School (2003 present). Previously, Mr. Roiter served as Vice President and Fidelity Distributors Corporation (FDC) (1998 2005).
Year of Election or Appointment: 2003
Assistant Secretary of Short Intermediate Municipal Income. Mr. Fross also serves as Assistant Secretary of other Fidelity funds (2003 present), Vice President and Secretary of FDC (2005 present), and is an employee of FMR.
Year of Election or Appointment: 2004
President, Treasurer, and Anti Money Laundering (AML) officer of Short Intermediate Municipal Income. Ms. Reynolds also serves as President, Treasurer, and AML officer of other Fidelity funds (2004) and is a Vice President (2003) and an employee (2002) of FMR. Before joining Fidelity Investments, Ms. Reynolds worked at PricewaterhouseCoopers LLP (PwC) (1980 2002), where she was most recently an audit partner with PwC’s investment management practice.
Name, Age; Principal Occupation
Paul M. Murphy (58)
|
Year of Election or Appointment: 2005
Chief Financial Officer of Short Intermediate Municipal Income. Mr. Murphy also serves as Chief Financial Officer of other Fidelity funds (2005 present). He also serves as Senior Vice President of Fidelity Pricing and Cash Management Services Group (FPCMS).
Kenneth A. Rathgeber (58)
|
Year of Election or Appointment: 2004
Chief Compliance Officer of Short Intermediate Municipal Income. Mr. Rathgeber also serves as Chief Compliance Officer of other Fidelity funds (2004) and Executive Vice President of Risk Oversight for Fidelity Investments (2002). Previously, he served as Executive Vice President and Chief Operating Officer for Fidelity Investments Institutional Services Company, Inc. (1998 2002).
Year of Election or Appointment: 2003
Deputy Treasurer of Short Intermediate Municipal Income. Mr. Hebble also serves as Deputy Treasurer of other Fidelity funds (2003), and is an employee of FMR. Before joining Fidelity Investments, Mr. Hebble worked at Deutsche Asset Management where he served as Director of Fund Accounting (2002 2003) and Assistant Treasurer of the Scudder Funds (1998 2003).
Year of Election or Appointment: 2005
Deputy Treasurer of Short Intermediate Municipal Income.
Mr. Mehrmann also serves as Deputy Treasurer of other Fidelity funds (2005 present) and is an employee of FMR. Previously, Mr. Mehrmann served as Vice President of Fidelity Investments Institutional Services Group (FIIS)/Fidelity Investments Institutional Operations Corporation, Inc. (FIIOC) Client Services (1998 2004).
Kimberley H. Monasterio (42)
|
Year of Election or Appointment: 2004
Deputy Treasurer of Short Intermediate Municipal Income.
Ms. Monasterio also serves as Deputy Treasurer of other Fidelity funds (2004) and is an employee of FMR (2004). Before joining Fidelity Investments, Ms. Monasterio served as Treasurer (2000 2004) and Chief Financial Officer (2002 2004) of the Franklin Templeton Funds and Senior Vice President of Franklin Templeton Services, LLC (2000 2004).
61 Annual Report
Trustees and Officers - continued
| | Name, Age; Principal Occupation
Kenneth B. Robins (36)
|
Year of Election or Appointment: 2005
Deputy Treasurer of Short Intermediate Municipal Income. Mr. Robins also serves as Deputy Treasurer of other Fidelity funds (2005 present) and is an employee of FMR (2004 present). Before joining Fidelity Investments, Mr. Robins worked at KPMG LLP, where he was a partner in KPMG’s department of professional practice (2002 2004) and a Senior Manager (1999 2000). In addition, Mr. Robins served as Assistant Chief Accountant, United States Securities and Exchange Commission (2000 2002).
Year of Election or Appointment: 2005
Assistant Treasurer of Short Intermediate Municipal Income. Mr. Byrnes also serves as Assistant Treasurer of other Fidelity funds (2005 present) and is an employee of FMR (2005 present). Previously, Mr. Byrnes served as Vice President of FPCMS (2003 2005). Before joining Fidelity Investments, Mr. Byrnes worked at Deutsche Asset Management where he served as Vice President of the Investment Operations Group (2000 2003).
Year of Election or Appointment: 1986
Assistant Treasurer of Short Intermediate Municipal Income. Mr. Costello also serves as Assistant Treasurer of other Fidelity funds and is an employee of FMR.
Year of Election or Appointment: 2004
Assistant Treasurer of Short Intermediate Municipal Income. Mr. Lydecker also serves as Assistant Treasurer of other Fidelity funds (2004) and is an employee of FMR.
Year of Election or Appointment: 2002
Assistant Treasurer of Short Intermediate Municipal Income. Mr. Osterheld also serves as Assistant Treasurer of other Fidelity funds (2002) and is an employee of FMR.
Name, Age; Principal Occupation
Gary W. Ryan (47)
|
Year of Election or Appointment: 2005
Assistant Treasurer of Short Intermediate Municipal Income. Mr. Ryan also serves as Assistant Treasurer of other Fidelity funds (2005 present) and is an employee of FMR (2005 present). Previously, Mr. Ryan served as Vice President of Fund Reporting in FPCMS (1999 2005).
Year of Election or Appointment: 2005
Assistant Treasurer of Short Intermediate Municipal Income.
Mr. Schiavone also serves as Assistant Treasurer of other Fidelity funds (2005 present) and is an employee of FMR (2005 present). Before joining Fidelity Investments, Mr. Schiavone worked at Deutsche Asset Management, where he most recently served as Assistant Treasurer (2003 2005) of the Scudder Funds and Vice President and Head of Fund Reporting (1996 2003).
63 Annual Report
During fiscal year ended 2005, 100% of the fund’s income dividends was free from federal income tax, and 9.66% of the fund’s income dividends was subject to the federal alternative minimum tax.
The fund will notify shareholders in January 2006 of amounts for use in preparing 2005 income tax returns.
Proxy Voting Results
A special meeting of the fund’s shareholders was held on January 18, 2006. The results of votes taken among shareholders on the proposal before them are reported below. Each vote reported represents one dollar of net asset value held on the record date for the meeting.
| PROPOSAL 1 | | | | |
| To elect a Board of Trustees.A | | |
| | | # of | | % of |
| | | Votes | | Votes |
| |
| Dennis J. Dirks | | | | |
| Affirmative | | 4,012,578,790.76 | | 95.238 |
| Withheld | | 200,653,306.55 | | 4.762 |
| TOTAL | | 4,213,232,097.31 | | 100.000 |
| Albert R. Gamper, Jr. | | |
| Affirmative | | 4,015,643,707.84 | | 95.310 |
| Withheld | | 197,588,389.47 | | 4.690 |
| TOTAL | | 4,213,232,097.31 | | 100.000 |
| Robert M. Gates | | |
| Affirmative | | 4,004,345,809.00 | | 95.042 |
| Withheld | | 208,886,288.31 | | 4.958 |
| TOTAL | | 4,213,232,097.31 | | 100.000 |
| George H. Heilmeier | | |
| Affirmative | | 4,008,127,523.93 | | 95.132 |
| Withheld | | 205,104,573.38 | | 4.868 |
| TOTAL | | 4,213,232,097.31 | | 100.000 |
| Abigail P. Johnson | | |
| Affirmative | | 3,993,175,527.66 | | 94.777 |
| Withheld | | 220,056,569.65 | | 5.223 |
| TOTAL | | 4,213,232,097.31 | | 100.000 |
| Edward C. Johnson 3d | | |
| Affirmative | | 3,987,333,615.26 | | 94.638 |
| Withheld | | 225,898,482.05 | | 5.362 |
| TOTAL | | 4,213,232,097.31 | | 100.000 |
| Stephen P. Jonas | | |
| Affirmative | | 4,010,007,680.52 | | 95.177 |
| Withheld | | 203,224,416.79 | | 4.823 |
| TOTAL | | 4,213,232,097.31 | | 100.000 |
| | | # of | | % of |
| | | Votes | | Votes |
| |
| Marie L. Knowles | | |
| Affirmative | | 4,010,231,303.96 | | 95.182 |
| Withheld | | 203,000,793.35 | | 4.818 |
| TOTAL | | 4,213,232,097.31 | | 100.000 |
| |
| Ned C. Lautenbach | | |
| Affirmative | | 4,009,136,177.44 | | 95.156 |
| Withheld | | 204,095,919.87 | | 4.844 |
| TOTAL | | 4,213,232,097.31 | | 100.000 |
| |
| William O. McCoy | | |
| Affirmative | | 4,001,996,735.35 | | 94.986 |
| Withheld | | 211,235,361.96 | | 5.014 |
| TOTAL | | 4,213,232,097.31 | | 100.000 |
| |
| Robert L. Reynolds | | |
| Affirmative | | 4,010,560,206.65 | | 95.190 |
| Withheld | | 202,671,890.66 | | 4.810 |
| TOTAL | | 4,213,232,097.31 | | 100.000 |
| |
| Cornelia M. Small | | |
| Affirmative | | 4,011,161,760.21 | | 95.204 |
| Withheld | | 202,070,337.10 | | 4.796 |
| TOTAL | | 4,213,232,097.31 | | 100.000 |
| |
| William S. Stavropoulos | | |
| Affirmative | | 4,001,217,912.57 | | 94.968 |
| Withheld | | 212,014,184.74 | | 5.032 |
| TOTAL | | 4,213,232,097.31 | | 100.000 |
| |
| Kenneth L. Wolfe | | |
| Affirmative | | 4,011,439,868.05 | | 95.211 |
| Withheld | | 201,792,229.26 | | 4.789 |
| TOTAL | | 4,213,232,097.31 | | 100.000 |
A Denotes trust-wide proposals and voting results.
65 Annual Report
Managing Your Investments
Fidelity offers several ways to conveniently manage your personal investments via your telephone or PC. You can access your account information, conduct trades and research your investments 24 hours a day.
By Phone
Fidelity Automated Service Telephone provides a single toll free number to access account balances, positions, quotes and trading. It’s easy to navigate the service, and on your first call, the system will help you create a personal identification number (PIN) for security.


By PC
Fidelity’s web site on the Internet provides a wide range of information, including daily financial news, fund performance, interactive planning tools and news about Fidelity products and services.

* When you call the quotes line, please remember that a fund’s yield and return will vary and, except for money market funds, share price will also vary. This means that you may have a gain or loss when you sell your shares. There is no assurance that money market funds will be able to maintain a stable $1 share price; an investment in a money market fund is not insured or guar anteed by the U.S. government. Total returns are historical and include changes in share price, reinvestment of dividends and capital gains, and the effects of any sales charges.
Annual Report 66
To Write Fidelity
We’ll give your correspondence immediate attention and send you written confirmation upon completion of your request.

(such as changing name, address, bank, etc.)
Fidelity Investments
P.O. Box 770001
Cincinnati, OH 45277-0002
|

| | Buying shares
Fidelity Investments
P.O. Box 770001
Cincinnati, OH 45277-0003
Overnight Express
Fidelity Investments
Attn: Distribution Services
100 Crosby Parkway KC1H
Covington, KY 41015
Selling shares
Fidelity Investments
P.O. Box 770001
Cincinnati, OH 45277-0035
Overnight Express
Fidelity Investments
Attn: Distribution Services
100 Crosby Parkway KC1H
Covington, KY 41015
General Correspondence
Fidelity Investments
P.O. Box 500
Merrimack, NH 03054-0500
|

| | Buying shares
Fidelity Investments
P.O. Box 770001
Cincinnati, OH 45277-0003
Selling shares
Fidelity Investments
P.O. Box 770001
Cincinnati, OH 45277-0035
Overnight Express
Fidelity Investments
Attn: Distribution Services
100 Crosby Parkway KC1H
Covington, KY 41015
General Correspondence
Fidelity Investments
P.O. Box 500
Merrimack, NH 03054-0500
|
67 Annual Report
To Visit Fidelity
For directions and hours,
please call 1-800-544-9797.
Arizona
7001 West Ray Road
Chandler, AZ
7373 N. Scottsdale Road
Scottsdale, AZ
California
815 East Birch Street
Brea, CA
1411 Chapin Avenue
Burlingame, CA
851 East Hamilton Avenue
Campbell, CA
19200 Von Karman Avenue
Irvine, CA
601 Larkspur Landing Circle
Larkspur, CA
10100 Santa Monica Blvd.
Los Angeles, CA
27101 Puerta Real
Mission Viejo, CA
73 575 El Paseo
Palm Desert, CA
251 University Avenue
Palo Alto, CA
123 South Lake Avenue
Pasadena, CA
16995 Bernardo Ctr. Drive
Rancho Bernardo, CA
1740 Arden Way
Sacramento, CA
7676 Hazard Center Drive
San Diego, CA
8 Montgomery Street
San Francisco, CA
3793 State Street
Santa Barbara, CA
21701 Hawthorne Boulevard
Torrance, CA
2001 North Main Street
Walnut Creek, CA
6300 Canoga Avenue
Woodland Hills, CA
|
Colorado
1625 Broadway
Denver, CO
9185 East Westview Road
Littleton, CO
Connecticut
48 West Putnam Avenue
Greenwich, CT
265 Church Street
New Haven, CT
300 Atlantic Street
Stamford, CT
29 South Main Street
West Hartford, CT
Delaware
222 Delaware Avenue
Wilmington, DE
Florida
4400 N. Federal Highway
Boca Raton, FL
121 Alhambra Plaza
Coral Gables, FL
2948 N. Federal Highway
Ft. Lauderdale, FL
1907 West State Road 434
Longwood, FL
8880 Tamiami Trail, North
Naples, FL
3550 Tamiami Trail, South
Sarasota, FL
1502 N. Westshore Blvd.
Tampa, FL
2465 State Road 7
Wellington, FL
3501 PGA Boulevard
West Palm Beach, FL
Georgia
3445 Peachtree Road, N.E.
Atlanta, GA
1000 Abernathy Road
Atlanta, GA
Illinois
One North LaSalle Street
Chicago, IL
875 North Michigan Ave.
Chicago, IL
1415 West 22nd Street
Oak Brook, IL
|
1700 East Golf Road
Schaumburg, IL
3232 Lake Avenue
Wilmette, IL
Indiana
4729 East 82nd Street
Indianapolis, IN
Kansas
5400 College Boulevard
Overland Park, KS
Maine
Three Canal Plaza
Portland, ME
Maryland
7315 Wisconsin Avenue
Bethesda, MD
One W. Pennsylvania Ave.
Towson, MD
Massachusetts
801 Boylston Street
Boston, MA
155 Congress Street
Boston, MA
300 Granite Street
Braintree, MA
44 Mall Road
Burlington, MA
405 Cochituate Road
Framingham, MA
416 Belmont Street
Worcester, MA
Michigan
500 E. Eisenhower Pkwy.
Ann Arbor, MI
280 Old N. Woodward Ave.
Birmingham, MI
43420 Grand River Avenue
Novi, MI
29155 Northwestern Hwy.
Southfield, MI
Minnesota
7600 France Avenue South
Edina, MN
Missouri
8885 Ladue Road
Ladue, MO
|
Annual Report 68
Nevada
2225 Village Walk Drive
Henderson, NV
New Jersey
150 Essex Street
Millburn, NJ
56 South Street
Morristown, NJ
396 Route 17, North
Paramus, NJ
3518 Route 1 North
Princeton, NJ
530 Highway 35
Shrewsbury, NJ
New York
1055 Franklin Avenue
Garden City, NY
37 West Jericho Turnpike
Huntington Station, NY
1271 Avenue of the Americas
New York, NY
61 Broadway
New York, NY
350 Park Avenue
New York, NY
200 Fifth Avenue
New York, NY
733 Third Avenue
New York, NY
11 Penn Plaza
New York, NY
2070 Broadway
New York, NY
1075 Northern Blvd.
Roslyn, NY
North Carolina
4611 Sharon Road
Charlotte, NC
Ohio
3805 Edwards Road
Cincinnati, OH
1324 Polaris Parkway
Columbus, OH
28699 Chagrin Boulevard
Woodmere Village, OH
Oregon
16850 SW 72nd Avenue
Tigard, OR
|
Pennsylvania
600 West DeKalb Pike
King of Prussia, PA
1735 Market Street
Philadelphia, PA
12001 Perry Highway
Wexford, PA
Rhode Island
47 Providence Place
Providence, RI
Tennessee
6150 Poplar Avenue
Memphis, TN
Texas
10000 Research Boulevard
Austin, TX
4001 Northwest Parkway
Dallas, TX
12532 Memorial Drive
Houston, TX
2701 Drexel Drive
Houston, TX
6500 N. MacArthur Blvd.
Irving, TX
6005 West Park Boulevard
Plano, TX
14100 San Pedro
San Antonio, TX
1576 East Southlake Blvd.
Southlake, TX
19740 IH 45 North
Spring, TX
Utah
215 South State Street
Salt Lake City, UT
Virginia
1861 International Drive
McLean, VA
Washington
411 108th Avenue, N.E.
Bellevue, WA
1518 6th Avenue
Seattle, WA
Washington, DC
1900 K Street, N.W.
Washington, DC
Wisconsin
595 North Barker Road
Brookfield, WI
|
Fidelity Brokerage Services, Inc., 100 Summer St., Boston, MA 02110 Member NYSE/SIPC
69 Annual Report
69
71 Annual Report
Investment Adviser
Fidelity Management & Research Company
Boston, MA
Investment Sub Adviser
Fidelity Investments Money
Management, Inc.
Fidelity International Investment Advisors
Fidelity International Investment Advisors
(U.K.) Limited
General Distributor
Fidelity Distributors Corporation
Boston, MA
Transfer and Service Agents
Citibank, N.A.
New York, NY
Fidelity Service Company, Inc.
Boston, MA
Custodian
Citibank, N.A.
New York, NY
|
| The Fidelity Telephone Connection |
| Mutual Fund 24-Hour Service |
| Exchanges/Redemptions | | |
| and Account Assistance | | 1-800-544-6666 |
| Product Information | | 1-800-544-6666 |
| Retirement Accounts | | 1-800-544-4774 |
| (8 a.m. - 9 p.m.) | | |
| TDD Service | | 1-800-544-0118 |
| for the deaf and hearing impaired |
| (9 a.m. - 9 p.m. Eastern time) |
| Fidelity Automated Service | | |
| Telephone (FAST® ) (automated phone logo) | | 1-800-544-5555 |
| (automated phone logo) Automated line for quickest service |
STM-UANN-0206
1.787742.102
|


Fidelity Advisor
Short-Intermediate
Municipal Income
Fund - Class A, Class T, Class B
and Class C
|
Annual Report
December 31, 2005
|

Class A, Class T, Class B, and Class C are classes of Fidelity® Short Intermediate Municipal Income Fund
| Contents | | | | |
| |
| Chairman’s Message | | 4 | | Ned Johnson’s message to shareholders. |
| Performance | | 5 | | How the fund has done over time. |
| Management’s Discussion | | 7 | | The manager’s review of fund |
| | | | | performance, strategy and outlook. |
| Shareholder Expense | | 8 | | An example of shareholder expenses. |
| Example | | | | |
| Investment Changes | | 10 | | A summary of major shifts in the fund’s |
| | | | | investments over the past six months. |
| Investments | | 11 | | A complete list of the fund’s investments |
| | | | | with their market values. |
| Financial Statements | | 35 | | Statements of assets and liabilities, |
| | | | | operations, and changes in net assets, |
| | | | | as well as financial highlights. |
| Notes | | 45 | | Notes to the financial statements. |
| Report of Independent | | 53 | | |
| Registered Public | | | | |
| Accounting Firm | | | | |
| Trustees and Officers | | 54 | | |
| Distributions | | 65 | | |
| Proxy Voting Results | | 66 | | |
To view a fund’s proxy voting guidelines and proxy voting record for the 12 month period ended
June 30, visit www.fidelity.com/proxyvotingresults or visit the Securities and Exchange Commis
sion’s (SEC) web site at www.sec.gov. You may also call 1-877-208-0098 to request a free copy of
the proxy voting guidelines.
Standard & Poor’s, S&P and S&P 500 are registered service marks of The McGraw Hill Companies, Inc.
and have been licensed for use by Fidelity Distributors Corporation.
Other third party marks appearing herein are the property of their respective owners.
All other marks appearing herein are registered or unregistered trademarks or service marks of FMR
Corp. or an affiliated company.
|
This report and the financial statements contained herein are submitted for the general information
of the shareholders of the fund. This report is not authorized for distribution to prospective investors
in the fund unless preceded or accompanied by an effective prospectus.
A fund files its complete schedule of portfolio holdings with the SEC for the first and third
quarters of each fiscal year on Form N Q. Forms N Q are available on the SEC’s web site at
http://www.sec.gov. A fund’s Forms N Q may be reviewed and copied at the SEC’s Public Reference
Room in Washington, DC. Information regarding the operation of the SEC’s Public Reference
Room may be obtained by calling 1-800-SEC-0330. For a complete list of a fund’s portfolio hold
ings, view the most recent quarterly holdings report, semiannual report, or annual report on
Fidelity’s web site at http://www.advisor.fidelity.com.
NOT FDIC INSURED · MAY LOSE VALUE · NO BANK GUARANTEE
Neither the fund nor Fidelity Distributors Corporation is a bank.
|
3 Annual Report
Chairman’s Message
(photograph of Edward C. Johnson 3d)
Dear Shareholder:
During the past year or so, much has been reported about the mutual fund industry, and much of it has been more critical than I believe is warranted. Allegations that some companies have been less than forthright with their shareholders have cast a shadow on the entire industry. I continue to find these reports disturbing, and assert that they do not create an accurate picture of the industry overall. Therefore, I would like to remind every one where Fidelity stands on these issues. I will say two things specifically regarding allegations that some mutual fund companies were in violation of the Securities and Exchange Commission’s forward pricing rules or were involved in so called “market timing” activities.
First, Fidelity has no agreements that permit customers who buy fund shares after 4 p.m. to obtain the 4 p.m. price. This is not a new policy. This is not to say that some one could not deceive the company through fraudulent acts. However, we are extremely diligent in preventing fraud from occurring in this manner and in every other. But I underscore again that Fidelity has no so called “agreements” that sanction illegal practices.
Second, Fidelity continues to stand on record, as we have for years, in opposition to predatory short term trading that adversely affects shareholders in a mutual fund. Back in the 1980s, we initiated a fee which is returned to the fund and, therefore, to investors to discourage this activity. Further, we took the lead several years ago in developing a Fair Value Pricing Policy to prevent market timing on foreign securities in our funds. I am confident we will find other ways to make it more difficult for predatory traders to operate. However, this will only be achieved through close cooperation among regulators, legislators and the industry.
Yes, there have been unfortunate instances of unethical and illegal activity within the mutual fund industry from time to time. That is true of any industry. When this occurs, confessed or convicted offenders should be dealt with appropriately. But we are still concerned about the risk of over regulation and the quick application of simplistic solutions to intricate problems. Every system can be improved, and we support and applaud well thought out improvements by regulators, legislators and industry representatives that achieve the common goal of building and protecting the value of investors’ holdings.
For nearly 60 years, Fidelity has worked very hard to improve its products and service to justify your trust. When our family founded this company in 1946, we had only a few hundred customers. Today, we serve more than 18 million customers including individual investors and participants in retirement plans across America.
Let me close by saying that we do not take your trust in us for granted, and we realize that we must always work to improve all aspects of our service to you. In turn, we urge you to continue your active participation with your financial matters, so that your interests can be well served.
Best regards,
/s/ Edward C. Johnson 3d
Edward C. Johnson 3d
Annual Report 4
Performance: The Bottom Line
Average annual total return reflects the change in the value of an investment, assuming reinvestment of the class’ dividend income and capital gains (the profits earned upon the sale of securities that have grown in value) and assuming a constant rate of perfor mance each year. The $10,000 table and the fund’s returns do not reflect the deduc tion of taxes that a shareholder would pay on fund distributions or the redemption of fund shares. During periods of reimbursement by Fidelity, a fund’s total return will be greater than it would be had the reimbursement not occurred. How a fund did yesterday is no guarantee of how it will do tomorrow. Returns may reflect the conversion of Class B shares to Class A shares after a maximum of four years.
| Average Annual Total Returns | | | | | | |
| Periods ended December 31, 2005 | | Past 1 | | Past 5 | | Past 10 |
| | | year | | years | | years |
| Class A (incl. 3.75% sales charge)A | | 2.89% | | 2.73% | | 3.54% |
| Class T (incl. 2.75% sales charge)B | | 1.89% | | 2.87% | | 3.61% |
| Class B (incl. contingent deferred sales charge)C | | 2.82% | | 3.14% | | 3.75% |
| Class C (incl. contingent deferred sales charge)D | | 0.96% | | 3.06% | | 3.71% |
A Class A shares bear a 0.15% 12b 1 fee. The initial offering of Class A shares took place on July 23,
2003. Returns prior to July 23, 2003 are those of Short Intermediate Municipal Income Fund, the origi
nal retail class of the fund, which has no 12b 1 fee. Had Class A shares’ 12b 1 fee been reflected, returns
prior to July 23, 2003 would have been lower.
B Class T shares bear a 0.25% 12b 1 fee. The initial offering of Class T shares took place on July 23,
2003. Returns prior to July 23, 2003 are those of Short Intermediate Municipal Income Fund, the origi
nal retail class of the fund, which has no 12b 1 fee. Had Class T shares’ 12b 1 fee been reflected, returns
prior to July 23, 2003 would have been lower.
C Class B shares bear a 0.90% 12b 1 fee. The initial offering of Class B shares took place on July 23,
2003. Returns prior to July 23, 2003 are those of Short Intermediate Municipal Income Fund, the origi
nal retail class of the fund, which has no 12b 1 fee. Had Class B shares’ 12b 1 fee been reflected, returns
prior to July 23, 2003 would have been lower. Class B shares’ contingent deferred sales charges included
in the past one year, past five year and past 10 year total return figures are 3%, 0% and 0%, respectively.
D Class C shares bear a 1.00% 12b 1 fee. The initial offering of Class C shares took place on July 23,
2003. Returns prior to July 23, 2003 are those of Short Intermediate Municipal Income Fund, the origi
nal retail class of the fund, which has no 12b 1 fee. Had Class C shares’ 12b 1 fee been reflected, returns
prior to July 23, 2003 would have been lower. Class C shares’ contingent deferred sales charge included
in the past one year, past five year and past 10 year total return figures are 1%, 0% and 0%, respectively.
|
Let’s say hypothetically that $10,000 was invested in Fidelity Advisor Short Intermediate Municipal Income Class T on December 31, 1995, and the current 2.75% sales charge was paid. The chart shows how the value of your investment would have changed, and also shows how the Lehman Brothers® Municipal Bond Index performed over the same period.
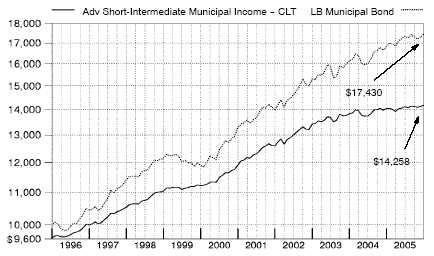
See Annual Report notes which are an integral part6of the financial statements.
Management’s Discussion of Fund Performance
Comments from Mark Sommer, Portfolio Manager of Fidelity Advisor Short Intermediate Municipal Income Fund
For the third consecutive year, the municipal bond market outperformed taxable bonds. The Lehman Brothers® Municipal Bond Index rose 3.51% for the year ending December 31, 2005. The taxable bond market, as measured by the Lehman Brothers Aggregate Bond Index, advanced 2.43% . Muni bonds were attractively valued relative to Treasuries, particu larly as tax free bond yields drew closer to those of high quality government bonds. Conse quently, the tax advantage of munis was compelling to such atypical investors in the asset class as hedge funds, corporations and taxable bond investors. The strong demand helped offset heavy issuance, particularly at the longer term end of the spectrum. The Federal Reserve Board raised short term interest rates eight times during the year, but long term rates remained persistently low, making the cost of borrowing more affordable for muni issuers. Still, absolute returns finished well below their historical averages. In addition to the rate hikes, surging energy prices pushed inflation higher, a condition further exacer bated by the damage to energy production facilities caused by Hurricane Katrina.
During the past year, the fund’s Class A, Class T, Class B and Class C shares returned 0.89%, 0.88%, 0.13% and 0.02%, respectively (excluding sales charges). By comparison, the LipperSM Short Intermediate Municipal Debt Funds Average gained 1.06% and the Lehman Brothers
1 6 Year Municipal Bond Index returned 1.02% . The biggest contributor to the fund’s performance relative to the Lehman Brothers index was my focus throughout much of the period on bonds with maturities in the six to eight year range, which outperformed securities in the two to five year segment that dominates the Lehman Brothers index. Security selection also was a plus, with Fidelity’s municipal bond research team helping me to avoid deteriorating credits. In addition, performance was helped by an overweighting relative to the index in lower quality investment grade munis, because they dramatically outpaced higher quality securities amid strong investor demand. That said, I believe the fund had less exposure to lower quality securities than many of its competitors, which may have cost it some ground. Similarly, performance likely was hurt by my shying away from below investment grade munis and tobacco bonds, both of which were among the market’s best performing segments and where I suspect my competitors had more exposure. Through out the period, I kept the fund’s overall interest rate sensitivity in line with the Lehman Brothers index. This strategy had no material impact on the fund’s performance relative to the index.
The views expressed in this statement reflect those of the portfolio manager only through the end of the period of the report as stated on the cover and do not necessarily represent the views of Fidelity or any other person in the Fidelity organization. Any such views are subject to change at any time based upon market or other conditions and Fidelity disclaims any responsibility to update such views. These views may not be relied on as investment advice and, because investment decisions for a Fidelity fund are based on numerous factors, may not be relied on as an indication of trading intent on behalf of any Fidelity fund.
Shareholder Expense Example
As a shareholder of the Fund, you incur two types of costs: (1) transaction costs, including sales charges (loads) on purchase payments or redemption proceeds, redemption fees, and (2) ongoing costs, including management fees, distribution and/or service (12b 1) fees and other Fund expenses. This Example is intended to help you understand your ongoing costs (in dollars) of investing in the Fund and to compare these costs with the ongoing costs of investing in other mutual funds.
The Example is based on an investment of $1,000 invested at the beginning of the period and held for the entire period (July 1, 2005 to December 31, 2005).
The first line of the table below for each class of the Fund provides information about actual account values and actual expenses. You may use the information in this line, together with the amount you invested, to estimate the expenses that you paid over the period. Simply divide your account value by $1,000.00 (for example, an $8,600 account value divided by $1,000.00 = 8.6), then multiply the result by the number in the first line for a class of the Fund under the heading entitled “Expenses Paid During Period” to estimate the expenses you paid on your account during this period.
Hypothetical Example for Comparison Purposes
The second line of the table below for each class of the Fund provides information about hypothetical account values and hypothetical expenses based on a Class’ actual expense ratio and an assumed rate of return of 5% per year before expenses, which is not the Class’ actual return. The hypothetical account values and expenses may not be used to estimate the actual ending account balance or expenses you paid for the period. You may use this information to compare the ongoing costs of investing in the Fund and other funds. To do so, compare this 5% hypothetical example with the 5% hypothetical examples that appear in the shareholder reports of the other funds.
Please note that the expenses shown in the table are meant to highlight your ongoing costs only and do not reflect any transaction costs. Therefore, the second line of the table is useful in comparing ongoing costs only, and will not help you determine the relative total costs of owning different funds. In addition, if these transactional costs were included, your costs would have been higher.
| | | | | | | | | | | | | Expenses Paid |
| | | | | | | | | | | | | During Period* |
| | | | | Beginning | | Ending | | | | July 1, 2005 |
| | | | | Account Value | | Account Value | | | | to December 31, |
| | | | | July 1, 2005 | | December 31, 2005 | | | | 2005 |
| Class A | | | | | | | | | | | | |
| Actual | | | $ | 1,000.00 | | $ | | 1,003.60 | | | $ | 3.23 |
| HypotheticalA | | | $ | 1,000.00 | | $ | | 1,021.98 | | | $ | 3.26 |
| Class T | | | | | | | | | | | | |
| Actual | | | $ | 1,000.00 | | $ | | 1,003.10 | | | $ | 3.74 |
| HypotheticalA | | | $ | 1,000.00 | | $ | | 1,021.48 | | | $ | 3.77 |
| Class B | | | | | | | | | | | | |
| Actual | | | $ | 1,000.00 | | $ | | 999.80 | | | $ | 7.01 |
| HypotheticalA | | | $ | 1,000.00 | | $ | | 1,018.20 | | | $ | 7.07 |
| Class C | | | | | | | | | | | | |
| Actual | | | $ | 1,000.00 | | $ | | 999.20 | | | $ | 7.61 |
| HypotheticalA | | | $ | 1,000.00 | | $ | | 1,017.59 | | | $ | 7.68 |
| Short Intermediate Municipal | | | | | | | | | | | | |
| Income | | | | | | | | | | | | |
| Actual | | | $ | 1,000.00 | | $ | | 1,004.40 | | | $ | 2.43 |
| HypotheticalA | | | $ | 1,000.00 | | $ | | 1,022.79 | | | $ | 2.45 |
| Institutional Class | | | | | | | | | | | | |
| Actual | | | $ | 1,000.00 | | $ | | 1,004.40 | | | $ | 2.48 |
| HypotheticalA | | | $ | 1,000.00 | | $ | | 1,022.74 | | | $ | 2.50 |
A 5% return per year before expenses | | | | | | | | |
* Expenses are equal to each Class’ annualized expense ratio (shown in the table below); multiplied by the average account value over the period, multiplied by 184/365 (to reflect the one half year period).
| | | Annualized |
| | | Expense Ratio |
| Class A | | 64% |
| Class T | | 74% |
| Class B | | 1.39% |
| Class C | | 1.51% |
| Short Intermediate Municipal Income | | 48% |
| Institutional Class | | 49% |
9 Annual Report
| Investment Changes | | | | |
| |
| Top Five States as of December 31, 2005 | | | | |
| | | % of fund’s | | % of fund’s net assets |
| | | net assets | | 6 months ago |
| Texas | | 14.7 | | 14.4 |
| New York | | 11.8 | | 8.5 |
| Illinois | | 9.4 | | 9.3 |
| California | | 7.6 | | 8.1 |
| New Jersey | | 6.9 | | 4.5 |
Top Five Sectors as of December 31, 2005 | | |
| | | % of fund’s | | % of fund’s net assets |
| | | net assets | | 6 months ago |
| General Obligations | | 49.1 | | 45.1 |
| Electric Utilities | | 13.8 | | 14.0 |
| Escrowed/Pre Refunded | | 8.2 | | 8.1 |
| Transportation | | 6.7 | | 6.6 |
| Health Care | | 6.5 | | 5.9 |
Average Years to Maturity as of December 31, 2005 | | |
| | | | | 6 months ago |
| Years | | 3.5 | | 3.4 |
Average years to maturity is based on the average time remaining to the stated maturity date of each bond, weighted by the market value of each bond.
| Duration as of December 31, 2005 | | | | |
| | | | | | | 6 months ago |
| Years | | | | 3.0 | | 2.9 |
Duration shows how much a bond fund’s price fluctuates with changes in comparable interest rates. If rates rise 1%, for example, a fund with a five year duration is likely to lose about 5% of its value. Other factors also can influence a bond fund’s performance and share price. Accordingly, a bond fund’s actual performance may differ from this example.
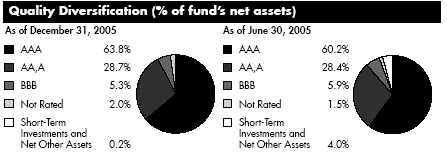
We have used ratings from Moody’s® Investors Services, Inc. Where Moody’s ratings are not available, we have used S&P® ratings.
Annual Report 10
Investments December 31, 2005
| Showing Percentage of Net Assets | | | | | | | | |
Municipal Bonds 99.8% | | | | | | | | |
| | | Principal | | Value (Note 1) |
| | | Amount (000s) | | (000s) |
| Alabama – 2.3% | | | | | | | | |
| Birmingham Baptist Med. Ctrs. Spl. Care Facilities Fing. | | | | | | | | |
| Auth. Rev. (Baptist Health Sys., Inc. Proj.) Series A, 5% | | | | | | | | |
| 11/15/09 | | $ | | 1,100 | | $ | | 1,140 |
| Huntsville Solid Waste Disp. Auth. & Resource Recovery | | | | | | | �� | |
| Rev.: | | | | | | | | |
| 5.25% 10/1/07 (MBIA Insured) (c) | | | | 1,750 | | | | 1,783 |
| 5.25% 10/1/08 (MBIA Insured) (c) | | | | 2,900 | | | | 2,998 |
| 5.75% 10/1/09 (MBIA Insured) (c) | | | | 4,000 | | | | 4,243 |
| Jefferson County Ltd. Oblig. School Warrants Series A, | | | | | | | | |
| 5% 1/1/07 | | | | 2,210 | | | | 2,244 |
| Jefferson County Swr. Rev.: | | | | | | | | |
| Series 1999 A, 5.75% 2/1/38 (Pre-Refunded to | | | | | | | | |
| 2/1/09 @ 101) (d) | | | | 5,000 | | | | 5,397 |
| Series A: | | | | | | | | |
| 5% 2/1/33 (Pre-Refunded to 2/1/09 @ 101) (d) | | | | 13,460 | | | | 14,176 |
| 5.5% 2/1/40 (Pre-Refunded to 2/1/11 @ 101) (d) | | | | 3,900 | | | | 4,294 |
| 5% 2/1/41 (Pre-Refunded to 8/1/12 @ 100) (d) | | | | 2,060 | | | | 2,215 |
| Mobile County Gen. Oblig. 5% 2/1/08 (MBIA Insured) . | | | | 1,475 | | | | 1,524 |
| | | | | | | | | 40,014 |
| |
| Alaska – 1.6% | | | | | | | | |
| Alaska Student Ln. Corp. Student Ln. Rev. Series A, | | | | | | | | |
| 5.85% 7/1/13 (AMBAC Insured) (c) | | | | 3,285 | | | | 3,544 |
| Anchorage Gen. Oblig. Series B, 5.75% 12/1/11 | | | | | | | | |
| (Pre-Refunded to 12/1/10 @ 100) (d) | | | | 2,500 | | | | 2,755 |
| North Slope Borough Gen. Oblig.: | | | | | | | | |
| Series 1996 B, 0% 6/30/07 (MBIA Insured) | | | | 3,100 | | | | 2,945 |
| Series A, 0% 6/30/07 (MBIA Insured) | | | | 5,000 | | | | 4,751 |
| Series B: | | | | | | | | |
| 0% 6/30/06 (MBIA Insured) | | | | 3,500 | | | | 3,444 |
| 0% 6/30/07 (MBIA Insured) | | | | 7,050 | | | | 6,699 |
| 0% 6/30/08 (MBIA Insured) | | | | 4,240 | | | | 3,891 |
| | | | | | | | | 28,029 |
| |
| Arizona – 1.5% | | | | | | | | |
| Arizona Ctfs. of Prtn. Series B, 5.5% 9/1/10 | | | | | | | | |
| (FSA Insured) | | | | 8,325 | | | | 9,016 |
| Arizona School Facilities Board Ctfs. of Prtn. Series C, | | | | | | | | |
| 5% 9/1/09 (FSA Insured) | | | | 1,115 | | | | 1,175 |
| Maricopa County Unified School District #48 Scottsdale | | | | | | | | |
| 7.4% 7/1/10 | | | | 3,750 | | | | 4,346 |
| Pima County Unified School District #1 Tucson 7.5% | | | | | | | | |
| 7/1/08 (FGIC Insured) | | | | 7,060 | | | | 7,749 |
See accompanying notes which are an integral part of the financial statements.
11 Annual Report
| Investments continued | | | | | | | | |
| |
| |
| Municipal Bonds continued | | | | | | | | |
| | | Principal | | Value (Note 1) |
| | | Amount (000s) | | (000s) |
| Arizona – continued | | | | | | | | |
| Tucson Wtr. Rev. Series A, 5% 7/1/11 (FGIC Insured) | | $ | | 1,500 | | $ | | 1,601 |
| Univ. of Arizona Ctfs. of Prtn. (Univ. of Arizona Parking | | | | | | | | |
| & Student Hsg. Proj.) Series A, 5% 6/1/09 (AMBAC | | | | | | | | |
| Insured) | | | | 2,000 | | | | 2,097 |
| | | | | | | | | 25,984 |
| |
| Arkansas – 0.3% | | | | | | | | |
| Arkansas Dev. Fin. Auth. Exempt Facilities Rev. (Waste | | | | | | | �� | |
| Mgmt. Proj.) 3.65%, tender 8/1/06 (b)(c) | | | | 1,000 | | | | 999 |
| Little Rock Gen. Oblig. 4% 4/1/07 (FSA Insured) | | | | 1,000 | | | | 1,009 |
| Rogers Sales & Use Tax Rev. Series A, 4.25% 9/1/07 | | | | | | | | |
| (FGIC Insured) | | | | 2,175 | | | | 2,208 |
| | | | | | | | | 4,216 |
| |
| California – 7.6% | | | | | | | | |
| California Dept. of Wtr. Resources Pwr. Supply Rev. | | | | | | | | |
| Series A: | | | | | | | | |
| 5.25% 5/1/07 (MBIA Insured) | | | | 27,455 | | | | 28,162 |
| 5.25% 5/1/12 (MBIA Insured) | | | | 6,000 | | | | 6,548 |
| California Econ. Recovery Series A, 5.25% 7/1/13 | | | | | | | | |
| (MBIA Insured) | | | | 2,900 | | | | 3,206 |
| California Gen. Oblig.: | | | | | | | | |
| 5% 2/1/09 | | | | 1,640 | | | | 1,713 |
| 5% 2/1/10 | | | | 2,000 | | | | 2,110 |
| 5.125% 9/1/12 | | | | 1,000 | | | | 1,061 |
| 5.25% 2/1/11 | | | | 5,775 | | | | 6,202 |
| 5.5% 3/1/11 (FGIC Insured) | | | | 3,210 | | | | 3,513 |
| 5.5% 3/1/11 (XL Cap. Assurance, Inc. Insured) | | | | 3,525 | | | | 3,850 |
| 5.75% 10/1/08 | | | | 1,085 | | | | 1,150 |
| 6.4% 9/1/08 | | | | 3,075 | | | | 3,301 |
| 6.5% 9/1/10 | | | | 1,740 | | | | 1,947 |
| 8% 11/1/07 (FGIC Insured) | | | | 4,670 | | | | 4,941 |
| California Health Facilities Fing. Auth. Rev. (Cedars-Sinai | | | | | | | | |
| Med. Ctr. Proj.) 5% 11/15/10 | | | | 1,000 | | | | 1,060 |
| California Poll. Cont. Fing. Auth. Ctfs. of Prtn. (Pacific | | | | | | | | |
| Gas & Elec. Co. Proj.) Series 2004 B, 3.5%, tender | | | | | | | | |
| 6/1/07 (FGIC Insured) (b)(c) | | | | 15,000 | | | | 15,010 |
| California Poll. Cont. Fing. Auth. Solid Waste Disp. Rev. | | | | | | | | |
| (Waste Mgmt., Inc. Proj.) Series A, 3.125%, tender | | | | | | | | |
| 5/1/06 (b)(c) | | | | 5,000 | | | | 4,988 |
| California Pub. Works Board Lease Rev.: | | | | | | | | |
| (California State Univ. Proj.) Series 1997 A, 5.5% | | | | | | | | |
| 10/1/07 | | | | 1,075 | | | | 1,110 |
See accompanying notes which are an integral part of the financial statements.
| Municipal Bonds continued | | | | | | | | |
| | | Principal | | Value (Note 1) |
| | | Amount (000s) | | (000s) |
| California – continued | | | | | | | | |
| California Pub. Works Board Lease Rev.: – continued | | | | | | | | |
| (Coalinga State Hosp. Proj.) Series 2004 A: | | | | | | | | |
| 5% 6/1/07 | | $ | | 4,000 | | $ | | 4,086 |
| 5% 6/1/08 | | | | 6,000 | | | | 6,210 |
| California Statewide Cmntys. Dev. Auth. Rev.: | | | | | | | | |
| (Kaiser Fund Hosp./Health Place, Inc. Proj.) | | | | | | | | |
| Series 2002 C, 3.85%, tender 6/1/12 (b) | | | | 1,400 | | | | 1,389 |
| (Kaiser Permanente Health Sys. Proj.): | | | | | | | | |
| Series 2001 A, 2.55%, tender 1/4/07 (b) | | | | 1,400 | | | | 1,388 |
| Series 2004 G, 2.3%, tender 5/1/07 (b) | | | | 8,000 | | | | 7,889 |
| Commerce Refuse To Energy Auth. Rev.: | | | | | | | | |
| 5% 7/1/07 (MBIA Insured) | | | | 1,770 | | | | 1,812 |
| 5.25% 7/1/08 (MBIA Insured) | | | | 855 | | | | 893 |
| North City West School Facilities Fing. Auth. Spl. Tax | | | | | | | | |
| Subseries C: | | | | | | | | |
| 5% 9/1/07 (AMBAC Insured) (a) | | | | 1,975 | | | | 2,012 |
| 5% 9/1/08 (AMBAC Insured) (a) | | | | 2,080 | | | | 2,143 |
| San Joaquin Hills Trans. Corridor Agcy. Toll Road Rev. | | | | | | | | |
| Series A, 0% 1/15/12 (MBIA Insured) | | | | 3,600 | | | | 2,852 |
| Univ. of California Revs. (UCLA Med. Ctr. Proj.) 4.55% | | | | | | | | |
| 12/1/09 (e) | | | | 8,955 | | | | 9,063 |
| | | | | | | | | 129,609 |
| |
| Colorado – 0.3% | | | | | | | | |
| E-470 Pub. Hwy. Auth. Rev. Series 2000 B: | | | | | | | | |
| 0% 9/1/06 (Escrowed to Maturity) (d) | | | | 2,200 | | | | 2,150 |
| 0% 9/1/07 (Escrowed to Maturity) (d) | | | | 3,200 | | | | 3,016 |
| | | | | | | | | 5,166 |
| |
| Connecticut – 0.6% | | | | | | | | |
| Connecticut Gen. Oblig.: | | | | | | | | |
| Series 2001 D, 5.125% 11/15/18 (Pre-Refunded to | | | | | | | | |
| 11/15/11 @ 100) (d) | | | | 5,000 | | | | 5,386 |
| Series 2002 C, 5% 12/15/08 | | | | 1,930 | | | | 2,020 |
| Connecticut Health & Edl. Facilities Auth. Rev. | | | | | | | | |
| (Connecticut Children’s Med. Ctr. Proj.) Series B: | | | | | | | | |
| 4% 7/1/07 (MBIA Insured) | | | | 1,275 | | | | 1,287 |
| 4.5% 7/1/08 (MBIA Insured) | | | | 1,045 | | | | 1,073 |
| 5% 7/1/09 (MBIA Insured) | | | | 1,000 | | | | 1,051 |
| | | | | | | | | 10,817 |
See accompanying notes which are an integral part of the financial statements.
13 Annual Report
| Investments continued | | | | | | | | |
| |
| |
| Municipal Bonds continued | | | | | | | | |
| | | Principal | | Value (Note 1) |
| | | Amount (000s) | | (000s) |
| District Of Columbia – 1.9% | | | | | | | | |
| District of Columbia Ctfs. of Prtn.: | | | | | | | | |
| (District’s Pub. Safety and Emergency Preparedness | | | | | | | | |
| Communications Ctr. and Related Technology Proj.) | | | | | | | | |
| Series 2003, 3% 1/1/06 (AMBAC Insured) | | $ | | 1,305 | | $ | | 1,305 |
| 5% 1/1/06 (AMBAC Insured) | | | | 1,000 | | | | 1,000 |
| 5% 1/1/07 (AMBAC Insured) | | | | 1,000 | | | | 1,016 |
| 5.25% 1/1/08 (AMBAC Insured) | | | | 935 | | | | 968 |
| District of Columbia Gen. Oblig.: | | | | | | | | |
| Series 1993 B2, 5.5% 6/1/07 (FSA Insured) | | | | 1,830 | | | | 1,885 |
| Series 2001 B, 5.5% 6/1/07 (FSA Insured) | | | | 1,345 | | | | 1,385 |
| Series A: | | | | | | | | |
| 5% 6/1/07 | | | | 2,810 | | | | 2,868 |
| 5.25% 6/1/09 (FSA Insured) | | | | 1,000 | | | | 1,057 |
| Series B, 0% 6/1/12 (MBIA Insured) | | | | 3,600 | | | | 2,772 |
| District of Columbia Rev. (Medstar Univ. Hosp. Proj.) | | | | | | | | |
| Series D, 6.875%, tender 2/16/07 (b)(d) | | | | 9,000 | | | | 9,354 |
| Metropolitan Washington Arpts. Auth. Gen. Arpt. Rev. | | | | | | | | |
| Series B, 5.5% 10/1/08 (FGIC Insured) (c) | | | | 6,460 | | | | 6,748 |
| Metropolitan Washington Arpts. Auth. Sys. Rev. Series D: | | | | | | | | |
| 4% 10/1/06 (FSA Insured) (c) | | | | 1,750 | | | | 1,756 |
| 4% 10/1/07 (FSA Insured) (c) | | | | 1,000 | | | | 1,007 |
| | | | | | | | | 33,121 |
| |
| Florida – 3.9% | | | | | | | | |
| Brevard County Util. Rev. 5% 3/1/06 (FGIC Insured) | | | | 530 | | | | 531 |
| Coral Gables Health Facilities Hosp. (Baptist Health | | | | | | | | |
| South Florida Obligated Group Proj.) 5% 8/15/06 | | | | 1,000 | | | | 1,010 |
| Florida Gen. Oblig. (Dept. of Trans. Right of Way Proj.) | | | | | | | | |
| Series B, 6.375% 7/1/08 | | | | 3,000 | | | | 3,214 |
| Highlands County Health Facilities Auth. Rev. (Adventist | | | | | | | | |
| Health Sys./Sunbelt Obligated Group Proj.): | | | | | | | | |
| Series A, 5% 11/15/10 | | | | 1,000 | | | | 1,052 |
| Series B, 5% 11/15/08 | | | | 800 | | | | 829 |
| 3.95%, tender 9/1/12 (b) | | | | 7,550 | | | | 7,515 |
| 5%, tender 11/16/09 (b) | | | | 4,700 | | | | 4,901 |
| Hillsborough County Indl. Dev. Auth. Poll. Cont. Rev. | | | | | | | | |
| (Tampa Elec. Co. Proj.): | | | | | | | | |
| 4%, tender 8/1/07 (b) | | | | 11,000 | | | | 11,001 |
| 4.25%, tender 8/1/07 (b)(c) | | | | 6,000 | | | | 6,001 |
| Lee Memorial Health Sys. Board of Directors Hosp. Rev. | | | | | | | | |
| Series A, 5.75% 4/1/12 (FSA Insured) | | | | 1,980 | | | | 2,201 |
See accompanying notes which are an integral part of the financial statements.
| Municipal Bonds continued | | | | | | | | |
| | | Principal | | Value (Note 1) |
| | | Amount (000s) | | (000s) |
| Florida – continued | | | | | | | | |
| Miami-Dade County Cap. Asset Acquisition | | | | | | | | |
| Fixed Rate Spl. Oblig. Series 2002 A, 5% 4/1/08 | | | | | | | | |
| (AMBAC Insured) | | $ | | 2,825 | | $ | | 2,928 |
| Miami-Dade County School Board Ctfs. of Prtn. 5%, | | | | | | | | |
| tender 5/1/11 (MBIA Insured) (b) | | | | 1,500 | | | | 1,598 |
| Orlando Utils. Commission Util. Sys. Rev. 5.25% 7/1/09 | | | | 6,000 | | | | 6,368 |
| Pasco County Solid Waste Disp. & Resource Recovery | | | | | | | | |
| Sys. Rev. 5.75% 4/1/06 (AMBAC Insured) (c) | | | | 1,500 | | | | 1,508 |
| Polk County Cap. Impt. Rev. Series 2004, 5.5%, tender | | | | | | | | |
| 12/1/10 (FSA Insured) (b) | | | | 9,000 | | | | 9,695 |
| Seminole County School Board Ctfs. of Prtn. | | | | | | | | |
| Series A, 4.5% 7/1/08 (MBIA Insured) | | | | 1,250 | | | | 1,285 |
| Univ. Athletic Assoc., Inc. Athletic Prog. Rev. | | | | | | | | |
| Series 2001: | | | | | | | | |
| 2.8%, tender 10/1/08, LOC SunTrust Banks of | | | | | | | | |
| Florida, Inc. (b) | | | | 2,000 | | | | 1,961 |
| 3%, tender 10/1/09, LOC SunTrust Banks, Inc. (b) | | | | 1,000 | | | | 978 |
| Volusia County School Board Ctfs. of Prtn. (School Board | | | | | | | | |
| of Volusia County Master Lease Prog.) 5% 8/1/08 | | | | | | | | |
| (FSA Insured) | | | | 1,625 | | | | 1,688 |
| | | | | | | | | 66,264 |
| |
| Georgia – 0.7% | | | | | | | | |
| Cobb County Dev. Auth. Solid Waste Disp. Rev. | | | | | | | | |
| (Georgia Waste Mgmt. Proj.) Series A, 3.65%, tender | | | | | | | | |
| 4/1/06 (b)(c) | | | | 1,000 | | | | 1,000 |
| Columbia County Gen. Oblig. 5% 1/1/09 | | | | | | | | |
| (FSA Insured) | | | | 1,505 | | | | 1,577 |
| Fulton DeKalb Hosp. Auth. Hosp. Rev. 5% 1/1/08 | | | | | | | | |
| (FSA Insured) | | | | 2,250 | | | | 2,318 |
| Georgia Muni. Elec. Auth. Pwr. Rev. Series 1992 B, | | | | | | | | |
| 8.25% 1/1/11 (MBIA Insured) | | | | 4,105 | | | | 4,953 |
| Gwinnett County Gen. Oblig. 4% 1/1/06 | | | | 1,035 | | | | 1,035 |
| Henry County Wtr. & Swr. Auth. Rev. 5% 2/1/08 | | | | | | | | |
| (MBIA Insured) | | | | 1,095 | | | | 1,133 |
| | | | | | | | | 12,016 |
| |
| Hawaii – 2.3% | | | | | | | | |
| Hawaii Arpts. Sys. Rev. Series 2000 B, 8% 7/1/10 | | | | | | | | |
| (FGIC Insured) (c) | | | | 3,850 | | | | 4,482 |
| Hawaii Gen. Oblig. Series CU: | | | | | | | | |
| 5.75% 10/1/11 (MBIA Insured) | | | | 3,040 | | | | 3,338 |
See accompanying notes which are an integral part of the financial statements.
15 Annual Report
| Investments continued | | | | | | | | |
| |
| |
| Municipal Bonds continued | | | | | | | | |
| | | Principal | | Value (Note 1) |
| | | Amount (000s) | | (000s) |
| Hawaii – continued | | | | | | | | |
| Hawaii Gen. Oblig. Series CU: – continued | | | | | | | | |
| 5.75% 10/1/11 (Pre-Refunded to 10/1/10 @ | | | | | | | | |
| 100) (d) | | $ | | 170 | | $ | | 187 |
| Honolulu City & County Gen. Oblig. Series B, 8% | | | | | | | | |
| 10/1/09 | | | | 26,940 | | | | 31,183 |
| | | | | | | | | 39,190 |
| |
| Illinois – 9.4% | | | | | | | | |
| Chicago Gen. Oblig.: | | | | | | | | |
| (Neighborhoods Alive 21 Prog.): | | | | | | | | |
| 5% 1/1/07 (MBIA Insured) | | | | 1,360 | | | | 1,382 |
| 5% 1/1/08 (MBIA Insured) | | | | 1,190 | | | | 1,227 |
| Series A, 5.25% 1/1/12 (FSA Insured) | | | | 1,000 | | | | 1,085 |
| Chicago Midway Arpt. Rev.: | | | | | | | | |
| Series 2001 B, 5% 1/1/07 (FSA Insured) | | | | 1,000 | | | | 1,015 |
| Series B: | | | | | | | | |
| 5% 1/1/10 (AMBAC Insured) | | | | 1,225 | | | | 1,292 |
| 5% 1/1/11 (AMBAC Insured) | | | | 3,625 | | | | 3,845 |
| Chicago O’Hare Int’l. Arpt. Rev.: | | | | | | | | |
| Series 2001 C, 5% 1/1/07 (AMBAC Insured) (c) | | | | 2,670 | | | | 2,708 |
| Series A: | | | | | | | | |
| 5% 1/1/12 (MBIA Insured) | | | | 1,135 | | | | 1,211 |
| 5.5% 1/1/08 (AMBAC Insured) | | | | 5,000 | | | | 5,109 |
| 5.5% 1/1/10 (AMBAC Insured) (c) | | | | 5,000 | | | | 5,318 |
| Chicago Park District: | | | | | | | | |
| Series B, 5% 1/1/11 (AMBAC Insured) | | | | 5,750 | | | | 6,123 |
| Series C, 5% 1/1/11 (AMBAC Insured) | | | | 2,515 | | | | 2,678 |
| Chicago School Fin. Auth. Series B, 5% 6/1/09 | | | | | | | | |
| (FSA Insured) | | | | 12,825 | | | | 13,458 |
| Chicago Tax Increment Rev. Series 2000 A, 0% | | | | | | | | |
| 12/1/08 (AMBAC Insured) | | | | 10,000 | | | | 9,041 |
| Chicago Transit Auth. Cap. Grant Receipts Rev.: | | | | | | | | |
| (Fed. Transit Administration Section 5307 Formula | | | | | | | | |
| Funds Proj.) Series A, 5.25% 6/1/10 (AMBAC | | | | | | | | |
| Insured) | | | | 4,785 | | | | 5,120 |
| Series A, 4.25% 6/1/08 (AMBAC Insured) | | | | 3,600 | | | | 3,614 |
| Chicago Wastewtr. Transmission Rev. 5.5% 1/1/09 | | | | | | | | |
| (FGIC Insured) | | | | 2,975 | | | | 3,151 |
| Cook County Cmnty. College District #508 Ctfs. of Prtn. | | | | | | | | |
| 8.75% 1/1/07 (FGIC Insured) | | | | 8,000 | | | | 8,419 |
| Du Page Wtr. Commission Wtr. Rev. 5% 5/1/08 | | | | | | | | |
| (AMBAC Insured) | | | | 4,525 | | | | 4,687 |
See accompanying notes which are an integral part of the financial statements.
| Municipal Bonds continued | | | | | | | | |
| | | Principal | | Value (Note 1) |
| | | Amount (000s) | | (000s) |
| Illinois – continued | | | | | | | | |
| Granite City Solid Waste Disp. Rev. (Waste Mgmt., Inc. | | | | | | | | |
| Proj.) 3.85%, tender 5/1/08 (b)(c) | | $ | | 2,200 | | $ | | 2,191 |
| Hodgkins Tax Increment Rev.: | | | | | | | | |
| 5% 1/1/07 | | | | 1,000 | | | | 1,013 |
| 5% 1/1/09 | | | | 1,805 | | | | 1,867 |
| Illinois Dev. Fin. Auth. Gas Supply Rev. (The Peoples Gas | | | | | | | | |
| Lt. & Coke Co. Proj.) Series 2003 B, 3.05%, tender | | | | | | | | |
| 2/1/08 (AMBAC Insured) (b) | | | | 6,100 | | | | 6,017 |
| Illinois Dev. Fin. Auth. Rev. (DePaul Univ. Proj.) Series | | | | | | | | |
| 2004 C, 5.5% 10/1/10 | | | | 1,900 | | | | 2,026 |
| Illinois Edl. Facilities Auth. Revs.: | | | | | | | | |
| (Art Institute of Chicago Proj.) Series 2003, 3.85%, | | | | | | | | |
| tender 3/1/11 (b) | | | | 12,800 | | | | 12,658 |
| (Univ. of Chicago Proj.): | | | | | | | | |
| Series 2004 B1, 3.45%, tender 7/1/08 (b) | | | | 6,100 | | | | 6,096 |
| Series A, 5.25% 7/1/41 (Pre-Refunded to 7/1/11 | | | | | | | | |
| @ 101) (d) | | | | 2,640 | | | | 2,881 |
| Series B: | | | | | | | | |
| 3.1%, tender 7/1/07 (b)(d) | | | | 5 | | | | 5 |
| 3.1%, tender 7/1/07 (b) | | | | 3,895 | | | | 3,858 |
| Illinois Fin. Auth. Rev. (DePaul Univ. Proj.): | | | | | | | | |
| 5% 10/1/06 | | | | 1,115 | | | | 1,125 |
| 5% 10/1/07 | | | | 1,225 | | | | 1,249 |
| 5% 10/1/08 | | | | 1,000 | | | | 1,035 |
| Illinois Gen. Oblig.: | | | | | | | | |
| First Series 2001, 5.25% 5/1/11 (FSA Insured) | | | | 1,475 | | | | 1,595 |
| First Series: | | | | | | | | |
| 5.25% 4/1/08 (MBIA Insured) | | | | 1,035 | | | | 1,078 |
| 5.5% 8/1/10 | | | | 1,415 | | | | 1,531 |
| 6% 1/1/11 (Pre-Refunded to 1/1/10 @ 100) (d) | | | | 7,075 | | | | 7,759 |
| Series A, 5% 10/1/09 | | | | 2,600 | | | | 2,739 |
| 5.75% 4/1/12 (Pre-Refunded to 4/1/10 @ 100) (d) . | | | | 1,000 | | | | 1,092 |
| Illinois Health Facilities Auth. Rev. (Condell Med. Ctr. | | | | | | | | |
| Proj.): | | | | | | | | |
| 5% 5/15/07 | | | | 500 | | | | 504 |
| 5% 5/15/08 | | | | 700 | | | | 715 |
| Kane & DeKalb Counties Cmnty. Unit School District | | | | | | | | |
| #301 0% 12/1/10 (AMBAC Insured) | | | | 2,000 | | | | 1,660 |
| Kane & DuPage Counties Cmnty. Unit School District | | | | | | | | |
| #303, Saint Charles Series A, 5.5% 1/1/12 | | | | | | | | |
| (FSA Insured) | | | | 2,270 | | | | 2,493 |
See accompanying notes which are an integral part of the financial statements.
17 Annual Report
| Investments continued | | | | | | | | |
| |
| |
| Municipal Bonds continued | | | | | | | | |
| | | Principal | | Value (Note 1) |
| | | Amount (000s) | | (000s) |
| Illinois – continued | | | | | | | | |
| Kane County School District #129, Aurora West Side | | | | | | | | |
| Series A, 5.75% 2/1/14 (Pre-Refunded to 2/1/12 @ | | | | | | | | |
| 100) (d) | | $ | | 1,600 | | $ | | 1,790 |
| Kane, McHenry, Cook & DeKalb Counties Cmnty. Unit | | | | | | | | |
| School District #300, Carpentersville 5.5% 12/1/13 | | | | | | | | |
| (Pre-Refunded to 12/1/11 @ 100) (d) | | | | 5,000 | | | | 5,515 |
| Lake County Cmnty. High School District #128, | | | | | | | | |
| Libertyville Series 2004, 5% 1/1/11 | | | | 2,365 | | | | 2,519 |
| Rosemont Gen. Oblig. Series 3: | | | | | | | | |
| 0% 12/1/07 (Escrowed to Maturity) (d) | | | | 2,375 | | | | 2,225 |
| 0% 12/1/07 (FGIC Insured) | | | | 625 | | | | 585 |
| Univ. of Illinois Auxiliary Facilities Sys. Rev. Series 2001 | | | | | | | | |
| A, 5% 4/1/08 (AMBAC Insured) | | | | 2,035 | | | | 2,105 |
| Univ. of Illinois Ctfs. of Prtn. (Util. Infrastructure Projs.) | | | | | | | | |
| 5% 8/15/11 (AMBAC Insured) | | | | 1,360 | | | | 1,451 |
| Will County School District #122 Series B: | | | | | | | | |
| 0% 11/1/08 (Escrowed to Maturity) (d) | | | | 220 | | | | 199 |
| 0% 11/1/08 (FSA Insured) | | | | 1,280 | | | | 1,159 |
| | | | | | | | | 161,218 |
| |
| Indiana – 3.7% | | | | | | | | |
| Carmel High School Bldg. Corp. 5% 1/10/11 | | | | | | | | |
| (FSA Insured) | | | | 1,000 | | | | 1,066 |
| Ctr. Grove 2000 Bldg. Corp.: | | | | | | | | |
| 5.5% 7/15/17 (Pre-Refunded to 7/15/11 @ 100) (d) | | | | 1,785 | | | | 1,961 |
| 5.5% 7/15/18 (Pre-Refunded to 7/15/11 @ 100) (d) | | | | 1,885 | | | | 2,071 |
| Hamilton Southeastern Consolidated School Bldg. Corp.: | | | | | | | | |
| Series A: | | | | | | | | |
| 5% 1/10/10 (FSA Insured) | | | | 1,750 | | | | 1,852 |
| 5.25% 7/10/11 (FSA Insured) | | | | 2,295 | | | | 2,483 |
| 5.25% 1/10/12 (FSA Insured) | | | | 1,355 | | | | 1,472 |
| 5% 1/15/10 (FSA Insured) | | | | 1,835 | | | | 1,942 |
| 5% 1/15/11 (FSA Insured) | | | | 1,910 | | | | 2,036 |
| 5% 1/15/12 (FSA Insured) | | | | 1,990 | | | | 2,135 |
| 5.5% 7/15/16 (Pre-Refunded to 7/15/11 @ 100) (d) | | | | 1,855 | | | | 2,038 |
| Indiana Health Facility Fing. Auth. Rev.: | | | | | | | | |
| (Ascension Health Cr. Group Prog.) Series 2002 F, | | | | | | | | |
| 5.5% 11/15/06 | | | | 1,000 | | | | 1,018 |
| (Ascension Health Cr. Group, Inc. Proj.) Series A, 5%, | | | | | | | | |
| tender 5/1/07 (b) | | | | 7,100 | | | | 7,241 |
| Indianapolis Local Pub. Impt. Bond Bank (Indianapolis | | | | | | | | |
| Arpt. Auth. Proj.) Series I: | | | | | | | | |
| 4% 1/1/06 (MBIA Insured) (c) | | | | 1,325 | | | | 1,325 |
See accompanying notes which are an integral part of the financial statements.
| Municipal Bonds continued | | | | | | | | |
| | | Principal | | Value (Note 1) |
| | | Amount (000s) | | (000s) |
| Indiana – continued | | | | | | | | |
| Indianapolis Local Pub. Impt. Bond Bank (Indianapolis | | | | | | | | |
| Arpt. Auth. Proj.) Series I: – continued | | | | | | | | |
| 5% 1/1/08 (MBIA Insured) (c) | | $ | | 1,550 | | $ | | 1,590 |
| Indianapolis Resource Recovery Rev. (Ogden Martin | | | | | | | | |
| Sys., Inc. Proj.) 6.75% 12/1/07 (AMBAC Insured) | | | | 3,000 | | | | 3,137 |
| Ivy Tech State College Series I, 5% 7/1/09 | | | | | | | | |
| (AMBAC Insured) | | | | 1,405 | | | | 1,478 |
| Logansport High School Bldg. Corp.: | | | | | | | | |
| 5.25% 1/15/11 (MBIA Insured) | | | | 1,000 | | | | 1,073 |
| 5.25% 7/15/11 (MBIA Insured) | | | | 1,020 | | | | 1,098 |
| 5.25% 1/15/12 (MBIA Insured) | | | | 1,045 | | | | 1,129 |
| 5.25% 7/15/12 (MBIA Insured) | | | | 1,075 | | | | 1,165 |
| Mount Vernon of Hancock County Multi-School Corp. | | | | | | | | |
| Series B: | | | | | | | | |
| 5.5% 7/15/16 (Pre-Refunded to 7/15/11 @ 100) (d) | | | | 1,605 | | | | 1,763 |
| 5.5% 7/15/17 (Pre-Refunded to 7/15/11 @ 100) (d) | | | | 1,695 | | | | 1,862 |
| Muncie School Bldg. Corp. 5.25% 7/10/12 | | | | | | | | |
| (MBIA Insured) | | | | 1,585 | | | | 1,727 |
| New Albany Floyd County Independent School Bldg. | | | | | | | | |
| Corp. 5% 1/15/11 (FSA Insured) | | | | 1,000 | | | | 1,066 |
| Rockport Poll. Cont. Rev. 4.9%, tender 6/1/07 (b) | | | | 4,000 | | | | 4,045 |
| Saint Joseph County Ind. Edl. Facilities Rev. (Univ. of | | | | | | | | |
| Notre Dame Du Lac Proj.) 2.5%, tender 12/3/07 (b) . | | | | 10,000 | | | | 9,791 |
| West Clark 2000 School Bldg. Corp.: | | | | | | | | |
| 5.25% 1/15/11 (MBIA Insured) | | | | 1,065 | | | | 1,145 |
| 5.25% 7/15/11 (MBIA Insured) | | | | 1,125 | | | | 1,214 |
| 5.25% 1/15/12 (MBIA Insured) | | | | 1,150 | | | | 1,246 |
| | | | | | | | | 63,169 |
| |
| Kansas 0.2% | | | | | | | | |
| Burlington Envir. Impt. Rev. (Kansas City Pwr. & Lt. Co. | | | | | | | | |
| Proj.) Series A, 4.75%, tender 10/1/07 (b) | | | | 2,400 | | | | 2,438 |
| Kansas Dev. Fin. Auth. Health Facilities Rev. (Hays Med. | | | | | | | | |
| Ctr. Proj.) Series 2005 L: | | | | | | | | |
| 5.25% 11/15/10 | | | | 545 | | | | 580 |
| 5.25% 11/15/12 | | | | 680 | | | | 728 |
| | | | | | | | | 3,746 |
| |
| Kentucky 0.7% | | | | | | | | |
| Kenton County Arpt. Board Arpt. Rev. Series B, 5% | | | | | | | | |
| 3/1/09 (MBIA Insured) (c) | | | | 1,185 | | | | 1,231 |
See accompanying notes which are an integral part of the financial statements.
19 Annual Report
| Investments continued | | | | | | | | |
| |
| |
| Municipal Bonds continued | | | | | | | | |
| | | Principal | | Value (Note 1) |
| | | Amount (000s) | | (000s) |
| Kentucky – continued | | | | | | | | |
| Owensboro Elec. Lt. & Pwr. Rev. Series B: | | | | | | | | |
| 0% 1/1/07 (AMBAC Insured) | | $ | | 10,000 | | $ | | 9,667 |
| 0% 1/1/09 (AMBAC Insured) | | | | 2,000 | | | | 1,795 |
| | | | | | | | | 12,693 |
| |
| Louisiana – 0.1% | | | | | | | | |
| East Baton Rouge Parish Pub. Impt. Sales Tax Rev. | | | | | | | | |
| Series B, 5% 2/1/12 (AMBAC Insured) | | | | 1,000 | | | | 1,068 |
| Maryland 0.1% | | | | | | | | |
| Prince Georges County Ctfs. of Prtn. (Equip. Acquisition | | | | | | | | |
| Prog.) 5.25% 5/15/10 (MBIA Insured) | | | | 1,535 | | | | 1,646 |
| Massachusetts 2.8% | | | | | | | | |
| Massachusetts Bay Trans. Auth. Series A, 7% 3/1/09 | | | | 6,880 | | | | 7,597 |
| Massachusetts Dev. Fin. Agcy. Rev. (Massachusetts | | | | | | | | |
| Biomedical Research Corp. Proj.) Series C: | | | | | | | | |
| 5.75% 8/1/06 | | | | 1,200 | | | | 1,214 |
| 5.875% 8/1/08 | | | | 1,630 | | | | 1,703 |
| Massachusetts Fed. Hwy.: | | | | | | | | |
| Series 2000 A, 5.75% 6/15/13 | | | | 3,000 | | | | 3,275 |
| Series B, 5.125% 12/15/14 (Pre-Refunded to | | | | | | | | |
| 12/15/08 @ 101) (d) | | | | 2,775 | | | | 2,924 |
| Massachusetts Gen. Oblig.: | | | | | | | | |
| Series 1999 C, 5.625% 9/1/12 (Pre-Refunded to | | | | | | | | |
| 9/1/09 @ 101) (d) | | | | 2,570 | | | | 2,778 |
| Series 2001 A, 5.5% 1/1/11 | | | | 5,000 | | | | 5,437 |
| Series 2003 A, 5.375% 8/1/08 | | | | 5,165 | | | | 5,414 |
| Series 2003 C, 5.5% 10/1/10 (MBIA Insured) | | | | 1,130 | | | | 1,228 |
| Series A, 4.5% 1/1/09 (Pre-Refunded to 1/1/08 @ | | | | | | | | |
| 101) (d) | | | | 2,055 | | | | 2,116 |
| Series C, 5.25% 11/1/30 (Pre-Refunded to 11/1/12 | | | | | | | | |
| @ 100) (d) | | | | 2,495 | | | | 2,704 |
| Massachusetts Health & Edl. Facilities Auth. Rev. | | | | | | | | |
| (Berkshire Health Sys., Inc. Proj.) Series F, 5% | | | | | | | | |
| 10/1/08 | | | | 2,720 | | | | 2,817 |
| Massachusetts Port Auth. Spl. Facilities Rev. | | | | | | | | |
| (Delta Air Lines, Inc. Proj.) Series A, 5.5% 1/1/12 | | | | | | | | |
| (AMBAC Insured) (c) | | | | 1,000 | | | | 1,064 |
| Springfield Gen. Oblig.: | | | | | | | | |
| 5% 1/15/06 (MBIA Insured) | | | | 1,000 | | | | 1,000 |
| 5.25% 8/1/12 (MBIA Insured) | | | | 6,000 | | | | 6,553 |
| | | | | | | | | 47,824 |
See accompanying notes which are an integral part of the financial statements.
| Municipal Bonds continued | | | | | | | | |
| | | Principal | | Value (Note 1) |
| | | Amount (000s) | | (000s) |
| Michigan – 3.3% | | | | | | | | |
| Chippewa Valley Schools 5% 5/1/08 | | $ | | 1,260 | | $ | | 1,306 |
| Detroit City School District Series A, 5.5% 5/1/11 | | | | | | | | |
| (FSA Insured) | | | | 1,200 | | | | 1,316 |
| Detroit Gen. Oblig.: | | | | | | | | |
| Series 2004 A, 5% 4/1/08 (FSA Insured) | | | | 7,275 | | | | 7,541 |
| Series A, 5% 4/1/07 (FSA Insured) | | | | 6,910 | | | | 7,053 |
| 5% 4/1/08 (MBIA Insured) | | | | 14,545 | | | | 15,077 |
| 5% 4/1/09 (MBIA Insured) | | | | 10,620 | | | | 11,170 |
| Detroit Swr. Disp. Rev. Series A, 5.75% 7/1/26 (Pre Re | | | | | | | | |
| funded to 1/1/10 @ 101) (d) | | | | 2,000 | | | | 2,180 |
| Greater Detroit Resource Recovery Auth. Rev. Series A, | | | | | | | | |
| 6.25% 12/13/07 (AMBAC Insured) | | | | 4,000 | | | | 4,216 |
| Hazel Park School District 5% 5/1/08 | | | | 1,275 | | | | 1,321 |
| Livonia Pub. School District Series II, 0% 5/1/21 | | | | | | | | |
| (FGIC Insured) (Pre-Refunded to 5/1/07 @ 39.31) | | | | 8,000 | | | | 3,000 |
| Troy School District 5% 5/1/11 (MBIA Insured) (a) | | | | 1,000 | | | | 1,054 |
| Wayne-Westland Cmnty. Schools 5% 5/1/10 | | | | | | | | |
| (FSA Insured) | | | | 1,225 | | | | 1,303 |
| | | | | | | | | 56,537 |
| |
| Minnesota 0.2% | | | | | | | | |
| Minneapolis & Saint Paul Hsg. & Redev. Auth. Health | | | | | | | | |
| Care Sys. Rev. (Health Partners Oblig. Group Proj.): | | | | | | | | |
| 5.25% 12/1/08 | | | | 1,200 | | | | 1,248 |
| 5.25% 12/1/10 | | | | 500 | | | | 530 |
| Saint Paul Port Auth. Lease Rev. (HealthEast Midway | | | | | | | | |
| Campus Proj.) Series 2003 A, 5% 5/1/10 | | | | 700 | | | | 696 |
| Waconia Independent School District #110 Series A, 5% | | | | | | | | |
| 2/1/11 (FSA Insured) | | | | 940 | | | | 1,006 |
| | | | | | | | | 3,480 |
| |
| Mississippi – 0.1% | | | | | | | | |
| Mississippi Higher Ed. Student Ln. Series 2000 B3, 5.3% | | | | | | | | |
| 9/1/08 (c) | | | | 1,190 | | | | 1,228 |
| Missouri – 0.3% | | | | | | | | |
| Kansas City School District Bldg. Corp. Rev.: | | | | | | | | |
| (School District Elementary School Proj.) Series B, 5% | | | | | | | | |
| 2/1/11 (FGIC Insured) | | | | 1,850 | | | | 1,979 |
| Series A, 5% 2/1/08 (FGIC Insured) | | | | 2,000 | | | | 2,068 |
| Saint Louis Muni. Fin. Corp. Leasehold Rev. | | | | | | | | |
| (Callahan Courthouse Proj.) Series A, 5.75% 2/15/14 | | | | | | | | |
| (FGIC Insured) | | | | 1,050 | | | | 1,171 |
| | | | | | | | | 5,218 |
See accompanying notes which are an integral part of the financial statements.
21 Annual Report
| Investments continued | | | | | | | | |
| |
| |
| Municipal Bonds continued | | | | | | | | |
| | | Principal | | Value (Note 1) |
| | | Amount (000s) | | (000s) |
| Montana 0.2% | | | | | | | | |
| Forsyth Poll. Cont. Rev. (Portland Gen. Elec. Co. Projs.) | | | | | | | | |
| Series A, 5.2%, tender 5/1/09 (b) | | $ | | 2,900 | | $ | | 3,010 |
| Nebraska – 1.9% | | | | | | | | |
| Lancaster County School District #1 (Lincoln Pub. Schools | | | | | | | | |
| Proj.) 4% 1/15/06 | | | | 1,000 | | | | 1,000 |
| Nebraska Pub. Pwr. District Rev. Series A: | | | | | | | | |
| 0% 1/1/06 (MBIA Insured) | | | | 24,465 | | | | 24,465 |
| 0% 1/1/07 (MBIA Insured) | | | | 4,000 | | | | 3,867 |
| Omaha Pub. Pwr. District Elec. Rev. Series B, 4.5% | | | | | | | | |
| 2/1/09 | | | | 3,500 | | | | 3,615 |
| | | | | | | | | 32,947 |
| |
| Nevada 2.0% | | | | | | | | |
| Clark County Arpt. Rev. Series C: | | | | | | | | |
| 5% 7/1/06 (AMBAC Insured) (c) | | | | 800 | | | | 806 |
| 5% 7/1/08 (AMBAC Insured) (c) | | | | 2,215 | | | | 2,283 |
| 5% 7/1/09 (AMBAC Insured) (c) | | | | 2,700 | | | | 2,803 |
| 5% 7/1/10 (AMBAC Insured) (c) | | | | 1,225 | | | | 1,279 |
| 5% 7/1/11 (AMBAC Insured) (c) | | | | 1,790 | | | | 1,877 |
| Clark County Hwy. Impt. Rev. (Motor Vehicle Fuel Tax) | | | | | | | | |
| 5% 7/1/11 (AMBAC Insured) | | | | 3,230 | | | | 3,455 |
| Clark County School District: | | | | | | | | |
| Series 2000 A, 5.75% 6/15/17 (Pre-Refunded to | | | | | | | | |
| 6/15/10 @ 100) (d) | | | | 1,600 | | | | 1,749 |
| Series C, 5% 6/15/10 (MBIA Insured) | | | | 1,075 | | | | 1,143 |
| Series D, 5% 6/15/09 (MBIA Insured) | | | | 13,890 | | | | 14,630 |
| Henderson Health Care Facility Rev. (Catholic Healthcare | | | | | | | | |
| West Proj.) Series 2005 B, 5% 7/1/08 | | | | 1,100 | | | | 1,137 |
| Lyon Co. School District Gen. Oblig.: | | | | | | | | |
| 5% 6/1/07 (a) | | | | 490 | | | | 498 |
| 5% 6/1/09 (a) | | | | 695 | | | | 723 |
| Washoe County School District Gen. Oblig. Series D, 5% | | | | | | | | |
| 6/1/10 (MBIA Insured) | | | | 2,410 | | | | 2,561 |
| | | | | | | | | 34,944 |
| |
| New Hampshire – 0.2% | | | | | | | | |
| New Hampshire Bus. Fin. Auth. Poll. Cont. Rev. | | | | | | | | |
| (United Illumination Co.) Series A, 3.65%, tender | | | | | | | | |
| 2/1/10 (AMBAC Insured) (b)(c) | | | | 2,500 | | | | 2,472 |
| New Hampshire Tpk. Sys. Rev. 5% 5/1/07 | | | | | | | | |
| (AMBAC Insured) (a) | | | | 1,500 | | | | 1,515 |
| | | | | | | | | 3,987 |
See accompanying notes which are an integral part of the financial statements.
| Municipal Bonds continued | | | | | | | | |
| | | Principal | | Value (Note 1) |
| | | Amount (000s) | | (000s) |
| New Jersey – 6.9% | | | | | | | | |
| Camden County Impt. Auth. Rev. (Cooper Health Sys. | | | | | | | | |
| Obligated Group Proj.) Series B, 5.25% 2/15/09 | | $ | | 1,250 | | $ | | 1,293 |
| Casino Reinvestment Dev. Auth. Hotel Room Fee Rev.: | | | | | | | | |
| 5% 1/1/08 (AMBAC Insured) | | | | 920 | | | | 947 |
| 5% 1/1/09 (AMBAC Insured) | | | | 1,000 | | | | 1,044 |
| Elizabeth Gen. Oblig. 5.25% 8/15/09 (MBIA Insured) . | | | | 1,225 | | | | 1,303 |
| Garden State Preservation Trust Open Space & | | | | | | | | |
| Farmland Preservation Series B: | | | | | | | | |
| 6.25% 11/1/09 (MBIA Insured) | | | | 4,000 | | | | 4,408 |
| 6.375% 11/1/11 (MBIA Insured) | | | | 7,470 | | | | 8,571 |
| New Jersey Econ. Dev. Auth. Rev. 5% 6/15/07 | | | | 7,500 | | | | 7,623 |
| New Jersey Gen. Oblig. Series 2005 N, 5% 7/15/08 | | | | | | | | |
| (FGIC Insured) | | | | 6,175 | | | | 6,423 |
| New Jersey Tpk. Auth. Tpk. Rev. Series 2004 A, 3.15%, | | | | | | | | |
| tender 1/1/10 (AMBAC Insured) (b) | | | | 9,150 | | | | 9,025 |
| New Jersey Trans. Trust Fund Auth.: | | | | | | | | |
| Series 2001 A, 5% 6/15/06 | | | | 355 | | | | 358 |
| Series A, 5.25% 12/15/08 (MBIA Insured) | | | | 13,500 | | | | 14,186 |
| Series B: | | | | | | | | |
| 5.25% 12/15/10 (FGIC Insured) | | | | 4,550 | | | | 4,896 |
| 5.25% 12/15/11 (FGIC Insured) | | | | 10,015 | | | | 10,864 |
| 5.25% 12/15/12 (FGIC Insured) | | | | 4,800 | | | | 5,243 |
| 6.5% 6/15/11 (MBIA Insured) | | | | 5,000 | | | | 5,685 |
| Series C, 5.5% 12/15/10 (FSA Insured) | | | | 25,000 | | | | 27,181 |
| New Jersey Transit Corp. Series 2000 B, 5.5% 2/1/08 | | | | | | | | |
| (AMBAC Insured) | | | | 1,000 | | | | 1,043 |
| New Jersey Transit Corp. Ctfs. of Prtn. Series A, 6% | | | | | | | | |
| 9/15/13 (Pre-Refunded to 9/15/09 @ 100) (d) | | | | 7,000 | | | | 7,614 |
| | | | | | | | | 117,707 |
| |
| New Jersey/Pennsylvania – 0.3% | | | | | | | | |
| Delaware River Joint Toll Bridge Commission Bridge Rev. | | | | | | | | |
| 5% 7/1/09 | | | | 5,170 | | | | 5,416 |
| New Mexico – 0.4% | | | | | | | | |
| Farmington Poll. Cont. Rev. (Pub. Svc. Co. of New | | | | | | | | |
| Mexico San Juan and Four Corners Projs.) | | | | | | | | |
| Series 2003 B, 2.1%, tender 4/1/06 (b) | | | | 7,000 | | | | 6,960 |
| New York – 11.8% | | | | | | | | |
| Grand Central District Mgmt. Assoc., Inc.: | | | | | | | | |
| 5% 1/1/10 | | | | 1,200 | | | | 1,264 |
| 5% 1/1/12 | | | | 1,175 | | | | 1,251 |
| Metropolitan Trans. Auth. Commuter Facilities Rev. Series A, | | | | | | | | |
| 5.375% 7/1/09 (Escrowed to Maturity) (d) | | | | 3,635 | | | | 3,882 |
See accompanying notes which are an integral part of the financial statements.
23 Annual Report
| Investments continued | | | | | | | | |
| |
| |
| Municipal Bonds continued | | | | | | | | |
| | | Principal | | Value (Note 1) |
| | | Amount (000s) | | (000s) |
| New York – continued | | | | | | | | |
| Metropolitan Trans. Auth. Rev. Series 2005 C: | | | | | | | | |
| 5% 11/15/10 | | $ | | 2,000 | | $ | | 2,121 |
| 5% 11/15/11 | | | | 2,750 | | | | 2,932 |
| Metropolitan Trans. Auth. Svc. Contract Rev. Series B, 5% | | | | | | | | |
| 1/1/06 | | | | 10,110 | | | | 10,110 |
| Nassau County Gen. Oblig. Series Z, 5% 9/1/11 | | | | | | | | |
| (FGIC Insured) | | | | 800 | | | | 848 |
| New York City Gen. Oblig.: | | | | | | | | |
| Series 1996 B, 6.5% 8/15/09 | | | | 3,425 | | | | 3,756 |
| Series 2000 A, 6.5% 5/15/11 | | | | 2,075 | | | | 2,325 |
| Series 2002 G, 5.5% 8/1/10 | | | | 2,720 | | | | 2,928 |
| Series 2004 G, 5% 8/1/09 | | | | 8,000 | | | | 8,380 |
| Series 2005 C, 5% 8/1/12 | | | | 19,770 | | | | 21,055 |
| Series 2005 D, 5% 8/1/12 | | | | 4,925 | | | | 5,245 |
| Series 2005 G, 5.625% 8/1/13 (MBIA Insured) | | | | 5,075 | | | | 5,618 |
| Series 2005 K: | | | | | | | | |
| 5% 8/1/11 | | | | 7,120 | | | | 7,553 |
| 5% 8/1/12 | | | | 4,360 | | | | 4,643 |
| Series 2005 O, 5% 6/1/12 | | | | 7,500 | | | | 7,998 |
| Series A, 5.25% 11/1/14 (MBIA Insured) | | | | 600 | | | | 651 |
| Series B, 5.75% 8/1/14 | | | | 1,000 | | | | 1,104 |
| Series E, 6% 8/1/11 | | | | 60 | | | | 62 |
| Series G, 5.25% 8/1/14 (AMBAC Insured) | | | | 1,000 | | | | 1,077 |
| Subseries 2005 F1, 5% 9/1/15 | | | | 3,560 | | | | 3,813 |
| New York City Indl. Dev. Agcy. Spl. Facilities Rev. (Term. | | | | | | | | |
| One Group Assoc. Proj.) 5% 1/1/07 (c) | | | | 1,700 | | | | 1,719 |
| New York City Muni. Wtr. Fin. Auth. Wtr. & Swr. Sys. | | | | | | | | |
| Rev. Series B, 5.875% 6/15/26 (Pre-Refunded to | | | | | | | | |
| 6/15/06 @ 101) (d) | | | | 7,320 | | | | 7,473 |
| New York City Transitional Fin. Auth. Rev. Series E: | | | | | | | | |
| 4.5% 2/1/07 | | | | 245 | | | | 248 |
| 4.5% 2/1/07 (Escrowed to Maturity) (d) | | | | 1,505 | | | | 1,525 |
| New York State Dorm. Auth. Revs.: | | | | | | | | |
| (City Univ. Sys. Consolidation Proj.): | | | | | | | | |
| Series 2000 A, 6.125% 7/1/12 (AMBAC Insured) . | | | | 5,540 | | | | 6,177 |
| Series A, 5.75% 7/1/13 | | | | 3,500 | | | | 3,849 |
| Series C, 7.5% 7/1/10 | | | | 3,100 | | | | 3,377 |
| Series 2003 A: | | | | | | | | |
| 5% 1/1/06 | | | | 1,250 | | | | 1,250 |
| 5% 3/15/08 | | | | 2,000 | | | | 2,070 |
| Series B, 5.25%, tender 5/15/12 (b) | | | | 13,000 | | | | 14,010 |
| 5.75% 7/1/13 (AMBAC Insured) | | | | 1,000 | | | | 1,103 |
See accompanying notes which are an integral part of the financial statements.
| Municipal Bonds continued | | | | | | | | |
| | | Principal | | Value (Note 1) |
| | | Amount (000s) | | (000s) |
| New York – continued | | | | | | | | |
| New York State Urban Dev. Corp. Rev. 5% 1/1/12 | | $ | | 5,000 | | $ | | 5,330 |
| New York Transitional Fin. Auth. Rev. Series 2003 E: | | | | | | | | |
| 4.5% 2/1/08 | | | | 1,500 | | | | 1,536 |
| 5% 2/1/09 | | | | 2,035 | | | | 2,132 |
| Tobacco Settlement Fing. Corp.: | | | | | | | | |
| Series 2004 B1, 5% 6/1/09 | | | | 3,800 | | | | 3,964 |
| Series A1: | | | | | | | | |
| 5.25% 6/1/12 | | | | 5,000 | | | | 5,041 |
| 5.25% 6/1/13 | | | | 17,500 | | | | 18,221 |
| Series B1: | | | | | | | | |
| 4% 6/1/07 | | | | 6,000 | | | | 6,047 |
| 5% 6/1/06 | | | | 17,815 | | | | 17,932 |
| | | | | | | | | 201,620 |
| |
| New York & New Jersey – 0.6% | | | | | | | | |
| Port Auth. of New York & New Jersey: | | | | | | | | |
| 124th Series, 5% 8/1/13 (FGIC Insured) (c) | | | | 1,200 | | | | 1,242 |
| 127th Series, 5% 12/15/08 (AMBAC Insured) (c) | | | | 3,510 | | | | 3,649 |
| Port Auth. of New York & New Jersey Spl. Oblig. Rev. | | | | | | | | |
| (JFK Int’l. Air Term. Spl. Proj.) Series 6, 6.25% | | | | | | | | |
| 12/1/13 (MBIA Insured) (c) | | | | 4,100 | | | | 4,610 |
| | | | | | | | | 9,501 |
| |
| North Carolina – 1.2% | | | | | | | | |
| Charlotte Ctfs. of Prtn. (FY 2004 Equip. Acquisition Proj.) | | | | | | | | |
| Series 2004 C, 4% 3/1/08 | | | | 4,940 | | | | 5,012 |
| North Carolina Eastern Muni. Pwr. Agcy. Pwr. Sys. Rev.: | | | | | | | | |
| Series 1993 B, 7% 1/1/08 (MBIA Insured) | | | | 1,500 | | | | 1,607 |
| Series A, 5.5% 1/1/10 | | | | 3,000 | | | | 3,187 |
| Series B, 6% 1/1/06 | | | | 6,170 | | | | 6,170 |
| Series C, 5% 1/1/08 | | | | 1,190 | | | | 1,221 |
| Series D, 5.375% 1/1/10 | | | | 3,715 | | | | 3,930 |
| | | | | | | | | 21,127 |
| |
| Ohio – 0.9% | | | | | | | | |
| Akron Ctfs. of Prtn. 5% 12/1/07 | | | | 2,350 | | | | 2,415 |
| Cleveland Pub. Pwr. Sys. Rev. (First Mtg. Prog.) | | | | | | | | |
| Series 1994 A, 0% 11/15/09 (MBIA Insured) | | | | 2,250 | | | | 1,949 |
| Franklin County Rev. (OCLC Online Computer Library | | | | | | | | |
| Ctr., Inc. Proj.) 5% 4/15/07 | | | | 1,960 | | | | 1,986 |
| Lakewood Hosp. Impt. Rev. (Lakewood Hosp. Assoc. | | | | | | | | |
| Proj.) 5.5% 2/15/07 | | | | 1,420 | | | | 1,447 |
See accompanying notes which are an integral part of the financial statements.
25 Annual Report
| Investments continued | | | | | | | | | | |
| |
| |
| Municipal Bonds continued | | | | | | | | | | |
| | | | | Principal | | Value (Note 1) |
| | | | | Amount (000s) | | (000s) |
| Ohio – continued | | | | | | | | | | |
| Ohio Air Quality Dev. Auth. Rev. Series 2002 A, 3.5%, | | | | | | | | |
| tender 1/1/06 (b) | | | | $ | | 1,000 | | $ | | 1,000 |
| Ohio Gen. Oblig.: | | | | | | | | | | |
| Series 2000 E, 5.5% 5/1/09 | | | | | | 1,905 | | | | 2,031 |
| Series 2003 D, 2.45%, tender 9/14/07 (b) | | | | 1,300 | | | | 1,277 |
| Ohio Univ. Gen. Receipts Athens 5% 12/1/07 | | | | | | | | |
| (FSA Insured) | | | | | | 1,285 | | | | 1,325 |
| Ohio Wtr. Dev. Auth. Wtr. Poll. Cont. Rev. (Ohio Edison | | | | | | | | |
| Co. Proj.) Series A, 3.35%, tender 6/1/06 (b) | | | | 1,800 | | | | 1,793 |
| | | | | | | | | | | 15,223 |
| |
| Oklahoma – 0.0% | | | | | | | | | | |
| Cherokee County Econ. Dev. Auth. Series A, 0% | | | | | | | | |
| 11/1/11 (Escrowed to Maturity) (d) | | | | | | 1,000 | | | | 792 |
| Oregon – 0.3% | | | | | | | | | | |
| Beaverton Wtr. Rev. Series B, 5% 6/1/10 (FSA Insured) . | | | | 1,210 | | | | 1,289 |
| Oregon Dept. Administrative Svcs. Ctfs. of Prtn. Series B: | | | | | | | | |
| 5% 5/1/09 (FSA Insured) | | | | | | 1,000 | | | | 1,050 |
| 5% 5/1/11 (FSA Insured) | | | | | | 1,000 | | | | 1,065 |
| Oregon Gen. Oblig. 8.25% 1/1/07 | | | | | | 1,000 | | | | 1,047 |
| | | | | | | | | | | 4,451 |
| |
| Pennsylvania – 4.5% | | | | | | | | | | |
| Allegheny County Arpt. Rev. (Pittsburgh Int’l. Arpt. Proj.) | | | | | | | | |
| Series A1, 5.75% 1/1/12 (MBIA Insured) (c) | | | | 1,300 | | | | 1,403 |
| Allegheny County Hosp. Dev. Auth. Rev. (Univ. of | | | | | | | | |
| Pittsburgh Med. Ctr. Proj.) Series B: | | | | | | | | | | |
| 5.5% 6/15/06 | | | | | | 3,065 | | | | 3,094 |
| 5.5% 6/15/07 | | | | | | 2,000 | | | | 2,057 |
| Allegheny County Indl. Dev. Auth. Rev. (Watson Institute | | | | | | | | |
| Ed. Ctr. Proj.) 3.375%, tender 5/1/08, LOC PNC | | | | | | | | |
| Bank NA, Pittsburgh (b) | | | | | | 4,500 | | | | 4,464 |
| Allegheny County San. Auth. Swr. Rev. 6% 12/1/11 | | | | | | | | |
| (MBIA Insured) | | | | | | 1,495 | | | | 1,676 |
| Hazleton Area School District 6.5% 3/1/06 | | | | | | | | |
| (FSA Insured) | | | | | | 1,155 | | | | 1,161 |
| Luzerne County Indl. Dev. Auth. Wtr. Facilities Rev. | | | | | | | | |
| (Pennsylvania-American Wtr. Co. Proj.) 3.6%, tender | | | | | | | | |
| 12/1/09 (AMBAC Insured) (b)(c) | | | | | | 10,000 | | | | 9,928 |
| Montgomery County Higher Ed. & Health Auth. Hosp. | | | | | | | | |
| Rev. (Abington Memorial Hosp. Proj.) Series A, 5% | | | | | | | | |
| 6/1/06 (AMBAC Insured) | | | | | | 3,750 | | | | 3,771 |
| |
| |
| See accompanying notes which are an integral part of the financial statements. | | | | |
| |
| Annual Report | | 26 | | | | | | | | |
| Municipal Bonds continued | | | | | | | | |
| | | Principal | | Value (Note 1) |
| | | Amount (000s) | | (000s) |
| Pennsylvania – continued | | | | | | | | |
| Pennsylvania Econ. Dev. Fing. Auth. Exempt Facilities | | | | | | | | |
| Rev. (Shippingport Proj.) Series A, 4.35%, tender | | | | | | | | |
| 6/1/10 (b)(c) | | $ | | 1,200 | | $ | | 1,179 |
| Pennsylvania Higher Edl. Facilities Auth. Rev.: | | | | | | | | |
| (Univ. of Pennsylvania Health Systems Proj.) Series A: | | | | | | | | |
| 4% 8/15/06 | | | | 1,405 | | | | 1,408 |
| 5% 8/15/07 | | | | 1,735 | | | | 1,769 |
| 5% 8/15/08 | | | | 2,000 | | | | 2,071 |
| (UPMC Health Sys. Proj.) Series 2001 A, 5.75% | | | | | | | | |
| 1/15/09 | | | | 1,750 | | | | 1,853 |
| Series B, 5.25% 9/1/08 | | | | 5,860 | | | | 6,137 |
| Pennsylvania Indl. Dev. Auth. Rev. 5.25% 7/1/10 | | | | | | | | |
| (AMBAC Insured) | | | | 2,750 | | | | 2,957 |
| Philadelphia Gas Works Rev. (1975 Gen. Ordinance | | | | | | | | |
| Proj.) 17th Series, 5% 7/1/08 (FSA Insured) | | | | 7,410 | | | | 7,692 |
| Philadelphia Muni. Auth. Rev.: | | | | | | | | |
| Series A: | | | | | | | | |
| 5% 5/15/07 (FSA Insured) | | | | 5,500 | | | | 5,620 |
| 5% 5/15/08 (FSA Insured) | | | | 5,000 | | | | 5,181 |
| Series B, 5.25% 11/15/11 (FSA Insured) | | | | 3,400 | | | | 3,686 |
| Philadelphia School District: | | | | | | | | |
| Series 2005 D, 5.25% 6/1/12 (FSA Insured) | | | | 1,465 | | | | 1,592 |
| Series B, 5% 4/1/11 (AMBAC Insured) | | | | 2,160 | | | | 2,309 |
| Pittsburgh Gen. Oblig. Series A, 6% 3/1/07 | | | | | | | | |
| (MBIA Insured) | | | | 2,000 | | | | 2,059 |
| Pittsburgh School District Series A, 5% 9/1/09 | | | | | | | | |
| (MBIA Insured) (a) | | | | 1,600 | | | | 1,668 |
| Westmoreland County Muni. Auth. Muni. Svc. Rev. | | | | | | | | |
| Series K, 0% 7/1/12 (Escrowed to Maturity) (d) | | | | 2,355 | | | | 1,827 |
| | | | | | | | | 76,562 |
| |
| Puerto Rico 0.1% | | | | | | | | |
| Puerto Rico Pub. Bldgs Auth. Rev. Series K, 4%, tender | | | | | | | | |
| 7/1/07 (MBIA Insured) (b) | | | | 1,000 | | | | 1,005 |
| Rhode Island – 0.4% | | | | | | | | |
| Providence Spl. Oblig. Series 2005 E: | | | | | | | | |
| 4% 6/1/08 (Radian Asset Assurance Ltd. Insured) | | | | 1,000 | | | | 1,009 |
| 5% 6/1/09 (Radian Asset Assurance Ltd. Insured) | | | | 1,315 | | | | 1,373 |
| 5% 6/1/10 (Radian Asset Assurance Ltd. Insured) | | | | 1,180 | | | | 1,239 |
See accompanying notes which are an integral part of the financial statements.
27 Annual Report
| Investments continued | | | | | | | | |
| |
| |
| Municipal Bonds continued | | | | | | | | |
| | | Principal | | Value (Note 1) |
| | | Amount (000s) | | (000s) |
| Rhode Island – continued | | | | | | | | |
| Rhode Island Health & Edl. Bldg. Corp. Rev. (Johnson & | | | | | | | | |
| Wales Univ. Proj.): | | | | | | | | |
| 5% 4/1/06 (XL Cap. Assurance, Inc. Insured) | | $ | | 2,225 | | $ | | 2,234 |
| 5% 4/1/08 (XL Cap. Assurance, Inc. Insured) | | | | 1,700 | | | | 1,760 |
| | | | | | | | | 7,615 |
| |
| South Carolina – 1.6% | | | | | | | | |
| Berkeley County School District 7% 4/1/07 | | | | 2,615 | | | | 2,733 |
| Charleston County Hosp. Facilities (Care Alliance Health | | | | | | | | |
| Services Proj.) Series A: | | | | | | | | |
| 5% 8/15/06 | | | | 1,000 | | | | 1,008 |
| 5% 8/15/07 | | | | 1,700 | | | | 1,735 |
| 5% 8/15/08 | | | | 1,690 | | | | 1,742 |
| Greenville County Pub. Facilities Corp. Certificate of | | | | | | | | |
| Prtn. (Courthouse and Detention Proj.) 5% 4/1/10 | | | | | | | | |
| (AMBAC Insured) | | | | 1,450 | | | | 1,544 |
| Piedmont Muni. Pwr. Agcy. Elec. Rev. 5.6% 1/1/09 | | | | | | | | |
| (MBIA Insured) | | | | 2,345 | | | | 2,501 |
| Rock Hill Util. Sys. Rev. Series 2003 A: | | | | | | | | |
| 5% 1/1/08 (FSA Insured) | | | | 1,850 | | | | 1,910 |
| 5% 1/1/09 (FSA Insured) | | | | 1,945 | | | | 2,041 |
| South Carolina Pub. Svc. Auth. Rev.: | | | | | | | | |
| Series 2005 B, 5% 1/1/10 (MBIA Insured) | | | | 3,000 | | | | 3,178 |
| Series A: | | | | | | | | |
| 5.5% 1/1/11 (MBIA Insured) | | | | 3,000 | | | | 3,243 |
| 5.5% 1/1/14 (FGIC Insured) | | | | 1,335 | | | | 1,502 |
| Series D, 5% 1/1/06 | | | | 2,750 | | | | 2,750 |
| Spartanburg County School District #5 Pub. Facilities | | | | | | | | |
| Corp. Ctfs. of Prtn. 5% 7/1/09 (FSA Insured) | | | | 1,000 | | | | 1,052 |
| | | | | | | | | 26,939 |
| |
| Tennessee – 0.9% | | | | | | | | |
| Elizabethton Health & Edl. Facilities Board Rev. (First | | | | | | | | |
| Mtg. Prog.) 6% 7/1/11 (MBIA Insured) | | | | 2,005 | | | | 2,233 |
| Maury County Gen. Oblig. Series 2004 B, 5% 4/1/10 | | | | | | | | |
| (MBIA Insured) | | | | 2,000 | | | | 2,125 |
| Memphis-Shelby County Arpt. Auth. Arpt. Rev. Series A: | | | | | | | | |
| 4.5% 9/1/08 (MBIA Insured) | | | | 1,620 | | | | 1,663 |
| 4.5% 9/1/09 (MBIA Insured) | | | | 1,685 | | | | 1,741 |
| Metropolitan Govt. Nashville & Series A, 5.25% | | | | | | | | |
| 10/15/09 | | | | 3,795 | | | | 4,039 |
See accompanying notes which are an integral part of the financial statements.
| Municipal Bonds continued | | | | | | | | | | |
| | | | | Principal | | Value (Note 1) |
| | | | | Amount (000s) | | (000s) |
| Tennessee – continued | | | | | | | | | | |
| Metropolitan Nashville Arpt. Auth. Rev. Series C, 5% | | | | | | | | | | |
| 7/1/06 (FGIC Insured) (c) | | | | $ | | 1,675 | | $ | | 1,687 |
| Shelby County Health Edl. & Hsg. Facility Board Hosp. | | | | | | | | | | |
| Rev. (Methodist Health Care Proj.) 5.5% 4/1/09 | | | | | | | | | | |
| (MBIA Insured) | | | | | | 1,200 | | | | 1,268 |
| | | | | | | | | | | 14,756 |
| |
| Texas 14.7% | | | | | | | | | | |
| Alief Independent School District Series 2004 B, 5% | | | | | | | | | | |
| 2/15/10 | | | | | | 1,500 | | | | 1,589 |
| Arlington Independent School District 5% 2/15/13 | | | | | | 2,500 | | | | 2,692 |
| Austin Independent School District 5% 8/1/07 (a) | | | | | | 3,605 | | | | 3,669 |
| Austin Util. Sys. Rev.: | | | | | | | | | | |
| Series 1992 A, 0% 11/15/09 (MBIA Insured) | | | | | | 5,130 | | | | 4,451 |
| Series A, 0% 11/15/10 (MBIA Insured) | | | | | | 5,300 | | | | 4,412 |
| Austin Wtr. & Wastewtr. Sys. Rev. 5% 11/15/07 | | | | | | | | | | |
| (MBIA Insured) (a) | | | | | | 3,295 | | | | 3,362 |
| Bexar County Series A: | | | | | | | | | | |
| 5% 6/15/09 (FSA Insured) | | | | | | 2,615 | | | | 2,751 |
| 5% 6/15/10 (FSA Insured) | | | | | | 1,000 | | | | 1,062 |
| Birdville Independent School District 5% 2/15/10 | | | | | | 1,300 | | | | 1,377 |
| Brazos River Auth. Poll. Cont. Rev. (Texas Utils. Elec. Co. | | | | | | | | |
| Proj.) Series 1995 B, 5.05%, tender 6/19/06 (b)(c) | | | | | | 6,255 | | | | 6,279 |
| Brownsville Independent School District 5% 8/15/11 | | | | | | 1,430 | | | | 1,528 |
| Bryan Wtrwks. & Swr. Sys. Rev. 5.5% 7/1/11 (FSA | | | | | | | | | | |
| Insured) | | | | | | 1,500 | | | | 1,642 |
| College Station Independent School District 5% 2/15/10 | | | | 1,000 | | | | 1,059 |
| Conroe Independent School District Lot B, 0% 2/15/08 | | . | | | | 3,000 | | | | 2,785 |
| Corpus Christi Gen. Oblig. 5% 3/1/07 (FSA Insured) | | | | | | 2,735 | | | | 2,787 |
| Corpus Christi Util. Sys. Rev.: | | | | | | | | | | |
| 5% 7/15/12 (FSA Insured) | | | | | | 1,000 | | | | 1,077 |
| 5% 7/15/13 (FSA Insured) | | | | | | 1,665 | | | | 1,800 |
| Cypress-Fairbanks Independent School District: | | | | | | | | | | |
| Series B, 0% 8/1/07 (AMBAC Insured) | | | | | | 10,000 | | | | 9,476 |
| 5% 2/15/08 | | | | | | 2,000 | | | | 2,067 |
| Dallas Independent School District Series 2005, 5.25% | | | | | | | | | | |
| 8/15/08 | | | | | | 2,000 | | | | 2,093 |
| Del Valle Independent School District 5.5% 2/1/09 | | | | | | 1,205 | | | | 1,279 |
| Denton County Gen. Oblig.: | | | | | | | | | | |
| 5% 7/15/11 (FSA Insured) | | | | | | 3,065 | | | | 3,272 |
| 5% 7/15/13 (FSA Insured) | | | | | | 1,200 | | | | 1,293 |
| El Paso Wtr. & Swr. Rev. 5% 3/1/08 (AMBAC Insured) | | . | | | | 2,770 | | | | 2,866 |
| |
| See accompanying notes which are an integral part of the financial statements. | | | | |
| |
| 29 | | | | | | | | Annual Report |
| Investments continued | | | | | | | | | | |
| |
| |
| Municipal Bonds continued | | | | | | | | | | |
| | | | | Principal | | Value (Note 1) |
| | | | | Amount (000s) | | (000s) |
| Texas continued | | | | | | | | | | |
| Fort Bend Independent School District 5%, tender | | | | | | | | | | |
| 8/15/09 (b) | | | | $ | | 5,000 | | $ | | 5,237 |
| Fort Worth Independent School District 5% 2/15/12 | | | | | | 1,500 | | | | 1,612 |
| Frisco Gen. Oblig. Series 2003 A: | | | | | | | | | | |
| 4% 2/15/08 (FSA Insured) | | | | | | 1,145 | | | | 1,161 |
| 5% 2/15/10 (FSA Insured) | | | | | | 1,710 | | | | 1,811 |
| Garland Independent School District 0% 2/15/07 | | | | | | 1,610 | | | | 1,550 |
| Harris County Gen. Oblig. Series A, 0% 8/15/07 | | | | | | | | | | |
| (FGIC Insured) | | | | | | 4,400 | | | | 4,164 |
| Harris County Health Facilities Dev. Corp. Rev. (Saint | | | | | | | | | | |
| Luke’s Episcopal Hosp. Proj.) Series 2001 A, 5.5% | | | | | | | | | | |
| 2/15/09 | | | | | | 3,710 | | | | 3,916 |
| Houston Cmnty. College Sys. Rev.: | | | | | | | | | | |
| 5.25% 4/15/11 (FSA Insured) | | | | | | 3,030 | | | | 3,277 |
| 5.25% 4/15/12 (FSA Insured) | | | | | | 2,000 | | | | 2,182 |
| Houston Util. Sys. Rev. Series A: | | | | | | | | | | |
| 5.25% 5/15/10 (MBIA Insured) | | | | | | 1,250 | | | | 1,340 |
| 5.25% 11/15/11 (FSA Insured) | | | | | | 4,430 | | | | 4,815 |
| Irving Independent School District 5.25% 2/15/13 | | | | | | 2,145 | | | | 2,343 |
| Katy Independent School District Series A, 5.25% | | | | | | | | | | |
| 2/15/12 | | | | | | 2,000 | | | | 2,176 |
| Killeen Independent School District 4% 2/15/08 | | | | | | 1,200 | | | | 1,216 |
| Klein Independent School District Series A, 5% 8/1/12 | | . | | | | 2,250 | | | | 2,415 |
| La Porte Independent School District 4% 2/15/08 | | | | | | 2,000 | | | | 2,026 |
| Lower Colorado River Auth. Rev.: | | | | | | | | | | |
| 0% 1/1/09 (Escrowed to Maturity) (d) | | | | | | 3,000 | | | | 2,695 |
| 5.25% 1/1/15 (Pre-Refunded to 1/1/11 @ 100) (d) | | . | | | | 5,000 | | | | 5,376 |
| Lubbock Gen. Oblig.: | | | | | | | | | | |
| (Wtrwks. Sys. Surplus Proj.) 5% 2/15/11 (FSA Insured) | | | | 2,465 | | | | 2,632 |
| 5% 2/15/09 (MBIA Insured) | | | | | | 1,615 | | | | 1,691 |
| 5% 2/15/10 (MBIA Insured) | | | | | | 1,845 | | | | 1,954 |
| Mesquite Independent School District: | | | | | | | | | | |
| Series A, 0% 8/15/06 | | | | | | 1,115 | | | | 1,093 |
| 3.65%, tender 12/1/08 (Liquidity Facility JPMorgan | | | | | | | | | | |
| Chase Bank) (b) | | | | | | 2,500 | | | | 2,500 |
| New Braunfels Independent School District 0% 2/1/07 | | . | | | | 2,000 | | | | 1,928 |
| North East Texas Independent School District 7% 2/1/11 | | | | | | | | |
| (Pre-Refunded to 2/1/10 @ 100) (d) | | | | | | 3,600 | | | | 4,076 |
| North Texas Tollway Auth. Dallas North Tollway Sys. Rev. | | | | | | | | |
| Series C: | | | | | | | | | | |
| 5% 1/1/09 (FSA Insured) | | | | | | 2,000 | | | | 2,093 |
| 5%, tender 7/1/08 (FSA Insured) (b) | | | | | | 2,650 | | | | 2,751 |
See accompanying notes which are an integral part of the financial statements.
| Municipal Bonds continued | | | | | | | | |
| | | Principal | | Value (Note 1) |
| | | Amount (000s) | | (000s) |
| Texas continued | | | | | | | | |
| Northside Independent School District Series B, 2.45%, | | | | | | | | |
| tender 8/1/06 (Liquidity Facility Dexia Cr. Local de | | | | | | | | |
| France) (b) | | $ | | 7,100 | | $ | | 7,066 |
| Port Houston Auth. Harris County 6% 10/1/06 | | | | | | | | |
| (FGIC Insured) (c) | | | | 2,000 | | | | 2,037 |
| Red River Ed. Fin. Corp. Ed. Rev. (Texas Christian Univ. | | | | | | | | |
| Proj.) 5% 3/15/12 (MBIA Insured) | | | | 2,625 | | | | 2,817 |
| Rockwall Independent School District: | | | | | | | | |
| 5% 2/15/08 | | | | 3,825 | | | | 3,952 |
| 5% 2/15/09 | | | | 4,690 | | | | 4,911 |
| San Angelo Wtrks & Swr. Sys. Impt. and Rfdg. Rev. 5% | | | | | | | | |
| 4/1/10 (FSA Insured) | | | | 1,630 | | | | 1,729 |
| San Antonio Elec. & Gas Systems Rev.: | | | | | | | | |
| Series 2000 A, 5.75% 2/1/15 (Pre-Refunded to | | | | | | | | |
| 2/1/10 @ 100) (d) | | | | 5,000 | | | | 5,425 |
| 3.55%, tender 12/1/07 (b) | | | | 6,700 | | | | 6,702 |
| 5.25% 2/1/08 | | | | 1,000 | | | | 1,038 |
| San Antonio Independent School District 7% 8/15/08 | | | | 5,000 | | | | 5,442 |
| San Antonio Muni. Drainage Util. Sys. Rev. 5.25% | | | | | | | | |
| 2/1/12 (MBIA Insured) | | | | 1,545 | | | | 1,681 |
| San Antonio Wtr. Sys. Rev. 5% 5/15/10 (FGIC Insured) | | | | 1,020 | | | | 1,083 |
| Socorro Independent School District 5% 8/15/09 | | | | 2,070 | | | | 2,179 |
| Spring Branch Independent School District Series 2001, | | | | | | | | |
| 5.375% 2/1/14 | | | | 2,790 | | | | 3,012 |
| Spring Independent School District 5% 2/15/08 | | | | 1,875 | | | | 1,937 |
| Texas Gen. Oblig.: | | | | | | | | |
| (College Student Ln. Prog.) 5% 8/1/11 (c) | | | | 3,000 | | | | 3,103 |
| Series 1992 A, 8% 10/1/07 | | | | 10,000 | | | | 10,785 |
| Series A, 6% 10/1/08 (MBIA Insured) | | | | 10,750 | | | | 11,495 |
| Series C, 0% 4/1/08 (Escrowed to Maturity) (d) | | | | 3,100 | | | | 2,866 |
| Texas Pub. Fin. Auth. Rev. (Bldg. and Procurement | | | | | | | | |
| Commission Projs.) Series A, 5% 2/1/10 | | | | | | | | |
| (AMBAC Insured) | | | | 1,055 | | | | 1,117 |
| Texas State Univ. Sys. Fing. Rev. 5% 3/15/13 | | | | | | | | |
| (FSA Insured) | | | | 2,000 | | | | 2,163 |
| Texas Tech Univ. Revs. Ninth Series, 5% 2/15/11 | | | | | | | | |
| (AMBAC Insured) | | | | 1,250 | | | | 1,335 |
| Travis County Gen. Oblig. 5.25% 3/1/12 | | | | 4,125 | | | | 4,481 |
| Tyler Health Facilities Dev. Corp. Hosp. Rev. (Mother | | | | | | | | |
| Frances Hosp. Reg’l. Health Care Ctr. Proj.): | | | | | | | | |
| 4.5% 7/1/06 | | | | 1,220 | | | | 1,224 |
| 5% 7/1/07 | | | | 1,000 | | | | 1,015 |
See accompanying notes which are an integral part of the financial statements.
31 Annual Report
| Investments continued | | | | | | | | | | |
| |
| |
| Municipal Bonds continued | | | | | | | | | | |
| | | | | Principal | | Value (Note 1) |
| | | | | Amount (000s) | | (000s) |
| Texas continued | | | | | | | | | | |
| Univ. of Texas Univ. Revs.: | | | | | | | | | | |
| (Fing. Sys. Proj.) Series A, 5.5% 8/15/09 | | $ | | 1,115 | | $ | | 1,192 |
| Series B: | | | | | | | | | | |
| 5% 8/15/09 | | | | | | 13,555 | | | | 14,262 |
| 5.25% 8/15/11 | | | | | | 5,025 | | | | 5,435 |
| Webb County Gen. Oblig. 5% 2/15/08 (FGIC Insured) . | | | | 1,170 | | | | 1,210 |
| Wichita Falls Independent School District 0% 2/1/10 | | | | 2,325 | | | | 1,995 |
| | | | | | | | | | | 251,387 |
| |
| Utah 0.6% | | | | | | | | | | |
| Salt Lake County Wtr. Conservancy District Rev. Series A: | | | | | | | | |
| 0% 10/1/11 (AMBAC Insured) | | | | | | 3,800 | | | | 3,024 |
| 0% 10/1/12 (AMBAC Insured) | | | | | | 3,800 | | | | 2,891 |
| 0% 10/1/13 (AMBAC Insured) | | | | | | 3,760 | | | | 2,730 |
| Utah Bldg. Ownership Auth. Lease Rev. (State Facilities | | | | | | | | |
| Master Lease Prog.) Series A, 5% 5/15/11 | | �� | | 1,700 | | | | 1,821 |
| | | | | | | | | | | 10,466 |
| |
| Virginia – 0.1% | | | | | | | | | | |
| Amelia County Indl. Dev. Auth. Solid Waste Disp. Rev. | | | | | | | | |
| (Waste Mgmt., Inc. Proj.) 4.05%, tender 4/1/08 (b)(c) | | | | 1,000 | | | | 1,000 |
| Washington 4.8% | | | | | | | | | | |
| Chelan County Pub. Util. District #1 Rev. Series B, 5% | | | | | | | | |
| 7/1/11 (FGIC Insured) | | | | | | 1,190 | | | | 1,273 |
| Clark County Pub. Util. District #1 Elec. Rev.: | | | | | | | | |
| Series B: | | | | | | | | | | |
| 5% 1/1/06 (FSA Insured) | | | | | | 1,375 | | | | 1,375 |
| 5.25% 1/1/08 (FSA Insured) | | | | | | 1,515 | | | | 1,569 |
| 5.25% 1/1/09 (FSA Insured) | | | | | | 1,595 | | | | 1,681 |
| 5% 1/1/11 (MBIA Insured) | | | | | | 1,680 | | | | 1,791 |
| 5.25% 1/1/11 (FSA Insured) | | | | | | 1,935 | | | | 2,085 |
| King & Snohomish Counties School District #417 | | | | | | | | |
| Northshore: | | | | | | | | | | |
| 5.5% 12/1/14 (Pre-Refunded to 6/1/12 @ 100) (d) . | | | | 6,300 | | | | 6,979 |
| 5.75% 12/1/15 (Pre-Refunded to 6/1/12 @ 100) (d) | | | | 2,500 | | | | 2,805 |
| King County School District #409, Tahoma 5% 6/1/11 | | | | | | | | |
| (FSA Insured) | | | | | | 1,740 | | | | 1,864 |
| King County Swr. Rev. Series B, 5.25% 1/1/08 | | | | | | | | |
| (FSA Insured) | | | | | | 3,500 | | | | 3,628 |
| Pierce County Gen. Oblig. 5.75% 8/1/13 | | | | | | | | |
| (Pre-Refunded to 8/1/10 @ 100) (d) | | | | | | 1,155 | | | | 1,265 |
| Pierce County School District #10 Tacoma Series A, 5% | | | | | | | | |
| 12/1/12 (FSA Insured) | | | | | | 4,175 | | | | 4,498 |
See accompanying notes which are an integral part of the financial statements. | | | | |
| |
| Annual Report | | 32 | | | | | | | | |
| Municipal Bonds continued | | | | | | | | | | |
| | | Principal | | | | Value (Note 1) |
| | | Amount (000s) | | | | (000s) |
| Washington – continued | | | | | | | | | | |
| Port of Seattle Rev. Series D, 5.75% 11/1/15 | | | | | | | | | | |
| (FGIC Insured) (c) | | $ | | 3,640 | | | | $ | | 3,990 |
| Seattle Muni. Lt. & Pwr. Rev. 5.25% 3/1/07 | | | | | | | | | | |
| (FSA Insured) | | | | 1,690 | | | | | | 1,726 |
| Snohomish County Pub. Hosp. District #2 (Stevens Health | | | | | | | | | | |
| Care Proj.) 4.5% 12/1/09 (FGIC Insured) | | | | 1,000 | | | | | | 1,036 |
| Snohomish County School District #2, Everett: | | | | | | | | | | |
| 5% 6/1/09 (FSA Insured) | | | | 1,045 | | | | | | 1,100 |
| 5% 6/1/10 (FSA Insured) | | | | 1,000 | | | | | | 1,063 |
| Vancouver Wtr. & Swr. Rev. 5.25% 6/1/11 | | | | | | | | | | |
| (FSA Insured) | | | | 1,000 | | | | | | 1,083 |
| Washington Gen. Oblig. Series A: | | | | | | | | | | |
| 4% 1/1/08 (MBIA Insured) | | | | 33,175 | | | | | | 33,592 |
| 5% 7/1/11 (FGIC Insured) | | | | 1,000 | | | | | | 1,070 |
| 5.5% 7/1/11 | | | | 3,500 | | | | | | 3,762 |
| Washington Pub. Pwr. Supply Sys. Nuclear Proj. #2 Rev. | | | | | | | | | | |
| Series A, 5.75% 7/1/08 | | | | 3,000 | | | | | | 3,165 |
| | | | | | | | | | | 82,400 |
| |
| Wisconsin – 1.5% | | | | | | | | | | |
| Milwaukee County Gen. Oblig. Series A, 0% 12/1/10 | | | | | | | | | | |
| (FGIC Insured) | | | | 3,370 | | | | | | 2,783 |
| Wisconsin Gen. Oblig. Series 1, 5% 5/1/10 | | | | | | | | | | |
| (MBIA Insured) (a) | | | | 2,500 | | | | | | 2,653 |
| Wisconsin Health & Edl. Facilities Auth. Rev.: | | | | | | | | | | |
| (Hosp. Sisters Svcs., Inc. Proj.) Series 2003 B, 4%, | | | | | | | | | | |
| tender 12/1/06 (FSA Insured) (b) | | | | 15,000 | | | | | | 15,083 |
| (Wheaton Franciscan Svcs., Inc. Proj.) Series A: | | | | | | | | | | |
| 5% 8/15/09 | | | | 1,000 | | | | | | 1,039 |
| 5% 8/15/10 | | | | 1,870 | | | | | | 1,946 |
| Wisconsin Trans. Rev. 5% 7/1/07 | | | | 1,500 | | | | | | 1,536 |
| | | | | | | | | | | 25,040 |
| |
| |
| TOTAL INVESTMENT PORTFOLIO 99.8% | | | | | | | | | | |
| (Cost $1,716,088) | | | | | | | | 1,707,108 |
| |
| NET OTHER ASSETS – 0.2% | | | | | | | | | | 3,162 |
| NET ASSETS 100% | | | | | | | | $ | | 1,710,270 |
See accompanying notes which are an integral part of the financial statements.
33 Annual Report
Investments continued
Legend
(a) Security or a portion of the security
purchased on a delayed delivery or
when-issued basis.
(b) The coupon rate shown on floating or
adjustable rate securities represents the
rate at period end.
(c) Private activity obligations whose
interest is subject to the federal
alternative minimum tax for individuals.
(d) Security collateralized by an amount
sufficient to pay interest and principal.
|
(e) Restricted securities – Investment in
securities not registered under the
Securities Act of 1933 (excluding 144A
issues). At the end of the period, the
value of restricted securities (excluding
144A issues) amounted to $9,063,000
or 0.5% of net assets.
|
Additional information on each holding is as follows:
| | | Acquisition | | Acquisition |
| Security | | Date | | Cost (000s) |
| Univ. of California | | | | | | |
| Revs. (UCLA Med. | | | | | | |
| Ctr. Proj.) 4.55% | | | | | | |
| 12/1/09 | | 3/6/02 | | $ | | 8,955 |
Affiliated Central Funds
Information regarding income received by the fund from the affiliated Central funds during the period is as follows:
| Fund | | Income received |
| | | (Amounts in Thousands) |
| Fidelity Municipal Cash Central Fund | | $ | | 238 |
Other Information
The distribution of municipal securities by revenue source, as a percentage of total net assets, is as follows:
| General Obligations | | 49.1% |
| Electric Utilities | | 13.8% |
| Escrowed/Pre Refunded | | 8.2% |
| Transportation | | 6.7% |
| Health Care | | 6.5% |
| Education | | 5.3% |
| Others* (individually less than 5%) | | 10.4% |
| | | 100.0% |
| *Includes net other assets | | |
Income Tax Information
At December 31, 2005, the fund had a capital loss carryforward of approximately $699,000 all of which will expire on December 31, 2013.
See accompanying notes which are an integral part of the financial statements.
Annual Report 34
| Financial Statements | | | | | | | | |
| |
| |
| Statement of Assets and Liabilities | | | | | | | | |
| Amounts in thousands (except per share amounts) | | | | | | December 31, 2005 |
| |
| Assets | | | | | | | | |
| Investment in securities, at value | | | | | | | | |
| See accompanying schedule: | | | | | | | | |
| Unaffiliated issuers (cost $1,716,088) | | | | | | $ | | 1,707,108 |
| Cash | | | | | | | | 6,150 |
| Receivable for fund shares sold | | | | | | | | 2,394 |
| Interest receivable | | | | | | | | 22,071 |
| Prepaid expenses | | | | | | | | 9 |
| Other receivables | | | | | | | | 56 |
| Total assets | | | | | | | | 1,737,788 |
| |
| Liabilities | | | | | | | | |
| Payable for investments purchased | | | | | | | | |
| Regular delivery | | $ | | 5 | | | | |
| Delayed delivery | | | | 19,326 | | | | |
| Payable for fund shares redeemed | | | | 6,201 | | | | |
| Distributions payable | | | | 1,209 | | | | |
| Accrued management fee | | | | 543 | | | | |
| Distribution fees payable | | | | 16 | | | | |
| Other affiliated payables | | | | 153 | | | | |
| Other payables and accrued expenses | | | | 65 | | | | |
| Total liabilities | | | | | | | | 27,518 |
| |
| Net Assets | | | | | | $ | | 1,710,270 |
| Net Assets consist of: | | | | | | | | |
| Paid in capital | | | | | | $ | | 1,721,093 |
| Distributions in excess of net investment income | | | | | | | | (3) |
| Accumulated undistributed net realized gain (loss) on | | | | | | | | |
| investments | | | | | | | | (1,840) |
| Net unrealized appreciation (depreciation) on | | | | | | | | |
| investments | | | | | | | | (8,980) |
| Net Assets | | | | | | $ | | 1,710,270 |
See accompanying notes which are an integral part of the financial statements.
35 Annual Report
| Financial Statements continued | | | | |
| |
| |
| |
| Statement of Assets and Liabilities continued | | | | |
| Amounts in thousands (except per share amounts) | | December 31, 2005 |
| |
| Calculation of Maximum Offering Price | | | | |
| Class A: | | | | |
| Net Asset Value and redemption price per share | | | | |
| ($14,402 ÷ 1,409.90 shares) | | $ | | 10.21 |
| |
| Maximum offering price per share (100/96.25 of $10.21) | | $ | | 10.61 |
| Class T: | | | | |
| Net Asset Value and redemption price per share | | | | |
| ($14,877 ÷ 1,458.63 shares) | | $ | | 10.20 |
| |
| Maximum offering price per share (100/97.25 of $10.20) | | $ | | 10.49 |
| Class B: | | | | |
| Net Asset Value and offering price per share | | | | |
| ($3,443 ÷ 337.18 shares)A | | $ | | 10.21 |
| |
| Class C: | | | | |
| Net Asset Value and offering price per share | | | | |
| ($10,240 ÷ 1,003.84 shares)A | | $ | | 10.20 |
| |
| Short Intermediate Municipal Income: | | | | |
| Net Asset Value, offering price and redemption price per | | | | |
| share ($1,664,683 ÷ 163,188.52 shares) | | $ | | 10.20 |
| |
| Institutional Class: | | | | |
| Net Asset Value, offering price and redemption price per | | | | |
| share ($2,625 ÷ 257.23 shares) | | $ | | 10.20 |
| |
| A Redemption price per share is equal to net asset value less any applicable contingent deferred sales charge. | | | | |
See accompanying notes which are an integral part of the financial statements.
Annual Report 36
| Statement of Operations | | | | | | |
| Amounts in thousands | | | | Year ended December 31, 2005 |
| |
| Investment Income | | | | | | |
| Interest | | | | $ | | 59,148 |
| Income from affiliated Central Funds | | | | | | 238 |
| Total income | | | | | | 59,386 |
| |
| Expenses | | | | | | |
| Management fee | | $ | | 6,951 | | |
| Transfer agent fees | | | | 1,501 | | |
| Distribution fees | | | | 210 | | |
| Accounting fees and expenses | | | | 362 | | |
| Independent trustees’ compensation | | | | 8 | | |
| Custodian fees and expenses | | | | 29 | | |
| Registration fees | | | | 114 | | |
| Audit | | | | 55 | | |
| Legal | | | | 13 | | |
| Miscellaneous | | | | 39 | | |
| Total expenses before reductions | | | | 9,282 | | |
| Expense reductions | | | | (1,241) | | 8,041 |
| |
| Net investment income | | | | | | 51,345 |
| Realized and Unrealized Gain (Loss) | | | | | | |
| Net realized gain (loss) on: | | | | | | |
| Investment securities: | | | | | | |
| Unaffiliated issuers | | | | | | (1,840) |
| Change in net unrealized appreciation (depreciation) on | | | | |
| investment securities | | | | | | (29,976) |
| Net gain (loss) | | | | | | (31,816) |
| Net increase (decrease) in net assets resulting from | | | | | | |
| operations | | | | $ | | 19,529 |
See accompanying notes which are an integral part of the financial statements.
37 Annual Report
| Financial Statements continued | | | | | | | | |
| |
| |
| Statement of Changes in Net Assets | | | | | | | | |
| | | | | Year ended | | | | Year ended |
| | | | | December 31, | | | | December 31, |
| Amounts in thousands | | | | 2005 | | | | 2004 |
| Increase (Decrease) in Net Assets | | | | | | | | |
| Operations | | | | | | | | |
| Net investment income | | $ | | 51,345 | | $ | | 47,437 |
| Net realized gain (loss) | | | | (1,840) | | | | 4,712 |
| Change in net unrealized appreciation (depreciation) . | | (29,976) | | | | (22,609) |
| Net increase (decrease) in net assets resulting | | | | | | | | |
| from operations | | | | 19,529 | | | | 29,540 |
| Distributions to shareholders from net investment income | | . | | (51,341) | | | | (47,598) |
| Distributions to shareholders from net realized gain | | | | (549) | | | | (3,486) |
| Total distributions | | | | (51,890) | | | | (51,084) |
| Share transactions - net increase (decrease) | | | | (147,427) | | | | 37,160 |
| Redemption fees | | | | 25 | | | | 65 |
| Total increase (decrease) in net assets | | | | (179,763) | | | | 15,681 |
| |
| Net Assets | | | | | | | | |
| Beginning of period | | | | 1,890,033 | | | | 1,874,352 |
| End of period (including distributions in excess of net | | | | | | | | |
| investment income of $3 and undistributed net | | | | | | | | |
| investment income of $190, respectively) | | $ | | 1,710,270 | | $ | | 1,890,033 |
See accompanying notes which are an integral part of the financial statements.
| Financial Highlights Class A | | | | | | | | | | | | |
| |
| Years ended December 31, | | | | 2005 | | | | 2004 | | | | 2003F |
| Selected Per Share Data | | | | | | | | | | | | |
| Net asset value, beginning of period | | | | $ 10.39 | | | | $ 10.50 | | | | $ 10.49 |
| Income from Investment Operations | | | | | | | | | | | | |
| Net investment incomeE | | | | 268 | | | | .250 | | | | .115 |
| Net realized and unrealized gain (loss) | | | | (.177) | | | | (.090) | | | | .071 |
| Total from investment operations | | | | 091 | | | | .160 | | | | .186 |
| Distributions from net investment income | | | | (.268) | | | | (.251) | | | | (.111) |
| Distributions from net realized gain | | | | (.003) | | | | (.019) | | | | (.065) |
| Total distributions | | | | (.271) | | | | (.270) | | | | (.176) |
| Redemption fees added to paid in capitalE,H | | | | — | | | | — | | | | — |
| Net asset value, end of period | | | | $ 10.21 | | | | $ 10.39 | | | | $ 10.50 |
| Total ReturnB,C,D | | | | 89% | | | | 1.55% | | | | 1.78% |
| Ratios to Average Net AssetsG | | | | | | | | | | | | |
| Expenses before reductions | | | | 65% | | | | .65% | | | | .65%A |
| Expenses net of fee waivers, if any | | | | 65% | | | | .65% | | | | .65%A |
| Expenses net of all reductions | | | | 58% | | | | .64% | | | | .64%A |
| Net investment income | | | | 2.61% | | | | 2.41% | | | | 2.52%A |
| Supplemental Data | | | | | | | | | | | | |
| Net assets, end of period (in millions) | | | | $ 14 | | | | $ 12 | | | | $ 9 |
| Portfolio turnover rate | | | | 27% | | | | 45% | | | | 34% |
A Annualized
B Total returns for periods of less than one year are not annualized.
C Total returns would have been lower had certain expenses not been reduced during the periods shown.
D Total returns do not include the effect of the sales charges.
E Calculated based on average shares outstanding during the period.
F For the period July 23, 2003 (commencement of sale of shares) to December 31, 2003.
G Expense ratios reflect operating expenses of the class. Expenses before reductions do not reflect amounts reimbursed by the investment adviser or
expense offset arrangements and do not represent the amount paid by the class during periods when reimbursements or reductions occur. Expense
ratios before reductions for start up periods may not be representative of longer term operating periods. Expenses net of fee waivers reflect
expenses after reimbursement by the investment adviser but prior to reductions from expense offset arrangements. Expenses net of all reductions
represent the net expenses paid by the class.
H Amount represents less than $.001 per share.
|
See accompanying notes which are an integral part of the financial statements.
39 Annual Report
| Financial Highlights Class T | | | | | | | | | | | | |
| |
| Years ended December 31, | | | | 2005 | | | | 2004 | | | | 2003F |
| Selected Per Share Data | | | | | | | | | | | | |
| Net asset value, beginning of period | | | | $ 10.37 | | | | $ 10.48 | | | | $ 10.49 |
| Income from Investment Operations | | | | | | | | | | | | |
| Net investment incomeE | | | | 257 | | | | .238 | | | | .110 |
| Net realized and unrealized gain (loss) | | | | (.167) | | | | (.089) | | | | .050 |
| Total from investment operations | | | | 090 | | | | .149 | | | | .160 |
| Distributions from net investment income | | | | (.257) | | | | (.240) | | | | (.105) |
| Distributions from net realized gain | | | | (.003) | | | | (.019) | | | | (.065) |
| Total distributions | | | | (.260) | | | | (.259) | | | | (.170) |
| Redemption fees added to paid in capitalE,H | | | | — | | | | — | | | | — |
| Net asset value, end of period | | | | $ 10.20 | | | | $ 10.37 | | | | $ 10.48 |
| Total ReturnB,C,D | | | | 88% | | | | 1.44% | | | | 1.54% |
| Ratios to Average Net AssetsG | | | | | | | | | | | | |
| Expenses before reductions | | | | 76% | | | | .76% | | | | .77%A |
| Expenses net of fee waivers, if any | | | | 76% | | | | .76% | | | | .77%A |
| Expenses net of all reductions | | | | 69% | | | | .75% | | | | .76%A |
| Net investment income | | | | 2.50% | | | | 2.30% | | | | 2.41%A |
| Supplemental Data | | | | | | | | | | | | |
| Net assets, end of period (in millions) | | | | $ 15 | | | | $ 20 | | | | $ 12 |
| Portfolio turnover rate | | | | 27% | | | | 45% | | | | 34% |
A Annualized
B Total returns for periods of less than one year are not annualized.
C Total returns would have been lower had certain expenses not been reduced during the periods shown.
D Total returns do not include the effect of the sales charges.
E Calculated based on average shares outstanding during the period.
F For the period July 23, 2003 (commencement of sale of shares) to December 31, 2003.
G Expense ratios reflect operating expenses of the class. Expenses before reductions do not reflect amounts reimbursed by the investment adviser or
expense offset arrangements and do not represent the amount paid by the class during periods when reimbursements or reductions occur. Expense
ratios before reductions for start up periods may not be representative of longer term operating periods. Expenses net of fee waivers reflect
expenses after reimbursement by the investment adviser but prior to reductions from expense offset arrangements. Expenses net of all reductions
represent the net expenses paid by the class.
H Amount represents less than $.001 per share.
|
See accompanying notes which are an integral part of the financial statements.
| Financial Highlights Class B | | | | | | | | | | | | |
| |
| Years ended December 31, | | | | 2005 | | | | 2004 | | | | 2003F |
| Selected Per Share Data | | | | | | | | | | | | |
| Net asset value, beginning of period | | | | $ 10.39 | | | | $ 10.49 | | | | $ 10.49 |
| Income from Investment Operations | | | | | | | | | | | | |
| Net investment incomeE | | | | 190 | | | | .172 | | | | .081 |
| Net realized and unrealized gain (loss) | | | | (.177) | | | | (.080) | | | | .059 |
| Total from investment operations | | | | 013 | | | | .092 | | | | .140 |
| Distributions from net investment income | | | | (.190) | | | | (.173) | | | | (.075) |
| Distributions from net realized gain | | | | (.003) | | | | (.019) | | | | (.065) |
| Total distributions | | | | (.193) | | | | (.192) | | | | (.140) |
| Redemption fees added to paid in capitalE,H | | | | — | | | | — | | | | — |
| Net asset value, end of period | | | | $ 10.21 | | | | $ 10.39 | | | | $ 10.49 |
| Total ReturnB,C,D | | | | 13% | | | | .89% | | | | 1.34% |
| Ratios to Average Net AssetsG | | | | | | | | | | | | |
| Expenses before reductions | | | | 1.41% | | | | 1.40% | | | | 1.40%A |
| Expenses net of fee waivers, if any | | | | 1.41% | | | | 1.40% | | | | 1.40%A |
| Expenses net of all reductions | | | | 1.34% | | | | 1.39% | | | | 1.39%A |
| Net investment income | | | | 1.85% | | | | 1.65% | | | | 1.78%A |
| Supplemental Data | | | | | | | | | | | | |
| Net assets, end of period (in millions) | | | | $ 3 | | | | $ 4 | | | | $ 2 |
| Portfolio turnover rate | | | | 27% | | | | 45% | | | | 34% |
A Annualized
B Total returns for periods of less than one year are not annualized.
C Total returns would have been lower had certain expenses not been reduced during the periods shown.
D Total returns do not include the effect of the contingent deferred sales charge.
E Calculated based on average shares outstanding during the period.
F For the period July 23, 2003 (commencement of sale of shares) to December 31, 2003.
G Expense ratios reflect operating expenses of the class. Expenses before reductions do not reflect amounts reimbursed by the investment adviser or
expense offset arrangements and do not represent the amount paid by the class during periods when reimbursements or reductions occur. Expense
ratios before reductions for start up periods may not be representative of longer term operating periods. Expenses net of fee waivers reflect
expenses after reimbursement by the investment adviser but prior to reductions from expense offset arrangements. Expenses net of all reductions
represent the net expenses paid by the class.
H Amount represents less than $.001 per share.
|
See accompanying notes which are an integral part of the financial statements.
41 Annual Report
| Financial Highlights Class C | | | | | | | | | | | | |
| |
| Years ended December 31, | | | | 2005 | | | | 2004 | | | | 2003F |
| Selected Per Share Data | | | | | | | | | | | | |
| Net asset value, beginning of period | | | | $ 10.38 | | | | $ 10.48 | | | | $ 10.49 |
| Income from Investment Operations | | | | | | | | | | | | |
| Net investment incomeE | | | | 178 | | | | .159 | | | | .077 |
| Net realized and unrealized gain (loss) | | | | (.176) | | | | (.080) | | | | .048 |
| Total from investment operations | | | | 002 | | | | .079 | | | | .125 |
| Distributions from net investment income | | | | (.179) | | | | (.160) | | | | (.070) |
| Distributions from net realized gain | | | | (.003) | | | | (.019) | | | | (.065) |
| Total distributions | | | | (.182) | | | | (.179) | | | | (.135) |
| Redemption fees added to paid in capitalE,H | | | | — | | | | — | | | | — |
| Net asset value, end of period | | | | $ 10.20 | | | | $ 10.38 | | | | $ 10.48 |
| Total ReturnB,C,D | | | | 02% | | | | .77% | | | | 1.20% |
| Ratios to Average Net AssetsG | | | | | | | | | | | | |
| Expenses before reductions | | | | 1.52% | | | | 1.52% | | | | 1.50%A |
| Expenses net of fee waivers, if any | | | | 1.52% | | | | 1.52% | | | | 1.50%A |
| Expenses net of all reductions | | | | 1.45% | | | | 1.51% | | | | 1.49%A |
| Net investment income | | | | 1.74% | | | | 1.53% | | | | 1.67%A |
| Supplemental Data | | | | | | | | | | | | |
| Net assets, end of period (in millions) | | | | $ 10 | | | | $ 11 | | | | $ 8 |
| Portfolio turnover rate | | | | 27% | | | | 45% | | | | 34% |
A Annualized
B Total returns for periods of less than one year are not annualized.
C Total returns would have been lower had certain expenses not been reduced during the periods shown.
D Total returns do not include the effect of the contingent deferred sales charge.
E Calculated based on average shares outstanding during the period.
F For the period July 23, 2003 (commencement of sale of shares) to December 31, 2003.
G Expense ratios reflect operating expenses of the class. Expenses before reductions do not reflect amounts reimbursed by the investment adviser or
expense offset arrangements and do not represent the amount paid by the class during periods when reimbursements or reductions occur. Expense
ratios before reductions for start up periods may not be representative of longer term operating periods. Expenses net of fee waivers reflect
expenses after reimbursement by the investment adviser but prior to reductions from expense offset arrangements. Expenses net of all reductions
represent the net expenses paid by the class.
H Amount represents less than $.001 per share.
|
See accompanying notes which are an integral part of the financial statements.
| Financial Highlights Short Intermediate Municipal Income | | | | |
| |
| Years ended December 31, | | | | 2005 | | | | 2004 | | | | 2003 | | | | 2002 | | | | 2001 |
| Selected Per Share Data | | | | | | | | | | | | | | | | | | | | |
| Net asset value, | | | | | | | | | | | | | | | | | | | | |
| beginning of period | | | | $ 10.38 | | | | $ 10.48 | | | | $ 10.52 | | | | $ 10.27 | | | | $ 10.12 |
| Income from Investment | | | | | | | | | | | | | | | | | | | | |
| Operations | | | | | | | | | | | | | | | | | | | | |
| Net investment incomeB | | | | 284 | | | | .268 | | | | .283 | | | | .336 | | | | .396D |
| Net realized and unrealized | | | | | | | | | | | | | | | | | | | | |
| gain (loss) | | | | (.177) | | | | (.080) | | | | .030 | | | | .317 | | | | .173D |
| Total from investment operations | | | | 107 | | | | .188 | | | | .313 | | | | .653 | | | | .569 |
| Distributions from net investment | | | | | | | | | | | | | | | | | | | | |
| income | | | | (.284) | | | | (.269) | | | | (.283) | | | | (.339) | | | | (.396) |
| Distributions from net realized | | | | | | | | | | | | | | | | | | | | |
| gain | | | | (.003) | | | | (.019) | | | | (.070) | | | | (.064) | | | | (.023) |
| Total distributions | | | | (.287) | | | | (.288) | | | | (.353) | | | | (.403) | | | | (.419) |
| Redemption fees added to paid | | | | | | | | | | | | | | | | | | | | |
| in capitalB,E | | | | — | | | | — | | | | — | | | | — | | | | — |
| Net asset value, end of period | | | | $ 10.20 | | | | $ 10.38 | | | | $ 10.48 | | | | $ 10.52 | | | | $ 10.27 |
| Total ReturnA | | | | 1.06% | | | | 1.82% | | | | 3.01% | | | | 6.47% | | | | 5.70% |
| Ratios to Average Net AssetsC | | | | | | | | | | | | | | | | | | | | |
| Expenses before reductions | | | | 49% | | | | .49% | | | | .49% | | | | .49% | | | | .49% |
| Expenses net of fee waivers, | | | | | | | | | | | | | | | | | | | | |
| if any | | | | 49% | | | | .48% | | | | .49% | | | | .49% | | | | .49% |
| Expenses net of all reductions | | | | 42% | | | | .47% | | | | .47% | | | | .45% | | | | .41% |
| Net investment income | | | | 2.77% | | | | 2.57% | | | | 2.69% | | | | 3.23% | | | | 3.85%D |
| Supplemental Data | | | | | | | | | | | | | | | | | | | | |
| Net assets, end of period | | | | | | | | | | | | | | | | | | | | |
| (in millions) | | | | $ 1,665 | | | | $ 1,841 | | | | $ 1,843 | | | | $ 1,683 | | | | $ 1,183 |
| Portfolio turnover rate | | | | 27% | | | | 45% | | | | 34% | | | | 38% | | | | 43% |
A Total returns would have been lower had certain expenses not been reduced during the periods shown.
B Calculated based on average shares outstanding during the period.
C Expense ratios reflect operating expenses of the class. Expenses before reductions do not reflect amounts reimbursed by the investment adviser or
expense offset arrangements and do not represent the amount paid by the class during periods when reimbursements or reductions occur. Ex
penses net of fee waivers reflect expenses after reimbursement by the investment adviser but prior to reductions from expense offset arrange
ments. Expenses net of all reductions represent the net expenses paid by the class.
D Effective January 1, 2001, the fund adopted the provisions of the AICPA Audit and Accounting Guide for Investment Companies and began
amortizing premium and discount on all debt securities. Per share data and ratios for periods prior to adoption have not been restated to reflect
this change.
E Amount represents less than $.001 per share.
|
See accompanying notes which are an integral part of the financial statements.
43 Annual Report
| Financial Highlights Institutional Class | | | | | | | | | | | | |
| |
| Years ended December 31, | | | | 2005 | | | | 2004 | | | | 2003E |
| Selected Per Share Data | | | | | | | | | | | | |
| Net asset value, beginning of period | | | | $ 10.38 | | | | $ 10.49 | | | | $ 10.49 |
| Income from Investment Operations | | | | | | | | | | | | |
| Net investment incomeD | | | | 283 | | | | .265 | | | | .125 |
| Net realized and unrealized gain (loss) | | | | (.176) | | | | (.088) | | | | .059 |
| Total from investment operations | | | | 107 | | | | .177 | | | | .184 |
| Distributions from net investment income | | | | (.284) | | | | (.268) | | | | (.119) |
| Distributions from net realized gain | | | | (.003) | | | | (.019) | | | | (.065) |
| Total distributions | | | | (.287) | | | | (.287) | | | | (.184) |
| Redemption fees added to paid in capitalD,G | | | | — | | | | — | | | | — |
| Net asset value, end of period | | | | $ 10.20 | | | | $ 10.38 | | | | $ 10.49 |
| Total ReturnB,C | | | | 1.05% | | | | 1.71% | | | | 1.77% |
| Ratios to Average Net AssetsF | | | | | | | | | | | | |
| Expenses before reductions | | | | 49% | | | | .49% | | | | .48%A |
| Expenses net of fee waivers, if any | | | | 49% | | | | .49% | | | | .48%A |
| Expenses net of all reductions | | | | 42% | | | | .48% | | | | .47%A |
| Net investment income | | | | 2.77% | | | | 2.57% | | | | 2.69%A |
| Supplemental Data | | | | | | | | | | | | |
| Net assets, end of period (000 omitted) | | | | $ 2,625 | | | | $ 1,253 | | | | $ 414 |
| Portfolio turnover rate | | | | 27% | | | | 45% | | | | 34% |
A Annualized
B Total returns for periods of less than one year are not annualized.
C Total returns would have been lower had certain expenses not been reduced during the periods shown.
D Calculated based on average shares outstanding during the period.
E For the period July 23, 2003 (commencement of sale of shares) to December 31, 2003.
F Expense ratios reflect operating expenses of the class. Expenses before reductions do not reflect amounts reimbursed by the investment adviser or
expense offset arrangements and do not represent the amount paid by the class during periods when reimbursements or reductions occur. Expense
ratios before reductions for start up periods may not be representative of longer term operating periods. Expenses net of fee waivers reflect
expenses after reimbursement by the investment adviser but prior to reductions from expense offset arrangements. Expenses net of all reductions
represent the net expenses paid by the class.
G Amount represents less than $.001 per share.
|
See accompanying notes which are an integral part of the financial statements.
Notes to Financial Statements
For the period ended December 31, 2005
(Amounts in thousands except ratios)
|
1. Significant Accounting Policies.
Fidelity Short Intermediate Municipal Income Fund (the fund) is a fund of Fidelity Municipal Trust (the trust) and is authorized to issue an unlimited number of shares. On July 21, 2005, the Board of Trustees approved a change in the name of Spartan Short Intermediate Municipal Income Fund to Fidelity Short Intermediate Municipal Income Fund effective August 15, 2005. The trust is registered under the Investment Company Act of 1940, as amended (the 1940 Act), as an open end management investment company organized as a Massachusetts business trust.
The fund offers Class A, Class T, Class B, Class C, Short Intermediate Municipal Income and Institutional Class shares, each of which has equal rights as to assets and voting privileges. Each class has exclusive voting rights with respect to matters that affect that class. Class B shares will automatically convert to Class A shares after a holding period of four years from the initial date of purchase. Investment income, realized and unrealized capital gains and losses, the common expenses of the fund, and certain fund level expense reductions, if any, are allocated on a pro rata basis to each class based on the relative net assets of each class to the total net assets of the fund. Each class differs with respect to transfer agent and distribution and service plan fees incurred. Certain ex pense reductions also differ by class.
The fund may invest in affiliated money market central funds (Money Market Central Funds), which are open end investment companies available to investment companies and other accounts managed by Fidelity Management & Research Company (FMR) and its affiliates. The financial statements have been prepared in conformity with accounting principles generally accepted in the United States of America, which require manage ment to make certain estimates and assumptions at the date of the financial statements. The following summarizes the significant accounting policies of the fund:
Security Valuation. Investments are valued and net asset value per share is calculated (NAV calculation) as of the close of business of the New York Stock Exchange, normally 4:00 p.m. Eastern time. Wherever possible, the fund uses independent pricing services approved by the Board of Trustees to value its investments. Debt securities, including restricted securities, for which quotes are readily available, are valued by independent pricing services or by dealers who make markets in such securities. Pricing services consider yield or price of bonds of comparable quality, coupon, maturity and type as well as dealer supplied prices. When current market prices or quotations are not readily available or do not accurately reflect fair value, valuations may be determined in accor dance with procedures adopted by the Board of Trustees. The frequency of when fair value pricing is used is unpredictable. The value of securities used for NAV calculation under fair value pricing may differ from published prices for the same securities.
45 Annual Report
| Notes to Financial Statements continued |
| (Amounts in thousands except ratios) | | |
1. Significant Accounting Policies continued |
Security Valuation continued | | |
Investments in open end mutual funds are valued at their closing net asset value each business day. Short term securities with remaining maturities of sixty days or less for which quotations are not readily available are valued at amortized cost, which approxi mates value.
Investment Transactions and Income. Security transactions are accounted for as of trade date. Gains and losses on securities sold are determined on the basis of identified cost. Interest income is accrued as earned. Interest income includes coupon interest and amortization of premium and accretion of discount on debt securities.
Expenses. Most expenses of the trust can be directly attributed to a fund. Expenses which cannot be directly attributed are apportioned among each fund in the trust.
Income Tax Information and Distributions to Shareholders. Each year, the fund intends to qualify as a regulated investment company by distributing all of its taxable income and realized gains under Subchapter M of the Internal Revenue Code. As a result, no provision for income taxes is required in the accompanying financial statements.
Dividends are declared daily and paid monthly from net investment income. Distribu tions from realized gains, if any, are recorded on the ex dividend date. Income dividends and capital gain distributions are declared separately for each class. Income and capital gain distributions are determined in accordance with income tax regulations, which may differ from generally accepted accounting principles. In addition, the fund will claim a portion of the payment made to redeeming shareholders as a distribution for income tax purposes.
Capital accounts within the financial statements are adjusted for permanent book tax differences. These adjustments have no impact on net assets or the results of operations. Temporary book tax differences will reverse in a subsequent period.
Book tax differences are primarily due to market discount, deferred trustees compensa tion, capital loss carryforwards and losses deferred due to excise tax regulations.
The fund purchases municipal securities whose interest, in the opinion of the issuer, is free from federal income tax. There is no assurance that the Internal Revenue Service (IRS) will agree with this opinion. In the event the IRS determines that the issuer does not comply with relevant tax requirements, interest payments from a security could become federally taxable, possibly retroactively to the date the security was issued.
| 1. Significant Accounting Policies continued | | |
Income Tax Information and Distributions to Shareholders continued |
The tax basis components of distributable earnings and the federal tax cost as of period end were as follows:
| Unrealized appreciation | | $ | | 6,805 | | | | |
| Unrealized depreciation | | | | (15,785) | | | | |
| Net unrealized appreciation (depreciation) | | | | (8,980) | | | | |
| Capital loss carryforward | | | | (699) | | | | |
| |
| Cost for federal income tax purposes | | $ | | 1,716,088 | | | | |
| |
| The tax character of distributions paid was as follows: | | | | |
| |
| | | | | December 31, 2005 | | | | December 31, 2004 |
| Tax exempt Income | | $ | | 51,341 | | $ | | 47,598 |
| Long term Capital Gains | | | | 549 | | | | 3,486 |
| Total | | $ | | 51,890 | | $ | | 51,084 |
Short Term Trading (Redemption) Fees. Shares held in the fund less than 30 days are subject to a redemption fee equal to .50% of the proceeds of the redeemed shares. All redemption fees, including any estimated redemption fees paid by FMR, are retained by the fund and accounted for as an addition to paid in capital.
Delayed Delivery Transactions and When Issued Securities. The fund may purchase or sell securities on a delayed delivery or when issued basis. Payment and delivery may take place after the customary settlement period for that security. The price of the underlying securities and the date when the securities will be delivered and paid for are fixed at the time the transaction is negotiated. During the time a delayed delivery sell is outstanding, the contract is marked to market daily and equivalent deliverable securities are held for the transaction. The value of the securities purchased on a delayed delivery or when issued basis are identified as such in the fund’s Schedule of Investments. The fund may receive compensation for interest forgone in the purchase of a delayed delivery or when issued security. With respect to purchase commitments, the fund identifies securities as segregated in its records with a value at least equal to the amount of the commitment. Losses may arise due to changes in the value of the underlying securities or if the counterparty does not perform under the contract’s terms, or if the issuer does not issue the securities due to political, economic, or other factors.
47 Annual Report
| Notes to Financial Statements continued |
| (Amounts in thousands except ratios) |
| |
| 2. Operating Policies continued |
Restricted Securities. The fund may invest in securities that are subject to legal or contractual restrictions on resale. These securities generally may be resold in transac tions exempt from registration or to the public if the securities are registered. Disposal of these securities may involve time consuming negotiations and expense, and prompt sale at an acceptable price may be difficult. Information regarding restricted securities is included at the end of the fund’s Schedule of Investments.
3. Purchases and Sales of Investments.
Purchases and sales of securities, other than short term securities and U.S. government securities, aggregated $492,046 and $656,962, respectively.
4. Fees and Other Transactions with Affiliates.
Management Fee. FMR and its affiliates provide the fund with investment manage ment related services for which the fund pays a monthly management fee. The manage ment fee is the sum of an individual fund fee rate that is based on an annual rate of .25% of the fund’s average net assets and a group fee rate that averaged .12% during the period. The group fee rate is based upon the average net assets of all the mutual funds advised by FMR. The group fee rate decreases as assets under management increase and increases as assets under management decrease. For the period, the total annual man agement fee rate was ..37% of the fund’s average net assets.
Distribution and Service Plan. In accordance with Rule 12b 1 of the 1940 Act, the fund has adopted separate Distribution and Service Plans for each class of shares. Certain classes pay Fidelity Distributors Corporation (FDC), an affiliate of FMR, separate Distribu tion and Service Fees, each of which is based on an annual percentage of each class’ average net assets. In addition, FDC may pay financial intermediaries for selling shares of the fund and providing shareholder support services. For the period, the Distribution and Service Fee rates and the total amounts paid to and retained by FDC were as follows:
| | | Distribution | | Service | | | | Paid to | | | | Retained |
| | | Fee | | Fee | | | | FDC | | | | by FDC |
| Class A | | 0% | | .15% | | | $ | 18 | | | $ | — |
| Class T | | 0% | | .25% | | | | 47 | | | | 1 |
| Class B | | 65% | | .25% | | | | 33 | | | | 24 |
| Class C | | 75% | | .25% | | | | 112 | | | | 40 |
| | | | | | | | $ | 210 | | | $ | 65 |
Sales Load. FDC receives a front end sales charge of up to 3.75% for selling Class A shares, and 2.75% for selling Class T shares, some of which is paid to financial intermedi aries for selling shares of the fund. FDC receives the proceeds of contingent deferred sales charges levied on Class A, Class T, Class B, and Class C redemptions. These charges
| 4. Fees and Other Transactions with Affiliates continued |
Sales Load - continued | | |
depend on the holding period. The deferred sales charges range from 3% to 1% for Class B, 1% for Class C, and .25% for certain purchases of Class A and Class T shares.
| For the period, sales charge amounts retained by FDC were as follows: | | |
| |
| | | | | Retained |
| | | | | by FDC |
| Class A | | | $ | 7 |
| Class T | | | | 10 |
| Class B* | | | | 7 |
| Class C* | | | | 5 |
| | | | $ | 29 |
* When Class B and Class C shares are initially sold, FDC pays commissions from its own resources to financial intermediaries through which the sales are made.
Transfer Agent and Accounting Fees. Citibank, N.A. (Citibank) is the custodian, transfer agent, and shareholder servicing agent for the fund’s Class A, Class T, Class B, Class C, Short Intermediate Municipal Income and Institutional Class shares. Citibank has entered into a sub arrangement with Fidelity Investments Institutional Operations Company, Inc. (FIIOC), an affiliate of FMR, with respect to all classes of the fund, except for Short Intermediate Municipal Income, to perform the transfer, dividend disbursing, and shareholder servicing agent functions. Citibank has also entered into a sub arrange ment with Fidelity Service Company, Inc. (FSC), an affiliate of FMR, with respect to Short Intermediate Municipal Income, to perform the transfer, dividend disbursing, and shareholder servicing agent functions. FIIOC and FSC receive account fees and asset based fees that vary according to the account size and type of account of the shareholders of the respective classes of the fund. All fees are paid to FIIOC by Citibank, which is reimbursed by each class for such payments. FIIOC and FSC pay for typesetting, printing and mailing of shareholder reports, except proxy statements. For the period, each class paid the following transfer agent fees:
| | | | | | | | | % of |
| | | | | | | | | Average |
| | | | | | | Amount | | Net Assets |
| Class A | | | | | $ | 11 | | .09 |
| Class T | | | | | | 19 | | .10 |
| Class B | | | | | | 4 | | .10 |
| Class C | | | | | | 12 | | .11 |
| Short Intermediate Municipal Income | | | | | | 1,454 | | .08 |
| Institutional Class | | | | | | 1 | | .08 |
| | | | | | $ | 1,501 | | |
| |
| |
| |
| | | 49 | | | | | | Annual Report |
| Notes to Financial Statements continued | | |
| (Amounts in thousands except ratios) | | |
4. Fees and Other Transactions with Affiliates continued |
Transfer Agent and Accounting Fees continued | | |
Citibank also has a sub arrangement with FSC to maintain the fund’s accounting records. The fee is based on the level of average net assets for the month.
Affiliated Central Funds. The fund may invest in Money Market Central Funds which seek preservation of capital and current income and are managed by Fidelity Investments Money Management, Inc. (FIMM), an affiliate of FMR. The Money Market Central Funds do not pay a management fee.
5. Committed Line of Credit.
|
The fund participates with other funds managed by FMR in a $4.2 billion credit facility (the “line of credit”) to be utilized for temporary or emergency purposes to fund share holder redemptions or for other short term liquidity purposes. The fund has agreed to pay commitment fees on its pro rata portion of the line of credit. During the period, there were no borrowings on this line of credit.
Through arrangements with the fund’s custodian and each class’ transfer agent, credits realized as a result of uninvested cash balances were used to reduce the fund’s expenses. During the period, these credits reduced the fund’s custody and accounting expenses by $29 and $332, respectively. During the period, credits reduced each class’ transfer agent expense as noted in the table below.
| | | | | Transfer Agent |
| | | | | expense reduction |
| Class A | | | $ | 6 |
| Class T | | | | 9 |
| Class B | | | | 1 |
| Class C | | | | 5 |
| Short Intermediate Municipal Income | | | | 858 |
| Institutional Class | | | | 1 |
| | | | $ | 880 |
| |
| 7. Other. | | | | |
The fund’s organizational documents provide former and current trustees and officers with a limited indemnification against liabilities arising in connection with the performance of their duties to the fund. In the normal course of business, the fund may also enter into contracts that provide general indemnifications. The fund’s maximum exposure under these arrangements is unknown as this would be dependent on future claims that may be made against the fund. The risk of material loss from such claims is considered remote.
| 8. Distributions to Shareholders. | | | | | | | | | | |
| |
| Distributions to shareholders of each class were as follows: | | | | | | | | |
| |
| | | | | | | | | Years ended December 31, |
| | | | | | | | | 2005 | | | | 2004 |
| From net investment income | | | | | | | | | | | | |
| Class A | | | | | | | $ | 313 | | | $ | 303 |
| Class T | | | | | | | | 465 | | | | 403 |
| Class B | | | | | | | | 68 | | | | 58 |
| Class C | | | | | | | | 195 | | | | 160 |
| Short Intermediate Municipal Income | | | | | | | | 50,256 | | | | 46,653 |
| Institutional Class | | | | | | | | 44 | | | | 21 |
| Total | | | | | | | $ | 51,341 | | | $ | 47,598 |
| From net realized gain | | | | | | | | | | | | |
| Class A | | | | | | | $ | 4 | | | $ | 23 |
| Class T | | | | | | | | 6 | | | | 36 |
| Class B | | | | | | | | 1 | | | | 7 |
| Class C | | | | | | | | 3 | | | | 20 |
| Short Intermediate Municipal Income | | | | | | | | 534 | | | | 3,398 |
| Institutional Class | | | | | | | | 1 | | | | 2 |
| Total | | | | | | | $ | 549 | | $ | | 3,486 |
| |
| 9. Share Transactions. | | | | | | | | | | | | |
| |
| Transactions for each class of shares were as follows: | | | | | | | | |
| |
| | | Shares | | | | Dollars |
| | | Years ended December 31, | | | | Years ended December 31, |
| | | 2005 | | 2004 | | | | 2005 | | | | 2004 |
| Class A | | | | | | | | | | | | |
| Shares sold | | 684 | | 1,095 | | | $ | 6,996 | | | $ | 11,465 |
| Reinvestment of distributions | | 23 | | 24 | | | | 238 | | | | 253 |
| Shares redeemed | | (498) | | (785) | | | | (5,104) | | | | (8,128) |
| Net increase (decrease) | | 209 | | 334 | | | $ | 2,130 | | | $ | 3,590 |
| Class T | | | | | | | | | | | | |
| Shares sold | | 517 | | 1,569 | | | $ | 5,299 | | | $ | 16,393 |
| Reinvestment of distributions | | 34 | | 30 | | | | 351 | | | | 309 |
| Shares redeemed | | (1,028) | | (818) | | | | (10,531) | | | | (8,551) |
| Net increase (decrease) | | (477) | | 781 | | | $ | (4,881) | | | $ | 8,151 |
| Class B | | | | | | | | | | | | |
| Shares sold | | 65 | | 214 | | | $ | 661 | | | $ | 2,231 |
| Reinvestment of distributions | | 4 | | 4 | | | | 44 | | | | 42 |
| Shares redeemed | | (100) | | (84) | | | | (1,025) | | | | (870) |
| Net increase (decrease) | | (31) | | 134 | | | $ | (320) | | | $ | 1,403 |
| |
| |
| | | 51 | | | | | | | | Annual Report |
| Notes to Financial Statements continued | | | | | | | | |
| (Amounts in thousands except ratios) | | | | | | | | | | |
| |
| 9. Share Transactions - continued | | | | | | | | |
| |
| | | Shares | | | | Dollars |
| | | Years ended December 31, | | | | Years ended December 31, |
| | | 2005 | | 2004 | | | | 2005 | | | | 2004 |
| Class C | | | | | | | | | | | | |
| Shares sold | | 438 | | 658 | | | $ | 4,492 | | | $ | 6,848 |
| Reinvestment of distributions | | 11 | | 10 | | | | 116 | | | | 103 |
| Shares redeemed | | (541) | | (295) | | | | (5,552) | | | | (3,054) |
| Net increase (decrease) | | (92) | | 373 | | | $ | (944) | | | $ | 3,897 |
| Short Intermediate Municipal | | | | | | | | | | | | |
| Income | | | | | | | | | | | | |
| Shares sold | | 46,854 | | 75,115 | | | $ | 481,284 | | | $ | 784,282 |
| Reinvestment of distributions | | 3,476 | | 3,669 | | | | 35,648 | | | | 38,189 |
| Shares redeemed | | (64,556) | | (77,123) | | | | (661,741) | | | | (803,196) |
| Net increase (decrease) | | (14,226) | | 1,661 | | | $ | (144,809) | | | $ | 19,275 |
| Institutional Class | | | | | | | | | | | | |
| Shares sold | | 194 | | 110 | | | $ | 1,994 | | | $ | 1,153 |
| Reinvestment of distributions | | 2 | | 1 | | | | 18 | | | | 8 |
| Shares redeemed | | (60) | | (30) | | | | (615) | | | | (317) |
| Net increase (decrease) | | 136 | | 81 | | | $ | 1,397 | | | $ | 844 |
Report of Independent Registered Public Accounting Firm
To the Trustees of Fidelity Municipal Trust and the Shareholders of Fidelity Short Intermediate Municipal Income Fund (formerly Spartan Short Intermediate Municipal Income Fund):
In our opinion, the accompanying statement of assets and liabilities, including the schedule of investments, and the related statements of operations and of changes in net assets and the financial highlights present fairly, in all material respects, the financial position of Fidelity Short Intermediate Municipal Income Fund (formerly Spartan Short Intermediate Municipal Income Fund) (a fund of Fidelity Municipal Trust) at December 31, 2005 and the results of its operations, the changes in its net assets and the financial highlights for the periods indicated, in conformity with accounting principles generally accepted in the United States of America. These financial statements and financial highlights (hereafter referred to as “financial statements”) are the responsibility of the Fidelity Short Intermediate Municipal Income Fund’s management; our responsi bility is to express an opinion on these financial statements based on our audits. We conducted our audits of these financial statements in accordance with the standards of the Public Company Accounting Oversight Board (United States). Those standards require that we plan and perform the audit to obtain reasonable assurance about whether the financial statements are free of material misstatement. An audit includes examining, on a test basis, evidence supporting the amounts and disclosures in the financial state ments, assessing the accounting principles used and significant estimates made by management, and evaluating the overall financial statement presentation. We believe that our audits, which included confirmation of securities at December 31, 2005 by correspon dence with the custodian and brokers, provide a reasonable basis for our opinion.
/s/ PricewaterhouseCoopers LLP
PricewaterhouseCoopers LLP
Boston, Massachusetts
February 14, 2006
|
53 Annual Report
Trustees and Officers
The Trustees, Member of the Advisory Board, and executive officers of the trust and fund, as applicable, are listed below. The Board of Trustees governs the fund and is responsible for protecting the interests of shareholders. The Trustees are experienced executives who meet periodically throughout the year to oversee the fund’s activities, review contractual arrangements with companies that provide services to the fund, and review the fund’s performance. Except for William O. McCoy and Albert R. Gamper, Jr., each of the Trustees oversees 326 funds advised by FMR or an affiliate. Mr. McCoy oversees 328 funds advised by FMR or an affiliate. Mr. Gamper oversees 235 funds advised by FMR or an affiliate.
The Trustees hold office without limit in time except that (a) any Trustee may resign; (b) any Trustee may be removed by written instrument, signed by at least two thirds of the number of Trustees prior to such removal; (c) any Trustee who requests to be retired or who has become incapacitated by illness or injury may be retired by written instru ment signed by a majority of the other Trustees; and (d) any Trustee may be removed at any special meeting of shareholders by a two thirds vote of the outstanding voting securities of the trust. Each Trustee who is not an interested person (as defined in the 1940 Act) (Independent Trustee), shall retire not later than the last day of the calendar year in which his or her 72nd birthday occurs. The Independent Trustees may waive this mandatory retirement age policy with respect to individual Trustees. The executive officers and Advisory Board Member hold office without limit in time, except that any officer and Advisory Board Member may resign or may be removed by a vote of a majority of the Trustees at any regular meeting or any special meeting of the Trustees. Except as indicated, each individual has held the office shown or other offices in the same company for the past five years.
The fund’s Statement of Additional Information (SAI) includes more information about the Trustees. To request a free copy, call Fidelity at 1-877-208-0098.
Correspondence intended for each Trustee who is an interested person may be sent to Fidelity Investments, 82 Devonshire Street, Boston, Massachusetts 02109.
| | Name, Age; Principal Occupation
Edward C. Johnson 3d (75)
|
Year of Election or Appointment: 1984
Mr. Johnson is Chairman of the Board of Trustees. Mr. Johnson serves as Chief Executive Officer, Chairman, and a Director of FMR Corp.; a Director and Chairman of the Board and of the Executive Committee of FMR; Chairman and a Director of Fidelity Management & Research (Far East) Inc.; Chairman and a Director of Fidelity Investments Money Management, Inc.; and Chairman (2001 present) and a Director (2000 present) of FMR Co., Inc.
| | Name, Age; Principal Occupation
Stephen P. Jonas (52)
|
Year of Election or Appointment: 2005
Mr. Jonas is Senior Vice President of the fund (2005 present). He also serves as Senior Vice President of other Fidelity funds (2005 present). Mr. Jonas is Executive Director of FMR (2005 present). Previously, Mr. Jonas served as President of Fidelity Enterprise Operations and Risk Services (2004 2005), Chief Administrative Officer (2002 2004), and Chief Financial Officer of FMR Co. (1998 2000). Mr. Jonas has been with Fidelity Investments since 1987 and has held various financial and management positions including Chief Financial Officer of FMR. In addition, he serves on the Boards of Boston Ballet (2003 present) and Simmons College (2003 present).
Year of Election or Appointment: 2003
Mr. Reynolds is a Director (2003 present) and Chief Operating Officer (2002 present) of FMR Corp. He also serves on the Board at Fidelity Investments Canada, Ltd. (2000 present). Previously, Mr. Reynolds served as President of Fidelity Investments Institutional Retirement Group (1996 2000).
* Trustees have been determined to be “Interested Trustees” by virtue of, among other things, their affiliation with the trust or various entities under common control with FMR.
55 Annual Report
Trustees and Officers - continued
Independent Trustees:
Correspondence intended for each Independent Trustee (that is, the Trustees other than the Interested Trustees) may be sent to Fidelity Investments, P.O. Box 55235, Boston, Massachusetts 02205 5235.
| | Name, Age; Principal Occupation
Dennis J. Dirks (57)
|
Year of Election or Appointment: 2005
Prior to his retirement in May 2003, Mr. Dirks was Chief Operating Officer and a member of the Board of The Depository Trust & Clearing Corporation (DTCC) (1999 2003). He also served as President, Chief Operating Officer, and Board member of The Depository Trust Company (DTC) (1999 2003) and President and Board member of the National Securities Clearing Corporation (NSCC) (1999 2003). In addition, Mr. Dirks served as Chief Executive Officer and Board member of the Government Securities Clearing Corporation (2001 2003) and Chief Executive Officer and Board member of the Mortgage Backed Securities Clearing Corporation (2001 2003). Mr. Dirks also serves as a Trustee of Manhattan College (2005 present).
| | Albert R. Gamper, Jr. (63)
|
Year of Election or Appointment: 2006
Mr. Gamper also serves as a Trustee (2006 present) or Member of the Advisory Board (2005 present) of other investment companies advised by FMR. Prior to his retirement in December 2004, Mr. Gamper served as Chairman of the Board of CIT Group Inc. (commercial finance). During his tenure with CIT Group Inc. Mr. Gamper served in numerous senior management positions, including Chairman (1987 1989; 1999 2001; 2002 2004), Chief Executive Officer (1987 2004), and President (1989 2002). He currently serves as a member of the Board of Directors of Public Service Enterprise Group (utilities, 2001 present), Chairman of the Board of Governors, Rutgers University (2004 present), and Chairman of the Board of Saint Barnabas Health Care System.
Name, Age; Principal Occupation
Robert M. Gates (62)
|
Year of Election or Appointment: 1997
Dr. Gates is Chairman of the Independent Trustees (2006 present). Dr. Gates is President of Texas A&M University (2002 present). He was Director of the Central Intelligence Agency (CIA) from 1991 to 1993. From 1989 to 1991, Dr. Gates served as Assistant to the President of the United States and Deputy National Security Advisor. Dr. Gates is a Director of NACCO Industries, Inc. (mining and manufacturing), Parker Drilling Co., Inc. (drilling and rental tools for the energy industry, 2001 present), and Brinker International (restaurant management, 2003 present). Previously, Dr. Gates served as a Director of LucasVarity PLC (automotive components and diesel engines), a Director of TRW Inc. (automotive, space, defense, and information technology), and Dean of the George Bush School of Government and Public Service at Texas A&M University (1999 2001). Dr. Gates also is a Trustee of the Forum for International Policy.
Year of Election or Appointment: 2004
Dr. Heilmeier is Chairman Emeritus of Telcordia Technologies (commu nication software and systems), where prior to his retirement, he served as company Chairman and Chief Executive Officer. He currently serves on the Boards of Directors of The Mitre Corporation (systems engineer ing and information technology support for the government), and HRL Laboratories (private research and development, 2004 present). He is Chairman of the General Motors Science & Technology Advisory Board and a Life Fellow of the Institute of Electrical and Electronics Engineers (IEEE) (2000 present). Dr. Heilmeier is a member of the Defense Science Board and the National Security Agency Advisory Board. He is also a member of the National Academy of Engineering, the American Academy of Arts and Sciences, and the Board of Overseers of the School of Engineering and Applied Science of the University of Pennsylvania. Previously, Dr. Heilmeier served as a Director of TRW Inc. (automotive, space, defense, and information technology, 1992 2002), Compaq (1994 2002), Automatic Data Processing, Inc. (ADP) (technology based business outsourcing, 1995 2002), INET Technologies Inc. (telecommu nications network surveillance, 2001 2004), and Teletech Holdings (customer management services). He is the recipient of the 2005 Kyoto Prize in Advanced Technology for his invention of the liquid display.
57 Annual Report
Trustees and Officers - continued
| | Name, Age; Principal Occupation
Marie L. Knowles (59)
|
Year of Election or Appointment: 2001
Prior to Ms. Knowles’ retirement in June 2000, she served as Executive Vice President and Chief Financial Officer of Atlantic Richfield Company (ARCO) (diversified energy, 1996 2000). From 1993 to 1996, she was a Senior Vice President of ARCO and President of ARCO Transportation Company. She served as a Director of ARCO from 1996 to 1998. She currently serves as a Director of Phelps Dodge Corporation (copper mining and manufacturing) and McKesson Corporation (healthcare ser vice, 2002 present). Ms. Knowles is a Trustee of the Brookings Institution and the Catalina Island Conservancy and also serves as a member of the Advisory Board for the School of Engineering of the University of Southern California.
Year of Election or Appointment: 2000
Mr. Lautenbach has been a partner of Clayton, Dubilier & Rice, Inc. (private equity investment firm) since September 1998. Previously, Mr. Lautenbach was with the International Business Machines Corpora tion (IBM) from 1968 until his retirement in 1998. Mr. Lautenbach serves as a Director of Italtel Holding S.p.A. (telecommunications (Milan, Italy), 2004 present) and Eaton Corporation (diversified industrial) as well as the Philharmonic Center for the Arts in Naples, Florida. He also is a member of the Board of Trustees of Fairfield University (2005 present), as well as a member of the Council on Foreign Relations.
Year of Election or Appointment: 1997
Prior to his retirement in December 1994, Mr. McCoy was Vice Chair man of the Board of BellSouth Corporation (telecommunications) and President of BellSouth Enterprises. He is currently a Director of Liberty Corporation (holding company), Duke Realty Corporation (real estate), and Progress Energy, Inc. (electric utility). He is also a partner of Frank lin Street Partners (private investment management firm) and a member of the Research Triangle Foundation Board. In addition, Mr. McCoy served as the Interim Chancellor (1999 2000) and a member of the Board of Visitors for the University of North Carolina at Chapel Hill and currently serves on the Board of Directors of the University of North Carolina Health Care System and the Board of Visitors of the Kenan Flagler Business School (University of North Carolina at Chapel Hill). He also served as Vice President of Finance for the University of North Carolina (16 school system).
Name, Age; Principal Occupation
Cornelia M. Small (61)
|
Year of Election or Appointment: 2005
Ms. Small is a member (2000 present) and Chairperson (2002 present) of the Investment Committee, and a member (2002 present) of the Board of Trustees of Smith College. Previously, she served as Chief Investment Officer (1999 2000), Director of Global Equity Investments (1996 1999), and a member of the Board of Directors of Scudder, Stevens & Clark (1990 1997) and Scudder Kemper Investments (1997 1998). In addition, Ms. Small served as Co Chair (2000 2003) of the Annual Fund for the Fletcher School of Law and Diplomacy.
William S. Stavropoulos (66)
|
Year of Election or Appointment: 2002
Mr. Stavropoulos is Chairman of the Board (2000 present) and a Member of the Board of Directors of The Dow Chemical Company. Since joining The Dow Chemical Company in 1967, Mr. Stavropoulos served in numerous senior management positions, including President (1993 2000; 2002 2003), CEO (1995 2000; 2002 2004), and Chair man of the Executive Committee (2000 2004). Currently, he is a Direc tor of NCR Corporation (data warehousing and technology solutions), BellSouth Corporation (telecommunications), Chemical Financial Corporation, Maersk Inc. (industrial conglomerate, 2002 present), and Metalmark Capital (private equity investment firm, 2005 present). He also serves as a member of the Board of Trustees of the American Enter prise Institute for Public Policy Research. In addition, Mr. Stavropoulos is a member of The Business Council, J.P. Morgan International Council and the University of Notre Dame Advisory Council for the College of Science.
Year of Election or Appointment: 2005
Prior to his retirement in 2001, Mr. Wolfe was Chairman and Chief Executive Officer of Hershey Foods Corporation (1993 2001). He cur rently serves as a member of the boards of Adelphia Communications Corporation (2003 present), Bausch & Lomb, Inc., and Revlon Inc. (2004 present).
59 Annual Report
Trustees and Officers - continued
Advisory Board Member and Executive Officers:
Correspondence intended for each executive officer and Mr. Lynch may be sent to Fidelity Investments, 82 Devonshire Street, Boston, Massachusetts 02109.
| | Name, Age; Principal Occupation
Peter S. Lynch (61)
|
Year of Election or Appointment: 2003
Member of the Advisory Board of Fidelity Municipal Trust. Vice Chair man and a Director of FMR, and Vice Chairman (2001 present) and a Director (2000 present) of FMR Co., Inc. Previously, Mr. Lynch served as a Trustee of the Fidelity funds (1990 2003). In addition, he serves as a Trustee of Boston College, Massachusetts Eye & Ear Infirmary, Historic Deerfield, John F. Kennedy Library, and the Museum of Fine Arts of Boston.
Year of Election or Appointment: 2005
Vice President of the fund. Mr. Donovan also serves as Vice President of Fidelity’s High Income Funds (2005 present), Fidelity’s Fixed Income Funds (2005 present), certain Asset Allocation Funds (2005 present), and certain Balanced Funds (2005 present). Mr. Donovan also serves as Executive Vice President of FMR (2005 present) and FMRC (2005 present). Previously, Mr. Donovan served as Vice President and Director of Fidelity’s International Equity Trading group (1998 2005).
Year of Election or Appointment: 2005
Vice President of the fund. Mr. Murphy also serves as Vice President of Fidelity’s Money Market Funds (2002 present), certain Asset Allocation Funds (2003 present), Fidelity’s Investment Grade Bond Funds (2005 present), and Fidelity’s Balanced Funds (2005 present). He serves as Senior Vice President (2000 present) and Head (2004 present) of the Fidelity Investments Fixed Income Division. Mr. Murphy is also a Senior Vice President of FIMM (2003 present) and a Vice President of FMR (2000 present). Previously, Mr. Murphy served as Money Market Group Leader (2002 2004), Bond Group Leader (2000 2002), and Vice President of Fidelity’s Taxable Bond Funds (2000 2002) and Fidelity’s Municipal Bond Funds (2001 2002). Mr. Murphy joined Fidelity Invest ments in 1989 as a portfolio manager in the Bond Group.
Name, Age; Principal Occupation
Thomas J. Silvia (44)
|
Year of Election or Appointment: 2005
Vice President of the fund. Mr. Silvia also serves as Vice President of Fidelity’s Bond Funds (2005 present), certain Balanced Funds (2005 present), certain Asset Allocation Funds (2005 present), and Senior Vice President and Bond Group Leader of the Fidelity Investments Fixed Income Division (2005 present). Previously, Mr. Silvia served as Director of Fidelity’s Taxable Bond portfolio managers (2002 2004) and a portfolio manager in the Bond Group (1997 2004).
Year of Election or Appointment: 2004
Vice President of the fund. Mr. Sommer also serves as Vice President of other funds advised by FMR. Prior to assuming his current responsibi lities, Mr. Sommer worked as an analyst and manager.
Year of Election or Appointment: 1998
Secretary of the fund. He also serves as Secretary of other Fidelity funds; Vice President, General Counsel, and Secretary of FMR Co., Inc. (2001 present) and FMR; Assistant Secretary of Fidelity Management & Research (U.K.) Inc. (2001 present), Fidelity Management & Research (Far East) Inc. (2001 present), and Fidelity Investments Money Manage ment, Inc. (2001 present). Mr. Roiter is an Adjunct Member, Faculty of Law, at Boston College Law School (2003 present). Previously, Mr. Roiter served as Vice President and Secretary of Fidelity Distributors Corpora tion (FDC) (1998 2005).
Year of Election or Appointment: 2003
Assistant Secretary of the fund. Mr. Fross also serves as Assistant Secre tary of other Fidelity funds (2003 present), Vice President and Secretary of FDC (2005 present), and is an employee of FMR.
Year of Election or Appointment: 2004
President, Treasurer, and Anti Money Laundering (AML) officer of the fund. Ms. Reynolds also serves as President, Treasurer, and AML officer of other Fidelity funds (2004) and is a Vice President (2003) and an employee (2002) of FMR. Before joining Fidelity Investments, Ms. Reynolds worked at PricewaterhouseCoopers LLP (PwC) (1980 2002), where she was most recently an audit partner with PwC’s investment management practice.
61 Annual Report
Trustees and Officers - continued
| | Name, Age; Principal Occupation
Paul M. Murphy (58)
|
Year of Election or Appointment: 2005
Chief Financial Officer of the fund. Mr. Murphy also serves as Chief Financial Officer of other Fidelity funds (2005 present). He also serves as Senior Vice President of Fidelity Pricing and Cash Management Services Group (FPCMS).
| | Kenneth A. Rathgeber (58)
|
Year of Election or Appointment: 2004
Chief Compliance Officer of the fund. Mr. Rathgeber also serves as Chief Compliance Officer of other Fidelity funds (2004) and Executive Vice President of Risk Oversight for Fidelity Investments (2002). Previously, he served as Executive Vice President and Chief Operating Officer for Fidelity Investments Institutional Services Company, Inc. (1998 2002).
Year of Election or Appointment: 2003
Deputy Treasurer of the fund. Mr. Hebble also serves as Deputy Treasurer of other Fidelity funds (2003), and is an employee of FMR. Before join ing Fidelity Investments, Mr. Hebble worked at Deutsche Asset Manage ment where he served as Director of Fund Accounting (2002 2003) and Assistant Treasurer of the Scudder Funds (1998 2003).
Year of Election or Appointment: 2005
Deputy Treasurer of the fund. Mr. Mehrmann also serves as Deputy Treasurer of other Fidelity funds (2005 present) and is an employee of FMR. Previously, Mr. Mehrmann served as Vice President of Fidelity Investments Institutional Services Group (FIIS)/Fidelity Investments Institutional Operations Corporation, Inc. (FIIOC) Client Services (1998 2004).
| | Kimberley H. Monasterio (42)
|
Year of Election or Appointment: 2004
Deputy Treasurer of the fund. Ms. Monasterio also serves as Deputy Treasurer of other Fidelity funds (2004) and is an employee of FMR (2004). Before joining Fidelity Investments, Ms. Monasterio served as Treasurer (2000 2004) and Chief Financial Officer (2002 2004) of the Franklin Templeton Funds and Senior Vice President of Franklin Temple ton Services, LLC (2000 2004).
Name, Age; Principal Occupation
Kenneth B. Robins (36)
|
Year of Election or Appointment: 2005
Deputy Treasurer of the fund. Mr. Robins also serves as Deputy Treasurer of other Fidelity funds (2005 present) and is an employee of FMR (2004 present). Before joining Fidelity Investments, Mr. Robins worked at KPMG LLP, where he was a partner in KPMG’s department of profes sional practice (2002 2004) and a Senior Manager (1999 2000). In addition, Mr. Robins served as Assistant Chief Accountant, United States Securities and Exchange Commission (2000 2002).
Year of Election or Appointment: 2005
Assistant Treasurer of the fund. Mr. Byrnes also serves as Assistant Trea surer of other Fidelity funds (2005 present) and is an employee of FMR (2005 present). Previously, Mr. Byrnes served as Vice President of FPCMS (2003 2005). Before joining Fidelity Investments, Mr. Byrnes worked at Deutsche Asset Management where he served as Vice Presi dent of the Investment Operations Group (2000 2003).
Year of Election or Appointment: 1986
Assistant Treasurer of the fund. Mr. Costello also serves as Assistant Treasurer of other Fidelity funds and is an employee of FMR.
Year of Election or Appointment: 2004
Assistant Treasurer of the fund. Mr. Lydecker also serves as Assistant Treasurer of other Fidelity funds (2004) and is an employee of FMR.
Year of Election or Appointment: 2002
Assistant Treasurer of the fund. Mr. Osterheld also serves as Assistant Treasurer of other Fidelity funds (2002) and is an employee of FMR.
Year of Election or Appointment: 2005
Assistant Treasurer of the fund. Mr. Ryan also serves as Assistant Trea surer of other Fidelity funds (2005 present) and is an employee of FMR (2005 present). Previously, Mr. Ryan served as Vice President of Fund Reporting in FPCMS (1999 2005).
63 Annual Report
Trustees and Officers - continued
| | Name, Age; Principal Occupation
Salvatore Schiavone (40)
|
Year of Election or Appointment: 2005
Assistant Treasurer of the fund. Mr. Schiavone also serves as Assistant Treasurer of other Fidelity funds (2005 present) and is an employee of FMR (2005 present). Before joining Fidelity Investments, Mr. Schiavone worked at Deutsche Asset Management, where he most recently served as Assistant Treasurer (2003 2005) of the Scudder Funds and Vice Pres ident and Head of Fund Reporting (1996 2003).
During fiscal year ended 2005, 100% of the fund’s income dividends was free from federal income tax, and 9.66% of the fund’s income dividends was subject to the federal alternative minimum tax.
The fund will notify shareholders in January 2006 of amounts for use in preparing 2005 income tax returns.
65 Annual Report
Proxy Voting Results
A special meeting of the fund’s shareholders was held on January 18, 2006. The results of votes taken among shareholders on the proposal before them are reported below. Each vote reported represents one dollar of net asset value held on the record date for the meeting.
| PROPOSAL 1 | | | | |
| To elect a Board of Trustees.A | | |
| | | # of | | % of |
| | | Votes | | Votes |
| |
| Dennis J. Dirks | | | | |
| Affirmative | | 4,012,578,790.76 | | 95.238 |
| Withheld | | 200,653,306.55 | | 4.762 |
| TOTAL | | 4,213,232,097.31 | | 100.000 |
| Albert R. Gamper, Jr. | | |
| Affirmative | | 4,015,643,707.84 | | 95.310 |
| Withheld | | 197,588,389.47 | | 4.690 |
| TOTAL | | 4,213,232,097.31 | | 100.000 |
| Robert M. Gates | | |
| Affirmative | | 4,004,345,809.00 | | 95.042 |
| Withheld | | 208,886,288.31 | | 4.958 |
| TOTAL | | 4,213,232,097.31 | | 100.000 |
| George H. Heilmeier | | |
| Affirmative | | 4,008,127,523.93 | | 95.132 |
| Withheld | | 205,104,573.38 | | 4.868 |
| TOTAL | | 4,213,232,097.31 | | 100.000 |
| Abigail P. Johnson | | |
| Affirmative | | 3,993,175,527.66 | | 94.777 |
| Withheld | | 220,056,569.65 | | 5.223 |
| TOTAL | | 4,213,232,097.31 | | 100.000 |
| Edward C. Johnson 3d | | |
| Affirmative | | 3,987,333,615.26 | | 94.638 |
| Withheld | | 225,898,482.05 | | 5.362 |
| TOTAL | | 4,213,232,097.31 | | 100.000 |
| Stephen P. Jonas | | |
| Affirmative | | 4,010,007,680.52 | | 95.177 |
| Withheld | | 203,224,416.79 | | 4.823 |
| TOTAL | | 4,213,232,097.31 | | 100.000 |
| | | # of | | % of |
| | | Votes | | Votes |
| |
| Marie L. Knowles | | |
| Affirmative | | 4,010,231,303.96 | | 95.182 |
| Withheld | | 203,000,793.35 | | 4.818 |
| TOTAL | | 4,213,232,097.31 | | 100.000 |
| |
| Ned C. Lautenbach | | |
| Affirmative | | 4,009,136,177.44 | | 95.156 |
| Withheld | | 204,095,919.87 | | 4.844 |
| TOTAL | | 4,213,232,097.31 | | 100.000 |
| |
| William O. McCoy | | |
| Affirmative | | 4,001,996,735.35 | | 94.986 |
| Withheld | | 211,235,361.96 | | 5.014 |
| TOTAL | | 4,213,232,097.31 | | 100.000 |
| |
| Robert L. Reynolds | | |
| Affirmative | | 4,010,560,206.65 | | 95.190 |
| Withheld | | 202,671,890.66 | | 4.810 |
| TOTAL | | 4,213,232,097.31 | | 100.000 |
| |
| Cornelia M. Small | | |
| Affirmative | | 4,011,161,760.21 | | 95.204 |
| Withheld | | 202,070,337.10 | | 4.796 |
| TOTAL | | 4,213,232,097.31 | | 100.000 |
| |
| William S. Stavropoulos | | |
| Affirmative | | 4,001,217,912.57 | | 94.968 |
| Withheld | | 212,014,184.74 | | 5.032 |
| TOTAL | | 4,213,232,097.31 | | 100.000 |
| |
| Kenneth L. Wolfe | | |
| Affirmative | | 4,011,439,868.05 | | 95.211 |
| Withheld | | 201,792,229.26 | | 4.789 |
| TOTAL | | 4,213,232,097.31 | | 100.000 |
A Denotes trust-wide proposals and voting results.
Annual Report 66
67 Annual Report
Investment Adviser
Fidelity Management & Research Company
Boston, MA
Investment Sub Advisers
Fidelity Investments Money
Management, Inc.
Fidelity International Investment Advisors
Fidelity International Investment Advisors
(U.K.) Limited
General Distributor
Fidelity Distributors Corporation
Boston, MA
Transfer and Service Agents
Citibank, N.A.
New York, NY
Fidelity Investments Institutional
Operations Company, Inc.
Boston, MA
Custodian
Citibank, N.A.
New York, NY
|
ASTM-UANN-0206
1.796655.102
|


Fidelity Advisor
Short-Intermediate
Municipal Income
Fund - Institutional Class
|
| | Annual Report
December 31, 2005
|

Institutional Class is a class of Fidelity® Short Intermediate Municipal Income Fund
| Contents | | | | |
| |
| Chairman’s Message | | 4 | | Ned Johnson’s message to shareholders. |
| Performance | | 5 | | How the fund has done over time. |
| Management’s Discussion | | 7 | | The manager’s review of fund |
| | | | | performance, strategy and outlook. |
| Shareholder Expense | | 8 | | An example of shareholder expenses. |
| Example | | | | |
| Investment Changes | | 10 | | A summary of major shifts in the fund’s |
| | | | | investments over the past six months. |
| Investments | | 11 | | A complete list of the fund’s investments |
| | | | | with their market values. |
| Financial Statements | | 35 | | Statements of assets and liabilities, |
| | | | | operations, and changes in net assets, |
| | | | | as well as financial highlights. |
| Notes | | 45 | | Notes to the financial statements. |
| Report of Independent | | 53 | | |
| Registered Public | | | | |
| Accounting Firm | | | | |
| Trustees and Officers | | 54 | | |
| Distributions | | 65 | | |
| Proxy Voting Results | | 66 | | |
To view a fund’s proxy voting guidelines and proxy voting record for the 12 month period ended
June 30, visit www.fidelity.com/proxyvotingresults or visit the Securities and Exchange Commis
sion’s (SEC) web site at www.sec.gov. You may also call 1-877-208-0098 to request a free copy of
the proxy voting guidelines.
Standard & Poor’s, S&P and S&P 500 are registered service marks of The McGraw Hill Companies, Inc.
and have been licensed for use by Fidelity Distributors Corporation.
Other third party marks appearing herein are the property of their respective owners.
All other marks appearing herein are registered or unregistered trademarks or service marks of FMR
Corp. or an affiliated company.
|
This report and the financial statements contained herein are submitted for the general information
of the shareholders of the fund. This report is not authorized for distribution to prospective investors
in the fund unless preceded or accompanied by an effective prospectus.
A fund files its complete schedule of portfolio holdings with the SEC for the first and third
quarters of each fiscal year on Form N Q. Forms N Q are available on the SEC’s web site at
http://www.sec.gov. A fund’s Forms N Q may be reviewed and copied at the SEC’s Public Reference
Room in Washington, DC. Information regarding the operation of the SEC’s Public Reference
Room may be obtained by calling 1-800-SEC-0330. For a complete list of a fund’s portfolio hold
ings, view the most recent quarterly holdings report, semiannual report, or annual report on
Fidelity’s web site at http://www.advisor.fidelity.com.
NOT FDIC INSURED · MAY LOSE VALUE · NO BANK GUARANTEE
Neither the fund nor Fidelity Distributors Corporation is a bank.
|
3 Annual Report
Chairman’s Message
(photograph of Edward C. Johnson 3d)
Dear Shareholder:
During the past year or so, much has been reported about the mutual fund industry, and much of it has been more critical than I believe is warranted. Allegations that some companies have been less than forthright with their shareholders have cast a shadow on the entire industry. I continue to find these reports disturbing, and assert that they do not create an accurate picture of the industry overall. Therefore, I would like to remind every one where Fidelity stands on these issues. I will say two things specifically regarding allegations that some mutual fund companies were in violation of the Securities and Exchange Commission’s forward pricing rules or were involved in so called “market timing” activities.
First, Fidelity has no agreements that permit customers who buy fund shares after 4 p.m. to obtain the 4 p.m. price. This is not a new policy. This is not to say that some one could not deceive the company through fraudulent acts. However, we are extremely diligent in preventing fraud from occurring in this manner and in every other. But I underscore again that Fidelity has no so called “agreements” that sanction illegal practices.
Second, Fidelity continues to stand on record, as we have for years, in opposition to predatory short term trading that adversely affects shareholders in a mutual fund. Back in the 1980s, we initiated a fee which is returned to the fund and, therefore, to investors to discourage this activity. Further, we took the lead several years ago in developing a Fair Value Pricing Policy to prevent market timing on foreign securities in our funds. I am confident we will find other ways to make it more difficult for predatory traders to operate. However, this will only be achieved through close cooperation among regulators, legislators and the industry.
Yes, there have been unfortunate instances of unethical and illegal activity within the mutual fund industry from time to time. That is true of any industry. When this occurs, confessed or convicted offenders should be dealt with appropriately. But we are still concerned about the risk of over regulation and the quick application of simplistic solutions to intricate problems. Every system can be improved, and we support and applaud well thought out improvements by regulators, legislators and industry representatives that achieve the common goal of building and protecting the value of investors’ holdings.
For nearly 60 years, Fidelity has worked very hard to improve its products and service to justify your trust. When our family founded this company in 1946, we had only a few hundred customers. Today, we serve more than 18 million customers including individual investors and participants in retirement plans across America.
Let me close by saying that we do not take your trust in us for granted, and we realize that we must always work to improve all aspects of our service to you. In turn, we urge you to continue your active participation with your financial matters, so that your interests can be well served.
Best regards,
/s/ Edward C. Johnson 3d
Edward C. Johnson 3d
Annual Report 4
Performance: The Bottom Line
Average annual total return reflects the change in the value of an investment, assuming reinvestment of the class’ dividend income and capital gains (the profits earned upon the sale of securities that have grown in value) and assuming a constant rate of perfor mance each year. The $10,000 table and the fund’s returns do not reflect the deduction of taxes that a shareholder would pay on fund distributions or the redemption of fund shares. During periods of reimbursement by Fidelity, a fund’s total return will be greater than it would be had the reimbursement not occurred. How a fund did yesterday is no guarantee of how it will do tomorrow.
| Average Annual Total Returns | | | | | | |
| Periods ended December 31, 2005 | | Past 1 | | Past 5 | | Past 10 |
| | | year | | years | | years |
| Institutional ClassA | | 1.05% | | 3.58% | | 3.97% |
A The initial offering of Institutional Class shares took place on July 23, 2003. Returns prior to July 23, 2003 are those of Short Intermediate Municipal Income Fund, the original retail class of the fund.
Let’s say hypothetically that $10,000 was invested in Fidelity Advisor Short Intermediate Municipal Income Institutional Class on December 31, 1995. The chart shows how the value of your investment would have changed, and also shows how the Lehman Brothers® Municipal Bond Index performed over the same period.
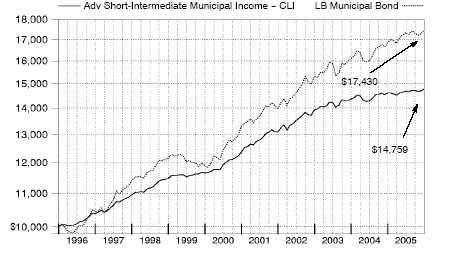
See Annual Report notes which are an integral part6of the financial statements.
Management’s Discussion of Fund Performance
Comments from Mark Sommer, Portfolio Manager of Fidelity Advisor Short Intermediate Municipal Income Fund
For the third consecutive year, the municipal bond market outperformed taxable bonds. The Lehman Brothers® Municipal Bond Index rose 3.51% for the year ending December 31, 2005. The taxable bond market, as measured by the Lehman Brothers Aggregate Bond Index, advanced 2.43% . Muni bonds were attractively valued relative to Treasuries, particu larly as tax free bond yields drew closer to those of high quality government bonds. Conse quently, the tax advantage of munis was compelling to such atypical investors in the asset class as hedge funds, corporations and taxable bond investors. The strong demand helped offset heavy issuance, particularly at the longer term end of the spectrum. The Federal Reserve Board raised short term interest rates eight times during the year, but long term rates remained persistently low, making the cost of borrowing more affordable for muni issuers. Still, absolute returns finished well below their historical averages. In addition to the rate hikes, surging energy prices pushed inflation higher, a condition further exacer bated by the damage to energy production facilities caused by Hurricane Katrina.
The fund’s Institutional Class shares returned 1.05% during the past year. By comparison, the LipperSM Short Intermediate Municipal Debt Funds Average gained 1.06% and the Lehman Brothers 1 6 Year Municipal Bond Index returned 1.02% . The biggest contributor to the fund’s performance relative to the Lehman Brothers index was my focus throughout much of the period on bonds with maturities in the six to eight year range, which outper formed securities in the two to five year segment that dominates the Lehman Brothers index. Security selection also was a plus, with Fidelity’s municipal bond research team helping me to avoid deteriorating credits. In addition, performance was helped by an overweighting relative to the index in lower quality investment grade munis, because they dramatically outpaced higher quality securities amid strong investor demand. That said, I believe the fund had less exposure to lower quality securities than many of its competitors, which may have cost it some ground. Similarly, performance likely was hurt by my shying away from below investment grade munis and tobacco bonds, both of which were among the market’s best performing segments and where I suspect my competitors had more exposure.
Throughout the period, I kept the fund’s overall interest rate sensitivity in line with the Lehman Brothers index. This strategy had no material impact on the fund’s performance relative to the index.
The views expressed in this statement reflect those of the portfolio manager only through the end of the period of the report as stated on the cover and do not necessarily represent the views of Fidelity or any other person in the Fidelity organization. Any such views are subject to change at any time based upon market or other conditions and Fidelity disclaims any responsibility to update such views. These views may not be relied on as investment advice and, because investment decisions for a Fidelity fund are based on numerous factors, may not be relied on as an indication of trading intent on behalf of any Fidelity fund.
Shareholder Expense Example
As a shareholder of the Fund, you incur two types of costs: (1) transaction costs, including sales charges (loads) on purchase payments or redemption proceeds, redemption fees, and (2) ongoing costs, including management fees, distribution and/or service (12b 1) fees and other Fund expenses. This Example is intended to help you understand your ongoing costs (in dollars) of investing in the Fund and to compare these costs with the ongoing costs of investing in other mutual funds.
The Example is based on an investment of $1,000 invested at the beginning of the period and held for the entire period (July 1, 2005 to December 31, 2005).
The first line of the table below for each class of the Fund provides information about actual account values and actual expenses. You may use the information in this line, together with the amount you invested, to estimate the expenses that you paid over the period. Simply divide your account value by $1,000.00 (for example, an $8,600 account value divided by $1,000.00 = 8.6), then multiply the result by the number in the first line for a class of the Fund under the heading entitled “Expenses Paid During Period” to estimate the expenses you paid on your account during this period.
Hypothetical Example for Comparison Purposes
The second line of the table below for each class of the Fund provides information about hypothetical account values and hypothetical expenses based on a Class’ actual expense ratio and an assumed rate of return of 5% per year before expenses, which is not the Class’ actual return. The hypothetical account values and expenses may not be used to estimate the actual ending account balance or expenses you paid for the period. You may use this information to compare the ongoing costs of investing in the Fund and other funds. To do so, compare this 5% hypothetical example with the 5% hypothetical examples that appear in the shareholder reports of the other funds.
Please note that the expenses shown in the table are meant to highlight your ongoing costs only and do not reflect any transaction costs. Therefore, the second line of the table is useful in comparing ongoing costs only, and will not help you determine the relative total costs of owning different funds. In addition, if these transactional costs were included, your costs would have been higher.
| | | | | | | | | | | | | Expenses Paid |
| | | | | | | | | | | | | During Period* |
| | | | | Beginning | | Ending | | | | July 1, 2005 |
| | | | | Account Value | | Account Value | | | | to December 31, |
| | | | | July 1, 2005 | | December 31, 2005 | | | | 2005 |
| Class A | | | | | | | | | | | | |
| Actual | | | $ | 1,000.00 | | $ | | 1,003.60 | | | $ | 3.23 |
| HypotheticalA | | | $ | 1,000.00 | | $ | | 1,021.98 | | | $ | 3.26 |
| Class T | | | | | | | | | | | | |
| Actual | | | $ | 1,000.00 | | $ | | 1,003.10 | | | $ | 3.74 |
| HypotheticalA | | | $ | 1,000.00 | | $ | | 1,021.48 | | | $ | 3.77 |
| Class B | | | | | | | | | | | | |
| Actual | | | $ | 1,000.00 | | $ | | 999.80 | | | $ | 7.01 |
| HypotheticalA | | | $ | 1,000.00 | | $ | | 1,018.20 | | | $ | 7.07 |
| Class C | | | | | | | | | | | | |
| Actual | | | $ | 1,000.00 | | $ | | 999.20 | | | $ | 7.61 |
| HypotheticalA | | | $ | 1,000.00 | | $ | | 1,017.59 | | | $ | 7.68 |
| Short Intermediate Municipal | | | | | | | | | | | | |
| Income | | | | | | | | | | | | |
| Actual | | | $ | 1,000.00 | | $ | | 1,004.40 | | | $ | 2.43 |
| HypotheticalA | | | $ | 1,000.00 | | $ | | 1,022.79 | | | $ | 2.45 |
| Institutional Class | | | | | | | | | | | | |
| Actual | | | $ | 1,000.00 | | $ | | 1,004.40 | | | $ | 2.48 |
| HypotheticalA | | | $ | 1,000.00 | | $ | | 1,022.74 | | | $ | 2.50 |
A 5% return per year before expenses | | | | | | | | |
* Expenses are equal to each Class’ annualized expense ratio (shown in the table below); multiplied by the average account value over the period, multiplied by 184/365 (to reflect the one half year period).
| | | Annualized |
| | | Expense Ratio |
| Class A | | 64% |
| Class T | | 74% |
| Class B | | 1.39% |
| Class C | | 1.51% |
| Short Intermediate Municipal Income | | 48% |
| Institutional Class | | 49% |
9 Annual Report
| Investment Changes | | | | |
| |
| Top Five States as of December 31, 2005 | | | | |
| | | % of fund’s | | % of fund’s net assets |
| | | net assets | | 6 months ago |
| Texas | | 14.7 | | 14.4 |
| New York | | 11.8 | | 8.5 |
| Illinois | | 9.4 | | 9.3 |
| California | | 7.6 | | 8.1 |
| New Jersey | | 6.9 | | 4.5 |
Top Five Sectors as of December 31, 2005 | | |
| | | % of fund’s | | % of fund’s net assets |
| | | net assets | | 6 months ago |
| General Obligations | | 49.1 | | 45.1 |
| Electric Utilities | | 13.8 | | 14.0 |
| Escrowed/Pre Refunded | | 8.2 | | 8.1 |
| Transportation | | 6.7 | | 6.6 |
| Health Care | | 6.5 | | 5.9 |
Average Years to Maturity as of December 31, 2005 | | |
| | | | | 6 months ago |
| Years | | 3.5 | | 3.4 |
Average years to maturity is based on the average time remaining to the stated maturity date of each bond, weighted by the market value of each bond.
| Duration as of December 31, 2005 | | | | |
| | | | | | | 6 months ago |
| Years | | | | 3.0 | | 2.9 |
Duration shows how much a bond fund’s price fluctuates with changes in comparable interest rates. If rates rise 1%, for example, a fund with a five year duration is likely to lose about 5% of its value. Other factors also can influence a bond fund’s performance and share price. Accordingly, a bond fund’s actual performance may differ from this example.
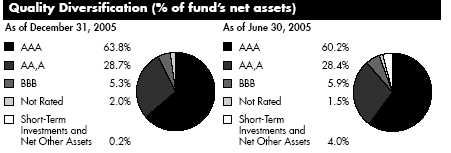
We have used ratings from Moody’s® Investors Services, Inc. Where Moody’s ratings are not available, we have used S&P® ratings.
Annual Report 10
Investments December 31, 2005
| Showing Percentage of Net Assets | | | | | | | | |
| Municipal Bonds 99.8% | | | | | | | | |
| | | Principal | | Value (Note 1) |
| | | Amount (000s) | | (000s) |
| Alabama – 2.3% | | | | | | | | |
| Birmingham Baptist Med. Ctrs. Spl. Care Facilities Fing. | | | | | | | | |
| Auth. Rev. (Baptist Health Sys., Inc. Proj.) Series A, 5% | | | | | | | | |
| 11/15/09 | | $ | | 1,100 | | $ | | 1,140 |
| Huntsville Solid Waste Disp. Auth. & Resource Recovery | | | | | | | | |
| �� Rev.: | | | | | | | | |
| 5.25% 10/1/07 (MBIA Insured) (c) | | | | 1,750 | | | | 1,783 |
| 5.25% 10/1/08 (MBIA Insured) (c) | | | | 2,900 | | | | 2,998 |
| 5.75% 10/1/09 (MBIA Insured) (c) | | | | 4,000 | | | | 4,243 |
| Jefferson County Ltd. Oblig. School Warrants Series A, | | | | | | | | |
| 5% 1/1/07 | | | | 2,210 | | | | 2,244 |
| Jefferson County Swr. Rev.: | | | | | | | | |
| Series 1999 A, 5.75% 2/1/38 (Pre-Refunded to | | | | | | | | |
| 2/1/09 @ 101) (d) | | | | 5,000 | | | | 5,397 |
| Series A: | | | | | | | | |
| 5% 2/1/33 (Pre-Refunded to 2/1/09 @ 101) (d) | | | | 13,460 | | | | 14,176 |
| 5.5% 2/1/40 (Pre-Refunded to 2/1/11 @ 101) (d) | | | | 3,900 | | | | 4,294 |
| 5% 2/1/41 (Pre-Refunded to 8/1/12 @ 100) (d) | | | | 2,060 | | | | 2,215 |
| Mobile County Gen. Oblig. 5% 2/1/08 (MBIA Insured) . | | | | 1,475 | | | | 1,524 |
| | | | | | | | | 40,014 |
| |
| Alaska – 1.6% | | | | | | | | |
| Alaska Student Ln. Corp. Student Ln. Rev. Series A, | | | | | | | | |
| 5.85% 7/1/13 (AMBAC Insured) (c) | | | | 3,285 | | | | 3,544 |
| Anchorage Gen. Oblig. Series B, 5.75% 12/1/11 | | | | | | | | |
| (Pre-Refunded to 12/1/10 @ 100) (d) | | | | 2,500 | | | | 2,755 |
| North Slope Borough Gen. Oblig.: | | | | | | | | |
| Series 1996 B, 0% 6/30/07 (MBIA Insured) | | | | 3,100 | | | | 2,945 |
| Series A, 0% 6/30/07 (MBIA Insured) | | | | 5,000 | | | | 4,751 |
| Series B: | | | | | | | | |
| 0% 6/30/06 (MBIA Insured) | | | | 3,500 | | | | 3,444 |
| 0% 6/30/07 (MBIA Insured) | | | | 7,050 | | | | 6,699 |
| 0% 6/30/08 (MBIA Insured) | | | | 4,240 | | | | 3,891 |
| | | | | | | | | 28,029 |
| |
| Arizona – 1.5% | | | | | | | | |
| Arizona Ctfs. of Prtn. Series B, 5.5% 9/1/10 | | | | | | | | |
| (FSA Insured) | | | | 8,325 | | | | 9,016 |
| Arizona School Facilities Board Ctfs. of Prtn. Series C, | | | | | | | | |
| 5% 9/1/09 (FSA Insured) | | | | 1,115 | | | | 1,175 |
| Maricopa County Unified School District #48 Scottsdale | | | | | | | | |
| 7.4% 7/1/10 | | | | 3,750 | | | | 4,346 |
| Pima County Unified School District #1 Tucson 7.5% | | | | | | | | |
| 7/1/08 (FGIC Insured) | | | | 7,060 | | | | 7,749 |
See accompanying notes which are an integral part of the financial statements.
11 Annual Report
| Investments continued | | | | | | | | |
| |
| |
| Municipal Bonds continued | | | | | | | | |
| | | Principal | | Value (Note 1) |
| | | Amount (000s) | | (000s) |
| Arizona – continued | | | | | | | | |
| Tucson Wtr. Rev. Series A, 5% 7/1/11 (FGIC Insured) | | $ | | 1,500 | | $ | | 1,601 |
| Univ. of Arizona Ctfs. of Prtn. (Univ. of Arizona Parking | | | | | | | | |
| & Student Hsg. Proj.) Series A, 5% 6/1/09 (AMBAC | | | | | | | | |
| Insured) | | | | 2,000 | | | | 2,097 |
| | | | | | | | | 25,984 |
| |
| Arkansas – 0.3% | | | | | | | | |
| Arkansas Dev. Fin. Auth. Exempt Facilities Rev. (Waste | | | | | | | | |
| Mgmt. Proj.) 3.65%, tender 8/1/06 (b)(c) | | | | 1,000 | | | | 999 |
| Little Rock Gen. Oblig. 4% 4/1/07 (FSA Insured) | | | | 1,000 | | | | 1,009 |
| Rogers Sales & Use Tax Rev. Series A, 4.25% 9/1/07 | | | | | | | | |
| (FGIC Insured) | | | | 2,175 | | | | 2,208 |
| | | | | | | | | 4,216 |
| |
| California – 7.6% | | | | | | | | |
| California Dept. of Wtr. Resources Pwr. Supply Rev. | | | | | | | | |
| Series A: | | | | | | | | |
| 5.25% 5/1/07 (MBIA Insured) | | | | 27,455 | | | | 28,162 |
| 5.25% 5/1/12 (MBIA Insured) | | | | 6,000 | | | | 6,548 |
| California Econ. Recovery Series A, 5.25% 7/1/13 | | | | | | | | |
| (MBIA Insured) | | | | 2,900 | | | | 3,206 |
| California Gen. Oblig.: | | | | | | | | |
| 5% 2/1/09 | | | | 1,640 | | | | 1,713 |
| 5% 2/1/10 | | | | 2,000 | | | | 2,110 |
| 5.125% 9/1/12 | | | | 1,000 | | | | 1,061 |
| 5.25% 2/1/11 | | | | 5,775 | | | | 6,202 |
| 5.5% 3/1/11 (FGIC Insured) | | | | 3,210 | | | | 3,513 |
| 5.5% 3/1/11 (XL Cap. Assurance, Inc. Insured) | | | | 3,525 | | | | 3,850 |
| 5.75% 10/1/08 | | | | 1,085 | | | | 1,150 |
| 6.4% 9/1/08 | | | | 3,075 | | | | 3,301 |
| 6.5% 9/1/10 | | | | 1,740 | | | | 1,947 |
| 8% 11/1/07 (FGIC Insured) | | | | 4,670 | | | | 4,941 |
| California Health Facilities Fing. Auth. Rev. (Cedars-Sinai | | | | | | | | |
| Med. Ctr. Proj.) 5% 11/15/10 | | | | 1,000 | | | | 1,060 |
| California Poll. Cont. Fing. Auth. Ctfs. of Prtn. (Pacific | | | | | | | | |
| Gas & Elec. Co. Proj.) Series 2004 B, 3.5%, tender | | | | | | | | |
| 6/1/07 (FGIC Insured) (b)(c) | | | | 15,000 | | | | 15,010 |
| California Poll. Cont. Fing. Auth. Solid Waste Disp. Rev. | | | | | | | | |
| (Waste Mgmt., Inc. Proj.) Series A, 3.125%, tender | | | | | | | | |
| 5/1/06 (b)(c) | | | | 5,000 | | | | 4,988 |
| California Pub. Works Board Lease Rev.: | | | | | | | | |
| (California State Univ. Proj.) Series 1997 A, 5.5% | | | | | | | | |
| 10/1/07 | | | | 1,075 | | | | 1,110 |
See accompanying notes which are an integral part of the financial statements.
| Municipal Bonds continued | | | | | | | | |
| | | Principal | | Value (Note 1) |
| | | Amount (000s) | | (000s) |
| California – continued | | | | | | | | |
| California Pub. Works Board Lease Rev.: – continued | | | | | | | | |
| (Coalinga State Hosp. Proj.) Series 2004 A: | | | | | | | | |
| 5% 6/1/07 | | $ | | 4,000 | | $ | | 4,086 |
| 5% 6/1/08 | | | | 6,000 | | | | 6,210 |
| California Statewide Cmntys. Dev. Auth. Rev.: | | | | | | | | |
| (Kaiser Fund Hosp./Health Place, Inc. Proj.) | | | | | | | | |
| Series 2002 C, 3.85%, tender 6/1/12 (b) | | | | 1,400 | | | | 1,389 |
| (Kaiser Permanente Health Sys. Proj.): | | | | | | | | |
| Series 2001 A, 2.55%, tender 1/4/07 (b) | | | | 1,400 | | | | 1,388 |
| Series 2004 G, 2.3%, tender 5/1/07 (b) | | | | 8,000 | | | | 7,889 |
| Commerce Refuse To Energy Auth. Rev.: | | | | | | | | |
| 5% 7/1/07 (MBIA Insured) | | | | 1,770 | | | | 1,812 |
| 5.25% 7/1/08 (MBIA Insured) | | | | 855 | | | | 893 |
| North City West School Facilities Fing. Auth. Spl. Tax | | | | | | | | |
| Subseries C: | | | | | | | | |
| 5% 9/1/07 (AMBAC Insured) (a) | | | | 1,975 | | | | 2,012 |
| 5% 9/1/08 (AMBAC Insured) (a) | | | | 2,080 | | | | 2,143 |
| San Joaquin Hills Trans. Corridor Agcy. Toll Road Rev. | | | | | | | | |
| Series A, 0% 1/15/12 (MBIA Insured) | | | | 3,600 | | | | 2,852 |
| Univ. of California Revs. (UCLA Med. Ctr. Proj.) 4.55% | | | | | | | | |
| 12/1/09 (e) | | | | 8,955 | | | | 9,063 |
| | | | | | | | | 129,609 |
| |
| Colorado – 0.3% | | | | | | | | |
| E-470 Pub. Hwy. Auth. Rev. Series 2000 B: | | | | | | | | |
| 0% 9/1/06 (Escrowed to Maturity) (d) | | | | 2,200 | | | | 2,150 |
| 0% 9/1/07 (Escrowed to Maturity) (d) | | | | 3,200 | | | | 3,016 |
| | | | | | | | | 5,166 |
| |
| Connecticut – 0.6% | | | | | | | | |
| Connecticut Gen. Oblig.: | | | | | | | | |
| Series 2001 D, 5.125% 11/15/18 (Pre-Refunded to | | | | | | | | |
| 11/15/11 @ 100) (d) | | | | 5,000 | | | | 5,386 |
| Series 2002 C, 5% 12/15/08 | | | | 1,930 | | | | 2,020 |
| Connecticut Health & Edl. Facilities Auth. Rev. | | | | | | | | |
| (Connecticut Children’s Med. Ctr. Proj.) Series B: | | | | | | | | |
| 4% 7/1/07 (MBIA Insured) | | | | 1,275 | | | | 1,287 |
| 4.5% 7/1/08 (MBIA Insured) | | | | 1,045 | | | | 1,073 |
| 5% 7/1/09 (MBIA Insured) | | | | 1,000 | | | | 1,051 |
| | | | | | | | | 10,817 |
See accompanying notes which are an integral part of the financial statements.
13 Annual Report
| Investments continued | | | | | | | | |
| |
| |
| Municipal Bonds continued | | | | | | | | |
| | | Principal | | Value (Note 1) |
| | | Amount (000s) | | (000s) |
| District Of Columbia – 1.9% | | | | | | | | |
| District of Columbia Ctfs. of Prtn.: | | | | | | | | |
| (District’s Pub. Safety and Emergency Preparedness | | | | | | | | |
| Communications Ctr. and Related Technology Proj.) | | | | | | | | |
| Series 2003, 3% 1/1/06 (AMBAC Insured) | | $ | | 1,305 | | $ | | 1,305 |
| 5% 1/1/06 (AMBAC Insured) | | | | 1,000 | | | | 1,000 |
| 5% 1/1/07 (AMBAC Insured) | | | | 1,000 | | | | 1,016 |
| 5.25% 1/1/08 (AMBAC Insured) | | | | 935 | | | | 968 |
| District of Columbia Gen. Oblig.: | | | | | | | | |
| Series 1993 B2, 5.5% 6/1/07 (FSA Insured) | | | | 1,830 | | | | 1,885 |
| Series 2001 B, 5.5% 6/1/07 (FSA Insured) | | | | 1,345 | | | | 1,385 |
| Series A: | | | | | | | | |
| 5% 6/1/07 | | | | 2,810 | | | | 2,868 |
| 5.25% 6/1/09 (FSA Insured) | | | | 1,000 | | | | 1,057 |
| Series B, 0% 6/1/12 (MBIA Insured) | | | | 3,600 | | | | 2,772 |
| District of Columbia Rev. (Medstar Univ. Hosp. Proj.) | | | | | | | | |
| Series D, 6.875%, tender 2/16/07 (b)(d) | | | | 9,000 | | | | 9,354 |
| Metropolitan Washington Arpts. Auth. Gen. Arpt. Rev. | | | | | | | | |
| Series B, 5.5% 10/1/08 (FGIC Insured) (c) | | | | 6,460 | | | | 6,748 |
| Metropolitan Washington Arpts. Auth. Sys. Rev. Series D: | | | | | | | | |
| 4% 10/1/06 (FSA Insured) (c) | | | | 1,750 | | | | 1,756 |
| 4% 10/1/07 (FSA Insured) (c) | | | | 1,000 | | | | 1,007 |
| | | | | | | | | 33,121 |
| |
| Florida – 3.9% | | | | | | | | |
| Brevard County Util. Rev. 5% 3/1/06 (FGIC Insured) | | | | 530 | | | | 531 |
| Coral Gables Health Facilities Hosp. (Baptist Health | | | | | | | | |
| South Florida Obligated Group Proj.) 5% 8/15/06 | | | | 1,000 | | | | 1,010 |
| Florida Gen. Oblig. (Dept. of Trans. Right of Way Proj.) | | | | | | | | |
| Series B, 6.375% 7/1/08 | | | | 3,000 | | | | 3,214 |
| Highlands County Health Facilities Auth. Rev. (Adventist | | | | | | | | |
| Health Sys./Sunbelt Obligated Group Proj.): | | | | | | | | |
| Series A, 5% 11/15/10 | | | | 1,000 | | | | 1,052 |
| Series B, 5% 11/15/08 | | | | 800 | | | | 829 |
| 3.95%, tender 9/1/12 (b) | | | | 7,550 | | | | 7,515 |
| 5%, tender 11/16/09 (b) | | | | 4,700 | | | | 4,901 |
| Hillsborough County Indl. Dev. Auth. Poll. Cont. Rev. | | | | | | | | |
| (Tampa Elec. Co. Proj.): | | | | | | | | |
| 4%, tender 8/1/07 (b) | | | | 11,000 | | | | 11,001 |
| 4.25%, tender 8/1/07 (b)(c) | | | | 6,000 | | | | 6,001 |
| Lee Memorial Health Sys. Board of Directors Hosp. Rev. | | | | | | | | |
| Series A, 5.75% 4/1/12 (FSA Insured) | | | | 1,980 | | | | 2,201 |
See accompanying notes which are an integral part of the financial statements.
| Municipal Bonds continued | | | | | | | | |
| | | Principal | | Value (Note 1) |
| | | Amount (000s) | | (000s) |
| Florida – continued | | | | | | | | |
| Miami-Dade County Cap. Asset Acquisition | | | | | | | | |
| Fixed Rate Spl. Oblig. Series 2002 A, 5% 4/1/08 | | | | | | | | |
| (AMBAC Insured) | | $ | | 2,825 | | $ | | 2,928 |
| Miami-Dade County School Board Ctfs. of Prtn. 5%, | | | | | | | | |
| tender 5/1/11 (MBIA Insured) (b) | | | | 1,500 | | | | 1,598 |
| Orlando Utils. Commission Util. Sys. Rev. 5.25% 7/1/09 | | | | 6,000 | | | | 6,368 |
| Pasco County Solid Waste Disp. & Resource Recovery | | | | | | | | |
| Sys. Rev. 5.75% 4/1/06 (AMBAC Insured) (c) | | | | 1,500 | | | | 1,508 |
| Polk County Cap. Impt. Rev. Series 2004, 5.5%, tender | | | | | | | | |
| 12/1/10 (FSA Insured) (b) | | | | 9,000 | | | | 9,695 |
| Seminole County School Board Ctfs. of Prtn. | | | | | | | | |
| Series A, 4.5% 7/1/08 (MBIA Insured) | | | | 1,250 | | | | 1,285 |
| Univ. Athletic Assoc., Inc. Athletic Prog. Rev. | | | | | | | | |
| Series 2001: | | | | | | | | |
| 2.8%, tender 10/1/08, LOC SunTrust Banks of | | | | | | | | |
| Florida, Inc. (b) | | | | 2,000 | | | | 1,961 |
| 3%, tender 10/1/09, LOC SunTrust Banks, Inc. (b) | | | | 1,000 | | | | 978 |
| Volusia County School Board Ctfs. of Prtn. (School Board | | | | | | | | |
| of Volusia County Master Lease Prog.) 5% 8/1/08 | | | | | | | | |
| (FSA Insured) | | | | 1,625 | | | | 1,688 |
| | | | | | | | | 66,264 |
| |
| Georgia – 0.7% | | | | | | | | |
| Cobb County Dev. Auth. Solid Waste Disp. Rev. | | | | | | | | |
| (Georgia Waste Mgmt. Proj.) Series A, 3.65%, tender | | | | | | | | |
| 4/1/06 (b)(c) | | | | 1,000 | | | | 1,000 |
| Columbia County Gen. Oblig. 5% 1/1/09 | | | | | | | | |
| (FSA Insured) | | | | 1,505 | | | | 1,577 |
| Fulton DeKalb Hosp. Auth. Hosp. Rev. 5% 1/1/08 | | | | | | | | |
| (FSA Insured) | | | | 2,250 | | | | 2,318 |
| Georgia Muni. Elec. Auth. Pwr. Rev. Series 1992 B, | | | | | | | | |
| 8.25% 1/1/11 (MBIA Insured) | | | | 4,105 | | | | 4,953 |
| Gwinnett County Gen. Oblig. 4% 1/1/06 | | | | 1,035 | | | | 1,035 |
| Henry County Wtr. & Swr. Auth. Rev. 5% 2/1/08 | | | | | | | | |
| (MBIA Insured) | | | | 1,095 | | | | 1,133 |
| | | | | | | | | 12,016 |
| |
| Hawaii – 2.3% | | | | | | | | |
| Hawaii Arpts. Sys. Rev. Series 2000 B, 8% 7/1/10 | | | | | | | | |
| (FGIC Insured) (c) | | | | 3,850 | | | | 4,482 |
| Hawaii Gen. Oblig. Series CU: | | | | | | | | |
| 5.75% 10/1/11 (MBIA Insured) | | | | 3,040 | | | | 3,338 |
See accompanying notes which are an integral part of the financial statements.
15 Annual Report
| Investments continued | | | | | | | | |
| |
| |
| Municipal Bonds continued | | | | | | | | |
| | | Principal | | Value (Note 1) |
| | | Amount (000s) | | (000s) |
| Hawaii – continued | | | | | | | | |
| Hawaii Gen. Oblig. Series CU: – continued | | | | | | | | |
| 5.75% 10/1/11 (Pre-Refunded to 10/1/10 @ | | | | | | | | |
| 100) (d) | | $ | | 170 | | $ | | 187 |
| Honolulu City & County Gen. Oblig. Series B, 8% | | | | | | | | |
| 10/1/09 | | | | 26,940 | | | | 31,183 |
| | | | | | | | | 39,190 |
| |
| Illinois – 9.4% | | | | | | | | |
| Chicago Gen. Oblig.: | | | | | | | | |
| (Neighborhoods Alive 21 Prog.): | | | | | | | | |
| 5% 1/1/07 (MBIA Insured) | | | | 1,360 | | | | 1,382 |
| 5% 1/1/08 (MBIA Insured) | | | | 1,190 | | | | 1,227 |
| Series A, 5.25% 1/1/12 (FSA Insured) | | | | 1,000 | | | | 1,085 |
| Chicago Midway Arpt. Rev.: | | | | | | | | |
| Series 2001 B, 5% 1/1/07 (FSA Insured) | | | | 1,000 | | | | 1,015 |
| Series B: | | | | | | | | |
| 5% 1/1/10 (AMBAC Insured) | | | | 1,225 | | | | 1,292 |
| 5% 1/1/11 (AMBAC Insured) | | | | 3,625 | | | | 3,845 |
| Chicago O’Hare Int’l. Arpt. Rev.: | | | | | | | | |
| Series 2001 C, 5% 1/1/07 (AMBAC Insured) (c) | | | | 2,670 | | | | 2,708 |
| Series A: | | | | | | | | |
| 5% 1/1/12 (MBIA Insured) | | | | 1,135 | | | | 1,211 |
| 5.5% 1/1/08 (AMBAC Insured) | | | | 5,000 | | | | 5,109 |
| 5.5% 1/1/10 (AMBAC Insured) (c) | | | | 5,000 | | | | 5,318 |
| Chicago Park District: | | | | | | | | |
| Series B, 5% 1/1/11 (AMBAC Insured) | | | | 5,750 | | | | 6,123 |
| Series C, 5% 1/1/11 (AMBAC Insured) | | | | 2,515 | | | | 2,678 |
| Chicago School Fin. Auth. Series B, 5% 6/1/09 | | | | | | | | |
| (FSA Insured) | | | | 12,825 | | | | 13,458 |
| Chicago Tax Increment Rev. Series 2000 A, 0% | | | | | | | | |
| 12/1/08 (AMBAC Insured) | | | | 10,000 | | | | 9,041 |
| Chicago Transit Auth. Cap. Grant Receipts Rev.: | | | | | | | | |
| (Fed. Transit Administration Section 5307 Formula | | | | | | | | |
| Funds Proj.) Series A, 5.25% 6/1/10 (AMBAC | | | | | | | | |
| Insured) | | | | 4,785 | | | | 5,120 |
| Series A, 4.25% 6/1/08 (AMBAC Insured) | | | | 3,600 | | | | 3,614 |
| Chicago Wastewtr. Transmission Rev. 5.5% 1/1/09 | | | | | | | | |
| (FGIC Insured) | | | | 2,975 | | | | 3,151 |
| Cook County Cmnty. College District #508 Ctfs. of Prtn. | | | | | | | | |
| 8.75% 1/1/07 (FGIC Insured) | | | | 8,000 | | | | 8,419 |
| Du Page Wtr. Commission Wtr. Rev. 5% 5/1/08 | | | | | | | | |
| (AMBAC Insured) | | | | 4,525 | | | | 4,687 |
See accompanying notes which are an integral part of the financial statements.
| Municipal Bonds continued | | | | | | | | |
| | | Principal | | Value (Note 1) |
| | | Amount (000s) | | (000s) |
| Illinois – continued | | | | | | | | |
| Granite City Solid Waste Disp. Rev. (Waste Mgmt., Inc. | | | | | | | | |
| Proj.) 3.85%, tender 5/1/08 (b)(c) | | $ | | 2,200 | | $ | | 2,191 |
| Hodgkins Tax Increment Rev.: | | | | | | | | |
| 5% 1/1/07 | | | | 1,000 | | | | 1,013 |
| 5% 1/1/09 | | | | 1,805 | | | | 1,867 |
| Illinois Dev. Fin. Auth. Gas Supply Rev. (The Peoples Gas | | | | | | | | |
| Lt. & Coke Co. Proj.) Series 2003 B, 3.05%, tender | | | | | | | | |
| 2/1/08 (AMBAC Insured) (b) | | | | 6,100 | | | | 6,017 |
| Illinois Dev. Fin. Auth. Rev. (DePaul Univ. Proj.) Series | | | | | | | | |
| 2004 C, 5.5% 10/1/10 | | | | 1,900 | | | | 2,026 |
| Illinois Edl. Facilities Auth. Revs.: | | | | | | | | |
| (Art Institute of Chicago Proj.) Series 2003, 3.85%, | | | | | | | | |
| tender 3/1/11 (b) | | | | 12,800 | | | | 12,658 |
| (Univ. of Chicago Proj.): | | | | | | | | |
| Series 2004 B1, 3.45%, tender 7/1/08 (b) | | | | 6,100 | | | | 6,096 |
| Series A, 5.25% 7/1/41 (Pre-Refunded to 7/1/11 | | | | | | | | |
| @ 101) (d) | | | | 2,640 | | | | 2,881 |
| Series B: | | | | | | | | |
| 3.1%, tender 7/1/07 (b)(d) | | | | 5 | | | | 5 |
| 3.1%, tender 7/1/07 (b) | | | | 3,895 | | | | 3,858 |
| Illinois Fin. Auth. Rev. (DePaul Univ. Proj.): | | | | | | | | |
| 5% 10/1/06 | | | | 1,115 | | | | 1,125 |
| 5% 10/1/07 | | | | 1,225 | | | | 1,249 |
| 5% 10/1/08 | | | | 1,000 | | | | 1,035 |
| Illinois Gen. Oblig.: | | | | | | | | |
| First Series 2001, 5.25% 5/1/11 (FSA Insured) | | | | 1,475 | | | | 1,595 |
| First Series: | | | | | | | | |
| 5.25% 4/1/08 (MBIA Insured) | | | | 1,035 | | | | 1,078 |
| 5.5% 8/1/10 | | | | 1,415 | | | | 1,531 |
| 6% 1/1/11 (Pre-Refunded to 1/1/10 @ 100) (d) | | | | 7,075 | | | | 7,759 |
| Series A, 5% 10/1/09 | | | | 2,600 | | | | 2,739 |
| 5.75% 4/1/12 (Pre-Refunded to 4/1/10 @ 100) (d) . | | | | 1,000 | | | | 1,092 |
| Illinois Health Facilities Auth. Rev. (Condell Med. Ctr. | | | | | | | | |
| Proj.): | | | | | | | | |
| 5% 5/15/07 | | | | 500 | | | | 504 |
| 5% 5/15/08 | | | | 700 | | | | 715 |
| Kane & DeKalb Counties Cmnty. Unit School District | | | | | | | | |
| #301 0% 12/1/10 (AMBAC Insured) | | | | 2,000 | | | | 1,660 |
| Kane & DuPage Counties Cmnty. Unit School District | | | | | | | | |
| #303, Saint Charles Series A, 5.5% 1/1/12 | | | | | | | | |
| (FSA Insured) | | | | 2,270 | | | | 2,493 |
See accompanying notes which are an integral part of the financial statements.
17 Annual Report
| Investments continued | | | | | | | | |
| |
| |
| Municipal Bonds continued | | | | | | | | |
| | | Principal | | Value (Note 1) |
| | | Amount (000s) | | (000s) |
| Illinois – continued | | | | | | | | |
| Kane County School District #129, Aurora West Side | | | | | | | | |
| Series A, 5.75% 2/1/14 (Pre-Refunded to 2/1/12 @ | | | | | | | | |
| 100) (d) | | $ | | 1,600 | | $ | | 1,790 |
| Kane, McHenry, Cook & DeKalb Counties Cmnty. Unit | | | | | | | | |
| School District #300, Carpentersville 5.5% 12/1/13 | | | | | | | | |
| (Pre-Refunded to 12/1/11 @ 100) (d) | | | | 5,000 | | | | 5,515 |
| Lake County Cmnty. High School District #128, | | | | | | | | |
| Libertyville Series 2004, 5% 1/1/11 | | | | 2,365 | | | | 2,519 |
| Rosemont Gen. Oblig. Series 3: | | | | | | | | |
| 0% 12/1/07 (Escrowed to Maturity) (d) | | | | 2,375 | | | | 2,225 |
| 0% 12/1/07 (FGIC Insured) | | | | 625 | | | | 585 |
| Univ. of Illinois Auxiliary Facilities Sys. Rev. Series 2001 | | | | | | | | |
| A, 5% 4/1/08 (AMBAC Insured) | | | | 2,035 | | | | 2,105 |
| Univ. of Illinois Ctfs. of Prtn. (Util. Infrastructure Projs.) | | | | | | | | |
| 5% 8/15/11 (AMBAC Insured) | | | | 1,360 | | | | 1,451 |
| Will County School District #122 Series B: | | | | | | | | |
| 0% 11/1/08 (Escrowed to Maturity) (d) | | | | 220 | | | | 199 |
| 0% 11/1/08 (FSA Insured) | | | | 1,280 | | | | 1,159 |
| | | | | | | | | 161,218 |
| |
| Indiana – 3.7% | | | | | | | | |
| Carmel High School Bldg. Corp. 5% 1/10/11 | | | | | | | | |
| (FSA Insured) | | | | 1,000 | | | | 1,066 |
| Ctr. Grove 2000 Bldg. Corp.: | | | | | | | | |
| 5.5% 7/15/17 (Pre-Refunded to 7/15/11 @ 100) (d) | | | | 1,785 | | | | 1,961 |
| 5.5% 7/15/18 (Pre-Refunded to 7/15/11 @ 100) (d) | | | | 1,885 | | | | 2,071 |
| Hamilton Southeastern Consolidated School Bldg. Corp.: | | | | | | | | |
| Series A: | | | | | | | | |
| 5% 1/10/10 (FSA Insured) | | | | 1,750 | | | | 1,852 |
| 5.25% 7/10/11 (FSA Insured) | | | | 2,295 | | | | 2,483 |
| 5.25% 1/10/12 (FSA Insured) | | | | 1,355 | | | | 1,472 |
| 5% 1/15/10 (FSA Insured) | | | | 1,835 | | | | 1,942 |
| 5% 1/15/11 (FSA Insured) | | | | 1,910 | | | | 2,036 |
| 5% 1/15/12 (FSA Insured) | | | | 1,990 | | | | 2,135 |
| 5.5% 7/15/16 (Pre-Refunded to 7/15/11 @ 100) (d) | | | | 1,855 | | | | 2,038 |
| Indiana Health Facility Fing. Auth. Rev.: | | | | | | | | |
| (Ascension Health Cr. Group Prog.) Series 2002 F, | | | | | | | | |
| 5.5% 11/15/06 | | | | 1,000 | | | | 1,018 |
| (Ascension Health Cr. Group, Inc. Proj.) Series A, 5%, | | | | | | | | |
| tender 5/1/07 (b) | | | | 7,100 | | | | 7,241 |
| Indianapolis Local Pub. Impt. Bond Bank (Indianapolis | | | | | | | | |
| Arpt. Auth. Proj.) Series I: | | | | | | | | |
| 4% 1/1/06 (MBIA Insured) (c) | | | | 1,325 | | | | 1,325 |
See accompanying notes which are an integral part of the financial statements.
| Municipal Bonds continued | | | | | | | | |
| | | Principal | | Value (Note 1) |
| | | Amount (000s) | | (000s) |
| Indiana – continued | | | | | | | | |
| Indianapolis Local Pub. Impt. Bond Bank (Indianapolis | | | | | | | | |
| Arpt. Auth. Proj.) Series I: – continued | | | | | | | | |
| 5% 1/1/08 (MBIA Insured) (c) | | $ | | 1,550 | | $ | | 1,590 |
| Indianapolis Resource Recovery Rev. (Ogden Martin | | | | | | | | |
| Sys., Inc. Proj.) 6.75% 12/1/07 (AMBAC Insured) | | | | 3,000 | | | | 3,137 |
| Ivy Tech State College Series I, 5% 7/1/09 | | | | | | | | |
| (AMBAC Insured) | | | | 1,405 | | | | 1,478 |
| Logansport High School Bldg. Corp.: | | | | | | | | |
| 5.25% 1/15/11 (MBIA Insured) | | | | 1,000 | | | | 1,073 |
| 5.25% 7/15/11 (MBIA Insured) | | | | 1,020 | | | | 1,098 |
| 5.25% 1/15/12 (MBIA Insured) | | | | 1,045 | | | | 1,129 |
| 5.25% 7/15/12 (MBIA Insured) | | | | 1,075 | | | | 1,165 |
| Mount Vernon of Hancock County Multi-School Corp. | | | | | | | | |
| Series B: | | | | | | | | |
| 5.5% 7/15/16 (Pre-Refunded to 7/15/11 @ 100) (d) | | | | 1,605 | | | | 1,763 |
| 5.5% 7/15/17 (Pre-Refunded to 7/15/11 @ 100) (d) | | | | 1,695 | | | | 1,862 |
| Muncie School Bldg. Corp. 5.25% 7/10/12 | | | | | | | | |
| (MBIA Insured) | | | | 1,585 | | | | 1,727 |
| New Albany Floyd County Independent School Bldg. | | | | | | | | |
| Corp. 5% 1/15/11 (FSA Insured) | | | | 1,000 | | | | 1,066 |
| Rockport Poll. Cont. Rev. 4.9%, tender 6/1/07 (b) | | | | 4,000 | | | | 4,045 |
| Saint Joseph County Ind. Edl. Facilities Rev. (Univ. of | | | | | | | | |
| Notre Dame Du Lac Proj.) 2.5%, tender 12/3/07 (b) . | | | | 10,000 | | | | 9,791 |
| West Clark 2000 School Bldg. Corp.: | | | | | | | | |
| 5.25% 1/15/11 (MBIA Insured) | | | | 1,065 | | | | 1,145 |
| 5.25% 7/15/11 (MBIA Insured) | | | | 1,125 | | | | 1,214 |
| 5.25% 1/15/12 (MBIA Insured) | | | | 1,150 | | | | 1,246 |
| | | | | | | | | 63,169 |
| |
| Kansas 0.2% | | | | | | | | |
| Burlington Envir. Impt. Rev. (Kansas City Pwr. & Lt. Co. | | | | | | | | |
| Proj.) Series A, 4.75%, tender 10/1/07 (b) | | | | 2,400 | | | | 2,438 |
| Kansas Dev. Fin. Auth. Health Facilities Rev. (Hays Med. | | | | | | | | |
| Ctr. Proj.) Series 2005 L: | | | | | | | | |
| 5.25% 11/15/10 | | | | 545 | | | | 580 |
| 5.25% 11/15/12 | | | | 680 | | | | 728 |
| | | | | | | | | 3,746 |
| |
| Kentucky 0.7% | | | | | | | | |
| Kenton County Arpt. Board Arpt. Rev. Series B, 5% | | | | | | | | |
| 3/1/09 (MBIA Insured) (c) | | | | 1,185 | | | | 1,231 |
See accompanying notes which are an integral part of the financial statements.
19 Annual Report
| Investments continued | | | | | | | | |
| |
| |
| Municipal Bonds continued | | | | | | | | |
| | | Principal | | Value (Note 1) |
| | | Amount (000s) | | (000s) |
| Kentucky – continued | | | | | | | | |
| Owensboro Elec. Lt. & Pwr. Rev. Series B: | | | | | | | | |
| 0% 1/1/07 (AMBAC Insured) | | $ | | 10,000 | | $ | | 9,667 |
| 0% 1/1/09 (AMBAC Insured) | | | | 2,000 | | | | 1,795 |
| | | | | | | | | 12,693 |
| |
| Louisiana – 0.1% | | | | | | | | |
| East Baton Rouge Parish Pub. Impt. Sales Tax Rev. | | | | | | | | |
| Series B, 5% 2/1/12 (AMBAC Insured) | | | | 1,000 | | | | 1,068 |
| Maryland 0.1% | | | | | | | | |
| Prince Georges County Ctfs. of Prtn. (Equip. Acquisition | | | | | | | | |
| Prog.) 5.25% 5/15/10 (MBIA Insured) | | | | 1,535 | | | | 1,646 |
| Massachusetts 2.8% | | | | | | | | |
| Massachusetts Bay Trans. Auth. Series A, 7% 3/1/09 | | | | 6,880 | | | | 7,597 |
| Massachusetts Dev. Fin. Agcy. Rev. (Massachusetts | | | | | | | | |
| Biomedical Research Corp. Proj.) Series C: | | | | | | | | |
| 5.75% 8/1/06 | | | | 1,200 | | | | 1,214 |
| 5.875% 8/1/08 | | | | 1,630 | | | | 1,703 |
| Massachusetts Fed. Hwy.: | | | | | | | | |
| Series 2000 A, 5.75% 6/15/13 | | | | 3,000 | | | | 3,275 |
| Series B, 5.125% 12/15/14 (Pre-Refunded to | | | | | | | | |
| 12/15/08 @ 101) (d) | | | | 2,775 | | | | 2,924 |
| Massachusetts Gen. Oblig.: | | | | | | | | |
| Series 1999 C, 5.625% 9/1/12 (Pre-Refunded to | | | | | | | | |
| 9/1/09 @ 101) (d) | | | | 2,570 | | | | 2,778 |
| Series 2001 A, 5.5% 1/1/11 | | | | 5,000 | | | | 5,437 |
| Series 2003 A, 5.375% 8/1/08 | | | | 5,165 | | | | 5,414 |
| Series 2003 C, 5.5% 10/1/10 (MBIA Insured) | | | | 1,130 | | | | 1,228 |
| Series A, 4.5% 1/1/09 (Pre-Refunded to 1/1/08 @ | | | | | | | | |
| 101) (d) | | | | 2,055 | | | | 2,116 |
| Series C, 5.25% 11/1/30 (Pre-Refunded to 11/1/12 | | | | | | | | |
| @ 100) (d) | | | | 2,495 | | | | 2,704 |
| Massachusetts Health & Edl. Facilities Auth. Rev. | | | | | | | | |
| (Berkshire Health Sys., Inc. Proj.) Series F, 5% | | | | | | | | |
| 10/1/08 | | | | 2,720 | | | | 2,817 |
| Massachusetts Port Auth. Spl. Facilities Rev. | | | | | | | | |
| (Delta Air Lines, Inc. Proj.) Series A, 5.5% 1/1/12 | | | | | | | | |
| (AMBAC Insured) (c) | | | | 1,000 | | | | 1,064 |
| Springfield Gen. Oblig.: | | | | | | | | |
| 5% 1/15/06 (MBIA Insured) | | | | 1,000 | | | | 1,000 |
| 5.25% 8/1/12 (MBIA Insured) | | | | 6,000 | | | | 6,553 |
| | | | | | | | | 47,824 |
See accompanying notes which are an integral part of the financial statements.
| Municipal Bonds continued | | | | | | | | |
| | | Principal | | Value (Note 1) |
| | | Amount (000s) | | (000s) |
| Michigan – 3.3% | | | | | | | | |
| Chippewa Valley Schools 5% 5/1/08 | | $ | | 1,260 | | $ | | 1,306 |
| Detroit City School District Series A, 5.5% 5/1/11 | | | | | | | | |
| (FSA Insured) | | | | 1,200 | | | | 1,316 |
| Detroit Gen. Oblig.: | | | | | | | | |
| Series 2004 A, 5% 4/1/08 (FSA Insured) | | | | 7,275 | | | | 7,541 |
| Series A, 5% 4/1/07 (FSA Insured) | | | | 6,910 | | | | 7,053 |
| 5% 4/1/08 (MBIA Insured) | | | | 14,545 | | | | 15,077 |
| 5% 4/1/09 (MBIA Insured) | | | | 10,620 | | | | 11,170 |
| Detroit Swr. Disp. Rev. Series A, 5.75% 7/1/26 (Pre Re | | | | | | | | |
| funded to 1/1/10 @ 101) (d) | | | | 2,000 | | | | 2,180 |
| Greater Detroit Resource Recovery Auth. Rev. Series A, | | | | | | | | |
| 6.25% 12/13/07 (AMBAC Insured) | | | | 4,000 | | | | 4,216 |
| Hazel Park School District 5% 5/1/08 | | | | 1,275 | | | | 1,321 |
| Livonia Pub. School District Series II, 0% 5/1/21 | | | | | | | | |
| (FGIC Insured) (Pre-Refunded to 5/1/07 @ 39.31) | | | | 8,000 | | | | 3,000 |
| Troy School District 5% 5/1/11 (MBIA Insured) (a) | | | | 1,000 | | | | 1,054 |
| Wayne-Westland Cmnty. Schools 5% 5/1/10 | | | | | | | | |
| (FSA Insured) | | | | 1,225 | | | | 1,303 |
| | | | | | | | | 56,537 |
| |
| Minnesota 0.2% | | | | | | | | |
| Minneapolis & Saint Paul Hsg. & Redev. Auth. Health | | | | | | | | |
| Care Sys. Rev. (Health Partners Oblig. Group Proj.): | | | | | | | | |
| 5.25% 12/1/08 | | | | 1,200 | | | | 1,248 |
| 5.25% 12/1/10 | | | | 500 | | | | 530 |
| Saint Paul Port Auth. Lease Rev. (HealthEast Midway | | | | | | | | |
| Campus Proj.) Series 2003 A, 5% 5/1/10 | | | | 700 | | | | 696 |
| Waconia Independent School District #110 Series A, 5% | | | | | | | | |
| 2/1/11 (FSA Insured) | | | | 940 | | | | 1,006 |
| | | | | | | | | 3,480 |
| |
| Mississippi – 0.1% | | | | | | | | |
| Mississippi Higher Ed. Student Ln. Series 2000 B3, 5.3% | | | | | | | | |
| 9/1/08 (c) | | | | 1,190 | | | | 1,228 |
| Missouri – 0.3% | | | | | | | | |
| Kansas City School District Bldg. Corp. Rev.: | | | | | | | | |
| (School District Elementary School Proj.) Series B, 5% | | | | | | | | |
| 2/1/11 (FGIC Insured) | | | | 1,850 | | | | 1,979 |
| Series A, 5% 2/1/08 (FGIC Insured) | | | | 2,000 | | | | 2,068 |
| Saint Louis Muni. Fin. Corp. Leasehold Rev. | | | | | | | | |
| (Callahan Courthouse Proj.) Series A, 5.75% 2/15/14 | | | | | | | | |
| (FGIC Insured) | | | | 1,050 | | | | 1,171 |
| | | | | | | | | 5,218 |
See accompanying notes which are an integral part of the financial statements.
21 Annual Report
| Investments continued | | | | | | | | |
| |
| |
| Municipal Bonds continued | | | | | | | | |
| | | Principal | | Value (Note 1) |
| | | Amount (000s) | | (000s) |
| Montana 0.2% | | | | | | | | |
| Forsyth Poll. Cont. Rev. (Portland Gen. Elec. Co. Projs.) | | | | | | | | |
| Series A, 5.2%, tender 5/1/09 (b) | | $ | | 2,900 | | $ | | 3,010 |
| Nebraska – 1.9% | | | | | | | | |
| Lancaster County School District #1 (Lincoln Pub. Schools | | | | | | | | |
| Proj.) 4% 1/15/06 | | | | 1,000 | | | | 1,000 |
| Nebraska Pub. Pwr. District Rev. Series A: | | | | | | | | |
| 0% 1/1/06 (MBIA Insured) | | | | 24,465 | | | | 24,465 |
| 0% 1/1/07 (MBIA Insured) | | | | 4,000 | | | | 3,867 |
| Omaha Pub. Pwr. District Elec. Rev. Series B, 4.5% | | | | | | | | |
| 2/1/09 | | | | 3,500 | | | | 3,615 |
| | | | | | | | | 32,947 |
| |
| Nevada 2.0% | | | | | | | | |
| Clark County Arpt. Rev. Series C: | | | | | | | | |
| 5% 7/1/06 (AMBAC Insured) (c) | | | | 800 | | | | 806 |
| 5% 7/1/08 (AMBAC Insured) (c) | | | | 2,215 | | | | 2,283 |
| 5% 7/1/09 (AMBAC Insured) (c) | | | | 2,700 | | | | 2,803 |
| 5% 7/1/10 (AMBAC Insured) (c) | | | | 1,225 | | | | 1,279 |
| 5% 7/1/11 (AMBAC Insured) (c) | | | | 1,790 | | | | 1,877 |
| Clark County Hwy. Impt. Rev. (Motor Vehicle Fuel Tax) | | | | | | | | |
| 5% 7/1/11 (AMBAC Insured) | | | | 3,230 | | | | 3,455 |
| Clark County School District: | | | | | | | | |
| Series 2000 A, 5.75% 6/15/17 (Pre-Refunded to | | | | | | | | |
| 6/15/10 @ 100) (d) | | | | 1,600 | | | | 1,749 |
| Series C, 5% 6/15/10 (MBIA Insured) | | | | 1,075 | | | | 1,143 |
| Series D, 5% 6/15/09 (MBIA Insured) | | | | 13,890 | | | | 14,630 |
| Henderson Health Care Facility Rev. (Catholic Healthcare | | | | | | | | |
| West Proj.) Series 2005 B, 5% 7/1/08 | | | | 1,100 | | | | 1,137 |
| Lyon Co. School District Gen. Oblig.: | | | | | | | | |
| 5% 6/1/07 (a) | | | | 490 | | | | 498 |
| 5% 6/1/09 (a) | | | | 695 | | | | 723 |
| Washoe County School District Gen. Oblig. Series D, 5% | | | | | | | | |
| 6/1/10 (MBIA Insured) | | | | 2,410 | | | | 2,561 |
| | | | | | | | | 34,944 |
| |
| New Hampshire – 0.2% | | | | | | | | |
| New Hampshire Bus. Fin. Auth. Poll. Cont. Rev. | | | | | | | | |
| (United Illumination Co.) Series A, 3.65%, tender | | | | | | | | |
| 2/1/10 (AMBAC Insured) (b)(c) | | | | 2,500 | | | | 2,472 |
| New Hampshire Tpk. Sys. Rev. 5% 5/1/07 | | | | | | | | |
| (AMBAC Insured) (a) | | | | 1,500 | | | | 1,515 |
| | | | | | | | | 3,987 |
See accompanying notes which are an integral part of the financial statements.
| Municipal Bonds continued | | | | | | | | |
| | | Principal | | Value (Note 1) |
| | | Amount (000s) | | (000s) |
| New Jersey – 6.9% | | | | | | | | |
| Camden County Impt. Auth. Rev. (Cooper Health Sys. | | | | | | | | |
| Obligated Group Proj.) Series B, 5.25% 2/15/09 | | $ | | 1,250 | | $ | | 1,293 |
| Casino Reinvestment Dev. Auth. Hotel Room Fee Rev.: | | | | | | | | |
| 5% 1/1/08 (AMBAC Insured) | | | | 920 | | | | 947 |
| 5% 1/1/09 (AMBAC Insured) | | | | 1,000 | | | | 1,044 |
| Elizabeth Gen. Oblig. 5.25% 8/15/09 (MBIA Insured) . | | | | 1,225 | | | | 1,303 |
| Garden State Preservation Trust Open Space & | | | | | | | | |
| Farmland Preservation Series B: | | | | | | | | |
| 6.25% 11/1/09 (MBIA Insured) | | | | 4,000 | | | | 4,408 |
| 6.375% 11/1/11 (MBIA Insured) | | | | 7,470 | | | | 8,571 |
| New Jersey Econ. Dev. Auth. Rev. 5% 6/15/07 | | | | 7,500 | | | | 7,623 |
| New Jersey Gen. Oblig. Series 2005 N, 5% 7/15/08 | | | | | | | | |
| (FGIC Insured) | | | | 6,175 | | | | 6,423 |
| New Jersey Tpk. Auth. Tpk. Rev. Series 2004 A, 3.15%, | | | | | | | | |
| tender 1/1/10 (AMBAC Insured) (b) | | | | 9,150 | | | | 9,025 |
| New Jersey Trans. Trust Fund Auth.: | | | | | | | | |
| Series 2001 A, 5% 6/15/06 | | | | 355 | | | | 358 |
| Series A, 5.25% 12/15/08 (MBIA Insured) | | | | 13,500 | | | | 14,186 |
| Series B: | | | | | | | | |
| 5.25% 12/15/10 (FGIC Insured) | | | | 4,550 | | | | 4,896 |
| 5.25% 12/15/11 (FGIC Insured) | | | | 10,015 | | | | 10,864 |
| 5.25% 12/15/12 (FGIC Insured) | | | | 4,800 | | | | 5,243 |
| 6.5% 6/15/11 (MBIA Insured) | | | | 5,000 | | | | 5,685 |
| Series C, 5.5% 12/15/10 (FSA Insured) | | | | 25,000 | | | | 27,181 |
| New Jersey Transit Corp. Series 2000 B, 5.5% 2/1/08 | | | | | | | | |
| (AMBAC Insured) | | | | 1,000 | | | | 1,043 |
| New Jersey Transit Corp. Ctfs. of Prtn. Series A, 6% | | | | | | | | |
| 9/15/13 (Pre-Refunded to 9/15/09 @ 100) (d) | | | | 7,000 | | | | 7,614 |
| | | | | | | | | 117,707 |
| |
| New Jersey/Pennsylvania – 0.3% | | | | | | | | |
| Delaware River Joint Toll Bridge Commission Bridge Rev. | | | | | | | | |
| 5% 7/1/09 | | | | 5,170 | | | | 5,416 |
| New Mexico – 0.4% | | | | | | | | |
| Farmington Poll. Cont. Rev. (Pub. Svc. Co. of New | | | | | | | | |
| Mexico San Juan and Four Corners Projs.) | | | | | | | | |
| Series 2003 B, 2.1%, tender 4/1/06 (b) | | | | 7,000 | | | | 6,960 |
| New York – 11.8% | | | | | | | | |
| Grand Central District Mgmt. Assoc., Inc.: | | | | | | | | |
| 5% 1/1/10 | | | | 1,200 | | | | 1,264 |
| 5% 1/1/12 | | | | 1,175 | | | | 1,251 |
| Metropolitan Trans. Auth. Commuter Facilities Rev. Series A, | | | | | | | | |
| 5.375% 7/1/09 (Escrowed to Maturity) (d) | | | | 3,635 | | | | 3,882 |
See accompanying notes which are an integral part of the financial statements.
23 Annual Report
| Investments continued | | | | | | | | |
| |
| |
| Municipal Bonds continued | | | | | | | | |
| | | Principal | | Value (Note 1) |
| | | Amount (000s) | | (000s) |
| New York – continued | | | | | | | | |
| Metropolitan Trans. Auth. Rev. Series 2005 C: | | | | | | | | |
| 5% 11/15/10 | | $ | | 2,000 | | $ | | 2,121 |
| 5% 11/15/11 | | | | 2,750 | | | | 2,932 |
| Metropolitan Trans. Auth. Svc. Contract Rev. Series B, 5% | | | | | | | | |
| 1/1/06 | | | | 10,110 | | | | 10,110 |
| Nassau County Gen. Oblig. Series Z, 5% 9/1/11 | | | | | | | | |
| (FGIC Insured) | | | | 800 | | | | 848 |
| New York City Gen. Oblig.: | | | | | | | | |
| Series 1996 B, 6.5% 8/15/09 | | | | 3,425 | | | | 3,756 |
| Series 2000 A, 6.5% 5/15/11 | | | | 2,075 | | | | 2,325 |
| Series 2002 G, 5.5% 8/1/10 | | | | 2,720 | | | | 2,928 |
| Series 2004 G, 5% 8/1/09 | | | | 8,000 | | | | 8,380 |
| Series 2005 C, 5% 8/1/12 | | | | 19,770 | | | | 21,055 |
| Series 2005 D, 5% 8/1/12 | | | | 4,925 | | | | 5,245 |
| Series 2005 G, 5.625% 8/1/13 (MBIA Insured) | | | | 5,075 | | | | 5,618 |
| Series 2005 K: | | | | | | | | |
| 5% 8/1/11 | | | | 7,120 | | | | 7,553 |
| 5% 8/1/12 | | | | 4,360 | | | | 4,643 |
| Series 2005 O, 5% 6/1/12 | | | | 7,500 | | | | 7,998 |
| Series A, 5.25% 11/1/14 (MBIA Insured) | | | | 600 | | | | 651 |
| Series B, 5.75% 8/1/14 | | | | 1,000 | | | | 1,104 |
| Series E, 6% 8/1/11 | | | | 60 | | | | 62 |
| Series G, 5.25% 8/1/14 (AMBAC Insured) | | | | 1,000 | | | | 1,077 |
| Subseries 2005 F1, 5% 9/1/15 | | | | 3,560 | | | | 3,813 |
| New York City Indl. Dev. Agcy. Spl. Facilities Rev. (Term. | | | | | | | | |
| One Group Assoc. Proj.) 5% 1/1/07 (c) | | | | 1,700 | | | | 1,719 |
| New York City Muni. Wtr. Fin. Auth. Wtr. & Swr. Sys. | | | | | | | | |
| Rev. Series B, 5.875% 6/15/26 (Pre-Refunded to | | | | | | | | |
| 6/15/06 @ 101) (d) | | | | 7,320 | | | | 7,473 |
| New York City Transitional Fin. Auth. Rev. Series E: | | | | | | | | |
| 4.5% 2/1/07 | | | | 245 | | | | 248 |
| 4.5% 2/1/07 (Escrowed to Maturity) (d) | | | | 1,505 | | | | 1,525 |
| New York State Dorm. Auth. Revs.: | | | | | | | | |
| (City Univ. Sys. Consolidation Proj.): | | | | | | | | |
| Series 2000 A, 6.125% 7/1/12 (AMBAC Insured) . | | | | 5,540 | | | | 6,177 |
| Series A, 5.75% 7/1/13 | | | | 3,500 | | | | 3,849 |
| Series C, 7.5% 7/1/10 | | | | 3,100 | | | | 3,377 |
| Series 2003 A: | | | | | | | | |
| 5% 1/1/06 | | | | 1,250 | | | | 1,250 |
| 5% 3/15/08 | | | | 2,000 | | | | 2,070 |
| Series B, 5.25%, tender 5/15/12 (b) | | | | 13,000 | | | | 14,010 |
| 5.75% 7/1/13 (AMBAC Insured) | | | | 1,000 | | | | 1,103 |
See accompanying notes which are an integral part of the financial statements.
| Municipal Bonds continued | | | | | | | | |
| | | Principal | | Value (Note 1) |
| | | Amount (000s) | | (000s) |
| New York – continued | | | | | | | | |
| New York State Urban Dev. Corp. Rev. 5% 1/1/12 | | $ | | 5,000 | | $ | | 5,330 |
| New York Transitional Fin. Auth. Rev. Series 2003 E: | | | | | | | | |
| 4.5% 2/1/08 | | | | 1,500 | | | | 1,536 |
| 5% 2/1/09 | | | | 2,035 | | | | 2,132 |
| Tobacco Settlement Fing. Corp.: | | | | | | | | |
| Series 2004 B1, 5% 6/1/09 | | | | 3,800 | | | | 3,964 |
| Series A1: | | | | | | | | |
| 5.25% 6/1/12 | | | | 5,000 | | | | 5,041 |
| 5.25% 6/1/13 | | | | 17,500 | | | | 18,221 |
| Series B1: | | | | | | | | |
| 4% 6/1/07 | | | | 6,000 | | | | 6,047 |
| 5% 6/1/06 | | | | 17,815 | | | | 17,932 |
| | | | | | | | | 201,620 |
| |
| New York & New Jersey – 0.6% | | | | | | | | |
| Port Auth. of New York & New Jersey: | | | | | | | | |
| 124th Series, 5% 8/1/13 (FGIC Insured) (c) | | | | 1,200 | | | | 1,242 |
| 127th Series, 5% 12/15/08 (AMBAC Insured) (c) | | | | 3,510 | | | | 3,649 |
| Port Auth. of New York & New Jersey Spl. Oblig. Rev. | | | | | | | | |
| (JFK Int’l. Air Term. Spl. Proj.) Series 6, 6.25% | | | | | | | | |
| 12/1/13 (MBIA Insured) (c) | | | | 4,100 | | | | 4,610 |
| | | | | | | | | 9,501 |
| |
| North Carolina – 1.2% | | | | | | | | |
| Charlotte Ctfs. of Prtn. (FY 2004 Equip. Acquisition Proj.) | | | | | | | | |
| Series 2004 C, 4% 3/1/08 | | | | 4,940 | | | | 5,012 |
| North Carolina Eastern Muni. Pwr. Agcy. Pwr. Sys. Rev.: | | | | | | | | |
| Series 1993 B, 7% 1/1/08 (MBIA Insured) | | | | 1,500 | | | | 1,607 |
| Series A, 5.5% 1/1/10 | | | | 3,000 | | | | 3,187 |
| Series B, 6% 1/1/06 | | | | 6,170 | | | | 6,170 |
| Series C, 5% 1/1/08 | | | | 1,190 | | | | 1,221 |
| Series D, 5.375% 1/1/10 | | | | 3,715 | | | | 3,930 |
| | | | | | | | | 21,127 |
| |
| Ohio – 0.9% | | | | | | | | |
| Akron Ctfs. of Prtn. 5% 12/1/07 | | | | 2,350 | | | | 2,415 |
| Cleveland Pub. Pwr. Sys. Rev. (First Mtg. Prog.) | | | | | | | | |
| Series 1994 A, 0% 11/15/09 (MBIA Insured) | | | | 2,250 | | | | 1,949 |
| Franklin County Rev. (OCLC Online Computer Library | | | | | | | | |
| Ctr., Inc. Proj.) 5% 4/15/07 | | | | 1,960 | | | | 1,986 |
| Lakewood Hosp. Impt. Rev. (Lakewood Hosp. Assoc. | | | | | | | | |
| Proj.) 5.5% 2/15/07 | | | | 1,420 | | | | 1,447 |
See accompanying notes which are an integral part of the financial statements.
25 Annual Report
| Investments continued | | | | | | | | | | |
| |
| |
| Municipal Bonds continued | | | | | | | | | | |
| | | | | Principal | | Value (Note 1) |
| | | | | Amount (000s) | | (000s) |
| Ohio – continued | | | | | | | | | | |
| Ohio Air Quality Dev. Auth. Rev. Series 2002 A, 3.5%, | | | | | | | | |
| tender 1/1/06 (b) | | | | $ | | 1,000 | | $ | | 1,000 |
| Ohio Gen. Oblig.: | | | | | | | | | | |
| Series 2000 E, 5.5% 5/1/09 | | | | | | 1,905 | | | | 2,031 |
| Series 2003 D, 2.45%, tender 9/14/07 (b) | | | | 1,300 | | | | 1,277 |
| Ohio Univ. Gen. Receipts Athens 5% 12/1/07 | | | | | | | | |
| (FSA Insured) | | | | | | 1,285 | | | | 1,325 |
| Ohio Wtr. Dev. Auth. Wtr. Poll. Cont. Rev. (Ohio Edison | | | | | | | | |
| Co. Proj.) Series A, 3.35%, tender 6/1/06 (b) | | | | 1,800 | | | | 1,793 |
| | | | | | | | | | | 15,223 |
| |
| Oklahoma – 0.0% | | | | | | | | | | |
| Cherokee County Econ. Dev. Auth. Series A, 0% | | | | | | | | |
| 11/1/11 (Escrowed to Maturity) (d) | | | | | | 1,000 | | | | 792 |
| Oregon – 0.3% | | | �� | | | | | | | |
| Beaverton Wtr. Rev. Series B, 5% 6/1/10 (FSA Insured) . | | | | 1,210 | | | | 1,289 |
| Oregon Dept. Administrative Svcs. Ctfs. of Prtn. Series B: | | | | | | | | |
| 5% 5/1/09 (FSA Insured) | | | | | | 1,000 | | | | 1,050 |
| 5% 5/1/11 (FSA Insured) | | | | | | 1,000 | | | | 1,065 |
| Oregon Gen. Oblig. 8.25% 1/1/07 | | | | | | 1,000 | | | | 1,047 |
| | | | | | | | | | | 4,451 |
| |
| Pennsylvania – 4.5% | | | | | | | | | | |
| Allegheny County Arpt. Rev. (Pittsburgh Int’l. Arpt. Proj.) | | | | | | | | |
| Series A1, 5.75% 1/1/12 (MBIA Insured) (c) | | | | 1,300 | | | | 1,403 |
| Allegheny County Hosp. Dev. Auth. Rev. (Univ. of | | | | | | | | |
| Pittsburgh Med. Ctr. Proj.) Series B: | | | | | | | | | | |
| 5.5% 6/15/06 | | | | | | 3,065 | | | | 3,094 |
| 5.5% 6/15/07 | | | | | | 2,000 | | | | 2,057 |
| Allegheny County Indl. Dev. Auth. Rev. (Watson Institute | | | | | | | | |
| Ed. Ctr. Proj.) 3.375%, tender 5/1/08, LOC PNC | | | | | | | | |
| Bank NA, Pittsburgh (b) | | | | | | 4,500 | | | | 4,464 |
| Allegheny County San. Auth. Swr. Rev. 6% 12/1/11 | | | | | | | | |
| (MBIA Insured) | | | | | | 1,495 | | | | 1,676 |
| Hazleton Area School District 6.5% 3/1/06 | | | | | | | | |
| (FSA Insured) | | | | | | 1,155 | | | | 1,161 |
| Luzerne County Indl. Dev. Auth. Wtr. Facilities Rev. | | | | | | | | |
| (Pennsylvania-American Wtr. Co. Proj.) 3.6%, tender | | | | | | | | |
| 12/1/09 (AMBAC Insured) (b)(c) | | | | | | 10,000 | | | | 9,928 |
| Montgomery County Higher Ed. & Health Auth. Hosp. | | | | | | | | |
| Rev. (Abington Memorial Hosp. Proj.) Series A, 5% | | | | | | | | |
| 6/1/06 (AMBAC Insured) | | | | | | 3,750 | | | | 3,771 |
| |
| |
| See accompanying notes which are an integral part of the financial statements. | | | | |
| |
| Annual Report | | 26 | | | | | | | | |
| Municipal Bonds continued | | | | | | | | |
| | | Principal | | Value (Note 1) |
| | | Amount (000s) | | (000s) |
| Pennsylvania – continued | | | | | | | | |
| Pennsylvania Econ. Dev. Fing. Auth. Exempt Facilities | | | | | | | | |
| Rev. (Shippingport Proj.) Series A, 4.35%, tender | | | | | | | | |
| 6/1/10 (b)(c) | | $ | | 1,200 | | $ | | 1,179 |
| Pennsylvania Higher Edl. Facilities Auth. Rev.: | | | | | | | | |
| (Univ. of Pennsylvania Health Systems Proj.) Series A: | | | | | | | | |
| 4% 8/15/06 | | | | 1,405 | | | | 1,408 |
| 5% 8/15/07 | | | | 1,735 | | | | 1,769 |
| 5% 8/15/08 | | | | 2,000 | | | | 2,071 |
| (UPMC Health Sys. Proj.) Series 2001 A, 5.75% | | | | | | | | |
| 1/15/09 | | | | 1,750 | | | | 1,853 |
| Series B, 5.25% 9/1/08 | | | | 5,860 | | | | 6,137 |
| Pennsylvania Indl. Dev. Auth. Rev. 5.25% 7/1/10 | | | | | | | | |
| (AMBAC Insured) | | | | 2,750 | | | | 2,957 |
| Philadelphia Gas Works Rev. (1975 Gen. Ordinance | | | | | | | | |
| Proj.) 17th Series, 5% 7/1/08 (FSA Insured) | | | | 7,410 | | | | 7,692 |
| Philadelphia Muni. Auth. Rev.: | | | | | | | | |
| Series A: | | | | | | | | |
| 5% 5/15/07 (FSA Insured) | | | | 5,500 | | | | 5,620 |
| 5% 5/15/08 (FSA Insured) | | | | 5,000 | | | | 5,181 |
| Series B, 5.25% 11/15/11 (FSA Insured) | | | | 3,400 | | | | 3,686 |
| Philadelphia School District: | | | | | | | | |
| Series 2005 D, 5.25% 6/1/12 (FSA Insured) | | | | 1,465 | | | | 1,592 |
| Series B, 5% 4/1/11 (AMBAC Insured) | | | | 2,160 | | | | 2,309 |
| Pittsburgh Gen. Oblig. Series A, 6% 3/1/07 | | | | | | | | |
| (MBIA Insured) | | | | 2,000 | | | | 2,059 |
| Pittsburgh School District Series A, 5% 9/1/09 | | | | | | | | |
| (MBIA Insured) (a) | | | | 1,600 | | | | 1,668 |
| Westmoreland County Muni. Auth. Muni. Svc. Rev. | | | | | | | | |
| Series K, 0% 7/1/12 (Escrowed to Maturity) (d) | | | | 2,355 | | | | 1,827 |
| | | | | | | | | 76,562 |
| |
| Puerto Rico 0.1% | | | | | | | | |
| Puerto Rico Pub. Bldgs Auth. Rev. Series K, 4%, tender | | | | | | | | |
| 7/1/07 (MBIA Insured) (b) | | | | 1,000 | | | | 1,005 |
| Rhode Island – 0.4% | | | | | | | | |
| Providence Spl. Oblig. Series 2005 E: | | | | | | | | |
| 4% 6/1/08 (Radian Asset Assurance Ltd. Insured) | | | | 1,000 | | | | 1,009 |
| 5% 6/1/09 (Radian Asset Assurance Ltd. Insured) | | | | 1,315 | | | | 1,373 |
| 5% 6/1/10 (Radian Asset Assurance Ltd. Insured) | | | | 1,180 | | | | 1,239 |
See accompanying notes which are an integral part of the financial statements.
27 Annual Report
| Investments continued | | | | | | | | |
| |
| |
| Municipal Bonds continued | | | | | | | | |
| | | Principal | | Value (Note 1) |
| | | Amount (000s) | | (000s) |
| Rhode Island – continued | | | | | | | | |
| Rhode Island Health & Edl. Bldg. Corp. Rev. (Johnson & | | | | | | | | |
| Wales Univ. Proj.): | | | | | | | | |
| 5% 4/1/06 (XL Cap. Assurance, Inc. Insured) | | $ | | 2,225 | | $ | | 2,234 |
| 5% 4/1/08 (XL Cap. Assurance, Inc. Insured) | | | | 1,700 | | | | 1,760 |
| | | | | | | | | 7,615 |
| |
| South Carolina – 1.6% | | | | | | | | |
| Berkeley County School District 7% 4/1/07 | | | | 2,615 | | | | 2,733 |
| Charleston County Hosp. Facilities (Care Alliance Health | | | | | | | | |
| Services Proj.) Series A: | | | | | | | | |
| 5% 8/15/06 | | | | 1,000 | | | | 1,008 |
| 5% 8/15/07 | | | | 1,700 | | | | 1,735 |
| 5% 8/15/08 | | | | 1,690 | | | | 1,742 |
| Greenville County Pub. Facilities Corp. Certificate of | | | | | | | | |
| Prtn. (Courthouse and Detention Proj.) 5% 4/1/10 | | | | | | | | |
| (AMBAC Insured) | | | | 1,450 | | | | 1,544 |
| Piedmont Muni. Pwr. Agcy. Elec. Rev. 5.6% 1/1/09 | | | | | | | | |
| (MBIA Insured) | | | | 2,345 | | | | 2,501 |
| Rock Hill Util. Sys. Rev. Series 2003 A: | | | | | | | | |
| 5% 1/1/08 (FSA Insured) | | | | 1,850 | | | | 1,910 |
| 5% 1/1/09 (FSA Insured) | | | | 1,945 | | | | 2,041 |
| South Carolina Pub. Svc. Auth. Rev.: | | | | | | | | |
| Series 2005 B, 5% 1/1/10 (MBIA Insured) | | | | 3,000 | | | | 3,178 |
| Series A: | | | | | | | | |
| 5.5% 1/1/11 (MBIA Insured) | | | | 3,000 | | | | 3,243 |
| 5.5% 1/1/14 (FGIC Insured) | | | | 1,335 | | | | 1,502 |
| Series D, 5% 1/1/06 | | | | 2,750 | | | | 2,750 |
| Spartanburg County School District #5 Pub. Facilities | | | | | | | | |
| Corp. Ctfs. of Prtn. 5% 7/1/09 (FSA Insured) | | | | 1,000 | | | | 1,052 |
| | | | | | | | | 26,939 |
| |
| Tennessee – 0.9% | | | | | | | | |
| Elizabethton Health & Edl. Facilities Board Rev. (First | | | | | | | | |
| Mtg. Prog.) 6% 7/1/11 (MBIA Insured) | | | | 2,005 | | | | 2,233 |
| Maury County Gen. Oblig. Series 2004 B, 5% 4/1/10 | | | | | | | | |
| (MBIA Insured) | | | | 2,000 | | | | 2,125 |
| Memphis-Shelby County Arpt. Auth. Arpt. Rev. Series A: | | | | | | | | |
| 4.5% 9/1/08 (MBIA Insured) | | | | 1,620 | | | | 1,663 |
| 4.5% 9/1/09 (MBIA Insured) | | | | 1,685 | | | | 1,741 |
| Metropolitan Govt. Nashville & Series A, 5.25% | | | | | | | | |
| 10/15/09 | | | | 3,795 | | | | 4,039 |
See accompanying notes which are an integral part of the financial statements.
| Municipal Bonds continued | | | | | | | | | | |
| | | | | Principal | | Value (Note 1) |
| | | | | Amount (000s) | | (000s) |
| Tennessee – continued | | | | | | | | | | |
| Metropolitan Nashville Arpt. Auth. Rev. Series C, 5% | | | | | | | | | | |
| 7/1/06 (FGIC Insured) (c) | | | | $ | | 1,675 | | $ | | 1,687 |
| Shelby County Health Edl. & Hsg. Facility Board Hosp. | | | | | | | | | | |
| Rev. (Methodist Health Care Proj.) 5.5% 4/1/09 | | | | | | | | | | |
| (MBIA Insured) | | | | | | 1,200 | | | | 1,268 |
| | | | | | | | | | | 14,756 |
| |
| Texas 14.7% | | | | | | | | | | |
| Alief Independent School District Series 2004 B, 5% | | | | | | | | | | |
| 2/15/10 | | | | | | 1,500 | | | | 1,589 |
| Arlington Independent School District 5% 2/15/13 | | | | | | 2,500 | | | | 2,692 |
| Austin Independent School District 5% 8/1/07 (a) | | | | | | 3,605 | | | | 3,669 |
| Austin Util. Sys. Rev.: | | | | | | | | | | |
| Series 1992 A, 0% 11/15/09 (MBIA Insured) | | | | | | 5,130 | | | | 4,451 |
| Series A, 0% 11/15/10 (MBIA Insured) | | | | | | 5,300 | | | | 4,412 |
| Austin Wtr. & Wastewtr. Sys. Rev. 5% 11/15/07 | | | | | | | | | | |
| (MBIA Insured) (a) | | | | | | 3,295 | | | | 3,362 |
| Bexar County Series A: | | | | | | | | | | |
| 5% 6/15/09 (FSA Insured) | | | | | | 2,615 | | | | 2,751 |
| 5% 6/15/10 (FSA Insured) | | | | | | 1,000 | | | | 1,062 |
| Birdville Independent School District 5% 2/15/10 | | | | | | 1,300 | | | | 1,377 |
| Brazos River Auth. Poll. Cont. Rev. (Texas Utils. Elec. Co. | | | | | | | | |
| Proj.) Series 1995 B, 5.05%, tender 6/19/06 (b)(c) | | | | | | 6,255 | | | | 6,279 |
| Brownsville Independent School District 5% 8/15/11 | | | | | | 1,430 | | | | 1,528 |
| Bryan Wtrwks. & Swr. Sys. Rev. 5.5% 7/1/11 (FSA | | | | | | | | | | |
| Insured) | | | | | | 1,500 | | | | 1,642 |
| College Station Independent School District 5% 2/15/10 | | | | 1,000 | | | | 1,059 |
| Conroe Independent School District Lot B, 0% 2/15/08 | | . | | | | 3,000 | | | | 2,785 |
| Corpus Christi Gen. Oblig. 5% 3/1/07 (FSA Insured) | | | | | | 2,735 | | | | 2,787 |
| Corpus Christi Util. Sys. Rev.: | | | | | | | | | | |
| 5% 7/15/12 (FSA Insured) | | | | | | 1,000 | | | | 1,077 |
| 5% 7/15/13 (FSA Insured) | | | | | | 1,665 | | | | 1,800 |
| Cypress-Fairbanks Independent School District: | | | | | | | | | | |
| Series B, 0% 8/1/07 (AMBAC Insured) | | | | | | 10,000 | | | | 9,476 |
| 5% 2/15/08 | | | | | | 2,000 | | | | 2,067 |
| Dallas Independent School District Series 2005, 5.25% | | | | | | | | | | |
| 8/15/08 | | | | | | 2,000 | | | | 2,093 |
| Del Valle Independent School District 5.5% 2/1/09 | | | | | | 1,205 | | | | 1,279 |
| Denton County Gen. Oblig.: | | | | | | | | | | |
| 5% 7/15/11 (FSA Insured) | | | | | | 3,065 | | | | 3,272 |
| 5% 7/15/13 (FSA Insured) | | | | | | 1,200 | | | | 1,293 |
| El Paso Wtr. & Swr. Rev. 5% 3/1/08 (AMBAC Insured) | | . | | | | 2,770 | | | | 2,866 |
| |
| See accompanying notes which are an integral part of the financial statements. | | | | |
| |
| 29 | | | | | | | | Annual Report |
| Investments continued | | | | | | | | | | |
| |
| |
| Municipal Bonds continued | | | | | | | | | | |
| | | | | Principal | | Value (Note 1) |
| | | | | Amount (000s) | | (000s) |
| Texas continued | | | | | | | | | | |
| Fort Bend Independent School District 5%, tender | | | | | | | | | | |
| 8/15/09 (b) | | | | $ | | 5,000 | | $ | | 5,237 |
| Fort Worth Independent School District 5% 2/15/12 | | | | | | 1,500 | | | | 1,612 |
| Frisco Gen. Oblig. Series 2003 A: | | | | | | | | | | |
| 4% 2/15/08 (FSA Insured) | | | | | | 1,145 | | | | 1,161 |
| 5% 2/15/10 (FSA Insured) | | | | | | 1,710 | | | | 1,811 |
| Garland Independent School District 0% 2/15/07 | | | | | | 1,610 | | | | 1,550 |
| Harris County Gen. Oblig. Series A, 0% 8/15/07 | | | | | | | | | | |
| (FGIC Insured) | | | | | | 4,400 | | | | 4,164 |
| Harris County Health Facilities Dev. Corp. Rev. (Saint | | | | | | | | | | |
| Luke’s Episcopal Hosp. Proj.) Series 2001 A, 5.5% | | | | | | | | | | |
| 2/15/09 | | | | | | 3,710 | | | | 3,916 |
| Houston Cmnty. College Sys. Rev.: | | | | | | | | | | |
| 5.25% 4/15/11 (FSA Insured) | | | | | | 3,030 | | | | 3,277 |
| 5.25% 4/15/12 (FSA Insured) | | | | | | 2,000 | | | | 2,182 |
| Houston Util. Sys. Rev. Series A: | | | | | | | | | | |
| 5.25% 5/15/10 (MBIA Insured) | | | | | | 1,250 | | | | 1,340 |
| 5.25% 11/15/11 (FSA Insured) | | | | | | 4,430 | | | | 4,815 |
| Irving Independent School District 5.25% 2/15/13 | | | | | | 2,145 | | | | 2,343 |
| Katy Independent School District Series A, 5.25% | | | | | | | | | | |
| 2/15/12 | | | | | | 2,000 | | | | 2,176 |
| Killeen Independent School District 4% 2/15/08 | | | | | | 1,200 | | | | 1,216 |
| Klein Independent School District Series A, 5% 8/1/12 | | . | | | | 2,250 | | | | 2,415 |
| La Porte Independent School District 4% 2/15/08 | | | | | | 2,000 | | | | 2,026 |
| Lower Colorado River Auth. Rev.: | | | | | | | | | | |
| 0% 1/1/09 (Escrowed to Maturity) (d) | | | | | | 3,000 | | | | 2,695 |
| 5.25% 1/1/15 (Pre-Refunded to 1/1/11 @ 100) (d) | | . | | | | 5,000 | | | | 5,376 |
| Lubbock Gen. Oblig.: | | | | | | | | | | |
| (Wtrwks. Sys. Surplus Proj.) 5% 2/15/11 (FSA Insured) | | | | 2,465 | | | | 2,632 |
| 5% 2/15/09 (MBIA Insured) | | | | | | 1,615 | | | | 1,691 |
| 5% 2/15/10 (MBIA Insured) | | | | | | 1,845 | | | | 1,954 |
| Mesquite Independent School District: | | | | | | | | | | |
| Series A, 0% 8/15/06 | | | | | | 1,115 | | | | 1,093 |
| 3.65%, tender 12/1/08 (Liquidity Facility JPMorgan | | | | | | | | | | |
| Chase Bank) (b) | | | | | | 2,500 | | | | 2,500 |
| New Braunfels Independent School District 0% 2/1/07 | | . | | | | 2,000 | | | | 1,928 |
| North East Texas Independent School District 7% 2/1/11 | | | | | | | | |
| (Pre-Refunded to 2/1/10 @ 100) (d) | | | | | | 3,600 | | | | 4,076 |
| North Texas Tollway Auth. Dallas North Tollway Sys. Rev. | | | | | | | | |
| Series C: | | | | | | | | | | |
| 5% 1/1/09 (FSA Insured) | | | | | | 2,000 | | | | 2,093 |
| 5%, tender 7/1/08 (FSA Insured) (b) | | | | | | 2,650 | | | | 2,751 |
See accompanying notes which are an integral part of the financial statements.
| Municipal Bonds continued | | | | | | | | |
| | | Principal | | Value (Note 1) |
| | | Amount (000s) | | (000s) |
| Texas continued | | | | | | | | |
| Northside Independent School District Series B, 2.45%, | | | | | | | | |
| tender 8/1/06 (Liquidity Facility Dexia Cr. Local de | | | | | | | | |
| France) (b) | | $ | | 7,100 | | $ | | 7,066 |
| Port Houston Auth. Harris County 6% 10/1/06 | | | | | | | | |
| (FGIC Insured) (c) | | | | 2,000 | | | | 2,037 |
| Red River Ed. Fin. Corp. Ed. Rev. (Texas Christian Univ. | | | | | | | | |
| Proj.) 5% 3/15/12 (MBIA Insured) | | | | 2,625 | | | | 2,817 |
| Rockwall Independent School District: | | | | | | | | |
| 5% 2/15/08 | | | | 3,825 | | | | 3,952 |
| 5% 2/15/09 | | | | 4,690 | | | | 4,911 |
| San Angelo Wtrks & Swr. Sys. Impt. and Rfdg. Rev. 5% | | | | | | | | |
| 4/1/10 (FSA Insured) | | | | 1,630 | | | | 1,729 |
| San Antonio Elec. & Gas Systems Rev.: | | | | | | | | |
| Series 2000 A, 5.75% 2/1/15 (Pre-Refunded to | | | | | | | | |
| 2/1/10 @ 100) (d) | | | | 5,000 | | | | 5,425 |
| 3.55%, tender 12/1/07 (b) | | | | 6,700 | | | | 6,702 |
| 5.25% 2/1/08 | | | | 1,000 | | | | 1,038 |
| San Antonio Independent School District 7% 8/15/08 | | | | 5,000 | | | | 5,442 |
| San Antonio Muni. Drainage Util. Sys. Rev. 5.25% | | | | | | | | |
| 2/1/12 (MBIA Insured) | | | | 1,545 | | | | 1,681 |
| San Antonio Wtr. Sys. Rev. 5% 5/15/10 (FGIC Insured) | | | | 1,020 | | | | 1,083 |
| Socorro Independent School District 5% 8/15/09 | | | | 2,070 | | | | 2,179 |
| Spring Branch Independent School District Series 2001, | | | | | | | | |
| 5.375% 2/1/14 | | | | 2,790 | | | | 3,012 |
| Spring Independent School District 5% 2/15/08 | | | | 1,875 | | | | 1,937 |
| Texas Gen. Oblig.: | | | | | | | | |
| (College Student Ln. Prog.) 5% 8/1/11 (c) | | | | 3,000 | | | | 3,103 |
| Series 1992 A, 8% 10/1/07 | | | | 10,000 | | | | 10,785 |
| Series A, 6% 10/1/08 (MBIA Insured) | | | | 10,750 | | | | 11,495 |
| Series C, 0% 4/1/08 (Escrowed to Maturity) (d) | | | | 3,100 | | | | 2,866 |
| Texas Pub. Fin. Auth. Rev. (Bldg. and Procurement | | | | | | | | |
| Commission Projs.) Series A, 5% 2/1/10 | | | | | | | | |
| (AMBAC Insured) | | | | 1,055 | | | | 1,117 |
| Texas State Univ. Sys. Fing. Rev. 5% 3/15/13 | | | | | | | | |
| (FSA Insured) | | | | 2,000 | | | | 2,163 |
| Texas Tech Univ. Revs. Ninth Series, 5% 2/15/11 | | | | | | | | |
| (AMBAC Insured) | | | | 1,250 | | | | 1,335 |
| Travis County Gen. Oblig. 5.25% 3/1/12 | | | | 4,125 | | | | 4,481 |
| Tyler Health Facilities Dev. Corp. Hosp. Rev. (Mother | | | | | | | | |
| Frances Hosp. Reg’l. Health Care Ctr. Proj.): | | | | | | | | |
| 4.5% 7/1/06 | | | | 1,220 | | | | 1,224 |
| 5% 7/1/07 | | | | 1,000 | | | | 1,015 |
See accompanying notes which are an integral part of the financial statements.
31 Annual Report
| Investments continued | | | | | | | | | | |
| |
| |
| Municipal Bonds continued | | | | | | | | | | |
| | | | | Principal | | Value (Note 1) |
| | | | | Amount (000s) | | (000s) |
| Texas continued | | | | | | | | | | |
| Univ. of Texas Univ. Revs.: | | | | | | | | | | |
| (Fing. Sys. Proj.) Series A, 5.5% 8/15/09 | | $ | | 1,115 | | $ | | 1,192 |
| Series B: | | | | | | | | | | |
| 5% 8/15/09 | | | | | | 13,555 | | | | 14,262 |
| 5.25% 8/15/11 | | | | | | 5,025 | | | | 5,435 |
| Webb County Gen. Oblig. 5% 2/15/08 (FGIC Insured) . | | | | 1,170 | | | | 1,210 |
| Wichita Falls Independent School District 0% 2/1/10 | | | | 2,325 | | | | 1,995 |
| | | | | | | | | | | 251,387 |
| |
| Utah 0.6% | | | | | | | | | | |
| Salt Lake County Wtr. Conservancy District Rev. Series A: | | | | | | | | |
| 0% 10/1/11 (AMBAC Insured) | | | | | | 3,800 | | | | 3,024 |
| 0% 10/1/12 (AMBAC Insured) | | | | | | 3,800 | | | | 2,891 |
| 0% 10/1/13 (AMBAC Insured) | | | | | | 3,760 | | | | 2,730 |
| Utah Bldg. Ownership Auth. Lease Rev. (State Facilities | | | | | | | | |
| Master Lease Prog.) Series A, 5% 5/15/11 | | | | 1,700 | | | | 1,821 |
| | | | | | | | | | | 10,466 |
| |
| Virginia – 0.1% | | | | | | | | | | |
| Amelia County Indl. Dev. Auth. Solid Waste Disp. Rev. | | | | | | | | |
| (Waste Mgmt., Inc. Proj.) 4.05%, tender 4/1/08 (b)(c) | | | | 1,000 | | | | 1,000 |
| Washington 4.8% | | | | | | | | | | |
| Chelan County Pub. Util. District #1 Rev. Series B, 5% | | | | | | | | |
| 7/1/11 (FGIC Insured) | | | | | | 1,190 | | | | 1,273 |
| Clark County Pub. Util. District #1 Elec. Rev.: | | | | | | | | |
| Series B: | | | | | | | | | | |
| 5% 1/1/06 (FSA Insured) | | | | | | 1,375 | | | | 1,375 |
| 5.25% 1/1/08 (FSA Insured) | | | | | | 1,515 | | | | 1,569 |
| 5.25% 1/1/09 (FSA Insured) | | | | | | 1,595 | | | | 1,681 |
| 5% 1/1/11 (MBIA Insured) | | | | | | 1,680 | | | | 1,791 |
| 5.25% 1/1/11 (FSA Insured) | | | | | | 1,935 | | | | 2,085 |
| King & Snohomish Counties School District #417 | | | | | | | | |
| Northshore: | | | | | | | | | | |
| 5.5% 12/1/14 (Pre-Refunded to 6/1/12 @ 100) (d) . | | | | 6,300 | | | | 6,979 |
| 5.75% 12/1/15 (Pre-Refunded to 6/1/12 @ 100) (d) | | | | 2,500 | | | | 2,805 |
| King County School District #409, Tahoma 5% 6/1/11 | | | | | | | | |
| (FSA Insured) | | | | | | 1,740 | | | | 1,864 |
| King County Swr. Rev. Series B, 5.25% 1/1/08 | | | | | | | | |
| (FSA Insured) | | | | | | 3,500 | | | | 3,628 |
| Pierce County Gen. Oblig. 5.75% 8/1/13 | | | | | | | | |
| (Pre-Refunded to 8/1/10 @ 100) (d) | | | | | | 1,155 | | | | 1,265 |
| Pierce County School District #10 Tacoma Series A, 5% | | | | | | | | |
| 12/1/12 (FSA Insured) | | | | | | 4,175 | | | | 4,498 |
See accompanying notes which are an integral part of the financial statements. | | | | |
| |
| Annual Report | | 32 | | | | | | | | |
| Municipal Bonds continued | | | | | | | | | | |
| | | Principal | | | | Value (Note 1) |
| | | Amount (000s) | | | | (000s) |
| Washington – continued | | | | | | | | | | |
| Port of Seattle Rev. Series D, 5.75% 11/1/15 | | | | | | | | | | |
| (FGIC Insured) (c) | | $ | | 3,640 | | | | $ | | 3,990 |
| Seattle Muni. Lt. & Pwr. Rev. 5.25% 3/1/07 | | | | | | | | | | |
| (FSA Insured) | | | | 1,690 | | | | | | 1,726 |
| Snohomish County Pub. Hosp. District #2 (Stevens Health | | | | | | | | | | |
| Care Proj.) 4.5% 12/1/09 (FGIC Insured) | | | | 1,000 | | | | | | 1,036 |
| Snohomish County School District #2, Everett: | | | | | | | | | | |
| 5% 6/1/09 (FSA Insured) | | | | 1,045 | | | | | | 1,100 |
| 5% 6/1/10 (FSA Insured) | | | | 1,000 | | | | | | 1,063 |
| Vancouver Wtr. & Swr. Rev. 5.25% 6/1/11 | | | | | | | | | | |
| (FSA Insured) | | | | 1,000 | | | | | | 1,083 |
| Washington Gen. Oblig. Series A: | | | | | | | | | | |
| 4% 1/1/08 (MBIA Insured) | | | | 33,175 | | | | | | 33,592 |
| 5% 7/1/11 (FGIC Insured) | | | | 1,000 | | | | | | 1,070 |
| 5.5% 7/1/11 | | | | 3,500 | | | | | | 3,762 |
| Washington Pub. Pwr. Supply Sys. Nuclear Proj. #2 Rev. | | | | | | | | | | |
| Series A, 5.75% 7/1/08 | | | | 3,000 | | | | | | 3,165 |
| | | | | | | | | | | 82,400 |
| |
| Wisconsin – 1.5% | | | | | | | | | | |
| Milwaukee County Gen. Oblig. Series A, 0% 12/1/10 | | | | | | | | | | |
| (FGIC Insured) | | | | 3,370 | | | | | | 2,783 |
| Wisconsin Gen. Oblig. Series 1, 5% 5/1/10 | | | | | | | | | | |
| (MBIA Insured) (a) | | | | 2,500 | | | | | | 2,653 |
| Wisconsin Health & Edl. Facilities Auth. Rev.: | | | | | | | | | | |
| (Hosp. Sisters Svcs., Inc. Proj.) Series 2003 B, 4%, | | | | | | | | | | |
| tender 12/1/06 (FSA Insured) (b) | | | | 15,000 | | | | | | 15,083 |
| (Wheaton Franciscan Svcs., Inc. Proj.) Series A: | | | | | | | | | | |
| 5% 8/15/09 | | | | 1,000 | | | | | | 1,039 |
| 5% 8/15/10 | | | | 1,870 | | | | | | 1,946 |
| Wisconsin Trans. Rev. 5% 7/1/07 | | | | 1,500 | | | | | | 1,536 |
| | | | | | | | | | | 25,040 |
| |
| |
| TOTAL INVESTMENT PORTFOLIO 99.8% | | | | | | | | | | |
| (Cost $1,716,088) | | | | | | | | 1,707,108 |
| |
| NET OTHER ASSETS – 0.2% | | | | | | | | | | 3,162 |
| NET ASSETS 100% | | | | | | | | $ | | 1,710,270 |
See accompanying notes which are an integral part of the financial statements.
33 Annual Report
Investments continued
Legend
(a) Security or a portion of the security
purchased on a delayed delivery or
when-issued basis.
(b) The coupon rate shown on floating or
adjustable rate securities represents the
rate at period end.
(c) Private activity obligations whose
interest is subject to the federal
alternative minimum tax for individuals.
(d) Security collateralized by an amount
sufficient to pay interest and principal.
|
(e) Restricted securities – Investment in
securities not registered under the
Securities Act of 1933 (excluding 144A
issues). At the end of the period, the
value of restricted securities (excluding
144A issues) amounted to $9,063,000
or 0.5% of net assets.
|
Additional information on each holding is as follows:
| | | Acquisition | | Acquisition |
| Security | | Date | | Cost (000s) |
| Univ. of California | | | | | | |
| Revs. (UCLA Med. | | | | | | |
| Ctr. Proj.) 4.55% | | | | | | |
| 12/1/09 | | 3/6/02 | | $ | | 8,955 |
Affiliated Central Funds
Information regarding income received by the fund from the affiliated Central funds during the period is as follows:
| Fund | | Income received |
| | | (Amounts in Thousands) |
| Fidelity Municipal Cash Central Fund | | $ | | 238 |
Other Information
The distribution of municipal securities by revenue source, as a percentage of total net assets, is as follows:
| General Obligations | | 49.1% |
| Electric Utilities | | 13.8% |
| Escrowed/Pre Refunded | | 8.2% |
| Transportation | | 6.7% |
| Health Care | | 6.5% |
| Education | | 5.3% |
| Others* (individually less than 5%) | | 10.4% |
| | | 100.0% |
| *Includes net other assets | | |
Income Tax Information
At December 31, 2005, the fund had a capital loss carryforward of approximately $699,000 all of which will expire on December 31, 2013.
See accompanying notes which are an integral part of the financial statements.
Annual Report 34
| Financial Statements | | | | | | | | |
| |
| |
| Statement of Assets and Liabilities | | | | | | | | |
| Amounts in thousands (except per share amounts) | | | | | | December 31, 2005 |
| |
| Assets | | | | | | | | |
| Investment in securities, at value | | | | | | | | |
| See accompanying schedule: | | | | | | | | |
| Unaffiliated issuers (cost $1,716,088) | | | | | | $ | | 1,707,108 |
| Cash | | | | | | | | 6,150 |
| Receivable for fund shares sold | | | | | | | | 2,394 |
| Interest receivable | | | | | | | | 22,071 |
| Prepaid expenses | | | | | | | | 9 |
| Other receivables | | | | | | | | 56 |
| Total assets | | | | | | | | 1,737,788 |
| |
| Liabilities | | | | | | | | |
| Payable for investments purchased | | | | | | | | |
| Regular delivery | | $ | | 5 | | | | |
| Delayed delivery | | | | 19,326 | | | | |
| Payable for fund shares redeemed | | | | 6,201 | | | | |
| Distributions payable | | | | 1,209 | | | | |
| Accrued management fee | | | | 543 | | | | |
| Distribution fees payable | | | | 16 | | | | |
| Other affiliated payables | | | | 153 | | | | |
| Other payables and accrued expenses | | | | 65 | | | | |
| Total liabilities | | | | | | | | 27,518 |
| |
| Net Assets | | | | | | $ | | 1,710,270 |
| Net Assets consist of: | | | | | | | | |
| Paid in capital | | | | | | $ | | 1,721,093 |
| Distributions in excess of net investment income | | | | | | | | (3) |
| Accumulated undistributed net realized gain (loss) on | | | | | | | | |
| investments | | | | | | | | (1,840) |
| Net unrealized appreciation (depreciation) on | | | | | | | | |
| investments | | | | | | | | (8,980) |
| Net Assets | | | | | | $ | | 1,710,270 |
See accompanying notes which are an integral part of the financial statements.
35 Annual Report
| Financial Statements continued | | | | |
| |
| |
| |
| Statement of Assets and Liabilities continued | | | | |
| Amounts in thousands (except per share amounts) | | December 31, 2005 |
| |
| Calculation of Maximum Offering Price | | | | |
| Class A: | | | | |
| Net Asset Value and redemption price per share | | | | |
| ($14,402 ÷ 1,409.90 shares) | | $ | | 10.21 |
| |
| Maximum offering price per share (100/96.25 of $10.21) | | $ | | 10.61 |
| Class T: | | | | |
| Net Asset Value and redemption price per share | | | | |
| ($14,877 ÷ 1,458.63 shares) | | $ | | 10.20 |
| |
| Maximum offering price per share (100/97.25 of $10.20) | | $ | | 10.49 |
| Class B: | | | | |
| Net Asset Value and offering price per share | | | | |
| ($3,443 ÷ 337.18 shares)A | | $ | | 10.21 |
| |
| Class C: | | | | |
| Net Asset Value and offering price per share | | | | |
| ($10,240 ÷ 1,003.84 shares)A | | $ | | 10.20 |
| |
| Short Intermediate Municipal Income: | | | | |
| Net Asset Value, offering price and redemption price per | | | | |
| share ($1,664,683 ÷ 163,188.52 shares) | | $ | | 10.20 |
| |
| Institutional Class: | | | | |
| Net Asset Value, offering price and redemption price per | | | | |
| share ($2,625 ÷ 257.23 shares) | | $ | | 10.20 |
| |
| A Redemption price per share is equal to net asset value less any applicable contingent deferred sales charge. | | | | |
See accompanying notes which are an integral part of the financial statements.
Annual Report 36
| Statement of Operations | | | | | | |
| Amounts in thousands | | | | Year ended December 31, 2005 |
| |
| Investment Income | | | | | | |
| Interest | | | | $ | | 59,148 |
| Income from affiliated Central Funds | | | | | | 238 |
| Total income | | | | | | 59,386 |
| |
| Expenses | | | | | | |
| Management fee | | $ | | 6,951 | | |
| Transfer agent fees | | | | 1,501 | | |
| Distribution fees | | | | 210 | | |
| Accounting fees and expenses | | | | 362 | | |
| Independent trustees’ compensation | | | | 8 | | |
| Custodian fees and expenses | | | | 29 | | |
| Registration fees | | | | 114 | | |
| Audit | | | | 55 | | |
| Legal | | | | 13 | | |
| Miscellaneous | | | | 39 | | |
| Total expenses before reductions | | | | 9,282 | | |
| Expense reductions | | | | (1,241) | | 8,041 |
| |
| Net investment income | | | | | | 51,345 |
| Realized and Unrealized Gain (Loss) | | | | | | |
| Net realized gain (loss) on: | | | | | | |
| Investment securities: | | | | | | |
| Unaffiliated issuers | | | | | | (1,840) |
| Change in net unrealized appreciation (depreciation) on | | | | |
| investment securities | | | | | | (29,976) |
| Net gain (loss) | | | | | | (31,816) |
| Net increase (decrease) in net assets resulting from | | | | | | |
| operations | | | | $ | | 19,529 |
See accompanying notes which are an integral part of the financial statements.
37 Annual Report
| Financial Statements continued | | | | | | | | |
| |
| |
| Statement of Changes in Net Assets | | | | | | | | |
| | | | | Year ended | | | | Year ended |
| | | | | December 31, | | | | December 31, |
| Amounts in thousands | | | | 2005 | | | | 2004 |
| Increase (Decrease) in Net Assets | | | | | | | | |
| Operations | | | | | | | | |
| Net investment income | | $ | | 51,345 | | $ | | 47,437 |
| Net realized gain (loss) | | | | (1,840) | | | | 4,712 |
| Change in net unrealized appreciation (depreciation) . | | (29,976) | | | | (22,609) |
| Net increase (decrease) in net assets resulting | | | | | | | | |
| from operations | | | | 19,529 | | | | 29,540 |
| Distributions to shareholders from net investment income | | . | | (51,341) | | | | (47,598) |
| Distributions to shareholders from net realized gain | | | | (549) | | | | (3,486) |
| Total distributions | | | | (51,890) | | | | (51,084) |
| Share transactions - net increase (decrease) | | | | (147,427) | | | | 37,160 |
| Redemption fees | | | | 25 | | | | 65 |
| Total increase (decrease) in net assets | | | | (179,763) | | | | 15,681 |
| |
| Net Assets | | | | | | | | |
| Beginning of period | | | | 1,890,033 | | | | 1,874,352 |
| End of period (including distributions in excess of net | | | | | | | | |
| investment income of $3 and undistributed net | | | | | | | | |
| investment income of $190, respectively) | | $ | | 1,710,270 | | $ | | 1,890,033 |
See accompanying notes which are an integral part of the financial statements.
| Financial Highlights Class A | | | | | | | | | | | | |
| |
| Years ended December 31, | | | | 2005 | | | | 2004 | | | | 2003F |
| Selected Per Share Data | | | | | | | | | | | | |
| Net asset value, beginning of period | | | | $ 10.39 | | | | $ 10.50 | | | | $ 10.49 |
| Income from Investment Operations | | | | | | | | | | | | |
| Net investment incomeE | | | | 268 | | | | .250 | | | | .115 |
| Net realized and unrealized gain (loss) | | | | (.177) | | | | (.090) | | | | .071 |
| Total from investment operations | | | | 091 | | | | .160 | | | | .186 |
| Distributions from net investment income | | | | (.268) | | | | (.251) | | | | (.111) |
| Distributions from net realized gain | | | | (.003) | | | | (.019) | | | | (.065) |
| Total distributions | | | | (.271) | | | | (.270) | | | | (.176) |
| Redemption fees added to paid in capitalE,H | | | | — | | | | — | | | | — |
| Net asset value, end of period | | | | $ 10.21 | | | | $ 10.39 | | | | $ 10.50 |
| Total ReturnB,C,D | | | | 89% | | | | 1.55% | | | | 1.78% |
| Ratios to Average Net AssetsG | | | | | | | | | | | | |
| Expenses before reductions | | | | 65% | | | | .65% | | | | .65%A |
| Expenses net of fee waivers, if any | | | | 65% | | | | .65% | | | | .65%A |
| Expenses net of all reductions | | | | 58% | | | | .64% | | | | .64%A |
| Net investment income | | | | 2.61% | | | | 2.41% | | | | 2.52%A |
| Supplemental Data | | | | | | | | | | | | |
| Net assets, end of period (in millions) | | | | $ 14 | | | | $ 12 | | | | $ 9 |
| Portfolio turnover rate | | | | 27% | | | | 45% | | | | 34% |
A Annualized
B Total returns for periods of less than one year are not annualized.
C Total returns would have been lower had certain expenses not been reduced during the periods shown.
D Total returns do not include the effect of the sales charges.
E Calculated based on average shares outstanding during the period.
F For the period July 23, 2003 (commencement of sale of shares) to December 31, 2003.
G Expense ratios reflect operating expenses of the class. Expenses before reductions do not reflect amounts reimbursed by the investment adviser or
expense offset arrangements and do not represent the amount paid by the class during periods when reimbursements or reductions occur. Expense
ratios before reductions for start up periods may not be representative of longer term operating periods. Expenses net of fee waivers reflect
expenses after reimbursement by the investment adviser but prior to reductions from expense offset arrangements. Expenses net of all reductions
represent the net expenses paid by the class.
H Amount represents less than $.001 per share.
|
See accompanying notes which are an integral part of the financial statements.
39 Annual Report
| Financial Highlights Class T | | | | | | | | | | | | |
| |
| Years ended December 31, | | | | 2005 | | | | 2004 | | | | 2003F |
| Selected Per Share Data | | | | | | | | | | | | |
| Net asset value, beginning of period | | | | $ 10.37 | | | | $ 10.48 | | | | $ 10.49 |
| Income from Investment Operations | | | | | | | | | | | | |
| Net investment incomeE | | | | 257 | | | | .238 | | | | .110 |
| Net realized and unrealized gain (loss) | | | | (.167) | | | | (.089) | | | | .050 |
| Total from investment operations | | | | 090 | | | | .149 | | | | .160 |
| Distributions from net investment income | | | | (.257) | | | | (.240) | | | | (.105) |
| Distributions from net realized gain | | | | (.003) | | | | (.019) | | | | (.065) |
| Total distributions | | | | (.260) | | | | (.259) | | | | (.170) |
| Redemption fees added to paid in capitalE,H | | | | — | | | | — | | | | — |
| Net asset value, end of period | | | | $ 10.20 | | | | $ 10.37 | | | | $ 10.48 |
| Total ReturnB,C,D | | | | 88% | | | | 1.44% | | | | 1.54% |
| Ratios to Average Net AssetsG | | | | | | | | | | | | |
| Expenses before reductions | | | | 76% | | | | .76% | | | | .77%A |
| Expenses net of fee waivers, if any | | | | 76% | | | | .76% | | | | .77%A |
| Expenses net of all reductions | | | | 69% | | | | .75% | | | | .76%A |
| Net investment income | | | | 2.50% | | | | 2.30% | | | | 2.41%A |
| Supplemental Data | | | | | | | | | | | | |
| Net assets, end of period (in millions) | | | | $ 15 | | | | $ 20 | | | | $ 12 |
| Portfolio turnover rate | | | | 27% | | | | 45% | | | | 34% |
A Annualized
B Total returns for periods of less than one year are not annualized.
C Total returns would have been lower had certain expenses not been reduced during the periods shown.
D Total returns do not include the effect of the sales charges.
E Calculated based on average shares outstanding during the period.
F For the period July 23, 2003 (commencement of sale of shares) to December 31, 2003.
G Expense ratios reflect operating expenses of the class. Expenses before reductions do not reflect amounts reimbursed by the investment adviser or
expense offset arrangements and do not represent the amount paid by the class during periods when reimbursements or reductions occur. Expense
ratios before reductions for start up periods may not be representative of longer term operating periods. Expenses net of fee waivers reflect
expenses after reimbursement by the investment adviser but prior to reductions from expense offset arrangements. Expenses net of all reductions
represent the net expenses paid by the class.
H Amount represents less than $.001 per share.
|
See accompanying notes which are an integral part of the financial statements.
| Financial Highlights Class B | | | | | | | | | | | | |
| |
| Years ended December 31, | | | | 2005 | | | | 2004 | | | | 2003F |
| Selected Per Share Data | | | | | | | | | | | | |
| Net asset value, beginning of period | | | | $ 10.39 | | | | $ 10.49 | | | | $ 10.49 |
| Income from Investment Operations | | | | | | | | | | | | |
| Net investment incomeE | | | | 190 | | | | .172 | | | | .081 |
| Net realized and unrealized gain (loss) | | | | (.177) | | | | (.080) | | | | .059 |
| Total from investment operations | | | | 013 | | | | .092 | | | | .140 |
| Distributions from net investment income | | | | (.190) | | | | (.173) | | | | (.075) |
| Distributions from net realized gain | | | | (.003) | | | | (.019) | | | | (.065) |
| Total distributions | | | | (.193) | | | | (.192) | | | | (.140) |
| Redemption fees added to paid in capitalE,H | | | | — | | | | — | | | | — |
| Net asset value, end of period | | | | $ 10.21 | | | | $ 10.39 | | | | $ 10.49 |
| Total ReturnB,C,D | | | | 13% | | | | .89% | | | | 1.34% |
| Ratios to Average Net AssetsG | | | | | | | | | | | | |
| Expenses before reductions | | | | 1.41% | | | | 1.40% | | | | 1.40%A |
| Expenses net of fee waivers, if any | | | | 1.41% | | | | 1.40% | | | | 1.40%A |
| Expenses net of all reductions | | | | 1.34% | | | | 1.39% | | | | 1.39%A |
| Net investment income | | | | 1.85% | | | | 1.65% | | | | 1.78%A |
| Supplemental Data | | | | | | | | | | | | |
| Net assets, end of period (in millions) | | | | $ 3 | | | | $ 4 | | | | $ 2 |
| Portfolio turnover rate | | | | 27% | | | | 45% | | | | 34% |
A Annualized
B Total returns for periods of less than one year are not annualized.
C Total returns would have been lower had certain expenses not been reduced during the periods shown.
D Total returns do not include the effect of the contingent deferred sales charge.
E Calculated based on average shares outstanding during the period.
F For the period July 23, 2003 (commencement of sale of shares) to December 31, 2003.
G Expense ratios reflect operating expenses of the class. Expenses before reductions do not reflect amounts reimbursed by the investment adviser or
expense offset arrangements and do not represent the amount paid by the class during periods when reimbursements or reductions occur. Expense
ratios before reductions for start up periods may not be representative of longer term operating periods. Expenses net of fee waivers reflect
expenses after reimbursement by the investment adviser but prior to reductions from expense offset arrangements. Expenses net of all reductions
represent the net expenses paid by the class.
H Amount represents less than $.001 per share.
|
See accompanying notes which are an integral part of the financial statements.
41 Annual Report
| Financial Highlights Class C | | | | | | | | | | | | |
| |
| Years ended December 31, | | | | 2005 | | | | 2004 | | | | 2003F |
| Selected Per Share Data | | | | | | | | | | | | |
| Net asset value, beginning of period | | | | $ 10.38 | | | | $ 10.48 | | | | $ 10.49 |
| Income from Investment Operations | | | | | | | | | | | | |
| Net investment incomeE | | | | 178 | | | | .159 | | | | .077 |
| Net realized and unrealized gain (loss) | | | | (.176) | | | | (.080) | | | | .048 |
| Total from investment operations | | | | 002 | | | | .079 | | | | .125 |
| Distributions from net investment income | | | | (.179) | | | | (.160) | | | | (.070) |
| Distributions from net realized gain | | | | (.003) | | | | (.019) | | | | (.065) |
| Total distributions | | | | (.182) | | | | (.179) | | | | (.135) |
| Redemption fees added to paid in capitalE,H | | | | — | | | | — | | | | — |
| Net asset value, end of period | | | | $ 10.20 | | | | $ 10.38 | | | | $ 10.48 |
| Total ReturnB,C,D | | | | 02% | | | | .77% | | | | 1.20% |
| Ratios to Average Net AssetsG | | | | | | | | | | | | |
| Expenses before reductions | | | | 1.52% | | | | 1.52% | | | | 1.50%A |
| Expenses net of fee waivers, if any | | | | 1.52% | | | | 1.52% | | | | 1.50%A |
| Expenses net of all reductions | | | | 1.45% | | | | 1.51% | | | | 1.49%A |
| Net investment income | | | | 1.74% | | | | 1.53% | | | | 1.67%A |
| Supplemental Data | | | | | | | | | | | | |
| Net assets, end of period (in millions) | | | | $ 10 | | | | $ 11 | | | | $ 8 |
| Portfolio turnover rate | | | | 27% | | | | 45% | | | | 34% |
A Annualized
B Total returns for periods of less than one year are not annualized.
C Total returns would have been lower had certain expenses not been reduced during the periods shown.
D Total returns do not include the effect of the contingent deferred sales charge.
E Calculated based on average shares outstanding during the period.
F For the period July 23, 2003 (commencement of sale of shares) to December 31, 2003.
G Expense ratios reflect operating expenses of the class. Expenses before reductions do not reflect amounts reimbursed by the investment adviser or
expense offset arrangements and do not represent the amount paid by the class during periods when reimbursements or reductions occur. Expense
ratios before reductions for start up periods may not be representative of longer term operating periods. Expenses net of fee waivers reflect
expenses after reimbursement by the investment adviser but prior to reductions from expense offset arrangements. Expenses net of all reductions
represent the net expenses paid by the class.
H Amount represents less than $.001 per share.
|
See accompanying notes which are an integral part of the financial statements.
| Financial Highlights Short Intermediate Municipal Income | | | | |
| |
| Years ended December 31, | | | | 2005 | | | | 2004 | | | | 2003 | | | | 2002 | | | | 2001 |
| Selected Per Share Data | | | | | | | | | | | | | | | | | | | | |
| Net asset value, | | | | | | | | | | | | | | | | | | | | |
| beginning of period | | | | $ 10.38 | | | | $ 10.48 | | | | $ 10.52 | | | | $ 10.27 | | | | $ 10.12 |
| Income from Investment | | | | | | | | | | | | | | | | | | | | |
| Operations | | | | | | | | | | | | | | | | | | | | |
| Net investment incomeB | | | | 284 | | | | .268 | | | | .283 | | | | .336 | | | | .396D |
| Net realized and unrealized | | | | | | | | | | | | | | | | | | | | |
| gain (loss) | | | | (.177) | | | | (.080) | | | | .030 | | | | .317 | | | | .173D |
| Total from investment operations | | | | 107 | | | | .188 | | | | .313 | | | | .653 | | | | .569 |
| Distributions from net investment | | | | | | | | | | | | | | | | | | | | |
| income | | | | (.284) | | | | (.269) | | | | (.283) | | | | (.339) | | | | (.396) |
| Distributions from net realized | | | | | | | | | | | | | | | | | | | | |
| gain | | | | (.003) | | | | (.019) | | | | (.070) | | | | (.064) | | | | (.023) |
| Total distributions | | | | (.287) | | | | (.288) | | | | (.353) | | | | (.403) | | | | (.419) |
| Redemption fees added to paid | | | | | | | | | | | | | | | | | | | | |
| in capitalB,E | | | | — | | | | — | | | | — | | | | — | | | | — |
| Net asset value, end of period | | | | $ 10.20 | | | | $ 10.38 | | | | $ 10.48 | | | | $ 10.52 | | | | $ 10.27 |
| Total ReturnA | | | | 1.06% | | | | 1.82% | | | | 3.01% | | | | 6.47% | | | | 5.70% |
| Ratios to Average Net AssetsC | | | | | | | | | | | | | | | | | | | | |
| Expenses before reductions | | | | 49% | | | | .49% | | | | .49% | | | | .49% | | | | .49% |
| Expenses net of fee waivers, | | | | | | | | | | | | | | | | | | | | |
| if any | | | | 49% | | | | .48% | | | | .49% | | | | .49% | | | | .49% |
| Expenses net of all reductions | | | | 42% | | | | .47% | | | | .47% | | | | .45% | | | | .41% |
| Net investment income | | | | 2.77% | | | | 2.57% | | | | 2.69% | | | | 3.23% | | | | 3.85%D |
| Supplemental Data | | | | | | | | | | | | | | | | | | | | |
| Net assets, end of period | | | | | | | | | | | | | | | | | | | | |
| (in millions) | | | | $ 1,665 | | | | $ 1,841 | | | | $ 1,843 | | | | $ 1,683 | | | | $ 1,183 |
| Portfolio turnover rate | | | | 27% | | | | 45% | | | | 34% | | | | 38% | | | | 43% |
A Total returns would have been lower had certain expenses not been reduced during the periods shown.
B Calculated based on average shares outstanding during the period.
C Expense ratios reflect operating expenses of the class. Expenses before reductions do not reflect amounts reimbursed by the investment adviser or
expense offset arrangements and do not represent the amount paid by the class during periods when reimbursements or reductions occur. Ex
penses net of fee waivers reflect expenses after reimbursement by the investment adviser but prior to reductions from expense offset arrange
ments. Expenses net of all reductions represent the net expenses paid by the class.
D Effective January 1, 2001, the fund adopted the provisions of the AICPA Audit and Accounting Guide for Investment Companies and began
amortizing premium and discount on all debt securities. Per share data and ratios for periods prior to adoption have not been restated to reflect
this change.
E Amount represents less than $.001 per share.
|
See accompanying notes which are an integral part of the financial statements.
43 Annual Report
| Financial Highlights Institutional Class | | | | | | | | | | | | |
| |
| Years ended December 31, | | | | 2005 | | | | 2004 | | | | 2003E |
| Selected Per Share Data | | | | | | | | | | | | |
| Net asset value, beginning of period | | | | $ 10.38 | | | | $ 10.49 | | | | $ 10.49 |
| Income from Investment Operations | | | | | | | | | | | | |
| Net investment incomeD | | | | 283 | | | | .265 | | | | .125 |
| Net realized and unrealized gain (loss) | | | | (.176) | | | | (.088) | | | | .059 |
| Total from investment operations | | | | 107 | | | | .177 | | | | .184 |
| Distributions from net investment income | | | | (.284) | | | | (.268) | | | | (.119) |
| Distributions from net realized gain | | | | (.003) | | | | (.019) | | | | (.065) |
| Total distributions | | | | (.287) | | | | (.287) | | | | (.184) |
| Redemption fees added to paid in capitalD,G | | | | — | | | | — | | | | — |
| Net asset value, end of period | | | | $ 10.20 | | | | $ 10.38 | | | | $ 10.49 |
| Total ReturnB,C | | | | 1.05% | | | | 1.71% | | | | 1.77% |
| Ratios to Average Net AssetsF | | | | | | | | | | | | |
| Expenses before reductions | | | | 49% | | | | .49% | | | | .48%A |
| Expenses net of fee waivers, if any | | | | 49% | | | | .49% | | | | .48%A |
| Expenses net of all reductions | | | | 42% | | | | .48% | | | | .47%A |
| Net investment income | | | | 2.77% | | | | 2.57% | | | | 2.69%A |
| Supplemental Data | | | | | | | | | | | | |
| Net assets, end of period (000 omitted) | | | | $ 2,625 | | | | $ 1,253 | | | | $ 414 |
| Portfolio turnover rate | | | | 27% | | | | 45% | | | | 34% |
A Annualized
B Total returns for periods of less than one year are not annualized.
C Total returns would have been lower had certain expenses not been reduced during the periods shown.
D Calculated based on average shares outstanding during the period.
E For the period July 23, 2003 (commencement of sale of shares) to December 31, 2003.
F Expense ratios reflect operating expenses of the class. Expenses before reductions do not reflect amounts reimbursed by the investment adviser or
expense offset arrangements and do not represent the amount paid by the class during periods when reimbursements or reductions occur. Expense
ratios before reductions for start up periods may not be representative of longer term operating periods. Expenses net of fee waivers reflect
expenses after reimbursement by the investment adviser but prior to reductions from expense offset arrangements. Expenses net of all reductions
represent the net expenses paid by the class.
G Amount represents less than $.001 per share.
|
See accompanying notes which are an integral part of the financial statements.
Notes to Financial Statements
For the period ended December 31, 2005
(Amounts in thousands except ratios)
|
1. Significant Accounting Policies.
Fidelity Short Intermediate Municipal Income Fund (the fund) is a fund of Fidelity Municipal Trust (the trust) and is authorized to issue an unlimited number of shares. On July 21, 2005, the Board of Trustees approved a change in the name of Spartan Short Intermediate Municipal Income Fund to Fidelity Short Intermediate Municipal Income Fund effective August 15, 2005. The trust is registered under the Investment Company Act of 1940, as amended (the 1940 Act), as an open end management investment company organized as a Massachusetts business trust.
The fund offers Class A, Class T, Class B, Class C, Short Intermediate Municipal Income and Institutional Class shares, each of which has equal rights as to assets and voting privileges. Each class has exclusive voting rights with respect to matters that affect that class. Class B shares will automatically convert to Class A shares after a holding period of four years from the initial date of purchase. Investment income, realized and unrealized capital gains and losses, the common expenses of the fund, and certain fund level expense reductions, if any, are allocated on a pro rata basis to each class based on the relative net assets of each class to the total net assets of the fund. Each class differs with respect to transfer agent and distribution and service plan fees incurred. Certain ex pense reductions also differ by class.
The fund may invest in affiliated money market central funds (Money Market Central Funds), which are open end investment companies available to investment companies and other accounts managed by Fidelity Management & Research Company (FMR) and its affiliates. The financial statements have been prepared in conformity with accounting principles generally accepted in the United States of America, which require manage ment to make certain estimates and assumptions at the date of the financial statements. The following summarizes the significant accounting policies of the fund:
Security Valuation. Investments are valued and net asset value per share is calculated (NAV calculation) as of the close of business of the New York Stock Exchange, normally 4:00 p.m. Eastern time. Wherever possible, the fund uses independent pricing services approved by the Board of Trustees to value its investments. Debt securities, including restricted securities, for which quotes are readily available, are valued by independent pricing services or by dealers who make markets in such securities. Pricing services consider yield or price of bonds of comparable quality, coupon, maturity and type as well as dealer supplied prices. When current market prices or quotations are not readily available or do not accurately reflect fair value, valuations may be determined in accor dance with procedures adopted by the Board of Trustees. The frequency of when fair value pricing is used is unpredictable. The value of securities used for NAV calculation under fair value pricing may differ from published prices for the same securities.
45 Annual Report
| Notes to Financial Statements continued |
| (Amounts in thousands except ratios) | | |
1. Significant Accounting Policies continued |
Security Valuation continued | | |
Investments in open end mutual funds are valued at their closing net asset value each business day. Short term securities with remaining maturities of sixty days or less for which quotations are not readily available are valued at amortized cost, which approxi mates value.
Investment Transactions and Income. Security transactions are accounted for as of trade date. Gains and losses on securities sold are determined on the basis of identified cost. Interest income is accrued as earned. Interest income includes coupon interest and amortization of premium and accretion of discount on debt securities.
Expenses. Most expenses of the trust can be directly attributed to a fund. Expenses which cannot be directly attributed are apportioned among each fund in the trust.
Income Tax Information and Distributions to Shareholders. Each year, the fund intends to qualify as a regulated investment company by distributing all of its taxable income and realized gains under Subchapter M of the Internal Revenue Code. As a result, no provision for income taxes is required in the accompanying financial statements.
Dividends are declared daily and paid monthly from net investment income. Distribu tions from realized gains, if any, are recorded on the ex dividend date. Income dividends and capital gain distributions are declared separately for each class. Income and capital gain distributions are determined in accordance with income tax regulations, which may differ from generally accepted accounting principles. In addition, the fund will claim a portion of the payment made to redeeming shareholders as a distribution for income tax purposes.
Capital accounts within the financial statements are adjusted for permanent book tax differences. These adjustments have no impact on net assets or the results of operations. Temporary book tax differences will reverse in a subsequent period.
Book tax differences are primarily due to market discount, deferred trustees compensa tion, capital loss carryforwards and losses deferred due to excise tax regulations.
The fund purchases municipal securities whose interest, in the opinion of the issuer, is free from federal income tax. There is no assurance that the Internal Revenue Service (IRS) will agree with this opinion. In the event the IRS determines that the issuer does not comply with relevant tax requirements, interest payments from a security could become federally taxable, possibly retroactively to the date the security was issued.
| 1. Significant Accounting Policies continued | | |
Income Tax Information and Distributions to Shareholders continued |
The tax basis components of distributable earnings and the federal tax cost as of period end were as follows:
| Unrealized appreciation | | $ | | 6,805 | | | | |
| Unrealized depreciation | | | | (15,785) | | | | |
| Net unrealized appreciation (depreciation) | | | | (8,980) | | | | |
| Capital loss carryforward | | | | (699) | | | | |
| |
| Cost for federal income tax purposes | | $ | | 1,716,088 | | | | |
| |
| The tax character of distributions paid was as follows: | | | | |
| |
| | | | | December 31, 2005 | | | | December 31, 2004 |
| Tax exempt Income | | $ | | 51,341 | | $ | | 47,598 |
| Long term Capital Gains | | | | 549 | | | | 3,486 |
| Total | | $ | | 51,890 | | $ | | 51,084 |
Short Term Trading (Redemption) Fees. Shares held in the fund less than 30 days are subject to a redemption fee equal to .50% of the proceeds of the redeemed shares. All redemption fees, including any estimated redemption fees paid by FMR, are retained by the fund and accounted for as an addition to paid in capital.
Delayed Delivery Transactions and When Issued Securities. The fund may purchase or sell securities on a delayed delivery or when issued basis. Payment and delivery may take place after the customary settlement period for that security. The price of the underlying securities and the date when the securities will be delivered and paid for are fixed at the time the transaction is negotiated. During the time a delayed delivery sell is outstanding, the contract is marked to market daily and equivalent deliverable securities are held for the transaction. The value of the securities purchased on a delayed delivery or when issued basis are identified as such in the fund’s Schedule of Investments. The fund may receive compensation for interest forgone in the purchase of a delayed delivery or when issued security. With respect to purchase commitments, the fund identifies securities as segregated in its records with a value at least equal to the amount of the commitment. Losses may arise due to changes in the value of the underly ing securities or if the counterparty does not perform under the contract’s terms, or if the issuer does not issue the securities due to political, economic, or other factors.
47 Annual Report
| Notes to Financial Statements continued |
| (Amounts in thousands except ratios) |
| |
| 2. Operating Policies continued |
Restricted Securities. The fund may invest in securities that are subject to legal or contractual restrictions on resale. These securities generally may be resold in transac tions exempt from registration or to the public if the securities are registered. Disposal of these securities may involve time consuming negotiations and expense, and prompt sale at an acceptable price may be difficult. Information regarding restricted securities is included at the end of the fund’s Schedule of Investments.
3. Purchases and Sales of Investments.
Purchases and sales of securities, other than short term securities and U.S. government securities, aggregated $492,046 and $656,962, respectively.
4. Fees and Other Transactions with Affiliates.
Management Fee. FMR and its affiliates provide the fund with investment manage ment related services for which the fund pays a monthly management fee. The manage ment fee is the sum of an individual fund fee rate that is based on an annual rate of .25% of the fund’s average net assets and a group fee rate that averaged .12% during the period. The group fee rate is based upon the average net assets of all the mutual funds advised by FMR. The group fee rate decreases as assets under management increase and increases as assets under management decrease. For the period, the total annual man agement fee rate was ..37% of the fund’s average net assets.
Distribution and Service Plan. In accordance with Rule 12b 1 of the 1940 Act, the fund has adopted separate Distribution and Service Plans for each class of shares. Certain classes pay Fidelity Distributors Corporation (FDC), an affiliate of FMR, separate Distribu tion and Service Fees, each of which is based on an annual percentage of each class’ average net assets. In addition, FDC may pay financial intermediaries for selling shares of the fund and providing shareholder support services. For the period, the Distribution and Service Fee rates and the total amounts paid to and retained by FDC were as follows:
| | | Distribution | | Service | | | | Paid to | | | | Retained |
| | | Fee | | Fee | | | | FDC | | | | by FDC |
| Class A | | 0% | | .15% | | | $ | 18 | | | $ | — |
| Class T | | 0% | | .25% | | | | 47 | | | | 1 |
| Class B | | 65% | | .25% | | | | 33 | | | | 24 |
| Class C | | 75% | | .25% | | | | 112 | | | | 40 |
| | | | | | | | $ | 210 | | | $ | 65 |
Sales Load. FDC receives a front end sales charge of up to 3.75% for selling Class A shares, and 2.75% for selling Class T shares, some of which is paid to financial intermedi aries for selling shares of the fund. FDC receives the proceeds of contingent deferred sales charges levied on Class A, Class T, Class B, and Class C redemptions. These charges
| 4. Fees and Other Transactions with Affiliates continued |
Sales Load - continued | | |
depend on the holding period. The deferred sales charges range from 3% to 1% for Class B, 1% for Class C, and .25% for certain purchases of Class A and Class T shares.
| For the period, sales charge amounts retained by FDC were as follows: | | |
| |
| | | | | Retained |
| | | | | by FDC |
| Class A | | | $ | 7 |
| Class T | | | | 10 |
| Class B* | | | | 7 |
| Class C* | | | | 5 |
| | | | $ | 29 |
* When Class B and Class C shares are initially sold, FDC pays commissions from its own resources to financial intermediaries through which the sales are made.
Transfer Agent and Accounting Fees. Citibank, N.A. (Citibank) is the custodian, transfer agent, and shareholder servicing agent for the fund’s Class A, Class T, Class B, Class C, Short Intermediate Municipal Income and Institutional Class shares. Citibank has entered into a sub arrangement with Fidelity Investments Institutional Operations Company, Inc. (FIIOC), an affiliate of FMR, with respect to all classes of the fund, except for Short Intermediate Municipal Income, to perform the transfer, dividend disbursing, and shareholder servicing agent functions. Citibank has also entered into a sub arrange ment with Fidelity Service Company, Inc. (FSC), an affiliate of FMR, with respect to Short Intermediate Municipal Income, to perform the transfer, dividend disbursing, and shareholder servicing agent functions. FIIOC and FSC receive account fees and asset based fees that vary according to the account size and type of account of the shareholders of the respective classes of the fund. All fees are paid to FIIOC by Citibank, which is reimbursed by each class for such payments. FIIOC and FSC pay for typesetting, printing and mailing of shareholder reports, except proxy statements. For the period, each class paid the following transfer agent fees:
| | | | | | | | | % of |
| | | | | | | | | Average |
| | | | | | | Amount | | Net Assets |
| Class A | | | | | $ | 11 | | .09 |
| Class T | | | | | | 19 | | .10 |
| Class B | | | | | | 4 | | .10 |
| Class C | | | | | | 12 | | .11 |
| Short Intermediate Municipal Income | | | | | | 1,454 | | .08 |
| Institutional Class | | | | | | 1 | | .08 |
| | | | | | $ | 1,501 | | |
| |
| |
| |
| | | 49 | | | | | | Annual Report |
| Notes to Financial Statements continued | | |
| (Amounts in thousands except ratios) | | |
4. Fees and Other Transactions with Affiliates continued |
Transfer Agent and Accounting Fees continued | | |
Citibank also has a sub arrangement with FSC to maintain the fund’s accounting records. The fee is based on the level of average net assets for the month.
Affiliated Central Funds. The fund may invest in Money Market Central Funds which seek preservation of capital and current income and are managed by Fidelity Investments Money Management, Inc. (FIMM), an affiliate of FMR. The Money Market Central Funds do not pay a management fee.
5. Committed Line of Credit.
|
The fund participates with other funds managed by FMR in a $4.2 billion credit facility (the “line of credit”) to be utilized for temporary or emergency purposes to fund share holder redemptions or for other short term liquidity purposes. The fund has agreed to pay commitment fees on its pro rata portion of the line of credit. During the period, there were no borrowings on this line of credit.
Through arrangements with the fund’s custodian and each class’ transfer agent, credits realized as a result of uninvested cash balances were used to reduce the fund’s expenses. During the period, these credits reduced the fund’s custody and accounting expenses by $29 and $332, respectively. During the period, credits reduced each class’ transfer agent expense as noted in the table below.
| | | | | Transfer Agent |
| | | | | expense reduction |
| Class A | | | $ | 6 |
| Class T | | | | 9 |
| Class B | | | | 1 |
| Class C | | | | 5 |
| Short Intermediate Municipal Income | | | | 858 |
| Institutional Class | | | | 1 |
| | | | $ | 880 |
| |
| 7. Other. | | | | |
The fund’s organizational documents provide former and current trustees and officers with a limited indemnification against liabilities arising in connection with the performance of their duties to the fund. In the normal course of business, the fund may also enter into contracts that provide general indemnifications. The fund’s maximum exposure under these arrangements is unknown as this would be dependent on future claims that may be made against the fund. The risk of material loss from such claims is considered remote.
| 8. Distributions to Shareholders. | | | | | | | | | | |
| |
| Distributions to shareholders of each class were as follows: | | | | | | | | |
| |
| | | | | | | | | Years ended December 31, |
| | | | | | | | | 2005 | | | | 2004 |
| From net investment income | | | | | | | | | | | | |
| Class A | | | | | | | $ | 313 | | | $ | 303 |
| Class T | | | | | | | | 465 | | | | 403 |
| Class B | | | | | | | | 68 | | | | 58 |
| Class C | | | | | | | | 195 | | | | 160 |
| Short Intermediate Municipal Income | | | | | | | | 50,256 | | | | 46,653 |
| Institutional Class | | | | | | | | 44 | | | | 21 |
| Total | | | | | | | $ | 51,341 | | | $ | 47,598 |
| From net realized gain | | | | | | | | | | | | |
| Class A | | | | | | | $ | 4 | | | $ | 23 |
| Class T | | | | | | | | 6 | | | | 36 |
| Class B | | | | | | | | 1 | | | | 7 |
| Class C | | | | | | | | 3 | | | | 20 |
| Short Intermediate Municipal Income | | | | | | | | 534 | | | | 3,398 |
| Institutional Class | | | | | | | | 1 | | | | 2 |
| Total | | | | | | | $ | 549 | | | $ | 3,486 |
| |
| 9. Share Transactions. | | | | | | | | | | | | |
| |
| Transactions for each class of shares were as follows: | | | | | | | | |
| |
| | | Shares | | | | Dollars |
| | | Years ended December 31, | | | | Years ended December 31, |
| | | 2005 | | 2004 | | | | 2005 | | | | 2004 |
| Class A | | | | | | | | | | | | |
| Shares sold | | 684 | | 1,095 | | | $ | 6,996 | | | $ | 11,465 |
| Reinvestment of distributions | | 23 | | 24 | | | | 238 | | | | 253 |
| Shares redeemed | | (498) | | (785) | | | | (5,104) | | | | (8,128) |
| Net increase (decrease) | | 209 | | 334 | | | $ | 2,130 | | | $ | 3,590 |
| Class T | | | | | | | | | | | | |
| Shares sold | | 517 | | 1,569 | | | $ | 5,299 | | | $ | 16,393 |
| Reinvestment of distributions | | 34 | | 30 | | | | 351 | | | | 309 |
| Shares redeemed | | (1,028) | | (818) | | | | (10,531) | | | | (8,551) |
| Net increase (decrease) | | (477) | | 781 | | | $ | (4,881) | | | $ | 8,151 |
| Class B | | | | | | | | | | | | |
| Shares sold | | 65 | | 214 | | | $ | 661 | | | $ | 2,231 |
| Reinvestment of distributions | | 4 | | 4 | | | | 44 | | | | 42 |
| Shares redeemed | | (100) | | (84) | | | | (1,025) | | | | (870) |
| Net increase (decrease) | | (31) | | 134 | | | $ | (320) | | | $ | 1,403 |
| |
| |
| | | 51 | | | | | | | | Annual Report |
| Notes to Financial Statements continued | | | | | | | | |
| (Amounts in thousands except ratios) | | | | | | | | | | |
| |
| 9. Share Transactions - continued | | | | | | | | |
| |
| | | Shares | | | | Dollars |
| | | Years ended December 31, | | | | Years ended December 31, |
| | | 2005 | | 2004 | | | | 2005 | | | | 2004 |
| Class C | | | | | | | | | | | | |
| Shares sold | | 438 | | 658 | | | $ | 4,492 | | | $ | 6,848 |
| Reinvestment of distributions | | 11 | | 10 | | | | 116 | | | | 103 |
| Shares redeemed | | (541) | | (295) | | | | (5,552) | | | | (3,054) |
| Net increase (decrease) | | (92) | | 373 | | | $ | (944) | | | $ | 3,897 |
| Short Intermediate Municipal | | | | | | | | | | | | |
| Income | | | | | | | | | | | | |
| Shares sold | | 46,854 | | 75,115 | | | $ | 481,284 | | | $ | 784,282 |
| Reinvestment of distributions | | 3,476 | | 3,669 | | | | 35,648 | | | | 38,189 |
| Shares redeemed | | (64,556) | | (77,123) | | | | (661,741) | | | | (803,196) |
| Net increase (decrease) | | (14,226) | | 1,661 | | | $ | (144,809) | | | $ | 19,275 |
| Institutional Class | | | | | | | | | | | | |
| Shares sold | | 194 | | 110 | | | $ | 1,994 | | | $ | 1,153 |
| Reinvestment of distributions | | 2 | | 1 | | | | 18 | | | | 8 |
| Shares redeemed | | (60) | | (30) | | | | (615) | | | | (317) |
| Net increase (decrease) | | 136 | | 81 | | | $ | 1,397 | | | $ | 844 |
Report of Independent Registered Public Accounting Firm
To the Trustees of Fidelity Municipal Trust and the Shareholders of Fidelity Short Intermediate Municipal Income Fund (formerly Spartan Short Intermediate Municipal Income Fund):
In our opinion, the accompanying statement of assets and liabilities, including the schedule of investments, and the related statements of operations and of changes in net assets and the financial highlights present fairly, in all material respects, the financial position of Fidelity Short Intermediate Municipal Income Fund (formerly Spartan Short Intermediate Municipal Income Fund) (a fund of Fidelity Municipal Trust) at December 31, 2005 and the results of its operations, the changes in its net assets and the financial highlights for the periods indicated, in conformity with accounting principles generally accepted in the United States of America. These financial statements and financial highlights (hereafter referred to as “financial statements”) are the responsibility of the Fidelity Short Intermediate Municipal Income Fund’s management; our responsi bility is to express an opinion on these financial statements based on our audits. We conducted our audits of these financial statements in accordance with the standards of the Public Company Accounting Oversight Board (United States). Those standards require that we plan and perform the audit to obtain reasonable assurance about whether the financial statements are free of material misstatement. An audit includes examining, on a test basis, evidence supporting the amounts and disclosures in the financial state ments, assessing the accounting principles used and significant estimates made by management, and evaluating the overall financial statement presentation. We believe that our audits, which included confirmation of securities at December 31, 2005 by correspon dence with the custodian and brokers, provide a reasonable basis for our opinion.
/s/ PricewaterhouseCoopers LLP
PricewaterhouseCoopers LLP
Boston, Massachusetts
February 14, 2006
|
53 Annual Report
Trustees and Officers
The Trustees, Member of the Advisory Board, and executive officers of the trust and fund, as applicable, are listed below. The Board of Trustees governs the fund and is responsible for protecting the interests of shareholders. The Trustees are experienced executives who meet periodically throughout the year to oversee the fund’s activities, review contractual arrangements with companies that provide services to the fund, and review the fund’s performance. Except for William O. McCoy and Albert R. Gamper, Jr., each of the Trustees oversees 326 funds advised by FMR or an affiliate. Mr. McCoy oversees 328 funds advised by FMR or an affiliate. Mr. Gamper oversees 235 funds advised by FMR or an affiliate.
The Trustees hold office without limit in time except that (a) any Trustee may resign; (b) any Trustee may be removed by written instrument, signed by at least two thirds of the number of Trustees prior to such removal; (c) any Trustee who requests to be retired or who has become incapacitated by illness or injury may be retired by written instru ment signed by a majority of the other Trustees; and (d) any Trustee may be removed at any special meeting of shareholders by a two thirds vote of the outstanding voting securities of the trust. Each Trustee who is not an interested person (as defined in the 1940 Act) (Independent Trustee), shall retire not later than the last day of the calendar year in which his or her 72nd birthday occurs. The Independent Trustees may waive this mandatory retirement age policy with respect to individual Trustees. The executive officers and Advisory Board Member hold office without limit in time, except that any officer and Advisory Board Member may resign or may be removed by a vote of a majority of the Trustees at any regular meeting or any special meeting of the Trustees. Except as indicated, each individual has held the office shown or other offices in the same company for the past five years.
The fund’s Statement of Additional Information (SAI) includes more information about the Trustees. To request a free copy, call Fidelity at 1-877-208-0098.
Correspondence intended for each Trustee who is an interested person may be sent to Fidelity Investments, 82 Devonshire Street, Boston, Massachusetts 02109.
| | Name, Age; Principal Occupation
Edward C. Johnson 3d (75)
|
Year of Election or Appointment: 1984
Mr. Johnson is Chairman of the Board of Trustees. Mr. Johnson serves as Chief Executive Officer, Chairman, and a Director of FMR Corp.; a Director and Chairman of the Board and of the Executive Committee of FMR; Chairman and a Director of Fidelity Management & Research (Far East) Inc.; Chairman and a Director of Fidelity Investments Money Management, Inc.; and Chairman (2001 present) and a Director (2000 present) of FMR Co., Inc.
| | Name, Age; Principal Occupation
Stephen P. Jonas (52)
|
Year of Election or Appointment: 2005
Mr. Jonas is Senior Vice President of the fund (2005 present). He also serves as Senior Vice President of other Fidelity funds (2005 present). Mr. Jonas is Executive Director of FMR (2005 present). Previously, Mr. Jonas served as President of Fidelity Enterprise Operations and Risk Services (2004 2005), Chief Administrative Officer (2002 2004), and Chief Financial Officer of FMR Co. (1998 2000). Mr. Jonas has been with Fidelity Investments since 1987 and has held various financial and management positions including Chief Financial Officer of FMR. In addition, he serves on the Boards of Boston Ballet (2003 present) and Simmons College (2003 present).
Year of Election or Appointment: 2003
Mr. Reynolds is a Director (2003 present) and Chief Operating Officer (2002 present) of FMR Corp. He also serves on the Board at Fidelity Investments Canada, Ltd. (2000 present). Previously, Mr. Reynolds served as President of Fidelity Investments Institutional Retirement Group (1996 2000).
* Trustees have been determined to be “Interested Trustees” by virtue of, among other things, their affiliation with the trust or various entities under common control with FMR.
55 Annual Report
Trustees and Officers - continued
Independent Trustees:
Correspondence intended for each Independent Trustee (that is, the Trustees other than the Interested Trustees) may be sent to Fidelity Investments, P.O. Box 55235, Boston, Massachusetts 02205 5235.
| | Name, Age; Principal Occupation
Dennis J. Dirks (57)
|
Year of Election or Appointment: 2005
Prior to his retirement in May 2003, Mr. Dirks was Chief Operating Officer and a member of the Board of The Depository Trust & Clearing Corporation (DTCC) (1999 2003). He also served as President, Chief Operating Officer, and Board member of The Depository Trust Company (DTC) (1999 2003) and President and Board member of the National Securities Clearing Corporation (NSCC) (1999 2003). In addition, Mr. Dirks served as Chief Executive Officer and Board member of the Government Securities Clearing Corporation (2001 2003) and Chief Executive Officer and Board member of the Mortgage Backed Securities Clearing Corporation (2001 2003). Mr. Dirks also serves as a Trustee of Manhattan College (2005 present).
| | Albert R. Gamper, Jr. (63)
|
Year of Election or Appointment: 2006
Mr. Gamper also serves as a Trustee (2006 present) or Member of the Advisory Board (2005 present) of other investment companies advised by FMR. Prior to his retirement in December 2004, Mr. Gamper served as Chairman of the Board of CIT Group Inc. (commercial finance). During his tenure with CIT Group Inc. Mr. Gamper served in numerous senior management positions, including Chairman (1987 1989; 1999 2001; 2002 2004), Chief Executive Officer (1987 2004), and President (1989 2002). He currently serves as a member of the Board of Directors of Public Service Enterprise Group (utilities, 2001 present), Chairman of the Board of Governors, Rutgers University (2004 present), and Chairman of the Board of Saint Barnabas Health Care System.
Name, Age; Principal Occupation
Robert M. Gates (62)
|
Year of Election or Appointment: 1997
Dr. Gates is Chairman of the Independent Trustees (2006 present). Dr. Gates is President of Texas A&M University (2002 present). He was Director of the Central Intelligence Agency (CIA) from 1991 to 1993. From 1989 to 1991, Dr. Gates served as Assistant to the President of the United States and Deputy National Security Advisor. Dr. Gates is a Director of NACCO Industries, Inc. (mining and manufacturing), Parker Drilling Co., Inc. (drilling and rental tools for the energy industry, 2001 present), and Brinker International (restaurant management, 2003 present). Previously, Dr. Gates served as a Director of LucasVarity PLC (automotive components and diesel engines), a Director of TRW Inc. (automotive, space, defense, and information technology), and Dean of the George Bush School of Government and Public Service at Texas A&M University (1999 2001). Dr. Gates also is a Trustee of the Forum for International Policy.
Year of Election or Appointment: 2004
Dr. Heilmeier is Chairman Emeritus of Telcordia Technologies (commu nication software and systems), where prior to his retirement, he served as company Chairman and Chief Executive Officer. He currently serves on the Boards of Directors of The Mitre Corporation (systems engineer ing and information technology support for the government), and HRL Laboratories (private research and development, 2004 present). He is Chairman of the General Motors Science & Technology Advisory Board and a Life Fellow of the Institute of Electrical and Electronics Engineers (IEEE) (2000 present). Dr. Heilmeier is a member of the Defense Science Board and the National Security Agency Advisory Board. He is also a member of the National Academy of Engineering, the American Academy of Arts and Sciences, and the Board of Overseers of the School of Engineering and Applied Science of the University of Pennsylvania. Previously, Dr. Heilmeier served as a Director of TRW Inc. (automotive, space, defense, and information technology, 1992 2002), Compaq (1994 2002), Automatic Data Processing, Inc. (ADP) (technology based business outsourcing, 1995 2002), INET Technologies Inc. (telecommu nications network surveillance, 2001 2004), and Teletech Holdings (customer management services). He is the recipient of the 2005 Kyoto Prize in Advanced Technology for his invention of the liquid display.
57 Annual Report
Trustees and Officers - continued
| | Name, Age; Principal Occupation
Marie L. Knowles (59)
|
Year of Election or Appointment: 2001
Prior to Ms. Knowles’ retirement in June 2000, she served as Executive Vice President and Chief Financial Officer of Atlantic Richfield Company (ARCO) (diversified energy, 1996 2000). From 1993 to 1996, she was a Senior Vice President of ARCO and President of ARCO Transportation Company. She served as a Director of ARCO from 1996 to 1998. She currently serves as a Director of Phelps Dodge Corporation (copper mining and manufacturing) and McKesson Corporation (healthcare ser vice, 2002 present). Ms. Knowles is a Trustee of the Brookings Institution and the Catalina Island Conservancy and also serves as a member of the Advisory Board for the School of Engineering of the University of Southern California.
Year of Election or Appointment: 2000
Mr. Lautenbach has been a partner of Clayton, Dubilier & Rice, Inc. (private equity investment firm) since September 1998. Previously, Mr. Lautenbach was with the International Business Machines Corpora tion (IBM) from 1968 until his retirement in 1998. Mr. Lautenbach serves as a Director of Italtel Holding S.p.A. (telecommunications (Milan, Italy), 2004 present) and Eaton Corporation (diversified industrial) as well as the Philharmonic Center for the Arts in Naples, Florida. He also is a member of the Board of Trustees of Fairfield University (2005 present), as well as a member of the Council on Foreign Relations.
Year of Election or Appointment: 1997
Prior to his retirement in December 1994, Mr. McCoy was Vice Chair man of the Board of BellSouth Corporation (telecommunications) and President of BellSouth Enterprises. He is currently a Director of Liberty Corporation (holding company), Duke Realty Corporation (real estate), and Progress Energy, Inc. (electric utility). He is also a partner of Frank lin Street Partners (private investment management firm) and a member of the Research Triangle Foundation Board. In addition, Mr. McCoy served as the Interim Chancellor (1999 2000) and a member of the Board of Visitors for the University of North Carolina at Chapel Hill and currently serves on the Board of Directors of the University of North Carolina Health Care System and the Board of Visitors of the Kenan Flagler Business School (University of North Carolina at Chapel Hill). He also served as Vice President of Finance for the University of North Carolina (16 school system).
Name, Age; Principal Occupation
Cornelia M. Small (61)
|
Year of Election or Appointment: 2005
Ms. Small is a member (2000 present) and Chairperson (2002 present) of the Investment Committee, and a member (2002 present) of the Board of Trustees of Smith College. Previously, she served as Chief Investment Officer (1999 2000), Director of Global Equity Investments (1996 1999), and a member of the Board of Directors of Scudder, Stevens & Clark (1990 1997) and Scudder Kemper Investments (1997 1998). In addition, Ms. Small served as Co Chair (2000 2003) of the Annual Fund for the Fletcher School of Law and Diplomacy.
William S. Stavropoulos (66)
|
Year of Election or Appointment: 2002
Mr. Stavropoulos is Chairman of the Board (2000 present) and a Member of the Board of Directors of The Dow Chemical Company. Since joining The Dow Chemical Company in 1967, Mr. Stavropoulos served in numerous senior management positions, including President (1993 2000; 2002 2003), CEO (1995 2000; 2002 2004), and Chair man of the Executive Committee (2000 2004). Currently, he is a Direc tor of NCR Corporation (data warehousing and technology solutions), BellSouth Corporation (telecommunications), Chemical Financial Corporation, Maersk Inc. (industrial conglomerate, 2002 present), and Metalmark Capital (private equity investment firm, 2005 present). He also serves as a member of the Board of Trustees of the American Enter prise Institute for Public Policy Research. In addition, Mr. Stavropoulos is a member of The Business Council, J.P. Morgan International Council and the University of Notre Dame Advisory Council for the College of Science.
Year of Election or Appointment: 2005
Prior to his retirement in 2001, Mr. Wolfe was Chairman and Chief Executive Officer of Hershey Foods Corporation (1993 2001). He cur rently serves as a member of the boards of Adelphia Communications Corporation (2003 present), Bausch & Lomb, Inc., and Revlon Inc. (2004 present).
59 Annual Report
Trustees and Officers - continued
Advisory Board Member and Executive Officers:
Correspondence intended for each executive officer and Mr. Lynch may be sent to Fidelity Investments, 82 Devonshire Street, Boston, Massachusetts 02109.
| | Name, Age; Principal Occupation
Peter S. Lynch (61)
|
Year of Election or Appointment: 2003
Member of the Advisory Board of Fidelity Municipal Trust. Vice Chair man and a Director of FMR, and Vice Chairman (2001 present) and a Director (2000 present) of FMR Co., Inc. Previously, Mr. Lynch served as a Trustee of the Fidelity funds (1990 2003). In addition, he serves as a Trustee of Boston College, Massachusetts Eye & Ear Infirmary, Historic Deerfield, John F. Kennedy Library, and the Museum of Fine Arts of Boston.
Year of Election or Appointment: 2005
Vice President of the fund. Mr. Donovan also serves as Vice President of Fidelity’s High Income Funds (2005 present), Fidelity’s Fixed Income Funds (2005 present), certain Asset Allocation Funds (2005 present), and certain Balanced Funds (2005 present). Mr. Donovan also serves as Executive Vice President of FMR (2005 present) and FMRC (2005 present). Previously, Mr. Donovan served as Vice President and Director of Fidelity’s International Equity Trading group (1998 2005).
Year of Election or Appointment: 2005
Vice President of the fund. Mr. Murphy also serves as Vice President of Fidelity’s Money Market Funds (2002 present), certain Asset Allocation Funds (2003 present), Fidelity’s Investment Grade Bond Funds (2005 present), and Fidelity’s Balanced Funds (2005 present). He serves as Senior Vice President (2000 present) and Head (2004 present) of the Fidelity Investments Fixed Income Division. Mr. Murphy is also a Senior Vice President of FIMM (2003 present) and a Vice President of FMR (2000 present). Previously, Mr. Murphy served as Money Market Group Leader (2002 2004), Bond Group Leader (2000 2002), and Vice President of Fidelity’s Taxable Bond Funds (2000 2002) and Fidelity’s Municipal Bond Funds (2001 2002). Mr. Murphy joined Fidelity Invest ments in 1989 as a portfolio manager in the Bond Group.
Name, Age; Principal Occupation
Thomas J. Silvia (44)
|
Year of Election or Appointment: 2005
Vice President of the fund. Mr. Silvia also serves as Vice President of Fidelity’s Bond Funds (2005 present), certain Balanced Funds (2005 present), certain Asset Allocation Funds (2005 present), and Senior Vice President and Bond Group Leader of the Fidelity Investments Fixed Income Division (2005 present). Previously, Mr. Silvia served as Director of Fidelity’s Taxable Bond portfolio managers (2002 2004) and a portfolio manager in the Bond Group (1997 2004).
Year of Election or Appointment: 2004
Vice President of the fund. Mr. Sommer also serves as Vice President of other funds advised by FMR. Prior to assuming his current responsibi lities, Mr. Sommer worked as an analyst and manager.
Year of Election or Appointment: 1998
Secretary of the fund. He also serves as Secretary of other Fidelity funds; Vice President, General Counsel, and Secretary of FMR Co., Inc. (2001 present) and FMR; Assistant Secretary of Fidelity Management & Research (U.K.) Inc. (2001 present), Fidelity Management & Research (Far East) Inc. (2001 present), and Fidelity Investments Money Manage ment, Inc. (2001 present). Mr. Roiter is an Adjunct Member, Faculty of Law, at Boston College Law School (2003 present). Previously, Mr. Roiter served as Vice President and Secretary of Fidelity Distributors Corpora tion (FDC) (1998 2005).
Year of Election or Appointment: 2003
Assistant Secretary of the fund. Mr. Fross also serves as Assistant Secre tary of other Fidelity funds (2003 present), Vice President and Secretary of FDC (2005 present), and is an employee of FMR.
Year of Election or Appointment: 2004
President, Treasurer, and Anti Money Laundering (AML) officer of the fund. Ms. Reynolds also serves as President, Treasurer, and AML officer of other Fidelity funds (2004) and is a Vice President (2003) and an employee (2002) of FMR. Before joining Fidelity Investments, Ms. Reynolds worked at PricewaterhouseCoopers LLP (PwC) (1980 2002), where she was most recently an audit partner with PwC’s investment management practice.
61 Annual Report
Trustees and Officers - continued
| | Name, Age; Principal Occupation
Paul M. Murphy (58)
|
Year of Election or Appointment: 2005
Chief Financial Officer of the fund. Mr. Murphy also serves as Chief Financial Officer of other Fidelity funds (2005 present). He also serves as Senior Vice President of Fidelity Pricing and Cash Management Services Group (FPCMS).
| | Kenneth A. Rathgeber (58)
|
Year of Election or Appointment: 2004
Chief Compliance Officer of the fund. Mr. Rathgeber also serves as Chief Compliance Officer of other Fidelity funds (2004) and Executive Vice President of Risk Oversight for Fidelity Investments (2002). Previously, he served as Executive Vice President and Chief Operating Officer for Fidelity Investments Institutional Services Company, Inc. (1998 2002).
Year of Election or Appointment: 2003
Deputy Treasurer of the fund. Mr. Hebble also serves as Deputy Treasurer of other Fidelity funds (2003), and is an employee of FMR. Before join ing Fidelity Investments, Mr. Hebble worked at Deutsche Asset Manage ment where he served as Director of Fund Accounting (2002 2003) and Assistant Treasurer of the Scudder Funds (1998 2003).
Year of Election or Appointment: 2005
Deputy Treasurer of the fund. Mr. Mehrmann also serves as Deputy Treasurer of other Fidelity funds (2005 present) and is an employee of FMR. Previously, Mr. Mehrmann served as Vice President of Fidelity Investments Institutional Services Group (FIIS)/Fidelity Investments Institutional Operations Corporation, Inc. (FIIOC) Client Services (1998 2004).
| | Kimberley H. Monasterio (42)
|
Year of Election or Appointment: 2004
Deputy Treasurer of the fund. Ms. Monasterio also serves as Deputy Treasurer of other Fidelity funds (2004) and is an employee of FMR (2004). Before joining Fidelity Investments, Ms. Monasterio served as Treasurer (2000 2004) and Chief Financial Officer (2002 2004) of the Franklin Templeton Funds and Senior Vice President of Franklin Temple ton Services, LLC (2000 2004).
Name, Age; Principal Occupation
Kenneth B. Robins (36)
|
Year of Election or Appointment: 2005
Deputy Treasurer of the fund. Mr. Robins also serves as Deputy Treasurer of other Fidelity funds (2005 present) and is an employee of FMR (2004 present). Before joining Fidelity Investments, Mr. Robins worked at KPMG LLP, where he was a partner in KPMG’s department of professional practice (2002 2004) and a Senior Manager (1999 2000). In addition, Mr. Robins served as Assistant Chief Accountant, United States Securities and Exchange Commission (2000 2002).
Year of Election or Appointment: 2005
Assistant Treasurer of the fund. Mr. Byrnes also serves as Assistant Trea surer of other Fidelity funds (2005 present) and is an employee of FMR (2005 present). Previously, Mr. Byrnes served as Vice President of FPCMS (2003 2005). Before joining Fidelity Investments, Mr. Byrnes worked at Deutsche Asset Management where he served as Vice President of the Investment Operations Group (2000 2003).
Year of Election or Appointment: 1986
Assistant Treasurer of the fund. Mr. Costello also serves as Assistant Treasurer of other Fidelity funds and is an employee of FMR.
Year of Election or Appointment: 2004
Assistant Treasurer of the fund. Mr. Lydecker also serves as Assistant Treasurer of other Fidelity funds (2004) and is an employee of FMR.
Year of Election or Appointment: 2002
Assistant Treasurer of the fund. Mr. Osterheld also serves as Assistant Treasurer of other Fidelity funds (2002) and is an employee of FMR.
Year of Election or Appointment: 2005
Assistant Treasurer of the fund. Mr. Ryan also serves as Assistant Treasurer of other Fidelity funds (2005 present) and is an employee of FMR (2005 present). Previously, Mr. Ryan served as Vice President of Fund Reporting in FPCMS (1999 2005).
63 Annual Report
Trustees and Officers - continued
| | Name, Age; Principal Occupation
Salvatore Schiavone (40)
|
Year of Election or Appointment: 2005
Assistant Treasurer of the fund. Mr. Schiavone also serves as Assistant Treasurer of other Fidelity funds (2005 present) and is an employee of FMR (2005 present). Before joining Fidelity Investments, Mr. Schiavone worked at Deutsche Asset Management, where he most recently served as Assistant Treasurer (2003 2005) of the Scudder Funds and Vice President and Head of Fund Reporting (1996 2003).
During fiscal year ended 2005, 100% of the fund’s income dividends was free from federal income tax, and 9.66% of the fund’s income dividends was subject to the federal alternative minimum tax.
The fund will notify shareholders in January 2006 of amounts for use in preparing 2004 income tax returns.
65 Annual Report
Proxy Voting Results
A special meeting of the fund’s shareholders was held on January 18, 2006. The results of votes taken among shareholders on the proposal before them are reported below. Each vote reported represents one dollar of net asset value held on the record date for the meeting.
| PROPOSAL 1 | | | | |
| To elect a Board of Trustees.A | | |
| | | # of | | % of |
| | | Votes | | Votes |
| |
| Dennis J. Dirks | | | | |
| Affirmative | | 4,012,578,790.76 | | 95.238 |
| Withheld | | 200,653,306.55 | | 4.762 |
| TOTAL | | 4,213,232,097.31 | | 100.000 |
| Albert R. Gamper, Jr. | | |
| Affirmative | | 4,015,643,707.84 | | 95.310 |
| Withheld | | 197,588,389.47 | | 4.690 |
| TOTAL | | 4,213,232,097.31 | | 100.000 |
| Robert M. Gates | | |
| Affirmative | | 4,004,345,809.00 | | 95.042 |
| Withheld | | 208,886,288.31 | | 4.958 |
| TOTAL | | 4,213,232,097.31 | | 100.000 |
| George H. Heilmeier | | |
| Affirmative | | 4,008,127,523.93 | | 95.132 |
| Withheld | | 205,104,573.38 | | 4.868 |
| TOTAL | | 4,213,232,097.31 | | 100.000 |
| Abigail P. Johnson | | |
| Affirmative | | 3,993,175,527.66 | | 94.777 |
| Withheld | | 220,056,569.65 | | 5.223 |
| TOTAL | | 4,213,232,097.31 | | 100.000 |
| Edward C. Johnson 3d | | |
| Affirmative | | 3,987,333,615.26 | | 94.638 |
| Withheld | | 225,898,482.05 | | 5.362 |
| TOTAL | | 4,213,232,097.31 | | 100.000 |
| Stephen P. Jonas | | |
| Affirmative | | 4,010,007,680.52 | | 95.177 |
| Withheld | | 203,224,416.79 | | 4.823 |
| TOTAL | | 4,213,232,097.31 | | 100.000 |
| | | # of | | % of |
| | | Votes | | Votes |
| |
| Marie L. Knowles | | |
| Affirmative | | 4,010,231,303.96 | | 95.182 |
| Withheld | | 203,000,793.35 | | 4.818 |
| TOTAL | | 4,213,232,097.31 | | 100.000 |
| |
| Ned C. Lautenbach | | |
| Affirmative | | 4,009,136,177.44 | | 95.156 |
| Withheld | | 204,095,919.87 | | 4.844 |
| TOTAL | | 4,213,232,097.31 | | 100.000 |
| |
| William O. McCoy | | |
| Affirmative | | 4,001,996,735.35 | | 94.986 |
| Withheld | | 211,235,361.96 | | 5.014 |
| TOTAL | | 4,213,232,097.31 | | 100.000 |
| |
| Robert L. Reynolds | | |
| Affirmative | | 4,010,560,206.65 | | 95.190 |
| Withheld | | 202,671,890.66 | | 4.810 |
| TOTAL | | 4,213,232,097.31 | | 100.000 |
| |
| Cornelia M. Small | | |
| Affirmative | | 4,011,161,760.21 | | 95.204 |
| Withheld | | 202,070,337.10 | | 4.796 |
| TOTAL | | 4,213,232,097.31 | | 100.000 |
| |
| William S. Stavropoulos | | |
| Affirmative | | 4,001,217,912.57 | | 94.968 |
| Withheld | | 212,014,184.74 | | 5.032 |
| TOTAL | | 4,213,232,097.31 | | 100.000 |
| |
| Kenneth L. Wolfe | | |
| Affirmative | | 4,011,439,868.05 | | 95.211 |
| Withheld | | 201,792,229.26 | | 4.789 |
| TOTAL | | 4,213,232,097.31 | | 100.000 |
A Denotes trust-wide proposals and voting results.
Annual Report 66
67 Annual Report
69 Annual Report
Investment Adviser
Fidelity Management & Research Company
Boston, MA
Investment Sub Advisers
Fidelity Investments Money
Management, Inc.
Fidelity International Investment Advisors
Fidelity International Investment Advisors
(U.K.) Limited
General Distributor
Fidelity Distributors Corporation
Boston, MA
Transfer and Service Agents
Citibank, N.A.
New York, NY
Fidelity Investments Institutional
Operations Company, Inc.
Boston, MA
Custodian
Citibank, N.A.
New York, NY
|
ASTMI-UANN-0206
1.796657.102
|

Item 2. Code of Ethics
As of the end of the period, December 31, 2005, Fidelity Municipal Trust (the trust) has adopted a code of ethics, as defined in Item 2 of Form N-CSR, that applies to its President and Treasurer and its Chief Financial Officer. A copy of the code of ethics is filed as an exhibit to this Form N-CSR.
Item 3. Audit Committee Financial Expert
The Board of Trustees of the trust has determined that Marie L. Knowles is an audit committee financial expert, as defined in Item 3 of Form N-CSR. Ms. Knowles is independent for purposes of Item 3 of Form N-CSR.
Item 4. Principal Accountant Fees and Services
(a) Audit Fees.
For the fiscal years ended December 31, 2005 and December 31, 2004, the aggregate Audit Fees billed by PricewaterhouseCoopers LLP (PwC) for professional services rendered for the audits of the financial statements, or services that are normally provided in connection with statutory and regulatory filings or engagements for those fiscal years, for the Fidelity Michigan Municipal Income Fund, Fidelity Minnesota Municipal Income Fund, Fidelity Municipal Income Fund, Fidelity Ohio Municipal Income Fund, Fidelity Pennsylvania Municipal Income Fund and Fidelity Short-Intermediate Municipal Income Fund (the funds) and for all funds in the Fidelity Group of Funds are shown in the table below.
Fund | 2005A | 2004A |
Fidelity Michigan Municipal Income Fund | $41,000 | $38,000 |
Fidelity Minnesota Municipal Income Fund | $41,000 | $37,000 |
Fidelity Municipal Income Fund | $67,000 | $60,000 |
Fidelity Ohio Municipal Income Fund | $41,000 | $38,000 |
Fidelity Pennsylvania Municipal Income Fund | $41,000 | $37,000 |
Fidelity Short-Intermediate Municipal Income Fund | $46,000 | $41,000 |
All funds in the Fidelity Group of Funds audited by PwC | $12,300,000 | $10,800,000 |
A | Aggregate amounts may reflect rounding. |
(b) Audit-Related Fees.
In each of the fiscal years ended December 31, 2005 and December 31, 2004 the aggregate Audit-Related Fees billed by PwC for services rendered for assurance and related services to each fund that are reasonably related to the performance of the audit or review of the fund's financial statements, but not reported as Audit Fees, are shown in the table below.
Fund | 2005A | 2004A |
Fidelity Michigan Municipal Income Fund | $0 | $0 |
Fidelity Minnesota Municipal Income Fund | $0 | $0 |
Fidelity Municipal Income Fund | $0 | $0 |
Fidelity Ohio Municipal Income Fund | $0 | $0 |
Fidelity Pennsylvania Municipal Income Fund | $0 | $0 |
Fidelity Short-Intermediate Municipal Income Fund | $0 | $0 |
A | Aggregate amounts may reflect rounding. |
In each of the fiscal years ended December 31, 2005 and December 31, 2004, the aggregate Audit-Related Fees that were billed by PwC that were required to be approved by the Audit Committee for services rendered on behalf of Fidelity Management & Research Company (FMR) and entities controlling, controlled by, or under common control with FMR (not including any sub-adviser whose role is primarily portfolio management and is subcontracted with or overseen by another investment adviser) that provide ongoing services to the funds ("Fund Service Providers") for assurance and related services that relate directly to the operations and financial reporting of each fund that are reasonably related to the performance of the audit or review of the fund's financial statements, but not reported as Audit Fees, are shown in the table below.
Billed By | 2005A | 2004A |
PwC | $0 | $0 |
A | Aggregate amounts may reflect rounding. |
Fees included in the audit-related category comprise assurance and related services (e.g., due diligence services) that are traditionally performed by the independent registered public accounting firm. These audit-related services include due diligence related to mergers and acquisitions, accounting consultations and audits in connection with acquisitions, internal control reviews, attest services that are not required by statute or regulation and consultation concerning financial accounting and reporting standards.
(c) Tax Fees.
In each of the fiscal years ended December 31, 2005 and December 31, 2004, the aggregate Tax Fees billed by PwC for professional services rendered for tax compliance, tax advice, and tax planning for each fund is shown in the table below.
Fund | 2005A | 2004A |
Fidelity Michigan Municipal Income Fund | $2,500 | $2,400 |
Fidelity Minnesota Municipal Income Fund | $2,500 | $2,400 |
Fidelity Municipal Income Fund | $2,500 | $2,400 |
Fidelity Ohio Municipal Income Fund | $2,500 | $2,400 |
Fidelity Pennsylvania Municipal Income Fund | $2,500 | $2,400 |
Fidelity Short-Intermediate Municipal Income Fund | $2,500 | $2,400 |
A | Aggregate amounts may reflect rounding. |
In each of the fiscal years ended December 31, 2005 and December 31, 2004, the aggregate Tax Fees billed by PwC that were required to be approved by the Audit Committee for professional services rendered on behalf of the Fund Service Providers for tax compliance, tax advice, and tax planning that relate directly to the operations and financial reporting of each fund is shown in the table below.
Billed By | 2005A | 2004A |
PwC | $0 | $0 |
A | Aggregate amounts may reflect rounding. |
Fees included in the Tax Fees category comprise all services performed by professional staff in the independent registered public accounting firm's tax division except those services related to the audit. Typically, this category would include fees for tax compliance, tax planning, and tax advice. Tax compliance, tax advice, and tax planning services include preparation of original and amended tax returns, claims for refund and tax payment-planning services, assistance with tax audits and appeals, tax advice related to mergers and acquisitions and requests for rulings or technical advice from taxing authorities.
(d) All Other Fees.
In each of the fiscal years ended December 31, 2005 and December 31, 2004, the aggregate Other Fees billed by PwC for all other non-audit services rendered to the funds is shown in the table below.
Fund | 2005A | 2004A |
Fidelity Michigan Municipal Income Fund | $1,800 | $1,700 |
Fidelity Minnesota Municipal Income Fund | $1,700 | $1,500 |
Fidelity Municipal Income Fund | $5,400 | $5,300 |
Fidelity Ohio Municipal Income Fund | $1,700 | $1,600 |
Fidelity Pennsylvania Municipal Income Fund | $1,600 | $1,500 |
Fidelity Short-Intermediate Municipal Income Fund | $3,000 | $2,800 |
A | Aggregate amounts may reflect rounding. |
In each of the fiscal years ended December 31, 2005 and December 31, 2004, the aggregate Other Fees billed by PwC that were required to be approved by the Audit Committee for all other non-audit services rendered on behalf of the Fund Service Providers that relate directly to the operations and financial reporting of each fund is shown in the table below.
Billed By | 2005A | 2004A |
PwC | $190,000 | $490,000 |
A | Aggregate amounts may reflect rounding. |
Fees included in the All Other Fees category include services related to internal control reviews, strategy and other consulting, financial information systems design and implementation, consulting on other information systems, and other tax services unrelated to the fund.
(e) (1) | Audit Committee Pre-Approval Policies and Procedures: |
The trust's Audit Committee must pre-approve all audit and non-audit services provided by the independent registered public accounting firm relating to the operations or financial reporting of the funds. Prior to the commencement of any audit or non-audit services to a fund, the Audit Committee reviews the services to determine whether they are appropriate and permissible under applicable law.
The trust's Audit Committee has adopted policies and procedures to, among other purposes, provide a framework for the Committee's consideration of non-audit services by the audit firms that audit the Fidelity funds. The policies and procedures require that any non-audit service provided by a fund audit firm to a Fidelity Fund and any non-audit service provided by a fund auditor to a Fund Service Provider that relates directly to the operations and financial reporting of a Fidelity fund (Covered Service) are subject to approval by the Audit Committee before such service is provided. Non-audit services provided by a fund audit firm for a Fund Service Provider that do not relate directly to the operations and financial reporting of a Fidelity fund (Non-Covered Service) but that are expected to exceed $50,000 are also subject to pre-approval by the Audit Committee.
All Covered Services, as well as Non-Covered Services that are expected to exceed $50,000, must be approved in advance of provision of the service either: (i) by formal resolution of the Audit Committee, or (ii) by oral or written approval of the service by the Chair of the Audit Committee (or if the Chair is unavailable, such other member of the Audit Committee as may be designated by the Chair to act in the Chair's absence). The approval contemplated by (ii) above is permitted where the Treasurer determines that action on such an engagement is necessary before the next meeting of the Audit Committee. Neither pre-approval nor advance notice of Non-Covered Service engagements for which fees are not expected to exceed $50,000 is required; such engagements are to be reported to the Audit Committee monthly.
(e) (2) | Services approved pursuant to paragraph (c)(7)(i)(C) of Rule 2-01 of Regulation S-X: |
Audit-Related Fees:
There were no amounts that were approved by the Audit Committee pursuant to the de minimis exception for the fiscal years ended December 31, 2005 and December 31, 2004 on behalf of each fund.
There were no amounts that were required to be approved by the Audit Committee pursuant to the de minimis exception for the fiscal years ended December 31, 2005 and December 31, 2004 on behalf of the Fund Service Providers that relate directly to the operations and financial reporting of each fund.
Tax Fees:
There were no amounts that were approved by the Audit Committee pursuant to the de minimis exception for the fiscal years ended December 31, 2005 and December 31, 2004 on behalf of each fund.
There were no amounts that were required to be approved by the Audit Committee pursuant to the de minimis exception for the fiscal years ended December 31, 2005 and December 31, 2004 on behalf of the Fund Service Providers that relate directly to the operations and financial reporting of each fund.
All Other Fees:
There were no amounts that were approved by the Audit Committee pursuant to the de minimis exception for the fiscal years ended December 31, 2005 and December 31, 2004 on behalf of each fund.
There were no amounts that were required to be approved by the Audit Committee pursuant to the de minimis exception for the fiscal years ended December 31, 2005 and December 31, 2004 on behalf of the Fund Service Providers that relate directly to the operations and financial reporting of each fund.
(f) Not applicable.
(g) For the fiscal years ended December 31, 2005 and December 31, 2004, the aggregate fees billed by PwC of $3,600,000A and $2,700,000A for non-audit services rendered on behalf of the funds, FMR (not including any sub-adviser whose role is primarily portfolio management and is subcontracted with or overseen by another investment adviser) and Fund Service Providers relating to Covered Services and Non-Covered Services are shown in the table below.
| 2005A | 2004A |
Covered Services | $250,000 | $550,000 |
Non-Covered Services | $3,350,000 | $2,150,000 |
A | Aggregate amounts may reflect rounding. |
(h) The trust's Audit Committee has considered Non-Covered Services that were not pre-approved that were provided by PwC to Fund Service Providers to be compatible with maintaining the independence of PwC in its audit of the funds, taking into account representations from PwC, in accordance with Independence Standards Board Standard No.1, regarding its independence from the funds and their related entities.
Item 5. Audit Committee of Listed Registrants
Not applicable.
Item 6. Schedule of Investments
Not applicable.
Item 7. Disclosure of Proxy Voting Policies and Procedures for Closed-End Management Investment Companies
Not applicable.
Item 8. Portfolio Managers of Closed-End Management Investment Companies
Not applicable.
Item 9. Purchase of Equity Securities by Closed-End Management Investment Company and Affiliated Purchasers
Not applicable.
Item 10. Submission of Matters to a Vote of Security Holders
There were no material changes to the procedures by which shareholders may recommend nominees to the trust's Board of Trustees.
Item 11. Controls and Procedures
(a)(i) The President and Treasurer and the Chief Financial Officer have concluded that the trust's disclosure controls and procedures (as defined in Rule 30a-3(c) under the Investment Company Act) provide reasonable assurances that material information relating to the trust is made known to them by the appropriate persons, based on their evaluation of these controls and procedures as of a date within 90 days of the filing date of this report.
(a)(ii) There was no change in the trust's internal control over financial reporting (as defined in Rule 30a-3(d) under the Investment Company Act) that occurred during the second fiscal quarter of the period covered by this report that has materially affected, or is reasonably likely to materially affect, the trust's internal control over financial reporting.
Item 12. Exhibits
(a) | (1) | Code of Ethics pursuant to Item 2 of Form N-CSR is filed and attached hereto as EX-99.CODE ETH. |
(a) | (2) | Certification pursuant to Rule 30a-2(a) under the Investment Company Act of 1940 (17 CFR 270.30a-2(a)) is filed and attached hereto as Exhibit 99.CERT. |
(a) | (3) | Not applicable. |
(b) | | Certification pursuant to Rule 30a-2(b) under the Investment Company Act of 1940 (17 CFR 270.30a-2(b)) is furnished and attached hereto as Exhibit 99.906CERT. |
SIGNATURES
Pursuant to the requirements of the Securities Exchange Act of 1934 and the Investment Company Act of 1940, the registrant has duly caused this report to be signed on its behalf by the undersigned, thereunto duly authorized.
Fidelity Municipal Trust
By: | /s/Christine Reynolds |
| Christine Reynolds |
| President and Treasurer |
| |
Date: | February 17, 2006 |
Pursuant to the requirements of the Securities Exchange Act of 1934 and the Investment Company Act of 1940, this report has been signed below by the following persons on behalf of the registrant and in the capacities and on the dates indicated.
By: | /s/Christine Reynolds |
| Christine Reynolds |
| President and Treasurer |
| |
Date: | February 17, 2006 |
By: | /s/Paul M. Murphy |
| Paul M. Murphy |
| Chief Financial Officer |
| |
Date: | February 17, 2006 |