UNITED STATES
SECURITIES AND EXCHANGE COMMISSION
Washington, D.C. 20549
FORM N-CSR
CERTIFIED SHAREHOLDER REPORT OF REGISTERED
MANAGEMENT INVESTMENT COMPANIES
Investment Company Act file number 811-02628
Fidelity Municipal Trust
(Exact name of registrant as specified in charter)
245 Summer St., Boston, MA 02210
(Address of principal executive offices) (Zip code)
Marc Bryant, Secretary
245 Summer St.
Boston, Massachusetts 02210
(Name and address of agent for service)
Registrant's telephone number, including area code:
617-563-7000
| |
Date of fiscal year end: | December 31 |
|
|
Date of reporting period: | June 30, 2016 |
Item 1.
Reports to Stockholders
Fidelity® Municipal Income Fund
Semi-Annual Report June 30, 2016 |
 |
Contents
To view a fund's proxy voting guidelines and proxy voting record for the 12-month period ended June 30, visit http://www.fidelity.com/proxyvotingresults or visit the Securities and Exchange Commission's (SEC) web site at http://www.sec.gov.
You may also call 1-800-544-8544 to request a free copy of the proxy voting guidelines.
Standard & Poor's, S&P and S&P 500 are registered service marks of The McGraw-Hill Companies, Inc. and have been licensed for use by Fidelity Distributors Corporation.
Other third-party marks appearing herein are the property of their respective owners.
All other marks appearing herein are registered or unregistered trademarks or service marks of FMR LLC or an affiliated company. © 2016 FMR LLC. All rights reserved.
This report and the financial statements contained herein are submitted for the general information of the shareholders of the Fund. This report is not authorized for distribution to prospective investors in the Fund unless preceded or accompanied by an effective prospectus.
A fund files its complete schedule of portfolio holdings with the SEC for the first and third quarters of each fiscal year on Form N-Q. Forms N-Q are available on the SEC’s web site at http://www.sec.gov. A fund's Forms N-Q may be reviewed and copied at the SEC’s Public Reference Room in Washington, DC. Information regarding the operation of the SEC's Public Reference Room may be obtained by calling 1-800-SEC-0330.
For a complete list of a fund's portfolio holdings, view the most recent holdings listing, semiannual report, or annual report on Fidelity's web site at http://www.fidelity.com, http://www.institutional.fidelity.com, or http://www.401k.com, as applicable.
NOT FDIC INSURED •MAY LOSE VALUE •NO BANK GUARANTEE
Neither the Fund nor Fidelity Distributors Corporation is a bank.
Investment Summary (Unaudited)
Top Five States as of June 30, 2016
| | % of fund's net assets | % of fund's net assets 6 months ago |
| Illinois | 16.8 | 17.2 |
| Florida | 13.9 | 12.9 |
| California | 12.7 | 15.3 |
| Texas | 10.4 | 8.6 |
| New York | 7.1 | 7.9 |
Top Five Sectors as of June 30, 2016
| | % of fund's net assets | % of fund's net assets 6 months ago |
| General Obligations | 31.3 | 31.9 |
| Health Care | 18.7 | 18.4 |
| Transportation | 17.3 | 15.8 |
| Escrowed/Pre-Refunded | 9.5 | 9.3 |
| Electric Utilities | 7.6 | 7.9 |
Quality Diversification (% of fund's net assets)
| As of June 30, 2016 |
| | AAA | 3.8% |
| | AA,A | 81.1% |
| | BBB | 9.9% |
| | BB and Below | 1.1% |
| | Not Rated | 3.3% |
| | Short-Term Investments and Net Other Assets | 0.8% |

| As of December 31, 2015 |
| | AAA | 4.5% |
| | AA,A | 78.1% |
| | BBB | 8.6% |
| | BB and Below | 2.9% |
| | Not Rated | 4.0% |
| | Short-Term Investments and Net Other Assets | 1.9% |

We have used ratings from Moody's Investors Service, Inc. Where Moody's® ratings are not available, we have used S&P® ratings. All ratings are as of the date indicated and do not reflect subsequent changes.
Investments June 30, 2016 (Unaudited)
Showing Percentage of Net Assets
| Municipal Bonds - 99.1% | | | |
| | | Principal Amount (000s) | Value (000s) |
| Alabama - 0.2% | | | |
| Birmingham Gen. Oblig. Series 2013 A, 0% 3/1/32 (a) | | 3,500 | 3,951 |
| Montgomery Med. Clinic Facilities: | | | |
| 4% 3/1/36 | | $500 | $519 |
| 5% 3/1/33 | | 4,000 | 4,583 |
| Univ. of Alabama at Birmingham Hosp. Rev. Series 2008 A, 5.75% 9/1/22 | | 3,000 | 3,319 |
|
| TOTAL ALABAMA | | | 12,372 |
|
| Alaska - 0.4% | | | |
| Alaska Gen. Oblig. Series 2016 A: | | | |
| 5% 8/1/31 | | 1,885 | 2,352 |
| 5% 8/1/32 | | 5,615 | 6,979 |
| Alaska Int'l. Arpts. Revs. Series 2016 B, 5% 10/1/35 (b) | | 10,800 | 13,123 |
|
| TOTAL ALASKA | | | 22,454 |
|
| Arizona - 1.9% | | | |
| Arizona Ctfs. of Prtn. Series 2010 A: | | | |
| 5% 10/1/18 (FSA Insured) | | 2,670 | 2,917 |
| 5.25% 10/1/20 (FSA Insured) | | 8,000 | 9,009 |
| 5.25% 10/1/26 (FSA Insured) | | 2,570 | 2,888 |
| 5.25% 10/1/28 (FSA Insured) | | 8,345 | 9,372 |
| Arizona Health Facilities Auth. Rev. (Banner Health Sys. Proj.): | | | |
| Series 2007 B, 1.229%, tender 1/1/37 (c) | | 3,000 | 2,793 |
| Series 2008 D: | | | |
| 5.5% 1/1/38 | | 12,000 | 12,845 |
| 6% 1/1/27 | | 2,600 | 2,803 |
| Arizona State Lottery Rev. Series 2010 A, 5% 7/1/21 (FSA Insured) | | 5,800 | 6,576 |
| Glendale Gen. Oblig. Series 2015, 4% 7/1/20 (FSA Insured) | | 2,600 | 2,901 |
| Goodyear McDowell Road Commercial Corridor Impt. District 5.25% 1/1/18 (AMBAC Insured) | | 1,660 | 1,697 |
| Marana Muni. Property Corp. Facilities Rev. Series 2008 A, 5% 7/1/21 | | 1,580 | 1,711 |
| Maricopa County Indl. Dev. Auth. Hosp. Facilities Rev. (Samaritan Health Svcs. Proj.) Series 1990 A, 7% 12/1/16 (Escrowed to Maturity) | | 270 | 277 |
| Maricopa County Poll. Cont. Rev. (Southern California Edison Co. Proj.) Series 2000 A, 5% 6/1/35 | | 3,600 | 4,086 |
| McAllister Academic Village LLC Rev. (Arizona State Univ. Hassayampa Academic Village Proj.) Series 2008, 5.25% 7/1/39 (Pre-Refunded to 7/1/18 @ 100) | | 4,800 | 5,219 |
| Phoenix Civic Impt. Corp. District Rev. (Plaza Expansion Proj.) Series 2005 B, 5.5% 7/1/38 (Nat'l. Pub. Fin. Guarantee Corp. Insured) | | 12,000 | 17,620 |
| Phoenix Civic Impt. Corp. Excise Tax Rev. Series 2011 C: | | | |
| 5% 7/1/22 | | 1,000 | 1,192 |
| 5% 7/1/23 | | 2,000 | 2,381 |
| Pima County Swr. Sys. Rev.: | | | |
| Series 2011 B, 5% 7/1/22 (Pre-Refunded to 7/1/22 @ 100) | | 1,500 | 1,781 |
| Series 2012 A: | | | |
| 5% 7/1/24 | | 1,140 | 1,397 |
| 5% 7/1/26 | | 1,000 | 1,221 |
| Salt River Proj. Agricultural Impt. & Pwr. District Elec. Sys. Rev. Series 2009 A, 5% 1/1/26 | | 700 | 772 |
| Salt Verde Finl. Corp. Sr. Gas Rev. Series 2007: | | | |
| 5.25% 12/1/21 | | 3,500 | 4,123 |
| 5.5% 12/1/29 | | 7,900 | 10,311 |
| Scottsdale Indl. Dev. Auth. Hosp. Rev. (Scottsdale Healthcare Proj.) Series 2006 C, 5% 9/1/35 (FSA Insured) | | 845 | 957 |
| Univ. Med. Ctr. Corp. Hosp. Rev. Series 2011, 6% 7/1/39 (Pre-Refunded to 7/1/21 @ 100) | | 3,000 | 3,698 |
|
| TOTAL ARIZONA | | | 110,547 |
|
| California - 12.7% | | | |
| ABAG Fin. Auth. for Nonprofit Corps. Rev. (Sharp HealthCare Proj.) Series 2009 B, 6.25% 8/1/39 | | 2,800 | 3,262 |
| ABC Unified School District Series 1997 C, 0% 8/1/28 (Nat'l. Pub. Fin. Guarantee Corp. Insured) | | 3,925 | 2,925 |
| Bay Area Toll Auth. San Francisco Bay Toll Bridge Rev. Series 2009 F1, 5.625% 4/1/44 (Pre-Refunded to 4/1/19 @ 100) | | 6,350 | 7,202 |
| Cabrillo Unified School District Series A, 0% 8/1/20 (AMBAC Insured) | | 4,275 | 3,917 |
| California Edl. Facilities Auth. Rev. (Loyola Marymount Univ. Proj.) Series 2001 A: | | | |
| 0% 10/1/16 (Nat'l. Pub. Fin. Guarantee Corp. Insured) | | 2,140 | 2,137 |
| 0% 10/1/17 (Nat'l. Pub. Fin. Guarantee Corp. Insured) | | 2,050 | 2,028 |
| 0% 10/1/22 (Nat'l. Pub. Fin. Guarantee Corp. Insured) | | 5,000 | 4,485 |
| California Gen. Oblig.: | | | |
| Series 2007, 5.625% 5/1/20 | | 120 | 120 |
| 5% 3/1/19 | | 1,800 | 1,931 |
| 5% 8/1/19 (Pre-Refunded to 2/1/17 @ 100) | | 8,310 | 8,523 |
| 5% 8/1/20 (Pre-Refunded to 2/1/17 @ 100) | | 5,355 | 5,492 |
| 5% 10/1/22 | | 2,300 | 2,605 |
| 5% 11/1/22 | | 3,100 | 3,280 |
| 5% 12/1/22 | | 6,800 | 7,220 |
| 5% 11/1/24 | | 1,600 | 1,693 |
| 5% 9/1/35 (Pre-Refunded to 9/1/16 @ 100) | | 555 | 559 |
| 5.25% 9/1/23 | | 24,300 | 29,556 |
| 5.25% 12/1/33 | | 160 | 161 |
| 5.25% 4/1/35 | | 12,000 | 14,589 |
| 5.25% 3/1/38 | | 9,000 | 9,658 |
| 5.25% 11/1/40 | | 3,200 | 3,762 |
| 5.5% 8/1/27 | | 14,700 | 16,173 |
| 5.5% 4/1/28 | | 10 | 10 |
| 5.5% 8/1/29 | | 9,850 | 10,837 |
| 5.5% 4/1/30 | | 5 | 5 |
| 5.5% 3/1/40 | | 5,900 | 6,843 |
| 5.6% 3/1/36 | | 2,550 | 2,968 |
| 5.75% 4/1/31 | | 5,020 | 5,691 |
| 6% 3/1/33 | | 23,800 | 28,058 |
| 6% 4/1/38 | | 19,600 | 22,324 |
| 6% 11/1/39 | | 10,020 | 11,698 |
| 6.5% 4/1/33 | | 7,900 | 9,140 |
| California Health Facilities Fing. Auth. Rev.: | | | |
| (Catholic Healthcare West Proj.) Series 2009 E, 5.625% 7/1/25 | | 10,000 | 11,418 |
| (St. Joseph Health Sys. Proj.) Series 2009 A, 5.75% 7/1/39 | | 6,800 | 7,844 |
| (Stanford Hosp. & Clinics Proj.) Series 2010 B, 5.75% 11/15/31 | | 12,500 | 15,265 |
| California Pub. Works Board Lease Rev.: | | | |
| (Coalinga State Hosp. Proj.) Series 2013 E: | | | |
| 5% 6/1/27 | | 6,730 | 8,220 |
| 5% 6/1/28 | | 6,175 | 7,519 |
| (Monterey Bay Campus Library Proj.) Series 2009 D, 6.25% 4/1/34 (Pre-Refunded to 4/1/19 @ 100) | | 7,280 | 8,390 |
| (Office of Emergency Svcs. Proj.) Series 2007 A: | | | |
| 5% 3/1/21 | | 3,515 | 3,610 |
| 5% 3/1/22 | | 1,695 | 1,741 |
| (Porterville Developmental Ctr. Hsg. Expansion and Recreation Complex Proj.) Series 2009 C, 6.25% 4/1/34 | | 2,825 | 3,235 |
| (Univ. Proj.) Series 2011 B, 5.25% 10/1/26 (Pre-Refunded to 10/1/21 @ 100) | | 2,515 | 3,065 |
| (Various Cap. Projs.): | | | |
| Series 2011 A: | | | |
| 5% 10/1/27 | | 10,000 | 11,912 |
| 5.25% 10/1/26 | | 5,000 | 6,030 |
| Series 2012 A: | | | |
| 5% 4/1/25 | | 4,700 | 5,690 |
| 5% 4/1/26 | | 13,495 | 16,321 |
| Series 2012 G, 5% 11/1/25 | | 4,000 | 4,903 |
| (Various Judicial Council Projects) Series 2011 D: | | | |
| 5% 12/1/22 | | 4,100 | 4,934 |
| 5% 12/1/23 | | 7,355 | 8,847 |
| Series 2009 G1, 5.75% 10/1/30 | | 2,500 | 2,872 |
| Series 2009 I: | | | |
| 6.125% 11/1/29 | | 1,600 | 1,877 |
| 6.375% 11/1/34 | | 4,600 | 5,417 |
| Series 2010 A, 5.75% 3/1/30 | | 4,900 | 5,712 |
| California Statewide Cmntys. Dev. Auth. Rev.: | | | |
| (St. Joseph Health Sys. Proj.) Series 2007 C, 5.75% 7/1/47 (FGIC Insured) | | 5,000 | 5,507 |
| (Sutter Health Proj.) Series 2011 A, 6% 8/15/42 | | 11,700 | 14,231 |
| Encinitas Union School District Series 1996: | | | |
| 0% 8/1/20 (Nat'l. Pub. Fin. Guarantee Corp. Insured) | | 3,500 | 3,331 |
| 0% 8/1/21 (Nat'l. Pub. Fin. Guarantee Corp. Insured) | | 2,810 | 2,618 |
| Fontana Unified School District Gen. Oblig. 5% 5/1/19 (Assured Guaranty Corp. Insured) | | 1,300 | 1,454 |
| Long Beach Unified School District Series 2009: | | | |
| 5.5% 8/1/28 | | 235 | 268 |
| 5.5% 8/1/28 (Pre-Refunded to 8/1/19 @ 100) | | 3,575 | 4,101 |
| 5.5% 8/1/29 | | 125 | 142 |
| 5.5% 8/1/29 (Pre-Refunded to 8/1/19 @ 100) | | 1,875 | 2,151 |
| Los Angeles Cmnty. Redev. Agcy. Lease Rev. (Vermont Manchester Social Svcs. Proj.) Series 2005: | | | |
| 5% 9/1/18 (AMBAC Insured) | | 1,000 | 1,003 |
| 5% 9/1/19 (AMBAC Insured) | | 2,545 | 2,552 |
| Los Angeles Muni. Impt. Corp. Lease Rev. Series 2012 C: | | | |
| 5% 3/1/23 | | 5,335 | 6,404 |
| 5% 3/1/27 | | 2,000 | 2,372 |
| Los Angeles Wastewtr. Sys. Rev. Series 2009 A: | | | |
| 5.75% 6/1/34 | | 4,325 | 4,933 |
| 5.75% 6/1/34 (Pre-Refunded to 6/1/19 @ 100) | | 5,390 | 6,172 |
| Madera County Ctfs. of Prtn. (Children's Hosp. Central California Proj.) Series 2010, 5.375% 3/15/36 | | 3,000 | 3,384 |
| Monrovia Unified School District Series B, 0% 8/1/29 (Nat'l. Pub. Fin. Guarantee Corp. Insured) | | 4,525 | 3,258 |
| Monterey County Pub. Impt. Corp. Ctfs. of Prtn. Series 2007, 5% 8/1/19 (AMBAC Insured) | | 2,320 | 2,419 |
| North City West School Facilities Fing. Auth. Spl. Tax Series C, 5% 9/1/19 (AMBAC Insured) | | 3,015 | 3,388 |
| Oakland Gen. Oblig.: | | | |
| Series 2009 B, 6% 1/15/34 (Pre-Refunded to 1/15/19 @ 100) | | 2,500 | 2,834 |
| Series 2012: | | | |
| 5% 1/15/26 | | 4,535 | 5,266 |
| 5% 1/15/28 | | 4,345 | 5,026 |
| 5% 1/15/29 | | 5,370 | 6,205 |
| Oakland Unified School District Alameda County: | | | |
| Series 2009 A, 6.5% 8/1/22 | | 2,320 | 2,675 |
| Series 2015 A: | | | |
| 5% 8/1/25 (FSA Insured) | | 2,400 | 3,084 |
| 5% 8/1/26 | | 1,025 | 1,288 |
| 5% 8/1/27 (FSA Insured) | | 1,160 | 1,458 |
| 5% 8/1/29 | | 1,750 | 2,156 |
| Oakland-Alameda County Coliseum Auth. (Oakland Coliseum Proj.) Series 2012 A: | | | |
| 5% 2/1/19 | | 4,190 | 4,633 |
| 5% 2/1/24 | | 8,200 | 9,742 |
| Port of Oakland Rev.: | | | |
| Series 2007 B, 5% 11/1/19 (Nat'l. Pub. Fin. Guarantee Corp. Insured) | | 7,000 | 7,413 |
| Series 2012 P: | | | |
| 5% 5/1/23 (d) | | 6,455 | 7,725 |
| 5% 5/1/24 (d) | | 9,900 | 11,830 |
| Poway Unified School District: | | | |
| (District #2007-1 School Facilities Proj.) Series 2008 A, 0% 8/1/32 | | 4,900 | 3,195 |
| Series B: | | | |
| 0% 8/1/37 | | 7,800 | 4,191 |
| 0% 8/1/38 | | 10,200 | 5,275 |
| 0% 8/1/39 | | 20,100 | 10,044 |
| 0% 8/1/40 | | 3,000 | 1,448 |
| 0% 8/1/41 | | 13,610 | 6,341 |
| Poway Unified School District Pub. Fing.: | | | |
| 5% 9/1/26 | | 1,275 | 1,559 |
| 5% 9/1/29 | | 2,650 | 3,175 |
| 5% 9/1/31 | | 1,200 | 1,416 |
| Sacramento City Fing. Auth. Rev. Series A, 0% 12/1/26 (FGIC Insured) | | 4,200 | 3,260 |
| Sacramento Muni. Util. District Elec. Rev. Series 2012 Y, 5% 8/15/26 | | 10,000 | 12,212 |
| San Bernardino County Ctfs. of Prtn. (Arrowhead Proj.) Series 2009 A, 5.25% 8/1/26 | | 2,800 | 3,146 |
| San Diego Convention Ctr. Expansion Series 2012 A, 5% 4/15/25 | | 10,425 | 12,526 |
| San Diego Unified School District: | | | |
| Series 2008 C: | | | |
| 0% 7/1/34 | | 3,600 | 2,207 |
| 0% 7/1/39 | | 9,650 | 4,945 |
| 0% 7/1/41 | | 21,370 | 10,230 |
| Series 2008 E: | | | |
| 0% 7/1/47 (a) | | 7,400 | 4,894 |
| 0% 7/1/49 | | 25,500 | 8,995 |
| San Francisco City & County Arpts. Commission Int'l. Arpt. Rev. Series 2014 A, 5% 5/1/44 (d) | | 12,800 | 15,070 |
| San Joaquin County Ctfs. of Prtn. (County Administration Bldg. Proj.) Series 2007, 5% 11/15/18 (Nat'l. Pub. Fin. Guarantee Corp. Insured) | | 3,495 | 3,688 |
| San Jose Fing. Auth. Lease Rev. (Civic Ctr. Proj.) Series 2013 A: | | | |
| 5% 6/1/27 | | 4,610 | 5,634 |
| 5% 6/1/30 | | 16,190 | 19,539 |
| 5% 6/1/31 | | 11,785 | 14,155 |
| San Marcos Unified School District: | | | |
| Series 2010 A, 5% 8/1/38 | | 5,150 | 5,986 |
| Series 2010 B, 0% 8/1/47 | | 18,400 | 6,422 |
| San Mateo County Cmnty. College District Series A, 0% 9/1/26 (Nat'l. Pub. Fin. Guarantee Corp. Insured) | | 5,430 | 4,477 |
| Santa Monica-Malibu Unified School District Series 1999, 0% 8/1/20 (Nat'l. Pub. Fin. Guarantee Corp. Insured) | | 2,815 | 2,678 |
| Sonoma County Jr. College District Rev. Series 2002, 5% 8/1/28 (FSA Insured) | | 490 | 491 |
| Union Elementary School District: | | | |
| Series A, 0% 9/1/19 (Nat'l. Pub. Fin. Guarantee Corp. Insured) | | 1,750 | 1,683 |
| Series B, 0% 9/1/22 (Nat'l. Pub. Fin. Guarantee Corp. Insured) | | 1,500 | 1,341 |
| Univ. of California Regents Med. Ctr. Pool Rev. Series 2013 J, 5% 5/15/48 | | 4,000 | 4,765 |
| Univ. of California Revs.: | | | |
| (UCLA Med. Ctr. Proj.) Series B, 5.5% 5/15/17 (AMBAC Insured) | | 2,545 | 2,548 |
| Series 2016 O, 5.25% 5/15/39 (Pre-Refunded to 5/15/19 @ 100) | | 685 | 773 |
| Series 2016, 5.25% 5/15/39 | | 1,325 | 1,496 |
| Series O, 5.25% 5/15/39 (Pre-Refunded to 5/15/19 @ 100) | | 390 | 440 |
| Washington Township Health Care District Gen. Oblig. Series 2013 A, 5.5% 8/1/38 | | 4,500 | 5,691 |
| Washington Township Health Care District Rev.: | | | |
| Series 2007 A: | | | |
| 5% 7/1/18 | | 1,185 | 1,228 |
| 5% 7/1/27 | | 1,840 | 1,905 |
| Series 2009 A, 5.75% 7/1/24 | | 1,750 | 1,956 |
| Series 2010 A, 5.5% 7/1/38 | | 3,815 | 4,102 |
| West Contra Costa Unified School District: | | | |
| (Election of 2005 Proj.) Series B, 5.625% 8/1/35 (Pre-Refunded to 8/1/18 @ 100) | | 3,850 | 4,246 |
| Series 2012: | | | |
| 5% 8/1/24 | | 3,625 | 4,384 |
| 5% 8/1/25 | | 10,000 | 12,030 |
|
| TOTAL CALIFORNIA | | | 740,484 |
|
| Colorado - 0.6% | | | |
| Colorado Health Facilities Auth. Retirement Hsg. Rev. (Liberty Heights Proj.): | | | |
| Series B, 0% 7/15/20 (Escrowed to Maturity) | | 5,800 | 5,527 |
| 0% 7/15/22 (Escrowed to Maturity) | | 15,700 | 14,340 |
| Colorado Health Facilities Auth. Rev. (Parkview Episcopal Med. Ctr. Proj.) Series B: | | | |
| 5% 9/1/19 | | 1,115 | 1,171 |
| 5% 9/1/22 | | 1,500 | 1,578 |
| Denver City & County Arpt. Rev. Series 2007 E, 5% 11/15/32 (AMBAC Insured) | | 2,500 | 2,631 |
| E-470 Pub. Hwy. Auth. Rev.: | | | |
| Series 2000 B, 0% 9/1/20 (Nat'l. Pub. Fin. Guarantee Corp. Insured) | | 12,075 | 11,400 |
| Series 2010 C, 5.375% 9/1/26 | | 1,000 | 1,130 |
|
| TOTAL COLORADO | | | 37,777 |
|
| Connecticut - 0.4% | | | |
| Connecticut Gen. Oblig. Series 2016 B: | | | |
| 5% 5/15/25 | | 2,390 | 3,002 |
| 5% 5/15/26 | | 16,000 | 20,341 |
|
| TOTAL CONNECTICUT | | | 23,343 |
|
| Delaware - 0.1% | | | |
| Delaware Trans. Auth. (U.S. 301 Proj.) Series 2015, 5% 6/1/55 | | 4,800 | 5,664 |
| District Of Columbia - 1.1% | | | |
| District of Columbia Hosp. Rev. (Sibley Memorial Hosp. Proj.) Series 2009, 6.375% 10/1/39 (Pre-Refunded to 10/1/19 @ 100) | | 8,140 | 9,595 |
| District of Columbia Rev. Series B, 4.75% 6/1/32 | | 2,200 | 2,460 |
| Metropolitan Washington Arpts. Auth. Dulles Toll Road Rev. Series 2009 B: | | | |
| 0% 10/1/33 (Assured Guaranty Corp. Insured) | | 15,000 | 8,887 |
| 0% 10/1/34 (Assured Guaranty Corp. Insured) | | 15,000 | 8,544 |
| 0% 10/1/35 (Assured Guaranty Corp. Insured) | | 33,975 | 18,623 |
| 0% 10/1/39 (Assured Guaranty Corp. Insured) | | 5,030 | 2,367 |
| Metropolitan Washington DC Arpts. Auth. Sys. Rev. Series 2014 A: | | | |
| 5% 10/1/23 (d) | | 2,715 | 3,329 |
| 5% 10/1/24 (d) | | 7,000 | 8,738 |
|
| TOTAL DISTRICT OF COLUMBIA | | | 62,543 |
|
| Florida - 13.9% | | | |
| Alachua County Health Facilities Auth. Health Facilities Rev. (Avmed/Santa Fe Health Care Sys. Proj.) Series 1993, 6.05% 11/15/16 (Escrowed to Maturity) | | 1,055 | 1,076 |
| Boynton Beach Util. Sys. Rev. Series 2002, 5.5% 11/1/19 (Nat'l. Pub. Fin. Guarantee Corp. Insured) | | 3,300 | 3,793 |
| Brevard County School Board Ctfs. of Prtn. Series 2015 C: | | | |
| 5% 7/1/25 | | 2,000 | 2,529 |
| 5% 7/1/26 | | 1,000 | 1,261 |
| 5% 7/1/28 | | 1,745 | 2,174 |
| Broward County Arpt. Sys. Rev.: | | | |
| Series 2012 Q1, 5% 10/1/25 | | 5,215 | 6,253 |
| Series A: | | | |
| 5% 10/1/28 (d) | | 2,500 | 3,049 |
| 5% 10/1/30 (d) | | 3,500 | 4,250 |
| 5% 10/1/31 (d) | | 2,000 | 2,423 |
| 5% 10/1/32 (d) | | 2,400 | 2,899 |
| Broward County School Board Ctfs. of Prtn.: | | | |
| Series 2012 A: | | | |
| 5% 7/1/23 | | 21,020 | 25,377 |
| 5% 7/1/27 | | 5,695 | 6,803 |
| Series 2015 A: | | | |
| 5% 7/1/24 | | 1,915 | 2,413 |
| 5% 7/1/26 | | 7,200 | 9,131 |
| Series 2015 B: | | | |
| 5% 7/1/24 | | 1,940 | 2,444 |
| 5% 7/1/25 | | 2,355 | 3,009 |
| Citizens Property Ins. Corp.: | | | |
| Series 2011 A1: | | | |
| 5% 6/1/19 | | 1,715 | 1,915 |
| 5% 6/1/20 | | 3,000 | 3,456 |
| Series 2012 A1, 5% 6/1/21 | | 8,400 | 9,915 |
| Collier County Indl. Dev. Auth. Healthcare Facilities Rev. (NCH Healthcare Sys. Proj.) Series 2011, 6.25% 10/1/39 | | 24,450 | 29,691 |
| Duval County School Board Ctfs. of Prtn. Series 2015 B, 5% 7/1/32 | | 12,225 | 15,103 |
| Florida Board of Ed. Pub. Ed. Cap. Outlay: | | | |
| Series 2006 C, 5% 6/1/29 (Pre-Refunded to 6/1/17 @ 101) | | 4,500 | 4,718 |
| Series 2011 E, 5% 6/1/24 | | 6,600 | 7,822 |
| Series 2011 F, 5% 6/1/23 | | 6,070 | 7,213 |
| Series A, 5.5% 6/1/38 | | 2,000 | 2,189 |
| Florida Dept. of Children and Family Svcs. Ctfs. of Prtn. (South Florida Evaluation Treatment Ctr. Proj.): | | | |
| 5% 10/1/16 | | 2,025 | 2,031 |
| 5% 10/1/17 | | 2,130 | 2,137 |
| Florida Dept. of Trans. Rev. Series 2005 A: | | | |
| 5% 7/1/17 | | 3,360 | 3,371 |
| 5% 7/1/18 | | 3,320 | 3,331 |
| Florida Dev. Fin. Corp. Healthcare Facility Rev. 6% 2/1/33 | | 5,700 | 6,632 |
| Florida Gen. Oblig.: | | | |
| Series 2008 A, 5.25% 7/1/37 (Pre-Refunded to 7/1/17 @ 101) | | 3,000 | 3,163 |
| Series 2011 B, 5% 7/1/23 | | 10,175 | 12,079 |
| Florida Mid-Bay Bridge Auth. Rev.: | | | |
| Series 2015 A, 5% 10/1/35 | | 5,400 | 6,522 |
| Series 2015 C: | | | |
| 5% 10/1/30 | | 3,270 | 3,911 |
| 5% 10/1/40 | | 1,000 | 1,181 |
| Florida Muni. Pwr. Agcy. Rev.: | | | |
| (Requirements Pwr. Supply Proj.) Series 2016 A: | | | |
| 5% 10/1/30 | | 1,835 | 2,340 |
| 5% 10/1/31 | | 2,005 | 2,536 |
| (St. Lucie Proj.) Series 2012 A, 5% 10/1/26 | | 3,100 | 3,703 |
| Series 2009 A, 6.25% 10/1/31 (Pre-Refunded to 10/1/19 @ 100) | | 3,000 | 3,524 |
| Series 2015 B: | | | |
| 5% 10/1/28 | | 1,000 | 1,254 |
| 5% 10/1/30 | | 1,800 | 2,234 |
| Florida Wtr. Poll. Cont. Fing. Corp. Rev. Series 2003, 5.25% 1/15/20 | | 1,950 | 1,957 |
| Greater Orlando Aviation Auth. Arpt. Facilities Rev. Series 2016: | | | |
| 5% 10/1/24 (b)(d) | | 3,000 | 3,725 |
| 5% 10/1/25 (b)(d) | | 3,225 | 4,051 |
| 5% 10/1/26 (b)(d) | | 1,700 | 2,162 |
| 5% 10/1/27 (b)(d) | | 1,000 | 1,283 |
| Gulf Breeze Util. Sys. Rev. Series 2004, 5% 10/1/16 (AMBAC Insured) | | 520 | 521 |
| Halifax Hosp. Med. Ctr. Rev.: | | | |
| 4% 6/1/27 | | 1,200 | 1,342 |
| 5% 6/1/25 | | 1,285 | 1,603 |
| 5% 6/1/26 | | 1,375 | 1,702 |
| 5% 6/1/46 | | 2,510 | 2,934 |
| Highlands County Health Facilities Auth. Rev. (Adventist Health Sys./Sunbelt, Inc. Prog.): | | | |
| Series 2006 G: | | | |
| 5.125% 11/15/17 (Pre-Refunded to 11/15/16 @ 100) | | 95 | 97 |
| 5.125% 11/15/19 (Pre-Refunded to 11/15/16 @ 100) | | 70 | 71 |
| Series 2008 B, 6% 11/15/37 | | 11,000 | 12,756 |
| Hillsborough County Indl. Dev.: | | | |
| (H Lee Moffitt Cancer Ctr. Proj.) Series A: | | | |
| 5% 7/1/17 | | 1,930 | 2,010 |
| 5% 7/1/18 | | 2,125 | 2,211 |
| (Tampa Gen. Hosp. Proj.) Series 2006, 5.25% 10/1/41 | | 8,525 | 8,614 |
| Hillsborough County Indl. Dev. Auth. Indl. Dev. Rev. (Health Facilities/Univ. Cmnty. Hosp. Proj.) Series 2008 B, 8% 8/15/32 (Pre-Refunded to 8/15/19 @ 101) | | 4,900 | 6,020 |
| Jacksonville Sales Tax Rev. Series 2012, 5% 10/1/24 | | 5,500 | 6,645 |
| Lake County School Board Ctfs. of Prtn. Series 2014 A: | | | |
| 5% 6/1/27 (FSA Insured) | | 1,000 | 1,229 |
| 5% 6/1/28 (FSA Insured) | | 1,000 | 1,225 |
| 5% 6/1/30 (FSA Insured) | | 1,650 | 2,005 |
| Lee County Arpt. Rev. Series 2011 A, 5.375% 10/1/32 (d) | | 5,260 | 6,085 |
| Miami Beach Wtr. & Swr. Rev. 5.5% 9/1/27 (AMBAC Insured) | | 6,000 | 6,020 |
| Miami-Dade County Aviation Rev.: | | | |
| Series 2010 A: | | | |
| 5.375% 10/1/41 | | 5,800 | 6,673 |
| 5.5% 10/1/30 | | 3,000 | 3,541 |
| Series 2012 A: | | | |
| 5% 10/1/23 (d) | | 7,500 | 8,919 |
| 5% 10/1/24 (d) | | 9,050 | 10,704 |
| 5% 10/1/30 (d) | | 6,095 | 6,992 |
| 5% 10/1/31 (d) | | 2,500 | 2,863 |
| Series 2014 A: | | | |
| 5% 10/1/28 (d) | | 4,000 | 4,853 |
| 5% 10/1/33 (d) | | 8,385 | 9,923 |
| 5% 10/1/36 (d) | | 12,755 | 14,949 |
| 5% 10/1/37 | | 11,100 | 13,448 |
| Series 2015 A: | | | |
| 5% 10/1/29 (d) | | 1,585 | 1,930 |
| 5% 10/1/31 (d) | | 1,330 | 1,604 |
| 5% 10/1/35 (d) | | 3,400 | 3,990 |
| Miami-Dade County Cap. Asset Acquisition Series 2012 A, 5% 10/1/26 | | 3,750 | 4,514 |
| Miami-Dade County Expressway Auth.: | | | |
| Series 2014 A, 5% 7/1/44 | | 3,000 | 3,554 |
| Series 2014 B: | | | |
| 5% 7/1/26 | | 2,500 | 3,114 |
| 5% 7/1/27 | | 1,750 | 2,163 |
| Miami-Dade County School Board Ctfs. of Prtn.: | | | |
| Series 2008 A: | | | |
| 5% 8/1/18 (AMBAC Insured) | | 4,000 | 4,344 |
| 5% 8/1/20 (AMBAC Insured) | | 2,500 | 2,697 |
| 5% 8/1/21 (AMBAC Insured) | | 5,095 | 5,496 |
| 5% 8/1/22 (AMBAC Insured) | | 3,325 | 3,586 |
| Series 2011 B, 5.625% 5/1/31 | | 6,600 | 7,804 |
| Series 2015 A: | | | |
| 5% 5/1/26 | | 5,500 | 6,929 |
| 5% 5/1/28 | | 17,710 | 22,051 |
| Series 2015 B: | | | |
| 5% 5/1/26 | | 8,500 | 10,709 |
| 5% 5/1/27 | | 17,480 | 21,844 |
| 5% 5/1/28 | | 14,465 | 18,010 |
| Series 2016 A: | | | |
| 5% 5/1/30 | | 3,900 | 4,907 |
| 5% 5/1/32 | | 16,860 | 21,042 |
| Series 2016 B, 5% 8/1/26 | | 9,230 | 11,919 |
| Miami-Dade County Transit Sales Surtax Rev. Series 2012: | | | |
| 5% 7/1/24 | | 2,255 | 2,731 |
| 5% 7/1/42 | | 1,900 | 2,207 |
| Orange County Edl. Facilities Auth. Ed. Rev. (Rollins College Proj.): | | | |
| 5.25% 12/1/32 (AMBAC Insured) | | 1,350 | 1,430 |
| 5.25% 12/1/37 (AMBAC Insured) | | 1,365 | 1,443 |
| Orange County Health Facilities Auth.: | | | |
| (Orlando Health, Inc.) Series 2009, 5.125% 10/1/26 | | 5,030 | 5,674 |
| Series 2012 A, 5% 10/1/42 | | 14,700 | 16,812 |
| Series 2012 B, 5% 10/1/42 | | 5,900 | 6,748 |
| Orange County Health Facilities Auth. Rev. (Orlando Reg'l. Health Care Sys. Proj.) Series 1996 A, 6.25% 10/1/18 (Nat'l. Pub. Fin. Guarantee Corp. Insured) | | 4,500 | 4,855 |
| Orange County School Board Ctfs. of Prtn. Series 2015 C, 5% 8/1/30 | | 8,500 | 10,678 |
| Orlando & Orange County Expressway Auth. Rev. Series 2012, 5% 7/1/22 | | 2,500 | 3,034 |
| Orlando Utils. Commission Util. Sys. Rev.: | | | |
| Series 2009 B, 5% 10/1/33 | | 3,700 | 4,086 |
| Series 2012 A: | | | |
| 5% 10/1/23 | | 2,300 | 2,904 |
| 5% 10/1/25 | | 1,100 | 1,436 |
| Series 2013 A, 5% 10/1/25 | | 4,800 | 6,268 |
| Palm Beach County Arpt. Sys. Rev. Series 2016: | | | |
| 5% 10/1/21 (b)(d) | | 1,200 | 1,416 |
| 5% 10/1/23 (b)(d) | | 1,325 | 1,620 |
| 5% 10/1/24 (b)(d) | | 1,375 | 1,704 |
| 5% 10/1/25 (b)(d) | | 2,915 | 3,653 |
| 5% 10/1/26 (b)(d) | | 2,060 | 2,618 |
| 5% 10/1/27 (b)(d) | | 1,000 | 1,260 |
| 5% 10/1/29 (b)(d) | | 1,040 | 1,301 |
| 5% 10/1/30 (b)(d) | | 1,850 | 2,303 |
| 5% 10/1/31 (b)(d) | | 1,300 | 1,612 |
| 5% 10/1/32 (b)(d) | | 2,000 | 2,465 |
| 5% 10/1/33 (b)(d) | | 4,295 | 5,272 |
| Palm Beach County Health Facilities Auth. Hosp. Rev. Series 2014: | | | |
| 5% 12/1/22 | | 670 | 789 |
| 5% 12/1/23 | | 1,000 | 1,193 |
| 5% 12/1/24 | | 750 | 908 |
| 5% 12/1/25 | | 500 | 601 |
| Palm Beach County School Board Ctfs. of Prtn.: | | | |
| Series 2014 B: | | | |
| 4% 8/1/20 | | 5,000 | 5,563 |
| 5% 8/1/20 | | 6,010 | 6,925 |
| 5% 8/1/24 | | 3,500 | 4,416 |
| Series 2015 D: | | | |
| 5% 8/1/28 | | 4,035 | 5,084 |
| 5% 8/1/29 | | 13,665 | 17,153 |
| 5% 8/1/30 | | 14,105 | 17,585 |
| 5% 8/1/31 | | 14,165 | 17,594 |
| Palm Beach County Solid Waste Auth. Rev. Series 2011, 5% 10/1/24 | | 11,100 | 13,185 |
| South Florida Wtr. Mgmt. District Ctfs. of Prtn. Series 2015: | | | |
| 5% 10/1/26 | | 9,250 | 11,940 |
| 5% 10/1/29 | | 4,000 | 5,069 |
| 5% 10/1/32 | | 6,270 | 7,826 |
| South Lake County Hosp. District (South Lake Hosp., Inc.): | | | |
| Series 2009 A, 6.25% 4/1/39 | | 3,300 | 3,690 |
| Series 2010: | | | |
| 5% 10/1/25 | | 4,140 | 4,692 |
| 5.25% 10/1/34 | | 3,500 | 3,926 |
| St. Johns County School Board 5.25% 7/1/16 (Nat'l. Pub. Fin. Guarantee Corp. Insured) | | 1,400 | 1,400 |
| St. Petersburg Pub. Util. Rev. Series 2009 A, 5.5% 10/1/37 | | 7,000 | 8,005 |
| Tallahassee Health Facilities Rev.: | | | |
| (Tallahassee Memorial Healthcare, Inc. Proj.) Series 2016 A, 5% 12/1/55 | | 6,000 | 6,887 |
| Series 2015 A: | | | |
| 4% 12/1/35 | | 3,300 | 3,482 |
| 5% 12/1/40 | | 1,900 | 2,200 |
| Tampa Health Sys. Rev. (Baycare Health Sys. Proj.) Series 2010, 5% 11/15/23 | | 8,080 | 9,270 |
| Tampa Tax Allocation (H. Lee Moffitt Cancer Ctr. Proj.) Series 2012 A, 5% 9/1/22 | | 2,300 | 2,767 |
| Volusia County School Board Ctfs. of Prtn.: | | | |
| (Florida Master Lease Prog.) Series 2016 A, 5% 8/1/32 (Build America Mutual Assurance Insured) | | 5,000 | 6,192 |
| (Master Lease Prog.) Series 2014 B, 5% 8/1/25 | | 1,775 | 2,229 |
| Walton County School Board Ctfs. of Prtn. 5.25% 7/1/18 (FSA Insured) | | 1,865 | 2,022 |
|
| TOTAL FLORIDA | | | 810,318 |
|
| Georgia - 3.4% | | | |
| Atlanta Wtr. & Wastewtr. Rev.: | | | |
| Series 2009 A: | | | |
| 6% 11/1/25 (Pre-Refunded to 11/1/19 @ 100) | | 9,785 | 11,459 |
| 6.25% 11/1/39 (Pre-Refunded to 11/1/19 @ 100) | | 10,800 | 12,736 |
| 5% 11/1/27 | | 1,000 | 1,269 |
| 5% 11/1/30 | | 2,500 | 3,145 |
| Burke County Indl. Dev. Auth. Poll. Cont. Rev. Bonds: | | | |
| (Oglethorpe Pwr. Corp. Vogtle Proj.) Series 2013 A, 2.4%, tender 4/1/20 (c) | | 8,100 | 8,376 |
| 2.2%, tender 4/2/19 (c) | | 3,000 | 3,076 |
| 2.2%, tender 4/2/19 (c) | | 300 | 308 |
| 2.2%, tender 4/2/19 (c) | | 6,500 | 6,664 |
| 2.2%, tender 4/2/19 (c) | | 4,100 | 4,203 |
| Colquitt County Dev. Auth. Rev. Series C, 0% 12/1/21 (Escrowed to Maturity) | | 10,200 | 9,598 |
| DeKalb County Hosp. Auth. Rev. (DeKalb Med. Ctr., Inc. Proj.) Series 2010: | | | |
| 6% 9/1/30 | | 7,745 | 8,954 |
| 6.125% 9/1/40 | | 9,310 | 10,597 |
| DeKalb County Wtr. & Swr. Rev. Series 2011 A: | | | |
| 5.25% 10/1/36 | | 3,000 | 3,543 |
| 5.25% 10/1/41 | | 5,600 | 6,561 |
| Fulton County Wtr. & Swr. Rev. Series 2011: | | | |
| 5% 1/1/23 | | 1,500 | 1,755 |
| 5% 1/1/24 | | 6,500 | 7,604 |
| Georgia Gen. Oblig. Series 2007 E, 5% 8/1/22 (Pre-Refunded to 8/1/17 @ 100) | | 575 | 602 |
| Georgia Muni. Elec. Auth. Pwr. Rev.: | | | |
| Series C, 5% 1/1/22 | | 7,700 | 9,213 |
| Series GG, 5% 1/1/22 | | 4,000 | 4,805 |
| Georgia Muni. Gas Auth. Rev. (Gas Portfolio III Proj.) Series S: | | | |
| 5% 10/1/22 | | 3,425 | 4,122 |
| 5% 10/1/23 | | 4,000 | 4,852 |
| Main Street Natural Gas, Inc. Georgia Gas Proj. Rev. Series A, 5.25% 9/15/19 | | 1,915 | 2,140 |
| Metropolitan Atlanta Rapid Transit Auth. Sales Tax Rev. Third Series 2009 A, 5.25% 7/1/36 | | 8,500 | 9,555 |
| Private Colleges & Univs. Auth. Rev. (The Savannah College of Arts and Design Projs.) Series 2014: | | | |
| 5% 4/1/25 | | 3,500 | 4,230 |
| 5% 4/1/30 | | 1,200 | 1,435 |
| Richmond County Dev. Auth. Rev. (Southern Care Corp. Facility Proj.): | | | |
| Series A, 0% 12/1/21 (Escrowed to Maturity) | | 5,615 | 5,213 |
| Series C, 0% 12/1/21 (Escrowed to Maturity) | | 19,400 | 18,011 |
| Richmond County Hosp. Auth. (Univ. Health Svcs., Inc. Proj.) Series 2009, 5.5% 1/1/36 | | 13,550 | 14,959 |
| Savannah Econ. Dev. Auth. Rev. (Southern Care Corp. Proj.) Series C, 0% 12/1/21 (Escrowed to Maturity) | | 18,045 | 16,798 |
| Valdosta & Lowndes County Hosp. (South Georgia Med. Ctr. Proj.) 5% 10/1/20 | | 1,570 | 1,657 |
|
| TOTAL GEORGIA | | | 197,440 |
|
| Hawaii - 0.5% | | | |
| Hawaii Arpts. Sys. Rev. Series 2015 A: | | | |
| 5% 7/1/41 (d) | | 7,500 | 8,914 |
| 5% 7/1/45 (d) | | 14,505 | 17,189 |
| State of Hawaii Dept. of Trans. Series 2013: | | | |
| 5.25% 8/1/24 (d) | | 2,000 | 2,437 |
| 5.25% 8/1/25 (d) | | 2,500 | 3,033 |
|
| TOTAL HAWAII | | | 31,573 |
|
| Idaho - 0.3% | | | |
| Idaho Health Facilities Auth. Rev.: | | | |
| (St. Luke's Health Sys. Proj.) Series 2008 A: | | | |
| 6.5% 11/1/28 | | 4,355 | 4,920 |
| 6.75% 11/1/37 | | 4,300 | 4,855 |
| (Trinity Health Group Proj.) 2008 B, 6.25% 12/1/33 (Pre-Refunded to 12/1/18 @ 100) | | 2,190 | 2,480 |
| Series 2015 ID, 5% 12/1/25 | | 2,750 | 3,533 |
|
| TOTAL IDAHO | | | 15,788 |
|
| Illinois - 16.8% | | | |
| Boone & Winnebago County Cmnty. Unit School District 200: | | | |
| 0% 1/1/21 (Nat'l. Pub. Fin. Guarantee Corp. Insured) | | 1,810 | 1,662 |
| 0% 1/1/22 (Nat'l. Pub. Fin. Guarantee Corp. Insured) | | 1,950 | 1,745 |
| Chicago Board of Ed.: | | | |
| Series 1999 A, 0% 12/1/16 (Nat'l. Pub. Fin. Guarantee Corp. Insured) | | 3,200 | 3,166 |
| Series 2008 C: | | | |
| 5.25% 12/1/23 | | 2,050 | 1,907 |
| 5.25% 12/1/24 | | 1,385 | 1,276 |
| Series 2009: | | | |
| 4% 12/1/16 | | 350 | 355 |
| 4% 12/1/16 | | 1,040 | 1,049 |
| Series 2010 F, 5% 12/1/20 | | 1,100 | 1,005 |
| Series 2011 A: | | | |
| 5.25% 12/1/41 | | 2,975 | 2,633 |
| 5.5% 12/1/39 | | 7,900 | 7,267 |
| Series 2012 A, 5% 12/1/42 | | 3,130 | 2,774 |
| Chicago Gen. Oblig.: | | | |
| (Cap. Impt. Proj.) Series 1999: | | | |
| 0% 1/1/27 (Nat'l. Pub. Fin. Guarantee Corp. Insured) | | 4,700 | 3,174 |
| 0% 1/1/39 (Nat'l. Pub. Fin. Guarantee Corp. Insured) | | 15,200 | 5,776 |
| Series 2004 A, 5.25% 1/1/29 (FSA Insured) | | 435 | 436 |
| Series 2009 A, 5% 1/1/22 | | 1,720 | 1,773 |
| Series 2012 C, 5% 1/1/23 | | 3,070 | 3,182 |
| Series A, 5% 1/1/42 (AMBAC Insured) | | 40 | 40 |
| 5% 1/1/34 | | 1,500 | 1,507 |
| 5% 1/1/35 | | 15,000 | 14,982 |
| 5% 1/1/36 | | 11,555 | 11,541 |
| Chicago Midway Arpt. Rev.: | | | |
| Series 2014 A: | | | |
| 5% 1/1/27 (d) | | 10,330 | 12,340 |
| 5% 1/1/28 (d) | | 14,950 | 17,779 |
| 5% 1/1/33 (d) | | 5,375 | 6,275 |
| 5% 1/1/34 (d) | | 2,600 | 3,028 |
| Series 2016 B, 5% 1/1/46 | | 6,225 | 7,445 |
| Chicago O'Hare Int'l. Arpt. Rev.: | | | |
| Series 2011 C, 6.5% 1/1/41 | | 19,600 | 23,675 |
| Series 2012 A, 5% 1/1/22 (d) | | 5,575 | 6,544 |
| Series 2013 B, 5% 1/1/27 | | 11,275 | 13,543 |
| Series 2013 D, 5% 1/1/27 | | 1,000 | 1,201 |
| Series 2015 A, 5% 1/1/25 (d) | | 4,430 | 5,490 |
| Chicago Park District Gen. Oblig. Series 2013 A, 5.5% 1/1/33 | | 2,500 | 2,998 |
| Chicago Transit Auth. Series 2014, 5.25% 12/1/49 | | 13,000 | 15,074 |
| Chicago Transit Auth. Cap. Grant Receipts Rev. (Fed. Transit Administration Section 5307 Proj.) Series 2008 A: | | | |
| 5.25% 6/1/23 (Assured Guaranty Corp. Insured) | | 2,425 | 2,590 |
| 5.25% 6/1/25 (Assured Guaranty Corp. Insured) | | 3,495 | 3,721 |
| Chicago Wtr. Rev. Series 2000, 0% 11/1/16 (AMBAC Insured) | | 7,555 | 7,508 |
| Cook County Forest Preservation District: | | | |
| (Ltd. Tax Proj.) Series 2012 B, 5% 12/15/37 | | 2,500 | 2,831 |
| Series 2012 A, 5% 11/15/22 | | 2,000 | 2,323 |
| Series 2012 C, 5% 12/15/37 | | 1,000 | 1,133 |
| Cook County Gen. Oblig.: | | | |
| Series 2010 A, 5.25% 11/15/33 | | 19,775 | 21,955 |
| Series 2010 G, 5% 11/15/25 | | 3,400 | 3,801 |
| Series 2012 C, 5% 11/15/24 | | 9,400 | 11,020 |
| Series 2016 A: | | | |
| 5% 11/15/26 (b) | | 5,000 | 6,189 |
| 5% 11/15/27 (b) | | 1,240 | 1,522 |
| 5% 11/15/28 (b) | | 1,750 | 2,141 |
| 5% 11/15/29 (b) | | 3,100 | 3,774 |
| 5% 11/15/30 (b) | | 2,750 | 3,342 |
| DuPage County Forest Preserve District Rev. Series 2000, 0% 11/1/17 | | 6,665 | 6,588 |
| Illinois Dedicated Tax Rev. Series B, 0% 12/15/18 (AMBAC Insured) | | 4,500 | 4,138 |
| Illinois Dev. Fin. Auth. Retirement Hsg. Regency Park Rev. 0% 7/15/23 (Escrowed to Maturity) | | 29,680 | 26,444 |
| Illinois Fin. Auth. Rev.: | | | |
| (Advocate Health Care Proj.) Series 2008 D, 6.5% 11/1/38 (Pre-Refunded to 11/1/18 @ 100) | | 4,300 | 4,875 |
| (Central DuPage Health Proj.) Series 2009 B, 5.375% 11/1/39 | | 6,500 | 7,344 |
| (Children's Memorial Hosp. Proj.) Series 2008 A: | | | |
| 5.25% 8/15/33 (Assured Guaranty Corp. Insured) | | 7,800 | 8,459 |
| 5.25% 8/15/47 (Assured Guaranty Corp. Insured) | | 2,000 | 2,125 |
| (Edward Hosp. Obligated Group Proj.) Series 2008 A: | | | |
| 5.5% 2/1/40 (AMBAC Insured) | | 3,165 | 3,378 |
| 6% 2/1/28 (AMBAC Insured) | | 2,855 | 3,087 |
| (Northwest Cmnty. Hosp. Proj.) Series 2008 A, 5.5% 7/1/38 (Pre-Refunded to 7/1/18 @ 100) | | 12,615 | 13,818 |
| (Northwestern Memorial Hosp. Proj.) Series 2009 A, 6% 8/15/39 | | 4,020 | 4,679 |
| (Palos Cmnty. Hosp. Proj.) Series 2010 C: | | | |
| 5.375% 5/15/25 | | 25,230 | 29,179 |
| 5.375% 5/15/30 | | 6,160 | 7,084 |
| (Provena Health Proj.) Series 2010 A, 6% 5/1/28 | | 13,500 | 15,358 |
| (Rush Univ. Med. Ctr. Proj.): | | | |
| Series 2009 C, 6.625% 11/1/39 (Pre-Refunded to 5/1/19 @ 100) | | 8,200 | 9,559 |
| Series 2009 D, 6.625% 11/1/39 (Pre-Refunded to 5/1/19 @ 100) | | 8,000 | 9,326 |
| (Silver Cross Hosp. and Med. Ctr. Proj.) Series 2008 A, 5.5% 8/15/30 | | 1,645 | 1,761 |
| (Southern Illinois Healthcare Enterprises, Inc. Proj.) Series 2005, 5.25% 3/1/30 | | 5,900 | 6,715 |
| (The Univ. of Chicago Med. Ctr. Proj.) Series 2009 B, 5% 8/15/23 | | 5,550 | 6,378 |
| Series 2008 A: | | | |
| 5.625% 1/1/37 | | 27,960 | 29,589 |
| 6% 2/1/24 | | 300 | 325 |
| 6.25% 2/1/33 (AMBAC Insured) | | 300 | 325 |
| Series 2009: | | | |
| 6.875% 8/15/38 (Pre-Refunded to 8/15/19 @ 100) | | 430 | 510 |
| 7% 8/15/44 (Pre-Refunded to 8/15/19 @ 100) | | 15,955 | 18,986 |
| Series 2010 A: | | | |
| 5.5% 8/15/24 | | 2,900 | 3,253 |
| 5.5% 4/1/44 | | 1,590 | 1,775 |
| 5.5% 4/1/44 (Pre-Refunded to 4/1/19 @ 100) | | 1,410 | 1,590 |
| 5.75% 8/15/29 | | 2,320 | 2,609 |
| Series 2010, 5.25% 5/1/25 | | 7,000 | 8,106 |
| Series 2012 A, 5% 5/15/22 | | 2,120 | 2,528 |
| Series 2012: | | | |
| 4% 9/1/32 | | 7,460 | 7,706 |
| 5% 9/1/38 | | 23,950 | 26,708 |
| 5% 11/15/43 | | 4,395 | 4,900 |
| Series 2013: | | | |
| 5% 11/15/28 | | 2,875 | 3,304 |
| 5% 11/15/29 | | 1,400 | 1,605 |
| 5% 5/15/43 | | 10,000 | 11,061 |
| Series 2015 A: | | | |
| 5% 11/15/23 | | 500 | 619 |
| 5% 11/15/45 | | 2,410 | 2,859 |
| Series 2015 B, 5% 11/15/27 | | 3,160 | 3,900 |
| Series 2015 C: | | | |
| 5% 8/15/35 | | 6,425 | 7,566 |
| 5% 8/15/44 | | 30,850 | 35,868 |
| Series 2016 A: | | | |
| 5% 7/1/28 | | 1,230 | 1,526 |
| 5% 7/1/30 | | 710 | 874 |
| 5% 7/1/31 | | 535 | 656 |
| 5% 7/1/34 | | 3,000 | 3,633 |
| Illinois Gen. Oblig.: | | | |
| Series 2006: | | | |
| 5% 1/1/19 | | 4,200 | 4,512 |
| 5.5% 1/1/31 | | 3,000 | 3,670 |
| Series 2010: | | | |
| 5% 1/1/21 (FSA Insured) | | 2,600 | 2,846 |
| 5% 1/1/23 (FSA Insured) | | 6,600 | 7,194 |
| Series 2012 A, 5% 1/1/33 | | 4,700 | 5,054 |
| Series 2012: | | | |
| 5% 8/1/19 | | 2,500 | 2,724 |
| 5% 8/1/21 | | 2,000 | 2,210 |
| 5% 3/1/23 | | 4,000 | 4,450 |
| 5% 8/1/23 | | 3,900 | 4,401 |
| 5% 3/1/35 | | 2,000 | 2,152 |
| 5% 3/1/37 | | 1,000 | 1,075 |
| Series 2013 A, 5% 4/1/35 | | 1,800 | 1,948 |
| Series 2014: | | | |
| 5% 2/1/23 | | 4,400 | 4,941 |
| 5% 4/1/28 | | 1,125 | 1,251 |
| 5% 5/1/32 | | 2,600 | 2,867 |
| 5.25% 2/1/30 | | 9,000 | 10,077 |
| 5% 2/1/26 | | 2,325 | 2,599 |
| Illinois Health Facilities Auth. Rev.: | | | |
| (Delnor-Cmnty. Hosp. Proj.) Series 2002 D, 5.25% 5/15/32 (FSA Insured) | | 3,000 | 3,232 |
| (Lutheran Gen. Health Care Sys. Proj.) Series C, 6% 4/1/18 | | 2,015 | 2,122 |
| Illinois Muni. Elec. Agcy. Pwr. Supply Series 2015 A: | | | |
| 5% 2/1/25 | | 8,110 | 10,068 |
| 5% 2/1/26 | | 4,370 | 5,440 |
| Illinois Reg'l. Trans. Auth. Series A, 8% 6/1/17 (AMBAC Insured) | | 2,335 | 2,487 |
| Illinois Toll Hwy. Auth. Toll Hwy. Rev.: | | | |
| Series 2015 A, 5% 1/1/40 | | 13,300 | 16,116 |
| Series 2015 B, 5% 1/1/40 | | 7,400 | 9,010 |
| Series 2016 A: | | | |
| 5% 12/1/31 | | 5,000 | 6,241 |
| 5% 12/1/32 | | 7,900 | 9,815 |
| Kane, McHenry, Cook & DeKalb Counties Unit School District #300: | | | |
| Series 2014, 6.5% 1/1/20 (Escrowed to Maturity) | | 465 | 555 |
| 0% 12/1/17 (AMBAC Insured) | | 3,350 | 3,280 |
| 0% 12/1/17 (Escrowed to Maturity) | | 350 | 346 |
| 0% 12/1/21 (AMBAC Insured) | | 3,095 | 2,756 |
| 0% 12/1/21 (Escrowed to Maturity) | | 1,905 | 1,783 |
| 6.5% 1/1/20 (AMBAC Insured) | | 2,755 | 3,244 |
| 6.5% 1/1/20 (Escrowed to Maturity) | | 4,645 | 5,546 |
| Kendall, Kane & Will Counties Cmnty. Unit School District #308 Series 2016: | | | |
| 5% 2/1/34 | | 7,000 | 8,369 |
| 5% 2/1/35 | | 5,000 | 5,959 |
| 5% 2/1/36 | | 5,200 | 6,193 |
| Lake County Cmnty. Consolidated School District #73 Gen. Oblig. 0% 12/1/16 (Nat'l. Pub. Fin. Guarantee Corp. Insured) | | 1,905 | 1,898 |
| Lake County Cmnty. High School District #117, Antioch Series B, 0% 12/1/18 (Nat'l. Pub. Fin. Guarantee Corp. Insured) | | 7,240 | 6,925 |
| McHenry & Kane Counties Cmnty. Consolidated School District #158: | | | |
| Series 2004, 0% 1/1/24 (FSA Insured) | | 4,300 | 3,610 |
| 0% 1/1/19 | | 2,955 | 2,822 |
| 0% 1/1/19 (Escrowed to Maturity) | | 45 | 44 |
| Metropolitan Pier & Exposition: | | | |
| (McCormick Place Expansion Proj.): | | | |
| Series 1992 A, 0% 6/15/20 (Nat'l. Pub. Fin. Guarantee Corp. Insured) | | 3,610 | 3,304 |
| Series 1994 A, 0% 6/15/19 (Nat'l. Pub. Fin. Guarantee Corp. Insured) | | 2,935 | 2,764 |
| Series 1996 A, 0% 6/15/23 (Nat'l. Pub. Fin. Guarantee Corp. Insured) | | 5,300 | 4,394 |
| Series 2002 A: | | | |
| 0% 12/15/30 (Nat'l. Pub. Fin. Guarantee Corp. Insured) | | 32,600 | 19,977 |
| 0% 6/15/36 (Nat'l. Pub. Fin. Guarantee Corp. Insured) | | 4,445 | 2,102 |
| Series 2010 B1: | | | |
| 0% 6/15/43 (FSA Insured) | | 45,400 | 16,598 |
| 0% 6/15/44 (FSA Insured) | | 53,800 | 18,896 |
| 0% 6/15/45 (FSA Insured) | | 27,900 | 9,412 |
| 0% 6/15/47 (FSA Insured) | | 16,540 | 5,145 |
| Series 2012 B: | | | |
| 0% 12/15/51 | | 16,200 | 3,292 |
| 5% 6/15/52 | | 17,900 | 19,409 |
| Series A, 0% 6/15/19 (Nat'l. Pub. Fin. Guarantee Corp. Insured) | | 3,345 | 3,150 |
| Series 1996 A, 0% 6/15/24 | | 3,060 | 2,438 |
| Series A, 0% 12/15/19 (Nat'l. Pub. Fin. Guarantee Corp. Insured) | | 2,155 | 2,003 |
| 5.5% 6/15/20 | | 1,625 | 1,711 |
| 5.5% 6/15/20 (Pre-Refunded to 6/15/17 @ 100) | | 375 | 396 |
| Quincy Hosp. Rev. Series 2007: | | | |
| 5% 11/15/16 | | 1,200 | 1,218 |
| 5% 11/15/18 | | 1,000 | 1,056 |
| Univ. of Illinois Board of Trustees Ctfs. of Prtn. Series 2009 A: | | | |
| 5% 10/1/17 | | 555 | 583 |
| 5% 10/1/17 (Escrowed to Maturity) | | 745 | 785 |
| 5% 10/1/18 | | 615 | 646 |
| 5% 10/1/20 | | 550 | 577 |
| 5% 10/1/20 (Pre-Refunded to 10/1/17 @ 100) | | 740 | 780 |
| Univ. of Illinois Rev.: | | | |
| (Auxiliary Facilities Sys. Proj.): | | | |
| Series 1991: | | | |
| 0% 4/1/17 (Nat'l. Pub. Fin. Guarantee Corp. Insured) | | 16,270 | 16,097 |
| 0% 4/1/20 (Nat'l. Pub. Fin. Guarantee Corp. Insured) | | 8,000 | 7,432 |
| Series 1999 A, 0% 4/1/21 (Nat'l. Pub. Fin. Guarantee Corp. Insured) | | 4,965 | 4,485 |
| Series 2009 A, 5.75% 4/1/38 (Pre-Refunded to 4/1/19 @ 100) | | 7,805 | 8,855 |
| Series 2010 A: | | | |
| 5% 4/1/25 | | 5,125 | 5,743 |
| 5.25% 4/1/30 | | 3,200 | 3,611 |
| Series 2013: | | | |
| 6% 10/1/42 | | 4,600 | 5,581 |
| 6.25% 10/1/38 | | 4,530 | 5,611 |
| Will County Cmnty. Unit School District #365-U: | | | |
| 0% 11/1/16 (FSA Insured) | | 4,885 | 4,869 |
| 0% 11/1/17 (FSA Insured) | | 3,200 | 3,154 |
| 0% 11/1/19 (Escrowed to Maturity) | | 675 | 652 |
| 0% 11/1/19 (FSA Insured) | | 4,325 | 4,127 |
|
| TOTAL ILLINOIS | | | 981,853 |
|
| Indiana - 3.3% | | | |
| Crown Point Multi-School Bldg. Corp. 0% 1/15/21 (Nat'l. Pub. Fin. Guarantee Corp. Insured) | | 7,480 | 6,969 |
| Hobart Bldg. Corp. Series 2006, 6.5% 1/15/29 (Pre-Refunded to 1/15/20 @ 100) | | 25,900 | 31,031 |
| Indiana Fin. Auth. Health Sys. Rev. (Sisters of Saint Francis Health Svcs., Inc. Obligated Group Proj.): | | | |
| Series 2008 C, 5.375% 11/1/32 | | 7,815 | 8,591 |
| Series 2009 A, 5.25% 11/1/39 | | 5,300 | 5,963 |
| Indiana Fin. Auth. Rev.: | | | |
| (Trinity Health Cr. Group Proj.) Series 2009 A, 5.25% 12/1/38 | | 8,000 | 8,955 |
| Series 2012: | | | |
| 5% 3/1/30 | | 3,900 | 4,459 |
| 5% 3/1/41 | | 7,070 | 7,905 |
| Series 2015 A, 5.25% 2/1/32 | | 6,020 | 7,613 |
| Indiana Fin. Auth. Wastewtr. Util. Rev.: | | | |
| (CWA Auth. Proj.): | | | |
| Series 2012 A, 5% 10/1/26 | | 2,545 | 3,055 |
| Series 2015 A: | | | |
| 5% 10/1/30 | | 4,820 | 6,008 |
| 5% 10/1/45 | | 25,600 | 30,295 |
| Series 2011 A, 5.25% 10/1/25 | | 1,750 | 2,088 |
| Indiana Muni. Pwr. Agcy. Pwr. Supply Sys. Rev. Series 2011 A: | | | |
| 5% 1/1/22 | | 2,000 | 2,358 |
| 5% 1/1/23 | | 1,800 | 2,108 |
| Indiana Trans. Fin. Auth. Hwy. Rev. Series 1993 A, 0% 6/1/18 (AMBAC Insured) | | 1,700 | 1,673 |
| Indianapolis Local Pub. Impt. Series 2016: | | | |
| 4% 1/1/32 (d) | | 1,000 | 1,117 |
| 4% 1/1/33 (d) | | 1,000 | 1,113 |
| 4% 1/1/35 (d) | | 2,780 | 3,077 |
| 5% 1/1/21 (d) | | 3,945 | 4,573 |
| 5% 1/1/22 (d) | | 7,000 | 8,298 |
| 5% 1/1/23 (d) | | 2,625 | 3,175 |
| 5% 1/1/26 (d) | | 1,055 | 1,331 |
| Indianapolis Local Pub. Impt. Bond Bank (Indianapolis Arpt. Auth. Proj.) Series 2006 F, 5% 1/1/17 (AMBAC Insured) (d) | | 1,700 | 1,700 |
| Jasper County Indl. Poll. Ctl. Rev. (Northern Indiana Pub. Svc. Co. Proj.) Series 1988 C, 5.6% 11/1/16 (Nat'l. Pub. Fin. Guarantee Corp. Insured) | | 4,000 | 4,061 |
| Lake Central Multi-District School Bldg. Corp. Series 2012 B: | | | |
| 4% 7/15/18 | | 400 | 424 |
| 5% 1/15/30 | | 24,540 | 28,777 |
| Purdue Univ. Rev. (Student Facilities Sys. Proj.) Series 2009 B: | | | |
| 5% 7/1/24 (Pre-Refunded to 7/1/19 @ 100) | | 1,150 | 1,296 |
| 5% 7/1/25 (Pre-Refunded to 7/1/19 @ 100) | | 1,000 | 1,127 |
| 5% 7/1/26 (Pre-Refunded to 7/1/19 @ 100) | | 1,325 | 1,493 |
| 5% 7/1/29 (Pre-Refunded to 7/1/19 @ 100) | | 670 | 755 |
| Zionsville Cmnty. Schools Bldg. Series 2005, 5% 7/15/20 (FSA Insured) | | 1,945 | 2,226 |
|
| TOTAL INDIANA | | | 193,614 |
|
| Iowa - 0.1% | | | |
| Iowa Fin. Auth. Health Facilities Rev. Series 2008 A, 5.625% 8/15/37 (Pre-Refunded to 8/15/19 @ 100) | | 4,800 | 5,518 |
| Kansas - 0.6% | | | |
| Kansas Dev. Fin. Agcy. (Adventist Health Sys./Sunbelt Obligated Group Proj.) Series 2009 C, 5.75% 11/15/38 | | 10,600 | 12,202 |
| Leavenworth County Unified School District #453 Gen. Oblig. Series 2009 A, 5.25% 9/1/24 (Pre-Refunded to 9/1/19 @ 100) | | 1,575 | 1,784 |
| Overland Park Sales Tax Spl. Oblig. Rev. Series 2012, 4.375% 12/15/23 | | 4,700 | 4,361 |
| Wyandotte County/Kansas City Unified Govt. Util. Sys. Rev.: | | | |
| Series 2012 A: | | | |
| 5% 9/1/23 | | 1,860 | 2,226 |
| 5% 9/1/25 | | 4,000 | 4,765 |
| Series 2016 A: | | | |
| 5% 9/1/40 | | 3,115 | 3,751 |
| 5% 9/1/45 | | 5,000 | 6,008 |
|
| TOTAL KANSAS | | | 35,097 |
|
| Kentucky - 1.1% | | | |
| Ashland Med. Ctr. Rev. (Ashland Hosp. Corp. d/b/a/ King's Daughters Med. Ctr. Proj.) Series 2010 B, 5% 2/1/22 | | 1,355 | 1,481 |
| Kenton County Arpt. Board Arpt. Rev. Series 2016: | | | |
| 5% 1/1/21 | | 650 | 757 |
| 5% 1/1/22 | | 725 | 864 |
| 5% 1/1/23 | | 425 | 517 |
| 5% 1/1/28 | | 1,585 | 1,988 |
| 5% 1/1/31 | | 1,500 | 1,856 |
| 5% 1/1/32 | | 1,500 | 1,852 |
| Kentucky Econ. Dev. Fin. Auth. Hosp. Rev.: | | | |
| (Baptist Healthcare Sys. Proj.) Series A, 5% 8/15/17 | | 3,650 | 3,818 |
| (St. Elizabeth Med. Ctr., Inc. Proj.) Series 2009 A, 5.5% 5/1/39 (Pre-Refunded to 5/1/19 @ 100) | | 4,005 | 4,531 |
| Series 2010 A, 6% 6/1/30 | | 1,795 | 2,068 |
| Series 2015 A: | | | |
| 4.5% 6/1/46 | | 2,960 | 3,084 |
| 5.25% 6/1/50 | | 18,075 | 20,506 |
| Kentucky Econ. Dev. Fin. Auth. Rev. (Ashland Hosp. Corp. d/b/a King's Daughters Med. Ctr. Proj.) Series 2010 A, 5% 2/1/30 | | 5,000 | 5,334 |
| Louisville & Jefferson County Series 2013 A: | | | |
| 5.5% 10/1/33 | | 2,900 | 3,596 |
| 5.75% 10/1/38 | | 7,410 | 9,200 |
| Pikeville Hosp. Rev. (Pikeville Med. Ctr., Inc. Proj.) Series 2011, 6.5% 3/1/41 | | 3,000 | 3,560 |
|
| TOTAL KENTUCKY | | | 65,012 |
|
| Louisiana - 1.4% | | | |
| Louisiana Citizens Property Ins. Corp. Assessment Rev. Series 2015: | | | |
| 5% 6/1/20 | | 3,000 | 3,440 |
| 5% 6/1/22 (FSA Insured) | | 4,000 | 4,811 |
| Louisiana Gen. Oblig. Series 2016 B: | | | |
| 5% 8/1/27 | | 18,220 | 23,069 |
| 5% 8/1/28 | | 1,060 | 1,335 |
| 5% 8/1/29 | | 5,000 | 6,263 |
| Louisiana Pub. Facilities Auth. Hosp. Rev. (Franciscan Missionaries of Our Lady Health Sys. Proj.) Series 2009, 6.75% 7/1/39 (Pre-Refunded to 7/1/19 @ 100) | | 2,100 | 2,465 |
| New Orleans Aviation Board Rev.: | | | |
| (North Term. Proj.) Series 2015 B: | | | |
| 5% 1/1/29 (d) | | 2,400 | 2,881 |
| 5% 1/1/30 (d) | | 2,000 | 2,389 |
| 5% 1/1/31 (d) | | 2,500 | 2,977 |
| 5% 1/1/40 (d) | | 6,885 | 8,125 |
| Series 2007 A, 5% 1/1/17 (FSA Insured) (d) | | 1,420 | 1,449 |
| New Orleans Gen. Oblig. Series 2012: | | | |
| 5% 12/1/22 | | 8,645 | 10,497 |
| 5% 12/1/30 | | 2,000 | 2,361 |
| 5% 12/1/31 | | 1,000 | 1,179 |
| 5% 12/1/32 | | 1,500 | 1,765 |
| Tobacco Settlement Fing. Corp. Series 2013 A: | | | |
| 5% 5/15/22 | | 5,000 | 5,861 |
| 5% 5/15/23 | | 1,300 | 1,547 |
|
| TOTAL LOUISIANA | | | 82,414 |
|
| Maine - 0.2% | | | |
| Maine Health & Higher Ed. Facilities Auth. Rev. Series 2013, 5% 7/1/25 | | 1,140 | 1,340 |
| Maine Health & Higher Edl. Facilities Auth. Rev. Series 2016 A, 5% 7/1/46 (b) | | 4,000 | 4,632 |
| Maine Tpk. Auth. Tpk. Rev.: | | | |
| Series 2009, 6% 7/1/38 (Pre-Refunded to 7/1/19 @ 100) | | 2,700 | 3,122 |
| Series 2015: | | | |
| 5% 7/1/32 | | 1,050 | 1,318 |
| 5% 7/1/36 | | 2,600 | 3,219 |
|
| TOTAL MAINE | | | 13,631 |
|
| Maryland - 0.7% | | | |
| Baltimore Convention Ctr. Hotel Rev. Series A, 5.25% 9/1/39 (XL Cap. Assurance, Inc. Insured) | | 4,710 | 4,725 |
| Baltimore Proj. Rev. (Wtr. Proj.) Series 2009 A, 5.75% 7/1/39 (Pre-Refunded to 7/1/19 @ 100) | | 1,250 | 1,434 |
| Maryland Econ. Dev. Corp. (Purple Line Lt. Rail Proj.) Series 2016 D, 5% 3/31/46 (d) | | 3,000 | 3,634 |
| Maryland Health & Higher Edl. Facilities Auth. Rev.: | | | |
| (Anne Arundel Health Sys. Proj.) Series 2010, 5% 7/1/40 | | 2,000 | 2,182 |
| (Doctors Cmnty. Hosp. Proj.) Series 2010, 5.75% 7/1/38 | | 5,090 | 5,691 |
| (Univ. of Maryland Med. Sys. Proj.) Series 2010, 5.125% 7/1/39 | | 4,400 | 4,838 |
| (Washington County Health Sys. Proj.) Series 2008, 6% 1/1/28 (Pre-Refunded to 1/1/18 @ 100) | | 5,000 | 5,394 |
| Series 2010, 5.625% 7/1/30 | | 2,865 | 3,210 |
| Series 2015: | | | |
| 5% 7/1/40 | | 1,000 | 1,173 |
| 5% 7/1/45 | | 5,000 | 5,834 |
| 4% 7/1/42 | | 1,450 | 1,572 |
|
| TOTAL MARYLAND | | | 39,687 |
|
| Massachusetts - 0.6% | | | |
| Massachusetts Bay Trans. Auth. Sales Tax Rev. Series 2015 A: | | | |
| 5% 7/1/40 | | 1,500 | 1,864 |
| 5% 7/1/45 | | 1,495 | 1,851 |
| Massachusetts Dev. Fin. Agcy. Rev.: | | | |
| (Boston Univ. Proj.) Series U4, 5.7% 10/1/40 | | 7,500 | 8,617 |
| Series 2011 I, 6.75% 1/1/36 | | 3,000 | 3,633 |
| Series 2013 B1, 4.75% 11/15/20 (e) | | 6,660 | 6,668 |
| Series 2015 D, 5% 7/1/44 | | 5,205 | 6,096 |
| Series 2016: | | | |
| 5% 7/1/31 | | 1,675 | 2,078 |
| 5% 7/1/46 | | 1,390 | 1,653 |
| Massachusetts Gen. Oblig. Series 2016 A, 5% 3/1/46 | | 2,175 | 2,631 |
| Massachusetts Health & Edl. Facilities Auth. Rev. (Blood Research Institute Proj.) Series A, 6.5% 2/1/22 (f) | | 1,905 | 1,913 |
|
| TOTAL MASSACHUSETTS | | | 37,004 |
|
| Michigan - 2.1% | | | |
| Detroit School District Series 2012 A, 5% 5/1/23 | | 4,000 | 4,711 |
| Detroit Swr. Disp. Rev.: | | | |
| Series 2001 E, 5.75% 7/1/31 (Berkshire Hathaway Assurance Corp. Insured) (FGIC Insured) | | 4,000 | 4,365 |
| Series 2006 B, 5% 7/1/36 (Nat'l. Pub. Fin. Guarantee Corp. Insured) | | 20,700 | 20,732 |
| Detroit Wtr. Supply Sys. Rev.: | | | |
| Series 2004 A, 5.25% 7/1/16 (Nat'l. Pub. Fin. Guarantee Corp. Insured) | | 1,685 | 1,685 |
| Series 2006 B, 7% 7/1/36 (FSA Insured) | | 4,900 | 5,733 |
| DeWitt Pub. Schools Gen. Oblig. 5% 5/1/21 (Nat'l. Pub. Fin. Guarantee Corp. Insured) | | 1,650 | 1,769 |
| Lansing Board of Wtr. & Lt. Util. Rev. 5.5% 7/1/41 | | 2,500 | 2,939 |
| Lapeer Cmnty. Schools Series 2007, 5% 5/1/33 (Pre-Refunded to 5/1/18 @ 100) | | 2,600 | 2,805 |
| Michigan Fin. Auth. Rev.: | | | |
| Series 2012 A: | | | |
| 4.125% 6/1/32 (Pre-Refunded to 6/1/22 @ 100) | | 6,325 | 7,396 |
| 5% 6/1/20 (Escrowed to Maturity) | | 2,050 | 2,372 |
| 5% 6/1/27 (Pre-Refunded to 6/1/22 @ 100) | | 3,000 | 3,657 |
| 5% 6/1/39 (Pre-Refunded to 6/1/22 @ 100) | | 6,350 | 7,741 |
| Series 2012, 5% 11/15/42 | | 11,825 | 13,734 |
| Series 2015 MI, 5% 12/1/24 | | 4,445 | 5,645 |
| Series MI: | | | |
| 5.5% 12/1/26 | | 4,500 | 5,942 |
| 5.5% 12/1/27 | | 4,750 | 6,181 |
| Michigan Hosp. Fin. Auth. Rev.: | | | |
| Series 2008 A1, 6.5% 12/1/33 (Pre-Refunded to 12/1/18 @ 100) | | 3,175 | 3,606 |
| Series 2012 A: | | | |
| 5% 6/1/23 | | 2,395 | 2,883 |
| 5% 6/1/26 | | 2,000 | 2,375 |
| 6.5% 12/1/33 (Pre-Refunded to 12/1/18 @ 100) | | 695 | 789 |
| 6.5% 12/1/33 (Pre-Refunded to 12/1/18 @ 100) | | 130 | 148 |
| Portage Pub. Schools Series 2016: | | | |
| 5% 11/1/30 | | 2,855 | 3,555 |
| 5% 11/1/31 | | 2,525 | 3,134 |
| 5% 11/1/36 | | 250 | 306 |
| Wayne County Arpt. Auth. Rev. Series 2015 G, 5% 12/1/28 (d) | | 5,500 | 6,671 |
|
| TOTAL MICHIGAN | | | 120,874 |
|
| Minnesota - 0.3% | | | |
| Maple Grove Health Care Facilities Series 2015, 5% 9/1/29 | | 2,830 | 3,377 |
| Maple Grove Health Care Sys. Rev.: | | | |
| (Maple Grove Hosp. Corp. Proj.) Series 2007, 5.25% 5/1/28 | | 3,500 | 3,609 |
| 5% 5/1/20 | | 1,000 | 1,033 |
| Minnesota 911 Rev. (Pub. Safety Radio Communications Sys. Proj.) Series 2009, 5% 6/1/20 (Assured Guaranty Corp. Insured) | | 3,835 | 4,307 |
| Saint Paul Hsg. & Redev. Auth. Hosp. Rev. (HealthEast Care Sys. Proj.) Series 2015 A, 5% 11/15/44 | | 1,515 | 1,799 |
| St. Louis Park Health Care Facilities Rev. (Park Nicollet Health Svcs. Proj.) Series 2008 C, 5.5% 7/1/18 (Escrowed to Maturity) | | 5,600 | 6,128 |
|
| TOTAL MINNESOTA | | | 20,253 |
|
| Missouri - 0.4% | | | |
| Kansas City Spl. Oblig.: | | | |
| 5% 9/1/26 | | 1,185 | 1,326 |
| 5% 9/1/27 | | 490 | 547 |
| 5% 9/1/28 | | 1,000 | 1,116 |
| 5% 9/1/29 | | 1,000 | 1,115 |
| 5% 9/1/30 | | 1,390 | 1,549 |
| Missouri Dev. Fin. Board Infrastructure Facilities Rev. (City of Branson-Branson Landing Proj.) Series 2005 A, 6% 6/1/20 | | 1,500 | 1,624 |
| Missouri Health & Edl. Facilities Auth. Edl. Facilities Rev. Series 2015 B: | | | |
| 3.125% 2/1/27 | | 800 | 836 |
| 3.25% 2/1/28 | | 800 | 840 |
| 4% 2/1/40 | | 700 | 750 |
| 5% 2/1/31 | | 2,595 | 3,125 |
| 5% 2/1/33 | | 2,870 | 3,423 |
| 5% 2/1/36 | | 2,300 | 2,711 |
| 5% 2/1/45 | | 3,600 | 4,202 |
|
| TOTAL MISSOURI | | | 23,164 |
|
| Nebraska - 0.5% | | | |
| Central Plains Energy Proj. Rev. (Nebraska Gas Proj.) Series 2007 B, 0.951% 12/1/17 (c) | | 7,900 | 7,853 |
| Douglas County Hosp. Auth. #2 Health Facilities Rev.: | | | |
| 6% 8/15/23 | | 1,210 | 1,286 |
| 6% 8/15/28 | | 1,980 | 2,102 |
| 6.125% 8/15/31 | | 1,275 | 1,354 |
| Nebraska Pub. Pwr. District Rev. Series 2016 B, 5% 1/1/37 | | 11,900 | 14,590 |
|
| TOTAL NEBRASKA | | | 27,185 |
|
| Nevada - 0.2% | | | |
| Clark County Wtr. Reclamation District Series 2009 A, 5.25% 7/1/29 (Berkshire Hathaway Assurance Corp. Insured) | | 4,300 | 4,861 |
| Las Vegas Valley Wtr. District Wtr. Impt. Gen. Oblig. Series 2011 C, 5% 6/1/24 | | 5,415 | 6,378 |
|
| TOTAL NEVADA | | | 11,239 |
|
| New Hampshire - 0.5% | | | |
| New Hampshire Bus. Fin. Auth. Rev. Series 2009 A, 6.125% 10/1/39 | | 9,300 | 10,471 |
| New Hampshire Health & Ed. Facilities Auth. Rev.: | | | |
| (Dartmouth College Proj.) Series 2009, 5.25% 6/1/39 (Pre-Refunded to 6/1/19 @ 100) | | 4,000 | 4,517 |
| Series 2007 A, 5% 10/1/37 | | 6,100 | 6,393 |
| Series 2012: | | | |
| 4% 7/1/32 | | 2,370 | 2,488 |
| 5% 7/1/24 | | 1,000 | 1,170 |
| 5% 7/1/25 | | 1,185 | 1,375 |
| New Hampshire Tpk. Sys. Rev. Series 2012 B: | | | |
| 5% 2/1/19 | | 2,000 | 2,210 |
| 5% 2/1/24 | | 1,775 | 2,111 |
|
| TOTAL NEW HAMPSHIRE | | | 30,735 |
|
| New Jersey - 3.4% | | | |
| New Jersey Econ. Dev. Auth. Rev.: | | | |
| Series 2009 AA, 5.5% 12/15/29 | | 4,000 | 4,385 |
| Series 2013 NN, 5% 3/1/27 | | 69,700 | 77,195 |
| Series 2013: | | | |
| 5% 3/1/23 | | 12,200 | 13,763 |
| 5% 3/1/24 | | 17,000 | 18,895 |
| 5% 3/1/25 | | 1,900 | 2,125 |
| Series 2015 XX, 5.25% 6/15/27 | | 17,000 | 19,705 |
| New Jersey Edl. Facility Series 2016 A: | | | |
| 5% 7/1/31 (b) | | 1,100 | 1,315 |
| 5% 7/1/32 (b) | | 3,000 | 3,571 |
| New Jersey Health Care Facilities Fing. Auth. Rev.: | | | |
| Series 2008, 6.625% 7/1/38 | | 9,930 | 10,891 |
| Series 2016 A: | | | |
| 5% 7/1/27 | | 750 | 945 |
| 5% 7/1/30 | | 1,000 | 1,241 |
| New Jersey Trans. Trust Fund Auth.: | | | |
| Series 2001 A, 6% 6/15/35 | | 3,900 | 4,594 |
| Series 2005 B, 5.5% 12/15/21 (Nat'l. Pub. Fin. Guarantee Corp. Insured) | | 5,000 | 5,833 |
| Series 2014 AA: | | | |
| 5% 6/15/23 | | 20,645 | 23,506 |
| 5% 6/15/24 | | 10,000 | 11,419 |
|
| TOTAL NEW JERSEY | | | 199,383 |
|
| New York - 7.1% | | | |
| Hudson Yards Infrastructure Corp. New York Rev. Series 2012 A, 5.75% 2/15/47 | | 14,600 | 17,468 |
| Long Island Pwr. Auth. Elec. Sys. Rev. Series 2012 A, 5% 9/1/42 | | 13,000 | 15,092 |
| New York City Gen. Oblig.: | | | |
| Series 2003 A, 5.5% 8/1/20 (Nat'l. Pub. Fin. Guarantee Corp. Insured) | | 5 | 5 |
| Series 2007 D1: | | | |
| 5.125% 12/1/22 | | 1,980 | 2,103 |
| 5.125% 12/1/22 (Pre-Refunded to 12/1/17 @ 100) | | 490 | 521 |
| Series 2008: | | | |
| 5.25% 8/15/27 | | 9,575 | 10,483 |
| 5.25% 8/15/27 (Pre-Refunded to 8/15/18 @ 100) | | 365 | 400 |
| Series 2009: | | | |
| 5.625% 4/1/29 | | 1,675 | 1,897 |
| 5.625% 4/1/29 (Pre-Refunded to 4/1/19 @ 100) | | 1,925 | 2,179 |
| Series 2012 A1, 5% 8/1/24 | | 7,400 | 8,815 |
| Series 2012 G1, 5% 4/1/25 | | 13,700 | 16,476 |
| New York City Indl. Dev. Agcy. Civic Facility Rev. (Polytechnic Univ. NY Proj.) 5.25% 11/1/27 (ACA Finl. Guaranty Corp. Insured) | | 3,100 | 3,284 |
| New York City Indl. Dev. Agcy. Rev.: | | | |
| (Queens Baseball Stadium Proj.) 5% 1/1/19 (AMBAC Insured) | | 3,735 | 3,817 |
| (Yankee Stadium Proj.) Series 2006, 5% 3/1/31 | | 4,725 | 4,755 |
| New York City Muni. Wtr. Fin. Auth. Wtr. & Swr. Sys. Rev.: | | | |
| Series 2009 A, 5.75% 6/15/40 (Pre-Refunded to 6/15/18 @ 100) | | 345 | 379 |
| Series 2009 EE, 5.25% 6/15/40 | | 11,600 | 13,058 |
| Series 2009 FF 2, 5.5% 6/15/40 | | 17,800 | 20,183 |
| Series 2011 EE, 5.375% 6/15/43 | | 42,080 | 49,657 |
| Series 2012 EE, 5.25% 6/15/30 | | 17,200 | 20,985 |
| Series 2013 BB, 5% 6/15/47 | | 8,985 | 10,714 |
| New York City Transitional Fin. Auth. Bldg. Aid Rev.: | | | |
| Series 2009 S1: | | | |
| 5.5% 7/15/38 | | 1,600 | 1,745 |
| 5.625% 7/15/38 | | 2,825 | 3,092 |
| Series 2009 S3: | | | |
| 5.25% 1/15/34 | | 21,000 | 23,242 |
| 5.25% 1/15/39 | | 3,400 | 3,750 |
| 5.375% 1/15/34 | | 2,750 | 3,052 |
| Series 2009 S4: | | | |
| 5.5% 1/15/39 | | 8,800 | 9,792 |
| 5.75% 1/15/39 | | 4,100 | 4,594 |
| New York City Transitional Fin. Auth. Rev. Series 2015 E1, 5% 2/1/41 | | 2,725 | 3,335 |
| New York Dorm. Auth. Mental Health Svcs. Facilities Impt. Rev.: | | | |
| (State Univ. Proj.) Series 2012 A: | | | |
| 5% 5/15/21 | | 10,710 | 12,675 |
| 5% 5/15/22 | | 4,300 | 5,216 |
| Series 2012 A: | | | |
| 4% 5/15/21 | | 3,500 | 3,977 |
| 5% 5/15/23 | | 5,600 | 6,797 |
| New York Dorm. Auth. Personal Income Tax Rev.: | | | |
| (Ed. Proj.) Series 2008 B, 5.75% 3/15/36 | | 3,400 | 3,843 |
| Series 2014 A: | | | |
| 5% 2/15/39 | | 3,995 | 4,406 |
| 5% 2/15/39 (Pre-Refunded to 2/15/19 @ 100) | | 5 | 6 |
| New York Dorm. Auth. Revs.: | | | |
| (New York Univ. Hosp. Ctr. Proj.) Series 2007 B, 5.25% 7/1/24 (Pre-Refunded to 7/1/17 @ 100) | | 1,655 | 1,714 |
| (State Univ. Edl. Facilities Proj.) Series A, 5.875% 5/15/17 (Nat'l. Pub. Fin. Guarantee Corp. Insured) | | 3,515 | 3,676 |
| Series 2010 A, 5% 7/1/26 | | 4,000 | 4,565 |
| New York Metropolitan Trans. Auth. Dedicated Tax Fund Rev. Series 2009 B, 5% 11/15/34 | | 11,800 | 13,330 |
| New York Metropolitan Trans. Auth. Rev.: | | | |
| Series 2010 D, 5.25% 11/15/40 | | 6,600 | 7,683 |
| Series 2012 D, 5% 11/15/25 | | 25,900 | 31,712 |
| Series 2012 F, 5% 11/15/24 | | 12,400 | 15,225 |
| Series 2014 B, 5% 11/15/44 | | 8,500 | 10,202 |
| Series 2015 A1, 5% 11/15/45 | | 14,850 | 17,901 |
| New York Trans. Dev. Corp. (Laguardia Arpt. Term. B Redev. Proj.) Series 2016 A, 5% 7/1/46 (d) | | 8,000 | 9,215 |
| Niagara Falls City Niagara County Pub. Impt. 7.5% 3/1/18 (Nat'l. Pub. Fin. Guarantee Corp. Insured) | | 460 | 507 |
| Rockland County Gen. Oblig. Series 2014 A, 4% 3/1/24 (FSA Insured) | | 1,375 | 1,590 |
| Tobacco Settlement Fing. Corp. Series 2013 B, 5% 6/1/21 | | 90 | 90 |
| Triborough Bridge & Tunnel Auth. Revs. Series 2015 A, 5.25% 11/15/45 | | 4,000 | 4,988 |
|
| TOTAL NEW YORK | | | 414,191 |
|
| North Carolina - 0.3% | | | |
| Charlotte-Mecklenburg Hosp. Auth. Health Care Sys. Rev. Series A, 5% 1/15/20 (FSA Insured) | | 960 | 984 |
| Nash Health Care Sys. Health Care Facilities Rev. Series 2012, 5% 11/1/41 | | 4,625 | 5,191 |
| North Carolina Med. Care Cmnty. Health Series 2012 A, 5% 11/15/26 | | 1,295 | 1,551 |
| North Carolina Med. Care Commission Health Care Facilities Rev. (Rex Healthcare Proj.) Series 2010 A, 5% 7/1/30 | | 7,830 | 8,932 |
| North Carolina Muni. Pwr. Agcy. #1 Catawba Elec. Rev.: | | | |
| Series 2009, 5% 1/1/30 (Pre-Refunded to 1/1/19 @ 100) | | 1,630 | 1,800 |
| 5% 1/1/30 | | 670 | 730 |
|
| TOTAL NORTH CAROLINA | | | 19,188 |
|
| North Dakota - 0.1% | | | |
| Cass County Health Care Facilities Rev. (Essentia Health Obligated Group Proj.) Series 2008, 5.125% 2/15/37 (Assured Guaranty Corp. Insured) | | 4,600 | 5,165 |
| Fargo Health Sys. Rev. (Sanford Proj.) Series 2011, 6% 11/1/28 | | 1,500 | 1,852 |
|
| TOTAL NORTH DAKOTA | | | 7,017 |
|
| Ohio - 1.8% | | | |
| American Muni. Pwr., Inc. Rev.: | | | |
| (Freemont Energy Ctr. Proj.) Series 2012 B, 5% 2/15/42 | | 2,500 | 2,926 |
| (Prairie State Energy Campus Proj.) Series 2015, 5% 2/15/28 | | 12,100 | 14,745 |
| Buckeye Tobacco Settlement Fing. Auth. Series 2007 A1, 5% 6/1/17 | | 5,045 | 5,235 |
| Cleveland Parking Facilities Rev.: | | | |
| 5.25% 9/15/18 (Escrowed to Maturity) | | 640 | 703 |
| 5.25% 9/15/18 (FSA Insured) | | 1,360 | 1,466 |
| Columbus City School District 5% 12/1/29 (b) | | 1,800 | 2,285 |
| Franklin County Hosp. Rev. (Nationwide Children's Hosp. Proj.) Series 2009, 5.25% 11/1/40 | | 1,500 | 1,688 |
| Hamilton County Convention Facilities Auth. Rev. Series 2014, 5% 12/1/25 | | 3,595 | 4,408 |
| Lake County Hosp. Facilities Rev.: | | | |
| Series 2015: | | | |
| 5% 8/15/29 | | 1,000 | 1,191 |
| 5% 8/15/30 | | 1,505 | 1,787 |
| 6% 8/15/43 | | 800 | 881 |
| 6% 8/15/43 (Pre-Refunded to 8/15/18 @ 100) | | 4,200 | 4,664 |
| Lucas County Hosp. Rev. (ProMedica Healthcare Oblig. Group Proj.) Series 2011 A, 6.5% 11/15/37 | | 6,000 | 7,514 |
| Muskingum County Hosp. Facilities (Genesis Healthcare Sys. Obligated Group Proj.) Series 2013, 5% 2/15/48 | | 11,600 | 12,625 |
| Ohio Air Quality Dev. Auth. Rev.: | | | |
| Bonds (First Energy Nuclear Generation Proj.) Series 2006 A, 3.75%, tender 12/3/18 (c) | | 18,800 | 19,231 |
| Series 2009 C, 5.625% 6/1/18 | | 2,000 | 2,116 |
| Ohio Higher Edl. Facility Commission Rev. (Cleveland Clinic Foundation Proj.) Series 2008 A, 5.5% 1/1/43 | | 1,500 | 1,607 |
| Ohio Tpk. Commission Tpk. Rev. (Infastructure Proj.) Series 2005 A, 0% 2/15/43 | | 15,000 | 6,069 |
| Scioto County Hosp. Facilities Rev. Series 2016, 5% 2/15/29 | | 2,195 | 2,722 |
| Univ. of Akron Gen. Receipts Series 2016 A, 5% 1/1/35 | | 9,500 | 11,634 |
|
| TOTAL OHIO | | | 105,497 |
|
| Oklahoma - 0.5% | | | |
| Oklahoma City Pub. Property Auth. Hotel Tax Rev. Series 2015: | | | |
| 5% 10/1/28 | | 1,270 | 1,555 |
| 5% 10/1/29 | | 700 | 854 |
| 5% 10/1/36 | | 1,000 | 1,191 |
| 5% 10/1/39 | | 1,850 | 2,194 |
| Oklahoma Dev. Fin. Auth. Health Sys. Rev. (Integris Baptist Med. Ctr. Proj.) Series C, 5.5% 8/15/20 (Pre-Refunded to 8/15/18 @ 100) | | 5,000 | 5,506 |
| Oklahoma Dev. Fin. Auth. Rev.: | | | |
| (Saint John Health Sys. Proj.) Series 2012, 5% 2/15/42 | | 9,640 | 10,969 |
| Series 2012: | | | |
| 5% 2/15/21 | | 2,200 | 2,572 |
| 5% 2/15/24 | | 4,190 | 4,991 |
| Tulsa County Indl. Auth. Health Care Rev. 5% 12/15/19 | | 1,680 | 1,716 |
|
| TOTAL OKLAHOMA | | | 31,548 |
|
| Oregon - 0.3% | | | |
| Clackamas County School District #7J: | | | |
| 5.25% 6/1/23 | | 2,000 | 2,535 |
| 5.25% 6/1/24 (FSA Insured) | | 2,605 | 3,380 |
| Multnomah County Hosp. Facilities Auth. Rev. (Adventist Health Sys./West Proj.) Series 2009 A, 5.125% 9/1/40 | | 2,500 | 2,765 |
| Oregon Facilities Auth. Rev. (Legacy Health Sys. Proj.) Series 2009 A, 5% 3/15/30 | | 1,000 | 1,126 |
| Oregon State Dept. of Administrative Svcs. Lottery Rev. Series 2011 A, 5.25% 4/1/31 | | 5,600 | 6,658 |
| Washington County School District #15: | | | |
| 5.5% 6/15/20 (FSA Insured) | | 1,770 | 2,079 |
| 5.5% 6/15/21 (FSA Insured) | | 1,060 | 1,283 |
|
| TOTAL OREGON | | | 19,826 |
|
| Pennsylvania - 3.0% | | | |
| Allegheny County Hosp. Dev. Auth. Rev. (Univ. of Pittsburgh Med. Ctr. Proj.) Series 2009 A, 5.625% 8/15/39 | | 6,225 | 7,049 |
| Centre County Hosp. Auth. Rev. (Mount Nittany Med. Ctr. Proj.) Series 2011, 7% 11/15/46 (Pre-Refunded to 11/15/21 @ 100) | | 2,600 | 3,393 |
| Dauphin County Gen. Auth. (Pinnacle Health Sys. Proj.) Series 2016 A: | | | |
| 5% 6/1/28 | | 1,070 | 1,345 |
| 5% 6/1/29 | | 1,170 | 1,465 |
| Monroeville Fin. Auth. UPMC Rev. Series 2012, 5% 2/15/25 | | 4,680 | 5,882 |
| Montgomery County Higher Ed. & Health Auth. Hosp. Rev. (Abington Memorial Hosp. Proj.): | | | |
| Series 1993 A, 6% 6/1/22 (AMBAC Insured) | | 2,000 | 2,461 |
| Series 2012 A, 5% 6/1/27 | | 4,105 | 4,790 |
| Montgomery County Higher Ed. & Health Auth. Rev. Series 2014 A: | | | |
| 5% 10/1/21 | | 1,320 | 1,483 |
| 5% 10/1/22 | | 1,380 | 1,566 |
| 5% 10/1/24 | | 1,165 | 1,352 |
| Northampton County Gen. Purp. Auth. Hosp. Rev. Series 2016 A, 5% 8/15/46 (b) | | 24,875 | 29,478 |
| Pennsylvania Convention Ctr. Auth. Rev. Series A, 6.7% 9/1/16 (Escrowed to Maturity) | | 310 | 313 |
| Pennsylvania Econ. Dev. Fin. Auth. Unemployment Compensation Rev. Series 2012 B: | | | |
| 5% 7/1/21 | | 5,300 | 5,644 |
| 5% 1/1/23 | | 605 | 605 |
| Pennsylvania Gen. Oblig.: | | | |
| Series 2015 1, 5% 3/15/29 | | 16,370 | 20,123 |
| Series 2015, 5% 3/15/33 | | 4,975 | 6,028 |
| Series 2016: | | | |
| 5% 2/1/27 | | 17,175 | 21,574 |
| 5% 2/1/28 | | 18,030 | 22,488 |
| Pennsylvania Higher Edl. Facilities Auth. Rev. (Univ. of Pennsylvania Health Sys. Proj.) Series 2009 A, 5.25% 8/15/21 (Pre-Refunded to 8/15/19 @ 100) | | 2,900 | 3,300 |
| Pennsylvania Tpk. Commission Tpk. Rev. Series 2009 D, 5.5% 12/1/41 | | 12,600 | 14,261 |
| Philadelphia Gas Works Rev. (1998 Gen. Ordinance Proj.): | | | |
| Ninth Series, 5.25% 8/1/40 | | 3,750 | 4,243 |
| Seventh Series, 5% 10/1/37 (AMBAC Insured) | | 8,900 | 9,296 |
| Philadelphia Gen. Oblig. Series 2008 A, 5.25% 12/15/32 (FSA Insured) | | 2,500 | 2,747 |
| Southeastern Pennsylvania Trans. Auth. Rev. Series 2011: | | | |
| 5% 6/1/22 | | 1,000 | 1,177 |
| 5% 6/1/23 | | 2,500 | 2,939 |
|
| TOTAL PENNSYLVANIA | | | 175,002 |
|
| Rhode Island - 0.2% | | | |
| Rhode Island Comm Corp. Rev. Series 2016 A: | | | |
| 5% 6/15/23 | | 5,405 | 6,580 |
| 5% 6/15/24 | | 2,720 | 3,373 |
|
| TOTAL RHODE ISLAND | | | 9,953 |
|
| South Carolina - 3.0% | | | |
| Richland County Hosp. Facilities Rev. (Cmnty. Provider Pooled Ln. Prog.) Series A, 7.125% 7/1/17 (Escrowed to Maturity) | | 265 | 273 |
| Scago Edl. Facilities Corp. for Colleton School District (School District of Colleton County Proj.) Series 2015: | | | |
| 5% 12/1/25 | | 2,745 | 3,381 |
| 5% 12/1/28 | | 5,665 | 6,849 |
| South Carolina Jobs-Econ. Dev. Auth. Econ. Dev. Rev. Series 2013, 5% 11/1/27 | | 7,700 | 9,110 |
| South Carolina Jobs-Econ. Dev. Auth. Health Facilities Rev. (Bishop Gadsden Proj.) 5% 4/1/24 | | 4,000 | 4,098 |
| South Carolina Pub. Svc. Auth. Rev.: | | | |
| Series 2012 B, 5% 12/1/20 | | 1,500 | 1,754 |
| Series 2013 E, 5.5% 12/1/53 | | 34,335 | 41,153 |
| Series 2014 A: | | | |
| 5% 12/1/49 | | 6,500 | 7,653 |
| 5.5% 12/1/54 | | 13,185 | 16,005 |
| Series 2014 C, 5% 12/1/46 | | 3,900 | 4,641 |
| Series 2015 A, 5% 12/1/50 | | 13,210 | 15,750 |
| Series 2015 C: | | | |
| 5% 12/1/20 | | 18,545 | 21,689 |
| 5% 12/1/21 | | 15,000 | 17,964 |
| 5% 12/1/22 | | 8,440 | 10,323 |
| Series 2015 E, 5.25% 12/1/55 | | 5,900 | 7,164 |
| Univ. of South Carolina Athletic Facilities Rev. Series 2008 A, 5.5% 5/1/38 | | 6,900 | 7,448 |
|
| TOTAL SOUTH CAROLINA | | | 175,255 |
|
| South Dakota - 0.1% | | | |
| South Dakota Health & Edl. Facilities Auth. Rev. (Reg'l. Health Proj.) Series 2010: | | | |
| 4.625% 9/1/27 | | 1,000 | 1,118 |
| 5% 9/1/28 | | 3,000 | 3,439 |
|
| TOTAL SOUTH DAKOTA | | | 4,557 |
|
| Tennessee - 0.3% | | | |
| Jackson Hosp. Rev.: | | | |
| 5.75% 4/1/41 | | 1,785 | 1,928 |
| 5.75% 4/1/41 (Pre-Refunded to 4/1/18 @ 100) | | 4,815 | 5,222 |
| Memphis-Shelby County Arpt. Auth. Arpt. Rev. Series 2010 B: | | | |
| 5.75% 7/1/23 (d) | | 5,820 | 6,715 |
| 5.75% 7/1/24 (d) | | 2,400 | 2,768 |
| Sullivan County Health, Ed. and Hsg. Board (Wellmont Health Sys. Proj.) Series 2006 C, 5.25% 9/1/36 | | 2,180 | 2,199 |
|
| TOTAL TENNESSEE | | | 18,832 |
|
| Texas - 10.4% | | | |
| Argyle Independent School District 5.25% 8/15/40 (FSA Insured) | | 125 | 125 |
| Austin Arpt. Sys. Rev. Series 2014: | | | |
| 5% 11/15/26 (d) | | 1,000 | 1,214 |
| 5% 11/15/27 (d) | | 1,250 | 1,512 |
| 5% 11/15/28 (d) | | 1,000 | 1,203 |
| 5% 11/15/39 (d) | | 9,700 | 11,335 |
| 5% 11/15/44 (d) | | 24,965 | 29,052 |
| Austin Cmnty. College District Rev. (Convention Ctr. Proj.) Series 2002, 0% 2/1/22 (AMBAC Insured) | | 2,900 | 2,629 |
| Austin Elec. Util. Sys. Rev. 0% 5/15/18 (Nat'l. Pub. Fin. Guarantee Corp. Insured) | | 5,000 | 4,929 |
| Austin Wtr. & Wastewtr. Sys. Rev. Series 2016: | | | |
| 5% 11/15/27 | | 2,000 | 2,618 |
| 5% 11/15/28 | | 1,000 | 1,304 |
| 5% 11/15/29 | | 3,000 | 3,897 |
| Canyon Reg'l. Wtr. Auth. Contract Rev. (Wells Ranch Proj.): | | | |
| 5% 8/1/19 (AMBAC Insured) | | 1,695 | 1,774 |
| 5% 8/1/20 (AMBAC Insured) | | 1,780 | 1,863 |
| Central Reg'l. Mobility Auth.: | | | |
| Series 2015 A: | | | |
| 5% 1/1/30 | | 1,650 | 2,002 |
| 5% 1/1/32 | | 1,000 | 1,206 |
| 5% 1/1/45 | | 6,000 | 7,121 |
| Series 2016, 5% 1/1/46 | | 5,000 | 5,943 |
| Coppell Independent School District 0% 8/15/20 | | 2,000 | 1,914 |
| Corpus Christi Util. Sys. Rev.: | | | |
| 5% 7/15/21 | | 4,500 | 5,317 |
| 5% 7/15/22 | | 2,500 | 3,007 |
| 5% 7/15/24 | | 2,255 | 2,718 |
| 5.25% 7/15/18 (FSA Insured) | | 3,305 | 3,460 |
| 5.25% 7/15/19 (FSA Insured) | | 4,000 | 4,187 |
| Dallas Area Rapid Transit Sales Tax Rev.: | | | |
| 5.25% 12/1/38 | | 8,980 | 9,873 |
| 5.25% 12/1/38 (Pre-Refunded to 12/1/18 @ 100) | | 12,020 | 13,312 |
| Dallas Fort Worth Int'l. Arpt. Rev.: | | | |
| Series 2009 A, 5% 11/1/23 | | 1,250 | 1,268 |
| Series 2010 A, 5% 11/1/42 | | 14,800 | 17,045 |
| Series 2012 D, 5% 11/1/42 (d) | | 2,370 | 2,690 |
| Series 2012 H, 5% 11/1/42 (d) | | 2,740 | 3,110 |
| Series 2014 D, 5% 11/1/23 (d) | | 2,795 | 3,404 |
| Dallas Independent School District Series 2008, 6.375% 2/15/34 (Pre-Refunded to 2/15/18 @ 100) | | 1,800 | 1,964 |
| DeSoto Independent School District 0% 8/15/20 | | 3,335 | 3,192 |
| El Paso Gen. Oblig. Series 2016: | | | |
| 5% 8/15/34 | | 6,345 | 7,869 |
| 5% 8/15/35 | | 6,000 | 7,417 |
| 5% 8/15/36 | | 4,000 | 4,928 |
| Freer Independent School District Series 2007, 5.25% 8/15/37 (Pre-Refunded to 8/15/17 @ 100) | | 895 | 941 |
| Grand Parkway Trans. Corp. Series 2013 B: | | | |
| 5% 4/1/53 | | 1,290 | 1,503 |
| 5.25% 10/1/51 | | 53,600 | 64,360 |
| 5.5% 4/1/53 | | 5,440 | 6,423 |
| Harris County Cultural Ed. Facilities Fin. Corp. Med. Facilities Rev. (Baylor College of Medicine Proj.) Series 2012 A, 5% 11/15/37 | | 14,050 | 16,518 |
| Harris County Gen. Oblig.: | | | |
| (Road Proj.) Series 2008 B, 5.25% 8/15/47 (Pre-Refunded to 8/15/18 @ 100) | | 25,440 | 27,881 |
| Series 2002: | | | |
| 0% 8/15/25 (Nat'l. Pub. Fin. Guarantee Corp. Insured) | | 3,000 | 2,553 |
| 0% 8/15/28 (Nat'l. Pub. Fin. Guarantee Corp. Insured) | | 5,000 | 3,883 |
| Houston Arpt. Sys. Rev. Series 2011 A: | | | |
| 5% 7/1/23 (d) | | 3,000 | 3,481 |
| 5% 7/1/25 (d) | | 1,500 | 1,724 |
| Keller Independent School District Series 1996 A, 0% 8/15/17 | | 2,000 | 1,985 |
| Love Field Arpt. Modernization Rev. Series 2015: | | | |
| 5% 11/1/27 (d) | | 2,150 | 2,638 |
| 5% 11/1/29 (d) | | 2,000 | 2,430 |
| 5% 11/1/32 (d) | | 3,690 | 4,449 |
| Lower Colorado River Auth. Rev.: | | | |
| Series 2015 D: | | | |
| 5% 5/15/28 | | 2,200 | 2,723 |
| 5% 5/15/30 | | 5,000 | 6,144 |
| 5.25% 5/15/18 (AMBAC Insured) | | 40 | 40 |
| Mansfield Independent School District 5.5% 2/15/18 | | 40 | 40 |
| Midway Independent School District Series 2000, 0% 8/15/19 | | 3,600 | 3,505 |
| North Texas Tollway Auth. Rev.: | | | |
| Series 2008 I, 6.2% 1/1/42 (Assured Guaranty Corp. Insured) | | 7,200 | 9,764 |
| Series 2009 A, 6.25% 1/1/39 (Pre-Refunded to 1/1/19 @ 100) | | 8,290 | 9,411 |
| Series 2009, 6.25% 1/1/39 | | 1,910 | 2,142 |
| Series 2011 A: | | | |
| 5.5% 9/1/41 | | 14,250 | 17,027 |
| 6% 9/1/41 | | 6,200 | 7,613 |
| Series 2011 D, 5% 9/1/28 | | 13,000 | 15,361 |
| Series 2014 A, 5% 1/1/25 | | 5,000 | 6,207 |
| Series 2015 B, 5% 1/1/40 | | 8,000 | 9,379 |
| Series 2016 A, 5% 1/1/31 | | 6,450 | 8,070 |
| 6% 1/1/23 | | 590 | 636 |
| 6% 1/1/24 | | 230 | 248 |
| Rockwall Independent School District Series 2016, 5% 2/15/46 | | 10,700 | 13,056 |
| San Antonio Arpt. Sys. Rev.: | | | |
| Series 2007 (AMT): | | | |
| 5% 7/1/17 (FSA Insured) (d) | | 2,765 | 2,879 |
| 5.25% 7/1/20 (FSA Insured) (d) | | 3,215 | 3,345 |
| Series 2007 (AMT-SUB LIEN): | | | |
| 5% 7/1/17 (FSA Insured) (d) | | 2,385 | 2,482 |
| 5.25% 7/1/20 (FSA Insured) (d) | | 2,775 | 2,885 |
| 5.25% 7/1/19 (FSA Insured) (d) | | 2,635 | 2,739 |
| San Antonio Elec. & Gas Sys. Rev.: | | | |
| Series 2008, 5% 2/1/24 | | 2,590 | 2,761 |
| Series 2012, 5.25% 2/1/25 | | 4,200 | 5,470 |
| San Antonio Wtr. Sys. Rev. Series 2012, 5% 5/15/25 | | 10,000 | 12,131 |
| Southwest Higher Ed. Auth. Rev. (Southern Methodist Univ. Proj.) Series 2016 A: | | | |
| 5% 10/1/25 | | 9,345 | 12,063 |
| 5% 10/1/26 | | 5,250 | 6,860 |
| 5% 10/1/27 | | 5,000 | 6,473 |
| 5% 10/1/28 | | 5,000 | 6,446 |
| 5% 10/1/29 | | 5,000 | 6,425 |
| Tarrant County Cultural Ed. Facilities Fin. Corp. Hosp. Rev.: | | | |
| (Hendrick Med. Ctr. Proj.) Series 2009 B: | | | |
| 5.25% 9/1/26 (Assured Guaranty Corp. Insured) | | 1,785 | 2,017 |
| 5.25% 9/1/27 (Assured Guaranty Corp. Insured) | | 2,375 | 2,680 |
| (Scott & White Healthcare Proj.) Series 2013 A: | | | |
| 4% 8/15/43 | | 2,900 | 3,168 |
| 5% 8/15/43 | | 4,000 | 4,719 |
| 5.75% 11/15/24 (Pre-Refunded to 11/15/18 @ 100) | | 3,925 | 4,380 |
| Texas Gen. Oblig.: | | | |
| Series 2014 A, 5% 10/1/44 | | 5,900 | 7,173 |
| Series 2016: | | | |
| 5% 4/1/40 | | 6,300 | 7,857 |
| 5% 4/1/46 | | 20,000 | 24,824 |
| 5% 4/1/25 (Pre-Refunded to 4/1/18 @ 100) | | 385 | 414 |
| 5% 4/1/25 (Pre-Refunded to 4/1/18 @ 100) | | 3,915 | 4,210 |
| 5.75% 8/1/26 | | 660 | 662 |
| Texas Muni. Pwr. Agcy. Rev. 0% 9/1/16 (Escrowed to Maturity) | | 15 | 15 |
| Texas Private Activity Bond Surface Trans. Corp.: | | | |
| (LBJ Infrastructure Group LLC IH-635 Managed Lanes Proj.) Series 2010, 7% 6/30/40 | | 5,200 | 6,228 |
| Series 2013, 6.75% 6/30/43 (d) | | 12,600 | 15,796 |
| Texas Wtr. Dev. Board Rev. Series 2015 A, 5% 10/15/40 | | 7,500 | 9,281 |
| Waller Independent School District 5.5% 2/15/37 (Pre-Refunded to 2/15/18 @ 100) | | 4,920 | 5,308 |
| Weatherford Independent School District 0% 2/15/33 | | 6,985 | 4,646 |
|
| TOTAL TEXAS | | | 604,874 |
|
| Utah - 0.2% | | | |
| Intermountain Pwr. Agcy. Pwr. Supply Rev. Series A, 6% 7/1/16 (Escrowed to Maturity) | | 2,415 | 2,415 |
| Utah Associated Muni. Pwr. Sys. Rev. (Payson Pwr. Proj.) 5% 9/1/22 | | 3,180 | 3,823 |
| Utah State Board of Regents Rev. Series 2011 B: | | | |
| 5% 8/1/24 (Pre-Refunded to 8/1/20 @ 100) | | 2,670 | 3,111 |
| 5% 8/1/25 (Pre-Refunded to 8/1/20 @ 100) | | 2,175 | 2,534 |
|
| TOTAL UTAH | | | 11,883 |
|
| Virginia - 0.7% | | | |
| Fredericksburg Econ. Dev. Auth. Rev. Series 2014, 5% 6/15/25 | | 4,665 | 5,781 |
| Stafford County Econ. Dev. Auth. Hosp. Facilities Rev. Series 2016: | | | |
| 4% 6/15/37 | | 600 | 647 |
| 5% 6/15/27 | | 1,500 | 1,882 |
| 5% 6/15/30 | | 250 | 309 |
| 5% 6/15/35 | | 2,200 | 2,651 |
| Univ. of Virginia Gen. Rev. Series 2015 A, 5% 4/1/45 | | 6,000 | 7,458 |
| Virginia College Bldg. Auth. Edl. Facilities Rev. Series 2015 A: | | | |
| 5% 1/1/35 | | 1,000 | 1,225 |
| 5% 1/1/40 | | 1,750 | 2,126 |
| Virginia Small Bus. Fing. Auth. (95 Express Lane LLC Proj.) Series 2012: | | | |
| 5% 7/1/34 (d) | | 6,000 | 6,657 |
| 5% 1/1/40 (d) | | 4,200 | 4,615 |
| Winchester Econ. Dev. Auth. Series 2015: | | | |
| 5% 1/1/31 | | 2,500 | 3,060 |
| 5% 1/1/34 | | 1,500 | 1,807 |
| 5% 1/1/35 | | 1,500 | 1,800 |
|
| TOTAL VIRGINIA | | | 40,018 |
|
| Washington - 2.2% | | | |
| Chelan County Pub. Util. District #1 Columbia River-Rock Island Hydro-Elec. Sys. Rev. Series 1997 A, 0% 6/1/17 (Nat'l. Pub. Fin. Guarantee Corp. Insured) | | 7,200 | 7,131 |
| Clark County School District #37, Vancouver Series 2001 C, 0% 12/1/19 (Nat'l. Pub. Fin. Guarantee Corp. Insured) | | 2,030 | 1,972 |
| Kent Spl. Events Ctr. Pub. Facilities District Rev.: | | | |
| 5.25% 12/1/25 (Pre-Refunded to 6/1/18 @ 100) | | 2,575 | 2,799 |
| 5.25% 12/1/36 (Pre-Refunded to 6/1/18 @ 100) | | 9,180 | 9,977 |
| King County Swr. Rev. Series 2009, 5.25% 1/1/42 (Pre-Refunded to 1/1/19 @ 100) | | 2,600 | 2,888 |
| Port of Seattle Spl. Facility Rev. Series 2013: | | | |
| 5% 6/1/21 (d) | | 1,340 | 1,538 |
| 5% 6/1/22 (d) | | 1,000 | 1,167 |
| 5% 6/1/24 (d) | | 1,000 | 1,183 |
| Spokane Pub. Facilities District Hotel/Motel Tax & Sales/Use Tax Rev. Series 2013 B: | | | |
| 5% 12/1/25 | | 5,600 | 6,795 |
| 5% 12/1/27 | | 2,625 | 3,157 |
| Tobacco Settlement Auth. Rev. Series 2013, 5% 6/1/21 | | 6,250 | 7,216 |
| Washington Gen. Oblig. Series R 97A: | | | |
| 0% 7/1/17 (Escrowed to Maturity) | | 7,045 | 6,995 |
| 0% 7/1/19 (Escrowed to Maturity) | | 9,100 | 8,859 |
| Washington Health Care Facilities Auth. Rev.: | | | |
| (Catholic Health Initiatives Proj.) Series 2008 D, 6.375% 10/1/36 | | 5,000 | 5,596 |
| (MultiCare Health Sys. Proj.) Series 2010 A: | | | |
| 5.25% 8/15/19 | | 3,850 | 4,363 |
| 5.25% 8/15/20 | | 2,000 | 2,260 |
| (Overlake Hosp. Med. Ctr.) Series 2010, 5.7% 7/1/38 | | 11,300 | 13,211 |
| (Providence Health Systems Proj.): | | | |
| Series 2006 D, 5.25% 10/1/33 | | 1,500 | 1,637 |
| Series 2012 A: | | | |
| 5% 10/1/25 | | 5,130 | 6,256 |
| 5% 10/1/26 | | 13,395 | 16,345 |
| (Seattle Children's Hosp. Proj.) Series 2009, 5.625% 10/1/38 (Pre-Refunded to 10/1/19 @ 100) | | 7,550 | 8,706 |
| Series 2009, 7% 7/1/39 (Pre-Refunded to 7/1/19 @ 100) | | 3,000 | 3,548 |
| Series 2015: | | | |
| 5% 1/1/25 | | 2,000 | 2,435 |
| 5% 1/1/27 | | 1,610 | 1,936 |
|
| TOTAL WASHINGTON | | | 127,970 |
|
| West Virginia - 0.4% | | | |
| West Virginia Econ. Dev. Auth. Solid Waste Disp. Facilities Rev. Bonds 1.9%, tender 4/1/19 (c) | | 9,125 | 9,193 |
| West Virginia Hosp. Fin. Auth. Hosp. Rev.: | | | |
| (West Virginia United Health Sys. Proj.) Series 2008 E, 5.625% 6/1/35 (Pre-Refunded to 12/1/18 @ 100) | | 700 | 782 |
| (West Virginia Univ. Hospitals, Inc. Proj.) Series 2003 D, 5.5% 6/1/33 (Pre-Refunded to 12/1/18 @ 100) | | 2,600 | 2,898 |
| West Virginia Univ. Revs. (West Virginia Univ. Projs.) Series 2014 A, 5% 10/1/44 | | 6,500 | 7,756 |
|
| TOTAL WEST VIRGINIA | | | 20,629 |
|
| Wisconsin - 0.6% | | | |
| Wisconsin Health & Edl. Facilities Series 2014, 4% 5/1/33 | | 3,015 | 3,086 |
| Wisconsin Health & Edl. Facilities Auth. Rev.: | | | |
| (Agnesian HealthCare, Inc. Proj.): | | | |
| Series 2010: | | | |
| 5.5% 7/1/40 | | 2,375 | 2,724 |
| 5.75% 7/1/30 | | 2,655 | 3,096 |
| Series 2013 B: | | | |
| 5% 7/1/27 | | 1,205 | 1,428 |
| 5% 7/1/36 | | 5,000 | 5,776 |
| (Children's Hosp. of Wisconsin Proj.): | | | |
| Series 2008 A, 5.25% 8/15/22 | | 2,000 | 2,190 |
| Series 2008 B, 5.375% 8/15/37 | | 8,045 | 9,075 |
| Series 2012: | | | |
| 4% 10/1/23 | | 2,500 | 2,845 |
| 5% 6/1/27 | | 1,925 | 2,252 |
| 5% 6/1/39 | | 2,775 | 3,167 |
|
| TOTAL WISCONSIN | | | 35,639 |
|
| Wyoming - 0.2% | | | |
| Campbell County Solid Waste Facilities Rev. (Basin Elec. Pwr. Coop. - Dry Fork Station Facilities Proj.) Series 2009 A, 5.75% 7/15/39 | | 8,600 | 9,718 |
| TOTAL MUNICIPAL BONDS | | | |
| (Cost $5,228,745) | | | 5,788,563 |
|
| Municipal Notes - 0.1% | | | |
| Kentucky - 0.1% | | | |
| Kentucky Pub. Trans. BAN Series 2013 A, 5% 7/1/17 | | | |
| (Cost $8,843) | | 8,600 | 8,919 |
| | | Shares | Value (000s) |
|
| Money Market Funds - 0.6% | | | |
| Fidelity Municipal Cash Central Fund, 0.44%(g)(h) | | | |
| (Cost $35,100) | | 35,100,000 | 35,100 |
| TOTAL INVESTMENT PORTFOLIO - 99.8% | | | |
| (Cost $5,272,688) | | | 5,832,582 |
| NET OTHER ASSETS (LIABILITIES) - 0.2% | | | 10,935 |
| NET ASSETS - 100% | | | $5,843,517 |
Security Type Abbreviations
BAN – BOND ANTICIPATION NOTE
Legend
(a) Security initially issued in zero coupon form which converts to coupon form at a specified rate and date. The rate shown is the rate at period end.
(b) Security or a portion of the security purchased on a delayed delivery or when-issued basis.
(c) Coupon rates for floating and adjustable rate securities reflect the rates in effect at period end.
(d) Private activity obligations whose interest is subject to the federal alternative minimum tax for individuals.
(e) Security exempt from registration under Rule 144A of the Securities Act of 1933. These securities may be resold in transactions exempt from registration, normally to qualified institutional buyers. At the end of the period, the value of these securities amounted to $6,668,000 or 0.1% of net assets.
(f) Restricted securities - Investment in securities not registered under the Securities Act of 1933 (excluding 144A issues). At the end of the period, the value of restricted securities (excluding 144A issues) amounted to $1,913,000 or 0.0% of net assets.
(g) Affiliated fund that is available only to investment companies and other accounts managed by Fidelity Investments. The rate quoted is the annualized seven-day yield of the fund at period end. A complete unaudited listing of the fund's holdings as of its most recent quarter end is available upon request. In addition, each Fidelity Central Fund's financial statements are available on the SEC's website or upon request.
(h) Information in this report regarding holdings by state and security types does not reflect the holdings of the Fidelity Municipal Cash Central Fund.
Additional information on each restricted holding is as follows:
| Security | Acquisition Date | Acquisition Cost (000s) |
| Massachusetts Health & Edl. Facilities Auth. Rev. (Blood Research Institute Proj.) Series A, 6.5% 2/1/22 | 9/3/92 | $1,796 |
Affiliated Central Funds
Information regarding fiscal year to date income earned by the Fund from investments in Fidelity Central Funds is as follows:
| Fund | Income earned |
| | (Amounts in thousands) |
| Fidelity Municipal Cash Central Fund | $5 |
| Total | $5 |
Investment Valuation
The following is a summary of the inputs used, as of June 30, 2016, involving the Fund's assets and liabilities carried at fair value. The inputs or methodology used for valuing securities may not be an indication of the risk associated with investing in those securities. For more information on valuation inputs, and their aggregation into the levels used below, please refer to the Investment Valuation section in the accompanying Notes to Financial Statements.
| | Valuation Inputs at Reporting Date: |
| Description | Total | Level 1 | Level 2 | Level 3 |
| (Amounts in thousands) | | | | |
| Investments in Securities: | | | | |
| Municipal Securities | $5,797,482 | $-- | $5,797,482 | $-- |
| Money Market Funds | 35,100 | 35,100 | -- | -- |
| Total Investments in Securities: | $5,832,582 | $35,100 | $5,797,482 | $-- |
Other Information
The distribution of municipal securities by revenue source, as a percentage of total Net Assets, is as follows (Unaudited):
| General Obligations | 31.3% |
| Health Care | 18.7% |
| Transportation | 17.3% |
| Escrowed/Pre-Refunded | 9.5% |
| Electric Utilities | 7.6% |
| Special Tax | 6.1% |
| Water & Sewer | 5.3% |
| Others* (Individually Less Than 5%) | 4.2% |
| | 100.0% |
* Includes net other assets
See accompanying notes which are an integral part of the financial statements.
Financial Statements
Statement of Assets and Liabilities
| Amounts in thousands (except per-share amount) | | June 30, 2016 (Unaudited) |
| Assets | | |
Investment in securities, at value — See accompanying schedule:
Unaffiliated issuers (cost $5,237,588) | $5,797,482 | |
| Fidelity Central Funds (cost $35,100) | 35,100 | |
| Total Investments (cost $5,272,688) | | $5,832,582 |
| Cash | | 38,934 |
| Receivable for investments sold | | 23,156 |
| Receivable for fund shares sold | | 1,613 |
| Interest receivable | | 63,158 |
| Distributions receivable from Fidelity Central Funds | | 5 |
| Other receivables | | 9 |
| Total assets | | 5,959,457 |
| Liabilities | | |
| Payable for investments purchased on a delayed delivery basis | $106,336 | |
| Payable for fund shares redeemed | 2,446 | |
| Distributions payable | 4,920 | |
| Accrued management fee | 1,737 | |
| Other affiliated payables | 457 | |
| Other payables and accrued expenses | 44 | |
| Total liabilities | | 115,940 |
| Net Assets | | $5,843,517 |
| Net Assets consist of: | | |
| Paid in capital | | $5,255,289 |
| Distributions in excess of net investment income | | (3,004) |
| Accumulated undistributed net realized gain (loss) on investments | | 31,338 |
| Net unrealized appreciation (depreciation) on investments | | 559,894 |
| Net Assets, for 420,917 shares outstanding | | $5,843,517 |
| Net Asset Value, offering price and redemption price per share ($5,843,517 ÷ 420,917 shares) | | $13.88 |
See accompanying notes which are an integral part of the financial statements.
Statement of Operations
| Amounts in thousands | | Six months ended June 30, 2016 (Unaudited) |
| Investment Income | | |
| Interest | | $104,382 |
| Income from Fidelity Central Funds | | 5 |
| Total income | | 104,387 |
| Expenses | | |
| Management fee | $10,322 | |
| Transfer agent fees | 2,590 | |
| Accounting fees and expenses | 344 | |
| Custodian fees and expenses | 21 | |
| Independent trustees' fees and expenses | 13 | |
| Registration fees | 56 | |
| Audit | 36 | |
| Legal | 3 | |
| Miscellaneous | 30 | |
| Total expenses before reductions | 13,415 | |
| Expense reductions | (33) | 13,382 |
| Net investment income (loss) | | 91,005 |
| Realized and Unrealized Gain (Loss) | | |
| Net realized gain (loss) on: | | |
| Investment securities: | | |
| Unaffiliated issuers | 31,346 | |
| Total net realized gain (loss) | | 31,346 |
| Change in net unrealized appreciation (depreciation) on investment securities | | 159,386 |
| Net gain (loss) | | 190,732 |
| Net increase (decrease) in net assets resulting from operations | | $281,737 |
See accompanying notes which are an integral part of the financial statements.
Statement of Changes in Net Assets
| Amounts in thousands | Six months ended June 30, 2016 (Unaudited) | Year ended December 31, 2015 |
| Increase (Decrease) in Net Assets | | |
| Operations | | |
| Net investment income (loss) | $91,005 | $195,762 |
| Net realized gain (loss) | 31,346 | 33,561 |
| Change in net unrealized appreciation (depreciation) | 159,386 | (47,495) |
| Net increase (decrease) in net assets resulting from operations | 281,737 | 181,828 |
| Distributions to shareholders from net investment income | (93,884) | (196,687) |
| Distributions to shareholders from net realized gain | – | (28,582) |
| Total distributions | (93,884) | (225,269) |
| Share transactions | | |
| Proceeds from sales of shares | 465,186 | 909,862 |
| Reinvestment of distributions | 63,215 | 151,510 |
| Cost of shares redeemed | (642,346) | (993,485) |
| Net increase (decrease) in net assets resulting from share transactions | (113,945) | 67,887 |
| Redemption fees | 99 | 50 |
| Total increase (decrease) in net assets | 74,007 | 24,496 |
| Net Assets | | |
| Beginning of period | 5,769,510 | 5,745,014 |
| End of period | $5,843,517 | $5,769,510 |
| Other Information | | |
| Distributions in excess of net investment income end of period | $(3,004) | $(125) |
| Shares | | |
| Sold | 34,242 | 67,590 |
| Issued in reinvestment of distributions | 4,640 | 11,269 |
| Redeemed | (47,395) | (74,016) |
| Net increase (decrease) | (8,513) | 4,843 |
See accompanying notes which are an integral part of the financial statements.
Financial Highlights — Fidelity Municipal Income Fund
| | Six months ended (Unaudited) June 30, | Years ended December 31, | | | | |
| | 2016 | 2015 | 2014 | 2013 | 2012 | 2011 |
| Selected Per–Share Data | | | | | | |
| Net asset value, beginning of period | $13.44 | $13.53 | $12.68 | $13.57 | $13.03 | $12.27 |
| Income from Investment Operations | | | | | | |
| Net investment income (loss)A | .217 | .460 | .475 | .479 | .483 | .513 |
| Net realized and unrealized gain (loss) | .446 | (.021) | .851 | (.873) | .537 | .764 |
| Total from investment operations | .663 | .439 | 1.326 | (.394) | 1.020 | 1.277 |
| Distributions from net investment income | (.223) | (.462) | (.476) | (.478) | (.479) | (.515) |
| Distributions from net realized gain | – | (.067) | – | (.018) | (.001) | (.002) |
| Total distributions | (.223) | (.529) | (.476) | (.496) | (.480) | (.517) |
| Redemption fees added to paid in capitalA,B | – | – | – | – | – | – |
| Net asset value, end of period | $13.88 | $13.44 | $13.53 | $12.68 | $13.57 | $13.03 |
| Total ReturnC,D | 4.98% | 3.31% | 10.59% | (2.94)% | 7.92% | 10.64% |
| Ratios to Average Net AssetsE,F | | | | | | |
| Expenses before reductions | .47%G | .48% | .47% | .46% | .46% | .46% |
| Expenses net of fee waivers, if any | .47%G | .48% | .47% | .46% | .46% | .46% |
| Expenses net of all reductions | .47%G | .48% | .47% | .46% | .46% | .46% |
| Net investment income (loss) | 3.20%G | 3.42% | 3.58% | 3.65% | 3.60% | 4.08% |
| Supplemental Data | | | | | | |
| Net assets, end of period (in millions) | $5,844 | $5,770 | $5,745 | $5,337 | $6,792 | $5,917 |
| Portfolio turnover rateH | 21%G | 14% | 9% | 10% | 10% | 11% |
A Calculated based on average shares outstanding during the period.
B Amount represents less than $.0005 per share.
C Total returns for periods of less than one year are not annualized.
D Total returns would have been lower if certain expenses had not been reduced during the applicable periods shown.
E Fees and expenses of any underlying Fidelity Central Funds are not included in the Fund's expense ratio. The Fund indirectly bears its proportionate share of the expenses of any underlying Fidelity Central Funds.
F Expense ratios reflect operating expenses of the Fund. Expenses before reductions do not reflect amounts reimbursed by the investment adviser or reductions from expense offset arrangements and do not represent the amount paid by the Fund during periods when reimbursements or reductions occur. Expenses net of fee waivers reflect expenses after reimbursement by the investment adviser but prior to reductions from expense offset arrangements. Expenses net of all reductions represent the net expenses paid by the Fund.
G Annualized
H Amount does not include the portfolio activity of any underlying Fidelity Central Funds.
See accompanying notes which are an integral part of the financial statements.
Notes to Financial Statements (Unaudited)
For the period ended June 30, 2016
(Amounts in thousands except percentages)
1. Organization.
Fidelity Municipal Income Fund (the Fund) is a fund of Fidelity Municipal Trust (the Trust) and is authorized to issue an unlimited number of shares. Share transactions on the Statement of Changes in Net Assets may contain exchanges between affiliated funds. The Trust is registered under the Investment Company Act of 1940, as amended (the 1940 Act), as an open-end management investment company organized as a Massachusetts business trust.
2. Investments in Fidelity Central Funds.
The Fund invests in Fidelity Central Funds, which are open-end investment companies generally available only to other investment companies and accounts managed by the investment adviser and its affiliates. The Fund's Schedule of Investments lists each of the Fidelity Central Funds held as of period end, if any, as an investment of the Fund, but does not include the underlying holdings of each Fidelity Central Fund. As an Investing Fund, the Fund indirectly bears its proportionate share of the expenses of the underlying Fidelity Central Funds.
The Money Market Central Funds seek preservation of capital and current income and are managed by Fidelity Investments Money Management, Inc. (FIMM), an affiliate of the investment adviser. Annualized expenses of the Money Market Central Funds as of their most recent shareholder report date are less than .005%.
A complete unaudited list of holdings for each Fidelity Central Fund is available upon request or at the Securities and Exchange Commission (the SEC) website at www.sec.gov. In addition, the financial statements of the Fidelity Central Funds are available on the SEC website or upon request.
3. Significant Accounting Policies.
The financial statements have been prepared in conformity with accounting principles generally accepted in the United States of America (GAAP), which require management to make certain estimates and assumptions at the date of the financial statements. Actual results could differ from those estimates. Subsequent events, if any, through the date that the financial statements were issued have been evaluated in the preparation of the financial statements. The following summarizes the significant accounting policies of the Fund:
Investment Valuation. Investments are valued as of 4:00 p.m. Eastern time on the last calendar day of the period. The Board of Trustees (the Board) has delegated the day to day responsibility for the valuation of the Fund's investments to the Fidelity Management & Research Company (FMR) Fair Value Committee (the Committee). In accordance with valuation policies and procedures approved by the Board, the Fund attempts to obtain prices from one or more third party pricing vendors or brokers to value its investments. When current market prices, quotations or currency exchange rates are not readily available or reliable, investments will be fair valued in good faith by the Committee, in accordance with procedures adopted by the Board. Factors used in determining fair value vary by investment type and may include market or investment specific events, changes in interest rates and credit quality. The frequency with which these procedures are used cannot be predicted and they may be utilized to a significant extent. The Committee oversees the Fund's valuation policies and procedures and reports to the Board on the Committee's activities and fair value determinations. The Board monitors the appropriateness of the procedures used in valuing the Fund's investments and ratifies the fair value determinations of the Committee.
The Fund categorizes the inputs to valuation techniques used to value its investments into a disclosure hierarchy consisting of three levels as shown below:
- Level 1 – quoted prices in active markets for identical investments
- Level 2 – other significant observable inputs (including quoted prices for similar investments, interest rates, prepayment speeds, etc.)
- Level 3 – unobservable inputs (including the Fund's own assumptions based on the best information available)
Valuation techniques used to value the Fund's investments by major category are as follows:
Debt securities, including restricted securities, are valued based on evaluated prices received from third party pricing vendors or from brokers who make markets in such securities. Municipal securities are valued by pricing vendors who utilize matrix pricing which considers yield or price of bonds of comparable quality, coupon, maturity and type or by broker-supplied prices. When independent prices are unavailable or unreliable, debt securities may be valued utilizing pricing methodologies which consider similar factors that would be used by third party pricing vendors. Debt securities are generally categorized as Level 2 in the hierarchy but may be Level 3 depending on the circumstances.
Investments in open-end mutual funds, including the Fidelity Central Funds, are valued at their closing net asset value (NAV) each business day and are categorized as Level 1 in the hierarchy.
Changes in valuation techniques may result in transfers in or out of an assigned level within the disclosure hierarchy. The aggregate value of investments by input level as of June 30, 2016, is included at the end of the Fund's Schedule of Investments.
Investment Transactions and Income. For financial reporting purposes, the Fund's investment holdings and NAV include trades executed through the end of the last business day of the period. The NAV per share for processing shareholder transactions is calculated as of the close of business of the New York Stock Exchange (NYSE), normally 4:00 p.m. Eastern time and includes trades executed through the end of the prior business day. Gains and losses on securities sold are determined on the basis of identified cost. Income and capital gain distributions from Fidelity Central Funds, if any, are recorded on the ex-dividend date. Interest income is accrued as earned and includes coupon interest and amortization of premium and accretion of discount on debt securities as applicable. Debt obligations may be placed on non-accrual status and related interest income may be reduced by ceasing current accruals and writing off interest receivables when the collection of all or a portion of interest has become doubtful based on consistently applied procedures. A debt obligation is removed from non-accrual status when the issuer resumes interest payments or when collectability of interest is reasonably assured.
Expenses. Expenses directly attributable to a fund are charged to that fund. Expenses attributable to more than one fund are allocated among the respective funds on the basis of relative net assets or other appropriate methods. Expense estimates are accrued in the period to which they relate and adjustments are made when actual amounts are known.
Income Tax Information and Distributions to Shareholders. Each year, the Fund intends to qualify as a regulated investment company under Subchapter M of the Internal Revenue Code, including distributing substantially all of its taxable income and realized gains. As a result, no provision for U.S. Federal income taxes is required. The Fund files a U.S. federal tax return, in addition to state and local tax returns as required. The Fund's federal income tax returns are subject to examination by the Internal Revenue Service (IRS) for a period of three fiscal years after they are filed. State and local tax returns may be subject to examination for an additional fiscal year depending on the jurisdiction.
Dividends are declared and recorded daily and paid monthly from net investment income. Distributions from realized gains, if any, are declared and recorded on the ex-dividend date. Income and capital gain distributions are determined in accordance with income tax regulations, which may differ from GAAP.
Capital accounts within the financial statements are adjusted for permanent book-tax differences. These adjustments have no impact on net assets or the results of operations. Capital accounts are not adjusted for temporary book-tax differences which will reverse in a subsequent period.
Book-tax differences are primarily due to market discount, deferred trustees compensation, capital loss carryforwards and losses deferred due to futures contracts.
The Fund purchases municipal securities whose interest, in the opinion of the issuer, is free from federal income tax. There is no assurance that the IRS will agree with this opinion. In the event the IRS determines that the issuer does not comply with relevant tax requirements, interest payments from a security could become federally taxable, possibly retroactively to the date the security was issued.
The federal tax cost of investment securities and unrealized appreciation (depreciation) as of period end were as follows:
| Gross unrealized appreciation | $563,559 |
| Gross unrealized depreciation | (3,661) |
| Net unrealized appreciation (depreciation) on securities | $559,898 |
| Tax cost | $5,272,684 |
Short-Term Trading (Redemption) Fees. Shares held by investors in the Fund less than 30 days may have been subject to a redemption fee equal to .50% of the NAV of shares redeemed. All redemption fees, which reduce the proceeds of the shareholder redemption, are retained by the Fund and accounted for as an addition to paid in capital.
Delayed Delivery Transactions and When-Issued Securities. During the period, the Fund transacted in securities on a delayed delivery or when-issued basis. Payment and delivery may take place after the customary settlement period for that security. The price of the underlying securities and the date when the securities will be delivered and paid for are fixed at the time the transaction is negotiated. The securities purchased on a delayed delivery or when-issued basis are identified as such in the Fund's Schedule of Investments. The Fund may receive compensation for interest forgone in the purchase of a delayed delivery or when-issued security. With respect to purchase commitments, the Fund identifies securities as segregated in its records with a value at least equal to the amount of the commitment. Losses may arise due to changes in the value of the underlying securities or if the counterparty does not perform under the contract's terms, or if the issuer does not issue the securities due to political, economic, or other factors.
Restricted Securities. The Fund may invest in securities that are subject to legal or contractual restrictions on resale. These securities generally may be resold in transactions exempt from registration or to the public if the securities are registered. Disposal of these securities may involve time-consuming negotiations and expense, and prompt sale at an acceptable price may be difficult. Information regarding restricted securities is included at the end of the Fund's Schedule of Investments.
4. Purchases and Sales of Investments.
Purchases and sales of securities, other than short-term securities, aggregated $590,062 and $627,845, respectively.
5. Fees and Other Transactions with Affiliates.
Management Fee. Fidelity Management & Research Company (the investment adviser) and its affiliates provide the Fund with investment management related services for which the Fund pays a monthly management fee. The management fee is the sum of an individual fund fee rate that is based on an annual rate of .25% of the Fund's average net assets and an annualized group fee rate that averaged .11% during the period. The group fee rate is based upon the average net assets of all the mutual funds advised by the investment adviser, including any mutual funds previously advised by the investment adviser that are currently advised by Fidelity SelectCo, LLC, an affiliate of the investment adviser. The group fee rate decreases as assets under management increase and increases as assets under management decrease. For the reporting period, the total annualized management fee rate was .36% of the Fund's average net assets.
Transfer Agent Fees. Fidelity Investments Institutional Operations Company, Inc. (FIIOC), an affiliate of the investment adviser, is the transfer, dividend disbursing and shareholder servicing agent for the Fund. FIIOC receives account fees and asset-based fees that vary according to account size and type of account. FIIOC pays for typesetting and printing and mailing of shareholder reports, except proxy statements. For the period, transfer agent fees were equivalent to an annualized rate of .09% of average net assets.
Accounting Fees. Fidelity Service Company, Inc. (FSC), an affiliate of the investment adviser, maintains the Fund's accounting records. The fee is based on the level of average net assets for each month.
Interfund Trades. The Fund may purchase from or sell securities to other Fidelity Funds under procedures adopted by the Board. The procedures have been designed to ensure these interfund trades are executed in accordance with Rule 17a-7 of the 1940 Act. Interfund trades are included within the respective purchases and sales amounts shown in the Purchases and Sales of Investments note.
6. Committed Line of Credit.
The Fund participates with other funds managed by the investment adviser or an affiliate in a $4.25 billion credit facility (the "line of credit") to be utilized for temporary or emergency purposes to fund shareholder redemptions or for other short-term liquidity purposes. The Fund has agreed to pay commitment fees on its pro-rata portion of the line of credit, which amounted to $5 and is reflected in Miscellaneous expenses on the Statement of Operations. During the period, the Fund did not borrow on this line of credit.
7. Expense Reductions.
Through arrangements with the Fund's custodian, credits realized as a result of certain uninvested cash balances were used to reduce the Fund's expenses. During the period, these credits reduced the Fund's custody expenses by $21.
In addition, during the period the investment adviser reimbursed and/or waived a portion of operating expenses in the amount of $12.
8. Other.
The Fund's organizational documents provide former and current trustees and officers with a limited indemnification against liabilities arising in connection with the performance of their duties to the Fund. In the normal course of business, the Fund may also enter into contracts that provide general indemnifications. The Fund's maximum exposure under these arrangements is unknown as this would be dependent on future claims that may be made against the Fund. The risk of material loss from such claims is considered remote.
Shareholder Expense Example
As a shareholder of the Fund, you incur two types of costs: (1) transaction costs, including redemption fees and (2) ongoing costs, including management fees and other Fund expenses. This Example is intended to help you understand your ongoing costs (in dollars) of investing in the Fund and to compare these costs with the ongoing costs of investing in other mutual funds.
The Example is based on an investment of $1,000 invested at the beginning of the period and held for the entire period (January 1, 2016 to June 30, 2016).
Actual Expenses
The first line of the accompanying table provides information about actual account values and actual expenses. You may use the information in this line, together with the amount you invested, to estimate the expenses that you paid over the period. Simply divide your account value by $1,000.00 (for example, an $8,600 account value divided by $1,000.00 = 8.6), then multiply the result by the number in the first line under the heading entitled "Expenses Paid During Period" to estimate the expenses you paid on your account during this period. A small balance maintenance fee of $12.00 that is charged once a year may apply for certain accounts with a value of less than $2,000. This fee is not included in the table below. If it was, the estimate of expenses you paid during the period would be higher, and your ending account value lower, by this amount. In addition, the Fund, as a shareholder in the underlying Fidelity Central Funds, will indirectly bear its pro-rata share of the fees and expenses incurred by the underlying Fidelity Central Funds. These fees and expenses are not included in the Fund's annualized expense ratio used to calculate the expense estimate in the table below.
Hypothetical Example for Comparison Purposes
The second line of the accompanying table provides information about hypothetical account values and hypothetical expenses based on the Fund's actual expense ratio and an assumed rate of return of 5% per year before expenses, which is not the Fund's actual return. The hypothetical account values and expenses may not be used to estimate the actual ending account balance or expenses you paid for the period. You may use this information to compare the ongoing costs of investing in the Fund and other funds. To do so, compare this 5% hypothetical example with the 5% hypothetical examples that appear in the shareholder reports of the other funds. A small balance maintenance fee of $12.00 that is charged once a year may apply for certain accounts with a value of less than $2,000. This fee is not included in the table below. If it was, the estimate of expenses you paid during the period would be higher, and your ending account value lower, by this amount. In addition, the Fund, as a shareholder in the underlying Fidelity Central Funds, will indirectly bear its pro-rata share of the fees and expenses incurred by the underlying Fidelity Central Funds. These fees and expenses are not included in the Fund's annualized expense ratio used to calculate the expense estimate in the table below.
Please note that the expenses shown in the table are meant to highlight your ongoing costs only and do not reflect any transaction costs. Therefore, the second line of the table is useful in comparing ongoing costs only, and will not help you determine the relative total costs of owning different funds. In addition, if these transactional costs were included, your costs would have been higher.
| | Annualized Expense Ratio-A | Beginning
Account Value
January 1, 2016 | Ending
Account Value
June 30, 2016 | Expenses Paid
During Period-B
January 1, 2016
to June 30, 2016 |
| Actual | .47% | $1,000.00 | $1,049.80 | $2.40 |
| Hypothetical-C | | $1,000.00 | $1,022.53 | $2.36 |
A Annualized expense ratio reflects expenses net of applicable fee waivers.
B Expenses are equal to the Fund's annualized expense ratio, multiplied by the average account value over the period, multiplied by 182/366 (to reflect the one-half year period).
C 5% return per year before expenses

Corporate Headquarters
245 Summer St.
Boston, MA 02210
www.fidelity.com
HIY-SANN-0816
1.704645.118
Fidelity® Pennsylvania Municipal Income Fund
Fidelity® Pennsylvania Municipal Money Market Fund
Semi-Annual Report June 30, 2016 |
|
Contents
To view a fund's proxy voting guidelines and proxy voting record for the 12-month period ended June 30, visit http://www.fidelity.com/proxyvotingresults or visit the Securities and Exchange Commission's (SEC) web site at http://www.sec.gov.
You may also call 1-800-544-8544 to request a free copy of the proxy voting guidelines.
Standard & Poor's, S&P and S&P 500 are registered service marks of The McGraw-Hill Companies, Inc. and have been licensed for use by Fidelity Distributors Corporation.
Other third-party marks appearing herein are the property of their respective owners.
All other marks appearing herein are registered or unregistered trademarks or service marks of FMR LLC or an affiliated company. © 2016 FMR LLC. All rights reserved.
This report and the financial statements contained herein are submitted for the general information of the shareholders of the Fund. This report is not authorized for distribution to prospective investors in the Fund unless preceded or accompanied by an effective prospectus.
A fund files its complete schedule of portfolio holdings with the SEC for the first and third quarters of each fiscal year on Form N-Q. Forms N-Q are available on the SEC’s web site at http://www.sec.gov. A fund's Forms N-Q may be reviewed and copied at the SEC’s Public Reference Room in Washington, DC. Information regarding the operation of the SEC's Public Reference Room may be obtained by calling 1-800-SEC-0330.
For a complete list of a fund's portfolio holdings, view the most recent holdings listing, semiannual report, or annual report on Fidelity's web site at http://www.fidelity.com, http://www.institutional.fidelity.com, or http://www.401k.com, as applicable.
NOT FDIC INSURED •MAY LOSE VALUE •NO BANK GUARANTEE
Neither the Fund nor Fidelity Distributors Corporation is a bank.
Fidelity® Pennsylvania Municipal Income Fund
Investment Summary (Unaudited)
Top Five Sectors as of June 30, 2016
| | % of fund's net assets | % of fund's net assets 6 months ago |
| Health Care | 26.6 | 23.9 |
| General Obligations | 23.1 | 24.2 |
| Escrowed/Pre-Refunded | 11.8 | 7.5 |
| Education | 10.7 | 13.1 |
| Water & Sewer | 8.0 | 8.4 |
Quality Diversification (% of fund's net assets)
| As of June 30, 2016 |
| | AAA | 0.1% |
| | AA,A | 74.5% |
| | BBB | 15.5% |
| | BB and Below | 2.0% |
| | Not Rated | 2.4% |
| | Short-Term Investments and Net Other Assets | 5.5% |

| As of December 31, 2015 |
| | AAA | 0.1% |
| | AA,A | 71.9% |
| | BBB | 17.5% |
| | BB and Below | 2.0% |
| | Not Rated | 2.1% |
| | Short-Term Investments and Net Other Assets | 6.4% |

We have used ratings from Moody's Investors Service, Inc. Where Moody's® ratings are not available, we have used S&P® ratings. All ratings are as of the date indicated and do not reflect subsequent changes.
Fidelity® Pennsylvania Municipal Income Fund
Investments June 30, 2016 (Unaudited)
Showing Percentage of Net Assets
| Municipal Bonds - 94.5% | | | |
| | | Principal Amount | Value |
| Guam - 0.5% | | | |
| Guam Int'l. Arpt. Auth. Rev. Series 2013 C: | | | |
| 5% 10/1/17 (a) | | $600,000 | $624,702 |
| 6.25% 10/1/34 (a) | | 700,000 | 864,199 |
| Guam Pwr. Auth. Rev. Series 2012 A, 5% 10/1/24 (FSA Insured) | | 900,000 | 1,077,174 |
|
| TOTAL GUAM | | | 2,566,075 |
|
| Pennsylvania - 92.6% | | | |
| Adams County Indl. Dev. Auth. Rev. (Gettysburg College Proj.) Series 2010, 5% 8/15/24 | | 1,000,000 | 1,147,110 |
| Allegheny County Series C: | | | |
| 5% 12/1/28 | | 1,000,000 | 1,226,620 |
| 5% 12/1/30 | | 1,365,000 | 1,662,570 |
| Allegheny County Arpt. Auth. Rev. Series 2006 B: | | | |
| 5% 1/1/21 (FGIC Insured) (a) | | 3,190,000 | 3,651,753 |
| 5% 1/1/22 (Nat'l. Pub. Fin. Guarantee Corp. Insured) (a) | | 1,650,000 | 1,934,064 |
| Allegheny County Port Auth. Spl. Rev. 5% 3/1/17 | | 2,000,000 | 2,055,900 |
| Allegheny County Sanitation Auth. Swr. Rev.: | | | |
| Series 2010, 5% 6/1/40 (FSA Insured) | | 6,690,000 | 7,601,245 |
| 5% 12/1/27 (Build America Mutual Assurance Insured) | | 2,500,000 | 3,139,925 |
| 5% 12/1/29 (Build America Mutual Assurance Insured) | | 3,905,000 | 4,866,645 |
| Beaver County Indl. Dev. Auth. Poll. Cont. Rev. Bonds (FirstEnergy Nuclear Generation Corp. Proj.) Series 2008 A, 2.7%, tender 4/2/18 (b) | | 4,000,000 | 3,995,840 |
| Berks County Muni. Auth. Rev. Series 2012 A, 5% 11/1/40 | | 3,590,000 | 4,151,009 |
| Bethlehem Wtr. Auth. Rev. Series 2014: | | | |
| 5% 11/15/19 (Build America Mutual Assurance Insured) | | 1,000,000 | 1,116,980 |
| 5% 11/15/20 (Build America Mutual Assurance Insured) | | 1,000,000 | 1,146,200 |
| Bucks County Cmnty. College Auth. College Bldg. Rev. 5% 6/15/28 | | 250,000 | 270,390 |
| Butler County Hosp. Auth. Hosp. Rev. (Butler Health Sys. Proj.): | | | |
| Series 2009 B, 7.125% 7/1/29 (Pre-Refunded to 7/1/19 @ 100) | | 1,035,000 | 1,227,779 |
| Series 2015 A: | | | |
| 5% 7/1/26 | | 500,000 | 612,215 |
| 5% 7/1/27 | | 490,000 | 595,522 |
| 5% 7/1/28 | | 540,000 | 653,854 |
| 5% 7/1/29 | | 710,000 | 857,779 |
| 5% 7/1/30 | | 685,000 | 822,671 |
| 5% 7/1/35 | | 1,885,000 | 2,220,643 |
| 5% 7/1/39 | | 6,675,000 | 7,794,131 |
| Central Bradford Prog. Auth. Rev. Series 2011, 5.375% 12/1/41 | | 2,000,000 | 2,296,480 |
| Centre County Hosp. Auth. Rev.: | | | |
| (Mount Nittany Med. Cneter Proj.) Series 2016 A, 5% 11/15/28 | | 840,000 | 1,037,929 |
| (Mount Nittany Med. Ctr. Proj.): | | | |
| Series 2011, 7% 11/15/46 (Pre-Refunded to 11/15/21 @ 100) | | 2,000,000 | 2,609,900 |
| Series 2016 A: | | | |
| 4% 11/15/32 | | 350,000 | 391,388 |
| 4% 11/15/34 | | 250,000 | 277,148 |
| 4% 11/15/35 | | 200,000 | 221,020 |
| 5% 11/15/29 | | 825,000 | 1,016,252 |
| 5% 11/15/30 | | 685,000 | 841,851 |
| 5% 11/15/46 | | 6,605,000 | 7,920,122 |
| Series 2016 B: | | | |
| 4% 11/15/40 | | 600,000 | 657,348 |
| 4% 11/15/47 | | 3,605,000 | 3,906,342 |
| Commonwealth Fing. Auth. Rev. Series 2013 A2: | | | |
| 5% 6/1/24 | | 800,000 | 957,096 |
| 5% 6/1/25 | | 1,175,000 | 1,402,069 |
| 5% 6/1/26 | | 1,250,000 | 1,486,913 |
| 5% 6/1/42 | | 12,000,000 | 13,785,709 |
| Cumberland County Muni. Auth. Rev. (Dickinson College Proj.): | | | |
| Series 2012: | | | |
| 5% 11/1/37 | | 1,520,000 | 1,787,414 |
| 5% 11/1/42 | | 3,000,000 | 3,514,200 |
| Series 2016: | | | |
| 5% 5/1/30 | | 1,000,000 | 1,252,050 |
| 5% 5/1/31 | | 500,000 | 623,515 |
| 5% 5/1/32 | | 750,000 | 931,530 |
| 5% 5/1/33 | | 2,210,000 | 2,733,925 |
| 5% 5/1/34 | | 1,000,000 | 1,232,120 |
| Dauphin County Gen. Auth.: | | | |
| (Pinnacle Health Sys. Proj.): | | | |
| Series 2009 A, 5.25% 6/1/17 (Pre-Refunded to 6/1/17 @ 100) | | 1,050,000 | 1,091,748 |
| Series 2016 A: | | | |
| 5% 6/1/34 | | 1,275,000 | 1,565,611 |
| 5% 6/1/35 | | 1,000,000 | 1,222,990 |
| 5% 6/1/36 | | 500,000 | 609,040 |
| 5% 6/1/42 | | 7,410,000 | 8,556,920 |
| Delaware County Auth. College Rev. (Haverford College Proj.) Series 2010 A, 5% 11/15/31 | | 4,090,000 | 4,736,670 |
| Delaware County Auth. Univ. Rev.: | | | |
| Series 2010, 5.25% 12/1/31 | | 2,450,000 | 2,778,962 |
| Series 2012: | | | |
| 5% 8/1/21 | | 350,000 | 416,742 |
| 5% 8/1/22 | | 300,000 | 365,556 |
| Series 2014: | | | |
| 5% 8/1/23 | | 1,050,000 | 1,309,172 |
| 5% 8/1/24 | | 1,100,000 | 1,400,190 |
| Doylestown Hosp. Auth. Hosp. Rev. Series 2013 A, 5% 7/1/27 | | 2,500,000 | 2,877,600 |
| East Stroudsburg Area School District: | | | |
| Series 2014 A: | | | |
| 7.75% 9/1/27 (Pre-Refunded to 9/1/17 @ 100) | | 4,040,000 | 4,372,290 |
| 7.75% 9/1/27 (Pre-Refunded to 9/1/17 @ 100) | | 225,000 | 243,506 |
| Series 2015 A: | | | |
| 7.5% 9/1/22 | | 115,000 | 124,143 |
| 7.5% 9/1/22 (Pre-Refunded to 9/1/17 @ 100) | | 885,000 | 954,711 |
| Series A, 7.75% 9/1/27 (Pre-Refunded to 9/1/17 @ 100) | | 3,935,000 | 4,258,654 |
| Erie County Hosp. Auth. Rev. (Saint Vincent Health Ctr. Proj.) Series 2010 A, 7% 7/1/27 | | 2,750,000 | 2,983,695 |
| Fox Chapel Area School District Series 2013: | | | |
| 4% 8/1/22 | | 500,000 | 578,225 |
| 5% 8/1/31 | | 3,080,000 | 3,700,743 |
| 5% 8/1/34 | | 1,000,000 | 1,191,270 |
| Franklin County Indl. Dev. Auth. (The Chambersburg Hosp. Proj.) Series 2010: | | | |
| 5.3% 7/1/30 | | 1,770,000 | 2,032,261 |
| 5.375% 7/1/42 | | 2,130,000 | 2,399,743 |
| Geisinger Auth. Health Sys. Rev. Series 2014 A, 4% 6/1/41 | | 2,000,000 | 2,155,800 |
| Indiana County Hosp. Auth. Series 2014 A: | | | |
| 5% 6/1/20 | | 650,000 | 721,039 |
| 6% 6/1/39 | | 1,625,000 | 1,824,485 |
| Lancaster County Hosp. Auth. Health Ctr. Rev.: | | | |
| (Masonic Homes Proj.) Series 2006, 5% 11/1/20 (Pre-Refunded to 11/1/16 @ 100) | | 1,065,000 | 1,079,718 |
| Series 2016: | | | |
| 5% 8/15/31 | | 1,000,000 | 1,260,780 |
| 5% 8/15/33 | | 1,000,000 | 1,249,420 |
| 5% 8/15/34 | | 1,000,000 | 1,236,160 |
| 5% 8/15/36 | | 1,000,000 | 1,228,080 |
| Lehigh County Indl. Dev. Auth. Poll. Cont. Rev. Bonds 0.9%, tender 8/15/17 (b) | | 4,745,000 | 4,748,132 |
| Lower Paxton Township Series 2014: | | | |
| 5% 4/1/40 | | 3,420,000 | 4,070,860 |
| 5% 4/1/44 | | 1,295,000 | 1,537,424 |
| Luzerne County Indl. Dev. Auth. Wtr. Facilities Rev. (Pennsylvania-American Wtr. Co. Proj.) Series 2009, 5.5% 12/1/39 | | 2,500,000 | 2,841,200 |
| Lycoming County Auth. Health Sys. Rev. (Susquehanna Health Sys.) Series 2009 A, 5.5% 7/1/21 | | 3,500,000 | 3,948,945 |
| Mifflin County School District Series 2007: | | | |
| 7.5% 9/1/26 (Pre-Refunded to 9/1/17 @ 100) | | 1,125,000 | 1,214,303 |
| 7.75% 9/1/30 (Pre-Refunded to 9/1/17 @ 100) | | 1,175,000 | 1,271,644 |
| Monroe County Hosp. Auth. Rev. (Pocono Med. Ctr. Proj.) Series 2012 A: | | | |
| 5% 1/1/32 | | 1,400,000 | 1,574,566 |
| 5% 1/1/41 | | 3,240,000 | 3,587,976 |
| Monroeville Fin. Auth. UPMC Rev. Series 2012, 5% 2/15/26 | | 1,500,000 | 1,908,105 |
| Montgomery County Higher Ed. & Health Auth. Hosp. Rev. (Abington Memorial Hosp. Proj.): | | | |
| Series 2009 A, 5% 6/1/17 | | 2,000,000 | 2,075,760 |
| Series 2012 A: | | | |
| 5% 6/1/23 | | 3,850,000 | 4,584,465 |
| 5% 6/1/24 | | 1,500,000 | 1,778,715 |
| Montgomery County Higher Ed. & Health Auth. Rev. Series 2014 A: | | | |
| 4% 10/1/19 | | 185,000 | 197,976 |
| 5% 10/1/20 | | 215,000 | 240,230 |
| 5% 10/1/21 | | 245,000 | 275,260 |
| 5% 10/1/22 | | 275,000 | 312,081 |
| 5% 10/1/23 | | 305,000 | 349,737 |
| 5% 10/1/24 | | 335,000 | 388,861 |
| 5% 10/1/25 | | 750,000 | 861,660 |
| 5% 10/1/26 | | 1,000,000 | 1,138,690 |
| 5% 10/1/27 | | 1,000,000 | 1,130,140 |
| Montour School District Series 2015 A: | | | |
| 5% 4/1/41 | | 1,000,000 | 1,198,620 |
| 5% 4/1/42 | | 1,000,000 | 1,197,710 |
| Moon Area School District Series 2015 A, 5% 11/15/29 | | 3,000,000 | 3,650,850 |
| Northampton County Gen. Purp. Auth. Hosp. Rev.: | | | |
| (St. Luke's Hosp. Proj.) Series 2010 A, 5.25% 8/15/16 | | 1,245,000 | 1,251,798 |
| (St. Luke's Hosp. Proj.) Series 2010 A, 5.25% 8/15/18 | | 1,450,000 | 1,573,468 |
| Pennsylvania Econ. Dev. Auth. Governmental Lease (Forum Place Proj.) Series 2012: | | | |
| 5% 3/1/24 | | 1,745,000 | 2,046,885 |
| 5% 3/1/25 | | 3,255,000 | 3,829,605 |
| Pennsylvania Gen. Oblig.: | | | |
| First Series 2008, 5% 5/15/27 (Pre-Refunded to 5/15/18 @ 100) | | 805,000 | 869,730 |
| Second Series 2007 A, 5% 8/1/25 (Pre-Refunded to 8/1/17 @ 100) | | 2,500,000 | 2,617,625 |
| Second Series 2009, 5% 4/15/25 | | 500,000 | 553,870 |
| Series 2012, 5% 6/1/25 | | 10,000,000 | 11,963,700 |
| Series 2013, 5% 10/15/27 | | 2,255,000 | 2,756,963 |
| Series 2015 1, 5% 3/15/31 | | 7,000,000 | 8,530,340 |
| Series 2015, 5% 3/15/33 | | 2,880,000 | 3,489,350 |
| Pennsylvania Higher Edl. Facilities Auth. Rev.: | | | |
| (Slippery Rock Univ. Proj.) Series 2007 A, 5% 7/1/39 (Pre-Refunded to 7/1/17 @ 100) | | 2,500,000 | 2,607,475 |
| (Thomas Jefferson Univ. Proj.) Series 2012: | | | |
| 5% 3/1/18 | | 250,000 | 267,245 |
| 5% 3/1/20 | | 300,000 | 341,310 |
| 5% 3/1/22 | | 275,000 | 327,795 |
| 5% 3/1/23 | | 585,000 | 700,339 |
| 5% 3/1/42 | | 3,950,000 | 4,597,919 |
| (Univ. of Pennsylvania Health Sys. Proj.): | | | |
| Series 2009 A, 5.25% 8/15/22 (Pre-Refunded to 8/15/19 @ 100) | | 2,655,000 | 3,021,363 |
| Series 2011 A, 5.75% 8/15/41 (Pre-Refunded to 8/15/21 @ 100) | | 4,980,000 | 6,014,246 |
| First Series 2012: | | | |
| 5% 4/1/20 | | 750,000 | 855,878 |
| 5% 4/1/21 | | 500,000 | 583,945 |
| 5% 4/1/22 | | 600,000 | 714,996 |
| 5% 4/1/23 | | 800,000 | 956,240 |
| 5% 4/1/24 | | 1,100,000 | 1,314,159 |
| Series 2010 E, 5% 5/15/31 | | 2,500,000 | 2,844,925 |
| Series 2010, 5% 9/1/30 (Pre-Refunded to 9/1/20 @ 100) | | 1,150,000 | 1,345,857 |
| Series 2011 A, 5% 9/1/41 (Pre-Refunded to 3/1/21 @ 100) | | 2,000,000 | 2,363,780 |
| Pennsylvania Pub. School Bldg. Auth. School Rev. (The School District of Harrisburg Proj.): | | | |
| Series 2014 B2: | | | |
| 5% 12/1/24 (Build America Mutual Assurance Insured) | | 1,250,000 | 1,549,613 |
| 5% 12/1/25 (Build America Mutual Assurance Insured) | | 1,250,000 | 1,539,788 |
| 5% 12/1/26 (Build America Mutual Assurance Insured) | | 1,250,000 | 1,528,963 |
| 5% 12/1/27 (Build America Mutual Assurance Insured) | | 1,010,000 | 1,225,857 |
| Series 2016 A, 5% 12/1/28 (FSA Insured) (c) | | 5,690,000 | 7,117,223 |
| Pennsylvania State Univ.: | | | |
| Series 2008 A, 5% 8/15/29 (Pre-Refunded to 2/15/18 @ 100) | | 3,945,000 | 4,221,071 |
| Series 2010, 5% 3/1/40 | | 4,385,000 | 4,953,515 |
| Series 2015 A: | | | |
| 5% 9/1/30 | | 1,100,000 | 1,391,544 |
| 5% 9/1/31 | | 1,415,000 | 1,783,240 |
| 5% 9/1/31 | | 4,000,000 | 5,040,960 |
| 5% 9/1/32 | | 1,500,000 | 1,883,190 |
| Series 2016 A, 5% 9/1/36 | | 1,000,000 | 1,258,680 |
| Pennsylvania Tpk. Commission Oil Franchise Tax Rev. Series 2003 C, 5% 12/1/29 (Nat'l. Pub. Fin. Guarantee Corp. Insured) | | 3,000,000 | 3,286,410 |
| Pennsylvania Tpk. Commission Tpk. Rev.: | | | |
| Series 2008 B1, 5.5% 6/1/33 (Pre-Refunded to 6/1/18 @ 100) | | 4,000,000 | 4,366,240 |
| Series 2008 C4, 6.25% 6/1/38 (Pre-Refunded to 6/1/18 @ 100) | | 2,000,000 | 2,211,440 |
| Series 2013 A2, 0% 12/1/38 (d) | | 2,500,000 | 2,744,050 |
| Series 2014 A, 5% 12/1/31 | | 865,000 | 1,064,028 |
| Series 2014 A2, 0% 12/1/40 (d) | | 5,500,000 | 4,589,750 |
| Philadelphia Gas Works Rev.: | | | |
| (1998 Gen. Ordinance Proj.): | | | |
| Ninth Series, 5.25% 8/1/40 | | 8,665,000 | 9,803,754 |
| Seventh Series, 5% 10/1/37 (AMBAC Insured) | | 5,245,000 | 5,478,140 |
| Series 1998 A, 5.25% 8/1/17 | | 3,555,000 | 3,721,161 |
| 5% 8/1/29 | | 2,000,000 | 2,443,400 |
| 5% 8/1/30 | | 1,500,000 | 1,825,695 |
| 5% 8/1/31 | | 1,100,000 | 1,332,837 |
| Philadelphia Gen. Oblig. Series 2008 A, 5.25% 12/15/32 (FSA Insured) | | 6,000,000 | 6,593,640 |
| Philadelphia Hospitals & Higher Ed. Facilities Auth. Health Systems Rev. (Jefferson Health Sys. Proj.) Series 2010 B, 5.25% 5/15/30 (Pre-Refunded to 5/15/20 @ 100) | | 4,000,000 | 4,653,360 |
| Philadelphia Hospitals & Higher Ed. Facilities Auth. Hosp. Rev. (Children's Hosp. of Philadelphia Proj.) Series 2011 D, 5% 7/1/32 | | 2,500,000 | 2,925,400 |
| Philadelphia Redev. Auth. Rev.: | | | |
| Series 2012: | | | |
| 5% 4/15/21 | | 1,000,000 | 1,153,690 |
| 5% 4/15/25 | | 2,230,000 | 2,599,712 |
| Series 2015 A, 5% 4/15/29 | | 3,000,000 | 3,598,020 |
| Philadelphia School District Series 2010 C, 5% 9/1/21 | | 4,000,000 | 4,375,440 |
| Philadelphia Wtr. & Wastewtr. Rev.: | | | |
| Series 2010 C, 5% 8/1/40 (FSA Insured) | | 4,000,000 | 4,526,960 |
| Series 2011 A, 5% 1/1/41 | | 2,715,000 | 3,081,552 |
| Series 2015 B, 5% 7/1/30 | | 3,500,000 | 4,307,905 |
| Pittsburgh & Allegheny County Sports & Exhibition Auth. Series 2012, 5% 2/1/25 (FSA Insured) | | 2,250,000 | 2,696,535 |
| Pittsburgh Gen. Oblig.: | | | |
| Series 2012 A, 5% 9/1/22 | | 2,000,000 | 2,398,200 |
| Series 2014: | | | |
| 5% 9/1/23 (Build America Mutual Assurance Insured) | | 575,000 | 705,749 |
| 5% 9/1/28 (Build America Mutual Assurance Insured) | | 1,300,000 | 1,614,106 |
| 5% 9/1/29 (Build America Mutual Assurance Insured) | | 1,015,000 | 1,255,900 |
| 5% 9/1/31 (Build America Mutual Assurance Insured) | | 1,165,000 | 1,431,610 |
| 5% 9/1/32 (Build America Mutual Assurance Insured) | | 1,000,000 | 1,224,630 |
| Pittsburgh School District: | | | |
| Series 2012 A, 5% 9/1/21 (FSA Insured) | | 4,000,000 | 4,700,320 |
| Series 2014 A, 5% 9/1/23 | | 1,000,000 | 1,216,770 |
| Series 2015: | | | |
| 4% 9/1/19 (FSA Insured) | | 895,000 | 974,619 |
| 5% 9/1/20 (FSA Insured) | | 1,050,000 | 1,210,230 |
| 5% 9/1/21 (FSA Insured) | | 730,000 | 859,794 |
| 5% 9/1/22 (FSA Insured) | | 885,000 | 1,064,080 |
| 5% 9/1/23 (FSA Insured) | | 1,085,000 | 1,331,718 |
| South Fork Muni. Auth. Hosp. Rev. (Conemaugh Health Sys. Proj.) Series 2010, 5.25% 7/1/23 (Pre-Refunded to 7/1/20 @ 100) | | 1,000,000 | 1,169,950 |
| Southcentral Pennsylvania Gen. Auth. Rev.: | | | |
| Series 2015: | | | |
| 4% 12/1/30 | | 1,010,000 | 1,078,953 |
| 5% 12/1/25 | | 1,285,000 | 1,575,616 |
| 5% 12/1/27 | | 1,480,000 | 1,789,675 |
| 5% 12/1/29 | | 1,000,000 | 1,197,190 |
| 6% 6/1/25 | | 1,080,000 | 1,189,728 |
| 6% 6/1/25 (Pre-Refunded to 6/1/18 @ 100) | | 1,420,000 | 1,560,566 |
| State Pub. School Bldg. Auth. College Rev.: | | | |
| (Delaware County Cmnty. College Proj.) Series 2008, 5% 10/1/20 (Pre-Refunded to 4/1/18 @ 100) | | 1,000,000 | 1,075,330 |
| (Montgomery County Cmnty. College Proj.) Series 2008: | | | |
| 5% 5/1/27 (Pre-Refunded to 5/1/18 @ 100) | | 1,775,000 | 1,914,746 |
| 5% 5/1/28 (Pre-Refunded to 5/1/18 @ 100) | | 1,000,000 | 1,078,730 |
| Univ. of Pittsburgh Commonwealth Sys. of Higher Ed. (Univ. Cap. Proj.): | | | |
| Series 2000 B, 5.25% 9/15/34 | | 2,000,000 | 2,262,940 |
| Series 2007 B, 5.25% 9/15/28 | | 2,500,000 | 2,840,525 |
| Series 2009 B, 5% 9/15/28 | | 2,000,000 | 2,217,560 |
| West Shore Area Auth. Hosp. Rev.: | | | |
| (Holy Spirit Hosp. Charity Proj.) Series 2011 B, 6% 1/1/28 | | 7,375,000 | 9,090,278 |
| Series 2011 B, 5.75% 1/1/41 | | 1,500,000 | 1,790,880 |
| Westmoreland County Indl. Dev. Auth. Rev. (Excela Health Proj.) Series 2010 A: | | | |
| 5% 7/1/19 | | 1,000,000 | 1,081,100 |
| 5% 7/1/25 | | 4,465,000 | 5,102,870 |
| 5.25% 7/1/20 | | 1,000,000 | 1,109,330 |
| Westmoreland County Muni. Auth. Muni. Svc. Rev. Series 2001 A: | | | |
| 0% 8/15/19 (Nat'l. Pub. Fin. Guarantee Corp. Insured) | | 5,000,000 | 4,759,800 |
| 0% 8/15/20 (Nat'l. Pub. Fin. Guarantee Corp. Insured) | | 2,500,000 | 2,321,625 |
| 0% 8/15/22 (Nat'l. Pub. Fin. Guarantee Corp. Insured) | | 6,550,000 | 5,775,790 |
|
| TOTAL PENNSYLVANIA | | | 467,427,477 |
|
| Pennsylvania, New Jersey - 1.4% | | | |
| Delaware River Joint Toll Bridge Commission Pennsylvania-New Jersey Bridge Rev.: | | | |
| Series 2012 A: | | | |
| 5% 7/1/22 | | 500,000 | 602,375 |
| 5% 7/1/23 | | 1,000,000 | 1,204,750 |
| Series A, 5% 7/1/27 (Pre-Refunded to 7/1/17 @ 100) | | 1,425,000 | 1,486,988 |
| Delaware River Port Auth. Pennsylvania & New Jersey Rev. Series 2010 D, 5% 1/1/30 | | 3,500,000 | 3,943,800 |
|
| TOTAL PENNSYLVANIA, NEW JERSEY | | | 7,237,913 |
|
| TOTAL MUNICIPAL BONDS | | | |
| (Cost $438,739,688) | | | 477,231,465 |
| TOTAL INVESTMENT PORTFOLIO - 94.5% | | | |
| (Cost $438,739,688) | | | 477,231,465 |
| NET OTHER ASSETS (LIABILITIES) - 5.5% | | | 27,688,941 |
| NET ASSETS - 100% | | | $504,920,406 |
Legend
(a) Private activity obligations whose interest is subject to the federal alternative minimum tax for individuals.
(b) Coupon rates for floating and adjustable rate securities reflect the rates in effect at period end.
(c) Security or a portion of the security purchased on a delayed delivery or when-issued basis.
(d) Security initially issued in zero coupon form which converts to coupon form at a specified rate and date. The rate shown is the rate at period end.
Investment Valuation
All investments are categorized as Level 2 under the Fair Value Hierarchy. The inputs or methodology used for valuing securities may not be an indication of the risk associated with investing in those securities. For more information on valuation inputs please refer to the Investment Valuation section in the accompanying Notes to Financial Statements.
Other Information
The distribution of municipal securities by revenue source, as a percentage of total Net Assets, is as follows (Unaudited):
| Health Care | 26.6% |
| General Obligations | 23.1% |
| Escrowed/Pre-Refunded | 11.8% |
| Education | 10.7% |
| Water & Sewer | 8.0% |
| Electric Utilities | 7.4% |
| Other | 5.5% |
| Others* (Individually Less Than 5%) | 6.9% |
| | 100.0% |
* Includes net other assets
See accompanying notes which are an integral part of the financial statements.
Fidelity® Pennsylvania Municipal Income Fund
Financial Statements
Statement of Assets and Liabilities
| | | June 30, 2016 (Unaudited) |
| Assets | | |
Investment in securities, at value — See accompanying schedule:
Unaffiliated issuers (cost $438,739,688) | | $477,231,465 |
| Cash | | 29,953,281 |
| Receivable for fund shares sold | | 26,173 |
| Interest receivable | | 5,445,084 |
| Other receivables | | 911 |
| Total assets | | 512,656,914 |
| Liabilities | | |
| Payable for investments purchased on a delayed delivery basis | $6,999,041 | |
| Payable for fund shares redeemed | 127,029 | |
| Distributions payable | 390,583 | |
| Accrued management fee | 149,949 | |
| Other affiliated payables | 44,296 | |
| Other payables and accrued expenses | 25,610 | |
| Total liabilities | | 7,736,508 |
| Net Assets | | $504,920,406 |
| Net Assets consist of: | | |
| Paid in capital | | $466,453,258 |
| Distributions in excess of net investment income | | (10,592) |
| Accumulated undistributed net realized gain (loss) on investments | | (14,037) |
| Net unrealized appreciation (depreciation) on investments | | 38,491,777 |
| Net Assets, for 43,440,577 shares outstanding | | $504,920,406 |
| Net Asset Value, offering price and redemption price per share ($504,920,406 ÷ 43,440,577 shares) | | $11.62 |
See accompanying notes which are an integral part of the financial statements.
Statement of Operations
| | | Six months ended June 30, 2016 (Unaudited) |
| Investment Income | | |
| Interest | | $8,266,445 |
| Expenses | | |
| Management fee | $871,397 | |
| Transfer agent fees | 197,197 | |
| Accounting fees and expenses | 62,546 | |
| Custodian fees and expenses | 1,904 | |
| Independent trustees' fees and expenses | 1,101 | |
| Registration fees | 20,626 | |
| Audit | 26,855 | |
| Legal | 278 | |
| Miscellaneous | 319 | |
| Total expenses before reductions | 1,182,223 | |
| Expense reductions | (2,854) | 1,179,369 |
| Net investment income (loss) | | 7,087,076 |
| Realized and Unrealized Gain (Loss) | | |
| Net realized gain (loss) on: | | |
| Investment securities: | | |
| Unaffiliated issuers | | 53,285 |
| Total net realized gain (loss) | | 53,285 |
| Change in net unrealized appreciation (depreciation) on investment securities | | 13,690,771 |
| Net gain (loss) | | 13,744,056 |
| Net increase (decrease) in net assets resulting from operations | | $20,831,132 |
See accompanying notes which are an integral part of the financial statements.
Statement of Changes in Net Assets
| | Six months ended June 30, 2016 (Unaudited) | Year ended December 31, 2015 |
| Increase (Decrease) in Net Assets | | |
| Operations | | |
| Net investment income (loss) | $7,087,076 | $14,709,852 |
| Net realized gain (loss) | 53,285 | 1,560,659 |
| Change in net unrealized appreciation (depreciation) | 13,690,771 | (1,274,614) |
| Net increase (decrease) in net assets resulting from operations | 20,831,132 | 14,995,897 |
| Distributions to shareholders from net investment income | (7,086,722) | (14,703,703) |
| Distributions to shareholders from net realized gain | (291,696) | (1,756,019) |
| Total distributions | (7,378,418) | (16,459,722) |
| Share transactions | | |
| Proceeds from sales of shares | 48,627,056 | 77,063,335 |
| Reinvestment of distributions | 4,870,932 | 10,807,008 |
| Cost of shares redeemed | (30,119,080) | (71,166,482) |
| Net increase (decrease) in net assets resulting from share transactions | 23,378,908 | 16,703,861 |
| Redemption fees | 2,388 | 984 |
| Total increase (decrease) in net assets | 36,834,010 | 15,241,020 |
| Net Assets | | |
| Beginning of period | 468,086,396 | 452,845,376 |
| End of period | $504,920,406 | $468,086,396 |
| Other Information | | |
| Distributions in excess of net investment income end of period | $(10,592) | $(10,946) |
| Shares | | |
| Sold | 4,255,675 | 6,819,246 |
| Issued in reinvestment of distributions | 425,569 | 956,105 |
| Redeemed | (2,636,091) | (6,306,204) |
| Net increase (decrease) | 2,045,153 | 1,469,147 |
See accompanying notes which are an integral part of the financial statements.
Financial Highlights — Fidelity Pennsylvania Municipal Income Fund
| | Six months ended (Unaudited) June 30, | Years ended December 31, | | | | |
| | 2016 | 2015 | 2014 | 2013 | 2012 | 2011 |
| Selected Per–Share Data | | | | | | |
| Net asset value, beginning of period | $11.31 | $11.34 | $10.77 | $11.47 | $11.10 | $10.51 |
| Income from Investment Operations | | | | | | |
| Net investment income (loss)A | .168 | .358 | .373 | .370 | .387 | .415 |
| Net realized and unrealized gain (loss) | .317 | .013 | .615 | (.654) | .395 | .590 |
| Total from investment operations | .485 | .371 | .988 | (.284) | .782 | 1.005 |
| Distributions from net investment income | (.168) | (.358) | (.373) | (.370) | (.386) | (.415) |
| Distributions from net realized gain | (.007) | (.043) | (.045) | (.046) | (.026) | – |
| Total distributions | (.175) | (.401) | (.418) | (.416) | (.412) | (.415) |
| Redemption fees added to paid in capitalA,B | – | – | – | – | – | – |
| Net asset value, end of period | $11.62 | $11.31 | $11.34 | $10.77 | $11.47 | $11.10 |
| Total ReturnC,D | 4.32% | 3.33% | 9.30% | (2.50)% | 7.13% | 9.76% |
| Ratios to Average Net AssetsE | | | | | | |
| Expenses before reductions | .49%F | .49% | .49% | .49% | .49% | .50% |
| Expenses net of fee waivers, if any | .49%F | .49% | .49% | .49% | .49% | .50% |
| Expenses net of all reductions | .49%F | .49% | .49% | .49% | .48% | .50% |
| Net investment income (loss) | 2.95%F | 3.17% | 3.35% | 3.33% | 3.40% | 3.87% |
| Supplemental Data | | | | | | |
| Net assets, end of period (000 omitted) | $504,920 | $468,086 | $452,845 | $404,493 | $487,622 | $424,693 |
| Portfolio turnover rate | 9%F | 17% | 12% | 9% | 16% | 12% |
A Calculated based on average shares outstanding during the period.
B Amount represents less than $.0005 per share.
C Total returns for periods of less than one year are not annualized.
D Total returns would have been lower if certain expenses had not been reduced during the applicable periods shown.
E Expense ratios reflect operating expenses of the Fund. Expenses before reductions do not reflect amounts reimbursed by the investment adviser or reductions from expense offset arrangements and do not represent the amount paid by the Fund during periods when reimbursements or reductions occur. Expenses net of fee waivers reflect expenses after reimbursement by the investment adviser but prior to reductions from expense offset arrangements. Expenses net of all reductions represent the net expenses paid by the Fund.
F Annualized
See accompanying notes which are an integral part of the financial statements.
Fidelity® Pennsylvania Municipal Money Market Fund
Investment Summary/Performance (Unaudited)
Effective Maturity Diversification
| Days | % of fund's investments 6/30/16 | % of fund's investments 12/31/15 | % of fund's investments 6/30/15 |
| 1 - 7 | 77.3 | 79.7 | 83.7 |
| 8 - 30 | 0.5 | 1.1 | 3.2 |
| 31 - 60 | 9.3 | 3.0 | 2.7 |
| 61 - 90 | 2.1 | 2.5 | 1.3 |
| 91 - 180 | 6.1 | 5.2 | 1.2 |
| > 180 | 4.7 | 8.5 | 7.9 |
Effective maturity is determined in accordance with the requirements of Rule 2a-7 under the Investment Company Act of 1940.
Asset Allocation (% of fund's net assets)
| As of June 30, 2016 |
| | Variable Rate Demand Notes (VRDNs) | 51.0% |
| | Tender Option Bond | 17.6% |
| | Other Municipal Security | 25.7% |
| | Investment Companies | 5.4% |
| | Net Other Assets (Liabilities) | 0.3% |

| As of December 31, 2015 |
| | Variable Rate Demand Notes (VRDNs) | 57.4% |
| | Tender Option Bond | 10.5% |
| | Other Municipal Security | 23.0% |
| | Investment Companies | 4.1% |
| | Net Other Assets (Liabilities) | 5.0% |

Current And Historical 7-Day Yields
| | 6/30/16 | 3/31/16 | 12/31/15 | 9/30/15 | 6/30/15 |
| Fidelity® Pennsylvania Municipal Money Market Fund | 0.01% | 0.01% | 0.01% | 0.01% | 0.01% |
Yield refers to the income paid by the Fund over a given period. Yields for money market funds are usually for seven-day periods, as they are here, though they are expressed as annual percentage rates. Past performance is no guarantee of future results. Yield will vary and it's possible to lose money investing in the Fund. A portion of the Fund's expenses was reimbursed and/or waived. Absent such reimbursements and/or waivers the yield for the period ending June 30, 2016, the most recent period shown in the table, would have been -0.04%.
Fidelity® Pennsylvania Municipal Money Market Fund
Investments June 30, 2016 (Unaudited)
Showing Percentage of Net Assets
| Variable Rate Demand Note - 51.0% | | | |
| | | Principal Amount | Value |
| Alabama - 0.1% | | | |
| Decatur Indl. Dev. Board Exempt Facilities Rev. (Nucor Steel Decatur LLC Proj.) Series 2003 A, 0.7% 7/7/16, VRDN (a)(b) | | $400,000 | $400,000 |
| Alaska - 0.2% | | | |
| Valdez Marine Term. Rev. (Phillips Trans. Alaska, Inc. Proj.) Series 1994 C, 0.56% 7/7/16, VRDN (b) | | 1,400,000 | 1,400,000 |
| Arkansas - 0.5% | | | |
| Blytheville Indl. Dev. Rev. (Nucor Corp. Proj.) Series 1998, 0.7% 7/7/16, VRDN (a)(b) | | 200,000 | 200,000 |
| Osceola Solid Waste Disp. Rev. (Plum Point Energy Associates, LLC Proj.) Series 2006, 0.7% 7/7/16, LOC Royal Bank of Scotland PLC, VRDN (a)(b) | | 2,500,000 | 2,500,000 |
| | | | 2,700,000 |
| Colorado - 0.2% | | | |
| Colorado Hsg. & Fin. Auth. Solid Waste Rev. (Waste Mgmt., Inc. Proj.) 0.45% 7/7/16, LOC Wells Fargo Bank NA, VRDN (a)(b)(c) | | 1,300,000 | 1,300,000 |
| Delaware - 0.0% | | | |
| Delaware Econ. Dev. Auth. Rev. (Delmarva Pwr. & Lt. Co. Proj.) Series 1994, 0.63% 7/1/16, VRDN (a)(b) | | 100,000 | 100,000 |
| District Of Columbia - 0.1% | | | |
| District of Columbia Rev. (American Psychological Assoc. Proj.) Series 2003, 0.47% 7/7/16, LOC Bank of America NA, VRDN (b) | | 750,000 | 750,000 |
| Florida - 0.6% | | | |
| Collier County Hsg. Fin. Auth. Multi-family Rev. (George Washington Carver Apts. Proj.) Series 2005, 0.51% 7/7/16, LOC PNC Bank NA, VRDN (a)(b) | | 3,350,000 | 3,350,000 |
| Georgia - 0.7% | | | |
| Bartow County Dev. Auth. Poll. Cont. Rev. (Georgia Pwr. Co. Plant Bowen Proj.) First Series 2009, 0.52% 7/7/16, VRDN (b) | | 1,000,000 | 1,000,000 |
| Burke County Indl. Dev. Auth. Poll. Cont. Rev. (Georgia Pwr. Co. Plant Vogtle Proj.) Series 2013, 0.52% 7/7/16, VRDN (b) | | 2,300,000 | 2,300,000 |
| Monroe County Dev. Auth. Poll. Cont. Rev. (Georgia Pwr. Co. Plant Scherer Proj.) First Series 2009, 0.54% 7/7/16, VRDN (b) | | 800,000 | 800,000 |
| | | | 4,100,000 |
| Indiana - 0.1% | | | |
| Indiana Dev. Fin. Auth. Envir. Rev. (PSI Energy Proj.) Series 2003 B, 0.6% 7/7/16, VRDN (a)(b) | | 400,000 | 400,000 |
| Louisiana - 0.2% | | | |
| Saint James Parish Gen. Oblig. (Nucor Steel Louisiana LLC Proj.): | | | |
| Series 2010 A1, 0.65% 7/7/16, VRDN (b) | | 700,000 | 700,000 |
| Series 2010 B1, 0.7% 7/7/16, VRDN (b) | | 180,000 | 180,000 |
| | | | 880,000 |
| Nebraska - 0.1% | | | |
| Stanton County Indl. Dev. Rev. (Nucor Corp. Proj.) Series 1996, 0.7% 7/7/16, VRDN (a)(b) | | 400,000 | 400,000 |
| Nevada - 0.0% | | | |
| Washoe County Gas Facilities Rev.: | | | |
| Series 2016 C, 0.63% 7/7/16, VRDN (a)(b) | | 100,000 | 100,000 |
| Series 2016 D, 0.64% 7/7/16, VRDN (a)(b) | | 100,000 | 100,000 |
| Series 2016 E, 0.65% 7/7/16, VRDN (a)(b) | | 100,000 | 100,000 |
| | | | 300,000 |
| New Jersey - 0.1% | | | |
| Salem County Poll. Cont. Fin. Auth. Rev. (Pub. Svc. Elec. and Gas Co. Proj.) Series 2012 A, 0.7% 7/7/16, VRDN (a)(b) | | 300,000 | 300,000 |
| Pennsylvania - 47.1% | | | |
| Allegheny County Hosp. Dev. Auth. Rev.: | | | |
| (Children's Institute Pittsburgh Proj.) Series 2005 A, 0.43% 7/7/16, LOC PNC Bank NA, VRDN (b) | | 2,965,000 | 2,965,000 |
| (Jefferson Reg'l. Med. Ctr.) Series 2010 A, 0.43% 7/7/16, LOC PNC Bank NA, VRDN (b) | | 13,975,000 | 13,975,000 |
| (South Hills Health Sys. Proj.) Series 2000 A, 0.43% 7/7/16, LOC PNC Bank NA, VRDN (b) | | 10,000,000 | 10,000,000 |
| Allegheny County Indl. Dev. Auth. Health Care Rev. (Vincentian Collaborative Sys. Proj.) Series 2008 A, 0.43% 7/7/16, LOC PNC Bank NA, VRDN (b) | | 6,440,000 | 6,440,000 |
| Allegheny County Indl. Dev. Auth. Rev.: | | | |
| (The Watson Institute Friendship Academy Proj.) Series 2010, 0.43% 7/7/16, LOC PNC Bank NA, VRDN (b) | | 3,525,000 | 3,525,000 |
| (Union Elec. Steel Co. Proj.) Series 1996 A, 0.5% 7/7/16, LOC PNC Bank NA, VRDN (a)(b) | | 3,120,000 | 3,120,000 |
| (United Jewish Federation Proj.) Series 1996 A, 0.43% 7/7/16, LOC PNC Bank NA, VRDN (b) | | 3,770,000 | 3,770,000 |
| Beaver County Indl. Dev. Auth. Poll. Cont. Rev. (FirstEnergy Nuclear Generation Corp. Proj.): | | | |
| Series 2008 B, 0.54% 7/1/16, LOC Bank of Nova Scotia, VRDN (b) | | 2,200,000 | 2,200,000 |
| Series 2008 C, 0.42% 7/1/16, LOC Bank of Nova Scotia, VRDN (a)(b) | | 9,850,000 | 9,850,000 |
| Bucks County Indl. Dev. Auth. Rev.: | | | |
| (Lutheran Cmnty. at Telford Healthcare Ctr., Inc. Proj.) Series 2007 B, 0.59% 7/7/16, LOC Citizens Bank of Pennsylvania, VRDN (b) | | 3,415,000 | 3,415,000 |
| (Snowball Real Estate LP Proj.) 0.6% 7/7/16, LOC Wells Fargo Bank NA, VRDN (a)(b) | | 1,005,000 | 1,005,000 |
| Cap. Region Wtr. Swr. Rev. Series 2014 B, 0.46% 7/7/16, LOC Manufacturers & Traders Trust Co., VRDN (b) | | 15,800,000 | 15,800,000 |
| Chester County Intermediate Unit Rev. Series 2003, 0.42% 7/7/16, LOC PNC Bank NA, VRDN (b) | | 1,765,000 | 1,765,000 |
| Crawford County Indl. Dev. Auth. College Rev. (Allegheny College Proj.) Series 2009 B, 0.44% 7/7/16, LOC PNC Bank NA, VRDN (b) | | 2,000,000 | 2,000,000 |
| Cumberland County Muni. Auth. Rev. (Diakon Lutheran Social Ministries Proj.) Series 2014 B, 0.46% 7/1/16, LOC Manufacturers & Traders Trust Co., VRDN (b) | | 7,045,000 | 7,045,000 |
| Delaware County Indl. Dev. Auth. Arpt. Facilities Rev. (United Parcel Svc. Proj.) Series 2015, 0.51% 7/1/16, VRDN (b) | | 6,300,000 | 6,300,000 |
| Erie County Hosp. Auth. Rev. (Saint Vincent Health Ctr. Proj.) Series 2010 B, 0.43% 7/7/16, LOC Manufacturers & Traders Trust Co., VRDN (b) | | 12,900,000 | 12,900,000 |
| Haverford Township School District Series 2009, 0.42% 7/7/16, LOC TD Banknorth, NA, VRDN (b) | | 13,360,000 | 13,360,000 |
| Lancaster Indl. Dev. Auth. Rev.: | | | |
| (Willow Valley Retirement Cmntys. Proj.) Series 2009 C, 0.44% 7/7/16, LOC PNC Bank NA, VRDN (b) | | 7,100,000 | 7,100,000 |
| (Willow Valley Retirement Proj.) Series 2009 B, 0.44% 7/7/16, LOC PNC Bank NA, VRDN (b) | | 685,000 | 685,000 |
| Lawrence County Gen. Oblig. Indl. Dev. Auth. 0.43% 7/7/16, LOC PNC Bank NA, VRDN (b) | | 1,935,000 | 1,935,000 |
| Luzerne County Convention Ctr. Series 2012, 0.43% 7/7/16, LOC PNC Bank NA, VRDN (b) | | 2,170,000 | 2,170,000 |
| Montgomery County Redev. Auth. Multi-family Hsg. Rev. (Kingswood Apts. Proj.) Series 2001 A, 0.43% 7/7/16, LOC Fannie Mae, VRDN (b) | | 12,675,000 | 12,675,000 |
| Pennsylvania Econ. Dev. Fing. Auth. Indl. Dev. Rev.: | | | |
| (Leidy's, Inc. Proj.) Series 1995 D7, 0.54% 7/7/16, LOC PNC Bank NA, VRDN (a)(b) | | 500,000 | 500,000 |
| Series 2002 B5, 0.5% 7/7/16, LOC PNC Bank NA, VRDN (a)(b) | | 3,900,000 | 3,900,000 |
| Series 2004 B, 0.44% 7/7/16, LOC PNC Bank NA, VRDN (b) | | 800,000 | 800,000 |
| Pennsylvania Higher Edl. Facilities Auth. Rev.: | | | |
| (Drexel Univ. Proj.) Second Series, 0.4% 7/7/16, LOC JPMorgan Chase Bank, VRDN (b) | | 2,015,000 | 2,015,000 |
| (Point Park College Proj.) 0.45% 7/7/16, LOC PNC Bank NA, VRDN (b) | | 600,000 | 600,000 |
| Philadelphia Arpt. Rev.: | | | |
| Series 2005 C1, 0.42% 7/7/16, LOC TD Banknorth, NA, VRDN (a)(b) | | 24,220,000 | 24,220,000 |
| Series 2005 C2, 0.42% 7/7/16, LOC Royal Bank of Canada, VRDN (a)(b) | | 12,620,000 | 12,620,000 |
| Philadelphia Auth. for Indl. Dev. Rev.: | | | |
| (Spl. People in Northeast, Inc. Proj.) Series 2006, 0.56% 7/7/16, LOC Citizens Bank of Pennsylvania, VRDN (b) | | 1,375,000 | 1,375,000 |
| (The Franklin Institute Proj.) Series 2006, 0.45% 7/7/16, LOC Bank of America NA, VRDN (b) | | 7,555,000 | 7,555,000 |
| Philadelphia Auth. Indl. Dev. Lease Rev. Series 2007 B3, 0.42% 7/7/16, LOC PNC Bank NA, VRDN (b) | | 7,300,000 | 7,300,000 |
| Philadelphia Gas Works Rev. (1998 Gen. Ordinance Proj.): | | | |
| Eighth Series B, 0.4% 7/7/16, LOC Wells Fargo Bank NA, VRDN (b) | | 14,550,000 | 14,550,000 |
| Eighth Series C, 0.42% 7/7/16, LOC Barclays Bank PLC, VRDN (b) | | 17,500,000 | 17,500,000 |
| Philadelphia School District Series 2016 B, 0.41% 7/7/16, LOC Bank of America NA, VRDN (b) | | 5,700,000 | 5,700,000 |
| Philadelphia Wtr. & Wastewtr. Rev. Series 1997 B, 0.41% 7/7/16, LOC TD Banknorth, NA, VRDN (b) | | 2,055,000 | 2,055,000 |
| Ridley School District Series 2009, 0.42% 7/7/16, LOC TD Banknorth, NA, VRDN (b) | | 8,795,000 | 8,795,000 |
| Washington County Auth. Rev. 0.4% 7/7/16, VRDN (b) | | 3,920,000 | 3,920,000 |
| Washington County Hosp. Auth. Rev. (Monongahela Valley Hosp. Proj.) Series 2011 A, 0.43% 7/7/16, LOC PNC Bank NA, VRDN (b) | | 1,380,000 | 1,380,000 |
| Westmoreland County Indl. Dev. Auth. Rev. (Excela Health Proj.) Series 2010 B, 0.43% 7/7/16, LOC PNC Bank NA, VRDN (b) | | 6,985,000 | 6,985,000 |
| | | | 265,770,000 |
| Texas - 0.9% | | | |
| Port Arthur Navigation District Envir. Facilities Rev. (Motiva Enterprises LLC Proj.): | | | |
| Series 2001 A, 0.54% 7/1/16, VRDN (b) | | 2,550,000 | 2,550,000 |
| Series 2004, 0.71% 7/7/16, VRDN (a)(b) | | 200,000 | 200,000 |
| Series 2009 A, 0.54% 7/1/16, VRDN (b) | | 600,000 | 600,000 |
| Series 2010 B, 0.54% 7/1/16, VRDN (b) | | 1,600,000 | 1,600,000 |
| | | | 4,950,000 |
| West Virginia - 0.1% | | | |
| West Virginia Econ. Dev. Auth. Solid Waste Disp. Facilities Rev.: | | | |
| (Appalachian Pwr. Co. - Amos Proj.) Series 2008 B, 0.72% 7/7/16, VRDN (a)(b) | | 400,000 | 400,000 |
| (Appalachian Pwr. Co.- Mountaineer Proj.) Series 2008 A, 0.72% 7/7/16, VRDN (a)(b) | | 400,000 | 400,000 |
| | | | 800,000 |
| TOTAL VARIABLE RATE DEMAND NOTE | | | |
| (Cost $287,900,000) | | | 287,900,000 |
|
| Tender Option Bond - 17.6% | | | |
| Nebraska - 0.0% | | | |
| Omaha Pub. Pwr. District Elec. Rev. Participating VRDN Series 16 XF1053, 0.59% 7/7/16 (Liquidity Facility Deutsche Bank AG New York Branch) (b)(d) | | 200,000 | 200,000 |
| Pennsylvania - 17.6% | | | |
| Geisinger Auth. Health Sys. Rev. Participating VRDN: | | | |
| Series 15 ZF0174, 0.44% 7/7/16 (Liquidity Facility JPMorgan Chase Bank) (b)(d) | | 2,785,000 | 2,785,000 |
| Series Putters 0047, 0.44% 7/7/16 (Liquidity Facility JPMorgan Chase Bank) (b)(d) | | 6,605,000 | 6,605,000 |
| 0.44% 7/7/16 (Liquidity Facility JPMorgan Chase Bank) (b)(d) | | 6,285,000 | 6,285,000 |
| Lancaster County Hosp. Auth. Health Ctr. Rev. Participating VRDN Series 16 ZF0383, 0.44% 7/7/16 (Liquidity Facility Toronto-Dominion Bank) (b)(d) | | 3,750,000 | 3,750,000 |
| Pennsylvania Gen. Oblig. Participating VRDN: | | | |
| Series 16 ZF0424, 0.44% 7/7/16 (Liquidity Facility JPMorgan Chase Bank) (b)(d) | | 4,770,000 | 4,770,000 |
| Series MS 3382, 0.45% 7/7/16 (Liquidity Facility Morgan Stanley Bank, West Valley City Utah) (b)(d) | | 5,000,000 | 5,000,000 |
| Series Putters 4014, 0.44% 7/7/16 (Liquidity Facility JPMorgan Chase Bank) (b)(d) | | 3,000,000 | 3,000,000 |
| Series ROC II R 14070, 0.43% 7/7/16 (Liquidity Facility Citibank NA) (b)(d) | | 8,000,000 | 8,000,000 |
| Pennsylvania Higher Edl. Facilities Auth. Rev.: | | | |
| Bonds Series WF 11 26C, 0.61%, tender 8/11/16 (Liquidity Facility Wells Fargo Bank NA) (b)(d)(e) | | 10,000,000 | 10,000,000 |
| Participating VRDN: | | | |
| ROC II R 11721, 0.43% 7/7/16 (Liquidity Facility Citibank NA) (b)(d) | | 7,500,000 | 7,500,000 |
| Series MS 3252, 0.45% 7/7/16 (Liquidity Facility Morgan Stanley Bank, West Valley City Utah) (b)(d) | | 5,840,000 | 5,840,000 |
| Pennsylvania Intergovernmental Coop. Auth. Spl. Tax Rev. Participating VRDN Series Putters 15 XM0010, 0.44% 7/7/16 (Liquidity Facility JPMorgan Chase Bank) (b)(d) | | 5,035,000 | 5,035,000 |
| Philadelphia Auth. For Indl. Dev. Participating VRDN: | | | |
| Series 15 ZF0167, 0.44% 7/7/16 (Liquidity Facility JPMorgan Chase Bank) (b)(d) | | 3,750,000 | 3,750,000 |
| Series Putters 14 XM0005, 0.44% 7/7/16 (Liquidity Facility JPMorgan Chase Bank) (b)(d)(f) | | 5,000,000 | 5,000,000 |
| Philadelphia Hospitals & Higher Ed. Facilities Auth. Hosp. Rev. Participating VRDN Series 15 F0114, 0.44% 7/7/16 (Liquidity Facility JPMorgan Chase Bank) (b)(d) | | 5,330,000 | 5,330,000 |
| RBC Muni. Products, Inc. Trust Bonds: | | | |
| Series E72, 0.59%, tender 9/1/16 (Liquidity Facility Royal Bank of Canada) (b)(d)(e) | | 5,900,000 | 5,900,000 |
| Series RBC E53, 0.57%, tender 10/3/16 (Liquidity Facility Royal Bank of Canada) (b)(d)(e) | | 6,500,000 | 6,500,000 |
| Tender Option Bond Trust Receipts Participating VRDN Series 16 XX 1021, 0.46% 7/7/16 (Liquidity Facility Barclays Bank PLC) (b)(d) | | 4,175,000 | 4,175,000 |
| | | | 99,225,000 |
| TOTAL TENDER OPTION BOND | | | |
| (Cost $99,425,000) | | | 99,425,000 |
|
| Other Municipal Security - 25.7% | | | |
| Georgia - 0.3% | | | |
| Main Street Natural Gas, Inc. Georgia Gas Proj. Rev. Bonds Series 2010 A1, 0.52%, tender 10/3/16 (Liquidity Facility Royal Bank of Canada) (b) | | 1,500,000 | 1,500,000 |
| Kentucky - 0.0% | | | |
| Jefferson County Poll. Cont. Rev. Bonds Series 2001 A, 0.8% tender 7/25/16, CP mode | | 200,000 | 200,000 |
| Massachusetts - 0.2% | | | |
| Massachusetts Indl. Fin. Agcy. Poll. Cont. Rev. Bonds: | | | |
| (New England Pwr. Co. Proj.) Series 1992: | | | |
| 0.86% tender 7/7/16, CP mode | | 700,000 | 700,000 |
| 0.86% tender 7/8/16, CP mode | | 200,000 | 200,000 |
| Series 93B, 0.9% tender 7/26/16, CP mode | | 400,000 | 400,000 |
| | | | 1,300,000 |
| New Hampshire - 0.4% | | | |
| New Hampshire Bus. Fin. Auth. Poll. Cont. Rev. Bonds: | | | |
| (New England Pwr. Co. Proj.): | | | |
| Series 1990 A, 0.9% tender 7/8/16, CP mode (a) | | 100,000 | 100,000 |
| Series 1990 B, 0.85% tender 7/15/16, CP mode | | 400,000 | 400,000 |
| Series 1990 A, 0.9% tender 7/6/16, CP mode (a) | | 800,000 | 800,000 |
| Series A1, 0.95% tender 7/26/16, CP mode (a) | | 700,000 | 700,000 |
| | | | 2,000,000 |
| Pennsylvania - 24.6% | | | |
| Allegheny County Hosp. Dev. Auth. Rev. Bonds Series 2011 A, 5% 10/15/16 | | 1,500,000 | 1,519,932 |
| Lancaster County Hosp. Auth. Health Ctr. Rev. Bonds: | | | |
| Series 2007 B, 5% 3/15/17 (Pre-Refunded to 3/15/17 @ 100) | | 1,025,000 | 1,056,057 |
| Series 2016, 5% 8/15/16 | | 4,725,000 | 4,751,513 |
| Pennsylvania Econ. Dev. Fin. Auth. Unemployment Compensation Rev. Bonds Series 2012 A: | | | |
| 4% 1/1/17 | | 1,020,000 | 1,037,557 |
| 5% 7/1/16 | | 18,615,000 | 18,615,000 |
| Pennsylvania Econ. Dev. Fing. Auth. Indl. Dev. Rev. Bonds Series 2014 A, 4% 2/1/17 | | 1,430,000 | 1,458,457 |
| Pennsylvania Gen. Oblig. Bonds: | | | |
| Series 2004, 5.375% 7/1/16 | | 17,500,000 | 17,500,000 |
| Series 2006: | | | |
| 5% 10/1/16 | | 1,000,000 | 1,011,315 |
| 5% 10/1/16 (Pre-Refunded to 10/1/16 @ 100) | | 5,000,000 | 5,056,955 |
| Series 2007 A: | | | |
| 5% 8/1/16 | | 5,525,000 | 5,546,313 |
| 5% 11/1/16 | | 1,000,000 | 1,014,861 |
| Series 2009, 5% 3/15/17 | | 1,235,000 | 1,272,270 |
| Series 2010 A, 5% 5/1/17 | | 2,990,000 | 3,095,221 |
| Series 2010, 5% 2/15/17 | | 5,240,000 | 5,382,086 |
| Series 2011, 5% 11/15/16 | | 7,120,000 | 7,238,922 |
| Series 2013, 5% 4/1/17 | | 1,000,000 | 1,032,417 |
| Series 2015, 5% 8/15/16 | | 2,270,000 | 2,282,955 |
| Series 2016, 5% 2/1/17 | | 5,900,000 | 6,048,232 |
| 5% 8/15/16 | | 8,225,000 | 8,271,568 |
| 5% 10/15/16 | | 8,650,000 | 8,765,286 |
| 5% 6/1/17 | | 6,000,000 | 6,234,949 |
| Pennsylvania Higher Edl. Facilities Auth. Rev. Bonds: | | | |
| Series 2015 A, 4% 10/1/16 | | 3,085,000 | 3,112,116 |
| Series 2015, 3% 8/15/16 | | 4,525,000 | 4,539,639 |
| Philadelphia Arpt. Rev. Series B3, 0.6% 8/10/16, LOC Wells Fargo Bank NA, CP (a) | | 6,300,000 | 6,300,000 |
| Univ. of Pittsburgh Commonwealth Sys. of Higher Ed.: | | | |
| BAN Series 2015, 2% 8/2/16 | | 5,700,000 | 5,707,494 |
| Bonds: | | | |
| Series 2007 B, 0.54% tender 9/1/16, CP mode | | 5,900,000 | 5,900,000 |
| Series 2014 B2, 0.5% tender 8/16/16, CP mode | | 5,000,000 | 5,000,000 |
| | | | 138,751,115 |
| Virginia - 0.1% | | | |
| Halifax County Indl. Dev. Auth. Poll. Cont. Rev. Bonds 0.9% tender 7/26/16, CP mode (a) | | 500,000 | 500,000 |
| Prince William County Indl. Dev. Auth. Poll. Cont. Rev. Bonds (Elec. Pwr. Co. Proj.) 0.85% tender 7/26/16, CP mode | | 100,000 | 100,000 |
| | | | 600,000 |
| West Virginia - 0.1% | | | |
| Grant County Cmnty. Solid Waste Disp. Rev. Bonds (Virginia Elec. and Pwr. Co. Proj.) Series 1996, 0.9% tender 7/8/16, CP mode (a) | | 300,000 | 300,000 |
| TOTAL OTHER MUNICIPAL SECURITY | | | |
| (Cost $144,651,115) | | | 144,651,115 |
| | | Shares | Value |
|
| Investment Company - 5.4% | | | |
| Fidelity Municipal Cash Central Fund, 0.44% (g)(h) | | | |
| (Cost $30,545,801) | | 30,545,800 | 30,545,801 |
| TOTAL INVESTMENT PORTFOLIO - 99.7% | | | |
| (Cost $562,521,916) | | | 562,521,916 |
| NET OTHER ASSETS (LIABILITIES) - 0.3% | | | 1,592,680 |
| NET ASSETS - 100% | | | $564,114,596 |
Security Type Abbreviations
BAN – BOND ANTICIPATION NOTE
CP – COMMERCIAL PAPER
VRDN – VARIABLE RATE DEMAND NOTE (A debt instrument that is payable upon demand, either daily, weekly or monthly)
The date shown for securities represents the date when principal payments must be paid, taking into account any call options exercised by the issuer and any permissible maturity shortening features other than interest rate resets.
Legend
(a) Private activity obligations whose interest is subject to the federal alternative minimum tax for individuals.
(b) Coupon rates for floating and adjustable rate securities reflect the rates in effect at period end.
(c) A portion of the security sold on a delayed delivery basis.
(d) Provides evidence of ownership in one or more underlying municipal bonds.
(e) Restricted securities - Investment in securities not registered under the Securities Act of 1933 (excluding 144A issues). At the end of the period, the value of restricted securities (excluding 144A issues) amounted to $22,400,000 or 4.0% of net assets.
(f) Security exempt from registration under Rule 144A of the Securities Act of 1933. These securities may be resold in transactions exempt from registration, normally to qualified institutional buyers. At the end of the period, the value of these securities amounted to $5,000,000 or 0.9% of net assets.
(g) Information in this report regarding holdings by state and security types does not reflect the holdings of the Fidelity Municipal Cash Central Fund.
(h) Affiliated fund that is available only to investment companies and other accounts managed by Fidelity Investments. The rate quoted is the annualized seven-day yield of the fund at period end. A complete unaudited listing of the fund's holdings as of its most recent quarter end is available upon request. In addition, each Fidelity Central Fund's financial statements are available on the SEC's website or upon request.
Additional information on each restricted holding is as follows:
| Security | Acquisition Date | Acquisition Cost |
| Indiana Health & Edl. Facilities Fing. Auth. Rev. Bonds Series E72, 0.59%, tender 9/1/16 (Liquidity Facility Royal Bank of Canada) | 6/1/16 | $5,900,000 |
| Pennsylvania Higher Edl. Facilities Auth. Rev. Bonds Series WF 11 26C, 0.61%, tender 8/11/16 (Liquidity Facility Wells Fargo Bank NA) | 5/30/13 - 11/12/15 | $10,000,000 |
| RBC Muni. Products, Inc. Trust Bonds Series RBC E53, 0.57%, tender 10/3/16 (Liquidity Facility Royal Bank of Canada) | 3/31/16 | $6,500,000 |
Affiliated Central Funds
Information regarding fiscal year to date income earned by the Fund from investments in Fidelity Central Funds is as follows:
| Fund | Income earned |
| Fidelity Municipal Cash Central Fund | $47,431 |
| Total | $47,431 |
Investment Valuation
All investments are categorized as Level 2 under the Fair Value Hierarchy. The inputs or methodology used for valuing securities may not be an indication of the risk associated with investing in those securities. For more information on valuation inputs please refer to the Investment Valuation section in the accompanying Notes to Financial Statements.
See accompanying notes which are an integral part of the financial statements.
Fidelity® Pennsylvania Municipal Money Market Fund
Financial Statements
Statement of Assets and Liabilities
| | | June 30, 2016 (Unaudited) |
| Assets | | |
Investment in securities, at value — See accompanying schedule:
Unaffiliated issuers (cost $531,976,116) | $531,976,116 | |
| Fidelity Central Funds (cost $30,545,800) | 30,545,800 | |
| Total Investments (cost $562,521,916) | | $562,521,916 |
| Receivable for investments sold | | |
| Regular delivery | | 5,117,189 |
| Delayed delivery | | 300,000 |
| Receivable for fund shares sold | | 3,165,275 |
| Interest receivable | | 2,128,827 |
| Distributions receivable from Fidelity Central Funds | | 13,136 |
| Other receivables | | 1,302 |
| Total assets | | 573,247,645 |
| Liabilities | | |
| Payable to custodian bank | $4,965,416 | |
| Payable for investments purchased | 100,049 | |
| Payable for fund shares redeemed | 3,860,361 | |
| Distributions payable | 287 | |
| Accrued management fee | 206,708 | |
| Other affiliated payables | 228 | |
| Total liabilities | | 9,133,049 |
| Net Assets | | $564,114,596 |
| Net Assets consist of: | | |
| Paid in capital | | $564,109,425 |
| Undistributed net investment income | | 14 |
| Accumulated undistributed net realized gain (loss) on investments | | 5,157 |
| Net Assets, for 563,870,972 shares outstanding | | $564,114,596 |
| Net Asset Value, offering price and redemption price per share ($564,114,596 ÷ 563,870,972 shares) | | $1.00 |
See accompanying notes which are an integral part of the financial statements.
Statement of Operations
| | | Six months ended June 30, 2016 (Unaudited) |
| Investment Income | | |
| Interest | | $777,791 |
| Income from Fidelity Central Funds | | 47,431 |
| Total income | | 825,222 |
| Expenses | | |
| Management fee | $1,608,993 | |
| Independent trustees' fees and expenses | 1,522 | |
| Total expenses before reductions | 1,610,515 | |
| Expense reductions | (817,411) | 793,104 |
| Net investment income (loss) | | 32,118 |
| Realized and Unrealized Gain (Loss) | | |
| Net realized gain (loss) on: | | |
| Investment securities: | | |
| Unaffiliated issuers | 1,902 | |
| Total net realized gain (loss) | | 1,902 |
| Net increase in net assets resulting from operations | | $34,020 |
See accompanying notes which are an integral part of the financial statements.
Statement of Changes in Net Assets
| | Six months ended June 30, 2016 (Unaudited) | Year ended December 31, 2015 |
| Increase (Decrease) in Net Assets | | |
| Operations | | |
| Net investment income (loss) | $32,118 | $71,521 |
| Net realized gain (loss) | 1,902 | 49,955 |
| Net increase in net assets resulting from operations | 34,020 | 121,476 |
| Distributions to shareholders from net investment income | (32,104) | (71,539) |
| Distributions to shareholders from net realized gain | – | (27,761) |
| Total distributions | (32,104) | (99,300) |
| Share transactions at net asset value of $1.00 per share | | |
| Proceeds from sales of shares | 495,028,239 | 1,599,662,197 |
| Reinvestment of distributions | 29,670 | 93,316 |
| Cost of shares redeemed | (662,645,743) | (1,628,544,631) |
| Net increase (decrease) in net assets and shares resulting from share transactions | (167,587,834) | (28,789,118) |
| Total increase (decrease) in net assets | (167,585,918) | (28,766,942) |
| Net Assets | | |
| Beginning of period | 731,700,514 | 760,467,456 |
| End of period | $564,114,596 | $731,700,514 |
| Other Information | | |
| Undistributed net investment income end of period | $14 | $– |
See accompanying notes which are an integral part of the financial statements.
Financial Highlights — Fidelity Pennsylvania Municipal Money Market Fund
| | Six months ended (Unaudited) June 30, | Years ended December 31, | | | | |
| | 2016 | 2015 | 2014 | 2013 | 2012 | 2011 |
| Selected Per–Share Data | | | | | | |
| Net asset value, beginning of period | $1.00 | $1.00 | $1.00 | $1.00 | $1.00 | $1.00 |
| Income from Investment Operations | | | | | | |
| Net investment income (loss)A | – | – | – | – | – | – |
| Net realized and unrealized gain (loss)A | – | – | – | – | – | – |
| Total from investment operationsA | – | – | – | – | – | – |
| Distributions from net investment incomeA | – | – | – | – | – | – |
| Distributions from net realized gain | – | –A | – | – | – | – |
| Total distributionsA | – | – | – | – | – | – |
| Net asset value, end of period | $1.00 | $1.00 | $1.00 | $1.00 | $1.00 | $1.00 |
| Total ReturnB,C | -% | .01% | .01% | .01% | .01% | .01% |
| Ratios to Average Net AssetsD,E | | | | | | |
| Expenses before reductions | .50%F | .50% | .50% | .50% | .50% | .50% |
| Expenses net of fee waivers, if any | .25%F | .06% | .07% | .11% | .18% | .22% |
| Expenses net of all reductions | .25%F | .06% | .07% | .11% | .18% | .22% |
| Net investment income (loss) | .01%F | .01% | .01% | .01% | .01% | .01% |
| Supplemental Data | | | | | | |
| Net assets, end of period (000 omitted) | $564,115 | $731,701 | $760,467 | $789,696 | $788,486 | $686,162 |
A Amount represents less than $.0005 per share.
B Total returns for periods of less than one year are not annualized.
C Total returns would have been lower if certain expenses had not been reduced during the applicable periods shown.
D Fees and expenses of any underlying Fidelity Central Funds are not included in the Fund's expense ratio. The Fund indirectly bears its proportionate share of the expenses of any underlying Fidelity Central Funds.
E Expense ratios reflect operating expenses of the Fund. Expenses before reductions do not reflect amounts reimbursed or waived or reductions from expense offset arrangements and do not represent the amount paid by the Fund during periods when reimbursements, waivers or reductions occur. Expenses net of fee waivers reflect expenses after reimbursement and waivers but prior to reductions from expense offset arrangements. Expenses net of all reductions represent the net expenses paid by the Fund.
F Annualized
See accompanying notes which are an integral part of the financial statements.
Notes to Financial Statements (Unaudited)
For the period ended June 30, 2016
1. Organization.
Fidelity Pennsylvania Municipal Income Fund (the Income Fund) is a fund of Fidelity Municipal Trust. Fidelity Pennsylvania Municipal Money Market Fund and (the Money Market Fund) is a fund of Fidelity Municipal Trust II. Each Trust is registered under the Investment Company Act of 1940, as amended (the 1940 Act), as an open-end management investment company. Fidelity Municipal Trust and Fidelity Municipal Trust II (the Trusts) are organized as a Massachusetts business trust and a Delaware statutory trust, respectively. Each Fund is authorized to issue an unlimited number of shares. Share transactions on the Statement of Changes in Net Assets may contain exchanges between affiliated funds. Effective January 1, 2016 shares of the Money Market Fund are only available for purchase by retail shareholders. Each Fund may be affected by economic and political developments in the state of Pennsylvania.
2. Investments in Fidelity Central Funds.
The Funds may invest in Fidelity Central Funds, which are open-end investment companies generally available only to other investment companies and accounts managed by the investment adviser and its affiliates. The Funds' Schedules of Investments list each of the Fidelity Central Funds held as of period end, if any, as an investment of each Fund, but do not include the underlying holdings of each Fidelity Central Fund. As an Investing Fund, each Fund indirectly bears its proportionate share of the expenses of the underlying Fidelity Central Funds.
The Money Market Central Funds seek preservation of capital and current income and are managed by Fidelity Investments Money Management, Inc. (FIMM), an affiliate of the investment adviser. Annualized expenses of the Money Market Central Funds as of their most recent shareholder report date are less than .005%.
A complete unaudited list of holdings for each Fidelity Central Fund is available upon request or at the Securities and Exchange Commission (the SEC) website at www.sec.gov. In addition, the financial statements of the Fidelity Central Funds are available on the SEC website or upon request.
3. Significant Accounting Policies.
The financial statements have been prepared in conformity with accounting principles generally accepted in the United States of America (GAAP), which require management to make certain estimates and assumptions at the date of the financial statements. Actual results could differ from those estimates. Subsequent events, if any, through the date that the financial statements were issued have been evaluated in the preparation of the financial statements. The following summarizes the significant accounting policies of the Funds:
Investment Valuation. Investments are valued as of 4:00 p.m. Eastern time on the last calendar day of the period. The Board of Trustees (the Board) has delegated the day to day responsibility for the valuation of the Fund's investments to the Fidelity Management & Research Company (FMR) Fair Value Committee (the Committee). In accordance with valuation policies and procedures approved by the Board, the Income Fund attempts to obtain prices from one or more third party pricing vendors or brokers to value its investments. When current market prices, quotations or currency exchange rates are not readily available or reliable, investments will be fair valued in good faith by the Committee, in accordance with procedures adopted by the Board. Factors used in determining fair value vary by investment type and may include market or investment specific events, changes in interest rates and credit quality. The frequency with which these procedures are used cannot be predicted and they may be utilized to a significant extent. The Committee oversees the Income Fund's valuation policies and procedures and reports to the Board on the Committee's activities and fair value determinations. The Board monitors the appropriateness of the procedures used in valuing the Income Fund's investments and ratifies the fair value determinations of the Committee.
Each Fund categorizes the inputs to valuation techniques used to value its investments into a disclosure hierarchy consisting of three levels as shown below:
- Level 1 – quoted prices in active markets for identical investments
- Level 2 – other significant observable inputs (including quoted prices for similar investments, interest rates, prepayment speeds, etc.)
- Level 3 – unobservable inputs (including the Fund's own assumptions based on the best information available)
Valuation techniques used to value each Fund's investments by major category are as follows:
For the Income Fund, debt securities, including restricted securities, are valued based on evaluated prices received from third party pricing vendors or from brokers who make markets in such securities. Municipal securities are valued by pricing vendors who utilize matrix pricing which considers yield or price of bonds of comparable quality, coupon, maturity and type or by broker-supplied prices. When independent prices are unavailable or unreliable, debt securities may be valued utilizing pricing methodologies which consider similar factors that would be used by third party pricing vendors. Debt securities are generally categorized as Level 2 in the hierarchy but may be Level 3 depending on the circumstances.
For the Money Market Fund, as permitted by compliance with certain conditions under Rule 2a-7 of the 1940 Act, securities are valued at amortized cost, which approximates fair value. The amortized cost of an instrument is determined by valuing it at its original cost and thereafter amortizing any discount or premium from its face value at a constant rate until maturity. Securities held by a money market fund are generally high quality and liquid; however, they are reflected as Level 2 because the inputs used to determine fair value are not quoted prices in an active market.
For the Income Fund, changes in valuation techniques may result in transfers in or out of an assigned level within the disclosure hierarchy.
Investment Transactions and Income. For financial reporting purposes, the Funds' investment holdings and NAV include trades executed through the end of the last business day of the period. The NAV per share for processing shareholder transactions is calculated as of the close of business of the New York Stock Exchange (NYSE), normally 4:00 p.m. Eastern time and includes trades executed through the end of the prior business day for the Income Fund and trades executed through the end of the current business day for the Money Market Fund. Gains and losses on securities sold are determined on the basis of identified cost. Income and capital gain distributions from Fidelity Central Funds, if any, are recorded on the ex-dividend date. Interest income is accrued as earned and includes coupon interest and amortization of premium and accretion of discount on debt securities as applicable. Debt obligations may be placed on non-accrual status and related interest income may be reduced by ceasing current accruals and writing off interest receivables when the collection of all or a portion of interest has become doubtful based on consistently applied procedures. A debt obligation is removed from non-accrual status when the issuer resumes interest payments or when collectability of interest is reasonably assured.
Expenses. Expenses directly attributable to a fund are charged to that fund. Expenses attributable to more than one fund are allocated among the respective funds on the basis of relative net assets or other appropriate methods. Expense estimates are accrued in the period to which they relate and adjustments are made when actual amounts are known.
Income Tax Information and Distributions to Shareholders. Each year, each Fund intends to qualify as a regulated investment company under Subchapter M of the Internal Revenue Code, including distributing substantially all of its taxable income and realized gains. As a result, no provision for U.S. Federal income taxes is required. Each Fund files a U.S. federal tax return, in addition to state and local tax returns as required. Each Fund's federal income tax returns are subject to examination by the Internal Revenue Service (IRS) for a period of three fiscal years after they are filed. State and local tax returns may be subject to examination for an additional fiscal year depending on the jurisdiction.
Dividends are declared and recorded daily and paid monthly from net investment income. Distributions from realized gains, if any, are declared and recorded on the ex-dividend date. Income and capital gain distributions are determined in accordance with income tax regulations, which may differ from GAAP.
Capital accounts within the financial statements are adjusted for permanent book-tax differences. These adjustments have no impact on net assets or the results of operations. Capital accounts are not adjusted for temporary book-tax differences which will reverse in a subsequent period.
Book-tax differences are primarily due to market discount and deferred trustees compensation.
The Funds purchase municipal securities whose interest, in the opinion of the issuer, is free from federal income tax. There is no assurance that the IRS will agree with this opinion. In the event the IRS determines that the issuer does not comply with relevant tax requirements, interest payments from a security could become federally taxable, possibly retroactively to the date the security was issued.
The federal tax cost of investment securities and unrealized appreciation (depreciation) as of period end were as follows for each Fund:
| | Tax cost | Gross unrealized appreciation | Gross unrealized depreciation | Net unrealized appreciation (depreciation) on securities |
| Fidelity Pennsylvania Municipal Income Fund | $438,729,099 | $38,513,441 | $(11,075) | $38,502,366 |
| Fidelity Pennsylvania Municipal Money Market Fund | $562,521,916 | $– | $– | $– |
Short-Term Trading (Redemption) Fees. Shares held by investors in the Income Fund less than 30 days may be subject to a redemption fee equal to .50% of the NAV of shares redeemed. All redemption fees, which reduce the proceeds of the shareholder redemption, are retained by the Fund and accounted for as an addition to paid in capital.
Delayed Delivery Transactions and When-Issued Securities. During the period, the Fund transacted in securities on a delayed delivery or when-issued basis. Payment and delivery may take place after the customary settlement period for that security. The price of the underlying securities and the date when the securities will be delivered and paid for are fixed at the time the transaction is negotiated. The securities purchased on a delayed delivery or when-issued basis are identified as such in each applicable Fund's Schedule of Investments. The Fund may receive compensation for interest forgone in the purchase of a delayed delivery or when-issued security. With respect to purchase commitments, each applicable Fund identifies securities as segregated in its records with a value at least equal to the amount of the commitment. Losses may arise due to changes in the value of the underlying securities or if the counterparty does not perform under the contract's terms, or if the issuer does not issue the securities due to political, economic, or other factors.
Restricted Securities. The Funds may invest in securities that are subject to legal or contractual restrictions on resale. These securities generally may be resold in transactions exempt from registration or to the public if the securities are registered. Disposal of these securities may involve time-consuming negotiations and expense, and prompt sale at an acceptable price may be difficult. Information regarding restricted securities is included at the end of each applicable Fund's Schedule of Investments.
4. Purchases and Sales of Investments.
Purchases and sales of securities, other than short-term securities, for the Income Fund aggregated $48,312,086 and $21,415,573, respectively.
5. Fees and Other Transactions with Affiliates.
Management Fee. Fidelity Management & Research Company (the investment adviser)and its affiliates provide the Income Fund with investment management related services for which the Fund pays a monthly management fee. The management fee is the sum of an individual fund fee rate that is based on an annual rate of .25% of the Fund's average net assets and an annualized group fee rate that averaged .11% during the period. The group fee rate is based upon the average net assets of all the mutual funds advised by the investment adviser, including any mutual funds previously advised by the investment adviser that are currently advised by Fidelity SelectCo, LLC, an affiliate of the investment adviser. The group fee rate decreases as assets under management increase and increases as assets under management decrease. For the reporting period, the total annualized management fee rate was .36% of the Fund's average net assets.
Fidelity Management & Research Company (the investment adviser) and its affiliates provide the Money Market Fund with investment management related services for which the Fund pays a monthly management fee that is based on an annual rate of .50% of the Fund's average net assets. Under the management contract, the investment adviser pays all other expenses, except the compensation of the independent Trustees and certain other expenses such as interest expense. The management fee is reduced by an amount equal to the fees and expenses paid by the Fund to the independent Trustees.
Transfer Agent Fees. Fidelity Investments Institutional Operations Company, Inc. (FIIOC), an affiliate of the investment adviser, is the transfer, dividend disbursing and shareholder servicing agent for the Funds. Under the terms of the management fee contract, the investment adviser pays transfer agent fees on behalf of the Money Market Fund. FIIOC receives account fees and asset-based fees that vary according to account size and type of account. FIIOC pays for typesetting, printing and mailing of shareholder reports, except proxy statements. For the period, the Income Fund's transfer agent fees were equivalent to the following annualized rates expressed as a percentage of average net assets:
| Fidelity Pennsylvania Municipal Income Fund | .08% |
Accounting Fees. Fidelity Service Company, Inc. (FSC), an affiliate of the investment adviser, maintains each Fund's accounting records. The fee is based on the level of average net assets for each month.
Interfund Trades. The Funds may purchase from or sell securities to other Fidelity Funds under procedures adopted by the Board. The procedures have been designed to ensure these interfund trades are executed in accordance with Rule 17a-7 of the 1940 Act. For the Income Fund, interfund trades are included within the respective purchases and sales amounts shown in the Purchases and Sales of Investments note.
6. Committed Line of Credit.
The Income Fund participates with other funds managed by the investment adviser or an affiliate in a $4.25 billion credit facility (the "line of credit") to be utilized for temporary or emergency purposes to fund shareholder redemptions or for other short-term liquidity purposes. The participating funds have agreed to pay commitment fees on their pro-rata portion of the line of credit, which are reflected in Miscellaneous expenses on the Statement of Operations, and are as follows:
| Fidelity Pennsylvania Municipal Income Fund | $423 |
During the period, the Income Fund did not borrow on this line of credit.
7. Expense Reductions.
The investment adviser or its affiliates voluntarily agreed to waive certain fees for the Money Market Fund in order to maintain a minimum annualized yield of .01%. Such arrangements may be discontinued by the investment adviser at any time. For the period, the amount of the waiver was $814,729.
Through arrangements with the Income Fund's custodian, credits realized as a result of certain uninvested cash balances were used to reduce fund expenses. These expense reductions are noted in the table below.
| | Custody
expense
reduction |
| Fidelity Pennsylvania Municipal Income Fund | $1,904 |
In addition, through an arrangement with the Money Market Fund's custodian, $2,682 of credits realized as a result of certain uninvested cash balances were used to reduce the Fund's management fee.
In addition, during the period the investment adviser reimbursed and/or waived a portion of operating expenses as follows:
| | Amount |
| Fidelity Pennsylvania Municipal Income Fund | $950 |
8. Other.
The Funds' organizational documents provide former and current trustees and officers with a limited indemnification against liabilities arising in connection with the performance of their duties to the Funds. In the normal course of business, the Funds may also enter into contracts that provide general indemnifications. The Funds' maximum exposure under these arrangements is unknown as this would be dependent on future claims that may be made against the Funds. The risk of material loss from such claims is considered remote.
Shareholder Expense Example
As a shareholder of a Fund, you incur two types of costs: (1) transaction costs, including redemption fees and (2) ongoing costs, including management fees and other Fund expenses. This Example is intended to help you understand your ongoing costs (in dollars) of investing in the Funds and to compare these costs with the ongoing costs of investing in other mutual funds.
The Example is based on an investment of $1,000 invested at the beginning of the period and held for the entire period (January 1, 2016 to June 30, 2016).
Actual Expenses
The first line of the accompanying table for each fund provides information about actual account values and actual expenses. You may use the information in this line, together with the amount you invested, to estimate the expenses that you paid over the period. Simply divide your account value by $1,000.00 (for example, an $8,600 account value divided by $1,000.00 = 8.6), then multiply the result by the number in the first line for a fund under the heading entitled "Expenses Paid During Period" to estimate the expenses you paid on your account during this period. A small balance maintenance fee of $12.00 that is charged once a year may apply for certain accounts with a value of less than $2,000. This fee is not included in the table below. If it was, the estimate of expenses you paid during the period would be higher, and your ending account value lower, by this amount. In addition, each Fund, as a shareholder in the underlying Fidelity Central Funds, will indirectly bear its pro-rata share of the fees and expenses incurred by the underlying Fidelity Central Funds. These fees and expenses are not included in the Fund's annualized expense ratio used to calculate the expense estimate in the table below.
Hypothetical Example for Comparison Purposes
The second line of the accompanying table for each fund provides information about hypothetical account values and hypothetical expenses based on a fund's actual expense ratio and an assumed rate of return of 5% per year before expenses, which is not the Fund's actual return. The hypothetical account values and expenses may not be used to estimate the actual ending account balance or expenses you paid for the period. You may use this information to compare the ongoing costs of investing in the Fund and other funds. To do so, compare this 5% hypothetical example with the 5% hypothetical examples that appear in the shareholder reports of the other funds. A small balance maintenance fee of $12.00 that is charged once a year may apply for certain accounts with a value of less than $2,000. This fee is not included in the table below. If it was, the estimate of expenses you paid during the period would be higher, and your ending account value lower, by this amount. In addition, each Fund, as a shareholder in the underlying Fidelity Central Funds, will indirectly bear its pro-rata share of the fees and expenses incurred by the underlying Fidelity Central Funds. These fees and expenses are not included in the Fund's annualized expense ratio used to calculate the expense estimate in the table below.
Please note that the expenses shown in the table are meant to highlight your ongoing costs only and do not reflect any transaction costs. Therefore, the second line of the table is useful in comparing ongoing costs only, and will not help you determine the relative total costs of owning different funds. In addition, if these transactional costs were included, your costs would have been higher.
| | Annualized Expense Ratio-A | Beginning
Account Value
January 1, 2016 | Ending
Account Value
June 30, 2016 | Expenses Paid
During Period-B
January 1, 2016
to June 30, 2016 |
| Fidelity Pennsylvania Municipal Income Fund | .49% | | | |
| Actual | | $1,000.00 | $1,043.20 | $2.49 |
| Hypothetical-C | | $1,000.00 | $1,022.43 | $2.46 |
| Fidelity Pennsylvania Municipal Money Market Fund | .25% | | | |
| Actual | | $1,000.00 | $1,000.05 | $1.24 |
| Hypothetical-C | | $1,000.00 | $1,023.62 | $1.26 |
A Annualized expense ratio reflects expenses net of applicable fee waivers.
B Expenses are equal to each Fund's annualized expense ratio, multiplied by the average account value over the period, multiplied by 182/366 (to reflect the one-half year period).
C 5% return per year before expenses
Proxy Voting Results
A special meeting of Fidelity® Pennsylvania Municipal Money Market Fund's shareholders was held on February 12, 2016. The results of votes taken among shareholders on the proposal before them are reported below. Each vote reported represents one dollar of net asset value held on the record date for the meeting.
PROPOSAL 1
| To elect a Board of Trustees. |
| | # of
Votes | % of
Votes |
| Elizabeth S. Acton | | |
| Affirmative | 990,112,248.51 | 94.973 |
| Withheld | 52,412,467.62 | 5.027 |
| TOTAL | 1,042,524,716.13 | 100.000 |
| John Engler | | |
| Affirmative | 979,840,026.26 | 93.988 |
| Withheld | 62,684,689.87 | 6.012 |
| TOTAL | 1,042,524,716.13 | 100.000 |
| Albert R. Gamper, Jr. | | |
| Affirmative | 988,200,285.84 | 94.790 |
| Withheld | 54,324,430.29 | 5.210 |
| TOTAL | 1,042,524,716.13 | 100.000 |
| Robert F. Gartland | | |
| Affirmative | 990,287,516.81 | 94.990 |
| Withheld | 52,237,199.32 | 5.010 |
| TOTAL | 1,042,524,716.13 | 100.000 |
| Abigail P. Johnson | | |
| Affirmative | 986,818,518.63 | 94.657 |
| Withheld | 55,706,197.50 | 5.343 |
| TOTAL | 1,042,524,716.13 | 100.000 |
| Arthur E. Johnson | | |
| Affirmative | 988,490,870.48 | 94.818 |
| Withheld | 54,033,845.65 | 5.182 |
| TOTAL | 1,042,524,716.13 | 100.000 |
| Michael E. Kenneally | | |
| Affirmative | 990,615,595.60 | 95.021 |
| Withheld | 51,909,120.53 | 4.979 |
| TOTAL | 1,042,524,716.13 | 100.000 |
| James H. Keyes | | |
| Affirmative | 989,121,754.10 | 94.878 |
| Withheld | 53,402,962.03 | 5.122 |
| TOTAL | 1,042,524,716.13 | 100.000 |
| Marie L. Knowles | | |
| Affirmative | 987,633,370.10 | 94.735 |
| Withheld | 54,891,346.03 | 5.265 |
| TOTAL | 1,042,524,716.13 | 100.000 |
| Geoffrey A. von Kuhn | | |
| Affirmative | 987,164,185.38 | 94.690 |
| Withheld | 55,360,530.75 | 5.310 |
| TOTAL | 1,042,524,716.13 | 100.000 |
| Proposal 1 reflects trust wide proposal and voting results. |
Corporate Headquarters
245 Summer St.
Boston, MA 02210
www.fidelity.com
PFR-SANN-0816
1.705577.118
Fidelity® Minnesota Municipal Income Fund
Semi-Annual Report June 30, 2016 |
|
Contents
To view a fund's proxy voting guidelines and proxy voting record for the 12-month period ended June 30, visit http://www.fidelity.com/proxyvotingresults or visit the Securities and Exchange Commission's (SEC) web site at http://www.sec.gov.
You may also call 1-800-544-8544 to request a free copy of the proxy voting guidelines.
Standard & Poor's, S&P and S&P 500 are registered service marks of The McGraw-Hill Companies, Inc. and have been licensed for use by Fidelity Distributors Corporation.
Other third-party marks appearing herein are the property of their respective owners.
All other marks appearing herein are registered or unregistered trademarks or service marks of FMR LLC or an affiliated company. © 2016 FMR LLC. All rights reserved.
This report and the financial statements contained herein are submitted for the general information of the shareholders of the Fund. This report is not authorized for distribution to prospective investors in the Fund unless preceded or accompanied by an effective prospectus.
A fund files its complete schedule of portfolio holdings with the SEC for the first and third quarters of each fiscal year on Form N-Q. Forms N-Q are available on the SEC’s web site at http://www.sec.gov. A fund's Forms N-Q may be reviewed and copied at the SEC’s Public Reference Room in Washington, DC. Information regarding the operation of the SEC's Public Reference Room may be obtained by calling 1-800-SEC-0330.
For a complete list of a fund's portfolio holdings, view the most recent holdings listing, semiannual report, or annual report on Fidelity's web site at http://www.fidelity.com, http://www.institutional.fidelity.com, or http://www.401k.com, as applicable.
NOT FDIC INSURED •MAY LOSE VALUE •NO BANK GUARANTEE
Neither the Fund nor Fidelity Distributors Corporation is a bank.
Investment Summary (Unaudited)
Top Five Sectors as of June 30, 2016
| | % of fund's net assets | % of fund's net assets 6 months ago |
| General Obligations | 35.3 | 33.2 |
| Health Care | 22.2 | 23.7 |
| Electric Utilities | 16.5 | 16.9 |
| Education | 9.0 | 8.1 |
| Transportation | 7.5 | 7.9 |
Quality Diversification (% of fund's net assets)
| As of June 30, 2016 |
| | AAA | 5.1% |
| | AA,A | 84.0% |
| | BBB | 7.0% |
| | BB and Below | 0.2% |
| | Not Rated | 3.0% |
| | Short-Term Investments and Net Other Assets | 0.7% |
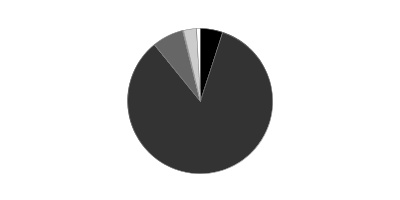
| As of December 31, 2015 |
| | AAA | 3.6% |
| | AA,A | 84.9% |
| | BBB | 8.1% |
| | Not Rated | 1.9% |
| | Short-Term Investments and Net Other Assets | 1.5% |
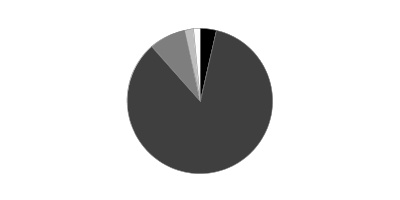
We have used ratings from Moody's Investors Service, Inc. Where Moody's® ratings are not available, we have used S&P® ratings. All ratings are as of the date indicated and do not reflect subsequent changes.
Investments June 30, 2016 (Unaudited)
Showing Percentage of Net Assets
| Municipal Bonds - 99.3% | | | |
| | | Principal Amount | Value |
| Guam - 0.9% | | | |
| Guam Ed. Fing. Foundation Ctfs. of Prtn. Series 2006 A, 5% 10/1/23 | | 1,500,000 | 1,511,520 |
| Guam Int'l. Arpt. Auth. Rev. Series 2013 C: | | | |
| 5% 10/1/17 (a) | | $800,000 | $832,936 |
| 6.25% 10/1/34 (a) | | 850,000 | 1,049,385 |
| Guam Pwr. Auth. Rev. Series 2012 A, 5% 10/1/21 (FSA Insured) | | 1,100,000 | 1,303,830 |
|
| TOTAL GUAM | | | 4,697,671 |
|
| Minnesota - 98.2% | | | |
| Anoka-Hennepin Independent School District 11 Series 2014 A: | | | |
| 5% 2/1/23 | | 805,000 | 982,317 |
| 5% 2/1/24 | | 1,110,000 | 1,378,032 |
| 5% 2/1/25 | | 1,015,000 | 1,252,764 |
| 5% 2/1/26 | | 1,220,000 | 1,491,230 |
| 5% 2/1/27 | | 1,285,000 | 1,553,514 |
| 5% 2/1/28 | | 1,345,000 | 1,620,819 |
| 5% 2/1/29 | | 1,415,000 | 1,693,118 |
| 5% 2/1/34 | | 1,800,000 | 2,118,060 |
| Breckenridge Gen. Oblig. (Catholic Health Initiatives Proj.) Series 2004 A, 5% 5/1/30 | | 4,365,000 | 4,378,401 |
| Burnsville-Eagan-Savage Independent School District #191 Gen. Oblig. (Minnesota School District Cr. Enhancement Prog.) Series 2007 A, 5% 2/1/17 (FSA Insured) | | 525,000 | 538,414 |
| Chaska Elec. Rev.: | | | |
| Series 2015 A: | | | |
| 5% 10/1/27 | | 1,665,000 | 2,095,486 |
| 5% 10/1/29 | | 785,000 | 975,943 |
| 5% 10/1/26 | | 1,000,000 | 1,268,230 |
| Chaska Independent School District #112 Gen. Oblig.: | | | |
| (Cr. Enhancement Prog.): | | | |
| Series 2012 A: | | | |
| 5% 2/1/19 | | 4,090,000 | 4,538,141 |
| 5% 2/1/22 | | 4,975,000 | 6,026,317 |
| Series 2013 A, 4% 2/1/19 | | 4,550,000 | 4,932,883 |
| (Minnesota School District Cr. Enhancement Prog.) Series 2016 A: | | | |
| 5% 2/1/30 | | 1,400,000 | 1,789,354 |
| 5% 2/1/31 | | 3,600,000 | 4,583,088 |
| (School Bldg. Proj.) Series 2007 A, 5% 2/1/17 (Nat'l. Pub. Fin. Guarantee Corp. Insured) | | 750,000 | 769,163 |
| Cloquet Independent School District #94 Series 2015 B: | | | |
| 5% 2/1/28 | | 3,030,000 | 3,810,437 |
| 5% 2/1/31 | | 1,245,000 | 1,546,651 |
| Ctr. City Health Care Facilities (Hazelden Betty Ford Foundation Proj.) Series 2014: | | | |
| 5% 11/1/23 | | 775,000 | 950,297 |
| 5% 11/1/25 | | 250,000 | 308,723 |
| 5% 11/1/26 | | 500,000 | 615,285 |
| 5% 11/1/27 | | 400,000 | 488,112 |
| Duluth Gen. Oblig. Series 2016 A: | | | |
| 5% 2/1/28 | | 1,660,000 | 2,141,898 |
| 5% 2/1/30 | | 1,235,000 | 1,578,466 |
| 5% 2/1/31 | | 1,495,000 | 1,895,750 |
| 5% 2/1/32 | | 2,130,000 | 2,690,339 |
| Duluth Independent School District #709 Ctfs. of Prtn. Series 2009 B: | | | |
| 4% 3/1/17 | | 1,495,000 | 1,520,535 |
| 4% 3/1/18 | | 1,235,000 | 1,285,203 |
| 5% 3/1/30 | | 2,535,000 | 2,650,064 |
| Hennepin County Gen. Oblig. Series 2016 A, 5% 12/1/40 (b) | | 7,200,000 | 9,169,560 |
| Hennepin County Sales Tax Rev. (Ballpark Proj.) Series 2007 A, 5% 12/15/24 | | 1,000,000 | 1,061,870 |
| Jordan Ind. School District Series 2014 A: | | | |
| 5% 2/1/28 | | 1,000,000 | 1,203,600 |
| 5% 2/1/29 | | 1,000,000 | 1,199,480 |
| 5% 2/1/30 | | 1,245,000 | 1,482,285 |
| Lakeville Independent School District #194 Series 2012 D, 5% 2/1/20 | | 1,570,000 | 1,795,609 |
| Maple Grove Health Care Facilities Series 2015: | | | |
| 4% 9/1/35 | | 1,250,000 | 1,325,700 |
| 5% 9/1/28 | | 695,000 | 834,452 |
| 5% 9/1/30 | | 1,500,000 | 1,782,090 |
| 5% 9/1/31 | | 1,300,000 | 1,535,222 |
| 5% 9/1/32 | | 1,000,000 | 1,173,860 |
| Maple Grove Health Care Sys. Rev. (Maple Grove Hosp. Corp. Proj.) Series 2007: | | | |
| 5.25% 5/1/24 | | 1,500,000 | 1,550,370 |
| 5.25% 5/1/25 | | 2,000,000 | 2,065,820 |
| 5.25% 5/1/28 | | 3,720,000 | 3,835,580 |
| Minneapolis & Saint Paul Hsg. & Redev. Auth. Health Care Sys. Rev.: | | | |
| (Children's Health Care Proj.): | | | |
| Series 1995 B, 5% 8/15/25 (FSA Insured) | | 3,000,000 | 3,451,710 |
| Series 2010 A, 5.25% 8/15/25 | | 1,000,000 | 1,167,120 |
| (Children's Hospitals and Clinics Proj.) Series 2004 A1, 5% 8/15/34 (FSA Insured) | | 500,000 | 568,395 |
| Minneapolis & Saint Paul Metropolitan Arpts. Commission Arpt. Rev.: | | | |
| Series 2007 A, 5% 1/1/21 | | 5,000,000 | 5,108,600 |
| Series 2007 B, 5% 1/1/18 (Nat'l. Pub. Fin. Guarantee Corp. Insured) | | 2,000,000 | 2,044,740 |
| Series 2010 D, 5% 1/1/17 (a) | | 4,155,000 | 4,243,792 |
| Series 2012 B: | | | |
| 5% 1/1/26 | | 1,250,000 | 1,491,938 |
| 5% 1/1/27 | | 1,500,000 | 1,785,945 |
| Series 2014 A: | | | |
| 5% 1/1/26 | | 3,015,000 | 3,745,112 |
| 5% 1/1/28 | | 4,000,000 | 4,943,200 |
| 5% 1/1/29 | | 2,150,000 | 2,639,964 |
| 5% 1/1/30 | | 2,000,000 | 2,440,100 |
| 5% 1/1/31 | | 6,020,000 | 7,302,501 |
| Series B, 5% 1/1/20 (Nat'l. Pub. Fin. Guarantee Corp. Insured) | | 2,830,000 | 2,891,326 |
| Minneapolis Health Care Sys. Rev.: | | | |
| Series 2015 A: | | | |
| 5% 11/15/27 (FSA Insured) | | 850,000 | 1,053,524 |
| 5% 11/15/28 | | 1,000,000 | 1,234,670 |
| 5% 11/15/29 | | 1,000,000 | 1,228,030 |
| 5% 11/15/30 | | 1,000,000 | 1,222,370 |
| 5% 11/15/31 | | 3,665,000 | 4,462,797 |
| 5% 11/15/32 | | 2,200,000 | 2,664,508 |
| 6.5% 11/15/38 | | 2,960,000 | 3,325,886 |
| 6.5% 11/15/38 (Pre-Refunded to 11/15/18 @ 100) | | 540,000 | 612,716 |
| Minnesota 911 Rev.: | | | |
| (Pub. Safety Radio Communications Sys. Proj.) Series 2009, 5% 6/1/21 (Assured Guaranty Corp. Insured) | | 2,220,000 | 2,492,438 |
| 5% 6/1/21 | | 2,000,000 | 2,244,220 |
| Minnesota Agric. & Econ. Dev. Board Rev. (Essentia Health Obligated Group Proj.) Series 2008 C1: | | | |
| 5% 2/15/17 (Assured Guaranty Corp. Insured) | | 1,975,000 | 2,026,567 |
| 5% 2/15/30 (Assured Guaranty Corp. Insured) | | 3,750,000 | 4,221,938 |
| 5.25% 2/15/23 (Assured Guaranty Corp. Insured) | | 1,660,000 | 1,895,438 |
| 5.5% 2/15/25 (Assured Guaranty Corp. Insured) | | 2,500,000 | 2,878,475 |
| Minnesota Gen. Oblig.: | | | |
| Series 2008 A, 5% 6/1/21 (Pre-Refunded to 6/1/18 @ 100) | | 3,300,000 | 3,570,996 |
| Series 2010 A, 5% 8/1/27 | | 5,000,000 | 5,797,750 |
| Series 2010 D: | | | |
| 5% 8/1/21 | | 1,000,000 | 1,163,460 |
| 5% 8/1/22 | | 5,000,000 | 5,815,150 |
| 5% 8/1/23 | | 10,000,000 | 11,608,500 |
| Series 2011 B: | | | |
| 5% 10/1/24 | | 2,500,000 | 2,983,475 |
| 5% 10/1/30 | | 3,000,000 | 3,551,700 |
| Series 2013 A, 5% 8/1/25 | | 3,780,000 | 4,797,652 |
| Series 2013 D, 5% 10/1/23 | | 1,100,000 | 1,390,598 |
| Series 2015 A, 5% 8/1/33 | | 1,900,000 | 2,426,737 |
| 5% 8/1/22 (Pre-Refunded to 8/1/17 @ 100) | | 2,545,000 | 2,664,742 |
| 5% 8/1/22 (Pre-Refunded to 8/1/17 @ 100) | | 55,000 | 57,558 |
| 5% 8/1/24 | | 4,780,000 | 5,871,561 |
| 5% 8/1/24 (Pre-Refunded to 8/1/22 @ 100) | | 220,000 | 269,951 |
| 5% 11/1/26 (Pre-Refunded to 11/1/16 @ 100) | | 790,000 | 801,431 |
| Minnesota Higher Ed. Facilities Auth. Rev.: | | | |
| (College of St. Scholastica, Inc. Proj.) Series Seven-H, 5.25% 12/1/35 | | 1,000,000 | 1,114,060 |
| (Gustovus Adolphus College Proj.) Series Seven-B: | | | |
| 5% 10/1/22 | | 2,250,000 | 2,520,540 |
| 5% 10/1/23 | | 1,000,000 | 1,119,900 |
| (Hamline Univ. Proj.) Series Seven-E: | | | |
| 5% 10/1/17 | | 1,565,000 | 1,631,998 |
| 5% 10/1/19 | | 1,000,000 | 1,104,790 |
| (Univ. of St. Thomas Proj.): | | | |
| Series Seven-A, 5% 10/1/39 | | 1,650,000 | 1,825,643 |
| Series Six-X, 5.25% 4/1/39 (Pre-Refunded to 4/1/17 @ 100) | | 1,500,000 | 1,551,705 |
| Series 2015 8J, 5% 3/1/24 | | 1,000,000 | 1,256,250 |
| Series 8 L: | | | |
| 5% 4/1/28 | | 920,000 | 1,162,116 |
| 5% 4/1/29 | | 1,000,000 | 1,258,130 |
| 5% 4/1/35 | | 500,000 | 612,740 |
| Series Eight J, 5% 3/1/26 | | 1,015,000 | 1,273,226 |
| Series G8, 5% 12/1/31 | | 1,000,000 | 1,241,440 |
| Series Seven-Q: | | | |
| 5% 10/1/17 | | 495,000 | 519,196 |
| 5% 10/1/18 | | 400,000 | 433,060 |
| 5% 10/1/19 | | 780,000 | 870,098 |
| 5% 10/1/20 | | 1,140,000 | 1,297,103 |
| 5% 3/1/21 | | 940,000 | 966,207 |
| 5% 3/1/21 (Pre-Refunded to 3/1/17 @ 100) | | 1,375,000 | 1,414,435 |
| 5% 3/1/22 | | 1,030,000 | 1,058,644 |
| 5% 3/1/22 (Pre-Refunded to 3/1/17 @ 100) | | 1,505,000 | 1,548,163 |
| 5% 3/1/27 | | 500,000 | 622,670 |
| Minnesota Hsg. Fin. Agcy. Series 2015 A: | | | |
| 5% 8/1/29 | | 1,000,000 | 1,221,690 |
| 5% 8/1/30 | | 1,000,000 | 1,215,040 |
| 5% 8/1/31 | | 1,000,000 | 1,213,390 |
| 5% 8/1/32 | | 1,000,000 | 1,210,910 |
| 5% 8/1/33 | | 1,000,000 | 1,208,440 |
| Minnesota Muni. Pwr. Agcy. Elec. Rev.: | | | |
| Series 2007, 5.25% 10/1/22 | | 1,000,000 | 1,053,980 |
| Series 2014 A: | | | |
| 5% 10/1/25 | | 200,000 | 250,170 |
| 5% 10/1/26 | | 830,000 | 1,031,009 |
| Series 2014: | | | |
| 5% 10/1/26 | | 630,000 | 782,573 |
| 5% 10/1/27 | | 750,000 | 925,178 |
| 5% 10/1/30 | | 1,000,000 | 1,222,480 |
| Minnesota Pub. Facilities Auth. Rev.: | | | |
| Series 2016 A, 5% 3/1/29 | | 5,000,000 | 6,457,900 |
| 5% 3/1/30 | | 5,150,000 | 6,619,913 |
| Minnesota State Colleges & Univs. Board of Trustees Rev.: | | | |
| Series 2009 A: | | | |
| 4% 10/1/18 | | 1,490,000 | 1,598,889 |
| 4% 10/1/19 | | 1,550,000 | 1,710,224 |
| 4% 10/1/20 | | 1,580,000 | 1,741,192 |
| Series 2011 A, 5% 10/1/30 | | 1,495,000 | 1,757,522 |
| Series 2013 A: | | | |
| 4% 10/1/18 | | 2,210,000 | 2,371,507 |
| 4% 10/1/19 | | 2,300,000 | 2,537,751 |
| 4% 10/1/20 | | 2,385,000 | 2,683,125 |
| Minnesota State Gen. Fdg. Rev.: | | | |
| Series 2012 B: | | | |
| 5% 3/1/27 | | 12,840,000 | 15,459,735 |
| 5% 3/1/28 | | 4,275,000 | 5,139,491 |
| 5% 3/1/29 | | 2,250,000 | 2,699,550 |
| 5% 6/1/27 | | 5,000,000 | 6,206,350 |
| 5% 6/1/38 | | 5,000,000 | 5,987,500 |
| Northern Muni. Pwr. Agcy. Elec. Sys. Rev.: | | | |
| Series 2010 A1: | | | |
| 5% 1/1/19 | | 3,010,000 | 3,315,876 |
| 5% 1/1/20 | | 2,100,000 | 2,387,070 |
| Series 2013 A: | | | |
| 5% 1/1/23 | | 850,000 | 1,036,150 |
| 5% 1/1/24 | | 650,000 | 793,254 |
| 5% 1/1/25 | | 975,000 | 1,183,143 |
| 5% 1/1/31 | | 1,740,000 | 2,036,426 |
| Series 2016: | | | |
| 5% 1/1/28 | | 500,000 | 630,500 |
| 5% 1/1/29 | | 620,000 | 776,947 |
| 5% 1/1/30 | | 520,000 | 648,586 |
| 5% 1/1/31 | | 350,000 | 435,526 |
| Series A, 5% 1/1/18 (Assured Guaranty Corp. Insured) | | 3,180,000 | 3,375,952 |
| Northfield Hosp. Rev. Series 2006: | | | |
| 5.375% 11/1/26 | | 1,000,000 | 1,013,770 |
| 5.5% 11/1/16 | | 1,025,000 | 1,035,988 |
| Ramsey County Gen. Oblig. Series 2012 B: | | | |
| 5% 2/1/19 | | 1,585,000 | 1,758,668 |
| 5% 2/1/20 | | 1,635,000 | 1,876,163 |
| 5% 2/1/21 | | 1,350,000 | 1,595,903 |
| Rochester Elec. Util. Rev.: | | | |
| Series 2007 C: | | | |
| 5% 12/1/30 | | 705,000 | 716,992 |
| 5% 12/1/30 (Pre-Refunded to 12/1/16 @ 100) | | 1,295,000 | 1,318,142 |
| Series 2013 B: | | | |
| 5% 12/1/26 | | 570,000 | 702,542 |
| 5% 12/1/27 | | 275,000 | 336,798 |
| 5% 12/1/28 | | 275,000 | 335,943 |
| 5% 12/1/43 | | 1,000,000 | 1,184,300 |
| Rochester Health Care Facilities Rev.: | | | |
| (Mayo Clinic Proj.) Series 2008 E, 5% 11/15/38 | | 4,000,000 | 4,563,400 |
| (Olmsted Med. Ctr. Proj.) Series 2013: | | | |
| 5% 7/1/17 | | 650,000 | 675,448 |
| 5% 7/1/18 | | 685,000 | 736,217 |
| 5% 7/1/21 | | 790,000 | 917,822 |
| 5% 7/1/22 | | 350,000 | 411,768 |
| 5% 7/1/24 | | 300,000 | 360,573 |
| 5% 7/1/27 | | 245,000 | 288,331 |
| 5% 7/1/28 | | 225,000 | 263,367 |
| 5% 7/1/33 | | 1,225,000 | 1,412,548 |
| Bonds: | | | |
| (Mayo Clinic Proj.): | | | |
| Series 2011, 4%, tender 11/15/18 (c) | | 2,475,000 | 2,657,828 |
| Series B, 4%, tender 11/15/18 (c) | | 3,000,000 | 3,221,610 |
| (Mayo Foundation Proj.) Series C, 4.5%, tender 11/15/21 (c) | | 1,100,000 | 1,282,853 |
| Saint Cloud Health Care Rev.: | | | |
| Series 2014 B, 5% 5/1/22 | | 1,950,000 | 2,355,522 |
| Series 2016 A: | | | |
| 5% 5/1/29 | | 1,000,000 | 1,256,080 |
| 5% 5/1/30 | | 1,000,000 | 1,250,040 |
| 5% 5/1/31 | | 1,000,000 | 1,243,040 |
| 5% 5/1/46 | | 5,000,000 | 6,118,850 |
| 5.125% 5/1/30 | | 310,000 | 354,662 |
| 5.125% 5/1/30 (Pre-Refunded to 5/1/20 @ 100) | | 4,695,000 | 5,441,881 |
| Saint Paul Hsg. & Redev. Auth. Hosp. Rev.: | | | |
| (Healtheast Care Sys. Proj.) Series 2015 A, 5% 11/15/27 | | 2,515,000 | 3,100,417 |
| (HealthEast Care Sys. Proj.) Series 2015 A, 5% 11/15/29 | | 1,750,000 | 2,140,793 |
| (HealthEast Care Sys. Proj.) Series 2015 A, 5% 11/15/30 | | 1,585,000 | 1,931,497 |
| Saint Paul Port Auth. Series 2007-2, 5% 3/1/37 | | 1,500,000 | 1,538,430 |
| Saint Paul Port Auth. Lease Rev.: | | | |
| (Regions Hosp. Package Proj.) Series 2007-1, 5% 8/1/16 | | 500,000 | 501,620 |
| Series 2013, 5% 12/1/21 | | 4,900,000 | 5,857,019 |
| Saint Paul Sales Tax Rev. Series 2014 G: | | | |
| 5% 11/1/26 | | 1,000,000 | 1,247,950 |
| 5% 11/1/28 | | 1,000,000 | 1,231,430 |
| Sartell Independent School District 748: | | | |
| Series 2016 A, 5% 2/1/27 (b) | | 1,825,000 | 2,292,255 |
| Series 2016 B, 5% 2/1/26 (b) | | 1,500,000 | 1,898,955 |
| Shakopee Health Care Facilities Rev. Series 2014: | | | |
| 5% 9/1/23 | | 1,895,000 | 2,297,403 |
| 5% 9/1/24 | | 1,000,000 | 1,230,540 |
| 5% 9/1/25 | | 1,345,000 | 1,644,854 |
| 5% 9/1/26 | | 575,000 | 697,412 |
| 5% 9/1/28 | | 1,000,000 | 1,196,360 |
| 5% 9/1/34 | | 1,040,000 | 1,213,961 |
| Shakopee Independent School District #720: | | | |
| Series 2012, 5% 2/1/21 | | 1,000,000 | 1,177,240 |
| Series 2013 A, 5% 2/1/19 | | 2,940,000 | 3,258,167 |
| Southern Minnesota Muni. Pwr. Agcy. Pwr. Supply Sys. Rev.: | | | |
| (Cap. Appreciation) Series 1994 A: | | | |
| 0% 1/1/19 (Nat'l. Pub. Fin. Guarantee Corp. Insured) | | 6,210,000 | 6,060,898 |
| 0% 1/1/21 (Nat'l. Pub. Fin. Guarantee Corp. Insured) | | 14,670,000 | 13,835,424 |
| 0% 1/1/26 (Nat'l. Pub. Fin. Guarantee Corp. Insured) | | 3,165,000 | 2,640,275 |
| Series 2009 A: | | | |
| 5.25% 1/1/30 (Pre-Refunded to 1/1/19 @ 100) | | 2,000,000 | 2,223,880 |
| 5.5% 1/1/24 (Pre-Refunded to 1/1/19 @ 100) | | 500,000 | 559,045 |
| Series 2015 A: | | | |
| 5% 1/1/28 | | 1,000,000 | 1,268,920 |
| 5% 1/1/34 | | 1,695,000 | 2,091,172 |
| 5% 1/1/36 | | 1,000,000 | 1,226,060 |
| 5% 1/1/41 | | 1,000,000 | 1,218,460 |
| 0% 1/1/18 (AMBAC Insured) | | 125,000 | 123,471 |
| St. Louis Park Health Care Facilities Rev. (Park Nicollet Health Svcs. Proj.) Series 2008 C, 5.5% 7/1/17 (Escrowed to Maturity) | | 535,000 | 560,627 |
| St. Paul Hsg. & Redev. Auth. Health Care Facilities Rev.: | | | |
| (Allina Health Sys. Proj.): | | | |
| Series 2007 A, 5% 11/15/22 (Nat'l. Pub. Fin. Guarantee Corp. Insured) | | 2,100,000 | 2,222,724 |
| Series 2009 A1, 5.25% 11/15/29 | | 3,000,000 | 3,415,740 |
| (HealthPartners Oblig. Group Proj.) Series 2006, 5.25% 5/15/17 (Pre-Refunded to 11/15/16 @ 100) | | 590,000 | 600,101 |
| Series 2007 A, 5% 11/15/19 (Nat'l. Pub. Fin. Guarantee Corp. Insured) | | 1,725,000 | 1,827,034 |
| Series 2009 A2, 5.5% 11/15/24 | | 2,000,000 | 2,307,240 |
| Series 2015 A: | | | |
| 5% 7/1/29 | | 5,000,000 | 6,135,850 |
| 5% 7/1/30 | | 5,000,000 | 6,117,600 |
| Univ. of Minnesota Gen. Oblig.: | | | |
| Series 2009 A: | | | |
| 5% 4/1/23 | | 200,000 | 222,744 |
| 5.125% 4/1/34 | | 1,000,000 | 1,108,750 |
| 5.25% 4/1/29 | | 1,000,000 | 1,119,030 |
| Series 2009 C, 5% 12/1/21 | | 1,000,000 | 1,121,190 |
| Series 2011 D: | | | |
| 5% 12/1/23 | | 1,180,000 | 1,414,560 |
| 5% 12/1/26 | | 1,020,000 | 1,220,991 |
| 5% 12/1/36 | | 2,085,000 | 2,456,401 |
| Series 2016: | | | |
| 5% 4/1/37 | | 2,125,000 | 2,688,529 |
| 5% 4/1/41 | | 3,000,000 | 3,771,390 |
| Univ. of Minnesota Spl. Purp. Rev.: | | | |
| (Biomedical Science Research Facilities Fdg. Prog.) Series 2013 C, 5% 8/1/38 | | 5,275,000 | 6,282,683 |
| (State Supported Biomedical Science Research Facilities Fdg. Prog.) Series 2011 B, 5% 8/1/25 | | 2,095,000 | 2,484,251 |
| Virginia Hsg. & Redev. Auth. Health Care Facility Lease Rev. Series 2005, 5.25% 10/1/25 | | 440,000 | 441,571 |
| West Saint Paul Independent School District #197 Series 2012 A, 4% 2/1/24 | | 3,530,000 | 4,050,675 |
| Western Minnesota Muni. Pwr. Agcy. Pwr. Supply Rev.: | | | |
| Series 2012 A: | | | |
| 5% 1/1/26 | | 5,000,000 | 6,098,450 |
| 5% 1/1/27 | | 2,150,000 | 2,614,916 |
| 5% 1/1/30 | | 1,000,000 | 1,205,940 |
| Series 2014 A: | | | |
| 5% 1/1/31 | | 1,750,000 | 2,161,250 |
| 5% 1/1/35 | | 1,595,000 | 1,947,224 |
| 5% 1/1/40 | | 1,500,000 | 1,812,585 |
| 5% 1/1/46 | | 11,270,000 | 13,514,533 |
| Series 2015 A, 5% 1/1/31 | | 1,820,000 | 2,300,407 |
|
| TOTAL MINNESOTA | | | 536,584,809 |
|
| Virgin Islands - 0.2% | | | |
| Virgin Islands Pub. Fin. Auth. Series 2009 B, 5% 10/1/25 | | 1,000,000 | 1,090,730 |
| TOTAL MUNICIPAL BONDS | | | |
| (Cost $506,836,807) | | | 542,373,210 |
| TOTAL INVESTMENT PORTFOLIO - 99.3% | | | |
| (Cost $506,836,807) | | | 542,373,210 |
| NET OTHER ASSETS (LIABILITIES) - 0.7% | | | 3,766,965 |
| NET ASSETS - 100% | | | $546,140,175 |
Legend
(a) Private activity obligations whose interest is subject to the federal alternative minimum tax for individuals.
(b) Security or a portion of the security purchased on a delayed delivery or when-issued basis.
(c) Coupon rates for floating and adjustable rate securities reflect the rates in effect at period end.
Investment Valuation
All investments are categorized as Level 2 under the Fair Value Hierarchy. The inputs or methodology used for valuing securities may not be an indication of the risk associated with investing in those securities. For more information on valuation inputs please refer to the Investment Valuation section in the accompanying Notes to Financial Statements.
Other Information
The distribution of municipal securities by revenue source, as a percentage of total Net Assets, is as follows (Unaudited):
| General Obligations | 35.3% |
| Health Care | 22.2% |
| Electric Utilities | 16.5% |
| Education | 9.0% |
| Transportation | 7.5% |
| Others* (Individually Less Than 5%) | 9.5% |
| | 100.0% |
* Includes net other assets
See accompanying notes which are an integral part of the financial statements.
Financial Statements
Statement of Assets and Liabilities
| | | June 30, 2016 (Unaudited) |
| Assets | | |
Investment in securities, at value — See accompanying schedule:
Unaffiliated issuers (cost $506,836,807) | | $542,373,210 |
| Cash | | 12,402,207 |
| Receivable for fund shares sold | | 162,002 |
| Interest receivable | | 6,942,835 |
| Other receivables | | 1,020 |
| Total assets | | 561,881,274 |
| Liabilities | | |
| Payable for investments purchased | | |
| Regular delivery | $1,524,330 | |
| Delayed delivery | 13,230,450 | |
| Payable for fund shares redeemed | 434,336 | |
| Distributions payable | 313,673 | |
| Accrued management fee | 161,947 | |
| Other affiliated payables | 50,655 | |
| Other payables and accrued expenses | 25,708 | |
| Total liabilities | | 15,741,099 |
| Net Assets | | $546,140,175 |
| Net Assets consist of: | | |
| Paid in capital | | $508,812,733 |
| Undistributed net investment income | | 114,336 |
| Accumulated undistributed net realized gain (loss) on investments | | 1,676,703 |
| Net unrealized appreciation (depreciation) on investments | | 35,536,403 |
| Net Assets, for 45,313,247 shares outstanding | | $546,140,175 |
| Net Asset Value, offering price and redemption price per share ($546,140,175 ÷ 45,313,247 shares) | | $12.05 |
See accompanying notes which are an integral part of the financial statements.
Statement of Operations
| | | Six months ended June 30, 2016 (Unaudited) |
| Investment Income | | |
| Interest | | $8,048,875 |
| Expenses | | |
| Management fee | $944,262 | |
| Transfer agent fees | 230,375 | |
| Accounting fees and expenses | 66,573 | |
| Custodian fees and expenses | 2,140 | |
| Independent trustees' fees and expenses | 1,191 | |
| Registration fees | 27,452 | |
| Audit | 26,855 | |
| Legal | 302 | |
| Miscellaneous | 970 | |
| Total expenses before reductions | 1,300,120 | |
| Expense reductions | (3,174) | 1,296,946 |
| Net investment income (loss) | | 6,751,929 |
| Realized and Unrealized Gain (Loss) | | |
| Net realized gain (loss) on: | | |
| Investment securities: | | |
| Unaffiliated issuers | | 1,751,493 |
| Total net realized gain (loss) | | 1,751,493 |
| Change in net unrealized appreciation (depreciation) on investment securities | | 11,925,251 |
| Net gain (loss) | | 13,676,744 |
| Net increase (decrease) in net assets resulting from operations | | $20,428,673 |
See accompanying notes which are an integral part of the financial statements.
Statement of Changes in Net Assets
| | Six months ended June 30, 2016 (Unaudited) | Year ended December 31, 2015 |
| Increase (Decrease) in Net Assets | | |
| Operations | | |
| Net investment income (loss) | $6,751,929 | $13,712,614 |
| Net realized gain (loss) | 1,751,493 | 2,126,037 |
| Change in net unrealized appreciation (depreciation) | 11,925,251 | (1,178,690) |
| Net increase (decrease) in net assets resulting from operations | 20,428,673 | 14,659,961 |
| Distributions to shareholders from net investment income | (6,751,223) | (13,710,535) |
| Distributions to shareholders from net realized gain | (86,811) | (2,144,688) |
| Total distributions | (6,838,034) | (15,855,223) |
| Share transactions | | |
| Proceeds from sales of shares | 43,339,507 | 51,680,463 |
| Reinvestment of distributions | 4,868,160 | 11,302,436 |
| Cost of shares redeemed | (21,653,755) | (62,113,437) |
| Net increase (decrease) in net assets resulting from share transactions | 26,553,912 | 869,462 |
| Redemption fees | 3,872 | 3,516 |
| Total increase (decrease) in net assets | 40,148,423 | (322,284) |
| Net Assets | | |
| Beginning of period | 505,991,752 | 506,314,036 |
| End of period | $546,140,175 | $505,991,752 |
| Other Information | | |
| Undistributed net investment income end of period | $114,336 | $113,630 |
| Shares | | |
| Sold | 3,649,599 | 4,399,563 |
| Issued in reinvestment of distributions | 409,479 | 962,635 |
| Redeemed | (1,825,423) | (5,296,254) |
| Net increase (decrease) | 2,233,655 | 65,944 |
See accompanying notes which are an integral part of the financial statements.
Financial Highlights — Fidelity Minnesota Municipal Income Fund
| | Six months ended (Unaudited) June 30, | Years ended December 31, | | | | |
| | 2016 | 2015 | 2014 | 2013 | 2012 | 2011 |
| Selected Per–Share Data | | | | | | |
| Net asset value, beginning of period | $11.75 | $11.77 | $11.39 | $11.99 | $11.80 | $11.25 |
| Income from Investment Operations | | | | | | |
| Net investment income (loss)A | .153 | .317 | .329 | .333 | .371 | .403 |
| Net realized and unrealized gain (loss) | .302 | .030 | .443 | (.559) | .204 | .601 |
| Total from investment operations | .455 | .347 | .772 | (.226) | .575 | 1.004 |
| Distributions from net investment income | (.153) | (.317) | (.329) | (.333) | (.370) | (.403) |
| Distributions from net realized gain | (.002) | (.050) | (.063) | (.041) | (.015) | (.051) |
| Total distributions | (.155) | (.367) | (.392) | (.374) | (.385) | (.454) |
| Redemption fees added to paid in capitalA,B | – | – | – | – | – | – |
| Net asset value, end of period | $12.05 | $11.75 | $11.77 | $11.39 | $11.99 | $11.80 |
| Total ReturnC,D | 3.90% | 3.00% | 6.85% | (1.91)% | 4.91% | 9.09% |
| Ratios to Average Net AssetsE | | | | | | |
| Expenses before reductions | .50%F | .50% | .49% | .50% | .49% | .49% |
| Expenses net of fee waivers, if any | .50%F | .49% | .49% | .50% | .49% | .49% |
| Expenses net of all reductions | .50%F | .49% | .49% | .49% | .49% | .49% |
| Net investment income (loss) | 2.59%F | 2.71% | 2.82% | 2.85% | 3.09% | 3.50% |
| Supplemental Data | | | | | | |
| Net assets, end of period (000 omitted) | $546,140 | $505,992 | $506,314 | $481,013 | $558,353 | $519,092 |
| Portfolio turnover rate | 12%F | 13% | 15% | 14% | 15% | 9% |
A Calculated based on average shares outstanding during the period.
B Amount represents less than $.0005 per share.
C Total returns for periods of less than one year are not annualized.
D Total returns would have been lower if certain expenses had not been reduced during the applicable periods shown.
E Expense ratios reflect operating expenses of the Fund. Expenses before reductions do not reflect amounts reimbursed by the investment adviser or reductions from expense offset arrangements and do not represent the amount paid by the Fund during periods when reimbursements or reductions occur. Expenses net of fee waivers reflect expenses after reimbursement by the investment adviser but prior to reductions from expense offset arrangements. Expenses net of all reductions represent the net expenses paid by the Fund.
F Annualized
See accompanying notes which are an integral part of the financial statements.
Notes to Financial Statements (Unaudited)
For the period ended June 30, 2016
1. Organization.
Fidelity Minnesota Municipal Income Fund (the Fund) is a non-diversified fund of Fidelity Municipal Trust (the Trust) and is authorized to issue an unlimited number of shares. Share transactions on the Statement of Changes in Net Assets may contain exchanges between affiliated funds. The Trust is registered under the Investment Company Act of 1940, as amended (the 1940 Act), as an open-end management investment company organized as a Massachusetts business trust. The Fund may be affected by economic and political developments in the state of Minnesota.
2. Significant Accounting Policies.
The financial statements have been prepared in conformity with accounting principles generally accepted in the United States of America (GAAP), which require management to make certain estimates and assumptions at the date of the financial statements. Actual results could differ from those estimates. Subsequent events, if any, through the date that the financial statements were issued have been evaluated in the preparation of the financial statements. The following summarizes the significant accounting policies of the Fund:
Investment Valuation. Investments are valued as of 4:00 p.m. Eastern time on the last calendar day of the period. The Board of Trustees (the Board) has delegated the day to day responsibility for the valuation of the Fund's investments to the Fidelity Management & Research Company (FMR) Fair Value Committee (the Committee). In accordance with valuation policies and procedures approved by the Board, the Fund attempts to obtain prices from one or more third party pricing vendors or brokers to value its investments. When current market prices, quotations or currency exchange rates are not readily available or reliable, investments will be fair valued in good faith by the Committee, in accordance with procedures adopted by the Board. Factors used in determining fair value vary by investment type and may include market or investment specific events, changes in interest rates and credit quality. The frequency with which these procedures are used cannot be predicted and they may be utilized to a significant extent. The Committee oversees the Fund's valuation policies and procedures and reports to the Board on the Committee's activities and fair value determinations. The Board monitors the appropriateness of the procedures used in valuing the Fund's investments and ratifies the fair value determinations of the Committee.
The Fund categorizes the inputs to valuation techniques used to value its investments into a disclosure hierarchy consisting of three levels as shown below:
- Level 1 – quoted prices in active markets for identical investments
- Level 2 – other significant observable inputs (including quoted prices for similar investments, interest rates, prepayment speeds, etc.)
- Level 3 – unobservable inputs (including the Fund's own assumptions based on the best information available)
Valuation techniques used to value the Fund's investments by major category are as follows:
Debt securities, including restricted securities, are valued based on evaluated prices received from third party pricing vendors or from brokers who make markets in such securities. Municipal securities are valued by pricing vendors who utilize matrix pricing which considers yield or price of bonds of comparable quality, coupon, maturity and type or by broker-supplied prices. When independent prices are unavailable or unreliable, debt securities may be valued utilizing pricing methodologies which consider similar factors that would be used by third party pricing vendors. Debt securities are generally categorized as Level 2 in the hierarchy but may be Level 3 depending on the circumstances.
Changes in valuation techniques may result in transfers in or out of an assigned level within the disclosure hierarchy.
Investment Transactions and Income. For financial reporting purposes, the Fund's investment holdings and net asset value (NAV) include trades executed through the end of the last business day of the period. The NAV per share for processing shareholder transactions is calculated as of the close of business of the New York Stock Exchange (NYSE), normally 4:00 p.m. Eastern time and includes trades executed through the end of the prior business day. Gains and losses on securities sold are determined on the basis of identified cost. Interest income is accrued as earned and includes coupon interest and amortization of premium and accretion of discount on debt securities as applicable. Debt obligations may be placed on non-accrual status and related interest income may be reduced by ceasing current accruals and writing off interest receivables when the collection of all or a portion of interest has become doubtful based on consistently applied procedures. A debt obligation is removed from non-accrual status when the issuer resumes interest payments or when collectability of interest is reasonably assured.
Expenses. Expenses directly attributable to a fund are charged to that fund. Expenses attributable to more than one fund are allocated among the respective funds on the basis of relative net assets or other appropriate methods. Expense estimates are accrued in the period to which they relate and adjustments are made when actual amounts are known.
Income Tax Information and Distributions to Shareholders. Each year, the Fund intends to qualify as a regulated investment company under Subchapter M of the Internal Revenue Code, including distributing substantially all of its taxable income and realized gains. As a result, no provision for U.S. Federal income taxes is required. The Fund files a U.S. federal tax return, in addition to state and local tax returns as required. The Fund's federal income tax returns are subject to examination by the Internal Revenue Service (IRS) for a period of three fiscal years after they are filed. State and local tax returns may be subject to examination for an additional fiscal year depending on the jurisdiction.
Dividends are declared and recorded daily and paid monthly from net investment income. Distributions from realized gains, if any, are declared and recorded on the ex-dividend date. Income and capital gain distributions are determined in accordance with income tax regulations, which may differ from GAAP.
Capital accounts within the financial statements are adjusted for permanent book-tax differences. These adjustments have no impact on net assets or the results of operations. Capital accounts are not adjusted for temporary book-tax differences which will reverse in a subsequent period.
Book-tax differences are primarily due to market discount, deferred trustees compensation and losses deferred due to futures contracts.
The Fund purchases municipal securities whose interest, in the opinion of the issuer, is free from federal income tax. There is no assurance that the IRS will agree with this opinion. In the event the IRS determines that the issuer does not comply with relevant tax requirements, interest payments from a security could become federally taxable, possibly retroactively to the date the security was issued.
The federal tax cost of investment securities and unrealized appreciation (depreciation) as of period end were as follows:
| Gross unrealized appreciation | $35,544,097 |
| Gross unrealized depreciation | (1,397) |
| Net unrealized appreciation (depreciation) on securities | $35,542,700 |
| Tax cost | $506,830,510 |
At the prior fiscal period end, the Fund was required to defer approximately $8,158 of losses on futures contracts.
Short-Term Trading (Redemption) Fees. Shares held by investors in the Fund less than 30 days may have been subject to a redemption fee equal to .50% of the NAV of shares redeemed. All redemption fees, which reduce the proceeds of the shareholder redemption, are retained by the Fund and accounted for as an addition to paid in capital.
Delayed Delivery Transactions and When-Issued Securities. During the period, the Fund transacted in securities on a delayed delivery or when-issued basis. Payment and delivery may take place after the customary settlement period for that security. The price of the underlying securities and the date when the securities will be delivered and paid for are fixed at the time the transaction is negotiated. The securities purchased on a delayed delivery or when-issued basis are identified as such in the Fund's Schedule of Investments. The Fund may receive compensation for interest forgone in the purchase of a delayed delivery or when-issued security. With respect to purchase commitments, the Fund identifies securities as segregated in its records with a value at least equal to the amount of the commitment. Losses may arise due to changes in the value of the underlying securities or if the counterparty does not perform under the contract's terms, or if the issuer does not issue the securities due to political, economic, or other factors.
3. Purchases and Sales of Investments.
Purchases and sales of securities, other than short-term securities, aggregated $63,982,018 and $31,299,061, respectively.
4. Fees and Other Transactions with Affiliates.
Management Fee. Fidelity Management & Research Company (the investment adviser) and its affiliates provide the Fund with investment management related services for which the Fund pays a monthly management fee. The management fee is the sum of an individual fund fee rate that is based on an annual rate of .25% of the Fund's average net assets and an annualized group fee rate that averaged .11% during the period. The group fee rate is based upon the average net assets of all the mutual funds advised by the investment adviser, including any mutual funds previously advised by the investment adviser that are currently advised by Fidelity SelectCo, LLC, an affiliate of the investment adviser. The group fee rate decreases as assets under management increase and increases as assets under management decrease. For the reporting period, the total annualized management fee rate was .36% of the Fund's average net assets.
Transfer Agent Fees. Fidelity Investments Institutional Operations Company, Inc. (FIIOC), an affiliate of the investment adviser, is the transfer, dividend disbursing and shareholder servicing agent for the Fund. FIIOC receives account fees and asset-based fees that vary according to account size and type of account. FIIOC pays for typesetting, printing and mailing of shareholder reports, except proxy statements. For the period, transfer agent fees were equivalent to an annualized rate of .09% of average net assets.
Accounting Fees. Fidelity Service Company, Inc. (FSC), an affiliate of the investment adviser, maintains the Fund's accounting records. The fee is based on the level of average net assets for each month.
Interfund Trades. The Fund may purchase from or sell securities to other Fidelity Funds under procedures adopted by the Board. The procedures have been designed to ensure these interfund trades are executed in accordance with Rule 17a-7 of the 1940 Act. Interfund trades are included within the respective purchases and sales amounts shown in the Purchases and Sales of Investments note.
5. Committed Line of Credit.
The Fund participates with other funds managed by the investment adviser or an affiliate in a $4.25 billion credit facility (the "line of credit") to be utilized for temporary or emergency purposes to fund shareholder redemptions or for other short-term liquidity purposes. The Fund has agreed to pay commitment fees on its pro-rata portion of the line of credit, which amounted to $459 and is reflected in Miscellaneous expenses on the Statement of Operations. During the period, the Fund did not borrow on this line of credit.
6. Expense Reductions.
Through arrangements with the Fund's custodian, credits realized as a result of certain uninvested cash balances were used to reduce the Fund's expenses. During the period, these credits reduced the Fund's custody expenses by $2,140.
In addition, during the period the investment adviser reimbursed and/or waived a portion of operating expenses in the amount of $1,034.
7. Other.
The Fund's organizational documents provide former and current trustees and officers with a limited indemnification against liabilities arising in connection with the performance of their duties to the Fund. In the normal course of business, the Fund may also enter into contracts that provide general indemnifications. The Fund's maximum exposure under these arrangements is unknown as this would be dependent on future claims that may be made against the Fund. The risk of material loss from such claims is considered remote.
Shareholder Expense Example
As a shareholder of the Fund, you incur two types of costs: (1) transaction costs, including redemption fees and (2) ongoing costs, including management fees and other Fund expenses. This Example is intended to help you understand your ongoing costs (in dollars) of investing in the Fund and to compare these costs with the ongoing costs of investing in other mutual funds.
The Example is based on an investment of $1,000 invested at the beginning of the period and held for the entire period (January 1, 2016 to June 30, 2016).
Actual Expenses
The first line of the accompanying table provides information about actual account values and actual expenses. You may use the information in this line, together with the amount you invested, to estimate the expenses that you paid over the period. Simply divide your account value by $1,000.00 (for example, an $8,600 account value divided by $1,000.00 = 8.6), then multiply the result by the number in the first line under the heading entitled "Expenses Paid During Period" to estimate the expenses you paid on your account during this period. A small balance maintenance fee of $12.00 that is charged once a year may apply for certain accounts with a value of less than $2,000. This fee is not included in the table below. If it was, the estimate of expenses you paid during the period would be higher, and your ending account value lower, by this amount.
Hypothetical Example for Comparison Purposes
The second line of the accompanying table provides information about hypothetical account values and hypothetical expenses based on the Fund's actual expense ratio and an assumed rate of return of 5% per year before expenses, which is not the Fund's actual return. The hypothetical account values and expenses may not be used to estimate the actual ending account balance or expenses you paid for the period. You may use this information to compare the ongoing costs of investing in the Fund and other funds. To do so, compare this 5% hypothetical example with the 5% hypothetical examples that appear in the shareholder reports of the other funds. A small balance maintenance fee of $12.00 that is charged once a year may apply for certain accounts with a value of less than $2,000. This fee is not included in the table below. If it was, the estimate of expenses you paid during the period would be higher, and your ending account value lower, by this amount.
Please note that the expenses shown in the table are meant to highlight your ongoing costs only and do not reflect any transaction costs. Therefore, the second line of the table is useful in comparing ongoing costs only, and will not help you determine the relative total costs of owning different funds. In addition, if these transactional costs were included, your costs would have been higher.
| | Annualized Expense Ratio-A | Beginning
Account Value
January 1, 2016 | Ending
Account Value
June 30, 2016 | Expenses Paid
During Period-B
January 1, 2016
to June 30, 2016 |
| Actual | .50% | $1,000.00 | $1,039.00 | $2.53 |
| Hypothetical-C | | $1,000.00 | $1,022.38 | $2.51 |
A Annualized expense ratio reflects expenses net of applicable fee waivers.
B Expenses are equal to the Fund's annualized expense ratio, multiplied by the average account value over the period, multiplied by 182/366 (to reflect the one-half year period).
C 5% return per year before expenses
Corporate Headquarters
245 Summer St.
Boston, MA 02210
www.fidelity.com
MNF-SANN-0816
1.705580.118
Fidelity® Ohio Municipal Income Fund
and
Fidelity® Ohio Municipal Money Market Fund
Semi-Annual Report June 30, 2016 |
|
Contents
To view a fund's proxy voting guidelines and proxy voting record for the 12-month period ended June 30, visit http://www.fidelity.com/proxyvotingresults or visit the Securities and Exchange Commission's (SEC) web site at http://www.sec.gov.
You may also call 1-800-544-8544 to request a free copy of the proxy voting guidelines.
Standard & Poor's, S&P and S&P 500 are registered service marks of The McGraw-Hill Companies, Inc. and have been licensed for use by Fidelity Distributors Corporation.
Other third-party marks appearing herein are the property of their respective owners.
All other marks appearing herein are registered or unregistered trademarks or service marks of FMR LLC or an affiliated company. © 2016 FMR LLC. All rights reserved.
This report and the financial statements contained herein are submitted for the general information of the shareholders of the Fund. This report is not authorized for distribution to prospective investors in the Fund unless preceded or accompanied by an effective prospectus.
A fund files its complete schedule of portfolio holdings with the SEC for the first and third quarters of each fiscal year on Form N-Q. Forms N-Q are available on the SEC’s web site at http://www.sec.gov. A fund's Forms N-Q may be reviewed and copied at the SEC’s Public Reference Room in Washington, DC. Information regarding the operation of the SEC's Public Reference Room may be obtained by calling 1-800-SEC-0330.
For a complete list of a fund's portfolio holdings, view the most recent holdings listing, semiannual report, or annual report on Fidelity's web site at http://www.fidelity.com, http://www.institutional.fidelity.com, or http://www.401k.com, as applicable.
NOT FDIC INSURED •MAY LOSE VALUE •NO BANK GUARANTEE
Neither the Fund nor Fidelity Distributors Corporation is a bank.
Fidelity® Ohio Municipal Income Fund
Investment Summary (Unaudited)
Top Five Sectors as of June 30, 2016
| | % of fund's net assets | % of fund's net assets 6 months ago |
| General Obligations | 32.2 | 35.1 |
| Health Care | 21.3 | 19.4 |
| Education | 21.0 | 19.8 |
| Escrowed/Pre-Refunded | 7.4 | 2.6 |
| Water & Sewer | 5.5 | 4.8 |
Quality Diversification (% of fund's net assets)
| As of June 30, 2016 |
| | AAA | 8.0% |
| | AA,A | 89.0% |
| | BBB | 2.3% |
| | BB and Below | 0.8% |
| | Not Rated | 0.1% |
| | Short-Term Investments and Net Other Assets* | (0.2)% |

* Short-Term Investments and Net Other Assets (Liabilities) are not included in the pie chart
| As of December 31, 2015 |
| | AAA | 9.1% |
| | AA,A | 84.5% |
| | BBB | 3.2% |
| | BB and Below | 0.3% |
| | Short-Term Investments and Net Other Assets | 2.9% |

We have used ratings from Moody's Investors Service, Inc. Where Moody's® ratings are not available, we have used S&P® ratings. All ratings are as of the date indicated and do not reflect subsequent changes.
Fidelity® Ohio Municipal Income Fund
Investments June 30, 2016 (Unaudited)
Showing Percentage of Net Assets
| Municipal Bonds - 100.2% | | | |
| | | Principal Amount | Value |
| Guam - 0.7% | | | |
| Guam Ed. Fing. Foundation Ctfs. of Prtn. Series 2006 A, 5% 10/1/23 | | 1,600,000 | 1,612,288 |
| Guam Int'l. Arpt. Auth. Rev. Series 2013 C: | | | |
| 5% 10/1/18 (a) | | $950,000 | $1,017,830 |
| 6.25% 10/1/34 (a) | | 900,000 | 1,111,113 |
| Guam Pwr. Auth. Rev. Series 2012 A, 5% 10/1/23 (FSA Insured) | | 1,000,000 | 1,201,800 |
|
| TOTAL GUAM | | | 4,943,031 |
|
| Ohio - 99.0% | | | |
| Akron Bath Copley Hosp. District Rev. (Children's Hosp. Med. Ctr. Proj.): | | | |
| Series 2012 5% 11/15/22 | | 1,000,000 | 1,196,190 |
| Series 2012, 5% 11/15/23 | | 3,245,000 | 3,863,562 |
| Allen County Hosp. Facilities Rev. (Catholic Healthcare Partners Proj.) Series 2010 B, 5.25% 9/1/27 | | 5,000,000 | 5,822,250 |
| American Muni. Pwr., Inc. Rev.: | | | |
| (AMP Freemont Energy Ctr. Proj.): | | | |
| Series 2012 B, 5.25% 2/15/26 | | 6,875,000 | 8,285,406 |
| Series 2012: | | | |
| 5% 2/15/25 | | 4,000,000 | 4,757,400 |
| 5.25% 2/15/28 | | 8,040,000 | 9,679,838 |
| (Prairie State Energy Campus Proj.) Series 2015: | | | |
| 5% 2/15/28 | | 3,995,000 | 4,868,387 |
| 5% 2/15/42 | | 3,000,000 | 3,543,960 |
| 5% 2/15/38 | | 240,000 | 253,651 |
| Beavercreek City School District Series 2015: | | | |
| 5% 12/1/28 | | 1,500,000 | 1,880,715 |
| 5% 12/1/29 | | 1,500,000 | 1,874,055 |
| Bowling Green Univ. Gen. Receipts Series 2016 A: | | | |
| 5% 6/1/42 | | 1,000,000 | 1,212,980 |
| 5% 6/1/44 | | 6,080,000 | 7,363,549 |
| Buckeye Tobacco Settlement Fing. Auth. Series 2007 A1, 5% 6/1/17 | | 3,240,000 | 3,362,148 |
| Butler County Hosp. Facilities Rev.: | | | |
| (Kettering Health Network Obligated Group Proj.) Series 2011, 6.375% 4/1/36 | | 5,030,000 | 6,072,618 |
| (UC Health Proj.) Series 2010, 5.5% 11/1/40 | | 3,025,000 | 3,561,091 |
| Butler County Trans. Impt. District Series 2007, 5% 12/1/18 (XL Cap. Assurance, Inc. Insured) | | 1,015,000 | 1,077,585 |
| Cincinnati City School District Ctfs. of Prtn. (Cincinnati City School District School Impt. Proj.) 5% 12/15/26 | | 4,000,000 | 4,966,400 |
| Cincinnati Gen. Oblig.: | | | |
| Series 2009 A: | | | |
| 4.5% 12/1/29 (Pre-Refunded to 6/1/19 @ 100) | | 500,000 | 553,890 |
| 5% 12/1/20 (Pre-Refunded to 6/1/19 @ 100) | | 1,240,000 | 1,391,416 |
| Series 2012 F: | | | |
| 5% 12/1/20 | | 3,045,000 | 3,562,589 |
| 5% 12/1/21 | | 2,765,000 | 3,313,023 |
| Series 2015, 5.25% 12/1/29 | | 4,285,000 | 5,520,408 |
| Cincinnati Wtr. Sys. Rev.: | | | |
| Series 2015 A: | | | |
| 5% 12/1/40 | | 3,260,000 | 4,047,094 |
| 5% 12/1/45 | | 1,665,000 | 2,059,006 |
| Series A, 5% 12/1/36 | | 1,700,000 | 2,009,587 |
| Cleveland Arpt. Sys. Rev. Series 2000 C, 5% 1/1/20 (Pre-Refunded to 1/1/17 @ 100) | | 3,500,000 | 3,576,020 |
| Cleveland Gen. Oblig.: | | | |
| Series 2005, 5.5% 10/1/20 (AMBAC Insured) | | 7,350,000 | 8,701,592 |
| Series 2012, 5% 12/1/25 | | 2,350,000 | 2,856,707 |
| Series 2015: | | | |
| 5% 12/1/26 | | 1,500,000 | 1,906,035 |
| 5% 12/1/27 | | 2,000,000 | 2,525,620 |
| 5% 12/1/29 | | 1,250,000 | 1,567,525 |
| Series C: | | | |
| 5.25% 11/15/20 (Nat'l. Pub. Fin. Guarantee Corp. Insured) | | 1,100,000 | 1,295,789 |
| 5.25% 11/15/21 (Nat'l. Pub. Fin. Guarantee Corp. Insured) | | 1,145,000 | 1,379,656 |
| 5.25% 11/15/22 (Nat'l. Pub. Fin. Guarantee Corp. Insured) | | 1,210,000 | 1,492,438 |
| 5.25% 11/15/23 (Nat'l. Pub. Fin. Guarantee Corp. Insured) | | 1,885,000 | 2,377,192 |
| Cleveland Heights & Univ. Heights County School District Series 2014, 4.5% 12/1/47 | | 3,000,000 | 3,410,760 |
| Cleveland Muni. School District: | | | |
| Series 2013: | | | |
| 5% 12/1/24 | | 1,255,000 | 1,536,785 |
| 5% 12/1/26 | | 4,060,000 | 4,965,989 |
| Series 2015 A: | | | |
| 5% 12/1/24 | | 3,725,000 | 4,596,091 |
| 5% 12/1/27 | | 1,750,000 | 2,124,605 |
| Cleveland Ohio Wtr. Poll. Ctl. Rev. Series 2016: | | | |
| 5% 11/15/34 | | 1,190,000 | 1,453,502 |
| 5% 11/15/35 | | 1,245,000 | 1,516,012 |
| 5% 11/15/36 | | 450,000 | 546,273 |
| 5% 11/15/45 | | 2,000,000 | 2,394,560 |
| Cleveland Parking Facilities Rev. 5.25% 9/15/17 (FSA Insured) | | 3,040,000 | 3,198,962 |
| Cleveland State Univ. Gen. Receipts Series 2012: | | | |
| 5% 6/1/24 | | 1,920,000 | 2,274,048 |
| 5% 6/1/25 | | 2,500,000 | 2,959,550 |
| 5% 6/1/26 | | 3,075,000 | 3,638,494 |
| Cleveland Wtr. Rev.: | | | |
| Series 2012 X, 5% 1/1/42 | | 5,465,000 | 6,408,969 |
| Series 2015 Y: | | | |
| 4% 1/1/28 | | 650,000 | 737,549 |
| 4% 1/1/29 | | 1,040,000 | 1,171,612 |
| 4% 1/1/30 | | 1,000,000 | 1,118,480 |
| Cleveland-Cuyahoga County Port Auth. Dev. Lease Rev. (Administrative Headquarters Proj.) Series 2013, 5% 7/1/37 | | 3,000,000 | 4,088,010 |
| Columbus City School District: | | | |
| (School Facilities Construction and Impt. Proj.) Series 2009 B, 5% 12/1/29 (Pre-Refunded to 12/1/19 @ 100) | | 1,000,000 | 1,137,810 |
| 5% 12/1/30 (b) | | 5,000,000 | 6,322,850 |
| 5% 12/1/31 (b) | | 5,000,000 | 6,297,700 |
| Columbus Gen. Oblig.: | | | |
| Series 2012 A, 4% 2/15/27 | | 10,000,000 | 11,397,500 |
| Series 2014 A, 4% 2/15/28 | | 5,000,000 | 5,771,100�� |
| Columbus Metropolitan Library Facility 5% 12/1/23 | | 1,000,000 | 1,173,750 |
| Cuyahoga Cmnty. College District Gen. Oblig. Series 2009 C: | | | |
| 5% 8/1/25 (Pre-Refunded to 2/1/20 @ 100) | | 1,140,000 | 1,308,150 |
| 5% 8/1/27 (Pre-Refunded to 2/1/20 @ 100) | | 1,200,000 | 1,377,000 |
| Cuyahoga County Gen. Oblig. Series 2012 A: | | | |
| 4% 12/1/27 | | 1,575,000 | 1,748,534 |
| 5% 12/1/25 | | 765,000 | 897,192 |
| Dayton Gen. Oblig.: | | | |
| 4% 12/1/22 | | 750,000 | 844,253 |
| 4% 12/1/25 | | 1,540,000 | 1,731,422 |
| Dayton School District Series 2013, 5% 11/1/22 | | 5,775,000 | 7,028,060 |
| Dublin Gen. Oblig.: | | | |
| 4% 12/1/27 | | 500,000 | 595,230 |
| 4% 12/1/28 | | 395,000 | 468,355 |
| 5% 12/1/26 | | 500,000 | 651,400 |
| Fairfield County Hosp. Facilities Rev. (Fairfield Med. Ctr. Proj.) Series 2013, 5.25% 6/15/43 | | 5,000,000 | 5,656,650 |
| Fairview Park Gen. Oblig. Series 2012: | | | |
| 4% 12/1/22 | | 1,225,000 | 1,421,025 |
| 4% 12/1/23 | | 1,395,000 | 1,628,467 |
| 4% 12/1/24 | | 1,490,000 | 1,734,375 |
| Forest Hills Local School District Series 2015, 5% 12/1/46 | | 5,000,000 | 5,958,650 |
| Franklin County Convention Facilities Auth. Tax & Lease Rev. Series 2014: | | | |
| 5% 12/1/25 | | 1,250,000 | 1,586,263 |
| 5% 12/1/26 | | 3,045,000 | 3,847,723 |
| 5% 12/1/32 | | 5,920,000 | 7,292,434 |
| Franklin County Hosp. Rev. (Nationwide Children's Hosp. Proj.): | | | |
| Series 2009, 5.25% 11/1/40 | | 5,000,000 | 5,627,350 |
| Series A, 5% 11/1/16 | | 265,000 | 268,827 |
| Granville Exempted Village School District: | | | |
| 5% 12/1/26 | | 1,720,000 | 2,200,964 |
| 5% 12/1/27 | | 1,165,000 | 1,481,507 |
| 5% 12/1/30 | | 1,130,000 | 1,420,342 |
| 5% 12/1/31 | | 600,000 | 751,242 |
| Greater Cleveland Reg'l. Transit Auth. Series 2012: | | | |
| 5% 12/1/23 | | 660,000 | 791,195 |
| 5% 12/1/23 (Pre-Refunded to 12/1/21 @ 100) | | 340,000 | 409,761 |
| 5% 12/1/24 | | 1,185,000 | 1,419,867 |
| 5% 12/1/24 (Pre-Refunded to 12/1/21 @ 100) | | 615,000 | 741,186 |
| 5% 12/1/25 (Pre-Refunded to 12/1/21 @ 100) | | 1,170,000 | 1,416,905 |
| Hamilton City School District Series 2015: | | | |
| 3.5% 12/1/31 | | 1,500,000 | 1,613,025 |
| 5% 12/1/26 | | 1,500,000 | 1,880,715 |
| 5% 12/1/28 | | 1,550,000 | 1,925,596 |
| Hamilton County Convention Facilities Auth. Rev. Series 2014: | | | |
| 5% 12/1/26 | | 1,000,000 | 1,222,390 |
| 5% 12/1/27 | | 3,825,000 | 4,651,965 |
| Hamilton County Health Care Facilities Rev. (The Christ Hosp. Proj.) Series 2012: | | | |
| 5.25% 6/1/24 | | 3,000,000 | 3,588,240 |
| 5.25% 6/1/27 | | 3,000,000 | 3,529,290 |
| Hamilton County Hosp. Facilities Rev. (Children's Hosp. Med. Ctr. Proj.) Series 2014 S, 5% 5/15/26 | | 5,000,000 | 6,284,150 |
| Hamilton County Sales Tax Rev. Series 2011 A, 5% 12/1/24 | | 4,870,000 | 5,677,008 |
| Hamilton County Student Hsg. Rev. (Stratford Heights Proj.) Series 2010, 5% 6/1/30 (FSA Insured) | | 2,500,000 | 2,738,775 |
| Hancock County Hosp. Facilities Rev. (Blanchard Valley Reg'l. Health Ctr. Proj.) Series 2011 A: | | | |
| 5% 12/1/21 | | 1,500,000 | 1,748,010 |
| 6.25% 12/1/34 | | 4,100,000 | 4,982,525 |
| Huber Heights City School District Unltd. Tax School Impt. Gen. Oblig. Series 2009, 5% 12/1/36 (Pre-Refunded to 12/1/19 @ 100) | | 1,500,000 | 1,712,145 |
| Kent State Univ. Revs.: | | | |
| Series 2009 B: | | | |
| 5% 5/1/26 | | 335,000 | 370,771 |
| 5% 5/1/28 | | 415,000 | 458,338 |
| 5% 5/1/28 (Pre-Refunded to 5/1/19 @ 100) | | 4,585,000 | 5,130,294 |
| 5% 5/1/29 | | 85,000 | 93,802 |
| 5% 5/1/29 (Pre-Refunded to 5/1/19 @ 100) | | 915,000 | 1,023,821 |
| 5% 5/1/30 | | 95,000 | 104,754 |
| 5% 5/1/30 (Pre-Refunded to 5/1/19 @ 100) | | 1,020,000 | 1,141,309 |
| Series 2012 A: | | | |
| 5% 5/1/24 | | 1,385,000 | 1,658,413 |
| 5% 5/1/25 | | 1,500,000 | 1,795,185 |
| 5% 5/1/26 | | 1,600,000 | 1,912,896 |
| Series 2016: | | | |
| 5% 5/1/29 | | 2,000,000 | 2,552,940 |
| 5% 5/1/30 | | 1,000,000 | 1,271,340 |
| Lake County Hosp. Facilities Rev.: | | | |
| (Lake Hosp. Sys., Inc. Proj.) Series 2008 C: | | | |
| 5% 8/15/16 | | 1,260,000 | 1,266,502 |
| 5% 8/15/17 | | 1,000,000 | 1,046,470 |
| Series 2015, 5% 8/15/45 | | 7,000,000 | 8,090,250 |
| Lakewood City School District Series 2014 C: | | | |
| 5% 12/1/25 | | 1,300,000 | 1,643,876 |
| 5% 12/1/27 | | 3,215,000 | 4,002,546 |
| Lancaster Ohio City School District Series 2012: | | | |
| 5% 10/1/37 | | 2,000,000 | 2,416,520 |
| 5% 10/1/49 | | 3,000,000 | 3,424,890 |
| Lucas County Hosp. Rev.: | | | |
| (ProMedica Healthcare Oblig. Group Proj.): | | | |
| Series 2008 D, 5% 11/15/38 | | 1,090,000 | 1,180,699 |
| Series 2011 A, 6.5% 11/15/37 | | 2,800,000 | 3,506,692 |
| Series 2011 D: | | | |
| 5% 11/15/22 | | 1,000,000 | 1,191,470 |
| 5% 11/15/25 | | 5,000,000 | 5,945,900 |
| Lucas-Plaza Hsg. Dev. Corp. Mtg. Rev. (The Plaza Section 8 Assisted Proj.) Series 1991 A, 0% 6/1/24 (Escrowed to Maturity) | | 9,000,000 | 7,953,660 |
| Miami Univ. Series 2012, 4% 9/1/28 | | 2,195,000 | 2,464,129 |
| Miamisburg City School District Series 2016: | | | |
| 4% 12/1/32 | | 510,000 | 585,715 |
| 5% 12/1/28 | | 500,000 | 638,320 |
| 5% 12/1/29 | | 300,000 | 381,504 |
| Middleburg Heights Hosp. Rev.: | | | |
| Series 2011, 5.25% 8/1/41 | | 3,000,000 | 3,395,040 |
| Series 2012 A, 5% 8/1/47 | | 10,725,000 | 12,161,394 |
| Milford Exempt Village School District Series 2015: | | | |
| 3.5% 12/1/31 | | 500,000 | 542,175 |
| 5% 12/1/28 | | 1,400,000 | 1,768,298 |
| Montgomery County Rev. (Catholic Health Initiatives Proj.) Series 2008 D, 6.25% 10/1/33 | | 2,500,000 | 2,794,200 |
| Muskingum County Hosp. Facilities (Genesis Healthcare Sys. Obligated Group Proj.) Series 2013, 5% 2/15/48 | | 2,000,000 | 2,176,780 |
| North Olmsted City School District Series 2015 A: | | | |
| 5% 12/1/26 | | 665,000 | 829,075 |
| 5% 12/1/27 | | 220,000 | 272,714 |
| 5% 12/1/28 | | 365,000 | 451,304 |
| 5% 12/1/29 | | 500,000 | 616,655 |
| 5% 12/1/30 | | 750,000 | 923,220 |
| Northeast Ohio Reg'l. Swr. District Wastewtr. Rev. Series 2014, 5% 11/15/44 | | 8,815,000 | 10,734,907 |
| Northmont City School District Series 2012 A, 5% 11/1/49 | | 5,000,000 | 5,685,550 |
| Northwest Local School District Series 2015, 5% 12/1/45 | | 2,880,000 | 3,460,723 |
| Ohio Air Quality Dev. Auth. Rev.: | | | |
| Bonds (FirstEnergy Nuclear Generation Proj.) Series 2008 C, 3.95%, tender 5/1/20 (a)(c) | | 2,000,000 | 2,046,940 |
| Series 2009 C, 5.625% 6/1/18 | | 2,600,000 | 2,750,982 |
| Ohio Bldg. Auth. (Adult Correctional Bldg. Fund Proj.): | | | |
| Series 2009 B, 5% 10/1/24 | | 1,790,000 | 2,015,576 |
| Series 2010 A, 5% 10/1/24 | | 6,030,000 | 6,995,222 |
| Ohio Gen. Oblig.: | | | |
| (Mental Health Facilities Impt. Fund Proj.) Series 2013 A, 5% 2/1/21 | | 2,085,000 | 2,449,458 |
| Series 2011, 5.25% 9/1/23 (Pre-Refunded to 9/1/20 @ 100) | | 2,000,000 | 2,356,500 |
| Series 2012 A: | | | |
| 5% 2/1/26 | | 1,000,000 | 1,188,510 |
| 5% 2/1/27 | | 5,000,000 | 5,934,450 |
| Series 2012 B, 5% 3/15/25 (Pre-Refunded to 9/15/21 @ 100) | | 7,500,000 | 9,013,950 |
| Series 2014 C, 4% 3/1/25 | | 7,650,000 | 8,846,001 |
| Series 2015 C, 5% 11/1/28 | | 5,955,000 | 7,597,210 |
| Series Q, 5% 4/1/25 | | 1,845,000 | 2,205,956 |
| 5.375% 9/1/23 (Pre-Refunded to 3/1/18 @ 100) | | 370,000 | 398,497 |
| 5.375% 9/1/28 (Pre-Refunded to 3/1/18 @ 100) | | 4,560,000 | 4,915,178 |
| Ohio Higher Edl. Facility Commission Rev.: | | | |
| (Case Western Reserve Univ. Proj.) Series 1990 B, 6.5% 10/1/20 | | 1,930,000 | 2,154,247 |
| (Cleveland Clinic Foundation Proj.) Series 2008 A: | | | |
| 5.25% 1/1/33 | | 1,635,000 | 1,746,082 |
| 5.5% 1/1/43 | | 3,500,000 | 3,750,635 |
| (Denison Univ. 2015 Proj.): | | | |
| 5% 11/1/28 | | 1,465,000 | 1,817,362 |
| 5% 11/1/29 | | 1,250,000 | 1,544,963 |
| 5% 11/1/30 | | 2,285,000 | 2,815,897 |
| (Kenyon College 2015 Proj.) 5% 7/1/41 | | 5,000,000 | 5,996,000 |
| (Kenyon College Proj.) Series 2010, 5.25% 7/1/44 | | 2,750,000 | 3,126,998 |
| (Univ. Hosp. Health Sys. Proj.) Series 2010 A, 5.25% 1/15/23 | | 2,500,000 | 2,840,075 |
| (Univ. of Dayton Proj.): | | | |
| Series 2009, 5.5% 12/1/36 | | 5,000,000 | 5,508,900 |
| Series 2013: | | | |
| 5% 12/1/23 | | 540,000 | 650,576 |
| 5% 12/1/24 | | 585,000 | 704,790 |
| 5% 12/1/25 | | 1,000,000 | 1,208,820 |
| 5% 12/1/26 | | 1,195,000 | 1,445,353 |
| 5% 12/1/27 | | 2,300,000 | 2,775,617 |
| (Xavier Univ. Proj.) Series 2015 C: | | | |
| 5% 5/1/26 | | 1,000,000 | 1,222,420 |
| 5% 5/1/28 | | 1,000,000 | 1,209,940 |
| 5% 5/1/29 | | 855,000 | 1,030,720 |
| 5% 5/1/31 | | 1,005,000 | 1,206,241 |
| Ohio Hosp. Facilities Rev.: | | | |
| (Cleveland Clinic Proj.) Series 2009 A, 5.5% 1/1/39 | | 7,000,000 | 7,822,990 |
| Series 2011 A, 5% 1/1/32 | | 3,500,000 | 4,036,130 |
| Ohio Hosp. Rev.: | | | |
| Series 2013 A, 5% 1/15/27 | | 5,000,000 | 5,953,700 |
| 5% 1/15/41 | | 5,000,000 | 6,030,100 |
| 5% 1/15/46 | | 5,000,000 | 6,002,000 |
| Ohio State Univ. Gen. Receipts: | | | |
| Series 2009 A, 5% 12/1/26 | | 2,000,000 | 2,205,040 |
| Series 2010 D, 5% 12/1/31 | | 1,365,000 | 1,901,104 |
| Series 2012 A: | | | |
| 4% 6/1/27 | | 1,270,000 | 1,524,572 |
| 5% 6/1/24 | | 1,690,000 | 2,153,787 |
| Series 2013 A: | | | |
| 5% 6/1/28 | | 2,000,000 | 2,451,480 |
| 5% 6/1/38 | | 3,500,000 | 4,206,265 |
| Ohio Tpk. Commission Tpk. Rev.: | | | |
| (Infastructure Proj.) Series 2005 A, 0% 2/15/43 | | 10,000,000 | 4,045,700 |
| Series 2010 A, 5% 2/15/31 | | 5,475,000 | 6,186,750 |
| Ohio Univ. Gen. Receipts Athens: | | | |
| Series 2013: | | | |
| 5% 12/1/23 | | 1,000,000 | 1,219,720 |
| 5% 12/1/24 | | 5,075,000 | 6,186,628 |
| Series A, 5% 12/1/33 (FSA Insured) | | 1,190,000 | 1,274,573 |
| Ohio Wtr. Dev. Auth. Rev.: | | | |
| (Fresh Wtr. Impt. Proj.) Series 2009 B, 5% 12/1/24 | | 1,025,000 | 1,299,598 |
| (Fresh Wtr. Proj.) Series 2009 B, 5% 12/1/25 | | 1,950,000 | 2,518,269 |
| (Pure Wtr. Proj.) Series I, 6% 12/1/16 (Escrowed to Maturity) | | 135,000 | 138,011 |
| Ohio Wtr. Dev. Auth. Wtr. Poll. Cont. Rev. (Wtr. Quality Proj.) Series 2010 A: | | | |
| 5% 12/1/29 (Pre-Refunded to 12/1/19 @ 100) | | 2,000,000 | 2,282,860 |
| 5% 6/1/30 (Pre-Refunded to 12/1/19 @ 100) | | 1,000,000 | 1,141,430 |
| Olentangy Local School District: | | | |
| 5% 12/1/17 (b) | | 1,955,000 | 2,044,617 |
| 5% 12/1/30 (b) | | 1,500,000 | 1,893,615 |
| 5% 12/1/32 (b) | | 1,275,000 | 1,597,295 |
| Princeton City School District Series 2014: | | | |
| 0% 12/1/40 | | 4,000,000 | 2,063,920 |
| 0% 12/1/41 | | 4,000,000 | 1,954,080 |
| 5% 12/1/39 | | 2,750,000 | 3,377,990 |
| Reynoldsburg City School District: | | | |
| (School Facilities Construction & Impt. Proj.) 0% 12/1/17 | | 1,250,000 | 1,230,225 |
| 4% 12/1/30 | | 4,625,000 | 5,266,626 |
| Ross County Hosp. Facilities Rev. (Adena Health Sys. Proj.) Series 2008, 5.75% 12/1/35 | | 2,600,000 | 2,889,172 |
| Scioto County Hosp. Facilities Rev. Series 2016: | | | |
| 5% 2/15/28 | | 5,030,000 | 6,263,406 |
| 5% 2/15/30 | | 2,145,000 | 2,645,836 |
| 5% 2/15/32 | | 1,625,000 | 1,988,708 |
| 5% 2/15/33 | | 1,460,000 | 1,779,769 |
| 5% 2/15/34 | | 1,000,000 | 1,214,240 |
| South-Western City School District Franklin & Pickway County Series 2012 B, 5% 12/1/36 | | 2,000,000 | 2,404,000 |
| Springboro Cmnty. City School District 5.25% 12/1/20 (FSA Insured) | | 2,780,000 | 3,249,681 |
| St. Marys City School District 5% 12/1/35 (Pre-Refunded to 6/1/18 @ 100) | | 495,000 | 536,144 |
| Strongsville Gen. Oblig. (Street Impt. Proj.) Series 2009, 5% 12/1/27 (Pre-Refunded to 12/1/19 @ 100) | | 1,680,000 | 1,920,643 |
| Toledo Gen. Oblig. Series 2012 A, 5% 12/1/20 | | 1,635,000 | 1,898,366 |
| Univ. of Akron Gen. Receipts: | | | |
| Series 2015 A, 5% 1/1/31 | | 4,000,000 | 4,859,240 |
| Series 2016 A: | | | |
| 5% 1/1/23 | | 460,000 | 560,423 |
| 5% 1/1/24 | | 955,000 | 1,183,216 |
| 5% 1/1/25 | | 1,025,000 | 1,285,719 |
| 5% 1/1/33 | | 2,535,000 | 3,127,303 |
| 5% 1/1/37 | | 6,000,000 | 7,306,440 |
| Univ. of Cincinnati Gen. Receipts: | | | |
| Series 2008 C: | | | |
| 5% 6/1/22 (FSA Insured) | | 1,000,000 | 1,080,340 |
| 5% 6/1/23 (FSA Insured) | | 2,000,000 | 2,159,080 |
| 5% 6/1/24 (FSA Insured) | | 2,000,000 | 2,158,300 |
| Series 2010 F, 5% 6/1/32 | | 2,000,000 | 2,312,840 |
| Series 2012 A: | | | |
| 5% 6/1/22 | | 2,000,000 | 2,431,820 |
| 5% 6/1/23 | | 2,000,000 | 2,419,140 |
| Series 2012 C: | | | |
| 4% 6/1/28 | | 2,000,000 | 2,252,040 |
| 5% 6/1/24 | | 1,230,000 | 1,514,659 |
| Series 2013 A: | | | |
| 5% 6/1/33 | | 4,085,000 | 4,944,647 |
| 5% 6/1/34 | | 5,130,000 | 6,191,038 |
| Series 2016 A: | | | |
| 5% 6/1/32 | | 745,000 | 941,047 |
| 5% 6/1/33 | | 800,000 | 1,006,440 |
| 5% 6/1/34 | | 585,000 | 732,987 |
| Series 2016 C: | | | |
| 5% 6/1/41 | | 2,585,000 | 3,194,750 |
| 5% 6/1/46 | | 5,500,000 | 6,769,950 |
| Willoughby-Eastlake City School District Series 2016, 5% 12/1/46 | | 4,000,000 | 4,855,640 |
| Wood County Hosp. Facilities Rev. (Hosp. Proj.) Series 2012, 5% 12/1/27 | | 3,500,000 | 3,900,610 |
| Wright State Univ. Gen. Receipts Series 2011 A, 5% 5/1/23 | | 2,665,000 | 3,092,999 |
|
| TOTAL OHIO | | | 705,491,311 |
|
| Virgin Islands - 0.5% | | | |
| Virgin Islands Pub. Fin. Auth.: | | | |
| (Cruzan Proj.) Series 2009 A, 6% 10/1/39 | | 1,000,000 | 1,115,210 |
| Series 2009 A, 6.75% 10/1/37 | | 1,000,000 | 1,141,830 |
| Series 2009 B, 5% 10/1/25 | | 1,000,000 | 1,090,730 |
|
| TOTAL VIRGIN ISLANDS | | | 3,347,770 |
|
| TOTAL MUNICIPAL BONDS | | | |
| (Cost $653,609,529) | | | 713,782,112 |
| TOTAL INVESTMENT PORTFOLIO - 100.2% | | | |
| (Cost $653,609,529) | | | 713,782,112 |
| NET OTHER ASSETS (LIABILITIES) - (0.2)% | | | (1,562,092) |
| NET ASSETS - 100% | | | $712,220,020 |
Legend
(a) Private activity obligations whose interest is subject to the federal alternative minimum tax for individuals.
(b) Security or a portion of the security purchased on a delayed delivery or when-issued basis.
(c) Coupon rates for floating and adjustable rate securities reflect the rates in effect at period end.
Investment Valuation
All investments are categorized as Level 2 under the Fair Value Hierarchy. The inputs or methodology used for valuing securities may not be an indication of the risk associated with investing in those securities. For more information on valuation inputs please refer to the Investment Valuation section in the accompanying Notes to Financial Statements.
Other Information
The distribution of municipal securities by revenue source, as a percentage of total Net Assets, is as follows (Unaudited):
| General Obligations | 32.2% |
| Health Care | 21.3% |
| Education | 21.0% |
| Escrowed/Pre-Refunded | 7.4% |
| Water & Sewer | 5.5% |
| Electric Utilities | 5.4% |
| Special Tax | 5.1% |
| Others* (Individually Less Than 5%) | 2.1% |
| | 100.0% |
* Includes net other assets
See accompanying notes which are an integral part of the financial statements.
Fidelity® Ohio Municipal Income Fund
Financial Statements
Statement of Assets and Liabilities
| | | June 30, 2016 (Unaudited) |
| Assets | | |
Investment in securities, at value — See accompanying schedule:
Unaffiliated issuers (cost $653,609,529) | | $713,782,112 |
| Cash | | 10,787,612 |
| Receivable for fund shares sold | | 182,994 |
| Interest receivable | | 5,796,223 |
| Other receivables | | 1,230 |
| Total assets | | 730,550,171 |
| Liabilities | | |
| Payable for investments purchased on a delayed delivery basis | $17,199,066 | |
| Payable for fund shares redeemed | 214,307 | |
| Distributions payable | 618,555 | |
| Accrued management fee | 210,809 | |
| Other affiliated payables | 61,499 | |
| Other payables and accrued expenses | 25,915 | |
| Total liabilities | | 18,330,151 |
| Net Assets | | $712,220,020 |
| Net Assets consist of: | | |
| Paid in capital | | $651,157,990 |
| Undistributed net investment income | | 104,892 |
| Accumulated undistributed net realized gain (loss) on investments | | 784,555 |
| Net unrealized appreciation (depreciation) on investments | | 60,172,583 |
| Net Assets, for 55,920,533 shares outstanding | | $712,220,020 |
| Net Asset Value, offering price and redemption price per share ($712,220,020 ÷ 55,920,533 shares) | | $12.74 |
See accompanying notes which are an integral part of the financial statements.
Statement of Operations
| | | Six months ended June 30, 2016 (Unaudited) |
| Investment Income | | |
| Interest | | $10,897,482 |
| Expenses | | |
| Management fee | $1,212,771 | |
| Transfer agent fees | 278,764 | |
| Accounting fees and expenses | 78,182 | |
| Custodian fees and expenses | 2,408 | |
| Independent trustees' fees and expenses | 1,528 | |
| Registration fees | 19,955 | |
| Audit | 26,855 | |
| Legal | 370 | |
| Miscellaneous | 462 | |
| Total expenses before reductions | 1,621,295 | |
| Expense reductions | (3,693) | 1,617,602 |
| Net investment income (loss) | | 9,279,880 |
| Realized and Unrealized Gain (Loss) | | |
| Net realized gain (loss) on: | | |
| Investment securities: | | |
| Unaffiliated issuers | | 970,369 |
| Total net realized gain (loss) | | 970,369 |
| Change in net unrealized appreciation (depreciation) on investment securities | | 23,805,894 |
| Net gain (loss) | | 24,776,263 |
| Net increase (decrease) in net assets resulting from operations | | $34,056,143 |
See accompanying notes which are an integral part of the financial statements.
Statement of Changes in Net Assets
| | Six months ended June 30, 2016 (Unaudited) | Year ended December 31, 2015 |
| Increase (Decrease) in Net Assets | | |
| Operations | | |
| Net investment income (loss) | $9,279,880 | $18,071,800 |
| Net realized gain (loss) | 970,369 | 6,373,031 |
| Change in net unrealized appreciation (depreciation) | 23,805,894 | 555,975 |
| Net increase (decrease) in net assets resulting from operations | 34,056,143 | 25,000,806 |
| Distributions to shareholders from net investment income | (9,277,693) | (18,067,795) |
| Distributions to shareholders from net realized gain | (421,060) | (5,977,113) |
| Total distributions | (9,698,753) | (24,044,908) |
| Share transactions | | |
| Proceeds from sales of shares | 79,536,931 | 88,241,729 |
| Reinvestment of distributions | 5,839,102 | 14,230,292 |
| Cost of shares redeemed | (33,775,877) | (65,862,421) |
| Net increase (decrease) in net assets resulting from share transactions | 51,600,156 | 36,609,600 |
| Redemption fees | 1,723 | 1,406 |
| Total increase (decrease) in net assets | 75,959,269 | 37,566,904 |
| Net Assets | | |
| Beginning of period | 636,260,751 | 598,693,847 |
| End of period | $712,220,020 | $636,260,751 |
| Other Information | | |
| Undistributed net investment income end of period | $104,892 | $102,705 |
| Shares | | |
| Sold | 6,370,354 | 7,188,823 |
| Issued in reinvestment of distributions | 467,106 | 1,158,778 |
| Redeemed | (2,704,153) | (5,384,173) |
| Net increase (decrease) | 4,133,307 | 2,963,428 |
See accompanying notes which are an integral part of the financial statements.
Financial Highlights — Fidelity Ohio Municipal Income Fund
| | Six months ended (Unaudited) June 30, | Years ended December 31, | | | | |
| | 2016 | 2015 | 2014 | 2013 | 2012 | 2011 |
| Selected Per–Share Data | | | | | | |
| Net asset value, beginning of period | $12.29 | $12.26 | $11.48 | $12.39 | $12.01 | $11.38 |
| Income from Investment Operations | | | | | | |
| Net investment income (loss)A | .172 | .363 | .384 | .392 | .421 | .443 |
| Net realized and unrealized gain (loss) | .458 | .147 | .780 | (.779) | .426 | .630 |
| Total from investment operations | .630 | .510 | 1.164 | (.387) | .847 | 1.073 |
| Distributions from net investment income | (.172) | (.363) | (.384) | (.392) | (.420) | (.443) |
| Distributions from net realized gain | (.008) | (.117) | – | (.131) | (.047) | – |
| Total distributions | (.180) | (.480) | (.384) | (.523) | (.467) | (.443) |
| Redemption fees added to paid in capitalA,B | – | – | – | – | – | – |
| Net asset value, end of period | $12.74 | $12.29 | $12.26 | $11.48 | $12.39 | $12.01 |
| Total ReturnC,D | 5.17% | 4.24% | 10.26% | (3.16)% | 7.14% | 9.62% |
| Ratios to Average Net AssetsE | | | | | | |
| Expenses before reductions | .49%F | .48% | .48% | .48% | .49% | .49% |
| Expenses net of fee waivers, if any | .48%F | .48% | .48% | .48% | .49% | .49% |
| Expenses net of all reductions | .48%F | .48% | .48% | .48% | .49% | .49% |
| Net investment income (loss) | 2.78%F | 2.97% | 3.20% | 3.28% | 3.42% | 3.81% |
| Supplemental Data | | | | | | |
| Net assets, end of period (000 omitted) | $712,220 | $636,261 | $598,694 | $535,347 | $647,324 | $554,942 |
| Portfolio turnover rate | 5%F | 17% | 7% | 17% | 14% | 8% |
A Calculated based on average shares outstanding during the period.
B Amount represents less than $.0005 per share.
C Total returns for periods of less than one year are not annualized.
D Total returns would have been lower if certain expenses had not been reduced during the applicable periods shown.
E Expense ratios reflect operating expenses of the Fund. Expenses before reductions do not reflect amounts reimbursed by the investment adviser or reductions from expense offset arrangements and do not represent the amount paid by the Fund during periods when reimbursements or reductions occur. Expenses net of fee waivers reflect expenses after reimbursement by the investment adviser but prior to reductions from expense offset arrangements. Expenses net of all reductions represent the net expenses paid by the Fund.
F Annualized
See accompanying notes which are an integral part of the financial statements.
Fidelity® Ohio Municipal Money Market Fund
Investment Summary/Performance (Unaudited)
Effective Maturity Diversification
| Days | % of fund's investments 6/30/16 | % of fund's investments 12/31/15 | % of fund's investments 6/30/15 |
| 1 - 7 | 68.1 | 70.9 | 75.0 |
| 8 - 30 | 6.5 | 2.2 | 0.6 |
| 31 - 60 | 3.0 | 5.5 | 4.6 |
| 61 - 90 | 7.6 | 3.5 | 1.7 |
| 91 - 180 | 4.1 | 7.2 | 7.7 |
| > 180 | 10.7 | 10.7 | 10.4 |
Effective maturity is determined in accordance with the requirements of Rule 2a-7 under the Investment Company Act of 1940.
Asset Allocation (% of fund's net assets)
| As of June 30, 2016 |
| | Variable Rate Demand Notes (VRDNs) | 53.9% |
| | Tender Option Bond | 5.0% |
| | Other Municipal Security | 35.6% |
| | Investment Companies | 7.4% |
| | Net Other Assets (Liabilities)* | (1.9)% |

* Short-Term Investments and Net Other Assets (Liabilities) are not included in the pie chart
| As of December 31, 2015 |
| | Variable Rate Demand Notes (VRDNs) | 54.1% |
| | Tender Option Bond | 1.3% |
| | Other Municipal Security | 28.3% |
| | Investment Companies | 2.0% |
| | Net Other Assets (Liabilities) | 14.3% |

Current And Historical 7-Day Yields
| | 6/30/16 | 3/31/16 | 12/31/15 | 09/30/15 | 06/30/15 |
| Fidelity® Ohio Municipal Money Market Fund | 0.01% | 0.01% | 0.01% | 0.01% | 0.01% |
Yield refers to the income paid by the Fund over a given period. Yields for money market funds are usually for seven-day periods, as they are here, though they are expressed as annual percentage rates. Past performance is no guarantee of future results. Yield will vary and it's possible to lose money investing in the Fund. A portion of the Fund's expenses was reimbursed and/or waived. Absent such reimbursements and/or waivers the yield for the period ending June 30, 2016, the most recent period shown in the table, would have been -0.01%.
Fidelity® Ohio Municipal Money Market Fund
Investments June 30, 2016 (Unaudited)
Showing Percentage of Net Assets
| Variable Rate Demand Note - 53.9% | | | |
| | | Principal Amount | Value |
| Alabama - 0.1% | | | |
| Decatur Indl. Dev. Board Exempt Facilities Rev. (Nucor Steel Decatur LLC Proj.) Series 2003 A, 0.7% 7/7/16, VRDN (a)(b) | | $700,000 | $700,000 |
| Alaska - 0.3% | | | |
| Valdez Marine Term. Rev. (Phillips Trans. Alaska, Inc. Proj.) Series 1994 C, 0.56% 7/7/16, VRDN (b) | | 2,200,000 | 2,200,000 |
| Arkansas - 0.6% | | | |
| Blytheville Indl. Dev. Rev. (Nucor Corp. Proj.): | | | |
| Series 1998, 0.7% 7/7/16, VRDN (a)(b) | | 400,000 | 400,000 |
| Series 2002, 0.73% 7/7/16, VRDN (a)(b) | | 2,400,000 | 2,400,000 |
| Osceola Solid Waste Disp. Rev. (Plum Point Energy Associates, LLC Proj.) Series 2006, 0.7% 7/7/16, LOC Royal Bank of Scotland PLC, VRDN (a)(b) | | 2,100,000 | 2,100,000 |
| | | | 4,900,000 |
| Delaware - 0.0% | | | |
| Delaware Econ. Dev. Auth. Rev. (Delmarva Pwr. & Lt. Co. Proj.): | | | |
| Series 1994, 0.63% 7/1/16, VRDN (a)(b) | | 100,000 | 100,000 |
| Series 1999 A, 0.5% 7/7/16, VRDN (b) | | 200,000 | 200,000 |
| | | | 300,000 |
| Georgia - 0.4% | | | |
| Bartow County Dev. Auth. Poll. Cont. Rev. (Georgia Pwr. Co. Plant Bowen Proj.) First Series 2009, 0.52% 7/7/16, VRDN (b) | | 2,150,000 | 2,150,000 |
| Monroe County Dev. Auth. Poll. Cont. Rev.: | | | |
| (Georgia Pwr. Co. Plant Scherer Proj.) First Series 2009, 0.54% 7/7/16, VRDN (b) | | 200,000 | 200,000 |
| (Georgia Pwr. Plant Co. Scherer Proj.) Series 2008, 0.46% 7/1/16, VRDN (b) | | 600,000 | 600,000 |
| | | | 2,950,000 |
| Indiana - 0.1% | | | |
| Indiana Dev. Fin. Auth. Envir. Rev. (PSI Energy Proj.) Series 2003 B, 0.6% 7/7/16, VRDN (a)(b) | | 600,000 | 600,000 |
| Louisiana - 0.1% | | | |
| Saint James Parish Gen. Oblig. (Nucor Steel Louisiana LLC Proj.) Series 2010 A1, 0.65% 7/7/16, VRDN (b) | | 600,000 | 600,000 |
| Montana - 0.1% | | | |
| Forsyth Poll. Cont. Rev. Series 2008 A, 0.51% 7/7/16, VRDN (a)(b) | | 750,000 | 750,000 |
| Nebraska - 0.1% | | | |
| Stanton County Indl. Dev. Rev. (Nucor Corp. Proj.) Series 1996, 0.7% 7/7/16, VRDN (a)(b) | | 700,000 | 700,000 |
| Nevada - 0.1% | | | |
| Washoe County Gas Facilities Rev.: | | | |
| Series 2016 C, 0.63% 7/7/16, VRDN (a)(b) | | 200,000 | 200,000 |
| Series 2016 D, 0.64% 7/7/16, VRDN (a)(b) | | 200,000 | 200,000 |
| Series 2016 E, 0.65% 7/7/16, VRDN (a)(b) | | 200,000 | 200,000 |
| | | | 600,000 |
| New Jersey - 0.1% | | | |
| Salem County Poll. Cont. Fin. Auth. Rev. (Pub. Svc. Elec. and Gas Co. Proj.): | | | |
| Series 2003 B1, 0.55% 7/7/16, VRDN (b) | | 400,000 | 400,000 |
| Series 2012 A, 0.7% 7/7/16, VRDN (a)(b) | | 700,000 | 700,000 |
| | | | 1,100,000 |
| Ohio - 50.4% | | | |
| Allen County Hosp. Facilities Rev.: | | | |
| (Catholic Healthcare Partners Proj.) Series 2010 C, 0.52% 7/1/16, LOC MUFG Union Bank NA, VRDN (b) | | 13,525,000 | 13,525,000 |
| Series 2012 B, 0.45% 7/7/16, VRDN (b) | | 81,000,000 | 80,999,997 |
| Alliance Hosp. Rev. (Alliance Obligated Group Proj.) Series 2003, 0.38% 7/1/16, LOC JPMorgan Chase Bank, VRDN (b) | | 9,100,000 | 9,100,000 |
| Athens County Port Auth. Hsg. 0.42% 7/7/16, LOC Barclays Bank PLC, VRDN (b) | | 12,575,000 | 12,575,000 |
| Cleveland Arpt. Sys. Rev.: | | | |
| Series 2008 D, 0.41% 7/7/16, LOC U.S. Bank NA, Cincinnati, VRDN (b) | | 5,975,000 | 5,975,000 |
| Series 2009 D, 0.41% 7/7/16, LOC U.S. Bank NA, Cincinnati, VRDN | | 5,000,000 | 5,000,000 |
| Cuyahoga County Health Care Facilities Rev. (The A.M. McGregor Home Proj.) Series 2014, 0.55% 7/7/16, LOC Northern Trust Co., VRDN (b) | | 10,340,000 | 10,340,000 |
| Cuyahoga County Hosp. Facilities Rev. (Sisters of Charity of Saint Augustine Health Sys. Proj.) Series 2000, 0.42% 7/7/16, LOC PNC Bank NA, VRDN (b) | | 2,850,000 | 2,850,000 |
| Franklin County Health Care Facilities Rev. (Presbyterian Retirement Svcs. Proj.) Series 2005 B, 0.46% 7/7/16, LOC Comerica Bank, VRDN (b) | | 5,000,000 | 5,000,000 |
| Franklin County Hosp. Rev.: | | | |
| (OhioHealth Corp. Proj.) Series D, 0.42% 7/7/16, LOC Northern Trust Co., VRDN (b) | | 9,670,000 | 9,670,000 |
| (U.S. Health Corp. of Columbus Proj.): | | | |
| Series 1996 A, 0.42% 7/7/16, LOC Northern Trust Co., VRDN (b) | | 10,780,000 | 10,780,000 |
| Series 1996 B, 0.42% 7/7/16, LOC Northern Trust Co., VRDN (b) | | 9,245,000 | 9,245,000 |
| Series 1998, 0.42% 7/7/16, LOC Northern Trust Co., VRDN (b) | | 6,815,000 | 6,815,000 |
| Series 2009 B, 0.42% 7/7/16 (Liquidity Facility Barclays Bank PLC), VRDN (b) | | 6,500,000 | 6,500,000 |
| Hamilton County Health Care Facilities Rev. (The Children's Home of Cincinnati Proj.) Series 2009, 0.42% 7/7/16, LOC U.S. Bank NA, Cincinnati, VRDN (b) | | 2,975,000 | 2,975,000 |
| Hamilton County Hosp. Facilities Rev.: | | | |
| (Children's Hosp. Med. Ctr. Proj.) Series 2007 M, 0.43% 7/7/16, LOC JPMorgan Chase Bank, VRDN (b) | | 15,015,000 | 15,015,000 |
| (Elizabeth Gamble Deaconess Home Assoc. Proj.) Series 2002 B, 0.42% 7/7/16, LOC PNC Bank NA, VRDN (b) | | 15,800,000 | 15,800,000 |
| Hamilton County Student Hsg. Rev. (Block 3 Proj.) Series 2004, 0.5% 7/7/16, LOC Bank of New York, New York, LOC Citizens Bank of Pennsylvania, VRDN (b) | | 11,690,000 | 11,690,000 |
| Lake County Indl. Dev. Rev. (Norshar Co. Proj.) 0.66% 7/7/16, LOC JPMorgan Chase Bank, VRDN (a)(b) | | 1,475,000 | 1,475,000 |
| Lorain County Port Auth. Edl. Facilities Rev. (St. Ignatius High School Proj.) 0.44% 7/7/16, LOC U.S. Bank NA, Cincinnati, VRDN (b) | | 2,350,000 | 2,350,000 |
| Middletown Hosp. Facilities Rev. Series 2008 A, 0.41% 7/7/16, LOC PNC Bank NA, VRDN (b) | | 10,000,000 | 10,000,000 |
| Ohio Air Quality Dev. Auth. Rev. (Ohio Valley Elec. Corp. Proj.) Series 2009 D, 0.42% 7/7/16, LOC Bank of Tokyo-Mitsubishi UFJ Ltd., VRDN (b) | | 24,400,000 | 24,400,000 |
| Ohio Gen. Oblig. 0.42% 7/7/16, VRDN (b) | | 5,000,000 | 5,000,000 |
| Ohio Higher Edl. Facility Commission Rev. (Case Western Reserve Univ. Proj.) Series 2008 A, 0.43% 7/7/16, LOC PNC Bank NA, VRDN (b) | | 50,000,000 | 50,000,000 |
| Ohio Hsg. Fin. Agcy. Mtg. Rev.: | | | |
| (Mtg.-Backed Securities Prog.) Series F, 0.44% 7/7/16 (Liquidity Facility Fed. Home Ln. Bank, Cincinnati), VRDN (a)(b) | | 8,845,000 | 8,845,000 |
| Series 2004 D, 0.44% 7/7/16 (Liquidity Facility Fed. Home Ln. Bank, Cincinnati), VRDN (a)(b) | | 5,415,000 | 5,415,000 |
| Ohio Hsg. Fin. Agcy. Multi-family Hsg. Rev.: | | | |
| (Pedcor Invts. Willow Lake Apts. Proj.) Series B, 0.59% 7/7/16, LOC Fed. Home Ln. Bank, Indianapolis, VRDN (a)(b) | | 245,000 | 245,000 |
| (Wingate at Belle Meadows Proj.) 0.46% 7/7/16, LOC Fed. Home Ln. Bank, Cincinnati, VRDN (a)(b) | | 8,520,000 | 8,520,000 |
| Ohio Hsg. Fin. Agcy. Residential Mtg. Rev.: | | | |
| Series 2016 F, 0.42% 7/7/16 (Liquidity Facility Fed. Home Ln. Bank, Cincinnati), VRDN (a)(b) | | 4,600,000 | 4,600,000 |
| Series 2016 G, 0.42% 7/7/16 (Liquidity Facility Fed. Home Ln. Bank, Cincinnati), VRDN (a)(b) | | 10,300,000 | 10,300,000 |
| Series 2016 H, 0.42% 7/7/16 (Liquidity Facility Fed. Home Ln. Bank, Cincinnati), VRDN (a)(b) | | 11,500,000 | 11,500,000 |
| Series 2016 I, 0.42% 7/7/16 (Liquidity Facility Fed. Home Ln. Bank, Cincinnati), VRDN (a)(b) | | 4,000,000 | 4,000,000 |
| Ohio State Univ. Gen. Receipts Series 2010 E, 0.4% 7/7/16, VRDN (b) | | 4,800,000 | 4,800,000 |
| Ohio Wtr. Dev. Auth. (Waste Mgmt., Inc. Proj.) Series B, 0.46% 7/7/16, LOC Bank of America NA, VRDN (a)(b) | | 12,100,000 | 12,100,000 |
| Village of Indian Hill Econ. Dev. Rev. (Cincinnati Country Day School Proj.) Series 1999, 0.49% 7/7/16, LOC PNC Bank NA, VRDN (b) | | 4,345,000 | 4,345,000 |
| Wood County Indl. Dev. Rev. (CMC Group Proj.) Series 2001, 0.58% 7/1/16, LOC PNC Bank NA, VRDN (a)(b) | | 120,000 | 120,000 |
| | | | 401,869,997 |
| Texas - 1.0% | | | |
| Port Arthur Navigation District Envir. Facilities Rev. (Motiva Enterprises LLC Proj.): | | | |
| Series 2001 A, 0.54% 7/1/16, VRDN (b) | | 1,300,000 | 1,300,000 |
| Series 2004, 0.71% 7/7/16, VRDN (a)(b) | | 2,700,000 | 2,700,000 |
| Series 2009 B, 0.54% 7/1/16, VRDN (b) | | 1,100,000 | 1,100,000 |
| Series 2009 C, 0.54% 7/1/16, VRDN (b) | | 1,000,000 | 1,000,000 |
| Series 2010 B, 0.54% 7/1/16, VRDN (b) | | 200,000 | 200,000 |
| Series 2010 D, 0.54% 7/1/16, VRDN (b) | | 2,035,000 | 2,035,000 |
| | | | 8,335,000 |
| West Virginia - 0.2% | | | |
| West Virginia Econ. Dev. Auth. Solid Waste Disp. Facilities Rev.: | | | |
| (Appalachian Pwr. Co. - Amos Proj.) Series 2008 B, 0.72% 7/7/16, VRDN (a)(b) | | 700,000 | 700,000 |
| (Appalachian Pwr. Co.- Mountaineer Proj.) Series 2008 A, 0.72% 7/7/16, VRDN (a)(b) | | 600,000 | 600,000 |
| | | | 1,300,000 |
| Wyoming - 0.3% | | | |
| Converse County Poll. Cont. Rev. (PacifiCorp Proj.) Series 1994, 0.47% 7/7/16, VRDN (b) | | 1,095,000 | 1,095,000 |
| Lincoln County Poll. Cont. Rev. (PacifiCorp Proj.) Series 1994, 0.47% 7/7/16, VRDN (b) | | 1,500,000 | 1,500,000 |
| | | | 2,595,000 |
| TOTAL VARIABLE RATE DEMAND NOTE | | | |
| (Cost $429,499,997) | | | 429,499,997 |
|
| Tender Option Bond - 5.0% | | | |
| Nebraska - 0.0% | | | |
| Omaha Pub. Pwr. District Elec. Rev. Participating VRDN Series 16 XF1053, 0.59% 7/7/16 (Liquidity Facility Deutsche Bank AG New York Branch) (b)(c) | | 300,000 | 300,000 |
| Ohio - 5.0% | | | |
| Cincinnati Wtr. Sys. Rev. Participating VRDN Series MS 3280, 0.45% 7/7/16 (Liquidity Facility Morgan Stanley Bank, West Valley City Utah) (b)(c) | | 3,330,000 | 3,330,000 |
| Columbus Gen. Oblig. Participating VRDN: | | | |
| Series Clipper 08 2, 0.44% 7/7/16 (Liquidity Facility State Street Bank & Trust Co., Boston) (b)(c) | | 4,000,000 | 4,000,000 |
| Series Putters 2365, 0.45% 7/7/16 (Liquidity Facility JPMorgan Chase Bank) (b)(c) | | 4,360,000 | 4,360,000 |
| Franklin County Hosp. Facilities Rev. Participating VRDN Series 15 XF0244, 0.44% 7/7/16 (Liquidity Facility Toronto-Dominion Bank) (b)(c) | | 4,000,000 | 4,000,000 |
| Franklin County Hosp. Rev. Participating VRDN Series 16 XL0004, 0.44% 7/7/16 (Liquidity Facility Barclays Bank PLC) (b)(c) | | 3,315,000 | 3,315,000 |
| Ohio Hosp. Facilities Rev. Participating VRDN: | | | |
| Series 16 ZF0354, 0.44% 7/7/16 (Liquidity Facility JPMorgan Chase Bank) (b)(c) | | 6,250,000 | 6,250,000 |
| Series 2015 XF0105, 0.44% 7/7/16 (Liquidity Facility JPMorgan Chase Bank) (b)(c) | | 4,500,000 | 4,500,000 |
| 0.44% 7/7/16 (Liquidity Facility JPMorgan Chase Bank) (b)(c) | | 9,805,000 | 9,805,000 |
| | | | 39,560,000 |
| TOTAL TENDER OPTION BOND | | | |
| (Cost $39,860,000) | | | 39,860,000 |
|
| Other Municipal Security - 35.6% | | | |
| Georgia - 0.3% | | | |
| Main Street Natural Gas, Inc. Georgia Gas Proj. Rev. Bonds Series 2010 A1, 0.52%, tender 10/3/16 (Liquidity Facility Royal Bank of Canada) (b) | | 2,200,000 | 2,200,000 |
| Kentucky - 0.0% | | | |
| Jefferson County Poll. Cont. Rev. Bonds Series 2001 A, 0.8% tender 7/25/16, CP mode | | 300,000 | 300,000 |
| Massachusetts - 0.2% | | | |
| Massachusetts Indl. Fin. Agcy. Poll. Cont. Rev. Bonds (New England Pwr. Co. Proj.): | | | |
| Series 1992, 0.86% tender 7/7/16, CP mode | | 1,000,000 | 1,000,000 |
| Series 1993 A, 0.86% tender 7/8/16, CP mode | | 300,000 | 300,000 |
| | | | 1,300,000 |
| New Hampshire - 0.4% | | | |
| New Hampshire Bus. Fin. Auth. Poll. Cont. Rev. Bonds: | | | |
| (New England Pwr. Co. Proj.): | | | |
| Series 1990 A, 0.9% tender 7/8/16, CP mode (a) | | 200,000 | 200,000 |
| Series 1990 B, 0.85% tender 7/15/16, CP mode | | 600,000 | 600,000 |
| 0.9% tender 7/26/16, CP mode | | 600,000 | 600,000 |
| Series 1990 A, 0.9% tender 7/6/16, CP mode (a) | | 1,100,000 | 1,100,000 |
| Series A1, 0.95% tender 7/26/16, CP mode (a) | | 1,000,000 | 1,000,000 |
| | | | 3,500,000 |
| Ohio - 34.5% | | | |
| American Muni. Pwr. BAN: | | | |
| Series 2015, 1% 10/21/16 | | 4,000,000 | 4,003,081 |
| 1.25% 4/27/17 (Ohio Gen. Oblig. Guaranteed) | | 850,000 | 853,510 |
| Avon Gen. Oblig. BAN: | | | |
| Series 2015, 2% 9/8/16 | | 8,500,000 | 8,526,008 |
| 1.5% 1/26/17 | | 2,615,000 | 2,625,352 |
| Avon Lake BAN Series 2015, 2% 7/13/16 | | 11,711,000 | 11,716,806 |
| Belmont County BAN 2% 4/21/17 | | 9,339,000 | 9,426,273 |
| Berea BAN 1.5% 3/16/17 | | 2,150,000 | 2,162,371 |
| Blendon Township BAN Series 2016, 2% 2/9/17 (Ohio Gen. Oblig. Guaranteed) | | 2,250,000 | 2,267,685 |
| Butler County Gen. Oblig. BAN 0.52% 7/28/16 | | 4,400,000 | 4,399,834 |
| Chillicothe City School District BAN: | | | |
| 2% 7/7/16 | | 4,900,000 | 4,901,162 |
| 2% 7/7/16 | | 12,650,000 | 12,653,008 |
| Cleveland Wtr. Rev. Bonds Series 2011, 5% 1/1/17 | | 1,140,000 | 1,166,053 |
| Columbus Gen. Oblig. Bonds: | | | |
| Series 2013 1, 5% 7/1/16 | | 3,300,000 | 3,300,000 |
| Series 2013 B, 4% 8/15/16 | | 500,000 | 502,205 |
| Delaware Gen. Oblig. BAN 1% 4/13/17 | | 3,365,000 | 3,370,209 |
| Dublin City School District BAN 1.5% 5/2/17 | | 2,250,000 | 2,263,065 |
| Fairborn Gen. Oblig. BAN 1.25% 3/23/17 | | 4,074,450 | 4,090,290 |
| Franklin County Hosp. Facilities Rev. Bonds Series 2013, 5% 5/15/17 | | 1,000,000 | 1,037,278 |
| Franklin County Hosp. Rev. Bonds: | | | |
| (U.S. Health Corp. of Columbus Proj.) Series 2011 B, 5%, tender 7/12/17 (b) | | 1,020,000 | 1,064,209 |
| Series 2011 D, 4%, tender 8/1/16 (b) | | 5,230,000 | 5,245,619 |
| Franklin County Rev. Bonds Series 2013 OH, 0.6%, tender 9/1/16 (b) | | 8,800,000 | 8,800,000 |
| Hancock County Gen. Oblig. BAN Series 2015, 2% 11/3/16 | | 3,725,000 | 3,742,819 |
| Huber Heights BAN 2% 6/1/17 | | 8,800,000 | 8,890,465 |
| Kenston Local School District BAN: | | | |
| Series 2015, 1% 9/15/16 | | 2,500,000 | 2,500,974 |
| Series 2016, 2% 6/29/17 | | 4,000,000 | 4,048,533 |
| Lebanon Gen. Oblig. BAN 2% 4/12/17 | | 4,600,000 | 4,642,003 |
| Licking County BAN 2% 5/24/17 | | 3,000,000 | 3,034,133 |
| Lima Gen. Oblig. BAN 1.5% 3/15/17 | | 4,295,000 | 4,319,017 |
| Lorain County Gen. Oblig. BAN Series 2016, 2.25% 11/10/16 | | 3,500,000 | 3,519,985 |
| Lucas County Gen. Oblig. BAN 1.5% 7/13/16 | | 11,552,000 | 11,556,147 |
| Madison Local School District Lake County BAN Series 2015, 1.25% 10/6/16 (Ohio Gen. Oblig. Guaranteed) | | 1,455,000 | 1,457,684 |
| Mason City School District BAN Series 2016, 1.5% 1/25/17 | | 3,900,000 | 3,919,371 |
| Mason Gen. Oblig. BAN 2% 5/24/17 | | 2,750,000 | 2,780,545 |
| Miami County Gen. Oblig. BAN Series 2015, 1.75% 11/22/16 | | 2,805,000 | 2,818,716 |
| Ohio Dept. of Administrative Svcs. Ctfs. of Prtn. Bonds (Administrative Knowledge Sys. Proj.) Series 2014 A, 5% 9/1/16 | | 1,790,000 | 1,803,012 |
| Ohio Gen. Oblig. Bonds: | | | |
| (Mental Health Facilities Impt. Fund Projs.) Series 2014 A, 4% 2/1/17 | | 1,500,000 | 1,530,120 |
| Series 2011 B, 5% 9/15/16 | | 1,080,000 | 1,090,018 |
| Series 2012 A, 1.5% 11/1/16 | | 1,000,000 | 1,003,195 |
| Series 2016 A, 2% 2/1/17 | | 1,750,000 | 1,763,616 |
| 2% 2/1/17 | | 1,070,000 | 1,079,719 |
| Ohio Higher Edl. Facility Commission Rev. Bonds: | | | |
| (Cleveland Clinic Proj.) Series B5, 0.54% tender 8/3/16, CP mode | | 9,500,000 | 9,500,000 |
| (Cleveland Hosp. Proj.) Series 2008 B5, 0.5% tender 8/10/16, CP mode | | 9,100,000 | 9,100,000 |
| 0.51% tender 9/6/16, CP mode | | 12,000,000 | 12,000,000 |
| 0.51% tender 9/6/16, CP mode | | 5,200,000 | 5,200,000 |
| 0.51% tender 9/14/16, CP mode | | 8,400,000 | 8,400,000 |
| 0.51% tender 9/22/16, CP mode | | 8,300,000 | 8,300,000 |
| Ohio Major New State Infrastructure Rev. Bonds: | | | |
| Series 3, 5% 12/15/16 | | 2,160,000 | 2,203,447 |
| 4% 12/15/16 | | 3,220,000 | 3,272,893 |
| Ohio Parks & Recreation Cap. Facilities Bonds (Park and Recreation Impt. Fund Projs.) Series 2015 A, 5% 2/1/17 | | 1,000,000 | 1,026,319 |
| Ohio Spl. Oblig. Bonds: | | | |
| (Adult Correctional Bldg. Fund Proj.) Series 2015 B, 2% 10/1/16 | | 1,980,000 | 1,987,892 |
| (Mental Health Facilities Impt. Fund Projs.) Series 2016 A, 4% 6/1/17 | | 2,435,000 | 2,508,560 |
| Series 2015, 4% 4/1/17 | | 2,735,000 | 2,805,058 |
| Ohio State Univ. Gen. Receipts Bonds: | | | |
| Series 2009 A, 5% 12/1/16 | | 1,800,000 | 1,833,344 |
| Series 2010 A, 5% 12/1/16 | | 1,715,000 | 1,746,560 |
| Ohio State Univ. Gen. Receipts Rev. Bonds 0.45% tender 7/19/16, CP mode | | 8,500,000 | 8,500,000 |
| Ohio Wtr. Dev. Auth. Wtr. Poll. Cont. Rev. Bonds: | | | |
| Series 2009, 5% 12/1/16 | | 4,310,000 | 4,390,441 |
| Series 2010, 5% 12/1/16 | | 860,000 | 875,927 |
| Reading Cmnty. City School District BAN: | | | |
| Series 2015, 2% 7/21/16 (Ohio Gen. Oblig. Guaranteed) | | 4,900,000 | 4,904,145 |
| Series 2016, 2% 7/21/16 (Ohio Gen. Oblig. Guaranteed) | | 7,500,000 | 7,506,371 |
| Scioto County Hosp. Facilities Rev. Bonds Series 2016, 3% 2/15/17 | | 775,000 | 785,895 |
| Union County Gen. Oblig. BAN 1.25% 3/29/17 | | 3,700,000 | 3,715,536 |
| Vandalia BAN Series 2015, 1.5% 9/8/16 | | 4,893,000 | 4,902,176 |
| Wayne County Ohio BD BAN Series 2016, 2% 6/30/17 | | 4,000,000 | 4,048,666 |
| Willoughby BAN 2% 5/26/17 | | 5,680,000 | 5,743,485 |
| | | | 275,130,805 |
| Virginia - 0.1% | | | |
| Halifax County Indl. Dev. Auth. Poll. Cont. Rev. Bonds 0.9% tender 7/26/16, CP mode (a) | | 700,000 | 700,000 |
| Prince William County Indl. Dev. Auth. Poll. Cont. Rev. Bonds (Elec. Pwr. Co. Proj.) 0.85% tender 7/26/16, CP mode | | 200,000 | 200,000 |
| | | | 900,000 |
| West Virginia - 0.1% | | | |
| Grant County Cmnty. Solid Waste Disp. Rev. Bonds (Virginia Elec. and Pwr. Co. Proj.) Series 1996, 0.9% tender 7/8/16, CP mode (a) | | 500,000 | 500,000 |
| TOTAL OTHER MUNICIPAL SECURITY | | | |
| (Cost $283,830,805) | | | 283,830,805 |
| | | Shares | Value |
|
| Investment Company - 7.4% | | | |
| Fidelity Municipal Cash Central Fund, 0.44% (d)(e) | | | |
| (Cost $58,791,000) | | 58,791,000 | 58,791,000 |
| TOTAL INVESTMENT PORTFOLIO - 101.9% | | | |
| (Cost $811,981,802) | | | 811,981,802 |
| NET OTHER ASSETS (LIABILITIES) - (1.9)% | | | (15,318,382) |
| NET ASSETS - 100% | | | $796,663,420 |
Security Type Abbreviations
BAN – BOND ANTICIPATION NOTE
CP – COMMERCIAL PAPER
VRDN – VARIABLE RATE DEMAND NOTE (A debt instrument that is payable upon demand, either daily, weekly or monthly)
The date shown for securities represents the date when principal payments must be paid, taking into account any call options exercised by the issuer and any permissible maturity shortening features other than interest rate resets.
Legend
(a) Private activity obligations whose interest is subject to the federal alternative minimum tax for individuals.
(b) Coupon rates for floating and adjustable rate securities reflect the rates in effect at period end.
(c) Provides evidence of ownership in one or more underlying municipal bonds.
(d) Information in this report regarding holdings by state and security types does not reflect the holdings of the Fidelity Municipal Cash Central Fund.
(e) Affiliated fund that is available only to investment companies and other accounts managed by Fidelity Investments. The rate quoted is the annualized seven-day yield of the fund at period end. A complete unaudited listing of the fund's holdings as of its most recent quarter end is available upon request. In addition, each Fidelity Central Fund's financial statements are available on the SEC's website or upon request.
Affiliated Central Funds
Information regarding fiscal year to date income earned by the Fund from investments in Fidelity Central Funds is as follows:
| Fund | Income earned |
| Fidelity Municipal Cash Central Fund | $68,911 |
| Total | $68,911 |
Investment Valuation
All investments are categorized as Level 2 under the Fair Value Hierarchy. The inputs or methodology used for valuing securities may not be an indication of the risk associated with investing in those securities. For more information on valuation inputs please refer to the Investment Valuation section in the accompanying Notes to Financial Statements.
See accompanying notes which are an integral part of the financial statements.
Fidelity® Ohio Municipal Money Market Fund
Financial Statements
Statement of Assets and Liabilities
| | | June 30, 2016 (Unaudited) |
| Assets | | |
Investment in securities, at value — See accompanying schedule:
Unaffiliated issuers (cost $753,190,802) | $753,190,802 | |
| Fidelity Central Funds (cost $58,791,000) | 58,791,000 | |
| Total Investments (cost $811,981,802) | | $811,981,802 |
| Cash | | 159,762 |
| Receivable for investments sold | | 28,932 |
| Receivable for fund shares sold | | 2,682,699 |
| Interest receivable | | 1,845,592 |
| Distributions receivable from Fidelity Central Funds | | 25,413 |
| Other receivables | | 1,860 |
| Total assets | | 816,726,060 |
| Liabilities | | |
| Payable for investments purchased | $13,620,034 | |
| Payable for fund shares redeemed | 6,099,937 | |
| Distributions payable | 228 | |
| Accrued management fee | 249,847 | |
| Other affiliated payables | 72,207 | |
| Other payables and accrued expenses | 20,387 | |
| Total liabilities | | 20,062,640 |
| Net Assets | | $796,663,420 |
| Net Assets consist of: | | |
| Paid in capital | | $796,652,981 |
| Distributions in excess of net investment income | | (1,179) |
| Accumulated undistributed net realized gain (loss) on investments | | 11,618 |
| Net Assets, for 796,096,674 shares outstanding | | $796,663,420 |
| Net Asset Value, offering price and redemption price per share ($796,663,420 ÷ 796,096,674 shares) | | $1.00 |
See accompanying notes which are an integral part of the financial statements.
Statement of Operations
| | | Six months ended June 30, 2016 (Unaudited) |
| Investment Income | | |
| Interest | | $1,287,801 |
| Income from Fidelity Central Funds | | 68,911 |
| Total income | | 1,356,712 |
| Expenses | | |
| Management fee | $1,765,386 | |
| Transfer agent fees | 646,361 | |
| Accounting fees and expenses | 57,654 | |
| Custodian fees and expenses | 3,847 | |
| Independent trustees' fees and expenses | 2,379 | |
| Registration fees | 26,417 | |
| Audit | 19,636 | |
| Legal | 992 | |
| Miscellaneous | 22,469 | |
| Total expenses before reductions | 2,545,141 | |
| Expense reductions | (1,236,034) | 1,309,107 |
| Net investment income (loss) | | 47,605 |
| Realized and Unrealized Gain (Loss) | | |
| Net realized gain (loss) on: | | |
| Investment securities: | | |
| Unaffiliated issuers | 14,393 | |
| Total net realized gain (loss) | | 14,393 |
| Net increase in net assets resulting from operations | | $61,998 |
See accompanying notes which are an integral part of the financial statements.
Statement of Changes in Net Assets
| | Six months ended June 30, 2016 (Unaudited) | Year ended December 31, 2015 |
| Increase (Decrease) in Net Assets | | |
| Operations | | |
| Net investment income (loss) | $47,605 | $128,156 |
| Net realized gain (loss) | 14,393 | 133,112 |
| Net increase in net assets resulting from operations | 61,998 | 261,268 |
| Distributions to shareholders from net investment income | (48,784) | (119,843) |
| Distributions to shareholders from net realized gain | (43,302) | (34,708) |
| Total distributions | (92,086) | (154,551) |
| Share transactions at net asset value of $1.00 per share | | |
| Proceeds from sales of shares | 743,467,607 | 2,902,865,221 |
| Reinvestment of distributions | 85,950 | 144,686 |
| Cost of shares redeemed | (1,197,406,347) | (2,989,505,964) |
| Net increase (decrease) in net assets and shares resulting from share transactions | (453,852,790) | (86,496,057) |
| Total increase (decrease) in net assets | (453,882,878) | (86,389,340) |
| Net Assets | | |
| Beginning of period | 1,250,546,298 | 1,336,935,638 |
| End of period | $796,663,420 | $1,250,546,298 |
| Other Information | | |
| Distributions in excess of net investment income end of period | $(1,179) | $– |
See accompanying notes which are an integral part of the financial statements.
Financial Highlights — Fidelity Ohio Municipal Money Market Fund
| | Six months ended (Unaudited) June 30, | Years ended December 31, | | | | |
| | 2016 | 2015 | 2014 | 2013 | 2012 | 2011 |
| Selected Per–Share Data | | | | | | |
| Net asset value, beginning of period | $1.00 | $1.00 | $1.00 | $1.00 | $1.00 | $1.00 |
| Income from Investment Operations | | | | | | |
| Net investment income (loss)A | – | – | – | – | – | – |
| Net realized and unrealized gain (loss)A | – | – | – | – | – | – |
| Total from investment operationsA | – | – | – | – | – | – |
| Distributions from net investment incomeA | – | – | – | – | – | – |
| Distributions from net realized gain | –A | –A | –A | – | – | – |
| Total distributionsA | – | – | – | – | – | – |
| Net asset value, end of period | $1.00 | $1.00 | $1.00 | $1.00 | $1.00 | $1.00 |
| Total ReturnB,C | .01% | .01% | .02% | .01% | .01% | .01% |
| Ratios to Average Net AssetsD,E | | | | | | |
| Expenses before reductions | .52%F | .52% | .51% | .52% | .52% | .52% |
| Expenses net of fee waivers, if any | .27%F | .07% | .08% | .12% | .19% | .24% |
| Expenses net of all reductions | .27%F | .07% | .08% | .12% | .19% | .24% |
| Net investment income (loss) | .01%F | .01% | .01% | .01% | .01% | .01% |
| Supplemental Data | | | | | | |
| Net assets, end of period (000 omitted) | $796,663 | $1,250,546 | $1,336,936 | $1,332,321 | $1,342,387 | $1,106,601 |
A Amount represents less than $.0005 per share.
B Total returns for periods of less than one year are not annualized.
C Total returns would have been lower if certain expenses had not been reduced during the applicable periods shown.
D Fees and expenses of any underlying Fidelity Central Funds are not included in the Fund's expense ratio. The Fund indirectly bears its proportionate share of the expenses of any underlying Fidelity Central Funds.
E Expense ratios reflect operating expenses of the Fund. Expenses before reductions do not reflect amounts reimbursed or waived or reductions from expense offset arrangements and do not represent the amount paid by the Fund during periods when reimbursements, waivers or reductions occur. Expenses net of fee waivers reflect expenses after reimbursement and waivers but prior to reductions from expense offset arrangements. Expenses net of all reductions represent the net expenses paid by the Fund.
F Annualized
See accompanying notes which are an integral part of the financial statements.
Notes to Financial Statements (Unaudited)
For the period ended June 30, 2016
1. Organization.
Fidelity Ohio Municipal Income Fund (the Income Fund) is a fund of Fidelity Municipal Trust. Fidelity Ohio Municipal Money Market Fund (the Money Market Fund) is a fund of Fidelity Municipal Trust II. Each Trust is registered under the Investment Company Act of 1940, as amended (the 1940 Act), as an open-end management investment company. Fidelity Municipal Trust and Fidelity Municipal Trust II (the Trusts) are organized as a Massachusetts business trust and a Delaware statutory trust, respectively. Each Fund is authorized to issue an unlimited number of shares. Share transactions on the Statement of Changes in Net Assets may contain exchanges between affiliated funds. Effective January 1, 2016 shares of the Money Market Fund are only available for purchase by retail shareholders. Each Fund may be affected by economic and political developments in the state of Ohio.
2. Investments in Fidelity Central Funds.
The Funds may invest in Fidelity Central Funds, which are open-end investment companies generally available only to other investment companies and accounts managed by the investment adviser and its affiliates. The Funds' Schedules of Investments list each of the Fidelity Central Funds held as of period end, if any, as an investment of each Fund, but do not include the underlying holdings of each Fidelity Central Fund. As an Investing Fund, each Fund indirectly bears its proportionate share of the expenses of the underlying Fidelity Central Funds.
The Money Market Central Funds seek preservation of capital and current income and are managed by Fidelity Investments Money Management, Inc. (FIMM), an affiliate of the investment adviser. Annualized expenses of the Money Market Central Funds as of their most recent shareholder report date are less than .005%.
A complete unaudited list of holdings for each Fidelity Central Fund is available upon request or at the Securities and Exchange Commission (the SEC) website at www.sec.gov. In addition, the financial statements of the Fidelity Central Funds are available on the SEC website or upon request.
3. Significant Accounting Policies.
The financial statements have been prepared in conformity with accounting principles generally accepted in the United States of America (GAAP), which require management to make certain estimates and assumptions at the date of the financial statements. Actual results could differ from those estimates. Subsequent events, if any, through the date that the financial statements were issued have been evaluated in the preparation of the financial statements. The following summarizes the significant accounting policies of the Funds:
Investment Valuation. Investments are valued as of 4:00 p.m. Eastern time on the last calendar day of the period. The Board of Trustees (the Board) has delegated the day to day responsibility for the valuation of the Income Fund's investments to the Fidelity Management & Research Company (FMR) Fair Value Committee (the Committee). In accordance with valuation policies and procedures approved by the Board, the Income Fund attempts to obtain prices from one or more third party pricing vendors or brokers to value its investments. When current market prices, quotations or currency exchange rates are not readily available or reliable, investments will be fair valued in good faith by the Committee, in accordance with procedures adopted by the Board. Factors used in determining fair value vary by investment type and may include market or investment specific events, changes in interest rates and credit quality. The frequency with which these procedures are used cannot be predicted and they may be utilized to a significant extent. The Committee oversees the Income Fund's valuation policies and procedures and reports to the Board on the Committee's activities and fair value determinations. The Board monitors the appropriateness of the procedures used in valuing the Income Fund's investments and ratifies the fair value determinations of the Committee.
Each Fund categorizes the inputs to valuation techniques used to value its investments into a disclosure hierarchy consisting of three levels as shown below:
- Level 1 – quoted prices in active markets for identical investments
- Level 2 – other significant observable inputs (including quoted prices for similar investments, interest rates, prepayment speeds, etc.)
- Level 3 – unobservable inputs (including the Fund's own assumptions based on the best information available)
Valuation techniques used to value each Fund's investments by major category are as follows:
For the Income Fund, debt securities, including restricted securities, are valued based on evaluated prices received from third party pricing vendors or from brokers who make markets in such securities. Municipal securities are valued by pricing vendors who utilize matrix pricing which considers yield or price of bonds of comparable quality, coupon, maturity and type or by broker-supplied prices. When independent prices are unavailable or unreliable, debt securities may be valued utilizing pricing methodologies which consider similar factors that would be used by third party pricing vendors. Debt securities are generally categorized as Level 2 in the hierarchy but may be Level 3 depending on the circumstances.
For the Money Market Fund, as permitted by compliance with certain conditions under Rule 2a-7 of the 1940 Act, securities are valued at amortized cost, which approximates fair value. The amortized cost of an instrument is determined by valuing it at its original cost and thereafter amortizing any discount or premium from its face value at a constant rate until maturity. Securities held by a money market fund are generally high quality and liquid; however, they are reflected as Level 2 because the inputs used to determine fair value are not quoted prices in an active market.
For the Income Fund, changes in valuation techniques may result in transfers in or out of an assigned level within the disclosure hierarchy.
Investment Transactions and Income. For financial reporting purposes, the Funds' investment holdings and net asset value (NAV) include trades executed through the end of the last business day of the period. The NAV per share for processing shareholder transactions is calculated as of the close of business of the New York Stock Exchange (NYSE), normally 4:00 p.m. Eastern time and includes trades executed through the end of the prior business day for the Income Fund and trades executed through the end of the current business day for the Money Market Fund. Gains and losses on securities sold are determined on the basis of identified cost. Income and capital gain distributions from Fidelity Central Funds, if any, are recorded on the ex-dividend date. Interest income is accrued as earned and includes coupon interest and amortization of premium and accretion of discount on debt securities as applicable. Debt obligations may be placed on non-accrual status and related interest income may be reduced by ceasing current accruals and writing off interest receivables when the collection of all or a portion of interest has become doubtful based on consistently applied procedures. A debt obligation is removed from non-accrual status when the issuer resumes interest payments or when collectability of interest is reasonably assured.
Expenses. Expenses directly attributable to a fund are charged to that fund. Expenses attributable to more than one fund are allocated among the respective funds on the basis of relative net assets or other appropriate methods. Expense estimates are accrued in the period to which they relate and adjustments are made when actual amounts are known.
Income Tax Information and Distributions to Shareholders. Each year, each Fund intends to qualify as a regulated investment company under Subchapter M of the Internal Revenue Code, including distributing substantially all of its taxable income and realized gains. As a result, no provision for U.S. Federal income taxes is required. Each Fund files a U.S. federal tax return, in addition to state and local tax returns as required. Each Fund's federal income tax returns are subject to examination by the Internal Revenue Service (IRS) for a period of three fiscal years after they are filed. State and local tax returns may be subject to examination for an additional fiscal year depending on the jurisdiction.
Dividends are declared and recorded daily and paid monthly from net investment income. Distributions from realized gains, if any, are declared and recorded on the ex-dividend date. Income and capital gain distributions are determined in accordance with income tax regulations, which may differ from GAAP.
Capital accounts within the financial statements are adjusted for permanent book-tax differences. These adjustments have no impact on net assets or the results of operations. Capital accounts are not adjusted for temporary book-tax differences which will reverse in a subsequent period.
Book-tax differences are primarily due to market discount, deferred trustees compensation and losses deferred due to future contracts.
The Funds purchase municipal securities whose interest, in the opinion of the issuer, is free from federal income tax. There is no assurance that the IRS will agree with this opinion. In the event the IRS determines that the issuer does not comply with relevant tax requirements, interest payments from a security could become federally taxable, possibly retroactively to the date the security was issued.
The federal tax cost of investment securities and unrealized appreciation (depreciation) as of period end were as follows for each Fund:
| | Tax cost | Gross unrealized appreciation | Gross unrealized depreciation | Net unrealized appreciation (depreciation) on securities |
| Fidelity Ohio Municipal Income Fund | $653,592,492 | $60,190,832 | $(1,212) | $60,189,620 |
| Fidelity Ohio Municipal Money Market Fund | $811,981,802 | – | – | – |
At the prior fiscal period end, certain of the Funds were required to defer losses on futures contracts. Loss deferrals were as follows:
| | Futures contracts |
| Fidelity Ohio Municipal Income Fund | $80,770 |
Short-Term Trading (Redemption) Fees. Shares held by investors in the Income Fund less than 30 days may be subject to a redemption fee equal to .50% of the NAV of shares redeemed. All redemption fees, which reduce the proceeds of the shareholder redemption, are retained by the Fund and accounted for as an addition to paid in capital.
Delayed Delivery Transactions and When-Issued Securities. During the period, certain Funds transacted in securities on a delayed delivery or when-issued basis. Payment and delivery may take place after the customary settlement period for that security. The price of the underlying securities and the date when the securities will be delivered and paid for are fixed at the time the transaction is negotiated. The securities purchased on a delayed delivery or when-issued basis are identified as such in each applicable Fund's Schedule of Investments. Certain Funds may receive compensation for interest forgone in the purchase of a delayed delivery or when-issued security. With respect to purchase commitments, each applicable Fund identifies securities as segregated in its records with a value at least equal to the amount of the commitment. Losses may arise due to changes in the value of the underlying securities or if the counterparty does not perform under the contract's terms, or if the issuer does not issue the securities due to political, economic, or other factors.
4. Purchases and Sales of Investments.
Purchases and sales of securities, other than short-term securities, for the Income Fund aggregated $90,725,416 and $16,904,209, respectively.
5. Fees and Other Transactions with Affiliates.
Management Fee. Fidelity Management & Research Company (the investment adviser) and its affiliates provide the Funds with investment management related services for which the Funds pay a monthly management fee. The management fee is the sum of an individual fund fee rate and an annualized group fee rate. The individual fund fee rate is applied to each Fund's average net assets. The group fee rate is based upon the average net assets of all the mutual funds advised by the investment adviser, including any mutual funds previously advised by the investment adviser that are currently advised by Fidelity SelectCo, LLC, an affiliate of the investment adviser. The group fee rate decreases as assets under management increase and increases as assets under management decrease. For the reporting period, each Fund's annualized management fee rate expressed as a percentage of each Fund's average net assets was as follows.
| | Individual Rate | Group Rate | Total |
| Fidelity Ohio Municipal Income Fund | .25% | .11% | .36% |
| Fidelity Ohio Municipal Money Market Fund | .25% | .11% | .36% |
Transfer Agent Fees. Fidelity Investments Institutional Operations Company, Inc. (FIIOC), an affiliate of the investment adviser, is the transfer, dividend disbursing and shareholder servicing agent for the Funds. FIIOC receives account fees and asset-based fees that vary according to account size and type of account. FIIOC pays for typesetting, printing and mailing of shareholder reports, except proxy statements. For the period, the transfer agent fees were equivalent to the following annualized rates expressed as a percentage of average net assets:
| Fidelity Ohio Municipal Income Fund | .08% |
| Fidelity Ohio Municipal Money Market Fund | .13% |
Accounting Fees. Fidelity Service Company, Inc. (FSC), an affiliate of the investment adviser, maintains each Fund's accounting records. The fee is based on the level of average net assets for each month.
Interfund Trades. The Funds may purchase from or sell securities to other Fidelity Funds under procedures adopted by the Board. The procedures have been designed to ensure these interfund trades are executed in accordance with Rule 17a-7 of the 1940 Act. For the Income Fund, interfund trades are included within the respective purchases and sales amounts shown in the Purchases and Sales of Investments note.
6. Committed Line of Credit.
The Income Fund participates with other funds managed by the investment adviser or an affiliate in a $4.25 billion credit facility (the "line of credit") to be utilized for temporary or emergency purposes to fund shareholder redemptions or for other short-term liquidity purposes. The participating funds have agreed to pay commitment fees on their pro-rata portion of the line of credit, which are reflected in Miscellaneous expenses on the Statement of Operations, and are as follows:
| Fidelity Ohio Municipal Income Fund | $576 |
During the period, the Income Fund did not borrow on this line of credit.
7. Expense Reductions.
The investment adviser or its affiliates voluntarily agreed to waive certain fees for the Money Market Fund in order to maintain a minimum annualized yield of .01%. Such arrangements may be discontinued by the investment adviser at any time. For the period, the amount of the waiver was $1,229,835.
In addition, through arrangements with each applicable Fund's custodian, credits realized as a result of certain uninvested cash balances were used to reduce each applicable Fund's expenses. All of the applicable expense reductions are noted in the table below.
| | Custody
expense
reduction |
| Fidelity Ohio Municipal Income Fund | $2,408 |
| Fidelity Ohio Municipal Money Market Fund | 3,724 |
In addition, during the period the investment adviser reimbursed and/or waived a portion of operating expenses as follows:
| | Amount |
| Fidelity Ohio Municipal Income Fund | $1,285 |
| Fidelity Ohio Municipal Money Market Fund | 2,475 |
8. Other.
The Funds' organizational documents provide former and current trustees and officers with a limited indemnification against liabilities arising in connection with the performance of their duties to the Funds. In the normal course of business, the Funds may also enter into contracts that provide general indemnifications. The Funds' maximum exposure under these arrangements is unknown as this would be dependent on future claims that may be made against the Funds. The risk of material loss from such claims is considered remote.
Shareholder Expense Example
As a shareholder of a Fund, you incur two types of costs: (1) transaction costs, including redemption fees and (2) ongoing costs, including management fees and other Fund expenses. This Example is intended to help you understand your ongoing costs (in dollars) of investing in the Funds and to compare these costs with the ongoing costs of investing in other mutual funds.
The Example is based on an investment of $1,000 invested at the beginning of the period and held for the entire period (January 1, 2016 to June 30, 2016).
Actual Expenses
The first line of the accompanying table for each fund provides information about actual account values and actual expenses. You may use the information in this line, together with the amount you invested, to estimate the expenses that you paid over the period. Simply divide your account value by $1,000.00 (for example, an $8,600 account value divided by $1,000.00 = 8.6), then multiply the result by the number in the first line for a fund under the heading entitled "Expenses Paid During Period" to estimate the expenses you paid on your account during this period. A small balance maintenance fee of $12.00 that is charged once a year may apply for certain accounts with a value of less than $2,000. This fee is not included in the table below. If it was, the estimate of expenses you paid during the period would be higher, and your ending account value lower, by this amount. In addition, each Fund, as a shareholder in the underlying Fidelity Central Funds, will indirectly bear its pro-rata share of the fees and expenses incurred by the underlying Fidelity Central Funds. These fees and expenses are not included in the Fund's annualized expense ratio used to calculate the expense estimate in the table below.
Hypothetical Example for Comparison Purposes
The second line of the accompanying table for each fund provides information about hypothetical account values and hypothetical expenses based on a fund's actual expense ratio and an assumed rate of return of 5% per year before expenses, which is not the Fund's actual return. The hypothetical account values and expenses may not be used to estimate the actual ending account balance or expenses you paid for the period. You may use this information to compare the ongoing costs of investing in the Fund and other funds. To do so, compare this 5% hypothetical example with the 5% hypothetical examples that appear in the shareholder reports of the other funds. A small balance maintenance fee of $12.00 that is charged once a year may apply for certain accounts with a value of less than $2,000. This fee is not included in the table below. If it was, the estimate of expenses you paid during the period would be higher, and your ending account value lower, by this amount. In addition, each Fund, as a shareholder in the underlying Fidelity Central Funds, will indirectly bear its pro-rata share of the fees and expenses incurred by the underlying Fidelity Central Funds. These fees and expenses are not included in the Fund's annualized expense ratio used to calculate the expense estimate in the table below.
Please note that the expenses shown in the table are meant to highlight your ongoing costs only and do not reflect any transaction costs. Therefore, the second line of the table is useful in comparing ongoing costs only, and will not help you determine the relative total costs of owning different funds. In addition, if these transactional costs were included, your costs would have been higher.
| | Annualized Expense Ratio-A | Beginning
Account Value
January 1, 2016 | Ending
Account Value
June 30, 2016 | Expenses Paid
During Period-B
January 1, 2016
to June 30, 2016 |
| Fidelity Ohio Municipal Income Fund | .48% | | | |
| Actual | | $1,000.00 | $1,051.70 | $2.45 |
| Hypothetical-C | | $1,000.00 | $1,022.48 | $2.41 |
| Fidelity Ohio Municipal Money Market Fund | .27% | | | |
| Actual | | $1,000.00 | $1,000.10 | $1.34 |
| Hypothetical-C | | $1,000.00 | $1,023.52 | $1.36 |
A Annualized expense ratio reflects expenses net of applicable fee waivers.
B Expenses are equal to each Fund's annualized expense ratio, multiplied by the average account value over the period, multiplied by 182/366 (to reflect the one-half year period).
C 5% return per year before expenses
Proxy Voting Results
A special meeting of Fidelity® Ohio Municipal Money Market Fund's shareholders was held on February 12, 2016. The results of votes taken among shareholders on the proposal before them are reported below. Each vote reported represents one dollar of net asset value held on the record date for the meeting.
PROPOSAL 1
| To elect a Board of Trustees. |
| | # of
Votes | % of
Votes |
| Elizabeth S. Acton | | |
| Affirmative | 990,112,248.51 | 94.973 |
| Withheld | 52,412,467.62 | 5.027 |
| TOTAL | 1,042,524,716.13 | 100.000 |
| John Engler | | |
| Affirmative | 979,840,026.26 | 93.988 |
| Withheld | 62,684,689.87 | 6.012 |
| TOTAL | 1,042,524,716.13 | 100.000 |
| Albert R. Gamper, Jr. | | |
| Affirmative | 988,200,285.84 | 94.790 |
| Withheld | 54,324,430.29 | 5.210 |
| TOTAL | 1,042,524,716.13 | 100.000 |
| Robert F. Gartland | | |
| Affirmative | 990,287,516.81 | 94.990 |
| Withheld | 52,237,199.32 | 5.010 |
| TOTAL | 1,042,524,716.13 | 100.000 |
| Abigail P. Johnson | | |
| Affirmative | 986,818,518.63 | 94.657 |
| Withheld | 55,706,197.50 | 5.343 |
| TOTAL | 1,042,524,716.13 | 100.000 |
| Arthur E. Johnson | | |
| Affirmative | 988,490,870.48 | 94.818 |
| Withheld | 54,033,845.65 | 5.182 |
| TOTAL | 1,042,524,716.13 | 100.000 |
| Michael E. Kenneally | | |
| Affirmative | 990,615,595.60 | 95.021 |
| Withheld | 51,909,120.53 | 4.979 |
| TOTAL | 1,042,524,716.13 | 100.000 |
| James H. Keyes | | |
| Affirmative | 989,121,754.10 | 94.878 |
| Withheld | 53,402,962.03 | 5.122 |
| TOTAL | 1,042,524,716.13 | 100.000 |
| Marie L. Knowles | | |
| Affirmative | 987,633,370.10 | 94.735 |
| Withheld | 54,891,346.03 | 5.265 |
| TOTAL | 1,042,524,716.13 | 100.000 |
| Geoffrey A. von Kuhn | | |
| Affirmative | 987,164,185.38 | 94.690 |
| Withheld | 55,360,530.75 | 5.310 |
| TOTAL | 1,042,524,716.13 | 100.000 |
| Proposal 1 reflects trust wide proposal and voting results. |
Corporate Headquarters
245 Summer St.
Boston, MA 02210
www.fidelity.com
OFF-SANN-0816
1.705575.118
Fidelity® Limited Term Municipal Income Fund
Semi-Annual Report June 30, 2016 |
|
Contents
To view a fund's proxy voting guidelines and proxy voting record for the 12-month period ended June 30, visit http://www.fidelity.com/proxyvotingresults or visit the Securities and Exchange Commission's (SEC) web site at http://www.sec.gov.
You may also call 1-800-544-8544 to request a free copy of the proxy voting guidelines.
Standard & Poor's, S&P and S&P 500 are registered service marks of The McGraw-Hill Companies, Inc. and have been licensed for use by Fidelity Distributors Corporation.
Other third-party marks appearing herein are the property of their respective owners.
All other marks appearing herein are registered or unregistered trademarks or service marks of FMR LLC or an affiliated company. © 2016 FMR LLC. All rights reserved.
This report and the financial statements contained herein are submitted for the general information of the shareholders of the Fund. This report is not authorized for distribution to prospective investors in the Fund unless preceded or accompanied by an effective prospectus.
A fund files its complete schedule of portfolio holdings with the SEC for the first and third quarters of each fiscal year on Form N-Q. Forms N-Q are available on the SEC’s web site at http://www.sec.gov. A fund's Forms N-Q may be reviewed and copied at the SEC’s Public Reference Room in Washington, DC. Information regarding the operation of the SEC's Public Reference Room may be obtained by calling 1-800-SEC-0330.
For a complete list of a fund's portfolio holdings, view the most recent holdings listing, semiannual report, or annual report on Fidelity's web site at http://www.fidelity.com, http://www.institutional.fidelity.com, or http://www.401k.com, as applicable.
NOT FDIC INSURED •MAY LOSE VALUE •NO BANK GUARANTEE
Neither the Fund nor Fidelity Distributors Corporation is a bank.
Investment Summary (Unaudited)
Top Five States as of June 30, 2016
| | % of fund's net assets | % of fund's net assets 6 months ago |
| New York | 13.5 | 13.7 |
| Florida | 11.2 | 11.6 |
| Texas | 10.3 | 9.0 |
| Illinois | 8.6 | 8.6 |
| Pennsylvania | 6.2 | 5.2 |
Top Five Sectors as of June 30, 2016
| | % of fund's net assets | % of fund's net assets 6 months ago |
| General Obligations | 42.4 | 42.9 |
| Transportation | 11.8 | 9.4 |
| Special Tax | 10.0 | 11.2 |
| Electric Utilities | 9.1 | 10.1 |
| Health Care | 7.5 | 7.8 |
Quality Diversification (% of fund's net assets)
| As of June 30, 2016 |
| | AAA | 9.3% |
| | AA,A | 71.1% |
| | BBB | 8.5% |
| | BB and Below | 0.9% |
| | Not Rated | 2.0% |
| | Short-Term Investments and Net Other Assets | 8.2% |

| As of December 31, 2015 |
| | AAA | 9.9% |
| | AA,A | 71.2% |
| | BBB | 8.1% |
| | BB and Below | 1.0% |
| | Not Rated | 2.1% |
| | Short-Term Investments and Net Other Assets | 7.7% |

We have used ratings from Moody's Investors Service, Inc. Where Moody's® ratings are not available, we have used S&P® ratings. All ratings are as of the date indicated and do not reflect subsequent changes.
Investments June 30, 2016 (Unaudited)
Showing Percentage of Net Assets
| Municipal Bonds - 91.7% | | | |
| | | Principal Amount (000s) | Value (000s) |
| Alabama - 0.4% | | | |
| Mobile County Board of School Commissioners: | | | |
| Series 2016 A: | | $ | $ |
| 5% 3/1/22 | | 600 | 714 |
| 5% 3/1/23 | | 850 | 1,033 |
| 5% 3/1/24 | | 1,250 | 1,545 |
| 5% 3/1/25 | | 1,250 | 1,570 |
| Series 2016 B: | | | |
| 5% 3/1/22 | | 1,000 | 1,187 |
| 5% 3/1/24 | | 1,000 | 1,232 |
| 5% 3/1/25 | | 1,500 | 1,878 |
| Montgomery Med. Clinic Facilities: | | | |
| 5% 3/1/20 | | 2,890 | 3,234 |
| 5% 3/1/25 | | 1,500 | 1,785 |
|
| TOTAL ALABAMA | | | 14,178 |
|
| Alaska - 0.6% | | | |
| Anchorage Gen. Oblig.: | | | |
| Series A: | | | |
| 5% 9/1/20 | | 1,090 | 1,271 |
| 5% 9/1/22 | | 1,200 | 1,467 |
| Series B: | | | |
| 5% 9/1/18 | | 3,685 | 4,029 |
| 5% 9/1/20 | | 2,000 | 2,333 |
| 5% 9/1/22 | | 1,425 | 1,742 |
| Series C: | | | |
| 5% 9/1/18 | | 1,000 | 1,093 |
| 5% 9/1/19 | | 2,150 | 2,433 |
| 5% 9/1/20 | | 1,260 | 1,470 |
| 5% 9/1/22 | | 1,000 | 1,223 |
| Series D: | | | |
| 5% 9/1/19 | | 3,895 | 4,408 |
| 5% 9/1/20 | | 2,000 | 2,333 |
|
| TOTAL ALASKA | | | 23,802 |
|
| Arizona - 2.3% | | | |
| Arizona Ctfs. of Prtn. Series 2010 A, 5% 10/1/16 (FSA Insured) | | 13,000 | 13,138 |
| Arizona Health Facilities Auth. Rev. (Scottsdale Lincoln Hospitals Proj.) Series 2014 A: | | | |
| 5% 12/1/18 | | 500 | 548 |
| 5% 12/1/19 | | 615 | 696 |
| 5% 12/1/20 | | 820 | 954 |
| 5% 12/1/21 | | 1,105 | 1,317 |
| 5% 12/1/22 | | 800 | 974 |
| 5% 12/1/23 | | 1,000 | 1,242 |
| 5% 12/1/24 | | 1,500 | 1,898 |
| Arizona School Facilities Board Ctfs. of Prtn. Series 2008, 5.5% 9/1/16 | | 1,385 | 1,396 |
| Arizona Wtr. Infrastructure Fin. Auth. Rev. Series 2009 A: | | | |
| 5% 10/1/18 | | 1,000 | 1,097 |
| 5% 10/1/20 (Pre-Refunded to 10/1/19 @ 100) | | 5,180 | 5,879 |
| Glendale Gen. Oblig. Series 2015: | | | |
| 4% 7/1/19 (FSA Insured) | | 600 | 654 |
| 5% 7/1/22 (FSA Insured) | | 1,000 | 1,214 |
| Glendale Trans. Excise Tax Rev.: | | | |
| 5% 7/1/21 (FSA Insured) | | 750 | 891 |
| 5% 7/1/22 (FSA Insured) | | 1,170 | 1,420 |
| 5% 7/1/23 (FSA Insured) | | 1,395 | 1,732 |
| Maricopa County Mesa Unified School District # 4 Series 2016, 4% 7/1/18 | | 1,325 | 1,412 |
| Maricopa County School District #28 Kyrene Elementary Series 2010 B: | | | |
| 4% 7/1/19 | | 900 | 986 |
| 4% 7/1/20 | | 1,360 | 1,526 |
| Phoenix Civic Impt. Corp. Wtr. Sys. Rev. Series 2009 B, 5% 7/1/16 | | 5,090 | 5,090 |
| Phoenix Indl. Solid Waste Disp. Rev. Bonds (Republic Svc., Inc. Proj.) Series 2013, 0.9%, tender 8/1/16 (a)(b) | | 20,880 | 20,880 |
| Pima County Ctfs. of Prtn. Series 2014: | | | |
| 5% 12/1/21 | | 2,210 | 2,629 |
| 5% 12/1/22 | | 2,470 | 2,991 |
| 5% 12/1/23 | | 3,425 | 4,224 |
| Pima County Swr. Sys. Rev.: | | | |
| Series 2011 B, 5% 7/1/19 | | 3,225 | 3,625 |
| Series 2012 A: | | | |
| 5% 7/1/18 | | 825 | 895 |
| 5% 7/1/19 | | 1,550 | 1,742 |
| Salt River Proj. Agricultural Impt. & Pwr. District Elec. Sys. Rev. Series 2009 A, 5% 1/1/26 | | 500 | 551 |
| Univ. Med. Ctr. Corp. Hosp. Rev. Series 2011: | | | |
| 5% 7/1/16 (Escrowed to Maturity) | | 3,055 | 3,055 |
| 5% 7/1/17 (Escrowed to Maturity) | | 3,315 | 3,458 |
| 5% 7/1/18 (Escrowed to Maturity) | | 3,365 | 3,639 |
|
| TOTAL ARIZONA | | | 91,753 |
|
| California - 4.9% | | | |
| Alameda Corridor Trans. Auth. Rev.: | | | |
| Series 2004: | | | |
| 0% 10/1/19 | | 3,335 | 3,237 |
| 0% 10/1/19 | | 265 | 250 |
| Series 2013 A, 5% 10/1/22 | | 2,190 | 2,672 |
| Bay Area Toll Auth. San Francisco Bay Toll Bridge Rev. Bonds 1.5%, tender 4/2/18 (a) | | 5,200 | 5,254 |
| California Gen. Oblig.: | | | |
| Bonds 3%, tender 12/1/19 (a) | | 15,600 | 16,541 |
| 5% 9/1/20 | | 20,000 | 23,370 |
| California Health Facilities Fing. Auth. Rev. Bonds (Children's Hosp. of Orange County Proj.) Series 2012 A, 2.21%, tender 7/7/16 (a) | | 4,000 | 4,016 |
| California Pub. Works Board Lease Rev.: | | | |
| (Dept. of Corrections & Rehab. Proj.) Series 2011 C, 5% 10/1/18 | | 1,750 | 1,914 |
| (Riverside Campus Proj.) Series 2012 H, 5% 4/1/22 | | 1,000 | 1,212 |
| (Univ. Proj.) Series 2011 B: | | | |
| 5% 10/1/18 (Escrowed to Maturity) | | 2,740 | 3,009 |
| 5% 10/1/19 (Escrowed to Maturity) | | 1,490 | 1,696 |
| (Various Cap. Projs.): | | | |
| Series 2011 A: | | | |
| 5% 10/1/18 | | 6,475 | 7,082 |
| 5% 10/1/19 | | 5,000 | 5,657 |
| 5% 10/1/20 | | 2,525 | 2,946 |
| Series 2012 A, 5% 4/1/21 | | 1,000 | 1,182 |
| Series 2012 G, 5% 11/1/22 | | 1,250 | 1,535 |
| (Various Judicial Council Projects) Series 2011 D, 5% 12/1/19 | | 4,100 | 4,664 |
| Series 2009 J, 5% 11/1/17 | | 2,300 | 2,432 |
| Series 2010 A, 5% 3/1/17 | | 5,405 | 5,561 |
| California Statewide Cmntys. Dev. Auth. Rev. Bonds: | | | |
| Series 2002 C, 5%, tender 5/1/17 (a) | | 4,000 | 4,141 |
| Series 2009 E2, 5%, tender 5/1/17 (a) | | 2,050 | 2,122 |
| Golden State Tobacco Securitization Corp. Tobacco Settlement Rev. Series 2013 A, 4% 6/1/21 | | 3,500 | 3,972 |
| Los Angeles County Metropolitan Trans. Auth. Sales Tax Rev. Series 2013 A, 5% 7/1/19 | | 4,400 | 4,961 |
| Los Angeles County Pub. Works Fing. Auth. Lease Rev. Series 2010 A, 5% 8/1/17 | | 5,000 | 5,234 |
| Los Angeles Muni. Impt. Corp. Lease Rev. Series 2012 C: | | | |
| 4.625% 3/1/18 | | 1,500 | 1,597 |
| 5% 3/1/19 | | 2,935 | 3,251 |
| Los Angeles Unified School District Series 2006 F, 5% 7/1/30 (Pre-Refunded to 7/1/16 @ 100) | | 1,900 | 1,900 |
| Los Angeles Unified School District Ctfs. of Prtn. (Multiple Properties Proj.) Series 2010 A: | | | |
| 5% 12/1/16 | | 2,025 | 2,062 |
| 5% 12/1/17 | | 9,790 | 10,385 |
| Monterey County Pub. Impt. Corp. Ctfs. of Prtn. (Refing. Proj.) Series 2009, 5% 8/1/17 (FSA Insured) | | 2,130 | 2,226 |
| Northern California Pwr. Agcy. Rev. (Hydroelectric #1 Proj.) Series 2010 A, 5% 7/1/18 | | 2,000 | 2,167 |
| Northern California Transmission Agcy. Rev. (Ref. Calif Ore Proj.) Series 2009 A, 3.5% 5/1/17 | | 2,500 | 2,560 |
| Oakland Unified School District Alameda County Series 2013, 5.5% 8/1/23 | | 1,000 | 1,220 |
| Port of Oakland Rev. Series 2012 P, 5% 5/1/21 (b) | | 2,500 | 2,938 |
| Rancho Cucamonga Redev. Agcy. (Rancho Redev. Proj.): | | | |
| 5% 9/1/23 (FSA Insured) | | 1,350 | 1,687 |
| 5% 9/1/24 (FSA Insured) | | 2,300 | 2,932 |
| Riverside County Asset Leasing Rev. (Riverside Cap. Proj.) Series 2012 A: | | | |
| 4% 6/1/17 | | 1,750 | 1,802 |
| 5% 6/1/17 | | 3,700 | 3,844 |
| 5% 6/1/18 | | 6,470 | 6,990 |
| Sacramento Muni. Util. District Elec. Rev. Series 2011 X, 5% 8/15/21 | | 4,000 | 4,804 |
| San Bernardino County Ctfs. of Prtn. (Arrowhead Proj.) Series 2009 A: | | | |
| 5% 8/1/16 | | 5,450 | 5,470 |
| 5% 8/1/18 | | 8,000 | 8,582 |
| San Diego Cmnty. College District Series 2007, 0% 8/1/16 (FSA Insured) | | 1,160 | 1,159 |
| San Pablo Calif Redev. Agcy. Series 2014 A, 5% 6/15/24 (FSA Insured) | | 1,380 | 1,732 |
| State Ctr. Cmnty. College District Series 2007 A, 5% 8/1/26 (Pre-Refunded to 8/1/17 @ 100) | | 9,480 | 9,930 |
| Stockton Unified School District Gen. Oblig. 5% 7/1/18 (FSA Insured) | | 1,035 | 1,122 |
|
| TOTAL CALIFORNIA | | | 195,020 |
|
| Colorado - 0.5% | | | |
| Colorado Health Facilities Auth. Rev. Bonds Series 2008 D3, 5%, tender 11/12/21 (a) | | 5,285 | 6,161 |
| Colorado Reg'l. Trans. District Ctfs. of Prtn.: | | | |
| Series 2013 A, 5% 6/1/23 | | 4,500 | 5,513 |
| Series 2014 A, 5% 6/1/23 | | 3,860 | 4,729 |
| E-470 Pub. Hwy. Auth. Rev.: | | | |
| Series 2008 D1, 5.25% 9/1/16 (Nat'l. Pub. Fin. Guarantee Corp. Insured) | | 2,360 | 2,378 |
| Series 2015 A: | | | |
| 5% 9/1/19 | | 1,000 | 1,118 |
| 5% 9/1/20 | | 1,000 | 1,152 |
| Univ. of Colorado Enterprise Sys. Rev. Series 2009 A, 5% 6/1/17 | | 500 | 520 |
|
| TOTAL COLORADO | | | 21,571 |
|
| Connecticut - 2.7% | | | |
| Connecticut Gen. Oblig.: | | | |
| Series 2005 B, 5.25% 6/1/17 (AMBAC Insured) | | 1,985 | 2,068 |
| Series 2009 B, 5% 3/1/18 | | 3,470 | 3,707 |
| Series 2012 C, 5% 6/1/21 | | 23,420 | 27,401 |
| Series 2013 A, 0.75% 3/1/17 (a) | | 1,400 | 1,400 |
| Series 2014 C, 5% 12/15/16 | | 16,070 | 16,389 |
| Series 2015 E, 5% 8/1/17 | | 26,395 | 27,619 |
| Series 2016 A, 4% 3/15/18 | | 13,900 | 14,639 |
| Connecticut Health & Edl. Facilities Auth. Rev. Bonds (Ascension Health Cr. Group Proj.) Series 1998 B, 1.55%, tender 2/1/17 (a) | | 2,715 | 2,730 |
| Connecticut Hsg. Fin. Auth. Series 2013 B2, 4% 11/15/32 | | 6,380 | 6,883 |
| Connecticut Spl. Tax Oblig. Trans. Infrastructure Rev. Series 2011 A, 5% 12/1/18 | | 5,575 | 6,128 |
|
| TOTAL CONNECTICUT | | | 108,964 |
|
| Delaware, New Jersey - 0.1% | | | |
| Delaware River & Bay Auth. Rev. Series 2014 C: | | | |
| 5% 1/1/20 | | 2,500 | 2,836 |
| 5% 1/1/21 | | 2,000 | 2,324 |
|
| TOTAL DELAWARE, NEW JERSEY | | | 5,160 |
|
| District Of Columbia - 0.4% | | | |
| District of Columbia Univ. Rev. Bonds (Georgetown Univ. Proj.) Series 2001 B, 4.7%, tender 4/1/18 (a) | | 8,500 | 9,038 |
| Metropolitan Washington DC Arpts. Auth. Sys. Rev.: | | | |
| Series 2012 A, 5% 10/1/22 (b) | | 6,325 | 7,621 |
| Series 2014 A, 5% 10/1/23 (b) | | 445 | 546 |
|
| TOTAL DISTRICT OF COLUMBIA | | | 17,205 |
|
| Florida - 11.2% | | | |
| Brevard County School Board Ctfs. of Prtn.: | | | |
| Series 2014, 5% 7/1/21 | | 1,000 | 1,179 |
| Series 2015 C: | | | |
| 5% 7/1/21 | | 650 | 766 |
| 5% 7/1/22 | | 3,725 | 4,485 |
| 5% 7/1/23 | | 3,000 | 3,681 |
| Broward County Arpt. Sys. Rev.: | | | |
| Series 2012 Q1, 5% 10/1/21 | | 1,000 | 1,193 |
| Series A: | | | |
| 5% 10/1/22 (b) | | 3,000 | 3,591 |
| 5% 10/1/23 (b) | | 4,020 | 4,895 |
| Broward County School Board Ctfs. of Prtn.: | | | |
| Series 2012 A: | | | |
| 5% 7/1/19 | | 7,000 | 7,837 |
| 5% 7/1/20 | | 15,070 | 17,375 |
| Series 2015 A: | | | |
| 5% 7/1/19 | | 2,000 | 2,239 |
| 5% 7/1/20 | | 4,000 | 4,612 |
| 5% 7/1/21 | | 4,500 | 5,318 |
| 5% 7/1/22 | | 3,500 | 4,237 |
| 5% 7/1/23 | | 2,750 | 3,401 |
| 5% 7/1/24 | | 1,320 | 1,663 |
| Series 2015 B: | | | |
| 5% 7/1/19 | | 2,000 | 2,239 |
| 5% 7/1/20 | | 3,000 | 3,459 |
| 5% 7/1/21 | | 6,235 | 7,368 |
| 5% 7/1/22 | | 1,275 | 1,543 |
| 5% 7/1/23 | | 2,750 | 3,401 |
| 5% 7/1/24 | | 1,145 | 1,443 |
| Series A, 5.25% 7/1/17 (AMBAC Insured) | | 7,015 | 7,332 |
| Citizens Property Ins. Corp.: | | | |
| Series 2009 A1, 6% 6/1/17 | | 1,275 | 1,335 |
| Series 2010 A1, 5.25% 6/1/17 | | 4,125 | 4,291 |
| Series 2012 A1, 5% 6/1/17 | | 18,095 | 18,784 |
| Clearwater Wtr. and Swr. Rev. Series 2011: | | | |
| 4% 12/1/16 | | 1,265 | 1,283 |
| 5% 12/1/17 | | 1,685 | 1,789 |
| 5% 12/1/18 | | 685 | 751 |
| 5% 12/1/19 | | 1,820 | 2,062 |
| 5% 12/1/20 | | 1,000 | 1,165 |
| Collier County Indl. Dev. Auth. Healthcare Facilities Rev. (NCH Healthcare Sys. Proj.) Series 2011: | | | |
| 5% 10/1/16 | | 1,530 | 1,546 |
| 5% 10/1/17 | | 1,455 | 1,531 |
| Florida Board of Ed. Lottery Rev. Series 2011 A, 5% 7/1/20 | | 8,600 | 9,959 |
| Florida Board of Ed. Pub. Ed. Cap. Outlay Series 2009 C, 5% 6/1/20 | | 3,625 | 4,103 |
| Florida Dept. of Envir. Protection Rev. Series 2012 A, 5% 7/1/19 | | 15,800 | 17,729 |
| Florida Dev. Fin. Corp. Healthcare Facility Rev. (Univ. Health Proj.) Series 2013 A: | | | |
| 5% 2/1/17 | | 700 | 713 |
| 5% 2/1/18 | | 1,790 | 1,871 |
| 5% 2/1/19 | | 1,450 | 1,549 |
| 5% 2/1/20 | | 2,025 | 2,201 |
| Florida Gen. Oblig. Series 2015 A, 4% 7/1/17 | | 17,295 | 17,888 |
| Florida Mid-Bay Bridge Auth. Rev. Series 2015 A: | | | |
| 5% 10/1/21 | | 1,030 | 1,200 |
| 5% 10/1/22 | | 2,000 | 2,377 |
| 5% 10/1/23 | | 1,270 | 1,526 |
| 5% 10/1/24 | | 2,000 | 2,433 |
| 5% 10/1/25 | | 1,750 | 2,144 |
| 5% 10/1/26 | | 2,000 | 2,434 |
| Florida Muni. Pwr. Agcy. Rev. (Stanton II Proj.) Series 2012 A, 5% 10/1/18 | | 2,850 | 3,117 |
| Greater Orlando Aviation Auth. Arpt. Facilities Rev. Series 2011 C: | | | |
| 5% 10/1/19 | | 1,705 | 1,923 |
| 5% 10/1/20 | | 1,000 | 1,163 |
| Halifax Hosp. Med. Ctr. Rev. 5% 6/1/23 | | 1,325 | 1,603 |
| Hillsborough County School Board Ctfs. of Prtn. Series 2015 A, 4% 7/1/17 | | 1,500 | 1,550 |
| Indian River County School Board Ctfs. of Prtn. Series 2014: | | | |
| 5% 7/1/20 | | 935 | 1,079 |
| 5% 7/1/22 | | 2,000 | 2,418 |
| 5% 7/1/23 | | 2,000 | 2,466 |
| Indian River County Wtr. & Swr. Rev. 5% 9/1/17 | | 1,000 | 1,051 |
| JEA Wtr. & Swr. Sys. Rev. Series 2010 D, 5% 10/1/21 | | 1,945 | 2,241 |
| Manatee County Rev. Series 2013: | | | |
| 5% 10/1/19 | | 1,250 | 1,415 |
| 5% 10/1/20 | | 2,000 | 2,332 |
| 5% 10/1/21 | | 2,000 | 2,389 |
| 5% 10/1/22 | | 1,000 | 1,224 |
| Miami-Dade County Expressway Auth.: | | | |
| (Waste Mgmt., Inc. of Florida Proj.): | | | |
| Series 2013, 5% 7/1/19 | | 2,000 | 2,240 |
| 5% 7/1/20 | | 1,000 | 1,155 |
| 5% 7/1/21 | | 2,000 | 2,370 |
| 5% 7/1/22 | | 2,000 | 2,429 |
| 5% 7/1/23 | | 2,000 | 2,430 |
| Series 2014 A, 5% 7/1/24 | | 625 | 787 |
| Series 2014 B: | | | |
| 5% 7/1/22 | | 1,500 | 1,822 |
| 5% 7/1/23 | | 3,250 | 4,021 |
| Miami-Dade County Gen. Oblig. (Parks Prog.) Series 2015 A, 5% 11/1/22 | | 3,880 | 4,751 |
| Miami-Dade County School Board Ctfs. of Prtn.: | | | |
| Series 2014 D: | | | |
| 5% 11/1/20 | | 4,875 | 5,677 |
| 5% 11/1/21 | | 6,275 | 7,493 |
| 5% 11/1/22 | | 2,915 | 3,561 |
| 5% 11/1/23 | | 7,650 | 9,584 |
| Series 2015 A: | | | |
| 5% 5/1/19 | | 1,000 | 1,113 |
| 5% 5/1/20 | | 2,095 | 2,405 |
| 5% 5/1/21 | | 4,000 | 4,720 |
| 5% 5/1/22 | | 3,720 | 4,496 |
| 5% 5/1/23 | | 6,500 | 8,064 |
| Series 2015 B, 5% 5/1/24 | | 29,560 | 36,968 |
| Series 2015 D, 5% 2/1/24 | | 14,945 | 18,614 |
| Series 2016 A, 5% 8/1/27 | | 5,560 | 7,121 |
| Miami-Dade County School District Series 2015, 5% 3/15/17 | | 3,225 | 3,322 |
| Miami-Dade County Transit Sales Surtax Rev. Series 2012, 5% 7/1/19 | | 1,250 | 1,399 |
| Orange County Health Facilities Auth.: | | | |
| (Orlando Health, Inc.) Series 2009, 5% 10/1/16 | | 1,325 | 1,339 |
| Series 2009, 5.25% 10/1/19 | | 1,245 | 1,413 |
| Orange County School Board Ctfs. of Prtn. Series 2015 C, 5% 8/1/18 | | 1,500 | 1,629 |
| Orlando & Orange County Expressway Auth. Rev. Series 2012, 5% 7/1/19 | | 1,000 | 1,121 |
| Orlando Utils. Commission Util. Sys. Rev.: | | | |
| Series 2009 C, 5% 10/1/17 | | 1,500 | 1,582 |
| Series 2010 C, 5% 10/1/17 | | 1,895 | 1,999 |
| Series 2011 B: | | | |
| 5% 10/1/18 | | 2,250 | 2,464 |
| 5% 10/1/19 | | 2,325 | 2,636 |
| Palm Beach County Health Facilities Auth. Hosp. Rev. Series 2014: | | | |
| 4% 12/1/19 | | 1,000 | 1,079 |
| 5% 12/1/20 | | 880 | 998 |
| 5% 12/1/21 | | 1,100 | 1,271 |
| Palm Beach County School Board Ctfs. of Prtn.: | | | |
| Series 2014 B: | | | |
| 4% 8/1/19 | | 4,000 | 4,357 |
| 4% 8/1/21 | | 4,040 | 4,569 |
| 5% 8/1/17 | | 1,170 | 1,224 |
| 5% 8/1/19 | | 3,000 | 3,358 |
| 5% 8/1/21 | | 5,300 | 6,253 |
| Series 2015 B: | | | |
| 5% 8/1/19 | | 2,735 | 3,061 |
| 5% 8/1/20 | | 1,750 | 2,016 |
| Pasco County School District Sales Tax Rev. Series 2013: | | | |
| 5% 10/1/18 | | 1,250 | 1,366 |
| 5% 10/1/19 | | 1,100 | 1,242 |
| 5% 10/1/20 | | 1,000 | 1,162 |
| 5% 10/1/21 | | 1,000 | 1,190 |
| 5% 10/1/22 | | 1,000 | 1,222 |
| Pasco County Solid Waste Disp. & Resource Recovery Sys. Rev.: | | | |
| Series 2011: | | | |
| 5% 10/1/17 (b) | | 4,465 | 4,696 |
| 5% 10/1/19 (b) | | 2,025 | 2,273 |
| 5% 10/1/18 (b) | | 2,745 | 2,985 |
| Tallahassee Health Facilities Rev. (Tallahassee Memorial Healthcare, Inc. Proj.) Series 2016 A, 5% 12/1/21 | | 1,000 | 1,170 |
| Tampa Bay Wtr. Reg'l. Wtr. Supply Auth. Util. Sys. Rev.: | | | |
| Series 2011 B: | | | |
| 5% 10/1/18 (Escrowed to Maturity) | | 2,440 | 2,671 |
| 5% 10/1/18 (Escrowed to Maturity) | | 2,260 | 2,477 |
| Series 2011, 5% 10/1/19 | | 5,590 | 6,339 |
| Tampa Health Sys. Rev. (Baycare Health Sys. Proj.) Series 2010: | | | |
| 5% 11/15/16 | | 2,500 | 2,541 |
| 5% 11/15/17 | | 1,605 | 1,702 |
| Tampa Solid Waste Sys. Rev. Series 2010: | | | |
| 5% 10/1/16 (FSA Insured) (b) | | 6,000 | 6,061 |
| 5% 10/1/17 (FSA Insured) (b) | | 5,000 | 5,260 |
| Tampa Tax Allocation (H. Lee Moffitt Cancer Ctr. Proj.) Series 2012 A, 5% 9/1/20 | | 1,800 | 2,072 |
| Titusville Wtr. & Swr. Rev. Series 2010, 5% 10/1/17 (Assured Guaranty Corp. Insured) | | 1,135 | 1,197 |
| Volusia County School Board Ctfs. of Prtn. (Master Lease Prog.) Series 2014 B: | | | |
| 5% 8/1/18 | | 500 | 544 |
| 5% 8/1/19 | | 310 | 348 |
|
| TOTAL FLORIDA | | | 449,321 |
|
| Georgia - 2.9% | | | |
| Atlanta Arpt. Rev.: | | | |
| 5% 1/1/22 | | 1,000 | 1,206 |
| 5% 1/1/23 | | 1,000 | 1,236 |
| 5% 1/1/24 | | 1,150 | 1,454 |
| Burke County Indl. Dev. Auth. Poll. Cont. Rev. Bonds: | | | |
| (Oglethorpe Pwr. Corp. Vogtle Proj.) Series 2013 A, 2.4%, tender 4/1/20 (a) | | 12,500 | 12,926 |
| 2.2%, tender 4/2/19 (a) | | 9,700 | 9,945 |
| Fulton County Wtr. & Swr. Rev. Series 2011: | | | |
| 5% 1/1/19 | | 4,000 | 4,419 |
| 5% 1/1/20 | | 4,000 | 4,565 |
| Georgia Gen. Oblig. Series 2014 D, 5% 7/1/16 | | 23,900 | 23,900 |
| Georgia Muni. Elec. Auth. Pwr. Rev.: | | | |
| (Combined Cycle Proj.) Series A, 5% 11/1/18 | | 2,000 | 2,194 |
| (Prerefunded Proj.) Series 2008 D: | | | |
| 5.75% 1/1/19 (Pre-Refunded to 7/1/18 @ 100) | | 11,020 | 12,125 |
| 5.75% 1/1/20 (Pre-Refunded to 7/1/18 @ 100) | | 2,630 | 2,894 |
| (Proj. One) Series 2008 A, 5.25% 1/1/17 (Berkshire Hathaway Assurance Corp. Insured) | | 7,925 | 8,107 |
| (Unrefunded Balance Proj.) Series 2008: | | | |
| 5.75% 1/1/19 | | 3,870 | 4,240 |
| 5.75% 1/1/20 | | 925 | 1,013 |
| Series B, 5% 1/1/17 | | 2,750 | 2,810 |
| Series GG: | | | |
| 5% 1/1/20 | | 675 | 767 |
| 5% 1/1/21 | | 1,670 | 1,959 |
| Georgia Muni. Gas Auth. Rev. (Gas Portfolio III Proj.): | | | |
| Series 2014 U: | | | |
| 5% 10/1/19 | | 1,500 | 1,688 |
| 5% 10/1/22 | | 1,000 | 1,206 |
| 5% 10/1/23 | | 2,420 | 2,969 |
| Series R, 5% 10/1/21 | | 5,000 | 5,920 |
| Monroe County Dev. Auth. Poll. Cont. Rev. Bonds (Georgia Pwr. Co. Plant Scherer Proj.) Series 2009, 2.35%, tender 12/11/20 (a) | | 4,715 | 4,903 |
| Private Colleges & Univs. Auth. Rev. (The Savannah College of Arts and Design Projs.) Series 2014, 5% 4/1/21 | | 2,000 | 2,312 |
| Richmond County Hosp. Auth. (Univ. Health Svcs., Inc. Proj.) Series 2009, 5% 1/1/18 | | 1,530 | 1,627 |
|
| TOTAL GEORGIA | | | 116,385 |
|
| Hawaii - 0.4% | | | |
| Hawaii Arpts. Sys. Rev. Series 2011, 5% 7/1/19 (b) | | 4,000 | 4,456 |
| State of Hawaii Dept. of Trans. Series 2013: | | | |
| 5% 8/1/17 (b) | | 2,300 | 2,401 |
| 5% 8/1/19 (b) | | 1,400 | 1,559 |
| 5% 8/1/20 (b) | | 3,050 | 3,495 |
| 5% 8/1/21 (b) | | 550 | 641 |
| 5% 8/1/22 (b) | | 2,075 | 2,464 |
| 5% 8/1/23 (b) | | 1,435 | 1,737 |
|
| TOTAL HAWAII | | | 16,753 |
|
| Illinois - 8.0% | | | |
| Chicago Board of Ed.: | | | |
| Series 1998 B1, 0% 12/1/21 (FGIC Insured) | | 10,000 | 8,335 |
| Series 2008 C: | | | |
| 5.25% 12/1/23 | | 7,665 | 7,130 |
| 5.25% 12/1/24 | | 955 | 880 |
| Series 2009 D: | | | |
| 5% 12/1/17 (Assured Guaranty Corp. Insured) | | 4,115 | 4,316 |
| 5% 12/1/18 (Assured Guaranty Corp. Insured) | | 2,335 | 2,462 |
| Series 2009: | | | |
| 4% 12/1/16 | | 240 | 243 |
| 4% 12/1/16 | | 710 | 716 |
| Series 2010 F, 5% 12/1/20 | | 760 | 694 |
| Chicago Gen. Oblig.: | | | |
| (City Colleges Proj.) Series 1999: | | | |
| 0% 1/1/17 (Nat'l. Pub. Fin. Guarantee Corp. Insured) | | 7,200 | 7,126 |
| 0% 1/1/18 (Nat'l. Pub. Fin. Guarantee Corp. Insured) | | 3,000 | 2,893 |
| 0% 1/1/19 (Nat'l. Pub. Fin. Guarantee Corp. Insured) | | 9,805 | 9,164 |
| 0% 1/1/20 (Nat'l. Pub. Fin. Guarantee Corp. Insured) | | 14,755 | 13,314 |
| Series 2012 C, 5% 1/1/23 | | 2,120 | 2,197 |
| 4.5% 1/1/20 | | 1,150 | 1,179 |
| 5% 1/1/23 | | 2,920 | 3,043 |
| Chicago Metropolitan Wtr. Reclamation District of Greater Chicago: | | | |
| Series 2014 C, 5% 12/1/17 | | 3,975 | 4,200 |
| Series 2014 D, 5% 12/1/17 | | 3,425 | 3,619 |
| Chicago Midway Arpt. Rev.: | | | |
| Series 2014 B: | | | |
| 5% 1/1/20 | | 625 | 712 |
| 5% 1/1/21 | | 400 | 467 |
| 5% 1/1/23 | | 2,500 | 3,051 |
| 5% 1/1/22 | | 5,000 | 5,979 |
| 5% 1/1/23 | | 5,900 | 7,200 |
| Chicago Motor Fuel Tax Rev. Series 2013: | | | |
| 5% 1/1/19 | | 250 | 263 |
| 5% 1/1/20 | | 300 | 320 |
| 5% 1/1/21 | | 400 | 430 |
| 5% 1/1/22 | | 300 | 326 |
| 5% 1/1/23 | | 535 | 584 |
| Chicago O'Hare Int'l. Arpt. Rev.: | | | |
| Series 2010 D, 5.25% 1/1/17 (b) | | 1,000 | 1,022 |
| Series 2011 B, 5% 1/1/18 | | 6,500 | 6,908 |
| Series 2012 A, 5% 1/1/21 | | 1,400 | 1,630 |
| Series 2012 B: | | | |
| 4% 1/1/17 (b) | | 4,100 | 4,165 |
| 5% 1/1/21 (b) | | 4,605 | 5,293 |
| Series 2013 B, 5% 1/1/22 | | 4,000 | 4,774 |
| Series 2013 D, 5% 1/1/22 | | 3,220 | 3,843 |
| Chicago Park District Gen. Oblig. Series 2014 D, 4% 1/1/17 | | 1,050 | 1,065 |
| Chicago Transit Auth. Cap. Grant Receipts Rev.: | | | |
| 5% 6/1/19 (Assured Guaranty Corp. Insured) | | 2,085 | 2,119 |
| 5% 6/1/19 (Pre-Refunded to 12/1/16 @ 100) | | 415 | 423 |
| Chicago Wastewtr. Transmission Rev. Series 2012: | | | |
| 5% 1/1/19 | | 1,310 | 1,415 |
| 5% 1/1/23 | | 1,200 | 1,387 |
| Cook County Gen. Oblig.: | | | |
| Series 2009 C, 5% 11/15/21 | | 8,575 | 9,456 |
| Series 2010 A, 5.25% 11/15/22 | | 4,960 | 5,643 |
| Series 2011 A, 5.25% 11/15/22 | | 1,000 | 1,168 |
| Series 2012 C: | | | |
| 5% 11/15/19 | | 3,200 | 3,555 |
| 5% 11/15/20 | | 7,210 | 8,179 |
| 5% 11/15/21 | | 4,970 | 5,743 |
| 5% 11/15/22 | | 1,250 | 1,470 |
| Series 2014 A: | | | |
| 5% 11/15/20 | | 1,000 | 1,134 |
| 5% 11/15/21 | | 500 | 578 |
| 5% 11/15/22 | | 1,000 | 1,176 |
| Cook County Thorton Township High School District #205 5.5% 12/1/16 (Assured Guaranty Corp. Insured) | | 2,500 | 2,549 |
| Illinois Edl. Facilities Auth. Rev. Bonds: | | | |
| (Univ. of Chicago Proj.) Series B2, 1.55%, tender 2/13/30 (a) | | 10,000 | 10,148 |
| Series 2001 B3, 0.5%, tender 3/7/17 (a) | | 6,000 | 5,982 |
| Illinois Fin. Auth. Rev.: | | | |
| (Palos Cmnty. Hosp. Proj.) Series 2010 C, 5% 5/15/17 | | 3,520 | 3,643 |
| (Provena Health Proj.) Series 2010 A, 5.75% 5/1/19 | | 2,650 | 2,948 |
| (Rush Univ. Med. Ctr. Proj.) Series 2006 B, 5% 11/1/16 (Escrowed to Maturity) | | 1,700 | 1,724 |
| Bonds Series E, 2.25%, tender 4/29/22 (a) | | 22,930 | 23,975 |
| Series 2008 D, 6.25% 11/1/28 (Pre-Refunded to 11/1/18 @ 100) | | 2,065 | 2,329 |
| Series 2012 A, 5% 5/15/23 | | 1,300 | 1,536 |
| Series 2012: | | | |
| 5% 9/1/18 | | 1,160 | 1,244 |
| 5% 9/1/19 | | 1,115 | 1,229 |
| 5% 9/1/20 | | 1,470 | 1,673 |
| 5% 9/1/21 | | 2,045 | 2,380 |
| 5% 9/1/22 | | 3,530 | 4,187 |
| Series 2015 A: | | | |
| 5% 11/15/24 | | 1,525 | 1,901 |
| 5% 11/15/25 | | 1,950 | 2,464 |
| 5% 11/15/26 | | 2,000 | 2,481 |
| 5% 11/15/20 | | 1,650 | 1,922 |
| 5% 11/15/22 | | 500 | 607 |
| 5% 11/15/24 | | 1,955 | 2,457 |
| Illinois Gen. Oblig.: | | | |
| Series 2004, 5% 11/1/16 | | 11,000 | 11,140 |
| Series 2005, 5% 4/1/17 (AMBAC Insured) | | 8,050 | 8,075 |
| Series 2007 B, 5% 1/1/17 | | 9,835 | 10,024 |
| Series 2010, 5% 1/1/21 (FSA Insured) | | 1,600 | 1,751 |
| Series 2012: | | | |
| 5% 3/1/19 | | 5,500 | 5,931 |
| 5% 8/1/19 | | 2,660 | 2,898 |
| 5% 8/1/20 | | 6,900 | 7,538 |
| 5% 8/1/21 | | 1,400 | 1,547 |
| 5% 8/1/22 | | 5,800 | 6,477 |
| Series 2013, 5% 7/1/22 | | 1,265 | 1,411 |
| Series 2014, 5% 2/1/22 | | 3,000 | 3,332 |
| Illinois Health Facilities Auth. Rev. Series 2003 A, 5% 5/15/17 (FSA Insured) | | 2,150 | 2,230 |
| Illinois Sales Tax Rev. Series 2009 B, 4.5% 6/15/17 | | 6,075 | 6,290 |
| Illinois Toll Hwy. Auth. Toll Hwy. Rev. Series 2006 A2, 5% 1/1/31 (Pre-Refunded to 7/1/16 @ 100) | | 2,100 | 2,100 |
| McHenry County Conservation District Gen. Oblig.: | | | |
| Series 2014: | | | |
| 5% 2/1/19 | | 2,285 | 2,527 |
| 5% 2/1/20 | | 2,275 | 2,598 |
| Series 2014. 5% 2/1/23 | | 2,225 | 2,723 |
| Will County Cmnty. Unit School District #365-U: | | | |
| 0% 11/1/16 (Escrowed to Maturity) | | 740 | 738 |
| 0% 11/1/16 (FSA Insured) | | 2,235 | 2,228 |
|
| TOTAL ILLINOIS | | | 321,926 |
|
| Indiana - 2.6% | | | |
| Indiana Fin. Auth. Hosp. Rev. Series 2013: | | | |
| 5% 8/15/22 | | 700 | 848 |
| 5% 8/15/23 | | 1,000 | 1,235 |
| Indiana Fin. Auth. Rev.: | | | |
| Series 2010 A, 5% 2/1/17 | | 2,800 | 2,872 |
| Series 2012: | | | |
| 5% 3/1/20 | | 650 | 727 |
| 5% 3/1/21 | | 1,225 | 1,402 |
| Indiana Fin. Auth. Wastewtr. Util. Rev. (CWA Auth. Proj.): | | | |
| Series 2012 A: | | | |
| 5% 10/1/20 | | 825 | 958 |
| 5% 10/1/22 | | 1,600 | 1,947 |
| Series 2014 A: | | | |
| 5% 10/1/20 | | 375 | 434 |
| 5% 10/1/21 | | 380 | 450 |
| 5% 10/1/22 | | 675 | 816 |
| Series 2015 A: | | | |
| 5% 10/1/24 | | 1,495 | 1,877 |
| 5% 10/1/25 | | 1,625 | 2,070 |
| Indiana Health & Edl. Facilities Fing. Auth. Rev. Bonds (Ascension Health Sr. Cr. Group Proj.) Series 2006 B1, 4.1%, tender 11/3/16 (a) | | 4,000 | 4,046 |
| Indiana Health Facility Fing. Auth. Rev. Bonds (Ascension Health Cr. Group Proj.) Series 2001 A2, 1.6%, tender 2/1/17 (a) | | 9,900 | 9,957 |
| Indiana Muni. Pwr. Agcy. Pwr. Supply Sys. Rev. Series 2011 A: | | | |
| 5% 1/1/19 | | 1,470 | 1,624 |
| 5% 1/1/20 | | 1,250 | 1,425 |
| Indianapolis Local Pub. Impt. Series 2016: | | | |
| 5% 1/1/21 (b) | | 2,750 | 3,188 |
| 5% 1/1/23 (b) | | 1,830 | 2,213 |
| 5% 1/1/24 (b) | | 2,775 | 3,410 |
| 5% 1/1/25 (b) | | 2,910 | 3,627 |
| Indianapolis Thermal Energy Sys. Series 2010 B: | | | |
| 5% 10/1/16 | | 5,000 | 5,051 |
| 5% 10/1/17 | | 5,000 | 5,259 |
| Lake Central Multi-District School Bldg. Corp. Series 2012 B: | | | |
| 4% 1/15/19 | | 1,000 | 1,075 |
| 4% 1/15/20 | | 1,345 | 1,483 |
| 4% 1/15/21 | | 1,250 | 1,401 |
| 5% 7/15/19 | | 1,680 | 1,881 |
| 5% 7/15/20 | | 1,170 | 1,353 |
| 5% 7/15/21 | | 1,000 | 1,179 |
| Purdue Univ. Rev.: | | | |
| (Student Facilities Sys. Proj.) Series 2009 B: | | | |
| 4% 7/1/17 (Escrowed to Maturity) | | 500 | 517 |
| 5% 7/1/16 | | 500 | 500 |
| Series Z-1: | | | |
| 5% 7/1/16 | | 1,215 | 1,215 |
| 5% 7/1/17 | | 1,000 | 1,044 |
| 5% 7/1/18 | | 1,500 | 1,628 |
| Rockport Poll. Cont. Rev. Bonds (Indiana Michigan Pwr. Co. Proj. Series 2009 B, 1.75%, tender 6/1/18 (a) | | 8,500 | 8,570 |
| Univ. of Southern Indiana Rev. Series J, 5% 10/1/16 (Assured Guaranty Corp. Insured) | | 1,165 | 1,177 |
| Whiting Envir. Facilities Rev. Bonds (BP Products North America, Inc. Proj.) Series 2015, 5%, tender 11/1/22 (a)(b) | | 20,745 | 24,516 |
|
| TOTAL INDIANA | | | 102,975 |
|
| Kansas - 0.4% | | | |
| Kansas Dev. Fin. Agcy. (Adventist Health Sys./Sunbelt Obligated Group Proj.) Series 2009 D, 5% 11/15/16 | | 875 | 889 |
| Wichita Hosp. Facilities Rev.: | | | |
| (Via Christi Health Sys., Inc. Proj.) Series 2009 III A, 5% 11/15/16 (Escrowed to Maturity) | | 5,410 | 5,496 |
| Series 2011 IV A: | | | |
| 5% 11/15/18 (Escrowed to Maturity) | | 2,250 | 2,471 |
| 5% 11/15/20 (Escrowed to Maturity) | | 2,745 | 3,215 |
| Wyandotte County/Kansas City Unified Govt. Util. Sys. Rev. Series 2016 A: | | | |
| 5% 9/1/22 | | 500 | 606 |
| 5% 9/1/23 | | 725 | 895 |
| 5% 9/1/25 | | 800 | 1,021 |
|
| TOTAL KANSAS | | | 14,593 |
|
| Kentucky - 0.9% | | | |
| Kentucky Econ. Dev. Fin. Auth. Bonds Series 2009 B, 2.7%, tender 11/10/21 (a) | | 9,000 | 9,439 |
| Kentucky Econ. Dev. Fin. Auth. Hosp. Rev. Series 2015 A: | | | |
| 5% 6/1/19 | | 1,000 | 1,106 |
| 5% 6/1/20 | | 1,410 | 1,604 |
| 5% 6/1/21 | | 1,000 | 1,154 |
| 5% 6/1/22 | | 1,560 | 1,830 |
| 5% 6/1/24 | | 1,690 | 2,023 |
| Kentucky State Property & Buildings Commission Rev.: | | | |
| (#82 Proj.) 5.25% 10/1/17 (FSA Insured) | | 2,450 | 2,585 |
| Series 2016, 3% 11/1/17 | | 1,630 | 1,677 |
| Louisville/Jefferson County Metropolitan Govt. Poll. Cont. Rev. Bonds (Louisville Gas and Elec. Co. Proj.): | | | |
| Series 2003 A, 1.65%, tender 4/3/17 (a) | | 6,000 | 6,032 |
| Series 2007 B: | | | |
| 1.15%, tender 6/1/17 (a) | | 2,600 | 2,605 |
| 1.6%, tender 6/1/17 (a) | | 8,050 | 8,094 |
|
| TOTAL KENTUCKY | | | 38,149 |
|
| Louisiana - 2.2% | | | |
| Louisiana Citizens Property Ins. Corp. Assessment Rev. Series 2015: | | | |
| 5% 6/1/19 | | 9,350 | 10,406 |
| 5% 6/1/21 (FSA Insured) | | 5,000 | 5,889 |
| Louisiana Gas & Fuel Tax Rev. Bonds Series 2013 B, 0.79%, tender 7/1/16 (a) | | 25,000 | 24,960 |
| Louisiana Gen. Oblig.: | | | |
| Series 2012 A, 5% 8/1/22 | | 1,515 | 1,821 |
| Series 2014 D1, 5% 12/1/22 | | 1,305 | 1,579 |
| Series 2015, 5% 5/1/18 | | 1,075 | 1,158 |
| Series 2016 B: | | | |
| 5% 8/1/22 | | 14,095 | 16,938 |
| 5% 8/1/23 | | 9,250 | 11,351 |
| Louisiana Pub. Facilities Auth. Rev. (Christus Health Proj.) Series 2009 A, 5% 7/1/16 | | 2,000 | 2,000 |
| Louisiana Stadium and Exposition District Series 2013 A: | | | |
| 5% 7/1/21 | | 1,500 | 1,768 |
| 5% 7/1/22 | | 1,000 | 1,203 |
| New Orleans Gen. Oblig. Series 2012, 5% 12/1/20 | | 2,800 | 3,251 |
| Reg'l. Transit Auth. Louisiana Sales Tax Rev. 4% 12/1/16 (FSA Insured) | | 1,000 | 1,014 |
| Tobacco Settlement Fing. Corp. Series 2013 A, 5% 5/15/23 | | 4,500 | 5,355 |
|
| TOTAL LOUISIANA | | | 88,693 |
|
| Maine - 0.2% | | | |
| Maine Tpk. Auth. Tpk. Rev. Series 2015: | | | |
| 5% 7/1/21 | | 2,400 | 2,845 |
| 5% 7/1/22 | | 1,850 | 2,243 |
| 5% 7/1/24 | | 2,350 | 2,967 |
|
| TOTAL MAINE | | | 8,055 |
|
| Maryland - 1.6% | | | |
| Maryland Gen. Oblig.: | | | |
| Series 2008 2, 5% 7/15/22 (Pre-Refunded to 7/15/18 @ 100) | | 5,500 | 5,985 |
| Series 2012 B, 5% 8/1/16 | | 6,400 | 6,425 |
| Maryland Health & Higher Edl. Facilities Auth. Rev.: | | | |
| Bonds: | | | |
| Series 2012 D, 1.124%, tender 11/15/17 (a) | | 13,940 | 13,945 |
| Series 2013 A: | | | |
| 0.886%, tender 5/15/18 (a) | | 4,515 | 4,496 |
| 0.906%, tender 5/15/18 (a) | | 7,100 | 7,072 |
| Series 2015: | | | |
| 5% 7/1/19 | | 400 | 447 |
| 5% 7/1/22 | | 900 | 1,093 |
| 5% 7/1/23 | | 1,000 | 1,229 |
| 5% 7/1/24 | | 2,000 | 2,481 |
| 5% 7/1/25 | | 1,770 | 2,213 |
| Montgomery County Gen. Oblig. Series 2011 A, 5% 7/1/20 | | 16,000 | 17,999 |
|
| TOTAL MARYLAND | | | 63,385 |
|
| Massachusetts - 2.0% | | | |
| Massachusetts Bay Trans. Auth. Sales Tax Rev. Series 2006 B, 5.25% 7/1/18 | | 2,300 | 2,508 |
| Massachusetts Dev. Fin. Agcy. Rev.: | | | |
| (Boston College Proj.): | | | |
| Series Q1, 4% 7/1/16 | | 1,000 | 1,000 |
| Series Q2: | | | |
| 4% 7/1/16 | | 1,000 | 1,000 |
| 5% 7/1/17 | | 1,370 | 1,430 |
| Bonds Series 2013 U-6E, 0.96%, tender 7/7/16 (a) | | 5,900 | 5,899 |
| Series 2016 I: | | | |
| 5% 7/1/21 | | 500 | 589 |
| 5% 7/1/22 | | 600 | 724 |
| 5% 7/1/23 | | 640 | 785 |
| 5% 7/1/24 | | 550 | 685 |
| 5% 7/1/25 | | 500 | 629 |
| 5% 7/1/26 | | 1,000 | 1,266 |
| Massachusetts Edl. Fing. Auth. Rev. Series 2013, 5% 7/1/19 (b) | | 4,725 | 5,179 |
| Massachusetts Gen. Oblig.: | | | |
| Bonds Series 2014 D1, 0.63%, tender 7/1/20 (a) | | 32,000 | 32,000 |
| Series 2004 B, 5.25% 8/1/20 | | 12,700 | 14,908 |
| Series 2006 D, 5% 8/1/22 (Pre-Refunded to 8/1/16 @ 100) | | 4,500 | 4,514 |
| Series 2007 C, 5% 8/1/19 (Pre-Refunded to 8/1/17 @ 100) | | 2,000 | 2,093 |
| Massachusetts Health & Edl. Facilities Auth. Rev. Bonds Series 2007 G6, 1.293%, tender 7/7/16 (a) | | 2,900 | 2,900 |
| Medford Gen. Oblig. Series 2011 B, 4% 3/1/19 | | 3,570 | 3,867 |
|
| TOTAL MASSACHUSETTS | | | 81,976 |
|
| Michigan - 2.3% | | | |
| Detroit Swr. Disp. Rev. Series 2006 D, 1.019% 7/1/32 (a) | | 4,070 | 3,835 |
| Grand Blanc Cmnty. Schools Series 2013: | | | |
| 5% 5/1/19 | | 1,225 | 1,360 |
| 5% 5/1/20 | | 2,635 | 3,012 |
| 5% 5/1/21 | | 2,150 | 2,520 |
| 5% 5/1/22 | | 1,850 | 2,219 |
| Grand Rapids Pub. Schools Series 2016: | | | |
| 4% 5/1/17 (FSA Insured) | | 500 | 513 |
| 4% 5/1/18 (FSA Insured) | | 1,950 | 2,064 |
| Grand Valley Michigan State Univ. Rev. Series 2009, 5% 12/1/16 | | 1,320 | 1,343 |
| Kent Hosp. Fin. Auth. Hosp. Facilities Rev. (Spectrum Health Sys. Proj.) Series 2011 A: | | | |
| 5% 11/15/18 | | 1,250 | 1,367 |
| 5% 11/15/19 | | 1,000 | 1,128 |
| Michigan Fin. Auth. Rev.: | | | |
| Bonds 1.1%, tender 8/15/19 (a) | | 4,250 | 4,268 |
| Series 2012 A: | | | |
| 5% 6/1/17 (Escrowed to Maturity) | | 1,410 | 1,465 |
| 5% 6/1/18 (Escrowed to Maturity) | | 2,430 | 2,627 |
| Series 2015 A: | | | |
| 5% 8/1/22 | | 2,400 | 2,887 |
| 5% 8/1/23 | | 3,800 | 4,660 |
| Michigan Hosp. Fin. Auth. Rev.: | | | |
| (McLaren Health Care Corp. Proj.) Series 2008 A, 5.75% 5/15/38 (Pre-Refunded to 5/15/18 @ 100) | | 1,190 | 1,300 |
| Bonds: | | | |
| Series 2005 A4, 1.625%, tender 11/1/19 (a) | | 8,630 | 8,721 |
| Series 2010 F3, 1.4%, tender 6/29/18 (a) | | 1,900 | 1,920 |
| Series 2010 F4, 1.95%, tender 4/1/20 (a) | | 6,545 | 6,760 |
| 0.95%, tender 2/1/18 (a) | | 3,995 | 4,006 |
| Portage Pub. Schools Series 2016: | | | |
| 5% 5/1/23 | | 2,035 | 2,482 |
| 5% 11/1/23 | | 1,365 | 1,679 |
| 5% 5/1/24 | | 1,920 | 2,380 |
| 5% 11/1/24 | | 2,000 | 2,498 |
| 5% 5/1/25 | | 1,125 | 1,415 |
| 5% 11/1/25 | | 1,220 | 1,545 |
| 5% 5/1/26 | | 1,700 | 2,172 |
| 5% 11/1/26 | | 1,180 | 1,501 |
| 5% 11/1/28 | | 1,005 | 1,265 |
| Royal Oak Hosp. Fin. Auth. Hosp. Rev. Series 2014 D: | | | |
| 5% 9/1/21 | | 1,500 | 1,772 |
| 5% 9/1/23 | | 500 | 614 |
| Spring Lake Pub. Schools: | | | |
| Series 2014, 5% 5/1/19 | | 2,300 | 2,554 |
| 5% 11/1/19 | | 2,775 | 3,135 |
| 5% 5/1/20 | | 3,630 | 4,149 |
| 5% 11/1/20 | | 1,745 | 2,026 |
| 5% 5/1/21 | | 4,110 | 4,810 |
|
| TOTAL MICHIGAN | | | 93,972 |
|
| Minnesota - 0.3% | | | |
| Minneapolis & Saint Paul Metropolitan Arpts. Commission Arpt. Rev.: | | | |
| Series 2014 A: | | | |
| 5% 1/1/22 | | 1,000 | 1,200 |
| 5% 1/1/23 | | 1,000 | 1,229 |
| Series 2014 B: | | | |
| 5% 1/1/21 (b) | | 2,290 | 2,645 |
| 5% 1/1/22 (b) | | 2,000 | 2,365 |
| 5% 1/1/23 (b) | | 1,000 | 1,207 |
| Western Minnesota Muni. Pwr. Agcy. Pwr. Supply Rev. Series 2014 A: | | | |
| 5% 1/1/22 | | 1,000 | 1,205 |
| 5% 1/1/23 | | 1,500 | 1,848 |
| 5% 1/1/24 | | 1,000 | 1,257 |
|
| TOTAL MINNESOTA | | | 12,956 |
|
| Mississippi - 0.2% | | | |
| Mississippi Gen. Oblig. (Cap. Impts. Proj.) Series 2012 D, 0.94% 9/1/17 (a) | | 3,080 | 3,080 |
| Mississippi Hosp. Equip. & Facilities Auth. Bonds (Baptist Memorial Health Care Proj.) Series 2004 B2, 0.75%, tender 7/7/16 (a)(c) | | 4,500 | 4,500 |
|
| TOTAL MISSISSIPPI | | | 7,580 |
|
| Missouri - 0.0% | | | |
| Saint Louis Arpt. Rev. Series 2013, 5% 7/1/18 | | 765 | 827 |
| Nebraska - 0.0% | | | |
| Nebraska Pub. Pwr. District Rev. Series 2012 C, 5% 1/1/22 (Pre-Refunded to 1/1/18 @ 100) | | 1,100 | 1,172 |
| Nevada - 1.7% | | | |
| Clark County School District Series 2012 A, 5% 6/15/19 | | 24,610 | 27,510 |
| Humboldt County Nev Poll. Cont. Rev. Bonds (Seirra Pacific Pwr. Co. Projs.) Series 2016 A, 1.25%, tender 6/3/19 (a) | | 2,000 | 2,005 |
| Las Vegas Valley Wtr. District Wtr. Impt. Gen. Oblig.: | | | |
| Series 2016 B, 3% 6/1/18 | | 1,020 | 1,065 |
| Series 2016, 3% 6/1/17 | | 2,195 | 2,243 |
| Nevada Gen. Oblig.: | | | |
| Series 2010 C, 5% 6/1/19 | | 12,140 | 13,607 |
| Series 2012 B, 5% 8/1/20 | | 2,230 | 2,592 |
| Series 2013 D1: | | | |
| 5% 3/1/23 | | 4,500 | 5,577 |
| 5% 3/1/24 | | 2,700 | 3,333 |
| Washoe County Gas & Wtr. Facilities Bonds (Seirra Pacific Pwr. Co. Projs.) Series 2016 B, 3%, tender 6/1/22 (a) | | 5,300 | 5,722 |
| Washoe County Gas Facilities Rev. Bonds (Seirra Pacific Pwr. Co. Projs.) Series 2016 A, 1.5%, tender 6/3/19 (a)(b) | | 6,125 | 6,141 |
|
| TOTAL NEVADA | | | 69,795 |
|
| New Hampshire - 0.3% | | | |
| New Hampshire Health & Ed. Facilities Auth. Rev. Series 2012: | | | |
| 4% 7/1/20 | | 2,705 | 2,956 |
| 4% 7/1/21 | | 1,520 | 1,683 |
| New Hampshire Tpk. Sys. Rev. Series 2012 B: | | | |
| 5% 2/1/17 | | 3,000 | 3,074 |
| 5% 2/1/18 | | 2,500 | 2,665 |
|
| TOTAL NEW HAMPSHIRE | | | 10,378 |
|
| New Jersey - 5.3% | | | |
| Camden County Impt. Auth. Health Care Redev. Rev. Series 2014 A: | | | |
| 5% 2/15/20 | | 3,000 | 3,384 |
| 5% 2/15/21 | | 2,500 | 2,887 |
| 5% 2/15/22 | | 2,500 | 2,956 |
| 5% 2/15/23 | | 2,750 | 3,292 |
| New Jersey Econ. Dev. Auth. Rev.: | | | |
| Series 2005 K, 5.5% 12/15/19 | | 8,030 | 8,954 |
| Series 2011 EE: | | | |
| 5% 9/1/20 | | 1,350 | 1,494 |
| 5% 9/1/20 (Escrowed to Maturity) | | 3,650 | 4,255 |
| Series 2012 II: | | | |
| 5% 3/1/21 | | 6,800 | 7,574 |
| 5% 3/1/22 | | 6,290 | 7,051 |
| Series 2013 NN, 5% 3/1/19 (Escrowed to Maturity) | | 8,165 | 9,070 |
| Series 2013, 5% 3/1/23 | | 6,000 | 6,769 |
| Series 2014 PP, 5% 6/15/19 | | 17,000 | 18,414 |
| New Jersey Edl. Facility: | | | |
| Series 2014: | | | |
| 5% 6/15/20 | | 11,000 | 12,030 |
| 5% 6/15/21 | | 11,000 | 12,062 |
| Series 2016 A: | | | |
| 4% 7/1/18 (d) | | 3,585 | 3,770 |
| 5% 7/1/21 (d) | | 2,200 | 2,535 |
| 5% 7/1/22 (d) | | 6,300 | 7,377 |
| 5% 7/1/23 (d) | | 3,390 | 4,029 |
| 5% 7/1/24 (d) | | 7,915 | 9,514 |
| New Jersey Gen. Oblig. Series O, 5% 8/1/17 | | 6,940 | 7,240 |
| New Jersey Health Care Facilities Fing. Auth. Rev. Series 2016 A, 5% 7/1/24 | | 1,225 | 1,526 |
| New Jersey Higher Ed. Student Assistance Auth. Student Ln. Rev. Series 2013: | | | |
| 5% 12/1/18 (b) | | 6,000 | 6,494 |
| 5% 12/1/19 (b) | | 3,850 | 4,257 |
| New Jersey Tpk. Auth. Tpk. Rev.: | | | |
| Series 2013 A, 5% 1/1/24 | | 4,345 | 5,285 |
| Series 2013 C, 0.89% 1/1/17 (a) | | 16,000 | 16,004 |
| New Jersey Trans. Trust Fund Auth.: | | | |
| Series 2003 A, 5.5% 12/15/16 (FSA Insured) | | 5,000 | 5,105 |
| Series 2003 B, 5.25% 12/15/19 | | 3,870 | 4,275 |
| Series 2012 AA, 5% 6/15/19 | | 1,500 | 1,627 |
| Series 2013 A: | | | |
| 5% 12/15/19 | | 6,455 | 7,078 |
| 5% 6/15/20 | | 18,000 | 19,878 |
| New Jersey Transit Corp. Ctfs. of Prtn. Series 2014 A, 5% 9/15/21 | | 4,900 | 5,554 |
|
| TOTAL NEW JERSEY | | | 211,740 |
|
| New Mexico - 0.9% | | | |
| Farmington Poll. Cont. Rev. Bonds (Southern California Edison Co. Four Corners Proj.): | | | |
| Series 2005 B, 1.875%, tender 4/1/20 (a) | | 11,000 | 11,225 |
| Series 2011, 1.875%, tender 4/1/20 (a) | | 6,290 | 6,419 |
| New Mexico Edl. Assistance Foundation: | | | |
| Series 2009 B, 4% 9/1/16 | | 7,000 | 7,041 |
| Series 2010 A1, 4% 12/1/16 | | 6,750 | 6,843 |
| Rio Rancho Wtr. & Wastewtr. Sys. Rev. Series 2009, 5% 5/15/17 (FSA Insured) | | 4,480 | 4,642 |
|
| TOTAL NEW MEXICO | | | 36,170 |
|
| New York - 10.1% | | | |
| Dutchess County Local Dev. Corp. Rev. (Health Quest Systems, Inc. Proj.) Series 2010 A: | | | |
| 5% 7/1/18 (Assured Guaranty Corp. Insured) (FSA Insured) | | 1,100 | 1,188 |
| 5% 7/1/19 (Assured Guaranty Corp. Insured) (FSA Insured) | | 640 | 714 |
| Metropolitan Trans. Auth. Svc. Contract Rev. Series 2002 A, 5.5% 7/1/17 | | 5,000 | 5,244 |
| New York City Gen. Oblig.: | | | |
| Series 2008 C, 5.25% 8/1/17 | | 2,280 | 2,394 |
| Series 2010 F, 5% 8/1/17 | | 8,365 | 8,759 |
| Series 2011 B, 5% 8/1/17 | | 1,000 | 1,047 |
| Series 2012 C, 4% 8/1/17 | | 2,740 | 2,840 |
| Series 2014 J, 3% 8/1/16 | | 5,600 | 5,612 |
| Series 2014 K, 3% 8/1/16 | | 3,900 | 3,908 |
| Series 2015 C: | | | |
| 5% 8/1/23 | | 10,000 | 12,445 |
| 5% 8/1/24 | | 5,000 | 6,343 |
| 5% 8/1/25 | | 1,700 | 2,172 |
| Series 2015 F1, 3% 6/1/17 | | 14,370 | 14,688 |
| Series 2016, 5% 8/1/18 | | 9,100 | 9,903 |
| New York City Transitional Fin. Auth. Bldg. Aid Rev. Series 2015 S2, 3% 7/15/17 | | 9,565 | 9,805 |
| New York City Transitional Fin. Auth. Rev.: | | | |
| Series 2003 B, 5% 2/1/20 | | 3,000 | 3,441 |
| Series 2010 B: | | | |
| 5% 11/1/17 | | 11,740 | 12,426 |
| 5% 11/1/17 (Escrowed to Maturity) | | 18,260 | 19,274 |
| 5% 11/1/20 | | 5,950 | 6,752 |
| Series 2010 D: | | | |
| 5% 11/1/17 | | 8,015 | 8,483 |
| 5% 11/1/17 (Escrowed to Maturity) | | 2,100 | 2,220 |
| Series 2012 A: | | | |
| 5% 11/1/17 | | 6,180 | 6,541 |
| 5% 11/1/17 (Escrowed to Maturity) | | 820 | 867 |
| 5% 11/1/20 | | 4,500 | 5,280 |
| New York Dorm. Auth. Mental Health Svcs. Facilities Impt. Rev.: | | | |
| (State Univ. Proj.) Series 2012 A, 5% 5/15/20 | | 4,000 | 4,617 |
| Series 2012 A, 4% 5/15/20 | | 8,000 | 8,932 |
| New York Dorm. Auth. Personal Income Tax Rev. Series 2012 A, 5% 12/15/20 | | 8,500 | 10,006 |
| New York Dorm. Auth. Revs.: | | | |
| Series 2008 D, 5.25% 8/15/17 (FSA Insured) | | 7,000 | 7,364 |
| Series 2009 A, 5% 7/1/16 | | 8,390 | 8,390 |
| New York Dorm. Auth. Sales Tax Rev. Series 2015 A, 5% 3/15/17 | | 90,000 | 92,799 |
| New York Metropolitan Trans. Auth. Rev.: | | | |
| Series 2003 B, 5.25% 11/15/19 (Nat'l. Pub. Fin. Guarantee Corp. Insured) | | 5,200 | 5,950 |
| Series 2008 B2: | | | |
| 5% 11/15/19 | | 6,185 | 7,026 |
| 5% 11/15/20 | | 5,500 | 6,431 |
| 5% 11/15/21 | | 4,000 | 4,791 |
| Series 2012 B, 5% 11/15/22 | | 2,000 | 2,449 |
| Series 2012 D, 5% 11/15/18 | | 2,515 | 2,764 |
| Series 2012 E: | | | |
| 4% 11/15/19 | | 4,000 | 4,412 |
| 5% 11/15/21 | | 2,435 | 2,917 |
| Series 2012 F, 5% 11/15/19 | | 5,000 | 5,680 |
| New York Thruway Auth. Gen. Rev. Series 2013 A, 5% 5/1/19 | | 20,400 | 22,747 |
| New York Thruway Auth. Second Gen. Hwy. & Bridge Trust Fund: | | | |
| Series 2010 A, 5% 4/1/17 | | 1,000 | 1,033 |
| Series 2011 A1: | | | |
| 5% 4/1/17 | | 1,500 | 1,549 |
| 5% 4/1/18 | | 3,500 | 3,766 |
| New York Trans. Dev. Corp. (Term. One Group Assoc. L.P. Proj.) Series 2015, 5% 1/1/17 (b) | | 8,890 | 9,072 |
| New York Urban Dev. Corp. Rev.: | | | |
| Series 2009 C, 5% 12/15/16 | | 17,000 | 17,349 |
| Series 2011 A, 5% 3/15/21 | | 18,425 | 21,804 |
| Tobacco Settlement Fing. Corp. Series 2013 B, 5% 6/1/21 | | 65 | 65 |
| Triborough Bridge & Tunnel Auth. Revs. Series Y, 5.5% 1/1/17 (Escrowed to Maturity) | | 760 | 779 |
|
| TOTAL NEW YORK | | | 405,038 |
|
| North Carolina - 0.6% | | | |
| Dare County Ctfs. of Prtn. Series 2012 B: | | | |
| 4% 6/1/17 | | 1,000 | 1,031 |
| 4% 6/1/18 | | 1,280 | 1,361 |
| 4% 6/1/20 | | 1,000 | 1,114 |
| 5% 6/1/19 | | 1,305 | 1,458 |
| Mecklenburg County Pub. Facilities Corp. Series 2009, 5% 3/1/18 | | 1,500 | 1,609 |
| North Carolina Cap. Facilities Fin. Agcy. Rev. Bonds (, Inc. Proj.) Series 2010 B, 0.85%, tender 9/1/16 (a)(b) | | 1,900 | 1,900 |
| North Carolina Med. Care Commission Hosp. Rev. (North Carolina Baptist Hosp. Proj.) Series 2010: | | | |
| 5% 6/1/17 | | 3,220 | 3,344 |
| 5% 6/1/18 | | 3,820 | 4,123 |
| North Carolina Muni. Pwr. Agcy. #1 Catawba Elec. Rev. Series 2015 E: | | | |
| 5% 1/1/22 | | 5,000 | 6,006 |
| 5% 1/1/23 | | 1,500 | 1,842 |
|
| TOTAL NORTH CAROLINA | | | 23,788 |
|
| Ohio - 2.9% | | | |
| American Muni. Pwr., Inc. Rev. Bonds Series B, 5%, tender 8/15/20 (a) | | 35,000 | 39,712 |
| Buckeye Tobacco Settlement Fing. Auth. Series 2007 A1, 5% 6/1/17 | | 3,500 | 3,632 |
| Cincinnati City School District 5.25% 12/1/18 (Nat'l. Pub. Fin. Guarantee Corp. Insured) | | 3,555 | 3,924 |
| Cleveland Arpt. Sys. Rev.: | | | |
| 5% 1/1/20 (FSA Insured) | | 425 | 480 |
| 5% 1/1/22 (FSA Insured) | | 1,325 | 1,565 |
| 5% 1/1/24 (FSA Insured) | | 1,200 | 1,473 |
| 5% 1/1/25 (FSA Insured) | | 1,250 | 1,560 |
| 5% 1/1/26 (FSA Insured) | | 500 | 622 |
| Columbus City School District (School Facilities Construction and Impt. Proj.) Series 2009 B, 4% 12/1/16 | | 1,000 | 1,014 |
| Columbus Gen. Oblig. Series 2013 1, 5% 7/1/17 | | 2,075 | 2,166 |
| Fairfield County Hosp. Facilities Rev. (Fairfield Med. Ctr. Proj.) Series 2013: | | | |
| 5% 6/15/22 | | 2,145 | 2,513 |
| 5% 6/15/23 | | 1,855 | 2,206 |
| Hamilton County Convention Facilities Auth. Rev. Series 2014: | | | |
| 5% 12/1/19 | | 1,910 | 2,133 |
| 5% 12/1/20 | | 2,205 | 2,524 |
| 5% 12/1/21 | | 2,045 | 2,390 |
| Hamilton County Student Hsg. Rev. (Stratford Heights Proj.) Series 2010, 5% 6/1/17 (FSA Insured) | | 1,160 | 1,205 |
| Ohio Air Quality Dev. Auth. Rev.: | | | |
| Bonds (First Energy Nuclear Generation Proj.) Series 2006 A, 3.75%, tender 12/3/18 (a) | | 13,300 | 13,605 |
| Series 2009 C, 5.625% 6/1/18 | | 1,395 | 1,476 |
| Ohio Bldg. Auth. (Administrative Bldg. Fund Proj.) Series 2010 C, 5% 10/1/16 | | 1,250 | 1,263 |
| Ohio Gen. Oblig.: | | | |
| (Common Schools Proj.) Series 2010 A, 5% 9/15/17 | | 2,600 | 2,738 |
| (Higher Ed. Proj.) Series 2010 A, 5% 8/1/17 | | 3,290 | 3,446 |
| Series 2011 A, 5% 8/1/17 | | 3,070 | 3,216 |
| Series 2012 C, 5% 9/15/21 | | 4,350 | 5,223 |
| Ohio Higher Edl. Facility Commission Rev. (Univ. Hosp. Health Sys. Proj.) Series 2010 A, 5% 1/15/17 | | 1,000 | 1,023 |
| Ohio State Univ. Gen. Receipts Series 2010 A: | | | |
| 5% 12/1/16 | | 4,720 | 4,806 |
| 5% 12/1/16 (Escrowed to Maturity) | | 280 | 285 |
| Scioto County Hosp. Facilities Rev. Series 2016: | | | |
| 5% 2/15/21 | | 650 | 758 |
| 5% 2/15/22 | | 1,100 | 1,310 |
| 5% 2/15/23 | | 2,120 | 2,572 |
| 5% 2/15/24 | | 1,640 | 2,022 |
| 5% 2/15/25 | | 1,710 | 2,140 |
| 5% 2/15/26 | | 1,250 | 1,584 |
|
| TOTAL OHIO | | | 116,586 |
|
| Oklahoma - 0.4% | | | |
| Oklahoma City Pub. Property Auth. Hotel Tax Rev. Series 2015, 5% 10/1/17 | | 450 | 473 |
| Oklahoma Dev. Fin. Auth. Rev.: | | | |
| (Saint John Health Sys. Proj.) Series 2012, 5% 2/15/23 | | 2,600 | 3,109 |
| Series 2004 A, 2.375% 12/1/21 | | 1,350 | 1,432 |
| Series 2012, 5% 2/15/21 | | 1,600 | 1,870 |
| Tulsa County Independent School Disctrict #9 Series 2015, 2% 4/1/17 | | 3,000 | 3,031 |
| Tulsa County Indl. Auth. Edl. Facilities Lease Rev. (Jenks Pub. Schools Proj.) Series 2009, 5.5% 9/1/18 | | 5,215 | 5,742 |
|
| TOTAL OKLAHOMA | | | 15,657 |
|
| Pennsylvania - 6.2% | | | |
| Beaver County Indl. Dev. Auth. Poll. Cont. Rev. Bonds (FirstEnergy Nuclear Generation Corp. Proj.): | | | |
| Series 2006 A, 3.5%, tender 6/1/20 (a) | | 5,250 | 5,332 |
| Series 2006 B, 3.5%, tender 6/1/20 (a) | | 6,000 | 6,094 |
| Franklin County Indl. Dev. Auth. (The Chambersburg Hosp. Proj.) Series 2010: | | | |
| 5% 7/1/16 | | 1,000 | 1,000 |
| 5% 7/1/17 | | 1,255 | 1,307 |
| Lehigh County Indl. Dev. Auth. Poll. Cont. Rev. Bonds 0.9%, tender 8/15/17 (a) | | 10,255 | 10,262 |
| Montgomery County Higher Ed. & Health Auth. Hosp. Rev. (Abington Memorial Hosp. Proj.) Series 2009 A, 5% 6/1/17 | | 2,200 | 2,283 |
| Montgomery County Higher Ed. & Health Auth. Rev. Series 2014 A: | | | |
| 4% 10/1/18 | | 1,000 | 1,056 |
| 4% 10/1/19 | | 660 | 706 |
| 5% 10/1/20 | | 1,260 | 1,408 |
| Mount Lebanon School District Series 2015, 4% 2/15/18 | | 865 | 910 |
| Pennsylvania Econ. Dev. Auth. Governmental Lease (Forum Place Proj.) Series 2012: | | | |
| 5% 3/1/18 | | 2,455 | 2,622 |
| 5% 3/1/19 | | 2,310 | 2,527 |
| 5% 3/1/20 | | 2,140 | 2,406 |
| Pennsylvania Econ. Dev. Fin. Auth. Unemployment Compensation Rev. Series 2012 B: | | | |
| 5% 1/1/22 | | 5,000 | 5,214 |
| 5% 7/1/22 | | 5,200 | 5,215 |
| 5% 1/1/23 | | 900 | 900 |
| Pennsylvania Econ. Dev. Fing. Auth. Solid Waste Disp. Rev. Bonds: | | | |
| (Waste Mgmt., Inc. Proj.) Series 2013, 0.85%, tender 8/1/16 (a)(b) | | 15,100 | 15,100 |
| 0.9%, tender 7/1/16 (a)(b) | | 4,000 | 4,000 |
| Pennsylvania Gen. Oblig.: | | | |
| Series 2006 1, 5% 10/1/19 (Pre-Refunded to 10/1/16 @ 100) | | 7,000 | 7,075 |
| Series 2006, 4.25% 3/1/24 (Pre-Refunded to 3/1/17 @ 100) | | 6,000 | 6,145 |
| Series 2010 A3, 5% 7/15/16 | | 3,900 | 3,907 |
| Series 2011, 5% 7/1/21 | | 1,900 | 2,223 |
| Series 2012, 5% 6/1/18 | | 3,410 | 3,679 |
| Series 2016: | | | |
| 5% 2/1/21 | | 8,825 | 10,226 |
| 5% 2/1/22 | | 9,265 | 10,942 |
| 5% 2/1/23 | | 9,075 | 10,941 |
| 5% 2/1/24 | | 10,215 | 12,551 |
| 5% 6/1/17 | | 9,000 | 9,353 |
| 5% 8/15/17 | | 18,000 | 18,859 |
| Pennsylvania Higher Edl. Facilities Auth. Rev. Series 2014: | | | |
| 5% 12/1/19 | | 340 | 387 |
| 5% 12/1/21 | | 275 | 331 |
| 5% 12/1/22 | | 855 | 1,053 |
| Pennsylvania Pub. School Bldg. Auth. School Rev. (The School District of Harrisburg Proj.) Series 2016 A, 5% 12/1/21 (FSA Insured) (d) | | 5,000 | 5,901 |
| Pennsylvania Tpk. Commission Tpk. Rev.: | | | |
| Series 2009 B, 5% 12/1/17 | | 12,500 | 13,238 |
| Series 2013 A, 1.01% 12/1/17 (a) | | 6,400 | 6,402 |
| Philadelphia Gas Works Rev.: | | | |
| Eighth Series A, 5% 8/1/16 | | 1,000 | 1,004 |
| Seventeenth Series, 5.375% 7/1/16 (Escrowed to Maturity) | | 2,300 | 2,300 |
| Philadelphia Gen. Oblig.: | | | |
| Series 2008 A, 5% 12/15/16 (FSA Insured) | | 7,275 | 7,413 |
| Series 2011: | | | |
| 5.25% 8/1/17 | | 6,165 | 6,456 |
| 5.25% 8/1/18 | | 5,515 | 5,993 |
| Philadelphia Muni. Auth. Rev. Series 2013 A: | | | |
| 5% 11/15/17 | | 6,635 | 7,010 |
| 5% 11/15/18 | | 3,430 | 3,747 |
| Philadelphia School District Series 2010 C, 5% 9/1/16 | | 13,610 | 13,696 |
| Pittsburgh School District Series 2010 A, 5% 9/1/16 (FSA Insured) | | 1,685 | 1,697 |
| Southeastern Pennsylvania Trans. Auth. Rev. Series 2011: | | | |
| 5% 6/1/18 | | 1,000 | 1,077 |
| 5% 6/1/19 | | 200 | 223 |
| State Pub. School Bldg. Auth. Lease Rev. (Philadelphia School District Proj.) Series 2012: | | | |
| 5% 4/1/19 | | 1,305 | 1,412 |
| 5% 4/1/20 | | 1,250 | 1,379 |
| 5% 4/1/21 | | 1,000 | 1,115 |
| Unionville-Chadds Ford School District Gen. Oblig. Series 2009, 5% 6/1/20 | | 1,190 | 1,333 |
|
| TOTAL PENNSYLVANIA | | | 247,410 |
|
| Rhode Island - 0.5% | | | |
| Rhode Island & Providence Plantations Series 2015 A, 4% 8/1/17 | | 5,000 | 5,181 |
| Rhode Island Health & Edl. Bldg. Corp. Higher Ed. Facilities Rev. Series 2013 A: | | | |
| 5% 5/15/18 | | 1,000 | 1,065 |
| 5% 5/15/19 | | 1,500 | 1,653 |
| Rhode Island Health & Edl. Bldg. Corp. Pub. Schools Rev. Series 2015, 5% 5/15/25 (FSA Insured) | | 6,040 | 7,510 |
| Tobacco Setlement Fing. Corp. Series 2015 A: | | | |
| 5% 6/1/26 | | 3,500 | 4,073 |
| 5% 6/1/27 | | 1,000 | 1,152 |
|
| TOTAL RHODE ISLAND | | | 20,634 |
|
| South Carolina - 1.9% | | | |
| Lexington County Health Svcs. District, Inc. Hosp. Rev. Series 2011, 5% 11/1/19 | | 1,190 | 1,341 |
| Scago Edl. Facilities Corp. for Colleton School District (School District of Colleton County Proj.) Series 2015: | | | |
| 5% 12/1/23 | | 4,440 | 5,403 |
| 5% 12/1/26 | | 1,100 | 1,339 |
| South Carolina Pub. Svc. Auth. Rev.: | | | |
| Series 2012 B: | | | |
| 5% 12/1/17 | | 2,000 | 2,117 |
| 5% 12/1/20 | | 1,000 | 1,170 |
| Series 2012 C, 5% 12/1/17 | | 10,535 | 11,152 |
| Series 2014 C: | | | |
| 5% 12/1/22 | | 1,100 | 1,345 |
| 5% 12/1/23 | | 5,000 | 6,206 |
| Series 2015 C: | | | |
| 5% 12/1/18 | | 15,000 | 16,489 |
| 5% 12/1/19 | | 18,690 | 21,252 |
| South Carolina Trans. Infrastructure Bank Rev. Series 2012 B, 5% 10/1/17 | | 8,000 | 8,429 |
|
| TOTAL SOUTH CAROLINA | | | 76,243 |
|
| South Dakota - 0.2% | | | |
| South Dakota Health & Edl. Facilities Auth. Rev.: | | | |
| (Reg'l. Health Proj.) Series 2010: | | | |
| 5% 9/1/16 | | 500 | 504 |
| 5% 9/1/17 | | 490 | 514 |
| Series 2011: | | | |
| 5% 9/1/17 | | 1,100 | 1,154 |
| 5% 9/1/18 | | 1,200 | 1,298 |
| 5% 9/1/19 | | 1,255 | 1,401 |
| Series 2014 B: | | | |
| 4% 11/1/19 | | 400 | 439 |
| 4% 11/1/20 | | 625 | 698 |
| 4% 11/1/21 | | 500 | 566 |
| 5% 11/1/22 | | 375 | 453 |
|
| TOTAL SOUTH DAKOTA | | | 7,027 |
|
| Tennessee - 0.1% | | | |
| Memphis-Shelby County Arpt. Auth. Arpt. Rev. Series 2010 B, 5% 7/1/16 (b) | | 1,730 | 1,730 |
| Metropolitan Nashville Arpt. Auth. Rev. Series 2010 A: | | | |
| 5% 7/1/16 | | 1,815 | 1,815 |
| 5% 7/1/17 | | 1,100 | 1,147 |
|
| TOTAL TENNESSEE | | | 4,692 |
|
| Texas - 10.3% | | | |
| Allen Independent School District Series 2013, 4% 2/15/18 | | 1,290 | 1,360 |
| Austin Elec. Util. Sys. Rev. 0% 5/15/18 (Nat'l. Pub. Fin. Guarantee Corp. Insured) | | 4,500 | 4,436 |
| Austin Independent School District Series 2004, 5% 8/1/17 | | 1,450 | 1,518 |
| Bastrop Independent School District Series 2007, 5.25% 2/15/37 (Pre-Refunded to 2/15/17 @ 100) | | 2,705 | 2,782 |
| Brownsville Util. Sys. Rev. Series 2015, 5% 9/1/17 | | 2,135 | 2,240 |
| Carroll Independent School District Series 2009 C, 5.25% 2/15/19 | | 1,000 | 1,115 |
| Central Reg'l. Mobility Auth. Series 2016: | | | |
| 5% 1/1/21 | | 500 | 576 |
| 5% 1/1/22 | | 1,500 | 1,765 |
| 5% 1/1/23 | | 2,450 | 2,938 |
| 5% 1/1/24 | | 3,370 | 4,101 |
| 5% 1/1/26 | | 2,865 | 3,585 |
| Cypress-Fairbanks Independent School District Bonds Series 2014 B3, 1.05%, tender 8/15/17 (a) | | 2,025 | 2,032 |
| Dallas Fort Worth Int'l. Arpt. Rev.: | | | |
| Series 2013 F: | | | |
| 5% 11/1/19 | | 2,000 | 2,268 |
| 5% 11/1/20 | | 1,500 | 1,751 |
| 5% 11/1/21 | | 3,000 | 3,581 |
| 5% 11/1/22 | | 5,000 | 6,078 |
| Series 2014 D, 5% 11/1/23 (b) | | 1,950 | 2,375 |
| Dallas Independent School District: | | | |
| Bonds: | | | |
| Series 2016 B1, 3%, tender 2/15/17 (a) | | 1,985 | 2,013 |
| Series 2016 B2, 4%, tender 2/15/18 (a) | | 3,970 | 4,178 |
| Series 2016 B3, 5%, tender 2/15/19 (a) | | 6,000 | 6,634 |
| Series 2016 B4, 5%, tender 2/15/20 (a) | | 7,000 | 7,984 |
| Series 2016 B5, 5%, tender 2/15/21 (a) | | 8,000 | 9,363 |
| Series 2016 B6, 5%, tender 2/15/22 (a) | | 10,000 | 11,989 |
| Series 2014 A, 4% 8/15/16 | | 9,280 | 9,320 |
| Dallas Wtrwks. & Swr. Sys. Rev. Series 2011, 5% 10/1/18 | | 1,600 | 1,752 |
| Dickinson Independent School District Bonds Series 2013, 1.05%, tender 7/1/17 (a) | | 5,150 | 5,168 |
| El Paso Gen. Oblig. Series 2014, 5% 8/15/18 | | 2,695 | 2,932 |
| Harris County Cultural Ed. Facilities Fin. Corp. Thermal Util. Rev. (TECO Proj.) Series 2009 A, 5% 11/15/16 | | 500 | 508 |
| Harris County Gen. Oblig. Series 2015 A, 4% 10/1/17 | | 2,500 | 2,605 |
| Houston Arpt. Sys. Rev.: | | | |
| Series 2011 A, 5% 7/1/17 (b) | | 7,380 | 7,679 |
| Series 2012 A, 5% 7/1/23 (b) | | 2,000 | 2,343 |
| Series A, 5% 7/1/16 | | 1,080 | 1,080 |
| Houston Util. Sys. Rev.: | | | |
| Bonds Series 2012 C, 1.01%, tender 7/7/16 (a) | | 9,200 | 9,198 |
| 5% 5/15/22 | | 5,000 | 6,062 |
| 5% 5/15/23 | | 7,000 | 8,689 |
| Kermit Independent School District Series 2007, 5.25% 2/15/32 (Pre-Refunded to 2/15/17 @ 100) | | 1,300 | 1,337 |
| Klein Independent School District Series 2009 A, 5% 8/1/16 | | 2,195 | 2,203 |
| Lewisville Independent School District Series 2009, 5% 8/15/17 | | 1,170 | 1,227 |
| Lower Colorado River Auth. Rev.: | | | |
| (LCRA Transmission Svcs. Corp. Proj.) Series 2010, 5% 5/15/18 | | 3,140 | 3,389 |
| Series 2010, 5% 5/15/17 | | 3,005 | 3,117 |
| Lubbock Health Facilities Dev. Corp. Rev. (St. Joseph Health Sys. Proj.) Series 2008 B: | | | |
| 5% 7/1/17 | | 2,800 | 2,916 |
| 5% 7/1/18 | | 3,030 | 3,278 |
| Mansfield Independent School District Series 2009, 4% 2/15/17 | | 1,840 | 1,879 |
| Mission Econ. Dev. Corp. Solid Waste Disp. Rev. Bonds (Republic Svcs., Inc. Proj.) Series 2008 A, 0.9%, tender 8/1/16 (a)(b) | | 12,850 | 12,850 |
| North East Texas Independent School District Series 2007 A, 5% 8/1/24 (Pre-Refunded to 8/1/17 @ 100) | | 10,000 | 10,465 |
| North Harris County Reg'l. Wtr. Auth. Series 2013, 4% 12/15/22 | | 1,580 | 1,836 |
| North Texas Tollway Auth. Rev.: | | | |
| Bonds Series 2012 C, 1.95%, tender 1/1/19 (a) | | 8,500 | 8,639 |
| Series 2016 A, 5% 1/1/26 | | 13,000 | 16,045 |
| 5.75% 1/1/38 (Pre-Refunded to 1/1/18 @ 100) | | 7,830 | 8,424 |
| Northside Independent School District Bonds: | | | |
| Series 2011 A, 2%, tender 6/1/19 (a) | | 6,225 | 6,385 |
| 1.2%, tender 8/1/17 (a) | | 28,800 | 28,947 |
| 2%, tender 6/1/21 (a) | | 10,000 | 10,396 |
| Plano Independent School District 5% 2/15/18 | | 2,500 | 2,654 |
| Port Houston Auth. Harris County Series 2015 B, 5% 10/1/17 (b) | | 2,000 | 2,107 |
| Round Rock Independent School District Series 2015, 5% 8/1/17 | | 5,000 | 5,235 |
| Sam Rayburn Muni. Pwr. Agcy. Series 2012, 5% 10/1/20 | | 1,000 | 1,148 |
| San Antonio Pub. Facilities Corp. and Rfdg. Lease (Convention Ctr. Proj.) Series 2012: | | | |
| 5% 9/15/20 | | 1,000 | 1,150 |
| 5% 9/15/21 | | 1,000 | 1,181 |
| 5% 9/15/22 | | 3,440 | 4,136 |
| San Antonio Wtr. Sys. Rev. Series 2012: | | | |
| 4% 5/15/19 | | 1,500 | 1,637 |
| 5% 5/15/20 | | 6,000 | 6,941 |
| 5% 5/15/21 | | 5,000 | 5,938 |
| Southwest Higher Ed. Auth. Rev. (Southern Methodist Univ. Proj.): | | | |
| Series 2009, 5% 10/1/16 | | 5,795 | 5,857 |
| Series 2016 A: | | | |
| 5% 10/1/20 | | 3,480 | 4,054 |
| 5% 10/1/21 | | 3,000 | 3,585 |
| Tarrant County Cultural Ed. Facilities Fin. Corp. Hosp. Rev.: | | | |
| (Scott & White Healthcare Proj.) Series 2013 A: | | | |
| 5% 8/15/21 | | 750 | 896 |
| 5% 8/15/23 | | 1,000 | 1,246 |
| Series 2013: | | | |
| 4% 9/1/18 | | 400 | 424 |
| 5% 9/1/19 | | 655 | 732 |
| 5% 9/1/20 | | 915 | 1,051 |
| 5.75% 11/15/24 (Pre-Refunded to 11/15/18 @ 100) | | 2,385 | 2,661 |
| Tarrant County Cultural Ed. Facilities Fin. Corp. Rev.: | | | |
| 5.75% 7/1/18 | | 2,600 | 2,722 |
| 5.75% 7/1/18 (Pre-Refunded to 7/1/16 @ 100) | | 50 | 50 |
| Texas Gen. Oblig.: | | | |
| Series 2009 A, 5% 10/1/16 | | 3,400 | 3,437 |
| Series 2014, 5% 10/1/16 | | 10,645 | 10,759 |
| Texas Muni. Pwr. Agcy. Rev. Series 2010, 5% 9/1/16 | | 750 | 755 |
| Texas Pub. Fin. Auth. Rev. Series 2014 B, 4% 7/1/17 | | 2,100 | 2,140 |
| Texas Trans. Commission Central Texas Tpk. Sys. Rev. Bonds Series 2015 A, 5%, tender 4/1/20 (a) | | 12,885 | 14,699 |
| Texas Trans. Commission State Hwy. Fund Rev.: | | | |
| Series 2007: | | | |
| 5% 4/1/20 (Pre-Refunded to 4/1/17 @ 100) | | 2,285 | 2,360 |
| 5% 4/1/25 (Pre-Refunded to 4/1/17 @ 100) | | 2,200 | 2,273 |
| 5% 4/1/26 (Pre-Refunded to 4/1/17 @ 100) | | 2,000 | 2,066 |
| Series 2015, 3% 10/1/17 | | 34,000 | 35,016 |
| Tomball Independent School District 5% 2/15/17 (Assured Guaranty Corp. Insured) | | 1,105 | 1,135 |
| Univ. of Texas Board of Regents Sys. Rev.: | | | |
| Series 2006 B, 5% 8/15/24 (Pre-Refunded to 8/15/16 @ 100) | | 5,975 | 6,004 |
| Series 2010 B, 5% 8/15/21 | | 1,800 | 2,156 |
| Univ. of Texas Permanent Univ. Fund Rev.: | | | |
| Series 2015 B, 4% 7/1/17 | | 5,625 | 5,816 |
| Series 2015, 5% 7/1/17 | | 1,985 | 2,072 |
|
| TOTAL TEXAS | | | 413,424 |
|
| Utah - 0.2% | | | |
| Utah Associated Muni. Pwr. Sys. Rev. (Payson Pwr. Proj.) 5% 9/1/17 | | 1,090 | 1,143 |
| Utah Gen. Oblig. Series 2009 C, 5% 7/1/16 | | 5,555 | 5,555 |
|
| TOTAL UTAH | | | 6,698 |
|
| Virginia - 1.1% | | | |
| Chesapeake Trans. Sys. Toll Road Rev. Series 2012 A: | | | |
| 4% 7/15/20 | | 605 | 667 |
| 5% 7/15/21 | | 400 | 466 |
| Fairfax County Gen. Oblig.: | | | |
| 5% 10/1/19 | | 8,000 | 9,090 |
| 5% 10/1/20 | | 6,710 | 7,869 |
| 5% 10/1/21 | | 3,000 | 3,614 |
| Fredericksburg Econ. Dev. Auth. Rev. Series 2014, 5% 6/15/24 | | 2,340 | 2,907 |
| Stafford County Econ. Dev. Auth. Hosp. Facilities Rev. Series 2016: | | | |
| 5% 6/15/24 | | 650 | 808 |
| 5% 6/15/25 | | 1,000 | 1,249 |
| 5% 6/15/26 | | 1,715 | 2,159 |
| Virginia College Bldg. Auth. Edl. Facilities Rev. (21st Century College and Equip. Progs.) Series 2015 D, 5% 2/1/17 | | 12,830 | 13,159 |
| York County Econ. Dev. Auth. Poll. Cont. Rev. Bonds (Virginia Elec. and Pwr. Co. Proj.) Series 2009 A, 1.875%, tender 5/16/19 (a) | | 2,500 | 2,550 |
|
| TOTAL VIRGINIA | | | 44,538 |
|
| Washington - 1.1% | | | |
| Grant County Pub. Util. District #2 Series 2012 A: | | | |
| 5% 1/1/20 | | 1,375 | 1,568 |
| 5% 1/1/21 | | 1,865 | 2,187 |
| King County Highline School District # 401 Series 2009: | | | |
| 5% 12/1/16 | | 6,350 | 6,464 |
| 5% 12/1/17 | | 2,950 | 3,128 |
| Port of Seattle Passenger Facilities Charge Rev. Series 2010 B, 5% 12/1/16 (b) | | 2,500 | 2,544 |
| Port of Seattle Rev.: | | | |
| Series 2010 C, 5% 2/1/17 (b) | | 2,500 | 2,561 |
| Series 2015 B, 5% 3/1/17 | | 5,000 | 5,140 |
| Seattle Muni. Lt. & Pwr. Rev. Series 2010 B, 5% 2/1/17 | | 2,000 | 2,051 |
| Tacoma Elec. Sys. Rev. Series 2013 A: | | | |
| 4% 1/1/20 | | 5,000 | 5,536 |
| 4% 1/1/21 | | 2,000 | 2,260 |
| 5% 1/1/20 | | 3,000 | 3,425 |
| 5% 1/1/21 | | 1,770 | 2,077 |
| Washington Gen. Oblig. Series 2012 AR, 5% 7/1/18 | | 5,000 | 5,423 |
|
| TOTAL WASHINGTON | | | 44,364 |
|
| West Virginia - 0.3% | | | |
| West Virginia Econ. Dev. Auth. Solid Waste Disp. Facilities Rev. Bonds: | | | |
| Series 2011 A, 2.25%, tender 9/1/16 (a)(b) | | 7,000 | 7,011 |
| 1.9%, tender 4/1/19 (a) | | 6,285 | 6,332 |
|
| TOTAL WEST VIRGINIA | | | 13,343 |
|
| Wisconsin - 0.5% | | | |
| Madison Gen. Oblig. Series 2014 A, 5% 10/1/21 | | 3,215 | 3,869 |
| Milwaukee County Arpt. Rev. Series 2013 A: | | | |
| 5% 12/1/20 (b) | | 1,330 | 1,526 |
| 5% 12/1/22 (b) | | 1,470 | 1,745 |
| 5.25% 12/1/23 (b) | | 1,540 | 1,884 |
| Wisconsin Health & Edl. Facilities: | | | |
| Bonds Series 2013 B, 4%, tender 3/1/18 (a) | | 2,090 | 2,200 |
| Series 2014: | | | |
| 4% 5/1/18 | | 375 | 392 |
| 4% 5/1/19 | | 285 | 302 |
| 5% 5/1/20 | | 410 | 452 |
| 5% 5/1/21 | | 640 | 711 |
| Wisconsin Health & Edl. Facilities Auth. Rev.: | | | |
| (Agnesian HealthCare, Inc. Proj.) Series 2010, 5% 7/1/16 | | 1,175 | 1,175 |
| (Aurora Health Care, Inc. Proj.) Series 2010 A, 5% 4/15/17 | | 1,500 | 1,549 |
| (Thedacare, Inc. Proj.) Series 2010: | | | |
| 5% 12/15/16 | | 1,440 | 1,468 |
| 5% 12/15/17 | | 1,540 | 1,633 |
| Series 2012, 5% 10/1/21 | | 1,400 | 1,650 |
|
| TOTAL WISCONSIN | | | 20,556 |
|
| TOTAL MUNICIPAL BONDS | | | |
| (Cost $3,594,200) | | | 3,684,452 |
|
| Municipal Notes - 4.6% | | | |
| Arkansas - 0.1% | | | |
| Blytheville Indl. Dev. Rev. (Nucor Corp. Proj.) Series 2002, 0.73% 7/7/16, VRDN (a)(b) | | 3,800 | $3,800 |
| Connecticut - 0.2% | | | |
| New Britain Gen. Oblig. BAN 2% 3/23/17 | | 5,000 | 5,044 |
| New London BAN Series 2016, 2% 3/23/17 | | 4,800 | 4,835 |
|
| TOTAL CONNECTICUT | | | 9,879 |
|
| Illinois - 0.6% | | | |
| Univ. of Illinois Board of Trustees Ctfs. of Prtn. (Util. Infrastructure Projs.) Series 2004, 0.99% 7/7/16 (Liquidity Facility BMO Harris Bank NA), VRDN (a) | | 25,100 | 25,100 |
| Kentucky - 0.1% | | | |
| Kentucky Pub. Trans. BAN Series 2013 A, 5% 7/1/17 | | 2,165 | 2,245 |
| New Jersey - 0.2% | | | |
| New Brunswick Gen. Oblig. BAN Series 2016, 3% 6/6/17 | | 7,723 | 7,862 |
| New York - 3.4% | | | |
| Albany Gen. Oblig. BAN Series 2016, 2% 6/30/17 | | 14,600 | 14,756 |
| Binghamton Gen. Oblig. BAN Series 2015 B, 2% 11/18/16 | | 11,300 | 11,349 |
| Lockport City School District BAN: | | | |
| Series 2015 A, 2% 8/5/16 | | 8,705 | 8,714 |
| Series 2015 B, 2% 8/5/16 | | 15,000 | 15,016 |
| New York Metropolitan Trans. Auth. Rev. BAN 2% 10/1/16 | | 54,600 | 54,804 |
| Rockland County Gen. Oblig. TAN Series 2016, 2% 3/16/17 | | 3,500 | 3,529 |
| Suffolk County Gen. Oblig. TAN 2% 7/27/16 | | 28,400 | 28,428 |
|
| TOTAL NEW YORK | | | 136,596 |
|
| TOTAL MUNICIPAL NOTES | | | |
| (Cost $185,482) | | | 185,482 |
| | | Shares | Value (000s) |
|
| Money Market Funds - 2.8% | | | |
| Fidelity Municipal Cash Central Fund, 0.44% (e)(f) | | | |
| (Cost $112,386) | | 112,386,000 | 112,386 |
| TOTAL INVESTMENT PORTFOLIO - 99.1% | | | |
| (Cost $3,892,068) | | | 3,982,320 |
| NET OTHER ASSETS (LIABILITIES) - 0.9% | | | 35,904 |
| NET ASSETS - 100% | | | $4,018,224 |
Security Type Abbreviations
BAN – BOND ANTICIPATION NOTE
TAN – TAX ANTICIPATION NOTE
VRDN – VARIABLE RATE DEMAND NOTE (A debt instrument that is payable upon demand, either daily, weekly or monthly)
Legend
(a) Coupon rates for floating and adjustable rate securities reflect the rates in effect at period end.
(b) Private activity obligations whose interest is subject to the federal alternative minimum tax for individuals.
(c) Security exempt from registration under Rule 144A of the Securities Act of 1933. These securities may be resold in transactions exempt from registration, normally to qualified institutional buyers. At the end of the period, the value of these securities amounted to $4,500,000 or 0.1% of net assets.
(d) Security or a portion of the security purchased on a delayed delivery or when-issued basis.
(e) Information in this report regarding holdings by state and security types does not reflect the holdings of the Fidelity Municipal Cash Central Fund.
(f) Affiliated fund that is available only to investment companies and other accounts managed by Fidelity Investments. The rate quoted is the annualized seven-day yield of the fund at period end. A complete unaudited listing of the fund's holdings as of its most recent quarter end is available upon request. In addition, each Fidelity Central Fund's financial statements are available on the SEC's website or upon request.
Affiliated Central Funds
Information regarding fiscal year to date income earned by the Fund from investments in Fidelity Central Funds is as follows:
| Fund | Income earned |
| | (Amounts in thousands) |
| Fidelity Municipal Cash Central Fund | $59 |
| Total | $59 |
Investment Valuation
All investments are categorized as Level 2 under the Fair Value Hierarchy. The inputs or methodology used for valuing securities may not be an indication of the risk associated with investing in those securities. For more information on valuation inputs please refer to the Investment Valuation section in the accompanying Notes to Financial Statements.
Other Information
The distribution of municipal securities by revenue source, as a percentage of total Net Assets, is as follows (Unaudited):
| General Obligations | 42.4% |
| Transportation | 11.8% |
| Special Tax | 10.0% |
| Electric Utilities | 9.1% |
| Health Care | 7.5% |
| Escrowed/Pre-Refunded | 5.2% |
| Others* (Individually Less Than 5%) | 14.0% |
| | 100.0% |
* Includes net other assets
See accompanying notes which are an integral part of the financial statements.
Financial Statements
Statement of Assets and Liabilities
| Amounts in thousands (except per-share amounts) | | June 30, 2016 (Unaudited) |
| Assets | | |
Investment in securities, at value — See accompanying schedule:
Unaffiliated issuers (cost $3,779,682) | $3,869,934 | |
| Fidelity Central Funds (cost $112,386) | 112,386 | |
| Total Investments (cost $3,892,068) | | $3,982,320 |
| Cash | | 58,411 |
| Receivable for investments sold | | 1,140 |
| Receivable for fund shares sold | | 8,615 |
| Interest receivable | | 40,159 |
| Distributions receivable from Fidelity Central Funds | | 37 |
| Other receivables | | 7 |
| Total assets | | 4,090,689 |
| Liabilities | | |
| Payable for investments purchased | | |
| Regular delivery | $32,000 | |
| Delayed delivery | 33,111 | |
| Payable for fund shares redeemed | 4,470 | |
| Distributions payable | 1,116 | |
| Accrued management fee | 1,200 | |
| Distribution and service plan fees payable | 133 | |
| Other affiliated payables | 403 | |
| Other payables and accrued expenses | 32 | |
| Total liabilities | | 72,465 |
| Net Assets | | $4,018,224 |
| Net Assets consist of: | | |
| Paid in capital | | $3,928,271 |
| Distributions in excess of net investment income | | (63) |
| Accumulated undistributed net realized gain (loss) on investments | | (236) |
| Net unrealized appreciation (depreciation) on investments | | 90,252 |
| Net Assets | | $4,018,224 |
| Calculation of Maximum Offering Price | | |
| Class A: | | |
| Net Asset Value and redemption price per share ($364,620÷ 33,959 shares) | | $10.74 |
| Maximum offering price per share (100/97.25 of $10.74) | | $11.04 |
| Class T: | | |
| Net Asset Value and redemption price per share ($21,890 ÷ 2,042 shares) | | $10.72 |
| Maximum offering price per share (100/97.25 of $10.72) | | $11.02 |
| Class C: | | |
| Net Asset Value and offering price per share ($61,947 ÷ 5,780 shares)(a) | | $10.72 |
| Limited Term Municipal Income: | | |
| Net Asset Value, offering price and redemption price per share ($3,267,793 ÷ 304,877 shares) | | $10.72 |
| Class I: | | |
| Net Asset Value, offering price and redemption price per share ($301,974 ÷ 28,158 shares) | | $10.72 |
(a) Redemption price per share is equal to net asset value less any applicable contingent deferred sales charge.
See accompanying notes which are an integral part of the financial statements.
Statement of Operations
| Amounts in thousands | | Six months ended June 30, 2016 (Unaudited) |
| Investment Income | | |
| Interest | | $37,090 |
| Income from Fidelity Central Funds | | 59 |
| Total income | | 37,149 |
| Expenses | | |
| Management fee | $7,025 | |
| Transfer agent fees | 2,060 | |
| Distribution and service plan fees | 812 | |
| Accounting fees and expenses | 307 | |
| Custodian fees and expenses | 14 | |
| Independent trustees' fees and expenses | 9 | |
| Registration fees | 140 | |
| Audit | 27 | |
| Legal | 2 | |
| Miscellaneous | 13 | |
| Total expenses before reductions | 10,409 | |
| Expense reductions | (22) | 10,387 |
| Net investment income (loss) | | 26,762 |
| Realized and Unrealized Gain (Loss) | | |
| Net realized gain (loss) on: | | |
| Investment securities: | | |
| Unaffiliated issuers | (227) | |
| Total net realized gain (loss) | | (227) |
| Change in net unrealized appreciation (depreciation) on investment securities | | 34,279 |
| Net gain (loss) | | 34,052 |
| Net increase (decrease) in net assets resulting from operations | | $60,814 |
See accompanying notes which are an integral part of the financial statements.
Statement of Changes in Net Assets
| Amounts in thousands | Six months ended June 30, 2016 (Unaudited) | Year ended December 31, 2015 |
| Increase (Decrease) in Net Assets | | |
| Operations | | |
| Net investment income (loss) | $26,762 | $57,962 |
| Net realized gain (loss) | (227) | 7,031 |
| Change in net unrealized appreciation (depreciation) | 34,279 | (25,919) |
| Net increase (decrease) in net assets resulting from operations | 60,814 | 39,074 |
| Distributions to shareholders from net investment income | (26,735) | (58,133) |
| Distributions to shareholders from net realized gain | – | (7,563) |
| Total distributions | (26,735) | (65,696) |
| Share transactions - net increase (decrease) | 186,686 | (152,171) |
| Redemption fees | 18 | 42 |
| Total increase (decrease) in net assets | 220,783 | (178,751) |
| Net Assets | | |
| Beginning of period | 3,797,441 | 3,976,192 |
| End of period | $4,018,224 | $3,797,441 |
| Other Information | | |
| Distributions in excess of net investment income end of period | $(63) | $(90) |
See accompanying notes which are an integral part of the financial statements.
Financial Highlights — Fidelity Limited Term Municipal Income Fund Class A
| | Six months ended (Unaudited) June 30, | Years ended December 31, | | | | |
| | 2016 | 2015 | 2014 | 2013 | 2012 | 2011 |
| Selected Per–Share Data | | | | | | |
| Net asset value, beginning of period | $10.64 | $10.71 | $10.68 | $10.86 | $10.83 | $10.62 |
| Income from Investment Operations | | | | | | |
| Net investment income (loss)A | .059 | .129 | .153 | .158 | .164 | .198 |
| Net realized and unrealized gain (loss) | .100 | (.048) | .046 | (.170) | .034 | .225 |
| Total from investment operations | .159 | .081 | .199 | (.012) | .198 | .423 |
| Distributions from net investment income | (.059) | (.130) | (.153) | (.158) | (.156) | (.205) |
| Distributions from net realized gain | – | (.021) | (.016) | (.010) | (.012) | (.008) |
| Total distributions | (.059) | (.151) | (.169) | (.168) | (.168) | (.213) |
| Redemption fees added to paid in capitalA,B | – | – | – | – | – | – |
| Net asset value, end of period | $10.74 | $10.64 | $10.71 | $10.68 | $10.86 | $10.83 |
| Total ReturnC,D,E | 1.50% | .76% | 1.87% | (.11)% | 1.84% | 4.03% |
| Ratios to Average Net AssetsF,G | | | | | | |
| Expenses before reductions | .81%H | .81% | .79% | .78% | .79% | .77% |
| Expenses net of fee waivers, if any | .81%H | .81% | .79% | .78% | .79% | .77% |
| Expenses net of all reductions | .81%H | .81% | .79% | .78% | .78% | .77% |
| Net investment income (loss) | 1.11%H | 1.21% | 1.42% | 1.47% | 1.51% | 1.85% |
| Supplemental Data | | | | | | |
| Net assets, end of period (in millions) | $365 | $377 | $397 | $318 | $394 | $336 |
| Portfolio turnover rateI | 23%H | 30% | 21% | 20% | 21% | 22% |
A Calculated based on average shares outstanding during the period.
B Amount represents less than $.0005 per share.
C Total returns for periods of less than one year are not annualized.
D Total returns would have been lower if certain expenses had not been reduced during the applicable periods shown.
E Total returns do not include the effect of the sales charges.
F Fees and expenses of any underlying Fidelity Central Funds are not included in the Fund's expense ratio. The Fund indirectly bears its proportionate share of the expenses of any underlying Fidelity Central Funds.
G Expense ratios reflect operating expenses of the class. Expenses before reductions do not reflect amounts reimbursed by the investment adviser or reductions from expense offset arrangements and do not represent the amount paid by the class during periods when reimbursements or reductions occur. Expenses net of fee waivers reflect expenses after reimbursement by the investment adviser but prior to reductions from expense offset arrangements. Expenses net of all reductions represent the net expenses paid by the class.
H Annualized
I Amount does not include the portfolio activity of any underlying Fidelity Central Funds.
See accompanying notes which are an integral part of the financial statements.
Financial Highlights — Fidelity Limited Term Municipal Income Fund Class T
| | Six months ended (Unaudited) June 30, | Years ended December 31, | | | | |
| | 2016 | 2015 | 2014 | 2013 | 2012 | 2011 |
| Selected Per–Share Data | | | | | | |
| Net asset value, beginning of period | $10.62 | $10.69 | $10.66 | $10.85 | $10.81 | $10.60 |
| Income from Investment Operations | | | | | | |
| Net investment income (loss)A | .061 | .134 | .157 | .162 | .166 | .199 |
| Net realized and unrealized gain (loss) | .100 | (.049) | .046 | (.180) | .044 | .226 |
| Total from investment operations | .161 | .085 | .203 | (.018) | .210 | .425 |
| Distributions from net investment income | (.061) | (.134) | (.157) | (.162) | (.158) | (.207) |
| Distributions from net realized gain | – | (.021) | (.016) | (.010) | (.012) | (.008) |
| Total distributions | (.061) | (.155) | (.173) | (.172) | (.170) | (.215) |
| Redemption fees added to paid in capitalA,B | – | – | – | – | – | – |
| Net asset value, end of period | $10.72 | $10.62 | $10.69 | $10.66 | $10.85 | $10.81 |
| Total ReturnC,D,E | 1.52% | .80% | 1.91% | (.17)% | 1.95% | 4.05% |
| Ratios to Average Net AssetsF,G | | | | | | |
| Expenses before reductions | .77%H | .77% | .76% | .75% | .77% | .76% |
| Expenses net of fee waivers, if any | .77%H | .77% | .76% | .75% | .77% | .76% |
| Expenses net of all reductions | .77%H | .77% | .75% | .75% | .76% | .76% |
| Net investment income (loss) | 1.15%H | 1.25% | 1.46% | 1.50% | 1.52% | 1.86% |
| Supplemental Data | | | | | | |
| Net assets, end of period (in millions) | $22 | $22 | $25 | $24 | $25 | $26 |
| Portfolio turnover rateI | 23%H | 30% | 21% | 20% | 21% | 22% |
A Calculated based on average shares outstanding during the period.
B Amount represents less than $.0005 per share.
C Total returns for periods of less than one year are not annualized.
D Total returns would have been lower if certain expenses had not been reduced during the applicable periods shown.
E Total returns do not include the effect of the sales charges.
F Fees and expenses of any underlying Fidelity Central Funds are not included in the Fund's expense ratio. The Fund indirectly bears its proportionate share of the expenses of any underlying Fidelity Central Funds.
G Expense ratios reflect operating expenses of the class. Expenses before reductions do not reflect amounts reimbursed by the investment adviser or reductions from expense offset arrangements and do not represent the amount paid by the class during periods when reimbursements or reductions occur. Expenses net of fee waivers reflect expenses after reimbursement by the investment adviser but prior to reductions from expense offset arrangements. Expenses net of all reductions represent the net expenses paid by the class.
H Annualized
I Amount does not include the portfolio activity of any underlying Fidelity Central Funds.
See accompanying notes which are an integral part of the financial statements.
Financial Highlights — Fidelity Limited Term Municipal Income Fund Class C
| | Six months ended (Unaudited) June 30, | Years ended December 31, | | | | |
| | 2016 | 2015 | 2014 | 2013 | 2012 | 2011 |
| Selected Per–Share Data | | | | | | |
| Net asset value, beginning of period | $10.62 | $10.69 | $10.66 | $10.84 | $10.81 | $10.60 |
| Income from Investment Operations | | | | | | |
| Net investment income (loss)A | .019 | .050 | .072 | .077 | .082 | .117 |
| Net realized and unrealized gain (loss) | .100 | (.049) | .046 | (.169) | .035 | .226 |
| Total from investment operations | .119 | .001 | .118 | (.092) | .117 | .343 |
| Distributions from net investment income | (.019) | (.050) | (.072) | (.078) | (.075) | (.125) |
| Distributions from net realized gain | – | (.021) | (.016) | (.010) | (.012) | (.008) |
| Total distributions | (.019) | (.071) | (.088) | (.088) | (.087) | (.133) |
| Redemption fees added to paid in capitalA,B | – | – | – | – | – | – |
| Net asset value, end of period | $10.72 | $10.62 | $10.69 | $10.66 | $10.84 | $10.81 |
| Total ReturnC,D,E | 1.12% | .01% | 1.11% | (.86)% | 1.08% | 3.25% |
| Ratios to Average Net AssetsF,G | | | | | | |
| Expenses before reductions | 1.56%H | 1.55% | 1.54% | 1.54% | 1.53% | 1.53% |
| Expenses net of fee waivers, if any | 1.56%H | 1.55% | 1.54% | 1.54% | 1.53% | 1.53% |
| Expenses net of all reductions | 1.56%H | 1.55% | 1.54% | 1.53% | 1.53% | 1.52% |
| Net investment income (loss) | .36%H | .47% | .67% | .72% | .76% | 1.09% |
| Supplemental Data | | | | | | |
| Net assets, end of period (in millions) | $62 | $63 | $65 | $71 | $92 | $79 |
| Portfolio turnover rateI | 23%H | 30% | 21% | 20% | 21% | 22% |
A Calculated based on average shares outstanding during the period.
B Amount represents less than $.0005 per share.
C Total returns for periods of less than one year are not annualized.
D Total returns would have been lower if certain expenses had not been reduced during the applicable periods shown.
E Total returns do not include the effect of the contingent deferred sales charge.
F Fees and expenses of any underlying Fidelity Central Funds are not included in the Fund's expense ratio. The Fund indirectly bears its proportionate share of the expenses of any underlying Fidelity Central Funds.
G Expense ratios reflect operating expenses of the class. Expenses before reductions do not reflect amounts reimbursed by the investment adviser or reductions from expense offset arrangements and do not represent the amount paid by the class during periods when reimbursements or reductions occur. Expenses net of fee waivers reflect expenses after reimbursement by the investment adviser but prior to reductions from expense offset arrangements. Expenses net of all reductions represent the net expenses paid by the class.
H Annualized
I Amount does not include the portfolio activity of any underlying Fidelity Central Funds.
See accompanying notes which are an integral part of the financial statements.
Financial Highlights — Fidelity Limited Term Municipal Income Fund
| | Six months ended (Unaudited) June 30, | Years ended December 31, | | | | |
| | 2016 | 2015 | 2014 | 2013 | 2012 | 2011 |
| Selected Per–Share Data | | | | | | |
| Net asset value, beginning of period | $10.63 | $10.69 | $10.66 | $10.85 | $10.81 | $10.60 |
| Income from Investment Operations | | | | | | |
| Net investment income (loss)A | .076 | .164 | .186 | .191 | .197 | .228 |
| Net realized and unrealized gain (loss) | .090 | (.039) | .046 | (.180) | .045 | .227 |
| Total from investment operations | .166 | .125 | .232 | .011 | .242 | .455 |
| Distributions from net investment income | (.076) | (.164) | (.186) | (.191) | (.190) | (.237) |
| Distributions from net realized gain | – | (.021) | (.016) | (.010) | (.012) | (.008) |
| Total distributions | (.076) | (.185) | (.202) | (.201) | (.202) | (.245) |
| Redemption fees added to paid in capitalA,B | – | – | – | – | – | – |
| Net asset value, end of period | $10.72 | $10.63 | $10.69 | $10.66 | $10.85 | $10.81 |
| Total ReturnC,D | 1.57% | 1.18% | 2.19% | .10% | 2.25% | 4.34% |
| Ratios to Average Net AssetsE,F | | | | | | |
| Expenses before reductions | .48%G | .48% | .48% | .48% | .48% | .48% |
| Expenses net of fee waivers, if any | .48%G | .48% | .48% | .48% | .48% | .48% |
| Expenses net of all reductions | .48%G | .48% | .48% | .48% | .47% | .48% |
| Net investment income (loss) | 1.44%G | 1.54% | 1.73% | 1.78% | 1.81% | 2.14% |
| Supplemental Data | | | | | | |
| Net assets, end of period (in millions) | $3,268 | $3,058 | $3,225 | $3,168 | $3,624 | $3,523 |
| Portfolio turnover rateH | 23%G | 30% | 21% | 20% | 21% | 22% |
A Calculated based on average shares outstanding during the period.
B Amount represents less than $.0005 per share.
C Total returns for periods of less than one year are not annualized.
D Total returns would have been lower if certain expenses had not been reduced during the applicable periods shown.
E Fees and expenses of any underlying Fidelity Central Funds are not included in the Fund's expense ratio. The Fund indirectly bears its proportionate share of the expenses of any underlying Fidelity Central Funds.
F Expense ratios reflect operating expenses of the class. Expenses before reductions do not reflect amounts reimbursed by the investment adviser or reductions from expense offset arrangements and do not represent the amount paid by the class during periods when reimbursements or reductions occur. Expenses net of fee waivers reflect expenses after reimbursement by the investment adviser but prior to reductions from expense offset arrangements. Expenses net of all reductions represent the net expenses paid by the class.
G Annualized
H Amount does not include the portfolio activity of any underlying Fidelity Central Funds.
See accompanying notes which are an integral part of the financial statements.
Financial Highlights — Fidelity Limited Term Municipal Income Fund Class I
| | Six months ended (Unaudited) June 30, | Years ended December 31, | | | | |
| | 2016 | 2015 | 2014 | 2013 | 2012 | 2011 |
| Selected Per–Share Data | | | | | | |
| Net asset value, beginning of period | $10.63 | $10.70 | $10.67 | $10.85 | $10.81 | $10.61 |
| Income from Investment Operations | | | | | | |
| Net investment income (loss)A | .073 | .156 | .179 | .184 | .191 | .224 |
| Net realized and unrealized gain (loss) | .090 | (.048) | .046 | (.169) | .045 | .216 |
| Total from investment operations | .163 | .108 | .225 | .015 | .236 | .440 |
| Distributions from net investment income | (.073) | (.157) | (.179) | (.185) | (.184) | (.232) |
| Distributions from net realized gain | – | (.021) | (.016) | (.010) | (.012) | (.008) |
| Total distributions | (.073) | (.178) | (.195) | (.195) | (.196) | (.240) |
| Redemption fees added to paid in capitalA,B | – | – | – | – | – | – |
| Net asset value, end of period | $10.72 | $10.63 | $10.70 | $10.67 | $10.85 | $10.81 |
| Total ReturnC,D | 1.53% | 1.02% | 2.12% | .14% | 2.19% | 4.19% |
| Ratios to Average Net AssetsE,F | | | | | | |
| Expenses before reductions | .55%G | .55% | .55% | .54% | .54% | .52% |
| Expenses net of fee waivers, if any | .55%G | .55% | .55% | .54% | .54% | .52% |
| Expenses net of all reductions | .55%G | .55% | .54% | .54% | .53% | .52% |
| Net investment income (loss) | 1.37%G | 1.47% | 1.67% | 1.71% | 1.76% | 2.09% |
| Supplemental Data | | | | | | |
| Net assets, end of period (in millions) | $302 | $276 | $263 | $207 | $206 | $152 |
| Portfolio turnover rateH | 23%G | 30% | 21% | 20% | 21% | 22% |
A Calculated based on average shares outstanding during the period.
B Amount represents less than $.0005 per share.
C Total returns for periods of less than one year are not annualized.
D Total returns would have been lower if certain expenses had not been reduced during the applicable periods shown.
E Fees and expenses of any underlying Fidelity Central Funds are not included in the Fund's expense ratio. The Fund indirectly bears its proportionate share of the expenses of any underlying Fidelity Central Funds.
F Expense ratios reflect operating expenses of the class. Expenses before reductions do not reflect amounts reimbursed by the investment adviser or reductions from expense offset arrangements and do not represent the amount paid by the class during periods when reimbursements or reductions occur. Expenses net of fee waivers reflect expenses after reimbursement by the investment adviser but prior to reductions from expense offset arrangements. Expenses net of all reductions represent the net expenses paid by the class.
G Annualized
H Amount does not include the portfolio activity of any underlying Fidelity Central Funds.
See accompanying notes which are an integral part of the financial statements.
Notes to Financial Statements (Unaudited)
For the period ended June 30, 2016
(Amounts in thousands except percentages)
1. Organization.
Fidelity Limited Term Municipal Income Fund (the Fund) is a fund of Fidelity Municipal Trust (the Trust) and is authorized to issue an unlimited number of shares. The Trust is registered under the Investment Company Act of 1940, as amended (the 1940 Act), as an open-end management investment company organized as a Massachusetts business trust. The Fund offers Class A, Class T, Class C, Limited Term Municipal Income and Class I shares, each of which has equal rights as to assets and voting privileges. Each class has exclusive voting rights with respect to matters that affect that class.
After the close of business on June 24, 2016, all outstanding Class B shares were converted to Class A shares. All current fiscal period dollar and share amounts for Class B presented in the Notes to Financial Statements are for the period January 1, 2016 through June 24, 2016.
2. Investments in Fidelity Central Funds.
The Fund invests in Fidelity Central Funds, which are open-end investment companies generally available only to other investment companies and accounts managed by the investment adviser and its affiliates. The Fund's Schedule of Investments lists each of the Fidelity Central Funds held as of period end, if any, as an investment of the Fund, but does not include the underlying holdings of each Fidelity Central Fund. As an Investing Fund, the Fund indirectly bears its proportionate share of the expenses of the underlying Fidelity Central Funds.
The Money Market Central Funds seek preservation of capital and current income and are managed by Fidelity Investments Money Management, Inc. (FIMM), an affiliate of the investment adviser. Annualized expenses of the Money Market Central Funds as of their most recent shareholder report date are less than .005%.
A complete unaudited list of holdings for each Fidelity Central Fund is available upon request or at the Securities and Exchange Commission (the SEC) website at www.sec.gov. In addition, the financial statements of the Fidelity Central Funds are available on the SEC website or upon request
3. Significant Accounting Policies.
The financial statements have been prepared in conformity with accounting principles generally accepted in the United States of America (GAAP), which require management to make certain estimates and assumptions at the date of the financial statements. Actual results could differ from those estimates. Subsequent events, if any, through the date that the financial statements were issued have been evaluated in the preparation of the financial statements. The following summarizes the significant accounting policies of the Fund:
Investment Valuation. Investments are valued as of 4:00 p.m. Eastern time on the last calendar day of the period. The Board of Trustees (the Board) has delegated the day to day responsibility for the valuation of the Fund's investments to the Fidelity Management & Research Company (FMR) Fair Value Committee (the Committee). In accordance with valuation policies and procedures approved by the Board, the Fund attempts to obtain prices from one or more third party pricing vendors or brokers to value its investments. When current market prices, quotations or currency exchange rates are not readily available or reliable, investments will be fair valued in good faith by the Committee, in accordance with procedures adopted by the Board. Factors used in determining fair value vary by investment type and may include market or investment specific events, changes in interest rates and credit quality. The frequency with which these procedures are used cannot be predicted and they may be utilized to a significant extent. The Committee oversees the Fund's valuation policies and procedures and reports to the Board on the Committee's activities and fair value determinations. The Board monitors the appropriateness of the procedures used in valuing the Fund's investments and ratifies the fair value determinations of the Committee.
The Fund categorizes the inputs to valuation techniques used to value its investments into a disclosure hierarchy consisting of three levels as shown below:
- Level 1 – quoted prices in active markets for identical investments
- Level 2 – other significant observable inputs (including quoted prices for similar investments, interest rates, prepayment speeds, etc.)
- Level 3 – unobservable inputs (including the Fund's own assumptions based on the best information available)
Valuation techniques used to value the Fund's investments by major category are as follows:
Debt securities, including restricted securities, are valued based on evaluated prices received from third party pricing vendors or from brokers who make markets in such securities. Municipal securities are valued by pricing vendors who utilize matrix pricing which considers yield or price of bonds of comparable quality, coupon, maturity and type or by broker-supplied prices. When independent prices are unavailable or unreliable, debt securities may be valued utilizing pricing methodologies which consider similar factors that would be used by third party pricing vendors. Debt securities are generally categorized as Level 2 in the hierarchy but may be Level 3 depending on the circumstances. The Fund invests a significant portion of its assets in below investment grade securities. The value of these securities can be more volatile due to changes in the credit quality of the issuer and is sensitive to changes in economic, market and regulatory conditions.
Investments in open-end mutual funds, including the Fidelity Central Funds, are valued at their closing net asset value (NAV) each business day and are categorized as Level 1 in the hierarchy.
Changes in valuation techniques may result in transfers in or out of an assigned level within the disclosure hierarchy. The aggregate value of investments by input level as of June 30, 2016 is included at the end of the Fund's Schedule of Investments.
Investment Transactions and Income. For financial reporting purposes, the Fund's investment holdings and NAV include trades executed through the end of the last business day of the period. The NAV per share for processing shareholder transactions is calculated as of the close of business of the New York Stock Exchange (NYSE), normally 4:00 p.m. Eastern time and includes trades executed through the end of the prior business day. Gains and losses on securities sold are determined on the basis of identified cost. Income and capital gain distributions from Fidelity Central Funds, if any, are recorded on the ex-dividend date. Interest income is accrued as earned and includes coupon interest and amortization of premium and accretion of discount on debt securities as applicable. Debt obligations may be placed on non-accrual status and related interest income may be reduced by ceasing current accruals and writing off interest receivables when the collection of all or a portion of interest has become doubtful based on consistently applied procedures. A debt obligation is removed from non-accrual status when the issuer resumes interest payments or when collectability of interest is reasonably assured.
Class Allocations and Expenses. Investment income, realized and unrealized capital gains and losses, common expenses of the Fund, and certain fund-level expense reductions, if any, are allocated daily on a pro-rata basis to each class based on the relative net assets of each class to the total net assets of the Fund. Each class differs with respect to transfer agent and distribution and service plan fees incurred. Certain expense reductions may also differ by class. For the reporting period, the allocated portion of income and expenses to each class as a percent of its average net assets may vary due to the timing of recording these transactions in relation to fluctuating net assets of the classes. Expenses directly attributable to a fund are charged to that fund. Expenses attributable to more than one fund are allocated among the respective funds on the basis of relative net assets or other appropriate methods. Expense estimates are accrued in the period to which they relate and adjustments are made when actual amounts are known.
Income Tax Information and Distributions to Shareholders. Each year, the Fund intends to qualify as a regulated investment company under Subchapter M of the Internal Revenue Code, including distributing substantially all of its taxable income and realized gains. As a result, no provision for U.S. Federal income taxes is required. The Fund files a U.S. federal tax return, in addition to state and local tax returns as required. The Fund's federal income tax returns are subject to examination by the Internal Revenue Service (IRS) for a period of three fiscal years after they are filed. State and local tax returns may be subject to examination for an additional fiscal year depending on the jurisdiction.
Dividends are declared and recorded daily and paid monthly from net investment income. Distributions from realized gains, if any, are declared and recorded on the ex-dividend date. Income dividends and capital gain distributions are declared separately for each class. Income and capital gain distributions are determined in accordance with income tax regulations, which may differ from GAAP.
Capital accounts within the financial statements are adjusted for permanent book-tax differences. These adjustments have no impact on net assets or the results of operations. Capital accounts are not adjusted for temporary book-tax differences which will reverse in a subsequent period.
Book-tax differences are primarily due to market discount, deferred trustees compensation and losses deferred due to wash sales and excise tax regulations.
The Fund purchases municipal securities whose interest, in the opinion of the issuer, is free from federal income tax. There is no assurance that the IRS will agree with this opinion. In the event the IRS determines that the issuer does not comply with relevant tax requirements, interest payments from a security could become federally taxable, possibly retroactively to the date the security was issued.
The federal tax cost of investment securities and unrealized appreciation (depreciation) as of period end were as follows:
| Gross unrealized appreciation | $91,984 |
| Gross unrealized depreciation | (1,693) |
| Net unrealized appreciation (depreciation) on securities | $90,291 |
| Tax cost | $3,892,029 |
The Fund elected to defer to its next fiscal year approximately $6 of capital losses recognized during the period November 1, 2015 to December 31, 2015.
Short-Term Trading (Redemption) Fees. Shares held by investors in the Fund less than 30 days may have been subject to a redemption fee equal to .50% of the NAV of shares redeemed. All redemption fees, which reduce the proceeds of the shareholder redemption, are retained by the Fund and accounted for as an addition to paid in capital.
Delayed Delivery Transactions and When-Issued Securities. During the period, the Fund transacted in securities on a delayed delivery or when-issued basis. Payment and delivery may take place after the customary settlement period for that security. The price of the underlying securities and the date when the securities will be delivered and paid for are fixed at the time the transaction is negotiated. The securities purchased on a delayed delivery or when-issued basis are identified as such in the Fund's Schedule of Investments. The Fund may receive compensation for interest forgone in the purchase of a delayed delivery or when-issued security. With respect to purchase commitments, the Fund identifies securities as segregated in its records with a value at least equal to the amount of the commitment. Losses may arise due to changes in the value of the underlying securities or if the counterparty does not perform under the contract's terms, or if the issuer does not issue the securities due to political, economic, or other factors.
Restricted Securities. The Fund may invest in securities that are subject to legal or contractual restrictions on resale. These securities generally may be resold in transactions exempt from registration or to the public if the securities are registered. Disposal of these securities may involve time-consuming negotiations and expense, and prompt sale at an acceptable price may be difficult. Information regarding restricted securities is included at the end of the Fund's Schedule of Investments.
4. Purchases and Sales of Investments.
Purchases and sales of securities, other than short-term securities, aggregated $603,781 and $416,156, respectively.
5. Fees and Other Transactions with Affiliates.
Management Fee. Fidelity Management & Research Company (the investment adviser) and its affiliates provide the Fund with investment management related services for which the Fund pays a monthly management fee. The management fee is the sum of an individual fund fee rate that is based on an annual rate of .25% of the Fund's average net assets and an annualized group fee rate that averaged .11% during the period. The group fee rate is based upon the average net assets of all the mutual funds advised by the investment adviser, including any mutual funds previously advised by the investment adviser that are currently advised by Fidelity SelectCo, LLC, an affiliate of the investment adviser. The group fee rate decreases as assets under management increase and increases as assets under management decrease. For the reporting period, the total annualized management fee rate was .36% of the Fund's average net assets.
Distribution and Service Plan Fees. In accordance with Rule 12b-1 of the 1940 Act, the Fund has adopted separate Distribution and Service Plans for each class of shares. Certain classes pay Fidelity Distributors Corporation (FDC), an affiliate of the investment adviser, separate Distribution and Service Fees, each of which is based on an annual percentage of each class' average net assets. In addition, FDC may pay financial intermediaries for selling shares of the Fund and providing shareholder support services. For the period, the Distribution and Service Fee rates, total fees and amounts retained by FDC were as follows:
| | Distribution
Fee | Service
Fee | Total Fees | Retained
by FDC |
| Class A | -% | .25% | $467 | $– |
| Class T | -% | .25% | 28 | – |
| Class B | .65% | .25% | 1 | 1 |
| Class C | .75% | .25% | 316 | 33 |
| | | | $812 | $34 |
Sales Load. FDC may receive a front-end sales charge of up to 2.75% for selling Class A shares and Class T shares, some of which is paid to financial intermediaries for selling shares of the Fund. Depending on the holding period, FDC may receive contingent deferred sales charges levied on Class A, Class T, Class B and Class C redemptions. The deferred sales charges range from 3.00% to 1.00% for Class B shares, 1.00% for Class C shares, .75% or .50% for certain purchases of Class A shares and .25% for certain purchases of Class T shares.
For the period, sales charge amounts retained by FDC were as follows:
| | Retained
by FDC |
| Class A | $5 |
| Class T | 2 |
| Class B(a) | –(b) |
| Class C(a) | 8 |
| | $15 |
(a) When Class B and Class C shares are initially sold, FDC pays commissions from its own resources to financial intermediaries through which the sales are made.
(b) In the amount of less than five hundred dollars.
Transfer Agent Fees. Fidelity Investments Institutional Operations Company, Inc. (FIIOC), an affiliate of the investment adviser, is the transfer, dividend disbursing and shareholder servicing agent for the Fund. FIIOC receives account fees and asset-based fees that vary according to the account size and type of account of the shareholders of the respective classes of the Fund. FIIOC pays for typesetting, printing and mailing of shareholder reports, except proxy statements. For the period, transfer agent fees for each class were as follows:
| | Amount | % of
Class-Level Average
Net Assets(a) |
| Class A | $313 | .17 |
| Class T | 15 | .13 |
| Class B | –(b) | .10 |
| Class C | 52 | .17 |
| Limited Term Municipal Income | 1,450 | .09 |
| Class I | 230 | .16 |
| | $2,060 | |
(a) Annualized
(b) In the amount of less than five hundred dollars.
Accounting Fees. Fidelity Service Company, Inc. (FSC), an affiliate of the investment adviser, maintains the Fund's accounting records. The fee is based on the level of average net assets for each month.
Interfund Trades. The Fund may purchase from or sell securities to other Fidelity Funds under procedures adopted by the Board. The procedures have been designed to ensure these interfund trades are executed in accordance with Rule 17a-7 of the 1940 Act. Interfund trades are included within the respective purchases and sales amounts shown in the Purchases and Sales of Investments note.
6. Committed Line of Credit.
The Fund participates with other funds managed by the investment adviser or an affiliate in a $4.25 billion credit facility (the "line of credit") to be utilized for temporary or emergency purposes to fund shareholder redemptions or for other short-term liquidity purposes. The Fund has agreed to pay commitment fees on its pro-rata portion of the line of credit, which amounted to $3 and is reflected in Miscellaneous expenses on the Statement of Operations. During the period, the Fund did not borrow on this line of credit.
7. Expense Reductions.
Through arrangements with the Fund's custodian, credits realized as a result of certain uninvested cash balances were used to reduce the Fund's expenses. During the period, these credits reduced the Fund's custody expenses by $14.
In addition, during the period the investment adviser reimbursed and/or waived a portion of the fund-level operating expenses in the amount of $8.
8. Distributions to Shareholders.
Distributions to shareholders of each class were as follows:
| | Six months ended
June 30, 2016 | Year ended December 31, 2015 |
| From net investment income | | |
| Class A | $2,065 | $4,860 |
| Class T | 126 | 289 |
| Class B | 1 | 2 |
| Class C | 113 | 303 |
| Limited Term Municipal Income | 22,492 | 48,674 |
| Class I | 1,938 | 4,005 |
| Total | $26,735 | $58,133 |
| From net realized gain | | |
| Class A | $– | $751 |
| Class T | – | 45 |
| Class B | – | 1 |
| Class C | – | 125 |
| Limited Term Municipal Income | – | 6,100 |
| Class I | – | 541 |
| Total | $– | $7,563 |
9. Share Transactions.
Share transactions for each class were as follows and may contain automatic conversions between classes or exchanges between affiliated funds:
| | Shares | Shares | Dollars | Dollars |
| | Six months ended
June 30, 2016 | Year ended December 31, 2015 | Six months ended
June 30, 2016 | Year ended December 31, 2015 |
| Class A | | | | |
| Shares sold | 7,252 | 16,831 | $77,596 | $179,831 |
| Reinvestment of distributions | 176 | 483 | 1,883 | 5,154 |
| Shares redeemed | (8,914) | (18,951) | (95,378) | (202,084) |
| Net increase (decrease) | (1,486) | (1,637) | $(15,899) | $(17,099) |
| Class T | | | | |
| Shares sold | 256 | 791 | $2,730 | $8,447 |
| Reinvestment of distributions | 11 | 30 | 118 | 316 |
| Shares redeemed | (284) | (1,080) | (3,031) | (11,510) |
| Net increase (decrease) | (17) | (259) | $(183) | $(2,747) |
| Class B | | | | |
| Shares sold | 3 | 3 | $28 | $17 |
| Reinvestment of distributions | –(a) | –(a) | 1 | 3 |
| Shares redeemed | (30) | (14) | (317) | (144) |
| Net increase (decrease) | (27) | (11) | $(288) | $(124) |
| Class C | | | | |
| Shares sold | 600 | 1,149 | $6,410 | $12,246 |
| Reinvestment of distributions | 9 | 34 | 92 | 359 |
| Shares redeemed | (803) | (1,330) | (8,574) | (14,162) |
| Net increase (decrease) | (194) | (147) | $(2,072) | $(1,557) |
| Limited Term Municipal Income | | | | |
| Shares sold | 47,303 | 66,529 | $505,162 | $709,164 |
| Reinvestment of distributions | 1,556 | 3,861 | 16,622 | 41,135 |
| Shares redeemed | (31,802) | (84,109) | (339,665) | (895,882) |
| Net increase (decrease) | 17,057 | (13,719) | $182,119 | $(145,583) |
| Class I | | | | |
| Shares sold | 6,990 | 13,372 | $74,692 | $142,602 |
| Reinvestment of distributions | 144 | 335 | 1,543 | 3,575 |
| Shares redeemed | (4,980) | (12,317) | (53,226) | (131,238) |
| Net increase (decrease) | 2,154 | 1,390 | $23,009 | $14,939 |
(a) In the amount of less than five hundred shares
10. Other.
The Fund's organizational documents provide former and current trustees and officers with a limited indemnification against liabilities arising in connection with the performance of their duties to the Fund. In the normal course of business, the Fund may also enter into contracts that provide general indemnifications. The Fund's maximum exposure under these arrangements is unknown as this would be dependent on future claims that may be made against the Fund. The risk of material loss from such claims is considered remote.
Shareholder Expense Example
As a shareholder of the Fund, you incur two types of costs: (1) transaction costs, including sales charges (loads) on purchase payments or redemption proceeds, redemption fees and (2) ongoing costs, including management fees, distribution and/or service (12b-1) fees and other Fund expenses. This Example is intended to help you understand your ongoing costs (in dollars) of investing in the Fund and to compare these costs with the ongoing costs of investing in other mutual funds.
The Example is based on an investment of $1,000 invested at the beginning of the period and held for the entire period (January 1, 2016 to June 30, 2016).
Actual Expenses
The first line of the accompanying table for each class of the Fund provides information about actual account values and actual expenses. You may use the information in this line, together with the amount you invested, to estimate the expenses that you paid over the period. Simply divide your account value by $1,000.00 (for example, an $8,600 account value divided by $1,000.00 = 8.6), then multiply the result by the number in the first line for a class of the Fund under the heading entitled "Expenses Paid During Period" to estimate the expenses you paid on your account during this period. A small balance maintenance fee of $12.00 that is charged once a year may apply for certain accounts with a value of less than $2,000. This fee is not included in the table below. If it was, the estimate of expenses you paid during the period would be higher, and your ending account value lower, by this amount.
Hypothetical Example for Comparison Purposes
The second line of the accompanying table for each class of the Fund provides information about hypothetical account values and hypothetical expenses based on a Class' actual expense ratio and an assumed rate of return of 5% per year before expenses, which is not the Class' actual return. The hypothetical account values and expenses may not be used to estimate the actual ending account balance or expenses you paid for the period. You may use this information to compare the ongoing costs of investing in the Fund and other funds. To do so, compare this 5% hypothetical example with the 5% hypothetical examples that appear in the shareholder reports of the other funds. A small balance maintenance fee of $12.00 that is charged once a year may apply for certain accounts with a value of less than $2,000. This fee is not included in the table below. If it was, the estimate of expenses you paid during the period would be higher, and your ending account value lower, by this amount.
Please note that the expenses shown in the table are meant to highlight your ongoing costs only and do not reflect any transaction costs. Therefore, the second line of the table is useful in comparing ongoing costs only, and will not help you determine the relative total costs of owning different funds. In addition, if these transactional costs were included, your costs would have been higher.
| | Annualized Expense Ratio-A | Beginning
Account Value
January 1, 2016 | Ending
Account Value
June 30, 2016 | Expenses Paid
During Period-B
January 1, 2016
to June 30, 2016 |
| Class A | .81% | | | |
| Actual | | $1,000.00 | $1,015.00 | $4.06 |
| Hypothetical-C | | $1,000.00 | $1,020.84 | $4.07 |
| Class T | .77% | | | |
| Actual | | $1,000.00 | $1,015.20 | $3.86 |
| Hypothetical-C | | $1,000.00 | $1,021.03 | $3.87 |
| Class C | 1.56% | | | |
| Actual | | $1,000.00 | $1,011.20 | $7.80 |
| Hypothetical-C | | $1,000.00 | $1,017.11 | $7.82 |
| Limited Term Municipal Income | .48% | | | |
| Actual | | $1,000.00 | $1,015.70 | $2.41 |
| Hypothetical-C | | $1,000.00 | $1,022.48 | $2.41 |
| Class I | .55% | | | |
| Actual | | $1,000.00 | $1,015.30 | $2.76 |
| Hypothetical-C | | $1,000.00 | $1,022.13 | $2.77 |
A Annualized expense ratio reflects expenses net of applicable fee waivers.
B Expenses are equal to each Class' annualized expense ratio, multiplied by the average account value over the period, multiplied by 182/366 (to reflect the one-half year period).
C 5% return per year before expenses
Corporate Headquarters
245 Summer St.
Boston, MA 02210
www.fidelity.com
STM-SANN-0816
1.701069.118
Fidelity® Conservative Income Municipal Bond Fund
Fidelity® Conservative Income Municipal Bond Fund and
Institutional Class
Semi-Annual Report June 30, 2016 |
|
Contents
To view a fund's proxy voting guidelines and proxy voting record for the 12-month period ended June 30, visit http://www.fidelity.com/proxyvotingresults or visit the Securities and Exchange Commission's (SEC) web site at http://www.sec.gov.
You may also call 1-800-544-8544 to request a free copy of the proxy voting guidelines.
Standard & Poor's, S&P and S&P 500 are registered service marks of The McGraw-Hill Companies, Inc. and have been licensed for use by Fidelity Distributors Corporation.
Other third-party marks appearing herein are the property of their respective owners.
All other marks appearing herein are registered or unregistered trademarks or service marks of FMR LLC or an affiliated company. © 2016 FMR LLC. All rights reserved.
This report and the financial statements contained herein are submitted for the general information of the shareholders of the Fund. This report is not authorized for distribution to prospective investors in the Fund unless preceded or accompanied by an effective prospectus.
A fund files its complete schedule of portfolio holdings with the SEC for the first and third quarters of each fiscal year on Form N-Q. Forms N-Q are available on the SEC’s web site at http://www.sec.gov. A fund's Forms N-Q may be reviewed and copied at the SEC’s Public Reference Room in Washington, DC. Information regarding the operation of the SEC's Public Reference Room may be obtained by calling 1-800-SEC-0330.
For a complete list of a fund's portfolio holdings, view the most recent holdings listing, semiannual report, or annual report on Fidelity's web site at http://www.fidelity.com, http://www.institutional.fidelity.com, or http://www.401k.com, as applicable.
NOT FDIC INSURED •MAY LOSE VALUE •NO BANK GUARANTEE
Neither the Fund nor Fidelity Distributors Corporation is a bank.
Investment Summary (Unaudited)
Maturity Diversification
| | % of fund's investments | % of fund's investments 6 months ago |
| 1 - 7 | 46.0 | 41.1 |
| 8 - 30 | 0.4 | 0.3 |
| 31 - 60 | 2.0 | 1.3 |
| 61 - 90 | 1.0 | 0.3 |
| 91 - 180 | 5.1 | 5.1 |
| > 180 | 45.5 | 51.9 |
The date shown for securities represents the date when principal payments must be paid, taking into account any call options exercised by the issuer and any permissible maturity shortening features other than interest rate resets.
Top Five States as of June 30, 2016
| | % of fund's net assets | % of fund's net assets 6 months ago |
| Illinois | 18.4 | 19.4 |
| Texas | 14.9 | 13.4 |
| New Jersey | 6.2 | 4.6 |
| Michigan | 5.1 | 5.0 |
| Louisiana | 4.9 | 4.3 |
Top Five Sectors as of June 30, 2016
| | % of fund's net assets | % of fund's net assets 6 months ago |
| General Obligations | 22.3 | 13.4 |
| Industrial Development | 21.5 | 21.9 |
| Health Care | 13.9 | 18.7 |
| Synthetics | 13.3 | 9.5 |
| Electric Utilities | 12.3 | 13.4 |
Quality Diversification (% of fund's net assets)
| As of June 30, 2016 |
| | AAA | 0.4% |
| | AA,A | 53.6% |
| | BBB | 3.7% |
| | BB and Below | 0.7% |
| | Not Rated | 0.3% |
| | Short-Term Investments and Net Other Assets | 41.3% |

| As of December 31, 2015 |
| | AA,A | 55.3% |
| | BBB | 4.2% |
| | BB and Below | 0.4% |
| | Not Rated | 3.2% |
| | Short-Term Investments and Net Other Assets | 36.9% |

We have used ratings from Moody's Investors Service, Inc. Where Moody's® ratings are not available, we have used S&P® ratings. All ratings are as of the date indicated and do not reflect subsequent changes.
Investments June 30, 2016 (Unaudited)
Showing Percentage of Net Assets
| Municipal Bonds - 58.7% | | | |
| | | Principal Amount | Value |
| Alabama - 1.3% | | | |
| Mobile County Board of School Commissioners: | | | |
| Series 2016 A: | | $ | $ |
| 2% 3/1/18 | | 500,000 | 509,830 |
| 3% 3/1/19 | | 550,000 | 577,242 |
| Series 2016 B, 5% 3/1/19 | | 900,000 | 991,503 |
| Mobile Indl. Dev. Board Poll. Cont. Rev. Bonds: | | | |
| (Alabama Pwr. Co. Barry Plant Proj.) Series 2008, 1.625%, tender 10/2/18 (a) | | 3,000,000 | 3,034,050 |
| Series 2009 E, 1.65%, tender 3/20/17 (a) | | 725,000 | 729,169 |
| Montgomery Med. Clinic Facilities Series 2015, 5% 3/1/18 | | 1,000,000 | 1,057,580 |
|
| TOTAL ALABAMA | | | 6,899,374 |
|
| Arizona - 1.3% | | | |
| Arizona Board of Regents Arizona State Univ. Rev.: | | | |
| (Polytechnic Campus Proj.) Series 2008 C, 5.25% 7/1/16 | | 85,000 | 85,000 |
| Series 2011, 3% 8/1/17 | | 125,000 | 128,071 |
| Series 2013 A, 4% 7/1/16 | | 150,000 | 150,000 |
| Series B, 4% 8/1/16 | | 150,000 | 150,416 |
| Arizona Ctfs. of Prtn.: | | | |
| Series 2008 A: | | | |
| 4% 9/1/16 (FSA Insured) | | 670,000 | 673,839 |
| 4% 9/1/17 (FSA Insured) | | 145,000 | 150,500 |
| 5% 9/1/16 | | 225,000 | 226,656 |
| Series 2010 A: | | | |
| 5% 10/1/17 (FSA Insured) | | 150,000 | 157,943 |
| 5% 10/1/18 (FSA Insured) | | 140,000 | 152,939 |
| Series 2013 A, 3% 10/1/17 | | 100,000 | 102,838 |
| Series 2013 B, 5% 10/1/16 | | 655,000 | 661,956 |
| Arizona Health Facilities Auth. Rev.: | | | |
| (Scottsdale Lincoln Hospitals Proj.) Series 2014 A, 5% 12/1/17 | | 500,000 | 529,595 |
| Series 2007 A, 5% 1/1/17 | | 355,000 | 362,569 |
| 5% 1/1/19 (Pre-Refunded to 1/1/17 @ 100) | | 200,000 | 204,344 |
| Arizona School Facilities Board Ctfs. of Prtn.: | | | |
| Series 2008: | | | |
| 4.375% 9/1/16 | | 55,000 | 55,349 |
| 5.5% 9/1/16 | | 180,000 | 181,471 |
| Series 2013 A1, 4% 9/1/16 | | 170,000 | 170,974 |
| Series 2013 A2, 5% 9/1/17 | | 275,000 | 288,582 |
| Arizona School Facilities Board Rev. 5% 7/1/17 (AMBAC Insured) | | 125,000 | 129,831 |
| Arizona State Lottery Rev. Series 2010 A: | | | |
| 3% 7/1/16 | | 175,000 | 175,000 |
| 5% 7/1/16 | | 125,000 | 125,000 |
| Glendale Gen. Oblig. Series 2015, 4% 7/1/18 (FSA Insured) | | 370,000 | 393,284 |
| Maricopa County Indl. Dev. Auth. Health Facilities Rev. (Catholic Healthcare West Proj.) Series 2007 A, 5% 7/1/16 | | 320,000 | 320,000 |
| Phoenix Civic Impt. Board Arpt. Rev. Series 2010 A, 5% 7/1/16 | | 885,000 | 885,000 |
| Pima County Swr. Sys. Rev. Series 2008, 4% 7/1/16 (Assured Guaranty Corp. Insured) | | 150,000 | 150,000 |
| Tucson Gen. Oblig. Series 2005 E, 3.75% 7/1/16 (FGIC Insured) | | 55,000 | 55,000 |
| Univ. of Arizona Univ. Revs. Series 2011, 5% 8/1/16 | | 250,000 | 250,915 |
|
| TOTAL ARIZONA | | | 6,917,072 |
|
| California - 1.0% | | | |
| California Health Facilities Fing. Auth. Rev.: | | | |
| Series 2011 A, 5% 3/1/17 | | 350,000 | 359,783 |
| Series 2011, 3% 8/15/16 | | 215,000 | 215,682 |
| 4% 3/1/17 | | 500,000 | 510,890 |
| California Statewide Cmntys. Dev. Auth. Poll. Cont. Rev. Bonds: | | | |
| Series 2006 A, 1.375%, tender 4/2/18 (a) | | 2,400,000 | 2,421,696 |
| Series 2006 D, 4.25%, tender 11/1/16 (FGIC Insured) (a) | | 575,000 | 581,647 |
| California Statewide Cmntys. Dev. Auth. Rev. Series 2007 F, 5.25% 7/1/16 (FSA Insured) | | 600,000 | 600,000 |
| Los Angeles Dept. of Wtr. & Pwr. Wtrwks. Rev. Series 2009 A, 5% 7/1/16 | | 165,000 | 165,000 |
| Modesto Irrigation District Fing. Auth. Rev. Series 2013, 5% 9/1/16 | | 250,000 | 251,840 |
|
| TOTAL CALIFORNIA | | | 5,106,538 |
|
| Colorado - 0.7% | | | |
| Colorado Health Facilities Auth. Rev.: | | | |
| (Parkview Med. Ctr., Inc. Proj.) Series 2012, 4% 9/1/16 | | 735,000 | 738,579 |
| Series 2008 D1, 5% 10/1/16 | | 75,000 | 75,779 |
| Series 2011 A: | | | |
| 5% 2/1/17 | | 225,000 | 230,567 |
| 5% 2/1/18 | | 95,000 | 101,334 |
| Series 2011, 4% 2/1/17 | | 350,000 | 356,671 |
| 5% 9/1/16 | | 225,000 | 226,460 |
| 5.125% 10/1/17 | | 50,000 | 52,699 |
| 5.125% 11/15/17 (Pre-Refunded to 11/15/16 @ 100) | | 390,000 | 396,431 |
| 5.125%, tender 11/15/16 (a) | | 530,000 | 538,740 |
| Denver City & County Arpt. Rev.: | | | |
| Series 2011 A, 4% 11/15/17 (b) | | 50,000 | 52,199 |
| Series 2011 B, 5% 11/15/16 (b) | | 250,000 | 253,948 |
| Series 2012 A, 4% 11/15/17 (b) | | 75,000 | 78,298 |
| Series 2012 B, 5% 11/15/16 | | 350,000 | 355,590 |
|
| TOTAL COLORADO | | | 3,457,295 |
|
| Connecticut - 4.1% | | | |
| Connecticut Gen. Oblig.: | | | |
| Series 2006 E, 5% 12/15/18 | | 175,000 | 178,406 |
| Series 2006 F, 4% 12/1/16 | | 290,000 | 294,077 |
| Series 2012 D: | | | |
| 0.93% 9/15/17 (a) | | 2,000,000 | 2,004,560 |
| 1.18% 9/15/18 (a) | | 1,945,000 | 1,944,300 |
| 1.33% 9/15/19 (a) | | 2,045,000 | 2,051,074 |
| Series 2013 A: | | | |
| 0.96% 3/1/19 (a) | | 275,000 | 273,061 |
| 5% 10/15/19 | | 800,000 | 898,976 |
| Series 2013 D: | | | |
| 1.29% 8/15/18 (a) | | 3,000,000 | 3,003,510 |
| 1.29% 8/15/19 (a) | | 1,000,000 | 1,001,840 |
| Series 2014 C, 5% 6/15/17 | | 185,000 | 192,596 |
| Series 2014 H, 5% 11/15/18 | | 150,000 | 164,244 |
| Series 2016 B: | | | |
| 5% 5/15/19 | | 2,000,000 | 2,218,860 |
| 5% 5/15/20 | | 1,000,000 | 1,142,430 |
| Connecticut Health & Edl. Facilities Auth. Rev.: | | | |
| Bonds: | | | |
| (Ascension Health Cr. Group Proj.) Series 1998 B, 1.55%, tender 2/1/17 (a) | | 1,660,000 | 1,669,147 |
| Series 2010 A2, 1.2%, tender 2/1/19 (a) | | 100,000 | 100,786 |
| Series 2011 N, 4% 7/1/16 | | 535,000 | 535,000 |
| Series 2012 D, 5% 7/1/18 | | 225,000 | 242,840 |
| Series A: | | | |
| 4% 7/1/16 | | 280,000 | 280,000 |
| 4% 7/1/17 | | 200,000 | 206,434 |
| Series N: | | | |
| 4% 7/1/17 | | 190,000 | 196,112 |
| 5% 7/1/17 | | 245,000 | 255,160 |
| Connecticut Spl. Tax Oblig. Trans. Infrastructure Rev.: | | | |
| Series 2004 B, 5.25% 7/1/16 | | 310,000 | 310,000 |
| Series 2007 A, 4% 8/1/16 (AMBAC Insured) | | 200,000 | 200,590 |
| New Britain Gen. Oblig. Series 2016 A: | | | |
| 5% 3/1/17 | | 1,000,000 | 1,027,080 |
| 5% 3/1/18 | | 1,000,000 | 1,067,610 |
| New Haven Gen. Oblig. Series 2013 B, 3% 9/1/16 (FSA Insured) | | 200,000 | 200,710 |
|
| TOTAL CONNECTICUT | | | 21,659,403 |
|
| District Of Columbia - 0.4% | | | |
| District of Columbia Univ. Rev. Bonds (Georgetown Univ. Proj.) Series 2001 B, 4.7%, tender 4/1/18 (a) | | 300,000 | 318,999 |
| Metropolitan Washington DC Arpts. Auth. Sys. Rev.: | | | |
| Series 2010 B, 5% 10/1/16 (b) | | 410,000 | 414,256 |
| Series 2011 C, 4% 10/1/17 (b) | | 250,000 | 259,975 |
| Series 2012 A, 5% 10/1/18 (b) | | 200,000 | 218,110 |
| Series B 5% 10/1/16 (b) | | 515,000 | 520,346 |
| 5% 10/1/16 (b) | | 450,000 | 454,671 |
|
| TOTAL DISTRICT OF COLUMBIA | | | 2,186,357 |
|
| Florida - 3.6% | | | |
| Broward County Arpt. Sys. Rev. 5% 10/1/16 | | 365,000 | 368,752 |
| Broward County Port Facilities Rev. Series 2011 B, 5% 9/1/18 (b) | | 250,000 | 270,348 |
| Broward County School Board Ctfs. of Prtn.: | | | |
| Series 2004 A, 5.25% 7/1/16 (AMBAC Insured) | | 360,000 | 360,000 |
| Series 2006 A, 4.25% 7/1/16 (FSA Insured) | | 300,000 | 300,000 |
| Series 2008 A, 5% 7/1/16 (FSA Insured) | | 230,000 | 230,000 |
| Series 2012 A, 5% 7/1/16 | | 120,000 | 120,000 |
| Citizens Property Ins. Corp.: | | | |
| Series 2007 A, 5% 3/1/17 (Escrowed to Maturity) | | 530,000 | 545,381 |
| Series 2011 A1: | | | |
| 5% 6/1/18 | | 580,000 | 625,675 |
| 5% 6/1/19 | | 45,000 | 50,247 |
| Series 2015 A2, 1.26% 6/1/18 (a) | | 1,000,000 | 996,730 |
| Escambia County Poll. Cont. Rev. Bonds (Gulf Pwr. Co. Proj.) Series 2003, 1.15%, tender 6/21/18 (a) | | 3,500,000 | 3,510,150 |
| Florida Board of Ed. Lottery Rev. Series 2010 D, 5% 7/1/16 | | 410,000 | 410,000 |
| Florida Higher Edl. Facilities Fing. Auth. (Rollins College Proj.) Series 2012 A, 4% 12/1/16 | | 185,000 | 187,503 |
| Florida Mid-Bay Bridge Auth. Rev. Series 2015 C: | | | |
| 5% 10/1/17 | | 250,000 | 261,523 |
| 5% 10/1/18 | | 275,000 | 297,030 |
| Florida Muni. Pwr. Agcy. Rev.: | | | |
| (All-Requirements Pwr. Supply Proj.) Series 2015 B, 5% 10/1/17 | | 565,000 | 594,702 |
| (Stanton Proj.) Series 2008, 5% 10/1/16 | | 225,000 | 227,347 |
| Greater Orlando Aviation Auth. Arpt. Facilities Rev.: | | | |
| Series 2008 A, 5.25% 10/1/17 (FSA Insured) (b) | | 250,000 | 263,750 |
| Series 2010 A, 4% 10/1/16 | | 240,000 | 242,076 |
| Series 2010 B, 4.25% 10/1/18 (b) | | 150,000 | 161,028 |
| 6% 10/1/17 (b) | | 60,000 | 63,852 |
| Halifax Hosp. Med. Ctr. Rev. Series 2016: | | | |
| 4% 6/1/18 | | 500,000 | 529,855 |
| 5% 6/1/19 | | 250,000 | 277,398 |
| Jacksonville Elec. Auth. Elec. Sys. Rev. Series 2014 A, 3% 10/1/16 | | 300,000 | 301,788 |
| Lake County School Board Ctfs. of Prtn. Series 2014 A: | | | |
| 4% 6/1/18 (FSA Insured) | | 95,000 | 100,580 |
| 5% 6/1/17 (FSA Insured) | | 140,000 | 145,278 |
| Lee County Arpt. Rev. Series 2010 A, 5% 10/1/17 (FSA Insured) (b) | | 240,000 | 252,463 |
| Miami-Dade County Aviation Rev.: | | | |
| Series 2008 E, 5.375% 10/1/17 (Nat'l. Pub. Fin. Guarantee Corp. Insured) (b) | | 115,000 | 121,722 |
| Series 2010 B: | | | |
| 5% 10/1/17 | | 285,000 | 299,982 |
| 5% 10/1/18 | | 465,000 | 507,538 |
| Series 2012 B, 4% 10/1/17 | | 685,000 | 712,592 |
| Miami-Dade County Expressway Auth.: | | | |
| Series 2013 A: | | | |
| 4% 7/1/16 | | 575,000 | 575,000 |
| 5% 7/1/17 | | 100,000 | 104,218 |
| Series 2014 B: | | | |
| 5% 7/1/17 | | 370,000 | 385,607 |
| 5% 7/1/18 | | 590,000 | 638,852 |
| Miami-Dade County School Board Ctfs. of Prtn.: | | | |
| Series 2008 B: | | | |
| 5% 5/1/17 | | 500,000 | 517,365 |
| 5% 5/1/18 (Assured Guaranty Corp. Insured) | | 300,000 | 322,596 |
| Series 2015 A, 5% 5/1/20 | | 1,350,000 | 1,549,652 |
| Series A, 5% 5/1/17 (Nat'l. Pub. Fin. Guarantee Corp. Insured) | | 250,000 | 258,683 |
| Series B, 5% 5/1/17 (Nat'l. Pub. Fin. Guarantee Corp. Insured) | | 600,000 | 620,838 |
| Reedy Creek Impt. District Utils. Rev. Series 2013 1, 5% 10/1/17 | | 570,000 | 600,324 |
| Tampa Health Sys. Rev. (Baycare Health Sys. Proj.) Series 2010, 5% 11/15/17 | | 95,000 | 100,712 |
|
| TOTAL FLORIDA | | | 19,009,137 |
|
| Georgia - 0.7% | | | |
| Atlanta Arpt. Rev.: | | | |
| Series 2011 A, 5% 1/1/17 | | 425,000 | 434,061 |
| Series 2012 C, 5% 1/1/17 (b) | | 100,000 | 102,108 |
| Series 2014 C, 5% 1/1/18 (b) | | 150,000 | 159,150 |
| Burke County Indl. Dev. Auth. Poll. Cont. Rev. Bonds 1.375%, tender 4/4/17 (a) | | 1,905,000 | 1,911,267 |
| Georgia Muni. Elec. Auth. Pwr. Rev.: | | | |
| (Prerefunded Proj.) Series 2008 D, 5.75% 1/1/19 (Pre-Refunded to 7/1/18 @ 100) | | 210,000 | 231,057 |
| (Proj. One) Series 2008 A, 5.25% 1/1/18 | | 75,000 | 80,106 |
| (Unrefunded Balance Proj.) Series 2008, 5.75% 1/1/19 | | 45,000 | 49,305 |
| Series B: | | | |
| 5% 1/1/17 | | 100,000 | 102,172 |
| 6.25% 1/1/17 | | 445,000 | 457,362 |
| 4.25% 1/1/18 | | 100,000 | 105,331 |
| 5% 11/1/17 | | 180,000 | 190,417 |
| 6.25% 1/1/17 | | 115,000 | 118,195 |
|
| TOTAL GEORGIA | | | 3,940,531 |
|
| Hawaii - 0.2% | | | |
| Hawaii Arpts. Sys. Rev. Series 2010 B, 5% 7/1/18 (b) | | 155,000 | 167,578 |
| State of Hawaii Dept. of Trans. Series 2013, 3% 8/1/16 (b) | | 755,000 | 756,397 |
|
| TOTAL HAWAII | | | 923,975 |
|
| Illinois - 8.3% | | | |
| Chicago Gen. Oblig.: | | | |
| Series 2007 A, 5% 12/1/16 | | 100,000 | 101,012 |
| Series 2007 C, 5% 1/1/17 | | 100,000 | 101,390 |
| Series 2007, 5% 12/1/16 (AMBAC Insured) | | 125,000 | 126,265 |
| Series 2008 A, 5% 1/1/18 | | 75,000 | 76,878 |
| Series 2009 A, 4% 1/1/18 | | 100,000 | 101,065 |
| 5% 1/1/18 | | 205,000 | 210,133 |
| Chicago Metropolitan Wtr. Reclamation District of Greater Chicago: | | | |
| Series 2006, 5% 12/1/16 | | 500,000 | 508,465 |
| Series 2011 C, 5% 12/1/16 | | 1,070,000 | 1,088,115 |
| Chicago Midway Arpt. Rev. Series 2004 A, 4.5% 1/1/18 (AMBAC Finl. Group, Inc. Insured) (b) | | 50,000 | 50,000 |
| Chicago O'Hare Int'l. Arpt. Rev.: | | | |
| Series 2005 B, 5.25% 1/1/18 (Nat'l. Pub. Fin. Guarantee Corp. Insured) | | 340,000 | 362,620 |
| Series 2010 A, 5% 1/1/17 | | 295,000 | 301,189 |
| Series 2011 B: | | | |
| 4% 1/1/17 | | 100,000 | 101,613 |
| 5% 1/1/17 (b) | | 135,000 | 137,792 |
| 5% 1/1/17 | | 360,000 | 367,553 |
| 5% 1/1/18 (b) | | 60,000 | 63,587 |
| Series B, 5% 1/1/18 (FSA Insured) | | 180,000 | 183,982 |
| Chicago Park District Gen. Oblig.: | | | |
| Series 2008 G, 5% 1/1/17 | | 320,000 | 326,016 |
| Series 2008 H, 5% 1/1/17 | | 450,000 | 458,460 |
| Series 2011 D: | | | |
| 4% 1/1/18 | | 375,000 | 390,079 |
| 5% 1/1/17 | | 340,000 | 346,392 |
| Series 2013 B, 4% 1/1/17 | | 100,000 | 101,397 |
| Series 2014 D, 4% 1/1/18 | | 500,000 | 520,105 |
| 5% 1/1/17 | | 300,000 | 305,640 |
| 5% 1/1/17 | | 125,000 | 127,350 |
| Chicago Wastewtr. Transmission Rev.: | | | |
| Series 2006 A, 4% 1/1/17 | | 100,000 | 101,387 |
| Series 2006 B, 5% 1/1/18 (Nat'l. Pub. Fin. Guarantee Corp. Insured) | | 145,000 | 147,720 |
| Series 2008 C, 4% 1/1/17 | | 1,350,000 | 1,368,725 |
| Series 2010 A, 3% 1/1/18 | | 60,000 | 61,407 |
| 5.5% 1/1/17 | | 375,000 | 382,920 |
| Chicago Wtr. Rev.: | | | |
| Series 2006 A, 5% 11/1/16 (AMBAC Insured) | | 635,000 | 642,887 |
| Series 2012: | | | |
| 4% 11/1/16 | | 255,000 | 257,356 |
| 5% 11/1/16 | | 325,000 | 329,037 |
| 5% 11/1/16 (FSA Insured) | | 250,000 | 253,185 |
| 5% 11/1/17 (FSA Insured) | | 330,000 | 346,315 |
| Cook County Gen. Oblig.: | | | |
| Series 2009 A: | | | |
| 4% 11/15/16 | | 820,000 | 829,660 |
| 5% 11/15/17 | | 1,200,000 | 1,261,908 |
| Series 2011 A, 4% 11/15/16 | | 1,450,000 | 1,467,081 |
| Series 2014 A: | | | |
| 5% 11/15/16 | | 295,000 | 299,528 |
| 5% 11/15/17 | | 450,000 | 473,216 |
| 5% 11/15/18 | | 200,000 | 216,788 |
| Series B, 5% 11/15/17 (Nat'l. Pub. Fin. Guarantee Corp. Insured) | | 710,000 | 746,629 |
| Illinois Edl. Facilities Auth. Rev. Bonds (Univ. of Chicago Proj.) Series B1, 1.1%, tender 2/15/18 (a) | | 2,270,000 | 2,273,246 |
| Illinois Fin. Auth. Rev.: | | | |
| Bonds Series E, 5%, tender 5/1/17 (a) | | 1,025,000 | 1,061,716 |
| Series 2008 A, 4.375% 7/1/17 | | 250,000 | 258,660 |
| Series 2008 B, 5.5% 8/15/19 | | 250,000 | 273,190 |
| Series 2008 D, 5.5% 11/1/18 | | 265,000 | 285,013 |
| Series 2009 A, 5% 8/15/16 | | 110,000 | 110,579 |
| Series 2009 B: | | | |
| 4.25% 7/1/16 | | 370,000 | 370,000 |
| 5% 7/1/16 | | 225,000 | 225,000 |
| Series 2010 A, 5.5% 5/1/17 | | 100,000 | 103,352 |
| Series 2010: | | | |
| 5% 8/15/16 | | 800,000 | 803,440 |
| 5% 2/15/17 | | 100,000 | 102,549 |
| Series 2011 A1, 4% 4/1/17 | | 190,000 | 194,680 |
| Series 2012 A: | | | |
| 5% 8/15/16 | | 100,000 | 100,523 |
| 5% 5/15/17 | | 105,000 | 108,736 |
| 5% 5/15/18 | | 180,000 | 193,498 |
| Series 2015 A: | | | |
| 5% 11/15/16 | | 1,000,000 | 1,015,280 |
| 5% 11/15/17 | | 125,000 | 132,008 |
| 5% 11/15/18 | | 250,000 | 273,925 |
| Series 2015 C, 5% 8/15/16 | | 100,000 | 100,481 |
| Series 2016 A, 5% 7/1/19 | | 600,000 | 668,742 |
| 5% 8/15/17 | | 225,000 | 235,584 |
| Illinois Gen. Oblig.: | | | |
| Series 2004 A, 5% 3/1/17 | | 75,000 | 75,254 |
| Series 2004, 5% 11/1/17 (AMBAC Insured) | | 2,000,000 | 2,022,280 |
| Series 2006: | | | |
| 5% 1/1/17 | | 100,000 | 100,309 |
| 5% 1/1/18 | | 250,000 | 250,718 |
| Series 2007 A, 5% 6/1/18 (FSA Insured) | | 435,000 | 448,476 |
| Series 2007 B: | | | |
| 5% 1/1/17 | | 300,000 | 305,775 |
| 5.25% 1/1/18 | | 590,000 | 622,037 |
| Series 2007, 5% 6/1/17 (FSA Insured) | | 250,000 | 258,365 |
| Series 2008, 4.5% 4/1/18 | | 375,000 | 381,473 |
| Series 2010: | | | |
| 5% 1/1/17 | | 500,000 | 509,625 |
| 5% 1/1/17 (FSA Insured) | | 675,000 | 687,994 |
| 5% 1/1/18 | | 205,000 | 215,381 |
| Series 2012, 5% 3/1/17 | | 500,000 | 512,810 |
| Series 2013, 4% 7/1/16 | | 1,690,000 | 1,690,000 |
| Series 2014: | | | |
| 3% 2/1/17 | | 350,000 | 353,924 |
| 4% 2/1/17 | | 100,000 | 101,687 |
| 4% 2/1/18 | | 385,000 | 399,565 |
| 3% 1/1/18 | | 500,000 | 510,685 |
| 5% 8/1/16 | | 530,000 | 531,844 |
| 5% 8/1/17 | | 1,775,000 | 1,843,728 |
| Illinois Muni. Elec. Agcy. Pwr. Supply Series 2007 A, 5.25% 2/1/17 (FGIC Insured) | | 3,250,000 | 3,333,103 |
| Illinois Sales Tax Rev. Series 2013, 5% 6/15/17 | | 75,000 | 78,007 |
| Illinois Toll Hwy. Auth. Toll Hwy. Rev. Series 2013 B1, 5% 12/1/16 | | 250,000 | 254,398 |
| Illinois Unemployment Ins. Fund Bldg. Receipts: | | | |
| Series 2012 A, 5% 12/15/16 | | 610,000 | 621,736 |
| Series 2012 B, 5% 6/15/18 | | 810,000 | 826,168 |
| Metropolitan Pier & Exposition: | | | |
| (McCormick Place Expansion Proj.) Series 1996 A: | | | |
| 0% 12/15/16 (Nat'l. Pub. Fin. Guarantee Corp. Insured) | | 65,000 | 64,587 |
| 0% 12/15/17 (Nat'l. Pub. Fin. Guarantee Corp. Insured) | | 75,000 | 73,139 |
| 0% 6/15/17 (Escrowed to Maturity) | | 10,000 | 9,933 |
| 0% 6/15/17 (Nat'l. Pub. Fin. Guarantee Corp. Insured) | | 45,000 | 44,388 |
| 0% 6/15/18 (Nat'l. Pub. Fin. Guarantee Corp. Insured) | | 105,000 | 102,037 |
| Quincy Hosp. Rev. Series 2007, 5% 11/15/16 | | 115,000 | 116,737 |
| Railsplitter Tobacco Settlement Auth. Rev. Series 2010, 5% 6/1/17 | | 795,000 | 826,220 |
| Univ. of Illinois Board of Trustees Ctfs. of Prtn.: | | | |
| Series 2008 A, 5% 10/1/16 (Escrowed to Maturity) | | 5,000 | 5,053 |
| Series 2014 A, 5% 10/1/18 | | 500,000 | 541,555 |
| 5% 10/1/16 (FSA Insured) | | 130,000 | 131,343 |
| Univ. of Illinois Rev. Series 2000, 0% 4/1/17 | | 100,000 | 98,935 |
|
| TOTAL ILLINOIS | | | 43,482,318 |
|
| Indiana - 1.9% | | | |
| Indiana Fin. Auth. Health Sys. Rev. Series 2008 C, 5.5% 11/1/17 | | 125,000 | 132,694 |
| Indiana Fin. Auth. Hosp. Rev.: | | | |
| Series 2011 N, 5% 3/1/17 | | 325,000 | 334,432 |
| Series 2013 A, 5% 8/15/16 | | 100,000 | 100,515 |
| Series 2014 A, 3% 12/1/16 | | 275,000 | 277,761 |
| Indiana Fin. Auth. Rev. (l-69 Section 5 Proj.) Series 2014, 4% 3/1/17 (b) | | 800,000 | 807,696 |
| Indiana Fin. Auth. Wastewtr. Util. Rev. (CWA Auth. Proj.): | | | |
| Series 2011 B, 5% 10/1/16 | | 375,000 | 378,810 |
| Series 2012 A: | | | |
| 4% 10/1/16 | | 1,005,000 | 1,012,849 |
| 5% 10/1/18 | | 605,000 | 659,498 |
| Series 2014 A, 4% 10/1/16 | | 550,000 | 554,296 |
| Indiana Health & Edl. Facilities Fing. Auth. Rev. Bonds: | | | |
| (Ascension Health Sr. Cr. Group Proj.) Series 2006 B1, 4.1%, tender 11/3/16 (a) | | 350,000 | 354,025 |
| Series 2006 B8, 4.1%, tender 11/3/16 (a) | | 830,000 | 839,545 |
| Indiana Health Facility Fing. Auth. Rev. Bonds (Ascension Health Cr. Group Proj.) Series 2001 A2, 1.6%, tender 2/1/17 (a) | | 195,000 | 196,129 |
| Indianapolis Gas Util. Sys. Rev. 3.5% 6/1/17 (Nat'l. Pub. Fin. Guarantee Corp. Insured) | | 175,000 | 179,370 |
| Indianapolis Local Pub. Impt. Series 2016, 5% 1/1/20 (b) | | 2,685,000 | 3,037,245 |
| Indianapolis Local Pub. Impt. Bond Bank (Indianapolis Arpt. Auth. Proj.) Series 2006 F, 5% 1/1/17 (AMBAC Insured) (b) | | 150,000 | 150,000 |
| Indianapolis Thermal Energy Sys. Series 2010 B, 5% 10/1/17 | | 655,000 | 688,929 |
|
| TOTAL INDIANA | | | 9,703,794 |
|
| Kansas - 0.1% | | | |
| Wyandotte County/Kansas City Unified Govt. Util. Sys. Rev.: | | | |
| Series 2012 A, 4% 9/1/17 | | 175,000 | 181,433 |
| Series 2014 A, 4% 9/1/16 | | 250,000 | 251,375 |
|
| TOTAL KANSAS | | | 432,808 |
|
| Kentucky - 1.1% | | | |
| Kenton County Arpt. Board Arpt. Rev. Series 2016, 5% 1/1/20 | | 215,000 | 243,915 |
| Kentucky Econ. Dev. Fin. Auth. Hosp. Rev. (Baptist Healthcare Sys. Proj.) Series A, 5% 8/15/17 | | 550,000 | 575,245 |
| Kentucky State Property & Buildings Commission Rev. Series 2016 B, 5% 11/1/19 | | 2,000,000 | 2,255,620 |
| Louisville/Jefferson County Metropolitan Govt. Poll. Cont. Rev. Bonds (Louisville Gas and Elec. Co. Proj.): | | | |
| Series 2001 B, 1.35%, tender 5/1/18 (a)(b) | | 500,000 | 502,605 |
| Series 2003 A, 1.65%, tender 4/3/17 (a) | | 1,905,000 | 1,915,249 |
| Series 2007 B, 1.15%, tender 6/1/17 (a) | | 100,000 | 100,188 |
|
| TOTAL KENTUCKY | | | 5,592,822 |
|
| Louisiana - 1.7% | | | |
| Louisiana Citizens Property Ins. Corp. Assessment Rev. Series 2015: | | | |
| 5% 6/1/17 | | 1,350,000 | 1,400,517 |
| 5% 6/1/18 | | 1,500,000 | 1,613,970 |
| Louisiana Loc Govt. Envirl Facilities Bonds Series 2013, 1.02%, tender 8/1/18 (a) | | 5,475,000 | 5,416,418 |
| Louisiana Pub. Facilities Auth. Hosp. Rev. (Franciscan Missionaries of Our Lady Health Sys. Proj.) Series 1998 B, 5% 7/1/16 | | 140,000 | 140,000 |
| Louisiana Pub. Facilities Auth. Rev.: | | | |
| Series 2009 A, 5% 7/1/17 | | 475,000 | 494,698 |
| Series 2015, 5% 7/1/18 | | 100,000�� | 107,785 |
|
| TOTAL LOUISIANA | | | 9,173,388 |
|
| Maryland - 0.2% | | | |
| Maryland Health & Higher Edl. Facilities Auth. Rev. Series 2013 A, 3% 8/15/16 | | 685,000 | 686,966 |
| Montgomery County Gen. Oblig. Series 2008 A, 5% 8/1/16 | | 250,000 | 250,953 |
|
| TOTAL MARYLAND | | | 937,919 |
|
| Massachusetts - 4.2% | | | |
| Berkshire Wind Pwr. Coop. Corp. (Wind Proj.) Series 1, 5% 7/1/16 | | 420,000 | 420,000 |
| Massachusetts Dept. of Trans. Metropolitan Hwy. Sys. Rev. Series 2010 B, 5% 1/1/18 | | 615,000 | 654,120 |
| Massachusetts Dev. Fin. Agcy. Rev.: | | | |
| Bonds 0.96%, tender 1/30/18 (a) | | 7,530,000 | 7,512,079 |
| Series 2012 L, 5% 7/1/17 | | 165,000 | 172,178 |
| Series 2013 F, 4% 7/1/18 | | 405,000 | 429,081 |
| Series N, 5% 10/1/16 | | 215,000 | 217,258 |
| Massachusetts Dev. Fin. Agcy. Solid Waste Disp. Rev. Bonds (Waste Mgmt., Inc. Proj.) Series 2002, 1.6%, tender 5/1/17 (a)(b) | | 150,000 | 150,891 |
| Massachusetts Gen. Oblig.: | | | |
| Bonds Series 2014 D1, 0.63%, tender 7/1/20 (a) | | 5,000,000 | 4,999,950 |
| Series 1998 C, 0% 8/1/18 (Nat'l. Pub. Fin. Guarantee Corp. Insured) | | 180,000 | 176,796 |
| Series 2007 A, 0.887% 11/1/18 (a) | | 725,000 | 726,523 |
| Series 2012 D, 0.84% 1/1/18 (a) | | 1,500,000 | 1,500,630 |
| Massachusetts Health & Edl. Facilities Auth. Rev.: | | | |
| (Partners HealthCare Sys., Inc. Proj.) Series 2007 G, 5% 7/1/18 | | 100,000 | 104,421 |
| Bonds Series 2007 G6, 1.293%, tender 7/7/16 (a) | | 300,000 | 299,994 |
| Series 2004 D, 5% 11/15/16 | | 275,000 | 279,505 |
| Series 2008 E2, 5% 7/1/17 | | 120,000 | 125,014 |
| Series 2009 D, 5% 7/1/16 | | 620,000 | 620,000 |
| Series 2010 A, 5% 10/1/16 | | 870,000 | 879,031 |
| Series 2010 H, 5% 7/1/16 | | 125,000 | 125,000 |
| Series D, 4.5% 7/1/17 (Escrowed to Maturity) | | 430,000 | 446,594 |
| Massachusetts Muni. Wholesale Elec. Co. Pwr. Supply Sys. Rev.: | | | |
| (Nuclear Proj. 4) Series 2011, 5% 7/1/16 | | 650,000 | 650,000 |
| (Pwr. Supply Proj. 6) 4% 7/1/16 | | 400,000 | 400,000 |
| Series 2011, 5% 7/1/16 | | 710,000 | 710,000 |
| 4% 7/1/16 | | 200,000 | 200,000 |
|
| TOTAL MASSACHUSETTS | | | 21,799,065 |
|
| Michigan - 4.8% | | | |
| Battle Creek School District Series 2016, 5% 5/1/18 | | 1,000,000 | 1,074,380 |
| Chippewa Valley Schools Series 2016, 5% 5/1/19 (c) | | 1,730,000 | 1,913,674 |
| Forest Hills Pub. Schools 4% 5/1/17 | | 580,000 | 596,188 |
| Grand Rapids Pub. Schools Series 2016, 5% 5/1/19 (FSA Insured) | | 2,000,000 | 2,217,700 |
| Ingham, Eaton and Clinton Counties Lansing School District Series 2016 I, 5% 5/1/19 | | 765,000 | 850,757 |
| Lake Orion Cmnty. School District 5% 5/1/19 | | 900,000 | 999,288 |
| Lapeer Cmnty. Schools Series 2016: | | | |
| 4% 5/1/19 | | 535,000 | 578,260 |
| 4% 5/1/20 | | 1,215,000 | 1,340,655 |
| Lenawee Co. Hosp. Fin. Auth. Hosp. Rev. Series 2011 E, 3% 11/15/17 | | 240,000 | 246,919 |
| Lincoln Consolidated School District Series 2016 A, 5% 5/1/19 | | 1,000,000 | 1,106,200 |
| Michigan Fin. Auth. Rev.: | | | |
| Bonds Series 2015 D1, 0.913%, tender 10/15/18 (a) | | 1,955,000 | 1,944,990 |
| Series 2010 A: | | | |
| 5% 12/1/16 | | 440,000 | 447,740 |
| 5% 12/1/18 | | 325,000 | 357,253 |
| Series 2012, 4% 11/15/17 | | 280,000 | 292,390 |
| Series 2014, 4% 6/1/18 | | 300,000 | 318,207 |
| Michigan Hosp. Fin. Auth. Rev.: | | | |
| (Henry Ford Health Sys. Proj.) Series 2006 A, 5% 11/15/17 | | 500,000 | 507,950 |
| Bonds: | | | |
| (Ascension Health Cr. Group Proj.) 1.5%, tender 3/15/17 (a) | | 400,000 | 402,508 |
| Series 2010 F1, 2%, tender 5/30/18 (a) | | 690,000 | 705,056 |
| Series 2008 A, 5.25% 5/15/17 (Escrowed to Maturity) | | 250,000 | 259,583 |
| Series 2012 A, 5% 6/1/17 | | 100,000 | 103,807 |
| Oakland Univ. Rev.: | | | |
| Series 2012: | | | |
| 4% 3/1/17 | | 405,000 | 413,768 |
| 4% 3/1/18 | | 130,000 | 136,904 |
| Series 2013 A, 4% 3/1/18 | | 400,000 | 421,244 |
| Portage Pub. Schools Series 2016: | | | |
| 5% 5/1/19 | | 525,000 | 583,695 |
| 5% 11/1/19 | | 740,000 | 835,874 |
| 5% 5/1/20 | | 675,000 | 772,646 |
| Rochester Cmnty. School District 5% 5/1/19 (Nat'l. Pub. Fin. Guarantee Corp. Insured) | | 270,000 | 294,921 |
| Roseville Cmnty. Schools Series 2014, 5% 5/1/18 | | 410,000 | 440,496 |
| Royal Oak Hosp. Fin. Auth. Hosp. Rev. Series 2014 D: | | | |
| 5% 9/1/17 | | 375,000 | 393,435 |
| 5% 9/1/18 | | 465,000 | 504,823 |
| South Lyon Cmnty. Schools Series 2016, 4% 5/1/18 | | 1,000,000 | 1,060,670 |
| Warren Consolidated School District Series 2016: | | | |
| 4% 5/1/18 | | 550,000 | 579,156 |
| 4% 5/1/19 | | 1,000,000 | 1,076,510 |
| Wayne-Westland Cmnty. Schools Series 2014, 5% 5/1/18 | | 330,000 | 353,486 |
| Western Michigan Univ. Rev.: | | | |
| Series 2013, 4% 11/15/16 | | 100,000 | 101,215 |
| Series 2014, 5% 11/15/17 | | 200,000 | 211,548 |
| Zeeland Pub. Schools: | | | |
| 4% 5/1/18 | | 360,000 | 380,966 |
| 4% 5/1/18 (FSA Insured) | | 290,000 | 306,890 |
|
| TOTAL MICHIGAN | | | 25,131,752 |
|
| Minnesota - 0.6% | | | |
| Minneapolis & Saint Paul Hsg. & Redev. Auth. Health Care Sys. Rev. Series 2010, 4% 8/15/16 (FSA Insured) | | 465,000 | 466,739 |
| Minneapolis & Saint Paul Metropolitan Arpts. Commission Arpt. Rev. Series 2014 B, 5% 1/1/18 (b) | | 600,000 | 637,800 |
| Northern Muni. Pwr. Agcy. Elec. Sys. Rev.: | | | |
| Series 2008 A, 5% 1/1/19 (Assured Guaranty Corp. Insured) | | 150,000 | 159,012 |
| Series A, 5% 1/1/18 (Assured Guaranty Corp. Insured) | | 330,000 | 350,335 |
| Shakopee Health Care Facilities Rev. Series 2014: | | | |
| 4% 9/1/16 | | 295,000 | 296,676 |
| 5% 9/1/17 | | 500,000 | 524,520 |
| Southern Minnesota Muni. Pwr. Agcy. Pwr. Supply Sys. Rev.: | | | |
| Series 2002 A, 5.25% 1/1/17 | | 180,000 | 184,075 |
| 0% 1/1/18 (AMBAC Insured) | | 400,000 | 395,108 |
| Western Minnesota Muni. Pwr. Agcy. Pwr. Supply Rev. Series 2006 A, 5% 1/1/17 (FSA Insured) | | 135,000 | 137,946 |
|
| TOTAL MINNESOTA | | | 3,152,211 |
|
| Mississippi - 0.6% | | | |
| Mississippi Gen. Oblig. (Cap. Impts. Proj.) Series 2012 D, 0.94% 9/1/17 (a) | | 3,010,000 | 3,009,970 |
| Mississippi Hosp. Equip. & Facilities Auth. Bonds (Baptist Memorial Health Care Proj.) Series 2004 B2, 0.75%, tender 7/7/16 (a)(d) | | 400,000 | 400,024 |
|
| TOTAL MISSISSIPPI | | | 3,409,994 |
|
| Missouri - 0.2% | | | |
| Saint Louis Arpt. Rev. Series 2007 B, 5% 7/1/16 (FSA Insured) (b) | | 1,000,000 | 1,000,000 |
| Nebraska - 0.1% | | | |
| Nebraska Pub. Pwr. District Rev.: | | | |
| Series 2010 C, 5% 1/1/17 | | 145,000 | 148,186 |
| Series 2014, 4% 1/1/17 | | 125,000 | 127,140 |
| Omaha Pub. Pwr. District Elec. Rev. Series 2007 A, 4% 2/1/18 (Pre-Refunded to 2/1/17 @ 100) | | 90,000 | 91,773 |
|
| TOTAL NEBRASKA | | | 367,099 |
|
| Nevada - 1.1% | | | |
| Clark County Arpt. Rev.: | | | |
| Series 2014 B, 5% 7/1/18 | | 595,000 | 643,772 |
| 5% 7/1/17 (AMBAC Insured) (b) | | 140,000 | 145,820 |
| Clark County Fuel Tax: | | | |
| Series 2007, 5.5% 7/1/16 | | 200,000 | 200,000 |
| Series 2009 A, 3% 12/1/16 | | 75,000 | 75,753 |
| Clark County School District: | | | |
| Series 2007 A: | | | |
| 4.5% 6/15/17 (FGIC Insured) | | 605,000 | 626,828 |
| 4.5% 6/15/19 | | 360,000 | 382,370 |
| Series 2007 B, 5% 6/15/19 | | 350,000 | 371,028 |
| Series 2007 C, 5% 6/15/18 | | 350,000 | 372,334 |
| Series 2008 A: | | | |
| 5% 6/15/17 | | 170,000 | 176,931 |
| 5% 6/15/19 | | 110,000 | 118,594 |
| Series 2012 A, 5% 6/15/18 | | 250,000 | 270,645 |
| Series 2013 B, 5% 6/15/17 | | 380,000 | 395,493 |
| Series 2014 A, 5.5% 6/15/17 | | 360,000 | 376,362 |
| Series 2014 B, 5.5% 6/15/17 | | 175,000 | 182,954 |
| Las Vegas Valley Wtr. District Wtr. Impt. Gen. Oblig.: | | | |
| Series 2010 B, 4% 3/1/17 | | 55,000 | 56,238 |
| Series 2012 B, 5% 6/1/18 | | 70,000 | 75,762 |
| Nevada Gen. Oblig. 5% 12/1/16 | | 220,000 | 223,969 |
| Nevada Lease Rev. Ctfs. Prtn. (Bldg. 1 Proj.) Series 2013, 5% 4/1/17 | | 350,000 | 361,053 |
| Washoe County Gas Facilities Rev. Bonds (Seirra Pacific Pwr. Co. Projs.) Series 2016 A, 1.5%, tender 6/3/19 (a)(b) | | 900,000 | 902,295 |
|
| TOTAL NEVADA | | | 5,958,201 |
|
| New Hampshire - 0.2% | | | |
| New Hampshire Health & Ed. Facilities Auth. Rev. Series 2012, 4% 7/1/16 | | 1,215,000 | 1,215,000 |
| New Jersey - 5.5% | | | |
| Middlesex County Gen. Oblig. Series 2007, 4% 6/1/17 | | 195,000 | 200,977 |
| New Brunswick Hsg. Auth. Rev. (Rutgers Univ. Easton Avenue Proj.) Series 2011: | | | |
| 5% 7/1/16 | | 200,000 | 200,000 |
| 5% 7/1/17 | | 100,000 | 104,299 |
| New Jersey Bldg. Auth. State Bldg. Rev. Series 2007 B, 5% 6/15/17 | | 100,000 | 103,701 |
| New Jersey Econ. Dev. Auth. Rev.: | | | |
| (N.J. Transit Corp. Ligit Rail Transit Sys. Proj.) Series 2008 A, 5% 5/1/17 | | 150,000 | 154,857 |
| Series 2008: | | | |
| 5% 3/1/17 | | 280,000 | 287,246 |
| 5% 5/1/18 | | 250,000 | 265,315 |
| Series 2011 EE: | | | |
| 5% 9/1/18 | | 45,000 | 47,918 |
| 5% 9/1/18 (Escrowed to Maturity) | | 140,000 | 152,776 |
| Series 2012, 5% 6/15/17 | | 500,000 | 517,590 |
| Series 2015 XX, 5% 6/15/19 | | 1,000,000 | 1,083,190 |
| 5% 12/15/17 | | 95,000 | 99,975 |
| 5% 12/15/17 (Escrowed to Maturity) | | 150,000 | 159,258 |
| New Jersey Edl. Facilities Auth. Rev.: | | | |
| (Rowan Univ. Proj.) Series 2007 B, 5.5% 7/1/16 (Nat'l. Pub. Fin. Guarantee Corp. Insured) | | 600,000 | 600,000 |
| Series 2008 D, 5% 7/1/17 (FSA Insured) | | 1,860,000 | 1,936,576 |
| Series 2010 H, 5% 7/1/18 | | 125,000 | 134,603 |
| Series 2011 C, 3% 7/1/18 | | 100,000 | 103,963 |
| Series 2012 A, 5% 7/1/16 | | 430,000 | 430,000 |
| Series 2012 B: | | | |
| 3% 7/1/16 | | 250,000 | 250,000 |
| 5% 7/1/18 | | 255,000 | 274,589 |
| Series 2013 A, 5% 7/1/17 | | 80,000 | 83,294 |
| New Jersey Edl. Facility: | | | |
| Series 2015 B, 5% 7/1/19 | | 190,000 | 211,234 |
| 5% 7/1/19 | | 205,000 | 205,603 |
| New Jersey Gen. Oblig.: | | | |
| Series 2001 H: | | | |
| 5.25% 7/1/16 (Nat'l. Pub. Fin. Guarantee Corp. Insured) | | 515,000 | 515,000 |
| 5.25% 7/1/17 | | 280,000 | 291,987 |
| Series 2005 L, 5.25% 7/15/16 (AMBAC Insured) | | 650,000 | 651,099 |
| Series 2005 M, 5.5% 7/15/16 (AMBAC Insured) | | 355,000 | 355,632 |
| Series 2009 O, 5% 8/1/16 | | 145,000 | 145,512 |
| Series 2010 Q, 4% 8/15/16 | | 650,000 | 652,581 |
| Series H, 5.25% 7/1/16 | | 455,000 | 455,000 |
| New Jersey Health Care Facilities Fing. Auth. Rev.: | | | |
| (Virtua Health Proj.) Series A, 5.25% 7/1/17 (Assured Guaranty Corp. Insured) | | 75,000 | 78,409 |
| Series 2007, 5% 7/1/18 (Pre-Refunded to 7/1/17 @ 100) | | 210,000 | 219,028 |
| Series 2008 A, 5% 7/1/18 | | 4,095,000 | 4,424,770 |
| Series 2009 A, 5.25% 7/1/16 | | 360,000 | 360,000 |
| Series 2011: | | | |
| 4% 7/1/16 | | 800,000 | 800,000 |
| 5% 7/1/16 | | 1,150,000 | 1,150,000 |
| 5% 7/1/17 | | 150,000 | 156,297 |
| Series 2013 A: | | | |
| 3% 7/1/16 | | 190,000 | 190,000 |
| 5% 7/1/18 | | 100,000 | 108,053 |
| 4% 7/1/17 | | 330,000 | 339,887 |
| 4% 7/1/19 | | 245,000 | 266,646 |
| New Jersey Tpk. Auth. Tpk. Rev. Bonds 1.09%, tender 1/1/18 (a) | | 5,220,000 | 5,223,758 |
| New Jersey Trans. Trust Fund Auth.: | | | |
| Series 2003 B1, 5% 12/15/17 | | 150,000 | 157,856 |
| Series 2010 D, 5% 12/15/17 | | 790,000 | 831,372 |
| Series 2011 B, 5% 6/15/18 | | 130,000 | 138,467 |
| Series 2012 AA, 4% 6/15/18 | | 980,000 | 1,025,168 |
| 5% 6/15/17 | | 250,000 | 259,253 |
| 5% 6/15/17 | | 1,280,000 | 1,327,373 |
| New Jersey Transit Corp. Ctfs. of Prtn. Series 2014 A, 5% 9/15/17 | | 1,000,000 | 1,045,180 |
| Rutgers State Univ. Rev. Series 2009 F, 4% 5/1/17 | | 225,000 | 231,224 |
|
| TOTAL NEW JERSEY | | | 29,006,516 |
|
| New York - 1.0% | | | |
| New York City Gen. Oblig.: | | | |
| Series 2009 B, 4% 8/1/16 | | 275,000 | 275,820 |
| Series 2012 I: | | | |
| 4% 8/1/16 | | 200,000 | 200,596 |
| 5% 8/1/16 | | 250,000 | 250,955 |
| Series 2015 F, 1.06% 2/15/19 (a) | | 1,000,000 | 1,002,320 |
| New York Dorm. Auth. Revs. Series 2011 A, 4% 7/1/16 | | 240,000 | 240,000 |
| New York Metropolitan Trans. Auth. Rev. Series 2002 G1, 1.136% 11/1/17 (a) | | 165,000 | 165,210 |
| New York Thruway Auth. Gen. Rev.: | | | |
| Series 2007 H, 4% 1/1/18 (Nat'l. Pub. Fin. Guarantee Corp. Insured) | | 65,000 | 68,235 |
| Series II, 5% 1/1/17 (Nat'l. Pub. Fin. Guarantee Corp. Insured) | | 665,000 | 679,278 |
| New York Trans. Dev. Corp. (Term. One Group Assoc. L.P. Proj.) Series 2015, 5% 1/1/18 (b) | | 2,000,000 | 2,123,840 |
| Rochester Gen. Oblig. Series 2012 I, 4% 8/15/16 | | 200,000 | 200,846 |
|
| TOTAL NEW YORK | | | 5,207,100 |
|
| North Carolina - 0.9% | | | |
| Charlotte-Mecklenburg Hosp. Auth. Health Care Sys. Rev.: | | | |
| Series 2007 A: | | | |
| 5% 1/15/18 | | 420,000 | 430,391 |
| 5% 1/15/19 | | 125,000 | 128,106 |
| Series 2009 A, 4% 1/15/17 | | 150,000 | 152,750 |
| Series 2011 A, 3% 1/15/17 | | 100,000 | 101,309 |
| Series 2012 A, 5% 1/15/17 | | 100,000 | 102,356 |
| 5% 1/15/17 | | 350,000 | 358,246 |
| North Carolina Eastern Muni. Pwr. Agcy. Pwr. Sys. Rev.: | | | |
| Series 1991 A, 6.5% 1/1/18 (Escrowed to Maturity) | | 50,000 | 54,202 |
| Series 2008 A, 5.25% 1/1/19 (Pre-Refunded to 1/1/18 @ 100) | | 605,000 | 646,467 |
| Series 2009 A, 5% 1/1/18 (Escrowed to Maturity) | | 125,000 | 133,010 |
| North Carolina Med. Care Cmnty. Health Series 2010, 3% 11/15/16 | | 115,000 | 115,994 |
| North Carolina Muni. Pwr. Agcy. #1 Catawba Elec. Rev.: | | | |
| Series 2010 A, 5% 1/1/20 | | 200,000 | 227,710 |
| Series 2012 A, 5% 1/1/17 | | 660,000 | 674,236 |
| 4% 1/1/18 | | 380,000 | 398,624 |
| Raleigh Durham Arpt. Auth. Arpt. Rev.: | | | |
| Series 2007, 5% 5/1/18 (Nat'l. Pub. Fin. Guarantee Corp. Insured) (b) | | 190,000 | 196,758 |
| Series 2010 A, 5% 5/1/17 | | 200,000 | 207,248 |
| Univ. of North Carolina at Chapel Hill Rev. Bonds Series 2012 B, 1.056%, tender 12/1/17 (a) | | 550,000 | 551,991 |
|
| TOTAL NORTH CAROLINA | | | 4,479,398 |
|
| Ohio - 1.4% | | | |
| Cleveland Ctfs. of Prtn. (Cleveland Stadium Proj.) Series 2010 A, 5% 11/15/17 | | 200,000 | 211,072 |
| Cleveland State Univ. Gen. Receipts Series 2012, 4% 6/1/17 | | 150,000 | 154,488 |
| Franklin County Hosp. Facilities Rev. (Nationwide Children's Hosp. Proj.) Series 2012 A, 5% 11/1/16 | | 100,000 | 101,444 |
| Franklin County Hosp. Rev. Bonds: | | | |
| (U.S. Health Corp. of Columbus Proj.) Series 2011 B, 5%, tender 7/12/17 (a) | | 1,075,000 | 1,121,967 |
| Series 2011 D, 4%, tender 8/1/16 (a) | | 325,000 | 325,757 |
| Hamilton County Health Care Facilities Rev.: | | | |
| (Christ Hosp. Proj.) Series 2012, 5% 6/1/18 | | 425,000 | 458,218 |
| 5% 6/1/17 | | 65,000 | 67,330 |
| Kent State Univ. Revs. Series 2009 B: | | | |
| 5% 5/1/17 (Assured Guaranty Corp. Insured) | | 60,000 | 62,174 |
| 5% 5/1/18 (Assured Guaranty Corp. Insured) | | 310,000 | 334,406 |
| Lucas County Hosp. Rev. Series 2011 D, 3% 11/15/16 | | 220,000 | 221,797 |
| Middleburg Heights Hosp. Rev. Series 2012 A, 3% 8/1/16 | | 150,000 | 150,288 |
| Ohio Dept. of Administrative Svcs. Ctfs. of Prtn. (Administrative Knowledge Sys. Proj.) Series 2014 A, 5% 9/1/16 | | 250,000 | 251,853 |
| Ohio Higher Edl. Facility Commission Rev.: | | | |
| (Univ. of Dayton 2009 Proj.) 5% 12/1/17 | | 155,000 | 164,196 |
| Series 2010 A, 5% 1/15/18 | | 360,000 | 383,098 |
| 5% 12/1/16 | | 210,000 | 213,667 |
| Ohio Hosp. Rev.: | | | |
| Series 2012 A, 5% 1/15/17 | | 430,000 | 439,787 |
| Series 2013 A, 5% 1/15/17 | | 615,000 | 628,997 |
| Scioto County Hosp. Facilities Rev. Series 2016, 5% 2/15/20 | | 1,130,000 | 1,285,047 |
| Univ. of Akron Gen. Receipts Series 2010 A, 5% 1/1/19 (FSA Insured) | | 480,000 | 528,523 |
|
| TOTAL OHIO | | | 7,104,109 |
|
| Oklahoma - 0.1% | | | |
| Oklahoma Dev. Fin. Auth. Health Sys. Rev. Series 2008 C, 5% 8/15/16 (Escrowed to Maturity) | | 290,000 | 291,424 |
| Tulsa County Indl. Auth. Health Care Rev. Series 2006, 5% 12/15/16 | | 270,000 | 275,389 |
|
| TOTAL OKLAHOMA | | | 566,813 |
|
| Oregon - 0.2% | | | |
| Oregon Facilities Auth. Rev. (Legacy Health Proj.): | | | |
| Series 2011 A, 5.25% 5/1/19 | | 100,000 | 112,171 |
| Series 2012 A, 5% 5/1/17 | | 415,000 | 429,587 |
| Port of Portland Arpt. Rev. 5% 7/1/18 (b) | | 80,000 | 86,574 |
| Portland Swr. Sys. Rev. Series 2013 A, 5% 8/1/16 | | 225,000 | 225,866 |
|
| TOTAL OREGON | | | 854,198 |
|
| Pennsylvania - 3.8% | | | |
| Allegheny County Arpt. Auth. Rev.: | | | |
| Series 2007 B: | | | |
| 5% 1/1/17 (FSA Insured) | | 560,000 | 571,637 |
| 5% 1/1/18 (FSA Insured) | | 1,150,000 | 1,220,863 |
| Series 2010 A, 5% 1/1/17 (FSA Insured) (b) | | 465,000 | 474,546 |
| Series B, 5% 1/1/19 (FSA Insured) | | 215,000 | 227,917 |
| 5% 1/1/17 (Nat'l. Pub. Fin. Guarantee Corp. Insured) (b) | | 1,245,000 | 1,270,261 |
| 5% 1/1/18 (Nat'l. Pub. Fin. Guarantee Corp. Insured) (b) | | 235,000 | 248,759 |
| Allegheny County Hosp. Dev. Auth. Rev.: | | | |
| Series 2008 A, 5% 9/1/17 | | 255,000 | 267,717 |
| Series 2010 A, 5% 5/15/18 | | 220,000 | 237,433 |
| Bucks Co. Indl. Dev. Auth. Solid Waste Rev. Bonds 1.375%, tender 2/1/17 (a) | | 350,000 | 351,061 |
| Lehigh County Indl. Dev. Auth. Poll. Cont. Rev. Bonds 0.9%, tender 9/1/17 (a) | | 1,105,000 | 1,105,751 |
| Monroeville Fin. Auth. UPMC Rev.: | | | |
| Series 2012: | | | |
| 4% 2/15/17 | | 355,000 | 362,359 |
| 4% 2/15/18 | | 160,000 | 168,482 |
| Series 2014 B, 3% 2/1/19 | | 195,000 | 205,581 |
| Montgomery County Indl. Dev. 4% 10/1/17 | | 500,000 | 520,585 |
| Montgomery County Higher Ed. & Health Auth. Hosp. Rev.: | | | |
| (Abington Memorial Hosp. Proj.) Series 2009 A, 5% 6/1/17 | | 75,000 | 77,841 |
| Series 2009 A, 5% 6/1/18 | | 130,000 | 140,135 |
| Pennsylvania Econ. Dev. Fing. Auth. Indl. Dev. Rev. Series 2014 A: | | | |
| 4% 2/1/17 | | 350,000 | 356,794 |
| 4% 2/1/18 | | 395,000 | 415,437 |
| 4% 2/1/19 | | 100,000 | 107,962 |
| Pennsylvania Gen. Oblig.: | | | |
| Series 2006, 4% 9/1/17 | | 300,000 | 301,656 |
| Series 2007 A, 5% 11/1/17 | | 250,000 | 264,160 |
| Series 2008: | | | |
| 5% 5/15/17 | | 1,020,000 | 1,058,179 |
| 5% 2/15/18 | | 165,000 | 176,106 |
| Series 2009 1, 5% 3/15/18 | | 120,000 | 128,472 |
| Series 2011, 5% 7/1/18 | | 225,000 | 243,119 |
| Series 2012, 5% 6/1/18 | | 300,000 | 323,685 |
| Series 2013, 5% 4/1/17 | | 250,000 | 258,045 |
| Series 2014, 5% 7/1/18 | | 235,000 | 253,925 |
| Series 2015, 5% 3/15/18 | | 875,000 | 936,775 |
| 4% 9/1/16 | | 475,000 | 477,722 |
| 4% 9/1/19 | | 250,000 | 251,243 |
| 5% 3/1/17 | | 440,000 | 452,593 |
| Pennsylvania Higher Edl. Facilities Auth. Rev.: | | | |
| Series 2010 1, 5% 4/1/18 | | 255,000 | 273,289 |
| Series 2010 E: | | | |
| 5% 5/15/18 | | 400,000 | 431,696 |
| 5% 5/15/19 | | 610,000 | 680,778 |
| Series 2012, 4% 4/1/18 | | 200,000 | 210,904 |
| Philadelphia Arpt. Rev.: | | | |
| Series 2007 B, 5% 6/15/17 (FSA Insured) (b) | | 2,325,000 | 2,414,629 |
| Series 2010 C, 5% 6/15/18 (b) | | 445,000 | 479,229 |
| Series 2011 A, 5% 6/15/18 (b) | | 200,000 | 215,384 |
| Series 2015 A, 5% 6/15/19 (b) | | 1,195,000 | 1,328,422 |
| Philadelphia Gas Works Rev. Eighth Series A, 5% 8/1/16 | | 100,000 | 100,361 |
| Philadelphia Hospitals & Higher Ed. Facilities Auth. Hosp. Rev. (The Children's Hosp. of Philadelphia Proj.) Series 2007 A, 4.25% 7/1/16 | | 250,000 | 250,000 |
|
| TOTAL PENNSYLVANIA | | | 19,841,493 |
|
| Rhode Island - 0.1% | | | |
| Rhode Island Comm Corp. Rev. Series 2016 A, 5% 6/15/19 | | 635,000 | 707,466 |
| South Carolina - 0.4% | | | |
| Scago Edl. Facilities Corp. for Colleton School District (School District of Colleton County Proj.) Series 2015, 5% 12/1/18 | | 1,075,000 | 1,173,062 |
| South Carolina Pub. Svc. Auth. Rev.: | | | |
| Series 2006 C: | | | |
| 5% 1/1/17 (Escrowed to Maturity) | | 190,000 | 194,127 |
| 5% 1/1/18 (FSA Insured) | | 125,000 | 127,771 |
| Series 2007 A, 5% 1/1/18 (Pre-Refunded to 1/1/17 @ 100) | | 90,000 | 91,955 |
| Series 2010 B, 5% 1/1/18 | | 290,000 | 307,870 |
| Series 2015 A, 5% 1/1/19 (FSA Insured) | | 325,000 | 331,945 |
|
| TOTAL SOUTH CAROLINA | | | 2,226,730 |
|
| Tennessee - 0.1% | | | |
| Memphis-Shelby County Arpt. Auth. Arpt. Rev.: | | | |
| Series 2011 A1, 5% 7/1/17 (b) | | 30,000 | 31,132 |
| Series 2011 C, 5% 7/1/19 (b) | | 280,000 | 310,332 |
|
| TOTAL TENNESSEE | | | 341,464 |
|
| Texas - 4.0% | | | |
| Brownsville Util. Sys. Rev. Series 2015: | | | |
| 5% 9/1/17 | | 270,000 | 283,241 |
| 5% 9/1/18 | | 1,000,000 | 1,085,640 |
| Corpus Christi Util. Sys. Rev.: | | | |
| Bonds Series 2015 B, 2%, tender 7/15/17 (a) | | 4,465,000 | 4,491,120 |
| Series 2012, 3% 7/15/16 | | 200,000 | 200,198 |
| Dallas Fort Worth Int'l. Arpt. Rev.: | | | |
| Series 2009 A: | | | |
| 4% 11/1/17 | | 200,000 | 208,950 |
| 5% 11/1/16 | | 500,000 | 507,105 |
| Series 2013 D, 5% 11/1/16 | | 325,000 | 329,618 |
| Series 2013 E, 5% 11/1/17 (b) | | 165,000 | 174,210 |
| Series 2014 A: | | | |
| 3% 11/1/16 (b) | | 180,000 | 181,399 |
| 3% 11/1/17 (b) | | 185,000 | 190,478 |
| Series 2014 D, 5% 11/1/16 (b) | | 250,000 | 253,535 |
| Harris County Cultural Ed. Facilities Fin. Corp. Rev.: | | | |
| (Texas Children's Hosp. Proj.) Series 2010, 5% 10/1/16 | | 110,000 | 111,176 |
| Bonds Series 2014 B, 0.99%, tender 12/1/19 (a) | | 500,000 | 497,335 |
| Series 2013 A: | | | |
| 4% 12/1/16 | | 810,000 | 821,057 |
| 4% 12/1/18 | | 420,000 | 451,294 |
| 5% 12/1/17 | | 375,000 | 397,305 |
| Harris County Gen. Oblig. Series 2008 A, 4.25% 8/15/16 | | 250,000 | 251,158 |
| Harris County Health Facilities Dev. Corp. Rev.: | | | |
| Series 2005 A5, 5% 7/1/16 (FSA Insured) | | 1,050,000 | 1,050,000 |
| Series 2005 A6, 5% 7/1/16 (FSA Insured) | | 695,000 | 695,000 |
| Houston Arpt. Sys. Rev.: | | | |
| Series 2007 B, 5% 7/1/16 (Nat'l. Pub. Fin. Guarantee Corp. Insured) | | 375,000 | 375,000 |
| Series 2011 A: | | | |
| 5% 7/1/18 (b) | | 100,000 | 107,703 |
| 5% 7/1/19 (b) | | 685,000 | 761,768 |
| Series 2012 A, 5% 7/1/18 (b) | | 90,000 | 96,933 |
| 5% 7/1/17 (Nat'l. Pub. Fin. Guarantee Corp. Insured) | | 600,000 | 625,248 |
| Houston Cmnty. College Sys. Rev. Series 2011, 5% 2/15/18 | | 80,000 | 85,612 |
| Houston Gen. Oblig. Series 2014 A, 5% 3/1/19 | | 300,000 | 332,001 |
| Houston Util. Sys. Rev. Bonds 1.16%, tender 7/7/16 (a) | | 775,000 | 773,156 |
| Lewisville Independent School District Series 2006, 4.5% 8/15/17 | | 380,000 | 381,680 |
| Lower Colorado River Auth. Rev.: | | | |
| (LCRA Transmission Svcs. Corp. Proj.) Series 2006 A, 5% 5/15/18 | | 535,000 | 535,337 |
| Series 2008: | | | |
| 5% 5/15/18 | | 375,000 | 404,790 |
| 5.5% 5/15/19 | | 135,000 | 146,286 |
| Series 2010 4% 5/15/18 | | 250,000 | 265,253 |
| Series 2011 A 5% 5/15/17 | | 165,000 | 171,176 |
| Series 2012 B, 5% 5/15/17 | | 100,000 | 103,743 |
| Series 2014, 5% 5/15/18 | | 245,000 | 264,463 |
| Series 2015 D: | | | |
| 4% 5/15/17 | | 180,000 | 185,198 |
| 5% 5/15/17 | | 390,000 | 404,598 |
| Series 2015, 4% 5/15/17 | | 240,000 | 246,931 |
| 5% 5/15/19 | | 495,000 | 553,331 |
| San Antonio Elec. & Gas Sys. Rev. Series 2006 B, 5% 2/1/18 | | 100,000 | 102,707 |
| Southwest Higher Ed. Auth. Rev. (Southern Methodist Univ. Proj.) Series 2009, 5% 10/1/17 | | 60,000 | 63,230 |
| Tarrant County Cultural Ed. Facilities Fin. Corp. Hosp. Rev.: | | | |
| Series 2011 A, 5% 11/15/16 | | 200,000 | 203,188 |
| Series 2014, 5% 12/1/16 | | 125,000 | 127,275 |
| Texas Gen. Oblig.: | | | |
| Series 2010 B, 5% 8/1/16 | | 150,000 | 150,575 |
| Series 2010, 5% 8/1/16 | | 300,000 | 301,149 |
| Texas Muni. Pwr. Agcy. Rev.: | | | |
| Series 2010, 5% 9/1/16 | | 200,000 | 201,422 |
| 0% 9/1/16 | | 840,000 | 839,227 |
|
| TOTAL TEXAS | | | 20,988,799 |
|
| Utah - 0.1% | | | |
| Intermountain Pwr. Agcy. Pwr. Supply Rev. Series 2007 A, 5% 7/1/16 | | 390,000 | 390,000 |
| Virginia - 0.3% | | | |
| Louisa Indl. Dev. Auth. Poll. Cont. Rev. Bonds Series 2008 A, 1.75%, tender 5/16/19 (a) | | 1,500,000 | 1,526,100 |
| Washington - 1.0% | | | |
| Chelan County Pub. Util. District #1 Rev. Series 2011 B, 5% 7/1/18 (b) | | 140,000 | 150,986 |
| Energy Northwest Wind Proj. Rev. Series 2014, 5% 7/1/16 | | 160,000 | 160,000 |
| Port of Seattle Rev.: | | | |
| Series 2010 C: | | | |
| 5% 2/1/17 (b) | | 185,000 | 189,501 |
| 5% 2/1/18 (b) | | 840,000 | 893,684 |
| Series 2012 A: | | | |
| 4% 8/1/17 | | 100,000 | 103,488 |
| 5% 8/1/16 | | 1,050,000 | 1,053,896 |
| Series 2012 B, 4% 8/1/17 (b) | | 115,000 | 118,948 |
| Washington Ctfs. of Prtn. Series 2013 D, 4% 7/1/17 | | 240,000 | 247,817 |
| Washington Gen. Oblig.: | | | |
| Series 2000 S5, 0% 1/1/17 | | 200,000 | 199,390 |
| Series 2004 C, 0% 6/1/18 | | 210,000 | 207,148 |
| Series S5, 0% 1/1/18 (Nat'l. Pub. Fin. Guarantee Corp. Insured) | | 815,000 | 806,581 |
| Washington Health Care Facilities Auth. Rev.: | | | |
| Series 2011 B, 5% 10/1/16 | | 585,000 | 591,061 |
| Series 2014, 5% 3/1/18 | | 225,000 | 240,482 |
| Washington Pub. Pwr. Supply Sys. Nuclear Proj. #3 Rev. Series 1993 C, 0% 7/1/18 | | 100,000 | 98,563 |
|
| TOTAL WASHINGTON | | | 5,061,545 |
|
| West Virginia - 0.2% | | | |
| West Virginia Econ. Dev. Auth. Poll. Cont. Rev. (Appalacian Pwr. Co. - Amos Proj.) Series 2008 D, 3.25% 5/1/19 | | 250,000 | 261,570 |
| West Virginia Econ. Dev. Auth. Solid Waste Disp. Facilities Rev. Bonds: | | | |
| Series 2011 A, 2.25%, tender 9/1/16 (a)(b) | | 275,000 | 275,424 |
| 1.9%, tender 4/1/19 (a) | | 530,000 | 533,949 |
|
| TOTAL WEST VIRGINIA | | | 1,070,943 |
|
| Wisconsin - 1.2% | | | |
| Milwaukee County Arpt. Rev.: | | | |
| Series 2005 A, 5.25% 12/1/16 (FSA Insured) (b) | | 480,000 | 488,765 |
| Series 2007 A, 5% 12/1/17 (b) | | 200,000 | 203,468 |
| Series 2010 B, 5% 12/1/16 (b) | | 550,000 | 559,493 |
| Wisconsin Health & Edl. Facilities: | | | |
| Bonds Series 2013 B: | | | |
| 4%, tender 3/1/18 (a) | | 695,000 | 731,675 |
| 4%, tender 5/30/19 (a) | | 655,000 | 712,201 |
| Series 2013 A, 5% 11/15/18 | | 160,000 | 175,786 |
| Series 2014 A, 5% 11/15/16 | | 445,000 | 451,849 |
| 4% 12/15/16 | | 250,000 | 253,743 |
| Wisconsin Health & Edl. Facilities Auth. Rev.: | | | |
| (Aurora Health Care, Inc. Proj.) Series 2010 A, 5% 4/15/17 | | 55,000 | 56,780 |
| Bonds Series 2009 B, 5.125%, tender 8/15/16 (a) | | 845,000 | 849,276 |
| Series 2012 A, 5% 7/15/16 | | 500,000 | 500,865 |
| Series 2012 B: | | | |
| 5% 8/15/16 | | 510,000 | 512,642 |
| 5% 8/15/18 | | 500,000 | 543,705 |
| 5% 10/1/16 | | 335,000 | 338,437 |
|
| TOTAL WISCONSIN | | | 6,378,685 |
|
| TOTAL MUNICIPAL BONDS | | | |
| (Cost $306,425,341) | | | 307,207,412 |
|
| Municipal Notes - 44.9% | | | |
| Alabama - 0.6% | | | |
| Decatur Indl. Dev. Board Exempt Facilities Rev. (Nucor Steel Decatur LLC Proj.) Series 2003 A, 0.7% 7/7/16, VRDN (a)(b) | | 2,903,000 | $2,903,000 |
| Mobile County Board of School Commissioners TAN Series 2016 A, 2% 3/1/17 | | 350,000 | 353,024 |
|
| TOTAL ALABAMA | | | 3,256,024 |
|
| Arkansas - 1.1% | | | |
| Blytheville Indl. Dev. Rev. (Nucor Corp. Proj.) Series 2002, 0.73% 7/7/16, VRDN (a)(b) | | 5,900,000 | 5,900,000 |
| California - 1.1% | | | |
| San Francisco Calif. City & Cnty. Arpts. Commn. Int'l. Arpt. Rev. Participating VRDN Series 15 ZF 01 64, 0.71% 7/7/16 (Liquidity Facility JPMorgan Chase Bank) (a)(b)(e) | | 5,000,000 | 5,000,000 |
| Shafter Indl. Dev. Auth. Indl. Dev. Rev. 0.83% 7/7/16, LOC Deutsche Bank AG, VRDN (a)(b) | | 800,000 | 800,000 |
|
| TOTAL CALIFORNIA | | | 5,800,000 |
|
| Colorado - 0.3% | | | |
| Colorado Hsg. & Fin. Auth. Econ. Dev. (Pacific Instruments Proj.) Series 2000, 0.6% 7/7/16, LOC Wells Fargo Bank NA, VRDN (a)(b) | | 1,530,000 | 1,530,000 |
| Connecticut - 0.1% | | | |
| New London BAN Series 2016, 2% 3/23/17 | | 500,000 | 503,675 |
| Delaware - 3.6% | | | |
| Delaware Econ. Dev. Auth. Rev. (Delmarva Pwr. & Lt. Co. Proj.) Series 1994, 0.63% 7/1/16, VRDN (a)(b) | | 18,600,000 | 18,599,966 |
| Idaho - 0.8% | | | |
| Ammon Urban Renewal Agcy. Rev. Series A, 0.5% 7/7/16, LOC Wells Fargo Bank NA, VRDN (a) | | 845,000 | 845,000 |
| Eagle Indl. Dev. Corp. Rev. (Camille Beckman Proj.) 0.6% 7/7/16, LOC Wells Fargo Bank NA, VRDN (a)(b) | | 1,830,000 | 1,830,000 |
| Idaho Health Facilities Auth. Rev. Participating VRDN Series 16 XG 00 66, 0.73% 7/7/16 (Liquidity Facility Deutsche Bank AG New York Branch) (a)(e) | | 1,500,000 | 1,500,000 |
|
| TOTAL IDAHO | | | 4,175,000 |
|
| Illinois - 10.1% | | | |
| Chicago Metropolitan Wtr. Reclamation District of Greater Chicago Participating VRDN Series Putters 4360, 0.66% 7/7/16 (Liquidity Facility JPMorgan Chase Bank) (a)(e) | | 3,000,000 | 3,000,000 |
| Chicago Park District Gen. Oblig. Participating VRDN Series ROC II R 11935, 0.91% 7/7/16 (Liquidity Facility Citibank NA) (a)(e) | | 9,375,000 | 9,375,000 |
| Cook County Gen. Oblig. Participating VRDN Series 2015 XF0124, 0.81% 7/7/16 (Liquidity Facility JPMorgan Chase Bank) (a)(e) | | 5,000,000 | 5,000,000 |
| Deutsche Spears/Lifers Trust Participating VRDN Series DB 1115, 0.72% 7/7/16 (Liquidity Facility Deutsche Bank AG) (a)(e) | | 18,075,000 | 18,075,000 |
| Illinois Dev. Fin. Auth. Indl. Dev. Rev. (R. A. Zweig, Inc. Proj.) 1% 7/7/16, LOC JPMorgan Chase Bank, VRDN (a)(b) | | 650,000 | 650,000 |
| Illinois Gen. Oblig. Participating VRDN Series 15 XF 1006, 0.72% 7/7/16 (Liquidity Facility Deutsche Bank AG) (a)(e) | | 8,900,000 | 8,900,000 |
| Univ. of Illinois Board of Trustees Ctfs. of Prtn. (Util. Infrastructure Projs.) Series 2004, 0.99% 7/7/16 (Liquidity Facility BMO Harris Bank NA), VRDN (a) | | 7,825,000 | 7,825,000 |
|
| TOTAL ILLINOIS | | | 52,825,000 |
|
| Indiana - 0.8% | | | |
| Allen County Econ. Dev. Rev. (DeBrand, Inc. Proj.) 0.91% 7/7/16, LOC JPMorgan Chase Bank, VRDN (a)(b) | | 600,000 | 600,000 |
| Indiana Dev. Fin. Auth. Envir. Rev. (PSI Energy Proj.) Series 2003 B, 0.6% 7/7/16, VRDN (a)(b) | | 1,380,000 | 1,380,000 |
| Indiana Health Facility Fing. Auth. Rev. (Anthony Wayne Rehabilitation for Hanicapped and Blind, Inc. Proj.) Series 2011, 0.5% 7/7/16, LOC Wells Fargo Bank NA, VRDN (a) | | 2,050,000 | 2,050,000 |
|
| TOTAL INDIANA | | | 4,030,000 |
|
| Kentucky - 0.2% | | | |
| Bardstown Indl. Rev. (JAV Invt. LLC Proj.) Series 2001, 0.91% 7/7/16, LOC JPMorgan Chase Bank, VRDN (a)(b) | | 200,000 | 200,000 |
| Kentucky Pub. Trans. BAN Series 2013 A, 5% 7/1/17 | | 300,000 | 311,142 |
| Lexington-Fayette Urban County K Series 1998, 0.74% 7/7/16, LOC PNC Bank NA, VRDN (a) | | 335,000 | 335,000 |
|
| TOTAL KENTUCKY | | | 846,142 |
|
| Louisiana - 3.2% | | | |
| Saint James Parish Gen. Oblig. (Nucor Steel Louisiana LLC Proj.): | | | |
| Series 2010 A1, 0.65% 7/7/16, VRDN (a) | | 7,000,000 | 7,000,000 |
| Series 2010 B1, 0.7% 7/7/16, VRDN (a) | | 9,560,000 | 9,560,000 |
|
| TOTAL LOUISIANA | | | 16,560,000 |
|
| Maryland - 0.5% | | | |
| Maryland Health & Higher Edl. Facilities Auth. Rev. Series 1995, 0.72% 7/7/16 (Liquidity Facility Manufacturers & Traders Trust Co.), VRDN (a) | | 2,815,000 | 2,815,000 |
| Michigan - 0.3% | | | |
| Lowell Mich Ltd. Oblig. Indl. Dev. (Litehouse, Inc. Proj.) Series 2003, 0.8% 7/7/16, LOC Fifth Third Bank, Cincinnati, VRDN (a)(b) | | 965,000 | 965,000 |
| Michigan Strategic Fund Ltd. Oblig. Rev. (Press-Way, Inc. Proj.) Series 1998, 0.74% 7/7/16, LOC JPMorgan Chase Bank, VRDN (a)(b) | | 700,000 | 700,000 |
|
| TOTAL MICHIGAN | | | 1,665,000 |
|
| Mississippi - 0.2% | | | |
| Mississippi Bus. Fin. Corp. Rev. (Utils. Optimization LLC Proj.) Series 2002 A, 0.61% 7/7/16, LOC Cap. One Bank, VRDN (a)(b) | | 1,000,000 | 1,000,000 |
| Nevada - 3.3% | | | |
| Clark County Arpt. Rev. Participating VRDN Series ROC II R 11823, 0.71% 7/7/16 (Liquidity Facility Citibank NA) (a)(e) | | 16,600,000 | 16,600,000 |
| Sparks Econ. Dev. Rev. (RIX Industries Proj.) Series 2002, 0.6% 7/7/16, LOC Wells Fargo Bank NA, VRDN (a)(b) | | 670,000 | 670,000 |
|
| TOTAL NEVADA | | | 17,270,000 |
|
| New Jersey - 0.7% | | | |
| Jersey City Gen. Oblig. BAN 1% 12/9/16 | | 1,025,000 | 1,025,564 |
| New Brunswick Gen. Oblig. BAN Series 2016, 3% 6/6/17 | | 1,100,000 | 1,119,844 |
| New Jersey Health Care Facilities Fing. Auth. Rev. Participating VRDN Series 16 XG 00 47, 0.8% 7/7/16 (Liquidity Facility Deutsche Bank AG New York Branch) (a)(e) | | 1,750,725 | 1,750,725 |
|
| TOTAL NEW JERSEY | | | 3,896,133 |
|
| New York - 1.9% | | | |
| Albany Gen. Oblig. BAN Series 2016, 2% 6/30/17 | | 1,846,812 | 1,866,517 |
| Binghamton Gen. Oblig. BAN Series 2015 B, 2% 11/18/16 | | 1,000,000 | 1,004,320 |
| Nassau County Indl. Dev. Agcy. Indl. Dev. Rev. (Rubies Costume Co. Proj.) Series 1999, 0.72% 7/7/16, LOC Bank of America NA, VRDN (a) | | 570,000 | 570,000 |
| Rensselaer County Indl. Dev. Auth. Civic Facilities Rev. (Rensselaer Polytechnic Institute Proj.) Series 1997 A, 0.85% 7/7/16, VRDN (a) | | 5,715,000 | 5,715,000 |
| Ulster County Indl. Dev. Agcy. I (Selux Corp. Proj.) Series A: | | | |
| 0.79% 7/7/16, LOC Manufacturers & Traders Trust Co., VRDN (a)(b) | | 335,000 | 335,000 |
| 0.79% 7/7/16, LOC Manufacturers & Traders Trust Co., VRDN (a)(b) | | 525,000 | 525,000 |
|
| TOTAL NEW YORK | | | 10,015,837 |
|
| North Carolina - 3.7% | | | |
| Hertford County Indl. Facilities Poll. Cont. Fing. Auth.: | | | |
| (Nucor Corp. Proj.) Series 2000 A, 0.73% 7/7/16, VRDN (a)(b) | | 14,800,000 | 14,800,000 |
| Series 2000 B, 0.68% 7/7/16, VRDN (a)(b) | | 4,400,000 | 4,400,000 |
|
| TOTAL NORTH CAROLINA | | | 19,200,000 |
|
| Ohio - 0.7% | | | |
| Franklin County Indl. Dev. Rev. (Girl Scout Council Proj.) 0.83% 7/7/16, LOC PNC Bank NA, VRDN (a) | | 70,000 | 70,000 |
| Marietta BAN 1.5% 5/12/17 | | 3,475,000 | 3,489,213 |
|
| TOTAL OHIO | | | 3,559,213 |
|
| Pennsylvania - 0.1% | | | |
| Berks County Indl. Dev. Auth. Rev. (KTB Real Estate Partnership Proj.) 0.6% 7/7/16, LOC Manufacturers & Traders Trust Co., VRDN (a)(b) | | 750,000 | 750,000 |
| South Carolina - 0.1% | | | |
| Berkeley County Indl. Dev. Rev. (Nucor Corp. Proj.) Series 1995, 0.7% 7/7/16, VRDN (a)(b) | | 600,000 | 600,000 |
| Texas - 10.9% | | | |
| Port Arthur Navigation District Envir. Facilities Rev. (Motiva Enterprises LLC Proj.): | | | |
| Series 2001 A, 0.54% 7/1/16, VRDN (a) | | 10,000,000 | 10,000,000 |
| Series 2004, 0.71% 7/7/16, VRDN (a)(b) | | 10,230,000 | 10,230,000 |
| Series 2009 B, 0.54% 7/1/16, VRDN (a) | | 2,830,000 | 2,830,000 |
| Series 2009 C, 0.54% 7/1/16, VRDN (a) | | 4,900,000 | 4,900,000 |
| Series 2010 B, 0.54% 7/1/16, VRDN (a) | | 3,350,000 | 3,350,000 |
| Series 2010 C, 0.54% 7/1/16, VRDN (a) | | 4,500,000 | 4,500,000 |
| Series 2010 D: | | | |
| 0.54% 7/1/16, VRDN (a) | | 7,300,000 | 7,300,000 |
| 0.54% 7/1/16, VRDN (a) | | 13,980,000 | 13,980,000 |
|
| TOTAL TEXAS | | | 57,090,000 |
|
| Washington - 0.2% | | | |
| Seattle Hsg. Auth. Rev. (Douglas Apts. Proj.) 0.55% 7/7/16, LOC KeyBank NA, VRDN (a) | | 810,000 | 810,000 |
| Wisconsin - 0.4% | | | |
| Crosse Dev. Rev. Series 2008, 0.5% 7/7/16, LOC Wells Fargo Bank NA, VRDN (a) | | 935,000 | 935,000 |
| Kimberly Dev. Rev. (Fox Cities YMCA Proj.) Series 2002, 0.77% 7/7/16, LOC BMO Harris Bank NA, VRDN (a) | | 200,000 | 200,000 |
| Milwaukee Redev. Auth. Rev. Series 2001, 0.7% 7/1/16, LOC U.S. Bank NA, Cincinnati, VRDN (a) | | 625,000 | 625,000 |
| River Falls Indl. Dev. Rev. 0.83% 7/7/16, LOC U.S. Bank NA, Cincinnati, VRDN (a)(b) | | 460,000 | 460,000 |
|
| TOTAL WISCONSIN | | | 2,220,000 |
|
| TOTAL MUNICIPAL NOTES | | | |
| (Cost $234,913,969) | | | 234,916,990 |
| TOTAL INVESTMENT PORTFOLIO - 103.6% | | | |
| (Cost $541,339,310) | | | 542,124,402 |
| NET OTHER ASSETS (LIABILITIES) - (3.6)% | | | (18,744,773) |
| NET ASSETS - 100% | | | $523,379,629 |
Security Type Abbreviations
BAN – BOND ANTICIPATION NOTE
TAN – TAX ANTICIPATION NOTE
VRDN – VARIABLE RATE DEMAND NOTE (A debt instrument that is payable upon demand, either daily, weekly or monthly)
Legend
(a) Coupon rates for floating and adjustable rate securities reflect the rates in effect at period end.
(b) Private activity obligations whose interest is subject to the federal alternative minimum tax for individuals.
(c) Security or a portion of the security purchased on a delayed delivery or when-issued basis. Interest rate to be determined at settlement date.
(d) Security exempt from registration under Rule 144A of the Securities Act of 1933. These securities may be resold in transactions exempt from registration, normally to qualified institutional buyers. At the end of the period, the value of these securities amounted to $400,024 or 0.1% of net assets.
(e) Provides evidence of ownership in one or more underlying municipal bonds.
Investment Valuation
All investments are categorized as Level 2 under the Fair Value Hierarchy. The inputs or methodology used for valuing securities may not be an indication of the risk associated with investing in those securities. For more information on valuation inputs please refer to the Investment Valuation section in the accompanying Notes to Financial Statements.
Other Information
The distribution of municipal securities by revenue source, as a percentage of total Net Assets, is as follows (Unaudited):
| General Obligations | 22.3% |
| Industrial Development | 21.5% |
| Health Care | 13.9% |
| Synthetics | 13.3% |
| Electric Utilities | 12.3% |
| Transportation | 8.9% |
| Education | 5.5% |
| Others* (Individually Less Than 5%) | 2.3% |
| | 100.0% |
* Includes net other assets
See accompanying notes which are an integral part of the financial statements.
Financial Statements
Statement of Assets and Liabilities
| | | June 30, 2016 (Unaudited) |
| Assets | | |
Investment in securities, at value — See accompanying schedule:
Unaffiliated issuers (cost $541,339,310) | | $542,124,402 |
| Receivable for fund shares sold | | 1,977,341 |
| Interest receivable | | 3,316,143 |
| Receivable from investment adviser for expense reductions | | 39,196 |
| Other receivables | | 28 |
| Total assets | | 547,457,110 |
| Liabilities | | |
| Payable to custodian bank | $2,399,234 | |
| Payable for investments purchased | | |
| Regular delivery | 18,464,736 | |
| Delayed delivery | 1,894,938 | |
| Payable for fund shares redeemed | 1,102,057 | |
| Distributions payable | 68,332 | |
| Accrued management fee | 123,536 | |
| Other affiliated payables | 24,648 | |
| Total liabilities | | 24,077,481 |
| Net Assets | | $523,379,629 |
| Net Assets consist of: | | |
| Paid in capital | | $522,466,380 |
| Undistributed net investment income | | 13,308 |
| Accumulated undistributed net realized gain (loss) on investments | | 114,849 |
| Net unrealized appreciation (depreciation) on investments | | 785,092 |
| Net Assets | | $523,379,629 |
| Conservative Income Municipal Bond: | | |
| Net Asset Value, offering price and redemption price per share ($102,498,833 ÷ 10,192,720 shares) | | $10.06 |
| Institutional Class: | | |
| Net Asset Value, offering price and redemption price per share ($420,880,796 ÷ 41,851,894 shares) | | $10.06 |
See accompanying notes which are an integral part of the financial statements.
Statement of Operations
| | | Six months ended June 30, 2016 (Unaudited) |
| Investment Income | | |
| Interest | | $1,894,465 |
| Expenses | | |
| Management fee | $654,241 | |
| Transfer agent fees | 129,787 | |
| Independent trustees' fees and expenses | 934 | |
| Miscellaneous | 338 | |
| Total expenses before reductions | 785,300 | |
| Expense reductions | (201,517) | 583,783 |
| Net investment income (loss) | | 1,310,682 |
| Realized and Unrealized Gain (Loss) | | |
| Net realized gain (loss) on: | | |
| Investment securities: | | |
| Unaffiliated issuers | 114,849 | |
| Total net realized gain (loss) | | 114,849 |
| Change in net unrealized appreciation (depreciation) on investment securities | | 719,833 |
| Net gain (loss) | | 834,682 |
| Net increase (decrease) in net assets resulting from operations | | $2,145,364 |
See accompanying notes which are an integral part of the financial statements.
Statement of Changes in Net Assets
| | Six months ended June 30, 2016 (Unaudited) | Year ended December 31, 2015 |
| Increase (Decrease) in Net Assets | | |
| Operations | | |
| Net investment income (loss) | $1,310,682 | $1,045,098 |
| Net realized gain (loss) | 114,849 | 28,825 |
| Change in net unrealized appreciation (depreciation) | 719,833 | (55,919) |
| Net increase (decrease) in net assets resulting from operations | 2,145,364 | 1,018,004 |
| Distributions to shareholders from net investment income | (1,304,547) | (1,037,794) |
| Distributions to shareholders from net realized gain | – | (35,775) |
| Total distributions | (1,304,547) | (1,073,569) |
| Share transactions - net increase (decrease) | 157,802,143 | 176,194,534 |
| Total increase (decrease) in net assets | 158,642,960 | 176,138,969 |
| Net Assets | | |
| Beginning of period | 364,736,669 | 188,597,700 |
| End of period | $523,379,629 | $364,736,669 |
| Other Information | | |
| Undistributed net investment income end of period | $13,308 | $7,173 |
See accompanying notes which are an integral part of the financial statements.
Financial Highlights — Fidelity Conservative Income Municipal Bond Fund
| | Six months ended (Unaudited) June 30, | Years ended December 31, | | |
| | 2016 | 2015 | 2014 | 2013 A |
| Selected Per–Share Data | | | | |
| Net asset value, beginning of period | $10.04 | $10.04 | $10.02 | $10.00 |
| Income from Investment Operations | | | | |
| Net investment income (loss)B | .026 | .032 | .015 | .002 |
| Net realized and unrealized gain (loss) | .020 | –C | .021 | .020 |
| Total from investment operations | .046 | .032 | .036 | .022 |
| Distributions from net investment income | (.026) | (.031) | (.015) | (.002) |
| Distributions from net realized gain | – | (.001) | (.001) | – |
| Total distributions | (.026) | (.032) | (.016) | (.002) |
| Net asset value, end of period | $10.06 | $10.04 | $10.04 | $10.02 |
| Total ReturnD,E | .46% | .32% | .36% | .22% |
| Ratios to Average Net AssetsF,G | | | | |
| Expenses before reductions | .40%H | .40% | .40% | .40%H |
| Expenses net of fee waivers, if any | .35%H | .39% | .40% | .40%H |
| Expenses net of all reductions | .35%H | .39% | .40% | .40%H |
| Net investment income (loss) | .52%H | .32% | .15% | .11%H |
| Supplemental Data | | | | |
| Net assets, end of period (000 omitted) | $102,499 | $73,914 | $45,107 | $22,205 |
| Portfolio turnover rateI | 46%H | 32% | 51% | - %J,K |
A For the period October 15, 2013 (commencement of operations) to December 31, 2013.
B Calculated based on average shares outstanding during the period.
C Amount represents less than $.0005 per share.
D Total returns for periods of less than one year are not annualized.
E Total returns would have been lower if certain expenses had not been reduced during the applicable periods shown.
F Fees and expenses of any underlying Fidelity Central Funds are not included in the Fund's expense ratio. The Fund indirectly bears its proportionate share of the expenses of any underlying Fidelity Central Funds.
G Expense ratios reflect operating expenses of the class. Expenses before reductions do not reflect amounts reimbursed by the investment adviser or reductions from expense offset arrangements and do not represent the amount paid by the class during periods when reimbursements or reductions occur. Expense ratios before reductions for start-up periods may not be representative of longer-term operating periods. Expenses net of fee waivers reflect expenses after reimbursement by the investment adviser but prior to reductions from expense offset arrangements. Expenses net of all reductions represent the net expenses paid by the class.
H Annualized
I Amount does not include the portfolio activity of any underlying Fidelity Central Funds.
J Amount represents less than .005%.
K Amount not annualized.
See accompanying notes which are an integral part of the financial statements.
Financial Highlights — Fidelity Conservative Income Municipal Bond Fund Institutional Class
| | Six months ended (Unaudited) June 30, | Years ended December 31, | | |
| | 2016 | 2015 | 2014 | 2013 A |
| Selected Per–Share Data | | | | |
| Net asset value, beginning of period | $10.04 | $10.04 | $10.02 | $10.00 |
| Income from Investment Operations | | | | |
| Net investment income (loss)B | .031 | .042 | .025 | .004 |
| Net realized and unrealized gain (loss) | .020 | –C | .021 | .020 |
| Total from investment operations | .051 | .042 | .046 | .024 |
| Distributions from net investment income | (.031) | (.041) | (.025) | (.004) |
| Distributions from net realized gain | – | (.001) | (.001) | – |
| Total distributions | (.031) | (.042) | (.026) | (.004) |
| Net asset value, end of period | $10.06 | $10.04 | $10.04 | $10.02 |
| Total ReturnD,E | .51% | .42% | .46% | .24% |
| Ratios to Average Net AssetsF,G | | | | |
| Expenses before reductions | .35%H | .35% | .35% | .35%H |
| Expenses net of fee waivers, if any | .25%H | .29% | .30% | .30%H |
| Expenses net of all reductions | .25%H | .29% | .30% | .30%H |
| Net investment income (loss) | .62%H | .42% | .25% | .22%H |
| Supplemental Data | | | | |
| Net assets, end of period (000 omitted) | $420,881 | $290,823 | $143,491 | $27,963 |
| Portfolio turnover rateI | 46%H | 32% | 51% | - %J,K |
A For the period October 15, 2013 (commencement of operations) to December 31, 2013.
B Calculated based on average shares outstanding during the period.
C Amount represents less than $.0005 per share.
D Total returns for periods of less than one year are not annualized.
E Total returns would have been lower if certain expenses had not been reduced during the applicable periods shown.
F Fees and expenses of any underlying Fidelity Central Funds are not included in the Fund's expense ratio. The Fund indirectly bears its proportionate share of the expenses of any underlying Fidelity Central Funds.
G Expense ratios reflect operating expenses of the class. Expenses before reductions do not reflect amounts reimbursed by the investment adviser or reductions from expense offset arrangements and do not represent the amount paid by the class during periods when reimbursements or reductions occur. Expense ratios before reductions for start-up periods may not be representative of longer-term operating periods. Expenses net of fee waivers reflect expenses after reimbursement by the investment adviser but prior to reductions from expense offset arrangements. Expenses net of all reductions represent the net expenses paid by the class.
H Annualized
I Amount does not include the portfolio activity of any underlying Fidelity Central Funds.
J Amount represents less than .005%.
K Amount not annualized.
See accompanying notes which are an integral part of the financial statements.
Notes to Financial Statements (Unaudited)
For the period ended June 30, 2016
1. Organization.
Fidelity Conservative Income Municipal Bond Fund (the Fund) is a fund of Fidelity Municipal Trust (the Trust) and is authorized to issue an unlimited number of shares. The Trust is registered under the Investment Company Act of 1940, as amended (the 1940 Act), as an open-end management investment company organized as a Massachusetts business trust. The Fund offers Conservative Income Municipal Bond and Institutional Class shares, each of which has equal rights as to assets and voting privileges. Each class has exclusive voting rights with respect to matters that affect that class.
2. Significant Accounting Policies.
The financial statements have been prepared in conformity with accounting principles generally accepted in the United States of America (GAAP), which require management to make certain estimates and assumptions at the date of the financial statements. Actual results could differ from those estimates. Subsequent events, if any, through the date that the financial statements were issued have been evaluated in the preparation of the financial statements. The following summarizes the significant accounting policies of the Fund:
Investment Valuation. Investments are valued as of 4:00 p.m. Eastern time on the last calendar day of the period. The Board of Trustees (the Board) has delegated the day to day responsibility for the valuation of the Fund's investments to the Fidelity Management & Research Company (FMR) Fair Value Committee (the Committee). In accordance with valuation policies and procedures approved by the Board, the Fund attempts to obtain prices from one or more third party pricing vendors or brokers to value its investments. When current market prices, quotations or currency exchange rates are not readily available or reliable, investments will be fair valued in good faith by the Committee, in accordance with procedures adopted by the Board. Factors used in determining fair value vary by investment type and may include market or investment specific events, changes in interest rates and credit quality. The frequency with which these procedures are used cannot be predicted and they may be utilized to a significant extent. The Committee oversees the Fund's valuation policies and procedures and reports to the Board on the Committee's activities and fair value determinations. The Board monitors the appropriateness of the procedures used in valuing the Fund's investments and ratifies the fair value determinations of the Committee.
The Fund categorizes the inputs to valuation techniques used to value its investments into a disclosure hierarchy consisting of three levels as shown below:
- Level 1 – quoted prices in active markets for identical investments
- Level 2 – other significant observable inputs (including quoted prices for similar investments, interest rates, prepayment speeds, etc.)
- Level 3 – unobservable inputs (including the Fund's own assumptions based on the best information available)
Valuation techniques used to value the Fund's investments by major category are as follows:
Debt securities, including restricted securities, are valued based on evaluated prices received from third party pricing vendors or from brokers who make markets in such securities. Municipal securities are valued by pricing vendors who utilize matrix pricing which considers yield or price of bonds of comparable quality, coupon, maturity and type or by broker-supplied prices. When independent prices are unavailable or unreliable, debt securities may be valued utilizing pricing methodologies which consider similar factors that would be used by third party pricing vendors. Debt securities are generally categorized as Level 2 in the hierarchy but may be Level 3 depending on the circumstances.
Changes in valuation techniques may result in transfers in or out of an assigned level within the disclosure hierarchy.
Investment Transactions and Income. For financial reporting purposes, the Fund's investment holdings and NAV include trades executed through the end of the last business day of the period. The NAV per share for processing shareholder transactions is calculated as of the close of business of the New York Stock Exchange (NYSE), normally 4:00 p.m. Eastern time and includes trades executed through the end of the prior business day. Gains and losses on securities sold are determined on the basis of identified cost. Interest income is accrued as earned and includes coupon interest and amortization of premium and accretion of discount on debt securities as applicable. Debt obligations may be placed on non-accrual status and related interest income may be reduced by ceasing current accruals and writing off interest receivables when the collection of all or a portion of interest has become doubtful based on consistently applied procedures. A debt obligation is removed from non-accrual status when the issuer resumes interest payments or when collectability of interest is reasonably assured.
Class Allocations and Expenses. Investment income, realized and unrealized capital gains and losses, common expenses of the Fund, and certain fund-level expense reductions, if any, are allocated daily on a pro-rata basis to each class based on the relative net assets of each class to the total net assets of the Fund. Each class differs with respect to transfer agent fees incurred. Certain expense reductions may also differ by class. For the reporting period, the allocated portion of income and expenses to each class as a percent of its average net assets may vary due to the timing of recording these transactions in relation to fluctuating net assets of the classes. Expenses directly attributable to a fund are charged to that fund. Expenses attributable to more than one fund are allocated among the respective funds on the basis of relative net assets or other appropriate methods. Expense estimates are accrued in the period to which they relate and adjustments are made when actual amounts are known.
Income Tax Information and Distributions to Shareholders. Each year, the Fund intends to qualify as a regulated investment company under Subchapter M of the Internal Revenue Code, including distributing substantially all of its taxable income and realized gains. As a result, no provision for U.S. Federal income taxes is required. The Fund files a U.S. federal tax return, in addition to state and local tax returns as required. The Fund's federal income tax returns are subject to examination by the Internal Revenue Service (IRS) for a period of three fiscal years after they are filed. State and local tax returns may be subject to examination for an additional fiscal year depending on the jurisdiction.
Dividends are declared and recorded daily and paid monthly from net investment income. Distributions from realized gains, if any, are declared and recorded on the ex-dividend date. Income dividends and capital gain distributions are declared separately for each class. Income and capital gain distributions are determined in accordance with income tax regulations, which may differ from GAAP.
Capital accounts within the financial statements are adjusted for permanent book-tax differences. These adjustments have no impact on net assets or the results of operations. Capital accounts are not adjusted for temporary book-tax differences which will reverse in a subsequent period.
Book-tax differences are primarily due to market discount and losses deferred due to wash sales.
The Fund purchases municipal securities whose interest, in the opinion of the issuer, is free from federal income tax. There is no assurance that the IRS will agree with this opinion. In the event the IRS determines that the issuer does not comply with relevant tax requirements, interest payments from a security could become federally taxable, possibly retroactively to the date the security was issued.
The federal tax cost of investment securities and unrealized appreciation (depreciation) as of period end were as follows:
| Gross unrealized appreciation | $876,425 |
| Gross unrealized depreciation | (85,113) |
| Net unrealized appreciation (depreciation) on securities | $791,312 |
| Tax cost | $541,333,090 |
Delayed Delivery Transactions and When-Issued Securities. During the period, the Fund transacted in securities on a delayed delivery or when-issued basis. Payment and delivery may take place after the customary settlement period for that security. The price of the underlying securities and the date when the securities will be delivered and paid for are fixed at the time the transaction is negotiated. The securities purchased on a delayed delivery or when-issued basis are identified as such in the Fund's Schedule of Investments. The Fund may receive compensation for interest forgone in the purchase of a delayed delivery or when-issued security. With respect to purchase commitments, the Fund identifies securities as segregated in its records with a value at least equal to the amount of the commitment. Losses may arise due to changes in the value of the underlying securities or if the counterparty does not perform under the contract's terms, or if the issuer does not issue the securities due to political, economic, or other factors.
Restricted Securities. The Fund may invest in securities that are subject to legal or contractual restrictions on resale. These securities generally may be resold in transactions exempt from registration or to the public if the securities are registered. Disposal of these securities may involve time-consuming negotiations and expense, and prompt sale at an acceptable price may be difficult. Information regarding restricted securities is included at the end of the Fund's Schedule of Investments.
3. Purchases and Sales of Investments.
Purchases and sales of securities, other than short-term securities, aggregated $129,797,791 and $51,932,350, respectively.
4. Fees and Other Transactions with Affiliates.
Management Fee. Fidelity Management & Research Company (the investment adviser) and its affiliates provide the Fund with investment management related services for which the Fund pays a monthly management fee that is based on an annual rate of .30% of the Fund's average net assets. Under the management contract, the investment adviser pays all other fund-level expenses, except the compensation of the independent Trustees and certain other expenses such as interest expense, including commitment fees.
Transfer Agent Fees. Fidelity Investments Institutional Operations Company, Inc. (FIIOC), an affiliate of the investment adviser, is the transfer, dividend disbursing and shareholder servicing agent for the Fund. FIIOC receives asset-based fees of .10% and .05% of average net assets for Conservative Income Municipal Bond and Institutional Class, respectively. FIIOC pays for typesetting, printing and mailing of shareholder reports, except proxy statements. For the period, transfer agent fees for each class were as follows:
| | Amount |
| Conservative Income Municipal Bond | $41,494 |
| Institutional Class | 88,293 |
| | $129,787 |
Interfund Trades. The Fund may purchase from or sell securities to other Fidelity Funds under procedures adopted by the Board. The procedures have been designed to ensure these interfund trades are executed in accordance with Rule 17a-7 of the 1940 Act. Interfund trades are included within the respective purchases and sales amounts shown in the Purchases and Sales of Investments note.
5. Committed Line of Credit.
The Fund participates with other funds managed by the investment adviser or an affiliate in a $4.25 billion credit facility (the "line of credit") to be utilized for temporary or emergency purposes to fund shareholder redemptions or for other short-term liquidity purposes. The Fund has agreed to pay commitment fees on its pro-rata portion of the line of credit, which amounted to $338 and is reflected in Miscellaneous expenses on the Statement of Operations. During the period, the Fund did not borrow on this line of credit.
6. Expense Reductions.
The investment adviser contractually agreed to reimburse each class to the extent annual operating expenses exceeded certain levels of average net assets as noted in the table below. This reimbursement will remain in place through February 28, 2017. Some expenses, for example interest expense, including commitment fees, are excluded from this reimbursement.
The following classes were in reimbursement during the period:
| | Expense
Limitations | Reimbursement |
| Conservative Income Municipal Bond | .35% | $21,692 |
| Institutional Class | .25% | 179,746 |
| | | $201,438 |
In addition, through arrangements with the Fund's custodian, credits realized as a result of certain uninvested cash balances were used to reduce the Fund's expenses. During the period, these credits reduced the Fund's custody expenses by $79.
7. Distributions to Shareholders.
Distributions to shareholders of each class were as follows:
| | Six months ended
June 30, 2016 | Year ended December 31, 2015 |
| From net investment income | | |
| Conservative Income Municipal Bond | $215,420 | $167,696 |
| Institutional Class | 1,089,127 | 870,098 |
| Total | $1,304,547 | $1,037,794 |
| From net realized gain | | |
| Conservative Income Municipal Bond | $– | $7,215 |
| Institutional Class | – | 28,560 |
| Total | $– | $35,775 |
8. Share Transactions.
Share transactions for each class were as follows and may contain automatic conversions between classes or exchanges between affiliated funds:
| | Shares | Shares | Dollars | Dollars |
| | Six months ended
June 30, 2016 | Year ended December 31, 2015 | Six months ended
June 30, 2016 | Year ended December 31, 2015 |
| Conservative Income Municipal Bond | | | | |
| Shares sold | 4,924,542 | 5,228,688 | $49,495,393 | $52,487,644 |
| Reinvestment of distributions | 16,159 | 12,669 | 162,449 | 127,195 |
| Shares redeemed | (2,112,748) | (2,370,994) | (21,234,133) | (23,803,845) |
| Net increase (decrease) | 2,827,953 | 2,870,363 | $28,423,709 | $28,810,994 |
| Institutional Class | | | | |
| Shares sold | 22,151,759 | 26,484,896 | $222,617,524 | $265,900,155 |
| Reinvestment of distributions | 81,131 | 67,293 | 815,641 | 675,635 |
| Shares redeemed | (9,358,084) | (11,871,797) | (94,054,731) | (119,192,250) |
| Net increase (decrease) | 12,874,806 | 14,680,392 | $129,378,434 | $147,383,540 |
9. Other.
The Fund's organizational documents provide former and current trustees and officers with a limited indemnification against liabilities arising in connection with the performance of their duties to the Fund. In the normal course of business, the Fund may also enter into contracts that provide general indemnifications. The Fund's maximum exposure under these arrangements is unknown as this would be dependent on future claims that may be made against the Fund. The risk of material loss from such claims is considered remote.
Shareholder Expense Example
As a shareholder of the Fund, you incur two types of costs: (1) transaction costs, and (2) ongoing costs, including management fees and other Fund expenses. This Example is intended to help you understand your ongoing costs (in dollars) of investing in the Fund and to compare these costs with the ongoing costs of investing in other mutual funds.
The Example is based on an investment of $1,000 invested at the beginning of the period and held for the entire period (January 1, 2016 to June 30, 2016).
Actual Expenses
The first line of the accompanying table for each class of the Fund provides information about actual account values and actual expenses. You may use the information in this line, together with the amount you invested, to estimate the expenses that you paid over the period. Simply divide your account value by $1,000.00 (for example, an $8,600 account value divided by $1,000.00 = 8.6), then multiply the result by the number in the first line for a class of the Fund under the heading entitled "Expenses Paid During Period" to estimate the expenses you paid on your account during this period. A small balance maintenance fee of $12.00 that is charged once a year may apply for certain accounts with a value of less than $2,000. This fee is not included in the table below. If it was, the estimate of expenses you paid during the period would be higher, and your ending account value lower, by this amount.
Hypothetical Example for Comparison Purposes
The second line of the accompanying table for each class of the Fund provides information about hypothetical account values and hypothetical expenses based on a Class' actual expense ratio and an assumed rate of return of 5% per year before expenses, which is not the Class' actual return. The hypothetical account values and expenses may not be used to estimate the actual ending account balance or expenses you paid for the period. You may use this information to compare the ongoing costs of investing in the Fund and other funds. To do so, compare this 5% hypothetical example with the 5% hypothetical examples that appear in the shareholder reports of the other funds. A small balance maintenance fee of $12.00 that is charged once a year may apply for certain accounts with a value of less than $2,000. This fee is not included in the table below. If it was, the estimate of expenses you paid during the period would be higher, and your ending account value lower, by this amount.
Please note that the expenses shown in the table are meant to highlight your ongoing costs only and do not reflect any transaction costs. Therefore, the second line of the table is useful in comparing ongoing costs only, and will not help you determine the relative total costs of owning different funds.
| | Annualized Expense Ratio-A | Beginning
Account Value
January 1, 2016 | Ending
Account Value
June 30, 2016 | Expenses Paid
During Period-B
January 1, 2016
to June 30, 2016 |
| Conservative Income Municipal Bond | .35% | | | |
| Actual | | $1,000.00 | $1,004.60 | $1.74 |
| Hypothetical-C | | $1,000.00 | $1,023.12 | $1.76 |
| Institutional Class | .25% | | | |
| Actual | | $1,000.00 | $1,005.10 | $1.25 |
| Hypothetical-C | | $1,000.00 | $1,023.62 | $1.26 |
A Annualized expense ratio reflects expenses net of applicable fee waivers.
B Expenses are equal to each Class' annualized expense ratio, multiplied by the average account value over the period, multiplied by 182/366 (to reflect the one-half year period).
C 5% return per year before expenses
Corporate Headquarters
245 Summer St.
Boston, MA 02210
www.fidelity.com
CMB-SANN-0816
1.967795.102
Fidelity® Michigan Municipal Income Fund and
Fidelity® Michigan Municipal Money Market Fund
Semi-Annual Report June 30, 2016 |
|
Contents
To view a fund's proxy voting guidelines and proxy voting record for the 12-month period ended June 30, visit http://www.fidelity.com/proxyvotingresults or visit the Securities and Exchange Commission's (SEC) web site at http://www.sec.gov.
You may also call 1-800-544-8544 to request a free copy of the proxy voting guidelines.
Standard & Poor's, S&P and S&P 500 are registered service marks of The McGraw-Hill Companies, Inc. and have been licensed for use by Fidelity Distributors Corporation.
Other third-party marks appearing herein are the property of their respective owners.
All other marks appearing herein are registered or unregistered trademarks or service marks of FMR LLC or an affiliated company. © 2016 FMR LLC. All rights reserved.
This report and the financial statements contained herein are submitted for the general information of the shareholders of the Fund. This report is not authorized for distribution to prospective investors in the Fund unless preceded or accompanied by an effective prospectus.
A fund files its complete schedule of portfolio holdings with the SEC for the first and third quarters of each fiscal year on Form N-Q. Forms N-Q are available on the SEC’s web site at http://www.sec.gov. A fund's Forms N-Q may be reviewed and copied at the SEC’s Public Reference Room in Washington, DC. Information regarding the operation of the SEC's Public Reference Room may be obtained by calling 1-800-SEC-0330.
For a complete list of a fund's portfolio holdings, view the most recent holdings listing, semiannual report, or annual report on Fidelity's web site at http://www.fidelity.com, http://www.institutional.fidelity.com, or http://www.401k.com, as applicable.
NOT FDIC INSURED •MAY LOSE VALUE •NO BANK GUARANTEE
Neither the Fund nor Fidelity Distributors Corporation is a bank.
Fidelity® Michigan Municipal Income Fund
Investment Summary (Unaudited)
Top Five Sectors as of June 30, 2016
| | % of fund's net assets | % of fund's net assets 6 months ago |
| General Obligations | 34.4 | 36.1 |
| Health Care | 18.3 | 17.0 |
| Escrowed/Pre-Refunded | 12.0 | 13.8 |
| Education | 11.8 | 7.4 |
| Transportation | 7.2 | 5.7 |
Quality Diversification (% of fund's net assets)
| As of June 30, 2016 |
| | AAA | 4.0% |
| | AA,A | 80.9% |
| | BBB | 1.3% |
| | BB and Below | 0.4% |
| | Not Rated | 5.3% |
| | Short-Term Investments and Net Other Assets | 8.1% |
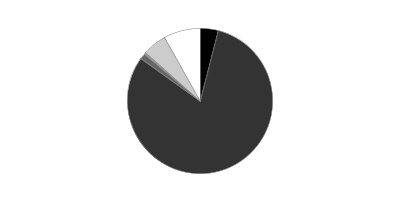
| As of December 31, 2015 |
| | AAA | 4.9% |
| | AA,A | 85.1% |
| | BBB | 1.1% |
| | BB and Below | 1.0% |
| | Not Rated | 5.5% |
| | Short-Term Investments and Net Other Assets | 2.4% |
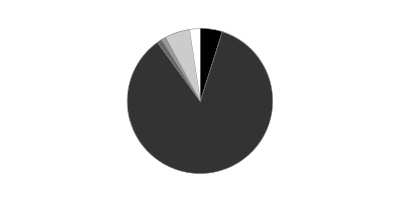
We have used ratings from Moody's Investors Service, Inc. Where Moody's® ratings are not available, we have used S&P® ratings. All ratings are as of the date indicated and do not reflect subsequent changes.
Fidelity® Michigan Municipal Income Fund
Investments June 30, 2016 (Unaudited)
Showing Percentage of Net Assets
| Municipal Bonds - 91.9% | | | |
| | | Principal Amount | Value |
| Guam - 0.8% | | | |
| Guam Ed. Fing. Foundation Ctfs. of Prtn.: | | | |
| (Guam Pub. School Facilities Proj.) Series 2006 A, 5% 10/1/16 | | $1,045,000 | $1,054,510 |
| Series 2006 A, 5% 10/1/23 | | 1,000,000 | 1,007,680 |
| Guam Int'l. Arpt. Auth. Rev. Series 2013 C: | | | |
| 5% 10/1/16 (a) | | 950,000 | 958,189 |
| 6.25% 10/1/34 (a) | | 1,000,000 | 1,234,570 |
| Guam Pwr. Auth. Rev. Series 2012 A, 5% 10/1/23 (FSA Insured) | | 1,175,000 | 1,412,115 |
|
| TOTAL GUAM | | | 5,667,064 |
|
| Michigan - 90.7% | | | |
| Algonac Cmnty. Schools Series 2008, 5.25% 5/1/28 (Pre-Refunded to 5/1/18 @ 100) | | 1,575,000 | 1,706,119 |
| Ann Arbor Econ. Dev. Corp. Ltd. Oblig. Rev. (Glacier Hills, Inc. Proj.) 8.375% 1/15/19 (Escrowed to Maturity) | | 1,053,000 | 1,168,030 |
| Battle Creek School District Series 2016: | | | |
| 5% 5/1/35 | | 2,240,000 | 2,707,488 |
| 5% 5/1/36 | | 1,500,000 | 1,807,275 |
| 5% 5/1/37 | | 1,175,000 | 1,412,315 |
| Bay City School District Rev.: | | | |
| 5% 11/1/25 | | 1,000,000 | 1,229,950 |
| 5% 11/1/26 | | 1,000,000 | 1,218,560 |
| 5% 11/1/27 | | 700,000 | 848,470 |
| 5% 11/1/28 | | 250,000 | 302,825 |
| Brandon School District Series 2016 A: | | | |
| 5% 5/1/28 | | 2,515,000 | 3,131,401 |
| 5% 5/1/29 | | 1,250,000 | 1,548,363 |
| 5% 5/1/30 | | 1,250,000 | 1,537,025 |
| Charter Township of Commerce Gen. Oblig. Series 2009 B, 5.125% 12/1/38 (Pre-Refunded to 12/1/18 @ 100) | | 970,000 | 1,072,578 |
| Chelsea School District Series 2008, 5% 5/1/18 (Nat'l. Pub. Fin. Guarantee Corp. Insured) | | 1,675,000 | 1,805,918 |
| Chippewa Valley Schools: | | | |
| Series 2016 A: | | | |
| 5% 5/1/32 | | 1,000,000 | 1,216,860 |
| 5% 5/1/33 | | 1,000,000 | 1,213,140 |
| 5% 5/1/34 | | 1,075,000 | 1,309,135 |
| 5% 5/1/35 | | 775,000 | 938,742 |
| Series 2016: | | | |
| 5% 5/1/25 (b) | | 1,420,000 | 1,788,604 |
| 5% 5/1/26 (b) | | 1,415,000 | 1,801,946 |
| 5% 5/1/27 (b) | | 555,000 | 701,698 |
| Clarkston Cmnty. Schools: | | | |
| Series 2016, 5% 5/1/29 | | 1,500,000 | 1,847,145 |
| 5% 5/1/28 | | 1,735,000 | 2,149,127 |
| Detroit City School District Series 2005 A, 5.25% 5/1/30 (FSA Insured) | | 5,000,000 | 6,563,850 |
| Detroit School District Series 2012 A, 5% 5/1/24 | | 5,000,000 | 5,865,050 |
| Detroit Swr. Disp. Rev.: | | | |
| Series 1998, 5.5% 7/1/17 (Nat'l. Pub. Fin. Guarantee Corp. Insured) | | 3,050,000 | 3,175,416 |
| Series 2001 E, 5.75% 7/1/31 (Berkshire Hathaway Assurance Corp. Insured) (FGIC Insured) | | 1,400,000 | 1,527,834 |
| Series 2006 B, 5% 7/1/36 (Nat'l. Pub. Fin. Guarantee Corp. Insured) | | 7,800,000 | 7,812,012 |
| Detroit Wtr. Supply Sys. Rev.: | | | |
| Series 2004 A, 5.25% 7/1/16 (Nat'l. Pub. Fin. Guarantee Corp. Insured) | | 1,000,000 | 1,000,000 |
| Series 2004, 5.25% 7/1/17 (Nat'l. Pub. Fin. Guarantee Corp. Insured) | | 2,000,000 | 2,005,500 |
| Series 2006 B, 7% 7/1/36 (FSA Insured) | | 2,700,000 | 3,158,865 |
| Series 2006, 5% 7/1/33 (FSA Insured) | | 5,000,000 | 5,016,300 |
| Detroit/Wayne Co. Stadium Auth. Series 2012: | | | |
| 5% 10/1/21 (FSA Insured) | | 1,000,000 | 1,149,480 |
| 5% 10/1/22 (FSA Insured) | | 1,000,000 | 1,166,740 |
| DeWitt Pub. Schools Gen. Oblig. Series 2008, 5% 5/1/17 (Nat'l. Pub. Fin. Guarantee Corp. Insured) | | 1,550,000 | 1,604,219 |
| Dexter Cmnty. Schools (School Bldg. and Site Proj.) Series 1998, 5.1% 5/1/18 (Nat'l. Pub. Fin. Guarantee Corp. Insured) | | 1,000,000 | 1,053,570 |
| Farmington Pub. School District Gen. Oblig.: | | | |
| 5% 5/1/25 (FSA Insured) | | 2,140,000 | 2,690,130 |
| 5% 5/1/26 (FSA Insured) | | 1,385,000 | 1,723,175 |
| 5% 5/1/27 (FSA Insured) | | 1,425,000 | 1,749,644 |
| Forest Hills Pub. Schools: | | | |
| 5% 5/1/18 | | 1,650,000 | 1,779,905 |
| 5% 5/1/19 | | 1,375,000 | 1,529,550 |
| 5% 5/1/20 | | 1,575,000 | 1,806,021 |
| 5% 5/1/21 | | 1,575,000 | 1,851,995 |
| Fraser Pub. School District Series 2006 B, 5% 5/1/29 | | 1,455,000 | 1,778,621 |
| Genesee County Gen. Oblig. Series 2005: | | | |
| 5% 5/1/17 (Nat'l. Pub. Fin. Guarantee Corp. Insured) | | 1,355,000 | 1,375,000 |
| 5% 5/1/18 (Nat'l. Pub. Fin. Guarantee Corp. Insured) | | 1,505,000 | 1,526,190 |
| Grand Blanc Cmnty. Schools Series 2013, 4% 5/1/24 | | 4,925,000 | 5,515,212 |
| Grand Rapids Cmnty. College Series 2008, 5% 5/1/19 (FSA Insured) | | 1,315,000 | 1,415,045 |
| Grand Rapids San. Swr. Sys. Rev.: | | | |
| Series 2012, 5% 1/1/37 | | 1,250,000 | 1,475,388 |
| Series 2014: | | | |
| 5% 1/1/27 | | 1,300,000 | 1,600,365 |
| 5% 1/1/29 | | 800,000 | 978,544 |
| 5% 1/1/30 | | 2,000,000 | 2,436,960 |
| Series 2016, 5% 1/1/37 | | 1,250,000 | 1,545,775 |
| Grand Traverse County Hosp.: | | | |
| Series 2011 A, 5.375% 7/1/35 | | 2,000,000 | 2,290,180 |
| Series 2014 A, 5% 7/1/47 | | 1,400,000 | 1,594,334 |
| Grand Valley Michigan State Univ. Rev.: | | | |
| Series 2007, 5% 12/1/19 (AMBAC Insured) | | 500,000 | 528,000 |
| Series 2008, 5% 12/1/33 (Pre-Refunded to 6/1/18 @ 100) | | 5,000,000 | 5,410,600 |
| Series 2014 B: | | | |
| 5% 12/1/25 | | 500,000 | 618,530 |
| 5% 12/1/26 | | 1,900,000 | 2,355,411 |
| 5% 12/1/28 | | 1,800,000 | 2,214,162 |
| Harper Creek Cmnty. School District (School Bldg. & Site Proj.) Series 2008: | | | |
| 4.75% 5/1/27 (FSA Insured) | | 500,000 | 531,560 |
| 5.25% 5/1/21 (FSA Insured) | | 2,000,000 | 2,153,600 |
| 5.25% 5/1/24 (FSA Insured) | | 2,100,000 | 2,260,881 |
| Hudsonville Pub. Schools: | | | |
| 4% 5/1/24 | | 1,220,000 | 1,398,242 |
| 4% 5/1/25 | | 500,000 | 572,705 |
| 5% 5/1/20 | | 1,000,000 | 1,143,040 |
| 5% 5/1/22 | | 600,000 | 717,336 |
| 5.25% 5/1/41 | | 1,750,000 | 1,995,333 |
| Ingham, Eaton and Clinton Counties Lansing School District 5% 5/1/22 | | 1,730,000 | 2,075,792 |
| Jackson County Hosp. Fin. Auth. Hosp. Rev. (Allegiance Health Proj.) Series 2010 A, 5% 6/1/37 (FSA Insured) | | 2,250,000 | 2,479,005 |
| Kalamazoo Pub. Schools 5% 5/1/17 (FSA Insured) | | 1,595,000 | 1,603,565 |
| Kent County Gen. Oblig. Series 2015: | | | |
| 5% 1/1/28 | | 4,655,000 | 5,893,556 |
| 5% 1/1/29 | | 4,390,000 | 5,542,199 |
| Kent Hosp. Fin. Auth. Hosp. Facilities Rev. (Spectrum Health Sys. Proj.) Series 2011 A, 5.5% 11/15/25 | | 5,000,000 | 6,083,450 |
| Kentwood Pub. Schools Series 2012: | | | |
| 4% 5/1/21 | | 1,000,000 | 1,123,730 |
| 4% 5/1/22 | | 1,000,000 | 1,140,000 |
| L'Anse Creuse Pub. Schools Series 2012: | | | |
| 5% 5/1/22 | | 1,500,000 | 1,750,020 |
| 5% 5/1/23 | | 1,500,000 | 1,746,975 |
| Lake Orion Cmnty. School District: | | | |
| 5% 5/1/23 | | 1,915,000 | 2,334,021 |
| 5% 5/1/25 | | 3,275,000 | 4,135,179 |
| Lansing Board of Wtr. & Lt. Util. Rev. 5.5% 7/1/41 | | 5,000,000 | 5,878,450 |
| Lansing Cmnty. College: | | | |
| 5% 5/1/23 | | 1,135,000 | 1,364,679 |
| 5% 5/1/25 | | 1,540,000 | 1,833,586 |
| Lapeer Cmnty. Schools Series 2007: | | | |
| 5% 5/1/19 (Pre-Refunded to 5/1/18 @ 100) | | 1,350,000 | 1,456,286 |
| 5% 5/1/20 (Pre-Refunded to 5/1/18 @ 100) | | 1,425,000 | 1,537,190 |
| 5% 5/1/22 (Pre-Refunded to 5/1/18 @ 100) | | 1,395,000 | 1,504,828 |
| Lenawee Co. Hosp. Fin. Auth. Hosp. Rev. (ProMedica Heathcare Oblig. Group Proj.) Series 2011 B, 6% 11/15/35 | | 3,030,000 | 3,725,930 |
| Lincoln Consolidated School District Series 2016 A: | | | |
| 5% 5/1/28 | | 2,025,000 | 2,481,111 |
| 5% 5/1/29 | | 1,430,000 | 1,743,699 |
| 5% 5/1/31 | | 500,000 | 605,800 |
| 5% 5/1/32 | | 1,000,000 | 1,206,770 |
| Marquette Board Lt. & Pwr. Elec. Util. Sys. Rev. Series 2016 A: | | | |
| 5% 7/1/29 | | 780,000 | 986,833 |
| 5% 7/1/30 | | 900,000 | 1,134,018 |
| 5% 7/1/31 | | 780,000 | 979,618 |
| 5% 7/1/32 | | 1,000,000 | 1,250,820 |
| 5% 7/1/33 | | 705,000 | 878,247 |
| Michigan Bldg. Auth. Rev.: | | | |
| (Facilities Prog.): | | | |
| Series 2015 1, 5% 10/15/50 | | 7,250,000 | 8,761,915 |
| Series 2015 I, 5% 4/15/29 | | 7,000,000 | 8,769,530 |
| Series 2009 I, 5.25% 10/15/25 (Assured Guaranty Corp. Insured) | | 2,000,000 | 2,246,960 |
| Series IA: | | | |
| 5.375% 10/15/41 | | 3,000,000 | 3,476,700 |
| 5.5% 10/15/45 | | 10,000,000 | 11,640,100 |
| 5% 4/15/33 | | 5,000,000 | 6,168,650 |
| 5% 4/15/38 | | 3,000,000 | 3,650,610 |
| 6% 10/15/38 | | 1,970,000 | 2,173,560 |
| 6% 10/15/38 (Pre-Refunded to 10/15/18 @ 100) | | 3,030,000 | 3,390,328 |
| Michigan Fin. Auth. Rev.: | | | |
| (Holland Cmnty. Hosp. Proj.) Series 2013 A: | | | |
| 5% 1/1/33 | | 1,250,000 | 1,440,888 |
| 5% 1/1/40 | | 3,000,000 | 3,408,030 |
| (Local Govt. Ln. Prog.) Series 2014 D, 5% 7/1/37 (FSA Insured) | | 1,000,000 | 1,175,220 |
| Series 2012 A: | | | |
| 4.125% 6/1/32 (Pre-Refunded to 6/1/22 @ 100) | | 3,000,000 | 3,507,900 |
| 5% 6/1/27 (Pre-Refunded to 6/1/22 @ 100) | | 125,000 | 152,388 |
| 5% 6/1/39 (Pre-Refunded to 6/1/22 @ 100) | | 12,790,000 | 15,592,289 |
| Series 2012 B, 5% 7/1/22 | | 2,600,000 | 2,610,738 |
| Series 2012: | | | |
| 5% 11/15/24 | | 660,000 | 800,917 |
| 5% 11/15/25 | | 1,000,000 | 1,208,110 |
| 5% 11/1/26 | | 6,425,000 | 7,677,425 |
| 5% 11/15/26 | | 800,000 | 961,120 |
| 5% 11/15/36 | | 6,200,000 | 7,244,700 |
| 5% 11/1/42 | | 2,000,000 | 2,300,620 |
| 5% 11/15/42 | | 4,500,000 | 5,226,300 |
| Series 2013: | | | |
| 5% 10/1/25 | | 1,255,000 | 1,521,361 |
| 5% 8/15/30 | | 4,105,000 | 4,896,157 |
| 5% 8/15/31 | | 2,310,000 | 2,746,798 |
| Series 2014 H1: | | | |
| 5% 10/1/22 | | 1,000,000 | 1,177,800 |
| 5% 10/1/25 | | 2,250,000 | 2,781,315 |
| 5% 10/1/39 | | 8,600,000 | 10,170,016 |
| Series 2014: | | | |
| 5% 6/1/25 | | 1,000,000 | 1,239,710 |
| 5% 6/1/26 | | 700,000 | 861,987 |
| 5% 6/1/27 | | 700,000 | 855,652 |
| Series 2015 C: | | | |
| 5% 7/1/26 | | 570,000 | 695,850 |
| 5% 7/1/27 | | 1,215,000 | 1,470,077 |
| 5% 7/1/28 | | 1,500,000 | 1,806,825 |
| 5% 7/1/35 | | 1,000,000 | 1,172,850 |
| Series 2015 D1: | | | |
| 5% 7/1/34 | | 1,250,000 | 1,485,713 |
| 5% 7/1/35 | | 500,000 | 592,530 |
| Series 2015: | | | |
| 5% 11/15/26 | | 2,250,000 | 2,803,680 |
| 5% 11/15/27 | | 3,500,000 | 4,322,815 |
| 5% 11/15/28 | | 1,835,000 | 2,258,059 |
| Series 2016 A, 5% 11/1/44 | | 6,000,000 | 7,162,860 |
| Series 2016, 5.25% 12/1/41 | | 4,000,000 | 5,003,400 |
| Series MI, 5.5% 12/1/28 | | 5,000,000 | 6,486,800 |
| 5% 12/1/27 | | 1,090,000 | 1,259,495 |
| 5% 12/1/27 (Pre-Refunded to 12/1/20 @ 100) | | 10,000 | 11,771 |
| Michigan Gen. Oblig. Series 2007, 5.25% 9/15/21 (FSA Insured) | | 5,000,000 | 5,244,300 |
| Michigan Hosp. Fin. Auth. Rev.: | | | |
| (Henry Ford Health Sys. Proj.): | | | |
| Series 2006 A, 5% 11/15/17 | | 1,000,000 | 1,015,900 |
| Series 2009, 5.25% 11/15/24 | | 3,000,000 | 3,418,950 |
| (McLaren Health Care Corp. Proj.): | | | |
| Series 2008 A, 5.75% 5/15/38 (Pre-Refunded to 5/15/18 @ 100) | | 6,890,000 | 7,525,809 |
| Series 2012 A, 5% 6/1/24 | | 2,765,000 | 3,318,332 |
| (MidMichigan Obligated Group Proj.) Series 2009 A, 6.125% 6/1/39 (Pre-Refunded to 6/1/19 @ 100) | | 3,740,000 | 4,305,600 |
| (Oakwood Hosp. Proj.) Series 2007, 5% 7/15/17 | | 1,000,000 | 1,041,320 |
| (Sparrow Hosp. Obligated Group Proj.) Series 2007, 5% 11/15/17 | | 535,000 | 565,891 |
| Bonds: | | | |
| Series 2010 F3, 1.4%, tender 6/29/18 (c) | | 6,200,000 | 6,266,836 |
| Series 2010 F4, 1.95%, tender 4/1/20 (c) | | 5,500,000 | 5,680,840 |
| Series 2008 A1, 6.5% 12/1/33 (Pre-Refunded to 12/1/18 @ 100) | | 3,965,000 | 4,503,804 |
| 5% 11/15/18 | | 500,000 | 528,660 |
| 5% 11/15/18 (Pre-Refunded to 11/15/17 @ 100) | | 1,225,000 | 1,296,246 |
| 5% 11/15/19 | | 290,000 | 307,029 |
| 5% 11/15/19 (Pre-Refunded to 11/15/17 @ 100) | | 710,000 | 751,294 |
| 5% 11/15/20 | | 575,000 | 609,494 |
| 5% 11/15/20 (Pre-Refunded to 11/15/17 @ 100) | | 1,425,000 | 1,507,878 |
| 5% 11/15/31 | | 1,450,000 | 1,533,723 |
| 5% 11/15/31 (Pre-Refunded to 11/15/17 @ 100) | | 3,550,000 | 3,756,468 |
| 6.5% 12/1/33 (Pre-Refunded to 12/1/18 @ 100) | | 870,000 | 988,224 |
| 6.5% 12/1/33 (Pre-Refunded to 12/1/18 @ 100) | | 165,000 | 187,379 |
| Michigan Muni. Bond Auth. Rev. Series 2005, 5% 10/1/23 | | 385,000 | 435,362 |
| Michigan State Univ. Revs. Series 2013 A, 5% 8/15/41 | | 1,125,000 | 1,369,204 |
| Michigan Strategic Fund Ltd. Oblig. Rev. (Cadillac Place Office Bldg. Proj.) Series 2011, 5.25% 10/15/26 | | 3,585,000 | 4,260,271 |
| Michigan Technological Univ. Series 2008, 5.25% 10/1/17 (Escrowed to Maturity) | | 1,875,000 | 1,982,681 |
| Michigan Trunk Line Fund Rev. Series 2011, 5% 11/15/36 | | 2,000,000 | 2,281,540 |
| North Kent Swr. Auth. Wtr. & Swr. Rev. Series 2006: | | | |
| 5% 11/1/19 (Pre-Refunded to 11/1/16 @ 100) | | 420,000 | 426,077 |
| 5% 11/1/20 (Pre-Refunded to 11/1/16 @ 100) | | 490,000 | 497,090 |
| Northview Pub. Schools District Series 2008, 5% 5/1/21 (FSA Insured) | | 1,070,000 | 1,147,361 |
| Oakland Univ. Rev.: | | | |
| Series 2012: | | | |
| 5% 3/1/24 | | 1,170,000 | 1,389,726 |
| 5% 3/1/25 | | 1,225,000 | 1,454,320 |
| 5% 3/1/26 | | 1,290,000 | 1,530,727 |
| 5% 3/1/37 | | 4,000,000 | 4,654,560 |
| Series 2013 A: | | | |
| 5% 3/1/25 | | 995,000 | 1,209,074 |
| 5% 3/1/26 | | 1,620,000 | 1,965,125 |
| 5% 3/1/27 | | 815,000 | 988,057 |
| 5% 3/1/38 | | 2,900,000 | 3,431,425 |
| Series 2014: | | | |
| 5% 3/1/28 | | 335,000 | 404,131 |
| 5% 3/1/29 | | 525,000 | 630,457 |
| 5% 3/1/39 | | 3,000,000 | 3,544,560 |
| Series 2016: | | | |
| 5% 3/1/41 | | 3,000,000 | 3,625,290 |
| 5% 3/1/47 | | 5,000,000 | 6,013,700 |
| Olivet Cmnty. School District (School Bldg. & Site Proj.) Series 2008: | | | |
| 5.25% 5/1/23 (FSA Insured) | | 1,010,000 | 1,091,396 |
| 5.25% 5/1/27 (FSA Insured) | | 1,135,000 | 1,218,105 |
| Plainwell Cmnty. School District (School Bldg. & Site Proj.) Series 2008: | | | |
| 5% 5/1/23 (Assured Guaranty Corp. Insured) | | 1,885,000 | 2,021,286 |
| 5% 5/1/28 (Assured Guaranty Corp. Insured) | | 1,000,000 | 1,067,800 |
| Plymouth-Canton Cmnty. School District Series 2008, 5% 5/1/20 (FSA Insured) | | 5,000,000 | 5,357,750 |
| Portage Pub. Schools: | | | |
| Series 2008, 5% 5/1/22 (Pre-Refunded to 5/1/18 @ 100) | | 4,300,000 | 4,638,539 |
| Series 2016: | | | |
| 5% 11/1/32 | | 2,500,000 | 3,090,200 |
| 5% 11/1/34 | | 1,250,000 | 1,537,688 |
| 5% 11/1/35 | | 1,300,000 | 1,594,086 |
| 5% 11/1/39 | | 755,000 | 918,420 |
| Ravenna Pub. Schools Gen. Oblig. (2008 School Bldg. and Site Proj.) Series 2008: | | | |
| 5% 5/1/31 (FSA Insured) | | 2,080,000 | 2,210,915 |
| 5% 5/1/38 (FSA Insured) | | 1,000,000 | 1,057,370 |
| Rochester Cmnty. School District: | | | |
| 4% 5/1/19 | | 1,375,000 | 1,490,583 |
| 5% 5/1/19 (Nat'l. Pub. Fin. Guarantee Corp. Insured) | | 1,475,000 | 1,611,143 |
| 5% 5/1/29 | | 1,625,000 | 2,037,864 |
| 5% 5/1/30 | | 1,700,000 | 2,121,668 |
| 5% 5/1/31 | | 1,500,000 | 1,866,045 |
| Rockford Pub. Schools Gen. Oblig. (2008 School Bldg. and Site Proj.) 5% 5/1/30 (Pre-Refunded to 5/1/18 @ 100) | | 3,975,000 | 4,287,952 |
| Roseville Cmnty. Schools: | | | |
| Series 2014: | | | |
| 5% 5/1/24 | | 780,000 | 966,412 |
| 5% 5/1/25 | | 1,000,000 | 1,257,070 |
| 5% 5/1/26 | | 1,385,000 | 1,723,175 |
| 5% 5/1/24 | | 570,000 | 706,224 |
| 5% 5/1/25 | | 1,640,000 | 2,061,595 |
| 5% 5/1/26 | | 1,715,000 | 2,133,752 |
| 5% 5/1/27 | | 1,795,000 | 2,212,050 |
| 5% 5/1/28 | | 1,885,000 | 2,326,373 |
| Royal Oak Hosp. Fin. Auth. Hosp. Rev.: | | | |
| (William Beaumont Hosp. Proj.) Series 2009 V: | | | |
| 8% 9/1/29 (Pre-Refunded to 9/1/18 @ 100) | | 1,945,000 | 2,249,179 |
| 8.25% 9/1/39 (Pre-Refunded to 9/1/18 @ 100) | | 3,425,000 | 3,978,925 |
| Series 2014 D: | | | |
| 5% 9/1/26 | | 1,000,000 | 1,225,390 |
| 5% 9/1/27 | | 1,175,000 | 1,430,469 |
| 5% 9/1/28 | | 1,870,000 | 2,264,720 |
| Saginaw Hosp. Fin. Auth. Hosp. Rev. (Covenant Med. Ctr., Inc.) Series 2010 H, 5% 7/1/30 | | 5,000,000 | 5,641,550 |
| Saint Clair County Gen. Oblig. 5% 4/1/26 | | 1,495,000 | 1,754,577 |
| Shepherd Pub. Schools Series 2008, 5% 5/1/17 (FSA Insured) | | 1,025,000 | 1,060,424 |
| South Haven Gen. Oblig. Series 2009, 5.125% 12/1/33 (Assured Guaranty Corp. Insured) | | 1,000,000 | 1,132,620 |
| South Lyon Cmnty. Schools Series 2016: | | | |
| 5% 5/1/23 | | 1,575,000 | 1,924,178 |
| 5% 5/1/24 | | 3,200,000 | 3,978,016 |
| 5% 5/1/25 | | 2,355,000 | 2,971,351 |
| Univ. of Michigan Rev. Series 2015, 5% 4/1/46 | | 5,000,000 | 6,250,600 |
| Warren Consolidated School District Series 2016: | | | |
| 5% 5/1/23 | | 810,000 | 968,728 |
| 5% 5/1/33 | | 5,410,000 | 6,507,851 |
| 5% 5/1/34 | | 5,630,000 | 6,750,933 |
| Wayne County Arpt. Auth. Rev.: | | | |
| (Detroit Metropolitan Wayne County Arpt. Proj.) Series 2012 A: | | | |
| 5% 12/1/24 | | 2,875,000 | 3,444,365 |
| 5% 12/1/25 | | 5,120,000 | 6,120,243 |
| Series 2011 A, 5% 12/1/21 (a) | | 5,000,000 | 5,775,550 |
| Series 2012 A: | | | |
| 5% 12/1/22 | | 2,220,000 | 2,670,083 |
| 5% 12/1/23 | | 2,300,000 | 2,767,866 |
| Series 2014 C: | | | |
| 5% 12/1/29 (a) | | 720,000 | 859,255 |
| 5% 12/1/31 (a) | | 860,000 | 1,013,450 |
| 5% 12/1/34 (a) | | 1,655,000 | 1,923,209 |
| Series 2015 F, 5% 12/1/27 (a) | | 4,810,000 | 5,852,471 |
| Series 2015 G: | | | |
| 5% 12/1/35 | | 5,435,000 | 6,607,819 |
| 5% 12/1/36 | | 5,760,000 | 6,981,350 |
| West Ottawa Pub. School District: | | | |
| Series 2012 A: | | | |
| 5% 5/1/25 | | 4,310,000 | 4,993,523 |
| 5% 5/1/26 | | 2,000,000 | 2,312,140 |
| Series 2014 1: | | | |
| 5% 5/1/30 | | 725,000 | 870,080 |
| 5% 5/1/32 | | 500,000 | 593,735 |
| 5% 5/1/34 | | 900,000 | 1,068,723 |
| 5% 5/1/35 | | 250,000 | 296,083 |
| Western Michigan Univ. Rev.: | | | |
| Series 2008, 5% 11/15/20 (Pre-Refunded to 5/15/18 @ 100) | | 5,280,000 | 5,699,443 |
| Series 2014: | | | |
| 5% 11/15/17 | | 45,000 | 47,598 |
| 5% 11/15/25 | | 320,000 | 396,883 |
| 5% 11/15/26 | | 400,000 | 494,360 |
| 5% 11/15/28 | | 650,000 | 792,682 |
| 5% 11/15/29 | | 750,000 | 910,793 |
| 5% 11/15/30 | | 855,000 | 1,034,670 |
| 5% 11/15/31 | | 700,000 | 843,542 |
| Series 2015 A: | | | |
| 5% 11/15/26 | | 1,000,000 | 1,248,850 |
| 5% 11/15/28 | | 2,505,000 | 3,098,485 |
| Woodhaven-Brownstown School District County of Wayne: | | | |
| 5% 5/1/36 | | 2,835,000 | 3,462,442 |
| 5% 5/1/38 | | 5,670,000 | 6,913,828 |
| Zeeland Pub. Schools: | | | |
| 5% 5/1/27 (FSA Insured) | | 1,000,000 | 1,220,630 |
| 5% 5/1/28 (FSA Insured) | | 500,000 | 607,635 |
| 5% 5/1/29 (FSA Insured) | | 1,000,000 | 1,209,060 |
| 5% 5/1/30 (FSA Insured) | | 1,000,000 | 1,204,640 |
|
| TOTAL MICHIGAN | | | 648,592,033 |
|
| Virgin Islands - 0.4% | | | |
| Virgin Islands Pub. Fin. Auth.: | | | |
| (Cruzan Proj.) Series 2009 A, 6% 10/1/39 | | 1,500,000 | 1,672,815 |
| Series 2009 B, 5% 10/1/25 | | 1,200,000 | 1,308,876 |
|
| TOTAL VIRGIN ISLANDS | | | 2,981,691 |
|
| TOTAL MUNICIPAL BONDS | | | |
| (Cost $608,740,464) | | | 657,240,788 |
|
| Municipal Notes - 5.8% | | | |
| Michigan - 5.8% | | | |
| Michigan Fin. Auth. Rev. Series 2016 E3, 0.45% 7/7/16, VRDN (c) | | 10,000,000 | $10,000,000 |
| Michigan Strategic Fund Ltd. Oblig. Rev. (Air Products and Chemicals, Inc. Proj.) Series 2007 V1, 0.4% 7/1/16, VRDN (c) | | 1,000,000 | 1,000,000 |
| Univ. of Michigan Rev. Series 2012 D2, 0.41% 7/7/16, VRDN (c) | | 30,915,000 | 30,914,987 |
|
| TOTAL MICHIGAN | | | 41,914,987 |
|
| TOTAL MUNICIPAL NOTES | | | |
| (Cost $41,915,007) | | | 41,914,987 |
| TOTAL INVESTMENT PORTFOLIO - 97.7% | | | |
| (Cost $650,655,471) | | | 699,155,775 |
| NET OTHER ASSETS (LIABILITIES) - 2.3% | | | 16,287,678 |
| NET ASSETS - 100% | | | $715,443,453 |
Security Type Abbreviations
VRDN – VARIABLE RATE DEMAND NOTE (A debt instrument that is payable upon demand, either daily, weekly or monthly)
Legend
(a) Private activity obligations whose interest is subject to the federal alternative minimum tax for individuals.
(b) Security or a portion of the security purchased on a delayed delivery or when-issued basis.
(c) Coupon rates for floating and adjustable rate securities reflect the rates in effect at period end.
Investment Valuation
All investments are categorized as Level 2 under the Fair Value Hierarchy. The inputs or methodology used for valuing securities may not be an indication of the risk associated with investing in those securities. For more information on valuation inputs please refer to the Investment Valuation section in the accompanying Notes to Financial Statements.
Other Information
The distribution of municipal securities by revenue source, as a percentage of total Net Assets, is as follows (Unaudited):
| General Obligations | 34.4% |
| Health Care | 18.3% |
| Escrowed/Pre-Refunded | 12.0% |
| Education | 11.8% |
| Transportation | 7.2% |
| Water & Sewer | 5.8% |
| Others* (Individually Less Than 5%) | 10.5% |
| | 100.0% |
* Includes net other assets
See accompanying notes which are an integral part of the financial statements.
Fidelity® Michigan Municipal Income Fund
Financial Statements
Statement of Assets and Liabilities
| | | June 30, 2016 (Unaudited) |
| Assets | | |
Investment in securities, at value — See accompanying schedule:
Unaffiliated issuers (cost $650,655,471) | | $699,155,775 |
| Cash | | 3,922,076 |
| Receivable for investments sold | | 10,714,411 |
| Receivable for fund shares sold | | 1,166,419 |
| Interest receivable | | 6,136,497 |
| Other receivables | | 1,233 |
| Total assets | | 721,096,411 |
| Liabilities | | |
| Payable for investments purchased on a delayed delivery basis | $4,050,579 | |
| Payable for fund shares redeemed | 751,554 | |
| Distributions payable | 549,186 | |
| Accrued management fee | 211,835 | |
| Other affiliated payables | 63,873 | |
| Other payables and accrued expenses | 25,931 | |
| Total liabilities | | 5,652,958 |
| Net Assets | | $715,443,453 |
| Net Assets consist of: | | |
| Paid in capital | | $663,728,078 |
| Undistributed net investment income | | 185,868 |
| Accumulated undistributed net realized gain (loss) on investments | | 3,029,203 |
| Net unrealized appreciation (depreciation) on investments | | 48,500,304 |
| Net Assets, for 56,297,771 shares outstanding | | $715,443,453 |
| Net Asset Value, offering price and redemption price per share ($715,443,453 ÷ 56,297,771 shares) | | $12.71 |
See accompanying notes which are an integral part of the financial statements.
Statement of Operations
| | | Six months ended June 30, 2016 (Unaudited) |
| Investment Income | | |
| Interest | | $11,529,314 |
| Expenses | | |
| Management fee | $1,219,585 | |
| Transfer agent fees | 292,358 | |
| Accounting fees and expenses | 78,476 | |
| Custodian fees and expenses | 2,661 | |
| Independent trustees' fees and expenses | 1,528 | |
| Registration fees | 21,398 | |
| Audit | 26,855 | |
| Legal | 430 | |
| Miscellaneous | 635 | |
| Total expenses before reductions | 1,643,926 | |
| Expense reductions | (3,923) | 1,640,003 |
| Net investment income (loss) | | 9,889,311 |
| Realized and Unrealized Gain (Loss) | | |
| Net realized gain (loss) on: | | |
| Investment securities: | | |
| Unaffiliated issuers | | 3,637,299 |
| Total net realized gain (loss) | | 3,637,299 |
| Change in net unrealized appreciation (depreciation) on investment securities | | 13,973,556 |
| Net gain (loss) | | 17,610,855 |
| Net increase (decrease) in net assets resulting from operations | | $27,500,166 |
See accompanying notes which are an integral part of the financial statements.
Statement of Changes in Net Assets
| | Six months ended June 30, 2016 (Unaudited) | Year ended December 31, 2015 |
| Increase (Decrease) in Net Assets | | |
| Operations | | |
| Net investment income (loss) | $9,889,311 | $18,652,068 |
| Net realized gain (loss) | 3,637,299 | 196,475 |
| Change in net unrealized appreciation (depreciation) | 13,973,556 | 2,430,258 |
| Net increase (decrease) in net assets resulting from operations | 27,500,166 | 21,278,801 |
| Distributions to shareholders from net investment income | (9,873,620) | (18,621,343) |
| Share transactions | | |
| Proceeds from sales of shares | 94,793,134 | 107,376,253 |
| Reinvestment of distributions | 6,476,274 | 12,034,426 |
| Cost of shares redeemed | (37,660,929) | (57,660,123) |
| Net increase (decrease) in net assets resulting from share transactions | 63,608,479 | 61,750,556 |
| Redemption fees | 2,808 | 1,745 |
| Total increase (decrease) in net assets | 81,237,833 | 64,409,759 |
| Net Assets | | |
| Beginning of period | 634,205,620 | 569,795,861 |
| End of period | $715,443,453 | $634,205,620 |
| Other Information | | |
| Undistributed net investment income end of period | $185,868 | $170,177 |
| Shares | | |
| Sold | 7,573,632 | 8,719,799 |
| Issued in reinvestment of distributions | 516,739 | 977,711 |
| Redeemed | (3,010,446) | (4,695,016) |
| Net increase (decrease) | 5,079,925 | 5,002,494 |
See accompanying notes which are an integral part of the financial statements.
Financial Highlights — Fidelity Michigan Municipal Income Fund
| | Six months ended (Unaudited) June 30, | Years ended December 31, | | | | |
| | 2016 | 2015 | 2014 | 2013 | 2012 | 2011 |
| Selected Per–Share Data | | | | | | |
| Net asset value, beginning of period | $12.38 | $12.33 | $11.70 | $12.54 | $12.24 | $11.66 |
| Income from Investment Operations | | | | | | |
| Net investment income (loss)A | .183 | .387 | .422 | .437 | .445 | .463 |
| Net realized and unrealized gain (loss) | .330 | .050 | .642 | (.777) | .303 | .586 |
| Total from investment operations | .513 | .437 | 1.064 | (.340) | .748 | 1.049 |
| Distributions from net investment income | (.183) | (.387) | (.421) | (.436) | (.444) | (.462) |
| Distributions from net realized gain | – | – | (.013) | (.064) | (.004) | (.007) |
| Total distributions | (.183) | (.387) | (.434) | (.500) | (.448) | (.469) |
| Redemption fees added to paid in capitalA,B | – | – | – | – | – | – |
| Net asset value, end of period | $12.71 | $12.38 | $12.33 | $11.70 | $12.54 | $12.24 |
| Total ReturnC,D | 4.17% | 3.61% | 9.23% | (2.75)% | 6.19% | 9.20% |
| Ratios to Average Net AssetsE | | | | | | |
| Expenses before reductions | .49%F | .49% | .48% | .48% | .49% | .49% |
| Expenses net of fee waivers, if any | .49%F | .49% | .48% | .48% | .49% | .49% |
| Expenses net of all reductions | .49%F | .49% | .48% | .48% | .48% | .49% |
| Net investment income (loss) | 2.94%F | 3.15% | 3.49% | 3.59% | 3.57% | 3.90% |
| Supplemental Data | | | | | | |
| Net assets, end of period (000 omitted) | $715,443 | $634,206 | $569,796 | $528,289 | $693,682 | $621,994 |
| Portfolio turnover rate | 25%F | 11% | 12% | 8% | 10% | 9% |
A Calculated based on average shares outstanding during the period.
B Amount represents less than $.0005 per share.
C Total returns for periods of less than one year are not annualized.
D Total returns would have been lower if certain expenses had not been reduced during the applicable periods shown.
E Expense ratios reflect operating expenses of the Fund. Expenses before reductions do not reflect amounts reimbursed by the investment adviser or reductions from expense offset arrangements and do not represent the amount paid by the Fund during periods when reimbursements or reductions occur. Expenses net of fee waivers reflect expenses after reimbursement by the investment adviser but prior to reductions from expense offset arrangements. Expenses net of all reductions represent the net expenses paid by the Fund.
F Annualized
See accompanying notes which are an integral part of the financial statements.
Fidelity® Michigan Municipal Money Market Fund
Investment Summary/Performance (Unaudited)
Effective Maturity Diversification
| Days | % of fund's investments 6/30/16 | % of fund's investments 12/31/15 | % of fund's investments 6/30/15 |
| 1 - 7 | 78.5 | 76.0 | 62.5 |
| 8 - 30 | 1.6 | 5.6 | 7.1 |
| 31 - 60 | 1.0 | 4.4 | 11.2 |
| 61 - 90 | 4.1 | 1.9 | 4.4 |
| 91 - 180 | 4.0 | 1.5 | 4.9 |
| > 180 | 10.8 | 10.6 | 9.9 |
Effective maturity is determined in accordance with the requirements of Rule 2a-7 under the Investment Company Act of 1940.
Asset Allocation (% of fund's net assets)
| As of June 30, 2016 |
| | Variable Rate Demand Notes (VRDNs) | 61.8% |
| | Tender Option Bond | 7.5% |
| | Other Municipal Security | 24.3% |
| | Investment Companies | 6.6% |
| | Net Other Assets (Liabilities)* | (0.2)% |

* Short-Term Investments and Net Other Assets (Liabilities) are not included in the pie chart
| As of December 31, 2015 |
| | Variable Rate Demand Notes (VRDNs) | 49.0% |
| | Tender Option Bond | 1.7% |
| | Other Municipal Security | 33.2% |
| | Investment Companies | 10.9% |
| | Net Other Assets (Liabilities) | 5.2% |

Current And Historical 7-Day Yields
| | 6/30/16 | 3/31/16 | 12/31/15 | 9/30/15 | 6/30/15 |
| Fidelity® Michigan Municipal Money Market Fund | 0.01% | 0.01% | 0.01% | 0.01% | 0.01% |
Yield refers to the income paid by the Fund over a given period. Yields for money market funds are usually for seven-day periods, as they are here, though they are expressed as annual percentage rates. Past performance is no guarantee of future results. Yield will vary and it's possible to lose money investing in the Fund. A portion of the Fund's expenses was reimbursed and/or waived. Absent such reimbursements and/or waivers the yield for the period ending June 30, 2016, the most recent period shown in the table, would have been -0.05%.
Fidelity® Michigan Municipal Money Market Fund
Investments June 30, 2016 (Unaudited)
Showing Percentage of Net Assets
| Variable Rate Demand Note - 61.8% | | | |
| | | Principal Amount | Value |
| Alabama - 0.1% | | | |
| Decatur Indl. Dev. Board Exempt Facilities Rev. (Nucor Steel Decatur LLC Proj.) Series 2003 A, 0.7% 7/7/16, VRDN (a)(b) | | $600,000 | $600,000 |
| Alaska - 0.3% | | | |
| Valdez Marine Term. Rev. (Phillips Trans. Alaska, Inc. Proj.) Series 1994 C, 0.56% 7/7/16, VRDN (b) | | 1,900,000 | 1,900,000 |
| Arkansas - 0.3% | | | |
| Osceola Solid Waste Disp. Rev. (Plum Point Energy Associates, LLC Proj.) Series 2006, 0.7% 7/7/16, LOC Royal Bank of Scotland PLC, VRDN (a)(b) | | 2,600,000 | 2,600,000 |
| Delaware - 0.0% | | | |
| Delaware Econ. Dev. Auth. Rev. (Delmarva Pwr. & Lt. Co. Proj.): | | | |
| Series 1994, 0.63% 7/1/16, VRDN (a)(b) | | 100,000 | 100,000 |
| Series 1999 A, 0.5% 7/7/16, VRDN (b) | | 200,000 | 200,000 |
| | | | 300,000 |
| Georgia - 0.6% | | | |
| Bartow County Dev. Auth. Poll. Cont. Rev. (Georgia Pwr. Co. Plant Bowen Proj.) First Series 2009, 0.52% 7/7/16, VRDN (b) | | 4,500,000 | 4,500,000 |
| Burke County Indl. Dev. Auth. Poll. Cont. Rev. (Georgia Pwr. Co. Plant Vogtle Proj.) Second Series 1995, 0.46% 7/1/16, VRDN (b) | | 400,000 | 400,000 |
| | | | 4,900,000 |
| Indiana - 0.0% | | | |
| Indiana Dev. Fin. Auth. Envir. Rev. (PSI Energy Proj.) Series 2003 B, 0.6% 7/7/16, VRDN (a)(b) | | 100,000 | 100,000 |
| Louisiana - 0.0% | | | |
| Saint James Parish Gen. Oblig. (Nucor Steel Louisiana LLC Proj.) Series 2010 A1, 0.65% 7/7/16, VRDN (b) | | 300,000 | 300,000 |
| Michigan - 58.4% | | | |
| Central Michigan Univ. Rev. Series 2008 A, 0.46% 7/7/16, LOC JPMorgan Chase Bank, VRDN (b) | | 13,400,000 | 13,400,000 |
| Grand Traverse County Hosp. Series 2011 B, 0.44% 7/7/16, LOC JPMorgan Chase Bank, VRDN (b) | | 19,825,000 | 19,825,000 |
| Grand Valley Michigan State Univ. Rev. Series 2008 B: | | | |
| 0.4% 7/7/16, LOC U.S. Bank NA, Cincinnati, VRDN (b) | | 1,955,000 | 1,955,000 |
| 0.4% 7/7/16, LOC U.S. Bank NA, Cincinnati, VRDN (b) | | 27,940,000 | 27,940,000 |
| Kent Hosp. Fin. Auth. Hosp. Facilities Rev. (Spectrum Health Sys. Proj.) Series 2008 C, 0.41% 7/7/16, LOC Bank of New York, New York, VRDN (b) | | 3,965,000 | 3,965,000 |
| Livonia Econ. Dev. Corp. (Madonna Univ. Proj.) Series 2009, 0.43% 7/7/16, LOC Fed. Home Ln. Bank Chicago, VRDN (b) | | 21,665,000 | 21,665,000 |
| Michigan Bldg. Auth. Rev.: | | | |
| Series 2007 1, 0.44% 7/7/16, LOC Citibank NA, VRDN (b) | | 27,070,000 | 27,070,000 |
| Series 2011 B, 0.44% 7/7/16, LOC Citibank NA, VRDN (b) | | 24,895,000 | 24,895,000 |
| Michigan Fin. Auth. Rev.: | | | |
| (Healthcare Equip. Ln. Prog.) Series 2015 C, 0.5% 7/7/16, LOC Fifth Third Bank, Cincinnati, VRDN (b) | | 1,500,000 | 1,500,000 |
| Series 22 A, 0.46% 7/7/16, LOC State Street Bank & Trust Co., Boston, VRDN (a)(b) | | 52,582,000 | 52,581,999 |
| Michigan Hosp. Fin. Auth. Rev.: | | | |
| (Trinity Health Sys. Proj.): | | | |
| Series 2005 E, 0.41% 7/7/16, VRDN (b) | | 14,000,000 | 14,000,000 |
| Series 2005 F, 0.4% 7/7/16, VRDN (b) | | 1,720,000 | 1,720,000 |
| Series B, 0.46% 7/7/16, LOC JPMorgan Chase Bank, VRDN (b) | | 18,025,000 | 18,025,000 |
| Michigan Hsg. Dev. Auth. Ltd.: | | | |
| (Sand Creek Apts., Phase I Proj.) Series 2007 A, 0.44% 7/7/16, LOC Citibank NA, VRDN (a)(b) | | 3,595,000 | 3,595,000 |
| (Sand Creek II Apts. Proj.) Series 2007 A, 0.44% 7/7/16, LOC Citibank NA, VRDN (a)(b) | | 5,345,000 | 5,345,000 |
| (Teal Run I Apts. Proj.) Series 2007 A, 0.44% 7/7/16, LOC Citibank NA, VRDN (a)(b) | | 6,180,000 | 6,180,000 |
| Michigan Hsg. Dev. Auth. Multi-family Hsg. Rev.: | | | |
| (Canton Club East Apts. Proj.) Series 1998 A, 0.47% 7/7/16, LOC Fannie Mae, VRDN (a)(b) | | 6,000,000 | 6,000,000 |
| (Hunt Club Apts. Proj.) 0.45% 7/7/16, LOC Fannie Mae, VRDN (a)(b) | | 5,865,000 | 5,865,000 |
| Michigan Hsg. Dev. Ltd. Oblig. Rev. (JAS Non-Profit Hsg. Corp. VI Proj.) Series 2000, 0.46% 7/7/16, LOC JPMorgan Chase Bank, VRDN (b) | | 10,200,000 | 10,200,000 |
| Michigan State Univ. Revs. Series 2000 A, 0.45% 7/7/16 (Liquidity Facility Northern Trust Co.), VRDN (b) | | 28,035,000 | 28,035,000 |
| Michigan Strategic Fund Indl. Dev. Rev. (Lapeer Industries, Inc. Proj.) Series 2007, 0.58% 7/7/16, LOC Bank of America NA, VRDN (a)(b) | | 695,000 | 695,000 |
| Michigan Strategic Fund Ltd. Oblig. Rev.: | | | |
| (Air Products and Chemicals, Inc. Proj.) Series 2007 V1, 0.4% 7/1/16, VRDN (b) | | 36,630,000 | 36,630,000 |
| (Consumers Energy Co. Proj.): | | | |
| 0.41% 7/7/16, LOC JPMorgan Chase Bank, VRDN (b) | | 30,500,000 | 30,500,000 |
| 0.43% 7/7/16, LOC JPMorgan Chase Bank, VRDN (a)(b) | | 1,900,000 | 1,900,000 |
| (Henry Ford Museum & Greenfield Village Proj.) Series 2002, 0.38% 7/1/16, LOC Comerica Bank, VRDN (b) | | 29,300,000 | 29,300,000 |
| (The Kroger Co. Recovery Zone Facilities Bond Proj.) Series 2010, 0.44% 7/7/16, LOC Bank of Tokyo-Mitsubishi UFJ Ltd., VRDN (b) | | 19,000,000 | 19,000,000 |
| (The YMCA of Greater Grand Rapids Proj.) Series 2010, 0.47% 7/7/16, LOC Comerica Bank, VRDN (b) | | 9,310,000 | 9,310,000 |
| Oakland County Econ. Dev. Corp. Ltd. Oblig. Rev. (Osmic, Inc. Proj.) Series 2001 A, 0.53% 7/7/16, LOC JPMorgan Chase Bank, VRDN (a)(b) | | 2,800,000 | 2,800,000 |
| Univ. of Michigan Rev. Series 2012 D2, 0.41% 7/7/16, VRDN (b) | | 29,110,000 | 29,110,000 |
| | | | 453,006,999 |
| Nebraska - 0.1% | | | |
| Stanton County Indl. Dev. Rev. (Nucor Corp. Proj.) Series 1996, 0.7% 7/7/16, VRDN (a)(b) | | 600,000 | 600,000 |
| Nevada - 0.1% | | | |
| Washoe County Gas Facilities Rev.: | | | |
| Series 2016 C, 0.63% 7/7/16, VRDN (a)(b) | | 200,000 | 200,000 |
| Series 2016 D, 0.64% 7/7/16, VRDN (a)(b) | | 200,000 | 200,000 |
| Series 2016 E, 0.65% 7/7/16, VRDN (a)(b) | | 200,000 | 200,000 |
| | | | 600,000 |
| New Jersey - 0.3% | | | |
| Salem County Poll. Cont. Fin. Auth. Rev. (Pub. Svc. Elec. and Gas Co. Proj.): | | | |
| Series 2003 B1, 0.55% 7/7/16, VRDN (b) | | 1,400,000 | 1,400,000 |
| Series 2012 A, 0.7% 7/7/16, VRDN (a)(b) | | 500,000 | 500,000 |
| | | | 1,900,000 |
| New York - 0.3% | | | |
| New York Hsg. Fin. Agcy. Rev. (125 West 31st Street Proj.) Series 2005 A, 0.49% 7/7/16, LOC Fannie Mae, VRDN (a)(b) | | 2,000,000 | 2,000,000 |
| Texas - 0.9% | | | |
| Port Arthur Navigation District Envir. Facilities Rev. (Motiva Enterprises LLC Proj.): | | | |
| Series 2001 A, 0.54% 7/1/16, VRDN (b) | | 900,000 | 900,000 |
| Series 2004, 0.71% 7/7/16, VRDN (a)(b) | | 400,000 | 400,000 |
| Series 2009 C, 0.54% 7/1/16, VRDN (b) | | 900,000 | 900,000 |
| Series 2010 B, 0.54% 7/1/16, VRDN (b) | | 1,085,000 | 1,085,000 |
| Series 2010 C, 0.54% 7/1/16, VRDN (b) | | 300,000 | 300,000 |
| Series 2010 D, 0.54% 7/1/16, VRDN (b) | | 3,625,000 | 3,625,000 |
| | | | 7,210,000 |
| Virginia - 0.2% | | | |
| Newport News Indl. Dev. Auth. (CNU Warwick LLC Student Apts. Proj.) 0.5% 7/7/16, LOC Bank of America NA, VRDN (b) | | 1,585,000 | 1,585,000 |
| West Virginia - 0.1% | | | |
| West Virginia Econ. Dev. Auth. Solid Waste Disp. Facilities Rev. (Appalachian Pwr. Co. - Amos Proj.) Series 2008 B, 0.72% 7/7/16, VRDN (a)(b) | | 600,000 | 600,000 |
| Wyoming - 0.1% | | | |
| Lincoln County Envir. (PacifiCorp Proj.) Series 1995, 0.51% 7/7/16, VRDN (a)(b) | | 600,000 | 600,000 |
| TOTAL VARIABLE RATE DEMAND NOTE | | | |
| (Cost $478,801,999) | | | 478,801,999 |
|
| Tender Option Bond - 7.5% | | | |
| California - 0.1% | | | |
| California Health Facilities Fing. Auth. Participating VRDN Series 16 XG 00 49, 0.56% 7/7/16 (Liquidity Facility Deutsche Bank AG New York Branch) (b)(c) | | 1,100,000 | 1,100,000 |
| Michigan - 7.4% | | | |
| JPMorgan Chase Participating VRDN Series Putters 5009, 0.39% 7/1/16 (Liquidity Facility JPMorgan Chase Bank) (b)(c) | | 8,200,000 | 8,200,000 |
| Michigan Fin. Auth. Rev. Participating VRDN: | | | |
| Series 15 XF0126, 0.44% 7/7/16 (Liquidity Facility JPMorgan Chase Bank) (b)(c) | | 10,000,000 | 10,000,000 |
| Series 16 XM0223, 0.42% 7/7/16 (Liquidity Facility Citibank NA) (b)(c) | | 6,210,000 | 6,210,000 |
| Series 16 ZM0166, 0.43% 7/7/16 (Liquidity Facility Royal Bank of Canada) (b)(c) | | 8,500,000 | 8,500,000 |
| Series RBC 2016 XM0132, 0.43% 7/7/16 (Liquidity Facility Royal Bank of Canada) (b)(c) | | 3,335,000 | 3,335,000 |
| Series RBC 2016 ZM0131, 0.43% 7/7/16 (Liquidity Facility Royal Bank of Canada) (b)(c) | | 1,665,000 | 1,665,000 |
| Michigan State Univ. Revs. Bonds Series WF 11 33 C, 0.61%, tender 9/8/16 (Liquidity Facility Wells Fargo Bank NA) (b)(c)(d) | | 7,610,000 | 7,610,000 |
| Univ. of Michigan Rev. Participating VRDN: | | | |
| Series 15 XF2199, 0.45% 7/7/16 (Liquidity Facility Morgan Stanley Bank, West Valley City Utah) (b)(c) | | 6,190,000 | 6,190,000 |
| Series 15 XF2205, 0.43% 7/7/16 (Liquidity Facility Citibank NA) (b)(c) | | 5,300,000 | 5,300,000 |
| | | | 57,010,000 |
| Nebraska - 0.0% | | | |
| Omaha Pub. Pwr. District Elec. Rev. Participating VRDN Series 16 XF1053, 0.59% 7/7/16 (Liquidity Facility Deutsche Bank AG New York Branch) (b)(c) | | 300,000 | 300,000 |
| TOTAL TENDER OPTION BOND | | | |
| (Cost $58,410,000) | | | 58,410,000 |
|
| Other Municipal Security - 24.3% | | | |
| Georgia - 0.7% | | | |
| Main Street Natural Gas, Inc. Georgia Gas Proj. Rev. Bonds: | | | |
| Series 2010 A1, 0.52%, tender 10/3/16 (Liquidity Facility Royal Bank of Canada) (b) | | 2,100,000 | 2,100,000 |
| Series 2010 A2, 0.49%, tender 10/3/16 (Liquidity Facility Royal Bank of Canada) (b) | | 3,585,000 | 3,585,000 |
| | | | 5,685,000 |
| Kentucky - 0.0% | | | |
| Jefferson County Poll. Cont. Rev. Bonds Series 2001 A, 0.8% tender 7/25/16, CP mode | | 300,000 | 300,000 |
| Massachusetts - 0.2% | | | |
| Massachusetts Indl. Fin. Agcy. Poll. Cont. Rev. Bonds: | | | |
| (New England Pwr. Co. Proj.): | | | |
| Series 1992, 0.86% tender 7/8/16, CP mode | | 300,000 | 300,000 |
| Series 1993 A, 0.86% tender 7/7/16, CP mode | | 900,000 | 900,000 |
| Series 93B, 0.9% tender 7/26/16, CP mode | | 500,000 | 500,000 |
| | | | 1,700,000 |
| Michigan - 22.8% | | | |
| Grand Valley Michigan State Univ. Rev. Bonds Series 2009, 5.625% 12/1/16 (Pre-Refunded to 12/1/16 @ 100) | | 1,180,000 | 1,204,861 |
| Ingham, Eaton and Clinton Counties Lansing School District Bonds Series 2016 I, 3% 5/1/17 | | 3,000,000 | 3,055,674 |
| Kent Hosp. Fin. Auth. Hosp. Facilities Rev. Bonds (Spectrum Health Sys. Proj.) Series 2015 A, 0.66%, tender 1/26/17 (b) | | 27,915,000 | 27,915,000 |
| Michigan Bldg. Auth. Rev.: | | | |
| Bonds (Facilities Prog.): | | | |
| Series 2009 I, 5% 10/15/16 | | 1,270,000 | 1,286,246 |
| Series 2013 1A, 5% 10/15/16 | | 8,880,000 | 8,996,474 |
| Series 7, 0.47% 7/7/16, LOC State Street Bank & Trust Co., Boston, LOC U.S. Bank NA, Cincinnati, CP | | 8,300,000 | 8,300,000 |
| Michigan Fin. Auth. Rev. Bonds: | | | |
| Series 2010 A, 5% 12/1/16 | | 1,595,000 | 1,623,956 |
| Series 2012 A, 5% 7/1/16 | | 4,725,000 | 4,725,000 |
| Series 2013 M1, 0.6%, tender 9/1/16 (b) | | 8,300,000 | 8,300,000 |
| Series 2015 MI, 5% 12/1/16 | | 3,465,000 | 3,531,143 |
| 5% 1/1/17 | | 8,275,000 | 8,459,444 |
| Michigan Gen. Oblig. Bonds Series 2002, 5.5% 12/1/16 | | 2,390,000 | 2,439,321 |
| Michigan Hosp. Fin. Auth. Rev. Bonds: | | | |
| (Ascension Health Sr. Cr. Group Proj.) Series 2010 F: | | | |
| 0.68%, tender 1/26/17 (b) | | 12,910,000 | 12,910,000 |
| 0.68%, tender 1/26/17 (b) | | 8,635,000 | 8,635,000 |
| 0.68%, tender 1/26/17 (b) | | 10,380,000 | 10,380,000 |
| (Trinity Health Sys. Proj.) 5% 12/1/16 (Pre-Refunded to 12/1/16 @ 100) | | 1,970,000 | 2,008,189 |
| 6% 12/1/16 | | 5,380,000 | 5,500,759 |
| Michigan Trunk Line Fund Rev. Bonds: | | | |
| Series 1998 A, 5.5% 11/1/16 | | 3,590,000 | 3,649,765 |
| Series 2006, 5% 11/1/16 | | 1,070,000 | 1,085,601 |
| Rochester Cmnty. School District Bonds 4% 5/1/17 (Michigan Gen. Oblig. Guaranteed) | | 4,560,000 | 4,685,621 |
| Univ. of Michigan Rev.: | | | |
| Bonds: | | | |
| Series 2009 B, 0.43% tender 7/1/16, CP mode | | 8,300,000 | 8,300,000 |
| 0.44% tender 7/18/16, CP mode | | 8,000,000 | 8,000,000 |
| Series K1: | | | |
| 0.45% 8/4/16, CP | | 7,900,000 | 7,900,000 |
| 0.48% 9/1/16, CP | | 8,000,000 | 8,000,000 |
| 0.49% 9/1/16, CP | | 7,900,000 | 7,900,000 |
| Series K2, 0.47% 3/21/17, CP | | 7,900,000 | 7,900,000 |
| | | | 176,692,054 |
| New Hampshire - 0.4% | | | |
| New Hampshire Bus. Fin. Auth. Poll. Cont. Rev. Bonds: | | | |
| (New England Pwr. Co. Proj.): | | | |
| Series 1990 A, 0.9% tender 7/8/16, CP mode (a) | | 200,000 | 200,000 |
| Series 1990 B, 0.85% tender 7/15/16, CP mode | | 600,000 | 600,000 |
| Series 1990 A, 0.9% tender 7/6/16, CP mode (a) | | 1,100,000 | 1,100,000 |
| Series A1, 0.95% tender 7/26/16, CP mode (a) | | 900,000 | 900,000 |
| | | | 2,800,000 |
| Virginia - 0.1% | | | |
| Halifax County Indl. Dev. Auth. Poll. Cont. Rev. Bonds 0.9% tender 7/26/16, CP mode (a) | | 700,000 | 700,000 |
| Prince William County Indl. Dev. Auth. Poll. Cont. Rev. Bonds (Elec. Pwr. Co. Proj.) 0.85% tender 7/26/16, CP mode | | 200,000 | 200,000 |
| | | | 900,000 |
| West Virginia - 0.1% | | | |
| Grant County Cmnty. Solid Waste Disp. Rev. Bonds (Virginia Elec. and Pwr. Co. Proj.) Series 1996, 0.9% tender 7/8/16, CP mode (a) | | 400,000 | 400,000 |
| TOTAL OTHER MUNICIPAL SECURITY | | | |
| (Cost $188,477,054) | | | 188,477,054 |
| | | Shares | Value |
|
| Investment Company - 6.6% | | | |
| Fidelity Municipal Cash Central Fund, 0.44% (e)(f) | | | |
| (Cost $51,267,000) | | 51,267,000 | 51,267,000 |
| TOTAL INVESTMENT PORTFOLIO - 100.2% | | | |
| (Cost $776,956,053) | | | 776,956,053 |
| NET OTHER ASSETS (LIABILITIES) - (0.2)% | | | (1,508,891) |
| NET ASSETS - 100% | | | $775,447,162 |
Security Type Abbreviations
VRDN – VARIABLE RATE DEMAND NOTE (A debt instrument that is payable upon demand, either daily, weekly or monthly)
CP – COMMERCIAL PAPER
The date shown for securities represents the date when principal payments must be paid, taking into account any call options exercised by the issuer and any permissible maturity shortening features other than interest rate resets.
Legend
(a) Private activity obligations whose interest is subject to the federal alternative minimum tax for individuals.
(b) Coupon rates for floating and adjustable rate securities reflect the rates in effect at period end.
(c) Provides evidence of ownership in one or more underlying municipal bonds.
(d) Restricted securities - Investment in securities not registered under the Securities Act of 1933 (excluding 144A issues). At the end of the period, the value of restricted securities (excluding 144A issues) amounted to $7,610,000 or 1.0% of net assets.
(e) Information in this report regarding holdings by state and security types does not reflect the holdings of the Fidelity Municipal Cash Central Fund.
(f) Affiliated fund that is available only to investment companies and other accounts managed by Fidelity Investments. The rate quoted is the annualized seven-day yield of the fund at period end. A complete unaudited listing of the fund's holdings as of its most recent quarter end is available upon request. In addition, each Fidelity Central Fund's financial statements are available on the SEC's website or upon request.
Additional information on each restricted holding is as follows:
| Security | Acquisition Date | Cost |
| Michigan State Univ. Revs. Bonds Series WF 11 33 C, 0.61%, tender 9/8/16 (Liquidity Facility Wells Fargo Bank NA) | 9/24/14 | $7,610,000 |
Affiliated Central Funds
Information regarding fiscal year to date income earned by the Fund from investments in Fidelity Central Funds is as follows:
| Fund | Income earned |
| Fidelity Municipal Cash Central Fund | $109,441 |
| Total | $109,441 |
Investment Valuation
All investments are categorized as Level 2 under the Fair Value Hierarchy. The inputs or methodology used for valuing securities may not be an indication of the risk associated with investing in those securities. For more information on valuation inputs please refer to the Investment Valuation section in the accompanying Notes to Financial Statements.
See accompanying notes which are an integral part of the financial statements.
Fidelity® Michigan Municipal Money Market Fund
Financial Statements
Statement of Assets and Liabilities
| | | June 30, 2016 (Unaudited) |
| Assets | | |
Investment in securities, at value — See accompanying schedule:
Unaffiliated issuers (cost $725,689,053) | $725,689,053 | |
| Fidelity Central Funds (cost $51,267,000) | 51,267,000 | |
| Total Investments (cost $776,956,053) | | $776,956,053 |
| Cash | | 122,635 |
| Receivable for investments sold | | 1,000,000 |
| Receivable for fund shares sold | | 2,765,273 |
| Interest receivable | | 881,217 |
| Distributions receivable from Fidelity Central Funds | | 28,011 |
| Other receivables | | 1,482 |
| Total assets | | 781,754,671 |
| Liabilities | | |
| Payable for investments purchased | $100,049 | |
| Payable for fund shares redeemed | 5,898,886 | |
| Distributions payable | 233 | |
| Accrued management fee | 242,535 | |
| Other affiliated payables | 45,813 | |
| Other payables and accrued expenses | 19,993 | |
| Total liabilities | | 6,307,509 |
| Net Assets | | $775,447,162 |
| Net Assets consist of: | | |
| Paid in capital | | $775,426,635 |
| Distributions in excess of net investment income | | (1,839) |
| Accumulated undistributed net realized gain (loss) on investments | | 22,366 |
| Net Assets, for 774,286,916 shares outstanding | | $775,447,162 |
| Net Asset Value, offering price and redemption price per share ($775,447,162 ÷ 774,286,916 shares) | | $1.00 |
See accompanying notes which are an integral part of the financial statements.
Statement of Operations
| | | Six months ended June 30, 2016 (Unaudited) |
| Investment Income | | |
| Interest | | $998,781 |
| Income from Fidelity Central Funds | | 109,441 |
| Total income | | 1,108,222 |
| Expenses | | |
| Management fee | $1,585,050 | |
| Transfer agent fees | 606,240 | |
| Accounting fees and expenses | 53,759 | |
| Custodian fees and expenses | 2,985 | |
| Independent trustees' fees and expenses | 2,073 | |
| Registration fees | 22,720 | |
| Audit | 19,636 | |
| Legal | 904 | |
| Miscellaneous | 19,613 | |
| Total expenses before reductions | 2,312,980 | |
| Expense reductions | (1,248,511) | 1,064,469 |
| Net investment income (loss) | | 43,753 |
| Realized and Unrealized Gain (Loss) | | |
| Net realized gain (loss) on: | | |
| Investment securities: | | |
| Unaffiliated issuers | 19,315 | |
| Total net realized gain (loss) | | 19,315 |
| Net increase in net assets resulting from operations | | $63,068 |
See accompanying notes which are an integral part of the financial statements.
Statement of Changes in Net Assets
| | Six months ended June 30, 2016 (Unaudited) | Year ended December 31, 2015 |
| Increase (Decrease) in Net Assets | | |
| Operations | | |
| Net investment income (loss) | $43,753 | $100,228 |
| Net realized gain (loss) | 19,315 | 3,904 |
| Net increase in net assets resulting from operations | 63,068 | 104,132 |
| Distributions to shareholders from net investment income | (43,731) | (100,222) |
| Share transactions at net asset value of $1.00 per share | | |
| Proceeds from sales of shares | 563,833,319 | 2,126,419,383 |
| Reinvestment of distributions | 41,909 | 95,842 |
| Cost of shares redeemed | (782,184,345) | (2,177,007,905) |
| Net increase (decrease) in net assets and shares resulting from share transactions | (218,309,117) | (50,492,680) |
| Total increase (decrease) in net assets | (218,289,780) | (50,488,770) |
| Net Assets | | |
| Beginning of period | 993,736,942 | 1,044,225,712 |
| End of period | $775,447,162 | $993,736,942 |
| Other Information | | |
| Distributions in excess of net investment income end of period | $(1,839) | $(1,861) |
See accompanying notes which are an integral part of the financial statements.
Financial Highlights — Fidelity Michigan Municipal Money Market Fund
| | Six months ended (Unaudited) June 30, | Years ended December 31, | | | | |
| | 2016 | 2015 | 2014 | 2013 | 2012 | 2011 |
| Selected Per–Share Data | | | | | | |
| Net asset value, beginning of period | $1.00 | $1.00 | $1.00 | $1.00 | $1.00 | $1.00 |
| Income from Investment Operations | | | | | | |
| Net investment income (loss)A | – | – | – | – | – | – |
| Net realized and unrealized gain (loss)A | – | – | – | – | – | – |
| Total from investment operationsA | – | – | – | – | – | – |
| Distributions from net investment incomeA | – | – | – | – | – | – |
| Distributions from net realized gain | – | – | – | –A | – | – |
| Total distributionsA | – | – | – | – | – | – |
| Net asset value, end of period | $1.00 | $1.00 | $1.00 | $1.00 | $1.00 | $1.00 |
| Total ReturnB,C | - % | .01% | .01% | .02% | .01% | .01% |
| Ratios to Average Net AssetsD,E | | | | | | |
| Expenses before reductions | .53%F | .53% | .53% | .54% | .55% | .55% |
| Expenses net of fee waivers, if any | .24%F | .06% | .07% | .11% | .19% | .22% |
| Expenses net of all reductions | .24%F | .06% | .07% | .11% | .19% | .22% |
| Net investment income (loss) | .01%F | .01% | .01% | .01% | .01% | .01% |
| Supplemental Data | | | | | | |
| Net assets, end of period (000 omitted) | $775,447 | $993,737 | $1,044,226 | $1,077,691 | $985,600 | $875,636 |
A Amount represents less than $.0005 per share.
B Total returns for periods of less than one year are not annualized.
C Total returns would have been lower if certain expenses had not been reduced during the applicable periods shown.
D Fees and expenses of any underlying Fidelity Central Funds are not included in the Fund's expense ratio. The Fund indirectly bears its proportionate share of the expenses of any underlying Fidelity Central Funds.
E Expense ratios reflect operating expenses of the Fund. Expenses before reductions do not reflect amounts reimbursed or waived or reductions from expense offset arrangements and do not represent the amount paid by the Fund during periods when reimbursements, waivers or reductions occur. Expenses net of fee waivers reflect expenses after reimbursement and waivers but prior to reductions from expense offset arrangements. Expenses net of all reductions represent the net expenses paid by the Fund.
F Annualized
See accompanying notes which are an integral part of the financial statements.
Notes to Financial Statements (Unaudited)
For the period ended June 30, 2016
1. Organization.
Fidelity Michigan Municipal Income Fund (the Income Fund) is a fund of Fidelity Municipal Trust. Fidelity Michigan Municipal Money Market Fund (the Money Market Fund) is a fund of Fidelity Municipal Trust II. Each Trust is registered under the Investment Company Act of 1940, as amended (the 1940 Act), as an open-end management investment company. Fidelity Municipal Trust and Fidelity Municipal Trust II (the Trusts) are organized as a Massachusetts business trust and a Delaware statutory trust, respectively. The Income Fund is a non-diversified fund. Each Fund is authorized to issue an unlimited number of shares. Share transactions on the Statement of Changes in Net Assets may contain exchanges between affiliated funds. Effective January 1, 2016 shares of the Money Market Fund are only available for purchase by retail shareholders. Each Fund may be affected by economic and political developments in the state of Michigan.
2. Investments in Fidelity Central Funds.
The Funds may invest in Fidelity Central Funds, which are open-end investment companies generally available only to other investment companies and accounts managed by the investment adviser and its affiliates. The Funds' Schedules of Investments list each of the Fidelity Central Funds held as of period end, if any, as an investment of each Fund, but does not include the underlying holdings of each Fidelity Central Fund. As an Investing Fund, each Fund indirectly bears its proportionate share of the expenses of the underlying Fidelity Central Funds.
The Money Market Central Funds seek preservation of capital and current income and are managed by Fidelity Investments Money Management, Inc. (FIMM), an affiliate of the investment adviser. Annualized expenses of the Money Market Central Funds as of their most recent shareholder report date are less than .005%.
A complete unaudited list of holdings for each Fidelity Central Fund is available upon request or at the Securities and Exchange Commission (the SEC) website at www.sec.gov. In addition, the financial statements of the Fidelity Central Funds are available on the SEC website or upon request.
3. Significant Accounting Policies.
The financial statements have been prepared in conformity with accounting principles generally accepted in the United States of America (GAAP), which require management to make certain estimates and assumptions at the date of the financial statements. Actual results could differ from those estimates. Subsequent events, if any, through the date that the financial statements were issued have been evaluated in the preparation of the financial statements. The following summarizes the significant accounting policies of the Funds:
Investment Valuation. Investments are valued as of 4:00 p.m. Eastern time on the last calendar day of the period. The Board of Trustees (the Board) has delegated the day to day responsibility for the valuation of the Income Fund's investments to the Fidelity Management & Research Company (FMR) Fair Value Committee (the Committee). In accordance with valuation policies and procedures approved by the Board, the Income Fund attempts to obtain prices from one or more third party pricing vendors or brokers to value its investments. When current market prices, quotations or currency exchange rates are not readily available or reliable, investments will be fair valued in good faith by the Committee, in accordance with procedures adopted by the Board. Factors used in determining fair value vary by investment type and may include market or investment specific events, changes in interest rates and credit quality. The frequency with which these procedures are used cannot be predicted and they may be utilized to a significant extent. The Committee oversees the Income Fund's valuation policies and procedures and reports to the Board on the Committee's activities and fair value determinations. The Board monitors the appropriateness of the procedures used in valuing the Income Fund's investments and ratifies the fair value determinations of the Committee.
Each Fund categorizes the inputs to valuation techniques used to value its investments into a disclosure hierarchy consisting of three levels as shown below:
- Level 1 – quoted prices in active markets for identical investments
- Level 2 – other significant observable inputs (including quoted prices for similar investments, interest rates, prepayment speeds, etc.)
- Level 3 – unobservable inputs (including the Fund's own assumptions based on the best information available)
Valuation techniques used to value each Fund's investments by major category are as follows:
For the Income Fund, debt securities, including restricted securities, are valued based on evaluated prices received from third party pricing vendors or from brokers who make markets in such securities. Municipal securities are valued by pricing vendors who utilize matrix pricing which considers yield or price of bonds of comparable quality, coupon, maturity and type or by broker-supplied prices. When independent prices are unavailable or unreliable, debt securities may be valued utilizing pricing methodologies which consider similar factors that would be used by third party pricing vendors. Debt securities are generally categorized as Level 2 in the hierarchy but may be Level 3 depending on the circumstances.
For the Money Market Fund, as permitted by compliance with certain conditions under Rule 2a-7 of the 1940 Act, securities are valued at amortized cost, which approximates fair value. The amortized cost of an instrument is determined by valuing it at its original cost and thereafter amortizing any discount or premium from its face value at a constant rate until maturity. Securities held by a money market fund are generally high quality and liquid; however, they are reflected as Level 2 because the inputs used to determine fair value are not quoted prices in an active market.
For the Income Fund, changes in valuation techniques may result in transfers in or out of an assigned level within the disclosure hierarchy.
Investment Transactions and Income. For financial reporting purposes, the Funds' investment holdings and net asset value (NAV) include trades executed through the end of the last business day of the period. The NAV per share for processing shareholder transactions is calculated as of the close of business of the New York Stock Exchange (NYSE), normally 4:00 p.m. Eastern time and includes trades executed through the end of the prior business day for the Income Fund and trades executed through the end of the current business day for the Money Market Fund. Gains and losses on securities sold are determined on the basis of identified cost. Income and capital gain distributions from Fidelity Central Funds, if any, are recorded on the ex-dividend date. Interest income is accrued as earned and includes coupon interest and amortization of premium and accretion of discount on debt securities as applicable. Debt obligations may be placed on non-accrual status and related interest income may be reduced by ceasing current accruals and writing off interest receivables when the collection of all or a portion of interest has become doubtful based on consistently applied procedures. A debt obligation is removed from non-accrual status when the issuer resumes interest payments or when collectability of interest is reasonably assured.
Expenses. Expenses directly attributable to a fund are charged to that fund. Expenses attributable to more than one fund are allocated among the respective funds on the basis of relative net assets or other appropriate methods. Expense estimates are accrued in the period to which they relate and adjustments are made when actual amounts are known.
Income Tax Information and Distributions to Shareholders. Each year, each Fund intends to qualify as a regulated investment company under Subchapter M of the Internal Revenue Code, including distributing substantially all of its taxable income and realized gains. As a result, no provision for U.S. Federal income taxes is required. Each Fund files a U.S. federal tax return, in addition to state and local tax returns as required. Each Fund's federal income tax returns are subject to examination by the Internal Revenue Service (IRS) for a period of three fiscal years after they are filed. State and local tax returns may be subject to examination for an additional fiscal year depending on the jurisdiction.
Dividends are declared and recorded daily and paid monthly from net investment income. Distributions from realized gains, if any, are declared and recorded on the ex-dividend date. Income and capital gain distributions are determined in accordance with income tax regulations, which may differ from GAAP.
Capital accounts within the financial statements are adjusted for permanent book-tax differences. These adjustments have no impact on net assets or the results of operations. Capital accounts are not adjusted for temporary book-tax differences which will reverse in a subsequent period.
Book-tax differences are primarily due to market discount, deferred trustees compensation and capital loss carryforwards.
The Funds purchase municipal securities whose interest, in the opinion of the issuer, is free from federal income tax. There is no assurance that the IRS will agree with this opinion. In the event the IRS determines that the issuer does not comply with relevant tax requirements, interest payments from a security could become federally taxable, possibly retroactively to the date the security was issued.
The federal tax cost of investment securities and unrealized appreciation (depreciation) as of period end were as follows for each Fund:
| | Tax cost | Gross unrealized appreciation | Gross unrealized depreciation | Net unrealized appreciation (depreciation) on securities |
| Fidelity Michigan Municipal Income Fund | $650,481,018 | $48,674,757 | $– | $48,674,757 |
| Fidelity Michigan Municipal Money Market Fund | 776,956,053 | – | – | – |
Capital loss carryforwards are only available to offset future capital gains of the Funds to the extent provided by regulations and may be limited. Under the Regulated Investment Company Modernization Act of 2010 (the Act), the Funds are permitted to carry forward capital losses incurred in taxable years beginning after December 22, 2010 for an unlimited period and such capital losses are required to be used prior to any losses that expire. The capital loss carryforward information presented below, including any applicable limitation, is estimated as of prior fiscal period end and is subject to adjustment.
| | No expiration | |
| | Short-term | Total capital loss carryforward |
| Fidelity Michigan Municipal Income Fund | $(608,096) | $(608,096) |
Short-Term Trading (Redemption) Fees. Shares held by investors in the Income Fund less than 30 days may be subject to a redemption fee equal to .50% of the NAV of shares redeemed. All redemption fees, which reduce the proceeds of the shareholder redemption, are retained by the Fund and accounted for as an addition to paid in capital.
Delayed Delivery Transactions and When-Issued Securities. During the period, certain Funds transacted in securities on a delayed delivery or when-issued basis. Payment and delivery may take place after the customary settlement period for that security. The price of the underlying securities and the date when the securities will be delivered and paid for are fixed at the time the transaction is negotiated. The securities purchased on a delayed delivery or when-issued basis are identified as such in each applicable Fund's Schedule of Investments. Certain Funds may receive compensation for interest forgone in the purchase of a delayed delivery or when-issued security. With respect to purchase commitments, each applicable Fund identifies securities as segregated in its records with a value at least equal to the amount of the commitment. Losses may arise due to changes in the value of the underlying securities or if the counterparty does not perform under the contract's terms, or if the issuer does not issue the securities due to political, economic, or other factors.
Restricted Securities. The Funds may invest in securities that are subject to legal or contractual restrictions on resale. These securities generally may be resold in transactions exempt from registration or to the public if the securities are registered. Disposal of these securities may involve time-consuming negotiations and expense, and prompt sale at an acceptable price may be difficult. Information regarding restricted securities is included at the end of each applicable Fund's Schedule of Investments.
4. Purchases and Sales of Investments.
Purchases and sales of securities, other than short-term securities, for the Income Fund aggregated $105,425,191 and $82,251,026, respectively.
5. Fees and Other Transactions with Affiliates.
Management Fee. Fidelity Management & Research Company (the investment adviser) and its affiliates provide the Funds with investment management related services for which the Funds pay a monthly management fee. The management fee is the sum of an individual fund fee rate and an annualized group fee rate. The individual fund fee rate is applied to each Fund's average net assets. The group fee rate is based upon the average net assets of all the mutual funds advised by the investment adviser, including any mutual funds previously advised by the investment adviser that are currently advised by Fidelity SelectCo, LLC, an affiliate of the investment adviser. The group fee rate decreases as assets under management increase and increases as assets under management decrease. For the reporting period, each Fund's annualized management fee rate expressed as a percentage of each Fund's average net assets was as follows.
| | Individual Rate | Group Rate | Total |
| Fidelity Michigan Municipal Income Fund | .25% | .11% | .36% |
| Fidelity Michigan Municipal Money Market Fund | .25% | .11% | .36% |
Transfer Agent Fees. Fidelity Investments Institutional Operations Company, Inc. (FIIOC), an affiliate of the investment adviser, is the transfer, dividend disbursing and shareholder servicing agent for the Funds. FIIOC receives account fees and asset-based fees that vary according to account size and type of account. FIIOC pays for typesetting, printing and mailing of shareholder reports, except proxy statements. For the period, the transfer agent fees were equivalent to the following annualized rates expressed as a percentage of average net assets:
| Fidelity Michigan Municipal Income Fund | .09% |
| Fidelity Michigan Municipal Money Market Fund | .14% |
Accounting Fees. Fidelity Service Company, Inc. (FSC), an affiliate of the investment adviser, maintains each Fund's accounting records. The fee is based on the level of average net assets for each month.
Interfund Trades. The Funds may purchase from or sell securities to other Fidelity Funds under procedures adopted by the Board. The procedures have been designed to ensure these interfund trades are executed in accordance with Rule 17a-7 of the 1940 Act. For the Income Fund, interfund trades are included within the respective purchases and sales amounts shown in the Purchases and Sales of Investments note.
6. Committed Line of Credit.
The Income Fund participates with other funds managed by the investment adviser or an affiliate in a $4.25 billion credit facility (the "line of credit") to be utilized for temporary or emergency purposes to fund shareholder redemptions or for other short-term liquidity purposes. The participating funds have agreed to pay commitment fees on their pro-rata portion of the line of credit, which are reflected in Miscellaneous expenses on the Statement of Operations, and are as follows:
| Fidelity Michigan Municipal Income Fund | $574 |
During the period, the Income Fund did not borrow on this line of credit.
7. Expense Reductions.
The investment adviser or its affiliates voluntarily agreed to waive certain fees for the Money Market Fund in order to maintain a minimum annualized yield of .01%. Such arrangements may be discontinued by the investment adviser at any time. For the period, the amount of the waiver was $1,243,514.
In addition, through arrangements with each applicable Fund's custodian, credits realized as a result of certain uninvested cash balances were used to reduce each applicable Fund's expenses. All of the applicable expense reductions are noted in the table below.
| | Custody
expense
reduction |
| Fidelity Michigan Municipal Income Fund | $2,661 |
| Fidelity Michigan Municipal Money Market Fund | 2,985 |
In addition, during the period the investment adviser reimbursed and/or waived a portion of operating expenses as follows:
| | Amount |
| Fidelity Michigan Municipal Income Fund | $1,262 |
| Fidelity Michigan Municipal Money Market Fund | $2,012 |
8. Other.
The Funds' organizational documents provide former and current trustees and officers with a limited indemnification against liabilities arising in connection with the performance of their duties to the Funds. In the normal course of business, the Funds may also enter into contracts that provide general indemnifications. The Funds' maximum exposure under these arrangements is unknown as this would be dependent on future claims that may be made against the Funds. The risk of material loss from such claims is considered remote.
Shareholder Expense Example
As a shareholder of a Fund, you incur two types of costs: (1) transaction costs, including redemption fees and (2) ongoing costs, including management fees and other Fund expenses. This Example is intended to help you understand your ongoing costs (in dollars) of investing in the Funds and to compare these costs with the ongoing costs of investing in other mutual funds.
The Example is based on an investment of $1,000 invested at the beginning of the period and held for the entire period (January 1, 2016 to June 30, 2016).
Actual Expenses
The first line of the accompanying table for each fund provides information about actual account values and actual expenses. You may use the information in this line, together with the amount you invested, to estimate the expenses that you paid over the period. Simply divide your account value by $1,000.00 (for example, an $8,600 account value divided by $1,000.00 = 8.6), then multiply the result by the number in the first line for a fund under the heading entitled "Expenses Paid During Period" to estimate the expenses you paid on your account during this period. A small balance maintenance fee of $12.00 that is charged once a year may apply for certain accounts with a value of less than $2,000. This fee is not included in the table below. If it was, the estimate of expenses you paid during the period would be higher, and your ending account value lower, by this amount. In addition, each Fund, as a shareholder in the underlying Fidelity Central Funds, will indirectly bear its pro-rata share of the fees and expenses incurred by the underlying Fidelity Central Funds. These fees and expenses are not included in the Fund's annualized expense ratio used to calculate the expense estimate in the table below.
Hypothetical Example for Comparison Purposes
The second line of the accompanying table for each fund provides information about hypothetical account values and hypothetical expenses based on a fund's actual expense ratio and an assumed rate of return of 5% per year before expenses, which is not the Fund's actual return. The hypothetical account values and expenses may not be used to estimate the actual ending account balance or expenses you paid for the period. You may use this information to compare the ongoing costs of investing in the Fund and other funds. To do so, compare this 5% hypothetical example with the 5% hypothetical examples that appear in the shareholder reports of the other funds. A small balance maintenance fee of $12.00 that is charged once a year may apply for certain accounts with a value of less than $2,000. This fee is not included in the table below. If it was, the estimate of expenses you paid during the period would be higher, and your ending account value lower, by this amount. In addition, each Fund, as a shareholder in the underlying Fidelity Central Funds, will indirectly bear its pro-rata share of the fees and expenses incurred by the underlying Fidelity Central Funds. These fees and expenses are not included in the Fund's annualized expense ratio used to calculate the expense estimate in the table below.
Please note that the expenses shown in the table are meant to highlight your ongoing costs only and do not reflect any transaction costs. Therefore, the second line of the table is useful in comparing ongoing costs only, and will not help you determine the relative total costs of owning different funds. In addition, if these transactional costs were included, your costs would have been higher.
| | Annualized Expense Ratio-A | Beginning
Account Value
January 1, 2016 | Ending
Account Value
June 30, 2016 | Expenses Paid
During Period-B
January 1, 2016
to June 30, 2016 |
| Fidelity Michigan Municipal Income Fund | .49% | | | |
| Actual | | $1,000.00 | $1,041.70 | $2.49 |
| Hypothetical-C | | $1,000.00 | $1,022.43 | $2.46 |
| Fidelity Michigan Municipal Money Market Fund | .24% | | | |
| Actual | | $1,000.00 | $1,000.05 | $1.19 |
| Hypothetical-C | | $1,000.00 | $1,023.67 | $1.21 |
A Annualized expense ratio reflects expenses net of applicable fee waivers.
B Expenses are equal to each Fund's annualized expense ratio, multiplied by the average account value over the period, multiplied by 182/366 (to reflect the one-half year period).
C 5% return per year before expenses
Proxy Voting Results
A special meeting of Fidelity® Michigan Municipal Money Market Fund's shareholders was held on February 12, 2016. The results of votes taken among shareholders on the proposal before them are reported below. Each vote reported represents one dollar of net asset value held on the record date for the meeting.
PROPOSAL 1
| To elect a Board of Trustees. |
| | # of
Votes | % of
Votes |
| Elizabeth S. Acton | | |
| Affirmative | 990,112,248.51 | 94.973 |
| Withheld | 52,412,467.62 | 5.027 |
| TOTAL | 1,042,524,716.13 | 100.000 |
| John Engler | | |
| Affirmative | 979,840,026.26 | 93.988 |
| Withheld | 62,684,689.87 | 6.012 |
| TOTAL | 1,042,524,716.13 | 100.000 |
| Albert R. Gamper, Jr. | | |
| Affirmative | 988,200,285.84 | 94.790 |
| Withheld | 54,324,430.29 | 5.210 |
| TOTAL | 1,042,524,716.13 | 100.000 |
| Robert F. Gartland | | |
| Affirmative | 990,287,516.81 | 94.990 |
| Withheld | 52,237,199.32 | 5.010 |
| TOTAL | 1,042,524,716.13 | 100.000 |
| Abigail P. Johnson | | |
| Affirmative | 986,818,518.63 | 94.657 |
| Withheld | 55,706,197.50 | 5.343 |
| TOTAL | 1,042,524,716.13 | 100.000 |
| Arthur E. Johnson | | |
| Affirmative | 988,490,870.48 | 94.818 |
| Withheld | 54,033,845.65 | 5.182 |
| TOTAL | 1,042,524,716.13 | 100.000 |
| Michael E. Kenneally | | |
| Affirmative | 990,615,595.60 | 95.021 |
| Withheld | 51,909,120.53 | 4.979 |
| TOTAL | 1,042,524,716.13 | 100.000 |
| James H. Keyes | | |
| Affirmative | 989,121,754.10 | 94.878 |
| Withheld | 53,402,962.03 | 5.122 |
| TOTAL | 1,042,524,716.13 | 100.000 |
| Marie L. Knowles | | |
| Affirmative | 987,633,370.10 | 94.735 |
| Withheld | 54,891,346.03 | 5.265 |
| TOTAL | 1,042,524,716.13 | 100.000 |
| Geoffrey A. von Kuhn | | |
| Affirmative | 987,164,185.38 | 94.690 |
| Withheld | 55,360,530.75 | 5.310 |
| TOTAL | 1,042,524,716.13 | 100.000 |
| Proposal 1 reflects trust wide proposal and voting results. |
Corporate Headquarters
245 Summer St.
Boston, MA 02210
www.fidelity.com
MIR-SANN-0816
1.705626.118
Fidelity Advisor® Limited Term Municipal Income Fund -
Class A, Class T, Class C and Class I
Semi-Annual Report June 30, 2016 Class A, Class T, Class C and Class I are classes of Fidelity® Limited Term Municipal Income Fund |
|
Contents
To view a fund's proxy voting guidelines and proxy voting record for the 12-month period ended June 30, visit http://www.fidelity.com/proxyvotingresults or visit the Securities and Exchange Commission's (SEC) web site at http://www.sec.gov.
You may also call 1-877-208-0098 to request a free copy of the proxy voting guidelines.
Standard & Poor's, S&P and S&P 500 are registered service marks of The McGraw-Hill Companies, Inc. and have been licensed for use by Fidelity Distributors Corporation.
Other third-party marks appearing herein are the property of their respective owners.
All other marks appearing herein are registered or unregistered trademarks or service marks of FMR LLC or an affiliated company. © 2016 FMR LLC. All rights reserved.
This report and the financial statements contained herein are submitted for the general information of the shareholders of the Fund. This report is not authorized for distribution to prospective investors in the Fund unless preceded or accompanied by an effective prospectus.
A fund files its complete schedule of portfolio holdings with the SEC for the first and third quarters of each fiscal year on Form N-Q. Forms N-Q are available on the SEC’s web site at http://www.sec.gov. A fund's Forms N-Q may be reviewed and copied at the SEC’s Public Reference Room in Washington, DC. Information regarding the operation of the SEC's Public Reference Room may be obtained by calling 1-800-SEC-0330.
For a complete list of a fund's portfolio holdings, view the most recent holdings listing, semiannual report, or annual report on Fidelity's web site at http://www.fidelity.com, http://www.institutional.fidelity.com, or http://www.401k.com, as applicable.
NOT FDIC INSURED •MAY LOSE VALUE •NO BANK GUARANTEE
Neither the Fund nor Fidelity Distributors Corporation is a bank.
Investment Summary (Unaudited)
Top Five States as of June 30, 2016
| | % of fund's net assets | % of fund's net assets 6 months ago |
| New York | 13.5 | 13.7 |
| Florida | 11.2 | 11.6 |
| Texas | 10.3 | 9.0 |
| Illinois | 8.6 | 8.6 |
| Pennsylvania | 6.2 | 5.2 |
Top Five Sectors as of June 30, 2016
| | % of fund's net assets | % of fund's net assets 6 months ago |
| General Obligations | 42.4 | 42.9 |
| Transportation | 11.8 | 9.4 |
| Special Tax | 10.0 | 11.2 |
| Electric Utilities | 9.1 | 10.1 |
| Health Care | 7.5 | 7.8 |
Quality Diversification (% of fund's net assets)
| As of June 30, 2016 |
| | AAA | 9.3% |
| | AA,A | 71.1% |
| | BBB | 8.5% |
| | BB and Below | 0.9% |
| | Not Rated | 2.0% |
| | Short-Term Investments and Net Other Assets | 8.2% |

| As of December 31, 2015 |
| | AAA | 9.9% |
| | AA,A | 71.2% |
| | BBB | 8.1% |
| | BB and Below | 1.0% |
| | Not Rated | 2.1% |
| | Short-Term Investments and Net Other Assets | 7.7% |

We have used ratings from Moody's Investors Service, Inc. Where Moody's® ratings are not available, we have used S&P® ratings. All ratings are as of the date indicated and do not reflect subsequent changes.
Investments June 30, 2016 (Unaudited)
Showing Percentage of Net Assets
| Municipal Bonds - 91.7% | | | |
| | | Principal Amount (000s) | Value (000s) |
| Alabama - 0.4% | | | |
| Mobile County Board of School Commissioners: | | | |
| Series 2016 A: | | $ | $ |
| 5% 3/1/22 | | 600 | 714 |
| 5% 3/1/23 | | 850 | 1,033 |
| 5% 3/1/24 | | 1,250 | 1,545 |
| 5% 3/1/25 | | 1,250 | 1,570 |
| Series 2016 B: | | | |
| 5% 3/1/22 | | 1,000 | 1,187 |
| 5% 3/1/24 | | 1,000 | 1,232 |
| 5% 3/1/25 | | 1,500 | 1,878 |
| Montgomery Med. Clinic Facilities: | | | |
| 5% 3/1/20 | | 2,890 | 3,234 |
| 5% 3/1/25 | | 1,500 | 1,785 |
|
| TOTAL ALABAMA | | | 14,178 |
|
| Alaska - 0.6% | | | |
| Anchorage Gen. Oblig.: | | | |
| Series A: | | | |
| 5% 9/1/20 | | 1,090 | 1,271 |
| 5% 9/1/22 | | 1,200 | 1,467 |
| Series B: | | | |
| 5% 9/1/18 | | 3,685 | 4,029 |
| 5% 9/1/20 | | 2,000 | 2,333 |
| 5% 9/1/22 | | 1,425 | 1,742 |
| Series C: | | | |
| 5% 9/1/18 | | 1,000 | 1,093 |
| 5% 9/1/19 | | 2,150 | 2,433 |
| 5% 9/1/20 | | 1,260 | 1,470 |
| 5% 9/1/22 | | 1,000 | 1,223 |
| Series D: | | | |
| 5% 9/1/19 | | 3,895 | 4,408 |
| 5% 9/1/20 | | 2,000 | 2,333 |
|
| TOTAL ALASKA | | | 23,802 |
|
| Arizona - 2.3% | | | |
| Arizona Ctfs. of Prtn. Series 2010 A, 5% 10/1/16 (FSA Insured) | | 13,000 | 13,138 |
| Arizona Health Facilities Auth. Rev. (Scottsdale Lincoln Hospitals Proj.) Series 2014 A: | | | |
| 5% 12/1/18 | | 500 | 548 |
| 5% 12/1/19 | | 615 | 696 |
| 5% 12/1/20 | | 820 | 954 |
| 5% 12/1/21 | | 1,105 | 1,317 |
| 5% 12/1/22 | | 800 | 974 |
| 5% 12/1/23 | | 1,000 | 1,242 |
| 5% 12/1/24 | | 1,500 | 1,898 |
| Arizona School Facilities Board Ctfs. of Prtn. Series 2008, 5.5% 9/1/16 | | 1,385 | 1,396 |
| Arizona Wtr. Infrastructure Fin. Auth. Rev. Series 2009 A: | | | |
| 5% 10/1/18 | | 1,000 | 1,097 |
| 5% 10/1/20 (Pre-Refunded to 10/1/19 @ 100) | | 5,180 | 5,879 |
| Glendale Gen. Oblig. Series 2015: | | | |
| 4% 7/1/19 (FSA Insured) | | 600 | 654 |
| 5% 7/1/22 (FSA Insured) | | 1,000 | 1,214 |
| Glendale Trans. Excise Tax Rev.: | | | |
| 5% 7/1/21 (FSA Insured) | | 750 | 891 |
| 5% 7/1/22 (FSA Insured) | | 1,170 | 1,420 |
| 5% 7/1/23 (FSA Insured) | | 1,395 | 1,732 |
| Maricopa County Mesa Unified School District # 4 Series 2016, 4% 7/1/18 | | 1,325 | 1,412 |
| Maricopa County School District #28 Kyrene Elementary Series 2010 B: | | | |
| 4% 7/1/19 | | 900 | 986 |
| 4% 7/1/20 | | 1,360 | 1,526 |
| Phoenix Civic Impt. Corp. Wtr. Sys. Rev. Series 2009 B, 5% 7/1/16 | | 5,090 | 5,090 |
| Phoenix Indl. Solid Waste Disp. Rev. Bonds (Republic Svc., Inc. Proj.) Series 2013, 0.9%, tender 8/1/16 (a)(b) | | 20,880 | 20,880 |
| Pima County Ctfs. of Prtn. Series 2014: | | | |
| 5% 12/1/21 | | 2,210 | 2,629 |
| 5% 12/1/22 | | 2,470 | 2,991 |
| 5% 12/1/23 | | 3,425 | 4,224 |
| Pima County Swr. Sys. Rev.: | | | |
| Series 2011 B, 5% 7/1/19 | | 3,225 | 3,625 |
| Series 2012 A: | | | |
| 5% 7/1/18 | | 825 | 895 |
| 5% 7/1/19 | | 1,550 | 1,742 |
| Salt River Proj. Agricultural Impt. & Pwr. District Elec. Sys. Rev. Series 2009 A, 5% 1/1/26 | | 500 | 551 |
| Univ. Med. Ctr. Corp. Hosp. Rev. Series 2011: | | | |
| 5% 7/1/16 (Escrowed to Maturity) | | 3,055 | 3,055 |
| 5% 7/1/17 (Escrowed to Maturity) | | 3,315 | 3,458 |
| 5% 7/1/18 (Escrowed to Maturity) | | 3,365 | 3,639 |
|
| TOTAL ARIZONA | | | 91,753 |
|
| California - 4.9% | | | |
| Alameda Corridor Trans. Auth. Rev.: | | | |
| Series 2004: | | | |
| 0% 10/1/19 | | 3,335 | 3,237 |
| 0% 10/1/19 | | 265 | 250 |
| Series 2013 A, 5% 10/1/22 | | 2,190 | 2,672 |
| Bay Area Toll Auth. San Francisco Bay Toll Bridge Rev. Bonds 1.5%, tender 4/2/18 (a) | | 5,200 | 5,254 |
| California Gen. Oblig.: | | | |
| Bonds 3%, tender 12/1/19 (a) | | 15,600 | 16,541 |
| 5% 9/1/20 | | 20,000 | 23,370 |
| California Health Facilities Fing. Auth. Rev. Bonds (Children's Hosp. of Orange County Proj.) Series 2012 A, 2.21%, tender 7/7/16 (a) | | 4,000 | 4,016 |
| California Pub. Works Board Lease Rev.: | | | |
| (Dept. of Corrections & Rehab. Proj.) Series 2011 C, 5% 10/1/18 | | 1,750 | 1,914 |
| (Riverside Campus Proj.) Series 2012 H, 5% 4/1/22 | | 1,000 | 1,212 |
| (Univ. Proj.) Series 2011 B: | | | |
| 5% 10/1/18 (Escrowed to Maturity) | | 2,740 | 3,009 |
| 5% 10/1/19 (Escrowed to Maturity) | | 1,490 | 1,696 |
| (Various Cap. Projs.): | | | |
| Series 2011 A: | | | |
| 5% 10/1/18 | | 6,475 | 7,082 |
| 5% 10/1/19 | | 5,000 | 5,657 |
| 5% 10/1/20 | | 2,525 | 2,946 |
| Series 2012 A, 5% 4/1/21 | | 1,000 | 1,182 |
| Series 2012 G, 5% 11/1/22 | | 1,250 | 1,535 |
| (Various Judicial Council Projects) Series 2011 D, 5% 12/1/19 | | 4,100 | 4,664 |
| Series 2009 J, 5% 11/1/17 | | 2,300 | 2,432 |
| Series 2010 A, 5% 3/1/17 | | 5,405 | 5,561 |
| California Statewide Cmntys. Dev. Auth. Rev. Bonds: | | | |
| Series 2002 C, 5%, tender 5/1/17 (a) | | 4,000 | 4,141 |
| Series 2009 E2, 5%, tender 5/1/17 (a) | | 2,050 | 2,122 |
| Golden State Tobacco Securitization Corp. Tobacco Settlement Rev. Series 2013 A, 4% 6/1/21 | | 3,500 | 3,972 |
| Los Angeles County Metropolitan Trans. Auth. Sales Tax Rev. Series 2013 A, 5% 7/1/19 | | 4,400 | 4,961 |
| Los Angeles County Pub. Works Fing. Auth. Lease Rev. Series 2010 A, 5% 8/1/17 | | 5,000 | 5,234 |
| Los Angeles Muni. Impt. Corp. Lease Rev. Series 2012 C: | | | |
| 4.625% 3/1/18 | | 1,500 | 1,597 |
| 5% 3/1/19 | | 2,935 | 3,251 |
| Los Angeles Unified School District Series 2006 F, 5% 7/1/30 (Pre-Refunded to 7/1/16 @ 100) | | 1,900 | 1,900 |
| Los Angeles Unified School District Ctfs. of Prtn. (Multiple Properties Proj.) Series 2010 A: | | | |
| 5% 12/1/16 | | 2,025 | 2,062 |
| 5% 12/1/17 | | 9,790 | 10,385 |
| Monterey County Pub. Impt. Corp. Ctfs. of Prtn. (Refing. Proj.) Series 2009, 5% 8/1/17 (FSA Insured) | | 2,130 | 2,226 |
| Northern California Pwr. Agcy. Rev. (Hydroelectric #1 Proj.) Series 2010 A, 5% 7/1/18 | | 2,000 | 2,167 |
| Northern California Transmission Agcy. Rev. (Ref. Calif Ore Proj.) Series 2009 A, 3.5% 5/1/17 | | 2,500 | 2,560 |
| Oakland Unified School District Alameda County Series 2013, 5.5% 8/1/23 | | 1,000 | 1,220 |
| Port of Oakland Rev. Series 2012 P, 5% 5/1/21 (b) | | 2,500 | 2,938 |
| Rancho Cucamonga Redev. Agcy. (Rancho Redev. Proj.): | | | |
| 5% 9/1/23 (FSA Insured) | | 1,350 | 1,687 |
| 5% 9/1/24 (FSA Insured) | | 2,300 | 2,932 |
| Riverside County Asset Leasing Rev. (Riverside Cap. Proj.) Series 2012 A: | | | |
| 4% 6/1/17 | | 1,750 | 1,802 |
| 5% 6/1/17 | | 3,700 | 3,844 |
| 5% 6/1/18 | | 6,470 | 6,990 |
| Sacramento Muni. Util. District Elec. Rev. Series 2011 X, 5% 8/15/21 | | 4,000 | 4,804 |
| San Bernardino County Ctfs. of Prtn. (Arrowhead Proj.) Series 2009 A: | | | |
| 5% 8/1/16 | | 5,450 | 5,470 |
| 5% 8/1/18 | | 8,000 | 8,582 |
| San Diego Cmnty. College District Series 2007, 0% 8/1/16 (FSA Insured) | | 1,160 | 1,159 |
| San Pablo Calif Redev. Agcy. Series 2014 A, 5% 6/15/24 (FSA Insured) | | 1,380 | 1,732 |
| State Ctr. Cmnty. College District Series 2007 A, 5% 8/1/26 (Pre-Refunded to 8/1/17 @ 100) | | 9,480 | 9,930 |
| Stockton Unified School District Gen. Oblig. 5% 7/1/18 (FSA Insured) | | 1,035 | 1,122 |
|
| TOTAL CALIFORNIA | | | 195,020 |
|
| Colorado - 0.5% | | | |
| Colorado Health Facilities Auth. Rev. Bonds Series 2008 D3, 5%, tender 11/12/21 (a) | | 5,285 | 6,161 |
| Colorado Reg'l. Trans. District Ctfs. of Prtn.: | | | |
| Series 2013 A, 5% 6/1/23 | | 4,500 | 5,513 |
| Series 2014 A, 5% 6/1/23 | | 3,860 | 4,729 |
| E-470 Pub. Hwy. Auth. Rev.: | | | |
| Series 2008 D1, 5.25% 9/1/16 (Nat'l. Pub. Fin. Guarantee Corp. Insured) | | 2,360 | 2,378 |
| Series 2015 A: | | | |
| 5% 9/1/19 | | 1,000 | 1,118 |
| 5% 9/1/20 | | 1,000 | 1,152 |
| Univ. of Colorado Enterprise Sys. Rev. Series 2009 A, 5% 6/1/17 | | 500 | 520 |
|
| TOTAL COLORADO | | | 21,571 |
|
| Connecticut - 2.7% | | | |
| Connecticut Gen. Oblig.: | | | |
| Series 2005 B, 5.25% 6/1/17 (AMBAC Insured) | | 1,985 | 2,068 |
| Series 2009 B, 5% 3/1/18 | | 3,470 | 3,707 |
| Series 2012 C, 5% 6/1/21 | | 23,420 | 27,401 |
| Series 2013 A, 0.75% 3/1/17 (a) | | 1,400 | 1,400 |
| Series 2014 C, 5% 12/15/16 | | 16,070 | 16,389 |
| Series 2015 E, 5% 8/1/17 | | 26,395 | 27,619 |
| Series 2016 A, 4% 3/15/18 | | 13,900 | 14,639 |
| Connecticut Health & Edl. Facilities Auth. Rev. Bonds (Ascension Health Cr. Group Proj.) Series 1998 B, 1.55%, tender 2/1/17 (a) | | 2,715 | 2,730 |
| Connecticut Hsg. Fin. Auth. Series 2013 B2, 4% 11/15/32 | | 6,380 | 6,883 |
| Connecticut Spl. Tax Oblig. Trans. Infrastructure Rev. Series 2011 A, 5% 12/1/18 | | 5,575 | 6,128 |
|
| TOTAL CONNECTICUT | | | 108,964 |
|
| Delaware, New Jersey - 0.1% | | | |
| Delaware River & Bay Auth. Rev. Series 2014 C: | | | |
| 5% 1/1/20 | | 2,500 | 2,836 |
| 5% 1/1/21 | | 2,000 | 2,324 |
|
| TOTAL DELAWARE, NEW JERSEY | | | 5,160 |
|
| District Of Columbia - 0.4% | | | |
| District of Columbia Univ. Rev. Bonds (Georgetown Univ. Proj.) Series 2001 B, 4.7%, tender 4/1/18 (a) | | 8,500 | 9,038 |
| Metropolitan Washington DC Arpts. Auth. Sys. Rev.: | | | |
| Series 2012 A, 5% 10/1/22 (b) | | 6,325 | 7,621 |
| Series 2014 A, 5% 10/1/23 (b) | | 445 | 546 |
|
| TOTAL DISTRICT OF COLUMBIA | | | 17,205 |
|
| Florida - 11.2% | | | |
| Brevard County School Board Ctfs. of Prtn.: | | | |
| Series 2014, 5% 7/1/21 | | 1,000 | 1,179 |
| Series 2015 C: | | | |
| 5% 7/1/21 | | 650 | 766 |
| 5% 7/1/22 | | 3,725 | 4,485 |
| 5% 7/1/23 | | 3,000 | 3,681 |
| Broward County Arpt. Sys. Rev.: | | | |
| Series 2012 Q1, 5% 10/1/21 | | 1,000 | 1,193 |
| Series A: | | | |
| 5% 10/1/22 (b) | | 3,000 | 3,591 |
| 5% 10/1/23 (b) | | 4,020 | 4,895 |
| Broward County School Board Ctfs. of Prtn.: | | | |
| Series 2012 A: | | | |
| 5% 7/1/19 | | 7,000 | 7,837 |
| 5% 7/1/20 | | 15,070 | 17,375 |
| Series 2015 A: | | | |
| 5% 7/1/19 | | 2,000 | 2,239 |
| 5% 7/1/20 | | 4,000 | 4,612 |
| 5% 7/1/21 | | 4,500 | 5,318 |
| 5% 7/1/22 | | 3,500 | 4,237 |
| 5% 7/1/23 | | 2,750 | 3,401 |
| 5% 7/1/24 | | 1,320 | 1,663 |
| Series 2015 B: | | | |
| 5% 7/1/19 | | 2,000 | 2,239 |
| 5% 7/1/20 | | 3,000 | 3,459 |
| 5% 7/1/21 | | 6,235 | 7,368 |
| 5% 7/1/22 | | 1,275 | 1,543 |
| 5% 7/1/23 | | 2,750 | 3,401 |
| 5% 7/1/24 | | 1,145 | 1,443 |
| Series A, 5.25% 7/1/17 (AMBAC Insured) | | 7,015 | 7,332 |
| Citizens Property Ins. Corp.: | | | |
| Series 2009 A1, 6% 6/1/17 | | 1,275 | 1,335 |
| Series 2010 A1, 5.25% 6/1/17 | | 4,125 | 4,291 |
| Series 2012 A1, 5% 6/1/17 | | 18,095 | 18,784 |
| Clearwater Wtr. and Swr. Rev. Series 2011: | | | |
| 4% 12/1/16 | | 1,265 | 1,283 |
| 5% 12/1/17 | | 1,685 | 1,789 |
| 5% 12/1/18 | | 685 | 751 |
| 5% 12/1/19 | | 1,820 | 2,062 |
| 5% 12/1/20 | | 1,000 | 1,165 |
| Collier County Indl. Dev. Auth. Healthcare Facilities Rev. (NCH Healthcare Sys. Proj.) Series 2011: | | | |
| 5% 10/1/16 | | 1,530 | 1,546 |
| 5% 10/1/17 | | 1,455 | 1,531 |
| Florida Board of Ed. Lottery Rev. Series 2011 A, 5% 7/1/20 | | 8,600 | 9,959 |
| Florida Board of Ed. Pub. Ed. Cap. Outlay Series 2009 C, 5% 6/1/20 | | 3,625 | 4,103 |
| Florida Dept. of Envir. Protection Rev. Series 2012 A, 5% 7/1/19 | | 15,800 | 17,729 |
| Florida Dev. Fin. Corp. Healthcare Facility Rev. (Univ. Health Proj.) Series 2013 A: | | | |
| 5% 2/1/17 | | 700 | 713 |
| 5% 2/1/18 | | 1,790 | 1,871 |
| 5% 2/1/19 | | 1,450 | 1,549 |
| 5% 2/1/20 | | 2,025 | 2,201 |
| Florida Gen. Oblig. Series 2015 A, 4% 7/1/17 | | 17,295 | 17,888 |
| Florida Mid-Bay Bridge Auth. Rev. Series 2015 A: | | | |
| 5% 10/1/21 | | 1,030 | 1,200 |
| 5% 10/1/22 | | 2,000 | 2,377 |
| 5% 10/1/23 | | 1,270 | 1,526 |
| 5% 10/1/24 | | 2,000 | 2,433 |
| 5% 10/1/25 | | 1,750 | 2,144 |
| 5% 10/1/26 | | 2,000 | 2,434 |
| Florida Muni. Pwr. Agcy. Rev. (Stanton II Proj.) Series 2012 A, 5% 10/1/18 | | 2,850 | 3,117 |
| Greater Orlando Aviation Auth. Arpt. Facilities Rev. Series 2011 C: | | | |
| 5% 10/1/19 | | 1,705 | 1,923 |
| 5% 10/1/20 | | 1,000 | 1,163 |
| Halifax Hosp. Med. Ctr. Rev. 5% 6/1/23 | | 1,325 | 1,603 |
| Hillsborough County School Board Ctfs. of Prtn. Series 2015 A, 4% 7/1/17 | | 1,500 | 1,550 |
| Indian River County School Board Ctfs. of Prtn. Series 2014: | | | |
| 5% 7/1/20 | | 935 | 1,079 |
| 5% 7/1/22 | | 2,000 | 2,418 |
| 5% 7/1/23 | | 2,000 | 2,466 |
| Indian River County Wtr. & Swr. Rev. 5% 9/1/17 | | 1,000 | 1,051 |
| JEA Wtr. & Swr. Sys. Rev. Series 2010 D, 5% 10/1/21 | | 1,945 | 2,241 |
| Manatee County Rev. Series 2013: | | | |
| 5% 10/1/19 | | 1,250 | 1,415 |
| 5% 10/1/20 | | 2,000 | 2,332 |
| 5% 10/1/21 | | 2,000 | 2,389 |
| 5% 10/1/22 | | 1,000 | 1,224 |
| Miami-Dade County Expressway Auth.: | | | |
| (Waste Mgmt., Inc. of Florida Proj.): | | | |
| Series 2013, 5% 7/1/19 | | 2,000 | 2,240 |
| 5% 7/1/20 | | 1,000 | 1,155 |
| 5% 7/1/21 | | 2,000 | 2,370 |
| 5% 7/1/22 | | 2,000 | 2,429 |
| 5% 7/1/23 | | 2,000 | 2,430 |
| Series 2014 A, 5% 7/1/24 | | 625 | 787 |
| Series 2014 B: | | | |
| 5% 7/1/22 | | 1,500 | 1,822 |
| 5% 7/1/23 | | 3,250 | 4,021 |
| Miami-Dade County Gen. Oblig. (Parks Prog.) Series 2015 A, 5% 11/1/22 | | 3,880 | 4,751 |
| Miami-Dade County School Board Ctfs. of Prtn.: | | | |
| Series 2014 D: | | | |
| 5% 11/1/20 | | 4,875 | 5,677 |
| 5% 11/1/21 | | 6,275 | 7,493 |
| 5% 11/1/22 | | 2,915 | 3,561 |
| 5% 11/1/23 | | 7,650 | 9,584 |
| Series 2015 A: | | | |
| 5% 5/1/19 | | 1,000 | 1,113 |
| 5% 5/1/20 | | 2,095 | 2,405 |
| 5% 5/1/21 | | 4,000 | 4,720 |
| 5% 5/1/22 | | 3,720 | 4,496 |
| 5% 5/1/23 | | 6,500 | 8,064 |
| Series 2015 B, 5% 5/1/24 | | 29,560 | 36,968 |
| Series 2015 D, 5% 2/1/24 | | 14,945 | 18,614 |
| Series 2016 A, 5% 8/1/27 | | 5,560 | 7,121 |
| Miami-Dade County School District Series 2015, 5% 3/15/17 | | 3,225 | 3,322 |
| Miami-Dade County Transit Sales Surtax Rev. Series 2012, 5% 7/1/19 | | 1,250 | 1,399 |
| Orange County Health Facilities Auth.: | | | |
| (Orlando Health, Inc.) Series 2009, 5% 10/1/16 | | 1,325 | 1,339 |
| Series 2009, 5.25% 10/1/19 | | 1,245 | 1,413 |
| Orange County School Board Ctfs. of Prtn. Series 2015 C, 5% 8/1/18 | | 1,500 | 1,629 |
| Orlando & Orange County Expressway Auth. Rev. Series 2012, 5% 7/1/19 | | 1,000 | 1,121 |
| Orlando Utils. Commission Util. Sys. Rev.: | | | |
| Series 2009 C, 5% 10/1/17 | | 1,500 | 1,582 |
| Series 2010 C, 5% 10/1/17 | | 1,895 | 1,999 |
| Series 2011 B: | | | |
| 5% 10/1/18 | | 2,250 | 2,464 |
| 5% 10/1/19 | | 2,325 | 2,636 |
| Palm Beach County Health Facilities Auth. Hosp. Rev. Series 2014: | | | |
| 4% 12/1/19 | | 1,000 | 1,079 |
| 5% 12/1/20 | | 880 | 998 |
| 5% 12/1/21 | | 1,100 | 1,271 |
| Palm Beach County School Board Ctfs. of Prtn.: | | | |
| Series 2014 B: | | | |
| 4% 8/1/19 | | 4,000 | 4,357 |
| 4% 8/1/21 | | 4,040 | 4,569 |
| 5% 8/1/17 | | 1,170 | 1,224 |
| 5% 8/1/19 | | 3,000 | 3,358 |
| 5% 8/1/21 | | 5,300 | 6,253 |
| Series 2015 B: | | | |
| 5% 8/1/19 | | 2,735 | 3,061 |
| 5% 8/1/20 | | 1,750 | 2,016 |
| Pasco County School District Sales Tax Rev. Series 2013: | | | |
| 5% 10/1/18 | | 1,250 | 1,366 |
| 5% 10/1/19 | | 1,100 | 1,242 |
| 5% 10/1/20 | | 1,000 | 1,162 |
| 5% 10/1/21 | | 1,000 | 1,190 |
| 5% 10/1/22 | | 1,000 | 1,222 |
| Pasco County Solid Waste Disp. & Resource Recovery Sys. Rev.: | | | |
| Series 2011: | | | |
| 5% 10/1/17 (b) | | 4,465 | 4,696 |
| 5% 10/1/19 (b) | | 2,025 | 2,273 |
| 5% 10/1/18 (b) | | 2,745 | 2,985 |
| Tallahassee Health Facilities Rev. (Tallahassee Memorial Healthcare, Inc. Proj.) Series 2016 A, 5% 12/1/21 | | 1,000 | 1,170 |
| Tampa Bay Wtr. Reg'l. Wtr. Supply Auth. Util. Sys. Rev.: | | | |
| Series 2011 B: | | | |
| 5% 10/1/18 (Escrowed to Maturity) | | 2,440 | 2,671 |
| 5% 10/1/18 (Escrowed to Maturity) | | 2,260 | 2,477 |
| Series 2011, 5% 10/1/19 | | 5,590 | 6,339 |
| Tampa Health Sys. Rev. (Baycare Health Sys. Proj.) Series 2010: | | | |
| 5% 11/15/16 | | 2,500 | 2,541 |
| 5% 11/15/17 | | 1,605 | 1,702 |
| Tampa Solid Waste Sys. Rev. Series 2010: | | | |
| 5% 10/1/16 (FSA Insured) (b) | | 6,000 | 6,061 |
| 5% 10/1/17 (FSA Insured) (b) | | 5,000 | 5,260 |
| Tampa Tax Allocation (H. Lee Moffitt Cancer Ctr. Proj.) Series 2012 A, 5% 9/1/20 | | 1,800 | 2,072 |
| Titusville Wtr. & Swr. Rev. Series 2010, 5% 10/1/17 (Assured Guaranty Corp. Insured) | | 1,135 | 1,197 |
| Volusia County School Board Ctfs. of Prtn. (Master Lease Prog.) Series 2014 B: | | | |
| 5% 8/1/18 | | 500 | 544 |
| 5% 8/1/19 | | 310 | 348 |
|
| TOTAL FLORIDA | | | 449,321 |
|
| Georgia - 2.9% | | | |
| Atlanta Arpt. Rev.: | | | |
| 5% 1/1/22 | | 1,000 | 1,206 |
| 5% 1/1/23 | | 1,000 | 1,236 |
| 5% 1/1/24 | | 1,150 | 1,454 |
| Burke County Indl. Dev. Auth. Poll. Cont. Rev. Bonds: | | | |
| (Oglethorpe Pwr. Corp. Vogtle Proj.) Series 2013 A, 2.4%, tender 4/1/20 (a) | | 12,500 | 12,926 |
| 2.2%, tender 4/2/19 (a) | | 9,700 | 9,945 |
| Fulton County Wtr. & Swr. Rev. Series 2011: | | | |
| 5% 1/1/19 | | 4,000 | 4,419 |
| 5% 1/1/20 | | 4,000 | 4,565 |
| Georgia Gen. Oblig. Series 2014 D, 5% 7/1/16 | | 23,900 | 23,900 |
| Georgia Muni. Elec. Auth. Pwr. Rev.: | | | |
| (Combined Cycle Proj.) Series A, 5% 11/1/18 | | 2,000 | 2,194 |
| (Prerefunded Proj.) Series 2008 D: | | | |
| 5.75% 1/1/19 (Pre-Refunded to 7/1/18 @ 100) | | 11,020 | 12,125 |
| 5.75% 1/1/20 (Pre-Refunded to 7/1/18 @ 100) | | 2,630 | 2,894 |
| (Proj. One) Series 2008 A, 5.25% 1/1/17 (Berkshire Hathaway Assurance Corp. Insured) | | 7,925 | 8,107 |
| (Unrefunded Balance Proj.) Series 2008: | | | |
| 5.75% 1/1/19 | | 3,870 | 4,240 |
| 5.75% 1/1/20 | | 925 | 1,013 |
| Series B, 5% 1/1/17 | | 2,750 | 2,810 |
| Series GG: | | | |
| 5% 1/1/20 | | 675 | 767 |
| 5% 1/1/21 | | 1,670 | 1,959 |
| Georgia Muni. Gas Auth. Rev. (Gas Portfolio III Proj.): | | | |
| Series 2014 U: | | | |
| 5% 10/1/19 | | 1,500 | 1,688 |
| 5% 10/1/22 | | 1,000 | 1,206 |
| 5% 10/1/23 | | 2,420 | 2,969 |
| Series R, 5% 10/1/21 | | 5,000 | 5,920 |
| Monroe County Dev. Auth. Poll. Cont. Rev. Bonds (Georgia Pwr. Co. Plant Scherer Proj.) Series 2009, 2.35%, tender 12/11/20 (a) | | 4,715 | 4,903 |
| Private Colleges & Univs. Auth. Rev. (The Savannah College of Arts and Design Projs.) Series 2014, 5% 4/1/21 | | 2,000 | 2,312 |
| Richmond County Hosp. Auth. (Univ. Health Svcs., Inc. Proj.) Series 2009, 5% 1/1/18 | | 1,530 | 1,627 |
|
| TOTAL GEORGIA | | | 116,385 |
|
| Hawaii - 0.4% | | | |
| Hawaii Arpts. Sys. Rev. Series 2011, 5% 7/1/19 (b) | | 4,000 | 4,456 |
| State of Hawaii Dept. of Trans. Series 2013: | | | |
| 5% 8/1/17 (b) | | 2,300 | 2,401 |
| 5% 8/1/19 (b) | | 1,400 | 1,559 |
| 5% 8/1/20 (b) | | 3,050 | 3,495 |
| 5% 8/1/21 (b) | | 550 | 641 |
| 5% 8/1/22 (b) | | 2,075 | 2,464 |
| 5% 8/1/23 (b) | | 1,435 | 1,737 |
|
| TOTAL HAWAII | | | 16,753 |
|
| Illinois - 8.0% | | | |
| Chicago Board of Ed.: | | | |
| Series 1998 B1, 0% 12/1/21 (FGIC Insured) | | 10,000 | 8,335 |
| Series 2008 C: | | | |
| 5.25% 12/1/23 | | 7,665 | 7,130 |
| 5.25% 12/1/24 | | 955 | 880 |
| Series 2009 D: | | | |
| 5% 12/1/17 (Assured Guaranty Corp. Insured) | | 4,115 | 4,316 |
| 5% 12/1/18 (Assured Guaranty Corp. Insured) | | 2,335 | 2,462 |
| Series 2009: | | | |
| 4% 12/1/16 | | 240 | 243 |
| 4% 12/1/16 | | 710 | 716 |
| Series 2010 F, 5% 12/1/20 | | 760 | 694 |
| Chicago Gen. Oblig.: | | | |
| (City Colleges Proj.) Series 1999: | | | |
| 0% 1/1/17 (Nat'l. Pub. Fin. Guarantee Corp. Insured) | | 7,200 | 7,126 |
| 0% 1/1/18 (Nat'l. Pub. Fin. Guarantee Corp. Insured) | | 3,000 | 2,893 |
| 0% 1/1/19 (Nat'l. Pub. Fin. Guarantee Corp. Insured) | | 9,805 | 9,164 |
| 0% 1/1/20 (Nat'l. Pub. Fin. Guarantee Corp. Insured) | | 14,755 | 13,314 |
| Series 2012 C, 5% 1/1/23 | | 2,120 | 2,197 |
| 4.5% 1/1/20 | | 1,150 | 1,179 |
| 5% 1/1/23 | | 2,920 | 3,043 |
| Chicago Metropolitan Wtr. Reclamation District of Greater Chicago: | | | |
| Series 2014 C, 5% 12/1/17 | | 3,975 | 4,200 |
| Series 2014 D, 5% 12/1/17 | | 3,425 | 3,619 |
| Chicago Midway Arpt. Rev.: | | | |
| Series 2014 B: | | | |
| 5% 1/1/20 | | 625 | 712 |
| 5% 1/1/21 | | 400 | 467 |
| 5% 1/1/23 | | 2,500 | 3,051 |
| 5% 1/1/22 | | 5,000 | 5,979 |
| 5% 1/1/23 | | 5,900 | 7,200 |
| Chicago Motor Fuel Tax Rev. Series 2013: | | | |
| 5% 1/1/19 | | 250 | 263 |
| 5% 1/1/20 | | 300 | 320 |
| 5% 1/1/21 | | 400 | 430 |
| 5% 1/1/22 | | 300 | 326 |
| 5% 1/1/23 | | 535 | 584 |
| Chicago O'Hare Int'l. Arpt. Rev.: | | | |
| Series 2010 D, 5.25% 1/1/17 (b) | | 1,000 | 1,022 |
| Series 2011 B, 5% 1/1/18 | | 6,500 | 6,908 |
| Series 2012 A, 5% 1/1/21 | | 1,400 | 1,630 |
| Series 2012 B: | | | |
| 4% 1/1/17 (b) | | 4,100 | 4,165 |
| 5% 1/1/21 (b) | | 4,605 | 5,293 |
| Series 2013 B, 5% 1/1/22 | | 4,000 | 4,774 |
| Series 2013 D, 5% 1/1/22 | | 3,220 | 3,843 |
| Chicago Park District Gen. Oblig. Series 2014 D, 4% 1/1/17 | | 1,050 | 1,065 |
| Chicago Transit Auth. Cap. Grant Receipts Rev.: | | | |
| 5% 6/1/19 (Assured Guaranty Corp. Insured) | | 2,085 | 2,119 |
| 5% 6/1/19 (Pre-Refunded to 12/1/16 @ 100) | | 415 | 423 |
| Chicago Wastewtr. Transmission Rev. Series 2012: | | | |
| 5% 1/1/19 | | 1,310 | 1,415 |
| 5% 1/1/23 | | 1,200 | 1,387 |
| Cook County Gen. Oblig.: | | | |
| Series 2009 C, 5% 11/15/21 | | 8,575 | 9,456 |
| Series 2010 A, 5.25% 11/15/22 | | 4,960 | 5,643 |
| Series 2011 A, 5.25% 11/15/22 | | 1,000 | 1,168 |
| Series 2012 C: | | | |
| 5% 11/15/19 | | 3,200 | 3,555 |
| 5% 11/15/20 | | 7,210 | 8,179 |
| 5% 11/15/21 | | 4,970 | 5,743 |
| 5% 11/15/22 | | 1,250 | 1,470 |
| Series 2014 A: | | | |
| 5% 11/15/20 | | 1,000 | 1,134 |
| 5% 11/15/21 | | 500 | 578 |
| 5% 11/15/22 | | 1,000 | 1,176 |
| Cook County Thorton Township High School District #205 5.5% 12/1/16 (Assured Guaranty Corp. Insured) | | 2,500 | 2,549 |
| Illinois Edl. Facilities Auth. Rev. Bonds: | | | |
| (Univ. of Chicago Proj.) Series B2, 1.55%, tender 2/13/30 (a) | | 10,000 | 10,148 |
| Series 2001 B3, 0.5%, tender 3/7/17 (a) | | 6,000 | 5,982 |
| Illinois Fin. Auth. Rev.: | | | |
| (Palos Cmnty. Hosp. Proj.) Series 2010 C, 5% 5/15/17 | | 3,520 | 3,643 |
| (Provena Health Proj.) Series 2010 A, 5.75% 5/1/19 | | 2,650 | 2,948 |
| (Rush Univ. Med. Ctr. Proj.) Series 2006 B, 5% 11/1/16 (Escrowed to Maturity) | | 1,700 | 1,724 |
| Bonds Series E, 2.25%, tender 4/29/22 (a) | | 22,930 | 23,975 |
| Series 2008 D, 6.25% 11/1/28 (Pre-Refunded to 11/1/18 @ 100) | | 2,065 | 2,329 |
| Series 2012 A, 5% 5/15/23 | | 1,300 | 1,536 |
| Series 2012: | | | |
| 5% 9/1/18 | | 1,160 | 1,244 |
| 5% 9/1/19 | | 1,115 | 1,229 |
| 5% 9/1/20 | | 1,470 | 1,673 |
| 5% 9/1/21 | | 2,045 | 2,380 |
| 5% 9/1/22 | | 3,530 | 4,187 |
| Series 2015 A: | | | |
| 5% 11/15/24 | | 1,525 | 1,901 |
| 5% 11/15/25 | | 1,950 | 2,464 |
| 5% 11/15/26 | | 2,000 | 2,481 |
| 5% 11/15/20 | | 1,650 | 1,922 |
| 5% 11/15/22 | | 500 | 607 |
| 5% 11/15/24 | | 1,955 | 2,457 |
| Illinois Gen. Oblig.: | | | |
| Series 2004, 5% 11/1/16 | | 11,000 | 11,140 |
| Series 2005, 5% 4/1/17 (AMBAC Insured) | | 8,050 | 8,075 |
| Series 2007 B, 5% 1/1/17 | | 9,835 | 10,024 |
| Series 2010, 5% 1/1/21 (FSA Insured) | | 1,600 | 1,751 |
| Series 2012: | | | |
| 5% 3/1/19 | | 5,500 | 5,931 |
| 5% 8/1/19 | | 2,660 | 2,898 |
| 5% 8/1/20 | | 6,900 | 7,538 |
| 5% 8/1/21 | | 1,400 | 1,547 |
| 5% 8/1/22 | | 5,800 | 6,477 |
| Series 2013, 5% 7/1/22 | | 1,265 | 1,411 |
| Series 2014, 5% 2/1/22 | | 3,000 | 3,332 |
| Illinois Health Facilities Auth. Rev. Series 2003 A, 5% 5/15/17 (FSA Insured) | | 2,150 | 2,230 |
| Illinois Sales Tax Rev. Series 2009 B, 4.5% 6/15/17 | | 6,075 | 6,290 |
| Illinois Toll Hwy. Auth. Toll Hwy. Rev. Series 2006 A2, 5% 1/1/31 (Pre-Refunded to 7/1/16 @ 100) | | 2,100 | 2,100 |
| McHenry County Conservation District Gen. Oblig.: | | | |
| Series 2014: | | | |
| 5% 2/1/19 | | 2,285 | 2,527 |
| 5% 2/1/20 | | 2,275 | 2,598 |
| Series 2014. 5% 2/1/23 | | 2,225 | 2,723 |
| Will County Cmnty. Unit School District #365-U: | | | |
| 0% 11/1/16 (Escrowed to Maturity) | | 740 | 738 |
| 0% 11/1/16 (FSA Insured) | | 2,235 | 2,228 |
|
| TOTAL ILLINOIS | | | 321,926 |
|
| Indiana - 2.6% | | | |
| Indiana Fin. Auth. Hosp. Rev. Series 2013: | | | |
| 5% 8/15/22 | | 700 | 848 |
| 5% 8/15/23 | | 1,000 | 1,235 |
| Indiana Fin. Auth. Rev.: | | | |
| Series 2010 A, 5% 2/1/17 | | 2,800 | 2,872 |
| Series 2012: | | | |
| 5% 3/1/20 | | 650 | 727 |
| 5% 3/1/21 | | 1,225 | 1,402 |
| Indiana Fin. Auth. Wastewtr. Util. Rev. (CWA Auth. Proj.): | | | |
| Series 2012 A: | | | |
| 5% 10/1/20 | | 825 | 958 |
| 5% 10/1/22 | | 1,600 | 1,947 |
| Series 2014 A: | | | |
| 5% 10/1/20 | | 375 | 434 |
| 5% 10/1/21 | | 380 | 450 |
| 5% 10/1/22 | | 675 | 816 |
| Series 2015 A: | | | |
| 5% 10/1/24 | | 1,495 | 1,877 |
| 5% 10/1/25 | | 1,625 | 2,070 |
| Indiana Health & Edl. Facilities Fing. Auth. Rev. Bonds (Ascension Health Sr. Cr. Group Proj.) Series 2006 B1, 4.1%, tender 11/3/16 (a) | | 4,000 | 4,046 |
| Indiana Health Facility Fing. Auth. Rev. Bonds (Ascension Health Cr. Group Proj.) Series 2001 A2, 1.6%, tender 2/1/17 (a) | | 9,900 | 9,957 |
| Indiana Muni. Pwr. Agcy. Pwr. Supply Sys. Rev. Series 2011 A: | | | |
| 5% 1/1/19 | | 1,470 | 1,624 |
| 5% 1/1/20 | | 1,250 | 1,425 |
| Indianapolis Local Pub. Impt. Series 2016: | | | |
| 5% 1/1/21 (b) | | 2,750 | 3,188 |
| 5% 1/1/23 (b) | | 1,830 | 2,213 |
| 5% 1/1/24 (b) | | 2,775 | 3,410 |
| 5% 1/1/25 (b) | | 2,910 | 3,627 |
| Indianapolis Thermal Energy Sys. Series 2010 B: | | | |
| 5% 10/1/16 | | 5,000 | 5,051 |
| 5% 10/1/17 | | 5,000 | 5,259 |
| Lake Central Multi-District School Bldg. Corp. Series 2012 B: | | | |
| 4% 1/15/19 | | 1,000 | 1,075 |
| 4% 1/15/20 | | 1,345 | 1,483 |
| 4% 1/15/21 | | 1,250 | 1,401 |
| 5% 7/15/19 | | 1,680 | 1,881 |
| 5% 7/15/20 | | 1,170 | 1,353 |
| 5% 7/15/21 | | 1,000 | 1,179 |
| Purdue Univ. Rev.: | | | |
| (Student Facilities Sys. Proj.) Series 2009 B: | | | |
| 4% 7/1/17 (Escrowed to Maturity) | | 500 | 517 |
| 5% 7/1/16 | | 500 | 500 |
| Series Z-1: | | | |
| 5% 7/1/16 | | 1,215 | 1,215 |
| 5% 7/1/17 | | 1,000 | 1,044 |
| 5% 7/1/18 | | 1,500 | 1,628 |
| Rockport Poll. Cont. Rev. Bonds (Indiana Michigan Pwr. Co. Proj. Series 2009 B, 1.75%, tender 6/1/18 (a) | | 8,500 | 8,570 |
| Univ. of Southern Indiana Rev. Series J, 5% 10/1/16 (Assured Guaranty Corp. Insured) | | 1,165 | 1,177 |
| Whiting Envir. Facilities Rev. Bonds (BP Products North America, Inc. Proj.) Series 2015, 5%, tender 11/1/22 (a)(b) | | 20,745 | 24,516 |
|
| TOTAL INDIANA | | | 102,975 |
|
| Kansas - 0.4% | | | |
| Kansas Dev. Fin. Agcy. (Adventist Health Sys./Sunbelt Obligated Group Proj.) Series 2009 D, 5% 11/15/16 | | 875 | 889 |
| Wichita Hosp. Facilities Rev.: | | | |
| (Via Christi Health Sys., Inc. Proj.) Series 2009 III A, 5% 11/15/16 (Escrowed to Maturity) | | 5,410 | 5,496 |
| Series 2011 IV A: | | | |
| 5% 11/15/18 (Escrowed to Maturity) | | 2,250 | 2,471 |
| 5% 11/15/20 (Escrowed to Maturity) | | 2,745 | 3,215 |
| Wyandotte County/Kansas City Unified Govt. Util. Sys. Rev. Series 2016 A: | | | |
| 5% 9/1/22 | | 500 | 606 |
| 5% 9/1/23 | | 725 | 895 |
| 5% 9/1/25 | | 800 | 1,021 |
|
| TOTAL KANSAS | | | 14,593 |
|
| Kentucky - 0.9% | | | |
| Kentucky Econ. Dev. Fin. Auth. Bonds Series 2009 B, 2.7%, tender 11/10/21 (a) | | 9,000 | 9,439 |
| Kentucky Econ. Dev. Fin. Auth. Hosp. Rev. Series 2015 A: | | | |
| 5% 6/1/19 | | 1,000 | 1,106 |
| 5% 6/1/20 | | 1,410 | 1,604 |
| 5% 6/1/21 | | 1,000 | 1,154 |
| 5% 6/1/22 | | 1,560 | 1,830 |
| 5% 6/1/24 | | 1,690 | 2,023 |
| Kentucky State Property & Buildings Commission Rev.: | | | |
| (#82 Proj.) 5.25% 10/1/17 (FSA Insured) | | 2,450 | 2,585 |
| Series 2016, 3% 11/1/17 | | 1,630 | 1,677 |
| Louisville/Jefferson County Metropolitan Govt. Poll. Cont. Rev. Bonds (Louisville Gas and Elec. Co. Proj.): | | | |
| Series 2003 A, 1.65%, tender 4/3/17 (a) | | 6,000 | 6,032 |
| Series 2007 B: | | | |
| 1.15%, tender 6/1/17 (a) | | 2,600 | 2,605 |
| 1.6%, tender 6/1/17 (a) | | 8,050 | 8,094 |
|
| TOTAL KENTUCKY | | | 38,149 |
|
| Louisiana - 2.2% | | | |
| Louisiana Citizens Property Ins. Corp. Assessment Rev. Series 2015: | | | |
| 5% 6/1/19 | | 9,350 | 10,406 |
| 5% 6/1/21 (FSA Insured) | | 5,000 | 5,889 |
| Louisiana Gas & Fuel Tax Rev. Bonds Series 2013 B, 0.79%, tender 7/1/16 (a) | | 25,000 | 24,960 |
| Louisiana Gen. Oblig.: | | | |
| Series 2012 A, 5% 8/1/22 | | 1,515 | 1,821 |
| Series 2014 D1, 5% 12/1/22 | | 1,305 | 1,579 |
| Series 2015, 5% 5/1/18 | | 1,075 | 1,158 |
| Series 2016 B: | | | |
| 5% 8/1/22 | | 14,095 | 16,938 |
| 5% 8/1/23 | | 9,250 | 11,351 |
| Louisiana Pub. Facilities Auth. Rev. (Christus Health Proj.) Series 2009 A, 5% 7/1/16 | | 2,000 | 2,000 |
| Louisiana Stadium and Exposition District Series 2013 A: | | | |
| 5% 7/1/21 | | 1,500 | 1,768 |
| 5% 7/1/22 | | 1,000 | 1,203 |
| New Orleans Gen. Oblig. Series 2012, 5% 12/1/20 | | 2,800 | 3,251 |
| Reg'l. Transit Auth. Louisiana Sales Tax Rev. 4% 12/1/16 (FSA Insured) | | 1,000 | 1,014 |
| Tobacco Settlement Fing. Corp. Series 2013 A, 5% 5/15/23 | | 4,500 | 5,355 |
|
| TOTAL LOUISIANA | | | 88,693 |
|
| Maine - 0.2% | | | |
| Maine Tpk. Auth. Tpk. Rev. Series 2015: | | | |
| 5% 7/1/21 | | 2,400 | 2,845 |
| 5% 7/1/22 | | 1,850 | 2,243 |
| 5% 7/1/24 | | 2,350 | 2,967 |
|
| TOTAL MAINE | | | 8,055 |
|
| Maryland - 1.6% | | | |
| Maryland Gen. Oblig.: | | | |
| Series 2008 2, 5% 7/15/22 (Pre-Refunded to 7/15/18 @ 100) | | 5,500 | 5,985 |
| Series 2012 B, 5% 8/1/16 | | 6,400 | 6,425 |
| Maryland Health & Higher Edl. Facilities Auth. Rev.: | | | |
| Bonds: | | | |
| Series 2012 D, 1.124%, tender 11/15/17 (a) | | 13,940 | 13,945 |
| Series 2013 A: | | | |
| 0.886%, tender 5/15/18 (a) | | 4,515 | 4,496 |
| 0.906%, tender 5/15/18 (a) | | 7,100 | 7,072 |
| Series 2015: | | | |
| 5% 7/1/19 | | 400 | 447 |
| 5% 7/1/22 | | 900 | 1,093 |
| 5% 7/1/23 | | 1,000 | 1,229 |
| 5% 7/1/24 | | 2,000 | 2,481 |
| 5% 7/1/25 | | 1,770 | 2,213 |
| Montgomery County Gen. Oblig. Series 2011 A, 5% 7/1/20 | | 16,000 | 17,999 |
|
| TOTAL MARYLAND | | | 63,385 |
|
| Massachusetts - 2.0% | | | |
| Massachusetts Bay Trans. Auth. Sales Tax Rev. Series 2006 B, 5.25% 7/1/18 | | 2,300 | 2,508 |
| Massachusetts Dev. Fin. Agcy. Rev.: | | | |
| (Boston College Proj.): | | | |
| Series Q1, 4% 7/1/16 | | 1,000 | 1,000 |
| Series Q2: | | | |
| 4% 7/1/16 | | 1,000 | 1,000 |
| 5% 7/1/17 | | 1,370 | 1,430 |
| Bonds Series 2013 U-6E, 0.96%, tender 7/7/16 (a) | | 5,900 | 5,899 |
| Series 2016 I: | | | |
| 5% 7/1/21 | | 500 | 589 |
| 5% 7/1/22 | | 600 | 724 |
| 5% 7/1/23 | | 640 | 785 |
| 5% 7/1/24 | | 550 | 685 |
| 5% 7/1/25 | | 500 | 629 |
| 5% 7/1/26 | | 1,000 | 1,266 |
| Massachusetts Edl. Fing. Auth. Rev. Series 2013, 5% 7/1/19 (b) | | 4,725 | 5,179 |
| Massachusetts Gen. Oblig.: | | | |
| Bonds Series 2014 D1, 0.63%, tender 7/1/20 (a) | | 32,000 | 32,000 |
| Series 2004 B, 5.25% 8/1/20 | | 12,700 | 14,908 |
| Series 2006 D, 5% 8/1/22 (Pre-Refunded to 8/1/16 @ 100) | | 4,500 | 4,514 |
| Series 2007 C, 5% 8/1/19 (Pre-Refunded to 8/1/17 @ 100) | | 2,000 | 2,093 |
| Massachusetts Health & Edl. Facilities Auth. Rev. Bonds Series 2007 G6, 1.293%, tender 7/7/16 (a) | | 2,900 | 2,900 |
| Medford Gen. Oblig. Series 2011 B, 4% 3/1/19 | | 3,570 | 3,867 |
|
| TOTAL MASSACHUSETTS | | | 81,976 |
|
| Michigan - 2.3% | | | |
| Detroit Swr. Disp. Rev. Series 2006 D, 1.019% 7/1/32 (a) | | 4,070 | 3,835 |
| Grand Blanc Cmnty. Schools Series 2013: | | | |
| 5% 5/1/19 | | 1,225 | 1,360 |
| 5% 5/1/20 | | 2,635 | 3,012 |
| 5% 5/1/21 | | 2,150 | 2,520 |
| 5% 5/1/22 | | 1,850 | 2,219 |
| Grand Rapids Pub. Schools Series 2016: | | | |
| 4% 5/1/17 (FSA Insured) | | 500 | 513 |
| 4% 5/1/18 (FSA Insured) | | 1,950 | 2,064 |
| Grand Valley Michigan State Univ. Rev. Series 2009, 5% 12/1/16 | | 1,320 | 1,343 |
| Kent Hosp. Fin. Auth. Hosp. Facilities Rev. (Spectrum Health Sys. Proj.) Series 2011 A: | | | |
| 5% 11/15/18 | | 1,250 | 1,367 |
| 5% 11/15/19 | | 1,000 | 1,128 |
| Michigan Fin. Auth. Rev.: | | | |
| Bonds 1.1%, tender 8/15/19 (a) | | 4,250 | 4,268 |
| Series 2012 A: | | | |
| 5% 6/1/17 (Escrowed to Maturity) | | 1,410 | 1,465 |
| 5% 6/1/18 (Escrowed to Maturity) | | 2,430 | 2,627 |
| Series 2015 A: | | | |
| 5% 8/1/22 | | 2,400 | 2,887 |
| 5% 8/1/23 | | 3,800 | 4,660 |
| Michigan Hosp. Fin. Auth. Rev.: | | | |
| (McLaren Health Care Corp. Proj.) Series 2008 A, 5.75% 5/15/38 (Pre-Refunded to 5/15/18 @ 100) | | 1,190 | 1,300 |
| Bonds: | | | |
| Series 2005 A4, 1.625%, tender 11/1/19 (a) | | 8,630 | 8,721 |
| Series 2010 F3, 1.4%, tender 6/29/18 (a) | | 1,900 | 1,920 |
| Series 2010 F4, 1.95%, tender 4/1/20 (a) | | 6,545 | 6,760 |
| 0.95%, tender 2/1/18 (a) | | 3,995 | 4,006 |
| Portage Pub. Schools Series 2016: | | | |
| 5% 5/1/23 | | 2,035 | 2,482 |
| 5% 11/1/23 | | 1,365 | 1,679 |
| 5% 5/1/24 | | 1,920 | 2,380 |
| 5% 11/1/24 | | 2,000 | 2,498 |
| 5% 5/1/25 | | 1,125 | 1,415 |
| 5% 11/1/25 | | 1,220 | 1,545 |
| 5% 5/1/26 | | 1,700 | 2,172 |
| 5% 11/1/26 | | 1,180 | 1,501 |
| 5% 11/1/28 | | 1,005 | 1,265 |
| Royal Oak Hosp. Fin. Auth. Hosp. Rev. Series 2014 D: | | | |
| 5% 9/1/21 | | 1,500 | 1,772 |
| 5% 9/1/23 | | 500 | 614 |
| Spring Lake Pub. Schools: | | | |
| Series 2014, 5% 5/1/19 | | 2,300 | 2,554 |
| 5% 11/1/19 | | 2,775 | 3,135 |
| 5% 5/1/20 | | 3,630 | 4,149 |
| 5% 11/1/20 | | 1,745 | 2,026 |
| 5% 5/1/21 | | 4,110 | 4,810 |
|
| TOTAL MICHIGAN | | | 93,972 |
|
| Minnesota - 0.3% | | | |
| Minneapolis & Saint Paul Metropolitan Arpts. Commission Arpt. Rev.: | | | |
| Series 2014 A: | | | |
| 5% 1/1/22 | | 1,000 | 1,200 |
| 5% 1/1/23 | | 1,000 | 1,229 |
| Series 2014 B: | | | |
| 5% 1/1/21 (b) | | 2,290 | 2,645 |
| 5% 1/1/22 (b) | | 2,000 | 2,365 |
| 5% 1/1/23 (b) | | 1,000 | 1,207 |
| Western Minnesota Muni. Pwr. Agcy. Pwr. Supply Rev. Series 2014 A: | | | |
| 5% 1/1/22 | | 1,000 | 1,205 |
| 5% 1/1/23 | | 1,500 | 1,848 |
| 5% 1/1/24 | | 1,000 | 1,257 |
|
| TOTAL MINNESOTA | | | 12,956 |
|
| Mississippi - 0.2% | | | |
| Mississippi Gen. Oblig. (Cap. Impts. Proj.) Series 2012 D, 0.94% 9/1/17 (a) | | 3,080 | 3,080 |
| Mississippi Hosp. Equip. & Facilities Auth. Bonds (Baptist Memorial Health Care Proj.) Series 2004 B2, 0.75%, tender 7/7/16 (a)(c) | | 4,500 | 4,500 |
|
| TOTAL MISSISSIPPI | | | 7,580 |
|
| Missouri - 0.0% | | | |
| Saint Louis Arpt. Rev. Series 2013, 5% 7/1/18 | | 765 | 827 |
| Nebraska - 0.0% | | | |
| Nebraska Pub. Pwr. District Rev. Series 2012 C, 5% 1/1/22 (Pre-Refunded to 1/1/18 @ 100) | | 1,100 | 1,172 |
| Nevada - 1.7% | | | |
| Clark County School District Series 2012 A, 5% 6/15/19 | | 24,610 | 27,510 |
| Humboldt County Nev Poll. Cont. Rev. Bonds (Seirra Pacific Pwr. Co. Projs.) Series 2016 A, 1.25%, tender 6/3/19 (a) | | 2,000 | 2,005 |
| Las Vegas Valley Wtr. District Wtr. Impt. Gen. Oblig.: | | | |
| Series 2016 B, 3% 6/1/18 | | 1,020 | 1,065 |
| Series 2016, 3% 6/1/17 | | 2,195 | 2,243 |
| Nevada Gen. Oblig.: | | | |
| Series 2010 C, 5% 6/1/19 | | 12,140 | 13,607 |
| Series 2012 B, 5% 8/1/20 | | 2,230 | 2,592 |
| Series 2013 D1: | | | |
| 5% 3/1/23 | | 4,500 | 5,577 |
| 5% 3/1/24 | | 2,700 | 3,333 |
| Washoe County Gas & Wtr. Facilities Bonds (Seirra Pacific Pwr. Co. Projs.) Series 2016 B, 3%, tender 6/1/22 (a) | | 5,300 | 5,722 |
| Washoe County Gas Facilities Rev. Bonds (Seirra Pacific Pwr. Co. Projs.) Series 2016 A, 1.5%, tender 6/3/19 (a)(b) | | 6,125 | 6,141 |
|
| TOTAL NEVADA | | | 69,795 |
|
| New Hampshire - 0.3% | | | |
| New Hampshire Health & Ed. Facilities Auth. Rev. Series 2012: | | | |
| 4% 7/1/20 | | 2,705 | 2,956 |
| 4% 7/1/21 | | 1,520 | 1,683 |
| New Hampshire Tpk. Sys. Rev. Series 2012 B: | | | |
| 5% 2/1/17 | | 3,000 | 3,074 |
| 5% 2/1/18 | | 2,500 | 2,665 |
|
| TOTAL NEW HAMPSHIRE | | | 10,378 |
|
| New Jersey - 5.3% | | | |
| Camden County Impt. Auth. Health Care Redev. Rev. Series 2014 A: | | | |
| 5% 2/15/20 | | 3,000 | 3,384 |
| 5% 2/15/21 | | 2,500 | 2,887 |
| 5% 2/15/22 | | 2,500 | 2,956 |
| 5% 2/15/23 | | 2,750 | 3,292 |
| New Jersey Econ. Dev. Auth. Rev.: | | | |
| Series 2005 K, 5.5% 12/15/19 | | 8,030 | 8,954 |
| Series 2011 EE: | | | |
| 5% 9/1/20 | | 1,350 | 1,494 |
| 5% 9/1/20 (Escrowed to Maturity) | | 3,650 | 4,255 |
| Series 2012 II: | | | |
| 5% 3/1/21 | | 6,800 | 7,574 |
| 5% 3/1/22 | | 6,290 | 7,051 |
| Series 2013 NN, 5% 3/1/19 (Escrowed to Maturity) | | 8,165 | 9,070 |
| Series 2013, 5% 3/1/23 | | 6,000 | 6,769 |
| Series 2014 PP, 5% 6/15/19 | | 17,000 | 18,414 |
| New Jersey Edl. Facility: | | | |
| Series 2014: | | | |
| 5% 6/15/20 | | 11,000 | 12,030 |
| 5% 6/15/21 | | 11,000 | 12,062 |
| Series 2016 A: | | | |
| 4% 7/1/18 (d) | | 3,585 | 3,770 |
| 5% 7/1/21 (d) | | 2,200 | 2,535 |
| 5% 7/1/22 (d) | | 6,300 | 7,377 |
| 5% 7/1/23 (d) | | 3,390 | 4,029 |
| 5% 7/1/24 (d) | | 7,915 | 9,514 |
| New Jersey Gen. Oblig. Series O, 5% 8/1/17 | | 6,940 | 7,240 |
| New Jersey Health Care Facilities Fing. Auth. Rev. Series 2016 A, 5% 7/1/24 | | 1,225 | 1,526 |
| New Jersey Higher Ed. Student Assistance Auth. Student Ln. Rev. Series 2013: | | | |
| 5% 12/1/18 (b) | | 6,000 | 6,494 |
| 5% 12/1/19 (b) | | 3,850 | 4,257 |
| New Jersey Tpk. Auth. Tpk. Rev.: | | | |
| Series 2013 A, 5% 1/1/24 | | 4,345 | 5,285 |
| Series 2013 C, 0.89% 1/1/17 (a) | | 16,000 | 16,004 |
| New Jersey Trans. Trust Fund Auth.: | | | |
| Series 2003 A, 5.5% 12/15/16 (FSA Insured) | | 5,000 | 5,105 |
| Series 2003 B, 5.25% 12/15/19 | | 3,870 | 4,275 |
| Series 2012 AA, 5% 6/15/19 | | 1,500 | 1,627 |
| Series 2013 A: | | | |
| 5% 12/15/19 | | 6,455 | 7,078 |
| 5% 6/15/20 | | 18,000 | 19,878 |
| New Jersey Transit Corp. Ctfs. of Prtn. Series 2014 A, 5% 9/15/21 | | 4,900 | 5,554 |
|
| TOTAL NEW JERSEY | | | 211,740 |
|
| New Mexico - 0.9% | | | |
| Farmington Poll. Cont. Rev. Bonds (Southern California Edison Co. Four Corners Proj.): | | | |
| Series 2005 B, 1.875%, tender 4/1/20 (a) | | 11,000 | 11,225 |
| Series 2011, 1.875%, tender 4/1/20 (a) | | 6,290 | 6,419 |
| New Mexico Edl. Assistance Foundation: | | | |
| Series 2009 B, 4% 9/1/16 | | 7,000 | 7,041 |
| Series 2010 A1, 4% 12/1/16 | | 6,750 | 6,843 |
| Rio Rancho Wtr. & Wastewtr. Sys. Rev. Series 2009, 5% 5/15/17 (FSA Insured) | | 4,480 | 4,642 |
|
| TOTAL NEW MEXICO | | | 36,170 |
|
| New York - 10.1% | | | |
| Dutchess County Local Dev. Corp. Rev. (Health Quest Systems, Inc. Proj.) Series 2010 A: | | | |
| 5% 7/1/18 (Assured Guaranty Corp. Insured) (FSA Insured) | | 1,100 | 1,188 |
| 5% 7/1/19 (Assured Guaranty Corp. Insured) (FSA Insured) | | 640 | 714 |
| Metropolitan Trans. Auth. Svc. Contract Rev. Series 2002 A, 5.5% 7/1/17 | | 5,000 | 5,244 |
| New York City Gen. Oblig.: | | | |
| Series 2008 C, 5.25% 8/1/17 | | 2,280 | 2,394 |
| Series 2010 F, 5% 8/1/17 | | 8,365 | 8,759 |
| Series 2011 B, 5% 8/1/17 | | 1,000 | 1,047 |
| Series 2012 C, 4% 8/1/17 | | 2,740 | 2,840 |
| Series 2014 J, 3% 8/1/16 | | 5,600 | 5,612 |
| Series 2014 K, 3% 8/1/16 | | 3,900 | 3,908 |
| Series 2015 C: | | | |
| 5% 8/1/23 | | 10,000 | 12,445 |
| 5% 8/1/24 | | 5,000 | 6,343 |
| 5% 8/1/25 | | 1,700 | 2,172 |
| Series 2015 F1, 3% 6/1/17 | | 14,370 | 14,688 |
| Series 2016, 5% 8/1/18 | | 9,100 | 9,903 |
| New York City Transitional Fin. Auth. Bldg. Aid Rev. Series 2015 S2, 3% 7/15/17 | | 9,565 | 9,805 |
| New York City Transitional Fin. Auth. Rev.: | | | |
| Series 2003 B, 5% 2/1/20 | | 3,000 | 3,441 |
| Series 2010 B: | | | |
| 5% 11/1/17 | | 11,740 | 12,426 |
| 5% 11/1/17 (Escrowed to Maturity) | | 18,260 | 19,274 |
| 5% 11/1/20 | | 5,950 | 6,752 |
| Series 2010 D: | | | |
| 5% 11/1/17 | | 8,015 | 8,483 |
| 5% 11/1/17 (Escrowed to Maturity) | | 2,100 | 2,220 |
| Series 2012 A: | | | |
| 5% 11/1/17 | | 6,180 | 6,541 |
| 5% 11/1/17 (Escrowed to Maturity) | | 820 | 867 |
| 5% 11/1/20 | | 4,500 | 5,280 |
| New York Dorm. Auth. Mental Health Svcs. Facilities Impt. Rev.: | | | |
| (State Univ. Proj.) Series 2012 A, 5% 5/15/20 | | 4,000 | 4,617 |
| Series 2012 A, 4% 5/15/20 | | 8,000 | 8,932 |
| New York Dorm. Auth. Personal Income Tax Rev. Series 2012 A, 5% 12/15/20 | | 8,500 | 10,006 |
| New York Dorm. Auth. Revs.: | | | |
| Series 2008 D, 5.25% 8/15/17 (FSA Insured) | | 7,000 | 7,364 |
| Series 2009 A, 5% 7/1/16 | | 8,390 | 8,390 |
| New York Dorm. Auth. Sales Tax Rev. Series 2015 A, 5% 3/15/17 | | 90,000 | 92,799 |
| New York Metropolitan Trans. Auth. Rev.: | | | |
| Series 2003 B, 5.25% 11/15/19 (Nat'l. Pub. Fin. Guarantee Corp. Insured) | | 5,200 | 5,950 |
| Series 2008 B2: | | | |
| 5% 11/15/19 | | 6,185 | 7,026 |
| 5% 11/15/20 | | 5,500 | 6,431 |
| 5% 11/15/21 | | 4,000 | 4,791 |
| Series 2012 B, 5% 11/15/22 | | 2,000 | 2,449 |
| Series 2012 D, 5% 11/15/18 | | 2,515 | 2,764 |
| Series 2012 E: | | | |
| 4% 11/15/19 | | 4,000 | 4,412 |
| 5% 11/15/21 | | 2,435 | 2,917 |
| Series 2012 F, 5% 11/15/19 | | 5,000 | 5,680 |
| New York Thruway Auth. Gen. Rev. Series 2013 A, 5% 5/1/19 | | 20,400 | 22,747 |
| New York Thruway Auth. Second Gen. Hwy. & Bridge Trust Fund: | | | |
| Series 2010 A, 5% 4/1/17 | | 1,000 | 1,033 |
| Series 2011 A1: | | | |
| 5% 4/1/17 | | 1,500 | 1,549 |
| 5% 4/1/18 | | 3,500 | 3,766 |
| New York Trans. Dev. Corp. (Term. One Group Assoc. L.P. Proj.) Series 2015, 5% 1/1/17 (b) | | 8,890 | 9,072 |
| New York Urban Dev. Corp. Rev.: | | | |
| Series 2009 C, 5% 12/15/16 | | 17,000 | 17,349 |
| Series 2011 A, 5% 3/15/21 | | 18,425 | 21,804 |
| Tobacco Settlement Fing. Corp. Series 2013 B, 5% 6/1/21 | | 65 | 65 |
| Triborough Bridge & Tunnel Auth. Revs. Series Y, 5.5% 1/1/17 (Escrowed to Maturity) | | 760 | 779 |
|
| TOTAL NEW YORK | | | 405,038 |
|
| North Carolina - 0.6% | | | |
| Dare County Ctfs. of Prtn. Series 2012 B: | | | |
| 4% 6/1/17 | | 1,000 | 1,031 |
| 4% 6/1/18 | | 1,280 | 1,361 |
| 4% 6/1/20 | | 1,000 | 1,114 |
| 5% 6/1/19 | | 1,305 | 1,458 |
| Mecklenburg County Pub. Facilities Corp. Series 2009, 5% 3/1/18 | | 1,500 | 1,609 |
| North Carolina Cap. Facilities Fin. Agcy. Rev. Bonds (, Inc. Proj.) Series 2010 B, 0.85%, tender 9/1/16 (a)(b) | | 1,900 | 1,900 |
| North Carolina Med. Care Commission Hosp. Rev. (North Carolina Baptist Hosp. Proj.) Series 2010: | | | |
| 5% 6/1/17 | | 3,220 | 3,344 |
| 5% 6/1/18 | | 3,820 | 4,123 |
| North Carolina Muni. Pwr. Agcy. #1 Catawba Elec. Rev. Series 2015 E: | | | |
| 5% 1/1/22 | | 5,000 | 6,006 |
| 5% 1/1/23 | | 1,500 | 1,842 |
|
| TOTAL NORTH CAROLINA | | | 23,788 |
|
| Ohio - 2.9% | | | |
| American Muni. Pwr., Inc. Rev. Bonds Series B, 5%, tender 8/15/20 (a) | | 35,000 | 39,712 |
| Buckeye Tobacco Settlement Fing. Auth. Series 2007 A1, 5% 6/1/17 | | 3,500 | 3,632 |
| Cincinnati City School District 5.25% 12/1/18 (Nat'l. Pub. Fin. Guarantee Corp. Insured) | | 3,555 | 3,924 |
| Cleveland Arpt. Sys. Rev.: | | | |
| 5% 1/1/20 (FSA Insured) | | 425 | 480 |
| 5% 1/1/22 (FSA Insured) | | 1,325 | 1,565 |
| 5% 1/1/24 (FSA Insured) | | 1,200 | 1,473 |
| 5% 1/1/25 (FSA Insured) | | 1,250 | 1,560 |
| 5% 1/1/26 (FSA Insured) | | 500 | 622 |
| Columbus City School District (School Facilities Construction and Impt. Proj.) Series 2009 B, 4% 12/1/16 | | 1,000 | 1,014 |
| Columbus Gen. Oblig. Series 2013 1, 5% 7/1/17 | | 2,075 | 2,166 |
| Fairfield County Hosp. Facilities Rev. (Fairfield Med. Ctr. Proj.) Series 2013: | | | |
| 5% 6/15/22 | | 2,145 | 2,513 |
| 5% 6/15/23 | | 1,855 | 2,206 |
| Hamilton County Convention Facilities Auth. Rev. Series 2014: | | | |
| 5% 12/1/19 | | 1,910 | 2,133 |
| 5% 12/1/20 | | 2,205 | 2,524 |
| 5% 12/1/21 | | 2,045 | 2,390 |
| Hamilton County Student Hsg. Rev. (Stratford Heights Proj.) Series 2010, 5% 6/1/17 (FSA Insured) | | 1,160 | 1,205 |
| Ohio Air Quality Dev. Auth. Rev.: | | | |
| Bonds (First Energy Nuclear Generation Proj.) Series 2006 A, 3.75%, tender 12/3/18 (a) | | 13,300 | 13,605 |
| Series 2009 C, 5.625% 6/1/18 | | 1,395 | 1,476 |
| Ohio Bldg. Auth. (Administrative Bldg. Fund Proj.) Series 2010 C, 5% 10/1/16 | | 1,250 | 1,263 |
| Ohio Gen. Oblig.: | | | |
| (Common Schools Proj.) Series 2010 A, 5% 9/15/17 | | 2,600 | 2,738 |
| (Higher Ed. Proj.) Series 2010 A, 5% 8/1/17 | | 3,290 | 3,446 |
| Series 2011 A, 5% 8/1/17 | | 3,070 | 3,216 |
| Series 2012 C, 5% 9/15/21 | | 4,350 | 5,223 |
| Ohio Higher Edl. Facility Commission Rev. (Univ. Hosp. Health Sys. Proj.) Series 2010 A, 5% 1/15/17 | | 1,000 | 1,023 |
| Ohio State Univ. Gen. Receipts Series 2010 A: | | | |
| 5% 12/1/16 | | 4,720 | 4,806 |
| 5% 12/1/16 (Escrowed to Maturity) | | 280 | 285 |
| Scioto County Hosp. Facilities Rev. Series 2016: | | | |
| 5% 2/15/21 | | 650 | 758 |
| 5% 2/15/22 | | 1,100 | 1,310 |
| 5% 2/15/23 | | 2,120 | 2,572 |
| 5% 2/15/24 | | 1,640 | 2,022 |
| 5% 2/15/25 | | 1,710 | 2,140 |
| 5% 2/15/26 | | 1,250 | 1,584 |
|
| TOTAL OHIO | | | 116,586 |
|
| Oklahoma - 0.4% | | | |
| Oklahoma City Pub. Property Auth. Hotel Tax Rev. Series 2015, 5% 10/1/17 | | 450 | 473 |
| Oklahoma Dev. Fin. Auth. Rev.: | | | |
| (Saint John Health Sys. Proj.) Series 2012, 5% 2/15/23 | | 2,600 | 3,109 |
| Series 2004 A, 2.375% 12/1/21 | | 1,350 | 1,432 |
| Series 2012, 5% 2/15/21 | | 1,600 | 1,870 |
| Tulsa County Independent School Disctrict #9 Series 2015, 2% 4/1/17 | | 3,000 | 3,031 |
| Tulsa County Indl. Auth. Edl. Facilities Lease Rev. (Jenks Pub. Schools Proj.) Series 2009, 5.5% 9/1/18 | | 5,215 | 5,742 |
|
| TOTAL OKLAHOMA | | | 15,657 |
|
| Pennsylvania - 6.2% | | | |
| Beaver County Indl. Dev. Auth. Poll. Cont. Rev. Bonds (FirstEnergy Nuclear Generation Corp. Proj.): | | | |
| Series 2006 A, 3.5%, tender 6/1/20 (a) | | 5,250 | 5,332 |
| Series 2006 B, 3.5%, tender 6/1/20 (a) | | 6,000 | 6,094 |
| Franklin County Indl. Dev. Auth. (The Chambersburg Hosp. Proj.) Series 2010: | | | |
| 5% 7/1/16 | | 1,000 | 1,000 |
| 5% 7/1/17 | | 1,255 | 1,307 |
| Lehigh County Indl. Dev. Auth. Poll. Cont. Rev. Bonds 0.9%, tender 8/15/17 (a) | | 10,255 | 10,262 |
| Montgomery County Higher Ed. & Health Auth. Hosp. Rev. (Abington Memorial Hosp. Proj.) Series 2009 A, 5% 6/1/17 | | 2,200 | 2,283 |
| Montgomery County Higher Ed. & Health Auth. Rev. Series 2014 A: | | | |
| 4% 10/1/18 | | 1,000 | 1,056 |
| 4% 10/1/19 | | 660 | 706 |
| 5% 10/1/20 | | 1,260 | 1,408 |
| Mount Lebanon School District Series 2015, 4% 2/15/18 | | 865 | 910 |
| Pennsylvania Econ. Dev. Auth. Governmental Lease (Forum Place Proj.) Series 2012: | | | |
| 5% 3/1/18 | | 2,455 | 2,622 |
| 5% 3/1/19 | | 2,310 | 2,527 |
| 5% 3/1/20 | | 2,140 | 2,406 |
| Pennsylvania Econ. Dev. Fin. Auth. Unemployment Compensation Rev. Series 2012 B: | | | |
| 5% 1/1/22 | | 5,000 | 5,214 |
| 5% 7/1/22 | | 5,200 | 5,215 |
| 5% 1/1/23 | | 900 | 900 |
| Pennsylvania Econ. Dev. Fing. Auth. Solid Waste Disp. Rev. Bonds: | | | |
| (Waste Mgmt., Inc. Proj.) Series 2013, 0.85%, tender 8/1/16 (a)(b) | | 15,100 | 15,100 |
| 0.9%, tender 7/1/16 (a)(b) | | 4,000 | 4,000 |
| Pennsylvania Gen. Oblig.: | | | |
| Series 2006 1, 5% 10/1/19 (Pre-Refunded to 10/1/16 @ 100) | | 7,000 | 7,075 |
| Series 2006, 4.25% 3/1/24 (Pre-Refunded to 3/1/17 @ 100) | | 6,000 | 6,145 |
| Series 2010 A3, 5% 7/15/16 | | 3,900 | 3,907 |
| Series 2011, 5% 7/1/21 | | 1,900 | 2,223 |
| Series 2012, 5% 6/1/18 | | 3,410 | 3,679 |
| Series 2016: | | | |
| 5% 2/1/21 | | 8,825 | 10,226 |
| 5% 2/1/22 | | 9,265 | 10,942 |
| 5% 2/1/23 | | 9,075 | 10,941 |
| 5% 2/1/24 | | 10,215 | 12,551 |
| 5% 6/1/17 | | 9,000 | 9,353 |
| 5% 8/15/17 | | 18,000 | 18,859 |
| Pennsylvania Higher Edl. Facilities Auth. Rev. Series 2014: | | | |
| 5% 12/1/19 | | 340 | 387 |
| 5% 12/1/21 | | 275 | 331 |
| 5% 12/1/22 | | 855 | 1,053 |
| Pennsylvania Pub. School Bldg. Auth. School Rev. (The School District of Harrisburg Proj.) Series 2016 A, 5% 12/1/21 (FSA Insured) (d) | | 5,000 | 5,901 |
| Pennsylvania Tpk. Commission Tpk. Rev.: | | | |
| Series 2009 B, 5% 12/1/17 | | 12,500 | 13,238 |
| Series 2013 A, 1.01% 12/1/17 (a) | | 6,400 | 6,402 |
| Philadelphia Gas Works Rev.: | | | |
| Eighth Series A, 5% 8/1/16 | | 1,000 | 1,004 |
| Seventeenth Series, 5.375% 7/1/16 (Escrowed to Maturity) | | 2,300 | 2,300 |
| Philadelphia Gen. Oblig.: | | | |
| Series 2008 A, 5% 12/15/16 (FSA Insured) | | 7,275 | 7,413 |
| Series 2011: | | | |
| 5.25% 8/1/17 | | 6,165 | 6,456 |
| 5.25% 8/1/18 | | 5,515 | 5,993 |
| Philadelphia Muni. Auth. Rev. Series 2013 A: | | | |
| 5% 11/15/17 | | 6,635 | 7,010 |
| 5% 11/15/18 | | 3,430 | 3,747 |
| Philadelphia School District Series 2010 C, 5% 9/1/16 | | 13,610 | 13,696 |
| Pittsburgh School District Series 2010 A, 5% 9/1/16 (FSA Insured) | | 1,685 | 1,697 |
| Southeastern Pennsylvania Trans. Auth. Rev. Series 2011: | | | |
| 5% 6/1/18 | | 1,000 | 1,077 |
| 5% 6/1/19 | | 200 | 223 |
| State Pub. School Bldg. Auth. Lease Rev. (Philadelphia School District Proj.) Series 2012: | | | |
| 5% 4/1/19 | | 1,305 | 1,412 |
| 5% 4/1/20 | | 1,250 | 1,379 |
| 5% 4/1/21 | | 1,000 | 1,115 |
| Unionville-Chadds Ford School District Gen. Oblig. Series 2009, 5% 6/1/20 | | 1,190 | 1,333 |
|
| TOTAL PENNSYLVANIA | | | 247,410 |
|
| Rhode Island - 0.5% | | | |
| Rhode Island & Providence Plantations Series 2015 A, 4% 8/1/17 | | 5,000 | 5,181 |
| Rhode Island Health & Edl. Bldg. Corp. Higher Ed. Facilities Rev. Series 2013 A: | | | |
| 5% 5/15/18 | | 1,000 | 1,065 |
| 5% 5/15/19 | | 1,500 | 1,653 |
| Rhode Island Health & Edl. Bldg. Corp. Pub. Schools Rev. Series 2015, 5% 5/15/25 (FSA Insured) | | 6,040 | 7,510 |
| Tobacco Setlement Fing. Corp. Series 2015 A: | | | |
| 5% 6/1/26 | | 3,500 | 4,073 |
| 5% 6/1/27 | | 1,000 | 1,152 |
|
| TOTAL RHODE ISLAND | | | 20,634 |
|
| South Carolina - 1.9% | | | |
| Lexington County Health Svcs. District, Inc. Hosp. Rev. Series 2011, 5% 11/1/19 | | 1,190 | 1,341 |
| Scago Edl. Facilities Corp. for Colleton School District (School District of Colleton County Proj.) Series 2015: | | | |
| 5% 12/1/23 | | 4,440 | 5,403 |
| 5% 12/1/26 | | 1,100 | 1,339 |
| South Carolina Pub. Svc. Auth. Rev.: | | | |
| Series 2012 B: | | | |
| 5% 12/1/17 | | 2,000 | 2,117 |
| 5% 12/1/20 | | 1,000 | 1,170 |
| Series 2012 C, 5% 12/1/17 | | 10,535 | 11,152 |
| Series 2014 C: | | | |
| 5% 12/1/22 | | 1,100 | 1,345 |
| 5% 12/1/23 | | 5,000 | 6,206 |
| Series 2015 C: | | | |
| 5% 12/1/18 | | 15,000 | 16,489 |
| 5% 12/1/19 | | 18,690 | 21,252 |
| South Carolina Trans. Infrastructure Bank Rev. Series 2012 B, 5% 10/1/17 | | 8,000 | 8,429 |
|
| TOTAL SOUTH CAROLINA | | | 76,243 |
|
| South Dakota - 0.2% | | | |
| South Dakota Health & Edl. Facilities Auth. Rev.: | | | |
| (Reg'l. Health Proj.) Series 2010: | | | |
| 5% 9/1/16 | | 500 | 504 |
| 5% 9/1/17 | | 490 | 514 |
| Series 2011: | | | |
| 5% 9/1/17 | | 1,100 | 1,154 |
| 5% 9/1/18 | | 1,200 | 1,298 |
| 5% 9/1/19 | | 1,255 | 1,401 |
| Series 2014 B: | | | |
| 4% 11/1/19 | | 400 | 439 |
| 4% 11/1/20 | | 625 | 698 |
| 4% 11/1/21 | | 500 | 566 |
| 5% 11/1/22 | | 375 | 453 |
|
| TOTAL SOUTH DAKOTA | | | 7,027 |
|
| Tennessee - 0.1% | | | |
| Memphis-Shelby County Arpt. Auth. Arpt. Rev. Series 2010 B, 5% 7/1/16 (b) | | 1,730 | 1,730 |
| Metropolitan Nashville Arpt. Auth. Rev. Series 2010 A: | | | |
| 5% 7/1/16 | | 1,815 | 1,815 |
| 5% 7/1/17 | | 1,100 | 1,147 |
|
| TOTAL TENNESSEE | | | 4,692 |
|
| Texas - 10.3% | | | |
| Allen Independent School District Series 2013, 4% 2/15/18 | | 1,290 | 1,360 |
| Austin Elec. Util. Sys. Rev. 0% 5/15/18 (Nat'l. Pub. Fin. Guarantee Corp. Insured) | | 4,500 | 4,436 |
| Austin Independent School District Series 2004, 5% 8/1/17 | | 1,450 | 1,518 |
| Bastrop Independent School District Series 2007, 5.25% 2/15/37 (Pre-Refunded to 2/15/17 @ 100) | | 2,705 | 2,782 |
| Brownsville Util. Sys. Rev. Series 2015, 5% 9/1/17 | | 2,135 | 2,240 |
| Carroll Independent School District Series 2009 C, 5.25% 2/15/19 | | 1,000 | 1,115 |
| Central Reg'l. Mobility Auth. Series 2016: | | | |
| 5% 1/1/21 | | 500 | 576 |
| 5% 1/1/22 | | 1,500 | 1,765 |
| 5% 1/1/23 | | 2,450 | 2,938 |
| 5% 1/1/24 | | 3,370 | 4,101 |
| 5% 1/1/26 | | 2,865 | 3,585 |
| Cypress-Fairbanks Independent School District Bonds Series 2014 B3, 1.05%, tender 8/15/17 (a) | | 2,025 | 2,032 |
| Dallas Fort Worth Int'l. Arpt. Rev.: | | | |
| Series 2013 F: | | | |
| 5% 11/1/19 | | 2,000 | 2,268 |
| 5% 11/1/20 | | 1,500 | 1,751 |
| 5% 11/1/21 | | 3,000 | 3,581 |
| 5% 11/1/22 | | 5,000 | 6,078 |
| Series 2014 D, 5% 11/1/23 (b) | | 1,950 | 2,375 |
| Dallas Independent School District: | | | |
| Bonds: | | | |
| Series 2016 B1, 3%, tender 2/15/17 (a) | | 1,985 | 2,013 |
| Series 2016 B2, 4%, tender 2/15/18 (a) | | 3,970 | 4,178 |
| Series 2016 B3, 5%, tender 2/15/19 (a) | | 6,000 | 6,634 |
| Series 2016 B4, 5%, tender 2/15/20 (a) | | 7,000 | 7,984 |
| Series 2016 B5, 5%, tender 2/15/21 (a) | | 8,000 | 9,363 |
| Series 2016 B6, 5%, tender 2/15/22 (a) | | 10,000 | 11,989 |
| Series 2014 A, 4% 8/15/16 | | 9,280 | 9,320 |
| Dallas Wtrwks. & Swr. Sys. Rev. Series 2011, 5% 10/1/18 | | 1,600 | 1,752 |
| Dickinson Independent School District Bonds Series 2013, 1.05%, tender 7/1/17 (a) | | 5,150 | 5,168 |
| El Paso Gen. Oblig. Series 2014, 5% 8/15/18 | | 2,695 | 2,932 |
| Harris County Cultural Ed. Facilities Fin. Corp. Thermal Util. Rev. (TECO Proj.) Series 2009 A, 5% 11/15/16 | | 500 | 508 |
| Harris County Gen. Oblig. Series 2015 A, 4% 10/1/17 | | 2,500 | 2,605 |
| Houston Arpt. Sys. Rev.: | | | |
| Series 2011 A, 5% 7/1/17 (b) | | 7,380 | 7,679 |
| Series 2012 A, 5% 7/1/23 (b) | | 2,000 | 2,343 |
| Series A, 5% 7/1/16 | | 1,080 | 1,080 |
| Houston Util. Sys. Rev.: | | | |
| Bonds Series 2012 C, 1.01%, tender 7/7/16 (a) | | 9,200 | 9,198 |
| 5% 5/15/22 | | 5,000 | 6,062 |
| 5% 5/15/23 | | 7,000 | 8,689 |
| Kermit Independent School District Series 2007, 5.25% 2/15/32 (Pre-Refunded to 2/15/17 @ 100) | | 1,300 | 1,337 |
| Klein Independent School District Series 2009 A, 5% 8/1/16 | | 2,195 | 2,203 |
| Lewisville Independent School District Series 2009, 5% 8/15/17 | | 1,170 | 1,227 |
| Lower Colorado River Auth. Rev.: | | | |
| (LCRA Transmission Svcs. Corp. Proj.) Series 2010, 5% 5/15/18 | | 3,140 | 3,389 |
| Series 2010, 5% 5/15/17 | | 3,005 | 3,117 |
| Lubbock Health Facilities Dev. Corp. Rev. (St. Joseph Health Sys. Proj.) Series 2008 B: | | | |
| 5% 7/1/17 | | 2,800 | 2,916 |
| 5% 7/1/18 | | 3,030 | 3,278 |
| Mansfield Independent School District Series 2009, 4% 2/15/17 | | 1,840 | 1,879 |
| Mission Econ. Dev. Corp. Solid Waste Disp. Rev. Bonds (Republic Svcs., Inc. Proj.) Series 2008 A, 0.9%, tender 8/1/16 (a)(b) | | 12,850 | 12,850 |
| North East Texas Independent School District Series 2007 A, 5% 8/1/24 (Pre-Refunded to 8/1/17 @ 100) | | 10,000 | 10,465 |
| North Harris County Reg'l. Wtr. Auth. Series 2013, 4% 12/15/22 | | 1,580 | 1,836 |
| North Texas Tollway Auth. Rev.: | | | |
| Bonds Series 2012 C, 1.95%, tender 1/1/19 (a) | | 8,500 | 8,639 |
| Series 2016 A, 5% 1/1/26 | | 13,000 | 16,045 |
| 5.75% 1/1/38 (Pre-Refunded to 1/1/18 @ 100) | | 7,830 | 8,424 |
| Northside Independent School District Bonds: | | | |
| Series 2011 A, 2%, tender 6/1/19 (a) | | 6,225 | 6,385 |
| 1.2%, tender 8/1/17 (a) | | 28,800 | 28,947 |
| 2%, tender 6/1/21 (a) | | 10,000 | 10,396 |
| Plano Independent School District 5% 2/15/18 | | 2,500 | 2,654 |
| Port Houston Auth. Harris County Series 2015 B, 5% 10/1/17 (b) | | 2,000 | 2,107 |
| Round Rock Independent School District Series 2015, 5% 8/1/17 | | 5,000 | 5,235 |
| Sam Rayburn Muni. Pwr. Agcy. Series 2012, 5% 10/1/20 | | 1,000 | 1,148 |
| San Antonio Pub. Facilities Corp. and Rfdg. Lease (Convention Ctr. Proj.) Series 2012: | | | |
| 5% 9/15/20 | | 1,000 | 1,150 |
| 5% 9/15/21 | | 1,000 | 1,181 |
| 5% 9/15/22 | | 3,440 | 4,136 |
| San Antonio Wtr. Sys. Rev. Series 2012: | | | |
| 4% 5/15/19 | | 1,500 | 1,637 |
| 5% 5/15/20 | | 6,000 | 6,941 |
| 5% 5/15/21 | | 5,000 | 5,938 |
| Southwest Higher Ed. Auth. Rev. (Southern Methodist Univ. Proj.): | | | |
| Series 2009, 5% 10/1/16 | | 5,795 | 5,857 |
| Series 2016 A: | | | |
| 5% 10/1/20 | | 3,480 | 4,054 |
| 5% 10/1/21 | | 3,000 | 3,585 |
| Tarrant County Cultural Ed. Facilities Fin. Corp. Hosp. Rev.: | | | |
| (Scott & White Healthcare Proj.) Series 2013 A: | | | |
| 5% 8/15/21 | | 750 | 896 |
| 5% 8/15/23 | | 1,000 | 1,246 |
| Series 2013: | | | |
| 4% 9/1/18 | | 400 | 424 |
| 5% 9/1/19 | | 655 | 732 |
| 5% 9/1/20 | | 915 | 1,051 |
| 5.75% 11/15/24 (Pre-Refunded to 11/15/18 @ 100) | | 2,385 | 2,661 |
| Tarrant County Cultural Ed. Facilities Fin. Corp. Rev.: | | | |
| 5.75% 7/1/18 | | 2,600 | 2,722 |
| 5.75% 7/1/18 (Pre-Refunded to 7/1/16 @ 100) | | 50 | 50 |
| Texas Gen. Oblig.: | | | |
| Series 2009 A, 5% 10/1/16 | | 3,400 | 3,437 |
| Series 2014, 5% 10/1/16 | | 10,645 | 10,759 |
| Texas Muni. Pwr. Agcy. Rev. Series 2010, 5% 9/1/16 | | 750 | 755 |
| Texas Pub. Fin. Auth. Rev. Series 2014 B, 4% 7/1/17 | | 2,100 | 2,140 |
| Texas Trans. Commission Central Texas Tpk. Sys. Rev. Bonds Series 2015 A, 5%, tender 4/1/20 (a) | | 12,885 | 14,699 |
| Texas Trans. Commission State Hwy. Fund Rev.: | | | |
| Series 2007: | | | |
| 5% 4/1/20 (Pre-Refunded to 4/1/17 @ 100) | | 2,285 | 2,360 |
| 5% 4/1/25 (Pre-Refunded to 4/1/17 @ 100) | | 2,200 | 2,273 |
| 5% 4/1/26 (Pre-Refunded to 4/1/17 @ 100) | | 2,000 | 2,066 |
| Series 2015, 3% 10/1/17 | | 34,000 | 35,016 |
| Tomball Independent School District 5% 2/15/17 (Assured Guaranty Corp. Insured) | | 1,105 | 1,135 |
| Univ. of Texas Board of Regents Sys. Rev.: | | | |
| Series 2006 B, 5% 8/15/24 (Pre-Refunded to 8/15/16 @ 100) | | 5,975 | 6,004 |
| Series 2010 B, 5% 8/15/21 | | 1,800 | 2,156 |
| Univ. of Texas Permanent Univ. Fund Rev.: | | | |
| Series 2015 B, 4% 7/1/17 | | 5,625 | 5,816 |
| Series 2015, 5% 7/1/17 | | 1,985 | 2,072 |
|
| TOTAL TEXAS | | | 413,424 |
|
| Utah - 0.2% | | | |
| Utah Associated Muni. Pwr. Sys. Rev. (Payson Pwr. Proj.) 5% 9/1/17 | | 1,090 | 1,143 |
| Utah Gen. Oblig. Series 2009 C, 5% 7/1/16 | | 5,555 | 5,555 |
|
| TOTAL UTAH | | | 6,698 |
|
| Virginia - 1.1% | | | |
| Chesapeake Trans. Sys. Toll Road Rev. Series 2012 A: | | | |
| 4% 7/15/20 | | 605 | 667 |
| 5% 7/15/21 | | 400 | 466 |
| Fairfax County Gen. Oblig.: | | | |
| 5% 10/1/19 | | 8,000 | 9,090 |
| 5% 10/1/20 | | 6,710 | 7,869 |
| 5% 10/1/21 | | 3,000 | 3,614 |
| Fredericksburg Econ. Dev. Auth. Rev. Series 2014, 5% 6/15/24 | | 2,340 | 2,907 |
| Stafford County Econ. Dev. Auth. Hosp. Facilities Rev. Series 2016: | | | |
| 5% 6/15/24 | | 650 | 808 |
| 5% 6/15/25 | | 1,000 | 1,249 |
| 5% 6/15/26 | | 1,715 | 2,159 |
| Virginia College Bldg. Auth. Edl. Facilities Rev. (21st Century College and Equip. Progs.) Series 2015 D, 5% 2/1/17 | | 12,830 | 13,159 |
| York County Econ. Dev. Auth. Poll. Cont. Rev. Bonds (Virginia Elec. and Pwr. Co. Proj.) Series 2009 A, 1.875%, tender 5/16/19 (a) | | 2,500 | 2,550 |
|
| TOTAL VIRGINIA | | | 44,538 |
|
| Washington - 1.1% | | | |
| Grant County Pub. Util. District #2 Series 2012 A: | | | |
| 5% 1/1/20 | | 1,375 | 1,568 |
| 5% 1/1/21 | | 1,865 | 2,187 |
| King County Highline School District # 401 Series 2009: | | | |
| 5% 12/1/16 | | 6,350 | 6,464 |
| 5% 12/1/17 | | 2,950 | 3,128 |
| Port of Seattle Passenger Facilities Charge Rev. Series 2010 B, 5% 12/1/16 (b) | | 2,500 | 2,544 |
| Port of Seattle Rev.: | | | |
| Series 2010 C, 5% 2/1/17 (b) | | 2,500 | 2,561 |
| Series 2015 B, 5% 3/1/17 | | 5,000 | 5,140 |
| Seattle Muni. Lt. & Pwr. Rev. Series 2010 B, 5% 2/1/17 | | 2,000 | 2,051 |
| Tacoma Elec. Sys. Rev. Series 2013 A: | | | |
| 4% 1/1/20 | | 5,000 | 5,536 |
| 4% 1/1/21 | | 2,000 | 2,260 |
| 5% 1/1/20 | | 3,000 | 3,425 |
| 5% 1/1/21 | | 1,770 | 2,077 |
| Washington Gen. Oblig. Series 2012 AR, 5% 7/1/18 | | 5,000 | 5,423 |
|
| TOTAL WASHINGTON | | | 44,364 |
|
| West Virginia - 0.3% | | | |
| West Virginia Econ. Dev. Auth. Solid Waste Disp. Facilities Rev. Bonds: | | | |
| Series 2011 A, 2.25%, tender 9/1/16 (a)(b) | | 7,000 | 7,011 |
| 1.9%, tender 4/1/19 (a) | | 6,285 | 6,332 |
|
| TOTAL WEST VIRGINIA | | | 13,343 |
|
| Wisconsin - 0.5% | | | |
| Madison Gen. Oblig. Series 2014 A, 5% 10/1/21 | | 3,215 | 3,869 |
| Milwaukee County Arpt. Rev. Series 2013 A: | | | |
| 5% 12/1/20 (b) | | 1,330 | 1,526 |
| 5% 12/1/22 (b) | | 1,470 | 1,745 |
| 5.25% 12/1/23 (b) | | 1,540 | 1,884 |
| Wisconsin Health & Edl. Facilities: | | | |
| Bonds Series 2013 B, 4%, tender 3/1/18 (a) | | 2,090 | 2,200 |
| Series 2014: | | | |
| 4% 5/1/18 | | 375 | 392 |
| 4% 5/1/19 | | 285 | 302 |
| 5% 5/1/20 | | 410 | 452 |
| 5% 5/1/21 | | 640 | 711 |
| Wisconsin Health & Edl. Facilities Auth. Rev.: | | | |
| (Agnesian HealthCare, Inc. Proj.) Series 2010, 5% 7/1/16 | | 1,175 | 1,175 |
| (Aurora Health Care, Inc. Proj.) Series 2010 A, 5% 4/15/17 | | 1,500 | 1,549 |
| (Thedacare, Inc. Proj.) Series 2010: | | | |
| 5% 12/15/16 | | 1,440 | 1,468 |
| 5% 12/15/17 | | 1,540 | 1,633 |
| Series 2012, 5% 10/1/21 | | 1,400 | 1,650 |
|
| TOTAL WISCONSIN | | | 20,556 |
|
| TOTAL MUNICIPAL BONDS | | | |
| (Cost $3,594,200) | | | 3,684,452 |
|
| Municipal Notes - 4.6% | | | |
| Arkansas - 0.1% | | | |
| Blytheville Indl. Dev. Rev. (Nucor Corp. Proj.) Series 2002, 0.73% 7/7/16, VRDN (a)(b) | | 3,800 | $3,800 |
| Connecticut - 0.2% | | | |
| New Britain Gen. Oblig. BAN 2% 3/23/17 | | 5,000 | 5,044 |
| New London BAN Series 2016, 2% 3/23/17 | | 4,800 | 4,835 |
|
| TOTAL CONNECTICUT | | | 9,879 |
|
| Illinois - 0.6% | | | |
| Univ. of Illinois Board of Trustees Ctfs. of Prtn. (Util. Infrastructure Projs.) Series 2004, 0.99% 7/7/16 (Liquidity Facility BMO Harris Bank NA), VRDN (a) | | 25,100 | 25,100 |
| Kentucky - 0.1% | | | |
| Kentucky Pub. Trans. BAN Series 2013 A, 5% 7/1/17 | | 2,165 | 2,245 |
| New Jersey - 0.2% | | | |
| New Brunswick Gen. Oblig. BAN Series 2016, 3% 6/6/17 | | 7,723 | 7,862 |
| New York - 3.4% | | | |
| Albany Gen. Oblig. BAN Series 2016, 2% 6/30/17 | | 14,600 | 14,756 |
| Binghamton Gen. Oblig. BAN Series 2015 B, 2% 11/18/16 | | 11,300 | 11,349 |
| Lockport City School District BAN: | | | |
| Series 2015 A, 2% 8/5/16 | | 8,705 | 8,714 |
| Series 2015 B, 2% 8/5/16 | | 15,000 | 15,016 |
| New York Metropolitan Trans. Auth. Rev. BAN 2% 10/1/16 | | 54,600 | 54,804 |
| Rockland County Gen. Oblig. TAN Series 2016, 2% 3/16/17 | | 3,500 | 3,529 |
| Suffolk County Gen. Oblig. TAN 2% 7/27/16 | | 28,400 | 28,428 |
|
| TOTAL NEW YORK | | | 136,596 |
|
| TOTAL MUNICIPAL NOTES | | | |
| (Cost $185,482) | | | 185,482 |
| | | Shares | Value (000s) |
|
| Money Market Funds - 2.8% | | | |
| Fidelity Municipal Cash Central Fund, 0.44% (e)(f) | | | |
| (Cost $112,386) | | 112,386,000 | 112,386 |
| TOTAL INVESTMENT PORTFOLIO - 99.1% | | | |
| (Cost $3,892,068) | | | 3,982,320 |
| NET OTHER ASSETS (LIABILITIES) - 0.9% | | | 35,904 |
| NET ASSETS - 100% | | | $4,018,224 |
Security Type Abbreviations
BAN – BOND ANTICIPATION NOTE
TAN – TAX ANTICIPATION NOTE
VRDN – VARIABLE RATE DEMAND NOTE (A debt instrument that is payable upon demand, either daily, weekly or monthly)
Legend
(a) Coupon rates for floating and adjustable rate securities reflect the rates in effect at period end.
(b) Private activity obligations whose interest is subject to the federal alternative minimum tax for individuals.
(c) Security exempt from registration under Rule 144A of the Securities Act of 1933. These securities may be resold in transactions exempt from registration, normally to qualified institutional buyers. At the end of the period, the value of these securities amounted to $4,500,000 or 0.1% of net assets.
(d) Security or a portion of the security purchased on a delayed delivery or when-issued basis.
(e) Information in this report regarding holdings by state and security types does not reflect the holdings of the Fidelity Municipal Cash Central Fund.
(f) Affiliated fund that is available only to investment companies and other accounts managed by Fidelity Investments. The rate quoted is the annualized seven-day yield of the fund at period end. A complete unaudited listing of the fund's holdings as of its most recent quarter end is available upon request. In addition, each Fidelity Central Fund's financial statements are available on the SEC's website or upon request.
Affiliated Central Funds
Information regarding fiscal year to date income earned by the Fund from investments in Fidelity Central Funds is as follows:
| Fund | Income earned |
| | (Amounts in thousands) |
| Fidelity Municipal Cash Central Fund | $59 |
| Total | $59 |
Investment Valuation
All investments are categorized as Level 2 under the Fair Value Hierarchy. The inputs or methodology used for valuing securities may not be an indication of the risk associated with investing in those securities. For more information on valuation inputs please refer to the Investment Valuation section in the accompanying Notes to Financial Statements.
Other Information
The distribution of municipal securities by revenue source, as a percentage of total Net Assets, is as follows (Unaudited):
| General Obligations | 42.4% |
| Transportation | 11.8% |
| Special Tax | 10.0% |
| Electric Utilities | 9.1% |
| Health Care | 7.5% |
| Escrowed/Pre-Refunded | 5.2% |
| Others* (Individually Less Than 5%) | 14.0% |
| | 100.0% |
* Includes net other assets
See accompanying notes which are an integral part of the financial statements.
Financial Statements
Statement of Assets and Liabilities
| Amounts in thousands (except per-share amounts) | | June 30, 2016 (Unaudited) |
| Assets | | |
Investment in securities, at value — See accompanying schedule:
Unaffiliated issuers (cost $3,779,682) | $3,869,934 | |
| Fidelity Central Funds (cost $112,386) | 112,386 | |
| Total Investments (cost $3,892,068) | | $3,982,320 |
| Cash | | 58,411 |
| Receivable for investments sold | | 1,140 |
| Receivable for fund shares sold | | 8,615 |
| Interest receivable | | 40,159 |
| Distributions receivable from Fidelity Central Funds | | 37 |
| Other receivables | | 7 |
| Total assets | | 4,090,689 |
| Liabilities | | |
| Payable for investments purchased | | |
| Regular delivery | $32,000 | |
| Delayed delivery | 33,111 | |
| Payable for fund shares redeemed | 4,470 | |
| Distributions payable | 1,116 | |
| Accrued management fee | 1,200 | |
| Distribution and service plan fees payable | 133 | |
| Other affiliated payables | 403 | |
| Other payables and accrued expenses | 32 | |
| Total liabilities | | 72,465 |
| Net Assets | | $4,018,224 |
| Net Assets consist of: | | |
| Paid in capital | | $3,928,271 |
| Distributions in excess of net investment income | | (63) |
| Accumulated undistributed net realized gain (loss) on investments | | (236) |
| Net unrealized appreciation (depreciation) on investments | | 90,252 |
| Net Assets | | $4,018,224 |
| Calculation of Maximum Offering Price | | |
| Class A: | | |
| Net Asset Value and redemption price per share ($364,620÷ 33,959 shares) | | $10.74 |
| Maximum offering price per share (100/97.25 of $10.74) | | $11.04 |
| Class T: | | |
| Net Asset Value and redemption price per share ($21,890 ÷ 2,042 shares) | | $10.72 |
| Maximum offering price per share (100/97.25 of $10.72) | | $11.02 |
| Class C: | | |
| Net Asset Value and offering price per share ($61,947 ÷ 5,780 shares)(a) | | $10.72 |
| Limited Term Municipal Income: | | |
| Net Asset Value, offering price and redemption price per share ($3,267,793 ÷ 304,877 shares) | | $10.72 |
| Class I: | | |
| Net Asset Value, offering price and redemption price per share ($301,974 ÷ 28,158 shares) | | $10.72 |
(a) Redemption price per share is equal to net asset value less any applicable contingent deferred sales charge.
See accompanying notes which are an integral part of the financial statements.
Statement of Operations
| Amounts in thousands | | Six months ended June 30, 2016 (Unaudited) |
| Investment Income | | |
| Interest | | $37,090 |
| Income from Fidelity Central Funds | | 59 |
| Total income | | 37,149 |
| Expenses | | |
| Management fee | $7,025 | |
| Transfer agent fees | 2,060 | |
| Distribution and service plan fees | 812 | |
| Accounting fees and expenses | 307 | |
| Custodian fees and expenses | 14 | |
| Independent trustees' fees and expenses | 9 | |
| Registration fees | 140 | |
| Audit | 27 | |
| Legal | 2 | |
| Miscellaneous | 13 | |
| Total expenses before reductions | 10,409 | |
| Expense reductions | (22) | 10,387 |
| Net investment income (loss) | | 26,762 |
| Realized and Unrealized Gain (Loss) | | |
| Net realized gain (loss) on: | | |
| Investment securities: | | |
| Unaffiliated issuers | (227) | |
| Total net realized gain (loss) | | (227) |
| Change in net unrealized appreciation (depreciation) on investment securities | | 34,279 |
| Net gain (loss) | | 34,052 |
| Net increase (decrease) in net assets resulting from operations | | $60,814 |
See accompanying notes which are an integral part of the financial statements.
Statement of Changes in Net Assets
| Amounts in thousands | Six months ended June 30, 2016 (Unaudited) | Year ended December 31, 2015 |
| Increase (Decrease) in Net Assets | | |
| Operations | | |
| Net investment income (loss) | $26,762 | $57,962 |
| Net realized gain (loss) | (227) | 7,031 |
| Change in net unrealized appreciation (depreciation) | 34,279 | (25,919) |
| Net increase (decrease) in net assets resulting from operations | 60,814 | 39,074 |
| Distributions to shareholders from net investment income | (26,735) | (58,133) |
| Distributions to shareholders from net realized gain | – | (7,563) |
| Total distributions | (26,735) | (65,696) |
| Share transactions - net increase (decrease) | 186,686 | (152,171) |
| Redemption fees | 18 | 42 |
| Total increase (decrease) in net assets | 220,783 | (178,751) |
| Net Assets | | |
| Beginning of period | 3,797,441 | 3,976,192 |
| End of period | $4,018,224 | $3,797,441 |
| Other Information | | |
| Distributions in excess of net investment income end of period | $(63) | $(90) |
See accompanying notes which are an integral part of the financial statements.
Financial Highlights — Fidelity Limited Term Municipal Income Fund Class A
| | Six months ended (Unaudited) June 30, | Years ended December 31, | | | | |
| | 2016 | 2015 | 2014 | 2013 | 2012 | 2011 |
| Selected Per–Share Data | | | | | | |
| Net asset value, beginning of period | $10.64 | $10.71 | $10.68 | $10.86 | $10.83 | $10.62 |
| Income from Investment Operations | | | | | | |
| Net investment income (loss)A | .059 | .129 | .153 | .158 | .164 | .198 |
| Net realized and unrealized gain (loss) | .100 | (.048) | .046 | (.170) | .034 | .225 |
| Total from investment operations | .159 | .081 | .199 | (.012) | .198 | .423 |
| Distributions from net investment income | (.059) | (.130) | (.153) | (.158) | (.156) | (.205) |
| Distributions from net realized gain | – | (.021) | (.016) | (.010) | (.012) | (.008) |
| Total distributions | (.059) | (.151) | (.169) | (.168) | (.168) | (.213) |
| Redemption fees added to paid in capitalA,B | – | – | – | – | – | – |
| Net asset value, end of period | $10.74 | $10.64 | $10.71 | $10.68 | $10.86 | $10.83 |
| Total ReturnC,D,E | 1.50% | .76% | 1.87% | (.11)% | 1.84% | 4.03% |
| Ratios to Average Net AssetsF,G | | | | | | |
| Expenses before reductions | .81%H | .81% | .79% | .78% | .79% | .77% |
| Expenses net of fee waivers, if any | .81%H | .81% | .79% | .78% | .79% | .77% |
| Expenses net of all reductions | .81%H | .81% | .79% | .78% | .78% | .77% |
| Net investment income (loss) | 1.11%H | 1.21% | 1.42% | 1.47% | 1.51% | 1.85% |
| Supplemental Data | | | | | | |
| Net assets, end of period (in millions) | $365 | $377 | $397 | $318 | $394 | $336 |
| Portfolio turnover rateI | 23%H | 30% | 21% | 20% | 21% | 22% |
A Calculated based on average shares outstanding during the period.
B Amount represents less than $.0005 per share.
C Total returns for periods of less than one year are not annualized.
D Total returns would have been lower if certain expenses had not been reduced during the applicable periods shown.
E Total returns do not include the effect of the sales charges.
F Fees and expenses of any underlying Fidelity Central Funds are not included in the Fund's expense ratio. The Fund indirectly bears its proportionate share of the expenses of any underlying Fidelity Central Funds.
G Expense ratios reflect operating expenses of the class. Expenses before reductions do not reflect amounts reimbursed by the investment adviser or reductions from expense offset arrangements and do not represent the amount paid by the class during periods when reimbursements or reductions occur. Expenses net of fee waivers reflect expenses after reimbursement by the investment adviser but prior to reductions from expense offset arrangements. Expenses net of all reductions represent the net expenses paid by the class.
H Annualized
I Amount does not include the portfolio activity of any underlying Fidelity Central Funds.
See accompanying notes which are an integral part of the financial statements.
Financial Highlights — Fidelity Limited Term Municipal Income Fund Class T
| | Six months ended (Unaudited) June 30, | Years ended December 31, | | | | |
| | 2016 | 2015 | 2014 | 2013 | 2012 | 2011 |
| Selected Per–Share Data | | | | | | |
| Net asset value, beginning of period | $10.62 | $10.69 | $10.66 | $10.85 | $10.81 | $10.60 |
| Income from Investment Operations | | | | | | |
| Net investment income (loss)A | .061 | .134 | .157 | .162 | .166 | .199 |
| Net realized and unrealized gain (loss) | .100 | (.049) | .046 | (.180) | .044 | .226 |
| Total from investment operations | .161 | .085 | .203 | (.018) | .210 | .425 |
| Distributions from net investment income | (.061) | (.134) | (.157) | (.162) | (.158) | (.207) |
| Distributions from net realized gain | – | (.021) | (.016) | (.010) | (.012) | (.008) |
| Total distributions | (.061) | (.155) | (.173) | (.172) | (.170) | (.215) |
| Redemption fees added to paid in capitalA,B | – | – | – | – | – | – |
| Net asset value, end of period | $10.72 | $10.62 | $10.69 | $10.66 | $10.85 | $10.81 |
| Total ReturnC,D,E | 1.52% | .80% | 1.91% | (.17)% | 1.95% | 4.05% |
| Ratios to Average Net AssetsF,G | | | | | | |
| Expenses before reductions | .77%H | .77% | .76% | .75% | .77% | .76% |
| Expenses net of fee waivers, if any | .77%H | .77% | .76% | .75% | .77% | .76% |
| Expenses net of all reductions | .77%H | .77% | .75% | .75% | .76% | .76% |
| Net investment income (loss) | 1.15%H | 1.25% | 1.46% | 1.50% | 1.52% | 1.86% |
| Supplemental Data | | | | | | |
| Net assets, end of period (in millions) | $22 | $22 | $25 | $24 | $25 | $26 |
| Portfolio turnover rateI | 23%H | 30% | 21% | 20% | 21% | 22% |
A Calculated based on average shares outstanding during the period.
B Amount represents less than $.0005 per share.
C Total returns for periods of less than one year are not annualized.
D Total returns would have been lower if certain expenses had not been reduced during the applicable periods shown.
E Total returns do not include the effect of the sales charges.
F Fees and expenses of any underlying Fidelity Central Funds are not included in the Fund's expense ratio. The Fund indirectly bears its proportionate share of the expenses of any underlying Fidelity Central Funds.
G Expense ratios reflect operating expenses of the class. Expenses before reductions do not reflect amounts reimbursed by the investment adviser or reductions from expense offset arrangements and do not represent the amount paid by the class during periods when reimbursements or reductions occur. Expenses net of fee waivers reflect expenses after reimbursement by the investment adviser but prior to reductions from expense offset arrangements. Expenses net of all reductions represent the net expenses paid by the class.
H Annualized
I Amount does not include the portfolio activity of any underlying Fidelity Central Funds.
See accompanying notes which are an integral part of the financial statements.
Financial Highlights — Fidelity Limited Term Municipal Income Fund Class C
| | Six months ended (Unaudited) June 30, | Years ended December 31, | | | | |
| | 2016 | 2015 | 2014 | 2013 | 2012 | 2011 |
| Selected Per–Share Data | | | | | | |
| Net asset value, beginning of period | $10.62 | $10.69 | $10.66 | $10.84 | $10.81 | $10.60 |
| Income from Investment Operations | | | | | | |
| Net investment income (loss)A | .019 | .050 | .072 | .077 | .082 | .117 |
| Net realized and unrealized gain (loss) | .100 | (.049) | .046 | (.169) | .035 | .226 |
| Total from investment operations | .119 | .001 | .118 | (.092) | .117 | .343 |
| Distributions from net investment income | (.019) | (.050) | (.072) | (.078) | (.075) | (.125) |
| Distributions from net realized gain | – | (.021) | (.016) | (.010) | (.012) | (.008) |
| Total distributions | (.019) | (.071) | (.088) | (.088) | (.087) | (.133) |
| Redemption fees added to paid in capitalA,B | – | – | – | – | – | – |
| Net asset value, end of period | $10.72 | $10.62 | $10.69 | $10.66 | $10.84 | $10.81 |
| Total ReturnC,D,E | 1.12% | .01% | 1.11% | (.86)% | 1.08% | 3.25% |
| Ratios to Average Net AssetsF,G | | | | | | |
| Expenses before reductions | 1.56%H | 1.55% | 1.54% | 1.54% | 1.53% | 1.53% |
| Expenses net of fee waivers, if any | 1.56%H | 1.55% | 1.54% | 1.54% | 1.53% | 1.53% |
| Expenses net of all reductions | 1.56%H | 1.55% | 1.54% | 1.53% | 1.53% | 1.52% |
| Net investment income (loss) | .36%H | .47% | .67% | .72% | .76% | 1.09% |
| Supplemental Data | | | | | | |
| Net assets, end of period (in millions) | $62 | $63 | $65 | $71 | $92 | $79 |
| Portfolio turnover rateI | 23%H | 30% | 21% | 20% | 21% | 22% |
A Calculated based on average shares outstanding during the period.
B Amount represents less than $.0005 per share.
C Total returns for periods of less than one year are not annualized.
D Total returns would have been lower if certain expenses had not been reduced during the applicable periods shown.
E Total returns do not include the effect of the contingent deferred sales charge.
F Fees and expenses of any underlying Fidelity Central Funds are not included in the Fund's expense ratio. The Fund indirectly bears its proportionate share of the expenses of any underlying Fidelity Central Funds.
G Expense ratios reflect operating expenses of the class. Expenses before reductions do not reflect amounts reimbursed by the investment adviser or reductions from expense offset arrangements and do not represent the amount paid by the class during periods when reimbursements or reductions occur. Expenses net of fee waivers reflect expenses after reimbursement by the investment adviser but prior to reductions from expense offset arrangements. Expenses net of all reductions represent the net expenses paid by the class.
H Annualized
I Amount does not include the portfolio activity of any underlying Fidelity Central Funds.
See accompanying notes which are an integral part of the financial statements.
Financial Highlights — Fidelity Limited Term Municipal Income Fund
| | Six months ended (Unaudited) June 30, | Years ended December 31, | | | | |
| | 2016 | 2015 | 2014 | 2013 | 2012 | 2011 |
| Selected Per–Share Data | | | | | | |
| Net asset value, beginning of period | $10.63 | $10.69 | $10.66 | $10.85 | $10.81 | $10.60 |
| Income from Investment Operations | | | | | | |
| Net investment income (loss)A | .076 | .164 | .186 | .191 | .197 | .228 |
| Net realized and unrealized gain (loss) | .090 | (.039) | .046 | (.180) | .045 | .227 |
| Total from investment operations | .166 | .125 | .232 | .011 | .242 | .455 |
| Distributions from net investment income | (.076) | (.164) | (.186) | (.191) | (.190) | (.237) |
| Distributions from net realized gain | – | (.021) | (.016) | (.010) | (.012) | (.008) |
| Total distributions | (.076) | (.185) | (.202) | (.201) | (.202) | (.245) |
| Redemption fees added to paid in capitalA,B | – | – | – | – | – | – |
| Net asset value, end of period | $10.72 | $10.63 | $10.69 | $10.66 | $10.85 | $10.81 |
| Total ReturnC,D | 1.57% | 1.18% | 2.19% | .10% | 2.25% | 4.34% |
| Ratios to Average Net AssetsE,F | | | | | | |
| Expenses before reductions | .48%G | .48% | .48% | .48% | .48% | .48% |
| Expenses net of fee waivers, if any | .48%G | .48% | .48% | .48% | .48% | .48% |
| Expenses net of all reductions | .48%G | .48% | .48% | .48% | .47% | .48% |
| Net investment income (loss) | 1.44%G | 1.54% | 1.73% | 1.78% | 1.81% | 2.14% |
| Supplemental Data | | | | | | |
| Net assets, end of period (in millions) | $3,268 | $3,058 | $3,225 | $3,168 | $3,624 | $3,523 |
| Portfolio turnover rateH | 23%G | 30% | 21% | 20% | 21% | 22% |
A Calculated based on average shares outstanding during the period.
B Amount represents less than $.0005 per share.
C Total returns for periods of less than one year are not annualized.
D Total returns would have been lower if certain expenses had not been reduced during the applicable periods shown.
E Fees and expenses of any underlying Fidelity Central Funds are not included in the Fund's expense ratio. The Fund indirectly bears its proportionate share of the expenses of any underlying Fidelity Central Funds.
F Expense ratios reflect operating expenses of the class. Expenses before reductions do not reflect amounts reimbursed by the investment adviser or reductions from expense offset arrangements and do not represent the amount paid by the class during periods when reimbursements or reductions occur. Expenses net of fee waivers reflect expenses after reimbursement by the investment adviser but prior to reductions from expense offset arrangements. Expenses net of all reductions represent the net expenses paid by the class.
G Annualized
H Amount does not include the portfolio activity of any underlying Fidelity Central Funds.
See accompanying notes which are an integral part of the financial statements.
Financial Highlights — Fidelity Limited Term Municipal Income Fund Class I
| | Six months ended (Unaudited) June 30, | Years ended December 31, | | | | |
| | 2016 | 2015 | 2014 | 2013 | 2012 | 2011 |
| Selected Per–Share Data | | | | | | |
| Net asset value, beginning of period | $10.63 | $10.70 | $10.67 | $10.85 | $10.81 | $10.61 |
| Income from Investment Operations | | | | | | |
| Net investment income (loss)A | .073 | .156 | .179 | .184 | .191 | .224 |
| Net realized and unrealized gain (loss) | .090 | (.048) | .046 | (.169) | .045 | .216 |
| Total from investment operations | .163 | .108 | .225 | .015 | .236 | .440 |
| Distributions from net investment income | (.073) | (.157) | (.179) | (.185) | (.184) | (.232) |
| Distributions from net realized gain | – | (.021) | (.016) | (.010) | (.012) | (.008) |
| Total distributions | (.073) | (.178) | (.195) | (.195) | (.196) | (.240) |
| Redemption fees added to paid in capitalA,B | – | – | – | – | – | – |
| Net asset value, end of period | $10.72 | $10.63 | $10.70 | $10.67 | $10.85 | $10.81 |
| Total ReturnC,D | 1.53% | 1.02% | 2.12% | .14% | 2.19% | 4.19% |
| Ratios to Average Net AssetsE,F | | | | | | |
| Expenses before reductions | .55%G | .55% | .55% | .54% | .54% | .52% |
| Expenses net of fee waivers, if any | .55%G | .55% | .55% | .54% | .54% | .52% |
| Expenses net of all reductions | .55%G | .55% | .54% | .54% | .53% | .52% |
| Net investment income (loss) | 1.37%G | 1.47% | 1.67% | 1.71% | 1.76% | 2.09% |
| Supplemental Data | | | | | | |
| Net assets, end of period (in millions) | $302 | $276 | $263 | $207 | $206 | $152 |
| Portfolio turnover rateH | 23%G | 30% | 21% | 20% | 21% | 22% |
A Calculated based on average shares outstanding during the period.
B Amount represents less than $.0005 per share.
C Total returns for periods of less than one year are not annualized.
D Total returns would have been lower if certain expenses had not been reduced during the applicable periods shown.
E Fees and expenses of any underlying Fidelity Central Funds are not included in the Fund's expense ratio. The Fund indirectly bears its proportionate share of the expenses of any underlying Fidelity Central Funds.
F Expense ratios reflect operating expenses of the class. Expenses before reductions do not reflect amounts reimbursed by the investment adviser or reductions from expense offset arrangements and do not represent the amount paid by the class during periods when reimbursements or reductions occur. Expenses net of fee waivers reflect expenses after reimbursement by the investment adviser but prior to reductions from expense offset arrangements. Expenses net of all reductions represent the net expenses paid by the class.
G Annualized
H Amount does not include the portfolio activity of any underlying Fidelity Central Funds.
See accompanying notes which are an integral part of the financial statements.
Notes to Financial Statements (Unaudited)
For the period ended June 30, 2016
(Amounts in thousands except percentages)
1. Organization.
Fidelity Limited Term Municipal Income Fund (the Fund) is a fund of Fidelity Municipal Trust (the Trust) and is authorized to issue an unlimited number of shares. The Trust is registered under the Investment Company Act of 1940, as amended (the 1940 Act), as an open-end management investment company organized as a Massachusetts business trust. The Fund offers Class A, Class T, Class C, Limited Term Municipal Income and Class I shares, each of which has equal rights as to assets and voting privileges. Each class has exclusive voting rights with respect to matters that affect that class.
After the close of business on June 24, 2016, all outstanding Class B shares were converted to Class A shares. All current fiscal period dollar and share amounts for Class B presented in the Notes to Financial Statements are for the period January 1, 2016 through June 24, 2016.
2. Investments in Fidelity Central Funds.
The Fund invests in Fidelity Central Funds, which are open-end investment companies generally available only to other investment companies and accounts managed by the investment adviser and its affiliates. The Fund's Schedule of Investments lists each of the Fidelity Central Funds held as of period end, if any, as an investment of the Fund, but does not include the underlying holdings of each Fidelity Central Fund. As an Investing Fund, the Fund indirectly bears its proportionate share of the expenses of the underlying Fidelity Central Funds.
The Money Market Central Funds seek preservation of capital and current income and are managed by Fidelity Investments Money Management, Inc. (FIMM), an affiliate of the investment adviser. Annualized expenses of the Money Market Central Funds as of their most recent shareholder report date are less than .005%.
A complete unaudited list of holdings for each Fidelity Central Fund is available upon request or at the Securities and Exchange Commission (the SEC) website at www.sec.gov. In addition, the financial statements of the Fidelity Central Funds are available on the SEC website or upon request
3. Significant Accounting Policies.
The financial statements have been prepared in conformity with accounting principles generally accepted in the United States of America (GAAP), which require management to make certain estimates and assumptions at the date of the financial statements. Actual results could differ from those estimates. Subsequent events, if any, through the date that the financial statements were issued have been evaluated in the preparation of the financial statements. The following summarizes the significant accounting policies of the Fund:
Investment Valuation. Investments are valued as of 4:00 p.m. Eastern time on the last calendar day of the period. The Board of Trustees (the Board) has delegated the day to day responsibility for the valuation of the Fund's investments to the Fidelity Management & Research Company (FMR) Fair Value Committee (the Committee). In accordance with valuation policies and procedures approved by the Board, the Fund attempts to obtain prices from one or more third party pricing vendors or brokers to value its investments. When current market prices, quotations or currency exchange rates are not readily available or reliable, investments will be fair valued in good faith by the Committee, in accordance with procedures adopted by the Board. Factors used in determining fair value vary by investment type and may include market or investment specific events, changes in interest rates and credit quality. The frequency with which these procedures are used cannot be predicted and they may be utilized to a significant extent. The Committee oversees the Fund's valuation policies and procedures and reports to the Board on the Committee's activities and fair value determinations. The Board monitors the appropriateness of the procedures used in valuing the Fund's investments and ratifies the fair value determinations of the Committee.
The Fund categorizes the inputs to valuation techniques used to value its investments into a disclosure hierarchy consisting of three levels as shown below:
- Level 1 – quoted prices in active markets for identical investments
- Level 2 – other significant observable inputs (including quoted prices for similar investments, interest rates, prepayment speeds, etc.)
- Level 3 – unobservable inputs (including the Fund's own assumptions based on the best information available)
Valuation techniques used to value the Fund's investments by major category are as follows:
Debt securities, including restricted securities, are valued based on evaluated prices received from third party pricing vendors or from brokers who make markets in such securities. Municipal securities are valued by pricing vendors who utilize matrix pricing which considers yield or price of bonds of comparable quality, coupon, maturity and type or by broker-supplied prices. When independent prices are unavailable or unreliable, debt securities may be valued utilizing pricing methodologies which consider similar factors that would be used by third party pricing vendors. Debt securities are generally categorized as Level 2 in the hierarchy but may be Level 3 depending on the circumstances. The Fund invests a significant portion of its assets in below investment grade securities. The value of these securities can be more volatile due to changes in the credit quality of the issuer and is sensitive to changes in economic, market and regulatory conditions.
Investments in open-end mutual funds, including the Fidelity Central Funds, are valued at their closing net asset value (NAV) each business day and are categorized as Level 1 in the hierarchy.
Changes in valuation techniques may result in transfers in or out of an assigned level within the disclosure hierarchy. The aggregate value of investments by input level as of June 30, 2016 is included at the end of the Fund's Schedule of Investments.
Investment Transactions and Income. For financial reporting purposes, the Fund's investment holdings and NAV include trades executed through the end of the last business day of the period. The NAV per share for processing shareholder transactions is calculated as of the close of business of the New York Stock Exchange (NYSE), normally 4:00 p.m. Eastern time and includes trades executed through the end of the prior business day. Gains and losses on securities sold are determined on the basis of identified cost. Income and capital gain distributions from Fidelity Central Funds, if any, are recorded on the ex-dividend date. Interest income is accrued as earned and includes coupon interest and amortization of premium and accretion of discount on debt securities as applicable. Debt obligations may be placed on non-accrual status and related interest income may be reduced by ceasing current accruals and writing off interest receivables when the collection of all or a portion of interest has become doubtful based on consistently applied procedures. A debt obligation is removed from non-accrual status when the issuer resumes interest payments or when collectability of interest is reasonably assured.
Class Allocations and Expenses. Investment income, realized and unrealized capital gains and losses, common expenses of the Fund, and certain fund-level expense reductions, if any, are allocated daily on a pro-rata basis to each class based on the relative net assets of each class to the total net assets of the Fund. Each class differs with respect to transfer agent and distribution and service plan fees incurred. Certain expense reductions may also differ by class. For the reporting period, the allocated portion of income and expenses to each class as a percent of its average net assets may vary due to the timing of recording these transactions in relation to fluctuating net assets of the classes. Expenses directly attributable to a fund are charged to that fund. Expenses attributable to more than one fund are allocated among the respective funds on the basis of relative net assets or other appropriate methods. Expense estimates are accrued in the period to which they relate and adjustments are made when actual amounts are known.
Income Tax Information and Distributions to Shareholders. Each year, the Fund intends to qualify as a regulated investment company under Subchapter M of the Internal Revenue Code, including distributing substantially all of its taxable income and realized gains. As a result, no provision for U.S. Federal income taxes is required. The Fund files a U.S. federal tax return, in addition to state and local tax returns as required. The Fund's federal income tax returns are subject to examination by the Internal Revenue Service (IRS) for a period of three fiscal years after they are filed. State and local tax returns may be subject to examination for an additional fiscal year depending on the jurisdiction.
Dividends are declared and recorded daily and paid monthly from net investment income. Distributions from realized gains, if any, are declared and recorded on the ex-dividend date. Income dividends and capital gain distributions are declared separately for each class. Income and capital gain distributions are determined in accordance with income tax regulations, which may differ from GAAP.
Capital accounts within the financial statements are adjusted for permanent book-tax differences. These adjustments have no impact on net assets or the results of operations. Capital accounts are not adjusted for temporary book-tax differences which will reverse in a subsequent period.
Book-tax differences are primarily due to market discount, deferred trustees compensation and losses deferred due to wash sales and excise tax regulations.
The Fund purchases municipal securities whose interest, in the opinion of the issuer, is free from federal income tax. There is no assurance that the IRS will agree with this opinion. In the event the IRS determines that the issuer does not comply with relevant tax requirements, interest payments from a security could become federally taxable, possibly retroactively to the date the security was issued.
The federal tax cost of investment securities and unrealized appreciation (depreciation) as of period end were as follows:
| Gross unrealized appreciation | $91,984 |
| Gross unrealized depreciation | (1,693) |
| Net unrealized appreciation (depreciation) on securities | $90,291 |
| Tax cost | $3,892,029 |
The Fund elected to defer to its next fiscal year approximately $6 of capital losses recognized during the period November 1, 2015 to December 31, 2015.
Short-Term Trading (Redemption) Fees. Shares held by investors in the Fund less than 30 days may have been subject to a redemption fee equal to .50% of the NAV of shares redeemed. All redemption fees, which reduce the proceeds of the shareholder redemption, are retained by the Fund and accounted for as an addition to paid in capital.
Delayed Delivery Transactions and When-Issued Securities. During the period, the Fund transacted in securities on a delayed delivery or when-issued basis. Payment and delivery may take place after the customary settlement period for that security. The price of the underlying securities and the date when the securities will be delivered and paid for are fixed at the time the transaction is negotiated. The securities purchased on a delayed delivery or when-issued basis are identified as such in the Fund's Schedule of Investments. The Fund may receive compensation for interest forgone in the purchase of a delayed delivery or when-issued security. With respect to purchase commitments, the Fund identifies securities as segregated in its records with a value at least equal to the amount of the commitment. Losses may arise due to changes in the value of the underlying securities or if the counterparty does not perform under the contract's terms, or if the issuer does not issue the securities due to political, economic, or other factors.
Restricted Securities. The Fund may invest in securities that are subject to legal or contractual restrictions on resale. These securities generally may be resold in transactions exempt from registration or to the public if the securities are registered. Disposal of these securities may involve time-consuming negotiations and expense, and prompt sale at an acceptable price may be difficult. Information regarding restricted securities is included at the end of the Fund's Schedule of Investments.
4. Purchases and Sales of Investments.
Purchases and sales of securities, other than short-term securities, aggregated $603,781 and $416,156, respectively.
5. Fees and Other Transactions with Affiliates.
Management Fee. Fidelity Management & Research Company (the investment adviser) and its affiliates provide the Fund with investment management related services for which the Fund pays a monthly management fee. The management fee is the sum of an individual fund fee rate that is based on an annual rate of .25% of the Fund's average net assets and an annualized group fee rate that averaged .11% during the period. The group fee rate is based upon the average net assets of all the mutual funds advised by the investment adviser, including any mutual funds previously advised by the investment adviser that are currently advised by Fidelity SelectCo, LLC, an affiliate of the investment adviser. The group fee rate decreases as assets under management increase and increases as assets under management decrease. For the reporting period, the total annualized management fee rate was .36% of the Fund's average net assets.
Distribution and Service Plan Fees. In accordance with Rule 12b-1 of the 1940 Act, the Fund has adopted separate Distribution and Service Plans for each class of shares. Certain classes pay Fidelity Distributors Corporation (FDC), an affiliate of the investment adviser, separate Distribution and Service Fees, each of which is based on an annual percentage of each class' average net assets. In addition, FDC may pay financial intermediaries for selling shares of the Fund and providing shareholder support services. For the period, the Distribution and Service Fee rates, total fees and amounts retained by FDC were as follows:
| | Distribution
Fee | Service
Fee | Total Fees | Retained
by FDC |
| Class A | -% | .25% | $467 | $– |
| Class T | -% | .25% | 28 | – |
| Class B | .65% | .25% | 1 | 1 |
| Class C | .75% | .25% | 316 | 33 |
| | | | $812 | $34 |
Sales Load. FDC may receive a front-end sales charge of up to 2.75% for selling Class A shares and Class T shares, some of which is paid to financial intermediaries for selling shares of the Fund. Depending on the holding period, FDC may receive contingent deferred sales charges levied on Class A, Class T, Class B and Class C redemptions. The deferred sales charges range from 3.00% to 1.00% for Class B shares, 1.00% for Class C shares, .75% or .50% for certain purchases of Class A shares and .25% for certain purchases of Class T shares.
For the period, sales charge amounts retained by FDC were as follows:
| | Retained
by FDC |
| Class A | $5 |
| Class T | 2 |
| Class B(a) | –(b) |
| Class C(a) | 8 |
| | $15 |
(a) When Class B and Class C shares are initially sold, FDC pays commissions from its own resources to financial intermediaries through which the sales are made.
(b) In the amount of less than five hundred dollars.
Transfer Agent Fees. Fidelity Investments Institutional Operations Company, Inc. (FIIOC), an affiliate of the investment adviser, is the transfer, dividend disbursing and shareholder servicing agent for the Fund. FIIOC receives account fees and asset-based fees that vary according to the account size and type of account of the shareholders of the respective classes of the Fund. FIIOC pays for typesetting, printing and mailing of shareholder reports, except proxy statements. For the period, transfer agent fees for each class were as follows:
| | Amount | % of
Class-Level Average
Net Assets(a) |
| Class A | $313 | .17 |
| Class T | 15 | .13 |
| Class B | –(b) | .10 |
| Class C | 52 | .17 |
| Limited Term Municipal Income | 1,450 | .09 |
| Class I | 230 | .16 |
| | $2,060 | |
(a) Annualized
(b) In the amount of less than five hundred dollars.
Accounting Fees. Fidelity Service Company, Inc. (FSC), an affiliate of the investment adviser, maintains the Fund's accounting records. The fee is based on the level of average net assets for each month.
Interfund Trades. The Fund may purchase from or sell securities to other Fidelity Funds under procedures adopted by the Board. The procedures have been designed to ensure these interfund trades are executed in accordance with Rule 17a-7 of the 1940 Act. Interfund trades are included within the respective purchases and sales amounts shown in the Purchases and Sales of Investments note.
6. Committed Line of Credit.
The Fund participates with other funds managed by the investment adviser or an affiliate in a $4.25 billion credit facility (the "line of credit") to be utilized for temporary or emergency purposes to fund shareholder redemptions or for other short-term liquidity purposes. The Fund has agreed to pay commitment fees on its pro-rata portion of the line of credit, which amounted to $3 and is reflected in Miscellaneous expenses on the Statement of Operations. During the period, the Fund did not borrow on this line of credit.
7. Expense Reductions.
Through arrangements with the Fund's custodian, credits realized as a result of certain uninvested cash balances were used to reduce the Fund's expenses. During the period, these credits reduced the Fund's custody expenses by $14.
In addition, during the period the investment adviser reimbursed and/or waived a portion of the fund-level operating expenses in the amount of $8.
8. Distributions to Shareholders.
Distributions to shareholders of each class were as follows:
| | Six months ended
June 30, 2016 | Year ended December 31, 2015 |
| From net investment income | | |
| Class A | $2,065 | $4,860 |
| Class T | 126 | 289 |
| Class B | 1 | 2 |
| Class C | 113 | 303 |
| Limited Term Municipal Income | 22,492 | 48,674 |
| Class I | 1,938 | 4,005 |
| Total | $26,735 | $58,133 |
| From net realized gain | | |
| Class A | $– | $751 |
| Class T | – | 45 |
| Class B | – | 1 |
| Class C | – | 125 |
| Limited Term Municipal Income | – | 6,100 |
| Class I | – | 541 |
| Total | $– | $7,563 |
9. Share Transactions.
Share transactions for each class were as follows and may contain automatic conversions between classes or exchanges between affiliated funds:
| | Shares | Shares | Dollars | Dollars |
| | Six months ended
June 30, 2016 | Year ended December 31, 2015 | Six months ended
June 30, 2016 | Year ended December 31, 2015 |
| Class A | | | | |
| Shares sold | 7,252 | 16,831 | $77,596 | $179,831 |
| Reinvestment of distributions | 176 | 483 | 1,883 | 5,154 |
| Shares redeemed | (8,914) | (18,951) | (95,378) | (202,084) |
| Net increase (decrease) | (1,486) | (1,637) | $(15,899) | $(17,099) |
| Class T | | | | |
| Shares sold | 256 | 791 | $2,730 | $8,447 |
| Reinvestment of distributions | 11 | 30 | 118 | 316 |
| Shares redeemed | (284) | (1,080) | (3,031) | (11,510) |
| Net increase (decrease) | (17) | (259) | $(183) | $(2,747) |
| Class B | | | | |
| Shares sold | 3 | 3 | $28 | $17 |
| Reinvestment of distributions | –(a) | –(a) | 1 | 3 |
| Shares redeemed | (30) | (14) | (317) | (144) |
| Net increase (decrease) | (27) | (11) | $(288) | $(124) |
| Class C | | | | |
| Shares sold | 600 | 1,149 | $6,410 | $12,246 |
| Reinvestment of distributions | 9 | 34 | 92 | 359 |
| Shares redeemed | (803) | (1,330) | (8,574) | (14,162) |
| Net increase (decrease) | (194) | (147) | $(2,072) | $(1,557) |
| Limited Term Municipal Income | | | | |
| Shares sold | 47,303 | 66,529 | $505,162 | $709,164 |
| Reinvestment of distributions | 1,556 | 3,861 | 16,622 | 41,135 |
| Shares redeemed | (31,802) | (84,109) | (339,665) | (895,882) |
| Net increase (decrease) | 17,057 | (13,719) | $182,119 | $(145,583) |
| Class I | | | | |
| Shares sold | 6,990 | 13,372 | $74,692 | $142,602 |
| Reinvestment of distributions | 144 | 335 | 1,543 | 3,575 |
| Shares redeemed | (4,980) | (12,317) | (53,226) | (131,238) |
| Net increase (decrease) | 2,154 | 1,390 | $23,009 | $14,939 |
(a) In the amount of less than five hundred shares
10. Other.
The Fund's organizational documents provide former and current trustees and officers with a limited indemnification against liabilities arising in connection with the performance of their duties to the Fund. In the normal course of business, the Fund may also enter into contracts that provide general indemnifications. The Fund's maximum exposure under these arrangements is unknown as this would be dependent on future claims that may be made against the Fund. The risk of material loss from such claims is considered remote.
Shareholder Expense Example
As a shareholder of the Fund, you incur two types of costs: (1) transaction costs, including sales charges (loads) on purchase payments or redemption proceeds, redemption fees and (2) ongoing costs, including management fees, distribution and/or service (12b-1) fees and other Fund expenses. This Example is intended to help you understand your ongoing costs (in dollars) of investing in the Fund and to compare these costs with the ongoing costs of investing in other mutual funds.
The Example is based on an investment of $1,000 invested at the beginning of the period and held for the entire period (January 1, 2016 to June 30, 2016).
Actual Expenses
The first line of the accompanying table for each class of the Fund provides information about actual account values and actual expenses. You may use the information in this line, together with the amount you invested, to estimate the expenses that you paid over the period. Simply divide your account value by $1,000.00 (for example, an $8,600 account value divided by $1,000.00 = 8.6), then multiply the result by the number in the first line for a class of the Fund under the heading entitled "Expenses Paid During Period" to estimate the expenses you paid on your account during this period. A small balance maintenance fee of $12.00 that is charged once a year may apply for certain accounts with a value of less than $2,000. This fee is not included in the table below. If it was, the estimate of expenses you paid during the period would be higher, and your ending account value lower, by this amount.
Hypothetical Example for Comparison Purposes
The second line of the accompanying table for each class of the Fund provides information about hypothetical account values and hypothetical expenses based on a Class' actual expense ratio and an assumed rate of return of 5% per year before expenses, which is not the Class' actual return. The hypothetical account values and expenses may not be used to estimate the actual ending account balance or expenses you paid for the period. You may use this information to compare the ongoing costs of investing in the Fund and other funds. To do so, compare this 5% hypothetical example with the 5% hypothetical examples that appear in the shareholder reports of the other funds. A small balance maintenance fee of $12.00 that is charged once a year may apply for certain accounts with a value of less than $2,000. This fee is not included in the table below. If it was, the estimate of expenses you paid during the period would be higher, and your ending account value lower, by this amount.
Please note that the expenses shown in the table are meant to highlight your ongoing costs only and do not reflect any transaction costs. Therefore, the second line of the table is useful in comparing ongoing costs only, and will not help you determine the relative total costs of owning different funds. In addition, if these transactional costs were included, your costs would have been higher.
| | Annualized Expense Ratio-A | Beginning
Account Value
January 1, 2016 | Ending
Account Value
June 30, 2016 | Expenses Paid
During Period-B
January 1, 2016
to June 30, 2016 |
| Class A | .81% | | | |
| Actual | | $1,000.00 | $1,015.00 | $4.06 |
| Hypothetical-C | | $1,000.00 | $1,020.84 | $4.07 |
| Class T | .77% | | | |
| Actual | | $1,000.00 | $1,015.20 | $3.86 |
| Hypothetical-C | | $1,000.00 | $1,021.03 | $3.87 |
| Class C | 1.56% | | | |
| Actual | | $1,000.00 | $1,011.20 | $7.80 |
| Hypothetical-C | | $1,000.00 | $1,017.11 | $7.82 |
| Limited Term Municipal Income | .48% | | | |
| Actual | | $1,000.00 | $1,015.70 | $2.41 |
| Hypothetical-C | | $1,000.00 | $1,022.48 | $2.41 |
| Class I | .55% | | | |
| Actual | | $1,000.00 | $1,015.30 | $2.76 |
| Hypothetical-C | | $1,000.00 | $1,022.13 | $2.77 |
A Annualized expense ratio reflects expenses net of applicable fee waivers.
B Expenses are equal to each Class' annualized expense ratio, multiplied by the average account value over the period, multiplied by 182/366 (to reflect the one-half year period).
C 5% return per year before expenses
ASTM-SANN-0816
1.803548.112
Item 2.
Code of Ethics
Not applicable.
Item 3.
Audit Committee Financial Expert
Not applicable.
Item 4.
Principal Accountant Fees and Services
Not applicable.
Item 5.
Audit Committee of Listed Registrants
Not applicable.
Item 6.
Investments
(a)
Not applicable.
(b)
Not applicable
Item 7.
Disclosure of Proxy Voting Policies and Procedures for Closed-End Management Investment Companies
Not applicable.
Item 8.
Portfolio Managers of Closed-End Management Investment Companies
Not applicable.
Item 9.
Purchase of Equity Securities by Closed-End Management Investment Company and Affiliated Purchasers
Not applicable.
Item 10.
Submission of Matters to a Vote of Security Holders
There were no material changes to the procedures by which shareholders may recommend nominees to the Fidelity Municipal Trust’s Board of Trustees.
Item 11.
Controls and Procedures
(a)(i) The President and Treasurer and the Chief Financial Officer have concluded that the Fidelity Municipal Trust’s (the “Trust”) disclosure controls and procedures (as defined in Rule 30a-3(c) under the Investment Company Act) provide reasonable assurances that material information relating to the Trust is made known to them by the appropriate persons, based on their evaluation of these controls and procedures as of a date within 90 days of the filing date of this report.
(a)(ii) There was no change in the Trust’s internal control over financial reporting (as defined in Rule 30a-3(d) under the Investment Company Act) that occurred during the second fiscal quarter of the period covered by this report that has materially affected, or is reasonably likely to materially affect, the Trust’s internal control over financial reporting.
Item 12.
Exhibits
| | |
(a) | (1) | Not applicable. |
(a) | (2) | Certification pursuant to Rule 30a-2(a) under the Investment Company Act of 1940 (17 CFR 270.30a-2(a)) is filed and attached hereto as Exhibit 99.CERT. |
(a) | (3) | Not applicable. |
(b) |
| Certification pursuant to Rule 30a-2(b) under the Investment Company Act of 1940 (17 CFR 270.30a-2(b)) is furnished and attached hereto as Exhibit 99.906CERT. |
SIGNATURES
Pursuant to the requirements of the Securities Exchange Act of 1934 and the Investment Company Act of 1940, the registrant has duly caused this report to be signed on its behalf by the undersigned, thereunto duly authorized.
Fidelity Municipal Trust
| |
By: | /s/Stephanie J. Dorsey |
| Stephanie J. Dorsey |
| President and Treasurer |
|
|
Date: | August 25, 2016 |
Pursuant to the requirements of the Securities Exchange Act of 1934 and the Investment Company Act of 1940, this report has been signed below by the following persons on behalf of the registrant and in the capacities and on the dates indicated.
| |
By: | /s/Stephanie J. Dorsey |
| Stephanie J. Dorsey |
| President and Treasurer |
|
|
Date: | August 25, 2016 |
| |
By: | /s/Howard J. Galligan III |
| Howard J. Galligan III |
| Chief Financial Officer |
|
|
Date: | August 25, 2016 |