Table of Contents
UNITED STATES
SECURITIES AND EXCHANGE COMMISSION
Washington, D.C. 20549
FORM N-CSR
CERTIFIED SHAREHOLDER REPORT OF REGISTERED
MANAGEMENT INVESTMENT COMPANIES
Investment Company Act File Number 002-73024
GARTMORE VARIABLE INSURANCE TRUST
(Exact name of registrant as specified in charter)
| 1200 RIVER ROAD, SUITE 1000, CONSHOHOCKEN, PENNSYLVANIA | 19428 | |
| (Address of principal executive offices) | (Zip code) |
Eric Miller
1200 River Road
Suite 1000
Conshohocken, PA 19428
(Name and address of agent for service)
Registrant’s telephone number, including area code: (484) 530-1300
Date of fiscal year end: 12/31/2005
Date of reporting period: 06/30/2005
Form N-CSR is to be used by management investment companies to file reports with the Commission not later than 10 days after the transmission to stockholders of any report that is required to be transmitted to stockholders under Rule 30e-1 under the Investment Company Act of 1940 (17 CFR 270.30e-1). The Commission may use the information provided on Form N-CSR in its regulatory, disclosure review, inspection, and policymaking roles.
A registrant is required to disclose the information specified by Form N-CSR, and the Commission will make this information public. A registrant is not required to respond to the collection of information contained in Form N-CSR unless the Form displays a currently valid Office of Management and Budget (“OMB”) control number. Please direct comments concerning the accuracy of the information collection burden estimate and any suggestions for reducing the burden to Secretary, Securities and Exchange Commission, 450 Fifth Street, NW, Washington, DC 20549-0609. The OMB has reviewed this collection of information under the clearance requirements of 44 U.S.C. § 3507.
Table of Contents
| Item 1. | Reports to Stockholders. |
Include a copy of the report transmitted to stockholders pursuant to Rule 30e-1 under the Act (17 CFR 270.30e-1).
Table of Contents
Gartmore GVIT Nationwide Fund
Semiannual Report
| | June 30, 2005 |


| Contents | ||
| 5 | Statement of Investments | |
| 10 | Statement of Assets and Liabilities | |
| 10 | Statement of Operations | |
| 11 | Statements of Changes in Net Assets | |
| 13 | Financial Highlights | |
| 14 | Notes to Financial Statements | |
Commentary provided by Gartmore Global Investments, investment adviser to Gartmore Variable Insurance Trust. All opinions and estimates included in this report constitute Gartmore Global Investments’ judgment as of the date of this report and are subject to change without notice.
Statement Regarding Availability of Quarterly Portfolio Schedule.
The Gartmore Variable Insurance Trust files complete schedules of portfolio holdings for each Fund with the Securities and Exchange Commission (the “Commission”) for the first and third quarters of each fiscal year on Form N-Q. The Funds’ Forms N-Q are available on the Commission’s website at http://www.sec.gov. The Funds’ Forms N-Q may be reviewed and copied at the Commission’s Public Reference Room in Washington, DC, and information on the operation of the Public Reference Room may be obtained by calling 800-SEC-0330; and the Funds make the information on Form N-Q available to shareholders upon request without charge.
Statement Regarding Availability of Proxy Voting Record.
Information regarding how the Fund voted proxies relating to portfolio securities held during the most recent 12-month period ended June 30, 2005 is available without charge, upon request, by calling 800-848-0920, and on the Commission’s website at http://www.sec.gov.
Table of Contents
Gartmore GVIT Nationwide Fund
For the semiannual period ended June 30, 2005, the Gartmore GVIT Nationwide Fund returned 0.49% (Class I at NAV) versus -0.81% for its benchmark, the S&P 500® Index. For broader comparison, the average return for the Fund’s Lipper peer category of Large-Cap Core Funds was -0.76%.
One of our goals in managing this Fund is to stay relatively close to the benchmark’s sector weightings and to add value primarily through stock selection. In that respect, the Fund was successful during the reporting period, as stock picking made significant contributions to the Fund’s performance in the financials, information technology, consumer discretionary and health care sectors.
In financials, the Fund benefited from its investments in The Allstate Corp., MetLife Inc. and Prudential Financial Inc., three insurers with relatively modest valuations, solid fundamentals and well-known brands. Global financial services provider Lehman Brothers Holdings Inc. also did well, paced by growing geographic diversification and strength in its asset management business that enabled the firm to exceed expectations for its fiscal second quarter, ended May 31, 2005.
In information technology, the Fund was helped by microprocessor maker Intel Corp., which reported better-than-expected sales and earnings for the first quarter of 2005. We liked Intel’s strong product line and its tight control of inventories, both of which we thought boded well for the firm’s near-term financial results. Although technology giants, International Business Machines Corp. (IBM) and Microsoft Corp. both performed poorly and detracted from the Fund’s absolute performance, they helped versus the benchmark because we significantly underweighted them. Particularly in IBM’s case, we thought the stock was expensive and growth prospects were unexciting.
On the negative side, the Fund was hurt by unfavorable stock selection in industrials and materials, along with an overweighting in materials. In industrials, we experienced poor performance from railroads Norfolk Southern Corp. and Burlington Northern Santa Fe Corp., as well as trucking company J.B. Hunt Transport Services, Inc. Concerns about increasing freight capacity in the truck and rail markets at a time when demand could falter caused the stocks to retreat. In the materials sector, the Fund was hurt by International Paper Co., which warned near the end of June that second-quarter earnings would fall short of the company’s previous estimates due to tepid paper and industrial packaging sales.
Our outlook is fairly positive for the remainder of 2005, as we believe that stock valuations are generally reasonable and global economic growth, while not spectacular, should allow for pockets of strong earnings gains. At a price of $60 per barrel, crude oil represents a significant challenge for consumers and many businesses. However, we think that high oil prices should not prevent the U.S. economy from continuing to grow at a moderate pace, if perhaps somewhat slower than it did in the first half of the year. Rising short-term interest rates also could inhibit growth, but it’s important to remember that, from a historical standpoint, rates remain low. At the company level, we’re still finding opportunities with strong earnings prospects, along with good dividend yields.
PORTFOLIO MANAGERS: Gary Haubold, CFA and William H. Miller
Investing in mutual funds involves risk, including possible loss of principal.
There is no assurance that the investment objective of any fund will be achieved.
Standard & Poor’s 500 (S&P 500) Index: An unmanaged, capitalization-weighted index of 500 widely held stocks of large-cap U.S. companies that gives a broad look at how the stock prices of those companies have performed.
Lipper Analytical Services, Inc. is an industry research firm whose rankings are based on total return performance and do not reflect the effects of sales charges.
The Gartmore Variable Insurance Trust Funds are available only as sub-account investment options in certain variable insurance products. Accordingly, investors are unable to invest in shares of these funds outside of an insurance product. Performance information found herein reflects only the performance of these funds, and does not indicate the performance your sub-account may experience under your variable insurance contract. Performance returns assume reinvestment of all distributions. The investment return and principal value of an investment will fluctuate so that an investor’s shares, when redeemed, may be worth more or less than their original cost. Index performance is provided for comparison purposes only; the indexes shown are unmanaged and do not reflect any fees or expenses. Investors cannot invest directly in market indexes. To obtain performance information about the sub-account option under your insurance contract that invests in one of these funds, please contact your variable insurance carrier. PAST PERFORMANCE IS NO GUARANTEE OF FUTURE RESULTS.
Commentary provided by Gartmore Global Investments. All opinions and estimates included in this report constitute Gartmore Global Investments’ judgment as of the date of this report and are subject to change without notice.
Investors should carefully consider a fund’s investment objectives, risks, fees, charges and expenses before investing any money. To obtain this and other information on Gartmore Variable Insurance Trust, please contact your variable insurance contract provider or call 800-848-0920. Please read the Trust’s prospectus carefully before investing any money.
Gartmore Funds distributed by Gartmore Distribution Services, Inc., Member NASD. 1200 River Road, Suite 1000, Conshohocken, PA 19428.
1
Table of Contents
Fund Performance | Gartmore GVIT Nationwide Fund |
| Average | Annual Total Return1 |
(For Periods Ended June 30, 2005)
| Six months* | One year | Five years | Ten years | |||||
| Class I2 | 0.49% | 7.94% | -0.60% | 8.31% | ||||
| Class II3 | 0.29% | 7.73% | -0.81% | 8.05% | ||||
| Class III3 | 0.41% | 7.95% | -0.56% | 8.33% | ||||
| Class IV3 | 0.40% | 7.85% | -0.61% | 8.31% |
| * | Not Annualized. |
| 1 | Not subject to any sales charges. |
| 2 | The existing shares of the Fund were designated Class I shares as of May 1, 2001. |
| 3 | These returns until the creation of Class II shares (July 11, 2002) Class III shares (May 6, 2002) and Class IV shares (April 28, 2003) are based on the performance of the Class I shares of the Fund. Excluding the effect of fee waivers or reimbursements, such prior performance is similar to what Class II, Class III and Class IV shares would have produced because all classes of shares invest in the same portfolio of securities. Class II shares’ annual returns have been restated to reflect the additional fees applicable to Class II shares and therefore are lower than those of Class I. For Class III shares, these returns do not reflect the short-term trading fees applicable to such shares; if these fees were reflected, the annual returns for Class III shares would have been lower. |
| Performance | of a $10,000 Investment |
Investment return and principal value will fluctuate, and when redeemed, shares may be worth more or less than original cost. Past performance is no guarantee of future results and does not reflect the deduction of taxes that a shareholder would pay on fund distributions or the redemption of fund shares. Investing in mutual funds involves market risk, including loss of principal. Performance returns assume the reinvestment of all distributions.
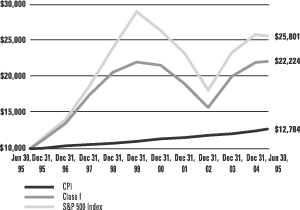
Comparative performance of $10,000 invested in Class I shares of the Gartmore GVIT Nationwide Fund, Standard & Poor’s 500 Index (S&P 500)(a), and Consumer Price Index (CPI)(b) over as 10-year period ended 06/30/05. Unlike, the Fund, the returns for these unmanaged indexes do not reflect any fees, expenses, or sales charges. Investors cannot invest directly in market indexes.
| (a) | S&P 500 is an unmanaged, market capitalization-weighted index of 500 widely held stocks of large-cap U.S. companies that gives a broad look at how the stock prices of those companies have performed. |
| (b) | The CPI represents changes in prices of a basket of goods and services purchased for consumption by urban households. |
2
Table of Contents
Shareholder
Expense Example | Gartmore GVIT Nationwide Fund |
As a shareholder of the Fund, you incur two types of costs: (1) transaction costs, including sales charges (loads) paid on purchase payments and redemption fees; and (2) ongoing costs, including investment advisory fees, administration fees, distribution fees and other Fund expenses. The examples below are intended to help you understand your ongoing costs (in dollars) of investing in the Fund and to compare these costs with the ongoing costs of investing in other mutual funds. Per SEC requirements, the examples assume that you had a $1,000 investment in the Class at the beginning of the reporting period, January 1, 2005, and continued to hold your shares at the end of the reporting period, June 30, 2005.
Actual Expenses
For each Class of the Fund in the table below, the first line provides information about actual account values and actual expenses. You may use the information in this line, together with the amount you invested, to estimate the expenses that you paid over the period. Simply divide your account value by $1,000 (for example, an $8,600 account value divided by $1,000 = 8.6), then multiply the result by the number in the first line of each Class under the heading entitled “Expenses Paid During Period��� to estimate the expenses you paid on your account during the period.
Hypothetical Example for Comparison Purposes
The second line of each Class in the table below provides information about hypothetical account values and hypothetical expenses based on the Class’ actual expense ratio and an assumed rate of return of 5% per year before expenses, which is not the Class’ actual return. The hypothetical account values and expenses may not be used to estimate the actual ending account balance or expenses you paid for the period. You may use this information to compare the ongoing costs of investing in the Class of the Fund and other funds. To do so, compare this 5% hypothetical example with the 5% hypothetical examples that appear in the shareholder reports of the other funds.
Please note that the expenses shown in the table are meant to highlight your ongoing costs only and do not reflect any transaction costs, such as sales charges (loads) or redemption fees. Therefore, the second line for each Class in the table is useful in comparing ongoing costs only, and will not help you determine the relative total costs of owning different funds. In addition, if these transaction costs were included, your costs would have been higher. The examples also assume all dividends and distributions have been reinvested.
| Beginning Account Value, January 1, 2005 | Ending Account Value, June 30, 2005 | Expenses Paid During Period* | Annualized Expense Ratio* | ||||||||||
| Nationwide Fund | |||||||||||||
Class I | Actual | $ | 1,000 | $ | 1,005 | $ | 4.08 | 0.82% | |||||
| Hypothetical1 | $ | 1,000 | $ | 1,021 | $ | 4.12 | 0.82% | ||||||
Class II | Actual | $ | 1,000 | $ | 1,003 | $ | 5.36 | 1.08% | |||||
| Hypothetical1 | $ | 1,000 | $ | 1,020 | $ | 5.42 | 1.08% | ||||||
Class III | Actual | $ | 1,000 | $ | 1,004 | $ | 3.98 | 0.80% | |||||
| Hypothetical1 | $ | 1,000 | $ | 1,021 | $ | 4.02 | 0.80% | ||||||
Class IV | Actual | $ | 1,000 | $ | 1,004 | $ | 4.07 | 0.82% | |||||
| Hypothetical1 | $ | 1,000 | $ | 1,021 | $ | 4.12 | 0.82% | ||||||
| * | Expenses are equal to the Fund’s annualized expense ratio multiplied by the average account value over the period multiplied by 181/365 (to reflect the one-half year period). The expense ratio presented represents a six month, annualized ratio in accordance with SEC guidelines. |
| 1 | Represents the hypothetical 5% return before expenses. |
3
Table of Contents
Portfolio Summary
(June 30, 2005) | Gartmore GVIT Nationwide Fund |
The SEC adopted a requirement that Funds present their portfolio holdings in a table, chart or graph format in their annual and semiannual reports to shareholders, whether or not a statement of investments is utilized. The following tables, which present portfolio holdings as a percentage of net assets, are provided in compliance with this requirement.
| Asset Allocation | ||
| Common Stocks | 96.5% | |
| Commercial Paper | 4.6% | |
| Other Investments* | 5.6% | |
| Liabilities in excess of other assets** | -6.7% | |
| 100.0% | ||
| Top Holdings | ||
| Johnson & Johnson, Inc. | 3.1% | |
| ChevronTexaco Corp. | 3.0% | |
| Countrywide Home Loans, 3.45%, 07/01/05 | 2.7% | |
| Exxon Mobil Corp. | 2.6% | |
| Microsoft Corp. | 2.5% | |
| General Electric Co. | 2.4% | |
| UBS Delaware, 3.26%, 07/05/05 | 1.9% | |
| Bank of America Corp. | 1.9% | |
| Unitedhealth Group, Inc. | 1.9% | |
| Altria Group, Inc. | 1.7% | |
| Other Holdings | 76.3% | |
| 100.0% | ||
| Top Industries | ||
| Oil & Gas | 11.7% | |
| Financial Services | 8.3% | |
| Healthcare | 8.2% | |
| Banks | 7.9% | |
| Computer Software & Services | 6.8% | |
| Retail | 6.2% | |
| Insurance | 4.9% | |
| Transportation | 4.3% | |
| Capital Goods | 3.5% | |
| Semiconductors | 3.4% | |
| Other Industries | 34.8% | |
| 100.0% | ||
| * | Includes value of collateral received from securities lending. |
| ** | Includes value of collateral owed from securities lending. |
4
Table of Contents
GARTMORE VARIABLE INSURANCE TRUST
GARTMORE GVIT NATIONWIDE FUND
Statement of Investments — June 30, 2005 (Unaudited)
| Shares or Principal Amount | Value | ||||
| COMMON STOCKS (96.5%) | |||||
| Advertising Agencies (0.2%) | |||||
| Monster Worldwide, Inc. (b) | 99,765 | $ | 2,861,260 | ||
| Aerospace & Defense (1.4%) | |||||
| Northrop Grumman Corp. | 232,612 | 12,851,813 | |||
| Raytheon Co. | 216,820 | 8,481,998 | |||
| 21,333,811 | |||||
| Airlines (0.2%) | |||||
| Southwest Airlines Co. | 257,390 | 3,585,443 | |||
| Auto/Truck Parts & Equipment (0.4%) | |||||
| Autoliv, Inc. | 115,850 | 5,074,230 | |||
| Oshkosh Truck Corp. | 16,600 | 1,299,448 | |||
| 6,373,678 | |||||
| Banks (5.2%) | |||||
| AmSouth Bancorp | 36,000 | 936,000 | |||
| Bank of America Corp. | 592,782 | 27,036,787 | |||
| Bank of New York Co., Inc. | 101,600 | 2,924,048 | |||
| Centerstate Bank of Florida | 11,840 | 386,339 | |||
| Comerica, Inc. | 48,000 | 2,774,400 | |||
| Compass Bancshares, Inc. | 10,000 | 450,000 | |||
| KeyCorp | 7,300 | 241,995 | |||
| National City Corp. | 49,000 | 1,671,880 | |||
| Northern Trust Corp. | 13,560 | 618,200 | |||
| PNC Bank Corp. | 28,000 | 1,524,880 | |||
| State Street Corp. | 36,100 | 1,741,825 | |||
| SunTrust Banks, Inc. | 42,000 | 3,034,080 | |||
| Wachovia Corp. | 483,448 | 23,979,021 | |||
| Zions Bancorp | 140,168 | 10,306,553 | |||
| 77,626,008 | |||||
| Broadcast Media & Cable Television (0.9%) | |||||
| Comcast Corp., Class A (b) | 203,594 | 6,250,336 | |||
| Viacom, Inc., Class B | 215,479 | 6,899,637 | |||
| 13,149,973 | |||||
| Building & Construction (1.3%) | |||||
| Builders Firstsource, Inc. (b) | 87,200 | 1,412,640 | |||
| Centex Corp. | 1,330 | 93,991 | |||
| Comstock Homebuilding Co., Class A (b) | 2,360 | 57,159 | |||
| D. R. Horton, Inc. | 15,880 | 597,247 | |||
| Lennar Corp. | 56,900 | 3,610,305 | |||
| Masco Corp. | 65,400 | 2,077,104 | |||
| Pulte Corp. | 45,919 | 3,868,676 | |||
| Weyerhaeuser Co. | 121,450 | 7,730,292 | |||
| 19,447,414 | |||||
| Shares or Principal Amount | Value | ||||
| COMMON STOCKS (continued) | |||||
| Business Services (0.2%) | |||||
| Pitney Bowes, Inc. | 74,000 | $ | 3,222,700 | ||
| Capital Goods (3.5%) | |||||
| Black & Decker Corp. | 51,900 | 4,663,215 | |||
| General Electric Co. | 1,024,275 | 35,491,129 | |||
| PACCAR, Inc. | 63,495 | 4,317,660 | |||
| Sherwin-Williams Co. | 23,000 | 1,083,070 | |||
| Timken Co. | 265,920 | 6,142,752 | |||
| 51,697,826 | |||||
| Chemicals (1.6%) | |||||
| Air Products & Chemicals, Inc. | 23,000 | 1,386,900 | |||
| Albemarle Corp. | 54,640 | 1,992,721 | |||
| Ashland, Inc. | 80,661 | 5,797,106 | |||
| Dow Chemical Co. | 99,800 | 4,444,094 | |||
| Lubrizol Corp. | 134,117 | 5,634,255 | |||
| Olin Corp. | 69,900 | 1,274,976 | |||
| PPG Industries, Inc. | 23,400 | 1,468,584 | |||
| Sigma-Aldrich Corp. | 23,000 | 1,288,920 | |||
| 23,287,556 | |||||
| Coal (0.4%) | |||||
| Massey Energy Co. | 65,700 | 2,478,204 | |||
| Peabody Energy Corp. | 78,400 | 4,079,936 | |||
| 6,558,140 | |||||
| Computer Equipment (2.7%) | |||||
| ATI Technologies, Inc. (b) | 80,500 | 953,925 | |||
| Dell, Inc. (b) | 452,692 | 17,885,861 | |||
| Hewlett Packard Co. | 381,200 | 8,962,012 | |||
| International Business Machines Corp. | 90,494 | 6,714,655 | |||
| Seagate Technology Co. | 301,500 | 5,291,325 | |||
| Western Digital Corp. (b) | 39,800 | 534,116 | |||
| 40,341,894 | |||||
| Computer Networks (0.4%) | |||||
| Cisco Systems, Inc. (b) | 310,643 | 5,936,388 | |||
| Computer Software & Services (6.8%) | |||||
| Adobe Systems, Inc. | 59,100 | 1,691,442 | |||
| Advanced Micro Devices, Inc. (b) | 204,400 | 3,544,296 | |||
| Affiliated Computer Services, Class A (b) | 111,003 | 5,672,253 | |||
| Avid Technology (b) | 14,000 | 745,920 | |||
5
Table of Contents
GARTMORE VARIABLE INSURANCE TRUST
GARTMORE GVIT NATIONWIDE FUND
Statement of Investments — June 30, 2005 (Unaudited) (continued)
| Shares or Principal Amount | Value | ||||
| COMMON STOCKS (continued) | |||||
| Computer Software & Services (continued) | |||||
| Check Point Software Technologies Ltd. ADR — IL (b) | 34,000 | $ | 673,200 | ||
| Checkfree Corp. (b) | 29,000 | 987,740 | |||
| Cognizant Technology Solutions Corp. (b) | 102,800 | 4,844,964 | |||
| Computer Sciences Corp. (b) | 109,935 | 4,804,160 | |||
| eBay, Inc. (b) | 69,100 | 2,280,991 | |||
| Electronic Data Systems Corp. | 294,350 | 5,666,238 | |||
| EMC Corp. (b) | 254,901 | 3,494,693 | |||
| Intuit, Inc. (b) | 20,000 | 902,200 | |||
| Microsoft Corp. | 1,504,356 | 37,368,202 | |||
| Oracle Corp. (b) | 720,400 | 9,509,280 | |||
| Quest Software, Inc. (b) | 13,000 | 177,190 | |||
| Verisign, Inc. (b) | 388,888 | 11,184,419 | |||
| Yahoo!, Inc. (b) | 193,072 | 6,689,945 | |||
| 100,237,133 | |||||
| Conglomerates (0.4%) | |||||
| Ingersoll Rand Co. | 79,924 | 5,702,577 | |||
| Consumer Products (0.8%) | |||||
| Colgate-Palmolive Co. | 72,237 | 3,605,349 | |||
| ConAgra, Inc. | 35,480 | 821,717 | |||
| Estee Lauder Cos., Class A | 175,876 | 6,882,027 | |||
| Mattel, Inc. | 23,000 | 420,900 | |||
| VF Corp. | 13,600 | 778,192 | |||
| 12,508,185 | |||||
| Containers—Metal & Glass (0.3%) | |||||
| Ball Corp. | 76,100 | 2,736,556 | |||
| Owens-Illinois, Inc. (b) | 65,560 | 1,642,278 | |||
| 4,378,834 | |||||
| Cruise Lines (0.7%) | |||||
| Royal Caribbean Cruises Ltd. | 212,211 | 10,262,524 | |||
| Drugs (0.6%) | |||||
| Amgen, Inc. (b) | 149,165 | 9,018,516 | |||
| Electronics (0.7%) | |||||
| Arrow Electronics, Inc. (b) | 213,500 | 5,798,660 | |||
| KLA-Tencor Corp. | 88,000 | 3,845,600 | |||
| 9,644,260 | |||||
| Energy (0.1%) | |||||
| Progress Energy, Inc. | 33,000 | 1,492,920 | |||
| Financial Services (8.3%) | |||||
| American Express Co. | 78,400 | 4,173,232 | |||
| Bear Stearns Cos., Inc. | 92,128 | 9,575,784 | |||
| Shares or Principal Amount | Value | ||||
| COMMON STOCKS (continued) | |||||
| Financial Services (continued) | |||||
| Capital One Financial Corp. | 164,515 | $ | 13,162,845 | ||
| Citigroup, Inc. | 140,663 | 6,502,850 | |||
| Countrywide Credit Industries, Inc. | 265,951 | 10,268,368 | |||
| E*Trade Group, Inc. (b) | 30,000 | 419,700 | |||
| Edwards (A.G.), Inc. | 14,300 | 645,645 | |||
| First American Financial Corp. | 128,350 | 5,151,969 | |||
| Freddie Mac | 9,137 | 596,007 | |||
| Goldman Sachs Group, Inc. | 77,428 | 7,899,205 | |||
| Greenhill & Co., Inc. | 24,100 | 976,291 | |||
| Hudson City Bancorp, Inc. | 556,000 | 6,343,960 | |||
| Interactive Data Corp. | 15,000 | 311,700 | |||
| J.P. Morgan Chase & Co. | 196,943 | 6,956,027 | |||
| Kkr Financial Corp. (b) | 236,100 | 5,902,500 | |||
| Lehman Brothers Holding, Inc. | 215,851 | 21,429,686 | |||
| Merrill Lynch & Co., Inc. | 195,734 | 10,767,327 | |||
| Morgan Stanley | 140,965 | 7,396,434 | |||
| New York Community Bancorp | 13,000 | 235,560 | |||
| Robert Half International, Inc. | 18,200 | 454,454 | |||
| T Rowe Price Group, Inc. | 8,000 | 500,800 | |||
| United Dominion Realty Trust, Inc. | 6,600 | 158,730 | |||
| Wells Fargo & Co. | 19,500 | 1,200,810 | |||
| 121,029,884 | |||||
| Food & Beverage (2.2%) | |||||
| Archer-Daniels-Midland Co. | 317,472 | 6,787,552 | |||
| Brown-Forman Corp. | 23,000 | 1,390,580 | |||
| Campbell Soup Co. | 157,200 | 4,837,044 | |||
| Constellation Brands, Inc. (b) | 174,950 | 5,161,025 | |||
| Hershey Foods Corp. | 20,000 | 1,242,000 | |||
| Hormel Foods Corp. | 166,500 | 4,883,445 | |||
| PepsiCo, Inc. | 62,357 | 3,362,913 | |||
| Safeway, Inc. | 161,946 | 3,658,360 | |||
| Smithfield Foods, Inc. (b) | 61,168 | 1,668,051 | |||
| 32,990,970 | |||||
| Gaming & Leisure (0.1%) | |||||
| Boyd Gaming Corp. | 25,190 | 1,287,965 | |||
| Healthcare (8.2%) | |||||
| Aetna, Inc. | 105,600 | 8,745,792 | |||
| Bristol-Myers Squibb Co. | 175,704 | 4,389,086 | |||
| Genzyme Corp. (b) | 123,569 | 7,425,261 | |||
| HCA, Inc. | 15,600 | 884,052 | |||
| Johnson & Johnson, Inc. | 689,812 | 44,837,779 | |||
| Manor Care, Inc. | 20,000 | 794,600 | |||
6
Table of Contents
GARTMORE VARIABLE INSURANCE TRUST
GARTMORE GVIT NATIONWIDE FUND
Statement of Investments — June 30, 2005 (Unaudited) (continued)
| Shares or Principal Amount | Value | ||||
| COMMON STOCKS (continued) | |||||
| Healthcare (continued) | |||||
| Medco Health Solutions, Inc. (b) | 93,050 | $ | 4,965,148 | ||
| Triad Hospitals, Inc. (b) | 143,300 | 7,829,912 | |||
| Unitedhealth Group, Inc. | 510,726 | 26,629,254 | |||
| Varian Medical Systems, Inc. (b) | 52,000 | 1,941,160 | |||
| Wellpoint, Inc. (b) | 156,200 | 10,877,768 | |||
| 119,319,812 | |||||
| Hotels & Motels (0.5%) | |||||
| Starwood Hotels & Resorts Worldwide | 133,165 | 7,799,474 | |||
| Instruments—Scientific (0.3%) | |||||
| Thermo Electron Corp. (b) | 187,233 | 5,030,951 | |||
| Insurance (4.9%) | |||||
| ACE Ltd. | 15,000 | 672,750 | |||
| Allstate Corp. | 277,118 | 16,557,800 | |||
| American International Group, Inc. | 161,011 | 9,354,739 | |||
| Aon Corp. | 14,000 | 350,560 | |||
| Assurant, Inc. | 168,817 | 6,094,294 | |||
| Chubb Corp. | 87,950 | 7,529,400 | |||
| Hartford Financial Services Group, Inc. | 101,750 | 7,608,865 | |||
| MetLife, Inc. | 166,194 | 7,468,758 | |||
| Principal Financial Group | 90,310 | 3,783,989 | |||
| Prudential Financial, Inc. | 160,865 | 10,562,396 | |||
| Wellchoice, Inc. (b) | 15,600 | 1,083,732 | |||
| XL Capital Ltd. | 20,000 | 1,488,400 | |||
| 72,555,683 | |||||
| Machinery & Equipment (0.1%) | |||||
| Deere & Co. | 21,000 | 1,375,290 | |||
| Toro Co. | 14,400 | 555,984 | |||
| 1,931,274 | |||||
| Manufacturing (1.1%) | |||||
| American Standard Cos., Inc. | 82,003 | 3,437,566 | |||
| Danaher Corp. | 69,138 | 3,618,683 | |||
| Eaton Corp. | 4,100 | 245,590 | |||
| Illinois Tool Works, Inc. | 21,700 | 1,729,056 | |||
| Textron, Inc. | 10,600 | 804,010 | |||
| Tyco International Ltd. | 204,185 | 5,962,202 | |||
| 15,797,107 | |||||
| Medical Products (1.1%) | |||||
| Bausch & Lomb, Inc. | 69,771 | 5,790,993 | |||
| Becton, Dickinson & Co. | 71,800 | 3,767,346 | |||
| Shares or Principal Amount | Value | ||||
| COMMON STOCKS (continued) | |||||
| Medical Products (continued) | |||||
| Fisher Scientific International, Inc. (b) | 105,250 | $ | 6,830,725 | ||
| 16,389,064 | |||||
| Metals (1.3%) | |||||
| Phelps Dodge Corp. | 167,400 | 15,484,500 | |||
| Southern Peru Copper Corp. | 92,980 | 3,983,263 | |||
| 19,467,763 | |||||
| Multi-Industry (0.3%) | |||||
| Lowes Corp. | 62,550 | 4,847,625 | |||
| Multimedia (2.1%) | |||||
| Carmike Cinemas, Inc. | 1,700 | 52,156 | |||
| Dreamworks Animation, Inc. (b) | 12,370 | 324,094 | |||
| EchoStar Communications Corp., Class A | 135,257 | 4,077,999 | |||
| Liberty Media Corp. (b) | 486,100 | 4,953,359 | |||
| News Corp. | 101,757 | 1,646,428 | |||
| Time Warner, Inc. (b) | 678,166 | 11,332,154 | |||
| Walt Disney Co. (The) | 318,016 | 8,007,643 | |||
| Westwood One, Inc. | 20,000 | 408,600 | |||
| 30,802,433 | |||||
| Office Automation & Equipment (0.3%) | |||||
| Xerox Corp. (b) | 322,764 | 4,450,916 | |||
| Oil & Gas (11.7%) | |||||
| Amerada Hess Corp. | 1,400 | 149,114 | |||
| Anadarko Petroleum Corp. | 49,500 | 4,066,425 | |||
| Apache Corp. | 120,580 | 7,789,468 | |||
| Baker Hughes, Inc. | 43,200 | 2,210,112 | |||
| BJ Services Co. | 60,200 | 3,159,296 | |||
| Bois D’ARC Energy, Inc. (b) | 128,090 | 1,889,328 | |||
| ChevronTexaco Corp. | 764,738 | 42,764,148 | |||
| Conocophillips | 300,164 | 17,256,428 | |||
| ENSCO International, Inc. | 20,700 | 740,025 | |||
| Exxon Mobil Corp. | 679,768 | 39,066,266 | |||
| Kerr-Mcgee Corp. | 37,000 | 2,823,470 | |||
| Nabors Industries Ltd. (b) | 177,190 | 10,741,258 | |||
| National-OilWell, Inc. (b) | 115,400 | 5,486,116 | |||
| Newfield Exploration Co. (b) | 12,000 | 478,680 | |||
| Occidental Petroleum Corp. | 24,000 | 1,846,320 | |||
| Oneok, Inc. | 33,835 | 1,104,713 | |||
| Praxair, Inc. | 86,800 | 4,044,880 | |||
| Precision Drilling Corp. ADR — CA (b) | 24,000 | 947,520 | |||
7
Table of Contents
GARTMORE VARIABLE INSURANCE TRUST
GARTMORE GVIT NATIONWIDE FUND
Statement of Investments — June 30, 2005 (Unaudited) (continued)
| Shares or Principal Amount | Value | ||||
| COMMON STOCKS (continued) | |||||
| Oil & Gas (continued) | |||||
| Rowan Cos., Inc. | 34,200 | $ | 1,016,082 | ||
| Sempra Energy | 379,970 | 15,696,561 | |||
| Shell Transport & Trading Co. ADR — GB | 13,400 | 778,004 | |||
| Smith International, Inc. | 20,300 | 1,293,110 | |||
| Transocean, Inc. (b) | 22,000 | 1,187,340 | |||
| Unit Corp. (b) | 13,000 | 572,130 | |||
| Weatherford International, Inc. (b) | 81,700 | 4,736,966 | |||
| 171,843,760 | |||||
| Paper & Forest Products (1.1%) | |||||
| International Paper Co. | 332,090 | 10,032,439 | |||
| Meadwestvaco Corp. | 209,757 | 5,881,586 | |||
| 15,914,025 | |||||
| Pharmaceuticals (1.3%) | |||||
| Pfizer, Inc. | 706,555 | 19,486,787 | |||
| Restaurants (1.2%) | |||||
| Darden Restaurants, Inc. | 261,823 | 8,634,923 | |||
| McDonald’s Corp. | 332,600 | 9,229,650 | |||
| 17,864,573 | |||||
| Retail (6.2%) | |||||
| Albertson’s, Inc. | 791,366 | 16,365,449 | |||
| Costco Wholesale Corp. | 160,206 | 7,180,433 | |||
| CVS Corp. | 337,900 | 9,822,753 | |||
| Dollar General | 162,833 | 3,315,280 | |||
| Federated Department Stores, Inc. | 63,850 | 4,678,928 | |||
| Foot Locker, Inc. | 16,000 | 435,520 | |||
| Home Depot, Inc. | 131,226 | 5,104,691 | |||
| Hughes Supply, Inc. | 22,500 | 632,250 | |||
| Kohl’s Corp. (b) | 130,995 | 7,323,930 | |||
| Kroger Co. (b) | 117,462 | 2,235,302 | |||
| Office Depot, Inc. (b) | 196,620 | 4,490,801 | |||
| Petsmart, Inc. | 196,383 | 5,960,224 | |||
| Radioshack Corp. | 218,806 | 5,069,735 | |||
| Staples, Inc. | 319,400 | 6,809,608 | |||
| Target Corp. | 67,065 | 3,649,007 | |||
| Wal-Mart Stores, Inc. | 195,153 | 9,406,375 | |||
| 92,480,286 | |||||
| Semiconductors (3.4%) | |||||
| Altera Corp. (b) | 30,000 | 594,600 | |||
| Applied Materials, Inc. | 79,400 | 1,284,692 | |||
| Shares or Principal Amount | Value | ||||
| COMMON STOCKS (continued) | |||||
| Semiconductors (continued) | |||||
| Intel Corp. | 876,836 | $ | 22,850,346 | ||
| Maxim Integrated Products, Inc. | 172,893 | 6,606,242 | |||
| Microchip Technology, Inc. | 236,116 | 6,993,756 | |||
| Micron Technology, Inc. (b) | 448,009 | 4,574,172 | |||
| Novellus Systems (b) | 31,025 | 766,628 | |||
| Texas Instruments, Inc. | 259,677 | 7,289,133 | |||
| 50,959,569 | |||||
| Steel (0.4%) | |||||
| Carpenter Technology Corp. | 18,000 | 932,400 | |||
| Nucor Corp. | 42,700 | 1,947,974 | |||
| United States Steel Corp. | 69,600 | 2,392,152 | |||
| 5,272,526 | |||||
| Technology (0.7%) | |||||
Ingram Micro, Inc. (b) | 299,600 | 4,691,736 | |||
| Linear Technology Corp. | 75,000 | 2,751,750 | |||
| Rockwell International Corp. | 16,000 | 779,360 | |||
| Xilinx, Inc. | 109,181 | 2,784,116 | |||
| 11,006,962 | |||||
| Telecommunications (2.9%) | |||||
| Alltel Corp. | 89,800 | 5,592,744 | |||
| Corning, Inc. (b) | 126,610 | 2,104,258 | |||
| Harris Corp. | 179,950 | 5,616,240 | |||
| Motorola, Inc. | 543,972 | 9,932,929 | |||
| SBC Communications, Inc. | 477,139 | 11,332,050 | |||
| Sprint Corp. | 247,150 | 6,200,994 | |||
| Verizon Communications | 51,587 | 1,782,331 | |||
| 42,561,546 | |||||
| Tire & Rubber (0.0%) | |||||
| Bandag, Inc. | 290 | 13,355 | |||
| Tobacco (2.2%) | |||||
| Altria Group, Inc. | 390,451 | 25,246,561 | |||
| Reynolds American, Inc. | 80,512 | 6,344,346 | |||
| U.S.T., Inc. | 25,000 | 1,141,500 | |||
| 32,732,407 | |||||
| Transportation (4.3%) | |||||
| Burlington Northern Santa Fe Corp. | 482,750 | 22,727,871 | |||
| CSX Corp. | 157,050 | 6,699,753 | |||
| Fedex Corp. | 66,800 | 5,411,468 | |||
| J.B. Hunt Transport Services, Inc. | 544,778 | 10,514,215 | |||
8
Table of Contents
GARTMORE VARIABLE INSURANCE TRUST
GARTMORE GVIT NATIONWIDE FUND
Statement of Investments — June 30, 2005 (Unaudited) (continued)
| Shares or Principal Amount | Value | |||||
| COMMON STOCKS (continued) | ||||||
| Transportation (continued) | ||||||
| Norfolk Southern Corp. | 571,042 | $ | 17,679,460 | |||
| Union Pacific Corp. | 8,300 | 537,840 | ||||
| 63,570,607 | ||||||
| Utilities (1.6%) | ||||||
| AES Corp. (b) | 185,219 | 3,033,887 | ||||
| Constellation Energy Group | 123,369 | 7,117,158 | ||||
| Dominion Resources, Inc. | 25,700 | 1,886,123 | ||||
| Duke Energy Corp. | 325,000 | 9,662,250 | ||||
| Nisource, Inc. | 5,000 | 123,650 | ||||
| Southern Co. | 43,500 | 1,508,145 | ||||
| 23,331,213 | ||||||
| Total Common Stocks | 1,429,405,577 | |||||
| COMMERCIAL PAPER (4.6%) | ||||||
| Banks—Domestic (2.7%) | ||||||
| Countrywide Home Loans, 3.45%, 07/01/05 | $ | 41,144,000 | 41,144,000 | |||
| Banks—Foreign (1.9%) | ||||||
| UBS Delaware, 3.26%, 07/05/05 | 27,411,000 | 27,398,589 | ||||
| Total Commercial Paper | 68,542,589 | |||||
| Shares or Principal Amount | Value | ||||||
| SHORT-TERM SECURITIES HELD AS COLLATERAL FOR SECURITIES LENDING (5.6%) | |||||||
| Pool of short-term securities for Gartmore Variable Insurance Trust Funds — note 2 (Securities Lending) | $ | 82,516,865 | $ | 82,516,865 | |||
| Total Short-Term Securities Held as Collateral for Securities Lending | 82,516,865 | ||||||
| Total Investments (Cost $1,488,429,456) (a) — 106.7% | 1,580,465,031 | ||||||
| Liabilities in excess of other assets — (6.7%) | (99,670,410 | ) | |||||
| NET ASSETS — 100.0% | $ | 1,480,794,621 | |||||
| (a) | See notes to financial statement for tax unrealized appreciation (depreciation) of securities. |
| (b) | Denotes a non-income producing security. |
| ADR | American Depositary Receipt |
| CA | Canada |
| GB | United Kingdom |
| IL | Israel |
At June 30, 2005 the Fund’s open futures contracts were as follows:
| Number of Contracts | Long Contracts* | Expiration | Market Value Covered by Contracts | Unrealized Appreciation/ (Depreciation) | |||||||
15 | S&P 500 Futures | 09/15/05 | $ | 4,483,125 | $ | (39,750 | ) | ||||
| * | Cash pledged as collateral. |
See notes to financial statements.
9
Table of Contents
GARTMORE VARIABLE INSURANCE TRUST
GARTMORE GVIT NATIONWIDE FUND
Statement of Assets and Liabilities
June 30, 2005 (Unaudited)
Assets: | ||||
Investments, at value (cost $1,488,429,456) | $ | 1,580,465,031 | ||
Cash | 236,654 | |||
Interest and dividends receivable | 1,332,183 | |||
Receivable for investments sold | 15,437,574 | |||
Prepaid expenses and other assets | 49,503 | |||
Total Assets | 1,597,520,945 | |||
Liabilities: | ||||
Payable for investments purchased | 33,236,462 | |||
Payable for variation margin on futures contracts | 27,750 | |||
Payable for return of collateral received for securities on loan | 82,516,865 | |||
Accrued expenses and other payables: | ||||
Investment advisory fees | 702,948 | |||
Fund administration and transfer agent fees | 43,852 | |||
Distribution fees | 2,684 | |||
Administrative servicing fees | 170,147 | |||
Other | 25,616 | |||
Total Liabilities | 116,726,324 | |||
Net Assets | $ | 1,480,794,621 | ||
Represented by: | ||||
Capital | $ | 1,590,478,695 | ||
Accumulated net investment income (loss) | 22,435 | |||
Accumulated net realized gain (losses) from investment and futures transactions | (201,702,334 | ) | ||
Net unrealized appreciation (depreciation) on investments and futures | 91,995,825 | |||
Net Assets | $ | 1,480,794,621 | ||
Net Assets: | ||||
Class I Shares | $ | 1,307,443,811 | ||
Class II Shares | 13,001,133 | |||
Class III Shares | 722,789 | |||
Class IV Shares | 159,626,888 | |||
Total | $ | 1,480,794,621 | ||
Shares outstanding (unlimited number of shares authorized): | ||||
Class I Shares | 117,411,939 | |||
Class II Shares | 1,169,577 | |||
Class III Shares | 64,814 | |||
Class IV Shares | 14,336,827 | |||
Total | 132,983,157 | |||
Net asset value and offering price per share:* | ||||
Class I Shares | $ | 11.14 | ||
Class II Shares | $ | 11.12 | ||
Class III Shares | $ | 11.15 | ||
Class IV Shares | $ | 11.13 |
| * | Not subject to a front-end sales charge. |
For the Six Months Ended June 30, 2005 (Unaudited)
Investment Income: | ||||
Interest income | $ | 624,785 | ||
Dividend income | 10,916,215 | |||
Income from securities lending | 81,866 | |||
Total Income | 11,622,866 | |||
Expenses: | ||||
Investment advisory fees | 4,287,378 | |||
Fund administration and transfer agent fees | 485,577 | |||
Distribution fees Class II Shares | 15,297 | |||
Administrative servicing fees | 982,055 | |||
Administrative servicing fees | 9,375 | |||
Administrative servicing fees | 501 | |||
Administrative servicing fees | 118,914 | |||
Other** | 301,934 | |||
Total Expenses | 6,201,031 | |||
Net Investment Income (Loss) | 5,421,835 | |||
REALIZED/UNREALIZED GAINS (LOSSES) ON INVESTMENTS: | ||||
Net realized gains (losses) on investment transactions | 86,542,880 | |||
Net change in unrealized appreciation/depreciation on investments and futures | (86,538,596 | ) | ||
Net realized/unrealized gains (losses) on investments and futures | 4,284 | |||
CHANGE IN NET ASSETS RESULTING FROM OPERATIONS | $ | 5,426,119 | ||
| ** | Other expenses may include the following fees: audit, custody, insurance, legal, printing, trustee, and out-of-pocket expenses. |
See notes to financial statements.
10
Table of Contents
GARTMORE VARIABLE INSURANCE TRUST
GARTMORE GVIT NATIONWIDE FUND
Statement of Changes in Net Assets
| Six Months Ended June 30, 2005 | Year Ended December 31, 2004 | |||||||
| (Unaudited) | ||||||||
From Investment Activities: | ||||||||
Operations: | ||||||||
Net investment income (loss) | $ | 5,421,835 | $ | 16,557,620 | ||||
Net realized gains (losses) on investment transactions | 86,542,880 | 132,174,826 | ||||||
Net change in unrealized appreciation/depreciation on investments | (86,538,596 | ) | (4,802,619 | ) | ||||
Change in net assets resulting from operations | 5,426,119 | 143,929,827 | ||||||
Distributions to Class I shareholders from: | ||||||||
Net investment income | (5,343,355 | ) | (17,672,987 | ) | ||||
Distributions to Class II shareholders from: | ||||||||
Net investment income | (36,484 | ) | (104,002 | ) | ||||
Distributions to Class III shareholders from: | ||||||||
Net investment income | (3,224 | ) | (10,479 | ) | ||||
Distributions to Class IV shareholders from: | ||||||||
Net investment income | (650,698 | ) | (2,092,528 | ) | ||||
Change in net assets from shareholder distributions | (6,033,761 | ) | (19,879,996 | ) | ||||
Change in net assets from capital transactions | (100,459,513 | ) | (178,235,775 | ) | ||||
Change in net assets | (101,067,155 | ) | (54,185,944 | ) | ||||
Net Assets: | ||||||||
Beginning of period | 1,581,861,776 | 1,636,047,720 | ||||||
End of period | $ | 1,480,794,621 | $ | 1,581,861,776 | ||||
CAPITAL TRANSACTIONS: | �� | |||||||
Class I Shares | ||||||||
Proceeds from shares issued | $ | 2,811,098 | $ | 9,230,749 | ||||
Dividends reinvested | 5,343,354 | 17,672,987 | ||||||
Cost of shares redeemed | (102,877,245 | ) | (194,143,788 | ) | ||||
| (94,722,793 | ) | (167,240,052 | ) | |||||
Class II Shares | ||||||||
Proceeds from shares issued | 2,646,228 | 8,221,409 | ||||||
Dividends reinvested | 36,484 | 104,002 | ||||||
Cost of shares redeemed | (914,778 | ) | (3,504,688 | ) | ||||
| 1,767,934 | 4,820,723 | |||||||
Class III Shares | ||||||||
Proceeds from shares issued | 130,297 | 629,071 | ||||||
Dividends reinvested | 3,224 | 10,479 | ||||||
Cost of shares redeemed | (255,717 | ) | (741,353 | ) | ||||
| (122,196 | ) | (101,803 | ) | |||||
Class IV Shares | ||||||||
Proceeds from shares issued | 2,392,014 | 5,160,379 | ||||||
Dividends reinvested | 650,698 | 2,092,528 | ||||||
Cost of shares redeemed | (10,425,170 | ) | (22,967,550 | ) | ||||
| (7,382,458 | ) | (15,714,643 | ) | |||||
Change in net assets from capital transactions | $ | (100,459,513 | ) | $ | (178,235,775 | ) | ||
11
Table of Contents
GARTMORE VARIABLE INSURANCE TRUST
GARTMORE GVIT NATIONWIDE FUND
Statement of Changes in Net Assets (continued)
| Six Months Ended June 30, 2005 | Year Ended December 31, 2004 | |||||
| (Unaudited) | ||||||
SHARE TRANSACTIONS: | ||||||
Class I Shares | ||||||
Issued | 254,777 | 881,678 | ||||
Reinvested | 483,184 | 1,653,559 | ||||
Redeemed | (9,322,087 | ) | (18,697,631 | ) | ||
| (8,584,126 | ) | (16,162,394 | ) | |||
Class II Shares | ||||||
Issued | 240,457 | 780,353 | ||||
Reinvested | 3,306 | 9,641 | ||||
Redeemed | (82,740 | ) | (324,495 | ) | ||
| 161,023 | 465,499 | |||||
Class III Shares | ||||||
Issued | 11,748 | 61,597 | ||||
Reinvested | 291 | 980 | ||||
Redeemed | (23,199 | ) | (71,238 | ) | ||
| (11,160 | ) | (8,661 | ) | |||
Class IV Shares | ||||||
Issued | 216,920 | 497,565 | ||||
Reinvested | 58,839 | 195,738 | ||||
Redeemed | (945,412 | ) | (2,212,346 | ) | ||
| (669,653 | ) | (1,519,043 | ) | |||
See notes to financial statements.
12
Table of Contents
GARTMORE VARIABLE INSURANCE TRUST
FINANCIAL HIGHLIGHTS
Selected Data for Each Share of Capital Outstanding
Gartmore GVIT Nationwide Fund
| Investment Activities | Distributions | Ratios/Supplemental Data | |||||||||||||||||||||||||||||||||||||||||
| Net Asset Value, Beginning of Period | Net Investment Income (Loss) | Net Realized and Unrealized Gains (Losses) on Investments | Total from Investment Activities | Net Investment Income | Net Realized Gains | Total Distributions | Net Asset Value, End of Period | Total Return | Net Assets at End of Period (000s) | Ratio of Expenses to Average Net Assets | Ratio of Net Investment Income (Loss) to Average Net Assets | Ratio of Expenses (Prior to Reimbursements) to Average Net Assets(a) | Ratio of Net Investment Income (Loss) (Prior to Reimbursements) to Average Net Assets(a) | Portfolio Turnover(b) | |||||||||||||||||||||||||||||
Class I Shares | |||||||||||||||||||||||||||||||||||||||||||
Year Ended December 31, 2000 | $ | 18.81 | 0.12 | (0.47 | ) | (0.35 | ) | (0.12 | ) | (6.70 | ) | (6.82 | ) | $ | 11.64 | (2.12% | ) | $ | 2,014,759 | 0.78% | 0.63% | 0.81% | 0.60% | 148.28% | |||||||||||||||||||
Year Ended December 31, 2001(c) | $ | 11.64 | 0.08 | (1.46 | ) | (1.38 | ) | (0.08 | ) | (0.29 | ) | (0.37 | ) | $ | 9.89 | (11.82% | ) | $ | 1,677,316 | 0.78% | 0.77% | 0.82% | 0.73% | 58.36% | |||||||||||||||||||
Year Ended December 31, 2002 | $ | 9.89 | 0.08 | (1.79 | ) | (1.71 | ) | (0.08 | ) | — | (0.08 | ) | $ | 8.10 | (17.35% | ) | $ | 1,252,686 | 0.83% | 0.84% | 0.84% | 0.83% | 33.25% | ||||||||||||||||||||
Year Ended December 31, 2003 | $ | 8.10 | 0.08 | 2.14 | 2.22 | (0.05 | ) | — | (0.05 | ) | $ | 10.27 | 27.51% | $ | 1,459,917 | 0.83% | 0.83% | (i | ) | (i | ) | 129.01% | |||||||||||||||||||||
Year Ended December 31, 2004 | $ | 10.27 | 0.12 | 0.88 | 1.00 | (0.14 | ) | — | (0.14 | ) | $ | 11.13 | 9.75% | $ | 1,402,753 | 0.83% | 1.07% | (i | ) | (i | ) | 131.43% | |||||||||||||||||||||
Six Months Ended June 30, 2005 (Unaudited) | $ | 11.13 | 0.04 | 0.01 | 0.05 | (0.04 | ) | — | (0.04 | ) | $ | 11.14 | 0.49% | (g) | $ | 1,307,444 | 0.82% | (h) | 0.73% | (h) | (i | ) | (i | ) | 76.68% | ||||||||||||||||||
Class II Shares | |||||||||||||||||||||||||||||||||||||||||||
Period Ended December 31, 2002(d) | $ | 8.68 | 0.04 | (0.57 | ) | (0.53 | ) | (0.05 | ) | — | (0.05 | ) | $ | 8.10 | (6.14% | )(g) | $ | 765 | 1.07% | (h) | 1.03% | (h) | (i | ) | (i | ) | 33.25% | ||||||||||||||||
Year Ended December 31, 2003 | $ | 8.10 | 0.05 | 2.15 | 2.20 | (0.04 | ) | — | (0.04 | ) | $ | 10.26 | 27.23% | $ | 5,570 | 1.08% | 0.60% | (i | ) | (i | ) | 129.01% | |||||||||||||||||||||
Year Ended December 31, 2004 | $ | 10.26 | 0.08 | 0.89 | 0.97 | (0.11 | ) | — | (0.11 | ) | $ | 11.12 | 9.53% | $ | 11,210 | 1.08% | 0.95% | (i | ) | (i | ) | 131.43% | |||||||||||||||||||||
Six Months Ended June 30, 2005 (Unaudited) | $ | 11.12 | 0.03 | — | 0.03 | (0.03 | ) | — | (0.03 | ) | $ | 11.12 | 0.29% | (g) | $ | 13,001 | 1.08% | (h) | 0.47% | (h) | (i | ) | (i | ) | 76.68% | ||||||||||||||||||
Class III Shares | |||||||||||||||||||||||||||||||||||||||||||
Period Ended December 31, 2002(e) | $ | 9.78 | 0.05 | (1.65 | ) | (1.60 | ) | (0.07 | ) | — | (0.07 | ) | $ | 8.11 | (16.38% | )(g) | $ | 399 | 0.72% | (h) | 1.07% | (h) | (i | ) | (i | ) | 33.25% | ||||||||||||||||
Year Ended December 31, 2003 | $ | 8.11 | 0.09 | 2.13 | 2.22 | (0.05 | ) | — | (0.05 | ) | $ | 10.28 | 27.48% | $ | 870 | 0.83% | 0.83% | (i | ) | (i | ) | 129.01% | |||||||||||||||||||||
Year Ended December 31, 2004 | $ | 10.28 | 0.11 | 0.89 | 1.00 | (0.13 | ) | — | (0.13 | ) | $ | 11.15 | 9.84% | $ | 847 | 0.83% | 1.05% | (i | ) | (i | ) | 131.43% | |||||||||||||||||||||
Six Months Ended June 30, 2005 (Unaudited) | $ | 11.15 | 0.05 | — | 0.05 | (0.05 | ) | — | (0.05 | ) | $ | 11.15 | 0.41% | (g) | $ | 723 | 0.80% | (h) | 0.74% | (h) | (i | ) | (i | ) | 76.68% | ||||||||||||||||||
Class IV Shares | |||||||||||||||||||||||||||||||||||||||||||
Period Ended December 31, 2003(f) | $ | 8.30 | 0.05 | 1.95 | 2.00 | (0.03 | ) | — | (0.03 | ) | $ | 10.27 | 24.17% | (g) | $ | 169,690 | 0.83% | (h) | 0.85% | (h) | (i | ) | (i | ) | 129.01% | ||||||||||||||||||
Year Ended December 31, 2004 | $ | 10.27 | 0.12 | 0.88 | 1.00 | (0.14 | ) | — | (0.14 | ) | $ | 11.13 | 9.75% | $ | 167,051 | 0.83% | 1.06% | (i | ) | (i | ) | 131.43% | |||||||||||||||||||||
Six Months Ended June 30, 2005 (Unaudited) | $ | 11.13 | 0.04 | — | 0.04 | (0.04 | ) | — | (0.04 | ) | $ | 11.13 | 0.40% | (g) | $ | 159,627 | 0.82% | (h) | 0.72% | (h) | (i | ) | (i | ) | 76.68% | ||||||||||||||||||
| (a) | During the period certain fees were waived and/or reimbursed. If such waivers/reimbursements had not occurred, the ratios would have been as indicated. |
| (b) | Portfolio turnover is calculated on the basis of the Fund as a whole without distinguishing among the classes of shares. |
| (c) | The existing shares of the Fund were designated Class I shares as of May 1, 2001. |
| (d) | For the period from July 11, 2002 (commencement of operations) through December 31, 2002. |
| (e) | For the period from May 6, 2002 (commencement of operations) through December 31, 2002. |
| (f) | For the period from April 28, 2003 (commencement of operations) through December 31, 2003. |
| (g) | Not annualized. |
| (h) | Annualized. |
| (i) | There were no fee reductions during the period. |
See notes to financial statements.
13
Table of Contents
GARTMORE VARIABLE INSURANCE TRUST
NOTES TO FINANCIAL STATEMENTS (Unaudited)
June 30, 2005
1. Organization
Gartmore Variable Insurance Trust (“GVIT” or the “Trust”) is an open-end management investment company, organized under the laws of Delaware by an amended and restated Agreement and Declaration of Trust, dated October 28, 2004, as amended to date. The Trust, originally created under the laws of Massachusetts as a Massachusetts business trust pursuant to a Declaration of Trust dated, as of June 30, 1981, was subsequently amended, redomesticated as a Delaware Statutory Trust after the close of trading on April 29, 2005, and is registered under the Investment Company Act of 1940, as amended (the “1940 Act”). The redomestication is a change in statutory status and does not affect the operations of the Trust. As of June 30, 2005, the Trust had authorized an unlimited number of shares of beneficial interest (“shares”) without par value. The Trust currently offers shares to life insurance company separate accounts to fund the benefits under variable life insurance or annuity policies. To date, only the separate accounts of Nationwide Life Insurance Company and Nationwide Life and Annuity Insurance Company (collectively, “Nationwide”) have purchased shares of the Trust’s series. The Trust operates thirty-one (31) separate series, or mutual funds, each with its own investment objectives and strategies. This report contains the financial statements and financial highlights of the Gartmore GVIT Nationwide Fund (the “Fund”).
Under the Trust’s organizational documents, the Trust’s officers and trustees are indemnified against certain liabilities arising out of the performance of their duties to the Trust. In addition, the Trust has entered into Indemnification Agreements with the Trust’s trustees and certain officers covering similar liabilities. In addition, in the normal course of business, the Trust enters into contracts with its vendors and others that provide for general indemnifications. The Trust’s maximum exposure under these arrangements is unknown, as this would involve future claims that may be made against the Trust. Based on experience, however, the Trust expects that risk of loss to be remote.
2. Summary of Significant Accounting Policies
The following is a summary of significant accounting policies followed by the Fund in the preparation of its financial statements. The policies are in conformity with accounting principles generally accepted in the United States of America (“GAAP”). The preparation of financial statements requires management to make estimates and assumptions that affect the reported amounts of assets and liabilities, the disclosure of contingent assets and liabilities at the date of the financial statements and the reported amounts of income and expenses for the period. Actual results could differ from those estimates.
| (a) | Security Valuation |
Securities for which market quotations are readily available are valued at current market value as of “Valuation Time.” Valuation Time is as of the close of regular trading on the New York Stock Exchange (usually 4 p.m. Eastern time). Equity securities are valued at the last quoted sale price or, if there is no sale price, the last quoted bid price provided by an independent pricing service approved by the Trust’s Board of Trustees. Securities traded on NASDAQ are valued at the NASDAQ official closing price. Prices are taken from the primary market or exchange in which each security trades. Most securities listed on a foreign exchange are valued either at fair value (see description below) or at the last sale price at the close of the exchange on which the security is principally traded. Foreign securities, currencies, and other assets and liabilities denominated in foreign currencies are translated into U.S. dollars at the exchange rate of said currencies against the U.S. Dollar, as of Valuation Time, as provided by an independent pricing service approved by the Board of Trustees.
Debt (including defaulted issues) and other fixed income securities (other than short-term obligations) are valued at the last quoted bid price and/or by using a combination of daily quotes and matrix evaluations provided by an independent pricing service, the use of which has been approved by the Trust’s Board of Trustees. Short-term debt securities, such as commercial paper and U.S. Treasury Bills having a remaining maturity of 60 days or less at the time of purchase, are considered to be “short-term” and are valued at amortized cost which approximates market value.
Securities for which market quotations are not readily available, or for which an independent pricing service does not provide a value or provides a value that does not represent fair value in the judgment of the Fund’s investment adviser or designee, are valued at fair value under procedures approved by the Trust’s Board of Trustees. The “Fair Value” of these securities is determined in good faith by taking into account relevant factors and surrounding circumstances. Methods utilized to obtain a
14
Table of Contents
GARTMORE VARIABLE INSURANCE TRUST
NOTES TO FINANCIAL STATEMENTS (Unaudited) (Continued)
June 30, 2005
“Fair Value” may include the following non-exclusive list of SEC acceptable methods: (i) a multiple of earnings; (ii) the discount from market value of a similar, freely traded security; (iii) the yield-to-maturity for debt issues; or (iv) a consolidation of the methods. The Gartmore Fair Value Committee considers a non-exclusive list of factors to arrive at the appropriate method upon determining “Fair Value.” For example, fair value determinations are required for securities whose value is affected by a “significant” event that materially affects the value of a domestic or foreign security which occurs subsequent to the time of the close of the principal market on which such domestic or foreign security trades and before the Valuation Time (i.e., a “subsequent event”). Typically, this will involve events occurring after the close of a foreign market on which a security trades and before the next Valuation Time.
| (b) | Repurchase Agreements |
The Fund may enter into repurchase agreements with an entity which is a member of the Federal Reserve System or which is a “primary dealer” (as designated by the Federal Reserve Bank of New York) in U.S. Government obligations. The repurchase price generally equals the price paid by the Fund plus interest negotiated on the basis of current short-term rates, which may be more or less than the rate on the underlying portfolio securities. The seller under a repurchase agreement is required to maintain the value of the collateral held pursuant to the agreement at a market value equal to or greater than the repurchase price (including accrued interest). Collateral subject to repurchase agreements is held by the Fund’s custodian or another qualified sub-custodian or in the Federal Reserve/Treasury book-entry system. If the counterparty defaults and the fair value of the collateral declines, realization of the collateral by the Fund may be delayed or limited. The Fund may transfer uninvested cash balances into a pooled cash account. These balances are invested in one or more repurchase agreements, which are fully collateralized by AA-rated Corporate Bonds with the counterparties of CS First Boston and Nomura Securities.
| (c) | Futures Contracts |
The Fund may invest in financial futures contracts (“futures contracts”) for the purpose of hedging its existing portfolio securities or securities that the Fund intends to purchase against fluctuations in value caused by changes in prevailing market interest rates or prices. Futures contracts may also be entered into for non-hedging purposes.
Upon entering into a futures contract, the Fund is required to pledge to the broker an amount of cash and/or other assets equal to a certain percentage of the contract amount (initial margin deposit). Subsequent payments, known as “variation margin,” are made each day, depending on the daily fluctuations in the fair value/market value of the underlying assets. A gain or loss equal to the daily variation margin is recognized on a daily basis. Futures contracts are valued daily at their last quoted sale price.
A “sale” of a futures contract means a contractual obligation to deliver the securities or foreign currency called for by the contract at a fixed price at a specified time in the future. A “purchase” of a futures contract means a contractual obligation to acquire the securities or foreign currency at a fixed price at a specified time in the future.
Should market conditions change unexpectedly, the Fund may not achieve the anticipated benefits of the futures contracts and may realize a loss. The use of futures transactions for hedging purposes involves the risk of imperfect correlation in movements in the price of futures contracts, interest rates, and the value of the underlying hedged assets.
| (d) | Written Options Contracts |
The Fund may write options contracts. A written option obligates the Fund to deliver (written call) or to receive (written put) a specified quantity of an underlying asset at the contract amount upon exercise by the holder of the option. The value of the option contract is recorded as a liability and unrealized gain or loss is measured by the difference between the current value and the premium received. Options traded on an exchange are valued at the last quoted sale price, or in the absence of a sale, the bid price provided by an independent pricing service approved by the Board of Trustees. Non-exchange traded options are valued using dealer supplied quotes.
15
Table of Contents
GARTMORE VARIABLE INSURANCE TRUST
NOTES TO FINANCIAL STATEMENTS (Unaudited) (Continued)
June 30, 2005
| (e) | Security Transactions and Investment Income |
Security transactions are accounted for on the date the security is purchased or sold (“trade date”). Securities gains and losses are calculated on the identified cost basis. Interest income is recognized on the accrual basis and includes, where applicable, the amortization or accretion of premium or discount. Dividend income is recorded on the ex-dividend date.
| (f) | Securities Lending |
To generate additional income, the Fund may lend up to 33 1/3% of the Fund’s total assets pursuant to agreements, requiring that the borrower deliver cash or securities as collateral with respect to each new loan of U.S. securities, equal to at least 102% of the value of the portfolio securities loaned, and with respect to each new loan of non-U.S. securities, collateral of at least 105% of the value of the portfolio securities loaned, and thereafter requiring the borrower to mark to market the collateral on a daily basis and requiring the borrower to make up any shortfall of collateral. The Fund receives payments from borrowers equivalent to the dividends and interest that would have been earned on securities lent while simultaneously seeking to earn income on the investment of cash collateral. Collateral is marked to market daily to provide a level of collateral at least equal to the market value of securities loaned. There may be risks of delay in recovery of the securities should the borrower of the securities fail financially. Loans will be made, however, only to borrowers deemed by the Fund’s investment adviser to be of good standing and creditworthy under guidelines established by the Board of Trustees and when, in the judgment of the adviser, the consideration which can be earned currently from these securities loans justifies the attendant risks. Loans are subject to termination by the Fund or the borrower at any time, and, therefore, are not considered to be illiquid investments. JPMorgan Chase Bank serves as custodian for the securities lending program of the Fund. JPMorgan Chase Bank receives a custody fee based on the value of collateral received from borrowers.
The cash collateral received by the Fund was pooled and, at June 30, 2005, was invested in the following:
Security Type | Security Name | Market Value | Maturity Rate | Maturity Date | ||||||
| Commercial Paper | HSBC Finance Corp. | $ | 18,000,000 | 3.14 | % | 07/05/05 | ||||
| Commercial Paper | Lexington Parker Capital | 4,465,534 | 3.05 | % | 07/08/05 | |||||
| Commercial Paper | Master Fund LLC Series B | 4,983,761 | 3.17 | % | 07/14/05 | |||||
| Domestic Certificates of Deposit — Fixed | Washington Mutual Bank FA | 8,501,954 | 3.15 | % | 08/01/05 | |||||
| Funding Agreement | GE Life and Annutiy | 2,000,000 | 3.32 | % | 07/14/05 | |||||
| Master Note — Floating | CDC Financial Product Inc. | 3,500,000 | 3.54 | % | 07/01/05 | |||||
| Master Note — Floating | CITIGroup Global Markets Inc. | 12,000,000 | 3.51 | % | 07/01/05 | |||||
| Medium Term Note — Floating | General Electric Capital Corp. | 1,000,171 | 3.37 | % | 09/08/05 | |||||
| Medium Term Note — Floating | Pacific Life Global Funding | 9,997,365 | 3.24 | % | 07/26/05 | |||||
| Money Market Fund | JPM S/L Collateral Investment | 4,000,000 | 3.26 | % | 07/01/05 | |||||
| Repurchase Agreements | Nomura Securities | 9,068,080 | 3.48 | % | 07/01/05 | |||||
| Yankee Certificates of Deposit — Floating | Credit Suisse First Boston, NY | 5,000,000 | 3.25 | % | 08/10/05 | |||||
As of June 30, 2005, the Fund had securities with the following market values on loan:
Market Value of | Market Value of Collateral | ||
$81,005,573 | $ | 82,516,865 | |
| (g) | Distributions to Shareholders |
The Fund’s dividends from net investment income, if any, are declared and paid quarterly. The Fund’s distributable net realized capital gains, if any, are declared and distributed at least annually.
Dividends and distributions to shareholders are determined in accordance with federal income tax regulations, which may differ from GAAP. These “book/tax” differences are considered either permanent or temporary in nature. In accordance with
16
Table of Contents
GARTMORE VARIABLE INSURANCE TRUST
NOTES TO FINANCIAL STATEMENTS (Unaudited) (Continued)
June 30, 2005
the American Institute of Certified Public Accountants (“AICPA”) Statement of Position 93-2, permanent differences (i.e., reclassification of market discounts, gain/loss, paydowns, and distributions) are reclassified within the capital accounts based on their nature for federal income tax purposes; temporary differences do not require reclassification. These reclassifications have no effect upon the net asset value of the Fund. To the extent distributions exceed current and accumulated earnings and profits for federal income tax purposes, these distributions are reported as distributions of paid-in-capital.
| (h) | Federal Income Taxes |
It is the policy of the Fund to qualify or continue to qualify as a “regulated investment company” by complying with the provisions available to certain investment companies, as defined in applicable sections of the U.S. Internal Revenue Code, and to make distributions of net investment income and net realized capital gains sufficient to relieve the Fund from all, or substantially all, federal income taxes.
As of June 30, 2005, the tax cost of securities and the breakdown of unrealized appreciation (depreciation) for the Fund is as follows:
Tax Cost of | Unrealized Appreciation | Unrealized Depreciation | Net Unrealized Appreciation (Depreciation) | |||||||
| $5,117,697 | $ | 126,537,338 | $ | (39,619,460 | ) | $ | 86,917,878 | |||
| (i) | Allocation of Expenses, Income, and Gains and Losses |
Expenses directly attributable to the Fund are charged to the Fund. Expenses not directly attributable to the Fund are allocated proportionately among various or all funds within the Trust. The method used by the Fund for allocating income, fund level expenses, and realized and unrealized gains or losses is based on the fair value of shares outstanding relative to net assets. Under this method, each class of shares participates based on the total net asset value of that class’s shares in proportion to the total net assets of the Fund. Expenses specific to a class (such as rule 12b-1 and administrative services fees) are charged to that class.
| 3. | Transactions with Affiliates |
Under the terms of the Trust’s Investment Advisory Agreement, Gartmore Mutual Fund Capital Trust (“GMF”) manages the investment of the assets and supervises the daily business affairs of the Fund. GMF is a wholly-owned subsidiary of Gartmore Global Investments, Inc. (“GGI”), a holding company. GGI is a majority-owned subsidiary of Gartmore Global Asset Management Trust (“GGAMT”). GGAMT is a wholly-owned subsidiary of Nationwide Corporation. All of the common stock of Nationwide Corporation is held by Nationwide Mutual Insurance Company (95.2%) and Nationwide Mutual Fire Insurance Company (4.8%), each of which is a mutual company owned by its policyholders.
Under the terms of the Investment Advisory Agreement, the Fund pays GMF an investment advisory fee based on the Fund’s average daily net assets and the following schedule:
| Fee Schedule | Fees | |
Up to $1 billion | 0.60% | |
Next $1 billion | 0.58% | |
Next $3 billion | 0.55% | |
$5 billion or more | 0.50% |
Under the terms of a Fund Administration and Transfer Agency Agreement, Gartmore SA Capital Trust (“GSA”) provides the Fund with various administrative and accounting services, and Gartmore Investors Services, Inc. (“GISI”), an indirect subsidiary of GSA, serves as Transfer and Dividend Disbursing Agent for the Fund. The fees for the services provided under this Agreement are calculated based on the Trust’s average daily net assets according to the fee schedule below. The fees are
17
Table of Contents
GARTMORE VARIABLE INSURANCE TRUST
NOTES TO FINANCIAL STATEMENTS (Unaudited) (Continued)
June 30, 2005
then allocated proportionately among all funds within the Trust in relation to the average daily net assets of each fund and are paid to GSA. GSA pays GISI from these fees for its services.
| Combined Fee Schedule* | ||
Up to $1 billion | 0.13% | |
$1 billion and more up to $3 billion | 0.08% | |
$3 billion and more up to $8 billion | 0.05% | |
$8 billion and more up to $10 billion | 0.04% | |
$10 billion and more up to $12 billion | 0.02% | |
$12 billion or more | 0.01% | |
| * | The assets of the Gartmore GVIT Investor Destinations Aggressive Fund, the Gartmore GVIT Investor Destinations Moderately Aggressive Fund, the Gartmore GVIT Investor Destinations Moderate Fund, the Gartmore GVIT Investor Destinations Moderately Conservative Fund, and the Gartmore GVIT Investor Destinations Conservative Fund (collectively, the “Investor Destinations Funds”) are excluded from the Trust asset level amount in order to calculate this asset-based fee. The Investor Destinations Funds do not pay any part of this fee. |
Effective January 1, 2005, the fee for the fund administration and transfer agency services increased as set forth below. The fees are calculated based on the Trust’s average daily net assets according to the fee schedule below. The fees are then allocated proportionately among all funds within the Trust in relation to the average daily net assets of each fund and are paid to GSA.
| Combined Fee Schedule* | ||
Up to $1 billion | 0.15% | |
$1 billion and more up to $3 billion | 0.10% | |
$3 billion and more up to $8 billion | 0.05% | |
$8 billion and more up to $10 billion | 0.04% | |
$10 billion and more up to $12 billion | 0.02% | |
$12 billion or more | 0.01% | |
| * | The assets of each of the Investor Destinations Funds are excluded from the Trust asset level amount in order to calculate this asset-based fee. The Investor Destinations Funds do not pay any part of this fee. |
GSA and GISI have entered into agreements with BISYS Fund Services Ohio, Inc. (“BISYS”), pursuant to which BISYS provides sub-administration and sub-transfer agency services, respectively, to the Fund.
Under the terms of a Distribution Plan under Rule 12b-1 of the 1940 Act, Gartmore Distribution Services, Inc. (“GDSI”), the Fund’s Distributor, is compensated by the Fund for expenses associated with the distribution of the Class II of the Fund. These fees are based on average daily net assets of Class II shares of the Fund at an annual rate not to exceed 0.25%.
Under the terms of an Administrative Services Plan, the Fund may pay fees to servicing organizations, such as broker-dealers, including Nationwide Financial Services, and financial institutions, which agree to provide administrative support services to the shareholders of certain classes. These services include, but are not limited, to the following: establishing and maintaining shareholder accounts; processing purchase and redemption transactions; arranging bank wires; performing shareholder sub-accounting; answering inquires regarding the Fund; and other such services. These fees are based on an annual rate of up to 0.25% of the average daily net assets of Class I, Class II, and Class III shares of the Fund and 0.20% on Class IV shares of the Fund.
4. Short-Term Trading Fees
The Fund reserves the right to assess a short-term trading fee on certain transactions out of Class III shares that a separate account makes on behalf of a variable insurance contract owner (the “contract owner”). A separate account that redeems Class III shares on behalf of a contract owner may be subject to a 1.00% short-term trading fee if the separate account held
18
Table of Contents
GARTMORE VARIABLE INSURANCE TRUST
NOTES TO FINANCIAL STATEMENTS (Unaudited) (Continued)
June 30, 2005
the Class III shares on behalf of the contract owner for 60 days or less, unless an exception applies as disclosed in the prospectus. The short-term trading fee is paid directly to the Fund and is intended to offset the cost to the Fund of excess brokerage commissions and other costs associated with fluctuations in fund asset levels and cash flow caused by short-term trading. For purposes of determining whether the short-term trading fee applies, the Class III shares that were held on behalf of the contract owner the longest will be treated as being redeemed first.
For the six months ended June 30, 2005, the Fund had no contributions to capital due to collection of redemption fees.
5. Investment Transactions
For the six months ended June 30, 2005, (excluding short-term securities) the Fund had purchases of $1,126,420,173 and sales of $1,238,445,250.
6. Bank Loans
The Trust has a credit agreement of $100,000,000. Borrowings under this arrangement bear interest at the Federal Funds rate plus 0.50%. The interest costs are included in custodian fees in the Statement of Operations. No compensation balances were required under the terms of the line of credit. There were no borrowings outstanding as of June 30, 2005.
7. Shareholder Meeting
A separate shareholders meeting was held on Tuesday, December 23, 2004, for the shareholders of the Trust’s predecessor pursuant to a Proxy Statement On Schedule 14A, dated October 29, 2004, and mailed to the shareholders of the Trust’s predecessor on or around November 5, 2004.
Two Proposals: The purpose of the December 23, 2004 meeting was to allow the shareholders of the Trust’s predecessor to vote on:
| i. | Proposal One: The election of the Trust’s Board of Trustees; and |
| ii. | Proposal Two: The approval of an “Agreement and Plan of Reorganization” that provided for the reorganization of the Trust from a Massachusetts business trust into a Delaware statutory trust. |
Proposal One: As set forth in the October 29, 2004 Proxy Statement, the nominees for election as Trustees of the Trust’s predecessor were: Charles E. Allen, Michael J. Baresich, Paula H.J. Cholmondeley, C. Brent DeVore, Phyllis Kay Dryden, Robert M. Duncan, Barbara L. Hennigar, Paul J. Hondros, Barbara I Jacobs, Thomas J. Kerr IV, Douglas F. Kridler, Michael D. McCarthy, Arden L. Shisler, and David C. Wetmore.
Proposal Two: As specifically set forth in the October 29, 2004 Proxy Statement, the Reorganization proposal requested the shareholders of the Trust’s predecessor to approve the proposed “Agreement and Plan of Reorganization” of the Trust’s predecessor (on behalf of each of the its funds) into a new Delaware-domiciled Trust, whereby the Funds of the new Delaware Trust would acquire all of the assets of the corresponding funds of the Trust’s predecessor subject to the liabilities, expenses, costs, charges, and reserves of the corresponding funds of the Trust’s predecessor (contingent or otherwise), in exchange for shares of the acquiring Funds to be distributed pro rata by the Trust to the holders of the shares of the funds of the Trust’s predecessor, in a complete liquidation of the Trust’s predecessor.
19
Table of Contents
GARTMORE VARIABLE INSURANCE TRUST
NOTES TO FINANCIAL STATEMENTS (Unaudited) (Continued)
June 30, 2005
| Voting | Results: |
The shareholders of the Trust’s predecessor voted to approve both Proposal One and Proposal Two, as follows:
Proposal 1: Election of a Board of Trustees of Gartmore Variable Insurance Trust
Charles E. Allen: | ||
FOR | 2,797,230,318.955 shares (96.078%) | |
WITHHOLD | 114,195,693.660 shares (3.922%) | |
TOTAL | 2,912,726,012.615 shares (100.000%) | |
Michael J. Baresich: | ||
FOR | 2,796,135,979.559 shares (96.040%) | |
WITHHOLD | 115,290,033.056 shares (3.960%) | |
TOTAL | 2,912,726,012.615 shares (100.000%) | |
Paula H.J. Cholmondeley: | ||
FOR | 2,795,095,945.396 shares (96.004%) | |
WITHHOLD | 116,330,067.219 shares (3.996%) | |
TOTAL | 2,912,726,012.615 shares (100.000%) | |
C. Brent DeVore: | ||
FOR | 2,797,207,046.916 shares (96.077%) | |
WITHHOLD | 114,218,965.699 shares (3.923%) | |
TOTAL | 2,912,726,012.615 shares (100.000%) | |
Phyllis Kay Dryden: | ||
FOR | 2,795,587,023.994 shares (96.021%) | |
WITHHOLD | 115,838,988.621 shares (3.979%) | |
TOTAL | 2,912,726,012.615 shares (100.000%) | |
Robert M. Duncan: | ||
FOR | 2,790,191,720.503 shares (95.836%) | |
WITHHOLD | 121,234,292.112 shares (4.164%) | |
TOTAL | 2,912,726,012.615 shares (100.000%) | |
Barbara L. Hennigar: | ||
FOR | 2,792,939,848.858 shares (95.937%) | |
WITHHOLD | 118,486,163.757 shares (4.070%) | |
TOTAL | 2,912,726,012.615 shares (100.000%) | |
Paul J. Hondros: | ||
FOR | 2,797,557,404.448 shares (96.089%) | |
WITHHOLD | 113,868,608.167 shares (3.911%) | |
TOTAL | 2,912,726,012.615 shares (100.000%) | |
20
Table of Contents
GARTMORE VARIABLE INSURANCE TRUST
NOTES TO FINANCIAL STATEMENTS (Unaudited) (Continued)
June 30, 2005
Barbara I. Jacobs: | ||
FOR | 2,796,306,126.654 shares (96.046%) | |
WITHHOLD | 115,119,885.961 shares (3.954%) | |
TOTAL | 2,912,726,012.615 shares (100.000%) | |
Thomas J. Kerr IV: | ||
FOR | 2,789,755,720.087 shares (95.821%) | |
WITHHOLD | 121,670,292.528 shares (4.179%) | |
TOTAL | 2,912,726,012.615 shares (100.000%) | |
Douglas F. Kridler: | ||
FOR | 2,798,065,774.375 shares (96.106%) | |
WITHHOLD | 113,360,238.240 shares (3.894%) | |
TOTAL | 2,912,726,012.615 shares (100.000%) | |
Michael D. McCarthy: | ||
FOR | 2,797,452,613.694 shares (96.085%) | |
WITHHOLD | 113,973,395.921 shares (3.915%) | |
TOTAL | 2,912,726,012.615 shares (100.000%) | |
Arden L. Shisler: | ||
FOR | 2,796,738,454.730 shares (96.061%) | |
WITHHOLD | 114,687,557.885 shares (3.939%) | |
TOTAL | 2,912,726,012.615 shares (100.000%) | |
David C. Wetmore: | ||
FOR | 2,794,784,752.247 shares (95.994%) | |
WITHHOLD | 116,641,260.368 shares (4.006%) | |
TOTAL | 2,912,726,012.615 shares (100.000%) | |
Proposal 2: Approval of the Agreement and Plan of Reorganization of Gartmore Variable Insurance Trust
FOR | 2,561,003,822.546 shares (87.964%) | |
AGAINST | 103,593,261.010 shares (3.558%) | |
ABSTAIN | 246,828,929.059 shares (8.478%) | |
TOTAL | 2,912,726,012.615 shares (100.000%) | |
21
Table of Contents
GARTMORE VARIABLE INSURANCE TRUST
Management Information (Unaudited)
June 30, 2005
Trustees who are not Interested Persons (as defined in the 1940 Act) and Officers of the Funds June 30, 2005
| Name, Address and Date of Birth | Position(s) Held with the Trust and Length of Time Served1 | Principal Occupation(s) During Past 5 Years | Number of Portfolios in the Gartmore Fund Complex Overseen by Trustee | Other Directorships Held by Trustee or Nominee2 | ||||
Charles E. Allen
c/o Gartmore Global Investments, Inc. 1200 River Road, Suite 1000 Conshohocken, PA 19428
1948 | Trustee since July 2000 | Mr. Allen is Chairman, Chief Executive Officer and President of the Graimark Realty Advisors, Inc. (real estate development, investment and asset management). | 84 | None | ||||
Paula H.J. Cholmondeley
c/o Gartmore Global Investments, Inc. 1200 River Road, Suite 1000 Conshohocken, PA 19428
1940 | Trustee since July 2000 | Ms. Cholmondeley has been the Chairman and Chief Executive Officer of the Sorrel Group, a management consulting company, since January 2004. From March 2000 through December 2003, Ms. Cholmondeley was Vice President and General Manager of Sappi Fine Paper North America. Prior thereto, Ms. Cholmondeley was Vice President and General Manager of Residential Insulation of Owens Corning. | 84 | Director of Dentsply International, Inc., Ultralife Batteries, Inc., Terex Corporation, Minerals Technology, Inc. and Albany International Corp. | ||||
C. Brent DeVore
c/o Gartmore Global Investments, Inc. 1200 River Road, Suite 1000 Conshohocken, PA 19428
1940 | Trustee since 1990 | Dr. DeVore is President of Otterbein College. | 84 | None | ||||
Phyllis K. Dryden
c/o Gartmore Global Investments, Inc. 1200 River Road, Suite 1000 Conshohocken, PA 19428
1947 | Trustee since December 2004 | Ms. Dryden was a former Managing Partner of marchFIRST, a global management consulting firm prior to 2002. | 84 | None |
22
Table of Contents
GARTMORE VARIABLE INSURANCE TRUST
Management Information (Unaudited)
June 30, 2005
| Name, Address and Date of Birth | Position(s) Held with the Trust and Length of Time Served1 | Principal Occupation(s) During Past 5 Years | Number of Portfolios in the Gartmore Fund Complex Overseen by Trustee | Other Directorships Held by Trustee or Nominee2 | ||||
Barbara L. Hennigar*
c/o Gartmore Global Investments, Inc. 1200 River Road, Suite 1000 Conshohocken, PA 19428
1935 | Trustee since July 2000 | Retired since June 2000. Prior thereto, Ms. Hennigar was the Chairman or President and Chief Executive Officer of OppenheimerFunds Services and a member of the Executive Committee of OppenheimerFunds. | 84 | None | ||||
Barbara I. Jacobs
c/o Gartmore Global Investments, Inc. 1200 River Road, Suite 1000 Conshohocken, PA 19428
1950 | Trustee since December 2004 | Ms. Jacobs has served as Chairman of the Board of Directors of KICAP Network Fund, a European (United Kingdom) hedge fund, since December 2000. Prior to 2004, Ms. Jacobs was also a Managing Director and European Portfolio Manager with CREF Investments (Teachers Insurance Annuity Association — College Retirement Equity Fund). | 84 | None | ||||
Douglas F. Kridler
c/o Gartmore Global Investments, Inc. 1200 River Road, Suite 1000 Conshohocken, PA 19428
1955 | Trustee since September 1997 | Mr. Kridler has served as the President and Chief Executive Officer of the Columbus Foundation (a Columbus, OH-based foundation which manages over 1,300 individual endowment funds) since February 2002. Mr. Kridler was the President of the Columbus Association for the Performing Arts prior thereto and Chairman of the Greater Columbus Convention and Visitors Bureau during 2000 and 2001. | 84 | None | ||||
Michael D. McCarthy
c/o Gartmore Global Investments, Inc. 1200 River Road, Suite 1000 Conshohocken, PA 19428
1947 | Trustee since December 2004 | Mr. McCarthy serves as: the Founder and Chairman of The Eureka Foundation (which sponsors and funds the “Great Museums” series on PBS); and a Partner of Pineville Properties LLC (a commercial real estate development firm). | 843 | None |
23
Table of Contents
GARTMORE VARIABLE INSURANCE TRUST
Management Information (Unaudited)
June 30, 2005
| Name, Address and Date of Birth | Position(s) Held with the Trust and Length of Time Served1 | Principal Occupation(s) During Past 5 Years | Number of Portfolios in the Gartmore Fund Complex Overseen by Trustee | Other Directorships Held by Trustee or Nominee2 | ||||
David C. Wetmore
c/o Gartmore Global Investments, Inc. 1200 River Road, Suite 1000 Conshohocken, PA 19428
1948 | Trustee since 1995 and Chairman since February 2005 | Retired. Mr. Wetmore was formerly a Managing Director of Updata Capital, an investment banking and venture capital firm. | 84 | None |
| * | Pursuant to the Trust’s mandatory retirement policy, Ms. Hennigar is expected to retire on or about January 12, 2006. |
| 1 | The term of office length is until a trustee resigns or reaches a mandatory retirement age of 70. On March 2, 2000, the Board adopted a five-year implementation period for any Trustee 65 or older as of the adoption of this policy. Pursuant to this policy, Messrs. Duncan and Kerr retired as trustees effective as of March 12, 2005. |
| 2 | Directorships held in (1) any other investment companies registered under the 1940 Act, (2) any company with a class of securities registered pursuant to Section 12 of the Securities Exchange Act of 1934, as amended (the “Exchange Act”), or (3) any company subject to the requirements of Section 15(d) of the Exchange Act. |
| 3 | Mr. McCarthy was also an Administrative Committee Member for the Alphagen Arneb Fund, LLC, The Healthcare Fund LDC, The Leaders Long-Short Fund, LLC, and The Leaders Long-Short Fund LDC, four private investment companies (hedge funds) managed by GSA. Mr. McCarthy resigned as an Administrative Committee Member effective June 30, 2005. |
Trustees and Officers who are not Interested Persons (as defined in the 1940 Act) of the Funds received aggregate compensation of $274,882 from the Trust for the Six Months Ended June 30, 2005. Additional information regarding the Trustees and Officers may be found in the Trust’s statement of additional information, which is available without charge upon request, by calling 1-800-848-0920.
24
Table of Contents
GARTMORE VARIABLE INSURANCE TRUST
Management Information (Unaudited)
June 30, 2005
Trustees who are Interested Persons (as defined in the 1940 Act) and/or Officers of the Funds June 30, 2005
| Name, Address and Age | Position(s) Held with the Trust and Length of Time Served1 | Principal Occupation(s) During Past 5 Years | Number of Portfolios in the Gartmore Fund Complex Overseen by Trustee | Other Directorships Held by Trustee2 | ||||
Paul J. Hondros
Gartmore Global Investments, Inc. 1200 River Road, Suite 1000 Conshohocken, PA 19428
1948 | Trustee since July 2000 | Mr. Hondros has been President and Chief Executive Officer of various Gartmore entities, including Gartmore Distribution Services, Inc. (“GDSI”),3 Gartmore Investor Services, Inc. (“GISI”),3 Gartmore Morley Capital Management, Inc. (“GMCM”),3 Gartmore Morley Financial Services, Inc. (“GMFS”),3 NorthPointe Capital, LLC (“NorthPointe”),3 Gartmore Global Asset Management Trust (“GGAMT”)3, Gartmore Global Investments, Inc. (“GGI”)3, Gartmore Mutual Fund Capital Trust (“GMFCT”)3 and Gartmore SA Capital Trust (“GSA”)3; and a Director of Nationwide Securities, Inc.3, as well as several entities within Nationwide Financial Services, Inc. | 844 | None | ||||
Arden L. Shisler
c/o Gartmore Global Investments, Inc. 1200 River Road, Suite 1000 Conshohocken, PA 19428
1941 | Trustee since February 2000 | Mr. Shisler has been a consultant since January 2003. Prior thereto, he was President and Chief Executive Officer of K&B Transport, Inc., a trucking firm. Since 1992, Mr. Shisler has also been Chairman of the Board for Nationwide Mutual Insurance Company3. | 84 | Director of Nationwide Financial Services, Inc. | ||||
Gerald J. Holland
Gartmore Global Investments, Inc. 1200 River Road, Suite 1000 Conshohocken, PA 19428
1951 | Treasurer since March 2001 | Mr. Holland is Senior Vice President — Operations for GGI3, GMFCT3 , and GSA3. Prior to July 2000, Mr. Holland was Vice President for First Data Investor Services, an investment company service provider. | 84 | None |
25
Table of Contents
GARTMORE VARIABLE INSURANCE TRUST
Management Information (Unaudited)
June 30, 2005
| Name, Address and Age | Position(s) Held with the Trust and Length of Time Served1 | Principal Occupation(s) During Past 5 Years | Number of Portfolios in the Gartmore Fund Complex Overseen by Trustee | Other Directorships Held by Trustee2 | ||||
Michael A. Krulikowski
Gartmore Global Investments, Inc. 1200 River Road, Suite 1000 Conshohocken, PA 19428
1959 | Chief Compliance Officer since June 2004 | Since November 1999, Mr. Krulikowski has served as a Vice President and Chief Compliance Officer of GGI. Prior thereto, Mr. Krulikowski served as Chief Compliance Officer of 1717 Capital Management Company/Provident Mutual Insurance Company. | 84 | None | ||||
Eric E. Miller
Gartmore Global Investments, Inc. 1200 River Road, Suite 1000 Conshohocken, PA 19428
1953 | Secretary since December 2002 | Mr. Miller is Senior Vice President, Chief Counsel for GGI3, GMFCT3 and GSA3 since August 2002. From August 2000 to August 2002, Mr. Miller was a Partner with Stradley Ronan Stevens & Young, LLP. Prior to August 2000, Mr. Miller served as Senior Vice President and Deputy General Counsel at Delaware Investments. | 84 | None |
| 1 | The term of office length is until a trustee resigns or reaches a mandatory retirement age of 70. On March 2, 2000, the Board adopted a five-year implementation period for any Trustee 65 or older as of the adoption of this policy. Pursuant to this policy, Messrs. Duncan and Kerr retired as trustees effective as of March 12, 2005. |
| 2 | Directorships held in (1) any other investment companies registered under the 1940 Act, (2) any company with a class of securities registered pursuant to Section 12 of the Securities Exchange Act of 1934, as amended (the “Exchange Act”), or (3) any company subject to the requirements of Section 15(d) of the Exchange Act. |
| 3 | This position is held with an affiliated person or principal underwriter of the Trust. |
| 4 | Mr. Hondros was also an Administrative Committee Member for the Alphagen Arneb Fund, LLC, The Healthcare Fund LDC, The Leaders Long-Short Fund, LLC, and The Leaders Long-Short Fund LDC, four private investment companies (hedge funds) managed by GSA. Mr. Hondros resigned as Administrative Committee Member effective June 30, 2005. |
Federal law requires the Trust, each of its investment advisers and sub-advisers to adopt procedures for voting proxies (“Proxy Voting Guidelines”) and to provide a summary of those Proxy Voting Guidelines used to vote the securities held by the Funds. The Funds’ proxy voting policies and procedures are available without charge (i) upon request, by calling 1-800-848-0920, (ii) on the Fund’s website at www.gartmorefunds.com, or (iii) on the Securities and Exchange Commission’s website at www.sec.gov.
26
Table of Contents
Gartmore GVIT Growth Fund
Semiannual Report
| | June 30, 2005 |
| Contents | ||
| 6 | Statement of Investments | |
| 8 | Statement of Assets and Liabilities | |
| 8 | Statement of Operations | |
| 9 | Statements of Changes in Net Assets | |
| 10 | Financial Highlights | |
| 11 | Notes to Financial Statements | |
Commentary provided by Gartmore Global Investments, investment adviser to Gartmore Variable Insurance Trust. All opinions and estimates included in this report constitute Gartmore Global Investments’ judgment as of the date of this report and are subject to change without notice.
Statement Regarding Availability of Quarterly Portfolio Schedule.
The Gartmore Variable Insurance Trust files complete schedules of portfolio holdings for each Fund with the Securities and Exchange Commission (the “Commission”) for the first and third quarters of each fiscal year on Form N-Q. The Funds’ Forms N-Q are available on the Commission’s website at http://www.sec.gov. The Funds’ Forms N-Q may be reviewed and copied at the Commission’s Public Reference Room in Washington, DC, and information on the operation of the Public Reference Room may be obtained by calling 800-SEC-0330; and the Funds make the information on Form N-Q available to shareholders upon request without charge.
Statement Regarding Availability of Proxy Voting Record.
Information regarding how the Fund voted proxies relating to portfolio securities held during the most recent 12-month period ended June 30, 2005 is available without charge, upon request, by calling 800-848-0920, and on the Commission’s website at http://www.sec.gov.
Table of Contents
Gartmore GVIT Growth Fund
For the semiannual period ended June 30, 2005, the Gartmore GVIT Growth Fund returned 0.45% (Class I at NAV) versus -1.72% for its benchmark, the Russell 1000® Growth Index. For broader comparison, the average return for the Fund’s Lipper peer category of Large-Cap Growth Funds was -1.42%.
The Fund is managed with a low tracking error to the benchmark and places emphasis on stock selection to add value. For this semi-annual reporting period the Fund outperformed the benchmark by more than two percentage points during the reporting period. The outperformance was driven by strong stock selection, particularly in the information technology, consumer discretionary and consumer staples sectors. In technology, the Fund benefited from its holdings in Internet search engine Google Inc., which rewarded investors with upwardly revised earnings, increasing market share and robust paid-search revenues. Another technology holding boosting the Fund’s results was microprocessor maker Intel Corp. A strong product lineup and improved demand for desktop computers led to expanding profit margins for Intel.
In the consumer discretionary sector, Nordstrom, Inc. was a key contributor. The department store chain’s share price benefited from solid increases in same-store sales, due to the company’s reputation for excellent service, quality merchandise and reasonable prices. In consumer staples, personal products maker The Gillette Co. performed well, as the company received a buyout offer from Procter & Gamble Co. at a premium to the price at which Gillette’s stock was trading at the time.
Holding back the Fund’s performance was biotechnology stock Biogen Idec Inc., which was hampered by the news that the company had voluntarily withdrawn from the market its multiple sclerosis medication, Tysabri, because of its apparent link to several deaths from a rare central nervous system disease. In the financials sector, consumer lender The First Marblehead Corp. and Investors Financial Services Corp., a provider of back-office services to asset management companies, struggled in part because of a flattening yield curve, a condition in which the difference between long-term and short-term interest rates narrows.
Important changes during the reporting period included a reduction in the Fund’s industrials weighting, which went from an overweighting to an underweighting versus the benchmark. In our opinion, sentiment regarding this sector had been overly optimistic, and we did not believe that such optimism was justified in relation to the capital spending we observed for industrial products. Conversely, we increased the Fund’s weighting in consumer discretionary stocks, especially in the retail area and the hotels, restaurants and leisure segment.
While the U.S. economy could slow from its recent pace, we should keep in mind that for the past two quarters, economists have had to revise gross domestic product growth upward from initial estimates. Similarly, personal disposable income continues to be surprisingly strong, buoyed in part by a robust housing market. At present, therefore, we are comfortable with the Fund’s modest overweightings in the technology and consumer discretionary sectors, and we anticipate a reasonably favorable near-term environment for applying our disciplined brand of bottom-up stock picking—a strategy that involves considering companies simply on their own merit, without regard to their given industries/sectors or the current economic conditions.
PORTFOLIO MANAGERS: Christopher Baggini, CFA and Douglas Burtnick, CFA
Russell 1000® Growth Index: An unmanaged index that measures the performance of the stocks of U.S. companies in the Russell 1000® Index (the largest 1,000 U.S. companies, based on market capitalization) with higher price-to-book ratios and higher forecasted growth values.
Investing in mutual funds involves risk, including possible loss of principal.
There is no assurance that the investment objective of any fund will be achieved.
Lipper Analytical Services, Inc. is an industry research firm whose rankings are based on total return performance and do not reflect the effects of sales charges.
The Gartmore Variable Insurance Trust Funds are available only as sub-account investment options in certain variable insurance products. Accordingly, investors are unable to invest in shares of these funds outside of an insurance product. Performance information found herein reflects only the performance of these funds, and does not indicate the performance your sub-account may experience under your variable insurance contract. Performance returns assume reinvestment of all distributions. The investment return and principal value of an investment will fluctuate so that an investor’s shares, when redeemed, may be worth more or less than their original cost. Index performance is provided for comparison purposes only; the indexes shown are unmanaged and do not reflect any fees or expenses. Investors cannot invest directly in market indexes. To obtain performance information about the sub-account option under your insurance contract that invests in one of these funds, please contact your variable insurance carrier. PAST PERFORMANCE IS NO GUARANTEE OF FUTURE RESULTS.
1
Table of Contents
Gartmore GVIT Growth Fund (continued)
Commentary provided by Gartmore Global Investments. All opinions and estimates included in this report constitute Gartmore Global Investments’ judgment as of the date of this report and are subject to change without notice.
Investors should carefully consider a fund’s investment objectives, risks, fees, charges and expenses before investing any money. To obtain this and other information on Gartmore Variable Insurance Trust, please contact your variable insurance contract provider or call 800-848-0920. Please read the Trust’s prospectus carefully before investing any money.
Gartmore Funds distributed by Gartmore Distribution Services, Inc., Member NASD. 1200 River Road, Suite 1000, Conshohocken, PA 19428.
2
Table of Contents
Fund Performance | Gartmore GVIT Growth Fund |
| Average | Annual Total Return1 |
(For Periods Ended June 30, 2005)
| Six months* | One year | Five years | Ten years | |||||
| Class I2 | 0.45% | 5.83% | -11.64% | 3.90% | ||||
| Class IV3 | 0.46% | 5.83% | -11.63% | 3.91% |
| * | Not Annualized. |
| 1 | Not subject to any sales charges. |
| 2 | The existing shares of the Fund were designated Class I shares as of May 1, 2001. |
| 3 | These returns until the creation of Class IV shares (April 28, 2003) are based on the performance of the Class I shares of the Fund. Excluding the effect of fee waivers or reimbursements, such prior performance is similar to what Class IV shares would have produced because Class IV shares invest in the same portfolio of securities. |
| Performance | of a $10,000 Investment |
Investment return and principal value will fluctuate, and when redeemed, shares may be worth more or less than original cost. Past performance is no guarantee of future results and does not reflect the deduction of taxes that a shareholder would pay on fund distributions or the redemption of fund shares. Investing in mutual funds involves market risk, including loss of principal. Performance returns assume the reinvestment of all distributions.
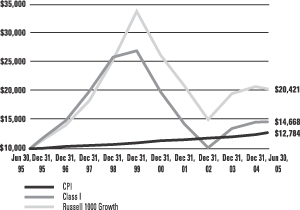
Comparative performance of $10,000 invested in Class I shares of the Gartmore GVIT Growth Fund, the Russell 1000 Growth Index (Russell 1000 Growth)(a), and the Consumer Price Index (CPI)(b) over a 10-year period ended 06/30/05. Unlike, the Fund, the returns for these unmanaged indexes do not reflect any fees, expenses, or sales charges. Investors cannot invest directly in market indexes.
| (a) | The Russell 1000 Growth measures the performance of those companies in the Russell 1000 Index (the largest 1000 U.S. companies, based on market capitalization) with higher price-to-book ratios and higher forecasted growth values. |
| (b) | The CPI represents changes in prices of a basket of goods and services purchased for consumption by urban households. |
3
Table of Contents
Shareholder
Expense Example | Gartmore GVIT Growth Fund |
As a shareholder of the Fund, you incur two types of costs: (1) transaction costs, including sales charges (loads) paid on purchase payments and redemption fees; and (2) ongoing costs, including investment advisory fees, administration fees, distribution fees and other Fund expenses. The examples below are intended to help you understand your ongoing costs (in dollars) of investing in the Fund and to compare these costs with the ongoing costs of investing in other mutual funds. Per SEC requirements, the examples assume that you had a $1,000 investment in the Class at the beginning of the reporting period, January 1, 2005, and continued to hold your shares at the end of the reporting period, June 30, 2005.
Actual Expenses
For each Class of the Fund in the table below, the first line provides information about actual account values and actual expenses. You may use the information in this line, together with the amount you invested, to estimate the expenses that you paid over the period. Simply divide your account value by $1,000 (for example, an $8,600 account value divided by $1,000 = 8.6), then multiply the result by the number in the first line of each Class under the heading entitled “Expenses Paid During Period” to estimate the expenses you paid on your account during the period.
Hypothetical Example for Comparison Purposes
The second line of each Class in the table below provides information about hypothetical account values and hypothetical expenses based on the Class’ actual expense ratio and an assumed rate of return of 5% per year before expenses, which is not the Class’ actual return. The hypothetical account values and expenses may not be used to estimate the actual ending account balance or expenses you paid for the period. You may use this information to compare the ongoing costs of investing in the Class of the Fund and other funds. To do so, compare this 5% hypothetical example with the 5% hypothetical examples that appear in the shareholder reports of the other funds.
Please note that the expenses shown in the table are meant to highlight your ongoing costs only and do not reflect any transaction costs, such as sales charges (loads) or redemption fees. Therefore, the second line for each Class in the table is useful in comparing ongoing costs only, and will not help you determine the relative total costs of owning different funds. In addition, if these transaction costs were included, your costs would have been higher. The examples also assume all dividends and distributions have been reinvested.
| Beginning Account Value, January 1, 2005 | Ending Account Value, June 30, 2005 | Expenses Paid During Period* | Annualized Expense Ratio* | |||||||||||
| Growth Fund | ||||||||||||||
Class I | Actual | $ | 1,000 | $ | 1,005 | $ | 4.27 | 0.86 | % | |||||
| Hypothetical1 | $ | 1,000 | $ | 1,021 | $ | 4.32 | 0.86 | % | ||||||
Class IV | Actual | $ | 1,000 | $ | 1,005 | $ | 4.27 | 0.86 | % | |||||
| Hypothetical1 | $ | 1,000 | $ | 1,021 | $ | 4.32 | 0.86 | % | ||||||
| * | Expenses are equal to the Fund’s annualized expense ratio multiplied by the average account value over the period multiplied by 181/365 (to reflect the one-half year period). The expense ratio presented represents a six month, annualized ratio in accordance with SEC guidelines. |
| 1 | Represents the hypothetical 5% return before expenses. |
4
Table of Contents
Portfolio Summary
(June 30, 2005) | Gartmore GVIT Growth Fund |
The SEC adopted a requirement that Funds present their portfolio holdings in a table, chart or graph format in their annual and semiannual reports to shareholders, whether or not a statement of investments is utilized. The following tables, which present portfolio holdings as a percentage of net assets, are provided in compliance with this requirement.
| Asset Allocation | ||
| Common Stocks | 99.9% | |
| Commercial Paper | 0.3% | |
| Other Investments* | 7.7% | |
| Liabilities in excess of other assets** | -7.9% | |
| 100.0% | ||
| Top Holdings | ||
| Johnson & Johnson | 3.7% | |
| Intel Corp. | 3.4% | |
| Microsoft Corp. | 3.3% | |
| Cisco Systems, Inc. | 3.2% | |
| General Electric Co. | 2.6% | |
| PepsiCo, Inc. | 2.5% | |
| Dell, Inc. | 2.2% | |
| Capital One Financial Corp. | 2.0% | |
| VeriSign, Inc. | 1.8% | |
| Franklin Resources, Inc. | 1.7% | |
| Other Holdings | 73.6% | |
| 100.0% | ||
| Top Industries | ||
| Retail | 11.5% | |
| Healthcare | 10.4% | |
| Telecommunications | 9.1% | |
| Financial Services | 8.5% | |
| Manufacturing | 6.8% | |
| Computer Software & Services | 6.5% | |
| Drugs | 5.3% | |
| Semiconductors | 4.6% | |
| Computer Equipment | 4.3% | |
| Medical Products | 4.2% | |
| Other Industries | 28.8% | |
| 100.0% | ||
| * | Includes value of collateral received from securities lending. |
| ** | Includes value of collateral owed from securities lending. |
5
Table of Contents
GARTMORE VARIABLE INSURANCE TRUST
GARTMORE GVIT GROWTH FUND
Statement of Investments — June 30, 2005 (Unaudited)
| Shares or Principal Amount | Value | ||||
| COMMON STOCKS (99.9%) | |||||
| Aerospace & Defense (2.3%) | |||||
| Boeing Co. | 29,650 | $ | 1,956,900 | ||
| United Technologies Corp. | 70,200 | 3,604,770 | |||
| 5,561,670 | |||||
| Agriculture (0.7%) | |||||
| Monsanto Co. | 27,100 | 1,703,777 | |||
| Building—Residential & Commercial (0.5%) | |||||
| Toll Brothers, Inc. (b) | 12,900 | 1,309,995 | |||
| Business Services (1.2%) | |||||
| CRA International, Inc. (b) | 28,350 | 1,526,648 | |||
| Monster Worldwide, Inc. (b) | 51,280 | 1,470,710 | |||
| 2,997,358 | |||||
| Chemicals (1.5%) | |||||
| Albemarle Corp. | 31,700 | 1,156,099 | |||
| Praxair, Inc. | 51,930 | 2,419,938 | |||
| 3,576,037 | |||||
| Coal (0.9%) | |||||
| Peabody Energy Corp. | 40,850 | 2,125,834 | |||
| Computer Equipment (4.3%) | |||||
| AutoDesk, Inc. | 72,440 | 2,489,763 | |||
| Dell, Inc. (b) | 134,600 | 5,318,045 | |||
| EMC Corp. (b) | 191,250 | 2,622,038 | |||
| 10,429,846 | |||||
| Computer Networks (3.2%) | |||||
| Cisco Systems, Inc. (b) | 409,350 | 7,822,679 | |||
| Computer Software & Services (6.5%) | |||||
| Cognizant Technology Solutions Corp. (b) | 39,670 | 1,869,647 | |||
| Google, Inc. (b) | 8,420 | 2,476,743 | |||
| Microsoft Corp. | 322,370 | 8,007,671 | |||
| THQ, Inc. (b) | 36,600 | 1,071,282 | |||
| Yahoo! Inc. (b) | 68,580 | 2,376,297 | |||
| 15,801,640 | |||||
| Consumer Products (1.4%) | |||||
| Colgate-Palmolive Co. | 29,050 | 1,449,886 | |||
| Estee Lauder Cos., Inc., Class A | 52,720 | 2,062,933 | |||
| 3,512,819 | |||||
| Drugs (5.3%) | |||||
| Abbott Laboratories | 74,370 | 3,644,873 | |||
| Eli Lilly & Co. | 60,670 | 3,379,926 | |||
| Schering-Plough Corp. | 120,450 | 2,295,777 | |||
| Shares or Principal Amount | Value | ||||
| COMMON STOCKS (continued) | |||||
| Drugs (continued) | |||||
| Sepracor, Inc. (b) | 20,150 | $ | 1,209,202 | ||
| Wyeth | 53,620 | 2,386,090 | |||
| 12,915,868 | |||||
| Electronics (3.4%) | |||||
| Intel Corp. | 316,000 | 8,234,960 | |||
| Financial Services (8.2%) | |||||
| American Express Corp. | 66,420 | 3,535,537 | |||
| Bank of America Corp. | 33,800 | 1,541,618 | |||
| Capital One Financial Corp. | 57,790 | 4,623,777 | |||
| Chicago Mercantile Exchange | 6,080 | 1,796,640 | |||
| Countrywide Financial Corp. | 44,450 | 1,716,215 | |||
| Franklin Resources, Inc. | 54,730 | 4,213,115 | |||
| Goldman Sachs Group, Inc. | 23,730 | 2,420,935 | |||
| 19,847,837 | |||||
| Food & Beverage (4.1%) | |||||
| Coca-Cola Co. (The) | 34,150 | 1,425,763 | |||
| Constellation Brands Inc (b) | 40,700 | 1,200,650 | |||
| Darden Restaurants, Inc. | 38,850 | 1,281,273 | |||
| PepsiCo, Inc. | 110,960 | 5,984,072 | |||
| 9,891,758 | |||||
| Healthcare (10.4%) | |||||
| Amgen, Inc. (b) | 52,190 | 3,155,407 | |||
| Fisher Scientific International, Inc. (b) | 23,880 | 1,549,812 | |||
| Ivax Corp. (b) | 75,480 | 1,622,820 | |||
| Johnson & Johnson | 134,030 | 8,711,951 | |||
| Medcohealth Solutions, Inc. (b) | 45,600 | 2,433,216 | |||
| UnitedHealth Group, Inc. | 76,560 | 3,991,838 | |||
| Wellpoint, Inc. (b) | 49,900 | 3,475,036 | |||
| 24,940,080 | |||||
| �� | |||||
| Hotels & Casinos (3.7%) | |||||
| Harrah’s Entertainment, Inc. | 16,700 | 1,203,569 | |||
| Marriott International, Inc. | 48,190 | 3,287,522 | |||
| Starwood Hotels & Resorts | 36,890 | 2,160,647 | |||
| Station Casinos, Inc. | 35,520 | 2,358,528 | |||
| 9,010,266 | |||||
| Manufacturing (6.8%) | |||||
| American Standard Cos., Inc. | 43,020 | 1,803,398 | |||
| D. R. Horton, Inc. | 33,800 | 1,271,218 | |||
| Danaher Corp. | 34,850 | 1,824,049 | |||
| Deere & Co. | 22,050 | 1,444,055 | |||
| General Electric Co. | 180,700 | 6,261,254 | |||
6
Table of Contents
GARTMORE VARIABLE INSURANCE TRUST
GARTMORE GVIT GROWTH FUND
Statement of Investments — June 30, 2005 (Unaudited) (continued)
| Shares or Principal Amount | Value | ||||
| COMMON STOCKS (continued) | |||||
| Manufacturing (continued) | |||||
| Honeywell International, Inc. | 39,100 | $ | 1,432,233 | ||
| Textron, Inc. | 32,450 | 2,461,333 | |||
| 16,497,540 | |||||
| Medical Products (4.2%) | |||||
| Genentech, Inc. (b) | 19,260 | 1,546,193 | |||
| Invitrogen Corp. (b) | 38,050 | 3,169,185 | |||
| St. Jude Medical, Inc. (b) | 72,000 | 3,139,920 | |||
| Stryker Corp. | 51,020 | 2,426,511 | |||
| 10,281,809 | |||||
| Multimedia (2.5%) | |||||
| Activision, Inc. (b) | 111,480 | 1,841,650 | |||
| News Corp., Class A | 114,590 | 1,854,066 | |||
| Walt Disney Co. (The) | 95,330 | 2,400,409 | |||
| 6,096,125 | |||||
| Oil & Gas (2.3%) | |||||
| Baker Hughes, Inc. | 19,350 | 989,946 | |||
| National-OilWell, Inc. (b) | 20,750 | 986,455 | |||
| Transocean, Inc. (b) | 49,170 | 2,653,705 | |||
| Weatherford International Ltd. (b) | 16,550 | 959,569 | |||
| 5,589,675 | |||||
| Retail (11.5%) | |||||
| American Eagle Outfitters | 59,500 | 1,823,675 | |||
| Brinker International, Inc. (b) | 50,850 | 2,036,543 | |||
| Coach, Inc. (b) | 37,900 | 1,272,303 | |||
| CVS Corp. | 105,800 | 3,075,606 | |||
| eBay, Inc. (b) | 70,750 | 2,335,458 | |||
| Home Depot, Inc. (The) | 60,980 | 2,372,122 | |||
| Kohl’s Corp. (b) | 59,170 | 3,308,195 | |||
| Lowe’s Cos., Inc. | 63,450 | 3,694,058 | |||
| Nordstrom, Inc. | 25,360 | 1,723,719 | |||
| Target Corp. | 55,700 | 3,030,637 | |||
| Wal-Mart Stores, Inc. | 63,730 | 3,071,786 | |||
| 27,744,102 | |||||
| Semiconductors (4.6%) | |||||
| Analog Devices, Inc. | 65,250 | 2,434,478 | |||
| Broadcom Corp. (b) | 81,010 | 2,876,664 | |||
| Maxim Integrated Products, Inc. | 62,760 | 2,398,060 | |||
| Texas Instruments, Inc. | 81,000 | 2,273,670 | |||
| Xilinx, Inc. | 46,650 | 1,189,575 | |||
| 11,172,447 | |||||
| Shares or Principal Amount | Value | ||||||
| COMMON STOCKS (continued) | |||||||
| Telecommunications (9.1%) | |||||||
| Alamosa Holdings, Inc. (b) | 142,610 | $ | 1,982,279 | ||||
| Comverse Technology, Inc. (b) | 152,870 | 3,615,375 | |||||
| Corning, Inc. (b) | 123,400 | 2,050,908 | |||||
| Juniper Networks, Inc. (b) | 133,600 | 3,364,048 | |||||
| Motorola, Inc. | 113,000 | 2,063,380 | |||||
| Nokia Corp. ADR — FI | 145,640 | 2,423,450 | |||||
| Sprint Corp. | 84,550 | 2,121,360 | |||||
| VeriSign, Inc. (b) | 146,860 | 4,223,693 | |||||
| 21,844,493 | |||||||
| Transportation Services (1.3%) | |||||||
| C.H. Robinson Worldwide, Inc. | 20,770 | 1,208,814 | |||||
| Carnival Corp. | 35,930 | 1,959,982 | |||||
| 3,168,796 | |||||||
| Total Common Stocks | 242,077,411 | ||||||
| COMMERCIAL PAPER (0.3%) | |||||||
| Financial Services (0.3%) | |||||||
| Countrywide Home Loans, 3.45%, 7/1/05 | $ | 819,000 | 819,000 | ||||
| Total Commercial Papers | 819,000 | ||||||
| SHORT-TERM SECURITIES HELD AS COLLATERAL FOR SECURITIES LENDING (7.7%) | |||||||
| Pool of short-term securities for Gartmore Variable Insurance Trust Funds — note 2 (Securities Lending) | 18,648,777 | 18,648,777 | |||||
| Total Investments (Cost $247,829,327) (a) — 107.9% | 261,545,188 | ||||||
| Liabilities in excess of other assets — (7.9%) | (19,115,739 | ) | |||||
| NET ASSETS — 100.0% | $ | 242,429,449 | |||||
| (a) | See notes to financial statements for tax unrealized appreciation (depreciation) of securities. |
| (b) | Denotes a non-income producing security. |
| ADR | American Depositary Receipt |
| FI | Finland |
See notes to financial statements.
7
Table of Contents
GARTMORE VARIABLE INSURANCE TRUST
GARTMORE GVIT GROWTH FUND
Statement of Assets and Liabilities
June 30, 2005 (Unaudited)
Assets: | ||||
Investments, at value (cost $247,829,327) | $ | 261,545,188 | ||
Cash | 919 | |||
Interest and dividends receivable | 99,145 | |||
Receivable for investments sold | 6,960,575 | |||
Prepaid expenses and other assets | 3,282 | |||
Total Assets | 268,609,109 | |||
Liabilities: | ||||
Payable for investments purchased | 7,370,611 | |||
Payable for return of collateral received for securities on loan | 18,648,777 | |||
Accrued expenses and other payables: | ||||
Investment advisory fees | 121,490 | |||
Fund administration and transfer agent fees | 7,068 | |||
Administrative servicing fees | 28,237 | |||
Other | 3,477 | |||
Total Liabilities | 26,179,660 | |||
Net Assets | $ | 242,429,449 | ||
Represented by: | ||||
Capital | $ | 550,417,995 | ||
Accumulated net investment income (loss) | (20,777 | ) | ||
Accumulated net realized gains (losses) from investment transactions | (321,683,630 | ) | ||
Net unrealized appreciation (depreciation) | 13,715,861 | |||
Net Assets | $ | 242,429,449 | ||
Net Assets: | ||||
Class I Shares | $ | 206,154,300 | ||
Class IV Shares | 36,275,149 | |||
Total | $ | 242,429,449 | ||
Shares outstanding (unlimited number of shares authorized): | ||||
Class I Shares | 19,088,939 | |||
Class IV Shares | 3,359,500 | |||
Total | 22,448,439 | |||
Net asset value and offering price per share:* | ||||
Class I Shares | $ | 10.80 | ||
Class IV Shares | $ | 10.80 |
| * | Not subject to a front-end sales charge. |
For the Six Months Ended June 30, 2005 (Unaudited)
Investment Income: | ||||
Interest income | $ | 15,135 | ||
Dividend income | 1,190,024 | |||
Income from securities lending | 17,627 | |||
Total Income | 1,222,786 | |||
Expenses: | ||||
Investment advisory fees | 735,364 | |||
Fund administration and transfer agent fees | 80,490 | |||
Administrative servicing fees | 155,311 | |||
Administrative servicing fees | 26,858 | |||
Other** | 51,423 | |||
Total Expenses | 1,049,446 | |||
Net Investment Income (Loss) | 173,340 | |||
REALIZED/UNREALIZED GAINS (LOSSES) ON INVESTMENTS: | ||||
Net realized gains (losses) on investment transactions | 7,779,986 | |||
Net change in unrealized appreciation/depreciation on investments | (7,238,743 | ) | ||
Net realized/unrealized gains (losses) on investments | 541,243 | |||
CHANGE IN NET ASSETS RESULTING FROM OPERATIONS | $ | 714,583 | ||
| ** | Other expenses may include the following fees: audit, custody, insurance, legal, printing, trustee, and out-of-pocket expenses. |
See notes to financial statements.
8
Table of Contents
GARTMORE VARIABLE INSURANCE TRUST
GARTMORE GVIT GROWTH FUND
Statement of Changes in Net Assets
| Six Months Ended June 30, 2005 | Year Ended December 31, 2004 | |||||||
| (Unaudited) | ||||||||
From Investment Activities: | ||||||||
Operations: | ||||||||
Net investment income (loss) | $ | 173,340 | $ | 685,987 | ||||
Net realized gains (losses) on investment transactions | 7,779,986 | 27,205,825 | ||||||
Net change in unrealized appreciation/depreciation on investments | (7,238,743 | ) | (8,047,573 | ) | ||||
Change in net assets resulting from operations | 714,583 | 19,844,239 | ||||||
Distributions to Class I shareholders from: | ||||||||
Net investment income | (169,795 | ) | (717,073 | ) | ||||
Distributions to Class IV shareholders from: | ||||||||
Net investment income | (30,322 | ) | (120,939 | ) | ||||
Change in net assets from shareholder distributions | (200,117 | ) | (838,012 | ) | ||||
Change in net assets from capital transactions | (20,452,753 | ) | (35,399,574 | ) | ||||
Change in net assets | (19,938,287 | ) | (16,393,347 | ) | ||||
Net Assets: | ||||||||
Beginning of period | 262,367,736 | 278,761,083 | ||||||
End of period | $ | 242,429,449 | $ | 262,367,736 | ||||
CAPITAL TRANSACTIONS: | ||||||||
Class I Shares | ||||||||
Proceeds from shares issued | $ | 3,594,283 | $ | 8,544,891 | ||||
Dividends reinvested | 169,795 | 717,073 | ||||||
Cost of shares redeemed | (22,322,404 | ) | (45,957,810 | ) | ||||
| (18,558,326 | ) | (36,695,846 | ) | |||||
Class IV Shares | ||||||||
Proceeds from shares issued | 1,512,635 | 7,007,935 | ||||||
Dividends reinvested | 30,322 | 120,939 | ||||||
Cost of shares redeemed | (3,437,384 | ) | (5,832,602 | ) | ||||
| (1,894,427 | ) | 1,296,272 | ||||||
Change in net assets from capital transactions | $ | (20,452,753 | ) | $ | (35,399,574 | ) | ||
SHARE TRANSACTIONS: | ||||||||
Class I Shares | ||||||||
Issued | 343,726 | 844,873 | ||||||
Reinvested | 15,946 | 67,417 | ||||||
Redeemed | (2,111,344 | ) | (4,595,533 | ) | ||||
| (1,751,672 | ) | (3,683,243 | ) | |||||
Class IV Shares | ||||||||
Issued | 142,973 | 691,327 | ||||||
Reinvested | 2,847 | 11,366 | ||||||
Redeemed | (323,839 | ) | (582,517 | ) | ||||
| (178,019 | ) | 120,176 | ||||||
See notes to financial statements.
9
Table of Contents
GARTMORE VARIABLE INSURANCE TRUST
FINANCIAL HIGHLIGHTS
Selected Data for Each Share of Capital Outstanding
Gartmore GVIT Growth Fund
| Investment Activities | Distributions | Ratios/Supplemental Data | ||||||||||||||||||||||||||||||||||||||||||
| Net Asset Value, Beginning of Period | Net Investment Income (Loss) | Net Realized and Unrealized Gains (Losses) on Investments | Total from Investment Activities | Net Investment Income | Net Realized Gains | Total Distributions | Net Asset Value, End of Period | Total Return | Net Assets at End of Period (000s) | Ratio of Expenses to Average Net Assets | Ratio of Net Investment Income (Loss) to Average Net Assets | Ratio of Expenses (Prior to Reimbursements) to Average Net Assets(a) | Ratio of Net Investment Income (Loss) (Prior to Reimbursements) to Average Net Assets(a) | Portfolio Turnover(b) | ||||||||||||||||||||||||||||||
Class I Shares | ||||||||||||||||||||||||||||||||||||||||||||
Year Ended December 31, 2000 | $ | 25.71 | (0.01 | ) | (6.76 | ) | (6.77 | ) | (0.04 | ) | (4.22 | ) | (4.26 | ) | $ | 14.68 | (26.53% | ) | $ | 606,599 | 0.80% | (0.07% | ) | 0.83% | (0.10% | ) | 205.34% | |||||||||||||||||
Year Ended December 31, 2001(c) | $ | 14.68 | (0.01 | ) | (4.12 | ) | (4.13 | ) | — | — | — | $ | 10.55 | (28.13% | ) | $ | 352,147 | 0.80% | (0.10% | ) | 0.85% | (0.15% | ) | 227.28% | ||||||||||||||||||||
Year Ended December 31, 2002 | $ | 10.55 | — | (3.03 | ) | (3.03 | ) | — | — | — | $ | 7.52 | (28.72% | ) | $ | 201,689 | 0.85% | (0.03% | ) | 0.85% | (0.03% | ) | 231.69% | |||||||||||||||||||||
Year Ended December 31, 2003 | $ | 7.52 | 0.01 | 2.45 | 2.46 | (e) | — | — | $ | 9.98 | 32.74% | $ | 244,671 | 0.84% | 0.09% | (h | ) | (h | ) | 293.58% | ||||||||||||||||||||||||
Year Ended December 31, 2004 | $ | 9.98 | 0.02 | 0.79 | 0.81 | (0.03 | ) | — | (0.03 | ) | $ | 10.76 | 8.16% | $ | 224,301 | 0.85% | 0.26% | (h | ) | (h | ) | 282.41% | ||||||||||||||||||||||
Six Months Ended June 30, 2005 (Unaudited) | $ | 10.76 | 0.01 | 0.04 | 0.05 | (0.01 | ) | — | (0.01 | ) | $ | 10.80 | 0.45% | (f) | $ | 206,154 | 0.86% | (g) | 0.14% | (g) | (h | ) | (h | ) | 129.75% | |||||||||||||||||||
Class IV Shares | ||||||||||||||||||||||||||||||||||||||||||||
Period Ended December 31, 2003(d) | $ | 7.90 | — | 2.08 | 2.08 | (e | ) | — | — | $ | 9.98 | 26.37% | (f) | $ | 34,090 | 0.84% | (g) | 0.10% | (g) | (h | ) | (h | ) | 293.58% | ||||||||||||||||||||
Year Ended December 31, 2004 | $ | 9.98 | 0.02 | 0.79 | 0.81 | (0.03 | ) | — | (0.03 | ) | $ | 10.76 | 8.16% | $ | 38,067 | 0.85% | 0.27% | (h | ) | (h | ) | 282.41% | ||||||||||||||||||||||
Six Months Ended June 30, 2005 (Unaudited) | $ | 10.76 | 0.01 | 0.04 | 0.05 | (0.01 | ) | — | (0.01 | ) | $ | 10.80 | 0.46% | (f) | $ | 36,275 | 0.86% | (g) | 0.14% | (g) | (h | ) | (h | ) | 129.75% | |||||||||||||||||||
| (a) | During the period certain fees were waived and/or reimbursed. If such waivers/reimbursements had not occurred, the ratios would have been as indicated. |
| (b) | Portfolio turnover is calculated on the basis of the Fund as a whole without distinguishing among the classes of shares. |
| (c) | The existing shares of the Fund were designated Class I shares as of May 1, 2001. |
| (d) | For the period from April 28, 2003 (commencement of operations) through December 31, 2003. |
| (e) | The amount is less than $0.005 per share. |
| (f) | Not annualized. |
| (g) | Annualized. |
| (h) | There were no fee reductions during the period. |
See notes to financial statements.
10
Table of Contents
GARTMORE VARIABLE INSURANCE TRUST
NOTES TO FINANCIAL STATEMENTS (Unaudited)
June 30, 2005
1. Organization
Gartmore Variable Insurance Trust (“GVIT” or the “Trust”) is an open-end management investment company, organized under the laws of Delaware by an amended and restated Agreement and Declaration of Trust, dated October 28, 2004, as amended to date. The Trust, originally created under the laws of Massachusetts as a Massachusetts business trust pursuant to a Declaration of Trust dated, as of June 30, 1981, as subsequently amended, redomesticated as a Delaware Statutory Trust after the close of trading on April 29, 2005, and is registered under the Investment Company Act of 1940, as amended (the “1940 Act”). The redomestication is a change in statutory status and does not affect the operations of the Trust. As of June 30, 2005, the Trust had authorized an unlimited number of shares of beneficial interest (“shares”) without par value. The Trust currently offers shares to life insurance company separate accounts to fund the benefits under variable life insurance or annuity policies. To date, only the separate accounts of Nationwide Life Insurance Company and Nationwide Life and Annuity Insurance Company (collectively, “Nationwide”) have purchased shares of the Trust’s series. The Trust operates thirty-one (31) separate series, or mutual funds, each with its own investment objectives and strategies. This report contains the financial statements and financial highlights of the Gartmore GVIT Growth Fund (the “Fund”).
Under the Trust’s organizational documents, the Trust’s officers and trustees are indemnified against certain liabilities arising out of the performance of their duties to the Trust. In addition, the Trust has entered into Indemnification Agreements with the Trust’s trustees and certain officers covering similar liabilities. In addition, in the normal course of business, the Trust enters into contracts with its vendors and others that provide for general indemnifications. The Trust’s maximum exposure under these arrangements is unknown, as this would involve future claims that may be made against the Trust. Based on experience, however, the Trust expects that risk of loss to be remote.
2. Summary of Significant Accounting Policies
The following is a summary of significant accounting policies followed by the Fund in the preparation of its financial statements. The policies are in conformity with accounting principles generally accepted in the United States of America (“GAAP”). The preparation of financial statements requires management to make estimates and assumptions that affect the reported amounts of assets and liabilities, the disclosure of contingent assets and liabilities at the date of the financial statements and the reported amounts of income and expenses for the period. Actual results could differ from those estimates.
| (a) | Security Valuation |
Securities for which market quotations are readily available are valued at current market value as of “Valuation Time.” Valuation Time is as of the close of regular trading on the New York Stock Exchange (usually 4 p.m. Eastern time). Equity securities are valued at the last quoted sale price or, if there is no sale price, the last quoted bid price provided by an independent pricing service approved by the Trust’s Board of Trustees. Securities traded on NASDAQ are valued at the NASDAQ official closing price. Prices are taken from the primary market or exchange in which each security trades. Most securities listed on a foreign exchange are valued either at fair value (see description below) or at the last sale price at the close of the exchange on which the security is principally traded. Foreign securities, currencies, and other assets and liabilities denominated in foreign currencies are translated into U.S. dollars at the exchange rate of said currencies against the U.S. Dollar, as of Valuation Time, as provided by an independent pricing service approved by the Board of Trustees.
Securities for which market quotations are not readily available, or for which an independent pricing service does not provide a value or provides a value that does not represent fair value in the judgment of the Fund’s investment adviser or designee, are valued at fair value under procedures approved by the Trust’s Board of Trustees. The “Fair Value” of these securities is determined in good faith by taking into account relevant factors and surrounding circumstances. Methods utilized to obtain a “Fair Value” may include the following non-exclusive list of SEC acceptable methods: (i) a multiple of earnings; (ii) the discount from market value of a similar, freely traded security; (iii) the yield-to-maturity for debt issues; or (iv) a consolidation of the methods. The Gartmore Fair Value Committee considers a non-exclusive list of factors to arrive at the appropriate method upon determining “Fair Value.” For example, fair value determinations are required for securities whose value is affected by a “significant” event that materially affects the value of a domestic or foreign security which occurs subsequent to the time of the close of the principal market on which such domestic or foreign security trades and before the
11
Table of Contents
GARTMORE VARIABLE INSURANCE TRUST
NOTES TO FINANCIAL STATEMENTS (Unaudited) (Continued)
June 30, 2005
Valuation Time (i.e., a “subsequent event”). Typically, this will involve events occurring after the close of a foreign market on which a security trades and before the next Valuation Time.
| (b) | Repurchase Agreements |
The Fund may enter into repurchase agreements with an entity which is a member of the Federal Reserve System or which is a “primary dealer” (as designated by the Federal Reserve Bank of New York) in U.S. Government obligations. The repurchase price generally equals the price paid by the Fund plus interest negotiated on the basis of current short-term rates, which may be more or less than the rate on the underlying portfolio securities. The seller under a repurchase agreement is required to maintain the value of the collateral held pursuant to the agreement at a market value equal to or greater than the repurchase price (including accrued interest). Collateral subject to repurchase agreements is held by the Fund’s custodian or another qualified sub-custodian or in the Federal Reserve/Treasury book-entry system. If the counterparty defaults and the fair value of the collateral declines, realization of the collateral by the Fund may be delayed or limited. The Fund may transfer uninvested cash balances into a pooled cash account. These balances are invested in one or more repurchase agreements, which are fully collateralized by AA-rated Corporate Bonds with the counterparties of CS First Boston and Nomura Securities.
| (c) | Foreign Currency Transactions |
The accounting records of the Fund are maintained in U.S. dollars. Foreign currency amounts are translated into U.S. dollars at the current rate of exchange to determine the value of investments, assets and liabilities. The Fund may enter into foreign currency contracts in connection with purchases or sales of securities denominated in a foreign currency. Purchases and sales of securities, and income and expenses, are translated at the prevailing rate of exchange on the respective date of these transactions. The Fund does not isolate that portion of the results of operations resulting from changes in foreign exchange rates on investments from fluctuations arising from changes in market prices of securities held. These fluctuations are included with the net realized and unrealized gain or loss from investments and foreign currencies.
| (d) | Risks Associated with Foreign Securities and Currencies |
Investments in securities of foreign issuers carry certain risks not ordinarily associated with investments in securities of U.S. issuers. These risks include future political and economic developments, and the possible imposition of exchange controls or other foreign governmental laws and restrictions. In addition, with respect to certain countries, there is the possibility of expropriation of assets, confiscatory taxation, political or social instability, or diplomatic developments, which could adversely affect investments in those countries.
Certain countries also may impose substantial restrictions on investments in their capital markets by foreign entities, including restrictions on investments in issuers of industries deemed sensitive to relevant national interests. These factors may limit the investment opportunities available and result in a lack of liquidity and high price volatility with respect to securities of issuers from developing countries.
| (e) | Futures Contracts |
The Fund may invest in financial futures contracts (“futures contracts”) for the purpose of hedging its existing portfolio securities or securities that the Fund intends to purchase against fluctuations in value caused by changes in prevailing market interest rates or prices. Futures contracts may also be entered into for non-hedging purposes.
Upon entering into a futures contract, the Fund is required to pledge to the broker an amount of cash and/or other assets equal to a certain percentage of the contract amount (initial margin deposit). Subsequent payments, known as “variation margin,” are made each day, depending on the daily fluctuations in the fair value/market value of the underlying assets. A gain or loss equal to the daily variation margin is recognized on a daily basis. Futures contracts are valued daily at their last quoted sale price.
A “sale” of a futures contract means a contractual obligation to deliver the securities or foreign currency called for by the contract at a fixed price at a specified time in the future. A “purchase” of a futures contract means a contractual obligation to acquire the securities or foreign currency at a fixed price at a specified time in the future.
12
Table of Contents
GARTMORE VARIABLE INSURANCE TRUST
NOTES TO FINANCIAL STATEMENTS (Unaudited) (Continued)
June 30, 2005
Should market conditions change unexpectedly, the Fund may not achieve the anticipated benefits of the futures contracts and may realize a loss. The use of futures transactions for hedging purposes involves the risk of imperfect correlation in movements in the price of futures contracts, interest rates, and the value of the underlying hedged assets.
| (f) | Written Options Contracts |
The Fund may write options contracts. A written option obligates the Fund to deliver (written call) or to receive (written put) a specified quantity of an underlying asset at the contract amount upon exercise by the holder of the option. The value of the option contract is recorded as a liability and unrealized gain or loss is measured by the difference between the current value and the premium received. Options traded on an exchange are valued at the last quoted sale price, or in the absence of a sale, the bid price provided by an independent pricing service approved by the Board of Trustees. Non-exchange traded options are valued using dealer supplied quotes.
| (g) | Short Sales |
The Fund is authorized to engage in short-selling of portfolio securities which obligates the Fund to replace any security that the Fund has borrowed by purchasing the security at current market value sometime in the future. The Fund will incur a loss if the price of the security increases between the date of the short sale and the date on which the Fund replaces the borrowed security. The Fund generally will realize a gain if the price of the security declines between these dates. Until the Fund replaces the borrowed security, the Fund will maintain a segregated account with cash, U.S. Government securities and/or securities held long to sufficiently cover the Fund’s short position on a daily basis. Dividends declared on securities sold short are recorded as an expense on the ex-dividend date and paid to the counterparty on the dividend pay date. The collateral for securities sold short are recorded as an expense on the ex-dividend date and paid to the counterparty on the dividend pay date. The collateral for securities sold short includes the deposits with brokers and securities held long as shown in the Statement of Investments for the Fund.
| (h) | Security Transactions and Investment Income |
Security transactions are accounted for on the date the security is purchased or sold (“trade date”). Securities gains and losses are calculated on the identified cost basis. Interest income is recognized on the accrual basis and includes, where applicable, the amortization or accretion of premium or discount. Dividend income is recorded on the ex-dividend date.
| (i) | Securities Lending |
To generate additional income, the Fund may lend up to 33 1/3% of the Fund’s total assets pursuant to agreements, requiring that the borrower deliver cash or securities as collateral with respect to each new loan of U.S. securities, equal to at least 102% of the value of the portfolio securities loaned, and with respect to each new loan of non-U.S. securities, collateral of at least 105% of the value of the portfolio securities loaned, and thereafter requiring the borrower to mark to market the collateral on a daily basis and requiring the borrower to make up any shortfall of collateral. The Fund receives payments from borrowers equivalent to the dividends and interest that would have been earned on securities lent while simultaneously seeking to earn income on the investment of cash collateral. Collateral is marked to market daily to provide a level of collateral at least equal to the market value of securities loaned. There may be risks of delay in recovery of the securities should the borrower of the securities fail financially. Loans will be made, however, only to borrowers deemed by the Fund’s investment adviser to be of good standing and creditworthy under guidelines established by the Board of Trustees and when, in the judgment of the adviser, the consideration which can be earned currently from these securities loans justifies the attendant risks. Loans are subject to termination by the Fund or the borrower at any time, and, therefore, are not considered to be illiquid investments. JPMorgan Chase Bank serves as custodian for the securities lending program of the Fund. JPMorgan Chase Bank receives a custody fee based on the value of collateral received from borrowers.
13
Table of Contents
GARTMORE VARIABLE INSURANCE TRUST
NOTES TO FINANCIAL STATEMENTS (Unaudited) (Continued)
June 30, 2005
The cash collateral received by the Fund was pooled and, at June 30, 2005, was invested in the following:
Security Type | Security Name | Market Value | Maturity Rate | Maturity Date | |||||
| Commercial Paper | MacQuarie Bankk Ltd. | $ | 2,496,840 | 3.25% | 07/01/05 | ||||
| Master Note — Floating | CDC Financial Product Inc. | 8,000,000 | 3.54% | 07/01/05 | |||||
| Medium Term Note — Floating | General Electric Capital Corp. | 1,000,171 | 3.37% | 09/08/05 | |||||
| Repurchase Agreements | Nomura Securities | 7,151,766 | 3.48% | 07/01/05 | |||||
As of June 30, 2005, the Fund had securities with the following market values on loan:
Market Value of | Market Value of Collateral | ||
$18,191,056 | $ | 18,648,777 | |
| (j) | Distributions to Shareholders |
The Fund’s dividends from net investment income, if any, are declared and paid quarterly. The Fund’s distributable net realized capital gains, if any, are declared and distributed at least annually.
Dividends and distributions to shareholders are determined in accordance with federal income tax regulations, which may differ from GAAP. These “book/tax” differences are considered either permanent or temporary in nature. In accordance with the American Institute of Certified Public Accountants (“AICPA”) Statement of Position 93-2, permanent differences (i.e., reclassification of market discounts, gain/loss, paydowns, and distributions) are reclassified within the capital accounts based on their nature for federal income tax purposes; temporary differences do not require reclassification. These reclassifications have no effect upon the net asset value of the Fund. To the extent distributions exceed current and accumulated earnings and profits for federal income tax purposes, these distributions are reported as distributions of paid-in-capital.
(k) Federal Income Taxes
It is the policy of the Fund to qualify or continue to qualify as a “regulated investment company” by complying with the provisions available to certain investment companies, as defined in applicable sections of the U.S. Internal Revenue Code, and to make distributions of net investment income and net realized capital gains sufficient to relieve the Fund from all, or substantially all, federal income taxes.
As of June 30, 2005, the tax cost of securities and the breakdown of unrealized appreciation (depreciation) for the Fund is as follows:
Tax Cost of | Unrealized Appreciation | Unrealized Depreciation | Net Unrealized (Depreciation) | |||||||
$3,258,450 | $ | 12,984,462 | $ | (2,527,051 | ) | $ | 10,457,411 | |||
| (l) | Allocation of Expenses, Income, and Gains and Losses |
Expenses directly attributable to the Fund are charged to the Fund. Expenses not directly attributable to the Fund are allocated proportionately among various or all funds within the Trust. The method used by the Fund for allocating income, fund level expenses, and realized and unrealized gains or losses is based on the fair value of shares outstanding relative to net assets. Under this method, each class of shares participates based on the total net asset value of that class’s shares in proportion to the total net assets of the Fund. Expenses specific to a class (such as rule 12b-1 and administrative services fees) are charged to that class.
3. Transactions with Affiliates
Under the terms of the Trust’s Investment Advisory Agreement, Gartmore Mutual Fund Capital Trust (“GMF”) manages the investment of the assets and supervises the daily business affairs of the Fund. GMF is a wholly-owned subsidiary of
14
Table of Contents
GARTMORE VARIABLE INSURANCE TRUST
NOTES TO FINANCIAL STATEMENTS (Unaudited) (Continued)
June 30, 2005
Gartmore Global Investments, Inc. (“GGI”), a holding company. GGI is a majority-owned subsidiary of Gartmore Global Asset Management Trust (“GGAMT”). GGAMT is a wholly-owned subsidiary of Nationwide Corporation. All of the common stock of Nationwide Corporation is held by Nationwide Mutual Insurance Company (95.2%) and Nationwide Mutual Fire Insurance Company (4.8%), each of which is a mutual company owned by its policyholders.
Under the terms of the Investment Advisory Agreement, the Fund pays GMF an investment advisory fee based on the Fund’s average daily net assets and the following schedule:
| Fee Schedule | Fees | |
Up to $250 million | 0.60% | |
Next $750 million | 0.575% | |
Next $1 billion | 0.55% | |
Next $3 billion | 0.525% | |
$5 billion or more | 0.50% |
Under the terms of a Fund Administration and Transfer Agency Agreement, Gartmore SA Capital Trust (“GSA”) provides the Fund with various administrative and accounting services, and Gartmore Investors Services, Inc. (“GISI”), an indirect subsidiary of GSA, serves as Transfer and Dividend Disbursing Agent for the Fund. The fees for the services provided under this Agreement are calculated based on the Trust’s average daily net assets according to the fee schedule below. The fees are then allocated proportionately among all funds within the Trust in relation to the average daily net assets of each fund and are paid to GSA. GSA pays GISI from these fees for its services.
| Combined Fee Schedule* | ||
Up to $1 billion | 0.13% | |
$1 billion and more up to $3 billion | 0.08% | |
$3 billion and more up to $8 billion | 0.05% | |
$8 billion and more up to $10 billion | 0.04% | |
$10 billion and more up to $12 billion | 0.02% | |
$12 billion or more | 0.01% | |
| * | The assets of the Gartmore GVIT Investor Destinations Aggressive Fund, the Gartmore GVIT Investor Destinations Moderately Aggressive Fund, the Gartmore GVIT Investor Destinations Moderate Fund, the Gartmore GVIT Investor Destinations Moderately Conservative Fund, and the Gartmore GVIT Investor Destinations Conservative Fund (collectively, the “Investor Destinations Funds”) are excluded from the Trust asset level amount in order to calculate this asset-based fee. The Investor Destinations Funds do not pay any part of this fee. |
Effective January 1, 2005, the fee for the fund administration and transfer agency services increased as set forth below. The fees are calculated based on the Trust’s average daily net assets according to the fee schedule below. The fees are then allocated proportionately among all funds within the Trust in relation to the average daily net assets of each fund and are paid to GSA.
| Combined Fee Schedule* | ||
Up to $1 billion | 0.15% | |
$1 billion and more up to $3 billion | 0.10% | |
$3 billion and more up to $8 billion | 0.05% | |
$8 billion and more up to $10 billion | 0.04% | |
$10 billion and more up to $12 billion | 0.02% | |
$12 billion or more | 0.01% | |
| * | The assets of each of the Investor Destinations Funds are excluded from the Trust asset level amount in order to calculate this asset-based fee. The Investor Destinations Funds do not pay any part of this fee. |
15
Table of Contents
GARTMORE VARIABLE INSURANCE TRUST
NOTES TO FINANCIAL STATEMENTS (Unaudited) (Continued)
June 30, 2005
GSA and GISI have entered into agreements with BISYS Fund Services Ohio, Inc. (“BISYS”), pursuant to which BISYS provides sub-administration and sub-transfer agency services, respectively, to the Fund.
Under the terms of an Administrative Services Plan, the Fund may pay fees to servicing organizations, such as broker-dealers, including Nationwide Financial Services, and financial institutions, which agree to provide administrative support services to the shareholders of certain classes. These services include, but are not limited, to the following: establishing and maintaining shareholder accounts; processing purchase and redemption transactions; arranging bank wires; performing shareholder sub-accounting; answering inquires regarding the Fund; and other such services. These fees are based on an annual rate of up to 0.25% of the average daily net assets of Class I shares of the Fund and 0.20% on Class IV shares of the Fund.
4. Investment Transactions
For the six months ended June 30, 2005, (excluding short-term securities) the Fund had purchases of $319,391,498 and sales of $336,981,977.
5. Bank Loans
The Trust has a credit agreement of $100,000,000. Borrowings under this arrangement bear interest at the Federal Funds rate plus 0.50%. The interest costs are included in custodian fees in the Statement of Operations. No compensation balances were required under the terms of the line of credit. There were no borrowings outstanding as of June 30, 2005.
6. Shareholder Meeting
A separate shareholders meeting was held on Tuesday, December 23, 2004, for the shareholders of the Trust’s predecessor pursuant to a Proxy Statement On Schedule 14A, dated October 29, 2004, and mailed to the shareholders of the Trust’s predecessor on or around November 5, 2004.
Two Proposals: The purpose of the December 23, 2004 meeting was to allow the shareholders of the Trust’s predecessor to vote on:
| i. | Proposal One: The election of the Trust’s Board of Trustees; and |
| ii. | Proposal Two: The approval of an “Agreement and Plan of Reorganization” that provided for the reorganization of the Trust from a Massachusetts business trust into a Delaware statutory trust. |
Proposal One: As set forth in the October 29, 2004 Proxy Statement, the nominees for election as Trustees of the Trust’s predecessor were: Charles E. Allen, Michael J. Baresich, Paula H.J. Cholmondeley, C. Brent DeVore, Phyllis Kay Dryden, Robert M. Duncan, Barbara L. Hennigar, Paul J. Hondros, Barbara I Jacobs, Thomas J. Kerr IV, Douglas F. Kridler, Michael D. McCarthy, Arden L. Shisler, and David C. Wetmore.
Proposal Two: As specifically set forth in the October 29, 2004 Proxy Statement, the Reorganization proposal requested the shareholders of the Trust’s predecessor to approve the proposed “Agreement and Plan of Reorganization” of the Trust’s predecessor (on behalf of each of the its funds) into a new Delaware-domiciled Trust, whereby the Funds of the new Delaware Trust would acquire all of the assets of the corresponding funds of the Trust’s predecessor subject to the liabilities, expenses, costs, charges, and reserves of the corresponding funds of the Trust’s predecessor (contingent or otherwise), in exchange for shares of the acquiring Funds to be distributed pro rata by the Trust to the holders of the shares of the funds of the Trust’s predecessor, in a complete liquidation of the Trust’s predecessor.
16
Table of Contents
GARTMORE VARIABLE INSURANCE TRUST
NOTES TO FINANCIAL STATEMENTS (Unaudited) (Continued)
June 30, 2005
| Voting | Results: |
The shareholders of the Trust’s predecessor voted to approve both Proposal One and Proposal Two, as follows:
Proposal 1: Election of a Board of Trustees of Gartmore Variable Insurance Trust
Charles E. Allen: | ||
FOR | 2,797,230,318.955 shares (96.078%) | |
WITHHOLD | 114,195,693.660 shares (3.922%) | |
TOTAL | 2,912,726,012.615 shares (100.000%) | |
Michael J. Baresich: | ||
FOR | 2,796,135,979.559 shares (96.040%) | |
WITHHOLD | 115,290,033.056 shares (3.960%) | |
TOTAL | 2,912,726,012.615 shares (100.000%) | |
Paula H.J. Cholmondeley: | ||
FOR | 2,795,095,945.396 shares (96.004%) | |
WITHHOLD | 116,330,067.219 shares (3.996%) | |
TOTAL | 2,912,726,012.615 shares (100.000%) | |
C. Brent DeVore: | ||
FOR | 2,797,207,046.916 shares (96.077%) | |
WITHHOLD | 114,218,965.699 shares (3.923%) | |
TOTAL | 2,912,726,012.615 shares (100.000%) | |
Phyllis Kay Dryden: | ||
FOR | 2,795,587,023.994 shares (96.021%) | |
WITHHOLD | 115,838,988.621 shares (3.979%) | |
TOTAL | 2,912,726,012.615 shares (100.000%) | |
Robert M. Duncan: | ||
FOR | 2,790,191,720.503 shares (95.836%) | |
WITHHOLD | 121,234,292.112 shares (4.164%) | |
TOTAL | 2,912,726,012.615 shares (100.000%) | |
Barbara L. Hennigar: | ||
FOR | 2,792,939,848.858 shares (95.937%) | |
WITHHOLD | 118,486,163.757 shares (4.070%) | |
TOTAL | 2,912,726,012.615 shares (100.000%) | |
Paul J. Hondros: | ||
FOR | 2,797,557,404.448 shares (96.089%) | |
WITHHOLD | 113,868,608.167 shares (3.911%) | |
TOTAL | 2,912,726,012.615 shares (100.000%) | |
17
Table of Contents
GARTMORE VARIABLE INSURANCE TRUST
NOTES TO FINANCIAL STATEMENTS (Unaudited) (Continued)
June 30, 2005
Barbara I. Jacobs: | ||
FOR | 2,796,306,126.654 shares (96.046%) | |
WITHHOLD | 115,119,885.961 shares (3.954%) | |
TOTAL | 2,912,726,012.615 shares (100.000%) | |
Thomas J. Kerr IV: | ||
FOR | 2,789,755,720.087 shares (95.821%) | |
WITHHOLD | 121,670,292.528 shares (4.179%) | |
TOTAL | 2,912,726,012.615 shares (100.000%) | |
Douglas F. Kridler: | ||
FOR | 2,798,065,774.375 shares (96.106%) | |
WITHHOLD | 113,360,238.240 shares (3.894%) | |
TOTAL | 2,912,726,012.615 shares (100.000%) | |
Michael D. McCarthy: | ||
FOR | 2,797,452,613.694 shares (96.085%) | |
WITHHOLD | 113,973,395.921 shares (3.915%) | |
TOTAL | 2,912,726,012.615 shares (100.000%) | |
Arden L. Shisler: | ||
FOR | 2,796,738,454.730 shares (96.061%) | |
WITHHOLD | 114,687,557.885 shares (3.939%) | |
TOTAL | 2,912,726,012.615 shares (100.000%) | |
David C. Wetmore: | ||
FOR | 2,794,784,752.247 shares (95.994%) | |
WITHHOLD | 116,641,260.368 shares (4.006%) | |
TOTAL | 2,912,726,012.615 shares (100.000%) | |
Proposal 2: Approval of the Agreement and Plan of Reorganization of Gartmore Variable Insurance Trust
FOR | 2,561,003,822.546 shares (87.964%) | |
AGAINST | 103,593,261.010 shares (3.558%) | |
ABSTAIN | 246,828,929.059 shares (8.478%) | |
TOTAL | 2,912,726,012.615 shares (100.000%) | |
18
Table of Contents
GARTMORE VARIABLE INSURANCE TRUST
Management Information (Unaudited)
June 30, 2005
Trustees who are not Interested Persons (as defined in the 1940 Act) and Officers of the Funds June 30, 2005
| Name, Address and Date of Birth | Position(s) Held with the Trust and Length of Time Served1 | Principal Occupation(s) During Past 5 Years | Number of Portfolios in the Gartmore Fund Complex Overseen by Trustee | Other Directorships Held by Trustee or Nominee2 | ||||
Charles E. Allen
c/o Gartmore Global Investments, Inc. 1200 River Road, Suite 1000 Conshohocken, PA 19428
1948 | Trustee since July 2000 | Mr. Allen is Chairman, Chief Executive Officer and President of the Graimark Realty Advisors, Inc. (real estate development, investment and asset management). | 84 | None | ||||
Paula H.J. Cholmondeley
c/o Gartmore Global Investments, Inc. 1200 River Road, Suite 1000 Conshohocken, PA 19428
1940 | Trustee since July 2000 | Ms. Cholmondeley has been the Chairman and Chief Executive Officer of the Sorrel Group, a management consulting company, since January 2004. From March 2000 through December 2003, Ms. Cholmondeley was Vice President and General Manager of Sappi Fine Paper North America. Prior thereto, Ms. Cholmondeley was Vice President and General Manager of Residential Insulation of Owens Corning. | 84 | Director of Dentsply International, Inc., Ultralife Batteries, Inc., Terex Corporation, Minerals Technology, Inc. and Albany International Corp. | ||||
C. Brent DeVore
c/o Gartmore Global Investments, Inc. 1200 River Road, Suite 1000 Conshohocken, PA 19428
1940 | Trustee since 1990 | Dr. DeVore is President of Otterbein College. | 84 | None | ||||
Phyllis K. Dryden
c/o Gartmore Global Investments, Inc. 1200 River Road, Suite 1000 Conshohocken, PA 19428
1947 | Trustee since December 2004 | Ms. Dryden was a former Managing Partner of marchFIRST, a global management consulting firm prior to 2002. | 84 | None |
19
Table of Contents
GARTMORE VARIABLE INSURANCE TRUST
Management Information (Unaudited)
June 30, 2005
| Name, Address and Date of Birth | Position(s) Held with the Trust and Length of Time Served1 | Principal Occupation(s) During Past 5 Years | Number of Portfolios in the Gartmore Fund Complex Overseen by Trustee | Other Directorships Held by Trustee or Nominee2 | ||||
Barbara L. Hennigar*
c/o Gartmore Global Investments, Inc. 1200 River Road, Suite 1000 Conshohocken, PA 19428
1935 | Trustee since July 2000 | Retired since June 2000. Prior thereto, Ms. Hennigar was the Chairman or President and Chief Executive Officer of OppenheimerFunds Services and a member of the Executive Committee of OppenheimerFunds. | 84 | None | ||||
Barbara I. Jacobs
c/o Gartmore Global Investments, Inc. 1200 River Road, Suite 1000 Conshohocken, PA 19428
1950 | Trustee since December 2004 | Ms. Jacobs has served as Chairman of the Board of Directors of KICAP Network Fund, a European (United Kingdom) hedge fund, since December 2000. Prior to 2004, Ms. Jacobs was also a Managing Director and European Portfolio Manager with CREF Investments (Teachers Insurance Annuity Association — College Retirement Equity Fund). | 84 | None | ||||
Douglas F. Kridler
c/o Gartmore Global Investments, Inc. 1200 River Road, Suite 1000 Conshohocken, PA 19428
1955 | Trustee since September 1997 | Mr. Kridler has served as the President and Chief Executive Officer of the Columbus Foundation (a Columbus, OH-based foundation which manages over 1,300 individual endowment funds) since February 2002. Mr. Kridler was the President of the Columbus Association for the Performing Arts prior thereto and Chairman of the Greater Columbus Convention and Visitors Bureau during 2000 and 2001. | 84 | None | ||||
Michael D. McCarthy
c/o Gartmore Global Investments, Inc. 1200 River Road, Suite 1000 Conshohocken, PA 19428
1947 | Trustee since December 2004 | Mr. McCarthy serves as: the Founder and Chairman of The Eureka Foundation (which sponsors and funds the “Great Museums” series on PBS); and a Partner of Pineville Properties LLC (a commercial real estate development firm). | 843 | None |
20
Table of Contents
GARTMORE VARIABLE INSURANCE TRUST
Management Information (Unaudited)
June 30, 2005
| Name, Address and Date of Birth | Position(s) Held with the Trust and Length of Time Served1 | Principal Occupation(s) During Past 5 Years | Number of Portfolios in the Gartmore Fund Complex Overseen by Trustee | Other Directorships Held by Trustee or Nominee2 | ||||
David C. Wetmore
c/o Gartmore Global Investments, Inc. 1200 River Road, Suite 1000 Conshohocken, PA 19428
1948 | Trustee since 1995 and Chairman since February 2005 | Retired. Mr. Wetmore was formerly a Managing Director of Updata Capital, an investment banking and venture capital firm. | 84 | None |
| * | Pursuant to the Trust’s mandatory retirement policy, Ms. Hennigar is expected to retire on or about January 12, 2006. |
| 1 | The term of office length is until a trustee resigns or reaches a mandatory retirement age of 70. On March 2, 2000, the Board adopted a five-year implementation period for any Trustee 65 or older as of the adoption of this policy. Pursuant to this policy, Messrs. Duncan and Kerr retired as trustees effective as of March 12, 2005. |
| 2 | Directorships held in (1) any other investment companies registered under the 1940 Act, (2) any company with a class of securities registered pursuant to Section 12 of the Securities Exchange Act of 1934, as amended (the “Exchange Act”), or (3) any company subject to the requirements of Section 15(d) of the Exchange Act. |
| 3 | Mr. McCarthy was also an Administrative Committee Member for the Alphagen Arneb Fund, LLC, The Healthcare Fund LDC, The Leaders Long-Short Fund, LLC, and The Leaders Long-Short Fund LDC, four private investment companies (hedge funds) managed by GSA. Mr. McCarthy resigned as an Administrative Committee Member effective June 30, 2005. |
Trustees and Officers who are not Interested Persons (as defined in the 1940 Act) of the Funds received aggregate compensation of $274,882 from the Trust for the Six Months Ended June 30, 2005. Additional information regarding the Trustees and Officers may be found in the Trust’s statement of additional information, which is available without charge upon request, by calling 1-800-848-0920.
21
Table of Contents
GARTMORE VARIABLE INSURANCE TRUST
Management Information (Unaudited)
June 30, 2005
Trustees who are Interested Persons (as defined in the 1940 Act) and/or Officers of the Funds June 30, 2005
| Name, Address and Age | Position(s) Held with the Trust and Length of Time Served1 | Principal Occupation(s) During Past 5 Years | Number of Portfolios in the Gartmore Fund Complex Overseen by Trustee | Other Directorships Held by Trustee2 | ||||
Paul J. Hondros
Gartmore Global Investments, Inc. 1200 River Road, Suite 1000 Conshohocken, PA 19428
1948 | Trustee since July 2000 | Mr. Hondros has been President and Chief Executive Officer of various Gartmore entities, including Gartmore Distribution Services, Inc. (“GDSI”),3 Gartmore Investor Services, Inc. (“GISI”),3 Gartmore Morley Capital Management, Inc. (“GMCM”),3 Gartmore Morley Financial Services, Inc. (“GMFS”),3 NorthPointe Capital, LLC (“NorthPointe”),3 Gartmore Global Asset Management Trust (“GGAMT”)3, Gartmore Global Investments, Inc. (“GGI”)3, Gartmore Mutual Fund Capital Trust (“GMFCT”)3 and Gartmore SA Capital Trust (“GSA”)3; and a Director of Nationwide Securities, Inc.3, as well as several entities within Nationwide Financial Services, Inc. | 844 | None | ||||
Arden L. Shisler
c/o Gartmore Global Investments, Inc. 1200 River Road, Suite 1000 Conshohocken, PA 19428
1941 | Trustee since February 2000 | Mr. Shisler has been a consultant since January 2003. Prior thereto, he was President and Chief Executive Officer of K&B Transport, Inc., a trucking firm. Since 1992, Mr. Shisler has also been Chairman of the Board for Nationwide Mutual Insurance Company3. | 84 | Director of Nationwide Financial Services, Inc. | ||||
Gerald J. Holland
Gartmore Global Investments, Inc. 1200 River Road, Suite 1000 Conshohocken, PA 19428
1951 | Treasurer since March 2001 | Mr. Holland is Senior Vice President — Operations for GGI3, GMFCT3 , and GSA3. Prior to July 2000, Mr. Holland was Vice President for First Data Investor Services, an investment company service provider. | 84 | None |
22
Table of Contents
GARTMORE VARIABLE INSURANCE TRUST
Management Information (Unaudited)
June 30, 2005
| Name, Address and Age | Position(s) Held with the Trust and Length of Time Served1 | Principal Occupation(s) During Past 5 Years | Number of Portfolios in the Gartmore Fund Complex Overseen by Trustee | Other Directorships Held by Trustee2 | ||||
Michael A. Krulikowski
Gartmore Global Investments, Inc. 1200 River Road, Suite 1000 Conshohocken, PA 19428
1959 | Chief Compliance Officer since June 2004 | Since November 1999, Mr. Krulikowski has served as a Vice President and Chief Compliance Officer of GGI. Prior thereto, Mr. Krulikowski served as Chief Compliance Officer of 1717 Capital Management Company/Provident Mutual Insurance Company. | 84 | None | ||||
Eric E. Miller
Gartmore Global Investments, Inc. 1200 River Road, Suite 1000 Conshohocken, PA 19428
1953 | Secretary since December 2002 | Mr. Miller is Senior Vice President, Chief Counsel for GGI3, GMFCT3 and GSA3 since August 2002. From August 2000 to August 2002, Mr. Miller was a Partner with Stradley Ronan Stevens & Young, LLP. Prior to August 2000, Mr. Miller served as Senior Vice President and Deputy General Counsel at Delaware Investments. | 84 | None |
| 1 | The term of office length is until a trustee resigns or reaches a mandatory retirement age of 70. On March 2, 2000, the Board adopted a five-year implementation period for any Trustee 65 or older as of the adoption of this policy. Pursuant to this policy, Messrs. Duncan and Kerr retired as trustees effective as of March 12, 2005. |
| 2 | Directorships held in (1) any other investment companies registered under the 1940 Act, (2) any company with a class of securities registered pursuant to Section 12 of the Securities Exchange Act of 1934, as amended (the “Exchange Act”), or (3) any company subject to the requirements of Section 15(d) of the Exchange Act. |
| 3 | This position is held with an affiliated person or principal underwriter of the Trust. |
| 4 | Mr. Hondros was also an Administrative Committee Member for the Alphagen Arneb Fund, LLC, The Healthcare Fund LDC, The Leaders Long-Short Fund, LLC, and The Leaders Long-Short Fund LDC, four private investment companies (hedge funds) managed by GSA. Mr. Hondros resigned as Administrative Committee Member effective June 30, 2005. |
Federal law requires the Trust, each of its investment advisers and sub-advisers to adopt procedures for voting proxies (“Proxy Voting Guidelines”) and to provide a summary of those Proxy Voting Guidelines used to vote the securities held by the Funds. The Funds’ proxy voting policies and procedures are available without charge (i) upon request, by calling 1-800-848-0920, (ii) on the Fund’s website at www.gartmorefunds.com, or (iii) on the Securities and Exchange Commission’s website at www.sec.gov.
23
Table of Contents
Gartmore GVIT Government Bond Fund
Semiannual Report
| | June 30, 2005 |
| Contents | ||
| 5 | Statement of Investments | |
| 8 | Statement of Assets and Liabilities | |
| 8 | Statement of Operations | |
| 9 | Statements of Changes in Net Assets | |
| 11 | Financial Highlights | |
| 12 | Notes to Financial Statements | |
Commentary provided by Gartmore Global Investments, investment adviser to Gartmore Variable Insurance Trust. All opinions and estimates included in this report constitute Gartmore Global Investments’ judgment as of the date of this report and are subject to change without notice.
Statement Regarding Availability of Quarterly Portfolio Schedule.
The Gartmore Variable Insurance Trust files complete schedules of portfolio holdings for each Fund with the Securities and Exchange Commission (the “Commission”) for the first and third quarters of each fiscal year on Form N-Q. The Funds’ Forms N-Q are available on the Commission’s website at http://www.sec.gov. The Funds’ Forms N-Q may be reviewed and copied at the Commission’s Public Reference Room in Washington, DC, and information on the operation of the Public Reference Room may be obtained by calling 800-SEC-0330; and the Funds make the information on Form N-Q available to shareholders upon request without charge.
Statement Regarding Availability of Proxy Voting Record.
Information regarding how the Fund voted proxies relating to portfolio securities held during the most recent 12-month period ended June 30, 2005 is available without charge, upon request, by calling 800-848-0920, and on the Commission’s website at http://www.sec.gov.
Table of Contents
Gartmore GVIT Government Bond Fund
For the semiannual period ended June 30, 2005, the Gartmore GVIT Government Bond Fund returned 3.39% (Class I at NAV) versus 2.99% for its benchmark, the Merrill Lynch Government Master Index. For broader comparison, the average return for the Fund’s Lipper peer category of General U.S. Government Funds was 2.95%.
Given the fact that the Federal Reserve was increasing the Federal Funds Rate during the period, the Fund performed well during the period, emphasizing spread product- any security with additional yield over treasuries. Mortgage backed securities (MBS) performed the best, followed by Agency notes and Treasuries.
The main component of Fund returns versus the benchmark was the positioning of the Fund in cash and bonds with a duration of 10 years and longer versus the more laddered composition of the benchmark index. During the reporting period two-year treasury notes’ yields increased 0.56% while 30-year Treasury yields fell 0.63%.
The main detractor from better performance was the Fund’s short duration versus that of the Index but this decision was based on wanting to keep some positions in the intermediate part of the yield curve as a safeguard in the event that our view on interest rates proved incorrect.
The Fund strategy remains the same and the next planned major positioning theme is to move into a more laddered position. We have exited some positions in MBS in anticipation of increasing prepayments, and we have increased the weighting in government-guaranteed products such as HUD and AID bonds. Our expectation for interest rates remains a range bound to lower long rates while two-year and shorter notes continue to underperform as the Fed continues to increase short-term interest rates.
PORTFOLIO MANAGER: Gary Hunt, CFA
Investing in mutual funds involves risk, including possible loss of principal.
There is no assurance that the investment objective of any fund will be achieved.
Merrill Lynch Government Master Index: An unmanaged index that gives a broad look at how U.S. government bonds have performed.
While the Fund invests primarily in securities of the U.S. government and its agencies, the Fund’s value is not guaranteed by these entities.
Lipper Analytical Services, Inc. is an industry research firm whose rankings are based on total return performance and do not reflect the effects of sales charges.
The Gartmore Variable Insurance Trust Funds are available only as sub-account investment options in certain variable insurance products. Accordingly, investors are unable to invest in shares of these funds outside of an insurance product. Performance information found herein reflects only the performance of these funds, and does not indicate the performance your sub-account may experience under your variable insurance contract. Performance returns assume reinvestment of all distributions. The investment return and principal value of an investment will fluctuate so that an investor’s shares, when redeemed, may be worth more or less than their original cost. Index performance is provided for comparison purposes only; the indexes shown are unmanaged and do not reflect any fees or expenses. Investors cannot invest directly in market indexes. To obtain performance information about the sub-account option under your insurance contract that invests in one of these funds, please contact your variable insurance carrier. PAST PERFORMANCE IS NO GUARANTEE OF FUTURE RESULTS.
Commentary provided by Gartmore Global Investments. All opinions and estimates included in this report constitute Gartmore Global Investments’ judgment as of the date of this report and are subject to change without notice.
Investors should carefully consider a fund’s investment objectives, risks, fees, charges and expenses before investing any money. To obtain this and other information on Gartmore Variable Insurance Trust, please contact your variable insurance contract provider or call 800-848-0920. Please read the Trust’s prospectus carefully before investing any money.
Gartmore Funds distributed by Gartmore Distribution Services, Inc., Member NASD. 1200 River Road, Suite 1000, Conshohocken, PA 19428.
1
Table of Contents
Fund Performance | Gartmore GVIT Government Bond Fund |
| Average | Annual Total Return1 |
(For Periods Ended June 30, 2005)
| Six months* | One year | Five years | Ten years | |||||
| Class I2 | 3.39% | 6.85% | 7.00% | 6.45% | ||||
| Class II3 | 3.27% | 6.61% | 6.73% | 6.18% | ||||
| Class III3 | 3.31% | 6.77% | 7.00% | 6.46% | ||||
| Class IV3 | 3.39% | 6.85% | 7.00% | 6.46% |
| * | Not Annualized. |
| 1 | Not subject to any sales charges. |
| 2 | The existing shares of the Fund were designated Class I shares as of May 1, 2001. |
| 3 | These returns until the creation of Class II shares, (July 8, 2002), Class III shares (May 20, 2002) and Class IV shares (April 28, 2003) are based on the performance of the Class I shares of the Fund. Excluding the effect of fee waivers or reimbursements, such prior performance is similar to what Class II, Class III and Class IV shares would have produced because all classes of shares invest in the same portfolio of securities. Class II shares’ annual returns have been restated to reflect the additional fees applicable to Class II shares and therefore are lower than those of Class I. For Class III shares, these returns do not reflect the short-term trading fees applicable to such shares; if these fees were reflected, the annual returns for Class III shares would have been lower. |
| Performance | of a $10,000 Investment |
Investment return and principal value will fluctuate, and when redeemed, shares may be worth more or less than original cost. Past performance is no guarantee of future results and does not reflect the deduction of taxes that a shareholder would pay on fund distributions or the redemption of fund shares. Investing in mutual funds involves market risk, including loss of principal. Performance returns assume the reinvestment of all distributions.
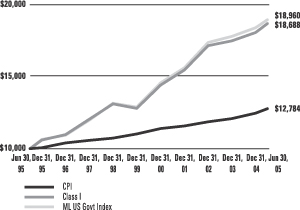
Comparative performance of $10,000 invested in Class I shares of the Gartmore GVIT Government Bond Fund, Merrill Lynch US Government Master Index (ML US Govt)(a), and Consumer Price Index (CPI)(b) over as 10-year period ended 06/30/05. Unlike, the Fund, the returns for these unmanaged indexes do not reflect any fees, expenses, or sales charges. Investors cannot invest directly in market indexes.
| (a) | ML US Govt is an unmanaged index that gives a broad look at how U.S. government bonds have performed. |
| (b) | The CPI represents changes in prices of a basket of goods and services purchased for consumption by urban households. |
2
Table of Contents
Shareholder
Expense Example | Gartmore GVIT Government Bond Fund |
As a shareholder of the Fund, you incur two types of costs: (1) transaction costs, including sales charges (loads) paid on purchase payments and redemption fees; and (2) ongoing costs, including investment advisory fees, administration fees, distribution fees and other Fund expenses. The examples below are intended to help you understand your ongoing costs (in dollars) of investing in the Fund and to compare these costs with the ongoing costs of investing in other mutual funds. Per SEC requirements, the examples assume that you had a $1,000 investment in the Class at the beginning of the reporting period, January 1, 2005, and continued to hold your shares at the end of the reporting period, June 30, 2005.
Actual Expenses
For each Class of the Fund in the table below, the first line provides information about actual account values and actual expenses. You may use the information in this line, together with the amount you invested, to estimate the expenses that you paid over the period. Simply divide your account value by $1,000 (for example, an $8,600 account value divided by $1,000 = 8.6), then multiply the result by the number in the first line of each Class under the heading entitled “Expenses Paid During Period” to estimate the expenses you paid on your account during the period.
Hypothetical Example for Comparison Purposes
The second line of each Class in the table below provides information about hypothetical account values and hypothetical expenses based on the Class’ actual expense ratio and an assumed rate of return of 5% per year before expenses, which is not the Class’ actual return. The hypothetical account values and expenses may not be used to estimate the actual ending account balance or expenses you paid for the period. You may use this information to compare the ongoing costs of investing in the Class of the Fund and other funds. To do so, compare this 5% hypothetical example with the 5% hypothetical examples that appear in the shareholder reports of the other funds.
Please note that the expenses shown in the table are meant to highlight your ongoing costs only and do not reflect any transaction costs, such as sales charges (loads) or redemption fees. Therefore, the second line for each Class in the table is useful in comparing ongoing costs only, and will not help you determine the relative total costs of owning different funds. In addition, if these transaction costs were included, your costs would have been higher. The examples also assume all dividends and distributions have been reinvested.
| Beginning Account Value, January 1, 2005 | Ending Account Value, June 30, 2005 | Expenses Paid During Period* | Annualized Expense Ratio* | ||||||||||
| Government Bond Fund | |||||||||||||
Class I | Actual | $ | 1,000 | $ | 1,034 | $ | 3.63 | 0.72% | |||||
| Hypothetical1 | $ | 1,000 | $ | 1,021 | $ | 3.62 | 0.72% | ||||||
Class II | Actual | $ | 1,000 | $ | 1,033 | $ | 4.94 | 0.98% | |||||
| Hypothetical1 | $ | 1,000 | $ | 1,020 | $ | 4.92 | 0.98% | ||||||
Class III | Actual | $ | 1,000 | $ | 1,033 | $ | 3.68 | 0.73% | |||||
| Hypothetical1 | $ | 1,000 | $ | 1,021 | $ | 3.67 | 0.73% | ||||||
Class IV | Actual | $ | 1,000 | $ | 1,034 | $ | 3.63 | 0.72% | |||||
| Hypothetical1 | $ | 1,000 | $ | 1,021 | $ | 3.62 | 0.72% | ||||||
| * | Expenses are equal to the Fund’s annualized expense ratio multiplied by the average account value over the period multiplied by 181/365 (to reflect the one-half year period). The expense ratio presented represents a six month, annualized ratio in accordance with SEC guidelines. |
| 1 | Represents the hypothetical 5% return before expenses. |
3
Table of Contents
Portfolio Summary
(June 30, 2005) | Gartmore GVIT Government Bond Fund |
The SEC adopted a requirement that Funds present their portfolio holdings in a table, chart or graph format in their annual and semiannual reports to shareholders, whether or not a statement of investments is utilized. The following tables, which present portfolio holdings as a percentage of net assets, are provided in compliance with this requirement.
| Asset Allocation | ||
| U.S. Government Sponsored and Agency Obligations | 57.4% | |
| U.S. Treasury Obligations | 20.5% | |
| Mortgage-Backed Securities | 15.6% | |
| Cash Equivalents | 5.5% | |
| Other Investments* | 2.5% | |
| Liabilities in excess of other assets** | -1.5% | |
| 100.0% | ||
| Top Holdings*** | ||
| U.S. Treasury Bonds, 6.25%, 08/15/23 | 7.3% | |
| Federal National Mortgage Association, 5.50%, 07/18/12 | 5.5% | |
| U.S. Treasury Bonds, 8.13%, 08/15/21 | 4.5% | |
| U.S. Treasury Bonds, 8.75%, 08/15/20 | 4.0% | |
| AID — Israel, 5.50%, 12/04/23 | 3.6% | |
| Federal Home Loan Mortgage Corporation, 4.65%, 10/10/13 | 2.8% | |
| Federal Home Loan Mortgage Corporation, 2.60%, 05/10/06 | 2.6% | |
| Federal National Mortgage Association, 3.55%, 01/12/07 | 2.5% | |
| Federal National Mortgage Association, 2.75%, 08/17/07 | 2.4% | |
| Federal National Mortgage Association, 6.00%, 12/25/33 | 2.3% | |
| Other Holdings | 62.5% | |
| 100.0% | ||
| Top Industries | ||
| Federal National Mortgage Association | 32.3% | |
| Federal Home Loan Mortgage Corporation | 24.6% | |
| U.S. Treasury Bonds | 18.8% | |
| Agency For International Development | 8.8% | |
| Federal Home Loan Bank | 3.2% | |
| Tennessee Valley Authority | 1.7% | |
| U.S. Treasury Inflation Protected Bonds | 1.7% | |
| Veterans Administration | 1.1% | |
| Housing and Urban Development | 0.8% | |
| Government-Backed Trust | 0.3% | |
| Other Industries | 6.7% | |
| 100.0% | ||
| * | Includes value of collateral received from securities lending. |
| ** | Includes value of collateral owed from securities lending. |
| *** | For purpose of listing top holdings, repurchase agreements are considered cash equivalents and are included as part of Other Holdings. |
4
Table of Contents
GARTMORE VARIABLE INSURANCE TRUST
GARTMORE GVIT GOVERNMENT BOND FUND
Statement of Investments — June 30, 2005 (Unaudited)
| Shares or Principal Amount | Value | |||||
| U.S. GOVERNMENT SPONSORED & AGENCY OBLIGATIONS (57.4%) | ||||||
| Agency For International Development (8.8%) | ||||||
| AID — Israel, 5.50%, 12/04/23 | $ | 40,000,000 | $ | 44,814,080 | ||
| AID — Israel, 5.50%, 04/26/24 | 20,000,000 | 22,412,280 | ||||
| AID — Israel, 5.50%, 09/18/33 | 20,000,000 | 22,933,860 | ||||
| Fond’s D’Equipment Communication, 7.29%, 05/01/23 | 8,100,000 | 9,352,746 | ||||
| Government Backed Trust T-1, 0.00%, 05/15/07 | 10,000,000 | 9,314,580 | ||||
| 108,827,546 | ||||||
| Federal Home Loan Bank (3.2%) | ||||||
| 5.80%, 08/12/05 | 6,395,000 | 6,412,011 | ||||
| 4.57%, 10/17/08 | 25,000,000 | 25,073,824 | ||||
| 5.91%, 04/07/09 | 6,860,000 | 7,337,772 | ||||
| 38,823,607 | ||||||
| Federal Home Loan Mortgage Corporation (17.7%) | ||||||
| 6.80%, 08/22/05 | 5,000,000 | 5,023,530 | ||||
| 6.79%, 08/26/05 | 5,000,000 | 5,025,310 | ||||
| 2.25%, 12/15/05 | 16,120,000 | 15,998,987 | ||||
| 2.60%, 05/10/06 | 32,960,000 | 32,635,641 | ||||
| 2.76%, 05/19/06 | 28,140,000 | 27,893,212 | ||||
| 6.75%, 05/30/06 | 4,400,000 | 4,516,926 | ||||
| 2.15%, 06/02/06 | 20,000,000 | 19,711,120 | ||||
| 6.70%, 01/09/07 | 5,000,000 | 5,212,730 | ||||
| 5.50%, 04/01/07 | 1,115,497 | 1,132,499 | ||||
| 4.26%, 07/19/07 | 20,000,000 | 20,136,200 | ||||
| 4.65%, 10/10/13 | 35,000,000 | 34,854,364 | ||||
| 4.80%, 12/18/13 | 8,350,000 | 8,421,150 | ||||
| 5.20%, 03/05/19 | 15,000,000 | 15,228,780 | ||||
| 5.50%, 08/20/19 | 20,000,000 | 20,307,560 | ||||
| 6.50%, 03/15/31 | 2,314,650 | 2,377,510 | ||||
| 218,475,519 | ||||||
| Federal National Mortgage Association (24.9%) | ||||||
| 6.63%, 03/21/06 | 5,000,000 | 5,101,705 | ||||
| 3.15%, 06/30/06 | 21,028,000 | 20,869,133 | ||||
| 3.25%, 12/01/06 | 18,465,000 | 18,274,367 | ||||
| 3.55%, 01/12/07 | 30,970,000 | 30,851,045 | ||||
| 3.25%, 03/29/07 | 17,975,000 | 17,803,896 | ||||
| 0.00%, 05/15/07 | 10,651,000 | 9,907,390 | ||||
| 2.75%, 08/17/07 | 30,000,000 | 29,975,670 | ||||
| Shares or Principal Amount | Value | |||||
| U.S. GOVERNMENT SPONSORED & AGENCY OBLIGATIONS (continued) | ||||||
| Federal National Mortgage Association (continued) | ||||||
| 4.50%, 04/01/10 | $ | 16,942,383 | $ | 16,973,030 | ||
| 5.38%, 11/15/11 | 40,000 | 42,867 | ||||
| 5.50%, 07/18/12 | 67,736,000 | 67,802,789 | ||||
| 6.68%, 05/01/16 | 4,125,005 | 4,484,632 | ||||
| 5.26%, 12/29/17 | 15,000,000 | 15,379,890 | ||||
| 9.25%, 10/25/18 | 111,382 | 121,484 | ||||
| 3.50%, 11/25/32 | 4,628,060 | 4,499,950 | ||||
| 6.00%, 12/25/33 | 27,484,965 | 28,499,132 | ||||
| 4.75%, 04/01/35 | 19,936,441 | 20,070,078 | ||||
| 6.30%, 10/17/38 | 15,044,521 | 16,148,037 | ||||
| 306,805,095 | ||||||
| Government-Backed Trust (0.3%) | ||||||
| Government Loan Trust, 0.00%, 04/01/15 | 6,072,000 | 3,976,067 | ||||
| Housing & Urban Development (0.8%) | ||||||
| 7.08%, 08/01/16 | 9,000,000 | 9,648,333 | ||||
| Tennessee Valley Authority (1.7%) | ||||||
| 7.13%, 05/01/30 | 15,000,000 | 20,572,020 | ||||
| Total U.S. Government Sponsored & Agency Obligations | 707,128,187 | |||||
| U.S. TREASURY OBLIGATIONS (20.5%) | ||||||
| U.S. Treasury Bonds (18.8%) | ||||||
| 8.75%, 05/15/20 | 17,000,000 | 25,493,353 | ||||
| 8.75%, 08/15/20 | 33,000,000 | 49,654,704 | ||||
| 8.13%, 08/15/21 | 38,000,000 | 55,165,322 | ||||
| 6.25%, 08/15/23 | 72,000,000 | 89,727,192 | ||||
| 6.00%, 02/15/26 | 10,000,000 | 12,321,090 | ||||
| 232,361,661 | ||||||
| U.S. Treasury Inflation Protected Bonds (1.7%) | ||||||
| 2.38%, 01/15/25 | 14,000,000 | 15,821,298 | ||||
| 3.88%, 04/15/29 | 2,830,000 | 4,708,339 | ||||
| 20,529,637 | ||||||
| Total U.S. Treasury Obligations | 252,891,298 | |||||
| MORTGAGE-BACKED SECURITIES (15.6%) | ||||||
| Federal Home Loan Mortgage Corporation (6.9%) | ||||||
| Gold Pool #C01184, 6.50%, 06/01/31 | 14,797 | 15,350 | ||||
| Gold Pool #C60657, 6.50%, 11/01/31 | 71,840 | 74,526 | ||||
5
Table of Contents
GARTMORE VARIABLE INSURANCE TRUST
GARTMORE GVIT GOVERNMENT BOND FUND
Statement of Investments — June 30, 2005 (Unaudited) (continued)
| Shares or Principal Amount | Value | |||||
| MORTGAGE-BACKED SECURITIES (continued) | ||||||
| Federal Home Loan Mortgage Corporation (continued) | ||||||
| Gold Pool #D94600, 7.50%, 03/01/21 | $ | 133,133 | $ | 142,628 | ||
| Pool #170217, 8.00%, 03/01/17 | 2,363 | 2,538 | ||||
| Pool #309774, 8.00%, 11/01/08 | 17,605 | 18,149 | ||||
| Pool #C01172, 6.50%, 05/01/31 | 67,140 | 69,650 | ||||
| Series 1136-H, 6.00%, 09/15/21 | 700,537 | 699,622 | ||||
| Series 1711-PD, 6.75%, 06/15/23 | 269,530 | 269,660 | ||||
| Series 2353-PC, 6.50%, 09/15/15 | 1,586,624 | 1,592,341 | ||||
| Series 2498, 5.50%, 08/15/13 | 7,209,381 | 7,353,328 | ||||
| Series 2498, 5.50%, 01/15/20 | 8,000,000 | 8,212,959 | ||||
| Series 2509, 5.50%, 10/15/17 | 18,750,000 | 19,486,677 | ||||
| Series 2517, 5.50%, 10/15/17 | 15,000,000 | 15,586,221 | ||||
| Series 2580-VA, 5.50%, 09/15/10 | 5,300,413 | 5,427,285 | ||||
| Series 2781, 4.50%, 12/15/24 | 18,605,000 | 18,001,093 | ||||
| Series 2827-AU, 5.00%, 07/15/24 | 7,500,000 | 7,594,202 | ||||
| 84,546,229 | ||||||
| Federal National Mortgage Association (7.4%) | ||||||
| Pool #250559, 7.50%, 03/01/26 | 37,680 | 40,638 | ||||
| Pool #251532, 10.50%, 11/01/17 | 38,592 | 40,817 | ||||
| Pool #252228, 7.00%, 12/01/28 | 23,871 | 25,259 | ||||
| Pool #252396, 7.00%, 09/01/28 | 157,429 | 166,575 | ||||
| Pool #252471, 8.50%, 04/01/28 | 153,075 | 167,028 | ||||
| Pool #254468, 5.00%, 09/01/09 | 2,345,545 | 2,370,101 | ||||
| Pool #323286, 7.13%, 09/01/07 | 5,195,656 | 5,339,272 | ||||
| Shares or Principal Amount | Value | |||||
| MORTGAGE-BACKED SECURITIES (continued) | ||||||
| Federal National Mortgage Association (continued) | ||||||
| Pool #380276, 6.36%, 04/01/08 | $ | 4,703,052 | $ | 4,903,190 | ||
| Pool #380348, 6.28%, 05/01/08 | 13,569,476 | 14,142,733 | ||||
| Pool #381089, 5.70%, 01/01/09 | 4,601,208 | 4,769,722 | ||||
| Pool #382344, 7.41%, 04/01/10 | 14,336,442 | 15,934,776 | ||||
| Pool #383661, 6.62%, 06/01/16 | 10,978,651 | 12,701,539 | ||||
| Pool #4486, 6.00%, 09/01/17 | 303,792 | 314,211 | ||||
| Pool #50544, 8.00%, 03/01/22 | 39,266 | 42,371 | ||||
| Pool #535159, 7.00%, 02/01/30 | 73,046 | 77,093 | ||||
| Pool #535723, 7.00%, 02/01/31 | 71,343 | 75,256 | ||||
| Pool #538673, 8.00%, 06/01/23 | 57,785 | 62,323 | ||||
| Pool #555456, 5.50%, 04/01/18 | 132,952 | 136,573 | ||||
| Pool #591224, 7.00%, 08/01/31 | 156,149 | 164,705 | ||||
| Pool #633937, 6.50%, 03/01/32 | 123,551 | 128,079 | ||||
| Pool #649431, 6.50%, 07/01/32 | 116,868 | 121,150 | ||||
| Pool #650872, 7.00%, 07/01/32 | 149,437 | 157,633 | ||||
| Pool #672366, 5.50%, 12/01/17 | 2,174,579 | 2,233,808 | ||||
| Pool #688602, 6.50%, 03/01/33 | 165,899 | 171,797 | ||||
| Pool #703444, 5.00%, 05/01/18 | 129,610 | 131,164 | ||||
| Pool #M80696, 6.00%, 08/01/08 | 582,980 | 592,186 | ||||
| Series 1991-73A, 8.00%, 07/25/21 | 111,220 | 119,531 | ||||
| Series 1993-114, 6.50%, 07/25/08 | 2,684,003 | 2,749,835 | ||||
| Series 1993-149M, 7.00%, 08/25/23 | 7,596,144 | 8,034,575 | ||||
| Series 1993-188PH, 6.25%, 03/25/13 | 266,395 | 266,669 | ||||
6
Table of Contents
GARTMORE VARIABLE INSURANCE TRUST
GARTMORE GVIT GOVERNMENT BOND FUND
Statement of Investments — June 30, 2005 (Unaudited) (continued)
| Shares or Principal Amount | Value | |||||
| MORTGAGE-BACKED SECURITIES (continued) | ||||||
| Federal National Mortgage Association (continued) | ||||||
| Series 1994-33H, 6.00%, 03/25/09 | $ | 1,792,189 | $ | 1,834,769 | ||
| Series 1994-76H, 5.00%, 02/25/24 | 3,835,036 | 3,855,355 | ||||
| Series 1998-M2C, 6.43%, 02/17/30 | �� | 2,124,942 | 2,204,520 | |||
| Series 2001-T11B, 5.50%, 09/25/11 | 6,215,000 | 6,637,844 | ||||
| 90,713,097 | ||||||
| Government National Mortgage Association (0.2%) | ||||||
| Pool #348813, 7.50%, 06/15/23 | 124,217 | 133,956 | ||||
| Pool #366564, 7.50%, 09/15/23 | 106,119 | 114,439 | ||||
| Pool #387078, 7.00%, 04/15/09 | 57,738 | 59,882 | ||||
| Pool #536369, 7.50%, 11/15/30 | 10,843 | 11,623 | ||||
| Pool #541200, 7.00%, 07/15/31 | 72,278 | 76,558 | ||||
| Pool #551733, 7.00%, 03/15/32 | 99,260 | 105,133 | ||||
| Pool #552525, 7.00%, 04/15/32 | 177,430 | 187,928 | ||||
| Pool #781525, 6.50%, 11/15/32 | 1,185,191 | 1,239,314 | ||||
| Pool #781572, 6.00%, 01/15/33 | 112,848 | 116,530 | ||||
| Pool #781613, 7.00%, 02/15/33 | 200,658 | 212,543 | ||||
| 2,257,906 | ||||||
| Veterans Administration (1.1%) | ||||||
| Vendee Mortgage Trust, Series 1996-2, 6.75%, 06/15/26 | 13,378,810 | 14,132,056 | ||||
| Total Mortgage-Backed Securities | 191,649,288 | |||||
| Shares or Principal Amount | Value | ||||||
| CASH EQUIVALENTS (5.5%) | |||||||
| Investments in repurchase agreements (collateralized by AA Corporate Bonds in a joint trading account at 3.49%, dated 06/30/05, due 07/01/05, repurchase price $67,914,415) | $ | 67,907,824 | $ | 67,907,824 | |||
| Total Cash Equivalents | 67,907,824 | ||||||
| SHORT-TERM SECURITIES HELD AS COLLATERAL FOR SECURITIES LENDING (2.5%) | |||||||
| Pool of short-term securities for Gartmore Variable Trust Funds — note 2 (Securities Lending) | 31,223,354 | 31,223,354 | |||||
| Total Short-Term Securities Held as Collateral for Securities Lending | 31,223,354 | ||||||
| Total Investments (Cost $1,224,401,122) (a) — 101.5% | 1,250,799,951 | ||||||
| Liabilities in excess of other assets — (1.5%) | (19,244,566 | ) | |||||
| NET ASSETS — 100.0% | $ | 1,231,555,385 | |||||
| (a) | See notes to financial statements for tax unrealized appreciation (depreciation) of securities. |
See notes to financial statements.
7
Table of Contents
GARTMORE VARIABLE INSURANCE TRUST
GARTMORE GVIT GOVERNMENT BOND FUND
Statement of Assets and Liabilities
June 30, 2005 (Unaudited)
Assets: | |||
Investments, at value (cost $1,156,493,298) | $ | 1,182,892,127 | |
Repurchase agreements, at cost and value | 67,907,824 | ||
Total Investments | 1,250,799,951 | ||
Interest and dividends receivable | 12,977,244 | ||
Receivable for capital shares issued | 362 | ||
Prepaid expenses and other assets | 16,629 | ||
Total Assets | 1,263,794,186 | ||
Liabilities: | |||
Payable to custodian | 331,191 | ||
Payable for return of collateral received for securities on loan | 31,223,354 | ||
Accrued expenses and other payables: | |||
Investment advisory fees | 481,207 | ||
Fund administration and transfer agent fees | 40,189 | ||
Distribution fees | 3,474 | ||
Administrative servicing fees | 137,869 | ||
Other | 21,517 | ||
Total Liabilities | 32,238,801 | ||
Net Assets | $ | 1,231,555,385 | |
Represented by: | |||
Capital | $ | 1,196,636,361 | |
Accumulated net investment income (loss) | 895,099 | ||
Accumulated net realized gains (losses) from investment transactions | 7,625,096 | ||
Net unrealized appreciation (depreciation) on investments | 26,398,829 | ||
Net Assets | $ | 1,231,555,385 | |
Net Assets: | |||
Class I Shares | $ | 1,163,915,458 | |
Class II Shares | 16,914,171 | ||
Class III Shares | 9,721,342 | ||
Class IV Shares | 41,004,414 | ||
Total | $ | 1,231,555,385 | |
Shares outstanding (unlimited number of shares authorized): | |||
Class I Shares | 98,819,134 | ||
Class II Shares | 1,439,890 | ||
Class III Shares | 825,109 | ||
Class IV Shares | 3,481,928 | ||
Total | 104,566,061 | ||
Net asset value and offering price per share:* | |||
Class I Shares | $ | 11.78 | |
Class II Shares | $ | 11.75 | |
Class III Shares | $ | 11.78 | |
Class IV Shares | $ | 11.78 |
| * | Not subject to a front-end sales charge. |
For the Six Months Ended June 30, 2005 (Unaudited)
Investment Income: | |||
Interest income | $ | 27,020,270 | |
Income from securities lending | 64,406 | ||
Total Income | 27,084,676 | ||
Expenses: | |||
Investment advisory fees | 2,946,436 | ||
Fund administration and transfer agent fees | 405,375 | ||
Distribution fees Class II Shares | 21,120 | ||
Administrative servicing fees | 866,054 | ||
Administrative servicing fees | 12,598 | ||
Administrative servicing fees | 5,958 | ||
Administrative servicing fees | 29,931 | ||
Other** | 226,466 | ||
Total Expenses | 4,513,938 | ||
Net Investment Income (Loss) | 22,570,738 | ||
REALIZED/UNREALIZED GAINS (LOSSES) ON INVESTMENTS: | |||
Net realized gains (losses) on investment transactions | 7,929,073 | ||
Net change in unrealized appreciation/depreciation on investments | 10,278,782 | ||
Net realized/unrealized gains (losses) on investments | 18,207,855 | ||
CHANGE IN NET ASSETS RESULTING FROM OPERATIONS | $ | 40,778,593 | |
| ** | Other expenses may include the following fees: audit, custody, insurance, legal, printing, trustee, and out-of-pocket expenses. |
See notes to financial statements.
8
Table of Contents
GARTMORE VARIABLE INSURANCE TRUST
GARTMORE GVIT GOVERNMENT BOND FUND
Statement of Changes in Net Assets
| Six Months Ended June 30, 2005 | Year Ended December 31, 2004 | |||||||
| (Unaudited) | ||||||||
From Investment Activities: | ||||||||
Operations: | ||||||||
Net investment income (loss) | $ | 22,570,738 | $ | 52,034,269 | ||||
Net realized gains (losses) on investment transactions | 7,929,073 | 5,238,587 | ||||||
Net change in unrealized appreciation/depreciation on investments | 10,278,782 | (12,611,291 | ) | |||||
Change in net assets resulting from operations | 40,778,593 | 44,661,565 | ||||||
Distributions to Class I shareholders from: | ||||||||
Net investment income | (20,796,976 | ) | (72,322,043 | ) | ||||
Net realized gains on investments | (2,077,780 | ) | (26,959,477 | ) | ||||
Distributions to Class II shareholders from: | ||||||||
Net investment income | (280,001 | ) | (987,487 | ) | ||||
Net realized gains on investments | (30,292 | ) | (385,901 | ) | ||||
Distributions to Class III shareholders from: | ||||||||
Net investment income | (157,001 | ) | (351,474 | ) | ||||
Net realized gains on investments | (17,636 | ) | (125,495 | ) | ||||
Distributions to Class IV shareholders from: | ||||||||
Net investment income | (722,735 | ) | (2,316,087 | ) | ||||
Net realized gains on investments | (73,151 | ) | (825,774 | ) | ||||
Change in net assets from shareholder distributions | (24,155,572 | ) | (104,273,738 | ) | ||||
Change in net assets from capital transactions | (73,198,745 | ) | (208,956,287 | ) | ||||
Change in net assets | (56,575,724 | ) | (268,568,460 | ) | ||||
Net Assets: | ||||||||
Beginning of period | 1,288,131,109 | 1,556,699,569 | ||||||
End of period | $ | 1,231,555,385 | $ | 1,288,131,109 | ||||
CAPITAL TRANSACTIONS: | ||||||||
Class I Shares | ||||||||
Proceeds from shares issued | $ | 43,910,130 | $ | 83,491,394 | ||||
Dividends reinvested | 22,874,756 | 99,281,367 | ||||||
Cost of shares redeemed | (141,218,309 | ) | (391,541,178 | ) | ||||
| (74,433,423 | ) | (208,768,417 | ) | |||||
Class II Shares | ||||||||
Proceeds from shares issued | 233,726 | 2,575,035 | ||||||
Dividends reinvested | 310,293 | 1,373,386 | ||||||
Cost of shares redeemed | (1,499,707 | ) | (6,462,421 | ) | ||||
| (955,688 | ) | (2,514,000 | ) | |||||
Class III Shares | ||||||||
Proceeds from shares issued | 5,302,195 | 8,174,076 | ||||||
Dividends reinvested | 174,637 | 476,969 | ||||||
Cost of shares redeemed | (2,721,501 | ) | (5,841,542 | ) | ||||
| 2,755,331 | 2,809,503 | |||||||
Class IV Shares | ||||||||
Proceeds from shares issued | 2,194,928 | 7,193,650 | ||||||
Dividends reinvested | 795,885 | 3,141,857 | ||||||
Cost of shares redeemed | (3,555,778 | ) | (10,818,880 | ) | ||||
| (564,965 | ) | (483,373 | ) | |||||
Change in net assets from capital transactions | $ | (73,198,745 | ) | $ | (208,956,287 | ) | ||
9
Table of Contents
GARTMORE VARIABLE INSURANCE TRUST
GARTMORE GVIT GOVERNMENT BOND FUND
Statement of Changes in Net Assets (continued)
| Six Months Ended June 30, 2005 | Year Ended December 31, 2004 | |||||
| (Unaudited) | ||||||
SHARE TRANSACTIONS: | ||||||
Class I Shares | ||||||
Issued | 3,759,673 | 7,049,585 | ||||
Reinvested | 1,963,028 | 8,453,976 | ||||
Redeemed | (12,096,544 | ) | (32,990,765 | ) | ||
| (6,373,843 | ) | (17,487,204 | ) | |||
Class II Shares | ||||||
Issued | 20,218 | 218,486 | ||||
Reinvested | 26,703 | 117,191 | ||||
Redeemed | (128,894 | ) | (549,100 | ) | ||
| (81,973 | ) | (213,423 | ) | |||
Class III Shares | ||||||
Issued | 452,475 | 686,759 | ||||
Reinvested | 14,958 | 40,583 | ||||
Redeemed | (231,757 | ) | (497,918 | ) | ||
| 235,676 | 229,424 | |||||
Class IV Shares | ||||||
Issued | 187,862 | 614,731 | ||||
Reinvested | 68,319 | 267,653 | ||||
Redeemed | (304,012 | ) | (917,931 | ) | ||
| (47,831 | ) | (35,547 | ) | |||
See notes to financial statements.
10
Table of Contents
GARTMORE VARIABLE INSURANCE TRUST
FINANCIAL HIGHLIGHTS
Selected Data for Each Share of Capital Outstanding
Gartmore GVIT Government Bond Fund
| Investment Activities | Distributions: | Ratios/Supplemental Data | ||||||||||||||||||||||||||||||||||||||||
| Net Asset Value, Beginning of Period | Net Investment Income (Loss) | Net Realized and Unrealized Gains (Losses) on Investments | Total from Investment Activities | Net Investment Income | Net Realized Gains | Total Distributions | Net Asset Value, End of Period | Total Return | Net Assets at End of Period (000s) | Ratio of Expenses to Average Net Assets | Ratio of Net Investment Income (Loss) to Average Net Assets | Ratio of Expenses (Prior to Reimbursements) to Average Net Assets(a) | Ratio of Net Investment Income (Loss) (Prior to Reimbursements) to Average Net Assets(a) | Portfolio Turnover(b) | ||||||||||||||||||||||||||||
Class I Shares | ||||||||||||||||||||||||||||||||||||||||||
Year Ended December 31, 2000 | $ | 10.79 | 0.66 | 0.65 | 1.31 | (0.66 | ) | — | (0.66 | ) | $ | 11.44 | 12.54% | $ | 867,139 | 0.66% | 6.00% | 0.73% | 5.93% | 75.91% | ||||||||||||||||||||||
Year Ended December 31, 2001(c) | $ | 11.44 | 0.58 | 0.24 | 0.82 | (0.58 | ) | (0.02 | ) | (0.60 | ) | $ | 11.66 | 7.25% | $ | 1,301,828 | 0.66% | 5.21% | 0.73% | 5.14% | 55.80% | |||||||||||||||||||||
Year Ended December 31, 2002 | $ | 11.66 | 0.53 | 0.72 | 1.25 | (0.53 | ) | (0.10 | ) | (0.63 | ) | $ | 12.28 | 10.98% | $ | 1,982,676 | 0.73% | 4.53% | 0.73% | 4.53% | 49.00% | |||||||||||||||||||||
Year Ended December 31, 2003(d) | $ | 12.28 | 0.50 | (0.25 | ) | 0.25 | (0.38 | ) | (0.02 | ) | (0.40 | ) | $ | 12.13 | 2.00% | $ | 1,488,089 | 0.73% | 4.12% | (j | ) | (j | ) | 40.46% | ||||||||||||||||||
Year Ended December 31, 2004 | $ | 12.13 | 0.47 | (0.08 | ) | 0.39 | (0.66 | ) | (0.24 | ) | (0.90 | ) | $ | 11.62 | 3.26% | $ | 1,222,615 | 0.73% | 3.75% | (j | ) | (j | ) | 69.37% | ||||||||||||||||||
Six Months Ended June 30, 2005 (Unaudited) | $ | 11.62 | 0.22 | 0.17 | 0.39 | (0.21 | ) | (0.02 | ) | (0.23 | ) | $ | 11.78 | 3.39% | (h) | $ | 1,163,915 | 0.72% | (i) | 3.64% | (i) | (j | ) | (j | ) | 41.32% | ||||||||||||||||
Class II Shares | ||||||||||||||||||||||||||||||||||||||||||
Period Ended December 31, 2002(e) | $ | 11.88 | 0.18 | 0.55 | 0.73 | (0.26 | ) | (0.09 | ) | (0.35 | ) | $ | 12.26 | 6.16% | (h) | $ | 10,111 | 0.97% | (i) | 3.93% | (i) | (j | ) | (j | ) | 49.00% | ||||||||||||||||
Year Ended December 31, 2003(d) | $ | 12.26 | 0.47 | (0.25 | ) | 0.22 | (0.36 | ) | (0.02 | ) | (0.38 | ) | $ | 12.10 | 1.77% | $ | 20,998 | 0.98% | 3.85% | (j | ) | (j | ) | 40.46% | ||||||||||||||||||
Year Ended December 31, 2004 | $ | 12.10 | 0.44 | (0.08 | ) | 0.36 | (0.63 | ) | (0.24 | ) | (0.87 | ) | $ | 11.59 | 3.01% | $ | 17,643 | 0.98% | 3.50% | (j | ) | (j | ) | 69.37% | ||||||||||||||||||
Six Months Ended June 30, 2005 (Unaudited) | $ | 11.59 | 0.20 | 0.17 | 0.37 | (0.19 | ) | (0.02 | ) | (0.21 | ) | $ | 11.75 | 3.27% | (h) | $ | 16,914 | 0.98% | (i) | 3.39% | (i) | (j | ) | (j | ) | 41.32% | ||||||||||||||||
Class III Shares | ||||||||||||||||||||||||||||||||||||||||||
Period Ended December 31, 2002(f) | $ | 11.75 | 0.36 | 0.67 | 1.03 | (0.41 | ) | (0.10 | ) | (0.51 | ) | $ | 12.27 | 8.84% | (h) | $ | 7,625 | 0.73% | (i) | 4.12% | (i) | (j | ) | (j | ) | 49.00% | ||||||||||||||||
Year Ended December 31, 2003(d) | $ | 12.27 | 0.50 | (0.24 | ) | 0.26 | (0.37 | ) | (0.02 | ) | (0.39 | ) | $ | 12.14 | 2.11% | $ | 4,369 | 0.73% | 4.10% | (j | ) | (j | ) | 40.46% | ||||||||||||||||||
Year Ended December 31, 2004(d) | $ | 12.14 | 0.46 | (0.07 | ) | 0.39 | (0.66 | ) | (0.24 | ) | (0.90 | ) | $ | 11.63 | 3.27% | $ | 6,854 | 0.73% | 3.72% | (j | ) | (j | ) | 69.37% | ||||||||||||||||||
Six Months Ended June 30, 2005 (Unaudited) | $ | 11.63 | 0.27 | 0.11 | 0.38 | (0.21 | ) | (0.02 | ) | (0.23 | ) | $ | 11.78 | 3.31% | (h) | $ | 9,721 | 0.73% | (i) | 3.66% | (i) | (j | ) | (j | ) | 41.32% | ||||||||||||||||
Class IV Shares | ||||||||||||||||||||||||||||||||||||||||||
Period Ended December 31, 2003(g) | $ | 12.29 | 0.34 | (0.24 | ) | 0.10 | (0.26 | ) | — | (0.26 | ) | $ | 12.13 | 0.84% | (h) | $ | 43,244 | 0.70% | (i) | 4.07% | (i) | (j | ) | (j | ) | 40.46% | ||||||||||||||||
Year Ended December 31, 2004 | $ | 12.13 | 0.46 | (0.07 | ) | 0.39 | (0.66 | ) | (0.24 | ) | (0.90 | ) | $ | 11.62 | 3.27% | $ | 41,019 | 0.73% | 3.74% | (j | ) | (j | ) | 69.37% | ||||||||||||||||||
Six Months Ended June 30, 2005 (Unaudited) | $ | 11.62 | 0.22 | 0.17 | 0.39 | (0.21 | ) | (0.02 | ) | (0.23 | ) | $ | 11.78 | 3.39% | (h) | $ | 41,004 | 0.72% | (i) | 3.64% | (i) | (j | ) | (j | ) | 41.32% | ||||||||||||||||
| (a) | During the period certain fees were waived and/or reimbursed. If such waivers/reimbursements had not occurred, the ratios would have been as indicated. |
| (b) | Portfolio turnover is calculated on the basis of the Fund as a whole without distinguishing among the classes of shares. |
| (c) | The existing shares of the Fund were designated Class I shares as of May 1, 2001. |
| (d) | Net investment income (loss) is calculated based average shares outstanding during the period. |
| (e) | For the period from July 8, 2002 (commencement of operations) through December 31, 2002. |
| (f) | For the period from May 20, 2002 (commencement of operations) through December 31, 2002. |
| (g) | For the period from April 28, 2003 (commencement of operations) through December 31, 2003. |
| (h) | Not annualized. |
| (i) | Annualized. |
| (j) | There were no fee reductions during the period. |
See notes to financial statements.
11
Table of Contents
GARTMORE VARIABLE INSURANCE TRUST
NOTES TO FINANCIAL STATEMENTS (Unaudited)
June 30, 2005
1. Organization
Gartmore Variable Insurance Trust (“GVIT” or the “Trust”) is an open-end management investment company, organized under the laws of Delaware by an amended and restated Agreement and Declaration of Trust, dated October 28, 2004, as amended to date. The Trust, originally created under the laws of Massachusetts as a Massachusetts business trust pursuant to a Declaration of Trust dated, as of June 30, 1981, as subsequently amended, redomesticated as a Delaware Statutory Trust after the close of trading on April 29, 2005, and is registered under the Investment Company Act of 1940, as amended (the “1940 Act”). The redomestication is a change in statutory status and will not affect the operations of the Trust. As of June 30, 2005, the Trust had authorized an unlimited number of shares of beneficial interest (“shares”) without par value. The Trust currently offers shares to life insurance company separate accounts to fund the benefits under variable life insurance or annuity policies. To date, only the separate accounts of Nationwide Life Insurance Company and Nationwide Life and Annuity Insurance Company (collectively, “Nationwide”) have purchased shares of the Trust’s series. The Trust operates thirty-one (31) separate series, or mutual funds, each with its own investment objectives and strategies. This report contains the financial statements and financial highlights of the Gartmore GVIT Government Bond Fund (the “Fund”).
Under the Trust’s organizational documents, the Trust’s officers and trustees are indemnified against certain liabilities arising out of the performance of their duties to the Trust. In addition, the Trust has entered into Indemnification Agreements with the Trust’s trustees and certain officers covering similar liabilities. In addition, in the normal course of business, the Trust enters into contracts with its vendors and others that provide for general indemnifications. The Trust’s maximum exposure under these arrangements is unknown, as this would involve future claims that may be made against the Trust. Based on experience, however, the Trust expects that risk of loss to be remote.
2. Summary of Significant Accounting Policies
The following is a summary of significant accounting policies followed by the Fund in the preparation of its financial statements. The policies are in conformity with accounting principles generally accepted in the United States of America (“GAAP”). The preparation of financial statements requires management to make estimates and assumptions that affect the reported amounts of assets and liabilities, the disclosure of contingent assets and liabilities at the date of the financial statements and the reported amounts of income and expenses for the period. Actual results could differ from those estimates.
| (a) | Security Valuation |
Securities for which market quotations are readily available are valued at current market value as of “Valuation Time.” Valuation Time is as of the close of regular trading on the New York Stock Exchange (usually 4 p.m. Eastern time). Equity securities are valued at the last quoted sale price or, if there is no sale price, the last quoted bid price provided by an independent pricing service approved by the Trust’s Board of Trustees. Securities traded on NASDAQ are valued at the NASDAQ official closing price. Prices are taken from the primary market or exchange in which each security trades. Most securities listed on a foreign exchange are valued either at fair value (see description below) or at the last sale price at the close of the exchange on which the security is principally traded. Foreign securities, currencies, and other assets and liabilities denominated in foreign currencies are translated into U.S. dollars at the exchange rate of said currencies against the U.S. Dollar, as of Valuation Time, as provided by an independent pricing service approved by the Board of Trustees.
Debt (including defaulted issues) and other fixed income securities (other than short-term obligations) are valued at the last quoted bid price and/or by using a combination of daily quotes and matrix evaluations provided by an independent pricing service, the use of which has been approved by the Trust’s Board of Trustees. Short-term debt securities, such as commercial paper and U.S. Treasury Bills having a remaining maturity of 60 days or less at the time of purchase, are considered to be “short-term” and are valued at amortized cost which approximates market value.
Securities for which market quotations are not readily available, or for which an independent pricing service does not provide a value or provides a value that does not represent fair value in the judgment of the Fund’s investment adviser or designee, are valued at fair value under procedures approved by the Trust’s Board of Trustees. The “Fair Value” of these securities is determined in good faith by taking into account relevant factors and surrounding circumstances. Methods utilized to obtain a
12
Table of Contents
GARTMORE VARIABLE INSURANCE TRUST
NOTES TO FINANCIAL STATEMENTS (Unaudited) (Continued)
June 30, 2005
“Fair Value” may include the following non-exclusive list of SEC acceptable methods: (i) a multiple of earnings; (ii) the discount from market value of a similar, freely traded security; (iii) the yield-to-maturity for debt issues; or (iv) a consolidation of the methods. The Gartmore Fair Value Committee considers a non-exclusive list of factors to arrive at the appropriate method upon determining “Fair Value.” For example, fair value determinations are required for securities whose value is affected by a “significant” event that materially affects the value of a domestic or foreign security which occurs subsequent to the time of the close of the principal market on which such domestic or foreign security trades and before the Valuation Time (i.e., a “subsequent event”). Typically, this will involve events occurring after the close of a foreign market on which a security trades and before the next Valuation Time.
| (b) | Repurchase Agreements |
The Fund may enter into repurchase agreements with an entity which is a member of the Federal Reserve System or which is a “primary dealer” (as designated by the Federal Reserve Bank of New York) in U.S. Government obligations. The repurchase price generally equals the price paid by the Fund plus interest negotiated on the basis of current short-term rates, which may be more or less than the rate on the underlying portfolio securities. The seller under a repurchase agreement is required to maintain the value of the collateral held pursuant to the agreement at a market value equal to or greater than the repurchase price (including accrued interest). Collateral subject to repurchase agreements is held by the Fund’s custodian or another qualified sub-custodian or in the Federal Reserve/Treasury book-entry system. If the counterparty defaults and the fair value of the collateral declines, realization of the collateral by the Fund may be delayed or limited. The Fund may transfer uninvested cash balances into a pooled cash account. These balances are invested in one or more repurchase agreements, which are fully collateralized by AA-rated Corporate Bonds with the counterparties of CS First Boston and Nomura Securities.
| (c) | Mortgage Dollar Rolls |
The Fund may enter into mortgage “dollar rolls” in which the Fund sells mortgage-backed securities for delivery in the current month and simultaneously contracts to repurchase substantially similar (same type, coupon, and maturity) securities on a specified future date. Mortgage dollar rolls are referred to as TBA’s on the Statement of Investments of the Fund. During the roll period, the Fund foregoes principal and interest paid on the mortgage-backed securities. The Fund is compensated by fee income or the difference between the current sales price and the lower forward price for the future purchase. Mortgage dollar rolls are valued at the last quoted bid price and/or by using a combination of daily quotes and matrix evaluations provided by an independent pricing service, the use of which has been approved by the Board of Trustees.
| (d) | Security Transactions and Investment Income |
Security transactions are accounted for on the date the security is purchased or sold (“trade date”). Securities gains and losses are calculated on the identified cost basis. Interest income is recognized on the accrual basis and includes, where applicable, the amortization or accretion of premium or discount.
| (e) | Securities Lending |
To generate additional income, the Fund may lend up to 33 1/3% of the Fund’s total assets pursuant to agreements, requiring that the borrower deliver cash or securities as collateral with respect to each new loan of U.S. securities, equal to at least 102% of the value of the portfolio securities loaned, and with respect to each new loan of non-U.S. securities, collateral of at least 105% of the value of the portfolio securities loaned, and thereafter requiring the borrower to mark to market the collateral on a daily basis and requiring the borrower to make up any shortfall of collateral. The Fund receives payments from borrowers equivalent to the dividends and interest that would have been earned on securities lent while simultaneously seeking to earn income on the investment of cash collateral. Collateral is marked to market daily to provide a level of collateral at least equal to the market value of securities loaned. There may be risks of delay in recovery of the securities should the borrower of the securities fail financially. Loans will be made, however, only to borrowers deemed by the Fund’s investment adviser to be of good standing and creditworthy under guidelines established by the Board of Trustees and when,
13
Table of Contents
GARTMORE VARIABLE INSURANCE TRUST
NOTES TO FINANCIAL STATEMENTS (Unaudited) (Continued)
June 30, 2005
in the judgment of the adviser, the consideration which can be earned currently from these securities loans justifies the attendant risks. Loans are subject to termination by the Fund or the borrower at any time, and, therefore, are not considered to be illiquid investments. JPMorgan Chase Bank serves as custodian for the securities lending program of the Fund. JPMorgan Chase Bank receives a custody fee based on the value of collateral received from borrowers.
The cash collateral received by the Fund was pooled and, at June 30, 2005, was invested in the following:
Security Type | Security Name | Market Value | Maturity Rate | Maturity Date | ||||||
| Commercial Paper | Lexington Parker Capital | $ | 2,232,767 | 3.05 | % | 07/08/05 | ||||
| Commercial Paper | MacQuarie Bank Ltd. | 2,496,840 | 3.25 | % | 07/01/05 | |||||
| Domestic Certificates of Deposit — Fixed | Washington Mutual Bank FA | 700,182 | 3.15 | % | 08/01/05 | |||||
| Repurchase Agreements | Nomura Securities | 25,793,564 | 3.48 | % | 07/01/05 | |||||
As of June 30, 2005, the Fund had securities with the following market values on loan:
Market Value of | Market Value of Collateral* | ||
$271,838,225 | $ | 277,079,674 | |
| * | Includes securities and cash collateral. |
| (f) | Distributions to Shareholders |
The Fund’s dividends from net investment income, if any, are declared and paid quarterly. The Fund’s distributable net realized capital gains, if any, are declared and distributed at least annually.
Dividends and distributions to shareholders are determined in accordance with federal income tax regulations, which may differ from GAAP. These “book/tax” differences are considered either permanent or temporary in nature. In accordance with the American Institute of Certified Public Accountants (“AICPA”) Statement of Position 93-2, permanent differences (i.e., reclassification of market discounts, gain/loss, paydowns, and distributions) are reclassified within the capital accounts based on their nature for federal income tax purposes; temporary differences do not require reclassification. These reclassifications have no effect upon the net asset value of the Fund. Dividends and distributions that exceed net investment income and net realized gains for financial reporting purposes, but not for tax purposes, are reported as distributions in excess of net investment income or net realized gains. To the extent distributions exceed current and accumulated earnings and profits for federal income tax purposes, these distributions are reported as distributions of paid-in-capital.
| (g) | Federal Income Taxes |
It is the policy of the Fund to qualify or continue to qualify as a “regulated investment company” by complying with the provisions available to certain investment companies, as defined in applicable sections of the U.S. Internal Revenue Code, and to make distributions of net investment income and net realized capital gains sufficient to relieve the Fund from all, or substantially all, federal income taxes.
As of June 30, 2005, the tax cost of securities and the breakdown of unrealized appreciation (depreciation) for the Fund is as follows:
Tax Cost of | Unrealized Appreciation | Unrealized Depreciation | Net Unrealized Appreciation (Depreciation) | |||||||
$303,975 | $ | 29,444,871 | $ | (3,350,017 | ) | $ | 26,094,854 | |||
14
Table of Contents
GARTMORE VARIABLE INSURANCE TRUST
NOTES TO FINANCIAL STATEMENTS (Unaudited) (Continued)
June 30, 2005
| (h) | Allocation of Expenses, Income, and Gains and Losses |
Expenses directly attributable to the Fund are charged to the Fund. Expenses not directly attributable to the Fund are allocated proportionately among various or all funds within the Trust. The method used by the Fund for allocating income, fund level expenses, and realized and unrealized gains or losses is based on the fair value of shares outstanding relative to net assets. Under this method, each class of shares participates based on the total net asset value of that class’s shares in proportion to the total net assets of the Fund. Expenses specific to a class (such as rule 12b-1 and administrative services fees) are charged to that class.
3. Transactions with Affiliates
Under the terms of the Trust’s Investment Advisory Agreement, Gartmore Mutual Fund Capital Trust (“GMF”) manages the investment of the assets and supervises the daily business affairs of the Fund. GMF is a wholly-owned subsidiary of Gartmore Global Investments, Inc. (“GGI”), a holding company. GGI is a majority-owned subsidiary of Gartmore Global Asset Management Trust (“GGAMT”). GGAMT is a wholly-owned subsidiary of Nationwide Corporation. All of the common stock of Nationwide Corporation is held by Nationwide Mutual Insurance Company (95.2%) and Nationwide Mutual Fire Insurance Company (4.8%), each of which is a mutual company owned by its policyholders.
Under the terms of the Investment Advisory Agreement, the Fund pays GMF an investment advisory fee based on the Fund’s average daily net assets and the following fee schedule:
| Fee Schedule | Fees | |
Up to $250 million | 0.50% | |
Next $750 million | 0.475% | |
Next $1 billion | 0.45% | |
Next $3 billion | 0.425% | |
$5 billion or more | 0.40% |
Under the terms of a Fund Administration and Transfer Agency Agreement, Gartmore SA Capital Trust (“GSA”) provides the Fund with various administrative and accounting services, and Gartmore Investors Services, Inc. (“GISI”), an indirect subsidiary of GSA, serves as Transfer and Dividend Disbursing Agent for the Fund. The fees for the services provided under this Agreement are calculated based on the Trust’s average daily net assets according to the fee schedule below. The fees are then allocated proportionately among all Funds within the Trust in relation to the average daily net assets of each Fund and are paid to GSA. GSA pays GISI from these fees for its services.
| Combined Fee Schedule* | ||
Up to $1 billion | 0.13% | |
$1 billion and more up to $3 billion | 0.08% | |
$3 billion and more up to $8 billion | 0.05% | |
$8 billion and more up to $10 billion | 0.04% | |
$10 billion and more up to $12 billion | 0.02% | |
$12 billion or more | 0.01% | |
| * | The assets of the Gartmore GVIT Investor Destinations Aggressive Fund, the Gartmore GVIT Investor Destinations Moderately Aggressive Fund, the Gartmore GVIT Investor Destinations Moderate Fund, the Gartmore GVIT Investor Destinations Moderately Conservative Fund, and the Gartmore GVIT Investor Destinations Conservative Fund (collectively, the “Investor Destinations Funds”) are excluded from the Trust asset level amount in order to calculate this asset-based fee. The Investor Destinations Funds do not pay any part of this fee. |
15
Table of Contents
GARTMORE VARIABLE INSURANCE TRUST
NOTES TO FINANCIAL STATEMENTS (Unaudited) (Continued)
June 30, 2005
Effective January 1, 2005, the fee for the fund administration and transfer agency services increased as set forth below. The fees are calculated based on the Trust’s average daily net assets according to the fee schedule below. The fees are then allocated proportionately among all funds within the Trust in relation to the average daily net assets of each fund and are paid to GSA.
| Combined Fee Schedule* | ||
Up to $1 billion | 0.15% | |
$1 billion and more up to $3 billion | 0.10% | |
$3 billion and more up to $8 billion | 0.05% | |
$8 billion and more up to $10 billion | 0.04% | |
$10 billion and more up to $12 billion | 0.02% | |
$12 billion or more | 0.01% | |
| * | The assets of each of the Investor Destinations Funds are excluded from the Trust asset level amount in order to calculate this asset-based fee. The Investor Destinations Funds do not pay any part of this fee. |
GSA and GISI have entered into agreements with BISYS Fund Services Ohio, Inc. (“BISYS”), pursuant to which BISYS provides sub-administration and sub-transfer agency services, respectively, to the Fund.
Under the terms of a Distribution Plan under Rule 12b-1 of the 1940 Act, Gartmore Distribution Services, Inc. (“GDSI”), the Fund’s Distributor, is compensated by the Fund for expenses associated with the distribution of the Class II shares of the Fund. These fees are based on average daily net assets of Class II shares of the Fund at an annual rate not to exceed 0.25%.
Under the terms of an Administrative Services Plan, the Fund may pay fees to servicing organizations, such as broker-dealers, including Nationwide Financial Services, and financial institutions, which agree to provide administrative support services to the shareholders of certain classes. These services include, but are not limited, to the following: establishing and maintaining shareholder accounts; processing purchase and redemption transactions; arranging bank wires; performing shareholder sub-accounting; answering inquires regarding the Fund; and other such services. These fees are based on an annual rate of up to 0.25% of the average daily net assets of Class I, Class II, and Class III shares of the Fund and 0.20% of Class IV shares of the Fund.
4. Short-Term Trading Fees
The Fund reserves the right to assess a short-term trading fee on certain transactions out of Class III shares that a separate account makes on behalf of a variable insurance contract owner (the “contract owner”). A separate account that redeems Class III shares on behalf of a contract owner may be subject to a 1.00% short-term trading fee if the separate account held the Class III shares on behalf of the contract owner for 60 days or less, unless an exception applies as disclosed in the prospectus. The short-term trading fee is paid directly to the Fund and is intended to offset the cost to the Fund of excess brokerage commissions and other costs associated with fluctuations in fund asset levels and cash flow caused by short-term trading. For purposes of determining whether the short-term trading fee applies, the Class III shares that were held on behalf of the contract owner the longest will be treated as being redeemed first.
For the six months ended June 30, 2005, the Fund had no contributions to capital due to collection of redemption fees.
5. Investment Transactions
For the six months ended June 30, 2005, (excluding short-term securities) the Fund had purchases of $478,016,983 and sales of $524,873,200.
6. Bank Loans
The Trust has a credit agreement of $100,000,000. Borrowings under this arrangement bear interest at the Federal Funds rate plus 0.50%. The interest costs are included in custodian fees in the Statement of Operations. No compensation balances were required under the terms of the line of credit. There were no borrowings outstanding as of June 30, 2005.
16
Table of Contents
GARTMORE VARIABLE INSURANCE TRUST
NOTES TO FINANCIAL STATEMENTS (Unaudited) (Continued)
June 30, 2005
7. Shareholder Meeting
A separate shareholders meeting was held on Tuesday, December 23, 2004, for the shareholders of the Trust’s predecessor pursuant to a Proxy Statement On Schedule 14A, dated October 29, 2004, and mailed to the shareholders of the Trust’s predecessor on or around November 5, 2004.
Two Proposals: The purpose of the December 23, 2004 meeting was to allow the shareholders of the Trust’s predecessor to vote on:
| i. | Proposal One: The election of the Trust’s Board of Trustees; and |
| ii. | Proposal Two: The approval of an “Agreement and Plan of Reorganization” that provided for the reorganization of the Trust from a Massachusetts business trust into a Delaware statutory trust. |
Proposal One: As set forth in the October 29, 2004 Proxy Statement, the nominees for election as Trustees of the Trust’s predecessor were: Charles E. Allen, Michael J. Baresich, Paula H.J. Cholmondeley, C. Brent DeVore, Phyllis Kay Dryden, Robert M. Duncan, Barbara L. Hennigar, Paul J. Hondros, Barbara I Jacobs, Thomas J. Kerr IV, Douglas F. Kridler, Michael D. McCarthy, Arden L. Shisler, and David C. Wetmore.
Proposal Two: As specifically set forth in the October 29, 2004 Proxy Statement, the Reorganization proposal requested the shareholders of the Trust’s predecessor to approve the proposed “Agreement and Plan of Reorganization” of the Trust��s predecessor (on behalf of each of the its funds) into a new Delaware-domiciled Trust, whereby the Funds of the new Delaware Trust would acquire all of the assets of the corresponding funds of the Trust’s predecessor subject to the liabilities, expenses, costs, charges, and reserves of the corresponding funds of the Trust’s predecessor (contingent or otherwise), in exchange for shares of the acquiring Funds to be distributed pro rata by the Trust to the holders of the shares of the funds of the Trust’s predecessor, in a complete liquidation of the Trust’s predecessor.
| Voting | Results: |
The shareholders of the Trust’s predecessor voted to approve both Proposal One and Proposal Two, as follows:
Proposal 1: Election of a Board of Trustees of Gartmore Variable Insurance Trust
Charles E. Allen: | ||
FOR | 2,797,230,318.955 shares (96.078%) | |
WITHHOLD | 114,195,693.660 shares (3.922%) | |
TOTAL | 2,912,726,012.615 shares (100.000%) | |
Michael J. Baresich: | ||
FOR | 2,796,135,979.559 shares (96.040%) | |
WITHHOLD | 115,290,033.056 shares (3.960%) | |
TOTAL | 2,912,726,012.615 shares (100.000%) | |
Paula H.J. Cholmondeley: | ||
FOR | 2,795,095,945.396 shares (96.004%) | |
WITHHOLD | 116,330,067.219 shares (3.996%) | |
TOTAL | 2,912,726,012.615 shares (100.000%) | |
C. Brent DeVore: | ||
FOR | 2,797,207,046.916 shares (96.077%) | |
WITHHOLD | 114,218,965.699 shares (3.923%) | |
TOTAL | 2,912,726,012.615 shares (100.000%) | |
17
Table of Contents
GARTMORE VARIABLE INSURANCE TRUST
NOTES TO FINANCIAL STATEMENTS (Unaudited) (Continued)
June 30, 2005
Phyllis Kay Dryden: | ||
FOR | 2,795,587,023.994 shares (96.021%) | |
WITHHOLD | 115,838,988.621 shares (3.979%) | |
TOTAL | 2,912,726,012.615 shares (100.000%) | |
Robert M. Duncan: | ||
FOR | 2,790,191,720.503 shares (95.836%) | |
WITHHOLD | 121,234,292.112 shares (4.164%) | |
TOTAL | 2,912,726,012.615 shares (100.000%) | |
Barbara L. Hennigar: | ||
FOR | 2,792,939,848.858 shares (95.937%) | |
WITHHOLD | 118,486,163.757 shares (4.070%) | |
TOTAL | 2,912,726,012.615 shares (100.000%) | |
Paul J. Hondros: | ||
FOR | 2,797,557,404.448 shares (96.089%) | |
WITHHOLD | 113,868,608.167 shares (3.911%) | |
TOTAL | 2,912,726,012.615 shares (100.000%) | |
Barbara I. Jacobs: | ||
FOR | 2,796,306,126.654 shares (96.046%) | |
WITHHOLD | 115,119,885.961 shares (3.954%) | |
TOTAL | 2,912,726,012.615 shares (100.000%) | |
Thomas J. Kerr IV: | ||
FOR | 2,789,755,720.087 shares (95.821%) | |
WITHHOLD | 121,670,292.528 shares (4.179%) | |
TOTAL | 2,912,726,012.615 shares (100.000%) | |
Douglas F. Kridler: | ||
FOR | 2,798,065,774.375 shares (96.106%) | |
WITHHOLD | 113,360,238.240 shares (3.894%) | |
TOTAL | 2,912,726,012.615 shares (100.000%) | |
Michael D. McCarthy: | ||
FOR | 2,797,452,613.694 shares (96.085%) | |
WITHHOLD | 113,973,395.921 shares (3.915%) | |
TOTAL | 2,912,726,012.615 shares (100.000%) | |
Arden L. Shisler: | ||
FOR | 2,796,738,454.730 shares (96.061%) | |
WITHHOLD | 114,687,557.885 shares (3.939%) | |
TOTAL | 2,912,726,012.615 shares (100.000%) | |
18
Table of Contents
GARTMORE VARIABLE INSURANCE TRUST
NOTES TO FINANCIAL STATEMENTS (Unaudited) (Continued)
June 30, 2005
David C. Wetmore: | ||
FOR | 2,794,784,752.247 shares (95.994%) | |
WITHHOLD | 116,641,260.368 shares (4.006%) | |
TOTAL | 2,912,726,012.615 shares (100.000%) | |
Proposal 2: Approval of the Agreement and Plan of Reorganization of Gartmore Variable Insurance Trust
FOR | 2,561,003,822.546 shares (87.964%) | |
AGAINST | 103,593,261.010 shares (3.558%) | |
ABSTAIN | 246,828,929.059 shares (8.478%) | |
TOTAL | 2,912,726,012.615 shares (100.000%) | |
19
Table of Contents
GARTMORE VARIABLE INSURANCE TRUST
Management Information (Unaudited)
June 30, 2005
Trustees who are not Interested Persons (as defined in the 1940 Act) and Officers of the Funds June 30, 2005
| Name, Address and Date of Birth | Position(s) Held with the Trust and Length of Time Served1 | Principal Occupation(s) During Past 5 Years | Number of Portfolios in the Gartmore Fund Complex Overseen by Trustee | Other Directorships Held by Trustee or Nominee2 | ||||
Charles E. Allen
c/o Gartmore Global Investments, Inc. 1200 River Road, Suite 1000 Conshohocken, PA 19428
1948 | Trustee since July 2000 | Mr. Allen is Chairman, Chief Executive Officer and President of the Graimark Realty Advisors, Inc. (real estate development, investment and asset management). | 84 | None | ||||
Paula H.J. Cholmondeley
c/o Gartmore Global Investments, Inc. 1200 River Road, Suite 1000 Conshohocken, PA 19428
1940 | Trustee since July 2000 | Ms. Cholmondeley has been the Chairman and Chief Executive Officer of the Sorrel Group, a management consulting company, since January 2004. From March 2000 through December 2003, Ms. Cholmondeley was Vice President and General Manager of Sappi Fine Paper North America. Prior thereto, Ms. Cholmondeley was Vice President and General Manager of Residential Insulation of Owens Corning. | 84 | Director of Dentsply International, Inc., Ultralife Batteries, Inc., Terex Corporation, Minerals Technology, Inc. and Albany International Corp. | ||||
C. Brent DeVore
c/o Gartmore Global Investments, Inc. 1200 River Road, Suite 1000 Conshohocken, PA 19428
1940 | Trustee since 1990 | Dr. DeVore is President of Otterbein College. | 84 | None | ||||
Phyllis K. Dryden
c/o Gartmore Global Investments, Inc. 1200 River Road, Suite 1000 Conshohocken, PA 19428
1947 | Trustee since December 2004 | Ms. Dryden was a former Managing Partner of marchFIRST, a global management consulting firm prior to 2002. | 84 | None |
20
Table of Contents
GARTMORE VARIABLE INSURANCE TRUST
Management Information (Unaudited)
June 30, 2005
| Name, Address and Date of Birth | Position(s) Held with the Trust and Length of Time Served1 | Principal Occupation(s) During Past 5 Years | Number of Portfolios in the Gartmore Fund Complex Overseen by Trustee | Other Directorships Held by Trustee or Nominee2 | ||||
Barbara L. Hennigar*
c/o Gartmore Global Investments, Inc. 1200 River Road, Suite 1000 Conshohocken, PA 19428
1935 | Trustee since July 2000 | Retired since June 2000. Prior thereto, Ms. Hennigar was the Chairman or President and Chief Executive Officer of OppenheimerFunds Services and a member of the Executive Committee of OppenheimerFunds. | 84 | None | ||||
Barbara I. Jacobs
c/o Gartmore Global Investments, Inc. 1200 River Road, Suite 1000 Conshohocken, PA 19428
1950 | Trustee since December 2004 | Ms. Jacobs has served as Chairman of the Board of Directors of KICAP Network Fund, a European (United Kingdom) hedge fund, since December 2000. Prior to 2004, Ms. Jacobs was also a Managing Director and European Portfolio Manager with CREF Investments (Teachers Insurance Annuity Association — College Retirement Equity Fund). | 84 | None | ||||
Douglas F. Kridler
c/o Gartmore Global Investments, Inc. 1200 River Road, Suite 1000 Conshohocken, PA 19428
1955 | Trustee since September 1997 | Mr. Kridler has served as the President and Chief Executive Officer of the Columbus Foundation (a Columbus, OH-based foundation which manages over 1,300 individual endowment funds) since February 2002. Mr. Kridler was the President of the Columbus Association for the Performing Arts prior thereto and Chairman of the Greater Columbus Convention and Visitors Bureau during 2000 and 2001. | 84 | None | ||||
Michael D. McCarthy
c/o Gartmore Global Investments, Inc. 1200 River Road, Suite 1000 Conshohocken, PA 19428
1947 | Trustee since December 2004 | Mr. McCarthy serves as: the Founder and Chairman of The Eureka Foundation (which sponsors and funds the “Great Museums” series on PBS); and a Partner of Pineville Properties LLC (a commercial real estate development firm). | 843 | None |
21
Table of Contents
GARTMORE VARIABLE INSURANCE TRUST
Management Information (Unaudited)
June 30, 2005
| Name, Address and Date of Birth | Position(s) Held with the Trust and Length of Time Served1 | Principal Occupation(s) During Past 5 Years | Number of Portfolios in the Gartmore Fund Complex Overseen by Trustee | Other Directorships Held by Trustee or Nominee2 | ||||
David C. Wetmore
c/o Gartmore Global Investments, Inc. 1200 River Road, Suite 1000 Conshohocken, PA 19428
1948 | Trustee since 1995 and Chairman since February 2005 | Retired. Mr. Wetmore was formerly a Managing Director of Updata Capital, an investment banking and venture capital firm. | 84 | None |
| * | Pursuant to the Trust’s mandatory retirement policy, Ms. Hennigar is expected to retire on or about January 12, 2006. |
| 1 | The term of office length is until a trustee resigns or reaches a mandatory retirement age of 70. On March 2, 2000, the Board adopted a five-year implementation period for any Trustee 65 or older as of the adoption of this policy. Pursuant to this policy, Messrs. Duncan and Kerr retired as trustees effective as of March 12, 2005. |
| 2 | Directorships held in (1) any other investment companies registered under the 1940 Act, (2) any company with a class of securities registered pursuant to Section 12 of the Securities Exchange Act of 1934, as amended (the “Exchange Act”), or (3) any company subject to the requirements of Section 15(d) of the Exchange Act. |
| 3 | Mr. McCarthy was also an Administrative Committee Member for the Alphagen Arneb Fund, LLC, The Healthcare Fund LDC, The Leaders Long-Short Fund, LLC, and The Leaders Long-Short Fund LDC, four private investment companies (hedge funds) managed by GSA. Mr. McCarthy resigned as an Administrative Committee Member effective June 30, 2005. |
Trustees and Officers who are not Interested Persons (as defined in the 1940 Act) of the Funds received aggregate compensation of $274,882 from the Trust for the Six Months Ended June 30, 2005. Additional information regarding the Trustees and Officers may be found in the Trust’s statement of additional information, which is available without charge upon request, by calling 1-800-848-0920.
22
Table of Contents
GARTMORE VARIABLE INSURANCE TRUST
Management Information (Unaudited)
June 30, 2005
Trustees who are Interested Persons (as defined in the 1940 Act) and/or Officers of the Funds June 30, 2005
| Name, Address and Age | Position(s) Held with the Trust and Length of Time Served1 | Principal Occupation(s) During Past 5 Years | Number of Portfolios in the Gartmore Fund Complex Overseen by Trustee | Other Directorships Held by Trustee2 | ||||
Paul J. Hondros
Gartmore Global Investments, Inc. 1200 River Road, Suite 1000 Conshohocken, PA 19428
1948 | Trustee since July 2000 | Mr. Hondros has been President and Chief Executive Officer of various Gartmore entities, including Gartmore Distribution Services, Inc. (“GDSI”),3 Gartmore Investor Services, Inc. (“GISI”),3 Gartmore Morley Capital Management, Inc. (“GMCM”),3 Gartmore Morley Financial Services, Inc. (“GMFS”),3 NorthPointe Capital, LLC (“NorthPointe”),3 Gartmore Global Asset Management Trust (“GGAMT”)3, Gartmore Global Investments, Inc. (“GGI”)3, Gartmore Mutual Fund Capital Trust (“GMFCT”)3 and Gartmore SA Capital Trust (“GSA”)3; and a Director of Nationwide Securities, Inc.3, as well as several entities within Nationwide Financial Services, Inc. | 844 | None | ||||
Arden L. Shisler
c/o Gartmore Global Investments, Inc. 1200 River Road, Suite 1000 Conshohocken, PA 19428
1941 | Trustee since February 2000 | Mr. Shisler has been a consultant since January 2003. Prior thereto, he was President and Chief Executive Officer of K&B Transport, Inc., a trucking firm. Since 1992, Mr. Shisler has also been Chairman of the Board for Nationwide Mutual Insurance Company3. | 84 | Director of Nationwide Financial Services, Inc. | ||||
Gerald J. Holland
Gartmore Global Investments, Inc. 1200 River Road, Suite 1000 Conshohocken, PA 19428
1951 | Treasurer since March 2001 | Mr. Holland is Senior Vice President — Operations for GGI3, GMFCT3 , and GSA3. Prior to July 2000, Mr. Holland was Vice President for First Data Investor Services, an investment company service provider. | 84 | None |
23
Table of Contents
GARTMORE VARIABLE INSURANCE TRUST
Management Information (Unaudited)
June 30, 2005
| Name, Address and Age | Position(s) Held with the Trust and Length of Time Served1 | Principal Occupation(s) During Past 5 Years | Number of Portfolios in the Gartmore Fund Complex Overseen by Trustee | Other Directorships Held by Trustee2 | ||||
Michael A. Krulikowski
Gartmore Global Investments, Inc. 1200 River Road, Suite 1000 Conshohocken, PA 19428
1959 | Chief Compliance Officer since June 2004 | Since November 1999, Mr. Krulikowski has served as a Vice President and Chief Compliance Officer of GGI. Prior thereto, Mr. Krulikowski served as Chief Compliance Officer of 1717 Capital Management Company/Provident Mutual Insurance Company. | 84 | None | ||||
Eric E. Miller
Gartmore Global Investments, Inc. 1200 River Road, Suite 1000 Conshohocken, PA 19428
1953 | Secretary since December 2002 | Mr. Miller is Senior Vice President, Chief Counsel for GGI3, GMFCT3 and GSA3 since August 2002. From August 2000 to August 2002, Mr. Miller was a Partner with Stradley Ronan Stevens & Young, LLP. Prior to August 2000, Mr. Miller served as Senior Vice President and Deputy General Counsel at Delaware Investments. | 84 | None |
| 1 | The term of office length is until a trustee resigns or reaches a mandatory retirement age of 70. On March 2, 2000, the Board adopted a five-year implementation period for any Trustee 65 or older as of the adoption of this policy. Pursuant to this policy, Messrs. Duncan and Kerr retired as trustees effective as of March 12, 2005. |
| 2 | Directorships held in (1) any other investment companies registered under the 1940 Act, (2) any company with a class of securities registered pursuant to Section 12 of the Securities Exchange Act of 1934, as amended (the “Exchange Act”), or (3) any company subject to the requirements of Section 15(d) of the Exchange Act. |
| 3 | This position is held with an affiliated person or principal underwriter of the Trust. |
| 4 | Mr. Hondros was also an Administrative Committee Member for the Alphagen Arneb Fund, LLC, The Healthcare Fund LDC, The Leaders Long-Short Fund, LLC, and The Leaders Long-Short Fund LDC, four private investment companies (hedge funds) managed by GSA. Mr. Hondros resigned as Administrative Committee Member effective June 30, 2005. |
| Federal law requires the Trust, each of its investment advisers and sub-advisers to adopt procedures for voting proxies (“Proxy Voting Guidelines”) and to provide a summary of those Proxy Voting Guidelines used to vote the securities held by the Funds. The Funds’ proxy voting policies and procedures are available without charge (i) upon request, by calling 1-800-848-0920, (ii) on the Fund’s website at www.gartmorefunds.com, or (iii) on the Securities and Exchange Commission’s website at www.sec.gov. |
24
Table of Contents
GVIT Small Company Fund
Semiannual Report
| | June 30, 2005 |
| Contents | ||
| 11 | Statement of Investments | |
| 25 | Statement of Assets and Liabilities | |
| 25 | Statement of Operations | |
| 26 | Statements of Changes in Net Assets | |
| 28 | Financial Highlights | |
| 29 | Notes to Financial Statements | |
Commentary provided by Gartmore Global Investments, investment adviser to Gartmore Variable Insurance Trust. All opinions and estimates included in this report constitute Gartmore Global Investments’ judgment as of the date of this report and are subject to change without notice.
Statement Regarding Availability of Quarterly Portfolio Schedule.
The Gartmore Variable Insurance Trust files complete schedules of portfolio holdings for each Fund with the Securities and Exchange Commission (the “Commission”) for the first and third quarters of each fiscal year on Form N-Q. The Funds’ Forms N-Q are available on the Commission’s website at http://www.sec.gov. The Funds’ Forms N-Q may be reviewed and copied at the Commission’s Public Reference Room in Washington, DC, and information on the operation of the Public Reference Room may be obtained by calling 800-SEC-0330; and the Funds make the information on Form N-Q available to shareholders upon request without charge.
Statement Regarding Availability of Proxy Voting Record.
Information regarding how the Fund voted proxies relating to portfolio securities held during the most recent 12-month period ended June 30, 2005 is available without charge, upon request, by calling 800-848-0920, and on the Commission’s website at http://www.sec.gov.
Table of Contents
GVIT Small Company Fund
For the semiannual period ended June 30, 2005, the GVIT Small Company Fund returned 3.07% (Class I at NAV) versus -1.25% for its benchmark, the Russell 2000® Index. For broader comparison, the average return for the Fund’s Lipper peer category of Small-Cap Growth Funds was -0.22%.
A portion of the Fund’s portfolio, with the investment syle noted in parenthesis followed by each sleeve’s appropriate return for the semiannual period ended June 30, 2005, is managed on a day-to-day basis by each of the following asset management companies: American Century Investment Management, Inc. (core: 2.43%); Morgan Stanley Investment Management, Inc. (small-cap growth: 5.65%); The Dreyfus Corp. (core: 0.71%); Neuberger Berman, LLC (small-cap value: 15.84%); Waddell & Reed Investment Management Co. (small-cap growth: 2.57%); and Gartmore Global Partners (international small cap: 8.13%). Gartmore Mutual Fund Capital Trust (“GMF”) is the Fund’s investment adviser and has selected the above companies as subadvisers for the Fund and manages a sleeve (small-cap value; 0.00%) through their dual employees at NorthPointe Capital®, LLC. Below are the individual reports on how each sleeve performed.
American Century Investment Management, Inc. – Core
The core sleeve’s best-performing sectors on an absolute basis were economic stalwarts, including health care, energy and utilities. Kos Pharmaceuticals, Inc.; United Defense Industries, Inc.; and utilities firm UGI Corp. were the top three contributors to absolute performance, reflecting a disparate range across the economy. The consumer staples sector performed strongly as well, adding positive performance results to the sleeve.
Our stock selection process, which evaluates securities based on a balanced set of growth and value criteria, has led to significant positions in firms such as health-care equipment producer Haemonetics Corp., industrial products distributor Applied Industrial Technologies, Inc. and medical test equipment maker Dade Behring Holdings Inc. Each posted strong gains during the reporting period. Our analysis also enabled us to sidestep a number of benchmark stocks that posted negative returns, such as high-tech ceramics producer Ceradyne, Inc. and defense products producer Cubic Corp. Both stocks lie in the industrial sector, which, overall, produced a positive return for the sleeve.
Among detractors to the sleeve’s performance, the materials and consumer discretionary sectors posted losses on an absolute basis, as did the information technology and financials sectors. AK Steel Holding Corp. had the largest negative impact for the sleeve in the materials sector as the company confronted problems with operating cash flow, profit margins and labor issues. Other negative impacts on
absolute return were posted by R&G Financial Corp. and by metals recycler Metal Management, Inc.
As always, we remain true to our disciplined investment approach—building a portfolio of smaller companies that we believe provides an optimal balance between risk and expected return.
Morgan Stanley Investment Management, Inc. — Small-Cap Growth
The small-cap growth sleeve outperformed its benchmark index, primarily driven by strong stock selection and, to a lesser extent, sector allocations. The top contributing sectors were technology, health care and utilities. With an emphasis on secular growth, we focus on stock selection rather than on short-term market events.
Within technology, communications technology, and computer services software and systems, the semiconductors/components companies were particularly beneficial to relative return. In addition, an overall underweighting in technology helped, since the sector struggled as a whole. Within health care, relative returns were bolstered by stocks in several industries, including pharmaceutical companies, biotechnology research and production companies, and medical instruments and services firms. Among the sleeve’s utilities holdings, gas distributors further enhanced relative performance. Additional portfolio contribution came from consumer discretionary stocks.
Not all stocks proved advantageous throughout the period, however. Trucking stocks hindered performance, as did exposure to the integrated oil industry. While health care enhanced relative returns for the sleeve, not all areas performed with equal strength. Health-care facilities and health-care management services slowed the sleeve’s pace versus that of the benchmark index. Also detracting from performance were education services companies as well as casino and gambling companies.
We continue to favor companies that have some uniqueness or dynamic competitive advantage in their business model, with a high-quality stream of cash flow and earnings growth, and the ability to redeploy capital at a high rate of return.
The Dreyfus Corp. — Core
During the reporting period, the core sleeve’s performance benefited from its exposure to the health care, producer durables, utilities and energy sectors. Conversely, the sleeve was hurt by its overall exposure to materials and processing as well as consumer staples.
Within health care, service providers drove performance, led by nursing home operator Beverly Enterprises, Inc. and rural hospital operator LifePoint Hospitals, Inc. Construction machinery manufacturer JLG Industries, Inc. and commercial auctioneer Ritchie Bros. Auctioneers Inc. provided strong upside performance within the producer durables sector. Finally, natural gas distributors
1
Table of Contents
GVIT Small Company Fund (continued)
Southwestern Energy Co. and NorthWestern Corp. led our utilities exposure to outperform.
On the negative side, chemical providers A. Schulman, Inc. and OM Group, Inc. declined during the period as slowing growth and high valuations began to affect companies in the materials and processing sector. Also detracting from performance were paper producer P.H. Glatfelter Co. and aluminum producer Century Aluminum Co. The sleeve’s investment in Chiquita Brands International, Inc. toward the end of the reporting period resulted in a decline, despite the fact that the stock has been up strongly so far this year.
We handled the positioning for the core sleeve in the more active areas of the market with cautious expectations. We remained underweight relative to the benchmark in the financial services sector, reflecting our concern that the rising-interest-rate environment will affect the sector’s strongest sources of growth during the past several years: mortgages and refinancings. We maintained our underweight position in consumer discretionary, because we believe that consumer spending, which was largely fueled by the meteoric rise in property values and historically low interest rates, has passed and that consumers will rein in spending due to the mixed labor environment.
Our exposure in the technology sector was emphasized due to attractive valuations and improving fundamentals in areas such as device components, semiconductors, the Internet, and software and services. Oil prices continued to rise and defy expectations, increasing fears of profit erosion and inflation. Accordingly, we remain overweight within energy, especially with the high demand of the summer months upon us. We believe that, given the current high commodity prices, companies within the energy sector should continue to show strong earnings and cash flows through 2005.
Neuberger Berman, LLC — Small-Cap Value
Positive stock selection—particularly within industrials and health care—helped contribute to the small-cap value sleeve’s overall performance for the reporting period. Stock selection also played a positive role in overall performance, with particular emphasis on our overweight position in the energy sector. Primary detractors included the financials and information technology sectors.
We are maintaining our overweight position in energy, which we believe is justified due to supply/demand characteristics that should drive pricing power and robust profit growth. The remainder of the sleeve’s exposure, however, is to companies that we believe have demonstrated resiliency in the face of economic woes, and those that we think can steadily generate cash flows that could enhance shareholder returns, whether through dividends, share buybacks or additive value.
For much of the year’s first half, investors demonstrated risk aversion and a preference for higher-quality, lower-beta stocks. We think that investors should soon be willing to assume more risk, based on our belief that the Federal Reserve’s interest-rate increases are coming to an end. Still, investors’ unwillingness to take on additional market and asset risk has led us to remain relatively defensive in terms of portfolio allocation and company selection.
Waddell & Reed Investment Management Co. — Small-Cap Growth
Overall, the financial markets were restrained throughout the period, primarily due to rising short-term interest rates and increasing oil prices. Unfortunately, we do not anticipate those circumstances changing for the better in the near term. Investors’ hope for signs of a more tepid economy, which would allow the Federal Reserve to terminate its interest-rate-increasing campaign, have not materialized, although oil prices soared to historical highs.
The second quarter of 2005 can best be characterized by a rebound of some of the biggest losers from the previous quarter. Health care jumped 8.4% toward the end of the second quarter after a decline of 10.1% from January to June. Telecommunications and utilities also produced more than 10% returns after posting negative results in the first quarter. Energy was the exception, with strong positive returns throughout the six-month period. By contrast, technology remained sluggish during the same period and remains the worst sector from the 2002–2003 market trough.
The consumer discretionary sector contributed positively to the small-cap growth sleeve’s performance, while the consumer staples sector was the largest detractor. Given the volatility and cyclical nature of energy and technology, we have decided to remain underweight in the sectors. We believe the opportunistic nature of these groups is not in line with our larger emphasis on high, stable profitability. As we look ahead, our greater concentration remains in the health-care and consumer discretionary sectors.
Biggest contributors to the Fund’s performance during the reporting period came from the consumer discretionary and health care sectors. We saw strong returns from O’Reilly Automotive, Vail Resorts and Panera Bread Co., as well as from Cerner Corporation and American Healthways. One other notably strong performer came from the technology sector, where Blackboard Inc. brought strong returns. Primary laggards in the portfolio came from the consumer staples sector, where we feel our stock selection hurt performance. We also feel that performance was held back somewhat by our underweight positions in energy and autos and transportation.
Overall, our higher-quality, mainstream holdings continued to edge out lower-quality companies, defined by their negative earnings and
2
Table of Contents
GVIT Small Company Fund (continued)
smaller market-cap size. This is a significant point, given that in the recent past, some performance boosts resulted from a spurt of more speculative strategies rather than from higher-quality holdings that may be part of a longer-term strategy.
GMF — Small-Cap Value
During the reporting period, stock selection was positive in nearly all sectors, though the small-cap value sleeve underperformed the benchmark by a slight margin. Sector selection continues to play a lesser role in the success of the sleeve as we continue to focus on stock selection or stock-specific risk. Performance was particularly strong in the consumer staples, health-care, information technology and utilities sectors. Technology alone added more than 200 basis points to performance during the reporting period, despite the fact that the area generally has been a poor performer this year. Our focus on quality and fundamental improvement—an overall theme found in the sleeve—has been beneficial, particularly in this sector.
We benefited by staying away from the steep decline in the deep cyclical area, again preferring to focus on companies that have attractive long-term business plans versus companies that are simply short-term beneficiaries of rising commodity prices and economic activity. Stock selection was weaker in the consumer discretionary and industrials sector. Despite positive company-specific trends, consumer discretionary name Radio One, Inc. suffered due to the soft topline growth in the radio industry. Furthermore, industrial name American Woodmark Corp.’s stock suffered when the company missed earnings expectations. The company has since made up some of the ground it lost.
At this time last year, our style faced a challenging environment. However, beyond the challenges lay promise in factors that we believe could lead to better performance. While value has remained the “preferred” style, it is no longer the market of extremes it once was. At the height of value’s run, performance was driven primarily by deep-value or high-beta (risky) stocks. We believe that this past year marked the beginning of a multi-year cycle that may provide the potential for strong returns for both value and growth stocks, with less disparity between the styles. In the past, this so-called “core” market environment has been more conducive to strong stock selection for us.
Gartmore Global Partners — International Small Cap
May 31, 2005, marked the first-year anniversary of the international small cap sleeve’s transition to our Quantitative Strategies platform. Effective May 31, 2004, we changed the sleeve’s portfolio manager and investment strategy in order to achieve disciplined security selection through the use of our proprietary quantitative models, which rank the relative attractiveness of equities using qualitative measures of estimate revision, earnings quality, momentum and valuation. Our optimized portfolio construction process attempts to minimize forecasted risks with the aim of producing portfolios with superior risk and return characteristics. Prior to these changes, we employed an investment approach that emphasized the use of our proprietary fundamental—rather than quantitative—research, which was focused on identifying the potential for unexpected earnings growth through the analysis of individual company franchises within the context of industry and market dynamics.
At the country level, the strongest stock selection for the sleeve during the reporting period was realized within Japan, Switzerland and the United Kingdom. At the sector level, the sleeve enjoyed positive stock selection within industrials, financials and consumer discretionary. At the stock level, an out-of-benchmark position in AFG Arbonia-Forster-Holding AG, a Swiss manufacturer of kitchen appliances, contributed the most to the sleeve’s relative outperformance. This was followed closely by overweight positions in Sumitomo Heavy Industries, Ltd., a manufacturer of heavy electric machinery, and Koninklijke BAM Groep nv, a firm that offers residential and nonresidential construction services.
The sleeve’s strong relative performance was partially offset by weak stock selection within Belgium and Australia. The only weakness at the sector level was within telecommunications services. On a stock-specific basis, Japanese vehicle manufacturer Nissan Diesel Motor Co., Ltd. was the most pronounced underperformer, followed by French recycler CFF RECYCLING and Australian television network Ten Network Holdings Ltd.
We are extremely pleased with the sleeve’s performance during the first half of 2005. All investment guidelines are closely monitored on a daily basis, the sleeve has remained fully invested at all times, turnover has been kept to an absolute minimum, and we continue to pay meticulous attention to risk control. We believe that the outperformance realized during the first half could potentially continue through the end of 2005.
Portfolio Managers:
American Century Investment Management, Inc.: John Schniedwind, William Martin and Wilhelmine von Turk
Morgan Stanley Investment Management, Inc.: Dennis Lynch, David Cohen
The Dreyfus Corp.: Paul Kandel, Hillary Woods
Neuberger Berman LLC: Judith M. Vale, Rober D’Alelio
Waddell & Reed Investment Management Co.: Mark G. Seferovich, Kenneth McQuade
3
Table of Contents
GVIT Small Company Fund (continued)
GMF: Jeffery C. Petherick, Mary C. Champagne
Gartmore Global Partners: Michael J. Gleason, Luke A. Smith
Investing in mutual funds involves risk, including possible loss of principal.
There is no assurance that the investment objective of any fund will be achieved.
Small-company stocks have higher risks than the stocks of larger, more established companies and have significant short-term price volatility.
Russell 2000® Index: An unmanaged index that measures the performance of the stocks of small-capitalization U.S. companies; includes the smallest 2,000 U.S. companies in the Russell 3000® Index, which measures the performance of the largest 3,000 U.S. companies, based on market capitalization.
International investing involves additional risks, including currency fluctuations, differences in accounting standards, political instability and foreign regulations, all of which are magnified in emerging markets.
Lipper Analytical Services, Inc. is an industry research firm whose rankings are based on total return performance and do not reflect the effects of sales charges.
The Gartmore Variable Insurance Trust Funds are available only as sub-account investment options in certain variable insurance products. Accordingly, investors are unable to invest in shares of these funds outside of an insurance product. Performance information found herein reflects only the performance of these funds, and does not indicate the performance your sub-account may experience under your variable insurance contract. Performance returns assume reinvestment of all distributions. The investment return and principal value of an investment will fluctuate, so that an investor’s shares, when redeemed, may be worth more or less than their original cost. Index performance is provided for comparison purposes only; the indexes shown are unmanaged and do not reflect any fees or expenses. Investors cannot invest directly in market indexes. To obtain performance information about the sub-account option under your insurance contract that invests in one of these funds, please contact your variable insurance carrier. PAST PERFORMANCE DOES NOT GUARANTEE FUTURE RESULTS.
Commentary provided by Gartmore Global Investments. All opinions and estimates included in this report constitute Gartmore Global Investments’ judgment as of the date of this report and are subject to change without notice.
Investors should carefully consider a fund’s investment objectives, risks, fees, charges and expenses before investing any money. To obtain this and other information on Gartmore Variable Insurance Trusts, please contact your variable insurance contract provider or call 800-848-0920. Please read the Trust’s prospectus carefully before investing any money.
Gartmore Funds distributed by Gartmore Distribution Services, Inc., Member NASD. 1200 River Road, Suite 1000, Conshohocken, PA 19428.
4
Table of Contents
Fund Performance | GVIT Small Company Fund |
| Average | Annual Total Return1 |
(For Periods Ended June 30, 2005)
| Six months* | One year | Five years | Inception2 | |||||
| Class I3 | 3.07% | 14.85% | 6.19% | 13.75% | ||||
| Class II4 | 2.92% | 14.57% | 5.93% | 13.47% | ||||
| Class III4 | 3.07% | 14.84% | 6.20% | 13.76% | ||||
| Class IV4 | 3.07% | 14.85% | 6.19% | 13.75% |
| * | Not Annualized. |
| 1 | Not subject to any sales charges. |
| 2 | Fund commenced operations on October 23, 1995. |
| 3 | The existing shares of the Fund were designated Class I shares as of May 1, 2001. |
| 4 | These returns until the creation of the Class II shares (March 5, 2002), Class III shares (July 1, 2002) and Class IV shares (April 28, 2003) are based on the performance of the Class I shares of the Fund. Excluding the effect of any fee waivers or reimbursements, such prior performance is similar to what Class II, Class III and Class IV shares would have produced because all classes of shares invest in the same portfolio of securities. Class II shares’ annual returns have been restated to reflect the additional fees applicable to Class II shares and therefore are lower than those of Class I shares. For Class III shares, these returns do not reflect the short-term trading fees applicable to such shares; if these fees were reflected, the annual returns for Class III shares would have been lower. |
| Performance | of a $10,000 Investment |
Investment return and principal value will fluctuate, and when redeemed, shares may be worth more or less than original cost. Past performance is no guarantee of future results and does not reflect the deduction of taxes that a shareholder would pay on fund distributions or the redemption of fund shares. Investing in mutual funds involves market risk, including loss of principal. Performance returns assume the reinvestment of all distributions.
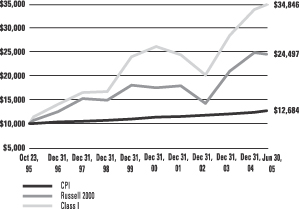
Comparative performance of $10,000 invested in Class I shares of the GVIT Small Company Fund, the Russell 2000 Index (Russell 2000)(a), and the Consumer Price Index (CPI)(b) since inception. Unlike, the Fund, the returns for these unmanaged indexes do not reflect any fees, expenses, or sales charges. Investors cannot invest directly in market indexes.
| (a) | The Russell 2000 is an unmanaged index that measures the performance of the stocks of small-capitalization U.S. companies; includes the smallest 2,000 U.S. companies in the Russell 3000® Index, which measures the performance of the largest 3,000 U.S. companies, based on market capitalization. |
| (b) | The CPI represents changes in prices of a basket of goods and services purchased for consumption by urban households. |
5
Table of Contents
Shareholder
Expense Example | GVIT Small Company Fund |
As a shareholder of the Fund, you incur two types of costs: (1) transaction costs, including sales charges (loads) paid on purchase payments and redemption fees; and (2) ongoing costs, including investment advisory fees, administration fees, distribution fees and other Fund expenses. The examples below are intended to help you understand your ongoing costs (in dollars) of investing in the Fund and to compare these costs with the ongoing costs of investing in other mutual funds. Per SEC requirements, the examples assume that you had a $1,000 investment in the Class at the beginning of the reporting period, January 1, 2005, and continued to hold your shares at the end of the reporting period, June 30, 2005.
Actual Expenses
For each Class of the Fund in the table below, the first line provides information about actual account values and actual expenses. You may use the information in this line, together with the amount you invested, to estimate the expenses that you paid over the period. Simply divide your account value by $1,000 (for example, an $8,600 account value divided by $1,000 = 8.6), then multiply the result by the number in the first line of each Class under the heading entitled “Expenses Paid During Period” to estimate the expenses you paid on your account during the period.
Hypothetical Example for Comparison Purposes
The second line of each Class in the table below provides information about hypothetical account values and hypothetical expenses based on the Class’ actual expense ratio and an assumed rate of return of 5% per year before expenses, which is not the Class’ actual return. The hypothetical account values and expenses may not be used to estimate the actual ending account balance or expenses you paid for the period. You may use this information to compare the ongoing costs of investing in the Class of the Fund and other funds. To do so, compare this 5% hypothetical example with the 5% hypothetical examples that appear in the shareholder reports of the other funds.
Please note that the expenses shown in the table are meant to highlight your ongoing costs only and do not reflect any transaction costs, such as sales charges (loads) or redemption fees. Therefore, the second line for each Class in the table is useful in comparing ongoing costs only, and will not help you determine the relative total costs of owning different funds. In addition, if these transaction costs were included, your costs would have been higher. The examples also assume all dividends and distributions have been reinvested.
| Beginning Account Value, January 1, 2005 | Ending Account Value, June 30, 2005 | Expenses Paid During Period* | Annualized Expense Ratio* | ||||||||||
| Small Company Fund | |||||||||||||
Class I | Actual | $ | 1,000 | $ | 1,031 | $ | 5.99 | 1.19% | |||||
| Hypothetical1 | $ | 1,000 | $ | 1,019 | $ | 5.97 | 1.19% | ||||||
Class II | Actual | $ | 1,000 | $ | 1,029 | $ | 7.25 | 1.44% | |||||
| Hypothetical1 | $ | 1,000 | $ | 1,018 | $ | 7.23 | 1.44% | ||||||
Class III | Actual | $ | 1,000 | $ | 1,031 | $ | 6.04 | 1.20% | |||||
| Hypothetical1 | $ | 1,000 | $ | 1,019 | $ | 6.03 | 1.20% | ||||||
Class IV | Actual | $ | 1,000 | $ | 1,031 | $ | 5.99 | 1.19% | |||||
| Hypothetical1 | $ | 1,000 | $ | 1,019 | $ | 5.97 | 1.19% | ||||||
| * | Expenses are equal to the Fund’s annualized expense ratio multiplied by the average account value over the period multiplied by 181/365 (to reflect the one-half year period). The expense ratio presented represents a six month, annualized ratio in accordance with SEC guidelines. |
| 1 | Represents the hypothetical 5% return before expenses. |
6
Table of Contents
Portfolio Summary
(June 30, 2005) | GVIT Small Company Fund |
The SEC adopted a requirement that Funds present their portfolio holdings in a table, chart or graph format in their annual and semiannual reports to shareholders, whether or not a statement of investments is utilized. The following tables, which present portfolio holdings as a percentage of net assets, are provided in compliance with this requirement.
| Asset Allocation | ||
| Common Stocks | 97.0% | |
| Commercial Paper | 0.3% | |
| Mutual Fund | 0.1% | |
| Other assets in excess of liabilities | 2.6% | |
| 100.0% | ||
| Top Holdings | ||
| Corporate Executive Board Co. | 0.8% | |
| Cal Dive International, Inc. | 0.7% | |
| Southwestern Energy Co. | 0.7% | |
| Dade Behring Holdings, Inc. | 0.6% | |
| Factset Research Systems, Inc. | 0.6% | |
| IDEXX Laboratories, Inc. | 0.6% | |
| Amsurg Corp. | 0.6% | |
| R.H. Donnelley Corp. | 0.5% | |
| VCA Antech, Inc. | 0.5% | |
| Cerner Corp. | 0.5% | |
| Other Holdings | 93.9% | |
| 100.0% | ||
| Top Industries | ||
| Oil & Gas | 5.9% | |
| Retail | 5.5% | |
| Financial Services | 4.3% | |
| Healthcare | 3.5% | |
| Financial | 3.5% | |
| Building & Construction | 3.3% | |
| Machinery | 3.2% | |
| Medical Products | 2.9% | |
| Insurance | 2.7% | |
| Transportation | 2.4% | |
| Other Industries | 62.8% | |
| 100.0% | ||
7
Table of Contents
GARTMORE VARIABLE INSURANCE TRUST
GVIT SMALL COMPANY FUND
Statement of Investments — June 30, 2005 (Unaudited)
| Shares or Principal Amount | Value | ||||
| COMMON STOCKS (97.0%) | |||||
| AUSTRALIA (1.2%) | |||||
| Banks (0.0%) | |||||
| Adelaide Bank Ltd. (c) | 22,353 | $ | 194,602 | ||
| Building & Construction (0.0%) | |||||
| United Group Ltd. (c) | 56,829 | 415,650 | |||
| Clothing (0.1%) | |||||
| Ansell Ltd. (c) | 92,687 | 705,776 | |||
| Coal (0.0%) | |||||
| Excel Coal Ltd. (c) | 72,901 | 413,508 | |||
| Conglomerates (0.1%) | |||||
| CSR Ltd. (c) | 458,621 | 932,005 | |||
| Engineering (0.1%) | |||||
| Downer Edi Ltd. (c) | 219,275 | 885,290 | |||
| Equipment Leasing (0.0%) | |||||
| Coates Hire Ltd. (c) | 102,417 | 370,666 | |||
| Finance (0.3%) | |||||
| Australian Stock Exchange Ltd. (c) | 90,718 | 1,592,779 | |||
| Perpetual Trustees Australia Ltd. (c) | 11,130 | 484,906 | |||
| Sfe Corp. Ltd. (c) | 16,251 | 131,316 | |||
| 2,209,001 | |||||
| Food (0.0%) | |||||
| Macquarie Countrywide Trust (c) | 129,576 | 188,636 | |||
| Metals & Mining (0.0%) | |||||
| Iluka Resources Ltd. (c) | 72,295 | 412,639 | |||
| Multimedia (0.1%) | |||||
| News & Media Ltd. (c) | 135,984 | 530,481 | |||
| Oil & Gas (0.1%) | |||||
| Australian Pipeline Trust (c) | 53,385 | 152,386 | |||
| Oil Search Ltd. (b) (c) | 369,503 | 859,997 | |||
| 1,012,383 | |||||
| Publishing (0.1%) | |||||
| John Fairfax Holdings Ltd. (c) | 143,645 | 468,966 | |||
| Recycling (0.0%) | |||||
| Sims Group Ltd. (c) | 20,347 | 228,764 | |||
| Retail (0.1%) | |||||
| Colorado Group Ltd. (c) | 172,115 | 595,869 | |||
| David Jones Ltd. (c) | 290,036 | 414,015 | |||
| 1,009,884 | |||||
| Shares or Principal Amount | Value | ||||
| COMMON STOCKS (continued) | |||||
| AUSTRALIA (continued) | |||||
| Television (0.2%) | |||||
| Ten Network Holdings Ltd. (c) | 415,857 | $ | 1,120,110 | ||
| 11,098,361 | |||||
| AUSTRIA (0.1%) | |||||
| Steel Manufacturing & Products (0.1%) | |||||
| Boehler-Uddeholm (c) | 4,653 | 614,822 | |||
| BELGIUM (0.1%) | |||||
| Chemicals (0.0%) | |||||
| Tessenderlo Chemie NV (c) | 6,558 | 213,315 | |||
| Metals (0.0%) | |||||
| Umicore (c) | 3,724 | 298,121 | |||
| Ventures Business Trust (0.1%) | |||||
| GINV NV (c) | 9,630 | 441,685 | |||
| 953,121 | |||||
| BERMUDA (0.3%) | |||||
| Insurance (0.2%) | |||||
| Scottish Annuity & Life Holdings Ltd. (c) | 60,400 | 1,464,096 | |||
| Transportation (0.1%) | |||||
| Jinhui Shipping and Transportation Ltd. (b) (c) | 320,073 | 1,234,617 | |||
| 2,698,713 | |||||
| CHINA (0.5%) | |||||
| Audio & Video Products (0.0%) | |||||
| TCL Multimedia Technology Holdings Ltd. (c) | 706,000 | 130,973 | |||
| Electronics (0.1%) | |||||
| VTech Holdings Ltd. (c) | 214,000 | 499,871 | |||
| Financial Services (0.1%) | |||||
| Guoco Group Ltd. (c) | 56,000 | 575,727 | |||
| Internet Content (0.0%) | |||||
| Netease.com, Inc. ADR (b) (c) | 18,800 | 1,073,669 | |||
| Real Estate (0.1%) | |||||
| China Overseas Land & Investment Ltd. (c) | 1,166,000 | 214,933 | |||
| China State Construction International Holdings Ltd. (b) (c) | 64,777 | 15,907 | |||
| Midland Realty Holdings Ltd. (c) | 506,000 | 281,390 | |||
| 512,230 | |||||
8
Table of Contents
GARTMORE VARIABLE INSURANCE TRUST
GVIT SMALL COMPANY FUND
Statement of Investments — June 30, 2005 (Unaudited) (continued)
| Shares or Principal Amount | Value | ||||
| COMMON STOCKS (continued) | |||||
| CHINA (continued) | |||||
| Semiconductors (0.0%) | |||||
| ASM Pacific Technology Ltd. (c) | 175,000 | $ | 814,945 | ||
| Telephone Communications (0.1%) | |||||
| SmarTone Telecommunications Holdings Ltd. (c) | 528,000 | 580,989 | |||
| Transportation (0.1%) | |||||
| Orient Overseas International (c) | 108,900 | 474,633 | |||
| 4,663,037 | |||||
| DENMARK (0.2%) | |||||
| Brewery (0.0%) | |||||
| Royal Unibrew AS (c) | 1,965 | 159,115 | |||
| Building & Construction (0.1%) | |||||
| Sjaelso Gruppen AS (c) | 2,752 | 538,014 | |||
| Financial Services (0.1%) | |||||
| Simcorp AS (c) | 7,118 | 641,773 | |||
| Telephone Communications (0.0%) | |||||
| GN Store Nord AS (c) | 26,206 | 295,889 | |||
| Transportation & Services (0.0%) | |||||
| Dampskibsselskabet Torm AS (c) | 8,294 | 446,562 | |||
| 2,081,353 | |||||
| FINLAND (0.4%) | |||||
| Electronics (0.0%) | |||||
| Perlos Oyj (c) | 18,915 | 152,245 | |||
| Financial Services (0.2%) | |||||
| OKO Osuuspankkien Oyj (c) | 85,922 | 1,400,697 | |||
| Steel (0.1%) | |||||
| Rautaruukki Oyj (c) | 60,789 | 907,188 | |||
| Telecommunication Equipment (0.1%) | |||||
| Elcoteq Network Corp. (c) | 39,548 | 775,813 | |||
| 3,235,943 | |||||
| FRANCE (0.8%) | |||||
| Building & Construction (0.0%) | |||||
| Kaufman & Broad SA (c) | 4,394 | 265,808 | |||
| Computer Services (0.1%) | |||||
| Alten (b) (c) | 25,739 | 651,530 | |||
| Groupe Steria SCA (c) | 8,237 | 321,468 | |||
| Iliad SA (c) | 3,729 | 139,362 | |||
| 1,112,360 | |||||
| Shares or Principal Amount | Value | ||||
| COMMON STOCKS (continued) | |||||
| FRANCE (continued) | |||||
| Electrical Equipment (0.0%) | |||||
| Nexans SA (c) | 3,205 | $ | 129,742 | ||
| Entertainment Software (0.0%) | |||||
| Ubi Soft Entertainment SA (b) (c) | 3,170 | 158,097 | |||
| Food (0.2%) | |||||
| Elior (c) | 93,745 | 1,118,791 | |||
| Leisure & Entertainment (0.0%) | |||||
| Trigano SA (c) | 2,934 | 255,128 | |||
| Medical Providers (0.1%) | |||||
| Generale de Sante (c) | 27,873 | 680,974 | |||
| Metals (0.1%) | |||||
| CFF Recycling (c) | 28,998 | 609,897 | |||
| Publishing (0.1%) | |||||
| Spir Communication (c) | 3,418 | 731,315 | |||
| Real Estate (0.0%) | |||||
| Pierre & Vacances (c) | 1,875 | 138,006 | |||
| Software (0.1%) | |||||
| Cie Generale de Geophysique SA (b) (c) | 9,726 | 823,127 | |||
| Steel (0.1%) | |||||
| Vallourec SA (c) | 2,925 | 841,378 | |||
| 6,864,623 | |||||
| GERMANY (0.6%) | |||||
| Computer Services (0.0%) | |||||
| SAP Systems Integration AG (c) | 5,225 | 172,504 | |||
| Diversified (0.1%) | |||||
| K&S AG (c) | 16,311 | 900,206 | |||
| Electronics (0.0%) | |||||
| Techem AG (b) (c) | 10,106 | 427,682 | |||
| Financial Services (0.0%) | |||||
| MPC Muenchmeyer Petersen Capital AG (c) | 4,884 | 307,045 | |||
| Medical-Drugs (0.1%) | |||||
| Stada Arzneimittel AG (c) | 18,169 | 662,990 | |||
| Metal Processors & Fabrication (0.2%) | |||||
| Norddeutsche Affinerie AG (c) | 54,593 | 1,151,343 | |||
| Retail (0.0%) | |||||
| Douglas Holdings (c) | 5,742 | 208,200 | |||
9
Table of Contents
GARTMORE VARIABLE INSURANCE TRUST
GVIT SMALL COMPANY FUND
Statement of Investments — June 30, 2005 (Unaudited) (continued)
| Shares or Principal Amount | Value | ||||
| COMMON STOCKS (continued) | |||||
| GERMANY (continued) | |||||
| Telecommunications (0.2%) | |||||
| Mobilcom AG (c) | 37,096 | $ | 796,041 | ||
| Telegate AG (b) (c) | 16,691 | 315,634 | |||
| 1,111,675 | |||||
| 4,941,645 | |||||
| GREECE (0.1%) | |||||
| Entertainment (0.1%) | |||||
| Intralot SA (c) | 77,850 | 1,191,249 | |||
| IRELAND (0.2%) | |||||
| Building & Construction (0.1%) | |||||
| McInerney Holdings PLC (b) (c) | 71,132 | 742,213 | |||
| Food Products (0.0%) | |||||
| Fyffes PLC (c) | 130,979 | 391,668 | |||
| Gambling (0.1%) | |||||
| Paddy Power PLC (c) | 57,595 | 983,591 | |||
| 2,117,472 | |||||
| ITALY (0.4%) | |||||
| Building Materials (0.0%) | |||||
| Cementir (c) | 35,349 | 169,562 | |||
| Computers (0.0%) | |||||
| Datamat Spa (c) | 15,749 | 182,277 | |||
| Food & Beverage (0.1%) | |||||
| Cremonini SPA (c) | 248,509 | 702,534 | |||
| Real Estate (0.1%) | |||||
| Pirelli & C. Real Estate SPA (c) | 11,050 | 661,966 | |||
| Textile Products (0.2%) | |||||
| Marzotto (Gaetano) & Figli SPA (c) | 57,261 | 1,488,615 | |||
| 3,204,954 | |||||
| JAPAN (4.3%) | |||||
| Aluminum (0.0%) | |||||
| SANKYO-TATEYAMA HO NPV (c) | 67,000 | 165,819 | |||
| Auto & Auto Parts (0.4%) | |||||
| Isuzu Motors Ltd. (c) | 96,000 | 255,684 | |||
| Keihin Corp., (c) | 75,700 | 1,236,426 | |||
| Nissan Diesel Motor Co., Ltd. (c) | 331,000 | 1,295,517 | |||
| Nissan Shatai Co., Ltd. (c) | 59,000 | 403,498 | |||
| Nissin Kogyo Co., Ltd. (c) | 7,600 | 280,796 | |||
| Shares or Principal Amount | Value | ||||
| COMMON STOCKS (continued) | |||||
| JAPAN (continued) | |||||
| Auto & Auto Parts (continued) | |||||
| Press Kogyo Co., Ltd. (c) | 142,000 | $ | 458,158 | ||
| 3,930,079 | |||||
| Banks (0.2%) | |||||
| Keiyo Bank Ltd. (c) | 101,000 | 514,348 | |||
| Sanyo Electric Credit Co., Ltd. (c) | 6,100 | 122,547 | |||
| Shinki Co., Ltd. (c) | 86,000 | 836,788 | |||
| 1,473,683 | |||||
| Building & Construction (0.1%) | |||||
| Bunka Shutter Co., Ltd. (c) | 42,000 | 226,362 | |||
| Sumitomo Osaka Cement Co., Ltd. (c) | 98,000 | 259,366 | |||
| Toda Corp. (c) | 29,000 | 123,494 | |||
| 609,222 | |||||
| Business Services (0.0%) | |||||
| Secom Techno Service Co., Ltd. (c) | 10,500 | 339,457 | |||
| Chemicals (0.1%) | |||||
| Mec Co., Ltd. (c) | 23,000 | 320,658 | |||
| Tohcello Co., Ltd. (c) | 38,000 | 239,520 | |||
| Tokuyama Corp., (c) | 32,000 | 226,811 | |||
| Toyo Tire & Rubber Co., Ltd. (c) | 119,000 | 462,354 | |||
| 1,249,343 | |||||
| Computer Software & Services (0.2%) | |||||
| Cac Corp. (c) | 13,900 | 153,371 | |||
| Daiwabo Information System Co., Ltd. (c) | 10,500 | 167,306 | |||
| Otsuka Shokai Co., Ltd. (c) | 8,400 | 709,659 | |||
| Trans Cosmos, Inc. (c) | 8,900 | 350,768 | |||
| 1,381,104 | |||||
| Consulting Services (0.1%) | |||||
| K.K. DaVinci Advisors (b) (c) | 207 | 588,988 | |||
| Pacific Management Corp. (b) (c) | 76 | 306,769 | |||
| 895,757 | |||||
| Distribution (0.1%) | |||||
| Telewave, Inc. (b) (c) | 158 | 778,819 | |||
| Drugs (0.1%) | |||||
| Santen Pharmaceutical Co., Ltd. (c) | 55,200 | 1,253,379 | |||
10
Table of Contents
GARTMORE VARIABLE INSURANCE TRUST
GVIT SMALL COMPANY FUND
Statement of Investments — June 30, 2005 (Unaudited) (continued)
| Shares or Principal Amount | Value | ||||
| COMMON STOCKS (continued) | |||||
| JAPAN (continued) | |||||
| Electrical & Electronic (0.7%) | |||||
| Dainippon Screen Manufacturing Co. (c) | 81,000 | $ | 542,363 | ||
| Eizo Nanao Corp. (c) | 20,300 | 612,502 | |||
| Hosiden Corp. (c) | 13,300 | 134,154 | |||
| Kenwood Corp. (c) | 111,000 | 189,997 | |||
| KOA Corp. (c) | 77,100 | 611,940 | |||
| Shibaura Mechatronics Corp. (c) | 44,000 | 396,671 | |||
| Shinko Electric Industries Co., Ltd. (c) | 10,700 | 416,930 | |||
| Star Micronics (c) | 90,000 | 971,994 | |||
| Toshiba TEC (c) | 139,000 | 614,084 | |||
| Yamatake Corp. (c) | 31,200 | 514,910 | |||
| 5,005,545 | |||||
| Food (0.2%) | |||||
| Kirin Beverage Corp. (c) | 13,400 | 302,446 | |||
| Plenus Co., Ltd. (c) | 10,100 | 356,066 | |||
| Toyo Suisan Kaisha Ltd. (c) | 45,000 | 702,616 | |||
| Warabeya Nichiyo Co., Ltd. (b) (c) | 30,800 | 552,277 | |||
| 1,913,405 | |||||
| Gambling (0.0%) | |||||
| Mars Engineering Corp. (c) | 5,400 | 137,190 | |||
| Industrial Gases (0.0%) | |||||
| Air Water, Inc. (c) | 17,000 | 125,017 | |||
| Investment Companies (0.1%) | |||||
| Kenedix, Inc. (b) (c) | 358 | 1,003,774 | |||
| Leasing (0.1%) | |||||
| Sumisho Lease Co., Ltd. (c) | 15,600 | 542,449 | |||
| Machinery (0.5%) | |||||
| Daifuku Co., Ltd. (c) | 45,000 | 424,463 | |||
| Fuji Electric Co., Ltd. (c) | 91,000 | 275,699 | |||
| Nabtesco Corp. (c) | 177,000 | 1,193,715 | |||
| Sumitomo Heavy Industries Ltd. (c) | 244,000 | 1,167,886 | |||
| Toshiba Machine Co., Ltd. (c) | 77,000 | 433,325 | |||
| Tsugami Corp. (c) | 119,000 | 572,221 | |||
| 4,067,309 | |||||
| Manufacturing (0.2%) | |||||
| Amano Corp. (c) | 80,000 | 950,740 | |||
| Glory Ltd. (c) | 70,900 | 1,133,643 | |||
| 2,084,383 | |||||
| Shares or Principal Amount | Value | ||||
| COMMON STOCKS (continued) | |||||
| JAPAN (continued) | |||||
| Medical Instruments (0.2%) | |||||
| Nihon Kohden Corp. (c) | 90,000 | $ | 1,364,827 | ||
| Topcon Corp. (c) | 27,000 | 466,110 | |||
| 1,830,937 | |||||
| Medical—Drugs (0.2%) | |||||
| Eiken Chemical Co., Ltd. (c) | 92,000 | 1,028,560 | |||
| Rohto Pharmaceutical Co., Ltd. (c) | 33,000 | 428,209 | |||
| Tsuruha Co., Ltd. (c) | 21,100 | 670,985 | |||
| 2,127,754 | |||||
| Metals (0.2%) | |||||
| Chuo Denki Kogyo Co., Ltd. (c) | 29,000 | 165,949 | |||
| Osaka Steel Co., Ltd. (c) | 80,300 | 987,401 | |||
| Pacific Metals Co., Ltd. (c) | 56,000 | 240,539 | |||
| Ryobi Ltd. (c) | 143,000 | 590,329 | |||
| 1,984,218 | |||||
| Networking Products (0.0%) | |||||
| NextCom K.K. (c) | 88 | 407,131 | |||
| Real Estate (0.1%) | |||||
| Aeon Mall Co., Ltd. (c) | 14,600 | 512,025 | |||
| Hoosiers Corp. (b) (c) | 59 | 237,227 | |||
| Tokyu Livable, Inc. (c) | 13,900 | 565,873 | |||
| 1,315,125 | |||||
| Retail (0.3%) | |||||
| Aoki International Co., Ltd. (c) | 24,000 | 296,754 | |||
| Hankyu Department Stores, Inc. (c) | 33,000 | 208,376 | |||
| Okuwa Co., Ltd. (c) | 49,000 | 596,837 | |||
| Ryohin Keikaku Co., Ltd. (c) | 9,500 | 467,967 | |||
| Sundrug Co., Ltd. (c) | 23,500 | 923,997 | |||
| 2,493,931 | |||||
| Telecommunications (0.1%) | |||||
| New Japan Radio Co., Ltd. (c) | 73,000 | 635,488 | |||
| Textile Products (0.0%) | |||||
| Nitto Boseki Co., Ltd. (c) | 152,000 | 315,095 | |||
| Transportation (0.1%) | |||||
| Nippon Konpo Unyu Soko Co., Ltd. (c) | 47,000 | 505,210 | |||
| Sankyu, Inc. (c) | 43,000 | 127,630 | |||
| 632,840 | |||||
| 38,698,253 | |||||
11
Table of Contents
GARTMORE VARIABLE INSURANCE TRUST
GVIT SMALL COMPANY FUND
Statement of Investments — June 30, 2005 (Unaudited) (continued)
| Shares or Principal Amount | Value | ||||
| COMMON STOCKS (continued) | |||||
| LUXEMBURG (0.0%) | |||||
| Oil & Gas (0.0%) | |||||
| Stolt Offshore SA (b) (c) | 37,952 | $ | 344,242 | ||
| NETHERLANDS (0.6%) | |||||
| Building & Construction (0.2%) | |||||
| Heijmans NV CVA (c) | 26,515 | 1,243,232 | |||
| Business Services (0.1%) | |||||
| United Services Group NV (c) | 26,906 | 712,625 | |||
| Computer Software (0.0%) | |||||
| Unit 4 Agresso NV (b) (c) | 25,042 | 382,504 | |||
| Packaging (0.0%) | |||||
| Buhrmann NV (c) | 22,576 | 222,323 | |||
| Real Estate Development (0.1%) | |||||
| Koninklijke Bam Groep NV (c) | 18,348 | 1,214,505 | |||
| Storage & Warehousing (0.1%) | |||||
| Koninklijke Vopak NV (c) | 29,876 | 753,705 | |||
| Tools (0.1%) | |||||
| Stork NV (c) | 22,202 | 919,205 | |||
| 5,448,099 | |||||
| NEW ZEALAND (0.1%) | |||||
| Building Materials (0.1%) | |||||
| Fletcher Building Ltd. (c) | 134,034 | 641,868 | |||
| NORWAY (0.3%) | |||||
| Banking & Finance (0.2%) | |||||
| Aktiv Kapital ASA (c) | 26,951 | 411,610 | |||
| Sparebanken Nord-Norge (c) | 17,640 | 331,691 | |||
| Sparebanken Rogaland (c) | 15,343 | 436,705 | |||
| 1,180,006 | |||||
| Computers Integrated Systems (0.0%) | |||||
| Visma ASA (c) | 10,525 | 127,291 | |||
| Construction (0.1%) | |||||
| Aker Yards AS (c) | 5,800 | 221,814 | |||
| Veidekke ASA (c) | 12,800 | 292,560 | |||
| 514,374 | |||||
| Oil & Gas (0.0%) | |||||
| Prosafe ASA (c) | 14,727 | 440,904 | |||
| Printing & Publishing (0.0%) | |||||
| Schibsted ASA (c) | 7,729 | 212,445 | |||
| Shares or Principal Amount | Value | ||||
| COMMON STOCKS (continued) | |||||
| NORWAY (continued) | |||||
| Retail (0.0%) | |||||
Expert ASA (c) | 19,200 | $ | 207,793 | ||
| 2,682,813 | |||||
| PORTUGAL (0.0%) | |||||
| Food Distributors, Supermarkets & Wholesalers (0.0%) | |||||
Jeronimo Martins, SA (c) | 13,400 | 192,363 | |||
| SINGAPORE (0.4%) | |||||
| Computer Hardware Manufacturing (0.0%) | |||||
| MFS Technology Ltd. (c) | 322,000 | 117,876 | |||
| Diversified Products (0.0%) | |||||
| First Engineering Ltd. (c) | 214,000 | 155,650 | |||
| Oil & Gas (0.1%) | |||||
| Singapore Petroleum Co., Ltd. (c) | 195,000 | 573,301 | |||
| Real Estate (0.1%) | |||||
| CapitaMall Trust (c) | 172,000 | 242,684 | |||
| Keppel Land Ltd. (c) | 393,000 | 581,977 | |||
| 824,661 | |||||
| Research & Development (0.0%) | |||||
| Sembcorp Industries Ltd. (c) | 257,340 | 406,619 | |||
| Services (0.0%) | |||||
| Singapore Airport Terminal Services Ltd. (c) | 172,000 | 231,909 | |||
| Transportation (0.2%) | |||||
| Neptune Orient Lines (c) | 412,000 | 922,443 | |||
| 3,232,459 | |||||
| SPAIN (0.1%) | |||||
| Airlines (0.0%) | |||||
| Iberia Lineas Aereas de Espana SA (c) | 79,777 | 228,028 | |||
| Financial Services (0.1%) | |||||
| Inmobiliaria Colonial SA (c) | 5,413 | 288,344 | |||
| 516,372 | |||||
| SWEDEN (0.6%) | |||||
| Auto—Retail (0.0%) | |||||
| Bilia AB (c) | 13,240 | 221,755 | |||
| Building & Construction (0.1%) | |||||
| JM AB (c) | 21,129 | 682,952 | |||
| Computer Services (0.0%) | |||||
| HiQ International AB (c) | 37,472 | 176,772 | |||
12
Table of Contents
GARTMORE VARIABLE INSURANCE TRUST
GVIT SMALL COMPANY FUND
Statement of Investments — June 30, 2005 (Unaudited) (continued)
| Shares or Principal Amount | Value | ||||
| COMMON STOCKS (continued) | |||||
| SWEDEN (continued) | |||||
| Electronic Equipment (0.0%) | |||||
| Gunnebo AB (c) | 31,600 | $ | 291,711 | ||
| Finance Services (0.1%) | |||||
| D. Carnegie & Co. AB (c) | 74,530 | 880,799 | |||
| Home Furnishing (0.1%) | |||||
| Nobia AB (c) | 66,011 | 958,421 | |||
| Medical Providers (0.1%) | |||||
| Capio AB (b) (c) | 40,002 | 588,464 | |||
| Metal Fabricate & Hardware (0.0%) | |||||
| SSAB — Series A (c) | 10,340 | 237,696 | |||
| Real Estate (0.2%) | |||||
| Kungsleden AB (c) | 54,132 | 1,424,818 | |||
| 5,463,388 | |||||
| SWITZERLAND (0.5%) | |||||
| Appliances (0.1%) | |||||
| AFG Arbonia-Forster Holding AG (c) | 3,856 | 1,073,126 | |||
| Building & Construction (0.3%) | |||||
| Sika Finanz AG (c) | 2,273 | 1,416,562 | |||
| Manufacturing (0.0%) | |||||
| Georg Fischer AG (b) (c) | 1,186 | 362,140 | |||
| Retail (0.1%) | |||||
| Charles Voegele Holding AG (c) | 15,739 | 1,001,817 | |||
| Telecommunications (0.0%) | |||||
| Ascom Holding AG (c) | 14,069 | 184,234 | |||
| 4,037,879 | |||||
| UNITED KINGDOM (2.4%) | |||||
| Auto (0.1%) | |||||
| European Motor Holdings PLC (c) | 62,316 | 300,196 | |||
| Inchcape PLC (c) | 27,743 | 1,020,250 | |||
| 1,320,446 | |||||
| Automotive Rental (0.1%) | |||||
| Arriva PLC (c) | 113,635 | 1,107,610 | |||
| Banking & Insurance (0.1%) | |||||
| Paragon Group (c) | 81,891 | 620,987 | |||
| Brewery (0.1%) | |||||
| Wolverhampton & Dudley Breweries PLC (c) | 44,415 | 916,826 | |||
| Shares or Principal Amount | Value | ||||
| COMMON STOCKS (continued) | |||||
| UNITED KINGDOM (continued) | |||||
| Building & Construction (0.3%) | |||||
| Carillion PLC (c) | 72,204 | $ | 364,423 | ||
| Kier Group PLC (c) | 58,154 | 954,095 | |||
| SIG PLC (c) | 76,396 | 864,236 | |||
| 2,182,754 | |||||
| Construction (0.1%) | |||||
| Bovis Homes Group PLC (c) | 66,295 | 842,573 | |||
| Morgan Sindall PLC (c) | 16,190 | 221,258 | |||
| 1,063,831 | |||||
| Consulting Services (0.1%) | |||||
| Atkins (WS) PLC (c) | 59,555 | 724,401 | |||
| Savills PLC (c) | 24,933 | 299,015 | |||
| 1,023,416 | |||||
| Consumer Products (0.2%) | |||||
| Body Shop International PLC (c) | 73,930 | 302,922 | |||
| Cookson Group PLC (b) (c) | 43,961 | 239,658 | |||
| De La Rue PLC (c) | 42,583 | 309,229 | |||
| Mcbride PLC (c) | 233,482 | 627,122 | |||
| 1,478,931 | |||||
| Electrical & Electronic (0.0%) | |||||
| TT Electronics PLC (c) | 62,771 | 204,167 | |||
| Electronic Components (0.0%) | |||||
| Renishaw PLC (c) | 19,948 | 262,393 | |||
| Engineering (0.1%) | |||||
| Barratt Developments PLC (c) | 58,315 | 747,909 | |||
| Financial Services (0.2%) | |||||
| Amlin PLC (c) | 375,122 | 1,212,920 | |||
| Brit Insurance Holdings PLC (c) | 526,146 | 832,010 | |||
| 2,044,930 | |||||
| Food (0.0%) | |||||
| Greggs PLC (c) | 4,954 | 407,894 | |||
| Food Diversified (0.2%) | |||||
| Dairy Crest Group PLC (b) (c) | 125,411 | 1,117,848 | |||
| Devro PLC (c) | 173,394 | 400,929 | |||
| Northern Foods PLC (c) | 43,074 | 121,844 | |||
| 1,640,621 | |||||
| Insurance (0.1%) | |||||
| Hiscox PLC (c) | 160,085 | 470,650 | |||
| Medical Supplies (0.0%) | |||||
| Cambridge Antibody Technology Group PLC (b) (c) | 14,501 | 166,792 | |||
13
Table of Contents
GARTMORE VARIABLE INSURANCE TRUST
GVIT SMALL COMPANY FUND
Statement of Investments — June 30, 2005 (Unaudited) (continued)
| Shares or Principal Amount | Value | ||||
| COMMON STOCKS (continued) | |||||
| UNITED KINGDOM (continued) | |||||
| Restaurants (0.0%) | |||||
| Restaurant Group PLC (c) | 63,743 | $ | 155,545 | ||
| Retail (0.4%) | |||||
| Children’s Place Retail Stores, Inc. (b) (c) | 36,174 | 1,688,242 | |||
| House of Fraser PLC (c) | 144,301 | 280,248 | |||
| Kesa Electricals PLC (c) | 88,200 | 440,476 | |||
| Woolworths Group PLC (c) | 359,745 | 238,583 | |||
| 2,647,549 | |||||
| Storage/Warehousing (0.0%) | |||||
| Wincanton PLC (c) | 51,755 | 230,608 | |||
| Transportation (0.1%) | |||||
| Go-Ahead Group PLC (c) | 29,278 | 709,176 | |||
| Travel Services (0.1%) | |||||
| First Choice Holidays PLC (c) | 284,337 | 972,191 | |||
| Utilities (0.1%) | |||||
| Northumbrian Water Group PLC (c) | 297,619 | 1,195,828 | |||
| 21,571,054 | |||||
| UNITED STATES (82.8%) | |||||
| Advertising & Marketing (0.9%) | |||||
| Arbitron, Inc. | 39,420 | 1,691,118 | |||
| Catalina Marketing Corp. | 9,800 | 249,018 | |||
| Getty Images, Inc. (b) | 50,400 | 3,742,704 | |||
| Harte-Hanks, Inc. | 67,300 | 2,000,829 | |||
| Ventiv Health, Inc. (b) | 5,454 | 105,153 | |||
| 7,788,822 | |||||
| Aerospace & Defense (1.0%) | |||||
| AAR Corp. (b) | 62,000 | 974,020 | |||
| Armor Holdings, Inc. (b) | 19,000 | 752,590 | |||
| Curtiss-Wright Corp. | 12,700 | 685,165 | |||
| DRS Technologies, Inc. | 13,100 | 671,768 | |||
| Esterline Technologies Corp. (b) | 30,563 | 1,224,965 | |||
| FLIR Systems, Inc. (b) | 51,900 | 1,548,696 | |||
| Innovative Solutions & Support, Inc. (b) | 8,424 | 282,794 | |||
| MTC Technologies, Inc. (b) | 34,100 | 1,255,903 | |||
| Teledyne Technologies, Inc. (b) | 22,709 | 739,859 | |||
| Triumph Group, Inc. (b) | 22,500 | 782,100 | |||
| 8,917,860 | |||||
| Shares or Principal Amount | Value | ||||
| COMMON STOCKS (continued) | |||||
| UNITED STATES (continued) | |||||
| Airlines (0.3%) | |||||
| Alaska Air Group, Inc. (b) | 41,300 | $ | 1,228,675 | ||
| Expressjet Holdings, Inc. | 56,600 | 481,666 | |||
| Mesa Air Group (b) | 10,828 | 72,656 | |||
| Pinnacle Airlines Corp. (b) | 43,800 | 376,242 | |||
| Republic Airways Holdings, Inc. (b) | 65,000 | 939,250 | |||
| 3,098,489 | |||||
| Aluminum (0.1%) | |||||
| Century Aluminum Co. (b) | 22,100 | 450,840 | |||
| Apparel (0.1%) | |||||
| Guess, Inc. (b) | 10,926 | 181,153 | |||
| Hartmarx Corp. (b) | 22,852 | 230,120 | |||
| K-Swiss, Inc. | 19,949 | 645,150 | |||
| 1,056,423 | |||||
| Applications Software (0.3%) | |||||
| Salesforce.com, Inc. (b) | 122,400 | 2,506,752 | |||
| Auction House (0.6%) | |||||
| Ritchie Brothers Auctioneers, Inc. | 106,900 | 4,120,995 | |||
| Sotheby’s Holdings, Inc. (b) | 60,905 | 834,399 | |||
| 4,955,394 | |||||
| Auto & Auto Parts (1.9%) | |||||
| Aftermarket Technology Corp. (b) | 7,994 | 139,335 | |||
| American Axle & Manufacturing Holdings, Inc. | 44,300 | 1,119,461 | |||
| Clarcor, Inc. | 82,200 | 2,404,350 | |||
| Commercial Vehicle Group, Inc. (b) | 9,650 | 171,288 | |||
| Gentex Corp. | 181,200 | 3,297,840 | |||
| LKQ Corp. (b) | 77,528 | 2,104,885 | |||
| Noble International Ltd. | 1,237 | 29,131 | |||
| O’Reilly Automotive, Inc. (b) | 133,380 | 3,976,058 | |||
| Oshkosh Truck Corp. | 12,870 | 1,007,464 | |||
| Tenneco Automotive, Inc. (b) | 36,337 | 604,648 | |||
| Terex Corp. (b) | 19,700 | 776,180 | |||
| TRW Automotive Holdings Corp. (b) | 46,965 | 1,151,112 | |||
| 16,781,752 | |||||
| Banking (1.8%) | |||||
| Accredited Home Lenders (b) | 18,000 | 792,000 | |||
| Amcore Financial, Inc. | 21,711 | 648,725 | |||
14
Table of Contents
GARTMORE VARIABLE INSURANCE TRUST
GVIT SMALL COMPANY FUND
Statement of Investments — June 30, 2005 (Unaudited) (continued)
| Shares or Principal Amount | Value | ||||
| COMMON STOCKS (continued) | |||||
| UNITED STATES (continued) | |||||
| Banking (continued) | |||||
| Amgey Bancorp, Inc. | 37,500 | $ | 839,250 | ||
| Anchor Bancorp Wisconsin, Inc. | 1,981 | 59,945 | |||
| BancFirst Corp. | 2,699 | 234,786 | |||
| Beverly Hills Bancorp, Inc. | 2,200 | 24,090 | |||
| BOK Financial Corp. | 21,792 | 1,005,047 | |||
| Boston Private Financial Holdings, Inc. | 31,400 | 791,280 | |||
| Center Financial Corp. | 6,772 | 168,149 | |||
| City Holding Co. | 6,100 | 222,772 | |||
| Columbia Banking System, Inc. | 43 | 1,059 | |||
| Community Trust Bancorp, Inc. | 715 | 23,395 | |||
| Corus Bankshares, Inc. | 12,427 | 689,574 | |||
| Criimi Mac, Inc. (b) | 1,300 | 28,405 | |||
| Dime Community Bancshares | 82,250 | 1,250,200 | |||
| First Citizens BancShares, Inc. | 1,550 | 224,053 | |||
| First Community Bancorp | 506 | 24,035 | |||
| First Financial Holdings, Inc. | 800 | 23,928 | |||
| First Republic Bancorp, Inc. | 2,164 | 76,454 | |||
| Firstbank Corp. | 61,522 | 2,470,107 | |||
| FirstFed Financial Corp. (b) | 24,543 | 1,463,008 | |||
| Franklin Bank Corp. (b) | 66,500 | 1,247,540 | |||
| International Bancshares Corp. | 6,647 | 188,044 | |||
| MAF Bancorp, Inc. | 16,000 | 682,080 | |||
| Old Second Bancorp, Inc. | 3,863 | 112,375 | |||
| Oriental Financial Group, Inc. | 50,830 | 775,666 | |||
| Pacific Capital Bancorp | 16,775 | 622,017 | |||
| Southwest Bancorp, Inc. | 1,911 | 39,137 | |||
| SVB Financial Group (b) | 1,581 | 75,730 | |||
| Texas Capital Bancshares, Inc. (b) | 38,000 | 750,120 | |||
| West Coast Bancorp Oregon | 896 | 21,871 | |||
| WFS Financial, Inc. (b) | 3,574 | 181,238 | |||
| Wilmington Trust Corp. | 3,638 | 131,004 | |||
| Wilshire Bancorp, Inc. | 5,660 | 81,108 | |||
| 15,968,192 | |||||
| Broadcasting (0.3%) | |||||
| CKX, Inc. (b) | 111,300 | 1,431,875 | |||
| Radio One, Inc. (b) | 104,600 | 1,335,742 | |||
| 2,767,617 | |||||
| Brokerage Services (0.2%) | |||||
| Neenah Paper, Inc. | 48,500 | 1,502,045 | |||
| Building & Construction (2.1%) | |||||
| Chicago Bridge & Iron Co. | 106,200 | 2,427,732 | |||
| Eagle Materials, Inc. | 12,400 | 1,122,076 | |||
| Shares or Principal Amount | Value | ||||
| COMMON STOCKS (continued) | |||||
| UNITED STATES (continued) | |||||
| Building & Construction (continued) | |||||
| Florida Rock Industries, Inc. | 21,800 | $ | 1,599,030 | ||
| Louisiana-Pacific Corp. | 61,790 | 1,518,798 | |||
| LSI Industries, Inc. | 4,800 | 66,912 | |||
| Meritage Homes Corp. (b) | 14,700 | 1,168,650 | |||
| NVR, Inc. (b) | 4,274 | 3,461,940 | |||
| Perini Corp. (b) | 25,152 | 412,996 | |||
| Simpson Manufacturing Co., Inc. | 61,200 | 1,869,660 | |||
| Standard-Pacific Corp. | 2,000 | 175,900 | |||
| USG Corp. (b) | 65,463 | 2,782,178 | |||
| Washington Group International, Inc. (b) | 47,000 | 2,402,640 | |||
| 19,008,512 | |||||
| Chemicals (0.6%) | |||||
| A. Schulman, Inc. | 41,500 | 742,435 | |||
| Albemarle Corp. | 23,200 | 846,104 | |||
| FMC Corp. (b) | 21,426 | 1,202,856 | |||
| Octel Corp. (b) | 27,300 | 491,400 | |||
| Pioneer Companies, Inc. (b) | 4,200 | 92,358 | |||
| Terra Industries, Inc. (b) | 275,958 | 1,879,274 | |||
| W.R. Grace & Co. (b) | 17,319 | 134,915 | |||
| 5,389,342 | |||||
| Coal (0.1%) | |||||
| Foundation Coal Holdings, Inc. | 35,500 | 920,870 | |||
| Commercial Services (0.9%) | |||||
| Administaff, Inc. | 2,886 | 68,571 | |||
| Alliance Data Systems Corp. (b) | 17,477 | 708,867 | |||
| Coinstar, Inc. (b) | 54,500 | 1,236,605 | |||
| Collectors Universe, Inc. (b) | 1,211 | 21,217 | |||
| Costar Group, Inc. (b) | 48,400 | 2,110,240 | |||
| Deluxe Corp. | 12,833 | 521,020 | |||
| Macquarie Infrastructure Co. Trust | 75,600 | 2,145,528 | |||
| Peoplesupport, Inc. (b) | 89,154 | 813,084 | |||
| Prepaid Legal Services, Inc. | 2,112 | 94,301 | |||
| Priceline.com, Inc. (b) | 33,300 | 776,889 | |||
| 8,496,322 | |||||
| Communications (0.6%) | |||||
| Emmis Communications Corp., Class A (b) | 6,880 | 121,570 | |||
| R.H. Donnelley Corp. (b) | 77,690 | 4,815,226 | |||
| Ubiquitel, Inc. (b) | 106,240 | 866,918 | |||
| 5,803,714 | |||||
15
Table of Contents
GARTMORE VARIABLE INSURANCE TRUST
GVIT SMALL COMPANY FUND
Statement of Investments — June 30, 2005 (Unaudited) (continued)
| Shares or Principal Amount | Value | ||||
| COMMON STOCKS (continued) | |||||
| UNITED STATES (continued) | |||||
| Computer Service (2.3%) | |||||
| Acxiom Corp. | 41,381 | $ | 864,035 | ||
| Adeza Biomedical Corp. (b) | 45,800 | 777,684 | |||
| Agilysys, Inc. | 93,315 | 1,465,046 | |||
| Anteon International Corp. (b) | 77,200 | 3,521,864 | |||
| Cerner Corp. (b) | 63,806 | 4,336,894 | |||
| Earthlink, Inc. (b) | 193,515 | 1,675,840 | |||
| Maxtor Corp. (b) | 338,900 | 1,762,280 | |||
| Micros Systems, Inc. (b) | 80,160 | 3,587,160 | |||
| MTS Systems | 39,397 | 1,322,951 | |||
| Phoenix Technology Ltd. (b) | 15,408 | 119,874 | |||
| Sykes Enterprises, Inc. (b) | 110,800 | 1,050,384 | |||
| 20,484,012 | |||||
| Computer Software (2.2%) | |||||
| Autodesk, Inc. | 10,704 | 367,896 | |||
| Avid Technology, Inc. (b) | 75,800 | 4,038,625 | |||
| Docucorp International, Inc. (b) | 5,652 | 41,542 | |||
| EPIQ Systems, Inc. (b) | 65,820 | 1,076,815 | |||
| Gamestop Corp. (b) | 9,227 | 275,887 | |||
| Hutchinson Technology, Inc. (b) | 25,362 | 976,691 | |||
| MicroStrategy, Inc. (b) | 35,000 | 1,856,400 | |||
| NETGEAR, Inc. (b) | 68,155 | 1,267,683 | |||
| Parametric Technology Corp. (b) | 309,984 | 1,977,698 | |||
| Scientific Games Corp. (b) | 102,400 | 2,757,632 | |||
| Shanda Interactive Entertainment Ltd. (b) | 44,200 | 1,626,118 | |||
| Sybase, Inc. (b) | 13,832 | 253,817 | |||
| Western Digital Corp. (b) | 180,636 | 2,424,135 | |||
| Wind River Systems, Inc. (b) | 61,500 | 964,320 | |||
| 19,905,259 | |||||
| Consulting Services (0.4%) | |||||
| Geo Group, Inc. (b) | 9,405 | 235,595 | |||
| The Advisory Board Co. (b) | 76,700 | 3,738,358 | |||
| 3,973,953 | |||||
| Consumer Goods & Services (1.7%) | |||||
| AptarGroup, Inc. | 72,000 | 3,657,600 | |||
| Church & Dwight Co., Inc. | 111,700 | 4,043,540 | |||
| Matthews International Corp., Class A | 65,900 | 2,567,464 | |||
| Scotts Company (The), Class A (b) | 32,600 | 2,321,446 | |||
| Wolverine World Wide, Inc. | 7,063 | 169,583 | |||
| Yankee Candle Co., Inc. | 68,100 | 2,186,010 | |||
| 14,945,643 | |||||
| Shares or Principal Amount | Value | ||||
| COMMON STOCKS (continued) | |||||
| UNITED STATES (continued) | |||||
| Containers (0.2%) | |||||
| Crown Holdings, Inc. (b) | 55,000 | $ | 782,650 | ||
| Silgan Holdings, Inc. | 15,595 | 877,063 | |||
| 1,659,713 | |||||
| Cosmetics (0.5%) | |||||
| Alberto-Culver Co., Class B | 50,400 | 2,183,832 | |||
| Chattem, Inc. (b) | 36,956 | 1,529,978 | |||
| Elizabeth Arden, Inc. (b) | 41,300 | 966,007 | |||
| 4,679,817 | |||||
| Data Processing & Reproduction (0.3%) | |||||
| CCC Information Services Group, Inc. (b) | 26,645 | 638,148 | |||
| Fair, Issac and Co., Inc. | 44,975 | 1,641,587 | |||
| infoUSA, Inc. | 2,978 | 34,843 | |||
| 2,314,578 | |||||
| Defense (0.4%) | |||||
| Engineered Support Systems, Inc. | 78,037 | 2,796,066 | |||
| Mantech International Corp., Class A (b) | 38,000 | 1,179,520 | |||
| 3,975,586 | |||||
| Diagnostic Equipment (0.3%) | |||||
| Biosite Diagnostics, Inc. (b) | 22,149 | 1,217,974 | |||
| Diagnostic Products Corp. | 29,000 | 1,372,570 | |||
| 2,590,544 | |||||
| Distribution (0.3%) | |||||
| Building Materials Holding Corp. | 9,895 | 685,625 | |||
| Northwest Natural Gas Co. | 24,900 | 952,176 | |||
| NuCo2, Inc. (b) | 39,600 | 1,016,532 | |||
| Transmontaigne, Inc. (b) | 36,784 | 386,232 | |||
| 3,040,565 | |||||
| Diversified Manufacturing Operations (0.1%) | |||||
| Esco Technologies, Inc. (b) | 684 | 68,947 | |||
| Teleflex, Inc. | 8,543 | 507,198 | |||
| 576,145 | |||||
| Education (0.9%) | |||||
| Blackboard, Inc. (b) | 131,900 | 3,155,048 | |||
| ITT Educational Services, Inc. (b) | 78,000 | 4,166,760 | |||
| Skillsoft PLC (b) | 158,200 | 545,790 | |||
| 7,867,598 | |||||
16
Table of Contents
GARTMORE VARIABLE INSURANCE TRUST
GVIT SMALL COMPANY FUND
Statement of Investments — June 30, 2005 (Unaudited) (continued)
| Shares or Principal Amount | Value | ||||
| COMMON STOCKS (continued) | |||||
| UNITED STATES (continued) | |||||
| Electric Integrated (0.1%) | |||||
| Duquesne Light Holdings, Inc. | 29,700 | $ | 554,796 | ||
| Electronic Components (0.5%) | |||||
| Amphenol Corp., Class A | 8,158 | 327,707 | |||
| Ansoft Corp. (b) | 29,192 | 705,279 | |||
| Arrow Electronics, Inc. (b) | 63,844 | 1,734,002 | |||
| Avnet, Inc. (b) | 19,289 | 434,581 | |||
| Badger Meter | 852 | 35,188 | |||
| Itron, Inc. (b) | 23,688 | 1,058,380 | |||
| Stoneridge, Inc. (b) | 21,783 | 143,768 | |||
| 4,438,905 | |||||
| Electronics (1.1%) | |||||
| American Science & Engineering, Inc. (b) | 11,639 | 516,306 | |||
| Ametek, Inc. | 2,841 | 118,896 | |||
| Brady Corp., Class A | 68,400 | 2,120,400 | |||
| Cree Research, Inc. (b) | 121,600 | 3,097,151 | |||
| El Paso Electric Co. (b) | 8,986 | 183,764 | |||
| Lecroy Corp. (b) | 27,802 | 382,278 | |||
| LoJack Corp. (b) | 2,607 | 45,779 | |||
| Mettler Toledo International, Inc. (b) | 17,374 | 809,281 | |||
| Varian Semiconductor Equipment Associates, Inc. (b) | 25,000 | 925,000 | |||
| WESCO International, Inc. (b) | 40,805 | 1,280,461 | |||
| 9,479,316 | |||||
| Energy (0.3%) | |||||
| CMS Energy Corp. (b) | 95,020 | 1,431,001 | |||
| Exide Technologies | 41,500 | 201,275 | |||
| Sierra Pacific Resources | 98,000 | 1,220,100 | |||
| 2,852,376 | |||||
| Engineering Services (0.2%) | |||||
| McDermott International, Inc. (b) | 30,605 | 642,705 | |||
| Michael Baker Corp. (b) | 40,459 | 722,598 | |||
| 1,365,303 | |||||
| Entertainment (1.0%) | |||||
| Image Entertainment, Inc. (b) | 5,503 | 15,463 | |||
| Lions Gate Entertainment Corp. (b) | 176,100 | 1,806,786 | |||
| LodgeNet Entertainment Corp. (b) | 50,494 | 837,695 | |||
| Netflix, Inc. (b) | 68,100 | 1,117,521 | |||
| Shares or Principal Amount | Value | ||||
| COMMON STOCKS (continued) | |||||
| UNITED STATES (continued) | |||||
| Entertainment (continued) | |||||
| Speedway Motorsports, Inc. (b) | 14,900 | $ | 544,744 | ||
| Take-Two Interactive Software, Inc. (b) | 106,410 | 2,708,135 | |||
| THQ, Inc. (b) | 52,400 | 1,533,748 | |||
| 8,564,092 | |||||
| Environmental Services (0.3%) | |||||
| Clean Harbors, Inc. (b) | 22,534 | 488,537 | |||
| Stericycle, Inc. (b) | 51,200 | 2,576,384 | |||
| 3,064,921 | |||||
| Financial (3.5%) | |||||
| Affiliated Managers Group, Inc. (b) | 35,600 | 2,432,548 | |||
| Alabama National Bankcorp | 10,400 | 679,848 | |||
| American Capital Strategies Ltd. | 26,700 | 964,137 | |||
| Central Pacific Financial Corp. | 120,600 | 4,293,360 | |||
| Colonial Bancgroup, Inc. | 47,200 | 1,041,232 | |||
| East-West Bancorp, Inc. | 87,500 | 2,939,125 | |||
| Financial Federal Corp. | 92,700 | 3,581,928 | |||
| First Midwest Bancorp, Inc. | 23,900 | 840,563 | |||
| Greenhill & Co., Inc. | 83,074 | 3,365,328 | |||
| IndyMac Bancorp, Inc. | 48,500 | 1,975,405 | |||
| Investment Technology Group, Inc. (b) | 54,567 | 1,146,998 | |||
| Mid-State Bancshares | 30,900 | 858,093 | |||
| Morningstar, Inc. (b) | 46,500 | 1,308,975 | |||
| Nasdaq Stock Market, Inc. (b) | 13,447 | 253,610 | |||
| OceanFirst Financial Corp. | 1,100 | 24,761 | |||
| Prosperity Bancshares, Inc. | 40,000 | 1,144,400 | |||
| Texas Regional Bancshares, Inc., Class A | 82,055 | 2,501,036 | |||
| Westamerica Bankcorp. | 37,700 | 1,990,937 | |||
| 31,342,284 | |||||
| Financial Services (3.6%) | |||||
| Ace Cash Express, Inc. (b) | 7,602 | 194,307 | |||
| Advanta Corp., Class B | 59,269 | 1,669,015 | |||
| Bank of Hawaii Corp. | 35,823 | 1,818,017 | |||
| Bankrate, Inc. (b) | 18,820 | 379,035 | |||
| City National Corp. | 41,372 | 2,966,786 | |||
| CompuCredit Corp. (b) | 14,144 | 484,856 | |||
| Corporate Executive Board Co. | 89,200 | 6,987,035 | |||
| Cullen/Frost Bankers, Inc. | 4,802 | 228,815 | |||
| Downey Financial Corp. | 42,558 | 3,115,246 | |||
| Factset Research Systems, Inc. | 146,500 | 5,250,560 | |||
17
Table of Contents
GARTMORE VARIABLE INSURANCE TRUST
GVIT SMALL COMPANY FUND
Statement of Investments — June 30, 2005 (Unaudited) (continued)
| Shares or Principal Amount | Value | ||||
| COMMON STOCKS (continued) | |||||
| UNITED STATES (continued) | |||||
| Financial Services (continued) | |||||
| Interactive Data Corp. | 49,200 | $ | 1,022,376 | ||
| Nelnet, Inc. (b) | 19,131 | 636,488 | |||
| Protective Life Corp. | 43,335 | 1,829,604 | |||
| R & G Finanical Corp., Class B | 43,700 | 773,053 | |||
| SWS Group, Inc. | 2,000 | 34,360 | |||
| Triad Guaranty, Inc. (b) | 8,530 | 429,827 | |||
| Westcorp, Inc. | 75,061 | 3,934,698 | |||
| World Acceptance (b) | 1,337 | 40,177 | |||
| 31,794,255 | |||||
| Food & Beverage (1.3%) | |||||
| AFC Enterprises, Inc. | 111,250 | 1,466,275 | |||
| Chiquita Brands International, Inc. | 69,987 | 1,921,843 | |||
| M & F Worldwide Corp. (b) | 17,991 | 240,360 | |||
| Peet’s Coffee & Tea, Inc. (b) | 45,100 | 1,490,104 | |||
| Pepsiamericas, Inc. | 1,407 | 36,104 | |||
| Pilgrim’s Pride Corp. | 78,097 | 2,665,450 | |||
| The J.M. Smucker Co. | 53,600 | 2,515,984 | |||
| Treehouse Foods, Inc. (b) | 55,500 | 1,582,305 | |||
| 11,918,425 | |||||
| Food Distributors, Supermarkets & Wholesalers (0.7%) | |||||
| Gold Kist, Inc. (b) | 28,208 | 608,729 | |||
| Nasch-Finch Co. | 41,771 | 1,534,667 | |||
| Sanderson Farms, Inc. | 20,100 | 913,344 | |||
| Seaboard Corp. | 1,291 | 2,148,223 | |||
| United Natural Foods, Inc. (b) | 28,000 | 850,360 | |||
| 6,055,323 | |||||
| Gaming & Hotels (1.2%) | |||||
| Alliance Gaming Corp. (b) | 45,700 | 640,714 | |||
| Global Payment, Inc. | 13,500 | 915,300 | |||
| Kerzner International Ltd. (b) | 49,100 | 2,796,245 | |||
| Lakes Entertainment, Inc. (b) | 55,600 | 856,240 | |||
| Penn National Gaming, Inc. (b) | 87,100 | 3,179,150 | |||
| Shuffle Master, Inc. (b) | 71,050 | 1,991,532 | |||
| 10,379,181 | |||||
| General Obligation (0.2%) | |||||
| Provide Commerce (b) | 66,500 | 1,435,735 | |||
| Healthcare (3.5%) | |||||
| American Healthways, Inc. (b) | 89,300 | 3,774,711 | |||
| Apria Healthcare Group, Inc. (b) | 30,000 | 1,039,200 | |||
| Beverly Enterprises, Inc. (b) | 78,500 | 1,000,090 | |||
| Charles River Laboratories International, Inc. (b) | 35,582 | 1,716,832 | |||
| Shares or Principal Amount | Value | ||||
| COMMON STOCKS (continued) | |||||
| UNITED STATES (continued) | |||||
| Healthcare (continued) | |||||
| Datascope Corp. | 8,800 | $ | 293,480 | ||
| Eclipsys Corp. (b) | 15,400 | 216,678 | |||
| Haemonetics Corp. (b) | 36,147 | 1,469,014 | |||
| Henry Schein, Inc. (b) | 28,000 | 1,162,560 | |||
| IDEXX Laboratories, Inc. (b) | 81,552 | 5,083,135 | |||
| K-V Pharmaceutical Co. (b) | 158,050 | 2,647,338 | |||
| LifePoint Hospitals, Inc. (b) | 20,500 | 1,035,660 | |||
| Magellan Health Services, Inc. (b) | 41,958 | 1,481,537 | |||
| Mentor Corp. | 100,600 | 4,172,887 | |||
| Respironics, Inc. (b) | 86,445 | 3,121,529 | |||
| Serologicals Corp. (b) | 29,500 | 626,875 | |||
| Techne Corp. (b) | 39,772 | 1,825,933 | |||
| Vertrue, Inc. (b) | 43,917 | 1,711,006 | |||
| 32,378,465 | |||||
| Healthcare Services (1.1%) | |||||
| American Retirement Corp. (b) | 7,910 | 115,644 | |||
| Amsurg Corp. (b) | 180,216 | 4,990,181 | |||
| Dendrite International, Inc. (b) | 196,100 | 2,706,180 | |||
| Genesis Healthcare Corp. (b) | 39,811 | 1,842,453 | |||
| Sierra Health Services, Inc. (b) | 3,425 | 244,751 | |||
| 9,899,209 | |||||
| Home Furnishings (0.9%) | |||||
| American Woodmark Corp. | 32,800 | 984,328 | |||
| Bassett Furniture Industries, Inc. | 52,000 | 980,720 | |||
| Genlyte Group, Inc. (b) | 18,800 | 916,312 | |||
| Hooker Furniture Corp. | 28,900 | 504,883 | |||
| SCP Pool Corp. | 84,000 | 2,947,561 | |||
| Stanley Furniture Co., Inc. | 199 | 4,887 | |||
| Toro Co. | 48,525 | 1,873,550 | |||
| 8,212,241 | |||||
| Hotels, Restaurants & Leisure (0.6%) | |||||
| Boykin Lodging Co. (b) | 1,200 | 16,080 | |||
| Great Wolf Resorts, Inc. (b) | 96,786 | 1,978,306 | |||
| LA Quinta Corp. (b) | 36,800 | 343,344 | |||
| Lasalle Hotel Properties | 40,300 | 1,322,243 | |||
| Orient Express Hotels Ltd. | 40,000 | 1,266,800 | |||
| 4,926,773 | |||||
| Human Resources (0.1%) | |||||
| Labor Ready, Inc. (b) | 48,081 | 1,120,768 | |||
| Industrial (0.5%) | |||||
| Actuant Corp. (b) | 41,300 | 1,979,921 | |||
| Agnico-Eagle Mines Ltd. | 60,500 | 762,300 | |||
18
Table of Contents
GARTMORE VARIABLE INSURANCE TRUST
GVIT SMALL COMPANY FUND
Statement of Investments — June 30, 2005 (Unaudited) (continued)
| Shares or Principal Amount | Value | ||||
| COMMON STOCKS (continued) | |||||
| UNITED STATES (continued) | |||||
| Industrial (continued) | |||||
| Airgas, Inc. | 37,900 | $ | 934,993 | ||
| Blount International, Inc. (b) | 25,514 | 425,829 | |||
| Gerber Scientific, Inc. (b) | 24,708 | 171,968 | |||
| Titan International, Inc. | 6,000 | 83,880 | |||
| 4,358,891 | |||||
| Insurance (2.4%) | |||||
| American Financial Group, Inc. | 30,057 | 1,007,511 | |||
| AmerUs Group Co. | 6,993 | 336,014 | |||
| Arch Capital Group Ltd. (b) | 24,817 | 1,118,006 | |||
| Argonaut Group, Inc. (b) | 3,600 | 83,124 | |||
| Aspen Insurance Holdings Ltd. | 86,488 | 2,383,608 | |||
| Brown & Brown, Inc. | 25,800 | 1,159,452 | |||
| Endurance Specialty Holdings Ltd. | 49,119 | 1,857,681 | |||
| First American Corp. | 74,619 | 2,995,206 | |||
| HCC Insurance Holdings, Inc. | 20,100 | 761,187 | |||
| Hilb, Rogal & Hamilton Co. | 26,300 | 904,720 | |||
| LandAmerica Financial Group, Inc. | 2,003 | 118,918 | |||
| Markel Corp. (b) | 3,075 | 1,042,425 | |||
| Max Re Capital Ltd. | 36,583 | 837,751 | |||
| Montpelier Re Holdings Ltd. | 17,700 | 612,066 | |||
| Safety Insurance Group, Inc. | 39,376 | 1,329,334 | |||
| Selective Insurance Group, Inc. | 5,824 | 288,579 | |||
| Tower Group, Inc. | 88,500 | 1,383,255 | |||
| United Fire & Casualty Co. | 24,978 | 1,109,523 | |||
| Zenith National Insurance Corp. | 33,684 | 2,285,796 | |||
| 21,614,156 | |||||
| Internet Content (1.0%) | |||||
| Checkfree Corp. (b) | 98,185 | 3,344,181 | |||
| CNET Networks, Inc. (b) | 108,000 | 1,267,920 | |||
| Intermix Media, Inc. (b) | 93,400 | 781,758 | |||
| Overstock.com, Inc. (b) | 37,900 | 1,349,240 | |||
| SINA Corp. (b) | 37,400 | 1,043,460 | |||
| Valueclick, Inc. (b) | 81,100 | 999,963 | |||
| 8,786,522 | |||||
| Internet Services (0.2%) | |||||
| Akamai Technologies, Inc. (b) | 123,300 | 1,618,929 | |||
| Riverstone Networks, Inc. (b) | 1 | 1 | |||
| Trizetto Group, Inc. (b) | 9,245 | 129,522 | |||
| 1,748,452 | |||||
| Investment Companies (0.2%) | |||||
| Calamos Asset Management, Inc. | 66,782 | 1,819,142 | |||
| Shares or Principal Amount | Value | ||||
| COMMON STOCKS (continued) | |||||
| UNITED STATES (continued) | |||||
| Leisure (1.3%) | |||||
| 4Kids Entertainment, Inc. (b) | 10,738 | $ | 213,471 | ||
| Gaylord Entertainment (b) | 70,400 | 3,272,896 | |||
| Planetout, Inc. (b) | 44,200 | 385,424 | |||
| Steinway Musical Instruments, Inc. (b) | 10,232 | 300,412 | |||
| Sunterra Corp. (b) | 10,800 | 175,068 | |||
| Vail Resorts, Inc. (b) | 130,712 | 3,673,007 | |||
| WMS Industries, Inc. (b) | 103,200 | 3,483,000 | |||
| 11,503,278 | |||||
| Machinery (2.7%) | |||||
| AGCO Corp. (b) | 46,000 | 879,520 | |||
| Applied Industrial Technology, Inc. | 57,424 | 1,854,221 | |||
| Bucyrus International Inc., Class A | 30,600 | 1,162,188 | |||
| Circor International, Inc. | 1,464 | 36,117 | |||
| Cognex Corp. | 39,900 | 1,044,981 | |||
| Commercial Metals Co. | 27,800 | 662,196 | |||
| Cummins Engine, Inc. | 24,713 | 1,843,837 | |||
| Dionex Corp. (b) | 71,000 | 3,096,309 | |||
| Flow International Corp. (b) | 10,034 | 64,117 | |||
| Gardner Denver, Inc. (b) | 17,685 | 620,390 | |||
| JLG Industries, Inc. | 44,400 | 1,220,112 | |||
| Joy Global, Inc. | 82,500 | 2,771,175 | |||
| Kennametal, Inc. | 34,795 | 1,595,351 | |||
| Lufkin Industries, Inc. | 1,342 | 48,285 | |||
| Middleby Corp. (b) | 16,200 | 856,332 | |||
| Roper Industries, Inc. | 21,400 | 1,527,318 | |||
| Tecumseh Products Co., Class A | 34,400 | 943,936 | |||
| Thomas Industries, Inc. | 23,200 | 927,072 | |||
| Wabtec Corp. | 45,000 | 966,600 | |||
| Zebra Technologies Corp. (b) | 38,247 | 1,674,836 | |||
| 23,794,893 | |||||
| Manufacturing (0.1%) | |||||
| Lone Star Technologies, Inc. (b) | 21,352 | 971,516 | |||
| Materials (0.0%) | |||||
| Sun Hydraulics Corp. | 3,315 | 120,633 | |||
| Wolverine Tube, Inc. (b) | 38,700 | 227,169 | |||
| 347,802 | |||||
| Medical Equipment & Supplies (2.0%) | |||||
| Advanced Medical Optics, Inc. (b) | 59,947 | 2,382,893 | |||
| Alliance Imaging, Inc. (b) | 36,478 | 381,560 | |||
19
Table of Contents
GARTMORE VARIABLE INSURANCE TRUST
GVIT SMALL COMPANY FUND
Statement of Investments — June 30, 2005 (Unaudited) (continued)
| Shares or Principal Amount | Value | ||||
| COMMON STOCKS (continued) | |||||
| UNITED STATES (continued) | |||||
| Medical Equipment & Supplies (continued) | |||||
| Allscripts Healthcare Solutions, Inc. (b) | 158,600 | $ | 2,634,347 | ||
| Amedisys, Inc. (b) | 15,500 | 570,090 | |||
| American Medical Systems Holdings, Inc. (b) | 71,700 | 1,480,605 | |||
| Cephalon, Inc. (b) | 31,877 | 1,269,023 | |||
| Conmed Corp. (b) | 27,412 | 843,467 | |||
| Kyphon Inc. (b) | 36,400 | 1,266,356 | |||
| Per-Se Technologies, Inc. (b) | 35,158 | 739,021 | |||
| Sybron Dental Specialties, Inc. (b) | 67,700 | 2,546,874 | |||
| Unifirst Corp. | 45,134 | 1,829,732 | |||
| Young Innovations, Inc. | 44,300 | 1,653,719 | |||
| 17,597,687 | |||||
| Medical Products (2.9%) | |||||
| Anika Therapeutics, Inc. (b) | 13,542 | 155,598 | |||
| Animas Corp. (b) | 59,400 | 1,196,910 | |||
| Arrow International, Inc. | 20,000 | 638,000 | |||
| Bausch & Lomb, Inc. | 7,273 | 603,659 | |||
| Bio-Rad Laboratories, Inc., Class A (b) | 14,800 | 876,308 | |||
| CNS, Inc. | 13,086 | 299,015 | |||
| Dade Behring Holdings, Inc. | 81,823 | 5,319,312 | |||
| Edwards Lifesciences Corp. (b) | 14,086 | 605,980 | |||
| Gen-Probe, Inc. (b) | 30,500 | 1,105,015 | |||
| Healthtronics, Inc. (b) | 210,070 | 2,728,808 | |||
| Hologic, Inc. (b) | 2,558 | 101,681 | |||
| ICU Medical, Inc. (b) | 65,100 | 2,094,267 | |||
| Impax Laboratories, Inc. (b) | 101,500 | 1,593,550 | |||
| Invitrogen Corp. (b) | 945 | 78,709 | |||
| Martek Biosciences Corp. (b) | 64,600 | 2,451,570 | |||
| MGI Pharma, Inc. (b) | 27,800 | 604,928 | |||
| Millipore Corp. (b) | 10,033 | 569,172 | |||
| Nutraceutical International Corp. (b) | 19,840 | 264,864 | |||
| Owens & Minor, Inc. | 29,739 | 962,057 | |||
| PSS World Medical, Inc. (b) | 68,000 | 846,600 | |||
| Surmodics, Inc. (b) | 9,796 | 424,853 | |||
| Telik, Inc. (b) | 51,500 | 837,390 | |||
| USANA Health Sciences, Inc. (b) | 5,094 | 215,476 | |||
| Viasys Healthcare, Inc. | 35,100 | 792,909 | |||
| Vital Signs, Inc. | 3,452 | 149,541 | |||
| 25,516,172 | |||||
| Shares or Principal Amount | Value | ||||
| COMMON STOCKS (continued) | |||||
| UNITED STATES (continued) | |||||
| Medical Providers (0.2%) | |||||
| Humana, Inc. (b) | 167 | $ | 6,637 | ||
| Kindred Healthcare, Inc. (b) | 52,878 | 2,094,497 | |||
| 2,101,134 | |||||
| Metals (0.4%) | |||||
| Allegheny Technologies, Inc. | 38,600 | 851,516 | |||
| Cleveland Cliffs, Inc. (b) | 9,600 | 554,496 | |||
| Quanex Corp. | 43,493 | 2,305,564 | |||
| 3,711,576 | |||||
| Multi-Media (0.1%) | |||||
| Cumulus Media, Inc. (b) | 42,600 | 501,828 | |||
| Sinclair Broadcast Group, Inc., Class A | 23,994 | 217,866 | |||
| 719,694 | |||||
| Office Equipment & Supplies (0.5%) | |||||
| CompX International, Inc. (b) | 2,866 | 48,006 | |||
| Ennis Business Forms, Inc. | 44,700 | 809,964 | |||
| Global Imaging Systems, Inc. (b) (b) | 3,060 | 97,492 | |||
| John H. Harland, Co. | 38,801 | 1,474,438 | |||
| United Stationers, Inc. (b) | 40,100 | 1,968,909 | |||
| 4,398,809 | |||||
| Oil & Gas (5.7%) | |||||
| Atwood Oceanics, Inc. (b) | 14,000 | 861,840 | |||
| Cabot Oil & Gas Corp., Class A | 25,250 | 876,175 | |||
| Cal Dive International, Inc. (b) | 125,133 | 6,553,216 | |||
| Carbo Ceramics, Inc. | 15,300 | 1,208,088 | |||
| Cimarex Energy Co. (b) | 77,838 | 3,028,677 | |||
| Encore Acquisition Co. (b) | 80,300 | 3,292,300 | |||
| Energen Corp. | 73,598 | 2,579,610 | |||
| Frontier Oil Corp. | 41,615 | 1,221,400 | |||
| Grey Wolf, Inc. (b) | 134,000 | 992,940 | |||
| Hydril Co. (b) | 14,700 | 798,945 | |||
| Meridian Resource Corp. (b) | 164,700 | 787,266 | |||
| National-Oilwell, Inc. (b) | 46,452 | 2,208,328 | |||
| Newfield Exploration Co. (b) | 91,400 | 3,645,946 | |||
| Nicor, Inc. | 4,738 | 195,063 | |||
| Oceaneering International, Inc. (b) | 54,100 | 2,090,965 | |||
| Offshore Logistics, Inc. (b) | 74,698 | 2,453,082 | |||
| Range Resources Corp. | 88,700 | 2,386,030 | |||
| Remington Oil & Gas Corp. (b) | 20,786 | 742,060 | |||
| Seacor Holdings, Inc. (b) | 18,014 | 1,158,300 | |||
20
Table of Contents
GARTMORE VARIABLE INSURANCE TRUST
GVIT SMALL COMPANY FUND
Statement of Investments — June 30, 2005 (Unaudited) (continued)
| Shares or Principal Amount | Value | ||||
| COMMON STOCKS (continued) | |||||
| UNITED STATES (continued) | |||||
| Oil & Gas (continued) | |||||
| St. Mary Land & Exploration Co. | 131,400 | $ | 3,807,972 | ||
| Swift Energy Co. (b) | 71,000 | 2,543,220 | |||
| Tesoro Petroleum Corp. | 42,070 | 1,957,096 | |||
| UGI Corp. | 104,387 | 2,912,397 | |||
| Unit Corp. (b) | 54,000 | 2,376,540 | |||
| Universal Compression Holdings, Inc. (b) | 17,500 | 634,200 | |||
| W-H Energy Services, Inc. (b) | 38,500 | 959,805 | |||
| 52,271,461 | |||||
| Oil & Gas Exploration Services (2.2%) | |||||
| Carrizo Oil & Gas, Inc. (b) | 53,000 | 904,180 | |||
| Comstock Resources, Inc. (b) | 28,600 | 723,294 | |||
| Core Laboratories NV (b) | 9,464 | 253,824 | |||
| Forest Oil Corp. (b) | 45,364 | 1,905,288 | |||
| Harvest Natural Resources, Inc. (b) | 57,340 | 626,726 | |||
| Hornbeck Offshore Services, Inc. (b) | 16,400 | 444,276 | |||
| KCS Energy, Inc. (b) | 66,100 | 1,148,157 | |||
| Petrohawk Energy Corp. (b) | 70,900 | 765,720 | |||
| Quicksilver Resources, Inc. (b) | 66,800 | 4,270,524 | |||
| Southwestern Energy Co. (b) | 123,300 | 5,792,635 | |||
| Stone Energy Corp. (b) | 40,900 | 2,000,010 | |||
| Veritas DGC, Inc. (b) | 20,058 | 556,409 | |||
| 19,391,043 | |||||
| Packaging (0.1%) | |||||
| STAMPS.COM, Inc. (b) | 41,200 | 772,500 | |||
| Paper & Related Products (0.2%) | |||||
| Glatfelter Co. | 109,609 | 1,359,152 | |||
| Pharmaceuticals (0.7%) | |||||
| Alpharma, Inc., Class A | 21,329 | 308,631 | |||
| Angiotech Pharmaceuticals, Inc. (b) | 8,600 | 119,196 | |||
| Bone Care International, Inc. (b) | 26,000 | 857,220 | |||
| King Pharmaceuticals, Inc. (b) | 25,970 | 270,607 | |||
| Kos Pharmaceuticals, Inc. (b) | 30,808 | 2,017,924 | |||
| Medicis Pharmaceutical Corp., Class A | 21,000 | 666,330 | |||
| Noven Pharmaceuticals, Inc. (b) | 44,800 | 783,104 | |||
| Taro Pharmaceuticals USA, Inc. (b) | 55,500 | 1,613,385 | |||
| 6,636,397 | |||||
| Shares or Principal Amount | Value | ||||
| COMMON STOCKS (continued) | |||||
| UNITED STATES (continued) | |||||
| Printing (0.3%) | |||||
| Consolidated Graphics, Inc. (b) | 7,763 | $ | 316,498 | ||
| Potlatch Corp. | 9,303 | 486,826 | |||
| Proquest Co. (b) | 27,700 | 908,283 | |||
| Scholastic Corp. (b) | 25,300 | 975,315 | |||
| TransAct Technologies, Inc. (b) | 35,400 | 299,838 | |||
| 2,986,760 | |||||
| Quarrying (0.2%) | |||||
| Compass Minerals International, Inc. | 84,000 | 1,965,600 | |||
| Real Estate Investment Trust (2.2%) | |||||
| Alexander’s, Inc. (b) | 7,500 | 1,865,624 | |||
| American Home Mortgage Investment Corp. | 26,000 | 908,960 | |||
| Amli Residential Properties Trust | 17,300 | 540,798 | |||
| Ashford Hospitality Trust, Inc. | 125,700 | 1,357,560 | |||
| Biomed Realty Trust, Inc. | 34,250 | 816,863 | |||
| CBL & Associates Properties, Inc. | 41,473 | 1,786,242 | |||
| Eagle Hospitality Poperties Trust, Inc. | 76,500 | 696,915 | |||
| ECC Capital Corp. | 140,500 | 935,730 | |||
| Equity Inns, Inc. | 68,900 | 916,370 | |||
| Equity Lifestyle Properties, Inc. | 605 | 24,055 | |||
| Essex Property Trust, Inc. | 7,100 | 589,726 | |||
| Glimcher Realty Trust | 60,900 | 1,689,975 | |||
| Housevalues, Inc. (b) | 49,100 | 887,728 | |||
| InnKeepers USA Trust | 58,205 | 869,583 | |||
| Jones Lang LaSalle, Inc. (b) | 26,000 | 1,149,980 | |||
| Mission West Properties, Inc. | 10,060 | 103,316 | |||
| Nationwide Health Properties, Inc. | 61,300 | 1,447,293 | |||
| SL Green Realty Corp. | 8,724 | 562,698 | |||
| Taubman Centers, Inc. | 24,300 | 828,387 | |||
| Trizec Properties, Inc. | 87,889 | 1,807,877 | |||
| Winston Hotels, Inc. | 1,600 | 18,016 | |||
| 19,803,696 | |||||
| Recreational Vehicles (0.0%) | |||||
| Arctic Cat, Inc. | 4,467 | 91,708 | |||
| Research & Development (0.0%) | |||||
| Life Sciences Research, Inc. (b) | 9,448 | 112,998 | |||
| PRA International (b) | 7,543 | 202,002 | |||
| 315,000 | |||||
21
Table of Contents
GARTMORE VARIABLE INSURANCE TRUST
GVIT SMALL COMPANY FUND
Statement of Investments — June 30, 2005 (Unaudited) (continued)
| Shares or Principal Amount | Value | ||||
| COMMON STOCKS (continued) | |||||
| UNITED STATES (continued) | |||||
| Residential (0.2%) | |||||
| Desarrolladora Homex (b) | 55,300 | $ | 1,516,326 | ||
| Restaurants (1.1%) | |||||
| CKE Restaurants, Inc. | 115,531 | 1,608,192 | |||
| Dave & Buster’s, Inc. (b) | 14,245 | 262,678 | |||
| Famous Dave’s of America, Inc. (b) | 3,956 | 39,046 | |||
| IHOP Corp. | 48,700 | 2,113,093 | |||
| Jack In the Box, Inc. (b) | 37,056 | 1,405,164 | |||
| PF Chang’s China Bistro, Inc. (b) | 38,700 | 2,282,525 | |||
| Ruby Tuesday, Inc. | 30,000 | 777,000 | |||
| Ryan’s Restaurant Group, Inc. | 62,500 | 875,625 | |||
| Steak n Shake Co. (b) | 2,250 | 41,895 | |||
| 9,405,218 | |||||
| Retail (4.6%) | |||||
| 7-ELEVEN, Inc. (b) | 19,545 | 591,041 | |||
| AC Moore Arts & Crafts, Inc. (b) | 30,500 | 964,105 | |||
| American Eagle Outfitters, Inc. (b) | 21,200 | 649,780 | |||
| Barnes & Noble, Inc. (b) | 35,444 | 1,375,227 | |||
| Big 5 Sporting Goods Corp. | 66,000 | 1,873,080 | |||
| BJ’s Restaurants, Inc. (b) | 74,935 | 1,524,178 | |||
| BJ’s Wholesale Club, Inc. (b) | 7,179 | 233,246 | |||
| Blue Nile, Inc. (b) | 82,100 | 2,683,849 | |||
| Build-A-Bear Workshop, Inc. (b) | 49,778 | 1,167,294 | |||
| Cabelas, Inc., Class A (b) | 58,000 | 1,238,880 | |||
| Carter’s, Inc. (b) | 46,000 | 2,685,480 | |||
| Charming Shoppes, Inc. (b) | 8,973 | 83,718 | |||
| Citi Trends, Inc. (b) | 2,349 | 42,470 | |||
| Department 56, Inc. (b) | 4,845 | 49,661 | |||
| Dick’s Sporting Goods, Inc. (b) | 23,500 | 906,865 | |||
| Eddie Bauer Holdings, Inc. (b) | 16,100 | 446,775 | |||
| EZCorp, Inc. (b) | 12,025 | 128,908 | |||
| Fossil, Inc. (b) | 130,300 | 2,957,809 | |||
| Genesco, Inc. (b) | 17,644 | 654,416 | |||
| Guitar Center, Inc. (b) | 24,300 | 1,418,391 | |||
| Handleman Co. | 16,969 | 280,158 | |||
| Joseph A. Bank Clothiers, Inc. (b) | 1 | 43 | |||
| Longs Drug Stores Corp. | 15,610 | 672,011 | |||
| Movie Gallery, Inc. | 105,806 | 2,796,453 | |||
| Pacific Sunwear of California, Inc. (b) | 37,000 | 850,630 | |||
| Pantry, Inc. (b) | 38,559 | 1,493,390 | |||
| Payless ShoeSource, Inc. (b) | 35,101 | 673,939 | |||
| Petco Animal Supplies, Inc. (b) | 20,000 | 586,400 | |||
| Shares or Principal Amount | Value | ||||
| COMMON STOCKS (continued) | |||||
| UNITED STATES (continued) | |||||
| Retail (continued) | |||||
| Ralcorp Holding, Inc. | 20,500 | $ | 843,575 | ||
| Rent-A-Center, Inc. (b) | 65,615 | 1,528,173 | |||
| Rex Stores Corp. (b) | 44,200 | 638,690 | |||
| Rocky Mountain Chocolate Factory, Inc. | 8,600 | 189,200 | |||
| Rocky Shoes & Boots, Inc. (b) | 693 | 21,656 | |||
| School Specialty, Inc. (b) | 22,800 | 1,060,200 | |||
| ShopKo Stores, Inc. (b) | 24,818 | 603,326 | |||
| Spartan Stores, Inc. (b) | 8,899 | 130,548 | |||
| Spectrum Brands, Inc. (b) | 37,124 | 1,225,092 | |||
| Tanger Factory Outlet Centers, Inc. | 913 | 24,587 | |||
| Timberland Co., Class A (b) | 1,530 | 59,242 | |||
| Tractor Supply Co. (b) | 60,400 | 2,965,639 | |||
| Trans World Entertainment Corp. (b) | 96,347 | 1,139,785 | |||
| Tuesday Morning Corp. | 69,300 | 2,184,336 | |||
| Zumiez, Inc. (b) | 6,200 | 180,730 | |||
| 41,822,976 | |||||
| Schools (0.5%) | |||||
| Bright Horizons Family Solutions, Inc. (b) | 33,300 | 1,355,976 | |||
| Strayer Education, Inc. | 33,300 | 2,872,458 | |||
| 4,228,434 | |||||
| Semiconductor Equipment (0.9%) | |||||
| ADE Corp. (b) | 16,679 | 467,846 | |||
| Axcelis Technologies, Inc. (b) | 110,600 | 758,716 | |||
| Cypress Semiconductor Corp. (b) | 31,300 | 394,067 | |||
| Omnivision Technologies, Inc. (b) | 43,113 | 585,906 | |||
| ON Semiconductor Corp. (b) | 204,400 | 940,240 | |||
| Photronics, Inc. (b) | 47,287 | 1,103,679 | |||
| Power Integrations, Inc. (b) | 32,500 | 701,025 | |||
| Sigmatel, Inc. (b) | 15,221 | 261,192 | |||
| Tessera Technologies, Inc. (b) | 93,500 | 3,123,835 | |||
| 8,336,506 | |||||
| Steel (0.5%) | |||||
| AK Steel Holding Corp. (b) | 138,933 | 890,561 | |||
| Ryerson Tull, Inc. | 52,400 | 747,748 | |||
| Shiloh Industries, Inc. (b) | 9,385 | 114,966 | |||
| Steel Dynamics, Inc. | 25,050 | 657,563 | |||
| Texas Industries, Inc. | 42,383 | 2,383,195 | |||
| 4,794,033 | |||||
22
Table of Contents
GARTMORE VARIABLE INSURANCE TRUST
GVIT SMALL COMPANY FUND
Statement of Investments — June 30, 2005 (Unaudited) (continued)
| Shares or Principal Amount | Value | ||||
| COMMON STOCKS (continued) | |||||
| UNITED STATES (continued) | |||||
| Technology (1.1%) | |||||
| Atheros Communications (b) | 88,500 | $ | 713,310 | ||
| Black Box Corp. | 18,500 | 654,900 | |||
| CACI International, Inc., Class A (b) | 23,100 | 1,458,996 | |||
| Cogent, Inc. (b) | 44,900 | 1,281,895 | |||
| Coherent, Inc. (b) | 31,093 | 1,119,659 | |||
| Electronics For Imaging, Inc. (b) | 66,400 | 1,397,056 | |||
| Flamel Technologies (b) | 38,080 | 689,438 | |||
| Ingram Micro, Inc. (b) | 31,515 | 493,525 | |||
| Intergraph Corp. (b) | 54,956 | 1,893,784 | |||
| Progress Software Corp. (b) | 13,787 | 415,678 | |||
| Tessco Technologies, Inc. (b) | 12,317 | 164,186 | |||
| 10,282,427 | |||||
| Telecommunication Equipment (0.2%) | |||||
| Harris Corp. | 26,600 | 830,186 | |||
| Plantronics, Inc. | 19,240 | 699,566 | |||
| SpectraLink Corp. | 9,000 | 94,680 | |||
| West Corp. (b) | 352 | 13,517 | |||
| 1,637,949 | |||||
| Telecommunication Services (1.5%) | |||||
| Commonwealth Telephone Enterprises, Inc. | 36,215 | 1,517,771 | |||
| Commscope, Inc. (b) | 5,280 | 91,925 | |||
| Comtech Telecommunications Corp. (b) | 81,350 | 2,654,450 | |||
| Digi International, Inc. (b) | 35,200 | 417,472 | |||
| Intrado, Inc. (b) | 954 | 14,272 | |||
| Jamdat Mobile, Inc. (b) | 42,800 | 1,184,704 | |||
| NII Holdings, Inc. (b) | 22,100 | 1,413,074 | |||
| Premiere Global Services, Inc. (b) | 109,861 | 1,240,331 | |||
| SBA Communications Corp. (b) | 111,612 | 1,506,762 | |||
| SpectraSite, Inc. (b) | 32,800 | 2,441,304 | |||
| Talk America Holdings, Inc. (b) | 60,218 | 602,782 | |||
| 13,084,847 | |||||
| Textiles (0.4%) | |||||
| Greif, Inc. | 27,280 | 1,666,808 | |||
| Myers Industries, Inc. | 61,400 | 767,500 | |||
| Valhi | 48,894 | 855,645 | |||
| 3,289,953 | |||||
| Tire & Rubber (0.3%) | |||||
| Cooper Tire & Rubber Co. | 38,500 | 714,945 | |||
| Goodyear Tire & Rubber Co. (b) | 120,797 | 1,799,875 | |||
| 2,514,820 | |||||
| Shares or Principal Amount | Value | ||||
| COMMON STOCKS (continued) | |||||
| UNITED STATES (continued) | |||||
| Tools (0.2%) | |||||
| Snap-On, Inc. | 26,900 | $ | 922,670 | ||
| The Stanley Works | 20,129 | 916,675 | |||
| 1,839,345 | |||||
| Toys (0.2%) | |||||
| Jakks Pacific, Inc. (b) | 93,704 | 1,800,054 | |||
| Transportation (1.9%) | |||||
| Arkansas Best Corp. | 7,549 | 240,134 | |||
| EGL, Inc. (b) | 15,545 | 315,874 | |||
| Forward Air Corp. | 9,728 | 275,011 | |||
| Frontier Airlines, Inc. (b) | 10,624 | 109,746 | |||
| Heartland Express, Inc. | 34,501 | 670,354 | |||
| HUB Group, Inc., Class A | 23,000 | 576,150 | |||
| J.B. Hunt Transport Services, Inc. | 159,400 | 3,076,420 | |||
| Kansas City Southern Industries, Inc. (b) | 161,160 | 3,252,210 | |||
| Kirby Corp. (b) | 7,523 | 339,287 | |||
| Knight Transportation, Inc. | 17,006 | 413,756 | |||
| Laidlaw International, Inc. (b) | 43,800 | 1,055,580 | |||
| Landstar System, Inc. (b) | 93,704 | 2,822,364 | |||
| Overseas Shipholding Group, Inc. (b) | 16,000 | 954,400 | |||
| RailAmerica, Inc. (b) | 111,962 | 1,332,348 | |||
| SCS Transportation, Inc. (b) | 35,900 | 639,020 | |||
| SkyWest, Inc. | 69,129 | 1,256,765 | |||
| 17,329,419 | |||||
| Travel Services (0.0%) | |||||
| Ambassadors Group, Inc. | 210 | 7,810 | |||
| Utilities (0.8%) | |||||
| Allegheny Energy, Inc. (b) | 74,876 | 1,888,373 | |||
| American States Water Co. | 31,900 | 936,903 | |||
| Gasco Energy Inc. (b) | 187,200 | 692,640 | |||
| Northwestern Corp. | 28,500 | 898,320 | |||
| UniSource Energy Corp. | 1,803 | 55,442 | |||
| Westar Energy, Inc. | 93,600 | 2,249,208 | |||
| 6,720,886 | |||||
| Veterinary Diagnostics (0.5%) | |||||
| VCA Antech, Inc. (b) | 186,500 | 4,522,625 | |||
| Waste Disposal (0.1%) | |||||
| Metal Management, Inc. | 67,034 | 1,297,108 | |||
| Wholesale Distribution (0.1%) | |||||
| Beacon Roofing Supply, Inc. (b) | 44,000 | 1,157,200 | |||
| 741,379,704 | |||||
| Total Common Stocks | 867,873,787 | ||||
23
Table of Contents
GARTMORE VARIABLE INSURANCE TRUST
GVIT SMALL COMPANY FUND
Statement of Investments — June 30, 2005 (Unaudited) (continued)
| Shares or Principal Amount | Value | |||||
| MUTUAL FUND (0.1%) | ||||||
| Federated Prime Obligation, Institutional Class | 34,959 | $ | 34,959 | |||
| Nasdaq Biotech Index | 11,000 | 746,900 | ||||
| Total Mutual Fund | 781,859 | |||||
| COMMERCIAL PAPER (0.3%) | ||||||
| Banks (0.2%) | ||||||
| Countrywide Home Loans 07/01/05 | $ | 1,407,000 | 1,407,000 | |||
| Real Estate Investment Trust (0.1%) | ||||||
| Ventures Business Trust PP, 07/01/05 | 1,500,000 | 1,500,000 | ||||
| Total Commercial Paper | 2,907,000 | |||||
| Value | |||||
| Total Investments (Cost $719,756,670) (a) — 97.4% | $ | 871,562,646 | |||
| Other assets in excess of liabilities — 2.6% | 23,163,508 | ||||
| NET ASSETS — 100.0% | $ | 894,726,154 | |||
| (a) | See notes to financial statements for tax unrealized appreciation (depreciation) of securities. |
| (b) | Denotes a non-income producing security |
| (c) | Fair valued security. |
| ADR | American Depositary Receipt |
| GDR | Global Depositary Receipt |
At June 30, 2005, the Fund’s open forward foreign currency contracts were as follows:
| Currency | Delivery Date | Contract Value | Market Value | Unrealized Appreciation (Depreciation) | ||||||||||
| Short Contracts: | ||||||||||||||
Australian Dollar | 07/05/05 | $ | (436,165 | ) | $ | (435,297 | ) | $ | 868 | |||||
Hong Kong Dollar | 07/05/05 | (58,682 | ) | (58,708 | ) | (26 | ) | |||||||
Japanese Yen | 07/01/05 | (129,293 | ) | (128,056 | ) | 1,237 | ||||||||
Japanese Yen | 07/05/05 | (1,623,247 | ) | (1,615,361 | ) | 7,886 | ||||||||
Japanese Yen | 07/05/05 | (9,895 | ) | (9,878 | ) | 17 | ||||||||
Singapore Dollar | 07/05/05 | (27,961 | ) | (27,960 | ) | 1 | ||||||||
| Total Short Contracts: | $ | (2,285,243 | ) | $ | (2,275,260 | ) | $ | 9,983 | ||||||
See notes to financial statements.
24
Table of Contents
GARTMORE VARIABLE INSURANCE TRUST
GVIT SMALL COMPANY FUND
Statement of Assets and Liabilities
June 30, 2005 (Unaudited)
Assets: | |||
Investments, at value (cost $719,756,670) | $ | 871,562,646 | |
Cash | 19,739,500 | ||
Foreign currencies, at value (cost $154,314) | 155,073 | ||
Interest and dividends receivable | 627,716 | ||
Receivable for investments sold | 10,119,031 | ||
Unrealized appreciation of forward foreign currency contracts | 9,983 | ||
Reclaims receivable | 95,471 | ||
Prepaid expenses and other assets | 23,663 | ||
Total Assets | 902,333,083 | ||
Liabilities: | |||
Payable for investments purchased | 6,786,815 | ||
Accrued expenses and other payables: | |||
Investment advisory fees | 679,607 | ||
Fund administration and transfer agent fees | 21,573 | ||
Distribution fees | 11,254 | ||
Administrative servicing fees | 96,095 | ||
Other | 11,585 | ||
Total Liabilities | 7,606,929 | ||
Net Assets | $ | 894,726,154 | |
Represented by: | |||
Capital | $ | 688,711,434 | |
Accumulated net investment income (loss) | 269,600 | ||
Accumulated net realized gains (losses) from investment and foreign currency transactions | 53,942,809 | ||
Net unrealized appreciation (depreciation) on investments and translation of assets and liabilities denominated in foreign currencies | 151,802,311 | ||
Net Assets | $ | 894,726,154 | |
Net Assets: | |||
Class I Shares | $ | 794,705,809 | |
Class II Shares | 55,678,854 | ||
Class III Shares | 1,377,098 | ||
Class IV Shares | 42,964,393 | ||
Total | $ | 894,726,154 | |
Shares outstanding (unlimited number of | |||
Class I Shares | 34,095,869 | ||
Class II Shares | 2,409,487 | ||
Class III Shares | 59,035 | ||
Class IV Shares | 1,843,348 | ||
Total | 38,407,739 | ||
Net asset value and offering price per share:* | |||
Class I Shares | $ | 23.31 | |
Class II Shares | $ | 23.11 | |
Class III Shares | $ | 23.33 | |
Class IV Shares | $ | 23.31 |
| * | Not subject to a front-end sales charge. |
For the Six Months Ended June 30, 2005 (Unaudited)
Investment Income: | ||||
Interest income | $ | 100,928 | ||
Dividend income (net of foreign withholding tax of $267,011) | 5,587,205 | |||
Income from securities lending | 1,256 | |||
Total Income | 5,689,389 | |||
Expenses: | ||||
Investment advisory fees | 4,064,624 | |||
Fund administration and transfer agent fees | 305,060 | |||
Distribution fees Class II Shares | 61,076 | |||
Administrative servicing fees | 570,719 | |||
Administrative servicing fees | 35,797 | |||
Administrative servicing fees | 1,036 | |||
Administrative servicing fees | 30,963 | |||
Other** | 178,782 | |||
Total Expenses | 5,248,057 | |||
Net Investment Income (Loss) | 441,332 | �� | ||
REALIZED/UNREALIZED GAINS (LOSSES) ON INVESTMENTS: | ||||
Net realized gains (losses) on investment transactions | 67,762,737 | |||
Net realized gains (losses) on foreign currency transactions | 421,570 | |||
Net realized gains (losses) on investment and foreign currency transactions | 68,184,307 | |||
Net change in unrealized appreciation/depreciation on investments and translation of assets and liabilities denominated in foreign currencies | (42,591,970 | ) | ||
Net realized/unrealized gains (losses) on investments and foreign currencies | 25,592,337 | |||
CHANGE IN NET ASSETS RESULTING FROM OPERATIONS | $ | 26,033,669 | ||
| ** | Other expenses may include the following fees: audit, custody, insurance, legal, printing, trustee, and out-of-pocket expenses. |
See notes to financial statements.
25
Table of Contents
GARTMORE VARIABLE INSURANCE TRUST
GVIT SMALL COMPANY FUND
Statement of Changes in Net Assets
| Six Months Ended June 30, 2005 | Year Ended December 31, 2004 | |||||||
| (Unaudited) | ||||||||
From Investment Activities: | ||||||||
Operations: | ||||||||
Net investment income (loss) | $ | 441,332 | $ | (1,456,197 | ) | |||
Net realized gains (losses) on investment and foreign currency transactions | 68,184,307 | 141,840,497 | ||||||
Net change in unrealized appreciation/depreciation on investments and translation of assets and liabilities denominated in foreign currencies | (42,591,970 | ) | 7,887,746 | |||||
Change in net assets resulting from operations | 26,033,669 | 148,272,046 | ||||||
Distributions to Class I shareholders from: | ||||||||
Net realized gains on investments | (11,761,626 | ) | (91,891,042 | ) | ||||
Distributions to Class II shareholders from: | ||||||||
Net realized gains on investments | (826,473 | ) | (6,183,979 | ) | ||||
Distributions to Class III shareholders from: | ||||||||
Net realized gains on investments | (20,332 | ) | (188,614 | ) | ||||
Distributions to Class IV shareholders from: | ||||||||
Net realized gains on investments | (637,919 | ) | (5,035,188 | ) | ||||
Change in net assets from shareholder distributions | (13,246,350 | ) | (103,298,823 | ) | ||||
Change in net assets from capital transactions | (27,051,761 | ) | 36,143,657 | |||||
Change in net assets | (14,264,442 | ) | 81,116,880 | |||||
Net Assets: | ||||||||
Beginning of period | 908,990,596 | 827,873,716 | ||||||
End of period | $ | 894,726,154 | $ | 908,990,596 | ||||
CAPITAL TRANSACTIONS: | ||||||||
Class I Shares | ||||||||
Proceeds from shares issued | $ | 34,798,445 | $ | 64,894,504 | ||||
Dividends reinvested | 11,761,581 | 91,891,014 | ||||||
Cost of shares redeemed | (78,816,627 | ) | (142,732,941 | ) | ||||
| (32,256,601 | ) | 14,052,577 | ||||||
Class II Shares | ||||||||
Proceeds from shares issued | 11,532,499 | 38,188,478 | ||||||
Dividends reinvested | 826,470 | 6,183,977 | ||||||
Cost of shares redeemed | (4,378,533 | ) | (16,783,644 | ) | ||||
| 7,980,436 | 27,588,811 | |||||||
Class III Shares | ||||||||
Proceeds from shares issued | 184,500 | 1,472,863 | ||||||
Dividends reinvested | 20,332 | 188,614 | ||||||
Cost of shares redeemed | (519,137 | ) | (1,258,071 | ) | ||||
| (314,305 | ) | 403,406 | ||||||
Class IV Shares | ||||||||
Proceeds from shares issued | 1,105,667 | 3,384,134 | ||||||
Dividends reinvested | 637,916 | 5,035,186 | ||||||
Cost of shares redeemed | (4,204,874 | ) | (14,320,457 | ) | ||||
| (2,461,291 | ) | (5,901,137 | ) | |||||
Change in net assets from capital transactions | $ | (27,051,761 | ) | $ | 36,143,657 | |||
26
Table of Contents
GARTMORE VARIABLE INSURANCE TRUST
GVIT SMALL COMPANY FUND
Statement of Changes in Net Assets (continued)
| Six Months Ended June 30, 2005 | Year Ended December 31, 2004 | |||||
| (Unaudited) | ||||||
SHARE TRANSACTIONS: | ||||||
Class I Shares | ||||||
Issued | 1,535,796 | 2,841,189 | ||||
Reinvested | 512,487 | 4,000,480 | ||||
Redeemed | (3,467,905 | ) | (6,307,646 | ) | ||
| (1,419,622 | ) | 534,023 | ||||
Class II Shares | ||||||
Issued | 510,858 | 1,687,196 | ||||
Reinvested | 36,328 | 271,227 | ||||
Redeemed | (195,116 | ) | (748,645 | ) | ||
| 352,070 | 1,209,778 | |||||
Class III Shares | ||||||
Issued | 8,001 | 63,858 | ||||
Reinvested | 885 | 8,204 | ||||
Redeemed | (22,982 | ) | (54,073 | ) | ||
| (14,096 | ) | 17,989 | ||||
Class IV Shares | ||||||
Issued | 48,537 | 149,917 | ||||
Reinvested | 27,796 | 219,207 | ||||
Redeemed | (184,689 | ) | (638,110 | ) | ||
| (108,356 | ) | (268,986 | ) | |||
See notes to financial statements.
27
Table of Contents
GARTMORE VARIABLE INSURANCE TRUST
FINANCIAL HIGHLIGHTS
Selected Data for Each Share of Capital Outstanding
GVIT Small Company Fund
| Investment Activities | Distributions | Ratios/Supplemental Data | ||||||||||||||||||||||||||||||||||||
| Net Asset Value, Beginning of Period | Net Investment Income (Loss) | Net Realized and Unrealized Gains (Losses) on Investments | Total from Investment Activities | Net Investment Income | Net Realized Gains | Total Distributions | Net Asset Value, End of Period | Total Return | Net Assets at End of Period (000s) | Ratio of Expenses to Average Net Assets | Ratio of Net Investment Income (Loss) to Average Net Assets | Portfolio Turnover(a) | ||||||||||||||||||||||||||
Class I Shares | ||||||||||||||||||||||||||||||||||||||
Year Ended December 31, 2000 | $ | 22.12 | 0.02 | 1.91 | 1.93 | (0.01 | ) | (4.04 | ) | (4.05 | ) | $ | 20.00 | 8.90% | $ | 790,607 | 1.21% | 0.06% | 163.66% | |||||||||||||||||||
Year Ended December 31, 2001(b) | $ | 20.00 | — | (1.34 | ) | (1.34 | ) | (0.02 | ) | — | (0.02 | ) | $ | 18.64 | (6.70% | ) | $ | 743,468 | 1.20% | 0.02% | 135.90% | |||||||||||||||||
Year Ended December 31, 2002 | $ | 18.64 | (0.07 | ) | (3.16 | ) | (3.23 | ) | — | — | — | $ | 15.41 | (17.33% | ) | $ | 561,836 | 1.18% | (0.33% | ) | 92.59% | |||||||||||||||||
Year Ended December 31, 2003 | $ | 15.41 | (0.07 | ) | 6.39 | 6.32 | — | — | — | $ | 21.73 | 41.01% | $ | 760,078 | 1.17% | (0.37% | ) | 93.72% | ||||||||||||||||||||
Year Ended December 31, 2004 | $ | 21.73 | (0.04 | ) | 4.17 | 4.13 | — | (2.90 | ) | (2.90 | ) | $ | 22.96 | 19.02% | $ | 815,585 | 1.19% | (0.17% | ) | 131.75% | ||||||||||||||||||
Six Months Ended June 30, 2005 (Unaudited) | $ | 22.96 | 0.01 | 0.69 | 0.70 | — | (0.35 | ) | (0.35 | ) | $ | 23.31 | 3.07% | (f) | $ | 794,706 | 1.19% | (g) | 0.10% | (g) | 71.67% | |||||||||||||||||
Class II Shares | ||||||||||||||||||||||||||||||||||||||
Period Ended December 31, 2002(c) | $ | 18.70 | (0.03 | ) | (3.28 | ) | (3.31 | ) | — | — | — | $ | 15.39 | (17.70% | )(f) | $ | 2,325 | 1.44% | (g) | (0.54% | )(g) | 92.59% | ||||||||||||||||
Year Ended December 31, 2003 | $ | 15.39 | (0.12 | ) | 6.37 | 6.25 | — | — | — | $ | 21.64 | 40.61% | $ | 18,345 | 1.42% | (0.63% | ) | 93.72% | ||||||||||||||||||||
Year Ended December 31, 2004 | $ | 21.64 | (0.07 | ) | 4.13 | 4.06 | — | (2.90 | ) | (2.90 | ) | $ | 22.80 | 18.78% | $ | 46,906 | 1.44% | (0.42% | ) | 131.75% | ||||||||||||||||||
Six Months Ended June 30, 2005 (Unaudited) | $ | 22.80 | (0.01 | ) | 0.67 | 0.66 | — | (0.35 | ) | (0.35 | ) | $ | 23.11 | 2.92% | (f) | $ | 55,679 | 1.44% | (g) | (0.12% | )(g) | 71.67% | ||||||||||||||||
Class III Shares | ||||||||||||||||||||||||||||||||||||||
Period Ended December 31, 2002(d) | $ | 17.48 | (0.01 | ) | (2.05 | ) | (2.06 | ) | — | — | — | $ | 15.42 | (11.78% | )(f) | $ | 51 | 1.15% | (g) | (0.25% | )(g) | 92.59% | ||||||||||||||||
Year Ended December 31, 2003 | $ | 15.42 | (0.08 | ) | 6.40 | 6.32 | — | — | — | $ | 21.74 | 40.99% | $ | 1,199 | 1.17% | (0.39% | ) | 93.72% | ||||||||||||||||||||
Year Ended December 31, 2004 | $ | 21.74 | (0.03 | ) | 4.17 | 4.14 | — | (2.90 | ) | (2.90 | ) | $ | 22.98 | 19.06% | $ | 1,681 | 1.19% | (0.15% | ) | 131.75% | ||||||||||||||||||
Six Months Ended June 30, 2005 (Unaudited) | $ | 22.98 | — | 0.70 | 0.70 | — | (0.35 | ) | (0.35 | ) | $ | 23.33 | 3.07% | (f) | $ | 1,377 | 1.20% | (g) | 0.07% | (g) | 71.67% | |||||||||||||||||
Class IV Shares | ||||||||||||||||||||||||||||||||||||||
Period Ended December 31, 2003(e) | $ | 15.61 | (0.05 | ) | 6.17 | 6.12 | — | — | — | $ | 21.73 | 39.21% | (f) | $ | 48,252 | 1.16% | (g) | (0.36% | )(g) | 93.72% | ||||||||||||||||||
Year Ended December 31, 2004 | $ | 21.73 | (0.04 | ) | 4.17 | 4.13 | — | (2.90 | ) | (2.90 | ) | $ | 22.96 | 19.02% | $ | 44,819 | 1.19% | (0.18% | ) | 131.75% | ||||||||||||||||||
Six Months Ended June 30, 2005 (Unaudited) | $ | 22.96 | 0.01 | 0.69 | 0.70 | — | (0.35 | ) | (0.35 | ) | $ | 23.31 | 3.07% | (f) | $ | 42,964 | 1.19% | (g) | 0.10% | (g) | 71.67% | |||||||||||||||||
| (a) | Portfolio turnover is calculated on the basis of the Fund as a whole without distinguishing among the classes of shares. |
| (b) | The existing shares of the Fund were designated Class I shares as of May 1, 2001. |
| (c) | For the period from March 5, 2002 (commencement of operations) through December 31, 2002. |
| (d) | For the period from July 1, 2002 (commencement of operations) through December 31, 2002. |
| (e) | For the period from April 28, 2003 (commencement of operations) through December 31, 2003. |
| (f) | Not annualized. |
| (g) | Annualized. |
See notes to financial statements.
28
Table of Contents
GARTMORE VARIABLE INSURANCE TRUST
NOTES TO FINANCIAL STATEMENTS (Unaudited)
June 30, 2005
1. Organization
Gartmore Variable Insurance Trust (“GVIT” or the “Trust”) is an open-end management investment company, organized under the laws of Delaware by an amended and restated Agreement and Declaration of Trust, dated October 28, 2004, as amended to date. The Trust, originally created under the laws of Massachusetts as a Massachusetts business trust pursuant to a Declaration of Trust dated, as of June 30, 1981, as subsequently amended, redomesticated as a Delaware Statutory Trust after the close of trading on April 29, 2005, and is registered under the Investment Company Act of 1940, as amended (the “1940 Act”). The redomestication is a change in statutory status and does not affect the operations of the Trust. As of June 30, 2005, the Trust had authorized an unlimited number of shares of beneficial interest (“shares”) without par value. The Trust currently offers shares to life insurance company separate accounts to fund the benefits under variable life insurance or annuity policies. To date, only the separate accounts of Nationwide Life Insurance Company and Nationwide Life and Annuity Insurance Company (collectively, “Nationwide”) have purchased shares of the Trust’s series. The Trust operates thirty-one (31) separate series, or mutual funds, each with its own investment objectives and strategies. This report contains the financial statements and financial highlights of the GVIT Small Company Fund (the “Fund”).
Under the Trust’s organizational documents, the Trust’s officers and trustees are indemnified against certain liabilities arising out of the performance of their duties to the Trust. In addition, the Trust has entered into Indemnification Agreements with the Trust’s trustees and certain officers covering similar liabilities. In addition, in the normal course of business, the Trust enters into contracts with its vendors and others that provide for general indemnifications. The Trust’s maximum exposure under these arrangements is unknown, as this would involve future claims that may be made against the Trust. Based on experience, however, the Trust expects that risk of loss to be remote.
2. Summary of Significant Accounting Policies
The following is a summary of significant accounting policies followed by the Fund in the preparation of its financial statements. The policies are in conformity with accounting principles generally accepted in the United States of America (“GAAP”). The preparation of financial statements requires management to make estimates and assumptions that affect the reported amounts of assets and liabilities, the disclosure of contingent assets and liabilities at the date of the financial statements and the reported amounts of income and expenses for the period. Actual results could differ from those estimates.
(a) Security Valuation
Securities for which market quotations are readily available are valued at current market value as of “Valuation Time.” Valuation Time is as of the close of regular trading on the New York Stock Exchange (usually 4 p.m. Eastern time). Equity securities are valued at the last quoted sale price or, if there is no sale price, the last quoted bid price provided by an independent pricing service approved by the Trust’s Board of Trustees. Securities traded on NASDAQ are valued at the NASDAQ official closing price. Prices are taken from the primary market or exchange in which each security trades. Most securities listed on a foreign exchange are valued either at fair value (see description below) or at the last sale price at the close of the exchange on which the security is principally traded. Foreign securities, currencies, and other assets and liabilities denominated in foreign currencies are translated into U.S. dollars at the exchange rate of said currencies against the U.S. Dollar, as of Valuation Time, as provided by an independent pricing service approved by the Board of Trustees.
Debt (including defaulted issues) and other fixed income securities (other than short-term obligations) are valued at the last quoted bid price and/or by using a combination of daily quotes and matrix evaluations provided by an independent pricing service, the use of which has been approved by the Trust’s Board of Trustees. Short-term debt securities, such as commercial paper and U.S. Treasury Bills having a remaining maturity of 60 days or less at the time of purchase, are considered to be “short-term” and are valued at amortized cost which approximates market value.
Securities for which market quotations are not readily available, or for which an independent pricing service does not provide a value or provides a value that does not represent fair value in the judgment of the Fund’s investment adviser or designee, are valued at fair value under procedures approved by the Trust’s Board of Trustees. The “Fair Value” of these securities is determined in good faith by taking into account relevant factors and surrounding circumstances. Methods utilized to obtain a
29
Table of Contents
GARTMORE VARIABLE INSURANCE TRUST
NOTES TO FINANCIAL STATEMENTS (Unaudited) (Continued)
June 30, 2005
“Fair Value” may include the following non-exclusive list of SEC acceptable methods: (i) a multiple of earnings; (ii) the discount from market value of a similar, freely traded security; (iii) the yield-to-maturity for debt issues; or (iv) a consolidation of the methods. The Gartmore Fair Value Committee considers a non-exclusive list of factors to arrive at the appropriate method upon determining “Fair Value.” For example, fair value determinations are required for securities whose value is affected by a “significant” event that materially affects the value of a domestic or foreign security which occurs subsequent to the time of the close of the principal market on which such domestic or foreign security trades and before the Valuation Time (i.e., a “subsequent event”). Typically, this will involve events occurring after the close of a foreign market on which a security trades and before the next Valuation Time.
The Fund values foreign securities at fair value in the circumstances described below. Generally, trading in foreign securities markets is completed each day at various times prior to the Valuation Time. Due to the time differences between the closings of the relevant foreign securities exchanges and the Valuation Time for the Fund, the Fund will fair value its foreign investments when it is determined that the market quotations for the foreign investments either are not readily available or are unreliable and, therefore, do not represent fair value. When the fair value prices are utilized, these prices will attempt to reflect the impact of the U.S. financial markets’ perceptions and trading activities on the Fund’s foreign investments since the last closing prices of the foreign investments were calculated on their primary foreign securities markets or exchanges. For these purposes, the Board of Trustees of the Trust has determined that movements in relevant indices or other appropriate market indicators, after the close of the foreign securities exchanges, may demonstrate that market quotations are unreliable, and may trigger fair value pricing for certain securities. Consequently, fair valuation of portfolio securities may occur on a daily basis. In determining fair value prices, the Trust utilizes data furnished by an independent pricing service (and that data draws upon, among other information, the market values of foreign investments). The fair value prices of portfolio securities generally will be used when it is determined that the use of these prices will have a material impact on the net asset value of the Fund. When the Fund uses fair value pricing, the values assigned to the Fund’s foreign investments may not be the quoted or published prices of the investments on their primary markets or exchanges.
| (b) | Repurchase Agreements |
The Fund may enter into repurchase agreements with an entity which is a member of the Federal Reserve System or which is a “primary dealer” (as designated by the Federal Reserve Bank of New York) in U.S. Government obligations. The repurchase price generally equals the price paid by the Fund plus interest negotiated on the basis of current short-term rates, which may be more or less than the rate on the underlying portfolio securities. The seller under a repurchase agreement is required to maintain the value of the collateral held pursuant to the agreement at a market value equal to or greater than the repurchase price (including accrued interest). Collateral subject to repurchase agreements is held by the Fund’s custodian or another qualified sub-custodian or in the Federal Reserve/Treasury book-entry system. If the counterparty defaults and the fair value of the collateral declines, realization of the collateral by the Fund may be delayed or limited. The Fund may transfer uninvested cash balances into a pooled cash account. These balances are invested in one or more repurchase agreements, which are fully collateralized by AA-rated Corporate Bonds with the counterparties of CS First Boston and Nomura Securities.
| (c) | Foreign Currency Transactions |
The accounting records of the Fund are maintained in U.S. dollars. Foreign currency amounts are translated into U.S. dollars at the current rate of exchange to determine the value of investments, assets and liabilities. The Fund may enter into foreign currency contracts in connection with purchases or sales of securities denominated in a foreign currency. Purchases and sales of securities, and income and expenses, are translated at the prevailing rate of exchange on the respective date of these transactions. The Fund does not isolate that portion of the results of operations resulting from changes in foreign exchange rates on investments from fluctuations arising from changes in market prices of securities held. These fluctuations are included with the net realized and unrealized gain or loss from investments and foreign currencies.
| (d) | Risks Associated with Foreign Securities and Currencies |
Investments in securities of foreign issuers carry certain risks not ordinarily associated with investments in securities of U.S. issuers. These risks include future political and economic developments, and the possible imposition of exchange controls or
30
Table of Contents
GARTMORE VARIABLE INSURANCE TRUST
NOTES TO FINANCIAL STATEMENTS (Unaudited) (Continued)
June 30, 2005
other foreign governmental laws and restrictions. In addition, with respect to certain countries, there is the possibility of expropriation of assets, confiscatory taxation, political or social instability, or diplomatic developments, which could adversely affect investments in those countries.
Certain countries also may impose substantial restrictions on investments in their capital markets by foreign entities, including restrictions on investments in issuers of industries deemed sensitive to relevant national interests. These factors may limit the investment opportunities available and result in a lack of liquidity and high price volatility with respect to securities of issuers from developing countries.
| (e) | Forward Foreign Currency Contracts |
The Fund may enter into forward foreign currency contracts in connection with planned purchases or sales of securities or to hedge the U.S. dollar value of portfolio securities denominated in a particular currency. The Fund could be exposed to risks if the counterparties to the contracts are unable to meet the terms of their contracts and from unanticipated movements in the value of a foreign currency relative to the U.S. dollar. Forward foreign currency contracts are valued at the current cost of covering these contracts, as provided by an independent pricing service approved by the Board of Trustees. The forward foreign currency contracts are adjusted by the daily exchange rate of the underlying currency and any gains or losses are recorded for financial statement purposes as unrealized gains or losses until the contract settlement date.
| (f) | Futures Contracts |
The Fund may invest in financial futures contracts (“futures contracts”) for the purpose of hedging its existing portfolio securities or securities that the Fund intends to purchase against fluctuations in value caused by changes in prevailing market interest rates or prices. Futures contracts may also be entered into for non-hedging purposes.
Upon entering into a futures contract, the Fund is required to pledge to the broker an amount of cash and/or other assets equal to a certain percentage of the contract amount (initial margin deposit). Subsequent payments, known as “variation margin,” are made each day, depending on the daily fluctuations in the fair value/market value of the underlying assets. A gain or loss equal to the daily variation margin is recognized on a daily basis. Futures contracts are valued daily at their last quoted sale price.
A “sale” of a futures contract means a contractual obligation to deliver the securities or foreign currency called for by the contract at a fixed price at a specified time in the future. A “purchase” of a futures contract means a contractual obligation to acquire the securities or foreign currency at a fixed price at a specified time in the future.
Should market conditions change unexpectedly, the Fund may not achieve the anticipated benefits of the futures contracts and may realize a loss. The use of futures transactions for hedging purposes involves the risk of imperfect correlation in movements in the price of futures contracts, interest rates, and the value of the underlying hedged assets.
| (g) | Written Options Contracts |
The Fund may write options contracts. A written option obligates the Fund to deliver (written call) or to receive (written put) a specified quantity of an underlying asset at the contract amount upon exercise by the holder of the option. The value of the option contract is recorded as a liability and unrealized gain or loss is measured by the difference between the current value and the premium received. Options traded on an exchange are valued at the last quoted sale price, or in the absence of a sale, the bid price provided by an independent pricing service approved by the Board of Trustees. Non-exchange traded options are valued using dealer supplied quotes.
| (h) | Mortgage Dollar Rolls |
The Fund may enter into mortgage “dollar rolls” in which the Fund sells mortgage-backed securities for delivery in the current month and simultaneously contracts to repurchase substantially similar (same type, coupon, and maturity) securities on a specified future date. Mortgage dollar rolls are referred to as TBA’s on the Statement of Investments of the Fund. During the roll period, the Fund foregoes principal and interest paid on the mortgage-backed securities. The Fund is
31
Table of Contents
GARTMORE VARIABLE INSURANCE TRUST
NOTES TO FINANCIAL STATEMENTS (Unaudited) (Continued)
June 30, 2005
compensated by fee income or the difference between the current sales price and the lower forward price for the future purchase. Mortgage dollar rolls are valued at the last quoted bid price and/or by using a combination of daily quotes and matrix evaluations provided by an independent pricing service, the use of which has been approved by the Board of Trustees.
| (i) | Short Sales |
The Fund is authorized to engage in short-selling of portfolio securities which obligates the Fund to replace and security that the Fund has borrowed by purchasing the security at current market value sometime in the future. The Fund will incur a loss if the price of the security increases between the date of the short sale and the date on which the Fund replaces the borrowed security. The Fund generally will realize a gain if the price of the security declines between these dates. Until the Fund replaces the borrowed security, the Fund will maintain a segregated account with cash, U.S. Government securities and/or securities held long to sufficiently cover the Fund’s short position on a daily basis. Dividends declared on securities sold short are recorded as an expense on the ex-dividend date and paid to the counterparty on the dividend pay date. The collateral for securities sold short are recorded as an expense on the ex-dividend date and paid to the counterparty on the dividend pay date. The collateral for securities sold short includes the deposits with brokers and securities held long as shown in the Statement of Investments for the Fund.
| (j) | Security Transactions and Investment Income |
Security transactions are accounted for on the date the security is purchased or sold (“trade date”). Securities gains and losses are calculated on the identified cost basis. Interest income is recognized on the accrual basis and includes, where applicable, the amortization or accretion of premium or discount. Dividend income is recorded on the ex-dividend date.
| (k) | Securities Lending |
To generate additional income, the Fund may lend up to 33 1/3% of the Fund’s total assets pursuant to agreements, requiring that the borrower deliver cash or securities as collateral with respect to each new loan of U.S. securities, equal to at least 102% of the value of the portfolio securities loaned, and with respect to each new loan of non-U.S. securities, collateral of at least 105% of the value of the portfolio securities loaned, and thereafter requiring the borrower to mark to market the collateral on a daily basis and requiring the borrower to make up any shortfall of collateral. The Fund receives payments from borrowers equivalent to the dividends and interest that would have been earned on securities lent while simultaneously seeking to earn income on the investment of cash collateral. Collateral is marked to market daily to provide a level of collateral at least equal to the market value of securities loaned. There may be risks of delay in recovery of the securities should the borrower of the securities fail financially. Loans will be made, however, only to borrowers deemed by the Fund’s investment adviser to be of good standing and creditworthy under guidelines established by the Board of Trustees and when, in the judgment of the adviser, the consideration which can be earned currently from these securities loans justifies the attendant risks. Loans are subject to termination by the Fund or the borrower at any time, and, therefore, are not considered to be illiquid investments. JPMorgan Chase Bank serves as custodian for the securities lending program of the Fund. JPMorgan Chase Bank receives a custody fee based on the value of collateral received from borrowers.
| (l) | Distributions to Shareholders |
The Fund’s dividends from net investment income, if any, are declared and paid quarterly. The Fund’s distributable net realized capital gains, if any, are declared and distributed at least annually.
Dividends and distributions to shareholders are determined in accordance with federal income tax regulations, which may differ from GAAP. These “book/tax” differences are considered either permanent or temporary in nature. In accordance with the American Institute of Certified Public Accountants (“AICPA”) Statement of Position 93-2, permanent differences (i.e., reclassification of market discounts, gain/loss, paydowns, and distributions) are reclassified within the capital accounts based on their nature for federal income tax purposes; temporary differences do not require reclassification. These reclassifications have no effect upon the net asset value of the Fund. To the extent distributions exceed current and accumulated earnings and profits for federal income tax purposes, these distributions are reported as distributions of paid-in-capital.
32
Table of Contents
GARTMORE VARIABLE INSURANCE TRUST
NOTES TO FINANCIAL STATEMENTS (Unaudited) (Continued)
June 30, 2005
| (m) | Federal Income Taxes |
It is the policy of the Fund to qualify or continue to qualify as a “regulated investment company” by complying with the provisions available to certain investment companies, as defined in applicable sections of the U.S. Internal Revenue Code, and to make distributions of net investment income and net realized capital gains sufficient to relieve the Fund from all, or substantially all, federal income taxes.
As of June 30, 2005, the tax cost of securities and the breakdown of unrealized appreciation (depreciation) for the Fund is as follows:
Tax Cost of | Unrealized Appreciation | Unrealized Depreciation | Net Unrealized Appreciation (Depreciation) | |||||||
$6,345,033 | $ | 167,578,685 | $ | (22,117,742 | ) | $ | 145,460,943 | |||
| (n) | Allocation of Expenses, Income, and Gains and Losses |
Expenses directly attributable to the Fund are charged to the Fund. Expenses not directly attributable to the Fund are allocated proportionately among various or all funds within the Trust. The method used by the Fund for allocating income, fund level expenses, and realized and unrealized gains or losses is based on the fair value of shares outstanding relative to net assets. Under this method, each class of shares participates based on the total net asset value of that class’s shares in proportion to the total net assets of the Fund. Expenses specific to a class (such as rule 12b-1 and administrative services fees) are charged to that class.
| 3. | Transactions with Affiliates |
Under the terms of the Trust’s Investment Advisory Agreement, Gartmore Mutual Fund Capital Trust (“GMF”) manages the investment of the assets and supervises the daily business affairs of the Fund. GMF is a wholly-owned subsidiary of Gartmore Global Investments, Inc. (“GGI”), a holding company. GGI is a majority-owned subsidiary of Gartmore Global Asset Management Trust (“GGAMT”). GGAMT is a wholly-owned subsidiary of Nationwide Corporation. All of the common stock of Nationwide Corporation is held by Nationwide Mutual Insurance Company (95.2%) and Nationwide Mutual Fire Insurance Company (4.8%), each of which is a mutual company owned by its policyholders. In addition, GMF provides investment management evaluation services in initially selecting and monitoring, on an ongoing basis, the performance of the subadvisers, for the Fund. The subadvisers listed below manage all or a portion of the Fund’s investments and have the responsibility for making all investment decisions for that portion of the Fund unless otherwise indicated. Below is a list of the subadvisers to the Fund:
| Subadvisers* | ||
- The Dreyfus Corporation | ||
- Neuberger Berman, LLC | ||
- Gartmore Global Partners** | ||
- American Century Investment Management Company | ||
- Morgan Stanley Investments Management, Inc. | ||
- Waddell & Reed Investment Management Company | ||
| * | GMF, as investment adviser, directly manages a portion of the Fund. |
| ** | Affliate of GMF and GGAMT. |
Under the terms of the Investment Advisory Agreement, the Fund pays GMF an investment advisory fee of 0.93% based on that Fund’s average daily net assets. From such fees, pursuant to the subadvisory agreements, GMF pays fees of 0.60% to the subadvisers.
Under the terms of a Fund Administration and Transfer Agency Agreement, Gartmore SA Capital Trust (“GSA”) provides the Fund with various administrative and accounting services, and Gartmore Investors Services, Inc. (“GISI”), an indirect
33
Table of Contents
GARTMORE VARIABLE INSURANCE TRUST
NOTES TO FINANCIAL STATEMENTS (Unaudited) (Continued)
June 30, 2005
subsidiary of GSA, serves as Transfer and Dividend Disbursing Agent for the Fund. The fees for the services provided under this Agreement are calculated based on the Trust’s average daily net assets according to the fee schedule below. The fees are then allocated proportionately among all funds within the Trust in relation to the average daily net assets of each fund and are paid to GSA. GSA pays GISI from these fees for its services.
| Combined Fee Schedule* | ||
Up to $1 billion | 0.13% | |
$1 billion and more up to $3 billion | 0.08% | |
$3 billion and more up to $8 billion | 0.05% | |
$8 billion and more up to $10 billion | 0.04% | |
$10 billion and more up to $12 billion | 0.02% | |
$12 billion or more | 0.01% | |
| * | The assets of the Gartmore GVIT Investor Destinations Aggressive Fund, the Gartmore GVIT Investor Destinations Moderately Aggressive Fund, the Gartmore GVIT Investor Destinations Moderate Fund, the Gartmore GVIT Investor Destinations Moderately Conservative Fund, and the Gartmore GVIT Investor Destinations Conservative Fund (collectively, the “Investor Destinations Funds”) are excluded from the Trust asset level amount in order to calculate this asset-based fee. The Investor Destinations Funds do not pay any part of this fee. |
Effective January 1, 2005, the fee for the fund administration and transfer agency services increased as set forth below. The fees are calculated based on the Trust’s average daily net assets according to the fee schedule below. The fees are then allocated proportionately among all funds within the Trust in relation to the average daily net assets of each fund and are paid to GSA.
| Combined Fee Schedule* | ||
Up to $1 billion | 0.15% | |
$1 billion and more up to $3 billion | 0.10% | |
$3 billion and more up to $8 billion | 0.05% | |
$8 billion and more up to $10 billion | 0.04% | |
$10 billion and more up to $12 billion | 0.02% | |
$12 billion or more | 0.01% | |
| * | The assets of each of the Investor Destinations Funds are excluded from the Trust asset level amount in order to calculate this asset-based fee. The Investor Destinations Funds do not pay any part of this fee. |
GSA and GISI have entered into agreements with BISYS Fund Services Ohio, Inc. (“BISYS”), pursuant to which BISYS provides sub-administration and sub-transfer agency services, respectively, to the Fund.
Under the terms of a Distribution Plan under Rule 12b-1 of the 1940 Act, Gartmore Distribution Services, Inc. (“GDSI”), the Fund’s Distributor, is compensated by the Fund for expenses associated with the distribution of the Class II shares of the Fund. These fees are based on average daily net assets of Class II and shares of the Fund at an annual rate not to exceed 0.25%.
Under the terms of an Administrative Services Plan, the Fund may pay fees to servicing organizations, such as broker-dealers, including Nationwide Financial Services, and financial institutions, which agree to provide administrative support services to the shareholders of certain classes. These services include, but are not limited, to the following: establishing and maintaining shareholder accounts; processing purchase and redemption transactions; arranging bank wires; performing shareholder sub-accounting; answering inquires regarding the Fund; and other such services. These fees are based on an annual rate of up to 0.25% of the average daily net assets of Class I, Class II, and Class III shares of the Fund and 0.20% of Class IV shares on the Fund.
4. Short-Term Trading Fees
The Fund reserves the right to assess a short-term trading fee on certain transactions out of Class III and Class VI shares that a separate account makes on behalf of a variable insurance contract owner (the “contract owner”). A separate account that
34
Table of Contents
GARTMORE VARIABLE INSURANCE TRUST
NOTES TO FINANCIAL STATEMENTS (Unaudited) (Continued)
June 30, 2005
redeems Class III or Class VI shares on behalf of a contract owner may be subject to a 1.00% short-term trading fee if the separate account held the Class III or Class VI shares on behalf of the contract owner for 60 days or less, unless an exception applies as disclosed in the prospectus. The short-term trading fee is paid directly to the Fund and is intended to offset the cost to the Fund of excess brokerage commissions and other costs associated with fluctuations in fund asset levels and cash flow caused by short-term trading. For purposes of determining whether the short-term trading fee applies, the Class III or Class VI shares that were held on behalf of the contract owner the longest will be treated as being redeemed first.
For the six months ended June 30, 2005, the Fund had no contributions to capital due to collection of redemption fees.
5. Investment Transactions
For the six months ended June 30, 2005, (excluding short-term securities) the Fund had purchases of $612,329,257 and sales of $661,022,004.
6. Bank Loans
The Trust has a credit agreement of $100,000,000. Borrowings under this arrangement bear interest at the Federal Funds rate plus 0.50%. The interest costs are included in custodian fees in the Statement of Operations. No compensation balances were required under the terms of the line of credit. There were no borrowings outstanding as of June 30, 2005.
7. Shareholder Meeting
A separate shareholders meeting was held on Tuesday, December 23, 2004, for the shareholders of the Trust’s predecessor pursuant to a Proxy Statement On Schedule 14A, dated October 29, 2004, and mailed to the shareholders of the Trust’s predecessor on or around November 5, 2004.
Two Proposals: The purpose of the December 23, 2004 meeting was to allow the shareholders of the Trust’s predecessor to vote on:
| i. | Proposal One: The election of the Trust’s Board of Trustees; and |
| ii. | Proposal Two: The approval of an “Agreement and Plan of Reorganization” that provided for the reorganization of the Trust from a Massachusetts business trust into a Delaware statutory trust. |
Proposal One: As set forth in the October 29, 2004 Proxy Statement, the nominees for election as Trustees of the Trust’s predecessor were: Charles E. Allen, Michael J. Baresich, Paula H.J. Cholmondeley, C. Brent DeVore, Phyllis Kay Dryden, Robert M. Duncan, Barbara L. Hennigar, Paul J. Hondros, Barbara I Jacobs, Thomas J. Kerr IV, Douglas F. Kridler, Michael D. McCarthy, Arden L. Shisler, and David C. Wetmore.
Proposal Two: As specifically set forth in the October 29, 2004 Proxy Statement, the Reorganization proposal requested the shareholders of the Trust’s predecessor to approve the proposed “Agreement and Plan of Reorganization” of the Trust’s predecessor (on behalf of each of the its funds) into a new Delaware-domiciled Trust, whereby the Funds of the new Delaware Trust would acquire all of the assets of the corresponding funds of the Trust’s predecessor subject to the liabilities, expenses, costs, charges, and reserves of the corresponding funds of the Trust’s predecessor (contingent or otherwise), in exchange for shares of the acquiring Funds to be distributed pro rata by the Trust to the holders of the shares of the funds of the Trust’s predecessor, in a complete liquidation of the Trust’s predecessor.
35
Table of Contents
GARTMORE VARIABLE INSURANCE TRUST
NOTES TO FINANCIAL STATEMENTS (Unaudited) (Continued)
June 30, 2005
| Voting | Results: |
The shareholders of the Trust’s predecessor voted to approve both Proposal One and Proposal Two, as follows:
Proposal 1: Election of a Board of Trustees of Gartmore Variable Insurance Trust
Charles E. Allen: | ||
FOR | 2,797,230,318.955 shares (96.078%) | |
WITHHOLD | 114,195,693.660 shares (3.922%) | |
TOTAL | 2,912,726,012.615 shares (100.000%) | |
Michael J. Baresich: | ||
FOR | 2,796,135,979.559 shares (96.040%) | |
WITHHOLD | 115,290,033.056 shares (3.960%) | |
TOTAL | 2,912,726,012.615 shares (100.000%) | |
Paula H.J. Cholmondeley: | ||
FOR | 2,795,095,945.396 shares (96.004%) | |
WITHHOLD | 116,330,067.219 shares (3.996%) | |
TOTAL | 2,912,726,012.615 shares (100.000%) | |
C. Brent DeVore: | ||
FOR | 2,797,207,046.916 shares (96.077%) | |
WITHHOLD | 114,218,965.699 shares (3.923%) | |
TOTAL | 2,912,726,012.615 shares (100.000%) | |
Phyllis Kay Dryden: | ||
FOR | 2,795,587,023.994 shares (96.021%) | |
WITHHOLD | 115,838,988.621 shares (3.979%) | |
TOTAL | 2,912,726,012.615 shares (100.000%) | |
Robert M. Duncan: | ||
FOR | 2,790,191,720.503 shares (95.836%) | |
WITHHOLD | 121,234,292.112 shares (4.164%) | |
TOTAL | 2,912,726,012.615 shares (100.000%) | |
Barbara L. Hennigar: | ||
FOR | 2,792,939,848.858 shares (95.937%) | |
WITHHOLD | 118,486,163.757 shares (4.070%) | |
TOTAL | 2,912,726,012.615 shares (100.000%) | |
Paul J. Hondros: | ||
FOR | 2,797,557,404.448 shares (96.089%) | |
WITHHOLD | 113,868,608.167 shares (3.911%) | |
TOTAL | 2,912,726,012.615 shares (100.000%) | |
36
Table of Contents
GARTMORE VARIABLE INSURANCE TRUST
NOTES TO FINANCIAL STATEMENTS (Unaudited) (Continued)
June 30, 2005
Barbara I. Jacobs: | ||
FOR | 2,796,306,126.654 shares (96.046%) | |
WITHHOLD | 115,119,885.961 shares (3.954%) | |
TOTAL | 2,912,726,012.615 shares (100.000%) | |
Thomas J. Kerr IV: | ||
FOR | 2,789,755,720.087 shares (95.821%) | |
WITHHOLD | 121,670,292.528 shares (4.179%) | |
TOTAL | 2,912,726,012.615 shares (100.000%) | |
Douglas F. Kridler: | ||
FOR | 2,798,065,774.375 shares (96.106%) | |
WITHHOLD | 113,360,238.240 shares (3.894%) | |
TOTAL | 2,912,726,012.615 shares (100.000%) | |
Michael D. McCarthy: | ||
FOR | 2,797,452,613.694 shares (96.085%) | |
WITHHOLD | 113,973,395.921 shares (3.915%) | |
TOTAL | 2,912,726,012.615 shares (100.000%) | |
Arden L. Shisler: | ||
FOR | 2,796,738,454.730 shares (96.061%) | |
WITHHOLD | 114,687,557.885 shares (3.939%) | |
TOTAL | 2,912,726,012.615 shares (100.000%) | |
David C. Wetmore: | ||
FOR | 2,794,784,752.247 shares (95.994%) | |
WITHHOLD | 116,641,260.368 shares (4.006%) | |
TOTAL | 2,912,726,012.615 shares (100.000%) | |
Proposal 2: Approval of the Agreement and Plan of Reorganization of Gartmore Variable Insurance Trust
FOR | 2,561,003,822.546 shares (87.964%) | |
AGAINST | 103,593,261.010 shares (3.558%) | |
ABSTAIN | 246,828,929.059 shares (8.478%) | |
TOTAL | 2,912,726,012.615 shares (100.000%) | |
37
Table of Contents
GARTMORE VARIABLE INSURANCE TRUST
Management Information (Unaudited)
June 30, 2005
Trustees who are not Interested Persons (as defined in the 1940 Act) and Officers of the Funds June 30, 2005
| Name, Address and Date of Birth | Position(s) Held with the Trust and Length of Time Served1 | Principal Occupation(s) During Past 5 Years | Number of Portfolios in the Gartmore Fund Complex Overseen by Trustee | Other Directorships Held by Trustee or Nominee2 | ||||
Charles E. Allen
c/o Gartmore Global Investments, Inc. 1200 River Road, Suite 1000 Conshohocken, PA 19428
1948 | Trustee since July 2000 | Mr. Allen is Chairman, Chief Executive Officer and President of the Graimark Realty Advisors, Inc. (real estate development, investment and asset management). | 84 | None | ||||
Paula H.J. Cholmondeley
c/o Gartmore Global Investments, Inc. 1200 River Road, Suite 1000 Conshohocken, PA 19428
1940 | Trustee since July 2000 | Ms. Cholmondeley has been the Chairman and Chief Executive Officer of the Sorrel Group, a management consulting company, since January 2004. From March 2000 through December 2003, Ms. Cholmondeley was Vice President and General Manager of Sappi Fine Paper North America. Prior thereto, Ms. Cholmondeley was Vice President and General Manager of Residential Insulation of Owens Corning. | 84 | Director of Dentsply International, Inc., Ultralife Batteries, Inc., Terex Corporation, Minerals Technology, Inc. and Albany International Corp. | ||||
C. Brent DeVore
c/o Gartmore Global Investments, Inc. 1200 River Road, Suite 1000 Conshohocken, PA 19428
1940 | Trustee since 1990 | Dr. DeVore is President of Otterbein College. | 84 | None | ||||
Phyllis K. Dryden
c/o Gartmore Global Investments, Inc. 1200 River Road, Suite 1000 Conshohocken, PA 19428
1947 | Trustee since December 2004 | Ms. Dryden was a former Managing Partner of marchFIRST, a global management consulting firm prior to 2002. | 84 | None |
38
Table of Contents
GARTMORE VARIABLE INSURANCE TRUST
Management Information (Unaudited)
June 30, 2005
| Name, Address and Date of Birth | Position(s) Held with the Trust and Length of Time Served1 | Principal Occupation(s) During Past 5 Years | Number of Portfolios in the Gartmore Fund Complex Overseen by Trustee | Other Directorships Held by Trustee or Nominee2 | ||||
Barbara L. Hennigar*
c/o Gartmore Global Investments, Inc. 1200 River Road, Suite 1000 Conshohocken, PA 19428
1935 | Trustee since July 2000 | Retired since June 2000. Prior thereto, Ms. Hennigar was the Chairman or President and Chief Executive Officer of OppenheimerFunds Services and a member of the Executive Committee of OppenheimerFunds. | 84 | None | ||||
Barbara I. Jacobs
c/o Gartmore Global Investments, Inc. 1200 River Road, Suite 1000 Conshohocken, PA 19428
1950 | Trustee since December 2004 | Ms. Jacobs has served as Chairman of the Board of Directors of KICAP Network Fund, a European (United Kingdom) hedge fund, since December 2000. Prior to 2004, Ms. Jacobs was also a Managing Director and European Portfolio Manager with CREF Investments (Teachers Insurance Annuity Association — College Retirement Equity Fund). | 84 | None | ||||
Douglas F. Kridler
c/o Gartmore Global Investments, Inc. 1200 River Road, Suite 1000 Conshohocken, PA 19428
1955 | Trustee since September 1997 | Mr. Kridler has served as the President and Chief Executive Officer of the Columbus Foundation (a Columbus, OH-based foundation which manages over 1,300 individual endowment funds) since February 2002. Mr. Kridler was the President of the Columbus Association for the Performing Arts prior thereto and Chairman of the Greater Columbus Convention and Visitors Bureau during 2000 and 2001. | 84 | None | ||||
Michael D. McCarthy
c/o Gartmore Global Investments, Inc. 1200 River Road, Suite 1000 Conshohocken, PA 19428
1947 | Trustee since December 2004 | Mr. McCarthy serves as: the Founder and Chairman of The Eureka Foundation (which sponsors and funds the “Great Museums” series on PBS); and a Partner of Pineville Properties LLC (a commercial real estate development firm). | 843 | None |
39
Table of Contents
GARTMORE VARIABLE INSURANCE TRUST
Management Information (Unaudited)
June 30, 2005
| Name, Address and Date of Birth | Position(s) Held with the Trust and Length of Time Served1 | Principal Occupation(s) During Past 5 Years | Number of Portfolios in the Gartmore Fund Complex Overseen by Trustee | Other Directorships Held by Trustee or Nominee2 | ||||
David C. Wetmore
c/o Gartmore Global Investments, Inc. 1200 River Road, Suite 1000 Conshohocken, PA 19428
1948 | Trustee since 1995 and Chairman since February 2005 | Retired. Mr. Wetmore was formerly a Managing Director of Updata Capital, an investment banking and venture capital firm. | 84 | None |
| * | Pursuant to the Trust’s mandatory retirement policy, Ms. Hennigar is expected to retire on or about January 12, 2006. |
| 1 | The term of office length is until a trustee resigns or reaches a mandatory retirement age of 70. On March 2, 2000, the Board adopted a five-year implementation period for any Trustee 65 or older as of the adoption of this policy. Pursuant to this policy, Messrs. Duncan and Kerr retired as trustees effective as of March 12, 2005. |
| 2 | Directorships held in (1) any other investment companies registered under the 1940 Act, (2) any company with a class of securities registered pursuant to Section 12 of the Securities Exchange Act of 1934, as amended (the “Exchange Act”), or (3) any company subject to the requirements of Section 15(d) of the Exchange Act. |
| 3 | Mr. McCarthy was also an Administrative Committee Member for the Alphagen Arneb Fund, LLC, The Healthcare Fund LDC, The Leaders Long-Short Fund, LLC, and The Leaders Long-Short Fund LDC, four private investment companies (hedge funds) managed by GSA. Mr. McCarthy resigned as an Administrative Committee Member June 30, 2005. |
Trustees and Officers who are not Interested Persons (as defined in the 1940 Act) of the Funds received aggregate compensation of $274,882 from the Trust for the Six Months Ended June 30, 2005. Additional information regarding the Trustees and Officers may be found in the Trust’s statement of additional information, which is available without charge upon request, by calling 1-800-848-0920.
40
Table of Contents
GARTMORE VARIABLE INSURANCE TRUST
Management Information (Unaudited)
June 30, 2005
Trustees who are Interested Persons (as defined in the 1940 Act) and/or Officers of the Funds June 30, 2005
| Name, Address and Age | Position(s) Held with the Trust and Length of Time Served1 | Principal Occupation(s) During Past 5 Years | Number of Portfolios in the Gartmore Fund Complex Overseen by Trustee | Other Directorships Held by Trustee2 | ||||
Paul J. Hondros
Gartmore Global Investments, Inc. 1200 River Road, Suite 1000 Conshohocken, PA 19428
1948 | Trustee since July 2000 | Mr. Hondros has been President and Chief Executive Officer of various Gartmore entities, including Gartmore Distribution Services, Inc. (“GDSI”),3 Gartmore Investor Services, Inc. (“GISI”),3 Gartmore Morley Capital Management, Inc. (“GMCM”),3 Gartmore Morley Financial Services, Inc. (“GMFS”),3 NorthPointe Capital, LLC (“NorthPointe”),3 Gartmore Global Asset Management Trust (“GGAMT”)3, Gartmore Global Investments, Inc. (“GGI”)3, Gartmore Mutual Fund Capital Trust (“GMFCT”)3 and Gartmore SA Capital Trust (“GSA”)3; and a Director of Nationwide Securities, Inc.3, as well as several entities within Nationwide Financial Services, Inc. | 844 | None | ||||
Arden L. Shisler
c/o Gartmore Global Investments, Inc. 1200 River Road, Suite 1000 Conshohocken, PA 19428
1941 | Trustee since February 2000 | Mr. Shisler has been a consultant since January 2003. Prior thereto, he was President and Chief Executive Officer of K&B Transport, Inc., a trucking firm. Since 1992, Mr. Shisler has also been Chairman of the Board for Nationwide Mutual Insurance Company3. | 84 | Director of Nationwide Financial Services, Inc. | ||||
Gerald J. Holland
Gartmore Global Investments, Inc. 1200 River Road, Suite 1000 Conshohocken, PA 19428
1951 | Treasurer since March 2001 | Mr. Holland is Senior Vice President — Operations for GGI3, GMFCT3 , and GSA3. Prior to July 2000, Mr. Holland was Vice President for First Data Investor Services, an investment company service provider. | 84 | None |
41
Table of Contents
GARTMORE VARIABLE INSURANCE TRUST
Management Information (Unaudited)
June 30, 2005
| Name, Address and Age | Position(s) Held with the Trust and Length of Time Served1 | Principal Occupation(s) During Past 5 Years | Number of Portfolios in the Gartmore Fund Complex Overseen by Trustee | Other Directorships Held by Trustee2 | ||||
Michael A. Krulikowski
Gartmore Global Investments, Inc. 1200 River Road, Suite 1000 Conshohocken, PA 19428
1959 | Chief Compliance Officer since June 2004 | Since November 1999, Mr. Krulikowski has served as a Vice President and Chief Compliance Officer of GGI. Prior thereto, Mr. Krulikowski served as Chief Compliance Officer of 1717 Capital Management Company/Provident Mutual Insurance Company. | 84 | None | ||||
Eric E. Miller
Gartmore Global Investments, Inc. 1200 River Road, Suite 1000 Conshohocken, PA 19428
1953 | Secretary since December 2002 | Mr. Miller is Senior Vice President, Chief Counsel for GGI3, GMFCT3 and GSA3 since August 2002. From August 2000 to August 2002, Mr. Miller was a Partner with Stradley Ronan Stevens & Young, LLP. Prior to August 2000, Mr. Miller served as Senior Vice President and Deputy General Counsel at Delaware Investments. | 84 | None |
| 1 | The term of office length is until a trustee resigns or reaches a mandatory retirement age of 70. On March 2, 2000, the Board adopted a five-year implementation period for any Trustee 65 or older as of the adoption of this policy. Pursuant to this policy, Messrs. Duncan and Kerr retired as trustees effective as of March 12, 2005. |
| 2 | Directorships held in (1) any other investment companies registered under the 1940 Act, (2) any company with a class of securities registered pursuant to Section 12 of the Securities Exchange Act of 1934, as amended (the “Exchange Act”), or (3) any company subject to the requirements of Section 15(d) of the Exchange Act. |
| 3 | This position is held with an affiliated person or principal underwriter of the Trust. |
| 4 | Mr. Hondros was also an Administrative Committee Member for the Alphagen Arneb Fund, LLC, The Healthcare Fund LDC, The Leaders Long-Short Fund, LLC, and The Leaders Long-Short Fund LDC, four private investment companies (hedge funds) managed by GSA. Mr. Hondros resigned as Administrative Committee Member effective June 30, 2005. |
Federal law requires the Trust, each of its investment advisers and sub-advisers to adopt procedures for voting proxies (“Proxy Voting Guidelines”) and to provide a summary of those Proxy Voting Guidelines used to vote the securities held by the Funds. The Funds’ proxy voting policies and procedures are available without charge (i) upon request, by calling 1-800-848-0920, (ii) on the Fund’s website at www.gartmorefunds.com, or (iii) on the Securities and Exchange Commission’s website at www.sec.gov.
42
Table of Contents
Gartmore GVIT Money Market Fund
Semiannual Report
| | June 30, 2005 |
| Contents | ||
| 6 | Statement of Investments | |
| 10 | Statement of Assets and Liabilities | |
| 10 | Statement of Operations | |
| 11 | Statements of Changes in Net Assets | |
| 13 | Financial Highlights | |
| 14 | Notes to Financial Statements | |
Commentary provided by Gartmore Global Investments, investment adviser to Gartmore Variable Insurance Trust. All opinions and estimates included in this report constitute Gartmore Global Investments’ judgment as of the date of this report and are subject to change without notice.
Statement Regarding Availability of Quarterly Portfolio Schedule.
The Gartmore Variable Insurance Trust files complete schedules of portfolio holdings for each Fund with the Securities and Exchange Commission (the “Commission”) for the first and third quarters of each fiscal year on Form N-Q. The Funds’ Forms N-Q are available on the Commission’s website at http://www.sec.gov. The Funds’ Forms N-Q may be reviewed and copied at the Commission’s Public Reference Room in Washington, DC, and information on the operation of the Public Reference Room may be obtained by calling 800-SEC-0330; and the Funds make the information on Form N-Q available to shareholders upon request without charge.
Statement Regarding Availability of Proxy Voting Record.
Information regarding how the Fund voted proxies relating to portfolio securities held during the most recent 12-month period ended June 30, 2005 is available without charge, upon request, by calling 800-848-0920, and on the Commission’s website at http://www.sec.gov.
Table of Contents
Gartmore GVIT Money Market Fund
For the semiannual period ended June 30, 2005, the Gartmore GVIT Money Market Fund returned 1.06% (Class I at NAV) versus 1.38% for its benchmark, the iMoneyNet First Tier Retail Index. For broader comparison, the average return for the Fund’s Lipper peer category of Money Market Funds was 1.07%.
During the reporting period, the investment strategy remained relatively consistent due to the rising-interest-rate environment and the likelihood that short-term rates would continue to rise. As a result, the weighted average maturity throughout the quarter remained in a range of between 35 and 45 days.
The Federal Reserve Board raised short-term rates by a total of 1.00% in four consecutive moves over the reporting period. The most recent increase on June 30, 2005, represented the ninth straight 25-basis-point hike in the federal funds rate, which has risen from 1.00% in June 2004 to the current level of 3.25%. During the period, financial markets dealt with record high oil prices, rising deficits, lower long-term interest rates and fears of an overheating housing market. In their June 30, 2005, statement, the Fed mentioned that: 1) inflation remained at an “elevated” level; 2) the expansion remained “firm”; and 3) rates would likely rise at a measured pace. Given the Fed’s determination to fight inflation, and in line with its belief that the economy is on a firm footing, short-term interest rates may continue to rise to a “neutral” level—the point at which interest rates keep inflation at an acceptable level while maintaining a suitable rate of growth. Financial markets and analysts differ greatly as to what this actual rate is, but it is generally believed to be somewhere between 3.25% and 4.25%.
During the reporting period, Fund assets were somewhat more volatile due to investors moving from fixed income into the equity markets. The asset-backed commercial paper market continues to have many benefits over traditional corporate paper. Asset-backed securities (ABS) are those backed by pools that can comprise assets such as trade receivables, mortgages and credit cards. In addition to offering greater diversification, ABS also is bankruptcy remote and historically have returned higher yields over traditional corporate paper. The ABS market currently comprises roughly 60% of the short-term market.
In addition to the ABS market, floating-rate instruments tied to the one-month LIBOR (London Interbank Offered Rate) also were attractive. LIBOR is the index traditionally used for floating- rate instruments. The one-month LIBOR index was the most attractive due to the rising-interest- rate environment. For quarter-end, ABS and floating-rate notes made up 50% and 25% of the portfolio, respectively. The Fund continues to hold only Tier One securities (two top-tier ratings), and no ratings downgrades occurred during the period.
The Fund is well positioned for a continued rising-interest-rate environment due to its lower weighted average maturity and its diversified portfolio.
PORTFOLIO MANAGER: Karen Mader
An investment in a money market fund is not insured or guaranteed by the FDIC or any other government agency. Although a money market fund seeks to preserve the value of your investment at $1.00 per share, it is possible to lose money by investing in the money market.
Investing in mutual funds involves risk, including possible loss of principal.
There is no assurance that the investment objective of any fund will be achieved.
There is no assurance that a diversified portfolio will produce better results than a nondiversified one.
iMoneyNet First Tier Retail Index: An unmanaged index that is an average of non-government retail money market mutual funds that do not invest in any second-tier securities. Portfolio holdings of first-tier money market mutual funds include U.S. Treasury, U.S. other, repurchase agreements, time deposits, domestic and foreign bank obligations, first-tier commercial paper, floating-rate notes and asset-backed commercial paper.
Lipper Analytical Services, Inc. is an industry research firm whose rankings are based on total return performance and do not reflect the effects of sales charges.
The Gartmore Variable Insurance Trust Funds are available only as sub-account investment options in certain variable insurance products. Accordingly, investors are unable to invest in shares of these funds outside of an insurance product. Performance information found herein reflects only the performance of these funds, and does not indicate the performance your sub-account may experience under your variable insurance contract. Performance returns assume reinvestment of all distributions. The investment return and principal value of an investment will fluctuate so that an investor’s shares, when redeemed, may be worth more or less than their original cost. Index performance is provided for comparison purposes only; the indexes shown are unmanaged and do not reflect any fees or expenses. Investors cannot invest directly in market indexes. To obtain performance information about the sub-account option under your insurance contract that invests in one of these funds, please contact your variable insurance carrier. PAST PERFORMANCE IS NO GUARANTEE OF FUTURE RESULTS.
1
Table of Contents
Gartmore GVIT Money Market Fund (continued)
Commentary provided by Gartmore Global Investments. All opinions and estimates included in this report constitute Gartmore Global Investments’ judgment as of the date of this report and are subject to change without notice.
Investors should carefully consider a fund’s investment objectives, risks, fees, charges and expenses before investing any money. To obtain this and other information on Gartmore Variable Insurance Trust, please contact your variable insurance contract provider or call 800-848-0920. Please read the Trust’s prospectus carefully before investing any money.
Gartmore Funds distributed by Gartmore Distribution Services, Inc., Member NASD. 1200 River Road, Suite 1000, Conshohocken, PA 19428.
2
Table of Contents
Fund Performance | Gartmore GVIT Money Market Fund |
| Average | Annual Total Return1 |
(For Periods Ended June 30, 2005)
| Six months* | One year | Five years | Ten years | |||||
| Class I2 | 1.06% | 1.63% | 2.08% | 3.64% | ||||
| Class IV3 | 1.13% | 1.76% | 2.14% | 3.67% | ||||
| Class V3 | 1.10% | 1.71% | 2.13% | 3.66% |
| * | Not Annualized. |
| 1 | Not subject to any sales charges. |
| 2 | The existing shares of the Fund were designated Class I shares as of May 1, 2001. |
| 3 | These returns until the creation of Class IV shares (April 28, 2003) and Class V shares (October 31, 2002) are based on the performance of the Class I shares of the Fund. Excluding the effect of fee waivers or reimbursements, such prior performance is similar to what Class IV or Class V shares would have produced because all classes of shares invest in the same portfolio of securities. The performance for Class V shares has not been adjusted to reflect its lower expenses. |
| Performance | of a $10,000 Investment |
Investment return and principal value will fluctuate, and when redeemed, shares may be worth more or less than original cost. Past performance is no guarantee of future results and does not reflect the deduction of taxes that a shareholder would pay on fund distributions or the redemption of fund shares. Investing in mutual funds involves market risk, including loss of principal. Performance returns assume the reinvestment of all distributions.

Comparative performance of $10,000 invested in Class I shares of the Gartmore GVIT Money Market Fund, the iMoneyNet First Tier Retail Index (iMoneyNet First Tier Retail)(a), and the Consumer Price Index (CPI)(b) over as 10-year period ended 06/30/05. Unlike, the Fund, the returns for these unmanaged indexes do not reflect any fees, expenses, or sales charges. Investors cannot invest directly in market indexes.
| (a) | The iMoneyNet First Tier Retail Index is unmanaged index that is an average of non-government retail money market mutual funds that do not invest in any second-tier securities. Portfolio holdings of first-tier money market mutual funds include U.S. Treasury, U.S. other, repurchase agreements, time deposits, domestic and foreign bank obligations, first-tier commercial paper, floating-rate notes and asset-backed commercial paper. |
| (b) | The CPI represents changes in prices of a basket of goods and services purchased for consumption by urban households. |
3
Table of Contents
Shareholder
Expense Example | Gartmore GVIT Money Market Fund |
As a shareholder of the Fund, you incur two types of costs: (1) transaction costs, including sales charges (loads) paid on purchase payments and redemption fees; and (2) ongoing costs, including investment advisory fees, administration fees, distribution fees and other Fund expenses. The examples below are intended to help you understand your ongoing costs (in dollars) of investing in the Fund and to compare these costs with the ongoing costs of investing in other mutual funds. Per SEC requirements, the examples assume that you had a $1,000 investment in the Class at the beginning of the reporting period, January 1, 2005, and continued to hold your shares at the end of the reporting period, June 30, 2005.
Actual Expenses
For each Class of the Fund in the table below, the first line provides information about actual account values and actual expenses. You may use the information in this line, together with the amount you invested, to estimate the expenses that you paid over the period. Simply divide your account value by $1,000 (for example, an $8,600 account value divided by $1,000 = 8.6), then multiply the result by the number in the first line of each Class under the heading entitled “Expenses Paid During Period” to estimate the expenses you paid on your account during the period.
Hypothetical Example for Comparison Purposes
The second line of each Class in the table below provides information about hypothetical account values and hypothetical expenses based on the Class’ actual expense ratio and an assumed rate of return of 5% per year before expenses, which is not the Class’ actual return. The hypothetical account values and expenses may not be used to estimate the actual ending account balance or expenses you paid for the period. You may use this information to compare the ongoing costs of investing in the Class of the Fund and other funds. To do so, compare this 5% hypothetical example with the 5% hypothetical examples that appear in the shareholder reports of the other funds.
Please note that the expenses shown in the table are meant to highlight your ongoing costs only and do not reflect any transaction costs, such as sales charges (loads) or redemption fees. Therefore, the second line for each Class in the table is useful in comparing ongoing costs only, and will not help you determine the relative total costs of owning different funds. In addition, if these transaction costs were included, your costs would have been higher. The examples also assume all dividends and distributions have been reinvested.
| Beginning Account Value, January 1, 2005 | Ending Account Value, June 30, 2005 | Expenses Paid During Period* | Annualized Expense Ratio* | ||||||||||
| Money Market Fund | |||||||||||||
Class I | Actual | $ | 1,000 | $ | 1,011 | $ | 3.19 | 0.64% | |||||
| Hypothetical1 | $ | 1,000 | $ | 1,022 | $ | 3.21 | 0.64% | ||||||
Class IV | Actual | $ | 1,000 | $ | 1,011 | $ | 2.49 | 0.50% | |||||
| Hypothetical1 | $ | 1,000 | $ | 1,023 | $ | 2.51 | 0.50% | ||||||
Class V | Actual | $ | 1,000 | $ | 1,011 | $ | 2.79 | 0.56% | |||||
| Hypothetical1 | $ | 1,000 | $ | 1,022 | $ | 2.81 | 0.56% | ||||||
| * | Expenses are equal to the Fund’s annualized expense ratio multiplied by the average account value over the period multiplied by 181/365 (to reflect the one-half year period). The expense ratio presented represents a six month, annualized ratio in accordance with SEC guidelines. |
| 1 | Represents the hypothetical 5% return before expenses. |
4
Table of Contents
Portfolio Summary
(June 30, 2005) | Gartmore GVIT Money Market Fund |
The SEC adopted a requirement that Funds present their portfolio holdings in a table, chart or graph format in their annual and semiannual reports to shareholders, whether or not a statement of investments is utilized. The following tables, which present portfolio holdings as a percentage of net assets, are provided in compliance with this requirement.
| Asset Allocation | ||
| Commercial Paper | 35.6% | |
| Asset Backed Commercial Paper | 35.0% | |
| Floating Rate Notes | 24.6% | |
| Municipal Bond | 3.3% | |
| U.S. Government Agencies | 1.7% | |
| Liabilities in excess of other assets | -0.2% | |
| 100.0% | ||
| Top Holdings | ||
| Northern Rock PLC, 3.09%, 07/05/05 | 3.0% | |
| Thornburg Mortgage Capital, 3.22%, 07/15/05 | 2.4% | |
| Georgetown Funding Co., 3.15%, 07/19/05 | 2.2% | |
| Lockhart Funding LLC, 3.41%, 07/01/05 | 2.1% | |
| Goldman Sachs Group, Inc., 3.41%, 05/19/06 | 2.1% | |
| Kitty Hawk Funding Corp., 3.29%, 07/25/05 | 2.0% | |
| ING U.S. Funding, 3.34%, 08/22/05 | 1.9% | |
| Morgan Stanley Dean Witter & Co., 3.13%, 02/03/06 | 1.7% | |
| Stanfield Victoria Funding LLC, 3.26%, 05/24/06 | 1.6% | |
| South Carolina Public Service Authority, 3.31%, 07/28/05 | 1.6% | |
| Other Holdings | 79.4% | |
| 100.0% | ||
| Top Industries | ||
| Asset Backed Securities — Yankee | 15.8% | |
| Banks — Foreign | 12.7% | |
| Asset Backed — Trade & Term Receivables | 9.1% | |
| Asset Backed — Mortgages | 7.6% | |
| Asset Backed Securities — Domestic | 7.2% | |
| Broker/Dealer | 5.4% | |
| Asset Backed CDO | 5.3% | |
| Banks — Mortgage | 4.6% | |
| Financial Services | 4.5% | |
| Finance Lessors | 3.6% | |
| Other Industries | 24.2% | |
| 100.0% | ||
5
Table of Contents
GARTMORE VARIABLE INSURANCE TRUST
GARTMORE GVIT MONEY MARKET FUND
Statement of Investments — June 30, 2005 (Unaudited)
| Principal Amount | Value | |||||
| ASSET BACKED COMMERCIAL PAPER (35.0%) | ||||||
| Asset Backed CDO—Trust Preferred (2.1%) | ||||||
| Lockhart Funding LLC (b) (2.1%) | ||||||
| 3.41%, 07/01/05 | $ | 38,000,000 | $ | 38,000,000 | ||
| Asset Backed—Domestic (5.8%) | ||||||
| CC USA, Inc. (b) (3.7%) | ||||||
| 3.28%, 08/01/05 | 15,000,000 | 14,957,763 | ||||
| 3.26%, 08/05/05 | 23,200,000 | 23,127,084 | ||||
| 3.22%, 08/10/05 | 10,000,000 | 9,964,333 | ||||
| 3.31%, 08/22/05 | 10,000,000 | 9,952,333 | ||||
| 3.27%, 08/26/05 | 7,500,000 | 7,462,083 | ||||
| 65,463,596 | ||||||
| Harrier Financial Funding US LLC (b) (2.2%) | ||||||
| 3.09%, 07/05/05 | 8,000,000 | 7,997,253 | ||||
| 3.31%, 07/27/05 | 12,000,000 | 11,971,313 | ||||
| 3.14%, 08/25/05 | 15,675,000 | 15,601,985 | ||||
| 3.37%, 09/06/05 | 3,232,000 | 3,211,849 | ||||
| 38,782,400 | ||||||
| 104,245,996 | ||||||
| Asset Backed—Mortgages (7.6%) | ||||||
| Georgetown Funding Co. (b) (3.8%) | ||||||
| 3.15%, 07/19/05 | 40,000,000 | 39,937,200 | ||||
| 3.17%, 07/20/05 | 20,000,000 | 19,966,644 | ||||
| 3.33%, 08/17/05 | 7,500,000 | 7,467,492 | ||||
| 67,371,336 | ||||||
| Thornburg Mortgage Capital (b) (3.8%) | ||||||
| 3.22%, 07/15/05 | 42,000,000 | 41,947,406 | ||||
| 3.23%, 08/05/05 | 26,000,000 | 25,918,606 | ||||
| 67,866,012 | ||||||
| 135,237,348 | ||||||
| Asset Backed—Repurchase Agreement (2.8%) | ||||||
| Liquid Funding (b) (2.8%) | ||||||
| 3.34%, 08/26/05 | 15,000,000 | 14,922,300 | ||||
| 3.59%, 12/06/05 | 10,000,000 | 9,844,633 | ||||
| 3.60%, 12/06/05 | 26,038,000 | 25,632,314 | ||||
| 50,399,247 | ||||||
| Asset Backed—Trade & Term Receivables (9.1%) | ||||||
| Falcon Asset Securitization Corp. (b) (2.3%) | ||||||
| 3.07%, 07/06/05 | 9,149,000 | 9,145,099 | ||||
| 3.06%, 07/07/05 | 633,000 | 632,677 | ||||
| 3.11%, 07/12/05 | 20,000,000 | 19,981,055 | ||||
| Principal Amount | Value | |||||
| ASSET BACKED COMMERCIAL PAPER (continued) | ||||||
| Asset Backed—Trade & Term Receivables (continued) | ||||||
| 3.26%, 07/26/05 | $ | 12,000,000 | $ | 11,972,917 | ||
| 41,731,748 | ||||||
| Golden Funding Corp. (b) (2.6%) | ||||||
| 3.09%, 07/05/05 | 18,942,000 | 18,935,539 | ||||
| 3.15%, 08/02/05 | 9,018,000 | 8,992,910 | ||||
| 3.27%, 08/10/05 | 18,841,000 | 18,772,754 | ||||
| 46,701,203 | ||||||
| Kitty Hawk Funding Corp. (b) (2.0%) | ||||||
| 3.29%, 07/25/05 | 35,000,000 | 34,923,233 | ||||
| Old Line Funding Corp. (b) (1.0%) | ||||||
| 3.31%, 07/05/05 | 1,192,000 | 1,191,562 | ||||
| 3.26%, 08/15/05 | 15,175,000 | 15,113,352 | ||||
| 3.23%, 08/22/05 | 1,658,000 | 1,650,312 | ||||
| 17,955,226 | ||||||
| Preferred Receivables Funding (b) (1.2%) | ||||||
| 3.09%, 07/08/05 | 10,273,000 | 10,266,828 | ||||
| 3.10%, 07/12/05 | 11,206,000 | 11,195,419 | ||||
| 21,462,247 | ||||||
| 162,773,657 | ||||||
| Asset Backed—Yankee (7.6%) | ||||||
| Check Point Charlie, Inc. (b) (2.1%) | ||||||
| 3.10%, 07/11/05 | 22,600,000 | 22,580,665 | ||||
| 3.22%, 08/08/05 | 5,230,000 | 5,212,389 | ||||
| 2.96%, 08/15/05 | 10,000,000 | 9,963,500 | ||||
| 37,756,554 | ||||||
| K2 (USA) LLC (b) (0.8%) | ||||||
| 3.29%, 08/22/05 | 10,500,000 | 10,450,405 | ||||
| 3.27%, 08/26/05 | 4,600,000 | 4,576,744 | ||||
| 15,027,149 | ||||||
| Premier Asset Collateralized Entity LLC (b) (1.0%) | ||||||
| 3.06%, 07/07/05 | 10,000,000 | 9,994,933 | ||||
| 3.27%, 07/25/05 | 3,366,000 | 3,358,662 | ||||
| 3.32%, 08/22/05 | 4,500,000 | 4,478,550 | ||||
| 17,832,145 | ||||||
| Sigma Finance, Inc. (b) (2.4%) | ||||||
| 3.13%, 07/13/05 | 2,900,000 | 2,896,984 | ||||
| 3.24%, 08/22/05 | 5,594,000 | 5,567,404 | ||||
| 3.27%, 08/24/05 | 17,000,000 | 16,917,125 | ||||
| 3.31%, 08/30/05 | 17,200,000 | 17,105,688 | ||||
| 42,487,201 | ||||||
6
Table of Contents
GARTMORE VARIABLE INSURANCE TRUST
GARTMORE GVIT MONEY MARKET FUND
Statement of Investments — June 30, 2005 (Unaudited) (continued)
| Principal Amount | Value | |||||
| ASSET BACKED COMMERCIAL PAPER (continued) | ||||||
| Stanfield Victoria Funding LLC (b) (1.3%) | ||||||
| 3.12%, 07/12/05 | $ | 6,500,000 | $ | 6,493,834 | ||
| 3.37%, 08/26/05 | 6,277,000 | 6,244,192 | ||||
| 3.43%, 09/01/05 | 3,200,000 | 3,181,207 | ||||
| 3.62%, 12/16/05 | 7,000,000 | 6,883,940 | ||||
| 22,803,173 | ||||||
| 135,906,222 | ||||||
| Total Asset Backed Commercial Paper | 626,562,470 | |||||
| COMMERCIAL PAPER (35.6%) | ||||||
| Banks—Domestic (0.6%) | ||||||
| Bank Of America Corp. (0.1%) | ||||||
| 3.08%, 07/06/05 | 2,870,000 | 2,868,776 | ||||
| 3.09%, 07/07/05 | 1,585,000 | 1,584,186 | ||||
| 4,452,962 | ||||||
| HSBC Americas, Inc. (0.5%) | ||||||
| 3.07%, 07/05/05 | 10,000,000 | 9,996,611 | ||||
| 14,449,573 | ||||||
| Banks—Foreign (11.5%) | ||||||
| ABN Amro NA Finance, Inc. (1.5%) | ||||||
| 3.10%, 07/08/05 | 15,000,000 | 14,990,973 | ||||
| 3.33%, 08/23/05 | 12,173,000 | 12,113,501 | ||||
| 27,104,474 | ||||||
| ANZ National (Int’l) Ltd. (b) (3.5%) | ||||||
| 3.08%, 07/08/05 | 3,800,000 | 3,797,723 | ||||
| 3.11%, 07/12/05 | 4,950,000 | 4,945,311 | ||||
| 3.32%, 08/10/05 | 6,242,000 | 6,219,043 | ||||
| 3.28%, 08/18/05 | 12,400,000 | 12,346,136 | ||||
| 3.37%, 08/24/05 | 20,000,000 | 19,899,200 | ||||
| 3.35%, 09/06/05 | 15,000,000 | 14,907,038 | ||||
| 62,114,451 | ||||||
| Barclays US Funding Corp. (1.2%) | ||||||
| 3.28%, 08/18/05 | 1,400,000 | 1,393,896 | ||||
| 3.31%, 08/23/05 | 20,000,000 | 19,902,833 | ||||
| 21,296,729 | ||||||
| HBOS Treasury Services PLC (0.3%) | ||||||
| 3.09%, 07/08/05 | 5,930,000 | 5,926,460 | ||||
| Societe Generale North American (0.2%) | ||||||
| 3.19%, 08/05/05 | 3,547,000 | 3,536,068 | ||||
| Principal Amount | Value | |||||
| COMMERCIAL PAPER (continued) | ||||||
| UBS Finance (DE) LLC (3.5%) | ||||||
| 3.10%, 07/08/05 | $ | 2,075,000 | $ | 2,073,753 | ||
| 3.11%, 07/12/05 | 3,000,000 | 2,997,168 | ||||
| 3.31%, 08/08/05 | 10,800,000 | 10,762,379 | ||||
| 3.28%, 08/30/05 | 27,583,000 | 27,432,715 | ||||
| 3.37%, 09/19/05 | 13,100,000 | 13,002,568 | ||||
| 3.42%, 09/26/05 | 7,400,000 | 7,339,303 | ||||
| 3.42%, 09/27/05 | 1,125,000 | 1,115,650 | ||||
| 64,723,536 | ||||||
| Westpac Capital Corp. (1.3%) | ||||||
| 3.09%, 07/08/05 | 2,700,000 | 2,698,376 | ||||
| 3.42%, 09/23/05 | 20,000,000 | 19,841,333 | ||||
| 22,539,709 | ||||||
| 207,241,427 | ||||||
| Banks—Mortgage (3.9%) | ||||||
| Nationwide Building Society (b) (0.9%) | ||||||
| 3.37%, 09/09/05 | 16,675,000 | 16,567,017 | ||||
| Northern Rock PLC (b) (3.0%) | ||||||
| 3.09%, 07/05/05 | 53,000,000 | 52,981,921 | ||||
| 69,548,938 | ||||||
| Broker & Dealer (1.7%) | ||||||
| Citicorp Global Markets Holding, Inc. (0.9%) | ||||||
| 3.07%, 07/07/05 | 15,000,000 | 14,992,375 | ||||
| Goldman Sachs Group, Inc. (0.8%) | ||||||
| 3.10%, 07/08/05 | 15,000,000 | 14,990,958 | ||||
| 29,983,333 | ||||||
| Finance Lessors (3.6%) | ||||||
| PB Finance (Delaware) (3.6%) | ||||||
| 3.13%, 07/11/05 | 20,000,000 | 19,982,723 | ||||
| 3.13%, 07/12/05 | 10,000,000 | 9,990,497 | ||||
| 3.14%, 07/14/05 | 13,000,000 | 12,985,353 | ||||
| 3.13%, 07/15/05 | 20,000,000 | 19,975,811 | ||||
| 3.15%, 07/25/05 | 1,891,000 | 1,887,054 | ||||
| 64,821,438 | ||||||
| Financial Services (4.5%) | ||||||
| ING US Funding (3.8%) | ||||||
| 3.09%, 07/08/05 | 15,000,000 | 14,991,046 | ||||
| 3.28%, 08/03/05 | 3,100,000 | 3,090,708 | ||||
| 3.32%, 08/05/05 | 1,600,000 | 1,594,851 | ||||
| 3.32%, 08/18/05 | 7,572,000 | 7,538,606 | ||||
7
Table of Contents
GARTMORE VARIABLE INSURANCE TRUST
GARTMORE GVIT MONEY MARKET FUND
Statement of Investments — June 30, 2005 (Unaudited) (continued)
| Principal Amount | Value | |||||
| COMMERCIAL PAPER (continued) | ||||||
| Financial Services (continued) | ||||||
| 3.34%, 08/22/05 | $ | 35,000,000 | $ | 34,831,649 | ||
| 3.35%, 08/29/05 | 5,000,000 | 4,972,631 | ||||
| 3.39%, 09/02/05 | 800,000 | 795,282 | ||||
| 67,814,773 | ||||||
| Rabobank USA Finance Corp. (0.7%) | ||||||
| 3.35%, 07/01/05 | 12,936,000 | 12,936,000 | ||||
| 80,750,773 | ||||||
| Insurance Carriers (1.5%) | ||||||
| Allianz Finance Corp. (b) (1.5%) | ||||||
| 3.13%, 07/12/05 | 25,000,000 | 24,976,243 | ||||
| 3.25%, 08/09/05 | 1,000,000 | 996,490 | ||||
| 25,972,733 | ||||||
| Personal Credit Institutions (1.9%) | ||||||
| General Electric Capital Corp. (1.9%) | ||||||
| 3.09%, 07/07/05 | 6,000,000 | 5,996,950 | ||||
| 3.07%, 07/08/05 | 1,954,000 | 1,952,841 | ||||
| 3.09%, 07/11/05 | 20,000,000 | 19,982,945 | ||||
| 3.14%, 08/03/05 | 6,000,000 | 5,982,840 | ||||
| 33,915,576 | ||||||
| Subdividers & Developers (2.5%) | ||||||
| Yorkshire Building Society (2.5%) | ||||||
| 3.05%, 07/05/05 | 19,500,000 | 19,493,168 | ||||
| 3.10%, 07/11/05 | 20,000,000 | 19,982,889 | ||||
| 3.23%, 08/09/05 | 25,500,000 | 25,411,324 | ||||
| 64,887,381 | ||||||
| Transportation Services (2.5%) | ||||||
| Netjets, Inc. (b) (2.5%) | ||||||
| 3.09%, 07/07/05 | 10,955,000 | 10,949,395 | ||||
| 3.10%, 07/12/05 | 7,500,000 | 7,492,942 | ||||
| 3.34%, 08/30/05 | 26,185,000 | 26,040,109 | ||||
| 44,482,446 | ||||||
| Total Commercial Paper | 636,053,618 | |||||
| FLOATING RATE NOTES (c) (24.6%) | ||||||
| Asset Backed CDO (5.3%) | ||||||
| Castle Hill III Ltd. (b) (0.6%) | ||||||
| 3.44%, 09/16/05 | 10,000,000 | 10,000,000 | ||||
| Commodore CDO II Ltd. (b) (1.4%) | ||||||
| 3.47%, 09/12/05 | 25,000,000 | 25,000,000 | ||||
| Principal Amount | Value | |||||
| FLOATING RATE NOTES (c) (continued) | ||||||
| Newcastle CDO Ltd. (b) (1.9%) | ||||||
| 3.30%, 10/24/05 | $ | 20,000,000 | $ | 20,000,000 | ||
| 3.33%, 08/24/05 | 15,000,000 | 15,000,000 | ||||
| 35,000,000 | ||||||
| NorthLake CDO Ltd. (b) (1.4%) | ||||||
| 3.44%, 09/06/05 | 25,000,000 | 25,000,000 | ||||
| 95,000,000 | ||||||
| Asset Backed—Domestic (1.4%) | ||||||
| Harrier Financial Funding US LLC (b) (1.4%) | ||||||
| 3.19%, 02/15/06 | 25,000,000 | 24,998,432 | ||||
| Asset Backed—Yankee (8.2%) | ||||||
| K2 (USA) LLC (b) (1.4%) | ||||||
| 3.26%, 03/22/06 | 25,000,000 | 24,997,419 | ||||
| Premier Asset Collateralized Entity LLC (b) (2.9%) | ||||||
| 3.18%, 09/15/05 | 25,000,000 | 24,998,959 | ||||
| 3.18%, 02/15/06 | 25,000,000 | 25,000,000 | ||||
| 49,998,959 | ||||||
| Sigma Finance, Inc. (b) (1.4%) | ||||||
| 3.21%, 09/15/05 | 10,000,000 | 10,000,188 | ||||
| 3.26%, 01/20/06 | 15,000,000 | 14,998,327 | ||||
| 24,998,515 | ||||||
| Stanfield Victoria Funding LLC (b) (2.5%) | ||||||
| 3.20%, 08/12/05 | 15,000,000 | 14,999,654 | ||||
| 3.26%, 05/24/06 | 30,000,000 | 29,995,946 | ||||
| 44,995,600 | ||||||
| 144,990,493 | ||||||
| Banks—Domestic (1.0%) | ||||||
| Wells Fargo & Co. (b) (1.0%) | ||||||
| 3.18%, 09/01/06 | 17,000,000 | 17,000,000 | ||||
| Banks—Foreign (1.2%) | ||||||
| HBOS Treasury Services PLC (1.2%) | ||||||
| 3.33%, 09/22/06 | 22,000,000 | 22,000,000 | ||||
| Banks—Mortgage (0.7%) | ||||||
| Northern Rock PLC (b) (0.7%) | ||||||
| 3.41%, 07/07/06 | 12,500,000 | 12,500,000 | ||||
| Broker / Dealer (3.7%) | ||||||
| Goldman Sachs Group, Inc. (2.0%) | ||||||
| 3.41%, 05/19/06 | 37,000,000 | 37,000,000 | ||||
8
Table of Contents
GARTMORE VARIABLE INSURANCE TRUST
GARTMORE GVIT MONEY MARKET FUND
Statement of Investments — June 30, 2005 (Unaudited) (continued)
| Principal Amount | Value | |||||
| FLOATING RATE NOTES (c) (continued) | ||||||
| Morgan Stanley Dean Witter & Co. (1.7%) | ||||||
| 3.13%, 02/03/06 | $ | 30,000,000 | $ | 30,000,000 | ||
| 67,000,000 | ||||||
| Insurance (1.5%) | ||||||
| Allstate Life Global Funding (b) (1.5%) | ||||||
| 3.30%, 06/27/06 | 12,500,000 | 12,500,000 | ||||
| 3.19%, 08/08/06 | 15,000,000 | 15,000,000 | ||||
| 27,500,000 | ||||||
| Personal Credit Institutions (1.6%) | ||||||
| General Electric Capital Corp. (b) (1.6%) | ||||||
| 3.28%, 09/08/06 | 21,000,000 | 21,000,000 | ||||
| 3.34%, 09/15/06 | 8,000,000 | 8,000,000 | ||||
| 29,000,000 | ||||||
| Total Floating Rate Notes (c) | 439,988,925 | |||||
| MUNICIPAL BONDS (3.3%) | ||||||
| Finance, Taxation, & Monetary Policy (3.3%) | ||||||
| South Carolina Public Service Authority (1.6%) | ||||||
| 3.31%, 07/28/05 | 27,964,000 | 27,894,579 | ||||
| Sunshine State Governmental Financing Commission (1.7%) | ||||||
| 3.13%, 07/13/05 | 9,761,000 | 9,750,816 | ||||
| 3.33%, 08/04/05 | 21,630,000 | 21,562,178 | ||||
| 31,312,994 | ||||||
| Total Municipal Bonds | 59,207,573 | |||||
| Principal Amount | Value | |||||
| U.S. GOVERNMENT AGENCIES (1.7%) | ||||||
| Federal Home Loan Bank (1.7%) | ||||||
| 3.00%, 02/06/06 | $ | 5,000,000 | $ | 5,000,000 | ||
| 3.25%, 04/25/06 | 25,000,000 | 25,000,000 | ||||
| Total U.S. Government Agencies | 30,000,000 | |||||
| Total Investments (Cost $1,791,812,585) (a) — 100.2% | 1,791,812,585 | |||||
| Liabilities in excess of other assets — (0.2%) | (3,686,593 | ) | ||||
| NET ASSETS — 100.0% | $ | 1,788,125,992 | ||||
| (a) | See notes to financial statements for tax unrealized appreciation (depreciation) of securities. |
| (b) | Restricted securities issued pursuant to Section 4(2) of the Securities Act of 1933. These securities were deemed liquid pursuant to procedures approved by the Board of Trustees. |
| (c) | Variable Rate Security. The rate reflected in the Statement of Investments is the rate in effect on March 31, 2005. The maturity date represents the actual maturity date. |
| CDO | Collateralized Debt Obligation |
See notes to financial statements.
9
Table of Contents
GARTMORE VARIABLE INSURANCE TRUST
GARTMORE GVIT MONEY MARKET FUND
Statement of Assets and Liabilities
June 30, 2005 (Unaudited)
Assets: | ||||
Investments, at value (cost $1,791,812,585) | $ | 1,791,812,585 | ||
Cash | 140 | |||
Interest and dividends receivable | 871,234 | |||
Receivable from adviser | 11,611 | |||
Prepaid expenses and other assets | 44,036 | |||
Total Assets | 1,792,739,606 | |||
Liabilities: | ||||
Distributions payable | 3,773,043 | |||
Accrued expenses and other payables: | ||||
Investment advisory fees | 581,290 | |||
Fund administration and transfer agent fees | 59,868 | |||
Administrative servicing fees | 181,690 | |||
Other | 17,723 | |||
Total Liabilities | 4,613,614 | |||
Net Assets | $ | 1,788,125,992 | ||
Represented by: | ||||
Capital | $ | 1,788,159,141 | ||
Accumulated net investment income (loss) | (1 | ) | ||
Accumulated net realized gains (losses) from investment transactions | (33,148 | ) | ||
Net Assets | $ | 1,788,125,992 | ||
Net Assets: | ||||
Class I Shares | $ | 1,232,203,747 | ||
Class IV Shares | 79,850,820 | |||
Class V Shares | 476,071,425 | |||
Total | $ | 1,788,125,992 | ||
Shares outstanding (unlimited number of shares authorized): | ||||
Class I Shares | 1,232,228,364 | |||
Class IV Shares | 79,852,815 | |||
Class V Shares | 476,081,609 | |||
Total | 1,788,162,788 | |||
Net asset value and offering price per share:* | ||||
Class I Shares | $ | 1.00 | ||
Class IV Shares | $ | 1.00 | ||
Class V Shares | $ | 1.00 |
| * | Not subject to a front-end sales charge. |
For the Six Months Ended June 30, 2005 (Unaudited)
Investment Income: | ||||
Interest income | $ | 25,371,221 | ||
Dividend income | 1,691 | |||
Total Income | 25,372,912 | |||
Expenses: | ||||
Investment advisory fees | 3,569,751 | |||
Fund administration and transfer agent fees | 588,530 | |||
Administrative servicing fees | 965,862 | |||
Administrative servicing fees | 61,877 | |||
Administrative servicing fees | 159,020 | |||
Other** | 301,552 | |||
Total expenses before waived or reimbursed expenses | 5,646,592 | |||
Expenses waived or reimbursed | (56,995 | ) | ||
Total Expenses | 5,589,597 | |||
Net Investment Income (Loss) | 19,783,315 | |||
REALIZED/UNREALIZED GAINS (LOSSES) ON INVESTMENTS: | ||||
Net realized gains (losses) on investment transactions | 1,170 | |||
CHANGE IN NET ASSETS RESULTING FROM OPERATIONS | $ | 19,784,485 | ||
| ** | Other expenses may include the following fees: audit, custody, insurance, legal, printing, trustee, and out-of-pocket expenses. |
See notes to financial statements.
10
Table of Contents
GARTMORE VARIABLE INSURANCE TRUST
GARTMORE GVIT MONEY MARKET FUND
Statement of Changes in Net Assets
| Six Months Ended June 30, 2005 | Year Ended December 31, 2004 | |||||||
| (Unaudited) | ||||||||
From Investment Activities: | ||||||||
Operations: | ||||||||
Net investment income | $ | 19,783,315 | $ | 16,484,796 | ||||
Net realized gains (losses) on investment transactions | 1,170 | 107 | ||||||
Change in net assets resulting from operations | 19,784,485 | 16,484,903 | ||||||
Distributions to Class I shareholders from: | ||||||||
Net investment income | (13,740,132 | ) | (11,878,997 | ) | ||||
Distributions to Class IV shareholders from: | ||||||||
Net investment income | (940,694 | ) | (859,899 | ) | ||||
Distributions to Class V shareholders from: | ||||||||
Net investment income | (5,102,490 | ) | (3,745,900 | ) | ||||
Change in net assets from shareholder distributions | (19,783,316 | ) | (16,484,796 | ) | ||||
Change in net assets from capital transactions | 473,278 | (255,057,787 | ) | |||||
Change in net assets | 474,447 | (255,057,680 | ) | |||||
Net Assets: | ||||||||
Beginning of period | 1,787,651,545 | 2,042,709,225 | ||||||
End of period | $ | 1,788,125,992 | $ | 1,787,651,545 | ||||
CAPITAL TRANSACTIONS: | ||||||||
Class I Shares | ||||||||
Proceeds from shares issued | $ | 501,948,025 | $ | 989,329,590 | ||||
Dividends reinvested | 12,851,189 | 10,923,966 | ||||||
Cost of shares redeemed | (506,126,621 | ) | (1,350,618,631 | ) | ||||
| 8,672,593 | (350,365,075 | ) | ||||||
Class IV Shares | ||||||||
Proceeds from shares issued | 22,882,876 | 39,499,580 | ||||||
Dividends reinvested | 883,441 | 798,082 | ||||||
Cost of shares redeemed | (28,330,783 | ) | (59,397,618 | ) | ||||
| (4,564,466 | ) | (19,099,956 | ) | |||||
Class V Shares | ||||||||
Proceeds from shares issued | 213,682,167 | 341,959,000 | ||||||
Dividends reinvested | 4,703,099 | 3,341,605 | ||||||
Cost of shares redeemed | (222,020,115 | ) | (230,893,361 | ) | ||||
| (3,634,849 | ) | 114,407,244 | ||||||
Change in net assets from capital transactions | $ | 473,278 | $ | (255,057,787 | ) | |||
11
Table of Contents
GARTMORE VARIABLE INSURANCE TRUST
GARTMORE GVIT MONEY MARKET FUND
Statement of Changes in Net Assets (continued)
| Six Months Ended June 30, 2005 | Year Ended December 31, 2004 | |||||
| (Unaudited) | ||||||
SHARE TRANSACTIONS: | ||||||
Class I Shares | ||||||
Issued | 501,948,024 | 989,329,590 | ||||
Reinvested | 12,851,189 | 10,923,966 | ||||
Redeemed | (506,126,621 | ) | (1,350,618,631 | ) | ||
| 8,672,592 | (350,365,075 | ) | ||||
Class IV Shares | ||||||
Issued | 22,882,876 | 39,499,580 | ||||
Reinvested | 883,441 | 798,082 | ||||
Redeemed | (28,330,783 | ) | (59,397,618 | ) | ||
| (4,564,466 | ) | (19,099,956 | ) | |||
Class V Shares | ||||||
Issued | 213,682,167 | 341,959,000 | ||||
Reinvested | 4,703,100 | 3,341,605 | ||||
Redeemed | (222,020,116 | ) | (230,893,361 | ) | ||
| (3,634,849 | ) | 114,407,244 | ||||
See notes to financial statements.
12
Table of Contents
GARTMORE VARIABLE INSURANCE TRUST
FINANCIAL HIGHLIGHTS
Selected Data for Each Share of Capital Outstanding
Gartmore GVIT Money Market Fund
| Investment Activities | Distributions | Ratios/Supplemental Data | ||||||||||||||||||||||||||||||||||
| Net Asset Value, Beginning of Period | Net Investment Income (Loss) | Total from Investment Activities | Net Investment Income | Total Distributions | Net Asset Value, End of Period | Total Return | Net Assets at End of Period | Ratio of to Average | Ratio of Net Investment Income (Loss) to Average Net Assets | Ratio of (Prior to Net Assets(a) | Ratio of Net Net Assets(a) | |||||||||||||||||||||||||
Class I Shares | ||||||||||||||||||||||||||||||||||||
Year Ended December 31, 2000 | $ | 1.00 | 0.06 | 0.06 | (0.06 | ) | (0.06 | ) | $ | 1.00 | 6.03% | $ | 1,982,922 | 0.55% | 5.87% | 0.61% | 5.81% | |||||||||||||||||||
Year Ended December 31, 2001(b) | $ | 1.00 | 0.04 | 0.04 | (0.04 | ) | (0.04 | ) | $ | 1.00 | 3.60% | $ | 2,869,354 | 0.55% | 3.41% | 0.61% | 3.35% | |||||||||||||||||||
Year Ended December 31, 2002 | $ | 1.00 | 0.01 | 0.01 | (0.01 | ) | (0.01 | ) | $ | 1.00 | 1.21% | $ | 2,436,783 | 0.62% | 1.21% | 0.62% | 1.21% | |||||||||||||||||||
Year Ended December 31, 2003 | $ | 1.00 | 0.01 | 0.01 | (0.01 | ) | (0.01 | ) | $ | 1.00 | 0.63% | $ | 1,573,895 | 0.63% | 0.63% | (h | ) | (h | ) | |||||||||||||||||
Year Ended December 31, 2004 | $ | 1.00 | 0.01 | 0.01 | (0.01 | ) | (0.01 | ) | $ | 1.00 | 0.81% | $ | 1,223,530 | 0.62% | 0.79% | (h | ) | (h | ) | |||||||||||||||||
Six Months Ended June 30, 2005 (Unaudited) | $ | 1.00 | 0.01 | 0.01 | (0.01 | ) | (0.01 | ) | $ | 1.00 | 1.06% | (f) | $ | 1,232,204 | 0.64% | (g) | 2.14% | (g) | (h | ) | (h | ) | ||||||||||||||
Class IV Shares | ||||||||||||||||||||||||||||||||||||
Period Ended December 31, 2003(c) | $ | 1.00 | (e | ) | (e | ) | (e | ) | (e | ) | $ | 1.00 | 0.46% | (f) | $ | 103,515 | 0.50% | (g) | 0.67% | (g) | 0.63% | (g) | 0.55% | (g) | ||||||||||||
Year Ended December 31, 2004 | $ | 1.00 | 0.01 | 0.01 | (0.01 | ) | (0.01 | ) | $ | 1.00 | 0.94% | $ | 84,415 | 0.50% | 0.91% | 0.62% | 0.79% | |||||||||||||||||||
Six Months Ended June 30, 2005 (Unaudited) | $ | 1.00 | 0.01 | 0.01 | (0.01 | ) | (0.01 | ) | $ | 1.00 | 1.13% | (f) | $ | 79,851 | 0.50% | (g) | 2.27% | (g) | 0.64% | (g) | 2.13% | (g) | ||||||||||||||
Class V Shares | ||||||||||||||||||||||||||||||||||||
Period Ended December 31, 2002(d) | $ | 1.00 | (e | ) | (e | ) | (e | ) | (e | ) | $ | 1.00 | 0.22% | (f) | $ | 324,950 | 0.56% | (g) | 1.11% | (g) | (h | ) | (h | ) | ||||||||||||
Year Ended December 31, 2003 | $ | 1.00 | 0.01 | 0.01 | (0.01 | ) | (0.01 | ) | $ | 1.00 | 0.71% | $ | 365,299 | 0.55% | 0.70% | (h | ) | (h | ) | |||||||||||||||||
Year Ended December 31, 2004 | $ | 1.00 | 0.01 | 0.01 | (0.01 | ) | (0.01 | ) | $ | 1.00 | 0.89% | $ | 479,706 | 0.55% | 0.92% | (h | ) | (h | ) | |||||||||||||||||
Six Months Ended June 30, 2005 (Unaudited) | $ | 1.00 | 0.01 | 0.01 | (0.01 | ) | (0.01 | ) | $ | 1.00 | 1.10% | (f) | $ | 476,071 | 0.56% | (g) | 2.22% | (g) | (h | ) | (h | ) | ||||||||||||||
| (a) | During the period certain fees were waived and/or reimbursed. If such waivers/reimbursements had not occurred, the ratios would have been as indicated. |
| (b) | The existing shares of the Fund were designated Class I shares as of May 1, 2001. |
| (c) | For the period from April 28, 2003 (commencement of operations) through December 31, 2003. |
| (d) | For the period from October 21, 2002 (commencement of operations) through December 31, 2002. |
| (e) | The amount is less than $0.005. |
| (f) | Not annualized. |
| (g) | Annualized. |
| (h) | There were no fee reductions during the period. |
See notes to financial statements.
13
Table of Contents
GARTMORE VARIABLE INSURANCE TRUST
NOTES TO FINANCIAL STATEMENTS (Unaudited)
June 30, 2005
1. Organization
Gartmore Variable Insurance Trust (“GVIT” or the “Trust”) is an open-end management investment company, organized under the laws of Delaware by an amended and restated Agreement and Declaration of Trust, dated October 28, 2004, as amended to date. The Trust, originally created under the laws of Massachusetts as a Massachusetts business trust pursuant to a Declaration of Trust dated, as of June 30, 1981, as subsequently amended, redomesticated as a Delaware Statutory Trust after the close of trading on April 29, 2005, and is registered under the Investment Company Act of 1940, as amended (the “1940 Act”). The redomestication is a change in statutory status and does not affect the operations of the Trust. As of June 30, 2005, the Trust had authorized an unlimited number of shares of beneficial interest (“shares”) without par value. The Trust currently offers shares to life insurance company separate accounts to fund the benefits under variable life insurance or annuity policies. To date, only the separate accounts of Nationwide Life Insurance Company and Nationwide Life and Annuity Insurance Company (collectively, “Nationwide”) have purchased shares of the Trust’s series. The Trust operates thirty-one (31) separate series, or mutual funds, each with its own investment objectives and strategies. This report contains the financial statements and financial highlights of the Gartmore GVIT Money Market Fund (the “Fund”).
Under the Trust’s organizational documents, the Trust’s officers and trustees are indemnified against certain liabilities arising out of the performance of their duties to the Trust. In addition, the Trust has entered into Indemnification Agreements with the Trust’s trustees and certain officers covering similar liabilities. In addition, in the normal course of business, the Trust enters into contracts with its vendors and others that provide for general indemnifications. The Trust’s maximum exposure under these arrangements is unknown, as this would involve future claims that may be made against the Trust. Based on experience, however, the Trust expects that risk of loss to be remote.
2. Summary of Significant Accounting Policies
The following is a summary of significant accounting policies followed by the Fund in the preparation of its financial statements. The policies are in conformity with accounting principles generally accepted in the United States of America (“GAAP”). The preparation of financial statements requires management to make estimates and assumptions that affect the reported amounts of assets and liabilities, the disclosure of contingent assets and liabilities at the date of the financial statements and the reported amounts of income and expenses for the period. Actual results could differ from those estimates.
| (a) | Security Valuation |
Investments of the Fund are valued at amortized cost, which approximates market value. Under the amortized cost method, premium or discount, if any, is amortized or accreted, respectively, on a constant (straight-line) basis to the maturity of the security.
| (b) | Repurchase Agreements |
The Fund may enter into repurchase agreements with an entity which is a member of the Federal Reserve System or which is a “primary dealer” (as designated by the Federal Reserve Bank of New York) in U.S. Government obligations. The repurchase price generally equals the price paid by the Fund plus interest negotiated on the basis of current short-term rates, which may be more or less than the rate on the underlying portfolio securities. The seller under a repurchase agreement is required to maintain the value of the collateral held pursuant to the agreement at a market value equal to or greater than the repurchase price (including accrued interest). Collateral subject to repurchase agreements is held by the Fund’s custodian or another qualified sub-custodian or in the Federal Reserve/Treasury book-entry system. If the counterparty defaults and the fair value of the collateral declines, realization of the collateral by the Fund may be delayed or limited. The Fund may transfer uninvested cash balances into a pooled cash account. These balances are invested in one or more repurchase agreements, which are fully collateralized by AA-rated Corporate Bonds with the counterparties of CS First Boston and Nomura Securities.
14
Table of Contents
GARTMORE VARIABLE INSURANCE TRUST
NOTES TO FINANCIAL STATEMENTS (Unaudited) (Continued)
June 30, 2005
| (c) | Security Transactions and Investment Income |
Security transactions are accounted for on the date the security is purchased or sold (“trade date”). Securities gains and losses are calculated on the identified cost basis. Interest income is recognized on the accrual basis and includes, where applicable, the amortization or accretion of premium or discount.
| (d) | Distributions to Shareholders |
The Fund’s dividends from net investment income, if any, are declared daily and paid monthly. The Fund’s distributable net realized capital gains, if any, are declared and distributed at least annually.
Dividends and distributions to shareholders are determined in accordance with federal income tax regulations, which may differ from GAAP. These “book/tax” differences are considered either permanent or temporary in nature. In accordance with the American Institute of Certified Public Accountants (“AICPA”) Statement of Position 93-2, permanent differences (i.e., reclassification of market discounts, gain/loss, paydowns, and distributions) are reclassified within the capital accounts based on their nature for federal income tax purposes; temporary differences do not require reclassification. These reclassifications have no effect upon the net asset value of the Fund. To the extent distributions exceed current and accumulated earnings and profits for federal income tax purposes, these distributions are reported as distributions of paid-in-capital.
| (e) | Federal Income Taxes |
It is the policy of the Fund to qualify or continue to qualify as a “regulated investment company” by complying with the provisions available to certain investment companies, as defined in applicable sections of the U.S. Internal Revenue Code, and to make distributions of net investment income and net realized capital gains sufficient to relieve the Fund from all, or substantially all, federal income taxes.
| (f) | Allocation of Expenses, Income, and Gains and Losses |
Expenses directly attributable to the Fund are charged to the Fund. Expenses not directly attributable to the Fund are allocated proportionately among various or all funds within the Trust. The method used by the Fund for allocating income, fund level expenses, and realized and unrealized gains or losses is based on the is based on the fair value of settled shares outstanding. Under this method, earnings are allocated based on the fair value of settled shares. Expenses specific to a class (such as administrative services fees) are charged to that class.
3. Transactions with Affiliates
Under the terms of the Trust’s Investment Advisory Agreement, Gartmore Mutual Fund Capital Trust (“GMF”) manages the investment of the assets and supervises the daily business affairs of the Fund. GMF is a wholly-owned subsidiary of Gartmore Global Investments, Inc. (“GGI”), a holding company. GGI is a majority-owned subsidiary of Gartmore Global Asset Management Trust (“GGAMT”). GGAMT is a wholly-owned subsidiary of Nationwide Corporation. All of the common stock of Nationwide Corporation is held by Nationwide Mutual Insurance Company (95.2%) and Nationwide Mutual Fire Insurance Company (4.8%), each of which is a mutual company owned by its policyholders.
Under the terms of the Investment Advisory Agreement, the Fund pays GMF an investment advisory fee based on the Fund’s average daily net assets and the following schedule:
| Schedule | Fees | |
Up to $1 billion | 0.40% | |
Next $1 billion | 0.38% | |
Next $3 billion | 0.36% | |
$5 billion or more | 0.34% |
15
Table of Contents
GARTMORE VARIABLE INSURANCE TRUST
NOTES TO FINANCIAL STATEMENTS (Unaudited) (Continued)
June 30, 2005
Effective May 1, 2005, GMF and the Fund have entered into a written contract (“Expense Limitation Agreement”) limiting operating expenses from exceeding 050% for Class IV shares until at least May 1, 2006.
GMF may request and receive reimbursement from the Fund of the advisory fees waived and other expenses reimbursed by GMF, respectively, pursuant to the Expense Limitation Agreement at a later date not to exceed three years from the fiscal year in which the corresponding reimbursement to the Fund was made, depending on the Fund (as described below), if the Fund has reached a sufficient asset size to permit reimbursement to be made without causing the total annual operating expense ratio of the Fund to exceed the limits set forth above. No reimbursement will be made unless: (i) the Fund’s assets exceed $100 million; (ii) the total annual expense ratio of the Class making such reimbursement is less than the limit set forth above; and (iii) the payment of such reimbursement is approved by the Board of Trustees on a quarterly basis. Except as provided for in the Expense Limitation Agreements, reimbursement of amounts previously waived or assumed by GMF is not permitted.
As of the six months ended June 30, 2005, the cumulative potential reimbursements for the Class IV shares of the Fund, based on reimbursements which expires within three years from the fiscal year in which the corresponding reimbursement to the Fund was made for expenses reimbursed by GMF would be:
Amount | Amount Fiscal Year 2004 | Amount June 30, | ||||
$103,443 | $ | 116,217 | $ | 56,995 | ||
Under the terms of a Fund Administration and Transfer Agency Agreement, Gartmore SA Capital Trust (“GSA”) provides the Fund with various administrative and accounting services, and Gartmore Investors Services, Inc. (“GISI”), an indirect subsidiary of GSA, serves as Transfer and Dividend Disbursing Agent for the Fund. The fees for the services provided under this Agreement are calculated based on the Trust’s average daily net assets according to the fee schedule below. The fees are then allocated proportionately among all funds within the Trust in relation to the average daily net assets of each fund and are paid to GSA. GSA pays GISI from these fees for its services.
| Combined Fee Schedule* | ||
Up to $1 billion | 0.13% | |
$1 billion and more up to $3 billion | 0.08% | |
$3 billion and more up to $8 billion | 0.05% | |
$8 billion and more up to $10 billion | 0.04% | |
$10 billion and more up to $12 billion | 0.02% | |
$12 billion or more | 0.01% | |
| * | The assets of the Gartmore GVIT Investor Destinations Aggressive Fund, the Gartmore GVIT Investor Destinations Moderately Aggressive Fund, the Gartmore GVIT Investor Destinations Moderate Fund, the Gartmore GVIT Investor Destinations Moderately Conservative Fund, and the Gartmore GVIT Investor Destinations Conservative Fund (collectively, the “Investor Destinations Funds”) are excluded from the Trust asset level amount in order to calculate this asset-based fee. The Investor Destinations Funds do not pay any part of this fee. |
16
Table of Contents
GARTMORE VARIABLE INSURANCE TRUST
NOTES TO FINANCIAL STATEMENTS (Unaudited) (Continued)
June 30, 2005
Effective January 1, 2005, the fee for the fund administration and transfer agency services increased as set forth below. The fees are calculated based on the Trust’s average daily net assets according to the fee schedule below. The fees are then allocated proportionately among all funds within the Trust in relation to the average daily net assets of each fund and are paid to GSA.
| Combined Fee Schedule* | ||
Up to $1 billion | 0.15% | |
$1 billion and more up to $3 billion | 0.10% | |
$3 billion and more up to $8 billion | 0.05% | |
$8 billion and more up to $10 billion | 0.04% | |
$10 billion and more up to $12 billion | 0.02% | |
$12 billion or more | 0.01% | |
| * | The assets of each of the Investor Destinations Funds are excluded from the Trust asset level amount in order to calculate this asset-based fee. The Investor Destinations Funds do not pay any part of this fee. |
GSA and GISI have entered into agreements with BISYS Fund Services Ohio, Inc. (“BISYS”), pursuant to which BISYS provides sub-administration and sub-transfer agency services, respectively, to the Fund.
Under the terms of an Administrative Services Plan, the Fund may pay fees to servicing organizations, such as broker-dealers, including Nationwide Financial Services, and financial institutions, which agree to provide administrative support services to the shareholders of certain classes. These services include, but are not limited, to the following: establishing and maintaining shareholder accounts; processing purchase and redemption transactions; arranging bank wires; performing shareholder sub-accounting; answering inquires regarding the Fund; and other such services. These fees are based on an annual rate of up to 0.25% of the average daily net assets of each class of shares of the Fund.
4. Bank Loans
The Trust has a credit agreement of $100,000,000. Borrowings under this arrangement bear interest at the Federal Funds rate plus 0.50%. The interest costs are included in custodian fees in the Statement of Operations. No compensation balances were required under the terms of the line of credit. There were no borrowings outstanding as of June 30, 2005.
5. Shareholder Meeting
A separate shareholders meeting was held on Tuesday, December 23, 2004, for the shareholders of the Trust’s predecessor pursuant to a Proxy Statement On Schedule 14A, dated October 29, 2004, and mailed to the shareholders of the Trust’s predecessor on or around November 5, 2004.
Two Proposals: The purpose of the December 23, 2004 meeting was to allow the shareholders of the Trust’s predecessor to vote on:
| i. | Proposal One: The election of the Trust’s Board of Trustees; and |
| ii. | Proposal Two: The approval of an “Agreement and Plan of Reorganization” that provided for the reorganization of the Trust from a Massachusetts business trust into a Delaware statutory trust. |
Proposal One: As set forth in the October 29, 2004 Proxy Statement, the nominees for election as Trustees of the Trust’s predecessor were: Charles E. Allen, Michael J. Baresich, Paula H.J. Cholmondeley, C. Brent DeVore, Phyllis Kay Dryden, Robert M. Duncan, Barbara L. Hennigar, Paul J. Hondros, Barbara I Jacobs, Thomas J. Kerr IV, Douglas F. Kridler, Michael D. McCarthy, Arden L. Shisler, and David C. Wetmore.
Proposal Two: As specifically set forth in the October 29, 2004 Proxy Statement, the Reorganization proposal requested the shareholders of the Trust’s predecessor to approve the proposed “Agreement and Plan of Reorganization” of the Trust’s predecessor (on behalf of each of the its funds) into a new Delaware-domiciled Trust, whereby the Funds of the new Delaware Trust would acquire all of the assets of the corresponding funds of the Trust’s predecessor subject to the liabilities,
17
Table of Contents
GARTMORE VARIABLE INSURANCE TRUST
NOTES TO FINANCIAL STATEMENTS (Unaudited) (Continued)
June 30, 2005
expenses, costs, charges, and reserves of the corresponding funds of the Trust’s predecessor (contingent or otherwise), in exchange for shares of the acquiring Funds to be distributed pro rata by the Trust to the holders of the shares of the funds of the Trust’s predecessor, in a complete liquidation of the Trust’s predecessor.
| Voting | Results: |
The shareholders of the Trust’s predecessor voted to approve both Proposal One and Proposal Two, as follows:
Proposal 1: Election of a Board of Trustees of Gartmore Variable Insurance Trust
Charles E. Allen: | ||
FOR | 2,797,230,318.955 shares (96.078%) | |
WITHHOLD | 114,195,693.660 shares (3.922%) | |
TOTAL | 2,912,726,012.615 shares (100.000%) | |
Michael J. Baresich: | ||
FOR | 2,796,135,979.559 shares (96.040%) | |
WITHHOLD | 115,290,033.056 shares (3.960%) | |
TOTAL | 2,912,726,012.615 shares (100.000%) | |
Paula H.J. Cholmondeley: | ||
FOR | 2,795,095,945.396 shares (96.004%) | |
WITHHOLD | 116,330,067.219 shares (3.996%) | |
TOTAL | 2,912,726,012.615 shares (100.000%) | |
C. Brent DeVore: | ||
FOR | 2,797,207,046.916 shares (96.077%) | |
WITHHOLD | 114,218,965.699 shares (3.923%) | |
TOTAL | 2,912,726,012.615 shares (100.000%) | |
Phyllis Kay Dryden: | ||
FOR | 2,795,587,023.994 shares (96.021%) | |
WITHHOLD | 115,838,988.621 shares (3.979%) | |
TOTAL | 2,912,726,012.615 shares (100.000%) | |
Robert M. Duncan: | ||
FOR | 2,790,191,720.503 shares (95.836%) | |
WITHHOLD | 121,234,292.112 shares (4.164%) | |
TOTAL | 2,912,726,012.615 shares (100.000%) | |
Barbara L. Hennigar: | ||
FOR | 2,792,939,848.858 shares (95.937%) | |
WITHHOLD | 118,486,163.757 shares (4.070%) | |
TOTAL | 2,912,726,012.615 shares (100.000%) | |
18
Table of Contents
GARTMORE VARIABLE INSURANCE TRUST
NOTES TO FINANCIAL STATEMENTS (Unaudited) (Continued)
June 30, 2005
Paul J. Hondros: | ||
FOR | 2,797,557,404.448 shares (96.089%) | |
WITHHOLD | 113,868,608.167 shares (3.911%) | |
TOTAL | 2,912,726,012.615 shares (100.000%) | |
Barbara I. Jacobs: | ||
FOR | 2,796,306,126.654 shares (96.046%) | |
WITHHOLD | 115,119,885.961 shares (3.954%) | |
TOTAL | 2,912,726,012.615 shares (100.000%) | |
Thomas J. Kerr IV: | ||
FOR | 2,789,755,720.087 shares (95.821%) | |
WITHHOLD | 121,670,292.528 shares (4.179%) | |
TOTAL | 2,912,726,012.615 shares (100.000%) | |
Douglas F. Kridler: | ||
FOR | 2,798,065,774.375 shares (96.106%) | |
WITHHOLD | 113,360,238.240 shares (3.894%) | |
TOTAL | 2,912,726,012.615 shares (100.000%) | |
Michael D. McCarthy: | ||
FOR | 2,797,452,613.694 shares (96.085%) | |
WITHHOLD | 113,973,395.921 shares (3.915%) | |
TOTAL | 2,912,726,012.615 shares (100.000%) | |
Arden L. Shisler: | ||
FOR | 2,796,738,454.730 shares (96.061%) | |
WITHHOLD | 114,687,557.885 shares (3.939%) | |
TOTAL | 2,912,726,012.615 shares (100.000%) | |
David C. Wetmore: | ||
FOR | 2,794,784,752.247 shares (95.994%) | |
WITHHOLD | 116,641,260.368 shares (4.006%) | |
TOTAL | 2,912,726,012.615 shares (100.000%) | |
Proposal 2: Approval of the Agreement and Plan of Reorganization of Gartmore Variable Insurance Trust
FOR | 2,561,003,822.546 shares (87.964%) | |
AGAINST | 103,593,261.010 shares (3.558%) | |
ABSTAIN | 246,828,929.059 shares (8.478%) | |
TOTAL | 2,912,726,012.615 shares (100.000%) | |
19
Table of Contents
GARTMORE VARIABLE INSURANCE TRUST
Management Information (Unaudited)
June 30, 2005
Trustees who are not Interested Persons (as defined in the 1940 Act) and Officers of the Funds June 30, 2005
| Name, Address and Date of Birth | Position(s) Held with the Trust and Length of Time Served1 | Principal Occupation(s) During Past 5 Years | Number of Portfolios in the Gartmore Fund Complex Overseen by Trustee | Other Directorships Held by Trustee or Nominee2 | ||||
Charles E. Allen
c/o Gartmore Global Investments, Inc. 1200 River Road, Suite 1000 Conshohocken, PA 19428
1948 | Trustee since July 2000 | Mr. Allen is Chairman, Chief Executive Officer and President of the Graimark Realty Advisors, Inc. (real estate development, investment and asset management). | 84 | None | ||||
Paula H.J. Cholmondeley
c/o Gartmore Global Investments, Inc. 1200 River Road, Suite 1000 Conshohocken, PA 19428
1940 | Trustee since July 2000 | Ms. Cholmondeley has been the Chairman and Chief Executive Officer of the Sorrel Group, a management consulting company, since January 2004. From March 2000 through December 2003, Ms. Cholmondeley was Vice President and General Manager of Sappi Fine Paper North America. Prior thereto, Ms. Cholmondeley was Vice President and General Manager of Residential Insulation of Owens Corning. | 84 | Director of Dentsply International, Inc., Ultralife Batteries, Inc., Terex Corporation, Minerals Technology, Inc. and Albany International Corp. | ||||
C. Brent DeVore
c/o Gartmore Global Investments, Inc. 1200 River Road, Suite 1000 Conshohocken, PA 19428
1940 | Trustee since 1990 | Dr. DeVore is President of Otterbein College. | 84 | None | ||||
Phyllis K. Dryden
c/o Gartmore Global Investments, Inc. 1200 River Road, Suite 1000 Conshohocken, PA 19428
1947 | Trustee since December 2004 | Ms. Dryden was a former Managing Partner of marchFIRST, a global management consulting firm prior to 2002. | 84 | None |
20
Table of Contents
GARTMORE VARIABLE INSURANCE TRUST
Management Information (Unaudited)
June 30, 2005
| Name, Address and Date of Birth | Position(s) Held with the Trust and Length of Time Served1 | Principal Occupation(s) During Past 5 Years | Number of Portfolios in the Gartmore Fund Complex Overseen by Trustee | Other Directorships Held by Trustee or Nominee2 | ||||
Barbara L. Hennigar*
c/o Gartmore Global Investments, Inc. 1200 River Road, Suite 1000 Conshohocken, PA 19428
1935 | Trustee since July 2000 | Retired since June 2000. Prior thereto, Ms. Hennigar was the Chairman or President and Chief Executive Officer of OppenheimerFunds Services and a member of the Executive Committee of OppenheimerFunds. | 84 | None | ||||
Barbara I. Jacobs
c/o Gartmore Global Investments, Inc. 1200 River Road, Suite 1000 Conshohocken, PA 19428
1950 | Trustee since December 2004 | Ms. Jacobs has served as Chairman of the Board of Directors of KICAP Network Fund, a European (United Kingdom) hedge fund, since December 2000. Prior to 2004, Ms. Jacobs was also a Managing Director and European Portfolio Manager with CREF Investments (Teachers Insurance Annuity Association — College Retirement Equity Fund). | 84 | None | ||||
Douglas F. Kridler
c/o Gartmore Global Investments, Inc. 1200 River Road, Suite 1000 Conshohocken, PA 19428
1955 | Trustee since September 1997 | Mr. Kridler has served as the President and Chief Executive Officer of the Columbus Foundation (a Columbus, OH-based foundation which manages over 1,300 individual endowment funds) since February 2002. Mr. Kridler was the President of the Columbus Association for the Performing Arts prior thereto and Chairman of the Greater Columbus Convention and Visitors Bureau during 2000 and 2001. | 84 | None | ||||
Michael D. McCarthy
c/o Gartmore Global Investments, Inc. 1200 River Road, Suite 1000 Conshohocken, PA 19428
1947 | Trustee since December 2004 | Mr. McCarthy serves as: the Founder and Chairman of The Eureka Foundation (which sponsors and funds the “Great Museums” series on PBS); and a Partner of Pineville Properties LLC (a commercial real estate development firm). | 843 | None |
21
Table of Contents
GARTMORE VARIABLE INSURANCE TRUST
Management Information (Unaudited)
June 30, 2005
| Name, Address and Date of Birth | Position(s) Held with the Trust and Length of Time Served1 | Principal Occupation(s) During Past 5 Years | Number of Portfolios in the Gartmore Fund Complex Overseen by Trustee | Other Directorships Held by Trustee or Nominee2 | ||||
David C. Wetmore
c/o Gartmore Global Investments, Inc. 1200 River Road, Suite 1000 Conshohocken, PA 19428
1948 | Trustee since 1995 and Chairman since February 2005 | Retired. Mr. Wetmore was formerly a Managing Director of Updata Capital, an investment banking and venture capital firm. | 84 | None |
| * | Pursuant to the Trust’s mandatory retirement policy, Ms. Hennigar is expected to retire on or about January 12, 2006. |
| 1 | The term of office length is until a trustee resigns or reaches a mandatory retirement age of 70. On March 2, 2000, the Board adopted a five-year implementation period for any Trustee 65 or older as of the adoption of this policy. Pursuant to this policy, Messrs. Duncan and Kerr retired as trustees effective as of March 12, 2005. |
| 2 | Directorships held in (1) any other investment companies registered under the 1940 Act, (2) any company with a class of securities registered pursuant to Section 12 of the Securities Exchange Act of 1934, as amended (the “Exchange Act”), or (3) any company subject to the requirements of Section 15(d) of the Exchange Act. |
| 3 | Mr. McCarthy was also an Administrative Committee Member for the Alphagen Arneb Fund, LLC, The Healthcare Fund LDC, The Leaders Long-Short Fund, LLC, and The Leaders Long-Short Fund LDC, four private investment companies (hedge funds) managed by GSA. Mr. McCarthy resigned as an Administrative Committee Member effective June 30, 2005. |
Trustees and Officers who are not Interested Persons (as defined in the 1940 Act) of the Funds received aggregate compensation of $274,882 from the Trust for the Six Months Ended June 30, 2005. Additional information regarding the Trustees and Officers may be found in the Trust’s statement of additional information, which is available without charge upon request, by calling 1-800-848-0920.
22
Table of Contents
GARTMORE VARIABLE INSURANCE TRUST
Management Information (Unaudited)
June 30, 2005
Trustees who are Interested Persons (as defined in the 1940 Act) and/or Officers of the Funds June 30, 2005
| Name, Address and Age | Position(s) Held with the Trust and Length of Time Served1 | Principal Occupation(s) During Past 5 Years | Number of Portfolios in the Gartmore Fund Complex Overseen by Trustee | Other Directorships Held by Trustee2 | ||||
Paul J. Hondros
Gartmore Global Investments, Inc. 1200 River Road, Suite 1000 Conshohocken, PA 19428
1948 | Trustee since July 2000 | Mr. Hondros has been President and Chief Executive Officer of various Gartmore entities, including Gartmore Distribution Services, Inc. (“GDSI”),3 Gartmore Investor Services, Inc. (“GISI”),3 Gartmore Morley Capital Management, Inc. (“GMCM”),3 Gartmore Morley Financial Services, Inc. (“GMFS”),3 NorthPointe Capital, LLC (“NorthPointe”),3 Gartmore Global Asset Management Trust (“GGAMT”)3, Gartmore Global Investments, Inc. (“GGI”)3, Gartmore Mutual Fund Capital Trust (“GMFCT”)3 and Gartmore SA Capital Trust (“GSA”)3; and a Director of Nationwide Securities, Inc.3, as well as several entities within Nationwide Financial Services, Inc. | 844 | None | ||||
Arden L. Shisler
c/o Gartmore Global Investments, Inc. 1200 River Road, Suite 1000 Conshohocken, PA 19428
1941 | Trustee since February 2000 | Mr. Shisler has been a consultant since January 2003. Prior thereto, he was President and Chief Executive Officer of K&B Transport, Inc., a trucking firm. Since 1992, Mr. Shisler has also been Chairman of the Board for Nationwide Mutual Insurance Company3. | 84 | Director of Nationwide Financial Services, Inc. | ||||
Gerald J. Holland
Gartmore Global Investments, Inc. 1200 River Road, Suite 1000 Conshohocken, PA 19428
1951 | Treasurer since March 2001 | Mr. Holland is Senior Vice President — Operations for GGI3, GMFCT3 , and GSA3. Prior to July 2000, Mr. Holland was Vice President for First Data Investor Services, an investment company service provider. | 84 | None |
23
Table of Contents
GARTMORE VARIABLE INSURANCE TRUST
Management Information (Unaudited)
June 30, 2005
| Name, Address and Age | Position(s) Held with the Trust and Length of Time Served1 | Principal Occupation(s) During Past 5 Years | Number of Portfolios in the Gartmore Fund Complex Overseen by Trustee | Other Directorships Held by Trustee2 | ||||
Michael A. Krulikowski
Gartmore Global Investments, Inc. 1200 River Road, Suite 1000 Conshohocken, PA 19428
1959 | Chief Compliance Officer since June 2004 | Since November 1999, Mr. Krulikowski has served as a Vice President and Chief Compliance Officer of GGI. Prior thereto, Mr. Krulikowski served as Chief Compliance Officer of 1717 Capital Management Company/Provident Mutual Insurance Company. | 84 | None | ||||
Eric E. Miller
Gartmore Global Investments, Inc. 1200 River Road, Suite 1000 Conshohocken, PA 19428
1953 | Secretary since December 2002 | Mr. Miller is Senior Vice President, Chief Counsel for GGI3, GMFCT3 and GSA3 since August 2002. From August 2000 to August 2002, Mr. Miller was a Partner with Stradley Ronan Stevens & Young, LLP. Prior to August 2000, Mr. Miller served as Senior Vice President and Deputy General Counsel at Delaware Investments. | 84 | None |
| 1 | The term of office length is until a trustee resigns or reaches a mandatory retirement age of 70. On March 2, 2000, the Board adopted a five-year implementation period for any Trustee 65 or older as of the adoption of this policy. Pursuant to this policy, Messrs. Duncan and Kerr retired as trustees effective as of March 12, 2005. |
| 2 | Directorships held in (1) any other investment companies registered under the 1940 Act, (2) any company with a class of securities registered pursuant to Section 12 of the Securities Exchange Act of 1934, as amended (the “Exchange Act”), or (3) any company subject to the requirements of Section 15(d) of the Exchange Act. |
| 3 | This position is held with an affiliated person or principal underwriter of the Trust. |
| 4 | Mr. Hondros was also an Administrative Committee Member for the Alphagen Arneb Fund, LLC, The Healthcare Fund LDC, The Leaders Long-Short Fund, LLC, and The Leaders Long-Short Fund LDC, four private investment companies (hedge funds) managed by GSA. Mr. Hondros resigned as Administrative Committee Member effective June 30, 2005. |
Federal law requires the Trust, each of its investment advisers and sub-advisers to adopt procedures for voting proxies (“Proxy Voting Guidelines”) and to provide a summary of those Proxy Voting Guidelines used to vote the securities held by the Funds. The Funds’ proxy voting policies and procedures are available without charge (i) upon request, by calling 1-800-848-0920, (ii) on the Fund’s website at www.gartmorefunds.com, or (iii) on the Securities and Exchange Commission’s website at www.sec.gov.
24
Table of Contents
Gartmore GVIT Money Market Fund II
Semiannual Report
| | June 30, 2005 |
| Contents | ||
| 5 | Statement of Investments | |
| 7 | Statement of Assets and Liabilities | |
| 7 | Statement of Operations | |
| 8 | Statements of Changes in Net Assets | |
| 9 | Financial Highlights | |
| 10 | Notes to Financial Statements | |
Commentary provided by Gartmore Global Investments, investment adviser to Gartmore Variable Insurance Trust. All opinions and estimates included in this report constitute Gartmore Global Investments’ judgment as of the date of this report and are subject to change without notice.
Statement Regarding Availability of Quarterly Portfolio Schedule.
The Gartmore Variable Insurance Trust files complete schedules of portfolio holdings for each Fund with the Securities and Exchange Commission (the “Commission”) for the first and third quarters of each fiscal year on Form N-Q. The Funds’ Forms N-Q are available on the Commission’s website at http://www.sec.gov. The Funds’ Forms N-Q may be reviewed and copied at the Commission’s Public Reference Room in Washington, DC, and information on the operation of the Public Reference Room may be obtained by calling 800-SEC-0330; and the Funds make the information on Form N-Q available to shareholders upon request without charge.
Statement Regarding Availability of Proxy Voting Record.
Information regarding how the Fund voted proxies relating to portfolio securities held during the most recent 12-month period ended June 30, 2005 is available without charge, upon request, by calling 800-848-0920, and on the Commission’s website at http://www.sec.gov.
Table of Contents
Gartmore GVIT Money Market Fund II
For the semiannual period ended June 30, 2005, the Gartmore GVIT Money Market Fund II returned 0.86% versus 1.38% for its benchmark, the iMoneyNet First Tier Retail Index. For broader comparison, the average return for the Fund’s Lipper peer category of Money Market Funds was 1.07%.
The Fund is designed for those investors wanting the flexibility to move between the fixed-income and equity markets. As a result, the Fund’s weighted average maturity (WAM) will be considerably shorter than that of the peer group. The Fund is limited to a WAM of 15 days. Since the Fund’s WAM is so short, returns are most affected by the daily change in the federal funds rate, which is set by the Federal Reserve Board and is considered the most accurate predictor of interest rates. However, while the rate is set to a certain percent, it fluctuates somewhat on a daily basis. As the Federal Reserve raises rates, the Fund’s yield is immediately affected due to the fact that the portfolio turns over so quickly.
During the reporting period, the Fed increased short-term interest rates (federal funds rate) on four consecutive occasions by 25 basis points each. On June 30, 2005, the rate was 3.25% (compared to 2.25% on Dec. 31, 2004) and represented nine consecutive rate increases from 1.00% in June 2004. In its statement on June 30, 2005, the Fed mentioned its continued concern with inflation and the likelihood that short-term rates would continue to rise at a measured pace. Observers expect short-term rates to rise to a “neutral rate—which allows for an acceptable rate of inflation and sustains economic growth. This rate believed to be somewhere between 3.25% and 4.25%, but, the Federal Open Market Committee will determine the exact rate.
At the end of the reporting period, the weighted average maturity (WAM) was six days. During the reporting period, Fund asset volatility was higher compared to previous months during the year, as investors moved from fixed income to equity markets. The Fund continued to be well diversified during the period. On June 30, 2005, the largest industry concentrations were as follows: finance services, foreign banks and personal credit institutions. All securities held by the Fund were Tier One (two top-tier ratings), and no ratings downgrades occurred.
PORTFOLIO MANAGER: Karen Mader
An investment in a money market fund is not insured or guaranteed by the FDIC or any other government agency. Although a money market fund seeks to preserve the value of your investment at $1.00 per share, it is possible to lose money by investing in the money market.
Investing in mutual funds involves risk, including possible loss of principal.
There is no assurance that the investment objective of any fund will be achieved.
There is no assurance that a diversified portfolio will produce better results than a nondiversified one.
iMoneyNet First Tier Retail Index: An unmanaged index that is an average of non-government retail money market mutual funds that do not invest in any second-tier securities. Portfolio holdings of first-tier money market mutual funds include U.S. Treasury, U.S. other, repurchase agreements, time deposits, domestic and foreign bank obligations, first-tier commercial paper, floating-rate notes and asset-backed commercial paper.
Lipper Analytical Services, Inc. is an industry research firm whose rankings are based on total return performance and do not reflect the effects of sales charges.
The Gartmore Variable Insurance Trust Funds are available only as sub-account investment options in certain variable insurance products. Accordingly, investors are unable to invest in shares of these funds outside of an insurance product. Performance information found herein reflects only the performance of these funds, and does not indicate the performance your sub-account may experience under your variable insurance contract. Performance returns assume reinvestment of all distributions. The investment return and principal value of an investment will fluctuate so that an investor’s shares, when redeemed, may be worth more or less than their original cost. Index performance is provided for comparison purposes only; the indexes shown are unmanaged and do not reflect any fees or expenses. Investors cannot invest directly in market indexes. To obtain performance information about the sub-account option under your insurance contract that invests in one of these funds, please contact your variable insurance carrier. PAST PERFORMANCE IS NO GUARANTEE OF FUTURE RESULTS.
Commentary provided by Gartmore Global Investments. All opinions and estimates included in this report constitute Gartmore Global Investments’ judgment as of the date of this report and are subject to change without notice.
Investors should carefully consider a fund’s investment objectives, risks, fees, charges and expenses before investing any money. To obtain this and other information on Gartmore Variable Insurance Trust, please contact your variable insurance contract provider or call 800-848-0920. Please read the Trust’s prospectus carefully before investing any money.
Gartmore Funds distributed by Gartmore Distribution Services, Inc., Member NASD. 1200 River Road, Suite 1000, Conshohocken, PA 19428.
1
Table of Contents
Fund Performance | Gartmore GVIT Money Market Fund II |
| Average | Annual Total Return1 |
(For Periods Ended June 30, 2005)
| Six months* | One year | Inception2 | ||||
| Class I | 0.86% | 1.22% | 0.64% |
| * | Not Annualized. |
| 1 | Not subject to any sales charges. |
| 2 | Fund commenced operations on October 1, 2001. |
| Performance | of a $10,000 Investment |
Investment return and principal value will fluctuate, and when redeemed, shares may be worth more or less than original cost. Past performance is no guarantee of future results and does not reflect the deduction of taxes that a shareholder would pay on fund distributions or the redemption of fund shares. Investing in mutual funds involves market risk, including loss of principal. Performance returns assume the reinvestment of all distributions.
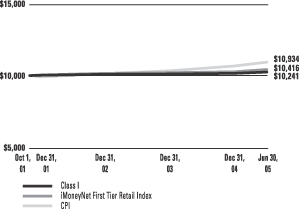
Comparative performance of $10,000 invested in Class I shares of the Gartmore GVIT Money II Market Fund, the iMoneyNet First Tier Retail Index (iMoneyNet First Tier Retail)(a), and the Consumer Price Index (CPI)(b) since inception. Unlike, the Fund, the returns for these unmanaged indexes do not reflect any fees, expenses, or sales charges. Investors cannot invest directly in market indexes.
| (a) | The iMoneyNet First Tier Retail Index is unmanaged index that is an average of non-government retail money market mutual funds that do not invest in any second-tier securities. Portfolio holdings of first-tier money market mutual funds include U.S. Treasury, U.S. other, repurchase agreements, time deposits, domestic and foreign bank obligations, first-tier commercial paper, floating-rate notes and asset-backed commercial paper. |
| (b) | The CPI represents changes in prices of a basket of goods and services purchased for consumption by urban households. |
2
Table of Contents
Shareholder
Expense Example | Gartmore GVIT Money Market Fund II |
As a shareholder of the Fund, you incur two types of costs: (1) transaction costs, including sales charges (loads) paid on purchase payments and redemption fees; and (2) ongoing costs, including investment advisory fees, administration fees, distribution fees and other Fund expenses. The examples below are intended to help you understand your ongoing costs (in dollars) of investing in the Fund and to compare these costs with the ongoing costs of investing in other mutual funds. Per SEC requirements, the examples assume that you had a $1,000 investment in the Class at the beginning of the reporting period, January 1, 2005, and continued to hold your shares at the end of the reporting period, June 30, 2005.
Actual Expenses
For each Class of the Fund in the table below, the first line provides information about actual account values and actual expenses. You may use the information in this line, together with the amount you invested, to estimate the expenses that you paid over the period. Simply divide your account value by $1,000 (for example, an $8,600 account value divided by $1,000 = 8.6), then multiply the result by the number in the first line of each Class under the heading entitled “Expenses Paid During Period” to estimate the expenses you paid on your account during the period.
Hypothetical Example for Comparison Purposes
The second line of each Class in the table below provides information about hypothetical account values and hypothetical expenses based on the Class’ actual expense ratio and an assumed rate of return of 5% per year before expenses, which is not the Class’ actual return. The hypothetical account values and expenses may not be used to estimate the actual ending account balance or expenses you paid for the period. You may use this information to compare the ongoing costs of investing in the Class of the Fund and other funds. To do so, compare this 5% hypothetical example with the 5% hypothetical examples that appear in the shareholder reports of the other funds.
Please note that the expenses shown in the table are meant to highlight your ongoing costs only and do not reflect any transaction costs, such as sales charges (loads) or redemption fees. Therefore, the second line for each Class in the table is useful in comparing ongoing costs only, and will not help you determine the relative total costs of owning different funds. In addition, if these transaction costs were included, your costs would have been higher. The examples also assume all dividends and distributions have been reinvested.
| Beginning Account Value, January 1, 2005 | Ending Account Value, June 30, 2005 | Expenses Paid During Period* | Annualized Expense Ratio* | ||||||||||
| Money Market Fund II | |||||||||||||
Class I(a) | Actual | $ | 1,000 | $ | 1,009 | $ | 4.98 | 1.00% | |||||
| Hypothetical1 | $ | 1,000 | $ | 1,020 | $ | 5.02 | 1.00% | ||||||
| (a) | The Money Market Fund II shares have no class designation. |
| * | Expenses are equal to the Fund’s annualized expense ratio multiplied by the average account value over the period multiplied by 181/365 (to reflect the one-half year period). The expense ratio presented represents a six month, annualized ratio in accordance with SEC guidelines. |
| 1 | Represents the hypothetical 5% return before expenses. |
3
Table of Contents
Portfolio Summary
(June 30, 2005) | Gartmore GVIT Money Market Fund II |
The SEC adopted a requirement that Funds present their portfolio holdings in a table, chart or graph format in their annual and semiannual reports to shareholders, whether or not a statement of investments is utilized. The following tables, which present portfolio holdings as a percentage of net assets, are provided in compliance with this requirement.
| Asset Allocation | ||
| Commercial Paper | 79.8% | |
| Asset Backed Securities | 20.5% | |
| Liabilities in excess of other assets | -0.3% | |
| 100.0% | ||
| Top Holdings | ||
| Cargill, Inc., 3.35%, 07/01/05 | 3.8% | |
| Citigroup Global, 3.35%, 07/01/05 | 3.8% | |
| Gillete Co., 3.34%, 07/01/05 | 3.8% | |
| Lockhart Funding LLC, 3.41%, 07/01/05 | 3.8% | |
| Stanfield Victoria Funding LLC, 3.10%, 07/01/05 | 3.8% | |
| Wal-Mart Stores, Inc., 3.20%, 07/05/05 | 3.4% | |
| Yorkshire Building Society, 3.35%, 07/05/05 | 3.4% | |
| HBOS Treasury Services PLC, 3.09%, 07/08/05 | 3.4% | |
| Colgate-Palmolive Co., 3.23%, 07/15/05 | 3.4% | |
| American Express Credit Corp., 3.20%, 07/11/05 | 3.3% | |
| Other Holdings | 64.1% | |
| 100.0% | ||
| Top Industries | ||
| Financial Services | 14.4% | |
| Banks — Foreign | 12.4% | |
| Short Term Business Credit | 9.6% | |
| Yankee | 7.0% | |
| Personal Credit Institutions | 6.7% | |
| Trade & Term Receivables | 5.9% | |
| Agricultural Services | 3.8% | |
| CDO Trust Preferred | 3.8% | |
| Cutlery | 3.8% | |
| Variety Stores | 3.4% | |
| Other Industries | 29.2% | |
| 100.0% | ||
4
Table of Contents
GARTMORE VARIABLE INSURANCE TRUST
GARTMORE GVIT MONEY MARKET FUND II
Statement of Investments — June 30, 2005 (Unaudited)
| Principal Amount | Value | |||||
| COMMERCIAL PAPER (79.8%) | ||||||
| Agricultural Services (3.8%) | ||||||
| Cargill, Inc., 3.35%, 07/01/05 (b) | $ | 9,700,000 | $ | 9,700,000 | ||
| Auto Parts (3.2%) | ||||||
| Honeywell International, 3.25%, 07/05/05 (b) | 4,000,000 | 3,998,556 | ||||
| Honeywell International, 3.25%, 07/06/05 (b) | 4,000,000 | 3,998,194 | ||||
| 7,996,750 | ||||||
| Bank Holdings Companies (0.7%) | ||||||
| Bank Of America Corp., 3.16%, 07/06/05 | 1,800,000 | 1,799,210 | ||||
| Banks—Foreign (12.4%) | ||||||
| HBOS Treasury Services PLC, 3.09%, 07/08/05 | 8,500,000 | 8,494,602 | ||||
| National Australia Funding (DE), 3.25%, 07/11/05 | 8,000,000 | 7,992,778 | ||||
| Societe Generale, 3.27%, 07/06/05 | 7,500,000 | 7,496,594 | ||||
| UBS Finance, 3.30%, 07/06/05 | 7,367,000 | 7,363,657 | ||||
| 31,347,631 | ||||||
| Cosmetics & Toiletries (3.4%) | ||||||
| Colgate-Palmolive Co., 3.23%, 07/15/05 (b) | 8,500,000 | 8,489,323 | ||||
| Cutlery (3.8%) | ||||||
| Gillete Co., 3.34%, 07/01/05 (b) | 9,700,000 | 9,700,000 | ||||
| Electric Services (1.8%) | ||||||
| FPL Group Capital, Inc., 3.26%, 07/05/05 (b) | 4,500,000 | 4,498,370 | ||||
| Finance Lessors (0.8%) | ||||||
| PB Finance (Delaware), 3.25%, 07/07/05 | 2,000,000 | 1,998,917 | ||||
| Financial Services (14.4%) | ||||||
| Citigroup Global, 3.35%, 07/01/05 | 9,700,000 | 9,700,000 | ||||
| First Data Corp., 3.35%, 07/01/05 | 8,000,000 | 8,000,000 | ||||
| First Data Corp., 3.19%, 07/05/05 | 1,090,000 | 1,089,614 | ||||
| Principal Amount | Value | |||||
| COMMERCIAL PAPER (continued) | ||||||
| Financial Services (continued) | ||||||
| ING (US) Funding LLC, 3.24%, 07/14/05 | $ | 8,000,000 | $ | 7,990,640 | ||
| Rabobank USA Finance Corp., 3.34%, 07/01/05 | 7,390,000 | 7,390,000 | ||||
| Rabobank USA Finance Corp., 3.20%, 07/07/05 | 2,308,000 | 2,306,742 | ||||
| 36,476,996 | ||||||
| General Industrial Machinery (2.8%) | ||||||
| Illinois Tool Works, Inc., 3.25%, 07/06/05 | 7,000,000 | 6,996,840 | ||||
| Office Machines (2.6%) | ||||||
| Pitney Bowes, Inc., 3.28%, 07/05/05 (b) | 6,600,000 | 6,597,595 | ||||
| Personal Credit Institutions (6.7%) | ||||||
| American General Finance Corp., 3.26%, 07/08/05 | 8,000,000 | 7,994,929 | ||||
| Toyota Motor Credit Corp., 3.25%, 07/07/05 | 3,000,000 | 2,998,375 | ||||
| Toyota Motor Credit Corp., 3.20%, 07/08/05 | 5,000,000 | 4,996,889 | ||||
| Toyota Motor Credit Corp., 3.28%, 07/15/05 | 898,000 | 896,865 | ||||
| 16,887,058 | ||||||
| Pharmaceuticals (2.4%) | ||||||
| Pfizer, Inc., 3.18%, 07/05/05 (b) | 6,000,000 | 5,997,880 | ||||
| Publishing—Newspapers (2.7%) | ||||||
| Gannett Co., 3.25%, 07/12/05 (b) | 3,900,000 | 3,896,127 | ||||
| Scripps, E.W. Co., 3.37%, 07/01/05 (b) | 3,000,000 | 3,000,000 | ||||
| 6,896,127 | ||||||
| Short Term Business Credit (9.6%) | ||||||
| American Express Credit Corp., 3.20%, 07/11/05 | 8,343,000 | 8,335,584 | ||||
| GE Capital Corp., 3.25%, 07/05/05 | 8,000,000 | 7,997,111 | ||||
| Prudential Funding LLC, 3.24%, 07/13/05 | 8,000,000 | 7,991,360 | ||||
| 24,324,055 | ||||||
5
Table of Contents
GARTMORE VARIABLE INSURANCE TRUST
GARTMORE GVIT MONEY MARKET FUND II
Statement of Investments — June 30, 2005 (Unaudited) (continued)
| Principal Amount | Value | |||||
| COMMERCIAL PAPER (continued) | ||||||
| Subdividers & Developers (3.4%) | ||||||
| Yorkshire Building Society, 3.35%, 07/05/05 | $ | 8,500,000 | $ | 8,496,836 | ||
| Surgical and Medical Instruments (1.9%) | ||||||
| Becton Dickinson, 3.35%, 07/01/05 | 4,800,000 | 4,800,000 | ||||
| Variety Stores (3.4%) | ||||||
| Wal-Mart Stores, Inc., 3.20%, 07/05/05 | 8,500,000 | 8,496,978 | ||||
| Total Commercial Paper | 201,500,566 | |||||
| ASSET BACKED SECURITIES (20.5%) | ||||||
| CDO Trust Preferred (3.8%) | ||||||
| Lockhart Funding LLC, 3.41%, 07/01/05 (b) | 9,700,000 | 9,700,000 | ||||
| ABS—Securities Domestic (2.0%) | ||||||
| Harrier Finance Funding LLC, 3.31%, 07/05/05 (b) | 5,000,000 | 4,998,161 | ||||
| ABS—Repurchase Agreements (1.8%) | ||||||
| Liquid Funding Ltd., 3.25%, 07/07/05 | 4,605,000 | 4,602,506 | ||||
| ABS—Trade & Term Receivables (5.9%) | ||||||
| Kitty Hawk Funding Corp., 3.27%, 07/11/05 (b) | 1,450,000 | 1,448,683 | ||||
| Old Line Funding Corp., 3.28%, 07/08/05 (b) | 7,500,000 | 7,495,217 | ||||
| Old Line Funding Corp., 3.27%, 07/14/05 (b) | 1,000,000 | 998,819 | ||||
| Variable Funding Capital Corp., 3.25%, 07/01/05 | 3,000,000 | 3,000,000 | ||||
| Variable Funding Capital Corp., 3.30%, 07/06/05 | 1,000,000 | 999,542 | ||||
| Variable Funding Capital Corp., 3.27%, 07/08/05 | 1,000,000 | 999,364 | ||||
| 14,941,625 | ||||||
| Principal Amount | Value | ||||||
| ASSET BACKED SECURITIES (continued) | |||||||
| ABS—Securities Yankee (7.0%) | |||||||
| K2 (USA) LLC, 3.39%, 07/01/05 (b) | $ | 8,000,000 | $ | 8,000,000 | |||
| Stanfield Victoria Funding LLC, 3.10%, 07/01/05 (b) | 9,700,000 | 9,699,999 | |||||
| 17,699,999 | |||||||
| Total Asset Backed Securities | 51,942,291 | ||||||
| Total Investments (Cost $253,442,857) (a) — 100.3% | 253,442,857 | ||||||
| Liabilities in excess of other assets — (0.3%) | (676,760 | ) | |||||
| NET ASSETS — 100.0% | $ | 252,766,097 | |||||
| (a) | See notes to financial statements for tax unrealized appreciation (depreciation) of securities. |
| (b) | Restricted Securities issued pursuant to Section 4(2) of the Securities Act of 1933. These securities were deemed liquid pursuant to procedures approved by the Board of Trustees. |
| CDO | Collateralized Debt Obligation |
See notes to financial statements.
6
Table of Contents
GARTMORE VARIABLE INSURANCE TRUST
GARTMORE GVIT MONEY MARKET FUND II
Statement of Assets and Liabilities
June 30, 2005 (Unaudited)
Assets: | ||||
Investments, at value (cost $253,442,857) | $ | 253,442,857 | ||
Interest and dividends receivable | 12,163 | |||
Prepaid expenses and other assets | 10,998 | |||
Total Assets | 253,466,018 | |||
Liabilities: | ||||
Payable to custodian | 10,157 | |||
Distributions payable | 468,222 | |||
Accrued expenses and other payables: | ||||
Investment advisory fees | 114,449 | |||
Fund administration and transfer agent fees | 7,538 | |||
Distribution fees | 57,225 | |||
Administrative servicing fees | 33,381 | |||
Other | 8,949 | |||
Total Liabilities | 699,921 | |||
Net Assets | $ | 252,766,097 | ||
Represented by: | ||||
Capital | $ | 252,766,133 | ||
Accumulated net realized gains (losses) from investment transactions | (36 | ) | ||
Net Assets | $ | 252,766,097 | ||
Net Assets: | ||||
Class I Shares* | $ | 252,766,097 | ||
Shares outstanding (unlimited number of shares authorized): | ||||
Class I Shares* | 252,766,132 | |||
Net asset value and offering price per share:** | ||||
Class I Shares* | $ | 1.00 |
| * | Shares have no class designation. |
| ** | Not subject to a front-end sales charge. |
For the Six Months Ended June 30, 2005 (Unaudited)
Investment Income: | |||
Interest income | $ | 3,954,189 | |
Dividend income | 50,610 | ||
Total Income | 4,004,799 | ||
Expenses: | |||
Investment advisory fees | 733,879 | ||
Fund administration and transfer agent fees | 94,022 | ||
Distribution fees | 366,940 | ||
Administrative servicing fees | 220,598 | ||
Other*** | 56,333 | ||
Total Expenses | 1,471,772 | ||
Net Investment Income (Loss) | 2,533,027 | ||
CHANGE IN NET ASSETS RESULTING FROM OPERATIONS | $ | 2,533,027 | |
| *** | Other expenses may include the following fees: audit, custody, insurance, legal, printing, trustee, and out-of-pocket expenses. |
See notes to financial statements.
7
Table of Contents
GARTMORE VARIABLE INSURANCE TRUST
GARTMORE GVIT MONEY MARKET II FUND
Statement of Changes in Net Assets
| Six Months Ended June 30, 2005 | Year Ended December 31, 2004 | |||||||
| (Unaudited) | ||||||||
From Investment Activities: | ||||||||
Operations: | ||||||||
Net investment income | $ | 2,533,027 | $ | 1,084,811 | ||||
Net realized gains (losses) on investment transactions | — | 3 | ||||||
Change in net assets resulting from operations | 2,533,027 | 1,084,814 | ||||||
Distributions to Class I shareholders from: | ||||||||
Net investment income | (2,533,027 | ) | (1,084,811 | ) | ||||
Change in net assets from capital transactions | 59,946,006 | 45,084,315 | ||||||
Change in net assets | 59,946,006 | 45,084,318 | ||||||
Net Assets: | ||||||||
Beginning of period | 192,820,091 | 147,735,773 | ||||||
End of period | $ | 252,766,097 | $ | 192,820,091 | ||||
CAPITAL TRANSACTIONS: | ||||||||
Proceeds from shares issued | $ | 776,414,368 | $ | 1,774,013,866 | ||||
Dividends reinvested | 2,288,675 | 876,584 | ||||||
Cost of shares redeemed | (718,757,037 | ) | (1,729,806,135 | ) | ||||
| 59,946,006 | 45,084,315 | |||||||
SHARE TRANSACTIONS: | ||||||||
Issued | 776,414,368 | 1,774,013,866 | ||||||
Reinvested | 2,288,675 | 876,584 | ||||||
Redeemed | (718,757,037 | ) | (1,729,806,135 | ) | ||||
| 59,946,006 | 45,084,315 | |||||||
See notes to financial statements.
8
Table of Contents
GARTMORE VARIABLE INSURANCE TRUST
FINANCIAL HIGHLIGHTS
Selected Data for Each Share of Capital Outstanding
GVIT Money Market Fund II
| Investment Activities | Distributions | Ratios/Supplemental Data | ||||||||||||||||||||||||||||||||||
| Net Asset Value, Beginning of Period | Net Investment Income (Loss) | Total from Investment Activities | Net Investment Income | Total Distributions | Net Asset Value, End of Period | Total Return | Net Assets at End of Period (000s) | Ratio of Expenses to Average Net Assets | Ratio of Net Investment Income (Loss) to Average Net Assets | Ratio of Expenses (Prior to Reimbursements) to Average Net Assets(a) | Ratio of Net Investment Income (Loss) (Prior to Reimbursements) to Average Net Assets(a) | |||||||||||||||||||||||||
Period Ended December 31, 2001(b) | $ | 1.00 | (c | ) | (c | ) | (c | ) | (c | ) | $ | 1.00 | 0.24% | (d) | $ | 37,411 | 1.30% | (e) | 0.93% | (e) | 1.45% | (e) | 0.78% | (e) | ||||||||||||
Year Ended December 31, 2002 | $ | 1.00 | 0.01 | 0.01 | (0.01 | ) | (0.01 | ) | $ | 1.00 | 0.70% | $ | 110,041 | 0.99% | 0.66% | 0.99% | 0.66% | |||||||||||||||||||
Year Ended December 31, 2003 | $ | 1.00 | (c | ) | (c | ) | (c | ) | (c | ) | $ | 1.00 | 0.18% | $ | 147,736 | 0.95% | 0.17% | 0.99% | 0.13% | |||||||||||||||||
Year Ended December 31, 2004 | $ | 1.00 | (c | ) | (c | ) | (c | ) | (c | ) | $ | 1.00 | 0.41% | $ | 192,820 | 0.96% | 0.43% | 0.99% | 0.40% | |||||||||||||||||
Six Months Ended June 30, 2005 (Unaudited) | $ | 1.00 | 0.01 | 0.01 | (0.01 | ) | (0.01 | ) | $ | 1.00 | 0.86% | (d) | $ | 252,766 | 1.00% | (e) | 1.73% | (e) | (f | ) | (f | ) | ||||||||||||||
| (a) | During the period certain fees were waived and/or reimbursed. If such waivers/reimbursements had not occurred, the ratios would have been as indicated. |
| (b) | For the period from October 2, 2001 (commencement of operations) through December 31, 2001. |
| (c) | The amount is less than $0.005. |
| (d) | Not annualized. |
| (e) | Annualized. |
| (f) | There were no fee reductions during the period. |
See notes to financial statements.
9
Table of Contents
GARTMORE VARIABLE INSURANCE TRUST
NOTES TO FINANCIAL STATEMENTS (Unaudited)
June 30, 2005
1. Organization
Gartmore Variable Insurance Trust (“GVIT” or the “Trust”) is an open-end management investment company, organized under the laws of Delaware by an amended and restated Agreement and Declaration of Trust, dated October 28, 2004, as amended to date. The Trust, originally created under the laws of Massachusetts as a Massachusetts business trust pursuant to a Declaration of Trust dated, as of June 30, 1981, as subsequently amended, redomesticated as a Delaware Statutory Trust after the close of trading on April 29, 2005, and is registered under the Investment Company Act of 1940, as amended (the “1940 Act”). The redomestication is a change in statutory status and does not affect the operations of the Trust. As of June 30, 2005, the Trust had authorized an unlimited number of shares of beneficial interest (“shares”) without par value. The Trust currently offers shares to life insurance company separate accounts to fund the benefits under variable life insurance or annuity policies. To date, only the separate accounts of Nationwide Life Insurance Company and Nationwide Life and Annuity Insurance Company (collectively, “Nationwide”) have purchased shares of the Trust’s series. The Trust operates thirty-one (31) separate series, or mutual funds, each with its own investment objectives and strategies. This report contains the financial statements and nancial highlights of the Gartmore GVIT Money Market II Fund (the “Fund”).
Under the Trust’s organizational documents, the Trust’s officers and trustees are indemnified against certain liabilities arising out of the performance of their duties to the Trust. In addition, the Trust has entered into Indemnification Agreements with the Trust’s trustees and certain officers covering similar liabilities. In addition, in the normal course of business, the Trust enters into contracts with its vendors and others that provide for general indemnifications. The Trust’s maximum exposure under these arrangements is unknown, as this would involve future claims that may be made against the Trust. Based on experience, however, the Trust expects that risk of loss to be remote.
2. Summary of Significant Accounting Policies
The following is a summary of significant accounting policies followed by the Fund in the preparation of its financial statements. The policies are in conformity with accounting principles generally accepted in the United States of America (“GAAP”). The preparation of financial statements requires management to make estimates and assumptions that affect the reported amounts of assets and liabilities, the disclosure of contingent assets and liabilities at the date of the financial statements and the reported amounts of income and expenses for the period. Actual results could differ from those estimates.
| (a) | Security Valuation |
Investments of the Funds are valued at amortized cost, which approximates market value. Under the amortized cost method, premium or discount, if any, is amortized or accreted, respectively, on a constant (straight-line) basis to the maturity of the security.
| (b) | Repurchase Agreements |
The Fund may enter into repurchase agreements with an entity which is a member of the Federal Reserve System or which is a “primary dealer” (as designated by the Federal Reserve Bank of New York) in U.S. Government obligations. The repurchase price generally equals the price paid by the Fund plus interest negotiated on the basis of current short-term rates, which may be more or less than the rate on the underlying portfolio securities. The seller under a repurchase agreement is required to maintain the value of the collateral held pursuant to the agreement at a market value equal to or greater than the repurchase price (including accrued interest). Collateral subject to repurchase agreements is held by the Fund’s custodian or another qualified sub-custodian or in the Federal Reserve/Treasury book-entry system. If the counterparty defaults and the fair value of the collateral declines, realization of the collateral by the Fund may be delayed or limited. The Fund may transfer uninvested cash balances into a pooled cash account. These balances are invested in one or more repurchase agreements, which are fully collateralized by AA-rated Corporate Bonds with the counterparties of CS First Boston and Nomura Securities.
10
Table of Contents
GARTMORE VARIABLE INSURANCE TRUST
NOTES TO FINANCIAL STATEMENTS (Unaudited) (Continued)
June 30, 2005
| (c) | Security Transactions and Investment Income |
Security transactions are accounted for on the date the security is purchased or sold (“trade date”). Securities gains and losses are calculated on the identified cost basis. Interest income is recognized on the accrual basis and includes, where applicable, the amortization or accretion of premium or discount.
| (d) | Distributions to Shareholders |
The Fund’s dividends from net investment income, if any, are declared daily and paid monthly. The Fund’s distributable net realized capital gains, if any, are declared and distributed at least annually.
Dividends and distributions to shareholders are determined in accordance with federal income tax regulations, which may differ from GAAP. These “book/tax” differences are considered either permanent or temporary in nature. In accordance with the American Institute of Certified Public Accountants (“AICPA”) Statement of Position 93-2, permanent differences (i.e., reclassification of market discounts, gain/loss, paydowns, and distributions) are reclassified within the capital accounts based on their nature for federal income tax purposes; temporary differences do not require reclassification. These reclassifications have no effect upon the net asset value of the Fund. To the extent distributions exceed current and accumulated earnings and profits for federal income tax purposes, these distributions are reported as distributions of paid-in-capital.
| (e) | Federal Income Taxes |
It is the policy of the Fund to qualify or continue to qualify as a “regulated investment company” by complying with the provisions available to certain investment companies, as defined in applicable sections of the U.S. Internal Revenue Code, and to make distributions of net investment income and net realized capital gains sufficient to relieve the Fund from all, or substantially all, federal income taxes.
| (f) | Allocation of Expenses, Income, and Gains and Losses |
Expenses directly attributable to the Fund are charged to the Fund. Expenses not directly attributable to the Fund are allocated proportionately among various or all funds within the Trust. The method used by the Fund for allocation is based on the fair value of settled shares outstanding. Under this method, earnings are allocated based on the fair value of settled shares.
3. Transactions with Affiliates
Under the terms of the Trust’s Investment Advisory Agreement, Gartmore Mutual Fund Capital Trust (“GMF”) manages the investment of the assets and supervises the daily business affairs of the Fund. GMF is a wholly-owned subsidiary of Gartmore Global Investments, Inc. (“GGI”), a holding company. GGI is a majority-owned subsidiary of Gartmore Global Asset Management Trust (“GGAMT”). GGAMT is a wholly-owned subsidiary of Nationwide Corporation. All of the common stock of Nationwide Corporation is held by Nationwide Mutual Insurance Company (95.2%) and Nationwide Mutual Fire Insurance Company (4.8%), each of which is a mutual company owned by its policyholders.
Under the terms of the Investment Advisory Agreement, the Fund pays GMF an investment advisory fee based on the Fund’s average daily net assets and the following schedule:
| Fee Schedule | Fees | |
Up to $1 billion | 0.50% | |
Next $1 billion | 0.48% | |
Next $3 billion | 0.46% | |
$5 billion or more | 0.44% |
11
Table of Contents
GARTMORE VARIABLE INSURANCE TRUST
NOTES TO FINANCIAL STATEMENTS (Unaudited) (Continued)
June 30, 2005
Under the terms of a Fund Administration and Transfer Agency Agreement, Gartmore SA Capital Trust (“GSA”) provides the Fund with various administrative and accounting services, and Gartmore Investors Services, Inc. (“GISI”), an indirect subsidiary of GSA, serves as Transfer and Dividend Disbursing Agent for the Fund. The fees for the services provided under this Agreement are calculated based on the Trust’s average daily net assets according to the fee schedule below. The fees are then allocated proportionately among all funds within the Trust in relation to the average daily net assets of each fund and are paid to GSA. GSA pays GISI from these fees for its services.
| Combined Fee Schedule* | ||
Up to $1 billion | 0.13% | |
$1 billion and more up to $3 billion | 0.08% | |
$3 billion and more up to $8 billion | 0.05% | |
$8 billion and more up to $10 billion | 0.04% | |
$10 billion and more up to $12 billion | 0.02% | |
$12 billion or more | 0.01% | |
| * | The assets of the Gartmore GVIT Investor Destinations Aggressive Fund, the Gartmore GVIT Investor Destinations Moderately Aggressive Fund, the Gartmore GVIT Investor Destinations Moderate Fund, the Gartmore GVIT Investor Destinations Moderately Conservative Fund, and the Gartmore GVIT Investor Destinations Conservative Fund (collectively, the “Investor Destinations Funds”) are excluded from the Trust asset level amount in order to calculate this asset-based fee. The Investor Destinations Funds do not pay any part of this fee. |
Effective January 1, 2005, the fee for the fund administration and transfer agency services increased as set forth below. The fees are calculated based on the Trust’s average daily net assets according to the fee schedule below. The fees are then allocated proportionately among all funds within the Trust in relation to the average daily net assets of each fund and are paid to GSA.
| Combined Fee Schedule* | ||
Up to $1 billion | 0.15% | |
$1 billion and more up to $3 billion | 0.10% | |
$3 billion and more up to $8 billion | 0.05% | |
$8 billion and more up to $10 billion | 0.04% | |
$10 billion and more up to $12 billion | 0.02% | |
$12 billion or more | 0.01% |
| * | The assets of each of the Investor Destinations Funds are excluded from the Trust asset level amount in order to calculate this asset-based fee. The Investor Destinations Funds do not pay any part of this fee. |
GSA and GISI have entered into agreements with BISYS Fund Services Ohio, Inc. (“BISYS”), pursuant to which BISYS provides sub-administration and sub-transfer agency services, respectively, to the Fund.
Under the terms of a Distribution Plan under Rule 12b-1 of the 1940 Act, Gartmore Distribution Services, Inc. (“GDSI”), the Fund’s Distributor, is compensated by the Fund for expenses associated with the distribution of the Fund. These fees are based on average daily net assets of the Fund at an annual rate not to exceed 0.25%.
Under the terms of an Administrative Services Plan, the Fund may pay fees to servicing organizations, such as broker-dealers, including Nationwide Financial Services, and financial institutions, which agree to provide administrative support services to the shareholders of certain classes. These services include, but are not limited, to the following: establishing and maintaining shareholder accounts; processing purchase and redemption transactions; arranging bank wires; performing shareholder sub-accounting; answering inquires regarding the Fund; and other such services. These fees are based on an annual rate of up to 0.25% of the average daily net assets of the Fund.
12
Table of Contents
GARTMORE VARIABLE INSURANCE TRUST
NOTES TO FINANCIAL STATEMENTS (Unaudited) (Continued)
June 30, 2005
4. Bank Loans
The Trust has a credit agreement of $100,000,000. Borrowings under this arrangement bear interest at the Federal Funds rate plus 0.50%. The interest costs are included in custodian fees in the Statement of Operations. No compensation balances were required under the terms of the line of credit. There were no borrowings outstanding as of June 30, 2005.
5. Shareholder Meeting
A separate shareholders meeting was held on Tuesday, December 23, 2004, for the shareholders of the Trust’s predecessor pursuant to a Proxy Statement On Schedule 14A, dated October 29, 2004, and mailed to the shareholders of the Trust’s predecessor on or around November 5, 2004.
Two Proposals: The purpose of the December 23, 2004 meeting was to allow the shareholders of the Trust’s predecessor to vote on:
| i | Proposal One: The election of the Trust’s Board of Trustees; and |
| ii | Proposal Two: The approval of an “Agreement and Plan of Reorganization” that provided for the reorganization of the Trust from a Massachusetts business trust into a Delaware statutory trust. |
Proposal One: As set forth in the October 29, 2004 Proxy Statement, the nominees for election as Trustees of the Trust’s predecessor were: Charles E. Allen, Michael J. Baresich, Paula H.J. Cholmondeley, C. Brent DeVore, Phyllis Kay Dryden, Robert M. Duncan, Barbara L. Hennigar, Paul J. Hondros, Barbara I Jacobs, Thomas J. Kerr IV, Douglas F. Kridler, Michael D. McCarthy, Arden L. Shisler, and David C. Wetmore.
Proposal Two: As specifically set forth in the October 29, 2004 Proxy Statement, the Reorganization proposal requested the shareholders of the Trust’s predecessor to approve the proposed “Agreement and Plan of Reorganization” of the Trust’s predecessor (on behalf of each of the its funds) into a new Delaware-domiciled Trust, whereby the Funds of the new Delaware Trust would acquire all of the assets of the corresponding funds of the Trust’s predecessor subject to the liabilities, expenses, costs, charges, and reserves of the corresponding funds of the Trust’s predecessor (contingent or otherwise), in exchange for shares of the acquiring Funds to be distributed pro rata by the Trust to the holders of the shares of the funds of the Trust’s predecessor, in a complete liquidation of the Trust’s predecessor.
| Voting | Results: |
The shareholders of the Trust’s predecessor voted to approve both Proposal One and Proposal Two, as follows:
Proposal 1: Election of a Board of Trustees of Gartmore Variable Insurance Trust
Charles E. Allen: | ||
FOR | 2,797,230,318.955 shares (96.078%) | |
WITHHOLD | 114,195,693.660 shares (3.922%) | |
TOTAL | 2,912,726,012.615 shares (100.000%) | |
Michael J. Baresich: | ||
FOR | 2,796,135,979.559 shares (96.040%) | |
WITHHOLD | 115,290,033.056 shares (3.960%) | |
TOTAL | 2,912,726,012.615 shares (100.000%) | |
13
Table of Contents
GARTMORE VARIABLE INSURANCE TRUST
NOTES TO FINANCIAL STATEMENTS (Unaudited) (Continued)
June 30, 2005
Paula H.J. Cholmondeley: | ||
FOR | 2,795,095,945.396 shares (96.004%) | |
WITHHOLD | 116,330,067.219 shares (3.996%) | |
TOTAL | 2,912,726,012.615 shares (100.000%) | |
C. Brent DeVore: | ||
FOR | 2,797,207,046.916 shares (96.077%) | |
WITHHOLD | 114,218,965.699 shares (3.923%) | |
TOTAL | 2,912,726,012.615 shares (100.000%) | |
Phyllis Kay Dryden: | ||
FOR | 2,795,587,023.994 shares (96.021%) | |
WITHHOLD | 115,838,988.621 shares (3.979%) | |
TOTAL | 2,912,726,012.615 shares (100.000%) | |
Robert M. Duncan: | ||
FOR | 2,790,191,720.503 shares (95.836%) | |
WITHHOLD | 121,234,292.112 shares (4.164%) | |
TOTAL | 2,912,726,012.615 shares (100.000%) | |
Barbara L. Hennigar: | ||
FOR | 2,792,939,848.858 shares (95.937%) | |
WITHHOLD | 118,486,163.757 shares (4.070%) | |
TOTAL | 2,912,726,012.615 shares (100.000%) | |
Paul J. Hondros: | ||
FOR | 2,797,557,404.448 shares (96.089%) | |
WITHHOLD | 113,868,608.167 shares (3.911%) | |
TOTAL | 2,912,726,012.615 shares (100.000%) | |
Barbara I. Jacobs: | ||
FOR | 2,796,306,126.654 shares (96.046%) | |
WITHHOLD | 115,119,885.961 shares (3.954%) | |
TOTAL | 2,912,726,012.615 shares (100.000%) | |
Thomas J. Kerr IV: | ||
FOR | 2,789,755,720.087 shares (95.821%) | |
WITHHOLD | 121,670,292.528 shares (4.179%) | |
TOTAL | 2,912,726,012.615 shares (100.000%) | |
Douglas F. Kridler: | ||
FOR | 2,798,065,774.375 shares (96.106%) | |
WITHHOLD | 113,360,238.240 shares (3.894%) | |
TOTAL | 2,912,726,012.615 shares (100.000%) | |
14
Table of Contents
GARTMORE VARIABLE INSURANCE TRUST
NOTES TO FINANCIAL STATEMENTS (Unaudited) (Continued)
June 30, 2005
Michael D. McCarthy: | ||
FOR | 2,797,452,613.694 shares (96.085%) | |
WITHHOLD | 113,973,395.921 shares (3.915%) | |
TOTAL | 2,912,726,012.615 shares (100.000%) | |
Arden L. Shisler: | ||
FOR | 2,796,738,454.730 shares (96.061%) | |
WITHHOLD | 114,687,557.885 shares (3.939%) | |
TOTAL | 2,912,726,012.615 shares (100.000%) | |
David C. Wetmore: | ||
FOR | 2,794,784,752.247 shares (95.994%) | |
WITHHOLD | 116,641,260.368 shares (4.006%) | |
TOTAL | 2,912,726,012.615 shares (100.000%) | |
Proposal 2: Approval of the Agreement and Plan of Reorganization of Gartmore Variable Insurance Trust
FOR | 2,561,003,822.546 shares (87.964%) | |
AGAINST | 103,593,261.010 shares (3.558%) | |
ABSTAIN | 246,828,929.059 shares (8.478%) | |
TOTAL | 2,912,726,012.615 shares (100.000%) | |
15
Table of Contents
GARTMORE VARIABLE INSURANCE TRUST
Management Information (Unaudited)
June 30, 2005
Trustees who are not Interested Persons (as defined in the 1940 Act) and Officers of the Funds June 30, 2005
| Name, Address and Date of Birth | Position(s) Held with the Trust and Length of Time Served1 | Principal Occupation(s) During Past 5 Years | Number of Portfolios in the Gartmore Fund Complex Overseen by Trustee | Other Directorships Held by Trustee or Nominee2 | ||||
Charles E. Allen
c/o Gartmore Global Investments, Inc. 1200 River Road, Suite 1000 Conshohocken, PA 19428
1948 | Trustee since July 2000 | Mr. Allen is Chairman, Chief Executive Officer and President of the Graimark Realty Advisors, Inc. (real estate development, investment and asset management). | 84 | None | ||||
Paula H.J. Cholmondeley
c/o Gartmore Global Investments, Inc. 1200 River Road, Suite 1000 Conshohocken, PA 19428
1940 | Trustee since July 2000 | Ms. Cholmondeley has been the Chairman and Chief Executive Officer of the Sorrel Group, a management consulting company, since January 2004. From March 2000 through December 2003, Ms. Cholmondeley was Vice President and General Manager of Sappi Fine Paper North America. Prior thereto, Ms. Cholmondeley was Vice President and General Manager of Residential Insulation of Owens Corning. | 84 | Director of Dentsply International, Inc., Ultralife Batteries, Inc., Terex Corporation, Minerals Technology, Inc. and Albany International Corp. | ||||
C. Brent DeVore
c/o Gartmore Global Investments, Inc. 1200 River Road, Suite 1000 Conshohocken, PA 19428
1940 | Trustee since 1990 | Dr. DeVore is President of Otterbein College. | 84 | None | ||||
Phyllis K. Dryden
c/o Gartmore Global Investments, Inc. 1200 River Road, Suite 1000 Conshohocken, PA 19428
1947 | Trustee since December | Ms. Dryden was a former Managing Partner of marchFIRST, a global management consulting firm prior to 2002. | 84 | None |
16
Table of Contents
GARTMORE VARIABLE INSURANCE TRUST
Management Information (Unaudited)
June 30, 2005
| Name, Address and Date of Birth | Position(s) Held with the Trust and Length of Time Served1 | Principal Occupation(s) During Past 5 Years | Number of Portfolios in the Gartmore Fund Complex Overseen by Trustee | Other Directorships Held by Trustee or Nominee2 | ||||
Barbara L. Hennigar*
c/o Gartmore Global Investments, Inc. 1200 River Road, Suite 1000 Conshohocken, PA 19428
1935 | Trustee since July 2000 | Retired since June 2000. Prior thereto, Ms. Hennigar was the Chairman or President and Chief Executive Officer of OppenheimerFunds Services and a member of the Executive Committee of OppenheimerFunds. | 84 | None | ||||
Barbara I. Jacobs
c/o Gartmore Global Investments, Inc. 1200 River Road, Suite 1000 Conshohocken, PA 19428
1950 | Trustee since December | Ms. Jacobs has served as Chairman of the Board of Directors of KICAP Network Fund, a European (United Kingdom) hedge fund, since December 2000. Prior to 2004, Ms. Jacobs was also a Managing Director and European Portfolio Manager with CREF Investments (Teachers Insurance Annuity Association — College Retirement Equity Fund). | 84 | None | ||||
Douglas F. Kridler
c/o Gartmore Global Investments, Inc. 1200 River Road, Suite 1000 Conshohocken, PA 19428
1955 | Trustee since September 1997 | Mr. Kridler has served as the President and Chief Executive Officer of the Columbus Foundation (a Columbus, OH-based foundation which manages over 1,300 individual endowment funds) since February 2002. Mr. Kridler was the President of the Columbus Association for the Performing Arts prior thereto and Chairman of the Greater Columbus Convention and Visitors Bureau during 2000 and 2001. | 84 | None | ||||
Michael D. McCarthy
c/o Gartmore Global Investments, Inc. 1200 River Road, Suite 1000 Conshohocken, PA 19428
1947 | Trustee since December | Mr. McCarthy serves as: the Founder and Chairman of The Eureka Foundation (which sponsors and funds the “Great Museums” series on PBS); and a Partner of Pineville Properties LLC (a commercial real estate development firm). | 843 | None |
17
Table of Contents
GARTMORE VARIABLE INSURANCE TRUST
Management Information (Unaudited)
June 30, 2005
| Name, Address and Date of Birth | Position(s) Held with the Trust and Length of Time Served1 | Principal Occupation(s) During Past 5 Years | Number of Portfolios in the Gartmore Fund Complex Overseen by Trustee | Other Directorships Held by Trustee or Nominee2 | ||||
David C. Wetmore
c/o Gartmore Global Investments, Inc. 1200 River Road, Suite 1000 Conshohocken, PA 19428
1948 | Trustee since 1995 and Chairman since February 2005 | Retired. Mr. Wetmore was formerly a Managing Director of Updata Capital, an investment banking and venture capital firm. | 84 | None |
| * | Pursuant to the Trust’s mandatory retirement policy, Ms. Hennigar is expected to retire on or about January 12, 2006. |
| 1 | The term of office length is until a trustee resigns or reaches a mandatory retirement age of 70. On March 2, 2000, the Board adopted a five-year implementation period for any Trustee 65 or older as of the adoption of this policy. Pursuant to this policy, Messrs. Duncan and Kerr retired as trustees effective as of March 12, 2005. |
| 2 | Directorships held in (1) any other investment companies registered under the 1940 Act, (2) any company with a class of securities registered pursuant to Section 12 of the Securities Exchange Act of 1934, as amended (the “Exchange Act”), or (3) any company subject to the requirements of Section 15(d) of the Exchange Act. |
| 3 | Mr. McCarthy was also an Administrative Committee Member for the Alphagen Arneb Fund, LLC, The Healthcare Fund LDC, The Leaders Long-Short Fund, LLC, and The Leaders Long-Short Fund LDC, four private investment companies (hedge funds) managed by GSA. Mr. McCarthy resigned as an Administrative Committee Member effective June 30, 2005. |
Trustees and Officers who are not Interested Persons (as defined in the 1940 Act) of the Funds received aggregate compensation of $274,882 from the Trust for the Six Months Ended June 30, 2005. Additional information regarding the Trustees and Officers may be found in the Trust’s statement of additional information, which is available without charge upon request, by calling 1-800-848-0920.
18
Table of Contents
GARTMORE VARIABLE INSURANCE TRUST
Management Information (Unaudited)
June 30, 2005
Trustees who are Interested Persons (as defined in the 1940 Act) and/or Officers of the Funds June 30, 2005
| Name, Address and Age | Position(s) Held with the Trust and Length of Time Served1 | Principal Occupation(s) During Past 5 Years | Number of Portfolios in the Gartmore Fund Complex Overseen by Trustee | Other Directorships Held by Trustee2 | ||||
Paul J. Hondros
Gartmore Global Investments, Inc. 1200 River Road, Suite 1000 Conshohocken, PA 19428
1948 | Trustee since July 2000 | Mr. Hondros has been President and Chief Executive Officer of various Gartmore entities, including Gartmore Distribution Services, Inc. (“GDSI”),3 Gartmore Investor Services, Inc. (“GISI”),3 Gartmore Morley Capital Management, Inc. (“GMCM”),3 Gartmore Morley Financial Services, Inc. (“GMFS”),3 NorthPointe Capital, LLC (“NorthPointe”),3 Gartmore Global Asset Management Trust (“GGAMT”)3, Gartmore Global Investments, Inc. (“GGI”)3, Gartmore Mutual Fund Capital Trust (“GMFCT”)3 and Gartmore SA Capital Trust (“GSA”)3; and a Director of Nationwide Securities, Inc.3, as well as several entities within Nationwide Financial Services, Inc. | 844 | None | ||||
Arden L. Shisler
c/o Gartmore Global Investments, Inc. 1200 River Road, Suite 1000 Conshohocken, PA 19428
1941 | Trustee since February 2000 | Mr. Shisler has been a consultant since January 2003. Prior thereto, he was President and Chief Executive Officer of K&B Transport, Inc., a trucking firm. Since 1992, Mr. Shisler has also been Chairman of the Board for Nationwide Mutual Insurance Company3. | 84 | Director of Nationwide Financial Services, Inc. | ||||
Gerald J. Holland
Gartmore Global Investments, Inc. 1200 River Road, Suite 1000 Conshohocken, PA 19428
1951 | Treasurer since March 2001 | Mr. Holland is Senior Vice President — Operations for GGI3, GMFCT3 , and GSA3. Prior to July 2000, Mr. Holland was Vice President for First Data Investor Services, an investment company service provider. | 84 | None |
19
Table of Contents
GARTMORE VARIABLE INSURANCE TRUST
Management Information (Unaudited)
June 30, 2005
| Name, Address and Age | Position(s) Held with the Trust and Length of Time Served1 | Principal Occupation(s) During Past 5 Years | Number of Portfolios in the Gartmore Fund Complex Overseen by Trustee | Other Directorships Held by Trustee2 | ||||
Michael A. Krulikowski
Gartmore Global Investments, Inc. 1200 River Road, Suite 1000 Conshohocken, PA 19428
1959 | Chief Compliance Officer since June 2004 | Since November 1999, Mr. Krulikowski has served as a Vice President and Chief Compliance Officer of GGI. Prior thereto, Mr. Krulikowski served as Chief Compliance Officer of 1717 Capital Management Company/Provident Mutual Insurance Company. | 84 | None | ||||
Eric E. Miller
Gartmore Global Investments, Inc. 1200 River Road, Suite 1000 Conshohocken, PA 19428
1953 | Secretary since December 2002 | Mr. Miller is Senior Vice President, Chief Counsel for GGI3, GMFCT3 and GSA3 since August 2002. From August 2000 to August 2002, Mr. Miller was a Partner with Stradley Ronan Stevens & Young, LLP. Prior to August 2000, Mr. Miller served as Senior Vice President and Deputy General Counsel at Delaware Investments. | 84 | None |
| 1 | The term of office length is until a trustee resigns or reaches a mandatory retirement age of 70. On March 2, 2000, the Board adopted a five-year implementation period for any Trustee 65 or older as of the adoption of this policy. Pursuant to this policy, Messrs. Duncan and Kerr retired as trustees effective as of March 12, 2005. |
| 2 | Directorships held in (1) any other investment companies registered under the 1940 Act, (2) any company with a class of securities registered pursuant to Section 12 of the Securities Exchange Act of 1934, as amended (the “Exchange Act”), or (3) any company subject to the requirements of Section 15(d) of the Exchange Act. |
| 3 | This position is held with an affiliated person or principal underwriter of the Trust. |
| 4 | Mr. Hondros was also an Administrative Committee Member for the Alphagen Arneb Fund, LLC, The Healthcare Fund LDC, The Leaders Long-Short Fund, LLC, and The Leaders Long-Short Fund LDC, four private investment companies (hedge funds) managed by GSA. Mr. Hondros resigned as Administrative Committee Member effective June 30, 2005. |
Federal law requires the Trust, each of its investment advisers and sub-advisers to adopt procedures for voting proxies (“Proxy Voting Guidelines”) and to provide a summary of those Proxy Voting Guidelines used to vote the securities held by the Funds. The Funds’ proxy voting policies and procedures are available without charge (i) upon request, by calling 1-800-848-0920, (ii) on the Fund’s website at www.gartmorefunds.com, or (iii) on the Securities and Exchange Commission’s website at www.sec.gov.
20
Table of Contents
J.P. Morgan GVIT Balanced Fund
Semiannual Report
| | June 30, 2005 |


| Contents | ||
| 6 | Statement of Investments | |
| 18 | Statement of Assets and Liabilities | |
| 18 | Statement of Operations | |
| 19 | Statements of Changes in New Assets | |
| 20 | Financial Highlights | |
| 21 | Notes to Financial Statements | |
Commentary provided by Gartmore Global Investments, investment adviser to Gartmore Variable Insurance Trust. All opinions and estimates included in this report constitute Gartmore Global Investments’ judgment as of the date of this report and are subject to change without notice.
Statement Regarding Availability of Quarterly Portfolio Schedule.
The Gartmore Variable Insurance Trust files complete schedules of portfolio holdings for each Fund with the Securities and Exchange Commission (the “Commission”) for the first and third quarters of each fiscal year on Form N-Q. The Funds’ Forms N-Q are available on the Commission’s website at http://www.sec.gov. The Funds’ Forms N-Q may be reviewed and copied at the Commission’s Public Reference Room in Washington, DC, and information on the operation of the Public Reference Room may be obtained by calling 800-SEC-0330; and the Funds make the information on Form N-Q available to shareholders upon request without charge.
Statement Regarding Availability of Proxy Voting Record.
Information regarding how the Fund voted proxies relating to portfolio securities held during the most recent 12-month period ended June 30, 2005 is available without charge, upon request, by calling 800-848-0920, and on the Commission’s website at http://www.sec.gov.
Table of Contents
J.P. Morgan GVIT Balanced Fund
For the semiannual period ended June 30, 2005, the J.P. Morgan GVIT Balanced Fund returned 0.00% (Class I at NAV) versus 0.55% for its blended benchmark, which consists of 60% S&P 500® Index and 40% Lehman Brothers U.S. Aggregate Index. For broader comparison, the average return for the Fund’s Lipper peer category of Balanced Funds was 0.51%.
In the U.S. large-cap portion of the Fund, the pharmaceutical/medical technology, industrial cyclical and semiconductor sectors detracted from performance, while stock selection in the network technology, energy, and health services and systems sectors benefited performance. On a stock-specific level, overweight positions in Corning Inc., Kohl’s Corp. and CSX Corp. aided performance. Overweight positions in Ambac Financial Group, Inc., Tyco International Ltd. and Boston Scientific Corp. were the primary performance detractors.
In the fixed-income portion of the Fund, we tactically traded duration, with a modest bias toward being short. Our high-yield position aided performance because we increased our allocation while maintaining a high-quality bias in the portfolio, focusing on security selection. Investors’ risk appetite for emerging markets debt increased, as low inflation in the United States, steady global growth indicators and a resumption of commodity price increases produced a favorable backdrop for emerging markets countries. The investment-grade corporate sector was a positive contributor, as corporate profit growth was healthy and technicals remained supportive. However, prepayment mortgage spreads experienced a high degree of volatility, moving in conjunction with rates, thus detracting from performance.
We select equities from a sector-neutral group of stocks that we believe are undervalued relative to their long-term potential. In the fixed-income portion of the Fund, we seek to assemble a high-quality, diversified portfolio that adds value through investments in the traditional and extended markets. Preliminary indicators point to real gross domestic product (GDP) growth of about 3.50%. We expect that the Federal Reserve (the Fed) will tighten policy by 25 basis points to 3.50% at its August meeting and again in September to a 3.75% target. With the economy on “firm footing” and spare capacity gradually absorbed, the Fed is unlikely to pause in its current tightening process until the federal funds rate reaches at least 3.75%.
Within the U.S. large-cap portion of the Fund, we expect the equity markets to trade range-bound until the Fed has completed its tightening cycle. Despite strong valuations favoring equities over fixed income, we remain cautiously optimistic as rising unit labor costs, a strengthening U.S. dollar and high energy costs are expected to put downward pressures on corporate earnings. Within the fixed-income portion of the Fund, our positioning continues to be characterized by the belief that fundamentals across sectors are strong, but value is scarce. Overall, we are neutral on corporate bonds and constructive on high-yield and emerging market bonds, given the persistence of strong fundamentals in these sectors.
PORTFOLIO MANAGERS: Patrick Jakobson, Anne Lester
Investing in mutual funds involves risk, including possible loss of principal.
There is no assurance that the investment objective of any fund will be achieved.
Standard & Poor’s 500 (S&P 500) Index: An unmanaged, capitalization-weighted index of 500 widely held stocks of large-cap U.S. companies that gives a broad look at how the stock prices of those companies have performed.
Lehman Brothers U.S. Aggregate Index: An unmanaged, market value-weighted index of investment-grade, fixed-rate debt issues (including government, corporate, asset-backed, and mortgage-backed securities with maturities of one year or more) that is generally representative of the bond market as a whole.
International investing involves additional risks, including currency fluctuations, differences in accounting standards, political instability and foreign regulations, all of which are magnified in emerging markets.
There is no assurance that a diversified portfolio will produce better results than a nondiversified one.
Lipper Analytical Services, Inc. is an industry research firm whose rankings are based on total return performance and do not reflect the effects of sales charges.
The Gartmore Variable Insurance Trust Funds are available only as sub-account investment options in certain variable insurance products. Accordingly, investors are unable to invest in shares of these funds outside of an insurance product. Performance information found herein reflects only the performance of these funds, and does not indicate the performance your sub-account may experience under your variable insurance contract. Performance returns assume reinvestment of all distributions. The investment return and principal value of an investment will fluctuate so that an investor’s shares, when redeemed, may be worth more or less than their original cost. Index performance is provided for comparison purposes only; the indexes shown are unmanaged and do not reflect any fees or expenses. Investors cannot invest directly in market indexes. To obtain performance information about the sub-account option under your insurance contract that invests in one of these funds, please contact your variable insurance carrier. PAST PERFORMANCE IS NO GUARANTEE OF FUTURE RESULTS.
1
Table of Contents
J.P. Morgan GVIT Balanced Fund (continued)
Commentary provided by Gartmore Global Investments. All opinions and estimates included in this report constitute Gartmore Global Investments’ judgment as of the date of this report and are subject to change without notice.
Investors should carefully consider a fund’s investment objectives, risks, fees, charges and expenses before investing any money. To obtain this and other information on Gartmore Variable Insurance Trust, please contact your variable insurance contract provider or call 800-848-0920. Please read the Trust’s prospectus carefully before investing any money.
Gartmore Funds distributed by Gartmore Distribution Services, Inc., Member NASD. 1200 River Road, Suite 1000, Conshohocken, PA 19428.
2
Table of Contents
Fund Performance | J.P. Morgan GVIT Balanced Fund |
| Average | Annual Total Return1 |
(For Periods Ended June 30, 2005)
| Six months* | One year | Five years | Inception2 | |||||
| Class I3 | 0.00% | 6.76% | 1.04% | 2.36% | ||||
| Class IV4 | 0.03% | 6.72% | 1.07% | 2.38% |
| * | Not Annualized. |
| 1 | Not subject to any sales charges. |
| 2 | Fund commenced operations on October 31, 1997. This performance includes performance for a period (prior to May 1, 2000) when the Fund’s previous subadviser managed the Fund. |
| 3 | The existing shares of the Fund were designated Class I shares as of May 1, 2001. |
| 4 | These returns until the creation of the Class IV shares (April 28, 2003) are based on the performance of the Class I shares of the Fund. Excluding the effect of any fee waivers or reimbursements, such prior performance is similar to what Class IV shares would have produced, because all classes of shares invest in the same portfolio of securities. |
| Performance | of a $10,000 Investment |
Investment return and principal value will fluctuate, and when redeemed, shares may be worth more or less than original cost. Past performance is no guarantee of future results and does not reflect the deduction of taxes that a shareholder would pay on fund distributions or the redemption of fund shares. Investing in mutual funds involves market risk, including loss of principal. Performance returns assume the reinvestment of all distributions.
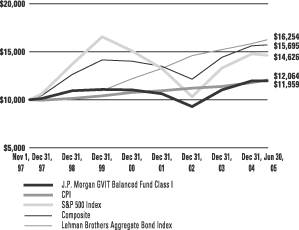
Comparative performance of $10,000 invested in Class I shares of the J.P. Morgan GVIT Balanced Fund, the J.P. Morgan GVIT Balanced Composite Index (Composite)(a), the Standard & Poor’s 500 Index (S&P 500)(b), Lehman Brothers U.S. Aggregate Bond Index (LB Aggregate Bond)(c) and the Consumer Price Index (CPI)(d) since inception. Unlike, the Fund, the returns for these unmanaged indexes do not reflect any fees, expenses, or sales charges. Investors cannot invest directly in market indexes.
| (a) | Composite is an unmanaged, hypothetical representation of the performance of each of the Fund’s asset classes according to their respective weightings. The composite is a combination of the S&P 500 (60%) and the LB Aggregate Bond (40%). |
| (b) | S&P 500 is an unmanaged, market capitalization-weighted index of 500 widely held stocks of large-cap U.S. companies that gives a broad look at how the stock prices of those companies have performed. |
| (c) | LB Aggregate Bond is an unmanaged, market value-weighted index of investment-grade, fixed-rate debt issues (including government, corporate, asset-backed, and mortgage-backed securities with maturities of one year or more) that is generally representative of the bond market as a whole. |
| (d) | The CPI represents changes in prices of a basket of goods and services purchased for consumption by urban households. |
3
Table of Contents
Shareholder
Expense Example | J.P. Morgan GVIT Balanced Fund |
As a shareholder of the Fund, you incur two types of costs: (1) transaction costs, including sales charges (loads) paid on purchase payments and redemption fees; and (2) ongoing costs, including investment advisory fees, administration fees, distribution fees and other Fund expenses. The examples below are intended to help you understand your ongoing costs (in dollars) of investing in the Fund and to compare these costs with the ongoing costs of investing in other mutual funds. Per SEC requirements, the examples assume that you had a $1,000 investment in the Class at the beginning of the reporting period, January 1, 2005, and continued to hold your shares at the end of the reporting period, June 30, 2005.
Actual Expenses
For each Class of the Fund in the table below, the first line provides information about actual account values and actual expenses. You may use the information in this line, together with the amount you invested, to estimate the expenses that you paid over the period. Simply divide your account value by $1,000 (for example, an $8,600 account value divided by $1,000 = 8.6), then multiply the result by the number in the first line of each Class under the heading entitled “Expenses Paid During Period” to estimate the expenses you paid on your account during the period.
Hypothetical Example for Comparison Purposes
The second line of each Class in the table below provides information about hypothetical account values and hypothetical expenses based on the Class’ actual expense ratio and an assumed rate of return of 5% per year before expenses, which is not the Class’ actual return. The hypothetical account values and expenses may not be used to estimate the actual ending account balance or expenses you paid for the period. You may use this information to compare the ongoing costs of investing in the Class of the Fund and other funds. To do so, compare this 5% hypothetical example with the 5% hypothetical examples that appear in the shareholder reports of the other funds.
Please note that the expenses shown in the table are meant to highlight your ongoing costs only and do not reflect any transaction costs, such as sales charges (loads) or redemption fees. Therefore, the second line for each Class in the table is useful in comparing ongoing costs only, and will not help you determine the relative total costs of owning different funds. In addition, if these transaction costs were included, your costs would have been higher. The examples also assume all dividends and distributions have been reinvested.
Beginning Account Value, January 1, 2005 | Ending Account Value, June 30, 2005 | Expenses Paid During Period* | Annualized Expense Ratio* | ||||||||||
| Balanced Fund | |||||||||||||
Class I | Actual | $ | 1,000 | $ | 1,000 | $ | 4.86 | 0.98% | |||||
| Hypothetical1 | $ | 1,000 | $ | 1,020 | $ | 4.92 | 0.98% | ||||||
Class IV | Actual | $ | 1,000 | $ | 1,000 | $ | 4.51 | 0.91% | |||||
| Hypothetical1 | $ | 1,000 | $ | 1,020 | $ | 4.57 | 0.91% | ||||||
| * | Expenses are equal to the Fund’s annualized expense ratio multiplied by the average account value over the period multiplied by 181/365 (to reflect the one-half year period). The expense ratio presented represents a six month, annualized ratio in accordance with SEC guidelines. |
| 1 | Represents the hypothetical 5% return before expenses. |
4
Table of Contents
Portfolio Summary
(June 30, 2005) | J.P. Morgan GVIT Balanced Fund |
The SEC adopted a requirement that Funds present their portfolio holdings in a table, chart or graph format in their annual and semiannual reports to shareholders, whether or not a statement of investments is utilized. The following tables, which present portfolio holdings as a percentage of net assets, are provided in compliance with this requirement.
| Asset Allocation | ||
| Common Stocks | 62.5% | |
| Mortgage-Backed Securities | 25.1% | |
| Commercial Papers | 13.1% | |
| Corporate Bonds | 9.9% | |
| Cash Equivalents | 3.2% | |
| U.S. Government Long-Term Obligations | 1.0% | |
| Liabilities in excess of other assets | -14.8% | |
| 100.0% | ||
| Top Holdings* | ||
| Federal National Mortgage Association, TBA, 5.50% 07/01/33 | 8.5% | |
| Federal Home Loan Mortgage Corp., TBA, 5.50%, 07/01/34 | 2.4% | |
| General Electric Co. | 2.3% | |
| Citigroup, Inc. | 2.0% | |
| Exxon Mobil Corp. | 2.0% | |
| Federal National Mortgage Association, 3.01% 12/19/05 | 2.0% | |
| Microsoft Corp. | 1.7% | |
| Federal National Mortgage Association, TBA, 5.00% 07/01/18 | 1.7% | |
| Johnson & Johnson, Inc. | 1.3% | |
| Practor & Gamble Co. | 1.1% | |
| Other Holdings | 75.0% | |
| 100.0% | ||
| Top Industries | ||
| Financial Services | 21.5% | |
| Federal National Mortgage Association | 11.0% | |
| Oil & Gas | 5.9% | |
| Financial | 5.8% | |
| Federal Home Loan Mortgage Corporation | 4.9% | |
| Retail | 4.1% | |
| Financial/Banks | 4.1% | |
| Drugs | 4.0% | |
| Healthcare | 3.9% | |
| Computer Software & Services | 3.8% | |
| Other Industries | 31.0% | |
| 100.0% | ||
| * | For purpose of listing top holdings, repurchase agreements are considered cash equivalents and are included as part of other holdings. |
5
Table of Contents
GARTMORE VARIABLE INSURANCE TRUST
J.P. MORGAN GVIT BALANCED FUND
Statement of Investments — June 30, 2005 (Unaudited)
Shares or Principal Amount | Value | ||||
| COMMON STOCKS (62.5%) | |||||
| Aerospace & Defense (0.6%) | |||||
| Lockheed Martin Corp. | 800 | $ | 51,896 | ||
| Northrop Grumman Corp. | 19,800 | 1,093,950 | |||
| Raytheon Co. | 8,300 | 324,696 | |||
| 1,470,542 | |||||
| Apparel (0.5%) | |||||
| Coach, Inc. (b) | 6,900 | 231,633 | |||
| Nike, Inc., Class B | 10,800 | 935,280 | |||
| 1,166,913 | |||||
| Auto Parts & Equipment (0.1%) | |||||
| Lear Corp. | 8,000 | 291,040 | |||
| Broadcast Media & Cable Television (1.4%) | |||||
| E.W. Scripps Co., Class A | 14,800 | 722,240 | |||
| Time Warner, Inc. (b) | 30,700 | 512,997 | |||
| Viacom, Inc., Class B | 63,200 | 2,023,664 | |||
| 3,258,901 | |||||
| Building—Residential & Commercial (0.1%) | |||||
| Lennar Corp., Class A | 4,200 | 266,490 | |||
| Business & Consumer Services (0.6%) | |||||
| eBay, Inc. (b) | 26,200 | 864,862 | |||
| FedEx Corp. | 5,500 | 445,555 | |||
| 1,310,417 | |||||
| Casino Hotels (0.1%) | |||||
| Station Casinos, Inc. | 3,400 | 225,760 | |||
| Chemicals & Diversified (1.3%) | |||||
| Air Products & Chemicals, Inc. | 12,200 | 735,660 | |||
| Nalco Holding Co. (b) | 30,300 | 594,789 | |||
| Praxair, Inc. | 16,100 | 750,260 | |||
| Rohm & Haas Co. | 22,400 | 1,038,016 | |||
| 3,118,725 | |||||
| Communication Equipment (1.4%) | |||||
| Corning, Inc. (b) | 87,000 | 1,445,940 | |||
| Motorola, Inc. | 33,200 | 606,232 | |||
| QUALCOMM, Inc. | 38,700 | 1,277,487 | |||
| 3,329,659 | |||||
| Computer Equipment (1.8%) | |||||
| Dell, Inc. (b) | 28,400 | 1,122,084 | |||
| EMC Corp. (b) | 24,000 | 329,040 | |||
| Hewlett-Packard Co. | 9,500 | 223,345 | |||
| International Business Machines Corp. | 23,900 | 1,773,380 | |||
Shares or Principal Amount | Value | ||||
| COMMON STOCKS (continued) | |||||
| Computer Equipment (continued) | |||||
| Juniper Networks, Inc. (b) | 15,300 | $ | 385,254 | ||
| Lexmark International, Inc. (b) | 7,000 | 453,810 | |||
| 4,286,913 | |||||
| Computer Software & Services (3.8%) | |||||
| Affiliated Computer Services, Inc., Class A (b) | 11,900 | 608,090 | |||
| Cisco Systems, Inc. (b) | 128,600 | 2,457,546 | |||
| First Data Corp. | 500 | 20,070 | |||
| Microsoft Corp. | 166,300 | 4,130,892 | |||
| NCR Corp. (b) | 7,700 | 270,424 | |||
| Oracle Corp. (b) | 100,400 | 1,325,280 | |||
| VERITAS Software Corp. (b) | 7,800 | 190,320 | |||
| 9,002,622 | |||||
| Conglomerates (1.2%) | |||||
| ITT Industries, Inc. | 500 | 48,815 | |||
| Johnson Controls, Inc. | 12,300 | 692,859 | |||
| Tyco International Ltd. | 61,500 | 1,795,800 | |||
| United Technologies Corp. | 6,200 | 318,370 | |||
| 2,855,844 | |||||
| Construction & Building Materials (0.7%) | |||||
| Caterpillar, Inc. | 2,100 | 200,151 | |||
| Centex Corp. | 4,300 | 303,881 | |||
| Deere & Co. | 16,200 | 1,060,938 | |||
| 1,564,970 | |||||
| Consumer & Non-Cyclical (0.5%) | |||||
| Gillette Co. | 24,300 | 1,230,309 | |||
| Consumer Products (1.4%) | |||||
| Fortune Brands, Inc. | 4,800 | 426,240 | |||
| Procter & Gamble Co. | 50,700 | 2,674,425 | |||
| Smurfit-Stone Container Corp. (b) | 18,400 | 187,128 | |||
| 3,287,793 | |||||
| Diversified Manufacturing Operations (0.3%) | |||||
| Danaher Corp. | 8,500 | 444,890 | |||
| SPX Corp. | 3,900 | 179,322 | |||
| 624,212 | |||||
| Drugs (4.0%) | |||||
| Amgen, Inc. (b) | 24,800 | 1,499,408 | |||
| Bristol-Myers Squibb Co. | 8,800 | 219,824 | |||
| Eli Lilly & Co. | 20,900 | 1,164,339 | |||
| Forest Laboratories, Inc. (b) | 20,900 | 811,965 | |||
6
Table of Contents
GARTMORE VARIABLE INSURANCE TRUST
J.P. MORGAN GVIT BALANCED FUND
Statement of Investments — June 30, 2005 (Unaudited) (continued)
Shares or Principal Amount | Value | ||||
| COMMON STOCKS (continued) | |||||
| Drugs (continued) | |||||
| Johnson & Johnson, Inc. | 46,500 | $ | 3,022,500 | ||
| Medicis Pharmaceutical Corp., Class A | 5,500 | 174,515 | |||
| OSI Pharmaceuticals, Inc. (b) | 14,100 | 576,267 | |||
| Pfizer, Inc. | 61,200 | 1,687,896 | |||
| Schering-Plough Corp. | 1,800 | 34,308 | |||
| Watson Pharmaceutical, Inc. (b) | 4,400 | 130,064 | |||
| 9,321,086 | |||||
| Electrical Equipment (2.5%) | |||||
| Eaton Corp. | 6,800 | 407,320 | |||
| General Electric Co. | 157,900 | 5,471,235 | |||
| 5,878,555 | |||||
| Electrical Services (2.2%) | |||||
| CMS Energy Corp. (b) | 19,200 | 289,152 | |||
| Consolidated Edison, Inc. | 3,500 | 163,940 | |||
| Constellation Energy Group, Inc. | 9,400 | 542,286 | |||
| Dominion Resources, Inc. | 15,900 | 1,166,901 | |||
| Edison International | 10,300 | 417,665 | |||
| Entergy Corp. | 2,000 | 151,100 | |||
| Florida Power & Light, Inc. | 4,600 | 193,476 | |||
| Northeast Utilities | 4,000 | 83,440 | |||
| PG&E Corp. | 11,400 | 427,956 | |||
| Pinnacle West Capital Corp. | 7,900 | 351,155 | |||
| PPL Corp. | 11,700 | 694,746 | |||
| Scana Corp. | 2,500 | 106,775 | |||
| Xcel Energy, Inc. | 33,700 | 657,824 | |||
| 5,246,416 | |||||
| Financial (5.8%) | |||||
| American Express Co. | 4,400 | 234,212 | |||
| CIT Group, Inc. | 15,300 | 657,441 | |||
| Citigroup, Inc. | 101,200 | 4,678,476 | |||
| Countrywide Credit Industries, Inc. | 26,400 | 1,019,304 | |||
| E*TRADE Financial Corp. (b) | 2,300 | 32,177 | |||
| Fannie Mae | 3,500 | 204,400 | |||
| Freddie Mac | 5,000 | 326,150 | |||
| Goldman Sachs Group, Inc. | 13,400 | 1,367,068 | |||
| MBNA Corp. | 76,100 | 1,990,776 | |||
| Mellon Financial Corp. | 5,300 | 152,057 | |||
| Merrill Lynch & Co., Inc. | 1,100 | 60,511 | |||
| Morgan Stanley | 31,900 | 1,673,793 | |||
| Schwab (Charles) Corp. | 36,700 | 413,976 | |||
| Washington Mutual, Inc. | 14,800 | 602,212 | |||
| 13,412,553 | |||||
Shares or Principal Amount | Value | ||||
| COMMON STOCKS (continued) | |||||
| Financial & Banks (4.1%) | |||||
| Bank of America Corp. | 51,900 | $ | 2,367,159 | ||
| Bank of New York Co., Inc. | 2,800 | 80,584 | |||
| BB&T Corp. | 3,000 | 119,910 | |||
| Capital One Financial Corp. | 2,200 | 176,022 | |||
| Comerica, Inc. | 1,300 | 75,140 | |||
| Hudson City Bancorp, Inc. | 21,200 | 241,892 | |||
| KeyCorp | 100 | 3,315 | |||
| Marshall & Ilsley Corp. | 4,000 | 177,800 | |||
| North Fork Bancorp, Inc. | 22,800 | 640,452 | |||
| PNC Financial Services Group | 1,200 | 65,352 | |||
| State Street Corp. | 33,300 | 1,606,725 | |||
| TCF Financial Corp. | 200 | 5,176 | |||
| U.S. Bancorp | 66,700 | 1,947,640 | |||
| Wells Fargo Co. | 28,800 | 1,773,504 | |||
| Zions Bancorp | 2,700 | 198,531 | |||
| 9,479,202 | |||||
| Food & Beverage (2.0%) | |||||
| Anheuser-Busch Cos., Inc. | 6,000 | 274,500 | |||
| Coca-Cola Co. (The) | 56,600 | 2,363,050 | |||
| Coca-Cola Enterprises, Inc. | 9,200 | 202,492 | |||
| PepsiCo, Inc. | 19,500 | 1,051,635 | |||
| SYSCO Corp. | 21,900 | 792,561 | |||
| 4,684,238 | |||||
| Healthcare (3.9%) | |||||
| Bausch & Lomb, Inc. | 7,700 | 639,100 | |||
| Biomet, Inc. | 8,600 | 297,904 | |||
| Boston Scientific Corp. (b) | 45,700 | 1,233,900 | |||
| Gilead Sciences, Inc. (b) | 10,700 | 470,693 | |||
| Guidant Corp. | 10,700 | 720,110 | |||
| HCA-The Healthcare Co. | 10,100 | 572,367 | |||
| McKesson Corp. | 7,300 | 326,967 | |||
| Medco Health Solutions, Inc. (b) | 4,800 | 256,128 | |||
| Sepracor, Inc. (b) | 16,200 | 972,162 | |||
| WellPoint, Inc. (b) | 25,800 | 1,796,712 | |||
| Wyeth | 23,400 | 1,041,300 | |||
| Zimmer Holdings, Inc. (b) | 10,400 | 792,168 | |||
| 9,119,511 | |||||
| Hotels & Motels (0.4%) | |||||
| Hilton Hotels Corp. | 900 | 21,465 | |||
| Host Marriott Corp. | 10,300 | 180,250 | |||
| International Game Technology | 10,200 | 287,130 | |||
| Marriott International, Inc., Class A | 6,100 | 416,142 | |||
7
Table of Contents
GARTMORE VARIABLE INSURANCE TRUST
J.P. MORGAN GVIT BALANCED FUND
Statement of Investments — June 30, 2005 (Unaudited) (continued)
Shares or Principal Amount | Value | ||||
| COMMON STOCKS (continued) | |||||
| Hotels & Motels (continued) | |||||
| Starwood Hotels & Resorts Worldwide, Inc. | 200 | $ | 11,714 | ||
| 916,701 | |||||
| Insurance (3.2%) | |||||
| Aetna, Inc. | 13,700 | 1,134,634 | |||
| AFLAC, Inc. | 18,700 | 809,336 | |||
| AMBAC Financial Group, Inc. | 15,800 | 1,102,208 | |||
| American International Group, Inc. | 7,500 | 435,750 | |||
| Assurant, Inc. | 8,900 | 321,290 | |||
| CIGNA Corp. | 600 | 64,218 | |||
| Genworth Financial, Inc., Class A | 16,900 | 510,887 | |||
| Hartford Financial Services Group, Inc. | 18,500 | 1,383,430 | |||
| MBIA, Inc. | 8,600 | 510,066 | |||
| MetLife, Inc. | 17,300 | 777,462 | |||
| Protective Life Corp. | 900 | 37,998 | |||
| St. Paul Travelers Cos., Inc. | 200 | 7,906 | |||
| W.R. Berkley Corp. | 13,100 | 467,408 | |||
| 7,562,593 | |||||
| Leisure & Amusements (0.0%) | |||||
| MGM MIRAGE (b) | 400 | 15,832 | |||
| Walt Disney Co. (The) | 2,500 | 62,950 | |||
| 78,782 | |||||
| Leisure Products (0.4%) | |||||
| Carnival Corp. | 17,100 | 932,805 | |||
| Hasbro, Inc. | 100 | 2,079 | |||
| Mattel, Inc. | 2,500 | 45,750 | |||
| 980,634 | |||||
| Media (0.5%) | |||||
| News Corp. | 79,200 | 1,281,456 | |||
| Metals & Mining (0.4%) | |||||
| Alcoa, Inc. | 27,400 | 715,962 | |||
| United States Steel Corp. | 4,700 | 161,539 | |||
| 877,501 | |||||
| Motorcycle Manufacturers (0.0%) | |||||
| Harley-Davidson, Inc. | 1,500 | 74,400 | |||
| Office Equipment & Services (0.8%) | |||||
| 3M Co. | 25,600 | 1,850,880 | |||
Shares or Principal Amount | Value | ||||
| COMMON STOCKS (continued) | |||||
| Oil & Gas (5.5%) | |||||
| Anadarko Petroleum Corp. | 3,400 | $ | 279,310 | ||
| Apache Corp. | 10,100 | 652,460 | |||
| Baker Hughes, Inc. | 13,200 | 675,312 | |||
| ChevronTexaco Corp. | 20,500 | 1,146,360 | |||
| ConocoPhillips | 36,500 | 2,098,385 | |||
| Devon Energy Corp. | 6,900 | 349,692 | |||
| Dynegy, Inc. (b) | 13,000 | 63,180 | |||
| EOG Resources, Inc. | 7,200 | 408,960 | |||
| Exxon Mobil Corp. | 80,400 | 4,620,588 | |||
| Kerr-Mcgee Corp. | 300 | 22,893 | |||
| Occidental Petroleums Corp. | 12,000 | 923,160 | |||
| Pride International, Inc. (b) | 7,800 | 200,460 | |||
| Rowan Cos., Inc. | 8,700 | 258,477 | |||
| Unocal Corp. | 7,700 | 500,885 | |||
| Valero Energy Corp. | 4,400 | 348,084 | |||
| 12,548,206 | |||||
| Paper & Forest Products (0.0%) | |||||
| International Paper Co. | 3,100 | 93,651 | |||
| Printing & Publishing (0.6%) | |||||
| Gannett Co., Inc. | 19,700 | 1,401,261 | |||
| Railroads (0.4%) | |||||
| CSX Corp. | 16,300 | 695,358 | |||
| Norfolk Southern Corp. | 8,800 | 272,448 | |||
| 967,806 | |||||
| Real Estate (0.3%) | |||||
| DUKE Realty Corp. | 2,000 | 63,320 | |||
| Kimco Realty Corp. | 1,600 | 94,256 | |||
| Mack-Cali Realty Corp. | 3,400 | 154,020 | |||
| ProLogis | 7,600 | 305,824 | |||
| 617,420 | |||||
| Restaurants (0.2%) | |||||
| McDonald’s Corp. | 20,400 | 566,100 | |||
| Retail (3.9%) | |||||
| Bed, Bath & Beyond, Inc. (b) | 3,200 | 133,696 | |||
| CVS Corp. | 12,000 | 348,840 | |||
| Dollar General Corp. | 5,000 | 101,800 | |||
| Family Dollar Stores, Inc. | 2,100 | 54,810 | |||
| Federated Department Stores, Inc. | 5,800 | 425,024 | |||
| Foot Locker, Inc. | 3,000 | 81,660 | |||
| Home Depot, Inc. | 47,600 | 1,851,640 | |||
| Jones Apparel Group, Inc. | 8,600 | 266,944 | |||
| Kohl’s Corp. (b) | 21,100 | 1,179,701 | |||
8
Table of Contents
GARTMORE VARIABLE INSURANCE TRUST
J.P. MORGAN GVIT BALANCED FUND
Statement of Investments — June 30, 2005 (Unaudited) (continued)
Shares or Principal Amount | Value | ||||
| COMMON STOCKS (continued) | |||||
| Retail (continued) | |||||
| Lowe’s Cos., Inc. | 19,400 | $ | 1,129,468 | ||
| Nordstrom, Inc. | 1,600 | 108,752 | |||
| Ross Stores, Inc. | 800 | 23,128 | |||
| Staples, Inc. | 27,600 | 588,432 | |||
| Target Corp. | 17,700 | 963,057 | |||
| Wal-Mart Stores, Inc. | 36,000 | 1,735,200 | |||
| Yum! Brands, Inc. | 2,200 | 114,576 | |||
| 9,106,728 | |||||
| Semiconductors (1.8%) | |||||
| Altera Corp. (b) | 20,500 | 406,310 | |||
| Analog Devices, Inc. | 29,700 | 1,108,107 | |||
| Broadcom Corp., Class A (b) | 8,000 | 284,080 | |||
| Intel Corp. | 43,600 | 1,136,216 | |||
| Intersil Holding Corp., Class A | 5,200 | 97,604 | |||
| Linear Technology Corp. | 7,900 | 289,851 | |||
| Maxim Integrated Products, Inc. | 4,700 | 179,587 | |||
| Microchip Technology, Inc. | 7,300 | 216,226 | |||
| Xilinx, Inc. | 19,100 | 487,050 | |||
| 4,205,031 | |||||
| Steel (0.0%) | |||||
| Nucor Corp. | 1,400 | 63,868 | |||
| Telecommunications (2.1%) | |||||
| American Tower Corp. (b) | 3,300 | 69,366 | |||
| AT&T Corp. | 5,700 | 108,528 | |||
| EchoStar Communications Corp., Class A | 10,500 | 316,575 | |||
| MCI, Inc. | 12,900 | 331,659 | |||
| Nextel Communications, Inc., Class A (b) | 15,300 | 494,343 | |||
| SBC Communications, Inc. | 44,100 | 1,047,375 | |||
| Sprint Corp. | 29,800 | 747,682 | |||
| Verizon Communications, Inc. | 55,200 | 1,907,160 | |||
| 5,022,688 | |||||
| Textiles (0.2%) | |||||
| Mohawk Industries, Inc. (b) | 5,000 | 412,500 | |||
| Tobacco (1.1%) | |||||
| Altria Group, Inc. | 39,300 | 2,541,138 | |||
| Transportation Services (0.4%) | |||||
| United Parcel Service, Inc., Class B | 12,000 | 829,920 | |||
| Total Common Stocks | 146,431,935 | ||||
Shares or Principal Amount | Value | |||||
| COMMERCIAL PAPER (13.1%) | ||||||
| Financial Services (13.1%) | ||||||
| Blue Ridge Asset Funding Corp., 3.20%, 07/19/05 | $ | 1,250,000 | $ | 1,247,900 | ||
| BMW US Capital Corp., 3.21%, 07/18/05 | 1,000,000 | 998,484 | ||||
| Clipper Receivables Corp., 3.19%, 07/18/05 | 1,250,000 | 1,248,025 | ||||
| Danske Corp., 3.27%, 08/01/05 | 1,500,000 | 1,496,321 | ||||
| DNB Nor Bank ASA, 3.16%, 07/18/05 | 1,750,000 | 1,747,389 | ||||
| Edison Asset Securitization LLC, 3.20%, 08/12/05 | 1,750,000 | 1,743,193 | ||||
| Eureka Securitization, Inc. (d), 3.09%, 07/14/05 | 1,500,000 | 1,498,200 | ||||
| Federal National Mortgage Association, 2.97%, 11/04/05 | 1,825,000 | 1,803,155 | ||||
| Federal National Mortgage Association, 2.95%, 12/09/05 | 1,520,000 | 1,496,276 | ||||
| Federal National Mortgage Association, 3.00%, 12/12/05 | 1,265,000 | 1,244,444 | ||||
| Federal National Mortgage Association, 3.01%, 12/19/05 | 4,695,000 | 4,618,705 | ||||
| Fortis Funding LLC, 3.22%, 07/22/05 | 1,000,000 | 998,090 | ||||
| ING US Funding LLC, 3.16%, 07/15/05 | 1,500,000 | 1,498,095 | ||||
| International Lease Finance Corp., 3.11%, 07/18/05 | 1,500,000 | 1,497,797 | ||||
| Ixis Corp., 3.19%, 07/22/05 | 1,000,000 | 998,090 | ||||
| Kitty Hawk Funding Corp., 3.28%, 07/25/05 | 1,250,000 | 1,247,039 | ||||
| National Australia Funding (DE), Inc., 5.49%, 07/28/05 | 1,500,000 | 1,496,325 | ||||
| Rabobank USA Financial Corp., 3.20%, 07/25/05 | 1,000,000 | 997,060 | ||||
9
Table of Contents
GARTMORE VARIABLE INSURANCE TRUST
J.P. MORGAN GVIT BALANCED FUND
Statement of Investments — June 30, 2005 (Unaudited) (continued)
Shares or Principal Amount | Value | |||||
| COMMERCIAL PAPER (continued) | ||||||
| Financial Services (continued) | ||||||
| UBS Finance (DE) LLC, 3.16%, 07/18/05 | $ | 1,250,000 | $ | 1,248,075 | ||
| Windmill Funding Corp., 5.75%, 07/21/05 | 1,500,000 | 1,497,358 | ||||
| Total Commercial Papers | 30,620,021 | |||||
| CASH EQUIVALENTS (3.2%) | ||||||
| Investments in repurchase agreements (Collateralized by AA Corporate Bonds, in a joint trading account at 3.34%, dated 06/30/05, due 07/01/05, repurchase price $7,505,002) | 7,504,306 | 7,504,306 | ||||
| Total Cash Equivalents | 7,504,306 | |||||
| CORPORATE BONDS (9.9%) | ||||||
| Aerospace & Defense (0.1%) | ||||||
| General Dynamics Corp., 2.13%, 05/15/06 | 165,000 | 162,542 | ||||
| Auto Related (0.6%) | ||||||
| Carmax Auto Owner Trust, 4.13%, 05/15/09 | 885,000 | 886,891 | ||||
| Ford Motor Credit Co., 7.38%, 10/28/09 | 200,000 | 195,437 | ||||
| Ford Motor Credit Co., 7.88%, 06/15/10 | 355,000 | 350,812 | ||||
| Ford Motor Credit Co., 7.00%, 10/01/13 | 50,000 | 47,974 | ||||
| 1,481,114 | ||||||
| Automotive Parts and Supplies (0.0%) | ||||||
| Breed Technologies, Inc. (e) (f) (g), 0.00%, 04/15/08 | 125,000 | 0 | ||||
| Banks (1.4%) | ||||||
| BNP Paribas (d) (h), 5.19%, 06/29/15 | 240,000 | 242,644 | ||||
| Chuo Mitsui Trust & Banking (d), 5.51%, 04/15/15 | 195,000 | 191,573 | ||||
| HBOS Treasury Services PLC (d), 3.60%, 08/15/07 | 225,000 | 222,926 | ||||
Shares or Principal Amount | Value | |||||
| CORPORATE BONDS (continued) | ||||||
| Banks (continued) | ||||||
| HSBC Capital Funding LP, 4.61%, 06/27/13 (d) (h) | $ | 420,000 | $ | 409,868 | ||
| Industrial Bank of Korea (d), 4.00%, 05/19/14 | 180,000 | 174,949 | ||||
| Korea First Bank, 7.27%, 03/03/34 | 165,000 | 185,410 | ||||
| National Capital Trust II (d) (h), 5.49%, 03/23/15 | 335,000 | 344,960 | ||||
| RBS Capital Trust III (h), 5.51%, 09/30/14 | 350,000 | 363,514 | ||||
| Shinhan Bank, 5.66%, 03/02/35 | 180,000 | 180,889 | ||||
| Suntrust Bank, 2.50%, 11/01/06 | 275,000 | 268,688 | ||||
| U.S. Bank NA Minnesota, 6.50%, 02/01/08 | 200,000 | 210,977 | ||||
| United Overseas Bank Ltd. (d), 5.38%, 09/03/19 | 275,000 | 283,218 | ||||
| Woori Bank (d), 5.75%, 03/13/14 | 160,000 | 164,133 | ||||
| 3,243,749 | ||||||
| Broadcast Media & Cable Television (0.7%) | ||||||
| AOL Time Warner, Inc., 7.63%, 04/15/31 | 115,000 | 143,622 | ||||
| Cablevision System Corp. (d), 8.00%, 04/15/12 | 25,000 | 24,500 | ||||
| Charter Communications LLC (d), 8.00%, 04/30/12 | 25,000 | 24,875 | ||||
| Clear Channel Communication, 5.50%, 09/15/14 | 245,000 | 232,372 | ||||
| Comcast Corp., 6.50%, 01/15/15 | 225,000 | 250,793 | ||||
| Comcast Corp., 4.95%, 06/16/16 | 240,000 | 238,911 | ||||
| Echostar DBS Corp., 6.38%, 10/01/11 | 35,000 | 34,694 | ||||
| News America, Inc., 8.88%, 04/26/23 | 100,000 | 130,666 | ||||
| News America, Inc., 6.20%, 12/15/34 | 145,000 | 152,176 | ||||
| Time Warner Cos., Inc., 9.15%, 02/01/23 | 75,000 | 102,972 | ||||
| Time Warner Entertainment, 8.38%, 03/15/23 | 185,000 | 236,539 | ||||
| 1,572,120 | ||||||
10
Table of Contents
GARTMORE VARIABLE INSURANCE TRUST
J.P. MORGAN GVIT BALANCED FUND
Statement of Investments — June 30, 2005 (Unaudited) (continued)
Shares or Principal Amount | Value | |||||
| CORPORATE BONDS (continued) | ||||||
| Building—Residential & Commercial (0.2%) | ||||||
| D.R. Horton, Inc., 8.50%, 04/15/12 | $ | 30,000 | $ | 32,701 | ||
| KB Home, 5.75%, 02/01/14 | 45,000 | 44,599 | ||||
| Masco Corp., 4.80%, 06/15/15 | 265,000 | 263,334 | ||||
| Standard Pacific Corp., 6.88%, 05/15/11 | 45,000 | 45,563 | ||||
| 386,197 | ||||||
| Casino Hotels (0.0%) | ||||||
| MGM Mirage, Inc., 5.88%, 02/27/14 | 35,000 | 33,994 | ||||
| Chemicals & Diversified (0.1%) | ||||||
| Huntsman International LLC, 9.88%, 03/01/09 | 35,000 | 37,450 | ||||
| ICI Wilmington, 5.63%, 12/01/13 | 175,000 | 181,569 | ||||
| Polyone Corp., 10.63%, 05/15/10 | 65,000 | 68,738 | ||||
| Service Corp International, 7.70%, 04/15/09 | 25,000 | 26,750 | ||||
| 314,507 | ||||||
| Commercial Services (0.0%) | ||||||
| Iron Mountain, Inc., 6.63%, 01/01/16 | 35,000 | 32,375 | ||||
| Consumer Products—Miscellaneous (0.0%) | ||||||
| Rayovac Corp. (d), 7.38%, 02/01/15 | 10,000 | 9,675 | ||||
| Containers (0.0%) | ||||||
| Crown Euro Holdings SA, 9.50%, 03/01/11 | 40,000 | 44,200 | ||||
| Owens-Brockway Glass Container, 7.75%, 05/15/11 | 30,000 | 31,875 | ||||
| Owens-Brockway Glass Container, 8.25%, 05/15/13 | 30,000 | 32,588 | ||||
| 108,663 | ||||||
| Diversified Manufacturing Operations (0.1%) | ||||||
| Hutchinson Whamp International Ltd. (d), 6.25%, 01/24/14 | 130,000 | 139,748 | ||||
Shares or Principal Amount | Value | |||||
| CORPORATE BONDS (continued) | ||||||
| Diversified Manufacturing Operations (continued) | ||||||
| Hutchinson Whamp International Ltd. (d), 7.45%, 11/24/33 | $ | 145,000 | $ | 170,605 | ||
| 310,353 | ||||||
| Electrical Services (0.8%) | ||||||
| Alabama Power Co., 2.80%, 12/01/06 | 130,000 | 127,829 | ||||
| Dominion Resources, Inc., 8.13%, 06/15/10 | 50,000 | 57,610 | ||||
| Dominion Resources, Inc., 5.00%, 03/15/13 | 195,000 | 196,422 | ||||
| Dominion Resources, Inc., 7.20%, 09/15/14 | 95,000 | 110,329 | ||||
| Exelon Corp., 4.90%, 06/15/15 | 260,000 | 260,926 | ||||
| FPL Group Capital, Inc., 7.63%, 09/15/06 | 215,000 | 223,797 | ||||
| Pacificorp, 4.30%, 09/15/08 | 125,000 | 125,482 | ||||
| Progress Energy, Inc., 6.85%, 04/15/12 | 315,000 | 349,942 | ||||
| Progress Energy, Inc., 7.00%, 10/30/31 | 100,000 | 115,500 | ||||
| Scottish Power PLC, 5.38%, 03/15/15 | 290,000 | 297,264 | ||||
| 1,865,101 | ||||||
| Enterprise Software & Services (0.2%) | ||||||
| Computer Associates, Inc. (d), 5.63%, 12/01/14 | 385,000 | 390,449 | ||||
| Environmental (0.0%) | ||||||
| Allied Waste North America, Inc., 6.13%, 02/15/14 | 60,000 | 55,725 | ||||
| Financial Products & Services (1.0%) | ||||||
| American General Finance Corp., 3.00%, 11/15/06 | 315,000 | 310,025 | ||||
| American General Finance Corp., 4.50%, 11/15/07 | 330,000 | 330,697 | ||||
| Arch Western Finance, 6.75%, 07/01/13 | 55,000 | 56,788 | ||||
| Associates Corporation of North America, 6.95%, 11/01/18 | 100,000 | 120,492 | ||||
11
Table of Contents
GARTMORE VARIABLE INSURANCE TRUST
J.P. MORGAN GVIT BALANCED FUND
Statement of Investments — June 30, 2005 (Unaudited) (continued)
Shares or Principal Amount | Value | |||||
| CORPORATE BONDS (continued) | ||||||
| Financial Products & Services (continued) | ||||||
| Capital One Financial, 8.75%, 02/01/07 | $ | 375,000 | $ | 400,393 | ||
| Capital One Financial, 5.25%, 02/21/17 | 40,000 | 39,649 | ||||
| Goldman Sachs Capital I, 6.35%, 02/15/34 | 295,000 | 319,635 | ||||
| HSBC Finance Corp., 5.00%, 06/30/15 | 120,000 | 120,937 | ||||
| Istar Financial, Inc., 6.00%, 12/15/10 | 115,000 | 119,617 | ||||
| Mizuho JGB Investment (d) (h), 9.87%, 06/30/08 | 190,000 | 215,247 | ||||
| Mizuho Preferred Capital (d) (h), 8.79%, 06/30/08 | 310,000 | 342,022 | ||||
| UGS Corp. (d), 10.00%, 06/01/12 | 15,000 | 16,650 | ||||
| 2,392,152 | ||||||
| Funeral Services & Related Items (0.0%) | ||||||
| Service Corp. International, 6.75%, 04/01/16 | 25,000 | 25,563 | ||||
| Healthcare (0.0%) | ||||||
| HCA, Inc., 6.38%, 01/15/15 | 75,000 | 77,821 | ||||
| Home Furnishings (0.0%) | ||||||
| Sealy Mattress Co., 8.25%, 06/15/14 | 25,000 | 25,250 | ||||
| Hotels & Motels (0.0%) | ||||||
| Starwood Hotels & Resorts, 7.38%, 11/15/15 | 35,000 | 38,938 | ||||
| Vail Resorts, Inc., 6.75%, 02/15/14 | 45,000 | 45,675 | ||||
| 84,613 | ||||||
| Insurance (0.5%) | ||||||
| Arch Capital Group Ltd., 7.35%, 05/01/34 | 105,000 | 118,504 | ||||
| Aspen Insurance Holdings Ltd. (d), 6.00%, 08/15/14 | 230,000 | 238,074 | ||||
| Liberty Mutual Group (d), 7.00%, 03/15/34 | 110,000 | 115,764 | ||||
| Liberty Mutual Group (d), 6.50%, 03/15/35 | 95,000 | 94,126 | ||||
Shares or Principal Amount | Value | |||||
| CORPORATE BONDS (continued) | ||||||
| Insurance (continued) | ||||||
| North Front Pass-Through Trust, 5.81%, 12/15/24 | $ | 250,000 | $ | 257,607 | ||
| Odyssey Re Holdings, 7.65%, 11/01/13 | 85,000 | 91,760 | ||||
| Odyssey Re Holdings, 6.88%, 06/01/15 | 50,000 | 51,311 | ||||
| UnitedHealth Group, Inc., 3.30%, 01/30/08 | 175,000 | 170,946 | ||||
| 1,138,092 | ||||||
| Metals (0.1%) | ||||||
| Noranda, Inc., 6.00%, 10/15/15 | 160,000 | 167,943 | ||||
| Noranda, Inc., 6.20%, 06/15/35 | 45,000 | 44,641 | ||||
| 212,584 | ||||||
| Mining (0.1%) | ||||||
| Newmont Mining Corp., 5.88%, 04/01/35 | 120,000 | 122,281 | ||||
| Motor Vehicles (0.1%) | ||||||
| Daimler Chrysler NA Holding Corp., 4.75%, 01/15/08 | 125,000 | 125,483 | ||||
| TRW Automotive, Inc., 9.38%, 02/15/13 | 41,000 | 45,408 | ||||
| 170,891 | ||||||
| Office Equipment & Services (0.0%) | ||||||
| Xerox Corp., 7.63%, 06/15/13 | 20,000 | 21,525 | ||||
| Oil & Gas (0.4%) | ||||||
| BP Capital Markets PLC, 2.75%, 12/29/06 | 205,000 | 201,722 | ||||
| Enterprise Production Operations (d), 6.65%, 10/15/34 | 125,000 | 137,234 | ||||
| Kinder Morgan Energy Partners, 7.40%, 03/15/31 | 135,000 | 164,485 | ||||
| Kinder Morgan Energy Partners, 7.75%, 03/15/32 | 65,000 | 82,516 | ||||
| Kinder Morgan Energy Partners, 7.30%, 08/15/33 | 35,000 | 42,458 | ||||
| Nexen, Inc., 5.88%, 03/10/35 | 230,000 | 233,751 | ||||
12
Table of Contents
GARTMORE VARIABLE INSURANCE TRUST
J.P. MORGAN GVIT BALANCED FUND
Statement of Investments — June 30, 2005 (Unaudited) (continued)
Shares or Principal Amount | Value | |||||
| CORPORATE BONDS (continued) | ||||||
| Oil & Gas (continued) | ||||||
| Transocean, Inc., 6.63%, 04/15/11 | $ | 40,000 | $ | 44,927 | ||
| Valero Energy Corp., 7.50%, 04/15/32 | 50,000 | 61,716 | ||||
| 968,809 | ||||||
| Paper & Forest Products (0.0%) | ||||||
| Georgia-Pacific Corp., 7.70%, 06/15/15 | 75,000 | 85,500 | ||||
| Real Estate (0.2%) | ||||||
| Istar Financial, Inc., 5.15%, 03/01/12 | 285,000 | 281,677 | ||||
| Societe Generale Estate LLC (d) (h), 7.64%, 09/30/07 | 90,000 | 96,308 | ||||
| 377,985 | ||||||
| Real Estate Investment Trusts (0.2%) | ||||||
| Developers Divers Realty, 5.50%, 05/01/15 | 275,000 | 280,795 | ||||
| Simon Property Group LP (d), 5.10%, 06/15/15 | 270,000 | 269,856 | ||||
| 550,651 | ||||||
| Retail (0.2%) | ||||||
| Delhaize America, Inc., 9.00%, 04/15/31 | 220,000 | 274,666 | ||||
| Safeway, Inc., 4.13%, 11/01/08 | 240,000 | 236,545 | ||||
| 511,211 | ||||||
| Semiconductors (0.0%) | ||||||
| Celestica, Inc., 7.88%, 07/01/11 | 25,000 | 25,625 | ||||
| Freescale Semiconductor, 7.13%, 07/15/14 | 15,000 | 16,125 | ||||
| 41,750 | ||||||
| Sovereign (1.7%) | ||||||
| Fannie Mae, 6.41%, 03/08/06 | 1,000,000 | 1,017,954 | ||||
| Federal Republic of Brazil, 10.50%, 07/14/14 | 70,000 | 82,775 | ||||
| Federal Republic of Brazil, 12.25%, 03/06/30 | 46,000 | 61,640 | ||||
Shares or Principal Amount | Value | |||||
| CORPORATE BONDS (continued) | ||||||
| Sovereign (continued) | ||||||
| Federal Republic of Brazil, 11.00%, 08/17/40 | $ | 115,000 | $ | 138,345 | ||
| Republic of Argentina, 8.28%, 12/31/33 | 234,092 | 215,364 | ||||
| Republic of Colombia, 9.75%, 04/09/11 | 230,321 | 263,026 | ||||
| Republic of Peru, 8.75%, 11/21/33 | 160,000 | 180,400 | ||||
| Republic of Venezuela, 10.75%, 09/19/13 | 75,000 | 87,788 | ||||
| Republic of Venezuela, 9.25%, 09/15/27 | 360,000 | 377,459 | ||||
| Russian Federation, 12.75%, 06/24/28 | 190,000 | 343,634 | ||||
| Russian Federation, 8.75%, 07/24/05 | 205,000 | 205,451 | ||||
| Ukraine Government (d), 6.88%, 03/04/11 | 267,000 | 281,018 | ||||
| Ukraine Government, 7.65%, 06/11/13 | 65,000 | 71,663 | ||||
| United Mexican States, 11.50%, 05/15/26 | 135,000 | 216,675 | ||||
| United Mexican States, 8.30%, 08/15/31 | 110,000 | 136,950 | ||||
| 3,680,142 | ||||||
| Special Purpose Entity (0.5%) | ||||||
| Aries Vermogensverwaltng (d), 9.60%, 10/25/14 | 250,000 | 324,063 | ||||
| Fresenius Medical Capital Trust II, 7.88%, 02/01/08 | 45,000 | 47,025 | ||||
| Mantis Reef Ltd. II, 4.80%, 11/03/09 | 200,000 | 200,351 | ||||
| Pricoa Global Funding I (d), 3.90%, 12/15/08 | 400,000 | 395,582 | ||||
| UFJ Finance Aruba AEC, 6.75%, 07/15/13 | 115,000 | 128,248 | ||||
| 1,095,269 | ||||||
| Telecommunications (0.7%) | ||||||
| America Movil SA de CV, 6.38%, 03/01/35 | 145,000 | 141,498 | ||||
| AT&T Wireless Services, Inc., 7.50%, 05/01/07 | 150,000 | 158,882 | ||||
13
Table of Contents
GARTMORE VARIABLE INSURANCE TRUST
J.P. MORGAN GVIT BALANCED FUND
Statement of Investments — June 30, 2005 (Unaudited) (continued)
Shares or Principal Amount | Value | |||||
| CORPORATE BONDS (continued) | ||||||
| Telecommunications (continued) | ||||||
| AT&T Wireless Services, Inc., 8.13%, 05/01/12 | $ | 15,000 | $ | 17,972 | ||
| Bellsouth Corp., 6.00%, 11/15/34 | 90,000 | 95,705 | ||||
| Deutsche Telekom, 5.25%, 07/22/13 | 175,000 | 181,690 | ||||
| Deutsche Telekom, 8.75%, 06/15/30 | 45,000 | 60,929 | ||||
| France Telecom, 8.75%, 03/01/31 | 115,000 | 160,334 | ||||
| Motorola, Inc., 7.50%, 05/15/25 | 165,000 | 201,839 | ||||
| Nextel Communications, 7.38%, 08/01/15 | 35,000 | 37,800 | ||||
| Qwest Corp. (d), 9.13%, 03/15/12 | 35,000 | 38,063 | ||||
| Rogers Wireless, Inc., 6.38%, 03/01/14 | 130,000 | 132,275 | ||||
| Sprint Capital Corp., 6.90%, 05/01/19 | 205,000 | 234,783 | ||||
| Sprint Capital Corp., 8.75%, 03/15/32 | 105,000 | 146,067 | ||||
| Tele-Communications, Inc., 7.88%, 08/01/13 | 30,000 | 35,708 | ||||
| 1,643,545 | ||||||
| Total Corporate Bonds | 23,192,198 | |||||
| MORTGAGE-BACKED SECURITIES (25.1%) | ||||||
| Federal Home Loan Mortgage Corporation (4.9%) | ||||||
| 5.50%, 01/15/23 | 494,190 | 502,809 | ||||
| 5.50%, 12/25/24 | 343,200 | 349,282 | ||||
| 5.00%, 11/15/28 | 700,000 | 713,165 | ||||
| 6.75%, 03/15/31 | 870,000 | 1,151,824 | ||||
| 6.25%, 07/15/32 | 175,000 | 219,732 | ||||
| 6.00%, 02/01/35 | 523,127 | 536,738 | ||||
| TBA, 5.50%, 07/01/34 | 5,600,000 | 5,676,999 | ||||
| TBA, 6.00%, 08/15/35 | 2,346,000 | 2,403,184 | ||||
| 11,553,733 | ||||||
| Federal National Mortgage Association (11.0%) | ||||||
| 7.25%, 05/15/30 | 635,000 | 881,547 | ||||
| 6.63%, 11/15/30 | 30,000 | 38,931 | ||||
| 6.50%, 02/01/35 | 659,995 | 683,261 | ||||
Shares or Principal Amount | Value | |||||
| MORTGAGE-BACKED SECURITIES (continued) | ||||||
| Federal National Mortgage Association (continued) | ||||||
| 7.00%, 02/01/35 | $ | 205,154 | $ | 216,361 | ||
| TBA, 5.00%, 07/01/18 | 4,000,000 | 4,043,752 | ||||
| TBA, 5.50%, 07/01/33 | 19,650,000 | 19,914,057 | ||||
| 25,777,909 | ||||||
| Financial Services (8.4%) | ||||||
| Americredit Automobile Receivables Trust, Series 03-CF, Class A3, 2.75%, 10/09/07 | 108,126 | 107,813 | ||||
| Americredit Automobile Receivables Trust, Series 03-CF, Class A4, 3.48%, 05/06/10 | 210,000 | 208,733 | ||||
| Americredit Automobile Receivables Trust, Series 04-BM, Class A4, 2.75%, 03/07/11 | 550,000 | 534,893 | ||||
| Americredit Automobile Receivables Trust, Series 04-DF, Class A3, 2.98%, 07/06/09 | 105,000 | 103,291 | ||||
| Bear Stearns Commercial Mortgage Securities, Series 04-PWR6, Class A4, 4.52%, 11/11/41 | 260,000 | 261,041 | ||||
| Bear Stearns Commercial Mortgage Securities, Series 05-PWR7, Class A3, 5.12%, 02/11/41 | 380,000 | 396,036 | ||||
| Bear Stearns Commercial Mortgage Securities, Series 05-T18, Class A4, 4.93%, 02/13/42 | 470,000 | 483,154 | ||||
| Capital Auto Receivables Asset Trust, Series 03-2, Class A, 1.96%, 01/15/09 | 275,000 | 267,731 | ||||
| Capital One Master Trust, Series 01-BA, Class A, 4.60%, 08/17/09 | 420,000 | 423,150 | ||||
14
Table of Contents
GARTMORE VARIABLE INSURANCE TRUST
J.P. MORGAN GVIT BALANCED FUND
Statement of Investments — June 30, 2005 (Unaudited) (continued)
Shares or Principal Amount | Value | ||||
| MORTGAGE-BACKED SECURITIES (continued) | |||||
| Financial Services (continued) | |||||
| Capital One Multi-Asset Execution Trust, Series 03-A4, Class A4, 3.65%, 07/15/11 | 520,000 | $ | 513,999 | ||
| Countrywide Alternative Loan Trust, Series 04-28CB, Class 3A1, 6.00%, 01/25/35 | 1,081,945 | 1,101,893 | |||
| Countrywide Asset-Backed Certificates, Series 03-5, Class MF1, 5.41%, 01/25/34 | 180,000 | 181,817 | |||
| Countrywide Home Loans, Series 04-28R, Class A1, 5.50%, 08/25/33 | 1,350,727 | 1,369,307 | |||
| CS First Boston Mortgage Securities Corp., Series 01-CK1, Class A3, 6.38%, 12/16/35 | 270,000 | 294,381 | |||
| CS First Boston Mortgage Securities Corp., Series 03-29, Class 7A1, 6.50%, 12/25/33 | 210,877 | 213,576 | |||
| CS First Boston Mortgage Securities Corp., Series 03-C4, Class A4, 5.14%, 08/15/36 | 480,000 | 499,378 | |||
| Daimler Chrysler Auto Trust, Series 03-A, Class A4, 2.88%, 10/08/09 | 100,000 | 98,869 | |||
| Greenwich Capital Commercial Funding Corp., Series 04-GG1, Class A3, 4.34%, 06/10/36 | 1,185,000 | 1,188,842 | |||
| Greenwich Capital Commercial Funding Corp., Series 05-GG3, Class A4, 4.80%, 08/10/42 | 535,000 | 544,444 | |||
| Greenwich Capital Commercial Funding Corp., Series 05-GG3, Class AJ, 4.86%, 08/10/42 | 535,000 | 543,138 | |||
| Honda Auto Receivables Owner Trust, Series 04-2, Class A3, 3.30%, 06/16/08 | 925,000 | 918,279 | |||
Shares or Principal Amount | Value | ||||
| MORTGAGE-BACKED SECURITIES (continued) | |||||
| Financial Services (continued) | |||||
| Household Automotive Trust, Series 03-2, Class A4, 3.02%, 12/17/10 | 350,000 | $ | 344,167 | ||
| Household Automotive Trust, Series 04-1, Class A3, 3.30%, 05/18/09 | 670,000 | 664,412 | |||
| Indymac Index Mortgage Loan Trust, Series 04-AR7, Class A1, 2.08%, 09/25/34 | 406,236 | 408,099 | |||
| LB-UBS Commercial Mortgage Trust, Series 04-C2, Class A2, 3.25%, 03/01/29 | 410,000 | 396,683 | |||
| LB-UBS Commercial Mortgage Trust, Series 05-C1, 4.74%, 02/06/30 | 485,000 | 491,085 | |||
| Long Beach Mortgage Loan Trust, Series 03-4, Class AV3, 3.43%, 08/25/33 | 149,878 | 150,054 | |||
| M&I Auto Loan Trust, Series 03-1, Class A4, 2.97%, 04/20/09 | 140,000 | 137,647 | |||
| MBNA Credit Card Master Note Trust, Series 03-A1, Class A1, 3.30%, 07/15/10 | 485,000 | 476,721 | |||
| Morgan Stanley Capital I, Series 04-HQ3, Class A2, 4.05%, 01/13/41 | 390,000 | 386,154 | |||
| Morgan Stanley Capital I, Series 05, Class IQ9, 4.70%, 07/15/56 | 265,000 | 267,939 | |||
| Morgan Stanley Dean Witter Capital I, Series 03-HQ2, Class A2, 4.92%, 03/12/35 | 250,000 | 256,603 | |||
| Nissan Auto Receivables Owner Trust, Series 05-A, Class A4, 3.82%, 07/15/10 | 625,000 | 621,408 | |||
| Onyx Acceptance Auto Trust, Series 03-C, Class A4, 2.66%, 05/17/10 | 200,000 | 196,275 | |||
| Onyx Acceptance Auto Trust, Series 03-D, Class A4, 3.20%, 03/15/10 | 140,000 | 138,559 | |||
15
Table of Contents
GARTMORE VARIABLE INSURANCE TRUST
J.P. MORGAN GVIT BALANCED FUND
Statement of Investments — June 30, 2005 (Unaudited) (continued)
Shares or Principal Amount | Value | ||||
| MORTGAGE-BACKED SECURITIES (continued) | |||||
| Financial Services (continued) | |||||
| Onyx Acceptance Auto Trust, Series 04-C, Class A4, 3.50%, 12/15/11 | 370,000 | $ | 365,730 | ||
| PSE&G Transition Funding LLC, Series 01-1, Class A6, 6.61%, 06/15/15 | 240,000 | 273,657 | |||
| Residential Asset Securities Corp., Series 02-KS4, Class AIIB, 3.34%, 07/25/32 | 56,840 | 56,953 | |||
| Residential Asset Securities Corp., Series 03-KS5, Class AIIB, 3.38%, 07/25/31 | 131,334 | 131,571 | |||
| Residential Asset Securities Corp., Series 03-KS7, Class AI3, 3.37%, 11/25/28 | 225,000 | 223,787 | |||
| SLM Student Loan Trust, Series 03-11, Class A5, 2.99%, 12/15/22 | 460,000 | 451,780 | |||
| Toyota Auto Receivables Owner Trust, Series 03-B, Class A4, 2.79%, 01/15/10 | 500,000 | 492,362 | |||
| Triad Auto Receivables Owner Trust, Series 03-B, Class A4, 3.20%, 12/13/10 | 235,000 | 231,713 | |||
| Volkswagen Auto Lease Trust, Series 04-A, Class A3, 2.84%, 07/20/07 | 450,000 | 445,504 | |||
| Volkswagen Auto Loan Enhanced Trust, Series 03-1, Class A4, 1.93%, 01/20/10 | 665,000 | 647,696 | |||
| Volkswagen Auto Loan Enhanced Trust, Series 03-2, Class A4, 2.94%, 03/22/10 | 275,000 | 270,152 | |||
| Wachovia Asset Securitization, Inc., Series 03-HE2, Class AII1, 3.35%, 07/25/33 | 205,360 | 205,892 | |||
| Wachovia Bank Commercial Mortgage Trust, Series 05, Class C17, 5.08%, 03/15/42 | 550,000 | 571,373 | |||
| WFS Financial Owner Trust, Series 03-4, Class A4, 3.15%, 05/20/11 | 180,000 | 178,097 | |||
| 19,735,838 | |||||
Shares or Principal Amount | Value | |||||
| MORTGAGE-BACKED SECURITIES (continued) | ||||||
| Government National Mortgage Association (0.8%) | ||||||
| TBA, 5.50%, 07/01/34 | 1,800,000 | $ | 1,837,688 | |||
| Total Mortgage-Backed Securities | 58,905,168 | |||||
| U.S. GOVERNMENT LONG-TERM OBLIGATIONS (1.0%) | ||||||
| U.S. Treasury Bonds (0.5%) | ||||||
| 5.38%, 02/15/31 | 675,000 | 796,500 | ||||
| 8.88%, 02/15/19 (c) | 200,000 | 297,320 | ||||
| 1,093,820 | ||||||
| U.S. Treasury Notes (0.5%) | ||||||
| 3.75%, 05/15/08 | 420,000 | 420,919 | ||||
| 3.63%, 06/15/10 | 320,000 | 318,600 | ||||
| 4.25%, 08/15/14 | 95,000 | 97,271 | ||||
| 4.13%, 05/15/15 | 465,000 | 471,794 | ||||
| 1,308,584 | ||||||
| Total U.S. Government Long-Term Obligations | 2,402,404 | |||||
| Total Investments (Cost $252,006,778) (a) — 114.8% | 269,056,032 | |||||
| Liabilities in excess of other assets — (14.8%) | (34,784,221 | ) | ||||
| NET ASSETS — 100.0% | $ | 234,271,811 | ||||
| (a) | See notes to financial statements for unrealized appreciation (depreciation) of securities. |
| (b) | Denotes a non-income producing security. |
| (c) | Pledged as collateral for futures. |
| (d) | Represents a restricted security acquired and eligible for resale under Rule 144A, which limits the resale to certain qualified buyers. |
| (e) | Bond in default. |
| (f) | Fair Valued Security. |
| (g) | Security has been deemed illiquid. The pricing committee has deemed the security to have zero value based upon procedures adopted by the Board of Trustees. |
| (h) | Securities with perpetual maturity. First call date disclosed. |
| TBA | To Be Announced |
16
Table of Contents
GARTMORE VARIABLE INSURANCE TRUST
J.P. MORGAN GVIT BALANCED FUND
Statement of Investments — June 30, 2005 (Unaudited) (continued)
At June 30, 2005 the Fund’s open futures contracts were as follows:
| Number of Contracts | Contracts | Expiration | Market Value Covered by Contracts | Unrealized Appreciation (Depreciation) | |||||||
| Long Contracts: | |||||||||||
25 | Euro Shatz Future | 08/24/05 | $ | 3,236,683 | $ | 4,597 | |||||
6 | Euro Bond Future | 08/24/05 | 897,094 | 1,502 | |||||||
4 | U.S. 2 yr Note Future | 08/26/05 | 830,750 | (564 | ) | ||||||
17 | U.S. Treasury Lond Bond | 08/26/05 | 2,018,750 | 19,940 | |||||||
12 | U.S. Call Treasury Bond | 08/26/05 | 16,313 | 7,693 | |||||||
53 | 90 Day Euro Dollar Future | 03/13/06 | 12,721,325 | 838 | |||||||
| Total Long Contracts | $ | 19,720,915 | $ | 34,006 | |||||||
| Short Contracts: | |||||||||||
85 | U.S. Treasury 5 yr Note Future | 08/26/05 | $ | 9,255,703 | $ | (26,188 | ) | ||||
3 | U.S. Treasury 10 yr Note Future | 08/26/05 | 340,406 | 527 | |||||||
22 | Euro Bobl Future | 09/12/05 | 3,080,000 | (10,736 | ) | ||||||
| Total Short Contracts | $ | 12,676,109 | $ | (36,397 | ) | ||||||
The following is a summary of option activity for the period ended June 30, 2005, by the Funds (amounts in thousands):
Covered Call Options | Shares Subject to Contract | Premiums | |||||
Balance at beginning of period | 59 | $ | 5,838 | ||||
Options written | (114 | ) | (17,265 | ) | |||
Options closed | 292 | 24,694 | |||||
Options expired | (352 | ) | (125 | ) | |||
Options exercised | 0 | 0 | |||||
Options outstanding at end of period | (115 | ) | $ | 13,142 | |||
See notes to financial statements.
17
Table of Contents
GARTMORE VARIABLE INSURANCE TRUST
J.P. MORGAN GVIT BALANCED FUND
Statement of Assets and Liabilities
June 30, 2005 (Unaudited)
Assets: | ||||
Investments, at value (cost $244,502,472) | $ | 261,551,726 | ||
Repurchase agreements, at cost and value | 7,504,306 | |||
Total Investments | 269,056,032 | |||
Interest and dividends receivable | 552,292 | |||
Receivable for investments sold | 26,135,659 | |||
Receivable from adviser | 4,404 | |||
Receivable for variation margin on futures and options contracts | 16,787 | |||
Prepaid expenses and other assets | 5,794 | |||
Total Assets | 295,770,968 | |||
Liabilities: | ||||
Securities sold short, at value | 88,627 | |||
Payable to custodian | 1,652,694 | |||
Payable for investments purchased | 59,557,349 | |||
Payable for variation margin on futures and options contracts | 20,999 | |||
Accrued expenses and other payables: | ||||
Investment advisory fees | 139,775 | |||
Fund administration and transfer agent fees | 11,089 | |||
Administrative servicing fees | 26,143 | |||
Other | 2,481 | |||
Total Liabilities | 61,499,157 | |||
Net Assets | $ | 234,271,811 | ||
Represented by: | ||||
Capital | $ | 233,591,147 | ||
Accumulated net investment income (loss) | 130,698 | |||
Accumulated net realized gain (losses) from investment, futures and foreign currency transactions | (16,496,746 | ) | ||
Net unrealized appreciation (depreciation) on investments, futures and translation of assets and liabilities denominated in foreign currencies | 17,046,712 | |||
Net Assets | $ | 234,271,811 | ||
Net Assets: | ||||
Class I Shares | $ | 184,873,212 | ||
Class IV Shares | 49,398,599 | |||
Total | $ | 234,271,811 | ||
Shares outstanding (unlimited number of shares authorized): | ||||
Class I Shares | 18,699,294 | |||
Class IV Shares | 4,995,514 | |||
Total | 23,694,808 | |||
Net asset value and offering price per share:* | ||||
Class I Shares | $ | 9.89 | ||
Class IV Shares | $ | 9.89 |
| * | Not subject to a front-end sales charge. |
For the Six Months Ended June 30, 2005 (Unaudited)
Investment Income: | ||||
Interest income | $ | 2,120,346 | ||
Dividend income (net of foreign withholding tax of $43) | 1,249,146 | |||
Total Income | 3,369,492 | |||
Expenses: | ||||
Investment advisory fees | 841,218 | |||
Fund administration and transfer agent fees | 92,942 | |||
Administrative servicing fees | 133,335 | |||
Administrative servicing fees | 36,473 | |||
Other** | 40,893 | |||
Total expenses before waived or reimbursed expenses | 1,144,861 | |||
Expenses waived or reimbursed | (18,240 | ) | ||
Total Expenses | 1,126,621 | |||
Net Investment Income (Loss) | 2,242,871 | |||
REALIZED/UNREALIZED GAINS (LOSSES) ON INVESTMENTS: | ||||
Net realized gains (losses) on investment transactions | 4,665,465 | |||
Net realized gains (losses) on futures | (100,754 | ) | ||
Net realized gains (losses) on foreign currency transactions | 1,008 | |||
Net realized gains (losses) on investment, futures, and foreign currency transactions | 4,565,719 | |||
Net change in unrealized appreciation/depreciation on investments, futures and translation of assets and liabilities denominated in foreign currencies | (6,786,689 | ) | ||
Net realized/unrealized gains (losses) on investments, futures, and foreign currencies | (2,220,970 | ) | ||
CHANGE IN NET ASSETS RESULTING FROM OPERATIONS | $ | 21,901 | ||
| ** | Other expenses may include the following fees: audit, custody, insurance, legal, printing, trustee, and out-of-pocket expenses. |
See notes to financial statements.
18
Table of Contents
GARTMORE VARIABLE INSURANCE TRUST
J.P. MORGAN GVIT BALANCED FUND
Statement of Changes in Net Assets
| Six Months Ended June 30, 2005 | Year Ended December 31, 2004 | |||||||
| (Unaudited) | ||||||||
From Investment Activities: | ||||||||
Operations: | ||||||||
Net investment income (loss) | $ | 2,242,871 | $ | 4,591,873 | ||||
Net realized gains (losses) on investment, futures and foreign currency transactions | 4,565,719 | 11,990,499 | ||||||
Net change in unrealized appreciation/depreciation on investments, futures and translation of assets and liabilities denominated in foreign currencies | (6,786,689 | ) | 2,486,354 | |||||
Change in net assets resulting from operations | 21,901 | 19,068,726 | ||||||
Distributions to Class I shareholders from: | ||||||||
Net investment income | (1,657,820 | ) | (3,580,406 | ) | ||||
Distributions to Class IV shareholders from: | ||||||||
Net investment income | (460,242 | ) | (1,007,550 | ) | ||||
Change in net assets from shareholder distributions | (2,118,062 | ) | (4,587,956 | ) | ||||
Change in net assets from capital transactions | (3,924,915 | ) | (7,054,409 | ) | ||||
Change in net assets | (6,021,076 | ) | 7,426,361 | |||||
Net Assets: | ||||||||
Beginning of period | 240,292,887 | 232,866,526 | ||||||
End of period | $ | 234,271,811 | $ | 240,292,887 | ||||
CAPITAL TRANSACTIONS: | ||||||||
Class I Shares | ||||||||
Proceeds from shares issued | $ | 9,350,895 | $ | 19,002,819 | ||||
Dividends reinvested | 1,657,820 | 3,580,406 | ||||||
Cost of shares redeemed | (13,726,902 | ) | (26,796,507 | ) | ||||
| (2,718,187 | ) | (4,213,282 | ) | |||||
Class IV Shares | ||||||||
Proceeds from shares issued | 1,145,589 | 3,240,774 | ||||||
Dividends reinvested | 460,242 | 1,007,550 | ||||||
Cost of shares redeemed | (2,812,559 | ) | (7,089,451 | ) | ||||
| (1,206,728 | ) | (2,841,127 | ) | |||||
Change in net assets from capital transactions | $ | (3,924,915 | ) | $ | (7,054,409 | ) | ||
SHARE TRANSACTIONS: | ||||||||
Class I Shares | ||||||||
Issued | 951,340 | 2,015,476 | ||||||
Reinvested | 169,321 | 372,177 | ||||||
Redeemed | (1,391,598 | ) | (2,816,399 | ) | ||||
| (270,937 | ) | (428,746 | ) | |||||
Class IV Shares | ||||||||
Issued | 116,148 | 341,879 | ||||||
Reinvested | 47,005 | 104,755 | ||||||
Redeemed | (285,610 | ) | (742,838 | ) | ||||
| (122,457 | ) | (296,204 | ) | |||||
See notes to financial statements.
19
Table of Contents
GARTMORE VARIABLE INSURANCE TRUST
FINANCIAL HIGHLIGHTS
Selected Data for Each Share of Capital Outstanding
J.P. Morgan GVIT Balanced Fund
| Investment Activities | Distributions | Ratios/Supplemental Data | ||||||||||||||||||||||||||||||||||||||
| Net Asset Value, Beginning of Period | Net Investment Income (Loss) | Net Realized and Unrealized Gains (Losses) on Investments | Total from Investment Activities | Net Investment Income | Total Distributions | Net Asset Value, End of Period | Total Return | Net Assets at End of Period (000s) | Ratio of Expenses to Average Net Assets | Ratio of Net Investment Income (Loss) to Average Net Assets | Ratio of Expenses (Prior to Reimbursements) to Average Net Assets(a) | Ratio of Net Investment Income (Loss) (Prior to Reimbursements) to Average Net Assets(a) | Portfolio Turnover(b) | |||||||||||||||||||||||||||
Class I Shares | ||||||||||||||||||||||||||||||||||||||||
Year Ended December 31, 2000 | $ | 10.31 | 0.28 | (0.30 | ) | (0.02 | ) | (0.29 | ) | (0.29 | ) | $ | 10.00 | (0.35% | ) | $ | 112,577 | 0.90% | 2.86% | 1.07% | 2.69% | 252.43% | ||||||||||||||||||
Year Ended December 31, 2001(c) | $ | 10.00 | 0.22 | (0.60 | ) | (0.38 | ) | (0.22 | ) | (0.22 | ) | $ | 9.40 | (3.77% | ) | $ | 149,875 | 0.90% | 2.34% | 1.03% | 2.21% | 181.89% | ||||||||||||||||||
Year Ended December 31, 2002 | $ | 9.40 | 0.19 | (1.34 | ) | (1.15 | ) | (0.19 | ) | (0.19 | ) | $ | 8.06 | (12.31% | ) | $ | 147,289 | 0.99% | 2.22% | 1.00% | 2.21% | 297.08% | ||||||||||||||||||
Year Ended December 31, 2003 | $ | 8.06 | 0.15 | 1.32 | 1.47 | (0.15 | ) | (0.15 | ) | $ | 9.38 | 18.41% | $ | 182,056 | 0.98% | 1.80% | (g | ) | (g | ) | 310.16% | |||||||||||||||||||
Year Ended December 31, 2004 | $ | 9.38 | 0.19 | 0.60 | 0.79 | (0.19 | ) | (0.19 | ) | $ | 9.98 | 8.49% | $ | 189,232 | 0.98% | 1.96% | (g | ) | (g | ) | 293.17% | |||||||||||||||||||
Six Months Ended June 30, 2005 (Unaudited) | $ | 9.98 | 0.10 | (0.10 | ) | 0.00 | (0.09 | ) | (0.09 | ) | $ | 9.89 | 0.00% | (e) | $ | 184,873 | 0.98% | (f) | 1.91% | (f) | (g | ) | (g | ) | 162.51% | |||||||||||||||
Class IV Shares | ||||||||||||||||||||||||||||||||||||||||
Period Ended December 31, 2003(d) | $ | 8.23 | 0.11 | 1.16 | 1.27 | (0.12 | ) | (0.12 | ) | $ | 9.38 | 15.47% | (e) | $ | 50,811 | 0.91% | (f) | 1.79% | (f) | 0.96% | (f) | 1.74% | (f) | 310.16% | ||||||||||||||||
Year Ended December 31, 2004 | $ | 9.38 | 0.19 | 0.60 | 0.79 | (0.19 | ) | (0.19 | ) | $ | 9.98 | 8.54% | $ | 51,061 | 0.91% | 2.02% | 0.98% | 1.95% | 293.17% | |||||||||||||||||||||
Six Months Ended June 30, 2005 (Unaudited) | $ | 9.98 | 0.10 | (0.10 | ) | 0.00 | (0.09 | ) | (0.09 | ) | $ | 9.89 | 0.03% | (e) | $ | 49,399 | 0.91% | (f) | 1.98% | (f) | 0.98% | (f) | 1.90% | (f) | 162.51% | |||||||||||||||
| (a) | During the period certain fees were waived and/or reimbursed. If such waivers/reimbursements had not occurred, the ratios would have been as indicated. |
| (b) | Portfolio turnover is calculated on the basis of the Fund as a whole without distinguishing among the classes of shares. |
| (c) | The existing shares of the Fund were designated Class I shares as of May 1, 2001. |
| (d) | For the period from April 28, 2003 (commencement of operations) through December 31, 2003. |
| (e) | Not annualized. |
| (f) | Annualized. |
| (g) | There were no fee reductions during the period. |
See notes to financial statements.
20
Table of Contents
GARTMORE VARIABLE INSURANCE TRUST
NOTES TO FINANCIAL STATEMENTS (Unaudited)
June 30, 2005
1. Organization
Gartmore Variable Insurance Trust (“GVIT” or the “Trust”) is an open-end management investment company, organized under the laws of Delaware by an amended and restated Agreement and Declaration of Trust, dated October 28, 2004, as amended to date. The Trust, originally created under the laws of Massachusetts as a Massachusetts business trust pursuant to a Declaration of Trust dated, as of June 30, 1981, was subsequently amended, redomesticated as a Delaware Statutory Trust after the close of trading on April 29, 2005, and is registered under the Investment Company Act of 1940, as amended (the “1940 Act”). The redomestication is a change in statutory status and does not affect the operations of the Trust. As of June 30, 2005, the Trust had authorized an unlimited number of shares of beneficial interest (“shares”) without par value. The Trust currently offers shares to life insurance company separate accounts to fund the benefits under variable life insurance or annuity policies. To date, only the separate accounts of Nationwide Life Insurance Company and Nationwide Life and Annuity Insurance Company (collectively, “Nationwide”) have purchased shares of the Trust’s series. The Trust operates thirty-one (31) separate series, or mutual funds, each with its own investment objectives and strategies. This report contains the financial statements and financial highlights of the J.P.Morgan GVIT Balanced Fund (the “Fund”).
Under the Trust’s organizational documents, the Trust’s officers and trustees are indemnified against certain liabilities arising out of the performance of their duties to the Trust. In addition, the Trust has entered into Indemnification Agreements with the Trust’s trustees and certain officers covering similar liabilities. In addition, in the normal course of business, the Trust enters into contracts with its vendors and others that provide for general indemnifications. The Trust’s maximum exposure under these arrangements is unknown, as this would involve future claims that may be made against the Trust. Based on experience, however, the Trust expects that risk of loss to be remote.
2. Summary of Significant Accounting Policies
The following is a summary of significant accounting policies followed by the Fund in the preparation of its financial statements. The policies are in conformity with accounting principles generally accepted in the United States of America (“GAAP”). The preparation of financial statements requires management to make estimates and assumptions that affect the reported amounts of assets and liabilities, the disclosure of contingent assets and liabilities at the date of the financial statements and the reported amounts of income and expenses for the period. Actual results could differ from those estimates.
| (a) | Security Valuation |
Securities for which market quotations are readily available are valued at current market value as of “Valuation Time.” Valuation Time is as of the close of regular trading on the New York Stock Exchange (usually 4 p.m. Eastern time). Equity securities are valued at the last quoted sale price or, if there is no sale price, the last quoted bid price provided by an independent pricing service approved by the Trust’s Board of Trustees. Securities traded on NASDAQ are valued at the NASDAQ official closing price. Prices are taken from the primary market or exchange in which each security trades. Most securities listed on a foreign exchange are valued either at fair value (see description below) or the last sale price at the close of the exchange on which the security is principally traded. Foreign securities, currencies, and other assets and liabilities denominated in foreign currencies are translated into U.S. dollars at the exchange rate of said currencies against the U.S. Dollar, as of Valuation Time, as provided by an independent pricing service approved by the Board of Trustees.
Debt (including defaulted issues) and other fixed income securities (other than short-term obligations) are valued at the last quoted bid price and/or by using a combination of daily quotes and matrix evaluations provided by an independent pricing service, the use of which has been approved by the Trust’s Board of Trustees. Short-term debt securities, such as commercial paper and U.S. Treasury Bills having a remaining maturity of 60 days or less at the time of purchase, are considered to be “short-term” and are valued at amortized cost which approximates market value.
Securities for which market quotations are not readily available, or for which an independent pricing service does not provide a value or provides a value that does not represent fair value in the judgment of the Fund’s investment adviser or designee, are valued at fair value under procedures approved by the Trust’s Board of Trustees. The “Fair Value” of these securities is
21
Table of Contents
GARTMORE VARIABLE INSURANCE TRUST
NOTES TO FINANCIAL STATEMENTS (Unaudited) (Continued)
June 30, 2005
determined in good faith by taking into account relevant factors and surrounding circumstances. Methods utilized to obtain a “Fair Value” may include the following non-exclusive list of SEC-acceptable methods: (i) a multiple of earnings; (ii) the discount from market value of a similar, freely traded security; (iii) the yield-to-maturity for debt issues; or (iv) a consolidation of the methods. The Gartmore Fair Value Committee considers a non-exclusive list of factors to arrive at the appropriate method upon determining “Fair Value.” For example, fair value determinations are required for securities whose value is affected by a “significant” event that materially affects the value of a domestic or foreign security which occurs subsequent to the time of the close of the principal market on which such domestic or foreign security trades and before the Valuation Time (i.e., a “subsequent event”). Typically, this will involve events occurring after the close of a foreign market on which a security trades and before the next Valuation Time.
| (b) | Repurchase Agreements |
The Fund may enter into repurchase agreements with an entity which is a member of the Federal Reserve System or which is a “primary dealer” (as designated by the Federal Reserve Bank of New York) in U.S. Government obligations. The repurchase price generally equals the price paid by the Fund plus interest negotiated on the basis of current short-term rates, which may be more or less than the rate on the underlying portfolio securities. The seller under a repurchase agreement is required to maintain the value of the collateral held pursuant to the agreement at a market value equal to or greater than the repurchase price (including accrued interest). Collateral subject to repurchase agreements is held by the Fund’s custodian or another qualified sub-custodian or in the Federal Reserve/Treasury book-entry system. If the counterparty defaults and the fair value of the collateral declines, realization of the collateral by the Fund may be delayed or limited. The Fund may transfer uninvested cash balances into a pooled cash account. These balances are invested in one or more repurchase agreements, which are fully collateralized by AA-rated Corporate Bonds with the counterparties of CS First Boston and Nomura Securities.
| (c) | Futures Contracts |
The Fund may invest in financial futures contracts (“futures contracts”) for the purpose of hedging its existing portfolio securities or securities that the Fund intends to purchase against fluctuations in value caused by changes in prevailing market interest rates or prices. Futures contracts may also be entered into for non-hedging purposes.
Upon entering into a futures contract, the Fund is required to pledge to the broker an amount of cash and/or other assets equal to a certain percentage of the contract amount (initial margin deposit). Subsequent payments, known as “variation margin,” are made each day, depending on the daily fluctuations in the fair value/market value of the underlying assets. A gain or loss equal to the daily variation margin is recognized on a daily basis. Futures contracts are valued daily at their last quoted sale price.
A “sale” of a futures contract means a contractual obligation to deliver the securities or foreign currency called for by the contract at a fixed price at a specified time in the future. A “purchase” of a futures contract means a contractual obligation to acquire the securities or foreign currency at a fixed price at a specified time in the future.
Should market conditions change unexpectedly, the Fund may not achieve the anticipated benefits of the futures contracts and may realize a loss. The use of futures transactions for hedging purposes involves the risk of imperfect correlation in movements in the price of futures contracts, interest rates, and the value of the underlying hedged assets.
| (d) | Written Options Contracts |
The Fund may write options contracts. A written option obligates the Fund to deliver (written call) or to receive (written put) a specified quantity of an underlying asset at the contract amount upon exercise by the holder of the option. The value of the option contract is recorded as a liability and unrealized gain or loss is measured by the difference between the current value and the premium received. Options traded on an exchange are valued at the last quoted sale price, or in the absence of a sale, the bid price provided by an independent pricing service approved by the Board of Trustees. Non-exchange traded options are valued using dealer supplied quotes.
22
Table of Contents
GARTMORE VARIABLE INSURANCE TRUST
NOTES TO FINANCIAL STATEMENTS (Unaudited) (Continued)
June 30, 2005
| (e) | Mortgage Dollar Rolls |
The Fund may enter into mortgage “dollar rolls” in which the Fund sells mortgage-backed securities for delivery in the current month and simultaneously contracts to repurchase substantially similar (same type, coupon, and maturity) securities on a specified future date. Mortgage dollar rolls are referred to as TBA’s on the Statement of Investments of the Fund. During the roll period, the Fund foregoes principal and interest paid on the mortgage-backed securities. The Fund is compensated by fee income or the difference between the current sales price and the lower forward price for the future purchase. Mortgage dollar rolls are valued at the last quoted bid price and/or by using a combination of daily quotes and matrix evaluations provided by an independent pricing service, the use of which has been approved by the Board of Trustees.
| (f) | Security Transactions and Investment Income |
Security transactions are accounted for on the date the security is purchased or sold (“trade date”). Securities gains and losses are calculated on the identified cost basis. Interest income is recognized on the accrual basis and includes, where applicable, the amortization or accretion of premium or discount. Dividend income is recorded on the ex-dividend date.
| (g) | Distributions to Shareholders |
The Fund’s dividends from net investment income, if any, are declared and paid quarterly. The Fund’s distributable net realized capital gains, if any, are declared and distributed at least annually.
Dividends and distributions to shareholders are determined in accordance with federal income tax regulations, which may differ from GAAP. These “book/tax” differences are considered either permanent or temporary in nature. In accordance with the American Institute of Certified Public Accountants (“AICPA”) Statement of Position 93-2, permanent differences (i.e., reclassification of market discounts, gain/loss, paydowns, and distributions) are reclassified within the capital accounts based on their nature for federal income tax purposes; temporary differences do not require reclassification. These reclassifications have no effect upon the net asset value of the Fund. To the extent distributions exceed current and accumulated earnings and profits for federal income tax purposes, these distributions are reported as distributions of paid-in-capital.
| (h) | Federal Income Taxes |
It is the policy of the Fund to qualify or continue to qualify as a “regulated investment company” by complying with the provisions available to certain investment companies, as defined in applicable sections of the U.S. Internal Revenue Code, and to make distributions of net investment income and net realized capital gains sufficient to relieve the Fund from all, or substantially all, federal income taxes.
As of June 30, 2005, the tax cost of securities and the breakdown of unrealized appreciation (depreciation) for the Fund is as follows:
Tax Cost | Unrealized Appreciation | Unrealized Depreciation | Net Unrealized Appreciation (Depreciation) | |||||||
$2,663,453 | $ | 19,210,136 | $ | (4,824,335 | ) | $ | 14,385,801 | |||
| (i) | Allocation of Expenses, Income, and Gains and Losses |
Expenses directly attributable to the Fund are charged to the Fund. Expenses not directly attributable to the Fund are allocated proportionately among various or all funds within the Trust. The method used by the Fund for allocating income, fund level expenses, and realized and unrealized gains or losses is based on the fair value of shares outstanding relative to net assets. Under this method, each class of shares participates based on the total net asset value of that class’s shares in proportion to the total net assets of the Fund. Expenses specific to a class (such as rule 12b-1 and administrative services fees) are charged to that class.
23
Table of Contents
GARTMORE VARIABLE INSURANCE TRUST
NOTES TO FINANCIAL STATEMENTS (Unaudited) (Continued)
June 30, 2005
3. Transactions with Affiliates
Under the terms of the Trust’s Investment Advisory Agreement, Gartmore Mutual Fund Capital Trust (“GMF”) manages the investment of the assets and supervises the daily business affairs of the Fund. GMF is a wholly-owned subsidiary of Gartmore Global Investments, Inc. (“GGI”), a holding company. GGI is a majority-owned subsidiary of Gartmore Global Asset Management Trust (“GGAMT”). GGAMT is a wholly-owned subsidiary of Nationwide Corporation. All of the common stock of Nationwide Corporation is held by Nationwide Mutual Insurance Company (95.2%) and Nationwide Mutual Fire Insurance Company (4.8%), each of which is a mutual company owned by its policyholders. In addition, GMF provides investment management evaluation services in initially selecting and monitoring, on an ongoing basis, the performance of the subadviser, for the Fund. JPMorgan Investment Management, Inc. (the “subadviser”) manages all of the Fund’s investments and has the responsibility for making all investment decisions for the Fund.
Under the terms of the Investment Advisory Agreement, the Fund pays GMF an investment advisory fee based on that Fund’s average daily net assets. From such fees, pursuant to the subadvisory agreement, the adviser pays fees to the subadviser. Additional information regarding investment advisory fees and subadvisory fees for GMF and the subadviser is as follows for the six months ended June 30, 2005:
| Fee Schedule | Total Fees | Fees Retained | Paid to Sub-adviser | |||
Up to $100 million | 0.75% | 0.40% | 0.35% | |||
$100 million or more | 0.70% | 0.40% | 0.30% |
Effective May 1, 2005, GMF and the Fund have entered into a written contract (“Expense Limitation Agreement”) that limits operating expenses from exceeding 0.91% for Class IV Shares until at least May 1, 2006.
GMF may request and receive reimbursement from the Fund of the advisory fees waived and other expenses reimbursed by GMF, respectively, pursuant to the Expense Limitation Agreement at a later date not to exceed three years from the fiscal year in which the corresponding reimbursement to the Fund was made, depending on the Fund (as described below), if the Fund has reached a sufficient asset size to permit reimbursement to be made without causing the total annual operating expense ratio of the Fund to exceed the limits set forth above. No reimbursement will be made unless: (i) the Fund’s assets exceed $100 million; (ii) the total annual expense ratio of the Class making such reimbursement is less than the limit set forth above; and (iii) the payment of such reimbursement is approved by the Board of Trustees on a quarterly basis. Except as provided for in the Expense Limitation Agreements, reimbursement of amounts previously waived or assumed by GMF is not permitted.
As of the six months ended June 30, 2005, the cumulative potential reimbursements for the Class IV shares of the Fund, based on reimbursements which expires within three years from the fiscal year in which the corresponding reimbursement to the Fund was made for expenses reimbursed by GMF would be:
Amount | Amount Fiscal Year 2004 | Amount Six Months April 30, | ||||
$20,093 | $ | 32,438 | $ | 18,240 | ||
24
Table of Contents
GARTMORE VARIABLE INSURANCE TRUST
NOTES TO FINANCIAL STATEMENTS (Unaudited) (Continued)
June 30, 2005
Under the terms of a Fund Administration and Transfer Agency Agreement, Gartmore SA Capital Trust (“GSA”) provides the Fund with various administrative and accounting services, and Gartmore Investors Services, Inc. (“GISI”), an indirect subsidiary of GSA, serves as Transfer and Dividend Disbursing Agent for the Fund. The fees for the services provided under this Agreement are calculated based on the Trust’s average daily net assets according to the fee schedule below. The fees are then allocated proportionately among all funds within the Trust in relation to the average daily net assets of each Fund and are paid to GSA. GSA pays GISI from these fees for its services.
| Combined Fee Schedule* | ||
Up to $1 billion | 0.13% | |
$1 billion and more up to $3 billion | 0.08% | |
$3 billion and more up to $8 billion | 0.05% | |
$8 billion and more up to $10 billion | 0.04% | |
$10 billion and more up to $12 billion | 0.02% | |
$12 billion or more | 0.01% | |
| * | The assets of the Gartmore GVIT Investor Destinations Aggressive Fund, the Gartmore GVIT Investor Destinations Moderately Aggressive Fund, the Gartmore GVIT Investor Destinations Moderate Fund, the Gartmore GVIT Investor Destinations Moderately Conservative Fund, and the Gartmore GVIT Investor Destinations Conservative Fund (collectively, the “Investor Destinations Funds”) are excluded from the Trust asset level amount in order to calculate this asset-based fee. The Investor Destinations Funds do not pay any part of this fee. |
Effective January 1, 2005, the fee for the fund administration and transfer agency services increased as set forth below. The fees are calculated based on the Trust’s average daily net assets according to the fee schedule below. The fees are then allocated proportionately among all funds within the Trust in relation to the average daily net assets of each fund and are paid to GSA.
| Combined Fee Schedule* | ||
Up to $1 billion | 0.15% | |
$1 billion and more up to $3 billion | 0.10% | |
$3 billion and more up to $8 billion | 0.05% | |
$8 billion and more up to $10 billion | 0.04% | |
$10 billion and more up to $12 billion | 0.02% | |
$12 billion or more | 0.01% | |
| * | The assets of each of the Investor Destinations Funds are excluded from the Trust asset level amount in order to calculate this asset-based fee. The Investor Destinations Funds do not pay any part of this fee. |
GSA and GISI have entered into agreements with BISYS Fund Services Ohio, Inc. (“BISYS”), pursuant to which BISYS provides sub-administration and sub-transfer agency services, respectively, to the Fund.
Under the terms of an Administrative Services Plan, the Fund may pay fees to servicing organizations, such as broker-dealers, including Nationwide Financial Services, and financial institutions, which agree to provide administrative support services to the shareholders of certain classes. These services include, but are not limited, to the following: establishing and maintaining shareholder accounts; processing purchase and redemption transactions; arranging bank wires; performing shareholder sub-accounting; answering inquires regarding the Fund; and other such services. These fees are based on an annual rate of up to 0.25% of the average daily net assets of Class I shares of the Fund and 0.20% of Class IV shares of the Fund.
4. Investment Transactions
For the six months ended June 30, 2005, (excluding short-term securities) the Fund had purchases of $379,164,736 and sales of $387,313,364.
25
Table of Contents
GARTMORE VARIABLE INSURANCE TRUST
NOTES TO FINANCIAL STATEMENTS (Unaudited) (Continued)
June 30, 2005
5. Bank Loans
The Trust has a credit agreement of $100,000,000. Borrowings under this arrangement bear interest at the Federal Funds rate plus 0.50%. The interest costs are included in custodian fees in the Statement of Operations. No compensation balances were required under the terms of the line of credit. There were no borrowings outstanding as of June 30, 2005.
6. Shareholder Meeting
A separate shareholders meeting was held on Tuesday, December 23, 2004, for the shareholders of the Trust’s predecessor pursuant to a Proxy Statement On Schedule 14A, dated October 29, 2004, and mailed to the shareholders of the Trust’s predecessor on or around November 5, 2004.
Two Proposals: The purpose of the December 23, 2004 meeting was to allow the shareholders of the Trust’s predecessor to vote on:
| i. | Proposal One: The election of the Trust’s Board of Trustees; and |
| ii. | Proposal Two: The approval of an “Agreement and Plan of Reorganization” that provided for the reorganization of the Trust from a Massachusetts business trust into a Delaware statutory trust. |
Proposal One: As set forth in the October 29, 2004 Proxy Statement, the nominees for election as Trustees of the Trust’s predecessor were: Charles E. Allen, Michael J. Baresich, Paula H.J. Cholmondeley, C. Brent DeVore, Phyllis Kay Dryden, Robert M. Duncan, Barbara L. Hennigar, Paul J. Hondros, Barbara I Jacobs, Thomas J. Kerr IV, Douglas F. Kridler, Michael D. McCarthy, Arden L. Shisler, and David C. Wetmore.
Proposal Two: As specifically set forth in the October 29, 2004 Proxy Statement, the Reorganization proposal requested the shareholders of the Trust’s predecessor to approve the proposed “Agreement and Plan of Reorganization” of the Trust’s predecessor (on behalf of each of the its funds) into a new Delaware-domiciled Trust, whereby the Funds of the new Delaware Trust would acquire all of the assets of the corresponding funds of the Trust’s predecessor subject to the liabilities, expenses, costs, charges, and reserves of the corresponding funds of the Trust’s predecessor (contingent or otherwise), in exchange for shares of the acquiring Funds to be distributed pro rata by the Trust to the holders of the shares of the funds of the Trust’s predecessor, in a complete liquidation of the Trust’s predecessor.
Voting Results:
The shareholders of the Trust’s predecessor voted to approve both Proposal One and Proposal Two, as follows:
Proposal 1: Election of a Board of Trustees of Gartmore Variable Insurance Trust
Charles E. Allen: | ||
FOR | 2,797,230,318.955 shares (96.078%) | |
WITHHOLD | 114,195,693.660 shares (3.922%) | |
TOTAL | 2,912,726,012.615 shares (100.000%) | |
Michael J. Baresich: | ||
FOR | 2,796,135,979.559 shares (96.040%) | |
WITHHOLD | 115,290,033.056 shares (3.960%) | |
TOTAL | 2,912,726,012.615 shares (100.000%) | |
Paula H.J. Cholmondeley: | ||
FOR | 2,795,095,945.396 shares (96.004%) | |
WITHHOLD | 116,330,067.219 shares (3.996%) | |
TOTAL | 2,912,726,012.615 shares (100.000%) | |
26
Table of Contents
GARTMORE VARIABLE INSURANCE TRUST
NOTES TO FINANCIAL STATEMENTS (Unaudited) (Continued)
June 30, 2005
C. Brent DeVore: | ||
FOR | 2,797,207,046.916 shares (96.077%) | |
WITHHOLD | 114,218,965.699 shares (3.923%) | |
TOTAL | 2,912,726,012.615 shares (100.000%) | |
Phyllis Kay Dryden: | ||
FOR | 2,795,587,023.994 shares (96.021%) | |
WITHHOLD | 115,838,988.621 shares (3.979%) | |
TOTAL | 2,912,726,012.615 shares (100.000%) | |
Robert M. Duncan: | ||
FOR | 2,790,191,720.503 shares (95.836%) | |
WITHHOLD | 121,234,292.112 shares (4.164%) | |
TOTAL | 2,912,726,012.615 shares (100.000%) | |
Barbara L. Hennigar: | ||
FOR | 2,792,939,848.858 shares (95.937%) | |
WITHHOLD | 118,486,163.757 shares (4.070%) | |
TOTAL | 2,912,726,012.615 shares (100.000%) | |
Paul J. Hondros: | ||
FOR | 2,797,557,404.448 shares (96.089%) | |
WITHHOLD | 113,868,608.167 shares (3.911%) | |
TOTAL | 2,912,726,012.615 shares (100.000%) | |
Barbara I. Jacobs: | ||
FOR | 2,796,306,126.654 shares (96.046%) | |
WITHHOLD | 115,119,885.961 shares (3.954%) | |
TOTAL | 2,912,726,012.615 shares (100.000%) | |
Thomas J. Kerr IV: | ||
FOR | 2,789,755,720.087 shares (95.821%) | |
WITHHOLD | 121,670,292.528 shares (4.179%) | |
TOTAL | 2,912,726,012.615 shares (100.000%) | |
Douglas F. Kridler: | ||
FOR | 2,798,065,774.375 shares (96.106%) | |
WITHHOLD | 113,360,238.240 shares (3.894%) | |
TOTAL | 2,912,726,012.615 shares (100.000%) | |
Michael D. McCarthy: | ||
FOR | 2,797,452,613.694 shares (96.085%) | |
WITHHOLD | 113,973,395.921 shares (3.915%) | |
TOTAL | 2,912,726,012.615 shares (100.000%) | |
27
Table of Contents
GARTMORE VARIABLE INSURANCE TRUST
NOTES TO FINANCIAL STATEMENTS (Unaudited) (Continued)
June 30, 2005
Arden L. Shisler: | ||
FOR | 2,796,738,454.730 shares (96.061%) | |
WITHHOLD | 114,687,557.885 shares (3.939%) | |
TOTAL | 2,912,726,012.615 shares (100.000%) | |
David C. Wetmore: | ||
FOR | 2,794,784,752.247 shares (95.994%) | |
WITHHOLD | 116,641,260.368 shares (4.006%) | |
TOTAL | 2,912,726,012.615 shares (100.000%) | |
Proposal 2: Approval of the Agreement and Plan of Reorganization of Gartmore Variable Insurance Trust
FOR | 2,561,003,822.546 shares (87.964%) | |
AGAINST | 103,593,261.010 shares (3.558%) | |
ABSTAIN | 246,828,929.059 shares (8.478%) | |
TOTAL | 2,912,726,012.615 shares (100.000%) | |
28
Table of Contents
GARTMORE VARIABLE INSURANCE TRUST
Management Information (Unaudited)
June 30, 2005
Trustees who are not Interested Persons (as defined in the 1940 Act) and Officers of the Funds June 30, 2005
| Name, Address and Date of Birth | Position(s) Held with the Trust and Length of Time Served1 | Principal Occupation(s) During Past 5 Years | Number of Portfolios in the Gartmore Fund Complex Overseen by Trustee | Other Directorships Held by Trustee or Nominee2 | ||||
Charles E. Allen
c/o Gartmore Global Investments, Inc. 1200 River Road, Suite 1000 Conshohocken, PA 19428
1948 | Trustee since July 2000 | Mr. Allen is Chairman, Chief Executive Officer and President of the Graimark Realty Advisors, Inc. (real estate development, investment and asset management). | 84 | None | ||||
Paula H.J. Cholmondeley
c/o Gartmore Global Investments, Inc. 1200 River Road, Suite 1000 Conshohocken, PA 19428
1940 | Trustee since July 2000 | Ms. Cholmondeley has been the Chairman and Chief Executive Officer of the Sorrel Group, a management consulting company, since January 2004. From March 2000 through December 2003, Ms. Cholmondeley was Vice President and General Manager of Sappi Fine Paper North America. Prior thereto, Ms. Cholmondeley was Vice President and General Manager of Residential Insulation of Owens Corning. | 84 | Director of Dentsply International, Inc., Ultralife Batteries, Inc., Terex Corporation, Minerals Technology, Inc. and Albany International Corp. | ||||
C. Brent DeVore
c/o Gartmore Global Investments, Inc. 1200 River Road, Suite 1000 Conshohocken, PA 19428
1940 | Trustee since 1990 | Dr. DeVore is President of Otterbein College. | 84 | None | ||||
Phyllis K. Dryden
c/o Gartmore Global Investments, Inc. 1200 River Road, Suite 1000 Conshohocken, PA 19428
1947 | Trustee since December 2004 | Ms. Dryden was a former Managing Partner of marchFIRST, a global management consulting firm prior to 2002. | 84 | None |
29
Table of Contents
GARTMORE VARIABLE INSURANCE TRUST
Management Information (Unaudited)
June 30, 2005
| Name, Address and Date of Birth | Position(s) Held with the Trust and Length of Time Served1 | Principal Occupation(s) During Past 5 Years | Number of Portfolios in the Gartmore Fund Complex Overseen by Trustee | Other Directorships Held by Trustee or Nominee2 | ||||
Barbara L. Hennigar*
c/o Gartmore Global Investments, Inc. 1200 River Road, Suite 1000 Conshohocken, PA 19428
1935 | Trustee since July 2000 | Retired since June 2000. Prior thereto, Ms. Hennigar was the Chairman or President and Chief Executive Officer of OppenheimerFunds Services and a member of the Executive Committee of OppenheimerFunds. | 84 | None | ||||
Barbara I. Jacobs
c/o Gartmore Global Investments, Inc. 1200 River Road, Suite 1000 Conshohocken, PA 19428
1950 | Trustee since December 2004 | Ms. Jacobs has served as Chairman of the Board of Directors of KICAP Network Fund, a European (United Kingdom) hedge fund, since December 2000. Prior to 2004, Ms. Jacobs was also a Managing Director and European Portfolio Manager with CREF Investments (Teachers Insurance Annuity Association–College Retirement Equity Fund). | 84 | None | ||||
Douglas F. Kridler
c/o Gartmore Global Investments, Inc. 1200 River Road, Suite 1000 Conshohocken, PA 19428
1955 | Trustee since September 1997 | Mr. Kridler has served as the President and Chief Executive Officer of the Columbus Foundation (a Columbus, OH-based foundation which manages over 1,300 individual endowment funds) since February 2002. Mr. Kridler was the President of the Columbus Association for the Performing Arts prior thereto and Chairman of the Greater Columbus Convention and Visitors Bureau during 2000 and 2001. | 84 | None | ||||
Michael D. McCarthy
c/o Gartmore Global Investments, Inc. 1200 River Road, Suite 1000 Conshohocken, PA 19428
1947 | Trustee since December 2004 | Mr. McCarthy serves as: the Founder and Chairman of The Eureka Foundation (which sponsors and funds the “Great Museums” series on PBS); and a Partner of Pineville Properties LLC (a commercial real estate development firm). | 843 | None |
30
Table of Contents
GARTMORE VARIABLE INSURANCE TRUST
Management Information (Unaudited)
June 30, 2005
| Name, Address and Date of Birth | Position(s) Held with the Trust and Length of Time Served1 | Principal Occupation(s) During Past 5 Years | Number of Portfolios in the Gartmore Fund Complex Overseen by Trustee | Other Directorships Held by Trustee or Nominee2 | ||||
David C. Wetmore
c/o Gartmore Global Investments, Inc. 1200 River Road, Suite 1000 Conshohocken, PA 19428
1948 | Trustee since 1995 and Chairman since February 2005 | Retired. Mr. Wetmore was formerly a Managing Director of Updata Capital, an investment banking and venture capital firm. | 84 | None |
| * | Pursuant to the Trust’s mandatory retirement policy, Ms. Hennigar is expected to retire on or about January 12, 2006. |
| 1 | The term of office length is until a trustee resigns or reaches a mandatory retirement age of 70. On March 2, 2000, the Board adopted a five-year implementation period for any Trustee 65 or older as of the adoption of this policy. Pursuant to this policy, Messrs. Duncan and Kerr retired as trustees effective as of March 12, 2005. |
| 2 | Directorships held in (1) any other investment companies registered under the 1940 Act, (2) any company with a class of securities registered pursuant to Section 12 of the Securities Exchange Act of 1934, as amended (the “Exchange Act”), or (3) any company subject to the requirements of Section 15(d) of the Exchange Act. |
| 3 | Mr. McCarthy was also an Administrative Committee Member for the Alphagen Arneb Fund, LLC, The Healthcare Fund LDC, The Leaders Long-Short Fund, LLC, and The Leaders Long-Short Fund LDC, four private investment companies (hedge funds) managed by GSA. Mr. McCarthy resigned as an Administrative Committee Member effective June 30, 2005. |
Trustees and Officers who are not Interested Persons (as defined in the 1940 Act) of the Funds received aggregate compensation of $274,882 from the Trust for the Six Months Ended June 30, 2005. Additional information regarding the Trustees and Officers may be found in the Trust’s statement of additional information, which is available without charge upon request, by calling 1-800-848-0920.
31
Table of Contents
GARTMORE VARIABLE INSURANCE TRUST
Management Information (Unaudited)
June 30, 2005
Trustees who are Interested Persons (as defined in the 1940 Act) and/or Officers of the Funds June 30, 2005
| Name, Address and Age | Position(s) Held with the Trust and Length of Time Served1 | Principal Occupation(s) During Past 5 Years | Number of Portfolios in the Gartmore Fund Complex Overseen by Trustee | Other Directorships Held by Trustee2 | ||||
Paul J. Hondros
Gartmore Global Investments, Inc. 1200 River Road, Suite 1000 Conshohocken, PA 19428
1948 | Trustee since July 2000 | Mr. Hondros has been President and Chief Executive Officer of various Gartmore entities, including Gartmore Distribution Services, Inc. (“GDSI”),3 Gartmore Investor Services, Inc. (“GISI”),3 Gartmore Morley Capital Management, Inc. (“GMCM”),3 Gartmore Morley Financial Services, Inc. (“GMFS”),3 NorthPointe Capital, LLC (“NorthPointe”),3 Gartmore Global Asset Management Trust (“GGAMT”)3, Gartmore Global Investments, Inc. (“GGI”)3, Gartmore Mutual Fund Capital Trust (“GMFCT”)3 and Gartmore SA Capital Trust (“GSA”)3; and a Director of Nationwide Securities, Inc.3, as well as several entities within Nationwide Financial Services, Inc. | 844 | None | ||||
Arden L. Shisler
c/o Gartmore Global Investments, Inc. 1200 River Road, Suite 1000 Conshohocken, PA 19428
1941 | Trustee since February 2000 | Mr. Shisler has been a consultant since January 2003. Prior thereto, he was President and Chief Executive Officer of K&B Transport, Inc., a trucking firm. Since 1992, Mr. Shisler has also been Chairman of the Board for Nationwide Mutual Insurance Company3. | 84 | Director of Nationwide Financial Services, Inc. | ||||
Gerald J. Holland
Gartmore Global Investments, Inc. 1200 River Road, Suite 1000 Conshohocken, PA 19428
1951 | Treasurer since March 2001 | Mr. Holland is Senior Vice President - Operations for GGI3, GMFCT3 , and GSA3. Prior to July 2000, Mr, Holland was Vice President for First Data Investor Services, an investment company service provider. | 84 | None |
32
Table of Contents
GARTMORE VARIABLE INSURANCE TRUST
Management Information (Unaudited)
June 30, 2005
| Name, Address and Age | Position(s) Held with the Trust and Length of Time Served1 | Principal Occupation(s) During Past 5 Years | Number of Portfolios in the Gartmore Fund Complex Overseen by Trustee | Other Directorships Held by Trustee2 | ||||
Michael A. Krulikowski
Gartmore Global Investments, Inc. 1200 River Road, Suite 1000 Conshohocken, PA 19428
1959 | Chief Compliance Officer since June 2004 | Since November 1999, Mr. Krulikowski has served as a Vice President and Chief Compliance Officer of GGI. Prior thereto, Mr. Krulikowski served as Chief Compliance Officer of 1717 Capital Management Company/Provident Mutual Insurance Company. | 84 | None | ||||
Eric E. Miller
Gartmore Global Investments, Inc. 1200 River Road, Suite 1000 Conshohocken, PA 19428
1953 | Secretary since December 2002 | Mr. Miller is Senior Vice President, Chief Counsel for GGI3, GMFCT3 and GSA3 since August 2002. From August 2000 to August 2002, Mr. Miller was a Partner with Stradley Ronan Stevens & Young, LLP. Prior to August 2000, Mr. Miller served as Senior Vice President and Deputy General Counsel at Delaware Investments. | 84 | None |
| 1 | The term of office length is until a trustee resigns or reaches a mandatory retirement age of 70. On March 2, 2000, the Board adopted a five-year implementation period for any Trustee 65 or older as of the adoption of this policy. Pursuant to this policy, Messrs. Duncan and Kerr retired as trustees effective as of March 12, 2005. |
| 2 | Directorships held in (1) any other investment companies registered under the 1940 Act, (2) any company with a class of securities registered pursuant to Section 12 of the Securities Exchange Act of 1934, as amended (the “Exchange Act”), or (3) any company subject to the requirements of Section 15(d) of the Exchange Act. |
| 3 | This position is held with an affiliated person or principal underwriter of the Trust. |
| 4 | Mr. Hondros was also an Administrative Committee Member for the Alphagen Arneb Fund, LLC, The Healthcare Fund LDC, The Leaders Long-Short Fund, LLC, and The Leaders Long-Short Fund LDC, four private investment companies (hedge funds) managed by GSA. Mr. Hondros resigned as Administrative Committee Member effective June 30, 2005. |
Federal law requires the Trust, each of its investment advisers and sub-advisers to adopt procedures for voting proxies (“Proxy Voting Guidelines”) and to provide a summary of those Proxy Voting Guidelines used to vote the securities held by the Funds. The Funds’ proxy voting policies and procedures are available without charge (i) upon request, by calling 1-800-848-0920, (ii) on the Fund’s website at www.gartmorefunds.com, or (iii) on the Securities and Exchange Commission’s website at www.sec.gov.
33
Table of Contents
Gartmore GVIT Mid Cap Growth Fund
Semiannual Report
| | June 30, 2005 |
| Contents | ||
| 5 | Statement of Investments | |
| 7 | Statement of Assets and Liabilities | |
| 7 | Statement of Operations | |
| 8 | Statements of Changes in New Assets | |
| 9 | Financial Highlights | |
| 10 | Notes to Financial Statements | |
Commentary provided by Gartmore Global Investments, investment adviser to Gartmore Variable Insurance Trust. All opinions and estimates included in this report constitute Gartmore Global Investments’ judgment as of the date of this report and are subject to change without notice.
Statement Regarding Availability of Quarterly Portfolio Schedule.
The Gartmore Variable Insurance Trust files complete schedules of portfolio holdings for each Fund with the Securities and Exchange Commission (the “Commission”) for the first and third quarters of each fiscal year on Form N-Q. The Funds’ Forms N-Q are available on the Commission’s website at http://www.sec.gov. The Funds’ Forms N-Q may be reviewed and copied at the Commission’s Public Reference Room in Washington, DC, and information on the operation of the Public Reference Room may be obtained by calling 800-SEC-0330; and the Funds make the information on Form N-Q available to shareholders upon request without charge.
Statement Regarding Availability of Proxy Voting Record.
Information regarding how the Fund voted proxies relating to portfolio securities held during the most recent 12-month period ended June 30, 2005 is available without charge, upon request, by calling 800-848-0920, and on the Commission’s website at http://www.sec.gov.
Table of Contents
Gartmore GVIT Mid Cap Growth Fund
For the semiannual period ended June 30, 2005, the Gartmore GVIT Mid Cap Growth Fund returned 1.70% (Class I at NAV) versus 1.70% for its benchmark, the Russell Midcap® Growth Index. For broader comparison, the average return for the Fund’s Lipper peer category of Mid-Cap Growth Funds was 0.32%.
Since 2005 began, significant contributors to the Fund’s performance have included exposure to the energy, consumer discretionary and health-care sectors. While the Fund’s energy segment has benefited from both strong stock selection and sector outperformance, we are particularly pleased with the stock selection in health care, an area of focus in the latter half of 2004. Stock selection was generally good across sectors with the exception of information technology, which was the most significant detractor from performance. Our overweight position in the underperforming technology sector was aggravated by poor stock selection. We should note, however, that negative stock selection has largely been concentrated to a few names within technology. We believe that our philosophy and strategy continue to work and that the Fund is well positioned for the second half of 2005.
We maintain a discipline of finding high-quality growth stocks, regardless of the prevailing market conditions. As we expected during the period, as investors’ confidence in the earnings recovery strengthened, cyclical and lower-quality companies’ stock performed very well, which is typical in the first stage of an economic recovery. As we look forward, we feel that we are currently entering the second phase of an earnings recovery, during which higher-quality companies with sustainable earnings growth has historically outperformed. We continue to believe that we are guarded on the downside by our careful attention to stock selection. Our core philosophy has not changed, and, therefore, the Fund remains relatively sector-neutral to the benchmark, since we prefer to let our stock selections drive performance. We remain focused on high-quality companies with sustainable competitive advantages, strong balance sheets and industry-leading returns trading at reasonable multiples. We are hopeful that our strategy will be rewarded during a complete market cycle.
PORTFOLIO MANAGER: Robert D. Glise
Investing in mutual funds involves risk, including possible loss of principal.
There is no assurance that the investment objective of any fund will be achieved.
Russell Midcap® Growth Index: An unmanaged index of mid-capitalization growth stocks of U.S. companies; measures the performance of the stocks of those Russell Midcap® Index companies with higher price-to-book ratios and higher forecasted growth values, and gives a broad look at how the stock prices of medium-sized U.S. companies have performed.
Lipper Analytical Services, Inc. is an industry research firm whose rankings are based on total return performance and do not reflect the effects of sales charges.
The Gartmore Variable Insurance Trust Funds are available only as sub-account investment options in certain variable insurance products. Accordingly, investors are unable to invest in shares of these funds outside of an insurance product. Performance information found herein reflects only the performance of these funds, and does not indicate the performance your sub-account may experience under your variable insurance contract. Performance returns assume reinvestment of all distributions. The investment return and principal value of an investment will fluctuate so that an investor’s shares, when redeemed, may be worth more or less than their original cost. Index performance is provided for comparison purposes only; the indexes shown are unmanaged and do not reflect any fees or expenses. Investors cannot invest directly in market indexes. To obtain performance information about the sub-account option under your insurance contract that invests in one of these funds, please contact your variable insurance carrier. PAST PERFORMANCE IS NO GUARANTEE OF FUTURE RESULTS.
Commentary provided by Gartmore Global Investments. All opinions and estimates included in this report constitute Gartmore Global Investments’ judgment as of the date of this report and are subject to change without notice.
Investors should carefully consider a fund’s investment objectives, risks, fees, charges and expenses before investing any money. To obtain this and other information on Gartmore Variable Insurance Trust, please contact your variable insurance contract provider or call 800-848-0920. Please read the Trust’s prospectus carefully before investing any money.
Gartmore Funds distributed by Gartmore Distribution Services, Inc., Member NASD. 1200 River Road, Suite 1000, Conshohocken, PA 19428.
1
Table of Contents
Fund Performance | Gartmore GVIT Mid Cap Growth Fund |
| Average | Annual Total Return1 |
(For Periods Ended June 30, 2005)
| Six months* | One year | Five years | Ten years | |||||
| Class I2 | 1.70% | 10.16% | 6.92% | 12.68% | ||||
| Class II2 | 1.62% | 10.04% | 6.71% | 12.42% | ||||
| Class III2 | 1.70% | 10.19% | 6.94% | 12.69% | ||||
| Class IV3 | 1.70% | 10.15% | 6.93% | 12.68% |
| * | Not Annualized. |
| 1 | Not subject to any sales charges. |
| 2 | These returns until April 28, 2003 are based on the performance of the Portfolio which is the same as performance for the Class IV shares and which was achieved prior to the acquisition of the Portfolio’s assets by the Fund and restatement of the performance of Class I, Class II, Class III shares. Excluding the effect of fee waivers or reimbursements, such prior performance is similar to what Class I, Class II, and Class III shares would have produced because all classes of shares invest in the same portfolio of securities. Class II shares’ annual returns have been restated to reflect the additional fees applicable to Class II shares and therefore are lower than those of Class IV. For Class III shares, these returns do not reflect the short-term trading fees applicable to such shares; if these fees were reflected, the annual returns for Class III shares would have been lower. |
| 3 | The Fund’s predecessor, Market Street Mid Cap Growth Portfolio (the “Portfolio”), commenced operations on May 1, 1989. As of April 28, 2003, the Strong GVIT Mid Cap Growth Fund (renamed Gartmore GVIT Mid Cap Growth Fund) acquired all the assets, subject to stated liabilities, of the Portfolio. As a result, the performance of the Gartmore GVIT Mid Cap Growth Fund was restated to reflect the performance of the Portfolio because the Portfolio was the survivor for performance purposes. The performance of the Strong GVIT Mid Cap Growth Fund prior to April 28, 2003 is no longer reflected when performance is presented for the Fund. |
| Performance | of a $10,000 Investment |
Investment return and principal value will fluctuate, and when redeemed, shares may be worth more or less than original cost. Past performance is no guarantee of future results and does not reflect the deduction of taxes that a shareholder would pay on fund distributions or the redemption of fund shares. Investing in mutual funds involves market risk, including loss of principal. Performance returns assume the reinvestment of all distributions.
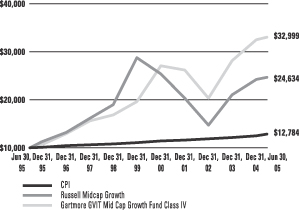
Comparative performance of $10,000 invested in Class IV shares of the Gartmore GVIT Mid Cap Growth Fund, Russell Midcap Growth Index (Russell Midcap Growth)(a), and the Consumer Price Index (CPI)(b) over as 10-year period ended 06/30/05. Unlike the Fund, the returns for these unmanaged indexes do not reflect any fees, expenses, or sales charges. Investors cannot invest directly in market indexes.
| (a) | The Russell Midcap Growth is an unmanaged index of mid-capitalization growth stocks of U.S. companies; measures the performance of the stocks of those Russell Midcap Index companies with higher price-to-book ratios and higher forecasted growth values, and gives a broad look at how the stock prices of medium-sized U.S. companies have performed. |
| (b) | The CPI represents changes in prices of a basket of goods and services purchased for consumption by urban households. |
2
Table of Contents
Shareholder
Expense Example | Gartmore GVIT Mid Cap Growth Fund |
As a shareholder of the Fund, you incur two types of costs: (1) transaction costs, including sales charges (loads) paid on purchase payments and redemption fees; and (2) ongoing costs, including investment advisory fees, administration fees, distribution fees and other Fund expenses. The examples below are intended to help you understand your ongoing costs (in dollars) of investing in the Fund and to compare these costs with the ongoing costs of investing in other mutual funds. Per SEC requirements, the examples assume that you had a $1,000 investment in the Class at the beginning of the reporting period, January 1, 2005, and continued to hold your shares at the end of the reporting period, June 30, 2005.
Actual Expenses
For each Class of the Fund in the table below, the first line provides information about actual account values and actual expenses. You may use the information in this line, together with the amount you invested, to estimate the expenses that you paid over the period. Simply divide your account value by $1,000 (for example, an $8,600 account value divided by $1,000 = 8.6), then multiply the result by the number in the first line of each Class under the heading entitled “Expenses Paid During Period” to estimate the expenses you paid on your account during the period.
Hypothetical Example for Comparison Purposes
The second line of each Class in the table below provides information about hypothetical account value and hypothetical expenses based on the Class’ actual expense ratio and an assumed rate of return of 5% per year before expenses, which is not the Class’ actual return. The hypothetical account values and expenses may not be used to estimate the actual ending account balance or expenses you paid for the period. You may use this information to compare the ongoing costs of investing in the Class of the Fund and other funds. To do so, compare this 5% hypothetical example with the 5% hypothetical examples that appear in the shareholder reports of the other funds.
Please note that the expenses shown in the table are meant to highlight your ongoing costs only and do not reflect any transaction costs, such as sales charges (loads) or redemption fees. Therefore, the second line for each Class in the table is useful in comparing ongoing costs only, and will not help you determine the relative total costs of owning different funds. In addition, if these transaction costs were included, your costs would have been higher. The examples also assume all dividends and distributions have been reinvested.
| Beginning Account Value, January 1, 2005 | Ending Account Value, June 30, 2005 | Expenses Paid During Period* | Annualized Expense Ratio* | ||||||||||
| Mid Cap Growth Fund | |||||||||||||
Class I | Actual | $ | 1,000 | $ | 1,017 | $ | 4.95 | 0.99% | |||||
| Hypothetical1 | $ | 1,000 | $ | 1,020 | $ | 4.97 | 0.99% | ||||||
Class II | Actual | $ | 1,000 | $ | 1,016 | $ | 5.50 | 1.10% | |||||
| Hypothetical1 | $ | 1,000 | $ | 1,020 | $ | 5.52 | 1.10% | ||||||
Class III | Actual | $ | 1,000 | $ | 1,017 | $ | 4.95 | 0.99% | |||||
| Hypothetical1 | $ | 1,000 | $ | 1,020 | $ | 4.97 | 0.99% | ||||||
Class IV | Actual | $ | 1,000 | $ | 1,017 | $ | 4.75 | 0.95% | |||||
| Hypothetical1 | $ | 1,000 | $ | 1,020 | $ | 4.77 | 0.95% | ||||||
| * | Expenses are equal to the Fund’s annualized expense ratio multiplied by the average account value over the period multiplied by 181/365 (to reflect the one-half year period). The expense ratio presented represents a six month, annualized ratio in accordance with SEC guidelines. |
| 1 | Represents the hypothetical 5% return before expenses. |
3
Table of Contents
Portfolio Summary
Gartmore GVIT Mid Cap Growth Fund | (June 30, 2005) |
The SEC adopted a requirement that Funds present their portfolio holdings in a table, chart or graph format in their annual and semiannual reports to shareholders, whether or not a statement of investments is utilized. The following tables, which present portfolio holdings as a percentage of net assets, are provided in compliance with this requirement.
| Asset Allocation | ||
| Common Stocks | 99.6% | |
| Cash Equivalents | 1.2% | |
| Other Investments* | 19.9% | |
| Liabilities in excess of other assets** | -20.7% | |
| 100.0% | ||
| Top Holdings*** | ||
| L-3 Communications Holdings, Inc. | 3.8% | |
| Investors Financial Services Corp. | 2.9% | |
| Corporate Executive Board Co. | 2.9% | |
| Amphenol Corp., Class A | 2.4% | |
| EOG Resources, Inc. | 2.3% | |
| Invitrogen Corp. | 2.1% | |
| Alliance Data Systems Corp. | 2.0% | |
| Marvel Technology Group Ltd. | 2.0% | |
| XTO Energy, Inc. | 2.0% | |
| Kos Pharmaceuticals, Inc. | 1.9% | |
| Other Holdings | 75.7% | |
| 100.0% | ||
| Top Industries | ||
| Computer Software & Services | 11.9% | |
| Medical Products & Services | 8.8% | |
| Retail | 8.5% | |
| Oil & Gas | 7.7% | |
| Electronics | 6.4% | |
| Telecommunications | 6.2% | |
| Semiconductors | 5.8% | |
| Consumer Products | 5.5% | |
| Consumer & Commercial Services | 4.7% | |
| Financial Services | 4.4% | |
| Other Industries | 30.1% | |
| 100.0% | ||
| * | Includes value of collateral received from securities lending. |
| ** | Includes value of collateral owed from securities lending. |
| *** | For purpose of listing top holdings, repurchase agreements are considered cash equivalents and are included as part of other holdings. |
4
Table of Contents
GARTMORE VARIABLE INSURANCE TRUST
GARTMORE GVIT MID CAP GROWTH FUND
Statement of Investments — June 30, 2005 (Unaudited)
Shares or Principal Amount | Value | ||||
| COMMON STOCKS (99.6%) | |||||
| Aerospace & Defense (3.8%) | |||||
| L-3 Communications Holdings, Inc. | 116,000 | $ | 8,883,280 | ||
| Banks (4.0%) | |||||
| City National Corp. | 46,700 | 3,348,857 | |||
| North Fork Bancorp, Inc. | 101,800 | 2,859,562 | |||
| Zions Bancorp | 45,000 | 3,308,850 | |||
| 9,517,269 | |||||
| Business Services (4.2%) | |||||
| ChoicePoint, Inc. (b) | 78,566 | 3,146,568 | |||
| Corporate Executive Board Co. | 85,800 | 6,720,714 | |||
| 9,867,282 | |||||
| Computer Software & Services (11.9%) | |||||
| Business Objectives S.A. ADR-FR (b) | 127,800 | 3,361,140 | |||
| CACI International, Inc., Class A (b) | 34,774 | 2,196,326 | |||
| eResearch Technology, Inc. (b) | 154,500 | 2,068,755 | |||
| Factset Research Systems, Inc. | 92,450 | 3,313,408 | |||
| Fiserv, Inc. (b) | 79,500 | 3,414,525 | |||
| Henry ( Jack) & Associates, Inc. | 123,400 | 2,259,454 | |||
| InfoSpace, Inc. (b) | 50,700 | 1,669,551 | |||
| Intuit, Inc. (b) | 69,600 | 3,139,656 | |||
| Mercury Interactive Corp. (b) | 111,700 | 4,284,812 | |||
| Navteq Corp. (b) | 63,100 | 2,346,058 | |||
| 28,053,685 | |||||
| Construction (1.4%) | |||||
| D.R. Horton, Inc. | 89,533 | 3,367,336 | |||
| Consumer & Commercial Services (4.7%) | |||||
| Alliance Data Systems Corp. (b) | 120,300 | 4,879,368 | |||
| Rollins, Inc. | 164,550 | 3,297,582 | |||
| Total System Services, Inc. | 121,600 | 2,930,560 | |||
| 11,107,510 | |||||
| Consumer Products (5.5%) | |||||
| Ball Corp. | 52,800 | 1,898,688 | |||
| Church & Dwight, Inc. | 60,900 | 2,204,580 | |||
| Fortune Brands, Inc. | 40,300 | 3,578,640 | |||
| Gildan Activewear, Inc., Class A (b) | 108,000 | 2,845,800 | |||
| Jarden Corp. (b) | 44,900 | 2,421,008 | |||
| 12,948,716 | |||||
Shares or Principal Amount | Value | ||||
| COMMON STOCKS (continued) | |||||
| Electronics (6.4%) | |||||
| Amphenol Corp., Class A | 138,700 | $ | 5,571,579 | ||
| Cabot Microelectronics Corp. (b) | 76,900 | 2,229,331 | |||
| Jabil Circuit, Inc. (b) | 127,900 | 3,930,367 | |||
| Microchip Technology, Inc. | 110,700 | 3,278,934 | |||
| 15,010,211 | |||||
| Financial Services (4.4%) | |||||
| Ameritrade Holdings Corp. (b) | 188,000 | 3,494,920 | |||
| Investors Financial Services Corp. | 182,900 | 6,917,278 | |||
| 10,412,198 | |||||
| Gaming & Leisure (2.5%) | |||||
| Penn National Gaming, Inc. (b) | 103,100 | 3,763,150 | |||
| Scientific Games Corp. (b) | 76,700 | 2,065,531 | |||
| 5,828,681 | |||||
| Healthcare (3.2%) | |||||
| Express Scripts, Inc. (b) | 76,000 | 3,798,480 | |||
| St. Jude Medical, Inc. (b) | 86,400 | 3,767,904 | |||
| 7,566,384 | |||||
| Instruments—Scientific (0.8%) | |||||
| Waters Corp. (b) | 50,400 | 1,873,368 | |||
| Medical Products & Services (8.8%) | |||||
| Biomet, Inc. | 58,990 | 2,043,414 | |||
| Charles River Laboratories International, Inc. (b) | 81,400 | 3,927,550 | |||
| Fisher Scientific International, Inc. (b) | 64,300 | 4,173,070 | |||
| Invitrogen Corp. (b) | 60,600 | 5,047,374 | |||
| Kinetic Concept, Inc. (b) | 30,453 | 1,827,180 | |||
| ResMed, Inc. (b) | 58,100 | 3,834,019 | |||
| 20,852,607 | |||||
| Oil & Gas (7.7%) | |||||
| EOG Resources, Inc. | 93,500 | 5,310,800 | |||
| Kinder Morgan, Inc. | 45,400 | 3,777,280 | |||
| Patterson-UTI Energy, Inc. | 151,300 | 4,210,679 | |||
| XTO Energy, Inc. | 141,030 | 4,793,610 | |||
| 18,092,369 | |||||
| Pharmaceuticals (3.4%) | |||||
| IVAX Corp. (b) | 158,050 | 3,398,075 | |||
| Kos Pharmaceuticals, Inc. (b) | 69,000 | 4,519,500 | |||
| 7,917,575 | |||||
5
Table of Contents
GARTMORE VARIABLE INSURANCE TRUST
GARTMORE GVIT MID CAP GROWTH FUND
Statement of Investments — June 30, 2005 (Unaudited) (continued)
Shares or Principal Amount | Value | ||||
| COMMON STOCKS (continued) | |||||
| Retail (8.5%) | |||||
| Bed, Bath & Beyond, Inc. (b) | 73,200 | $ | 3,058,296 | ||
| Cabelas, Inc. (b) | 101,000 | 2,157,360 | |||
| Coach, Inc. (b) | 118,800 | 3,988,116 | |||
| Office Depot, Inc. (b) | 129,500 | 2,957,780 | |||
| Staples, Inc. | 189,150 | 4,032,678 | |||
| Williams Sonoma, Inc. (b) | 98,400 | 3,893,688 | |||
| 20,087,918 | |||||
| Schools (1.4%) | |||||
| Education Management Corp. (b) | 97,100 | 3,275,183 | |||
| Security & Commodity Exchanges (1.2%) | |||||
| Chicago Mercantile Exchange | 9,300 | 2,748,150 | |||
| Semiconductors (5.8%) | |||||
| KLA-Tencor Corp. | 76,900 | 3,360,530 | |||
| Marvel Technology Group Ltd. (b) | 126,100 | 4,796,844 | |||
| QLogic Corp. (b) | 69,400 | 2,142,378 | |||
| Sigmatel, Inc. (b) | 63,900 | 1,096,524 | |||
| Tessera Technologies, Inc. (b) | 68,501 | 2,288,618 | |||
| 13,684,894 | |||||
| Telecommunications (6.2%) | |||||
| Amdocs Ltd. (b) | 96,400 | 2,547,852 | |||
| Avid Technology, Inc. (b) | 48,700 | 2,594,736 | |||
| Comverse Technology, Inc. (b) | 123,300 | 2,916,045 | |||
| Flir Systems, Inc. (b) | 76,100 | 2,270,824 | |||
| Neustar, Inc. (b) | 74,900 | 1,917,440 | |||
| NII Holdings, Inc. (b) | 38,300 | 2,448,902 | |||
| 14,695,799 | |||||
| Transportation (2.5%) | |||||
| Knight Transportation, Inc. | 136,800 | 3,328,344 | |||
| Oshkosh Truck Corp. | 31,500 | 2,465,820 | |||
| 5,794,164 | |||||
| Waste Disposal (1.3%) | |||||
| Stericycle, Inc. (b) | 63,100 | 3,175,192 | |||
| Total Common Stocks | 234,759,771 | ||||
Shares or Principal Amount | Value | ||||||
| CASH EQUIVALENTS (1.2%) | |||||||
| Investments in repurchase agreements (Collateralized by AA Corporate Bonds, in a joint trading account at 3.34%, dated 06/30/05, due 07/01/05, repurchase price $2,770,346) | $ | 2,770,089 | $ | 2,770,089 | |||
| Total Cash Equivalents | 2,770,089 | ||||||
| SHORT-TERM SECURITIES HELD AS COLLATERAL FOR SECURITIES LENDING (19.9%) | |||||||
| Pool of short-term securities for Gartmore Variable Insurance Trust Funds — note 2 (Securities Lending) | 47,023,286 | 47,023,286 | |||||
| Total Short-term Securities Held as Collateral for Securities Lending | 47,023,286 | ||||||
| Total Investments (Cost $238,855,508) (a) — 120.7% | 284,553,146 | ||||||
| Liabilities in excess of other assets — (20.7%) | (48,791,818 | ) | |||||
| NET ASSETS — 100.0% | $ | 235,761,328 | |||||
| (a) | See notes to financial statements for tax unrealized appreciation (depreciation) of securities. |
| (b) | Denotes a non-income producing security. |
| ADR | American Depositary Receipt |
| FR | France |
See notes to financial statements.
6
Table of Contents
GARTMORE VARIABLE INSURANCE TRUST
GARTMORE GVIT MID CAP GROWTH FUND
Statement of Assets and Liabilities
June 30, 2005 (Unaudited)
Assets: | ||||
Investments, at value (cost $236,085,419) | $ | 281,783,057 | ||
Repurchase agreements, at cost and value | 2,770,089 | |||
Total Investments | 284,553,146 | |||
Interest and dividends receivable | 36,273 | |||
Receivable from adviser | 7,574 | |||
Prepaid expenses and other assets | 17,985 | |||
Total Assets | 284,614,978 | |||
Liabilities: | ||||
Payable for investments purchased | 1,647,800 | |||
Payable for return of collateral received for securities on loan | 47,023,286 | |||
Accrued expenses and other payables: | ||||
Investment advisory fees | 142,109 | |||
Fund administration and transfer agent fees | 7,075 | |||
Distribution fees | 3,234 | |||
Administrative servicing fees | 23,528 | |||
Other | 6,618 | |||
Total Liabilities | 48,853,650 | |||
Net Assets | $ | 235,761,328 | ||
Represented by: | ||||
Capital | $ | 329,391,085 | ||
Accumulated net investment income (loss) | (504,866 | ) | ||
Accumulated net realized gain (losses) from investments | (138,822,529 | ) | ||
Net unrealized appreciation (depreciation) | 45,697,638 | |||
Net Assets | $ | 235,761,328 | ||
Net Assets: | ||||
Class I Shares | $ | 125,283,699 | ||
Class II Shares | 16,296,326 | |||
Class III Shares | 1,147,298 | |||
Class IV Shares | 93,034,005 | |||
Total | $ | 235,761,328 | ||
Shares outstanding (unlimited number of shares authorized): | ||||
Class I Shares | 4,980,462 | |||
Class II Shares | 649,502 | |||
Class III Shares | 45,555 | |||
Class IV Shares | 3,695,845 | |||
Total | 9,371,364 | |||
Net asset value and offering price per share:* | ||||
Class I Shares | $ | 25.16 | ||
Class II Shares | $ | 25.09 | ||
Class III Shares | $ | 25.19 | ||
Class IV Shares | $ | 25.17 |
| * | Not subject to a front-end sales charge. |
For the Six Months Ended June 30, 2005 (Unaudited)
Investment Income: | ||||
Interest income | $ | 33,748 | ||
Dividend income | 537,396 | |||
Income from securities lending | 61,146 | |||
Total Income | 632,290 | |||
Expenses: | ||||
Investment advisory fees | 861,230 | |||
Fund administration and transfer agent fees | 75,919 | |||
Distribution fees Class II Shares | 18,308 | |||
Administrative servicing fees | 90,993 | |||
Administrative servicing fees | 821 | |||
Administrative servicing fees | 65,068 | |||
Other** | 42,591 | |||
Total expenses before waived or reimbursed expenses | 1,154,930 | |||
Expenses waived or reimbursed | (17,774 | ) | ||
Total Expenses | 1,137,156 | |||
Net Investment Income (Loss) | (504,866 | ) | ||
REALIZED/UNREALIZED GAINS (LOSSES) ON INVESTMENTS: | ||||
Net realized gains (losses) on investment transactions | 12,440,484 | |||
Net change in unrealized appreciation/depreciation on investments | (9,032,284 | ) | ||
Net realized/unrealized gains (losses) on investments | 3,408,200 | |||
CHANGE IN NET ASSETS RESULTING FROM OPERATIONS | $ | 2,903,334 | ||
| ** | Other expenses may include the following fees: audit, custody, insurance, legal, printing, trustee, and out-of-pocket expenses. |
See notes to financial statements.
7
Table of Contents
GARTMORE VARIABLE INSURANCE TRUST
GARTMORE GVIT MID CAP GROWTH FUND
Statement of Changes in Net Assets
| Six Months Ended June 30, 2005 | Year Ended December 31, 2004 | |||||||
| (Unaudited) | ||||||||
From Investment Activities: | ||||||||
Operations: | ||||||||
Net investment income (loss) | $ | (504,866 | ) | $ | (1,153,768 | ) | ||
Net realized gains (losses) on investment transactions | 12,440,484 | 25,538,903 | ||||||
Net change in unrealized appreciation/depreciation on investments | (9,032,284 | ) | 8,966,217 | |||||
Change in net assets resulting from operations | 2,903,334 | 33,351,352 | ||||||
Change in net assets from capital transactions | (27,765,374 | ) | (2,995,098 | ) | ||||
Change in net assets | (24,862,040 | ) | 30,356,254 | |||||
Net Assets: | ||||||||
Beginning of period | 260,623,368 | 230,267,114 | ||||||
End of period | $ | 235,761,328 | $ | 260,623,368 | ||||
CAPITAL TRANSACTIONS: | ||||||||
Class I Shares | ||||||||
Proceeds from shares issued | $ | 12,853,657 | $ | 38,341,745 | ||||
Cost of shares redeemed | (38,018,062 | ) | (45,510,061 | ) | ||||
| (25,164,405 | ) | (7,168,316 | ) | |||||
Class II Shares | ||||||||
Proceeds from shares issued | 4,882,247 | 13,422,296 | ||||||
Cost of shares redeemed | (3,173,453 | ) | (3,215,596 | ) | ||||
| 1,708,794 | 10,206,700 | |||||||
Class III Shares | ||||||||
Proceeds from shares issued | 413,594 | 1,498,724 | ||||||
Cost of shares redeemed | (468,480 | ) | (1,085,441 | ) | ||||
| (54,886 | ) | 413,283 | ||||||
Class IV Shares | ||||||||
Proceeds from shares issued | 2,305,809 | 7,463,201 | ||||||
Cost of shares redeemed | (6,560,686 | ) | (13,909,966 | ) | ||||
| (4,254,877 | ) | (6,446,765 | ) | |||||
Change in net assets from capital transactions | $ | (27,765,374 | ) | $ | (2,995,098 | ) | ||
SHARE TRANSACTIONS: | ||||||||
Class I Shares | ||||||||
Issued | 532,033 | 1,698,608 | ||||||
Redeemed | (1,587,286 | ) | (2,087,533 | ) | ||||
| (1,055,253 | ) | (388,925 | ) | |||||
Class II Shares | ||||||||
Issued | 204,053 | 610,830 | ||||||
Redeemed | (131,968 | ) | (144,863 | ) | ||||
| 72,085 | 465,967 | |||||||
Class III Shares | ||||||||
Issued | 17,060 | 68,618 | ||||||
Redeemed | (19,533 | ) | (49,838 | ) | ||||
| (2,473 | ) | 18,780 | ||||||
Class IV Shares | ||||||||
Issued | 95,536 | 340,335 | ||||||
Redeemed | (272,246 | ) | (634,507 | ) | ||||
| (176,710 | ) | (294,172 | ) | |||||
See notes to financial statements.
8
Table of Contents
GARTMORE VARIABLE INSURANCE TRUST
FINANCIAL HIGHLIGHTS
Selected Data for Each Share of Capital Outstanding
Gartmore GVIT Mid Cap Growth Fund
| Investment Activities | Distributions | Ratios/Supplemental Data | ||||||||||||||||||||||||||||||||||||||||||
| Net Asset Value, Beginning of Period | Net Investment Income (Loss) | Net Realized and Unrealized Gains (Losses) on Investments | Total from Investment Activities | Net Investment Income | Net Realized Gains | Total Distributions | Net Asset Value, End of Period | Total Return | Net Assets at End of Period (000s) | Ratio of Expenses to Average Net Assets | Ratio of Net Investment Income (Loss) to Average Net Assets | Ratio of Expenses (Prior to Reimbursements) to Average Net Assets(a) | Ratio of Net Investment Income (Loss) (Prior to Reimbursements) to Average Net Assets(a) | Portfolio Turnover(b) | ||||||||||||||||||||||||||||||
Class I Shares | ||||||||||||||||||||||||||||||||||||||||||||
Period Ended December 31, 2003(c) | $ | 16.53 | (0.07 | ) | 4.99 | 4.92 | — | — | — | $ | 21.45 | 29.76% | (e) | $ | 137,837 | 0.98% | (f) | (0.49% | )(f) | (g | ) | (g | ) | 109.73% | ||||||||||||||||||||
Year Ended December 31, 2004 | $ | 21.45 | (0.11 | ) | 3.40 | 3.29 | — | — | — | $ | 24.74 | 15.34% | $ | 149,324 | 0.98% | (0.51% | ) | (g | ) | (g | ) | 90.14% | ||||||||||||||||||||||
Six Months Ended June 30, 2005 (Unaudited) | $ | 24.74 | (0.06 | ) | 0.48 | 0.42 | — | — | — | $ | 25.16 | 1.70% | (e) | $ | 125,284 | 0.99% | (f) | (0.44% | )(f) | (g | ) | (g | ) | 27.36% | ||||||||||||||||||||
Class II Shares | ||||||||||||||||||||||||||||||||||||||||||||
Period Ended December 31, 2003(c) | $ | 16.77 | (0.03 | ) | 4.69 | 4.66 | — | — | — | $ | 21.43 | 27.79% | (e) | $ | 2,388 | 1.17% | (f) | (0.64% | )(f) | (g | ) | (g | ) | 109.73% | ||||||||||||||||||||
Year Ended December 31, 2004 | $ | 21.43 | (0.09 | ) | 3.35 | 3.26 | — | — | — | $ | 24.69 | 15.21% | $ | 14,256 | 1.08% | (0.61% | ) | (g | ) | (g | ) | 90.14% | ||||||||||||||||||||||
Six Months Ended June 30, 2005 (Unaudited) | $ | 24.69 | (0.06 | ) | 0.46 | 0.40 | — | — | — | $ | 25.09 | 1.62% | (e) | $ | 16,296 | 1.10% | (f) | (0.55% | )(f) | (g | ) | (g | ) | 27.36% | ||||||||||||||||||||
Class III Shares | ||||||||||||||||||||||||||||||||||||||||||||
Period Ended December 31, 2003(c) | $ | 16.53 | (0.03 | ) | 4.98 | 4.95 | — | — | — | $ | 21.48 | 29.95% | (e) | $ | 628 | 0.98% | (f) | (0.48% | )(f) | (g | ) | (g | ) | 109.73% | ||||||||||||||||||||
Year Ended December 31, 2004 | $ | 21.48 | (0.10 | ) | 3.39 | 3.29 | — | — | — | $ | 24.77 | 15.32% | $ | 1,190 | 0.98% | (0.50% | ) | (g | ) | (g | ) | 90.14% | ||||||||||||||||||||||
Six Months Ended June 30, 2005 (Unaudited) | $ | 24.77 | (0.05 | ) | 0.47 | 0.42 | — | — | — | $ | 25.19 | 1.70% | (e) | $ | 1,147 | 0.99% | (f) | (0.45% | )(f) | (g | ) | (g | ) | 27.36% | ||||||||||||||||||||
Class IV Shares(d) | ||||||||||||||||||||||||||||||||||||||||||||
Year Ended December 31, 2000 | $ | 21.97 | 0.18 | 7.48 | 7.66 | (0.11 | ) | (1.81 | ) | (1.92 | ) | $ | 27.71 | 38.24% | $ | 98,969 | 0.53% | 0.81% | 0.53% | 0.81% | 68.00% | |||||||||||||||||||||||
Year Ended December 31, 2001 | $ | 27.71 | (0.07 | ) | (1.00 | ) | (1.07 | ) | (0.18 | ) | (6.45 | ) | (6.63 | ) | $ | 20.01 | (3.36% | ) | $ | 98,214 | 0.92% | (0.37% | ) | 1.01% | (0.46% | ) | 135.00% | |||||||||||||||||
Year Ended December 31, 2002 | $ | 20.01 | (0.11 | ) | (4.35 | ) | (4.46 | ) | — | (0.09 | ) | (0.09 | ) | $ | 15.46 | (22.38% | ) | $ | 70,669 | 0.95% | (0.61% | ) | 1.00% | (0.66% | ) | 64.00% | ||||||||||||||||||
Year Ended December 31, 2003 | $ | 15.46 | (0.10 | ) | 6.10 | 6.00 | — | — | — | $ | 21.46 | 38.81% | $ | 89,413 | 0.95% | (0.51% | ) | 1.02% | (0.58% | ) | 109.73% | |||||||||||||||||||||||
Year Ended December 31, 2004 | $ | 21.46 | (0.11 | ) | 3.40 | 3.29 | — | — | — | $ | 24.75 | 15.33% | $ | 95,854 | 0.95% | (0.48% | ) | 0.98% | (0.51% | ) | 90.14% | |||||||||||||||||||||||
Six Months Ended June 30, 2005 (Unaudited) | $ | 24.75 | (0.05 | ) | 0.47 | 0.42 | — | — | — | $ | 25.17 | 1.70% | (e) | $ | 93,034 | 0.95% | (f) | (0.41% | )(f) | 0.99% | (f) | (0.45% | )(f) | 27.36% | ||||||||||||||||||||
| (a) | During the period certain fees were waived and/or reimbursed. If such waivers/reimbursements had not occurred, the ratios would have been as indicated. |
| (b) | Portfolio turnover is calculated on the basis of the Fund as a whole without distinguishing among the classes of shares. |
| (c) | For the period from April 28, 2003 (commencement of operations) through December 31, 2003. |
| (d) | The Gartmore Mid Cap Growth Fund retained the financial history of the Market Street Mid Cap Growth Fund and the existing shares of the Fund were designated Class IV shares. |
| (e) | Not annualized. |
| (f) | Annualized. |
| (g) | There were no fee reductions during the period. |
See notes to financial statements.
9
Table of Contents
GARTMORE VARIABLE INSURANCE TRUST
NOTES TO FINANCIAL STATEMENTS (Unaudited)
June 30, 2005
1. Organization
Gartmore Variable Insurance Trust (“GVIT” or the “Trust”) is an open-end management investment company, organized under the laws of Delaware by an amended and restated Agreement and Declaration of Trust, dated October 28, 2004, as amended to date. The Trust, originally created under the laws of Massachusetts as a Massachusetts business trust pursuant to a Declaration of Trust dated, as of June 30, 1981, was subsequently amended, redomesticated as a Delaware Statutory Trust after the close of trading on April 29, 2005, and is registered under the Investment Company Act of 1940, as amended (the “1940 Act”). The redomestication is a change in statutory status and does not affect the operations of the Trust. As of June 30, 2005, the Trust had authorized an unlimited number of shares of beneficial interest (“shares”) without par value. The Trust currently offers shares to life insurance company separate accounts to fund the benefits under variable life insurance or annuity policies. To date, only the separate accounts of Nationwide Life Insurance Company and Nationwide Life and Annuity Insurance Company (collectively, “Nationwide”) have purchased shares of the Trust’s series. The Trust operates thirty-one (31) separate series, or mutual funds, each with its own investment objectives and strategies. This report contains the financial statements and financial highlights of the Gartmore GVIT Mid Cap Growth Fund (the “Fund”).
Under the Trust’s organizational documents, the Trust’s officers and trustees are indemnified against certain liabilities arising out of the performance of their duties to the Trust. In addition, the Trust has entered into Indemnification Agreements with the Trust’s trustees and certain officers covering similar liabilities. In addition, in the normal course of business, the Trust enters into contracts with its vendors and others that provide for general indemnifications. The Trust’s maximum exposure under these arrangements is unknown, as this would involve future claims that may be made against the Trust. Based on experience, however, the Trust expects that risk of loss to be remote.
2. Summary of Significant Accounting Policies
The following is a summary of significant accounting policies followed by the Fund in the preparation of its financial statements. The policies are in conformity with accounting principles generally accepted in the United States of America (“GAAP”). The preparation of financial statements requires management to make estimates and assumptions that affect the reported amounts of assets and liabilities, the disclosure of contingent assets and liabilities at the date of the financial statements and the reported amounts of income and expenses for the period. Actual results could differ from those estimates.
| (a) | Security Valuation |
Securities for which market quotations are readily available are valued at current market value as of “Valuation Time.” Valuation Time is as of the close of regular trading on the New York Stock Exchange (usually 4 p.m. Eastern time). Equity securities are valued at the last quoted sale price or, if there is no sale price, the last quoted bid price provided by an independent pricing service approved by the Trust’s Board of Trustees. Securities traded on NASDAQ are valued at the NASDAQ official closing price. Prices are taken from the primary market or exchange in which each security trades. Most securities listed on a foreign exchange are valued either at fair value (see description below) or at the last sale price at the close of the exchange on which the security is principally traded. Foreign securities, currencies, and other assets and liabilities denominated in foreign currencies are translated into U.S. dollars at the exchange rate of said currencies against the U.S. Dollar, as of Valuation Time, as provided by an independent pricing service approved by the Board of Trustees.
Securities for which market quotations are not readily available, or for which an independent pricing service does not provide a value or provides a value that does not represent fair value in the judgment of the Fund’s investment adviser or designee, are valued at fair value under procedures approved by the Trust’s Board of Trustees. The “Fair Value” of these securities is determined in good faith by taking into account relevant factors and surrounding circumstances. Methods utilized to obtain a “Fair Value” may include the following non-exclusive list of SEC acceptable methods: (i) a multiple of earnings; (ii) the discount from market value of a similar, freely traded security; (iii) the yield-to-maturity for debt issues; or (iv) a consolidation of the methods. The Gartmore Fair Value Committee considers a non-exclusive list of factors to arrive at the appropriate method upon determining “Fair Value.” For example, fair value determinations are required for securities whose value is affected by a “significant” event that materially affects the value of a domestic or foreign security which occurs subsequent to the time of the close of the principal market on which such domestic or foreign security trades and before the
10
Table of Contents
GARTMORE VARIABLE INSURANCE TRUST
NOTES TO FINANCIAL STATEMENTS (Unaudited) (Continued)
June 30, 2005
Valuation Time (i.e., a “subsequent event”). Typically, this will involve events occurring after the close of a foreign market on which a security trades and before the next Valuation Time.
| (b) | Repurchase Agreements |
The Fund may enter into repurchase agreements with an entity which is a member of the Federal Reserve System or which is a “primary dealer” (as designated by the Federal Reserve Bank of New York) in U.S. Government obligations. The repurchase price generally equals the price paid by the Fund plus interest negotiated on the basis of current short-term rates, which may be more or less than the rate on the underlying portfolio securities. The seller under a repurchase agreement is required to maintain the value of the collateral held pursuant to the agreement at a market value equal to or greater than the repurchase price (including accrued interest). Collateral subject to repurchase agreements is held by the Fund’s custodian or another qualified sub-custodian or in the Federal Reserve/Treasury book-entry system. If the counterparty defaults and the fair value of the collateral declines, realization of the collateral by the Fund may be delayed or limited. The Fund may transfer uninvested cash balances into a pooled cash account. These balances are invested in one or more repurchase agreements, which are fully collateralized by AA-rated Corporate Bonds with the counterparties of CS First Boston and Nomura Securities.
| (c) | Foreign Currency Transactions |
The accounting records of the Fund are maintained in U.S. dollars. Foreign currency amounts are translated into U.S. dollars at the current rate of exchange to determine the value of investments, assets and liabilities. The Fund may enter into foreign currency contracts in connection with purchases or sales of securities denominated in a foreign currency. Purchases and sales of securities, and income and expenses, are translated at the prevailing rate of exchange on the respective date of these transactions. The Fund does not isolate that portion of the results of operations resulting from changes in foreign exchange rates on investments from fluctuations arising from changes in market prices of securities held. These fluctuations are included with the net realized and unrealized gain or loss from investments and foreign currencies.
| (d) | Risks Associated with Foreign Securities and Currencies |
Investments in securities of foreign issuers carry certain risks not ordinarily associated with investments in securities of U.S. issuers. These risks include future political and economic developments, and the possible imposition of exchange controls or other foreign governmental laws and restrictions. In addition, with respect to certain countries, there is the possibility of expropriation of assets, confiscatory taxation, political or social instability, or diplomatic developments, which could adversely affect investments in those countries.
Certain countries also may impose substantial restrictions on investments in their capital markets by foreign entities, including restrictions on investments in issuers of industries deemed sensitive to relevant national interests. These factors may limit the investment opportunities available and result in a lack of liquidity and high price volatility with respect to securities of issuers from developing counties.
| (e) | Futures Contracts |
The Fund may invest in financial futures contracts (“futures contracts”) for the purpose of hedging its existing portfolio securities or securities that the Fund intends to purchase against fluctuations in value caused by changes in prevailing market interest rates or prices. Futures contracts may also be entered into for non-hedging purposes.
Upon entering into a futures contract, the Fund is required to pledge to the broker an amount of cash and/or other assets equal to a certain percentage of the contract amount (initial margin deposit). Subsequent payments, known as “variation margin,” are made each day, depending on the daily fluctuations in the fair value/market value of the underlying assets. A gain or loss equal to the daily variation margin is recognized on a daily basis. Futures contracts are valued daily at their last quoted sale price.
11
Table of Contents
GARTMORE VARIABLE INSURANCE TRUST
NOTES TO FINANCIAL STATEMENTS (Unaudited) (Continued)
June 30, 2005
A “sale” of a futures contract means a contractual obligation to deliver the securities or foreign currency called for by the contract at a fixed price at a specified time in the future. A “purchase” of a futures contract means a contractual obligation to acquire the securities or foreign currency at a fixed price at a specified time in the future.
Should market conditions change unexpectedly, the Fund may not achieve the anticipated benefits of the futures contracts and may realize a loss. The use of futures transactions for hedging purposes involves the risk of imperfect correlation in movements in the price of futures contracts, interest rates, and the value of the underlying hedged assets.
| (f) | Written Options Contracts |
The Fund may write options contracts. A written option obligates the Fund to deliver (written call) or to receive (written put) a specified quantity of an underlying asset at the contract amount upon exercise by the holder of the option. The value of the option contract is recorded as a liability and unrealized gain or loss is measured by the difference between the current value and the premium received. Options traded on an exchange are valued at the last quoted sale price, or in the absence of a sale, the bid price provided by an independent pricing service approved by the Board of Trustees. Non-exchange traded options are valued using dealer supplied quotes.
| (g) | Short Sales |
The Fund is authorized to engage in short-selling of portfolio securities which obligates the Fund to replace any security that the Fund has borrowed by purchasing the security at current market value sometime in the future. The Fund will incur a loss if the price of the security increases between the date of the short sale and the date on which the Fund replaces the borrowed security. The Fund generally will realize a gain if the price of the security declines between these dates. Until the Fund replaces the borrowed security, the Fund will maintain a segregated account with cash, U.S. Government securities and/or securities held long to sufficiently cover the Fund’s short position on a daily basis. Dividends declared on securities sold short are recorded as an expense on the ex-dividend date and paid to the counterparty on the dividend pay date. The collateral for securities sold short are recorded as an expense on the ex-dividend date and paid to the counterparty on the dividend pay date. The collateral for securities sold short includes the deposits with brokers and securities held long as shown in the Statement of Investments for the Fund.
| (h) | Security Transactions and Investment Income |
Security transactions are accounted for on the date the security is purchased or sold (“trade date”). Securities gains and losses are calculated on the identified cost basis. Interest income is recognized on the accrual basis and includes, where applicable, the amortization or accretion of premium or discount. Dividend income is recorded on the ex-dividend date.
| (i) | Securities Lending |
To generate additional income, the Fund may lend up to 33 1/3% of the Fund’s total assets pursuant to agreements, requiring that the borrower deliver cash or securities as collateral with respect to each new loan of U.S. securities, equal to at least 102% of the value of the portfolio securities loaned, and with respect to each new loan of non-U.S. securities, collateral of at least 105% of the value of the portfolio securities loaned, and thereafter requiring the borrower to mark to market the collateral on a daily basis and requiring the borrower to make up any shortfall of collateral. The Fund receives payments from borrowers equivalent to the dividends and interest that would have been earned on securities lent while simultaneously seeking to earn income on the investment of cash collateral. Collateral is marked to market daily to provide a level of collateral at least equal to the market value of securities loaned. There may be risks of delay in recovery of the securities should the borrower of the securities fail financially. Loans will be made, however, only to borrowers deemed by the Fund’s investment adviser to be of good standing and creditworthy under guidelines established by the Board of Trustees and when, in the judgment of the adviser, the consideration which can be earned currently from these securities loans justifies the attendant risks. Loans are subject to termination by the Fund or the borrower at any time, and, therefore, are not considered to be illiquid investments. JPMorgan Chase Bank serves as custodian for the securities lending program of the Fund. JPMorgan Chase Bank receives a custody fee based on the value of collateral received from borrowers.
12
Table of Contents
GARTMORE VARIABLE INSURANCE TRUST
NOTES TO FINANCIAL STATEMENTS (Unaudited) (Continued)
June 30, 2005
The cash collateral received by the Fund was pooled and, at June 30, 2005, was invested in the following:
Security Type | Security Name | Market Value | Maturity Rate | Maturity Date | |||||
| Commercial Paper | MacQuarie Bank Ltd. | $ | 2,996,208 | 3.25% | 07/01/05 | ||||
| Funding Agreement | Protective Life Insurance Company | 10,000,000 | 3.31% | 07/29/05 | |||||
| Medium Term Note — Floating | Deutsche Bank Financial | 3,000,000 | 3.57% | 07/01/05 | |||||
| Medium Term Note — Floating | General Electric Capital Corp. | 2,000,342 | 3.37% | 09/08/05 | |||||
| Medium Term Note — Floating | Northern Rock PLC | 14,000,000 | 3.41% | 09/09/05 | |||||
| Repurchase Agreements | Nomura Securities | 15,070,477 | 3.48% | 07/01/05 | |||||
As of June 30, 2005, the Fund had securities with the following market values on loan:
| Market Value of Loaned Securities | Market Value of Collateral | |||||
| $ | 45,875,262 | $ | 47,023,286 | |||
| (j) | Distributions to Shareholders |
The Fund’s dividends from net investment income, if any, are declared and paid quarterly. The Fund’s distributable net realized capital gains, if any, are declared and distributed at least annually.
Dividends and distributions to shareholders are determined in accordance with federal income tax regulations, which may differ from GAAP. These “book/tax” differences are considered either permanent or temporary in nature. In accordance with the American Institute of Certified Public Accountants (“AICPA”) Statement of Position 93-2, permanent differences (i.e., reclassification of market discounts, gain/loss, paydowns, and distributions) are reclassified within the capital accounts based on their nature for federal income tax purposes; temporary differences do not require reclassification. These reclassifications have no effect upon the net asset value of the Fund. To the extent distributions exceed current and accumulated earnings and profits for federal income tax purposes, these distributions are reported as distributions of paid-in-capital.
| (k) | Federal Income Taxes |
It is the policy of the Fund to qualify or continue to qualify as a “regulated investment company” by complying with the provisions available to certain investment companies, as defined in applicable sections of the U.S. Internal Revenue Code, and to make distributions of net investment income and net realized capital gains sufficient to relieve the Fund from all, or substantially all, federal income taxes.
As of June 30, 2005, the tax cost of securities and the breakdown of unrealized appreciation (depreciation) for the Fund is as follows:
Tax Cost | Unrealized Appreciation | Unrealized Depreciation | Net Unrealized Appreciation (Depreciation) | |||||||
$362,393 | $ | 49,872,450 | $ | (4,537,205 | ) | $ | 45,335,245 | |||
| (l) | Allocation of Expenses, Income, and Gains and Losses |
Expenses directly attributable to the Fund are charged to the Fund. Expenses not directly attributable to the Fund are allocated proportionately among various or all funds within the Trust. The method used by the Fund for allocating income, fund level expenses, and realized and unrealized gains or losses is based on the fair value of shares outstanding relative to net assets. Under this method, each class of shares participates based on the total net asset value of that class’s shares in proportion to the total net assets of the Fund. Expenses specific to a class (such as rule 12b-1 and administrative services fees) are charged to that class.
3. Transactions with Affiliates
Under the terms of the Trust’s Investment Advisory Agreement, Gartmore Mutual Fund Capital Trust (“GMF”) manages the investment of the assets and supervises the daily business affairs of the Fund. GMF is a wholly-owned subsidiary of
13
Table of Contents
GARTMORE VARIABLE INSURANCE TRUST
NOTES TO FINANCIAL STATEMENTS (Unaudited) (Continued)
June 30, 2005
Gartmore Global Investments, Inc. (“GGI”), a holding company. GGI is a majority-owned subsidiary of Gartmore Global Asset Management Trust (“GMF”). GMF is a wholly-owned subsidiary of Nationwide Corporation. All of the common stock of Nationwide Corporation is held by Nationwide Mutual Insurance Company (95.2%) and Nationwide Mutual Fire Insurance Company (4.8%), each of which is a mutual company owned by its policyholders.
Under the terms of the Investment Advisory Agreement, the Fund pays GMF an investment advisory fee based on the Fund’s average daily net assets and the following schedule:
| Fee Schedule | Fees | |
Up to $200 million | 0.75% | |
$200 million or more | 0.70% |
Effective May 1, 2005, GMF and the Fund have entered into a written contract (“Expense Limitation Agreement”) limiting operating expenses from exceeding 0.95% for Class IV Shares until at least May 1, 2006.
GMF may request and receive reimbursement from the Fund of the advisory fees waived and other expenses reimbursed by GMF, respectively, pursuant to the Expense Limitation Agreement at a later date not to exceed three years from the fiscal year in which the corresponding reimbursement to the Fund was made, depending on the Fund (as described below), if the Fund has reached a sufficient asset size to permit reimbursement to be made without causing the total annual operating expense ratio of the Fund to exceed the limits set forth above. No reimbursement will be made unless: (i) the Fund’s assets exceed $100 million; (ii) the total annual expense ratio of the Class making such reimbursement is less than the limit set forth above; and (iii) the payment of such reimbursement is approved by the Board of Trustees on a quarterly basis. Except as provided for in the Expense Limitation Agreements, reimbursement of amounts previously waived or assumed by GMF is not permitted.
As of the six months ended June 30, 2005, the cumulative potential reimbursements for the Class IV shares of the Fund, based on reimbursements which expires within three years from the fiscal year in which the corresponding reimbursement to the Fund was made for expenses reimbursed by GMF would be:
Amount | Amount Fiscal Year 2004 | Amount Six Months Ended April 30, 2005 | ||||
$56,667 | $ | 26,956 | $ | 17,774 | ||
Under the terms of a Fund Administration and Transfer Agency Agreement, Gartmore SA Capital Trust (“GSA”) provides the Fund with various administrative and accounting services, and Gartmore Investors Services, Inc. (“GISI”), an indirect subsidiary of GSA, serves as Transfer and Dividend Disbursing Agent for the Fund. The fees for the services provided under this Agreement are calculated based on the Trust’s average daily net assets according to the fee schedule below. The fees are then allocated proportionately among all funds within the Trust in relation to the average daily net assets of each fund and are paid to GSA. GSA pays GISI from these fees for its services.
| Combined Fee Schedule* | ||
Up to $1 billion | 0.13% | |
$1 billion and more up to $3 billion | 0.08% | |
$3 billion and more up to $8 billion | 0.05% | |
$8 billion and more up to $10 billion | 0.04% | |
$10 billion and more up to $12 billion | 0.02% | |
$12 billion or more | 0.01% | |
| * | The assets of the Gartmore GVIT Investor Destinations Aggressive Fund, the Gartmore GVIT Investor Destinations Moderately Aggressive Fund, the Gartmore GVIT Investor Destinations Moderate Fund, the Gartmore GVIT Investor Destinations Moderately Conservative Fund, and the Gartmore GVIT Investor Destinations Conservative Fund (collectively, the “Investor Destinations Funds”) are excluded from the Trust asset level amount in order to calculate this asset-based fee. The Investor Destinations Funds do not pay any part of this fee. |
14
Table of Contents
GARTMORE VARIABLE INSURANCE TRUST
NOTES TO FINANCIAL STATEMENTS (Unaudited) (Continued)
June 30, 2005
Effective January 1, 2005, the fee for the fund administration and transfer agency services increased as set forth below. The fees are calculated based on the Trust’s average daily net assets according to the fee schedule below. The fees are then allocated proportionately among all funds within the Trust in relation to the average daily net assets of each fund and are paid to GSA.
| Combined Fee Schedule* | ||
Up to $1 billion | 0.15% | |
$1 billion and more up to $3 billion | 0.10% | |
$3 billion and more up to $8 billion | 0.05% | |
$8 billion and more up to $10 billion | 0.04% | |
$10 billion and more up to $12 billion | 0.02% | |
$12 billion or more | 0.01% | |
| * | The assets of each of the Investor Destinations Funds are excluded from the Trust asset level amount in order to calculate this asset-based fee. The Investor Destinations Funds do not pay any part of this fee. |
GSA and GISI have entered into agreements with BISYS Fund Services Ohio, Inc. (“BISYS”), pursuant to which BISYS provides sub-administration and sub-transfer agency services, respectively, to the Fund.
Under the terms of a Distribution Plan under Rule 12b-1 of the 1940 Act, Gartmore Distribution Services, Inc. (“GDSI”), the Fund’s Distributor, is compensated by the Fund for expenses associated with the distribution of the Class II of the Fund. These fees are based on average daily net assets of Class II shares of the Fund at an annual rate not to exceed 0.25%.
Under the terms of an Administrative Services Plan, the Fund may pay fees to servicing organizations, such as broker-dealers, including Nationwide Financial Services, and financial institutions, which agree to provide administrative support services to the shareholders of certain classes. These services include, but are not limited, to the following: establishing and maintaining shareholder accounts; processing purchase and redemption transactions; arranging bank wires; performing shareholder sub-accounting; answering inquires regarding the Fund; and other such services. These fees are based on an annual rate of up to 0.25% of the average daily net assets of the Class I, Class II, and Class II shares of the Fund and of Class IV shares of the Fund.
4. Short-Term Trading Fees
The Fund reserves the right to assess a short-term trading fee on certain transactions out of Class III shares that a separate account makes on behalf of a variable insurance contract owner (the “contract owner”). A separate account that redeems Class III shares on behalf of a contract owner may be subject to a 1.00% short-term trading fee if the separate account held the Class III shares on behalf of the contract owner for 60 days or less, unless an exception applies as disclosed in the prospectus. The short-term trading fee is paid directly to the Fund and is intended to offset the cost to the Fund of excess brokerage commissions and other costs associated with fluctuations in fund asset levels and cash flow caused by short-term trading. For purposes of determining whether the short-term trading fee applies, the Class III shares that were held on behalf of the contract owner the longest will be treated as being redeemed first.
For the six months ended June 30, 2005, the Fund had no contributions to capital due to collection of redemption fees.
5. Investment Transactions
For the six months ended June 30, 2005, (excluding short-term securities) the Fund had purchases of $64,308,463 and sales of $91,472,852.
6. Bank Loans
The Trust has a credit agreement of $100,000,000. Borrowings under this arrangement bear interest at the Federal Funds rate plus 0.50%. The interest costs are included in custodian fees in the Statement of Operations. No compensation balances were required under the terms of the line of credit. There were no borrowings outstanding as of June 30, 2005.
15
Table of Contents
GARTMORE VARIABLE INSURANCE TRUST
NOTES TO FINANCIAL STATEMENTS (Unaudited) (Continued)
June 30, 2005
7. Shareholder Meeting
A separate shareholders meeting was held on Tuesday, December 23, 2004, for the shareholders of the Trust’s predecessor pursuant to a Proxy Statement On Schedule 14A, dated October 29, 2004, and mailed to the shareholders of the Trust’s predecessor on or around November 5, 2004.
Two Proposals: The purpose of the December 23, 2004 meeting was to allow the shareholders of the Trust’s predecessor to vote on:
| i. | Proposal One: The election of the Trust’s Board of Trustees; and |
| ii. | Proposal Two: The approval of an “Agreement and Plan of Reorganization” that provided for the reorganization of the Trust from a Massachusetts business trust into a Delaware statutory trust. |
Proposal One: As set forth in the October 29, 2004 Proxy Statement, the nominees for election as Trustees of the Trust’s predecessor were: Charles E. Allen, Michael J. Baresich, Paula H.J. Cholmondeley, C. Brent DeVore, Phyllis Kay Dryden, Robert M. Duncan, Barbara L. Hennigar, Paul J. Hondros, Barbara I Jacobs, Thomas J. Kerr IV, Douglas F. Kridler, Michael D. McCarthy, Arden L. Shisler, and David C. Wetmore.
Proposal Two: As specifically set forth in the October 29, 2004 Proxy Statement, the Reorganization proposal requested the shareholders of the Trust’s predecessor to approve the proposed “Agreement and Plan of Reorganization” of the Trust’s predecessor (on behalf of each of the its funds) into a new Delaware-domiciled Trust, whereby the Funds of the new Delaware Trust would acquire all of the assets of the corresponding funds of the Trust’s predecessor subject to the liabilities, expenses, costs, charges, and reserves of the corresponding funds of the Trust’s predecessor (contingent or otherwise), in exchange for shares of the acquiring Funds to be distributed pro rata by the Trust to the holders of the shares of the funds of the Trust’s predecessor, in a complete liquidation of the Trust’s predecessor.
| Voting | Results: |
The shareholders of the Trust’s predecessor voted to approve both Proposal One and Proposal Two, as follows:
Proposal 1: Election of a Board of Trustees of Gartmore Variable Insurance Trust
Charles E. Allen: | ||
FOR | 2,797,230,318.955 shares (96.078%) | |
WITHHOLD | 114,195,693.660 shares (3.922%) | |
TOTAL | 2,912,726,012.615 shares (100.000%) | |
Michael J. Baresich: | ||
FOR | 2,796,135,979.559 shares (96.040%) | |
WITHHOLD | 115,290,033.056 shares (3.960%) | |
TOTAL | 2,912,726,012.615 shares (100.000%) | |
Paula H.J. Cholmondeley: | ||
FOR | 2,795,095,945.396 shares (96.004%) | |
WITHHOLD | 116,330,067.219 shares (3.996%) | |
TOTAL | 2,912,726,012.615 shares (100.000%) | |
16
Table of Contents
GARTMORE VARIABLE INSURANCE TRUST
NOTES TO FINANCIAL STATEMENTS (Unaudited) (Continued)
June 30, 2005
C. Brent DeVore: | ||
FOR | 2,797,207,046.916 shares (96.077%) | |
WITHHOLD | 114,218,965.699 shares (3.923%) | |
TOTAL | 2,912,726,012.615 shares (100.000%) | |
Phyllis Kay Dryden: | ||
FOR | 2,795,587,023.994 shares (96.021%) | |
WITHHOLD | 115,838,988.621 shares (3.979%) | |
TOTAL | 2,912,726,012.615 shares (100.000%) | |
Robert M. Duncan: | ||
FOR | 2,790,191,720.503 shares (95.836%) | |
WITHHOLD | 121,234,292.112 shares (4.164%) | |
TOTAL | 2,912,726,012.615 shares (100.000%) | |
Barbara L. Hennigar: | ||
FOR | 2,792,939,848.858 shares (95.937%) | |
WITHHOLD | 118,486,163.757 shares (4.070%) | |
TOTAL | 2,912,726,012.615 shares (100.000%) | |
Paul J. Hondros: | ||
FOR | 2,797,557,404.448 shares (96.089%) | |
WITHHOLD | 113,868,608.167 shares (3.911%) | |
TOTAL | 2,912,726,012.615 shares (100.000%) | |
Barbara I. Jacobs: | ||
FOR | 2,796,306,126.654 shares (96.046%) | |
WITHHOLD | 115,119,885.961 shares (3.954%) | |
TOTAL | 2,912,726,012.615 shares (100.000%) | |
Thomas J. Kerr IV: | ||
FOR | 2,789,755,720.087 shares (95.821%) | |
WITHHOLD | 121,670,292.528 shares (4.179%) | |
TOTAL | 2,912,726,012.615 shares (100.000%) | |
Douglas F. Kridler: | ||
FOR | 2,798,065,774.375 shares (96.106%) | |
WITHHOLD | 113,360,238.240 shares (3.894%) | |
TOTAL | 2,912,726,012.615 shares (100.000%) | |
Michael D. McCarthy: | ||
FOR | 2,797,452,613.694 shares (96.085%) | |
WITHHOLD | 113,973,395.921 shares (3.915%) | |
TOTAL | 2,912,726,012.615 shares (100.000%) | |
17
Table of Contents
GARTMORE VARIABLE INSURANCE TRUST
NOTES TO FINANCIAL STATEMENTS (Unaudited) (Continued)
June 30, 2005
Arden L. Shisler: | ||
FOR | 2,796,738,454.730 shares (96.061%) | |
WITHHOLD | 114,687,557.885 shares (3.939%) | |
TOTAL | 2,912,726,012.615 shares (100.000%) | |
David C. Wetmore: | ||
FOR | 2,794,784,752.247 shares (95.994%) | |
WITHHOLD | 116,641,260.368 shares (4.006%) | |
TOTAL | 2,912,726,012.615 shares (100.000%) | |
Proposal 2: Approval of the Agreement and Plan of Reorganization of Gartmore Variable Insurance Trust
FOR | 2,561,003,822.546 shares (87.964%) | |
AGAINST | 103,593,261.010 shares (3.558%) | |
ABSTAIN | 246,828,929.059 shares (8.478%) | |
TOTAL | 2,912,726,012.615 shares (100.000%) | |
18
Table of Contents
GARTMORE VARIABLE INSURANCE TRUST
Management Information (Unaudited)
June 30, 2005
Trustees who are not Interested Persons (as defined in the 1940 Act) and Officers of the Funds June 30, 2005
| Name, Address and Date of Birth | Position(s) Held with the Trust and Length of Time Served1 | Principal Occupation(s) During Past 5 Years | Number of Portfolios in the Gartmore Fund Complex Overseen by Trustee | Other Directorships Held by Trustee or Nominee2 | ||||
Charles E. Allen
c/o Gartmore Global Investments, Inc. 1200 River Road, Suite 1000 Conshohocken, PA 19428
1948 | Trustee since July 2000 | Mr. Allen is Chairman, Chief Executive Officer and President of the Graimark Realty Advisors, Inc. (real estate development, investment and asset management). | 84 | None | ||||
Paula H.J. Cholmondeley
c/o Gartmore Global Investments, Inc. 1200 River Road, Suite 1000 Conshohocken, PA 19428
1940 | Trustee since July 2000 | Ms. Cholmondeley has been the Chairman and Chief Executive Officer of the Sorrel Group, a management consulting company, since January 2004. From March 2000 through December 2003, Ms. Cholmondeley was Vice President and General Manager of Sappi Fine Paper North America. Prior thereto, Ms. Cholmondeley was Vice President and General Manager of Residential Insulation of Owens Corning. | 84 | Director of Dentsply International, Inc., Ultralife Batteries, Inc., Terex Corporation, Minerals Technology, Inc. and Albany International Corp. | ||||
C. Brent DeVore
c/o Gartmore Global Investments, Inc. 1200 River Road, Suite 1000 Conshohocken, PA 19428
1940 | Trustee since 1990 | Dr. DeVore is President of Otterbein College. | 84 | None | ||||
Phyllis K. Dryden
c/o Gartmore Global Investments, Inc. 1200 River Road, Suite 1000 Conshohocken, PA 19428
1947 | Trustee since December 2004 | Ms. Dryden was a former Managing Partner of marchFIRST, a global management consulting firm prior to 2002. | 84 | None |
19
Table of Contents
GARTMORE VARIABLE INSURANCE TRUST
Management Information (Unaudited)
June 30, 2005
| Name, Address and Date of Birth | Position(s) Held with the Trust and Length of Time Served1 | Principal Occupation(s) During Past 5 Years | Number of Portfolios in the Gartmore Fund Complex Overseen by Trustee | Other Directorships Held by Trustee or Nominee2 | ||||
Barbara L. Hennigar*
c/o Gartmore Global Investments, Inc. 1200 River Road, Suite 1000 Conshohocken, PA 19428
1935 | Trustee since July 2000 | Retired since June 2000. Prior thereto, Ms. Hennigar was the Chairman or President and Chief Executive Officer of OppenheimerFunds Services and a member of the Executive Committee of OppenheimerFunds. | 84 | None | ||||
Barbara I. Jacobs
c/o Gartmore Global Investments, Inc. 1200 River Road, Suite 1000 Conshohocken, PA 19428
1950 | Trustee since December 2004 | Ms. Jacobs has served as Chairman of the Board of Directors of KICAP Network Fund, a European (United Kingdom) hedge fund, since December 2000. Prior to 2004, Ms. Jacobs was also a Managing Director and European Portfolio Manager with CREF Investments (Teachers Insurance Annuity Association — College Retirement Equity Fund). | 84 | None | ||||
Douglas F. Kridler
c/o Gartmore Global Investments, Inc. 1200 River Road, Suite 1000 Conshohocken, PA 19428
1955 | Trustee since September 1997 | Mr. Kridler has served as the President and Chief Executive Officer of the Columbus Foundation (a Columbus, OH-based foundation which manages over 1,300 individual endowment funds) since February 2002. Mr. Kridler was the President of the Columbus Association for the Performing Arts prior thereto and Chairman of the Greater Columbus Convention and Visitors Bureau during 2000 and 2001. | 84 | None | ||||
Michael D. McCarthy
c/o Gartmore Global Investments, Inc. 1200 River Road, Suite 1000 Conshohocken, PA 19428
1947 | Trustee since December 2004 | Mr. McCarthy serves as: the Founder and Chairman of The Eureka Foundation (which sponsors and funds the “Great Museums” series on PBS); and a Partner of Pineville Properties LLC (a commercial real estate development firm). | 843 | None |
20
Table of Contents
GARTMORE VARIABLE INSURANCE TRUST
Management Information (Unaudited)
June 30, 2005
| Name, Address and Date of Birth | Position(s) Held with the Trust and Length of Time Served1 | Principal Occupation(s) During Past 5 Years | Number of Portfolios in the Gartmore Fund Complex Overseen by Trustee | Other Directorships Held by Trustee or Nominee2 | ||||
David C. Wetmore
c/o Gartmore Global Investments, Inc. 1200 River Road, Suite 1000 Conshohocken, PA 19428
1948 | Trustee since 1995 and Chairman since February 2005 | Retired. Mr. Wetmore was formerly a Managing Director of Updata Capital, an investment banking and venture capital firm. | 84 | None |
| * | Pursuant to the Trust’s mandatory retirement policy, Ms. Hennigar is expected to retire on or about January 12, 2006. |
| 1 | The term of office length is until a trustee resigns or reaches a mandatory retirement age of 70. On March 2, 2000, the Board adopted a five-year implementation period for any Trustee 65 or older as of the adoption of this policy. Pursuant to this policy, Messrs. Duncan and Kerr retired as trustees effective as of March 12, 2005. |
| 2 | Directorships held in (1) any other investment companies registered under the 1940 Act, (2) any company with a class of securities registered pursuant to Section 12 of the Securities Exchange Act of 1934, as amended (the “Exchange Act”), or (3) any company subject to the requirements of Section 15(d) of the Exchange Act. |
| 3 | Mr. McCarthy was also an Administrative Committee Member for the Alphagen Arneb Fund, LLC, The Healthcare Fund LDC, The Leaders Long-Short Fund, LLC, and The Leaders Long-Short Fund LDC, four private investment companies (hedge funds) managed by GSA. Mr. McCarthy resigned as an Administrative Committee Member effective June 30, 2005. |
Trustees and Officers who are not Interested Persons (as defined in the 1940 Act) of the Funds received aggregate compensation of $274,882 from the Trust for the Six Months Ended June 30, 2005. Additional information regarding the Trustees and Officers may be found in the Trust’s statement of additional information, which is available without charge upon request, by calling 1-800-848-0920.
21
Table of Contents
GARTMORE VARIABLE INSURANCE TRUST
Management Information (Unaudited)
June 30, 2005
Trustees who are Interested Persons (as defined in the 1940 Act) and/or Officers of the Funds June 30, 2005
| Name, Address and Age | Position(s) Held with the Trust and Length of Time Served1 | Principal Occupation(s) During Past 5 Years | Number of Portfolios in the Gartmore Fund Complex Overseen by Trustee | Other Directorships Held by Trustee2 | ||||
Paul J. Hondros
Gartmore Global Investments, Inc. 1200 River Road, Suite 1000 Conshohocken, PA 19428
1948 | Trustee since July 2000 | Mr. Hondros has been President and Chief Executive Officer of various Gartmore entities, including Gartmore Distribution Services, Inc. (“GDSI”),3 Gartmore Investor Services, Inc. (“GISI”),3 Gartmore Morley Capital Management, Inc. (“GMCM”),3 Gartmore Morley Financial Services, Inc. (“GMFS”),3 NorthPointe Capital, LLC (“NorthPointe”),3 Gartmore Global Asset Management Trust (“GGAMT”)3, Gartmore Global Investments, Inc. (“GGI”)3, Gartmore Mutual Fund Capital Trust (“GMFCT”)3 and Gartmore SA Capital Trust (“GSA”)3; and a Director of Nationwide Securities, Inc.3, as well as several entities within Nationwide Financial Services, Inc. | 844 | None | ||||
Arden L. Shisler
c/o Gartmore Global Investments, Inc. 1200 River Road, Suite 1000 Conshohocken, PA 19428
1941 | Trustee since February 2000 | Mr. Shisler has been a consultant since January 2003. Prior thereto, he was President and Chief Executive Officer of K&B Transport, Inc., a trucking firm. Since 1992, Mr. Shisler has also been Chairman of the Board for Nationwide Mutual Insurance Company3. | 84 | Director of Nationwide Financial Services, Inc. | ||||
Gerald J. Holland
Gartmore Global Investments, Inc. 1200 River Road, Suite 1000 Conshohocken, PA 19428
1951 | Treasurer since March 2001 | Mr. Holland is Senior Vice President - Operations for GGI3, GMFCT3 , and GSA3. Prior to July 2000, Mr, Holland was Vice President for First Data Investor Services, an investment company service provider. | 84 | None |
22
Table of Contents
GARTMORE VARIABLE INSURANCE TRUST
Management Information (Unaudited)
June 30, 2005
| Name, Address and Age | Position(s) Held with the Trust and Length of Time Served1 | Principal Occupation(s) During Past 5 Years | Number of Portfolios in the Gartmore Fund Complex Overseen by Trustee | Other Directorships Held by Trustee2 | ||||
Michael A. Krulikowski
Gartmore Global Investments, Inc. 1200 River Road, Suite 1000 Conshohocken, PA 19428
1959 | Chief Compliance Officer since June 2004 | Since November 1999, Mr. Krulikowski has served as a Vice President and Chief Compliance Officer of GGI. Prior thereto, Mr. Krulikowski served as Chief Compliance Officer of 1717 Capital Management Company/Provident Mutual Insurance Company. | 84 | None | ||||
Eric E. Miller
Gartmore Global Investments, Inc. 1200 River Road, Suite 1000 Conshohocken, PA 19428
1953 | Secretary since December 2002 | Mr. Miller is Senior Vice President, Chief Counsel for GGI3, GMFCT3 and GSA3 since August 2002. From August 2000 to August 2002, Mr. Miller was a Partner with Stradley Ronan Stevens & Young, LLP. Prior to August 2000, Mr. Miller served as Senior Vice President and Deputy General Counsel at Delaware Investments. | 84 | None |
| 1 | The term of office length is until a trustee resigns or reaches a mandatory retirement age of 70. On March 2, 2000, the Board adopted a five-year implementation period for any Trustee 65 or older as of the adoption of this policy. Pursuant to this policy, Messrs. Duncan and Kerr retired as trustees effective as of March 12, 2005. |
| 2 | Directorships held in (1) any other investment companies registered under the 1940 Act, (2) any company with a class of securities registered pursuant to Section 12 of the Securities Exchange Act of 1934, as amended (the “Exchange Act”), or (3) any company subject to the requirements of Section 15(d) of the Exchange Act. |
| 3 | This position is held with an affiliated person or principal underwriter of the Trust. |
| 4 | Mr. Hondros was also an Administrative Committee Member for the Alphagen Arneb Fund, LLC, The Healthcare Fund LDC, The Leaders Long-Short Fund, LLC, and The Leaders Long-Short Fund LDC, four private investment companies (hedge funds) managed by GSA. Mr. Hondros resigned as Administrative Committee Member effective June 30, 2005. |
Federal law requires the Trust, each of its investment advisers and sub-advisers to adopt procedures for voting proxies (“Proxy Voting Guidelines”) and to provide a summary of those Proxy Voting Guidelines used to vote the securities held by the Funds. The Funds’ proxy voting policies and procedures are available without charge (i) upon request, by calling 1-800-848-0920, (ii) on the Fund’s website at www.gartmorefunds.com, or (iii) on the Securities and Exchange Commission’s website at www.sec.gov.
23
Table of Contents
Van Kampen GVIT Comstock Value Fund
Semiannual Report
| | June 30, 2005 |
| Contents | ||
| 5 | Statement of Investments | |
| 8 | Statement of Assets and Liabilities | |
| 8 | Statement of Operations | |
| 9 | Statements of Changes in New Assets | |
| 11 | Financial Highlights | |
| 12 | Notes to Financial Statements | |
Commentary provided by Gartmore Global Investments, investment adviser to Gartmore Variable Insurance Trust. All opinions and estimates included in this report constitute Gartmore Global Investments’ judgment as of the date of this report and are subject to change without notice.
Statement Regarding Availability of Quarterly Portfolio Schedule.
The Gartmore Variable Insurance Trust files complete schedules of portfolio holdings for each Fund with the Securities and Exchange Commission (the “Commission”) for the first and third quarters of each fiscal year on Form N-Q. The Funds’ Forms N-Q are available on the Commission’s website at http://www.sec.gov. The Funds’ Forms N-Q may be reviewed and copied at the Commission’s Public Reference Room in Washington, DC, and information on the operation of the Public Reference Room may be obtained by calling 800-SEC-0330; and the Funds make the information on Form N-Q available to shareholders upon request without charge.
Statement Regarding Availability of Proxy Voting Record.
Information regarding how the Fund voted proxies relating to portfolio securities held during the most recent 12-month period ended June 30, 2005 is available without charge, upon request, by calling 800-848-0920, and on the Commission’s website at http://www.sec.gov.
Table of Contents
Van Kampen GVIT Comstock Value Fund
For the semiannual period ended June 30, 2005, the Van Kampen GVIT Comstock Value Fund returned -1.04% (Class I at NAV) versus -0.81% for its benchmark, the S&P 500® Index. For broader comparison, the average return for the Fund’s Lipper peer category of Equity Income Funds was 0.72%.
Caution was the prevailing sentiment driving the stock market during the reporting period. Among investors’ chief concerns were high oil prices and rising interest rates, and the extent to which these pressures would affect future economic growth. Nevertheless, the economy continued to show signs of moderate growth, corporate earnings were generally good, and consumer confidence improved. Overall investor sentiment became more optimistic with the belief that the Federal Reserve Board was nearly finished raising the federal funds target rate. Against this backdrop, value stocks outperformed growth stocks during the reporting period, though neither style’s absolute returns, nor the market’s average returns, were particularly compelling.
Given our strict “bottom-up” approach to investing—a strategy that involves considering companies simply on their own merit, without regard to their given industries/sectors or the current economic conditions—all sector decisions are a result of our individual stock selections rather than a macroeconomic or broad sector call. The Fund lagged the Index primarily in the Fund’s considerable materials sector overweight relative to the Index. Materials stocks also represented the Fund’s largest detractor on an absolute basis. Paper stocks fell short in the wake of a challenging environment during the past 12 months. Specifically, soaring energy and commodity costs required to produce paper have cut into these companies’ profit margins. In addition, due to overcapacity in the industry, pricing power has been relatively sluggish. We are patient, however, and continue to monitor the situation carefully.
Relative to the benchmark, the largest contributors to the Fund’s performance were its underweights in technology and industrials, both weak-performing groups in the market. These sectors represented a very small portion of the Fund, and therefore the Fund’s exposure to downside performance in them was minimal. In our view, neither sector had produced any compelling investment opportunities in the recent past. In terms of absolute performance, the Fund’s energy stocks boosted overall returns. High oil prices continued to support a very favorable environment for many crude oil-related companies. Health care and utility holdings rounded out the Fund’s strong performers.
The most notable portfolio activity during the reporting period was our aggressive reduction of energy positions; many of these companies have approached or reached what we consider their fair valuations. We continued to maintain the Fund’s pharmaceuticals holdings, because our long-term view has not been altered by the negative sentiment that plagues that segment of the market. We selectively added to media companies that were attractively valued by our measures. As the market has recovered during the past few years, more stocks have become fully valued, leaving fewer that meet the Fund’s investment criteria.
We remain committed to the Fund’s discipline of seeking well-established, attractively valued companies. Within the portfolio, we continue to incorporate stocks with reasonable valuations relative to our assessment of their fair value. If valuations revert to the mean and prices approach fair value, we are likely to reduce some positions in favor of more attractive names.
PORTFOLIO MANAGERS: B. Robert Baker Jr., Jason S. Leder, Kevin C. Holt
Investing in mutual funds involves risk, including possible loss of principal.
There is no assurance that the investment objective of any fund will be achieved.
Standard & Poor’s 500 (S&P 500) Index: An unmanaged, capitalization-weighted index of 500 widely held stocks of large-cap U.S. companies that gives a broad look at how the stock prices of those companies have performed.
Lipper Analytical Services, Inc. is an industry research firm whose rankings are based on total return performance and do not reflect the effects of sales charges.
The Gartmore Variable Insurance Trust Funds are available only as sub-account investment options in certain variable insurance products. Accordingly, investors are unable to invest in shares of these funds outside of an insurance product. Performance information found herein reflects only the performance of these funds, and does not indicate the performance your sub-account may experience under your variable insurance contract. Performance returns assume reinvestment of all distributions. The investment return and principal value of an investment will fluctuate so that an investor’s shares, when redeemed, may be worth more or less than their original cost. Index performance is provided for comparison purposes only; the indexes shown are unmanaged and do not reflect any fees or expenses. Investors cannot invest directly in market indexes. To obtain performance information about the sub-account option under your insurance contract that invests in one of these funds, please contact your variable insurance carrier. PAST PERFORMANCE IS NO GUARANTEE OF FUTURE RESULTS.
Commentary provided by Gartmore Global Investments. All opinions and estimates included in this report constitute Gartmore Global Investments’ judgment as of the date of this report and are subject to change without notice.
Investors should carefully consider a fund’s investment objectives, risks, fees, charges and expenses before investing any money. To obtain this and other information on Gartmore Variable Insurance Trust, please contact your variable insurance contract provider or call 800-848-0920. Please read the Trust’s prospectus carefully before investing any money.
Gartmore Funds distributed by Gartmore Distribution Services, Inc., Member NASD. 1200 River Road, Suite 1000, Conshohocken, PA 19428.
1
Table of Contents
Fund Performance | Van Kampen GVIT Comstock Value Fund |
| Average | Annual Total Return1 |
(For Periods Ended June 30, 2005)
| Six months* | One year | Five years | Inception2 | |||||
| Class I3 | -1.04% | 10.91% | -2.46% | 2.93% | ||||
| Class II4 | -1.17% | 10.58% | -2.58% | 2.76% | ||||
| Class IV4 | -0.94% | 10.93% | -2.45% | 2.93% |
| * | Not Annualized. |
| 1 | Not subject to any sales charges. |
| 2 | The Fund commenced operations on October 31, 1997. This performance includes performance for a period (prior to May 1, 2002) when the Fund’s previous subadviser managed the Fund. |
| 3 | The existing shares of the Fund were designated Class I shares as of May 1, 2001. |
| 4 | These returns until the creation of the Class II shares (March 28, 2003) and Class IV shares (April 28, 2003) are based on the performance of the Class I shares of the Fund. Excluding the effect of any fee waivers or reimbursements, such prior performance is similar to what Class II and Class IV shares would have produced because all classes of shares invest in the same portfolio of securities. Class II shares’ annual returns have been restated to reflect the additional fees applicable to Class II and therefore are lower than the annual returns of Class I. |
| Performance | of a $10,000 Investment |
Investment return and principal value will fluctuate, and when redeemed, shares may be worth more or less than original cost. Past performance is no guarantee of future results and does not reflect the deduction of taxes that a shareholder would pay on fund distributions or the redemption of fund shares. Investing in mutual funds involves market risk, including loss of principal. Performance returns assume the reinvestment of all distributions.
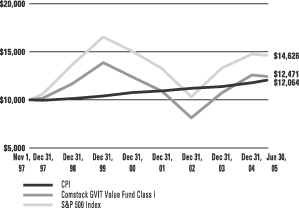
Comparative performance of $10,000 invested in Class I shares of the Van Kampen GVIT Comstock Value Fund, the Standard & Poor’s 500 Index (S&P 500)(a), and the Consumer Price Index (CPI)(b) since inception. Unlike, the Fund, the returns for these unmanaged indexes do not reflect any fees, expenses, or sales charges. Investors cannot invest directly in market indexes.
| (a) | S&P 500 is an unmanaged, market capitalization-weighted index of 500 widely held stocks of large-cap U.S. companies that gives a broad look at how the stock prices of those companies have performed. |
| (b) | The CPI represents changes in prices of a basket of goods and services purchased for consumption by urban households. |
2
Table of Contents
Shareholder
Expense Example | Van Kampen GVIT Comstock Value Fund |
As a shareholder of the Fund, you incur two types of costs: (1) transaction costs, including sales charges (loads) paid on purchase payments and redemption fees; and (2) ongoing costs, including investment advisory fees, administration fees, distribution fees and other Fund expenses. The examples below are intended to help you understand your ongoing costs (in dollars) of investing in the Fund and to compare these costs with the ongoing costs of investing in other mutual funds. Per SEC requirements, the examples assume that you had a $1,000 investment in the Class at the beginning of the reporting period, January 1, 2005, and continued to hold your shares at the end of the reporting period, June 30, 2005.
Actual Expenses
For each Class of the Fund in the table below, the first line provides information about actual account values and actual expenses. You may use the information in this line, together with the amount you invested, to estimate the expenses that you paid over the period. Simply divide your account value by $1,000 (for example, an $8,600 account value divided by $1,000 = 8.6), then multiply the result by the number in the first line of each Class under the heading entitled “Expenses Paid During Period” to estimate the expenses you paid on your account during the period.
Hypothetical Example for Comparison Purposes
The second line of each Class in the table below provides information about hypothetical account values and hypothetical expenses based on the Class’ actual expense ratio and an assumed rate of return of 5% per year before expenses, which is not the Class’ actual return. The hypothetical account values and expenses may not be used to estimate the actual ending account balance or expenses you paid for the period. You may use this information to compare the ongoing costs of investing in the Class of the Fund and other funds. To do so, compare this 5% hypothetical example with the 5% hypothetical examples that appear in the shareholder reports of the other funds.
Please note that the expenses shown in the table are meant to highlight your ongoing costs only and do not reflect any transaction costs, such as sales charges (loads) or redemption fees. Therefore, the second line for each Class in the table is useful in comparing ongoing costs only, and will not help you determine the relative total costs of owning different funds. In addition, if these transaction costs were included, your costs would have been higher. The examples also assume all dividends and distributions have been reinvested.
| Beginning Account Value, January 1, 2005 | Ending Account Value, June 30, 2005 | Expenses Paid During Period* | Annualized Expense Ratio* | ||||||||||
| Value Fund | |||||||||||||
Class I | Actual | $ | 1,000 | $ | 990 | $ | 4.59 | 0.93% | |||||
| Hypothetical1 | $ | 1,000 | $ | 1,020 | $ | 4.67 | 0.93% | ||||||
Class II | Actual | $ | 1,000 | $ | 988 | $ | 6.06 | 1.23% | |||||
| Hypothetical1 | $ | 1,000 | $ | 1,019 | $ | 6.18 | 1.23% | ||||||
Class IV | Actual | $ | 1,000 | $ | 991 | $ | 4.49 | 0.91% | |||||
| Hypothetical1 | $ | 1,000 | $ | 1,020 | $ | 4.57 | 0.91% | ||||||
| * | Expenses are equal to the Fund’s annualized expense ratio multiplied by the average account value over the period multiplied by 181/365 (to reflect the one-half year period). The expense ratio presented represents a six month, annualized ratio in accordance with SEC guidelines. |
| 1 | Represents the hypothetical 5% return before expenses. |
3
Table of Contents
Portfolio Summary
(June 30, 2005) | Van Kampen GVIT Comstock Value Fund |
The SEC adopted a requirement that Funds present their portfolio holdings in a table, chart or graph format in their annual and semiannual reports to shareholders, whether or not a statement of investments is utilized. The following tables, which present portfolio holdings as a percentage of net assets, are provided in compliance with this requirement.
| Asset Allocation | ||
| Common Stocks | 91.1% | |
| Cash Equivalents | 8.8% | |
| Other Investments* | 7.5% | |
| Liabilities in excess of other assets** | -7.4% | |
| 100.0% | ||
| Top Holdings*** | ||
| GlaxoSmithKline PLC ADR-GB | 4.7% | |
| Freddie Mac | 3.9% | |
| Bristol-Myers Squibb Co. | 3.3% | |
| International Paper Co. | 3.1% | |
| Bank of America Corp. | 3.1% | |
| Verizon Communications, Inc. | 3.0% | |
| SBC Communications, Inc. | 2.8% | |
| Citigroup, Inc. | 2.5% | |
| Georgia Pacific Corp. | 2.3% | |
| Halliburton Co. | 2.2% | |
| Other Holdings | 69.1% | |
| 100.0% | ||
| Top Industries | ||
| Pharmaceuticals | 14.4% | |
| Banks | 11.3% | |
| Telecommunications | 7.9% | |
| Financial Services | 6.0% | |
| Broadcast Media / Cable Television | 5.8% | |
| Paper & Forest Products | 5.4% | |
| Insurance | 5.3% | |
| Oil & Gas | 5.1% | |
| Food & Related | 4.5% | |
| Utilities | 4.1% | |
| Other Industries | 30.2% | |
| 100.0% | ||
| * | Includes value of collateral received from securities lending. |
| ** | Includes value of collateral owed from securities lending. |
| *** | For purpose of listing top holdings, repurchase agreements are considered cash equivalents and are included as part of other holdings. |
4
Table of Contents
GARTMORE VARIABLE INSURANCE TRUST
VAN KAMPEN GVIT COMSTOCK VALUE FUND
Statement of Investments — June 30, 2005 (Unaudited)
| Shares or Principal Amount | Value | ||||
| COMMON STOCKS (91.1%) | |||||
| Airlines (0.3%) | |||||
| Southwest Airlines | 43,100 | $ | 600,383 | ||
| Banks (11.3%) | |||||
| Bank of America Corp. | 137,434 | 6,268,364 | |||
| Bank of New York Co., Inc. | 59,900 | 1,723,922 | |||
| Citigroup, Inc. | 109,900 | 5,080,677 | |||
| J.P. Morgan Chase & Co. | 45,100 | 1,592,932 | |||
| PNC Bank Corp. | 47,700 | 2,597,742 | |||
| Suntrust Banks, Inc. | 4,400 | 317,856 | |||
| Wachovia Corp. | 28,505 | 1,413,848 | |||
| Wells Fargo & Co. | 67,700 | 4,168,966 | |||
| 23,164,307 | |||||
| Broadcast Media & Cable Television (5.8%) | |||||
| Clear Channel Communications, Inc. | 139,900 | 4,327,107 | |||
| Liberty Media Corp., Class A (b) | 286,600 | 2,920,454 | |||
| Time Warner, Inc. (b) | 147,600 | 2,466,396 | |||
| Viacom, Inc., Class B | 66,100 | 2,116,522 | |||
| 11,830,479 | |||||
| Chemicals (2.7%) | |||||
| Dow Chemical Co. | 40,700 | 1,812,371 | |||
| E.I. du Pont de Nemours & Co. | 87,900 | 3,780,579 | |||
| 5,592,950 | |||||
| Chemicals & Diversified (0.7%) | |||||
| Rohm & Haas Co. | 29,300 | 1,357,762 | |||
| Computer Hardware (1.3%) | |||||
| Hewlett-Packard Co. | 58,900 | 1,384,739 | |||
| International Business Machines Corp. | 7,700 | 571,340 | |||
| Lexmark International Group, Inc., Class A (b) | 9,195 | 596,112 | |||
| 2,552,191 | |||||
| Computer Software & Services (2.4%) | |||||
| Affiliated Computer Services, Inc., Class A (b) | 31,300 | 1,599,430 | |||
| Check Point Software Technologies Ltd. ADR-IL (b) | 7,800 | 154,440 | |||
| Cisco Systems, Inc. (b) | 34,600 | 661,206 | |||
| First Data Corp. | 22,400 | 899,136 | |||
| Microsoft Corp. | 26,200 | 650,808 | |||
| SunGard Data Systems, Inc. (b) | 28,300 | 995,311 | |||
| 4,960,331 | |||||
| Shares or Principal Amount | Value | ||||
| COMMON STOCKS (continued) | |||||
| Consumer Products (2.4%) | |||||
| Kimberly-Clark Corp. | 60,200 | $ | 3,767,918 | ||
| Mattel, Inc. | 57,000 | 1,043,100 | |||
| 4,811,018 | |||||
| Electronics (0.6%) | |||||
| Cognex Corp. | 15,300 | 400,707 | |||
| Credence Systems Corp. (b) | 32,000 | 289,600 | |||
| Flextronics International Ltd. ADR-SG (b) | 36,800 | 486,128 | |||
| Jabil Circuit, Inc. (b) | 1,953 | 60,016 | |||
| 1,236,451 | |||||
| Entertainment (1.5%) | |||||
| Walt Disney Co. (The) | 120,525 | 3,034,820 | |||
| Financial Services (6.0%) | |||||
| AMBAC Financial, Inc. | 14,150 | 987,104 | |||
| Capital One Financial Corp. | 3,100 | 248,031 | |||
| Fannie Mae | 12,050 | 703,720 | |||
| Freddie Mac | 121,300 | 7,912,399 | |||
| Lehman Brothers Holdings, Inc. | 9,500 | 943,160 | |||
| Merrill Lynch & Co., Inc. | 24,700 | 1,358,747 | |||
| 12,153,161 | |||||
| Food & Related (4.5%) | |||||
| Coca-Cola Co. | 60,700 | 2,534,225 | |||
| Kraft Foods, Inc. | 81,000 | 2,576,610 | |||
| Unilever NV ADR-NL | 63,200 | 4,097,256 | |||
| 9,208,091 | |||||
| Insurance (5.3%) | |||||
| American International Group, Inc. | 23,300 | 1,353,730 | |||
| Assurant, Inc. | 12,300 | 444,030 | |||
| Berkshire Hathaway, Inc., Class B (b) | 110 | 306,185 | |||
| Chubb Corp. (The) | 40,850 | 3,497,168 | |||
| Genworth Financial, Inc. | 30,400 | 918,992 | |||
| Hartford Financial Services Group, Inc. (The) | 7,400 | 553,372 | |||
| MetLife, Inc. | 21,200 | 952,728 | |||
| RenaissanceRe Holdings Ltd. | 4,300 | 211,732 | |||
| St. Paul Travelers Cos., Inc. | 22,262 | 880,017 | |||
| Torchmark Corp. | 32,900 | 1,717,380 | |||
| 10,835,334 | |||||
| Insurance & Life (0.3%) | |||||
| AFLAC, Inc. | 12,200 | 528,016 | |||
5
Table of Contents
GARTMORE VARIABLE INSURANCE TRUST
VAN KAMPEN GVIT COMSTOCK VALUE FUND
Statement of Investments — June 30, 2005 (Unaudited) (continued)
| Shares or Principal Amount | Value | ||||
| COMMON STOCKS (continued) | |||||
| Metals & Mining (1.8%) | |||||
| Alcoa, Inc. | 140,500 | $ | 3,671,265 | ||
| Oil & Gas (5.1%) | |||||
| ConocoPhillips | 19,074 | 1,096,564 | |||
| Global Santa Fe Corp. | 24,900 | 1,015,920 | |||
| Halliburton Co. | 94,576 | 4,522,625 | |||
| Petroleo Brasileiro SA ADR-BR | 2,254 | 117,501 | |||
| Petroleo Brasileiro SA ADR-BR | 15,000 | 690,600 | |||
| Schlumberger Ltd. | 6,800 | 516,392 | |||
| Total SA ADR-FR | 20,100 | 2,348,685 | |||
| 10,308,287 | |||||
| Paper & Forest Products (5.4%) | |||||
| Georgia Pacific Corp. | 148,300 | 4,715,940 | |||
| International Paper Co. | 209,236 | 6,321,020 | |||
| 11,036,960 | |||||
| Pharmaceuticals (14.4%) | |||||
| AmerisourceBergen Corp. | 27,500 | 1,901,625 | |||
| Bristol-Myers Squibb Co. | 266,900 | 6,667,162 | |||
| GlaxoSmithKline PLC ADR-GB | 197,800 | 9,595,277 | |||
| Pfizer, Inc. | 101,647 | 2,803,424 | |||
| Roche Holding AG ADR-CH | 43,300 | 2,741,107 | |||
| Sanofi-Aventis ADR-FR | 33,400 | 1,369,066 | |||
| Schering-Plough Corp. | 108,500 | 2,068,010 | |||
| Wyeth | 55,300 | 2,460,850 | |||
| 29,606,521 | |||||
| Photographic Equipment Supplies (0.5%) | |||||
| Eastman Kodak Co. | 39,400 | 1,057,890 | |||
| Restaurants (0.4%) | |||||
| McDonald’s Corp. | 27,400 | 760,350 | |||
| Retail (3.8%) | |||||
| Best Buy Co., Inc. | 12,000 | 822,600 | |||
| Federated Department Stores, Inc. | 15,000 | 1,099,200 | |||
| Jones Apparel Group, Inc. | 47,400 | 1,471,296 | |||
| May Department Stores Co. (The) | 25,700 | 1,032,112 | |||
| Wal-Mart Stores, Inc. | 71,000 | 3,422,200 | |||
| 7,847,408 | |||||
| Shares or Principal Amount | Value | |||||
| COMMON STOCKS (continued) | ||||||
| Semiconductors (0.1%) | ||||||
| Intel Corp. | 3,500 | $ | 91,210 | |||
| Novellus Systems, Inc. (b) | 3,800 | 93,898 | ||||
| 185,108 | ||||||
| Telecommunications (7.9%) | ||||||
| SBC Communications, Inc. | 246,000 | 5,842,500 | ||||
| Sprint Corp. | 167,020 | 4,190,532 | ||||
| Verizon Communications, Inc. | 178,800 | 6,177,540 | ||||
| 16,210,572 | ||||||
| Telecommunications Equipment (0.4%) | ||||||
| Andrew Corp. (b) | 4,600 | 58,696 | ||||
| Ericsson ADR-SE | 11,000 | 351,450 | ||||
| Nokia Corp. ADR-FI | 23,100 | 384,384 | ||||
| 794,530 | ||||||
| Tobacco (2.1%) | ||||||
| Altria Group, Inc. | 66,250 | 4,283,725 | ||||
| Utilities (4.1%) | ||||||
| American Electric Power Co., Inc. | 44,740 | 1,649,564 | ||||
| Constellation Energy Group, Inc. | 26,800 | 1,546,092 | ||||
| Dominion Resources, Inc. | 22,700 | 1,665,953 | ||||
| FirstEnergy Corp. | 49,200 | 2,367,012 | ||||
| Public Service Enterprise Group, Inc. | 20,000 | 1,216,400 | ||||
| 8,445,021 | ||||||
| Total Common Stocks | 186,072,931 | |||||
| CASH EQUIVALENTS (8.8%) | ||||||
| Investments in repurchase agreements (Collateralized by AA Corporate Bonds, in a joint trading account at 3.34%, dated 06/30/05, due 07/01/05, repurchase price $17,904,560) | $ | 17,902,899 | 17,902,899 | |||
| Total Cash Equivalents | 17,902,899 | |||||
6
Table of Contents
GARTMORE VARIABLE INSURANCE TRUST
VAN KAMPEN GVIT COMSTOCK VALUE FUND
Statement of Investments — June 30, 2005 (Unaudited) (continued)
| Shares or Principal Amount | Value | ||||||
| SHORT-TERM SECURITIES HELD AS COLLATERAL FOR SECURITIES LENDING (7.5%) | |||||||
| Pool of short-term securities for Gartmore Variable Insurance Trust Funds — note 2 (Securities Lending) | $ | 15,316,894 | $ | 15,316,894 | |||
| Total Short-Term Securities Held as Collateral for Securities Lending | 15,316,894 | ||||||
| Total Investments (Cost $202,448,938) (a) — 107.4% | 219,292,724 | ||||||
| Liabilities in excess of other assets — (7.4)% | (15,174,207 | ) | |||||
| NET ASSETS — 100.0% | $ | 204,118,517 | |||||
| (a) | See notes to financial statements for tax unrealized appreciation (depreciation) of securities. |
| (b) | Denotes a non-income producing security. |
| ADR | American Depositary Receipt |
| BR | Brazil |
| CH | Switzerland |
| FI | Finland |
| FR | France |
| GB | United Kingdom |
| IL | Israel |
| NL | Netherlands |
| SE | Sweden |
| SG | Singapore |
See notes to financial statements.
7
Table of Contents
GARTMORE VARIABLE INSURANCE TRUST
VAN KAMPEN GVIT COMSTOCK VALUE FUND
Statement of Assets and Liabilities
June 30, 2005 (Unaudited)
Assets: | ||||
Investments, at value (cost $184,546,039) | $ | 201,389,825 | ||
Repurchase agreements, at cost and value | 17,902,899 | |||
Total Investments | 219,292,724 | |||
Interest and dividends receivable | 416,903 | |||
Receivable for investments sold | 86,548 | |||
Prepaid expenses and other assets | 13,417 | |||
Total Assets | 219,809,592 | |||
Liabilities: | ||||
Payable to custodian | 8,858 | |||
Payable for investments purchased | 205,702 | |||
Payable for return of collateral received for securities on loan | 15,316,894 | |||
Accrued expenses and other payables: | ||||
Investment advisory fees | 116,064 | |||
Fund administration and transfer agent fees | 6,223 | |||
Distribution fees | 8,702 | |||
Administrative servicing fees | 25,527 | |||
Other | 3,105 | |||
Total Liabilities | 15,691,075 | |||
Net Assets | $ | 204,118,517 | ||
Represented by: | ||||
Capital | $ | 190,514,892 | ||
Accumulated net investment income (loss) | 107,154 | |||
Accumulated net realized gain (losses) from investments | (3,347,315 | ) | ||
Net unrealized appreciation (depreciation) | 16,843,786 | |||
Net Assets | $ | 204,118,517 | ||
Net Assets: | ||||
Class I Shares | $ | 107,201,343 | ||
Class II Shares | 42,729,224 | |||
Class IV Shares | 54,187,950 | |||
Total | $ | 204,118,517 | ||
Shares outstanding (unlimited number of shares authorized): | ||||
Class I Shares | 9,473,249 | |||
Class II Shares | 3,784,567 | |||
Class IV Shares | 4,788,565 | |||
Total | 18,046,381 | |||
Net asset value and offering price per share:* | ||||
Class I Shares | $ | 11.32 | ||
Class II Shares | $ | 11.29 | ||
Class IV Shares | $ | 11.32 |
| * | Not subject to a front-end sales charge. |
For the Six Months Ended June 30, 2005 (Unaudited)
Investment Income: | ||||
Interest income | $ | 210,626 | ||
Dividend income | 2,406,924 | |||
Income from securities lending | 17,400 | |||
Total Income | 2,634,950 | |||
Expenses: | ||||
Investment advisory fees | 685,038 | |||
Fund administration and transfer agent fees | 65,593 | |||
Distribution fees Class II Shares | 47,613 | |||
Administrative servicing fees | 77,751 | |||
Administrative servicing fees | 47,613 | |||
Administrative servicing fees | 33,481 | |||
Other** | 34,617 | |||
Total expenses before waived or reimbursed expenses | 991,706 | |||
Expenses waived or reimbursed | (10,247 | ) | ||
Total Expenses | 981,459 | |||
Net Investment Income (Loss) | 1,653,491 | |||
REALIZED/UNREALIZED GAINS (LOSSES) ON INVESTMENTS: | ||||
Net realized gains (losses) on investment transactions | 9,243,652 | |||
Net change in unrealized appreciation/depreciation on investments | (13,032,071 | ) | ||
Net realized/unrealized gains (losses) on investments | (3,788,419 | ) | ||
CHANGE IN NET ASSETS RESULTING FROM OPERATIONS | $ | (2,134,928 | ) | |
| ** | Other expenses may include the following fees: audit, custody, insurance, legal, printing, trustee, and out-of-pocket expenses. |
See notes to financial statements.
8
Table of Contents
GARTMORE VARIABLE INSURANCE TRUST
VAN KAMPEN GVIT COMSTOCK VALUE FUND
Statement of Changes in Net Assets
| Six Months Ended June 30, 2005 | Year Ended December 31, 2004 | |||||||
| (Unaudited) | ||||||||
From Investment Activities: | ||||||||
Operations: | ||||||||
Net investment income (loss) | $ | 1,653,491 | $ | 2,070,287 | ||||
Net realized gains (losses) on investment transactions | 9,243,652 | 13,939,924 | ||||||
Net change in unrealized appreciation/depreciation on investments | (13,032,071 | ) | 10,570,832 | |||||
Change in net assets resulting from operations | (2,134,928 | ) | 26,581,043 | |||||
Distributions to Class I shareholders from: | ||||||||
Net investment income | (853,509 | ) | (1,139,895 | ) | ||||
Distributions to Class II shareholders from: | ||||||||
Net investment income | (266,690 | ) | (238,831 | ) | ||||
Distributions to Class IV shareholders from: | ||||||||
Net investment income | (436,195 | ) | (681,504 | ) | ||||
Change in net assets from shareholder distributions | (1,556,394 | ) | (2,060,230 | ) | ||||
Change in net assets from capital transactions | 5,612,480 | 60,997,172 | ||||||
Change in net assets | 1,921,158 | 85,517,985 | ||||||
Net Assets: | ||||||||
Beginning of period | 202,197,359 | 116,679,374 | ||||||
End of period | $ | 204,118,517 | $ | 202,197,359 | ||||
CAPITAL TRANSACTIONS: | ||||||||
Class I Shares | ||||||||
Proceeds from shares issued | $ | 11,918,720 | $ | 42,512,463 | ||||
Dividends reinvested | 853,509 | 1,139,895 | ||||||
Cost of shares redeemed | (15,732,495 | ) | (7,409,130 | ) | ||||
| (2,960,266 | ) | 36,243,228 | ||||||
Class II Shares | ||||||||
Proceeds from shares issued | 11,304,977 | 26,006,982 | ||||||
Dividends reinvested | 266,690 | 238,831 | ||||||
Cost of shares redeemed | (2,508,520 | ) | (1,431,736 | ) | ||||
| 9,063,147 | 24,814,077 | |||||||
Class IV Shares | ||||||||
Proceeds from shares issued | 2,377,340 | 6,318,800 | ||||||
Dividends reinvested | 436,195 | 681,504 | ||||||
Cost of shares redeemed | (3,303,936 | ) | (7,060,437 | ) | ||||
| (490,401 | ) | (60,133 | ) | |||||
Change in net assets from capital transactions | $ | 5,612,480 | $ | 60,997,172 | ||||
9
Table of Contents
GARTMORE VARIABLE INSURANCE TRUST
VAN KAMPEN GVIT COMSTOCK VALUE FUND
Statement of Changes in Net Assets (continued)
| Six Months Ended June 30, 2005 | Year Ended December 31, 2004 | |||||
| (Unaudited) | ||||||
SHARE TRANSACTIONS: | ||||||
Class I Shares | ||||||
Issued | 1,054,302 | 4,054,355 | ||||
Reinvested | 75,647 | 105,861 | ||||
Redeemed | (1,392,062 | ) | (714,509 | ) | ||
| (262,113 | ) | 3,445,707 | ||||
Class II Shares | ||||||
Issued | 999,736 | 2,482,756 | ||||
Reinvested | 23,695 | 21,942 | ||||
Redeemed | (222,342 | ) | (134,989 | ) | ||
| 801,089 | 2,369,709 | |||||
Class IV Shares | ||||||
Issued | 209,564 | 610,531 | ||||
Reinvested | 38,660 | 63,774 | ||||
Redeemed | (291,186 | ) | (679,233 | ) | ||
| (42,962 | ) | (4,928 | ) | |||
See notes to financial statements.
10
Table of Contents
GARTMORE VARIABLE INSURANCE TRUST
FINANCIAL HIGHLIGHTS
Selected Data for Each Share of Capital Outstanding
VAN KAMPEN GVIT COMSTOCK VALUE FUND
| Investment Activities | Distributions | Ratios/Supplemental Data | ||||||||||||||||||||||||||||||||||||||
| Net Asset Value, Beginning of Period | Net Investment Income (Loss) | Net Realized and Unrealized Gains (Losses) on Investments | Total from Investment Activities | Net Investment Income | Total Distributions | Net Asset Value, End of Period | Total Return | Net Assets at End of Period (000s) | Ratio of Expenses to Average Net Assets | Ratio of Net Investment Income (Loss) to Average Net Assets | Ratio of Expenses (Prior to Reimbursements) to Average Net Assets(a) | Ratio of Net Investment Income (Loss) (Prior to Reimbursements) to Average Net Assets(a) | Portfolio Turnover(b) | |||||||||||||||||||||||||||
Class I Shares | ||||||||||||||||||||||||||||||||||||||||
Year Ended December 31, 2000 | $ | 13.53 | 0.12 | (1.54 | ) | (1.42 | ) | (0.12 | ) | (0.12 | ) | $ | 11.99 | (10.62% | ) | $ | 55,951 | 0.95% | 0.96% | 1.11% | 0.80% | 72.32% | ||||||||||||||||||
Year Ended December 31, 2001(c) | $ | 11.99 | 0.15 | (1.61 | ) | (1.46 | ) | (0.15 | ) | (0.15 | ) | $ | 10.38 | (12.15% | ) | $ | 52,848 | 0.95% | 1.41% | 1.09% | 1.27% | 127.03% | ||||||||||||||||||
Year Ended December 31, 2002 | $ | 10.38 | 0.12 | (2.72 | ) | (2.60 | ) | (0.12 | ) | (0.12 | ) | $ | 7.66 | (25.14% | ) | $ | 39,424 | 1.11% | 1.30% | 1.11% | 1.30% | 245.24% | ||||||||||||||||||
Year Ended December 31, 2003 | $ | 7.66 | 0.11 | 2.28 | 2.39 | (0.11 | ) | (0.11 | ) | $ | 9.94 | 31.43% | $ | 62,517 | 0.99% | 1.37% | (h | ) | (h | ) | 71.31% | |||||||||||||||||||
Year Ended December 31, 2004 | $ | 9.94 | 0.14 | 1.59 | 1.73 | (0.14 | ) | (0.14 | ) | $ | 11.53 | 17.50% | $ | 112,202 | 0.94% | 1.41% | (h | ) | (h | ) | 31.95% | |||||||||||||||||||
Six Months Ended June 30, 2005 (Unaudited) | $ | 11.53 | 0.10 | (0.22 | ) | (0.12 | ) | (0.09 | ) | (0.09 | ) | $ | 11.32 | (1.04% | )(f) | $ | 107,201 | 0.93% | (g) | 1.71% | (g) | (h | ) | (h | ) | 15.41% | ||||||||||||||
Class II Shares | ||||||||||||||||||||||||||||||||||||||||
Period Ended December 31, 2003(d) | $ | 7.47 | 0.08 | 2.47 | 2.55 | (0.09 | ) | (0.09 | ) | $ | 9.93 | 34.20% | (f) | $ | 6,092 | 1.20% | (g) | 1.27% | (g) | 1.31% | (g) | 1.16% | (g) | 71.31% | ||||||||||||||||
Year Ended December 31, 2004 | $ | 9.93 | 0.11 | 1.58 | 1.69 | (0.12 | ) | (0.12 | ) | $ | 11.50 | 17.08% | $ | 34,312 | 1.20% | 1.20% | 1.28% | 1.11% | 31.95% | |||||||||||||||||||||
Six Months Ended June 30, 2005 (Unaudited) | $ | 11.50 | 0.08 | (0.21 | ) | (0.13 | ) | (0.08 | ) | (0.08 | ) | $ | 11.29 | (1.17% | )(f) | $ | 42,729 | 1.23% | (g) | 1.42% | (g) | 1.29% | (g) | 1.37% | (g) | 15.41% | ||||||||||||||
Class IV Shares | ||||||||||||||||||||||||||||||||||||||||
Period Ended December 31, 2003(e) | $ | 7.76 | 0.09 | 2.18 | 2.27 | (0.09 | ) | (0.09 | ) | $ | 9.94 | 29.38% | (f) | $ | 48,070 | 0.94% | (g) | 1.50% | (g) | (h | ) | (h | ) | 71.31% | ||||||||||||||||
Year Ended December 31, 2004 | $ | 9.94 | 0.15 | 1.57 | 1.72 | (0.14 | ) | (0.14 | ) | $ | 11.52 | 17.42% | $ | 55,683 | 0.91% | 1.42% | (h | ) | (h | ) | 31.95% | |||||||||||||||||||
Six Months Ended June 30, 2005 (Unaudited) | $ | 11.52 | 0.10 | (0.21 | ) | (0.11 | ) | (0.09 | ) | (0.09 | ) | $ | 11.32 | (0.94% | )(f) | $ | 54,188 | 0.91% | (g) | 1.73% | (g) | (h | ) | (h | ) | 15.41% | ||||||||||||||
| (a) | During the period certain fees were waived and/or reimbursed. If such waivers/reimbursements had not occurred, the ratios would have been as indicated. |
| (b) | Portfolio turnover is calculated on the basis of the Fund as a whole without distinguishing among the classes of shares. |
| (c) | The existing shares of the Fund were designated Class I shares as of May 1, 2001. |
| (d) | For the period from March 28, 2003 (commencement of operations) through December 31, 2003. |
| (e) | For the period from April 28, 2003 (commencement of operations) through December 31, 2003. |
| (f) | Not annualized. |
| (g) | Annualized. |
| (h) | There were no fee reductions during the period. |
See notes to financial statements.
11
Table of Contents
GARTMORE VARIABLE INSURANCE TRUST
NOTES TO FINANCIAL STATEMENTS (Unaudited)
June 30, 2005
1. Organization
Gartmore Variable Insurance Trust (“GVIT” or the “Trust”) is an open-end management investment company, organized under the laws of Delaware by an amended and restated Agreement and Declaration of Trust, dated October 28, 2004, as amended to date. The Trust, originally created under the laws of Massachusetts as a Massachusetts business trust pursuant to a Declaration of Trust dated, as of June 30, 1981, was subsequently amended, redomesticated as a Delaware Statutory Trust after the close of trading on April 29, 2005, and is registered under the Investment Company Act of 1940, as amended (the “1940 Act”). The redomestication is a change in statutory status and does not affect the operations of the Trust. On June 30, 2005, the Trust had authorized an unlimited number of shares of beneficial interest (“shares”) without par value. The Trust currently offers shares to life insurance company separate accounts to fund the benefits under variable life insurance or annuity policies. To date, only the separate accounts of Nationwide Life Insurance Company and Nationwide Life and Annuity Insurance Company (collectively, “Nationwide”) have purchased shares of the Trust’s series. The Trust operates thirty-one (31) separate series, or mutual funds, each with its own investment objectives and strategies. This report contains the financial statements and financial highlights of the Van Kampen GVIT Comstock Value Fund (the “Fund”).
Under the Trust’s organizational documents, the Trust’s officers and trustees are indemnified against certain liabilities arising out of the performance of their duties to the Trust. In addition, the Trust has entered into Indemnification Agreements with the Trust’s trustees and certain officers covering similar liabilities. In addition, in the normal course of business, the Trust enters into contracts with its vendors and others that provide for general indemnifications. The Trust’s maximum exposure under these arrangements is unknown, as this would involve future claims that may be made against the Trust. Based on experience, however, the Trust expects that risk of loss to be remote.
2. Summary of Significant Accounting Policies
The following is a summary of significant accounting policies followed by the Fund in the preparation of its financial statements. The policies are in conformity with accounting principles generally accepted in the United States of America (“GAAP”). The preparation of financial statements requires management to make estimates and assumptions that affect the reported amounts of assets and liabilities, the disclosure of contingent assets and liabilities at the date of the financial statements and the reported amounts of income and expenses for the period. Actual results could differ from those estimates.
| (a) | Security Valuation |
Securities for which market quotations are readily available are valued at current market value as of “Valuation Time.” Valuation Time is as of the close of regular trading on the New York Stock Exchange (usually 4 p.m. Eastern time). Equity securities are valued at the last quoted sale price or, if there is no sale price, the last quoted bid price provided by an independent pricing service approved by the Trust’s Board of Trustees. Prices are taken from the primary market or exchange in which each security trades. Most securities listed on a foreign exchange are valued either at fair value (see description below) or at the last sale price at the close of the exchange on which the security is principally traded. Foreign securities, currencies, and other assets and liabilities denominated in foreign currencies are translated into U.S. dollars at the exchange rate of said currencies against the U.S. Dollar, as of Valuation Time, as provided by an independent pricing service approved by the Board of Trustees.
Debt (including defaulted issues) and other fixed income securities (other than short-term obligations) are valued at the last quoted bid price and/or by using a combination of daily quotes and matrix evaluations provided by an independent pricing service, the use of which has been approved by the Trust’s Board of Trustees. Short-term debt securities, such as commercial paper and U.S. Treasury Bills having a remaining maturity of 60 days or less at the time of purchase, are considered to be “shortterm” and are valued at amortized cost which approximates market value.
Securities for which market quotations are not readily available, or for which an independent pricing service does not provide a value or provides a value that does not represent fair value in the judgment of the Fund’s investment adviser or designee, are valued at fair value under procedures approved by the Trust’s Board of Trustees. The “Fair Value” of these securities is determined in good faith by taking into account relevant factors and surrounding circumstances. Methods utilized to obtain a “Fair Value” may include the following non-exclusive list of SEC-acceptable methods: (i) a multiple of earnings; (ii) the discount from market value of a similar, freely traded security; (iii) the yield-to-maturity for debt issues; or (iv) a
12
Table of Contents
GARTMORE VARIABLE INSURANCE TRUST
NOTES TO FINANCIAL STATEMENTS (Unaudited) (Continued)
June 30, 2005
consolidation of the methods. The Gartmore Fair Value Committee considers a non-exclusive list of factors to arrive at the appropriate method upon determining “Fair Value.” For example, fair value determinations are required for securities whose value is affected by a “significant” event that materially affects the value of a domestic or foreign security which occurs subsequent to the time of the close of the principal market on which such domestic or foreign security trades and before the Valuation Time (i.e., a “subsequent event”). Typically, this will involve events occurring after the close of a foreign market on which a security trades and before the next Valuation Time.
The Fund values foreign securities at fair value in the circumstances described below. Generally, trading in foreign securities markets is completed each day at various times prior to the Valuation Time. Due to the time differences between the closings of the relevant foreign securities exchanges and the Valuation Time for the Fund, the Fund will fair value its foreign investments when it is determined that the market quotations for the foreign investments either are not readily available or are unreliable and, therefore, do not represent fair value. When the fair value prices are utilized, these prices will attempt to reflect the impact of the U.S. financial markets’ perceptions and trading activities on the Fund’s foreign investments since the last closing prices of the foreign investments were calculated on their primary foreign securities markets or exchanges. For these purposes, the Board of Trustees of the Trust has determined that movements in relevant indices or other appropriate market indicators, after the close of the foreign securities exchanges, may demonstrate that market quotations are unreliable, and may trigger fair value pricing for certain securities. Consequently, fair valuation of portfolio securities may occur on a daily basis. In determining fair value prices, the Trust utilizes data furnished by an independent pricing service (and that data draws upon, among other information, the market values of foreign investments). The fair value prices of portfolio securities generally will be used when it is determined that the use of these prices will have a material impact on the net asset value of the Fund. When the Fund uses fair value pricing, the values assigned to the Fund’s foreign investments may not be the quoted or published prices of the investments on their primary markets or exchanges.
| (b) | Repurchase Agreements |
The Fund may enter into repurchase agreements with an entity which is a member of the Federal Reserve System or which is a “primary dealer” (as designated by the Federal Reserve Bank of New York) in U.S. Government obligations. The repurchase price generally equals the price paid by the Fund plus interest negotiated on the basis of current short-term rates, which may be more or less than the rate on the underlying portfolio securities. The seller under a repurchase agreement is required to maintain the value of the collateral held pursuant to the agreement at a market value equal to or greater than the repurchase price (including accrued interest). Collateral subject to repurchase agreements is held by the Fund’s custodian or another qualified sub-custodian or in the Federal Reserve/Treasury book-entry system. If the counterparty defaults and the fair value of the collateral declines, realization of the collateral by the Fund may be delayed or limited. The Fund may transfer uninvested cash balances into a pooled cash account. These balances are invested in one or more repurchase agreements, which are fully collateralized by AA-rated Corporate Bonds with the counterparties of CS First Boston and Nomura Securities.
| (c) | Futures Contracts |
The Fund may invest in financial futures contracts (“futures contracts”) for the purpose of hedging its existing portfolio securities or securities that the Fund intends to purchase against fluctuations in value caused by changes in prevailing market interest rates or prices. Futures contracts may also be entered into for non-hedging purposes.
Upon entering into a futures contract, the Fund is required to pledge to the broker an amount of cash and/or other assets equal to a certain percentage of the contract amount (initial margin deposit). Subsequent payments, known as “variation margin,” are made each day, depending on the daily fluctuations in the fair value/market value of the underlying assets. A gain or loss equal to the daily variation margin is recognized on a daily basis. Futures contracts are valued daily at their last quoted sale price.
A “sale” of a futures contract means a contractual obligation to deliver the securities or foreign currency called for by the contract at a fixed price at a specified time in the future. A “purchase” of a futures contract means a contractual obligation to acquire the securities or foreign currency at a fixed price at a specified time in the future.
Should market conditions change unexpectedly, the Fund may not achieve the anticipated benefits of the futures contracts and may realize a loss. The use of futures transactions for hedging purposes involves the risk of imperfect correlation in movements in the price of futures contracts, interest rates, and the value of the underlying hedged assets.
13
Table of Contents
GARTMORE VARIABLE INSURANCE TRUST
NOTES TO FINANCIAL STATEMENTS (Unaudited) (Continued)
June 30, 2005
| (d) | Written Options Contracts |
The Fund may write options contracts. A written option obligates the Fund to deliver (written call) or to receive (written put) a specified quantity of an underlying asset at the contract amount upon exercise by the holder of the option. The value of the option contract is recorded as a liability and unrealized gain or loss is measured by the difference between the current value and the premium received. Options traded on an exchange are valued at the last quoted sale price, or in the absence of a sale, the bid price provided by an independent pricing service approved by the Board of Trustees. Non-exchange traded options are valued using dealer supplied quotes.
| (e) | Security Transactions and Investment Income |
Security transactions are accounted for on the date the security is purchased or sold (“trade date”). Securities gains and losses are calculated on the identified cost basis. Interest income is recognized on the accrual basis and includes, where applicable, the amortization or accretion of premium or discount. Dividend income is recorded on the ex-dividend date.
| (f) | Securities Lending |
To generate additional income, the Fund may lend up to 33 1/3% of the Fund’s total assets pursuant to agreements, requiring that the borrower deliver cash or securities as collateral with respect to each new loan of U.S. securities, equal to at least 102% of the value of the portfolio securities loaned, and with respect to each new loan of non-U.S. securities, collateral of at least 105% of the value of the portfolio securities loaned, and thereafter requiring the borrower to mark to market the collateral on a daily basis and requiring the borrower to make up any shortfall of collateral. The Fund receives payments from borrowers equivalent to the dividends and interest that would have been earned on securities lent while simultaneously seeking to earn income on the investment of cash collateral. Collateral is marked to market daily to provide a level of collateral at least equal to the market value of securities loaned. There may be risks of delay in recovery of the securities should the borrower of the securities fail financially. Loans will be made, however, only to borrowers deemed by the Fund’s investment adviser to be of good standing and creditworthy under guidelines established by the Board of Trustees and when, in the judgment of the adviser, the consideration which can be earned currently from these securities loans justifies the attendant risks. Loans are subject to termination by the Fund or the borrower at any time, and, therefore, are not considered to be illiquid investments. JPMorgan Chase Bank serves as custodian for the securities lending program of the Fund. JPMorgan Chase Bank receives a custody fee based on the value of collateral received from borrowers.
The cash collateral received by the Fund was pooled and, at June 30, 2005, was invested in the following:
Security Type | Security Name | Market Value | Maturity Rate | Maturity Date | |||||
| Domestic Certificates of Deposit — Fixed | Washington Mutual Bank FA | $ | 700,182 | 3.15% | 08/01/05 | ||||
| Funding Agreement | GE Life and Annutiy | 500,000 | 3.32% | 07/14/05 | |||||
| Medium Term Note — Floating | General Electric Capital Corp. | 1,000,171 | 3.37% | 09/08/05 | |||||
| Repurchase Agreements | Nomura Securities | 13,116,541 | 3.48% | 07/01/05 | |||||
| As | of June 30, 2005, the Fund had securities with the following market values on loan: |
| Market Value of Loaned Securities | Market Value of Collateral | |||||
| $ | 15,045,859 | $ | 15,316,894 | |||
| (g) | Distributions to Shareholders |
The Fund’s dividends from net investment income, if any, are declared and paid quarterly. The Fund’s distributable net realized capital gains, if any, are declared and distributed at least annually.
Dividends and distributions to shareholders are determined in accordance with federal income tax regulations, which may differ from GAAP. These “book/tax” differences are considered either permanent or temporary in nature. In accordance with the American Institute of Certified Public Accountants (“AICPA”) Statement of Position 93-2, permanent differences (i.e., reclassification of market discounts, gain/loss, paydowns, and distributions) are reclassified within the capital accounts based
14
Table of Contents
GARTMORE VARIABLE INSURANCE TRUST
NOTES TO FINANCIAL STATEMENTS (Unaudited) (Continued)
June 30, 2005
on their nature for federal income tax purposes; temporary differences do not require reclassification. These reclassifications have no effect upon the net asset value of the Fund. To the extent distributions exceed current and accumulated earnings and profits for federal income tax purposes, these distributions are reported as distributions of paid-in-capital.
| (h) | Federal Income Taxes |
It is the policy of the Fund to qualify or continue to qualify as a “regulated investment company” by complying with the provisions available to certain investment companies, as defined in applicable sections of the U.S. Internal Revenue Code, and to make distributions of net investment income and net realized capital gains sufficient to relieve the Fund from all, or substantially all, federal income taxes.
As of June 30, 2005, the tax cost of securities and the breakdown of unrealized appreciation (depreciation) for the Fund is as follows:
Tax Cost of | Unrealized Appreciation | Unrealized Depreciation | Net Unrealized Appreciation (Depreciation) | |||||||
$ 1,647,659 | $ | 20,271,723 | $ | (5,075,596 | ) | $ | 15,196,127 | |||
| (i) | Allocation of Expenses, Income, and Gains and Losses |
Expenses directly attributable to the Fund are charged to the Fund. Expenses not directly attributable to the Fund are allocated proportionately among various or all funds within the Trust. The method used by the Fund for allocating income, fund level expenses, and realized and unrealized gains or losses is based on the fair value of shares outstanding relative to net assets. Under this method, each class of shares participates based on the total net asset value of that class’s shares in proportion to the total net assets of the Fund. Expenses specific to a class (such a rule 12b-1 and administrative services fees) are charged to that class.
3. Transactions with Affiliates
Under the terms of the Trust’s Investment Advisory Agreement, Gartmore Mutual Fund Capital Trust (“GMF”) manages the investment of the assets and supervises the daily business affairs of the Fund. GMF is a wholly-owned subsidiary of Gartmore Global Investments, Inc. (“GGI”), a holding company. GGI is a majority-owned subsidiary of Gartmore Global Asset Management Trust (“GGAMT”). GGAMT is a wholly-owned subsidiary of Nationwide Corporation. All of the common stock of Nationwide Corporation is held by Nationwide Mutual Insurance Company (95.2%) and Nationwide Mutual Fire Insurance Company (4.8%), each of which is a mutual company owned by its policyholders. In addition, GMF provides investment management evaluation services in initially selecting and monitoring, on an ongoing basis, the performance of the subadviser, for the Fund that GMF advises. Van Kampen Asset Management, Inc. (the “subadviser”), manages all of the Fund’s investments and has the responsibility for making all investment decisions for the Fund.
Under the terms of the Investment Advisory Agreement, the Fund pays GMF an investment advisory fee based on that Fund’s average daily net assets. From such fees, pursuant to the subadvisory agreement, GMF pays fees to the subadviser. Additional information regarding investment advisory fees and subadvisory fees for GMF and the subadviser is as follows for the six months ended June 30, 2005:
| Fee Schedule | Total Fees | Fees Retained | Paid to Sub-adviser | |||
Up to $50 million | 0.80% | 0.45% | 0.35% | |||
Next $200 million | 0.65% | 0.35% | 0.30% | |||
Next $250 million | 0.60% | 0.35% | 0.25% | |||
$500 million or more | 0.55% | 0.35% | 0.20% |
Effective May 1, 2005, GMF and the Fund have entered into a written contract (“Expense Limitation Agreement”) that limits operating expenses from exceeding 0.95% for Class IV shares until at least May 1, 2006.
15
Table of Contents
GARTMORE VARIABLE INSURANCE TRUST
NOTES TO FINANCIAL STATEMENTS (Unaudited) (Continued)
June 30, 2005
GMF may request and receive reimbursement from the Fund of the advisory fees waived and other expenses reimbursed by GMF, respectively, pursuant to the Expense Limitation Agreement at a later date not to exceed three years from the fiscal year in which the corresponding reimbursement to the Fund was made, depending on the Fund (as described below), if the Fund has reached a sufficient asset size to permit reimbursement to be made without causing the total annual operating expense ratio of the Fund to exceed the limits set forth above. No reimbursement will be made unless: (i) the Fund’s assets exceed $100 million; (ii) the total annual expense ratio of the Class making such reimbursement is less than the limit set forth above; and (iii) the payment of such reimbursement is approved by the Board of Trustees on a quarterly basis. Except as provided for in the Expense Limitation Agreements, reimbursement of amounts previously waived or assumed by GMF is not permitted.
As of the six months ended June 30, 2005, the cumulative potential reimbursements for the Class IV shares of the Fund, based on reimbursements which expires within three years from the fiscal year in which the corresponding reimbursement to the Fund was made for expenses reimbursed by GMF would be:
Amount | Amount Fiscal Year 2004 | Amount Six Months Ended April 30, 2005 | ||||
$1,369 | $ | 14,072 | $ | 10,247 | ||
Under the terms of a Fund Administration and Transfer Agency Agreement, Gartmore SA Capital Trust (“GSA”) provides the Fund with various administrative and accounting services, and Gartmore Investors Services, Inc. (“GISI”), an indirect subsidiary of GSA, serves as Transfer and Dividend Disbursing Agent for the Fund. The fees for the services provided under this Agreement are calculated based on the Trust’s average daily net assets according to the fee schedule below. The fees are then allocated proportionately among all funds within the Trust in relation to the average daily net assets of each fund and are paid to GSA. GSA pays GISI from these fees for its services.
| Combined Fee Schedule* | ||
Up to $1 billion | 0.13% | |
$1 billion and more up to $3 billion | 0.08% | |
$3 billion and more up to $8 billion | 0.05% | |
$8 billion and more up to $10 billion | 0.04% | |
$10 billion and more up to $12 billion | 0.02% | |
$12 billion or more | 0.01% | |
| * | The assets of the Gartmore GVIT Investor Destinations Aggressive Fund, the Gartmore GVIT Investor Destinations Moderately Aggressive Fund, the Gartmore GVIT Investor Destinations Moderate Fund, the Gartmore GVIT Investor Destinations Moderately Conservative Fund, and the Gartmore GVIT Investor Destinations Conservative Fund (collectively, the “Investor Destinations Funds”) are excluded from the Trust asset level amount in order to calculate this asset-based fee. The Investor Destinations Funds do not pay any part of this fee. |
Effective January 1, 2005, the fee for the fund administration and transfer agency services increased as set forth below. The fees are calculated based on the Trust’s average daily net assets according to the fee schedule below. The fees are then allocated proportionately among all funds within the Trust in relation to the average daily net assets of each fund and are paid to GSA.
| Combined Fee Schedule* | ||
Up to $1 billion | 0.15% | |
$1 billion and more up to $3 billion | 0.10% | |
$3 billion and more up to $8 billion | 0.05% | |
$8 billion and more up to $10 billion | 0.04% | |
$10 billion and more up to $12 billion | 0.02% | |
$12 billion or more | 0.01% | |
| * | The assets of each of the Investor Destinations Funds are excluded from the Trust asset level amount in order to calculate this asset-based fee. The Investor Destinations Funds do not pay any part of this fee. |
16
Table of Contents
GARTMORE VARIABLE INSURANCE TRUST
NOTES TO FINANCIAL STATEMENTS (Unaudited) (Continued)
June 30, 2005
GSA and GISI have entered into agreements with BISYS Fund Services Ohio, Inc. (“BISYS”), pursuant to which BISYS provides sub-administration and sub-transfer agency services, respectively, to the Fund.
Under the terms of a Distribution Plan under Rule 12b-1 of the 1940 Act, Gartmore Distribution Services, Inc. (“GDSI”), the Fund’s Distributor, is compensated by the Fund for expenses associated with the distribution of the Class II of the Fund. These fees are based on average daily net assets of Class II shares of the Fund at an annual rate not to exceed 0.25%.
Under the terms of an Administrative Services Plan, the Fund may pay fees to servicing organizations, such as broker-dealers, including Nationwide Financial Services, and financial institutions, which agree to provide administrative support services to the shareholders of certain classes. These services include, but are not limited, to the following: establishing and maintaining shareholder accounts; processing purchase and redemption transactions; arranging bank wires; performing shareholder sub-accounting; answering inquires regarding the Fund; and other such services. These fees are based on an annual rate of up to 0.25% of the average daily net assets of each class of shares of the Fund.
As of June 30, 2005, the advisers or affiliates of the advisers directly held 10% of the shares outstanding of the Fund.
4. Investment Transactions
For the six months ended June 30, 2005, (excluding short-term securities) the Fund had purchases of $33,382,822 and sales of $28,444,841.
5. Bank Loans
The Trust has a credit agreement of $100,000,000. Borrowings under this arrangement bear interest at the Federal Funds rate plus 0.50%. The interest costs are included in custodian fees in the Statement of Operations. No compensation balances were required under the terms of the line of credit. There were no borrowings outstanding as of June 30, 2005.
6. Shareholder Meeting
A separate shareholders meeting was held on Tuesday, December 23, 2004, for the shareholders of the Trust’s predecessor pursuant to a Proxy Statement On Schedule 14A, dated October 29, 2004, and mailed to the shareholders of the Trust’s predecessor on or around November 5, 2004.
Two Proposals: The purpose of the December 23, 2004 meeting was to allow the shareholders of the Trust’s predecessor to vote on:
| i. | Proposal One: The election of the Trust’s Board of Trustees; and |
| ii. | Proposal Two: The approval of an “Agreement and Plan of Reorganization” that provided for the reorganization of the Trust from a Massachusetts business trust into a Delaware statutory trust. |
Proposal One: As set forth in the October 29, 2004 Proxy Statement, the nominees for election as Trustees of the Trust’s predecessor were: Charles E. Allen, Michael J. Baresich, Paula H.J. Cholmondeley, C. Brent DeVore, Phyllis Kay Dryden, Robert M. Duncan, Barbara L. Hennigar, Paul J. Hondros, Barbara I Jacobs, Thomas J. Kerr IV, Douglas F. Kridler, Michael D. McCarthy, Arden L. Shisler, and David C. Wetmore.
Proposal Two: As specifically set forth in the October 29, 2004 Proxy Statement, the Reorganization proposal requested the shareholders of the Trust’s predecessor to approve the proposed “Agreement and Plan of Reorganization” of the Trust’s predecessor (on behalf of each of the its funds) into a new Delaware-domiciled Trust, whereby the Funds of the new Delaware Trust would acquire all of the assets of the corresponding funds of the Trust’s predecessor subject to the liabilities, expenses, costs, charges, and reserves of the corresponding funds of the Trust’s predecessor (contingent or otherwise), in exchange for shares of the acquiring Funds to be distributed pro rata by the Trust to the holders of the shares of the funds of the Trust’s predecessor, in a complete liquidation of the Trust’s predecessor.
17
Table of Contents
GARTMORE VARIABLE INSURANCE TRUST
NOTES TO FINANCIAL STATEMENTS (Unaudited) (Continued)
June 30, 2005
Voting Results:
The shareholders of the Trust’s predecessor voted to approve both Proposal One and Proposal Two, as follows:
Proposal 1: Election of a Board of Trustees of Gartmore Variable Insurance Trust
Charles E. Allen: | ||
FOR | 2,797,230,318.955 shares (96.078%) | |
WITHHOLD | 114,195,693.660 shares (3.922%) | |
TOTAL | 2,912,726,012.615 shares (100.000%) | |
Michael J. Baresich: | ||
FOR | 2,796,135,979.559 shares (96.040%) | |
WITHHOLD | 115,290,033.056 shares (3.960%) | |
TOTAL | 2,912,726,012.615 shares (100.000%) | |
Paula H.J. Cholmondeley: | ||
FOR | 2,795,095,945.396 shares (96.004%) | |
WITHHOLD | 116,330,067.219 shares (3.996%) | |
TOTAL | 2,912,726,012.615 shares (100.000%) | |
C. Brent DeVore: | ||
FOR | 2,797,207,046.916 shares (96.077%) | |
WITHHOLD | 114,218,965.699 shares (3.923%) | |
TOTAL | 2,912,726,012.615 shares (100.000%) | |
Phyllis Kay Dryden: | ||
FOR | 2,795,587,023.994 shares (96.021%) | |
WITHHOLD | 115,838,988.621 shares (3.979%) | |
TOTAL | 2,912,726,012.615 shares (100.000%) | |
Robert M. Duncan: | ||
FOR | 2,790,191,720.503 shares (95.836%) | |
WITHHOLD | 121,234,292.112 shares (4.164%) | |
TOTAL | 2,912,726,012.615 shares (100.000%) | |
Barbara L. Hennigar: | ||
FOR | 2,792,939,848.858 shares (95.937%) | |
WITHHOLD | 118,486,163.757 shares (4.070%) | |
TOTAL | 2,912,726,012.615 shares (100.000%) | |
Paul J. Hondros: | ||
FOR | 2,797,557,404.448 shares (96.089%) | |
WITHHOLD | 113,868,608.167 shares (3.911%) | |
TOTAL | 2,912,726,012.615 shares (100.000%) | |
18
Table of Contents
GARTMORE VARIABLE INSURANCE TRUST
NOTES TO FINANCIAL STATEMENTS (Unaudited) (Continued)
June 30, 2005
Barbara I. Jacobs: | ||
FOR | 2,796,306,126.654 shares (96.046%) | |
WITHHOLD | 115,119,885.961 shares (3.954%) | |
TOTAL | 2,912,726,012.615 shares (100.000%) | |
Thomas J. Kerr IV: | ||
FOR | 2,789,755,720.087 shares (95.821%) | |
WITHHOLD | 121,670,292.528 shares (4.179%) | |
TOTAL | 2,912,726,012.615 shares (100.000%) | |
Douglas F. Kridler: | ||
FOR | 2,798,065,774.375 shares (96.106%) | |
WITHHOLD | 113,360,238.240 shares (3.894%) | |
TOTAL | 2,912,726,012.615 shares (100.000%) | |
Michael D. McCarthy: | ||
FOR | 2,797,452,613.694 shares (96.085%) | |
WITHHOLD | 113,973,395.921 shares (3.915%) | |
TOTAL | 2,912,726,012.615 shares (100.000%) | |
Arden L. Shisler: | ||
FOR | 2,796,738,454.730 shares (96.061%) | |
WITHHOLD | 114,687,557.885 shares (3.939%) | |
TOTAL | 2,912,726,012.615 shares (100.000%) | |
David C. Wetmore: | ||
FOR | 2,794,784,752.247 shares (95.994%) | |
WITHHOLD | 116,641,260.368 shares (4.006%) | |
TOTAL | 2,912,726,012.615 shares (100.000%) | |
Proposal 2: Approval of the Agreement and Plan of Reorganization of Gartmore Variable Insurance Trust
FOR | 2,561,003,822.546 shares (87.964%) | |
AGAINST | 103,593,261.010 shares (3.558%) | |
ABSTAIN | 246,828,929.059 shares (8.478%) | |
TOTAL | 2,912,726,012.615 shares (100.000%) | |
19
Table of Contents
GARTMORE VARIABLE INSURANCE TRUST
Management Information (Unaudited)
June 30, 2005
Trustees who are not Interested Persons (as defined in the 1940 Act) and Officers of the Funds June 30, 2005
| Name, Address and Date of Birth | Position(s) Held with the Trust and Length of Time Served1 | Principal Occupation(s) During Past 5 Years | Number of Portfolios in the Gartmore Fund Complex Overseen by Trustee | Other Directorships Held by Trustee or Nominee2 | ||||
Charles E. Allen
c/o Gartmore Global Investments, Inc. 1200 River Road, Suite 1000 Conshohocken, PA 19428
1948 | Trustee since July 2000 | Mr. Allen is Chairman, Chief Executive Officer and President of the Graimark Realty Advisors, Inc. (real estate development, investment and asset management). | 84 | None | ||||
Paula H.J. Cholmondeley
c/o Gartmore Global Investments, Inc. 1200 River Road, Suite 1000 Conshohocken, PA 19428
1940 | Trustee since July 2000 | Ms. Cholmondeley has been the Chairman and Chief Executive Officer of the Sorrel Group, a management consulting company, since January 2004. From March 2000 through December 2003, Ms. Cholmondeley was Vice President and General Manager of Sappi Fine Paper North America. Prior thereto, Ms. Cholmondeley was Vice President and General Manager of Residential Insulation of Owens Corning. | 84 | Director of Dentsply International, Inc., Ultralife Batteries, Inc., Terex Corporation, Minerals Technology, Inc. and Albany International Corp. | ||||
C. Brent DeVore
c/o Gartmore Global Investments, Inc. 1200 River Road, Suite 1000 Conshohocken, PA 19428
1940 | Trustee since 1990 | Dr. DeVore is President of Otterbein College. | 84 | None | ||||
Phyllis K. Dryden
c/o Gartmore Global Investments, Inc. 1200 River Road, Suite 1000 Conshohocken, PA 19428
1947 | Trustee since December 2004 | Ms. Dryden was a former Managing Partner of marchFIRST, a global management consulting firm prior to 2002. | 84 | None |
20
Table of Contents
GARTMORE VARIABLE INSURANCE TRUST
Management Information (Unaudited)
June 30, 2005
| Name, Address and Date of Birth | Position(s) Held with the Trust and Length of Time Served1 | Principal Occupation(s) During Past 5 Years | Number of Portfolios in the Gartmore Fund Complex Overseen by Trustee | Other Directorships Held by Trustee or Nominee2 | ||||
Barbara L. Hennigar*
c/o Gartmore Global Investments, Inc. 1200 River Road, Suite 1000 Conshohocken, PA 19428
1935 | Trustee since July 2000 | Retired since June 2000. Prior thereto, Ms. Hennigar was the Chairman or President and Chief Executive Officer of OppenheimerFunds Services and a member of the Executive Committee of OppenheimerFunds. | 84 | None | ||||
Barbara I. Jacobs
c/o Gartmore Global Investments, Inc. 1200 River Road, Suite 1000 Conshohocken, PA 19428
1950 | Trustee since December 2004 | Ms. Jacobs has served as Chairman of the Board of Directors of KICAP Network Fund, a European (United Kingdom) hedge fund, since December 2000. Prior to 2004, Ms. Jacobs was also a Managing Director and European Portfolio Manager with CREF Investments (Teachers Insurance Annuity Association — College Retirement Equity Fund). | 84 | None | ||||
Douglas F. Kridler
c/o Gartmore Global Investments, Inc. 1200 River Road, Suite 1000 Conshohocken, PA 19428
1955 | Trustee since September 1997 | Mr. Kridler has served as the President and Chief Executive Officer of the Columbus Foundation (a Columbus, OH-based foundation which manages over 1,300 individual endowment funds) since February 2002. Mr. Kridler was the President of the Columbus Association for the Performing Arts prior thereto and Chairman of the Greater Columbus Convention and Visitors Bureau during 2000 and 2001. | 84 | None | ||||
Michael D. McCarthy
c/o Gartmore Global Investments, Inc. 1200 River Road, Suite 1000 Conshohocken, PA 19428
1947 | Trustee since December 2004 | Mr. McCarthy serves as: the Founder and Chairman of The Eureka Foundation (which sponsors and funds the “Great Museums” series on PBS); and a Partner of Pineville Properties LLC (a commercial real estate development firm). | 843 | None |
21
Table of Contents
GARTMORE VARIABLE INSURANCE TRUST
Management Information (Unaudited)
June 30, 2005
| Name, Address and Date of Birth | Position(s) Held with the Trust and Length of Time Served1 | Principal Occupation(s) During Past 5 Years | Number of Portfolios in the Gartmore Fund Complex Overseen by Trustee | Other Directorships Held by Trustee or Nominee2 | ||||
David C. Wetmore
c/o Gartmore Global Investments, Inc. 1200 River Road, Suite 1000 Conshohocken, PA 19428
1948 | Trustee since 1995 and Chairman since February 2005 | Retired. Mr. Wetmore was formerly a Managing Director of Updata Capital, an investment banking and venture capital firm. | 84 | None |
| * | Pursuant to the Trust’s mandatory retirement policy, Ms. Hennigar is expected to retire on or about January 12, 2006. |
| 1 | The term of office length is until a trustee resigns or reaches a mandatory retirement age of 70. On March 2, 2000, the Board adopted a five-year implementation period for any Trustee 65 or older as of the adoption of this policy. Pursuant to this policy, Messrs. Duncan and Kerr retired as trustees effective as of March 12, 2005. |
| 2 | Directorships held in (1) any other investment companies registered under the 1940 Act, (2) any company with a class of securities registered pursuant to Section 12 of the Securities Exchange Act of 1934, as amended (the “Exchange Act”), or (3) any company subject to the requirements of Section 15(d) of the Exchange Act. |
| 3 | Mr. McCarthy was also an Administrative Committee Member for the Alphagen Arneb Fund, LLC, The Healthcare Fund LDC, The Leaders Long-Short Fund, LLC, and The Leaders Long-Short Fund LDC, four private investment companies (hedge funds) managed by GSA. Mr. McCarthy resigned as an Administrative Committee Member effective June 30, 2005. |
Trustees and Officers who are not Interested Persons (as defined in the 1940 Act) of the Funds received aggregate compensation of $274,882 from the Trust for the Six Months Ended June 30, 2005. Additional information regarding the Trustees and Officers may be found in the Trust’s statement of additional information, which is available without charge upon request, by calling 1-800-848-0920.
22
Table of Contents
GARTMORE VARIABLE INSURANCE TRUST
Management Information (Unaudited)
June 30, 2005
Trustees who are Interested Persons (as defined in the 1940 Act) and/or Officers of the Funds June 30, 2005
| Name, Address and Age | Position(s) Held with the Trust and Length of Time Served1 | Principal Occupation(s) During Past 5 Years | Number of Portfolios in the Gartmore Fund Complex Overseen by Trustee | Other Directorships Held by Trustee2 | ||||
Paul J. Hondros
Gartmore Global Investments, Inc. 1200 River Road, Suite 1000 Conshohocken, PA 19428
1948 | Trustee since July 2000 | Mr. Hondros has been President and Chief Executive Officer of various Gartmore entities, including Gartmore Distribution Services, Inc. (“GDSI”),3 Gartmore Investor Services, Inc. (“GISI”),3 Gartmore Morley Capital Management, Inc. (“GMCM”),3 Gartmore Morley Financial Services, Inc. (“GMFS”),3 NorthPointe Capital, LLC (“NorthPointe”),3 Gartmore Global Asset Management Trust (“GGAMT”)3, Gartmore Global Investments, Inc. (“GGI”)3, Gartmore Mutual Fund Capital Trust (“GMFCT”)3 and Gartmore SA Capital Trust (“GSA”)3; and a Director of Nationwide Securities, Inc.3, as well as several entities within Nationwide Financial Services, Inc. | 844 | None | ||||
Arden L. Shisler
c/o Gartmore Global Investments, Inc. 1200 River Road, Suite 1000 Conshohocken, PA 19428
1941 | Trustee since February 2000 | Mr. Shisler has been a consultant since January 2003. Prior thereto, he was President and Chief Executive Officer of K&B Transport, Inc., a trucking firm. Since 1992, Mr. Shisler has also been Chairman of the Board for Nationwide Mutual Insurance Company3. | 84 | Director of Nationwide Financial Services, Inc. | ||||
Gerald J. Holland
Gartmore Global Investments, Inc. 1200 River Road, Suite 1000 Conshohocken, PA 19428
1951 | Treasurer since March 2001 | Mr. Holland is Senior Vice President - Operations for GGI3, GMFCT3 , and GSA3. Prior to July 2000, Mr, Holland was Vice President for First Data Investor Services, an investment company service provider. | 84 | None |
23
Table of Contents
GARTMORE VARIABLE INSURANCE TRUST
Management Information (Unaudited)
June 30, 2005
| Name, Address and Age | Position(s) Held with the Trust and Length of Time Served1 | Principal Occupation(s) During Past 5 Years | Number of Portfolios in the Gartmore Fund Complex Overseen by Trustee | Other Directorships Held by Trustee2 | ||||
Michael A. Krulikowski
Gartmore Global Investments, Inc. 1200 River Road, Suite 1000 Conshohocken, PA 19428
1959 | Chief Compliance Officer since June 2004 | Since November 1999, Mr. Krulikowski has served as a Vice President and Chief Compliance Officer of GGI. Prior thereto, Mr. Krulikowski served as Chief Compliance Officer of 1717 Capital Management Company/Provident Mutual Insurance Company. | 84 | None | ||||
Eric E. Miller
Gartmore Global Investments, Inc. 1200 River Road, Suite 1000 Conshohocken, PA 19428
1953 | Secretary since December 2002 | Mr. Miller is Senior Vice President, Chief Counsel for GGI3, GMFCT3 and GSA3 since August 2002. From August 2000 to August 2002, Mr. Miller was a Partner with Stradley Ronan Stevens & Young, LLP. Prior to August 2000, Mr. Miller served as Senior Vice President and Deputy General Counsel at Delaware Investments. | 84 | None |
| 1 | The term of office length is until a trustee resigns or reaches a mandatory retirement age of 70. On March 2, 2000, the Board adopted a five-year implementation period for any Trustee 65 or older as of the adoption of this policy. Pursuant to this policy, Messrs. Duncan and Kerr retired as trustees effective as of March 12, 2005. |
| 2 | Directorships held in (1) any other investment companies registered under the 1940 Act, (2) any company with a class of securities registered pursuant to Section 12 of the Securities Exchange Act of 1934, as amended (the “Exchange Act”), or (3) any company subject to the requirements of Section 15(d) of the Exchange Act. |
| 3 | This position is held with an affiliated person or principal underwriter of the Trust. |
| 4 | Mr. Hondros was also an Administrative Committee Member for the Alphagen Arneb Fund, LLC, The Healthcare Fund LDC, The Leaders Long-Short Fund, LLC, and The Leaders Long-Short Fund LDC, four private investment companies (hedge funds) managed by GSA. Mr. Hondros resigned as Administrative Committee Member effective June 30, 2005. |
Federal law requires the Trust, each of its investment advisers and sub-advisers to adopt procedures for voting proxies (“Proxy Voting Guidelines”) and to provide a summary of those Proxy Voting Guidelines used to vote the securities held by the Funds. The Funds’ proxy voting policies and procedures are available without charge (i) upon request, by calling 1-800-848-0920, (ii) on the Fund’s website at www.gartmorefunds.com, or (iii) on the Securities and Exchange Commission’s website at www.sec.gov.
24
Table of Contents
Federated GVIT High Income Bond Fund
Semiannual Report
| | June 30, 2005 |
| Contents | ||
| 5 | Statement of Investments | |
| 16 | Statement of Assets and Liabilities | |
| 16 | Statement of Operations | |
| 17 | Statements of Changes in New Assets | |
| 18 | Financial Highlights | |
| 19 | Notes to Financial Statements | |
Commentary provided by Gartmore Global Investments, investment adviser to Gartmore Variable Insurance Trust. All opinions and estimates included in this report constitute Gartmore Global Investments’ judgment as of the date of this report and are subject to change without notice.
Statement Regarding Availability of Quarterly Portfolio Schedule.
The Gartmore Variable Insurance Trust files complete schedules of portfolio holdings for each Fund with the Securities and Exchange Commission (the “Commission”) for the first and third quarters of each fiscal year on Form N-Q. The Funds’ Forms N-Q are available on the Commission’s website at http://www.sec.gov. The Funds’ Forms N-Q may be reviewed and copied at the Commission’s Public Reference Room in Washington, DC, and information on the operation of the Public Reference Room may be obtained by calling 800-SEC-0330; and the Funds make the information on Form N-Q available to shareholders upon request without charge.
Statement Regarding Availability of Proxy Voting Record.
Information regarding how the Fund voted proxies relating to portfolio securities held during the most recent 12-month period ended June 30, 2005 is available without charge, upon request, by calling 800-848-0920, and on the Commission’s website at http://www.sec.gov.
Table of Contents
Federated GVIT High Income Bond Fund
For the semiannual period ended June 30, 2005, the Federated GVIT High Income Bond Fund returned -0.15% (Class I at NAV) versus 1.11% for its benchmark, the Lehman Brothers U.S. Corporate High Yield Bond Index. For broader comparison, the average return for the Fund’s Lipper peer category of High Current Yield Funds was 0.45%.
During the reporting period, the high-yield bond market underperformed the high-quality bond market, evidenced by the fact that the Fund’s benchmark index returned 1.11% versus a 2.51% return for the Lehman Brothers U.S. Aggregate Index, a measure of high-quality bond performance. The general interest-rate environment was mixed. For example, the interest rate on shorter-maturity Treasury securities rose in response to the Federal Reserve’s “measured” rise in the federal funds rate, while interest rates for longer-maturity Treasury securities fell. This drop was a response to strong demand for those securities, modest inflation expectations, and concerns about the sustainability of the U.S. economic expansion in light of the Fed’s interest-rate policy and historically high oil prices.
Economic concerns coupled with ratings downgrades and earnings weakness at General Motors Corp. and Ford Motor Co. hurt the high-yield market in comparison to the higher- quality bond markets. For example, the risk premium or spread between the Credit Suisse First Boston High Yield Bond Index and U.S. Treasury securities increased from 3.46% on Dec. 31, 2004, to 4.06% on June 30, 2005. These credit concerns also were evident in the performance of the various credit tiers in the high-yield market. The higher-quality Ba-rated sector, which returned 2.27%, outperformed the lower-quality B-rated and Caa-rated sectors, which returned 1.06% and -1.19%, respectively. Among larger industry sectors within the high-yield market, the telecommunications–wireless, financials, textiles and energy sectors turned in very strong performance while the automotive, building material, consumer product, media-cable, transportation (heavily influenced by the airline sub sector) and paper sectors underperformed the overall market.
The Fund’s underperformance versus its benchmark was partly due to its overweight in the weaker-performing B-rated and Caa-rated quality sectors as well as the Fund’s underweight in the Ba-rated sector. The Fund’s overweight in the building material and consumer product sectors hurt performance, as did the Fund’s underweight in the energy, financials and telecommunications–wireless sectors. Poor security selection in the consumer products, entertainment, retail and utility–electric sectors also hurt Fund performance. Specific detractors included Allied Holdings, Inc; GNC Corp.; Simmons Bedding Co.; CDRV Investors, Inc.; and General Motors Corp.
The Fund was helped by its underweight in the media–cable and transportation (mainly the airline sub-sector) sectors and good security selection in the chemicals, food and beverages, and media–non-cable sectors. The fund also was helped by specific holdings in Advanstar Communications Inc., Ardent Health Services LLC, AT&T Corp., ASG Consolidated LLC and HCA Inc.
PORTFOLIO MANAGERS: Mark E. Durbiano and Nathan H. Kehm
Investing in mutual funds involves risk, including possible loss of principal.
There is no assurance that the investment objective of any fund will be achieved.
Lipper Analytical Services, Inc. is an industry research firm whose rankings are based on total return performance and do not reflect the effects of sales charges.
Lehman Brothers U.S. Corporate High Yield Index: An unmanaged index that reflects the performance of fixed-rate, non-investment-grade debt securities with at least $150 million par value outstanding, a maximum credit rating of Ba1 (including defaulted issues) and a maturity of one year or more; gives a broad look at how high-yield (“junk”) bonds have performed.
The Gartmore Variable Insurance Trust Funds are available only as sub-account investment options in certain variable insurance products. Accordingly, investors are unable to invest in shares of these funds outside of an insurance product. Performance information found herein reflects only the performance of these funds, and does not indicate the performance your sub-account may experience under your variable insurance contract. Performance returns assume reinvestment of all distributions. The investment return and principal value of an investment will fluctuate so that an investor’s shares, when redeemed, may be worth more or less than their original cost. Index performance is provided for comparison purposes only; the indexes shown are unmanaged and do not reflect any fees or expenses. Investors cannot invest directly in market indexes. To obtain performance information about the sub-account option under your insurance contract that invests in one of these funds, please contact your variable insurance carrier. PAST PERFORMANCE IS NO GUARANTEE OF FUTURE RESULTS.
Commentary provided by Gartmore Global Investments. All opinions and estimates included in this report constitute Gartmore Global Investments’ judgment as of the date of this report and are subject to change without notice.
Investors should carefully consider a fund’s investment objectives, risks, fees, charges and expenses before investing any money. To obtain this and other information on Gartmore Variable Insurance Trust, please contact your variable insurance contract provider or call 800-848-0920. Please read the Trust’s prospectus carefully before investing any money.
Gartmore Funds distributed by Gartmore Distribution Services, Inc., Member NASD. 1200 River Road, Suite 1000, Conshohocken, PA 19428.
1
Table of Contents
Fund Performance | Federated GVIT High Income Bond Fund |
| Average | Annual Total Return1 |
(For Periods Ended June 30, 2005)
| Six months* | One year | Five years | Inception2 | |||||
| Class I3 | -0.15% | 8.03% | 6.13% | 5.26% | ||||
| Class III4 | -0.11% | 8.07% | 6.14% | 5.27% |
| * | Not Annualized. |
| 1 | Not subject to any sales charges. |
| 2 | The Fund commenced operation on October 31, 1997. |
| 3 | The existing shares of the Fund were designated Class I shares as of May 1, 2001. |
| 4 | These returns until the creation of the Class III shares (April 28, 2005) are based on the performance of the Class I shares of the Fund. Excluding the effect of any fee waivers or reimbursements, such prior performance is similar to what Class III shares would have produced, because all classes of shares invest in the same portfolio of securities. |
| Performance | of a $10,000 Investment |
Investment return and principal value will fluctuate, and when redeemed, shares may be worth more or less than original cost. Past performance is no guarantee of future results and does not reflect the deduction of taxes that a shareholder would pay on fund distributions or the redemption of fund shares. Investing in mutual funds involves market risk, including loss of principal. Performance returns assume the reinvestment of all distributions.
Comparative performance of $10,000 invested in Class I shares of the Federated GVIT High Income Bond Fund, the Lehman High Yield Index (Lehman High Yield)(a), and the Consumer Price Index (CPI)(b) since inception. Unlike, the Fund, the returns for these unmanaged indexes do not reflect any fees, expenses, or sales charges. Investors cannot invest directly in market indexes.
| (a) | Lehman High Yield is an unmanaged index of bonds that are rated below investment grade that gives a broad look at the performance of these securities. |
| (b) | The CPI represents changes in prices of a basket of goods and services purchased for consumption by urban households. |
2
Table of Contents
Shareholder
Expense Example | Federated GVIT High Income Bond Fund |
As a shareholder of the Fund, you incur two types of costs: (1) transaction costs, including sales charges (loads) paid on purchase payments and redemption fees; and (2) ongoing costs, including investment advisory fees, administration fees, distribution fees and other Fund expenses. The examples below are intended to help you understand your ongoing costs (in dollars) of investing in the Fund and to compare these costs with the ongoing costs of investing in other mutual funds. Per SEC requirements, the examples assume that you had a $1,000 investment in the Class at the beginning of the reporting period, January 1, 2005, and continued to hold your shares at the end of the reporting period, June 30, 2005.
Actual Expenses
For each Class of the Fund in the table below, the first line provides information about actual account values and actual expenses. You may use the information in this line, together with the amount you invested, to estimate the expenses that you paid over the period. Simply divide your account value by $1,000 (for example, an $8,600 account value divided by $1,000 = 8.6), then multiply the result by the number in the first line of each Class under the heading entitled “Expenses Paid During Period” to estimate the expenses you paid on your account during the period.
Hypothetical Example for Comparison Purposes
The second line of each Class in the table below provides information about hypothetical account values and hypothetical expenses based on the Class’ actual expense ratio and an assumed rate of return of 5% per year before expenses, which is not the Class’ actual return. The hypothetical account values and expenses may not be used to estimate the actual ending account balance or expenses you paid for the period. You may use this information to compare the ongoing costs of investing in the Class of the Fund and other funds. To do so, compare this 5% hypothetical example with the 5% hypothetical examples that appear in the shareholder reports of the other funds.
Please note that the expenses shown in the table are meant to highlight your ongoing costs only and do not reflect any transaction costs, such as sales charges (loads) or redemption fees. Therefore, the second line for each Class in the table is useful in comparing ongoing costs only, and will not help you determine the relative total costs of owning different funds. In addition, if these transaction costs were included, your costs would have been higher. The examples also assume all dividends and distributions have been reinvested.
| Beginning Account Value, January 1, 2005 | Ending Account Value, June 30, 2005 | Expenses Paid During Period* | Annualized Expense Ratio* | |||||||||||
| High Income Bond Fund | ||||||||||||||
Class I | Actual | $ | 1,000 | $ | 999 | $ | 4.61 | 0.93% | ||||||
| Hypothetical1 | $ | 1,000 | $ | 1,020 | $ | 4.67 | 0.93% | |||||||
Class III(a) | Actual | $ | 1,000 | $ | 973 | $ | 1.58 | (b) | 0.93% | |||||
| Hypothetical1 | $ | 1,000 | $ | 1,007 | $ | 1.61 | (b) | 0.93% | ||||||
| * | Expenses are equal to the Fund’s annualized expense ratio multiplied by the average account value over the period multiplied by 181/365 (to reflect the one-half year period). The expense ratio presented represents a six month, annualized ratio in accordance with SEC guidelines. |
| 1 | Represents the hypothetical 5% return before expenses. |
| (a) | For the period from April 28, 2005 (commencement of operations) through June 30, 2005. |
| (b) | Expenses are equal to the Fund’s annualized expense ratio multiplied by the average account value over the period multiplied by 64/365 (to reflect the period). |
3
Table of Contents
Portfolio Summary
(June 30, 2005) | Federated GVIT High Income Bond Fund |
The SEC adopted a requirement that Funds present their portfolio holdings in a table, chart or graph format in their annual and semiannual reports to shareholders, whether or not a statement of investments is utilized. The following tables, which present portfolio holdings as a percentage of net assets, are provided in compliance with this requirement.
| Asset Allocation | ||
| Corporate Bonds | 96.6% | |
| Cash Equivalents | 1.2% | |
| Preferred Stocks | 0.2% | |
| Common Stocks | 0.2% | |
| Warrants | 0.1% | |
| Other Investments* | 0.2% | |
| Other assets in excess of liabilities** | 1.5% | |
| 100.0% | ||
| Top Holdings*** | ||
| AT&T Corp., 9.75%, 11/15/31 | 1.3% | |
| Qwest Services Corp., 13.50%, 12/15/10 | 1.0% | |
| Qwest Corp., 9.13%, 03/15/12 | 1.0% | |
| Georgia Pacific Corp., 9.38%, 02/01/13 | 0.9% | |
| Kabel Deutschland GMBH, 10.63%, 07/01/14 | 0.8% | |
| Dex Media West LLC, 9.88%, 08/15/13 | 0.7% | |
| Charter Communications Holdings Capital Corp., 10.25%, 09/15/10 | 0.7% | |
| NEXTEL Communications, Inc., 7.38%, 08/01/15 | 0.7% | |
| Genaral Motors Acceptance Corp., 6.88%, 09/15/11 | 0.6% | |
| Vertis, Inc., 10.88%, 06/15/09 | 0.6% | |
| Other Holdings | 91.7% | |
| 100.0% | ||
| Top Industries | ||
| Media — Non-Cable | 10.7% | |
| Healthcare | 6.4% | |
| Food & Beverage | 6.4% | |
| Chemicals | 5.6% | |
| Wireline Communications | 5.5% | |
| Industrial — Other | 5.4% | |
| Gaming | 4.6% | |
| Utility — Natural Gas | 4.6% | |
| Consumer Products | 4.5% | |
| Automotive | 4.3% | |
| Other Industries | 42.0% | |
| 100.0% | ||
| * | Includes value of collateral received from securities lending. |
| ** | Includes value of collateral owed from securities lending. |
| *** | For purpose of listing top holdings, repurchase agreements are considered cash equivalents and are included as part of other holdings. |
4
Table of Contents
GARTMORE VARIABLE INSURANCE TRUST
FEDERATED GVIT HIGH INCOME BOND FUND
Statement of Investments — June 30, 2005 (Unaudited)
Shares or Principal Amount | Value | |||||
| COMMON STOCKS (0.2%) | ||||||
| Food & Beverage (0.1%) | ||||||
| B&G Foods, Inc. | 19,220 | $ | 281,381 | |||
| Media—Cable (0.1%) | ||||||
| NTL, Inc. | 2,260 | 154,629 | ||||
| Packaging (0.0%) | ||||||
| Russell Stanley Holdings, Inc. (d) | 4,000 | 10,240 | ||||
| Wireline Communications (0.0%) | ||||||
| Viatel Holding (Bermuda) Ltd. | 2,209 | 155 | ||||
| Total Common Stocks | 446,405 | |||||
| CORPORATE BONDS (96.6%) | ||||||
| Aerospace & Defense (1.9%) | ||||||
| Alliant Techsystems, Inc., 8.50%, 05/15/11 | $ | 575,000 | 616,688 | |||
| Argo Tech Corp., 9.25%, 06/01/11 | 525,000 | 572,250 | ||||
| K&F Acquisition, Inc., 7.75%, 11/15/14 | 250,000 | 256,875 | ||||
| K&F Industries, Inc. (b), 11.50%, 02/01/15 | 400,000 | 425,000 | ||||
| L-3 Communications Corp., 5.88%, 01/15/15 | 225,000 | 219,375 | ||||
| L-3 Communications Corp., 6.13%, 01/15/14 | 1,300,000 | 1,306,500 | ||||
| Standard Aero Holdings, Inc. (b), 8.25%, 09/01/14 | 550,000 | 583,000 | ||||
| TransDigm, Inc., 8.38%, 07/15/11 | 725,000 | 772,125 | ||||
| 4,751,813 | ||||||
| Automotive (4.3%) | ||||||
| Advanced Accessory Systems LLC, 10.75%, 06/15/11 | 675,000 | 546,750 | ||||
| Cooper-Standard Automotive, Inc., 8.38%, 12/15/14 | 925,000 | 735,375 | ||||
| General Motors Acceptance Corp., 6.88%, 09/15/11 | 1,775,000 | 1,640,485 | ||||
Shares or Principal Amount | Value | |||||
| CORPORATE BONDS (continued) | ||||||
| Automotive (continued) | ||||||
| General Motors Acceptance Corp., 8.00%, 11/01/31 | $ | 1,650,000 | $ | 1,476,110 | ||
| General Motors Corp., 7.13%, 07/15/13 | 500,000 | 450,000 | ||||
| General Motors Corp., 8.38%, 07/15/33 | 1,525,000 | 1,281,000 | ||||
| Stanadyne Corp., 10.00%, 08/15/14 | 800,000 | 760,000 | ||||
| Stanadyne Holdings, Inc., 0.00%/13.66%, 02/15/15 | 450,000 | 245,250 | ||||
| Stoneridge, Inc., 11.50%, 05/01/12 | 825,000 | 845,625 | ||||
| Tenneco Automotive, Inc., 8.63%, 11/15/14 | 850,000 | 858,500 | ||||
| TRW Automotive, Inc., 9.38%, 02/15/13 | 400,000 | 445,000 | ||||
| TRW Automotive, Inc., 11.00%, 02/15/13 | 834,000 | 963,270 | ||||
| United Components, Inc., 9.38%, 06/15/13 | 750,000 | 759,375 | ||||
| 11,006,740 | ||||||
| Building Materials (3.3%) | ||||||
| AMH Holdings, Inc., 0.00%/11.91%, 03/01/14 | 950,000 | 608,000 | ||||
| Associated Materials, Inc., 9.75%, 04/15/12 | 475,000 | 494,000 | ||||
| Builders Firstsource, Inc. (b) (e), 7.52%, 02/15/12 | 850,000 | 850,000 | ||||
| Collins & Aikman Floorcoverings, Inc., 9.75%, 02/15/10 | 775,000 | 806,000 | ||||
| ERICO International Corp., 8.88%, 03/01/12 | 800,000 | 816,000 | ||||
| Fimep S.A., 10.50%, 02/15/13 | 350,000 | 400,750 | ||||
| Goodman Global Holdings (b), 7.88%, 12/15/12 | 800,000 | 744,000 | ||||
| Goodman Global Holdings (b) (e), 6.62%, 06/15/12 | 350,000 | 346,500 | ||||
| Norcraft Cos. LLC, 9.00%, 11/01/11 | 500,000 | 517,500 | ||||
| Norcraft Holdings Capital, 0.00%/10.78%, 09/01/12 | 1,475,000 | 1,025,125 | ||||
5
Table of Contents
GARTMORE VARIABLE INSURANCE TRUST
FEDERATED GVIT HIGH INCOME BOND FUND
Statement of Investments — June 30, 2005 (Unaudited) (continued)
Shares or Principal Amount | Value | |||||
| CORPORATE BONDS (continued) | ||||||
| Building Materials (continued) | ||||||
| Nortek Holdings, Inc., 8.50%, 09/01/14 | $ | 350,000 | $ | 327,250 | ||
| Nortek Holdings, Inc. (b), 14.99%, 03/01/14 | 925,000 | 439,375 | ||||
| Ply Gem Industries, Inc., 9.00%, 02/15/12 | 450,000 | 382,500 | ||||
| Texas Industries, Inc. (b), 7.25%, 07/15/13 | 150,000 | 154,500 | ||||
| U.S. Concrete, Inc., 8.38%, 04/01/14 | 625,000 | 590,625 | ||||
| 8,502,125 | ||||||
| Chemicals (5.6%) | ||||||
| Aventine Renewable Energy Holdings, Inc. (b) (e), 9.41%, 12/15/11 | 600,000 | 579,000 | ||||
| Borden U.S. Finance Corp. (b), 9.00%, 07/15/14 | 1,050,000 | 1,073,624 | ||||
| Compass Mineral Group, 0.00%/10.00%, 08/15/11 | 600,000 | 657,000 | ||||
| Compass Mineral International, 0.00%/7.94%, 12/15/12 | 500,000 | 440,000 | ||||
| Compass Mineral International, 0.00%/8.19%, 06/01/13 | 1,050,000 | 882,000 | ||||
| Crystal US Holdings, 9.63%, 06/15/14 | 650,000 | 731,250 | ||||
| Crystal US Holdings, 9.34%, 10/01/14 | 1,364,000 | 954,799 | ||||
| Equistar Chemical LP, 10.13%, 09/01/08 | 875,000 | 951,562 | ||||
| General Chemical Industries Products, Inc. (c) (f), 10.63%, 05/01/09 | 400,000 | 40,000 | ||||
| Huntsman Advanced Materials, Inc., 11.00%, 07/15/10 | 475,000 | 539,125 | ||||
| Huntsman ICI Chemicals LLC, 10.13%, 07/01/09 | 869,000 | 898,329 | ||||
| Invista (b), 9.25%, 05/01/12 | 750,000 | 823,125 | ||||
| Koppers, Inc., 9.88%, 10/15/13 | 500,000 | 542,500 | ||||
| Lyondell Chemical Co., 9.63%, 05/01/07 | 475,000 | 509,438 | ||||
| Lyondell Chemical Co., 9.50%, 12/15/08 | 325,000 | 347,344 | ||||
Shares or Principal Amount | Value | |||||
| CORPORATE BONDS (continued) | ||||||
| Chemicals (continued) | ||||||
| Lyondell Chemical Co., 10.88%, 05/01/09 | $ | 800,000 | $ | 834,000 | ||
| Lyondell Chemical Co., 10.50%, 06/01/13 | 150,000 | 172,313 | ||||
| Nalco Co., 7.75%, 11/15/11 | 225,000 | 240,750 | ||||
| Nalco Co., 0.00%/8.88%, 11/15/13 | 875,000 | 942,812 | ||||
| Nalco Co., 0.00%/8.70%, 02/01/14 | 481,000 | 357,744 | ||||
| Polypore, Inc., 8.75%, 05/15/12 | 850,000 | 799,000 | ||||
| PQ Corp. (b), 7.50%, 02/15/13 | 425,000 | 419,688 | ||||
| Union Carbide Corp., 7.88%, 04/01/23 | 75,000 | 85,111 | ||||
| Union Carbide Corp., 7.50%, 06/01/25 | 350,000 | 387,617 | ||||
| 14,208,131 | ||||||
| Construction Machinery (1.1%) | ||||||
| Case New Holland, Inc. (b), 9.25%, 08/01/11 | 1,175,000 | 1,239,625 | ||||
| Clark Materials Handling, Inc. (c) (d) (g), 0.00%, 11/15/06 | 100,000 | 0 | ||||
| Columbus McKinnon Corp., 10.00%, 08/01/10 | 125,000 | 136,250 | ||||
| NationsRent Cos., Inc., 9.50%, 10/15/10 | 500,000 | 547,500 | ||||
| NationsRent, Inc. (b), 9.50%, 05/01/15 | 525,000 | 522,375 | ||||
| United Rentals, Inc., 6.50%, 02/15/12 | 425,000 | 420,219 | ||||
| 2,865,969 | ||||||
| Consumer Products (4.5%) | ||||||
| AAC Group Holding Corp. (b), 11.25%, 10/01/12 | 900,000 | 612,000 | ||||
| Alltrista Corp., 9.75%, 05/01/12 | 725,000 | 767,594 | ||||
| American Achievement Corp., 8.25%, 04/01/12 | 250,000 | 252,500 | ||||
| Ames True Temper, Inc., 10.00%, 07/15/12 | 975,000 | 789,750 | ||||
6
Table of Contents
GARTMORE VARIABLE INSURANCE TRUST
FEDERATED GVIT HIGH INCOME BOND FUND
Statement of Investments — June 30, 2005 (Unaudited) (continued)
Shares or Principal Amount | Value | |||||
| CORPORATE BONDS (continued) | ||||||
| Consumer Products (continued) | ||||||
| Church & Dwight Co., 6.00%, 12/15/12 | $ | 400,000 | $ | 406,000 | ||
| Diamond Brands, Inc. (c) (d) (f) (g), 0.00%, 04/15/09 | 50,000 | 265 | ||||
| Jostens Holding Corp., 10.29%, 12/01/13 | 1,425,000 | 1,011,750 | ||||
| Jostens IH Corp., 7.63%, 10/01/12 | 1,050,000 | 1,042,124 | ||||
| K2, Inc., 7.38%, 07/01/14 | 125,000 | 132,188 | ||||
| Leiner Health Products, 11.00%, 06/01/12 | 600,000 | 591,000 | ||||
| Playtex Products, Inc., 9.38%, 06/01/11 | 725,000 | 766,688 | ||||
| Rayovac Corp. (b), 7.38%, 02/01/15 | 1,375,000 | 1,337,187 | ||||
| Sealy Mattress Co., 8.25%, 06/15/14 | 525,000 | 532,875 | ||||
| Simmons Co., 7.88%, 01/15/14 | 650,000 | 562,250 | ||||
| Simmons Co. (b), 0.00%/15.51%, 12/15/14 | 925,000 | 420,875 | ||||
| Sleepmaster LLC (c) (d) (f) (g), 0.00%, 05/15/09 | 175,000 | 63,473 | ||||
| Tempur-Pedic/Tempur Products, 10.25%, 08/15/10 | 654,000 | 722,670 | ||||
| True Temper Sports, Inc., 8.38%, 09/15/11 | 800,000 | 746,000 | ||||
| WH Holdings Ltd., 9.50%, 04/01/11 | 615,000 | 661,125 | ||||
| 11,418,314 | ||||||
| Energy (1.1%) | ||||||
| Compton Petroleum Corp., 9.90%, 05/15/09 | 750,000 | 806,250 | ||||
| Petroleum Helicoptors, Inc., 9.38%, 05/01/09 | 475,000 | 502,313 | ||||
| Range Resources Corp., 7.38%, 07/15/13 | 250,000 | 267,500 | ||||
| Range Resources Corp., 6.38%, 03/15/15 | 400,000 | 400,000 | ||||
| Swift Energy Co., 9.38%, 05/01/12 | 825,000 | 893,062 | ||||
| 2,869,125 | ||||||
Shares or Principal Amount | Value | |||||
| CORPORATE BONDS (continued) | ||||||
| Entertainment (2.7%) | ||||||
| AMC Entertainment, Inc., 9.88%, 02/01/12 | $ | 1,050,000 | $ | 1,047,375 | ||
| Cinemark USA, Inc., 10.42%, 03/15/14 | 1,850,000 | 1,239,500 | ||||
| Cinemark, Inc., 9.00%, 02/01/13 | 400,000 | 413,000 | ||||
| Intrawest Corp., 7.50%, 10/15/13 | 900,000 | 928,125 | ||||
| Loews Cineplex (b), 9.00%, 08/01/14 | 1,150,000 | 1,118,375 | ||||
| Universal City Development, 11.75%, 04/01/10 | 1,350,000 | 1,555,875 | ||||
| Universal City Florida Holding Co. (e), 7.96%, 05/01/10 | 250,000 | 260,625 | ||||
| Universal City Florida Holding Co., 8.38%, 05/01/10 | 200,000 | 209,500 | ||||
| 6,772,375 | ||||||
| Environmental (1.1%) | ||||||
| Allied Waste North America, Inc., 8.88%, 04/01/08 | 800,000 | 844,000 | ||||
| Allied Waste North America, Inc., 9.25%, 09/01/12 | 633,000 | 686,805 | ||||
| Allied Waste North America, Inc., 6.13%, 02/15/14 | 550,000 | 513,563 | ||||
| Clean Harbors, Inc. (b), 11.25%, 07/15/12 | 625,000 | 696,875 | ||||
| 2,741,243 | ||||||
| Financial Institutions (0.3%) | ||||||
| American Real Estate Partners LP Finance (b), 7.13%, 02/15/13 | 775,000 | 763,375 | ||||
| Food & Beverage (6.3%) | ||||||
| Agrilink Foods, Inc., 11.88%, 11/01/08 | 350,000 | 363,563 | ||||
| American Seafoods Group, 10.13%, 04/15/10 | 800,000 | 857,999 | ||||
| ASG Consolidated LLC, 0.00%/10.57%, 11/01/11 | 1,675,000 | 1,210,187 | ||||
7
Table of Contents
GARTMORE VARIABLE INSURANCE TRUST
FEDERATED GVIT HIGH INCOME BOND FUND
Statement of Investments — June 30, 2005 (Unaudited) (continued)
Shares or Principal Amount | Value | |||||
| CORPORATE BONDS (continued) | ||||||
| Food & Beverage (continued) | ||||||
| B&G Foods Holding Corp., 8.00%, 10/01/11 | $ | 725,000 | $ | 753,094 | ||
| Constellation Brands, Inc., 8.00%, 02/15/08 | 650,000 | 695,500 | ||||
| Cott Beverages, Inc., 8.00%, 12/15/11 | 500,000 | 538,750 | ||||
| Del Monte Corp., 8.63%, 12/15/12 | 475,000 | 524,875 | ||||
| Del Monte Corp. (b), 6.75%, 02/15/15 | 1,275,000 | 1,306,874 | ||||
| Dole Foods Co., 8.63%, 05/01/09 | 750,000 | 802,500 | ||||
| Dole Foods Co., 7.25%, 06/15/10 | 450,000 | 459,000 | ||||
| Eagle Family Foods, Inc., 8.75%, 01/15/08 | 250,000 | 201,250 | ||||
| Michael Foods, Inc., 8.00%, 11/15/13 | 925,000 | 945,812 | ||||
| National Beef Packaging Co., 10.50%, 08/01/11 | 600,000 | 574,500 | ||||
| Pierre Foods, Inc., 9.88%, 07/15/12 | 825,000 | 855,938 | ||||
| Pilgrim’s Pride Corp., 9.63%, 09/15/11 | 375,000 | 411,563 | ||||
| Pilgrim’s Pride Corp., 9.25%, 11/15/13 | 625,000 | 696,875 | ||||
| Reddy Ice Group, Inc., 0.00%/8.88%, 08/01/11 | 650,000 | 724,750 | ||||
| Reddy Ice Group, Inc. (b), 0.00%/10.14%, 11/01/12 | 1,025,000 | 743,125 | ||||
| Smithfield Foods, Inc., 7.63%, 02/15/08 | 300,000 | 313,500 | ||||
| Smithfield Foods, Inc., 8.00%, 10/15/09 | 650,000 | 705,250 | ||||
| Smithfield Foods, Inc., 7.75%, 05/15/13 | 675,000 | 739,125 | ||||
| Swift & Co., 10.13%, 10/01/09 | 375,000 | 410,625 | ||||
| Swift & Co., 12.50%, 01/01/10 | 375,000 | 420,469 | ||||
| UAP Holding Corp., 0.00%/9.04%, 07/15/12 | 1,000,000 | 825,000 | ||||
| 16,080,124 | ||||||
Shares or Principal Amount | Value | |||||
| CORPORATE BONDS (continued) | ||||||
| Gaming (4.6%) | ||||||
| 155 E. Tropicana LLC (b), 8.75%, 04/01/12 | $ | 575,000 | $ | 562,063 | ||
| Boyd Gaming Corp., 8.75%, 04/15/12 | 525,000 | 572,906 | ||||
| Boyd Gaming Corp., 7.75%, 12/15/12 | 475,000 | 510,031 | ||||
| Herbst Gaming, Inc., 7.00%, 11/15/14 | 275,000 | 278,438 | ||||
| Isle of Capri Casinos, Inc., 9.00%, 03/15/12 | 425,000 | 464,313 | ||||
| Magna Entertainment Corp., 7.25%, 12/15/09 | 425,000 | 407,469 | ||||
| Mandalay Resort Group, 10.25%, 08/01/07 | 1,150,000 | 1,270,749 | ||||
| Mandalay Resort Group, 9.50%, 08/01/08 | 250,000 | 279,688 | ||||
| Mandalay Resort Group, 9.38%, 02/15/10 | 700,000 | 785,750 | ||||
| MGM Grand, Inc., 9.75%, 06/01/07 | 925,000 | 1,007,093 | ||||
| MGM Grand, Inc., 6.00%, 10/01/09 | 500,000 | 505,000 | ||||
| MGM Grand, Inc., 8.38%, 02/01/11 | 700,000 | 766,500 | ||||
| MTR Gaming Group, Inc., 9.75%, 04/01/10 | 800,000 | 872,000 | ||||
| Park Place Entertainment Corp., 9.38%, 02/15/07 | 375,000 | 404,063 | ||||
| Park Place Entertainment Corp., 8.13%, 05/15/11 | 1,000,000 | 1,154,999 | ||||
| Penn National Gaming, Inc., 8.88%, 03/15/10 | 175,000 | 188,125 | ||||
| Penn National Gaming, Inc. (b), 6.75%, 03/01/15 | 925,000 | 922,688 | ||||
| Station Casinos, Inc., 6.00%, 04/01/12 | 200,000 | 204,000 | ||||
| Station Casinos, Inc., 6.50%, 02/01/14 | 525,000 | 538,125 | ||||
| 11,694,000 | ||||||
| Healthcare (6.4%) | ||||||
| AmeriPath, Inc., 10.50%, 04/01/13 | 1,150,000 | 1,170,125 | ||||
| AMR Holding Co./Emcare Holding Co. (b), 10.00%, 02/15/15 | 350,000 | 374,500 | ||||
8
Table of Contents
GARTMORE VARIABLE INSURANCE TRUST
FEDERATED GVIT HIGH INCOME BOND FUND
Statement of Investments — June 30, 2005 (Unaudited) (continued)
Shares or Principal Amount | Value | |||||
| CORPORATE BONDS (continued) | ||||||
| Healthcare (continued) | ||||||
| Ardent Health Services, 10.00%, 08/15/13 | $ | 775,000 | $ | 940,656 | ||
| BIO-RAD Laboratories, Inc., 6.13%, 12/15/14 | 375,000 | 380,625 | ||||
| CDRV Investors, Inc. (b), 0.00%/13.12%, 01/01/15 | 2,250,000 | 1,113,750 | ||||
| Concentra Operating Corp., 9.50%, 08/15/10 | 450,000 | 481,500 | ||||
| Concentra Operating Corp., 9.13%, 06/01/12 | 175,000 | 186,375 | ||||
| DaVita, Inc. (b), 7.25%, 03/15/15 | 625,000 | 645,313 | ||||
| Fisher Scientific International, Inc., 6.75%, 08/15/14 | 175,000 | 183,750 | ||||
| Fisher Scientific International, Inc. (b), 6.13%, 07/01/15 | 725,000 | 729,531 | ||||
| Hanger Orthopedic Group, Inc., 10.38%, 02/15/09 | 450,000 | 417,375 | ||||
| HCA — The Healthcare Corp., 8.75%, 09/01/10 | 300,000 | 342,453 | ||||
| HCA — The Healthcare Corp., 7.88%, 02/01/11 | 575,000 | 634,104 | ||||
| HCA — The Healthcare Corp., 6.75%, 07/15/13 | 1,250,000 | 1,321,552 | ||||
| HCA — The Healthcare Corp., 6.38%, 01/15/15 | 1,300,000 | 1,352,139 | ||||
| HCA — The Healthcare Corp., 7.50%, 11/06/33 | 900,000 | 972,482 | ||||
| Medical Device Manufacturing, Inc., 10.00%, 07/15/12 | 925,000 | 999,000 | ||||
| National Mentor, Inc. (b), 9.63%, 12/01/12 | 850,000 | 898,875 | ||||
| Psychiatric Solutions (b), 7.75%, 07/15/15 | 325,000 | 325,000 | ||||
| Sybron Dental Specialties, Inc., 8.13%, 06/15/12 | 525,000 | 564,375 | ||||
| Tenet Healthcare Corp., 9.88%, 07/01/14 | 475,000 | 511,813 | ||||
| Tenet Healthcare Corp. (b), 9.25%, 02/01/15 | 600,000 | 625,500 | ||||
| Vanguard Health Holdings, 9.00%, 10/01/14 | 425,000 | 461,125 | ||||
Shares or Principal Amount | Value | |||||
| CORPORATE BONDS (continued) | ||||||
| Healthcare (continued) | ||||||
| Ventas Realty LP, 6.63%, 10/15/14 | $ | 875,000 | $ | 883,750 | ||
| VWR International, Inc., 8.00%, 04/15/14 | 225,000 | 215,438 | ||||
| 16,731,106 | ||||||
| Industrial—Other (5.3%) | ||||||
| Aearo Co., 8.25%, 04/15/12 | 875,000 | 879,375 | ||||
| ALH Finance LLC/ALH Finance Corp., 8.50%, 01/15/13 | 1,050,000 | 967,313 | ||||
| American Tire Distributors, Inc. (b), 10.75%, 04/01/13 | 425,000 | 408,000 | ||||
| Amsted Industries, Inc. (b), 10.25%, 10/15/11 | 425,000 | 461,125 | ||||
| Brand Services, Inc., 12.00%, 10/15/12 | 1,050,000 | 1,128,750 | ||||
| Coleman Cable, Inc. (b), 9.88%, 10/01/12 | 625,000 | 559,375 | ||||
| Da-Lite Screen Co., Inc., 9.50%, 05/15/11 | 525,000 | 561,750 | ||||
| Hawk Corp., 8.75%, 11/01/14 | 675,000 | 688,500 | ||||
| Interline Brands, Inc., 11.50%, 05/15/11 | 487,000 | 538,135 | ||||
| Knowledge Learning Corp. (b), 7.75%, 02/01/15 | 1,050,000 | 1,008,000 | ||||
| Mueller Group, Inc., 10.00%, 05/01/12 | 525,000 | 553,875 | ||||
| Neenah Corp. (b), 11.00%, 09/30/10 | 842,000 | 917,780 | ||||
| Neenah Corp. (b), 13.00%, 09/30/13 | 514,185 | 511,614 | ||||
| Norcross Safety Products, 9.88%, 08/15/11 | 750,000 | 787,500 | ||||
| NSP Holdings LLC, 11.75%, 01/01/12 | 625,000 | 684,375 | ||||
| Rexnord Corp., 10.13%, 12/15/12 | 675,000 | 742,500 | ||||
| Safety Products Holdings, 11.75%, 01/01/12 | 150,000 | 141,882 | ||||
| Sensus Metering Systems, 8.63%, 12/15/13 | 875,000 | 818,125 | ||||
9
Table of Contents
GARTMORE VARIABLE INSURANCE TRUST
FEDERATED GVIT HIGH INCOME BOND FUND
Statement of Investments — June 30, 2005 (Unaudited) (continued)
Shares or Principal Amount | Value | |||||
| CORPORATE BONDS (continued) | ||||||
| Industrial—Other (continued) | ||||||
| Superior Essex Communications, 9.00%, 04/15/12 | $ | 925,000 | $ | 920,375 | ||
| Valmont Industries, Inc., 6.88%, 05/01/14 | 300,000 | 301,500 | ||||
| 13,579,849 | ||||||
| Lodging (1.9%) | ||||||
| Gaylord Entertainment Co., 6.75%, 11/15/14 | 825,000 | 810,563 | ||||
| Host Marriott LP, 7.13%, 11/01/13 | 875,000 | 916,563 | ||||
| Host Marriott LP (b), 6.38%, 03/15/15 | 450,000 | 447,750 | ||||
| Lodgenet Entertainment, 9.50%, 06/15/13 | 450,000 | 492,750 | ||||
| Royal Caribbean Cruises, 8.00%, 05/15/10 | 600,000 | 667,500 | ||||
| Starwood Hotels Resorts, 7.38%, 05/01/07 | 975,000 | 1,023,749 | ||||
| Starwood Hotels Resorts, 7.88%, 05/01/12 | 450,000 | 509,625 | ||||
| 4,868,500 | ||||||
| Media—Cable (2.8%) | ||||||
| Cablevision Systems Corp., 7.88%, 12/15/07 | 700,000 | 726,250 | ||||
| Cablevision Systems Corp., 8.13%, 07/15/09 | 875,000 | 890,313 | ||||
| Cablevision Systems Corp., 8.00%, 04/15/12 | 775,000 | 763,375 | ||||
| Charter Communications Holdings Capital Corp., 10.25%, 09/15/10 | 1,725,000 | 1,753,031 | ||||
| Charter Communications Holdings Capital Corp., 9.92%, 04/01/11 | 1,450,000 | 1,065,750 | ||||
| Kabel Deutschland GMBH (b), 10.63%, 07/01/14 | 1,750,000 | 1,907,500 | ||||
| 7,106,219 | ||||||
| Media—Non-Cable (10.7%) | ||||||
| Advanstar Communications, Inc., 10.75%, 08/15/10 | 200,000 | 219,500 | ||||
| Advanstar Communications, Inc., 12.00%, 02/15/11 | 1,075,000 | 1,152,938 | ||||
Shares or Principal Amount | Value | |||||
| CORPORATE BONDS (continued) | ||||||
| Media—Non-Cable (continued) | ||||||
| Advanstar, Inc., 0.00%/0.05%, 10/15/11 | $ | 600,000 | $ | 597,750 | ||
| Affinity Group, Inc., 9.00%, 02/15/12 | 425,000 | 432,438 | ||||
| Affinity Group, Inc., 10.88%, 02/15/12 | 525,000 | 510,563 | ||||
| American Media Operation, Inc., 10.25%, 05/01/09 | 650,000 | 653,250 | ||||
| American Media Operation, Inc., 8.88%, 01/15/11 | 525,000 | 500,063 | ||||
| CBD Media Holdings, 9.25%, 07/15/12 | 1,175,000 | 1,195,562 | ||||
| Dex Media East LLC, 12.13%, 11/15/12 | 989,000 | 1,189,273 | ||||
| Dex Media West LLC, 9.88%, 08/15/13 | 1,591,000 | 1,821,694 | ||||
| Dex Media, Inc., 0.00%/7.55%, 11/15/13 | 875,000 | 708,750 | ||||
| DIRECTV Holdings LLC, 8.38%, 03/15/13 | 844,000 | 938,950 | ||||
| DIRECTV Holdings LLC (b), 6.38%, 06/15/15 | 400,000 | 400,000 | ||||
| Echostar DBS Corp., 5.75%, 10/01/08 | 1,250,000 | 1,248,437 | ||||
| Echostar DBS Corp., 6.63%, 10/01/14 | 800,000 | 794,000 | ||||
| Emmis Communications (b) (e), 9.31%, 06/15/12 | 400,000 | 409,000 | ||||
| Houghton Mifflin Co., 0.00%/10.47%, 10/15/13 | 1,250,000 | 918,750 | ||||
| Intelsat Bermuda Ltd. (b) (e), 7.81%, 01/15/12 | 725,000 | 741,313 | ||||
| Intelsat Bermuda Ltd. (b), 8.63%, 01/15/15 | 575,000 | 609,500 | ||||
| Lamar Media Corp., 7.25%, 01/01/13 | 550,000 | 583,000 | ||||
| NBC Acqusition Corp., 0.00%/11.65%, 03/15/13 | 625,000 | 450,000 | ||||
| Nebraska Book Co., 8.63%, 03/15/12 | 350,000 | 328,125 | ||||
| PanAmSat Corp., 9.00%, 08/15/14 | 453,000 | 496,601 | ||||
| PanAmSat Holding Corp., 0.00%/9.34%, 11/01/14 | 2,200,000 | 1,523,499 | ||||
10
Table of Contents
GARTMORE VARIABLE INSURANCE TRUST
FEDERATED GVIT HIGH INCOME BOND FUND
Statement of Investments — June 30, 2005 (Unaudited) (continued)
Shares or Principal Amount | Value | |||||
| CORPORATE BONDS (continued) | ||||||
| Media—Non-Cable (continued) | ||||||
| Primedia, Inc., 8.88%, 05/15/11 | $ | 900,000 | $ | 947,250 | ||
| Quebecor Media, Inc., 0.00%/5.49%, 07/15/11 | 425,000 | 429,781 | ||||
| Quebecor Media, Inc., 0.00%/11.13%, 07/15/11 | 500,000 | 558,125 | ||||
| R.H. Donnelly Finance Corp. (b), 10.88%, 12/15/12 | 575,000 | 671,313 | ||||
| Rainbow National Services LLC (b), 10.38%, 09/01/14 | 725,000 | 837,375 | ||||
| Readers Digest Association, Inc., 6.50%, 03/01/11 | 575,000 | 586,500 | ||||
| Sinclair Broadcast Group, 8.75%, 12/15/11 | 475,000 | 501,125 | ||||
| Vertis, Inc., 9.75%, 04/01/09 | 250,000 | 261,250 | ||||
| Vertis, Inc., 10.88%, 06/15/09 | 1,700,000 | 1,631,999 | ||||
| WDAC Subsidiary Corp. (b), 8.38%, 12/01/14 | 1,175,000 | 1,128,000 | ||||
| XM Satellite Radio, Inc., 12.00%, 06/15/10 | 373,000 | 421,490 | ||||
| Yell Finance BV, 0.00%/5.51%, 08/01/11 | 539,000 | 543,043 | ||||
| Yell Finance BV, 0.00%/10.75%, 08/01/11 | 410,000 | 454,075 | ||||
| Ziff Davis Media, Inc., 13.00%, 08/12/09 | 45,947 | 49,393 | ||||
| 27,443,675 | ||||||
| Metals & Mining (1.2%) | ||||||
| Aleris International, Inc., 9.00%, 11/15/14 | 300,000 | 312,000 | ||||
| Imco Recycling, Inc., 10.38%, 10/15/10 | 850,000 | 937,125 | ||||
| Novelis, Inc. (b), 7.25%, 02/15/15 | 700,000 | 706,125 | ||||
| Republic Technologies International (c) (d) (f) (g), 0.00%, 07/15/09 | 200,000 | 0 | ||||
| RYERSON TULL, INC., 9.13%, 07/15/06 | 525,000 | 538,125 | ||||
Shares or Principal Amount | Value | |||||
| CORPORATE BONDS (continued) | ||||||
| Metals & Mining (continued) | ||||||
| United States Steel Corp., 9.75%, 05/15/10 | $ | 490,000 | $ | 531,650 | ||
| 3,025,025 | ||||||
| Packaging (1.9%) | ||||||
| Berry Plastics Corp., 10.75%, 07/15/12 | 950,000 | 1,041,437 | ||||
| Graham Packaging Co. (b), 8.50%, 10/15/12 | 400,000 | 406,000 | ||||
| Greif Brothers Corp., 8.88%, 08/01/12 | 825,000 | 891,000 | ||||
| Huntsman Packaging Corp., 13.00%, 06/01/10 | 450,000 | 366,750 | ||||
| Owens-Brockway Glass Container, 7.75%, 05/15/11 | 175,000 | 186,813 | ||||
| Owens-Brockway Glass Container, 8.25%, 05/15/13 | 375,000 | 409,219 | ||||
| Owens-Brockway Glass Container, 6.75%, 12/01/14 | 800,000 | 813,000 | ||||
| Owens-Illinois, Inc., 7.35%, 05/15/08 | 300,000 | 312,750 | ||||
| Pliant Corp., 13.00%, 06/01/10 | 325,000 | 264,875 | ||||
| Russell Stanley Holdings, Inc. (b) (d), 9.00%, 11/30/08 | 36,537 | 19,448 | ||||
| 4,711,292 | ||||||
| Paper (3.6%) | ||||||
| Abitibi-Consolidated, 8.38%, 04/01/15 | 575,000 | 589,375 | ||||
| Boise Cascade Co. (b), 0.00%/7.13%, 10/15/14 | 350,000 | 345,625 | ||||
| Boise Cascade Co. (b) (e), 0.00%/6.02%, 10/15/12 | 250,000 | 253,750 | ||||
| Georgia Pacific Corp., 8.13%, 05/15/11 | 600,000 | 679,500 | ||||
| Georgia Pacific Corp., 9.38%, 02/01/13 | 2,000,000 | 2,272,500 | ||||
| Graphic Packaging International, 9.50%, 08/15/13 | 850,000 | 860,625 | ||||
11
Table of Contents
GARTMORE VARIABLE INSURANCE TRUST
FEDERATED GVIT HIGH INCOME BOND FUND
Statement of Investments — June 30, 2005 (Unaudited) (continued)
Shares or Principal Amount | Value | |||||
| CORPORATE BONDS (continued) | ||||||
| Paper (continued) | ||||||
| Jefferson Smurfit Corp., 8.25%, 10/01/12 | $ | 450,000 | $ | 454,500 | ||
| Jefferson Smurfit Corp., 7.50%, 06/01/13 | 400,000 | 384,000 | ||||
| MDP Acquisitions PLC, 9.63%, 10/01/12 | 400,000 | 402,000 | ||||
| Mercer International, Inc., 9.25%, 02/15/13 | 1,050,000 | 845,250 | ||||
| NewPage Corp. (b), 12.00%, 05/01/13 | 850,000 | 845,750 | ||||
| Stone Container Corp., 9.75%, 02/01/11 | 600,000 | 637,500 | ||||
| Tembec Industries, Inc., 8.50%, 02/01/11 | 725,000 | 563,688 | ||||
| 9,134,063 | ||||||
| Restaurants (0.8%) | ||||||
| Buffets, Inc., 11.25%, 07/15/10 | 150,000 | 151,875 | ||||
| Carrols Corp. (b), 9.00%, 01/15/13 | 450,000 | 457,875 | ||||
| Dominos, Inc., 8.25%, 07/01/11 | 575,000 | 615,250 | ||||
| Landry’s Seafood Restaurants, Inc., 7.50%, 12/15/14 | 925,000 | 899,563 | ||||
| 2,124,563 | ||||||
| Retailers (2.3%) | ||||||
| Couche-Tard Financing Co., 7.50%, 12/15/13 | 800,000 | 844,000 | ||||
| FTD, Inc., 7.75%, 02/15/14 | 632,000 | 622,520 | ||||
| General Nuitrition Center, 8.50%, 12/01/10 | 350,000 | 281,750 | ||||
| Hines Nurseries, Inc., 10.25%, 10/01/11 | 550,000 | 569,250 | ||||
| Jean Coutu Group (PLC), Inc., 8.50%, 08/01/14 | 725,000 | 719,563 | ||||
| Penney (J.C.) Co., Inc., 9.00%, 08/01/12 | 929,000 | 1,103,187 | ||||
| Rite Aid Corp., 8.13%, 05/01/10 | 875,000 | 905,625 | ||||
| Rite Aid Corp., 9.50%, 02/15/11 | 175,000 | 187,250 | ||||
Shares or Principal Amount | Value | |||||
| CORPORATE BONDS (continued) | ||||||
| Retailers (continued) | ||||||
| U.S. Office Products Co. (c) (d) (g), 0.00%, 06/15/08 | $ | 475,000 | $ | 0 | ||
| United Auto Group, Inc., 9.63%, 03/15/12 | 500,000 | 536,250 | ||||
| 5,769,395 | ||||||
| Services (1.5%) | ||||||
| Brickman Group Ltd. (The), 11.75%, 12/15/09 | 725,000 | 824,688 | ||||
| CB Richard Ellis Services, Inc., 9.75%, 05/15/10 | 214,000 | 238,610 | ||||
| Global Cash Access LLC, 8.75%, 03/15/12 | 775,000 | 846,687 | ||||
| HydroChem Industrial Services (b), 9.25%, 02/15/13 | 775,000 | 720,750 | ||||
| Insurance Automotive (b), 11.00%, 04/01/13 | 525,000 | 543,179 | ||||
| SITEL Corp., 9.25%, 03/15/06 | 518,000 | 515,410 | ||||
| 3,689,324 | ||||||
| Supermarkets (0.0%) | ||||||
| Jitney-Jungle Stores of America, Inc. (c) (d) (g), 0.00%, 09/15/07 | 100,000 | 0 | ||||
| Technology (3.1%) | ||||||
| Activant Solutions, Inc., 10.50%, 06/15/11 | 875,000 | 953,750 | ||||
| Activant Solutions, Inc. (b) (e), 9.09%, 04/01/10 | 200,000 | 208,000 | ||||
| Danka Business Systems, 11.00%, 06/15/10 | 450,000 | 362,250 | ||||
| Freescale Semiconductor, Inc., 7.13%, 07/15/14 | 575,000 | 621,000 | ||||
| MagnaChip Semiconductor (b), 8.00%, 12/15/14 | 350,000 | 337,750 | ||||
| Seagate Technology HDD Holding, 8.00%, 05/15/09 | 350,000 | 374,063 | ||||
| Smart Modular Technologies (b) (e), 8.35%, 04/01/12 | 600,000 | 594,000 | ||||
12
Table of Contents
GARTMORE VARIABLE INSURANCE TRUST
FEDERATED GVIT HIGH INCOME BOND FUND
Statement of Investments — June 30, 2005 (Unaudited) (continued)
Shares or Principal Amount | Value | |||||
| CORPORATE BONDS (continued) | ||||||
| Technology (continued) | ||||||
| Telex Communications, Inc., 11.50%, 10/15/08 | $ | 450,000 | $ | 483,750 | ||
| UGS Corp., 10.00%, 06/01/12 | 1,150,000 | 1,282,250 | ||||
| Unisys Corp., 6.88%, 03/15/10 | 650,000 | 641,875 | ||||
| Xerox Corp., 9.75%, 01/15/09 | 1,350,000 | 1,540,687 | ||||
| Xerox Corp., 7.63%, 06/15/13 | 475,000 | 513,594 | ||||
| 7,912,969 | ||||||
| Textile (0.7%) | ||||||
| GFSI, Inc., 9.63%, 03/01/07 | 200,000 | 182,000 | ||||
| Glenoit Corp. (c) (d) (g), 0.00%, 04/15/07 | 125,000 | 0 | ||||
| Phillips Van-Heusen Corp., 8.13%, 05/01/13 | 350,000 | 380,625 | ||||
| Warnaco Group, Inc., 8.88%, 06/15/13 | 750,000 | 832,500 | ||||
| William Carter Co., 10.88%, 08/15/11 | 422,000 | 474,818 | ||||
| 1,869,943 | ||||||
| Tobacco (0.4%) | ||||||
| Commonwealth Brands, Inc. (b), 10.63%, 09/01/08 | 1,000,000 | 1,057,500 | ||||
| Transportation (0.7%) | ||||||
| Allied Holdings, Inc., 8.63%, 10/01/07 | 550,000 | 264,000 | ||||
| Holt Group, Inc. (The) (c) (d) (g), 9.75%, 01/15/06 | 50,000 | 0 | ||||
| Stena AB, 9.63%, 12/01/12 | 825,000 | 903,375 | ||||
| Stena AB, 7.50%, 11/01/13 | 575,000 | 569,250 | ||||
| 1,736,625 | ||||||
| Utility—Electric (4.0%) | ||||||
| Caithness Coso Funding Corp., 9.05%, 12/15/09 | 792,824 | 854,268 | ||||
| Edison Mission Holding Co., 9.88%, 04/15/11 | 1,350,000 | 1,587,937 | ||||
| FPL Energy National Wind (b), 6.13%, 03/25/19 | 350,000 | 340,457 | ||||
Shares or Principal Amount | Value | |||||
| CORPORATE BONDS (continued) | ||||||
| Utility—Electric (continued) | ||||||
| Nevada Power Co., 6.50%, 04/15/12 | $ | 75,000 | $ | 78,750 | ||
| Nevada Power Co., 9.00%, 08/15/13 | 1,400,000 | 1,581,999 | ||||
| Nevada Power Co. (b), 5.88%, 01/15/15 | 350,000 | 353,500 | ||||
| Northwestern Corp. (b), 5.88%, 11/01/14 | 200,000 | 206,000 | ||||
| NRG Energy, Inc. (b), 8.00%, 12/15/13 | 509,000 | 539,540 | ||||
| PSEG Energy Holdings, 10.00%, 10/01/09 | 1,125,000 | 1,268,438 | ||||
| Reliant Energy, Inc., 6.75%, 12/15/14 | 325,000 | 319,313 | ||||
| Reliant Resources, Inc., 9.25%, 07/15/10 | 375,000 | 410,625 | ||||
| Reliant Resources, Inc., 9.50%, 07/15/13 | 925,000 | 1,031,375 | ||||
| TECO Energy, Inc. (b), 6.75%, 05/01/15 | 225,000 | 239,625 | ||||
| Texas Genco LLC (b), 6.88%, 12/15/14 | 1,325,000 | 1,401,187 | ||||
| 10,213,014 | ||||||
| Utility—Natural Gas (4.6%) | ||||||
| ANR Pipeline Co., 8.88%, 03/15/10 | 150,000 | 165,289 | ||||
| EL Paso Corp., 6.75%, 05/15/09 | 775,000 | 778,875 | ||||
| EL Paso Corp., 7.75%, 06/01/13 | 950,000 | 1,018,875 | ||||
| EL Paso Corp., 8.05%, 10/15/30 | 675,000 | 671,625 | ||||
| EL Paso Corp., 7.80%, 08/01/31 | 1,450,000 | 1,417,375 | ||||
| Holly Energy Partners LP (b), 6.25%, 03/01/15 | 1,375,000 | 1,347,500 | ||||
| Inergy LP (b), 6.88%, 12/15/14 | 400,000 | 391,000 | ||||
| MarkWest Energy Partners (b), 6.88%, 11/01/14 | 175,000 | 175,000 | ||||
| Pacific Energy Partners, 7.13%, 06/15/14 | 700,000 | 732,375 | ||||
| Semco Energy, Inc., 7.13%, 05/15/08 | 400,000 | 409,234 | ||||
13
Table of Contents
GARTMORE VARIABLE INSURANCE TRUST
FEDERATED GVIT HIGH INCOME BOND FUND
Statement of Investments — June 30, 2005 (Unaudited) (continued)
Shares or Principal Amount | Value | |||||
| CORPORATE BONDS (continued) | ||||||
| Utility—Natural Gas (continued) | ||||||
| Tennessee Gas Pipeline, 7.50%, 04/01/17 | $ | 200,000 | $ | 222,531 | ||
| Tennessee Gas Pipeline, 8.38%, 06/15/32 | 1,225,000 | 1,447,573 | ||||
| Transcontinental Gas Pipeline Corp., 8.88%, 07/15/12 | 350,000 | 418,250 | ||||
| Williams Cos., Inc. (The), 7.63%, 07/15/19 | 750,000 | 847,500 | ||||
| Williams Cos., Inc. (The), 7.88%, 09/01/21 | 1,425,000 | 1,628,062 | ||||
| 11,671,064 | ||||||
| Wireless Communications (2.2%) | ||||||
| Inmarsat Finance PLC, 0.00%/7.63%, 06/30/12 | 125,000 | 132,500 | ||||
| Inmarsat Finance PLC, 0.00%/8.57%, 11/15/12 | 400,000 | 316,000 | ||||
| New Skies Satellites NV (b), 9.13%, 11/01/12 | 325,000 | 324,188 | ||||
| NEXTEL Communications, Inc., 7.38%, 08/01/15 | 1,575,000 | 1,708,874 | ||||
| Rogers Wireless, Inc., (e) 6.54%, 12/15/10 | 425,000 | 445,188 | ||||
| Rogers Wireless, Inc., (e) 7.25%, 12/15/12 | 200,000 | 217,000 | ||||
| Rogers Wireless, Inc., (e) 8.00%, 12/15/12 | 800,000 | 866,000 | ||||
| Rogers Wireless, Inc., (e) 6.38%, 03/01/14 | 625,000 | 639,063 | ||||
| Rogers Wireless, Inc., (e) 7.50%, 03/15/15 | 200,000 | 218,500 | ||||
| U.S. Unwired, Inc., 10.00%, 06/15/12 | 650,000 | 726,375 | ||||
| 5,593,688 | ||||||
| Wireline Communications (5.5%) | ||||||
| Alaska Communications System Holdings, 9.88%, 08/15/11 | 669,000 | 712,485 | ||||
| AT&T Corp., 9.75%, 11/15/31 | 2,475,000 | 3,232,968 | ||||
| Cincinnati Bell, Inc., 7.25%, 07/15/13 | 825,000 | 870,375 | ||||
Shares or Principal Amount | Value | |||||
| CORPORATE BONDS (continued) | ||||||
| Wireline Communications (continued) | ||||||
| Cincinnati Bell, Inc., 8.38%, 01/15/14 | $ | 500,000 | $ | 515,000 | ||
| Citizens Communications, 9.25%, 05/15/11 | 250,000 | 280,313 | ||||
| Citizens Communications, 6.25%, 01/15/13 | 525,000 | 510,563 | ||||
| Citizens Communications, 9.00%, 08/15/31 | 550,000 | 566,500 | ||||
| MCI, Inc., 8.74%, 05/01/14 | 1,075,000 | 1,208,031 | ||||
| Qwest Capital Funding, 7.25%, 02/15/11 | 350,000 | 336,875 | ||||
| Qwest Corp. (b), 9.13%, 03/15/12 | 2,225,000 | 2,430,813 | ||||
| Qwest Services Corp., 13.50%, 12/15/10 | 2,300,000 | 2,667,999 | ||||
| Valor Telecommunications Enterprises (b), 7.75%, 02/15/15 | 700,000 | 691,250 | ||||
| 14,023,172 | ||||||
| Total Corporate Bonds | 245,934,320 | |||||
| PREFERRED STOCKS (0.2%) | ||||||
| Media—Cable (0.0%) | ||||||
| Pegasus Communications | 0 | 7 | ||||
| Media—Non-Cable (0.0%) | ||||||
| Ziff Davis Media, Inc., Series E-1, PIK | 12 | 8,280 | ||||
| Retailers (0.2%) | ||||||
| General Nutrition Center, Series A | 725 | 487,563 | ||||
| Total Preferred Stocks | 495,850 | |||||
| WARRANTS (0.1%) | ||||||
| Entertainment (0.0%) | ||||||
| AMF Bowling Worldwide, Inc., Class B, expiring 03/09/09 (d) (g) | 811 | 0 | ||||
| Industrial—Other (0.1%) | ||||||
| ACP Holding Co., expiring 09/13/13 (b) | 96,400 | 183,160 | ||||
14
Table of Contents
GARTMORE VARIABLE INSURANCE TRUST
FEDERATED GVIT HIGH INCOME BOND FUND
Statement of Investments — June 30, 2005 (Unaudited) (continued)
Shares or Principal Amount | Value | |||||
| WARRANTS (continued) | ||||||
| Media—Non-Cable (0.0%) | ||||||
| Advanstar Holdings Corp., expiring 10/15/11 (b) (d) (g) | $ | 150 | $ | 0 | ||
| XM Satellite Radio, Inc., expiring 03/15/10 (b) | 300 | 18,900 | ||||
| Ziff Davis Media, Inc., expiring 08/12/12 (d) (g) | 2,200 | 0 | ||||
| 18,900 | ||||||
| Packaging (0.0%) | ||||||
| Pliant Corp., expiring 06/01/10 (b) (d) (g) | 275 | 0 | ||||
| Paper (0.0%) | ||||||
| MDP Acquisitions, expiring 10/01/13 (b) | 300 | 6,000 | ||||
| Total Warrants | 208,060 | |||||
| CASH EQUIVALENTS (1.2%) | ||||||
| Investments in repurchase agreements (Collateralized by AA Corporate Bonds, in a joint trading account at 3.34%, dated 06/30/05, due 07/01/05, repurchase price $2,970,735) | 2,970,459 | 2,970,459 | ||||
| Total Cash Equivalents | 2,970,459 | |||||
| SHORT-TERM SECURITIES HELD AS COLLATERAL FOR SECURITIES LENDING (0.2%) | ||||||
| Pool of short-term securities for Gartmore Variable Insurance Trust Funds — note 2 (Securities Lending) | 390,808 | 390,808 | ||||
| Total Investments (Cost $246,331,311) (a) — 98.5% | 250,445,902 | |||||
| Other assets in excess of liabilities — 1.5% | 3,957,520 | |||||
| NET ASSETS — 100.0% | $ | 254,403,422 | ||||
| (a) | See notes to financial statements for tax unrealized appreciation (depreciation) of securities. |
| (b) | Represents a restricted security acquired and eligible for resale under Rule 144A, which limits the resale to certain qualified buyers. |
| (c) | Bond in default. |
| (d) | Fair Valued Security. |
| (e) | Variable Rate Security. The rate reflected in the Statement of Investments is the rate in effect on June 30, 2005. |
| (f) | Security has filed for bankruptcy protection. |
| (g) | Security has been deemed illiquid. The pricing committee has deemed the security to have zero value based upon procedures adopted by the Board of Trustees. |
| PIK | Paid-In-Kind |
See notes to financial statements.
15
Table of Contents
GARTMORE VARIABLE INSURANCE TRUST
FEDERATED GVIT HIGH INCOME BOND FUND
Statement of Assets and Liabilities
June 30, 2005 (Unaudited)
Assets: | ||||
Investments, at value (cost $243,360,852) | $ | 247,475,443 | ||
Repurchase agreements, at cost and value | 2,970,459 | |||
Total Investments | 250,445,902 | |||
Cash | 67,235 | |||
Interest and dividends receivable | 5,216,541 | |||
Receivable for investments sold | 715,625 | |||
Prepaid expenses and other assets | 19,819 | |||
Total Assets | 256,465,122 | |||
Liabilities: | ||||
Payable for investments purchased | 1,476,169 | |||
Payable for return of collateral received for securities on loan | 390,808 | |||
Accrued expenses and other payables: | ||||
Investment advisory fees | 145,035 | |||
Fund administration and transfer agent fees | 13,705 | |||
Administrative servicing fees | 25,817 | |||
Other | 10,166 | |||
Total Liabilities | 2,061,700 | |||
Net Assets | $ | 254,403,422 | ||
Represented by: | ||||
Capital | $ | 265,584,389 | ||
Accumulated net investment income (loss) | 395,162 | |||
Accumulated net realized gain (losses) from investments | (15,690,720 | ) | ||
Net unrealized appreciation (depreciation) on investments | 4,114,591 | |||
Net Assets | $ | 254,403,422 | ||
Net Assets: | ||||
Class I Shares | $ | 219,994,128 | ||
Class III Shares | 34,409,294 | |||
Total | $ | 254,403,422 | ||
Shares outstanding (unlimited number of shares authorized): | ||||
Class I Shares | 27,911,773 | |||
Class III Shares | 4,369,030 | |||
Total | 32,280,803 | |||
Net asset value and offering price per share:* | ||||
Class I Shares | $ | 7.88 | ||
Class III Shares | $ | 7.88 |
| * | Not subject to a front-end sales charge. |
For the Six Months Ended June 30, 2005 (Unaudited)
Investment Income: | ||||
Interest income | $ | 11,425,504 | ||
Dividend income | 48,760 | |||
Income from securities lending | 126,707 | |||
Total Income | 11,600,971 | |||
Expenses: | ||||
Investment advisory fees | 928,008 | |||
Fund administration and transfer agent fees | 112,861 | |||
Administrative servicing fees Class I Shares | 188,774 | |||
Administrative servicing fees Class III Shares | 4,071 | |||
Other** | 55,048 | |||
Total Expenses | 1,288,762 | |||
Net Investment Income (Loss) | 10,312,209 | |||
REALIZED/UNREALIZED GAINS (LOSSES) ON INVESTMENTS: | ||||
Net realized gains (losses) on investment transactions | 762,009 | |||
Net change in unrealized appreciation/depreciation on investments | (11,824,057 | ) | ||
Net realized/unrealized gains (losses) on investments | (11,062,048 | ) | ||
CHANGE IN NET ASSETS RESULTING FROM OPERATIONS | $ | (749,839 | ) | |
| ** | Other expenses may include the following fees: audit, custody, insurance, legal, printing, trustee, and out-of-pocket expenses. |
See notes to financial statements.
16
Table of Contents
GARTMORE VARIABLE INSURANCE TRUST
FEDERATED GVIT HIGH INCOME BOND FUND
Statement of Changes in Net Assets
| Six Months Ended June 30, 2005 | Year Ended December 31, 2004 | |||||||
| (Unaudited) | ||||||||
From Investment Activities: | ||||||||
Operations: | ||||||||
Net investment income (loss) | $ | 10,312,209 | $ | 19,889,108 | ||||
Net realized gains (losses) on investment transactions | 762,009 | 4,971,926 | ||||||
Net change in unrealized appreciation/depreciation on investments | (11,824,057 | ) | 1,307,647 | |||||
Change in net assets resulting from operations | (749,839 | ) | 26,168,681 | |||||
Distributions to Class I shareholders from: | ||||||||
Net investment income | (9,262,503 | ) | (19,966,223 | ) | ||||
Distributions to Class III shareholders from: | ||||||||
Net investment income | (654,544 | ) | — | |||||
Change in net assets from shareholder distributions | (9,917,047 | ) | (19,966,223 | ) | ||||
Change in net assets from capital transactions | (37,214,268 | ) | 27,746,147 | |||||
Change in net assets | (47,881,154 | ) | 33,948,605 | |||||
Net Assets: | ||||||||
Beginning of period | 302,284,576 | 268,335,971 | ||||||
End of period | $ | 254,403,422 | $ | 302,284,576 | ||||
CAPITAL TRANSACTIONS: | ||||||||
Class I Shares | ||||||||
Proceeds from shares issued | $ | 35,287,107 | $ | 146,627,742 | ||||
Dividends reinvested | 9,262,508 | 19,966,229 | ||||||
Cost of shares redeemed | (116,170,456 | ) | (138,847,824 | ) | ||||
| (71,620,841 | ) | 27,746,147 | ||||||
Class III Capital Transactions: | ||||||||
Proceeds from shares issued | 35,816,291 | — | ||||||
Dividends reinvested | 654,544 | — | ||||||
Cost of shares redeemed | (2,064,262 | ) | — | |||||
| 34,406,573 | — | |||||||
Change in net assets from capital transactions | $ | (37,214,268 | ) | $ | 27,746,147 | |||
SHARE TRANSACTIONS: | ||||||||
Class I Shares | ||||||||
Issued | 4,339,061 | 18,163,294 | ||||||
Reinvested | 1,169,649 | 2,485,756 | ||||||
Redeemed | (14,457,171 | ) | (17,265,939 | ) | ||||
| (8,948,461 | ) | 3,383,111 | ||||||
Class III Share Transactions: | ||||||||
Issued | 4,545,116 | — | ||||||
Reinvested | 83,488 | — | ||||||
Redeemed | (259,574 | ) | — | |||||
| 4,369,030 | — | |||||||
See notes to financial statements.
17
Table of Contents
GARTMORE VARIABLE INSURANCE TRUST
FINANCIAL HIGHLIGHTS
Selected Data for Each Share of Capital Outstanding
Federated GVIT High Income Bond Fund
| Investment Activities: | Distributions | Ratios/Supplemental Data | |||||||||||||||||||||||||||||||||||||||||
| Net Asset Value, Beginning of Period | Net Investment Income (Loss) | Net Realized and Unrealized Gains (Losses) on Investments | Total from Investment Activities | Net Investment Income | Return of Capital | Total Distributions | Net Asset Value, End of Period | Total Return | Net Assets at End of Period (000s) | Ratio of Expenses to Average Net Assets | Ratio of Net Investment Income (Loss) to Average Net Assets | Ratio of Expenses (Prior to Reimbursements) to Average Net Assets(a) | Ratio of Net Investment Income (Loss) (Prior to Reimbursements) to Average Net Assets(a) | Portfolio Turnover(b) | |||||||||||||||||||||||||||||
Class I Shares | |||||||||||||||||||||||||||||||||||||||||||
Year Ended December 31, 2000 | $ | 9.52 | 0.89 | (1.62 | ) | (0.73 | ) | (0.89 | ) | (0.01 | ) | (0.90 | ) | $ | 7.89 | (8.28% | ) | $ | 78,631 | 0.95% | 10.44% | 1.12% | 10.27% | 18.12% | |||||||||||||||||||
Year Ended December 31, 2001(c) | $ | 7.89 | 0.76 | (0.45 | ) | 0.31 | (0.76 | ) | — | (0.76 | ) | $ | 7.44 | 4.22% | $ | 114,022 | 0.95% | 9.96% | 1.03% | 9.88% | 31.64% | ||||||||||||||||||||||
Year Ended December 31, 2002 | $ | 7.44 | 0.61 | (0.38 | ) | 0.23 | (0.61 | ) | — | (0.61 | ) | $ | 7.06 | 3.23% | $ | 162,733 | 0.97% | 8.82% | 0.97% | 8.82% | 30.59% | ||||||||||||||||||||||
Year Ended December 31, 2003 | $ | 7.06 | 0.57 | 0.96 | 1.53 | (0.57 | ) | — | (0.57 | ) | $ | 8.02 | 22.27% | $ | 268,336 | 0.95% | 7.74% | (d | ) | (d | ) | 41.30% | |||||||||||||||||||||
Year Ended December 31, 2004 | $ | 8.02 | 0.60 | 0.18 | 0.78 | (0.60 | ) | — | (0.60 | ) | $ | 8.20 | 10.10% | $ | 302,285 | 0.94% | 7.46% | (d | ) | (d | ) | 61.24% | |||||||||||||||||||||
Six Months Ended June 30, 2005 (Unaudited) | $ | 8.20 | 0.34 | (0.35 | ) | (0.01 | ) | (0.31 | ) | — | (0.31 | ) | $ | 7.88 | (0.15% | )(e) | $ | 219,994 | 0.93% | (f) | 7.46% | (f) | (d | ) | (d | ) | 19.27% | ||||||||||||||||
Class III Shares | |||||||||||||||||||||||||||||||||||||||||||
Period Ended June 30, 2005 (Unaudited) (g)(h) | $ | 7.83 | 0.26 | (0.05 | ) | 0.21 | (0.16 | ) | — | (0.16 | ) | $ | 7.88 | (2.68% | )(e) | $ | 34,409 | 0.93% | (f) | 7.54% | (f) | (d | ) | (d | ) | 19.27% | |||||||||||||||||
| (a) | During the period certain fees were waived and/or reimbursed. If such waivers/reimbursements had not occurred, the ratios would have been as indicated. |
| (b) | Portfolio turnover is calculated on the basis of the Fund as a whole without distinguishing among the classes of shares. |
| (c) | The existing shares of the Fund were designated Class I shares as of May 1, 2001. |
| (d) | There were no fee reductions during the period. |
| (e) | Not annualized. |
| (f) | Annualized. |
| (g) | For the period from April 28, 2005 (commencement of operations) through June 30, 2005. |
| (h) | Net investment income (loss) is based on average shares outstanding during the period. |
See notes to financial statements.
18
Table of Contents
GARTMORE VARIABLE INSURANCE TRUST
NOTES TO FINANCIAL STATEMENTS (Unaudited)
June 30, 2005
1. Organization
Gartmore Variable Insurance Trust (“GVIT” or the “Trust”) is an open-end management investment company, organized under the laws of Delaware by an amended and restated Agreement and Declaration of Trust, dated October 28, 2004, as amended to date. The Trust, originally created under the laws of Massachusetts as a Massachusetts business trust pursuant to a Declaration of Trust dated, as of June 30, 1981, was subsequently amended, redomesticated as a Delaware Statutory Trust after the close of trading on April 29, 2005, and is registered under the Investment Company Act of 1940, as amended (the “1940 Act”). The redomestication is a change in statutory status and does not affect the operations of the Trust. As of June 30, 2005, the Trust had authorized an unlimited number of shares of beneficial interest (“shares”) without par value. The Trust currently offers shares to life insurance company separate accounts to fund the benefits under variable life insurance or annuity policies. To date, only the separate accounts of Nationwide Life Insurance Company and Nationwide Life and Annuity Insurance Company (collectively, “Nationwide”) have purchased shares of the Trust’s series. The Trust operates thirty-one (31) separate series, or mutual funds, each with its own investment objectives and strategies. This report contains the financial statements and financial highlights of the Federated GVIT High Income Bond Fund (the “Fund”).
Under the Trust’s organizational documents, the Trust’s officers and trustees are indemnified against certain liabilities arising out of the performance of their duties to the Trust. In addition, the Trust has entered into Indemnification Agreements with the Trust’s trustees and certain officers covering similar liabilities. In addition, in the normal course of business, the Trust enters into contracts with its vendors and others that provide for general indemnifications. The Trust’s maximum exposure under these arrangements is unknown, as this would involve future claims that may be made against the Trust. Based on experience, however, the Trust expects that risk of loss to be remote.
2. Summary of Significant Accounting Policies
The following is a summary of significant accounting policies followed by the Fund in the preparation of its financial statements. The policies are in conformity with accounting principles generally accepted in the United States of America (“GAAP”). The preparation of financial statements requires management to make estimates and assumptions that affect the reported amounts of assets and liabilities, the disclosure of contingent assets and liabilities at the date of the financial statements and the reported amounts of income and expenses for the period. Actual results could differ from those estimates.
| (a) | Security Valuation |
Securities for which market quotations are readily available are valued at current market value as of “Valuation Time.” Valuation Time is as of the close of regular trading on the New York Stock Exchange (usually 4 p.m. Eastern time). Equity securities are valued at the last quoted sale price or, if there is no sale price, the last quoted bid price provided by an independent pricing service approved by the Trust’s Board of Trustees. Securities traded on NASDAQ are valued at the NASDAQ official closing price. Prices are taken from the primary market or exchange in which each security trades. Most securities listed on a foreign exchange are valued either at fair value (see description below) or at the last sale price at the close of the exchange on which the security is principally traded. Foreign securities, currencies, and other assets and liabilities denominated in foreign currencies are translated into U.S. dollars at the exchange rate of said currencies against the U.S. Dollar, as of Valuation Time, as provided by an independent pricing service approved by the Board of Trustees.
Debt (including defaulted issues) and other fixed income securities (other than short-term obligations) are valued at the last quoted bid price and/or by using a combination of daily quotes and matrix evaluations provided by an independent pricing service, the use of which has been approved by the Trust’s Board of Trustees. Short-term debt securities, such as commercial paper and U.S. Treasury Bills having a remaining maturity of 60 days or less at the time of purchase, are considered to be “short-term” and are valued at amortized cost which approximates market value.
Securities for which market quotations are not readily available, or for which an independent pricing service does not provide a value or provides a value that does not represent fair value in the judgment of the Fund’s investment adviser or designee, are valued at fair value under procedures approved by the Trust’s Board of Trustees. The “Fair Value” of these securities is determined in good faith by taking into account relevant factors and surrounding circumstances. Methods utilized to obtain a
19
Table of Contents
GARTMORE VARIABLE INSURANCE TRUST
NOTES TO FINANCIAL STATEMENTS (Unaudited) (Continued)
June 30, 2005
“Fair Value” may include the following non-exclusive list of SEC-acceptable methods: (i) a multiple of earnings; (ii) the discount from market value of a similar, freely traded security; (iii) the yield-to-maturity for debt issues; or (iv) a consolidation of the methods. The Gartmore Fair Value Committee considers a non-exclusive list of factors to arrive at the appropriate method upon determining “Fair Value.” For example, fair value determinations are required for securities whose value is affected by a “significant” event that materially affects the value of a domestic or foreign security which occurs subsequent to the time of the close of the principal market on which such domestic or foreign security trades and before the Valuation Time (i.e., a “subsequent event”). Typically, this will involve events occurring after the close of a foreign market on which a security trades and before the next Valuation Time.
The Fund values foreign securities at fair value in the circumstances described below. Generally, trading in foreign securities markets is completed each day at various times prior to the Valuation Time. Due to the time differences between the closings of the relevant foreign securities exchanges and the Valuation Time for the Fund, the Fund will fair value its foreign investments when it is determined that the market quotations for the foreign investments either are not readily available or are unreliable and, therefore, do not represent fair value. When the fair value prices are utilized, these prices will attempt to reflect the impact of the U.S. financial markets’ perceptions and trading activities on the Fund’s foreign investments since the last closing prices of the foreign investments were calculated on their primary foreign securities markets or exchanges. For these purposes, the Board of Trustees of the Trust has determined that movements in relevant indices or other appropriate market indicators, after the close of the foreign securities exchanges, may demonstrate that market quotations are unreliable, and may trigger fair value pricing for certain securities. Consequently, fair valuation of portfolio securities may occur on a daily basis. In determining fair value prices, the Trust utilizes data furnished by an independent pricing service (and that data draws upon, among other information, the market values of foreign investments). The fair value prices of portfolio securities generally will be used when it is determined that the use of these prices will have a material impact on the net asset value of the Fund. When the Fund uses fair value pricing, the values assigned to the Fund’s foreign investments may not be the quoted or published prices of the investments on their primary markets or exchanges.
| (b) | Repurchase Agreements |
The Fund may enter into repurchase agreements with an entity which is a member of the Federal Reserve System or which is a “primary dealer” (as designated by the Federal Reserve Bank of New York) in U.S. Government obligations. The repurchase price generally equals the price paid by the Fund plus interest negotiated on the basis of current short-term rates, which may be more or less than the rate on the underlying portfolio securities. The seller under a repurchase agreement is required to maintain the value of the collateral held pursuant to the agreement at a market value equal to or greater than the repurchase price (including accrued interest). Collateral subject to repurchase agreements is held by the Fund’s custodian or another qualified sub-custodian or in the Federal Reserve/Treasury book-entry system. If the counterparty defaults and the fair value of the collateral declines, realization of the collateral by the Fund may be delayed or limited. The Fund may transfer uninvested cash balances into a pooled cash account. These balances are invested in one or more repurchase agreements, which are fully collateralized by AA-rated Corporate Bonds with the counterparties of CS First Boston and Nomura Securities.
| (c) | Foreign Currency Transactions |
The accounting records of the Fund are maintained in U.S. dollars. Foreign currency amounts are translated into U.S. dollars at the current rate of exchange to determine the value of investments, assets and liabilities. The Fund may enter into foreign currency contracts in connection with purchases or sales of securities denominated in a foreign currency. Purchases and sales of securities, and income and expenses, are translated at the prevailing rate of exchange on the respective date of these transactions. The Fund does not isolate that portion of the results of operations resulting from changes in foreign exchange rates on investments from fluctuations arising from changes in market prices of securities held. These fluctuations are included with the net realized and unrealized gain or loss from investments and foreign currencies.
| (d) | Risks Associated with Foreign Securities and Currencies |
Investments in securities of foreign issuers carry certain risks not ordinarily associated with investments in securities of U.S. issuers. These risks include future political and economic developments, and the possible imposition of exchange controls or
20
Table of Contents
GARTMORE VARIABLE INSURANCE TRUST
NOTES TO FINANCIAL STATEMENTS (Unaudited) (Continued)
June 30, 2005
other foreign governmental laws and restrictions. In addition, with respect to certain countries, there is the possibility of expropriation of assets, confiscatory taxation, political or social instability, or diplomatic developments, which could adversely affect investments in those countries.
Certain countries also may impose substantial restrictions on investments in their capital markets by foreign entities, including restrictions on investments in issuers of industries deemed sensitive to relevant national interests. These factors may limit the investment opportunities available and result in a lack of liquidity and high price volatility with respect to securities of issuers from developing countries.
| (e) | Forward Foreign Currency Contracts |
The Fund may enter into forward foreign currency contracts in connection with planned purchases or sales of securities or to hedge the U.S. dollar value of portfolio securities denominated in a particular currency. The Fund could be exposed to risks if the counterparties to the contracts are unable to meet the terms of their contracts and from unanticipated movements in the value of a foreign currency relative to the U.S. dollar. Forward foreign currency contracts are valued at the current cost of covering these contracts, as provided by an independent pricing service approved by the Board of Trustees. The forward foreign currency contracts are adjusted by the daily exchange rate of the underlying currency and any gains or losses are recorded for financial statement purposes as unrealized gains or losses until the contract settlement date.
| (f) | Futures Contracts |
The Fund may invest in financial futures contracts (“futures contracts”) for the purpose of hedging its existing portfolio securities or securities that the Fund intends to purchase against fluctuations in value caused by changes in prevailing market interest rates or prices. Futures contracts may also be entered into for non-hedging purposes.
Upon entering into a futures contract, the Fund is required to pledge to the broker an amount of cash and/or other assets equal to a certain percentage of the contract amount (initial margin deposit). Subsequent payments, known as “variation margin,” are made each day, depending on the daily fluctuations in the fair value/market value of the underlying assets. A gain or loss equal to the daily variation margin is recognized on a daily basis. Futures contracts are valued daily at their last quoted sale price.
A “sale” of a futures contract means a contractual obligation to deliver the securities or foreign currency called for by the contract at a fixed price at a specified time in the future. A “purchase” of a futures contract means a contractual obligation to acquire the securities or foreign currency at a fixed price at a specified time in the future.
Should market conditions change unexpectedly, the Fund may not achieve the anticipated benefits of the futures contracts and may realize a loss. The use of futures transactions for hedging purposes involves the risk of imperfect correlation in movements in the price of futures contracts, interest rates, and the value of the underlying hedged assets.
| (g) | Written Options Contracts |
The Fund may write options contracts. A written option obligates the Fund to deliver (written call) or to receive (written put) a specified quantity of an underlying asset at the contract amount upon exercise by the holder of the option. The value of the option contract is recorded as a liability and unrealized gain or loss is measured by the difference between the current value and the premium received. Options traded on an exchange are valued at the last quoted sale price, or in the absence of a sale, the bid price provided by an independent pricing service approved by the Board of Trustees. Non-exchange traded options are valued using dealer supplied quotes.
| (h) | Security Transactions and Investment Income |
Security transactions are accounted for on the date the security is purchased or sold (“trade date”). Securities gains and losses are calculated on the identified cost basis. Interest income is recognized on the accrual basis and includes, where applicable, the amortization or accretion of premium or discount.
21
Table of Contents
GARTMORE VARIABLE INSURANCE TRUST
NOTES TO FINANCIAL STATEMENTS (Unaudited) (Continued)
June 30, 2005
| (i) | Securities Lending |
To generate additional income, the Fund may lend up to 33 1/3% of the Fund’s total assets pursuant to agreements, requiring that the borrower deliver cash or securities as collateral with respect to each new loan of U.S. securities, equal to at least 102% of the value of the portfolio securities loaned, and with respect to each new loan of non-U.S. securities, collateral of at least 105% of the value of the portfolio securities loaned, and thereafter requiring the borrower to mark to market the collateral on a daily basis and requiring the borrower to make up any shortfall of collateral. The Fund receives payments from borrowers equivalent to the dividends and interest that would have been earned on securities lent while simultaneously seeking to earn income on the investment of cash collateral. Collateral is marked to market daily to provide a level of collateral at least equal to the market value of securities loaned. There may be risks of delay in recovery of the securities should the borrower of the securities fail financially. Loans will be made, however, only to borrowers deemed by the Fund’s investment adviser to be of good standing and creditworthy under guidelines established by the Board of Trustees and when, in the judgment of the adviser, the consideration which can be earned currently from these securities loans justifies the attendant risks. Loans are subject to termination by the Fund or the borrower at any time, and, therefore, are not considered to be illiquid investments. JPMorgan Chase Bank serves as custodian for the securities lending program of the Fund. JPMorgan Chase Bank receives a custody fee based on the value of collateral received from borrowers.
The cash collateral received by the Fund was pooled and, at June 30, 2005, was invested in the following:
Security Type | Security Name | Market Value | Maturity Rate | Maturity Date | |||||
| Repurchase Agreement | Nomura Securities | $ | 390,808 | 3.48% | 07/01/05 | ||||
| As | of June 30, 2005, the Fund had securities with the following market values on loan: |
| Market Value of Loaned Securities | Market Value of Collateral | |||||
| $ | 385,733 | $ | 390,808 | |||
| (j) | Distributions to Shareholders |
The Fund’s dividends from net investment income, if any, are declared and paid quarterly. The Fund’s distributable net realized capital gains, if any, are declared and distributed at least annually.
Dividends and distributions to shareholders are determined in accordance with federal income tax regulations, which may differ from GAAP. These “book/tax” differences are considered either permanent or temporary in nature. In accordance with the American Institute of Certified Public Accountants (“AICPA”) Statement of Position 93-2, permanent differences (i.e., reclassification of market discounts, gain/loss, paydowns, and distributions) are reclassified within the capital accounts based on their nature for federal income tax purposes; temporary differences do not require reclassification. These reclassifications have no effect upon the net asset value of the Fund. To the extent distributions exceed current and accumulated earnings and profits for federal income tax purposes, these distributions are reported as distributions of paid-in-capital.
(k) Federal Income Taxes
It is the policy of the Fund to qualify or continue to qualify as a “regulated investment company” by complying with the provisions available to certain investment companies, as defined in applicable sections of the U.S. Internal Revenue Code, and to make distributions of net investment income and net realized capital gains sufficient to relieve the Fund from all, or substantially all, federal income taxes.
As of June 30, 2005, the tax cost of securities and the breakdown of unrealized appreciation (depreciation) for the Fund is as follows:
Tax Cost of | Unrealized Appreciation | Unrealized Depreciation | Net Unrealized Appreciation (Depreciation) | |||||||
$750 | $ | 11,425,801 | $ | (7,311,960 | ) | $ | 4,113,841 | |||
22
Table of Contents
GARTMORE VARIABLE INSURANCE TRUST
NOTES TO FINANCIAL STATEMENTS (Unaudited) (Continued)
June 30, 2005
| (l) | Allocation of Expenses, Income, and Gains and Losses |
Expenses directly attributable to the Fund are charged to the Fund. Expenses not directly attributable to the Fund are allocated proportionately among various or all funds within the Trust. The method used by the Fund for allocating income, fund level expenses, and realized and unrealized gains or losses is based on the fair value of shares outstanding relative to net assets. Under this method, each class of shares participates based on the total net asset value of that class’s shares in proportion to the total net assets of the Fund. Expenses specific to a class (such a rule 12b-1 and administrative services fees) are charged to that class.
3. Transactions with Affiliates
Under the terms of the Trust’s Investment Advisory Agreement, Gartmore Mutual Fund Capital Trust (“GMF”) manages the investment of the assets and supervises the daily business affairs of the Fund. GMF is a wholly-owned subsidiary of Gartmore Global Investments, Inc. (“GGI”), a holding company. GGI is a majority-owned subsidiary of Gartmore Global Asset Management Trust (“GGAMT”). GGAMT is a wholly-owned subsidiary of Nationwide Corporation. All of the common stock of Nationwide Corporation is held by Nationwide Mutual Insurance Company (95.2%) and Nationwide Mutual Fire Insurance Company (4.8%), each of which is a mutual company owned by its policyholders. In addition, GMF provides investment management evaluation services in initially selecting and monitoring, on an ongoing basis, the performance of the subadviser, for the Fund that GMF advises. Federated Investment Management Company (the “subadviser”), manages all of the Fund’s investments and has the responsibility for making all investment decisions for the Fund.
Under the terms of the Investment Advisory Agreement, the Fund pays GMF an investment advisory fee based on that Fund’s average daily net assets. From such fees, pursuant to the subadvisory agreement, GMF pays fees to the subadviser. Additional information regarding investment advisory fees and subadvisory fees for GMF and the subadviser is as follows for the six months ended June 30, 2005:
| Fee Schedule | Total Fees | Fees Retained | Paid to Sub-adviser | |||
Up to $50 million | 0.80% | 0.40% | 0.40% | |||
Next $200 million | 0.65% | 0.40% | 0.25% | |||
Next $250 million | 0.60% | 0.40% | 0.20% | |||
$500 million or more | 0.55% | 0.40% | 0.15% |
Under the terms of a Fund Administration and Transfer Agency Agreement, Gartmore SA Capital Trust (“GSA”) provides the Fund with various administrative and accounting services, and Gartmore Investors Services, Inc. (“GISI”), an indirect subsidiary of GSA, serves as Transfer and Dividend Disbursing Agent for the Fund. The fees for the services provided under this Agreement are calculated based on the Trust’s average daily net assets according to the fee schedule below. The fees are then allocated proportionately among all funds within the Trust in relation to the average daily net assets of each fund and are paid to GSA. GSA pays GISI from these fees for its services.
| Combined Fee Schedule* | ||
Up to $1 billion | 0.13% | |
$1 billion and more up to $3 billion | 0.08% | |
$3 billion and more up to $8 billion | 0.05% | |
$8 billion and more up to $10 billion | 0.04% | |
$10 billion and more up to $12 billion | 0.02% | |
$12 billion or more | 0.01% | |
| * | The assets of the Gartmore GVIT Investor Destinations Aggressive Fund, the Gartmore GVIT Investor Destinations Moderately Aggressive Fund, the Gartmore GVIT Investor Destinations Moderate Fund, the Gartmore GVIT Investor Destinations Moderately Conservative Fund, and the Gartmore GVIT Investor Destinations Conservative Fund (collectively, the “Investor Destinations Funds”) are excluded from the Trust asset level amount in order to calculate this asset-based fee. The Investor Destinations Funds do not pay any part of this fee. |
23
Table of Contents
GARTMORE VARIABLE INSURANCE TRUST
NOTES TO FINANCIAL STATEMENTS (Unaudited) (Continued)
June 30, 2005
Effective January 1, 2005, the fee for the fund administration and transfer agency services increased as set forth below. The fees are calculated based on the Trust’s average daily net assets according to the fee schedule below. The fees are then allocated proportionately among all funds within the Trust in relation to the average daily net assets of each fund and are paid to GSA.
| Combined Fee Schedule* | ||
Up to $1 billion | 0.15% | |
$1 billion and more up to $3 billion | 0.10% | |
$3 billion and more up to $8 billion | 0.05% | |
$8 billion and more up to $10 billion | 0.04% | |
$10 billion and more up to $12 billion | 0.02% | |
$12 billion or more | 0.01% | |
| * | The assets of each of the Investor Destinations Funds are excluded from the Trust asset level amount in order to calculate this asset-based fee. The Investor Destinations Funds do not pay any part of this fee. |
GSA and GISI have entered into agreements with BISYS Fund Services Ohio, Inc. (“BISYS”), pursuant to which BISYS provides sub-administration and sub-transfer agency services, respectively, to the Fund.
Under the terms of an Administrative Services Plan, the Fund may pay fees to servicing organizations, such as broker-dealers, including Nationwide Financial Services, and financial institutions, which agree to provide administrative support services to the shareholders of certain classes. These services include, but are not limited, to the following: establishing and maintaining shareholder accounts; processing purchase and redemption transactions; arranging bank wires; performing shareholder sub-accounting; answering inquires regarding the Fund; and other such services. These fees are based on an annual rate of up to 0.25% of the average daily net assets of each class of shares of the Fund.
4. Short-Term Trading Fees
The Fund reserves the right to assess a short-term trading fee on certain transactions out of Class III shares that a separate account makes on behalf of a variable insurance contract owner (the “contract owner”). A separate account that redeems Class III shares on behalf of a contract owner may be subject to a 1.00% short-term trading fee if the separate account held the Class III shares on behalf of the contract owner for 60 days or less. The short-term trading fee is paid directly to the Fund and is designed to offset the cost to the Fund of excess brokerage commissions and other costs associated with fluctuations in fund asset levels and cash flow caused by short-term trading. For purposes of determining whether the short-term trading fee applies, the Class III shares that were held on behalf of the contract owner the longest will be treated as being redeemed first.
For the six months ended June 30, 2005, the Fund had no contributions to capital due to collection of redemption fees.
5. Investment Transactions
For the six months ended June 30, 2005, (excluding short-term securities) the Fund had purchases of $51,407,774 and sales of $85,487,406.
6. Portfolio Investment Risks
Credit and Market Risk. The Fund invests in high yield instruments and are subject to certain additional credit and market risks. The yields of high yield debt obligations reflect, among other things, perceived credit risk. The Fund’s investment in securities rated below investment grade typically involve risks not associated with higher rated securities including, among others, greater risk of not receiving timely and/or ultimate payment of interest and principal, greater market price volatility, and less liquid secondary market trading.
24
Table of Contents
GARTMORE VARIABLE INSURANCE TRUST
NOTES TO FINANCIAL STATEMENTS (Unaudited) (Continued)
June 30, 2005
7. Bank Loans
The Trust has a credit agreement of $100,000,000. Borrowings under this arrangement bear interest at the Federal Funds rate plus 0.50%. The interest costs are included in custodian fees in the Statement of Operations. No compensation balances were required under the terms of the line of credit. There were no borrowings outstanding as of June 30, 2005.
8. Shareholder Meeting
A separate shareholders meeting was held on Tuesday, December 23, 2004, for the shareholders of the Trust’s predecessor pursuant to a Proxy Statement On Schedule 14A, dated October 29, 2004, and mailed to the shareholders of the Trust’s predecessor on or around November 5, 2004.
Two Proposals: The purpose of the December 23, 2004 meeting was to allow the shareholders of the Trust’s predecessor to vote on:
| i. | Proposal One: The election of the Trust’s Board of Trustees; and |
| ii. | Proposal Two: The approval of an “Agreement and Plan of Reorganization” that provided for the reorganization of the Trust from a Massachusetts business trust into a Delaware statutory trust. |
Proposal One: As set forth in the October 29, 2004 Proxy Statement, the nominees for election as Trustees of the Trust’s predecessor were: Charles E. Allen, Michael J. Baresich, Paula H.J. Cholmondeley, C. Brent DeVore, Phyllis Kay Dryden, Robert M. Duncan, Barbara L. Hennigar, Paul J. Hondros, Barbara I Jacobs, Thomas J. Kerr IV, Douglas F. Kridler, Michael D. McCarthy, Arden L. Shisler, and David C. Wetmore.
Proposal Two: As specifically set forth in the October 29, 2004 Proxy Statement, the Reorganization proposal requested the shareholders of the Trust’s predecessor to approve the proposed “Agreement and Plan of Reorganization” of the Trust’s predecessor (on behalf of each of the its funds) into a new Delaware-domiciled Trust, whereby the Funds of the new Delaware Trust would acquire all of the assets of the corresponding funds of the Trust’s predecessor subject to the liabilities, expenses, costs, charges, and reserves of the corresponding funds of the Trust’s predecessor (contingent or otherwise), in exchange for shares of the acquiring Funds to be distributed pro rata by the Trust to the holders of the shares of the funds of the Trust’s predecessor, in a complete liquidation of the Trust’s predecessor.
| Voting | Results: |
The shareholders of the Trust’s predecessor voted to approve both Proposal One and Proposal Two, as follows:
Proposal 1: Election of a Board of Trustees of Gartmore Variable Insurance Trust
Charles E. Allen: | ||
FOR | 2,797,230,318.955 shares (96.078%) | |
WITHHOLD | 114,195,693.660 shares (3.922%) | |
TOTAL | 2,912,726,012.615 shares (100.000%) | |
Michael J. Baresich: | ||
FOR | 2,796,135,979.559 shares (96.040%) | |
WITHHOLD | 115,290,033.056 shares (3.960%) | |
TOTAL | 2,912,726,012.615 shares (100.000%) | |
Paula H.J. Cholmondeley: | ||
FOR | 2,795,095,945.396 shares (96.004%) | |
WITHHOLD | 116,330,067.219 shares (3.996%) | |
TOTAL | 2,912,726,012.615 shares (100.000%) | |
25
Table of Contents
GARTMORE VARIABLE INSURANCE TRUST
NOTES TO FINANCIAL STATEMENTS (Unaudited) (Continued)
June 30, 2005
C. Brent DeVore: | ||
FOR | 2,797,207,046.916 shares (96.077%) | |
WITHHOLD | 114,218,965.699 shares (3.923%) | |
TOTAL | 2,912,726,012.615 shares (100.000%) | |
Phyllis Kay Dryden: | ||
FOR | 2,795,587,023.994 shares (96.021%) | |
WITHHOLD | 115,838,988.621 shares (3.979%) | |
TOTAL | 2,912,726,012.615 shares (100.000%) | |
Robert M. Duncan: | ||
FOR | 2,790,191,720.503 shares (95.836%) | |
WITHHOLD | 121,234,292.112 shares (4.164%) | |
TOTAL | 2,912,726,012.615 shares (100.000%) | |
Barbara L. Hennigar: | ||
FOR | 2,792,939,848.858 shares (95.937%) | |
WITHHOLD | 118,486,163.757 shares (4.070%) | |
TOTAL | 2,912,726,012.615 shares (100.000%) | |
Paul J. Hondros: | ||
FOR | 2,797,557,404.448 shares (96.089%) | |
WITHHOLD | 113,868,608.167 shares (3.911%) | |
TOTAL | 2,912,726,012.615 shares (100.000%) | |
Barbara I. Jacobs: | ||
FOR | 2,796,306,126.654 shares (96.046%) | |
WITHHOLD | 115,119,885.961 shares (3.954%) | |
TOTAL | 2,912,726,012.615 shares (100.000%) | |
Thomas J. Kerr IV: | ||
FOR | 2,789,755,720.087 shares (95.821%) | |
WITHHOLD | 121,670,292.528 shares (4.179%) | |
TOTAL | 2,912,726,012.615 shares (100.000%) | |
Douglas F. Kridler: | ||
FOR | 2,798,065,774.375 shares (96.106%) | |
WITHHOLD | 113,360,238.240 shares (3.894%) | |
TOTAL | 2,912,726,012.615 shares (100.000%) | |
Michael D. McCarthy: | ||
FOR | 2,797,452,613.694 shares (96.085%) | |
WITHHOLD | 113,973,395.921 shares (3.915%) | |
TOTAL | 2,912,726,012.615 shares (100.000%) | |
26
Table of Contents
GARTMORE VARIABLE INSURANCE TRUST
NOTES TO FINANCIAL STATEMENTS (Unaudited) (Continued)
June 30, 2005
Arden L. Shisler: | ||
FOR | 2,796,738,454.730 shares (96.061%) | |
WITHHOLD | 114,687,557.885 shares (3.939%) | |
TOTAL | 2,912,726,012.615 shares (100.000%) | |
David C. Wetmore: | ||
FOR | 2,794,784,752.247 shares (95.994%) | |
WITHHOLD | 116,641,260.368 shares (4.006%) | |
TOTAL | 2,912,726,012.615 shares (100.000%) | |
Proposal 2: Approval of the Agreement and Plan of Reorganization of Gartmore Variable Insurance Trust
FOR | 2,561,003,822.546 shares (87.964%) | |
AGAINST | 103,593,261.010 shares (3.558%) | |
ABSTAIN | 246,828,929.059 shares (8.478%) | |
TOTAL | 2,912,726,012.615 shares (100.000%) | |
27
Table of Contents
GARTMORE VARIABLE INSURANCE TRUST
Management Information (Unaudited)
June 30, 2005
Trustees who are not Interested Persons (as defined in the 1940 Act) and Officers of the Funds June 30, 2005
| Name, Address and Date of Birth | Position(s) Held with the Trust and Length of Time Served1 | Principal Occupation(s) During Past 5 Years | Number of Portfolios in the Gartmore Fund Complex Overseen by Trustee | Other Directorships Held by Trustee or Nominee2 | ||||
Charles E. Allen
c/o Gartmore Global Investments, Inc. 1200 River Road, Suite 1000 Conshohocken, PA 19428
1948 | Trustee since July 2000 | Mr. Allen is Chairman, Chief Executive Officer and President of the Graimark Realty Advisors, Inc. (real estate development, investment and asset management). | 84 | None | ||||
Paula H.J. Cholmondeley
c/o Gartmore Global Investments, Inc. 1200 River Road, Suite 1000 Conshohocken, PA 19428
1940 | Trustee since July 2000 | Ms. Cholmondeley has been the Chairman and Chief Executive Officer of the Sorrel Group, a management consulting company, since January 2004. From March 2000 through December 2003, Ms. Cholmondeley was Vice President and General Manager of Sappi Fine Paper North America. Prior thereto, Ms. Cholmondeley was Vice President and General Manager of Residential Insulation of Owens Corning. | 84 | Director of Dentsply International, Inc., Ultralife Batteries, Inc., Terex Corporation, Minerals Technology, Inc. and Albany International Corp. | ||||
C. Brent DeVore
c/o Gartmore Global Investments, Inc. 1200 River Road, Suite 1000 Conshohocken, PA 19428
1940 | Trustee since 1990 | Dr. DeVore is President of Otterbein College. | 84 | None | ||||
Phyllis K. Dryden
c/o Gartmore Global Investments, Inc. 1200 River Road, Suite 1000 Conshohocken, PA 19428
1947 | Trustee since December 2004 | Ms. Dryden was a former Managing Partner of marchFIRST, a global management consulting firm prior to 2002. | 84 | None |
28
Table of Contents
GARTMORE VARIABLE INSURANCE TRUST
Management Information (Unaudited)
June 30, 2005
| Name, Address and Date of Birth | Position(s) Held with the Trust and Length of Time Served1 | Principal Occupation(s) During Past 5 Years | Number of Portfolios in the Gartmore Fund Complex Overseen by Trustee | Other Directorships Held by Trustee or Nominee2 | ||||
Barbara L. Hennigar*
c/o Gartmore Global Investments, Inc. 1200 River Road, Suite 1000 Conshohocken, PA 19428
1935 | Trustee since July 2000 | Retired since June 2000. Prior thereto, Ms. Hennigar was the Chairman or President and Chief Executive Officer of OppenheimerFunds Services and a member of the Executive Committee of OppenheimerFunds. | 84 | None | ||||
Barbara I. Jacobs
c/o Gartmore Global Investments, Inc. 1200 River Road, Suite 1000 Conshohocken, PA 19428
1950 | Trustee since December 2004 | Ms. Jacobs has served as Chairman of the Board of Directors of KICAP Network Fund, a European (United Kingdom) hedge fund, since December 2000. Prior to 2004, Ms. Jacobs was also a Managing Director and European Portfolio Manager with CREF Investments (Teachers Insurance Annuity Association — College Retirement Equity Fund). | 84 | None | ||||
Douglas F. Kridler
c/o Gartmore Global Investments, Inc. 1200 River Road, Suite 1000 Conshohocken, PA 19428
1955 | Trustee since September 1997 | Mr. Kridler has served as the President and Chief Executive Officer of the Columbus Foundation (a Columbus, OH-based foundation which manages over 1,300 individual endowment funds) since February 2002. Mr. Kridler was the President of the Columbus Association for the Performing Arts prior thereto and Chairman of the Greater Columbus Convention and Visitors Bureau during 2000 and 2001. | 84 | None | ||||
Michael D. McCarthy
c/o Gartmore Global Investments, Inc. 1200 River Road, Suite 1000 Conshohocken, PA 19428
1947 | Trustee since December 2004 | Mr. McCarthy serves as: the Founder and Chairman of The Eureka Foundation (which sponsors and funds the “Great Museums” series on PBS); and a Partner of Pineville Properties LLC (a commercial real estate development firm). | 843 | None |
29
Table of Contents
GARTMORE VARIABLE INSURANCE TRUST
Management Information (Unaudited)
June 30, 2005
| Name, Address and Date of Birth | Position(s) Held with the Trust and Length of Time Served1 | Principal Occupation(s) During Past 5 Years | Number of Portfolios in the Gartmore Fund Complex Overseen by Trustee | Other Directorships Held by Trustee or Nominee2 | ||||
David C. Wetmore
c/o Gartmore Global Investments, Inc. 1200 River Road, Suite 1000 Conshohocken, PA 19428
1948 | Trustee since 1995 and Chairman since February 2005 | Retired. Mr. Wetmore was formerly a Managing Director of Updata Capital, an investment banking and venture capital firm. | 84 | None |
| * | Pursuant to the Trust’s mandatory retirement policy, Ms. Hennigar is expected to retire on or about January 12, 2006. |
| 1 | The term of office length is until a trustee resigns or reaches a mandatory retirement age of 70. On March 2, 2000, the Board adopted a five-year implementation period for any Trustee 65 or older as of the adoption of this policy. Pursuant to this policy, Messrs. Duncan and Kerr retired as trustees effective as of March 12, 2005. |
| 2 | Directorships held in (1) any other investment companies registered under the 1940 Act, (2) any company with a class of securities registered pursuant to Section 12 of the Securities Exchange Act of 1934, as amended (the “Exchange Act”), or (3) any company subject to the requirements of Section 15(d) of the Exchange Act. |
| 3 | Mr. McCarthy was also an Administrative Committee Member for the Alphagen Arneb Fund, LLC, The Healthcare Fund LDC, The Leaders Long-Short Fund, LLC, and The Leaders Long-Short Fund LDC, four private investment companies (hedge funds) managed by GSA. Mr. McCarthy resigned as an Administrative Committee Member effective June 30, 2005. |
Trustees and Officers who are not Interested Persons (as defined in the 1940 Act) of the Funds received aggregate compensation of $274,882 from the Trust for the Six Months Ended June 30, 2005. Additional information regarding the Trustees and Officers may be found in the Trust’s statement of additional information, which is available without charge upon request, by calling 1-800-848-0920.
30
Table of Contents
GARTMORE VARIABLE INSURANCE TRUST
Management Information (Unaudited)
June 30, 2005
Trustees who are Interested Persons (as defined in the 1940 Act) and/or Officers of the Funds June 30, 2005
| Name, Address and Age | Position(s) Held with the Trust and Length of Time Served1 | Principal Occupation(s) During Past 5 Years | Number of Portfolios in the Gartmore Fund Complex Overseen by Trustee | Other Directorships Held by Trustee2 | ||||
Paul J. Hondros
Gartmore Global Investments, Inc. 1200 River Road, Suite 1000 Conshohocken, PA 19428
1948 | Trustee since July 2000 | Mr. Hondros has been President and Chief Executive Officer of various Gartmore entities, including Gartmore Distribution Services, Inc. (“GDSI”),3 Gartmore Investor Services, Inc. (“GISI”),3 Gartmore Morley Capital Management, Inc. (“GMCM”),3 Gartmore Morley Financial Services, Inc. (“GMFS”),3 NorthPointe Capital, LLC (“NorthPointe”),3 Gartmore Global Asset Management Trust (“GGAMT”)3, Gartmore Global Investments, Inc. (“GGI”)3, Gartmore Mutual Fund Capital Trust (“GMFCT”)3 and Gartmore SA Capital Trust (“GSA”)3; and a Director of Nationwide Securities, Inc.3, as well as several entities within Nationwide Financial Services, Inc. | 844 | None | ||||
Arden L. Shisler
c/o Gartmore Global Investments, Inc. 1200 River Road, Suite 1000 Conshohocken, PA 19428
1941 | Trustee since February 2000 | Mr. Shisler has been a consultant since January 2003. Prior thereto, he was President and Chief Executive Officer of K&B Transport, Inc., a trucking firm. Since 1992, Mr. Shisler has also been Chairman of the Board for Nationwide Mutual Insurance Company3. | 84 | Director of Nationwide Financial Services, Inc. | ||||
Gerald J. Holland
Gartmore Global Investments, Inc. 1200 River Road, Suite 1000 Conshohocken, PA 19428
1951 | Treasurer since March 2001 | Mr. Holland is Senior Vice President - Operations for GGI3, GMFCT3 , and GSA3. Prior to July 2000, Mr, Holland was Vice President for First Data Investor Services, an investment company service provider. | 84 | None |
31
Table of Contents
GARTMORE VARIABLE INSURANCE TRUST
Management Information (Unaudited)
June 30, 2005
| Name, Address and Age | Position(s) Held with the Trust and Length of Time Served1 | Principal Occupation(s) During Past 5 Years | Number of Portfolios in the Gartmore Fund Complex Overseen by Trustee | Other Directorships Held by Trustee2 | ||||
Michael A. Krulikowski
Gartmore Global Investments, Inc. 1200 River Road, Suite 1000 Conshohocken, PA 19428
1959 | Chief Compliance Officer since June 2004 | Since November 1999, Mr. Krulikowski has served as a Vice President and Chief Compliance Officer of GGI. Prior thereto, Mr. Krulikowski served as Chief Compliance Officer of 1717 Capital Management Company/Provident Mutual Insurance Company. | 84 | None | ||||
Eric E. Miller
Gartmore Global Investments, Inc. 1200 River Road, Suite 1000 Conshohocken, PA 19428
1953 | Secretary since December 2002 | Mr. Miller is Senior Vice President, Chief Counsel for GGI3, GMFCT3 and GSA3 since August 2002. From August 2000 to August 2002, Mr. Miller was a Partner with Stradley Ronan Stevens & Young, LLP. Prior to August 2000, Mr. Miller served as Senior Vice President and Deputy General Counsel at Delaware Investments. | 84 | None |
| 1 | The term of office length is until a trustee resigns or reaches a mandatory retirement age of 70. On March 2, 2000, the Board adopted a five-year implementation period for any Trustee 65 or older as of the adoption of this policy. Pursuant to this policy, Messrs. Duncan and Kerr retired as trustees effective as of March 12, 2005. |
| 2 | Directorships held in (1) any other investment companies registered under the 1940 Act, (2) any company with a class of securities registered pursuant to Section 12 of the Securities Exchange Act of 1934, as amended (the “Exchange Act”), or (3) any company subject to the requirements of Section 15(d) of the Exchange Act. |
| 3 | This position is held with an affiliated person or principal underwriter of the Trust. |
| 4 | Mr. Hondros was also an Administrative Committee Member for the Alphagen Arneb Fund, LLC, The Healthcare Fund LDC, The Leaders Long-Short Fund, LLC, and The Leaders Long-Short Fund LDC, four private investment companies (hedge funds) managed by GSA. Mr. Hondros resigned as Administrative Committee Member effective June 30, 2005. |
Federal law requires the Trust, each of its investment advisers and sub-advisers to adopt procedures for voting proxies (“Proxy Voting Guidelines”) and to provide a summary of those Proxy Voting Guidelines used to vote the securities held by the Funds. The Funds’ proxy voting policies and procedures are available without charge (i) upon request, by calling 1-800-848-0920, (ii) on the Fund’s website at www.gartmorefunds.com, or (iii) on the Securities and Exchange Commission’s website at www.sec.gov.
32
Table of Contents
GVIT Equity 500 Index Fund
Semiannual Report
| | June 30, 2005 |
| Contents | ||
| 5 | Statement of Investments | |
| 13 | Statement of Assets and Liabilities | |
| 13 | Statement of Operations | |
| 14 | Statements of Changes in New Assets | |
| 15 | Financial Highlights | |
| 16 | Notes to Financial Statements | |
Commentary provided by Gartmore Global Investments, investment adviser to Gartmore Variable Insurance Trust. All opinions and estimates included in this report constitute Gartmore Global Investments’ judgment as of the date of this report and are subject to change without notice.
Statement Regarding Availability of Quarterly Portfolio Schedule.
The Gartmore Variable Insurance Trust files complete schedules of portfolio holdings for each Fund with the Securities and Exchange Commission (the “Commission”) for the first and third quarters of each fiscal year on Form N-Q. The Funds’ Forms N-Q are available on the Commission’s website at http://www.sec.gov. The Funds’ Forms N-Q may be reviewed and copied at the Commission’s Public Reference Room in Washington, DC, and information on the operation of the Public Reference Room may be obtained by calling 800-SEC-0330; and the Funds make the information on Form N-Q available to shareholders upon request without charge.
Statement Regarding Availability of Proxy Voting Record.
Information regarding how the Fund voted proxies relating to portfolio securities held during the most recent 12-month period ended June 30, 2005 is available without charge, upon request, by calling 800-848-0920, and on the Commission’s website at http://www.sec.gov.
Table of Contents
GVIT Equity 500 Index Fund
For the semiannual period ended June 30, 2005, the GVIT Equity 500 Index Fund (Class IV at NAV) returned -0.89% versus -0.81% for its benchmark, the S&P 500® Index. For broader comparison, the average return for the Fund’s Lipper peer category of S&P 500 Index Objective Funds was -0.96%.
The first half of 2005 proved to be volatile, with the Fund’s benchmark, the S&P 500 Index starting the year in negative territory, down 2.4% in January, ultimately resulting in a disappointing first quarter. The Index was down 2.2% through March. May has been the best-performing month of the year so far, returning 3.2% and making back some of the first quarter’s losses. The Index returned 1.4% in the second quarter, bringing the year-to-date return up to the loss stated above through June 30.
Equity markets stumbled during the first quarter, driven by record highs in crude oil prices, a sharply reduced profit outlook in the marketplace and a fresh sense of inflation concern from the U.S. Federal Open Market Committee. Each factor took its toll on investors’ appetite for risk.
The second quarter saw a continued tightening by the Federal Reserve Board as it continued to adjust rates upward, lifting the target federal funds rate to 3.25% by the end of June. Bonds remained resilient, keeping equities attractive on a relative basis. Crude oil also continued to rise, topping $60 per barrel.
During the first six months of the year, six S&P 500 Index sector’s performance declined; only four sectors returned gains within the Index. Of the six lagging sectors, the returns of the information technology, consumer discretionary and industrials sectors were the biggest detractors from Fund performance.
Within information technology, International Business Machines Corp. (IBM) declined steeply, adding to the sectors fall, which persisted through June. The firm suffered because it fell short of sales targets due to the weakening of the software market and the slowdown of demand in Europe. The consumer discretionary sector has retreated so far this year, largely due to eBay Inc.’s drop. The online auctioneer faces increased competition from rivals Google Inc. and Yahoo! Inc.’s. Industrials declined because United Parcel Service of America Inc. (UPS) pulled down the sector. Concerns about free trade and increased costs from high oil and gas prices have kept earnings growth flat for UPS. The materials sector was the worst performer during the reporting period, declining with International Paper Co. as the primary detractor.
The best-performing sector for the Fund was energy. ExxonMobil Corp.’s strong return pushed the sector’s performance due to the ongoing strength of both crude oil and natural gas prices. The next-best sector was utilities, led by eXelon Corp. and Duke Energy Corp. Health care also was up, led by UnitedHealth Group Inc. The health-care provider benefited from increased revenues and a continuing strategy of acquisitions.
The Fund is a replicating portfolio and continues to strive to match the performance of the S&P 500 Index. Three Index composition changes occurred during the period, resulting in 1.2% turnover. In September 2005, the S&P 500 Index will complete the free-float adjustments announced last year.
PORTFOLIO MANAGER: Deane Gyllenhaal
Investing in mutual funds involves risk, including possible loss of principal.
There is no assurance that the investment objective of any fund will be achieved.
Standard & Poor’s 500 (S&P 500) Index: An unmanaged, capitalization-weighted index of 500 widely held stocks of large-cap U.S. companies that gives a broad look at how the stock prices of those companies have performed.
Lipper Analytical Services, Inc. is an industry research firm whose rankings are based on total return performance and do not reflect the effects of sales charges.
The Gartmore Variable Insurance Trust Funds are available only as sub-account investment options in certain variable insurance products. Accordingly, investors are unable to invest in shares of these funds outside of an insurance product. Performance information found herein reflects only the performance of these funds, and does not indicate the performance your sub-account may experience under your variable insurance contract. Performance returns assume reinvestment of all distributions. The investment return and principal value of an investment will fluctuate so that an investor’s shares, when redeemed, may be worth more or less than their original cost. Index performance is provided for comparison purposes only; the indexes shown are unmanaged and do not reflect any fees or expenses. Investors cannot invest directly in market indexes. To obtain performance information about the sub-account option under your insurance contract that invests in one of these funds, please contact your variable insurance carrier. PAST PERFORMANCE IS NO GUARANTEE OF FUTURE RESULTS.
Commentary provided by Gartmore Global Investments. All opinions and estimates included in this report constitute Gartmore Global Investments’ judgment as of the date of this report and are subject to change without notice.
Investors should carefully consider a fund’s investment objectives, risks, fees, charges and expenses before investing any money. To obtain this and other information on Gartmore Variable Insurance Trust, please contact your variable insurance contract provider or call 800-848-0920. Please read the Trust’s prospectus carefully before investing any money.
Gartmore Funds distributed by Gartmore Distribution Services, Inc., Member NASD. 1200 River Road, Suite 1000, Conshohocken, PA 19428.
1
Table of Contents
Fund Performance | GVIT Equity 500 Index Fund |
| Average | Annual Total Return1 |
(For Periods Ended June 30, 2005)
| Six months* | One year | Five years | Inception2 | |||||
| Class IV | -0.89% | 6.06% | -2.60% | -1.98% |
| * | Not Annualized. |
| 1 | Not subject to any sales charges. |
| 2 | The Fund’s predecessor, the Market Street Equity 500 Index Portfolio, commenced operations on February 7, 2000. As of April 28, 2003, the GVIT Equity Index 500 Fund (which previously had not commenced operations) acquired all the assets, subject to stated liabilities, of the Market Street Equity Index 500 Portfolio. At that time the GVIT Equity Index 500 Fund took on the performance of the Market Street Equity Index 500 Portfolio |
| Performance | of a $10,000 Investment |
Investment return and principal value will fluctuate, and when redeemed, shares may be worth more or less than original cost. Past performance is no guarantee of future results and does not reflect the deduction of taxes that a shareholder would pay on fund distributions or the redemption of fund shares. Investing in mutual funds involves market risk, including loss of principal. Performance returns assume the reinvestment of all distributions.
Comparative performance of $10,000 invested in Class IV shares of the GVIT Equity 500 Index Fund, Standard & Poor’s 500 Index (S&P 500)(a), and Consumer Price Index (CPI)(b) since inception. Unlike, the Fund, the returns for these unmanaged indexes do not reflect any fees, expenses, or sales charges. Investors cannot invest directly in market indexes.
| (a) | S&P 500 is an unmanaged, market capitalization-weighted index of 500 widely held stocks of large-cap U.S. companies that gives a broad look at how the stock prices of those companies have performed. |
| (b) | The CPI represents changes in prices of a basket of goods and services purchased for consumption by urban households. |
2
Table of Contents
Shareholder
Expense Example | GVIT Equity 500 Index Fund |
As a shareholder of the Fund, you incur two types of costs: (1) transaction costs, including sales charges (loads) paid on purchase payments and redemption fees; and (2) ongoing costs, including investment advisory fees, administration fees, distribution fees and other Fund expenses. The examples below are intended to help you understand your ongoing costs (in dollars) of investing in the Fund and to compare these costs with the ongoing costs of investing in other mutual funds. Per SEC requirements, the examples assume that you had a $1,000 investment in the Class at the beginning of the reporting period, January 1, 2005, and continued to hold your shares at the end of the reporting period, June 30, 2005.
Actual Expenses
For each Class of the Fund in the table below, the first line provides information about actual account values and actual expenses. You may use the information in this line, together with the amount you invested, to estimate the expenses that you paid over the period. Simply divide your account value by $1,000 (for example, an $8,600 account value divided by $1,000 = 8.6), then multiply the result by the number in the first line of each Class under the heading entitled “Expenses Paid During Period” to estimate the expenses you paid on your account during the period.
Hypothetical Example for Comparison Purposes
The second line of each Class in the table below provides information about hypothetical account values and hypothetical expenses based on the Class’ actual expense ratio and an assumed rate of return of 5% per year before expenses, which is not the Class’ actual return. The hypothetical account values and expenses may not be used to estimate the actual ending account balance or expenses you paid for the period. You may use this information to compare the ongoing costs of investing in the Class of the Fund and other funds. To do so, compare this 5% hypothetical example with the 5% hypothetical examples that appear in the shareholder reports of the other funds.
Please note that the expenses shown in the table are meant to highlight your ongoing costs only and do not reflect any transaction costs, such as sales charges (loads) or redemption fees. Therefore, the second line for each Class in the table is useful in comparing ongoing costs only, and will not help you determine the relative total costs of owning different funds. In addition, if these transaction costs were included, your costs would have been higher. The examples also assume all dividends and distributions have been reinvested.
| Beginning Account Value, January 1, 2005 | Ending Account Value, June 30, 2005 | Expenses Paid During Period* | Annualized Expense Ratio* | ||||||||||
| Equity 500 Index | |||||||||||||
Class IV | Actual | $ | 1,000 | $ | 991 | $ | 1.38 | 0.28% | |||||
| Hypothetical1 | $ | 1,000 | $ | 1,024 | $ | 1.41 | 0.28% | ||||||
| * | Expenses are equal to the Fund’s annualized expense ratio multiplied by the average account value over the period multiplied by 181/365 (to reflect the one-half year period). The expense ratio presented represents a six month, annualized ratio in accordance with SEC guidelines. |
| 1 | Represents the hypothetical 5% return before expenses. |
3
Table of Contents
Portfolio Summary
(June 30, 2005) | GVIT Equity 500 Index Fund |
The SEC adopted a requirement that Funds present their portfolio holdings in a table, chart or graph format in their annual and semiannual reports to shareholders, whether or not a statement of investments is utilized. The following tables, which present portfolio holdings as a percentage of net assets, are provided in compliance with this requirement.
| Asset Allocation | ||
| Common Stocks | 98.7% | |
| Other Investments* | 5.0% | |
| Liabilities in excess of other assets** | -3.7% | |
| 100.0% | ||
| Top Holdings | ||
| General Electric Co. | 3.3% | |
| Exxon Mobil Corp. | 3.3% | |
| Microsoft Corp. | 2.3% | |
| Citigroup, Inc. | 2.2% | |
| Pfizer, Inc. | 1.8% | |
| Johnson & Johnson, Inc. | 1.7% | |
| Bank of America Corp. | 1.7% | |
| Wal-Mart Stores, Inc. | 1.5% | |
| Intel Corp. | 1.4% | |
| American International Group, Inc. | 1.4% | |
| Other Holdings | 79.4% | |
| 100.0% | ||
| Top Industries | ||
| Financial Services | 9.8% | |
| Computers | 9.8% | |
| Oil & Gas | 7.6% | |
| Healthcare | 6.4% | |
| Retail | 6.3% | |
| Banks | 5.1% | |
| Insurance | 4.8% | |
| Telecommunications | 4.6% | |
| Drugs | 4.4% | |
| Electrical Equipment | 3.7% | |
| Other Industries | 37.5% | |
| 100.0% | ||
| * | Includes value of collateral received from securities lending. |
| ** | Includes value of collateral owed from securities lending. |
4
Table of Contents
GARTMORE VARIABLE INSURANCE TRUST
GVIT EQUITY 500 INDEX FUND
Statement of Investments — June 30, 2005 (Unaudited)
Shares or Principal Amount | Value | ||||
| COMMON STOCKS (98.7%) | |||||
| Aerospace & Defense (1.9%) | |||||
| Boeing Co. (The) | 19,962 | $ | 1,317,491 | ||
| General Dynamics Corp. | 4,900 | 536,746 | |||
| Lockheed Martin Corp. | 9,800 | 635,726 | |||
| Northrop Grumman Corp. | 8,762 | 484,101 | |||
| Raytheon Co. | 10,900 | 426,408 | |||
| Rockwell Collins, Inc. | 4,414 | 210,460 | |||
| United Technologies Corp. | 24,700 | 1,268,345 | |||
| Xilinx, Inc. | 8,700 | 221,850 | |||
| 5,101,127 | |||||
| Agriculture (0.2%) | |||||
| Monsanto Co. | 6,495 | 408,341 | |||
| Airlines (0.1%) | |||||
| Delta Air Lines, Inc. (b) | 3,800 | 14,288 | |||
| Southwest Airlines Co. | 17,750 | 247,258 | |||
| 261,546 | |||||
| Apparel (0.3%) | |||||
| Jones Apparel Group, Inc. | 2,900 | 90,016 | |||
| Liz Claiborne, Inc. | 2,500 | 99,400 | |||
| Nike, Inc., Class B | 5,600 | 484,960 | |||
| Reebok International Ltd. | 1,300 | 54,379 | |||
| V.F. Corp. | 2,400 | 137,328 | |||
| 866,083 | |||||
| Auto Parts & Equipment (0.6%) | |||||
| AutoNation, Inc. (b) | 5,300 | 108,756 | |||
| AutoZone, Inc. (b) | 1,600 | 147,936 | |||
| Dana Corp. | 4,300 | 64,543 | |||
| Delphi Automotive Systems Corp. | 14,500 | 67,425 | |||
| Genuine Parts Co. | 4,400 | 180,796 | |||
| Ingersoll Rand Co. | 4,100 | 292,535 | |||
| Johnson Controls, Inc. | 4,600 | 259,118 | |||
| Navistar International Corp. (b) | 1,700 | 54,400 | |||
| PACCAR, Inc. | 4,225 | 287,300 | |||
| Snap-On, Inc. | 1,400 | 48,020 | |||
| Visteon Corp. | 3,723 | 22,450 | |||
| 1,533,279 | |||||
| Automobiles (0.5%) | |||||
| Ford Motor Co. | 44,132 | 451,912 | |||
| General Motors Corp. | 13,852 | 470,968 | |||
| Harley-Davidson, Inc. | 7,000 | 347,200 | |||
| 1,270,080 | |||||
Shares or Principal Amount | Value | ||||
| COMMON STOCKS (continued) | |||||
| Banks (5.1%) | |||||
| AmSouth Bancorp | 8,600 | $ | 223,600 | ||
| Bank of America Corp. | 97,040 | 4,425,994 | |||
| Bank of New York Co., Inc. | 18,928 | 544,748 | |||
| BB&T Corp. | 13,300 | 531,601 | |||
| Bear Stearns Cos., Inc. | 2,800 | 291,032 | |||
| Compass Bancshares, Inc. | 3,100 | 139,500 | |||
| Fifth Third Bancorp | 12,585 | 518,628 | |||
| Huntington Bancshares, Inc. | 5,410 | 130,597 | |||
| KeyCorp. | 9,700 | 321,555 | |||
| M & T Bank Corp. | 2,400 | 252,384 | |||
| Mellon Financial Corp. | 10,200 | 292,638 | |||
| National City Corp. | 14,400 | 491,328 | |||
| Northern Trust Corp. | 4,900 | 223,391 | |||
| PNC Bank Corp. | 6,800 | 370,328 | |||
| Regions Financial Corp. | 11,160 | 378,101 | |||
| Sovereign Bancorp | 8,800 | 196,592 | |||
| SunTrust Banks, Inc. | 8,300 | 599,592 | |||
| Synovus Financial Corp. | 7,500 | 215,025 | |||
| U.S. Bancorp | 44,168 | 1,289,706 | |||
| Wachovia Corp. | 38,054 | 1,887,478 | |||
| Zions Bancorp | 2,100 | 154,413 | |||
| 13,478,231 | |||||
| Beverages (2.2%) | |||||
| Anheuser-Busch Cos., Inc. | 18,743 | 857,492 | |||
| Brown-Forman Corp., Class B | 2,200 | 133,012 | |||
| Coca-Cola Co. | 54,612 | 2,280,051 | |||
| Coca-Cola Enterprises, Inc. | 8,800 | 193,688 | |||
| Constellation Brands, Inc. (b) | 400 | 11,800 | |||
| Molson Coors Brewing Co. | 1,900 | 117,800 | |||
| Pepsi Bottling Group, Inc. (The) | 4,900 | 140,189 | |||
| PepsiCo, Inc. | 40,430 | 2,180,390 | |||
| 5,914,422 | |||||
| Biotechnology (0.3%) | |||||
| Applera Corp. | 4,900 | 96,383 | |||
| Gilead Sciences, Inc. (b) | 10,500 | 461,895 | |||
| Group Chiron Corp. (b) | 3,500 | 122,115 | |||
| Waters Corp. (b) | 2,900 | 107,793 | |||
| 788,186 | |||||
| Business Services (2.8%) | |||||
| Apollo Group, Inc. (b) | 3,900 | 305,058 | |||
| AutoDesk, Inc. | 5,730 | 196,940 | |||
| Automatic Data Processing, Inc. | 14,108 | 592,113 | |||
5
Table of Contents
GARTMORE VARIABLE INSURANCE TRUST
GVIT EQUITY 500 INDEX FUND
Statement of Investments — June 30, 2005 (Unaudited) (continued)
Shares or Principal Amount | Value | ||||
| COMMON STOCKS (continued) | |||||
| Business Services (continued) | |||||
| Cintas Corp. | 3,600 | $ | 138,960 | ||
| Compuware Corp. (b) | 10,200 | 73,338 | |||
| Convergys Corp. (b) | 3,500 | 49,770 | |||
| Dow Jones & Co., Inc. | 1,600 | 56,720 | |||
| eBay, Inc. (b) | 29,300 | 967,193 | |||
| Electronic Data Systems Corp. | 12,700 | 244,475 | |||
| Equifax, Inc. | 3,100 | 110,701 | |||
| Exelon Corp. | 16,224 | 832,778 | |||
| First Data Corp. | 18,816 | 755,274 | |||
| Fiserv, Inc. (b) | 4,650 | 199,718 | |||
| IMS Health, Inc. | 6,053 | 149,933 | |||
| Interpublic Group Cos., Inc. (The) (b) | 9,800 | 119,364 | |||
| Monster Worldwide, Inc. (b) | 2,800 | 80,304 | |||
| Moody’s Corp. | 6,708 | 301,592 | |||
| Omnicom Group, Inc. | 4,400 | 351,384 | |||
| Paychex, Inc. | 8,650 | 281,471 | |||
| Pitney Bowes, Inc. | 5,600 | 243,880 | |||
| Robert Half International, Inc. | 3,700 | 92,389 | |||
| Sabre Holdings, Inc. | 3,368 | 67,192 | |||
| Sungard Data Systems (b) | 7,100 | 249,707 | |||
| Yahoo!, Inc. (b) | 31,700 | 1,098,404 | |||
| 7,558,658 | |||||
| Chemicals & Allied Products (1.6%) | |||||
| Air Products & Chemicals, Inc. | 5,500 | 331,650 | |||
| Dow Chemical Co. | 23,366 | 1,040,488 | |||
| E.I. du Pont de Nemours & Co. | 24,000 | 1,032,240 | |||
| Eastman Chemical Co. | 1,800 | 99,270 | |||
| Engelhard Corp. | 2,800 | 79,940 | |||
| Great Lakes Chemical Corp. | 1,100 | 34,617 | |||
| Hercules, Inc. (b) | 3,200 | 45,280 | |||
| Millipore Corp. (b) | 1,100 | 62,403 | |||
| Occidental Petroleum Corp. | 9,700 | 746,221 | |||
| Praxair, Inc. | 7,800 | 363,480 | |||
| Rohm & Haas Co. | 4,800 | 222,432 | |||
| Sigma-Aldrich Corp. | 1,800 | 100,872 | |||
| 4,158,893 | |||||
| Computers (9.8%) | |||||
| Adobe Systems, Inc. | 11,600 | 331,992 | |||
| Affiliated Computer Services, Class A (b) | 3,200 | 163,520 | |||
| American Power Conversion Corp. | 4,500 | 106,155 | |||
| Apple Computer, Inc. (b) | 19,900 | 732,519 | |||
| Avaya, Inc. (b) | 11,366 | 94,565 | |||
Shares or Principal Amount | Value | ||||
| COMMON STOCKS (continued) | |||||
| Computers (continued) | |||||
| BMC Software, Inc. (b) | 5,700 | $ | 102,315 | ||
| Cisco Systems, Inc. (b) | 154,157 | 2,945,940 | |||
| Citrix Systems, Inc. (b) | 3,900 | 84,474 | |||
| Computer Associates International, Inc. | 13,000 | 357,240 | |||
| Computer Sciences Corp. (b) | 4,400 | 192,280 | |||
| Dell, Inc. (b) | 58,400 | 2,307,384 | |||
| EMC Corp. (b) | 58,000 | 795,180 | |||
| Gateway, Inc. (b) | 5,700 | 18,810 | |||
| Hewlett Packard Co. | 69,600 | 1,636,296 | |||
| Intel Corp. | 148,873 | 3,879,630 | |||
| International Business Machines Corp. | 38,917 | 2,887,641 | |||
| Intuit, Inc. (b) | 4,400 | 198,484 | |||
| Lexmark International Group, Inc. (b) | 3,100 | 200,973 | |||
| Mercury Interactive Corp. (b) | 2,000 | 76,720 | |||
| Microsoft Corp. | 242,340 | 6,019,726 | |||
| NCR Corp. (b) | 4,400 | 154,528 | |||
| Network Appliance, Inc. (b) | 9,100 | 257,257 | |||
| Novell, Inc. (b) | 10,200 | 63,240 | |||
| NVIDIA Corp. (b) | 3,900 | 104,208 | |||
| Oracle Corp. (b) | 106,708 | 1,408,546 | |||
| Parametric Technology Corp. (b) | 7,100 | 45,298 | |||
| Siebel Systems, Inc. | 11,700 | 104,130 | |||
| Sun Microsystems, Inc. (b) | 83,256 | 310,545 | |||
| Symantec Corp. (b) | 17,300 | 376,102 | |||
| Symbol Technologies, Inc. | 5,600 | 55,272 | |||
| Unisys Corp. (b) | 8,400 | 53,172 | |||
| VERITAS Software Corp. (b) | 10,400 | 253,760 | |||
| 26,317,902 | |||||
| Conglomerates (0.8%) | |||||
| Illinois Tool Works, Inc. | 6,600 | 525,888 | |||
| ITT Industries, Inc. | 2,300 | 224,549 | |||
| Tyco International Ltd. | 48,756 | 1,423,675 | |||
| 2,174,112 | |||||
| Construction & Building Materials (1.0%) | |||||
| Caterpillar, Inc. | 8,300 | 791,073 | |||
| Centex Corp. | 3,200 | 226,144 | |||
| D. R. Horton, Inc. | 400 | 15,044 | |||
| Deere & Co. | 6,000 | 392,940 | |||
| Fluor Corp. | 2,000 | 115,180 | |||
| KB Home | 2,000 | 152,460 | |||
| Masco Corp. | 10,581 | 336,053 | |||
6
Table of Contents
GARTMORE VARIABLE INSURANCE TRUST
GVIT EQUITY 500 INDEX FUND
Statement of Investments — June 30, 2005 (Unaudited) (continued)
Shares or Principal Amount | Value | ||||
| COMMON STOCKS (continued) | |||||
| Construction & Building Materials (continued) | |||||
| Pulte Corp. | 2,800 | $ | 235,900 | ||
| Sherwin Williams Co. | 3,000 | 141,270 | |||
| Vulcan Materials Co. | 2,492 | 161,955 | |||
| 2,568,019 | |||||
| Consumer Products (3.0%) | |||||
| Alberto Culver Co., Class B | 1,950 | 84,494 | |||
| Avery-Dennison Corp. | 2,400 | 127,104 | |||
| Avon Products, Inc. | 11,400 | 431,490 | |||
| Black & Decker Corp. | 2,000 | 179,700 | |||
| Clorox Co. (The) | 3,799 | 211,680 | |||
| Colgate-Palmolive Co. | 12,761 | 636,902 | |||
| Danaher Corp. | 6,600 | 345,444 | |||
| Ecolab, Inc. | 5,300 | 171,508 | |||
| Fortune Brands, Inc. | 3,600 | 319,680 | |||
| Gillette Co. (The) | 24,100 | 1,220,183 | |||
| International Flavors & Fragrances, Inc. | 2,000 | 72,440 | |||
| Kimberly-Clark Corp. | 11,500 | 719,785 | |||
| Leggett & Platt, Inc. | 4,700 | 124,926 | |||
| Maytag Corp. | 2,100 | 32,886 | |||
| Pall Corp. | 2,800 | 85,008 | |||
| Procter & Gamble Co. | 59,742 | 3,151,390 | |||
| Whirlpool Corp. | 1,600 | 112,176 | |||
| 8,026,796 | |||||
| Containers (0.2%) | |||||
| Ball Corp. | 2,600 | 93,496 | |||
| Bemis Co. | 2,800 | 74,312 | |||
| Newell Rubbermaid, Inc. | 6,900 | 164,496 | |||
| Sealed Air Corp. (b) | 1,900 | 94,601 | |||
| 426,905 | |||||
| Drugs (4.4%) | |||||
| Amerisource Bergen Corp. | 2,454 | 169,694 | |||
| Biogen, Inc. (b) | 8,339 | 287,279 | |||
| Eli Lilly & Co. | 27,370 | 1,524,783 | |||
| Express Scripts, Inc., Class A (b) | 3,600 | 179,928 | |||
| Forest Laboratories, Inc., Class A (b) | 8,300 | 322,455 | |||
| Genzyme Corp. (b) | 6,000 | 360,540 | |||
| Medimmune, Inc. (b) | 6,109 | 163,232 | |||
| Merck & Co., Inc. | 53,164 | 1,637,451 | |||
| Mylan Laboratories, Inc. | 6,800 | 130,832 | |||
| Pfizer, Inc. | 179,361 | 4,946,776 | |||
| Schering Plough Corp. | 35,600 | 678,536 | |||
| Wyeth | 32,300 | 1,437,350 | |||
| 11,838,856 | |||||
Shares or Principal Amount | Value | ||||
| COMMON STOCKS (continued) | |||||
| Electrical Equipment (3.7%) | |||||
| Cooper Industries Ltd., Class A | 2,215 | $ | 141,539 | ||
| Eaton Corp. | 3,600 | 215,640 | |||
| Emerson Electric Co. | 10,100 | 632,563 | |||
| General Electric Co. | 255,848 | 8,865,133 | |||
| Grainger (W.W.), Inc. | 2,000 | 109,580 | |||
| 9,964,455 | |||||
| Electronics (0.9%) | |||||
| Agilent Technologies, Inc. (b) | 10,437 | 240,260 | |||
| Altera Corp. (b) | 9,200 | 182,344 | |||
| Broadcom Corp., Class A (b) | 7,000 | 248,570 | |||
| Molex, Inc. | 3,925 | 102,207 | |||
| Radioshack Corp. | 3,900 | 90,363 | |||
| Rockwell International Corp. | 4,200 | 204,582 | |||
| Sanmina Corp. (b) | 14,000 | 76,580 | |||
| Solectron Corp. (b) | 24,000 | 90,960 | |||
| Tektronix, Inc. | 2,100 | 48,867 | |||
| Teradyne, Inc. (b) | 4,800 | 57,456 | |||
| Texas Instruments, Inc. | 40,100 | 1,125,607 | |||
| 2,467,796 | |||||
| Entertainment (0.7%) | |||||
| Electronic Arts, Inc. (b) | 7,400 | 418,914 | |||
| International Game Technology | 8,300 | 233,645 | |||
| Walt Disney Co. (The) | 49,200 | 1,238,856 | |||
| 1,891,415 | |||||
| Financial Services (9.8%) | |||||
| AMBAC Financial Group, Inc. | 2,650 | 184,864 | |||
| American Express Co. | 28,300 | 1,506,409 | |||
| Capital One Financial Corp. | 6,000 | 480,060 | |||
| Charles Schwab Corp. | 27,450 | 309,636 | |||
| Cit Group, Inc. | 5,100 | 219,147 | |||
| Citigroup, Inc. | 125,454 | 5,799,739 | |||
| Comerica, Inc. | 4,000 | 231,200 | |||
| Countrywide Credit Industries, Inc. | 14,300 | 552,123 | |||
| E*TRADE Financial Corp. (b) | 8,900 | 124,511 | |||
| Federal Home Loan Mortgage Corp. | 16,700 | 1,089,341 | |||
| Federal National Mortgage Association | 23,386 | 1,365,742 | |||
| Federated Investors, Inc. | 2,100 | 63,021 | |||
| First Horizon National Corp. | 3,000 | 126,600 | |||
| Franklin Resources, Inc. | 4,800 | 369,504 | |||
| Golden West Financial Corp. | 6,800 | 437,784 | |||
7
Table of Contents
GARTMORE VARIABLE INSURANCE TRUST
GVIT EQUITY 500 INDEX FUND
Statement of Investments — June 30, 2005 (Unaudited) (continued)
Shares or Principal Amount | Value | ||||
| COMMON STOCKS (continued) | |||||
| Financial Services (continued) | |||||
| Goldman Sachs Group, Inc. | 10,700 | $ | 1,091,614 | ||
| H & R Block, Inc. | 4,100 | 239,235 | |||
| J.P. Morgan Chase & Co. | 84,901 | 2,998,703 | |||
| Janus Capital Group, Inc. | 5,500 | 82,720 | |||
| Lehman Brothers Holdings, Inc. | 6,667 | 661,900 | |||
| Marshall & Ilsley Corp. | 5,000 | 222,250 | |||
| MBNA Corp. | 30,550 | 799,188 | |||
| Merrill Lynch & Co. | 22,800 | 1,254,228 | |||
| Morgan Stanley Dean Witter & Co. | 26,400 | 1,385,208 | |||
| North Fork Bancorp, Inc. | 11,400 | 320,226 | |||
| Providian Financial Corp. (b) | 7,400 | 130,462 | |||
| SLM Corp. | 10,100 | 513,080 | |||
| State Street Corp. | 8,100 | 390,825 | |||
| T. Rowe Price Group, Inc. | 3,000 | 187,800 | |||
| Washington Mutual, Inc. | 21,315 | 867,307 | |||
| Wells Fargo Co. | 40,659 | 2,503,781 | |||
| 26,508,208 | |||||
| Food & Related (2.6%) | |||||
| Altria Group, Inc. | 50,000 | 3,233,001 | |||
| Archer-Daniels Midland Co. | 15,237 | 325,767 | |||
| Campbell Soup Co. | 7,800 | 240,006 | |||
| ConAgra, Inc. | 12,600 | 291,816 | |||
| General Mills, Inc. | 8,800 | 411,752 | |||
| H.J. Heinz Co. | 8,500 | 301,070 | |||
| Hershey Foods Corp. | 5,300 | 329,130 | |||
| Kellogg Co. | 8,400 | 373,296 | |||
| McCormick & Co. | 3,200 | 104,576 | |||
| Sara Lee Corp. | 19,029 | 376,964 | |||
| SYSCO Corp. | 15,300 | 553,707 | |||
| Wrigley (Wm.) Jr. Co. | 4,700 | 323,548 | |||
| 6,864,633 | |||||
| Healthcare (6.4%) | |||||
| Abbott Laboratories | 37,367 | 1,831,357 | |||
| Allergan, Inc. | 3,100 | 264,244 | |||
| Bausch & Lomb, Inc. | 1,300 | 107,900 | |||
| Baxter International, Inc. | 15,000 | 556,500 | |||
| Becton Dickinson & Co. | 6,100 | 320,067 | |||
| Bristol-Myers Squibb Co. | 47,162 | 1,178,107 | |||
| Cardinal Health, Inc. | 10,353 | 596,126 | |||
| Guidant Corp. | 7,800 | 524,940 | |||
| HCA, Inc. | 10,000 | 566,700 | |||
| Health Management Associates, Inc., Class A | 6,100 | 159,698 | |||
| Humana, Inc. (b) | 4,100 | 162,934 | |||
Shares or Principal Amount | Value | ||||
| COMMON STOCKS (continued) | |||||
| Healthcare (continued) | |||||
| Johnson & Johnson, Inc. | 71,711 | $ | 4,661,214 | ||
| King Pharmaceuticals, Inc. (b) | 6,133 | 63,906 | |||
| McKesson HBOC, Inc. | 7,200 | 322,488 | |||
| Medco Health Solutions, Inc. (b) | 6,648 | 354,737 | |||
| Medtronic, Inc. | 29,200 | 1,512,268 | |||
| Quest Diagnostics, Inc. | 4,400 | 234,388 | |||
| St. Jude Medical, Inc. (b) | 8,800 | 383,768 | |||
| Stryker Corp. | 9,000 | 428,040 | |||
| Tenet Healthcare Corp. (b) | 11,700 | 143,208 | |||
| Unitedhealth Group, Inc. | 30,544 | 1,592,564 | |||
| Watson Pharmaceutical, Inc. (b) | 2,800 | 82,768 | |||
| Wellpoint Health Networks, Inc. (b) | 14,800 | 1,030,672 | |||
| 17,078,594 | |||||
| Hotels & Motels (0.7%) | |||||
| Cendant Corp. | 25,400 | 568,198 | |||
| Harrah’s Entertainment, Inc. | 4,300 | 309,901 | |||
| Hilton Hotels Corp. | 9,200 | 219,420 | |||
| Marriott International, Inc., Class A | 4,800 | 327,456 | |||
| Starwood Hotels & Resorts Worldwide, Inc. | 5,300 | 310,421 | |||
| 1,735,396 | |||||
| Industrial (0.1%) | |||||
| Parker Hannifin Corp. | 3,000 | 186,030 | |||
| Thermo Electron Corp. (b) | 3,900 | 104,793 | |||
| 290,823 | |||||
| Insurance (4.8%) | |||||
| ACE Ltd. | 7,012 | 314,488 | |||
| Aetna, Inc. | 7,100 | 588,022 | |||
| AFLAC, Inc. | 12,100 | 523,688 | |||
| Allstate Corp. (The) | 16,100 | 961,975 | |||
| American International Group, Inc. | 62,568 | 3,635,200 | |||
| AON Corp. | 7,600 | 190,304 | |||
| Chubb Corp. (The) | 4,600 | 393,806 | |||
| CIGNA Corp. | 3,200 | 342,496 | |||
| Cincinnati Financial Corp. | 4,221 | 166,983 | |||
| Hartford Financial Services Group, Inc. | 7,200 | 538,416 | |||
| Jefferson-Pilot Corp. | 3,381 | 170,470 | |||
| Lincoln National Corp. | 4,300 | 201,756 | |||
| Loews Corp. | 3,867 | 299,693 | |||
| Marsh & McLennan Cos., Inc. | 13,000 | 360,100 | |||
| MBIA, Inc. | 3,250 | 192,758 | |||
8
Table of Contents
GARTMORE VARIABLE INSURANCE TRUST
GVIT EQUITY 500 INDEX FUND
Statement of Investments — June 30, 2005 (Unaudited) (continued)
Shares or Principal Amount | Value | ||||
| COMMON STOCKS (continued) | |||||
| Insurance (continued) | |||||
| MetLife, Inc. | 17,700 | $ | 795,438 | ||
| MGIC Investment Corp. | 2,400 | 156,528 | |||
| Principal Financial Group, Inc. | 7,100 | 297,490 | |||
| Progressive Corp. (The) | 4,800 | 474,288 | |||
| Prudential Financial, Inc. | 12,600 | 827,316 | |||
| SAFECO Corp. | 3,100 | 168,454 | |||
| St. Paul Travelers Cos., Inc. (The) | 16,265 | 642,955 | |||
| Torchmark Corp. | 2,500 | 130,500 | |||
| UnumProvident Corp. | 7,400 | 135,568 | |||
| XL Capital Ltd., Class A | 3,400 | 253,028 | |||
| 12,761,720 | |||||
| Leisure Products (0.4%) | |||||
| Brunswick Corp. | 2,300 | 99,636 | |||
| Carnival Corp. | 12,800 | 698,240 | |||
| Hasbro, Inc. | 4,400 | 91,476 | |||
| Mattel, Inc. | 10,200 | 186,660 | |||
| 1,076,012 | |||||
| Manufacturing (1.2%) | |||||
| 3M Co. | 18,538 | 1,340,297 | |||
| American Standard Cos., Inc. | 4,500 | 188,640 | |||
| Cummins Engine, Inc. | 1,100 | 82,071 | |||
| Dover Corp. | 5,000 | 181,900 | |||
| Honeywell International, Inc. | 20,800 | 761,904 | |||
| PPG Industries, Inc. | 4,100 | 257,316 | |||
| Stanley Works (The) | 1,800 | 81,972 | |||
| Textron, Inc. | 3,300 | 250,305 | |||
| 3,144,405 | |||||
| Medical Equipment & Supplies (0.7%) | |||||
| Bard (C.R.), Inc. | 2,500 | 166,275 | |||
| Biomet, Inc. | 6,051 | 209,607 | |||
| Boston Scientific Corp. (b) | 18,100 | 488,700 | |||
| Fisher Scientific International, Inc. (b) | 2,900 | 188,210 | |||
| Laboratory Corp. of America Holdings (b) | 3,200 | 159,680 | |||
| PerkinElmer, Inc. | 3,500 | 66,150 | |||
| Zimmer Holdings, Inc. (b) | 6,026 | 459,000 | |||
| 1,737,622 | |||||
| Medical Services (0.9%) | |||||
| Amgen, Inc. (b) | 29,832 | 1,803,643 | |||
| Caremark Rx, Inc. (b) | 11,041 | 491,545 | |||
| Hospira, Inc. (b) | 3,636 | 141,804 | |||
| Manor Care, Inc. | 2,200 | 87,406 | |||
| 2,524,398 | |||||
Shares or Principal Amount | Value | ||||
| COMMON STOCKS (continued) | |||||
| Metals & Mining (0.5%) | |||||
| Alcoa, Inc. | 21,040 | $ | 549,775 | ||
| Freeport-McMoran Copper & Gold, Inc., Class B | 4,400 | 164,736 | |||
| Newmont Mining Corp. | 10,758 | 419,885 | |||
| Phelps Dodge Corp. | 2,400 | 222,000 | |||
| 1,356,396 | |||||
| Multimedia (2.5%) | |||||
| Clear Channel Communications, Inc. | 12,500 | 386,625 | |||
| Comcast Corp., Class A (b) | 53,248 | 1,634,714 | |||
| L-3 Communications Holdings, Inc. | 2,900 | 222,082 | |||
| News Corp. | 69,600 | 1,126,128 | |||
| Time Warner, Inc. (b) | 113,021 | 1,888,580 | |||
| Viacom, Inc., Class B | 40,728 | 1,304,111 | |||
| 6,562,240 | |||||
| Office Equipment & Supplies (0.1%) | |||||
| Xerox Corp. (b) | 23,100 | 318,549 | |||
| Oil & Gas (7.6%) | |||||
| Amerada Hess Corp. | 2,100 | 223,671 | |||
| Anadarko Petroleum Corp. | 5,649 | 464,065 | |||
| Apache Corp. | 7,998 | 516,671 | |||
| Ashland, Inc. | 1,700 | 122,179 | |||
| Baker Hughes, Inc. | 8,200 | 419,512 | |||
| BJ Services Co. | 4,000 | 209,920 | |||
| ChevronTexaco Corp. | 50,580 | 2,828,434 | |||
| ConocoPhillips | 33,632 | 1,933,504 | |||
| Devon Energy Corp. | 11,400 | 577,752 | |||
| El Paso Corp. | 15,577 | 179,447 | |||
| EOG Resources, Inc. | 5,800 | 329,440 | |||
| Exxon Mobil Corp. | 153,554 | 8,824,748 | |||
| KeySpan Corp. | 3,800 | 154,660 | |||
| Kinder Morgan, Inc. | 2,700 | 224,640 | |||
| Marathon Oil Corp. | 8,400 | 448,308 | |||
| Nabors Industries Ltd. (b) | 3,400 | 206,108 | |||
| NICOR, Inc. | 900 | 37,053 | |||
| Noble Corp. | 3,300 | 202,983 | |||
| People’s Energy Corp. | 1,100 | 47,806 | |||
| Sempra Energy | 5,807 | 239,887 | |||
| Sunoco, Inc. | 1,700 | 193,256 | |||
| Transocean Sedco Forex, Inc. (b) | 8,000 | 431,760 | |||
| Unocal Corp. | 6,600 | 429,330 | |||
| Valero Energy Corp. | 6,200 | 490,482 | |||
9
Table of Contents
GARTMORE VARIABLE INSURANCE TRUST
GVIT EQUITY 500 INDEX FUND
Statement of Investments — June 30, 2005 (Unaudited) (continued)
Shares or Principal Amount | Value | ||||
| COMMON STOCKS (continued) | |||||
| Oil & Gas (continued) | |||||
| Williams Cos., Inc. (The) | 14,200 | $ | 269,800 | ||
| XTO Energy, Inc. | 8,666 | 294,557 | |||
| 20,299,973 | |||||
| Oil Equipment & Services (1.0%) | |||||
| Burlington Resources, Inc. | 9,400 | 519,256 | |||
| Dynergy, Inc., Class A (b) | 6,300 | 30,618 | |||
| Halliburton Co. | 12,200 | 583,404 | |||
| Kerr-Mcgee Corp. | 2,866 | 218,704 | |||
| National-OilWell, Inc. (b) | 4,100 | 194,914 | |||
| Rowan Cos., Inc. | 2,400 | 71,304 | |||
| Schlumberger Ltd. | 14,190 | 1,077,589 | |||
| 2,695,789 | |||||
| Paper & Forest Products (0.5%) | |||||
| Georgia Pacific Corp. | 6,390 | 203,202 | |||
| International Paper Co. | 12,021 | 363,154 | |||
| Louisiana-Pacific Corp. | 2,500 | 61,450 | |||
| MeadWestvaco Corp. | 3,907 | 109,552 | |||
| Pactiv Corp. (b) | 3,500 | 75,530 | |||
| Temple-Inland, Inc. | 2,800 | 104,020 | |||
| Weyerhaeuser Co. | 6,000 | 381,901 | |||
| 1,298,809 | |||||
| Photographic Equipment (0.1%) | |||||
| Eastman Kodak Co. | 7,100 | 190,635 | |||
| Printing & Publishing (0.6%) | |||||
| Donnelley (R.R.) & Sons Co. | 5,200 | 179,452 | |||
| Gannett Co., Inc. | 6,000 | 426,780 | |||
| Knight-Ridder, Inc. | 1,800 | 110,412 | |||
| McGraw-Hill Cos., Inc. (The) | 9,200 | 407,100 | |||
| Meredith Corp. | 1,200 | 58,872 | |||
| New York Times Co., Class A | 3,500 | 109,025 | |||
| Tribune Co. | 7,264 | 255,548 | |||
| 1,547,189 | |||||
| Railroads (0.5%) | |||||
| Burlington Northern Santa Fe Corp. | 9,100 | 428,428 | |||
| CSX Corp. | 5,300 | 226,098 | |||
| Norfolk Southern Corp. | 9,900 | 306,504 | |||
| Union Pacific Corp. | 6,400 | 414,720 | |||
| 1,375,750 | |||||
| Real Estate Investment Trusts (0.6%) | |||||
| Apartment Investment & Management Co. | 2,200 | 90,024 | |||
| Archstone-Smith Trust | 4,900 | 189,238 | |||
Shares or Principal Amount | Value | ||||
| COMMON STOCKS (continued) | |||||
| Real Estate Investment Trusts (continued) | |||||
| Equity Office Properties Trust | 9,800 | $ | 324,380 | ||
| Equity Residential Property Trust | 7,000 | 257,740 | |||
| Plum Creek Timber Co., Inc. | 4,424 | 160,591 | |||
| ProLogis Trust | 4,500 | 181,080 | |||
| Simon Property Group, Inc. | 5,300 | 384,197 | |||
| 1,587,250 | |||||
| Restaurants (0.6%) | |||||
| Darden Restaurants, Inc. | 3,750 | 123,675 | |||
| McDonald’s Corp. | 30,600 | 849,150 | |||
| Wendy’s International, Inc. | 2,700 | 128,655 | |||
| YUM! Brands, Inc. | 7,100 | 369,768 | |||
| 1,471,248 | |||||
| Retail (6.3%) | |||||
| Albertson’s, Inc. | 8,859 | 183,204 | |||
| Bed Bath & Beyond, Inc. (b) | 7,100 | 296,638 | |||
| Best Buy Co., Inc. | 7,250 | 496,988 | |||
| Big Lots, Inc. (b) | 3,200 | 42,368 | |||
| Circuit City Stores, Inc. | 4,700 | 81,263 | |||
| Coach, Inc. (b) | 9,200 | 308,844 | |||
| Costco Wholesale Corp. | 11,400 | 510,948 | |||
| CVS Corp. | 19,708 | 572,912 | |||
| Dillards, Inc. | 1,500 | 35,130 | |||
| Dollar General Corp. | 7,175 | 146,083 | |||
| Family Dollar Stores, Inc. | 4,000 | 104,400 | |||
| Federated Department Stores, Inc. | 4,100 | 300,448 | |||
| Gap, Inc. (The) | 18,400 | 363,400 | |||
| Home Depot, Inc. | 51,782 | 2,014,319 | |||
| J.C. Penney Co., Inc. | 6,500 | 341,770 | |||
| Kmart Holding Corp. (b) | 2,373 | 355,642 | |||
| Kohl’s Corp. (b) | 8,000 | 447,280 | |||
| Kroger Co. (b) | 17,600 | 334,928 | |||
| Limited, Inc. (The) | 9,166 | 196,336 | |||
| Lowe’s Cos., Inc. | 18,586 | 1,082,077 | |||
| May Department Stores Co. (The) | 7,100 | 285,136 | |||
| Nordstrom, Inc. | 3,000 | 203,910 | |||
| Office Depot, Inc. (b) | 7,800 | 178,152 | |||
| Officemax, Inc. | 2,100 | 62,517 | |||
| Safeway, Inc. | 11,000 | 248,490 | |||
| Staples, Inc. | 18,150 | 386,958 | |||
| Starbucks Corp. (b) | 9,500 | 490,770 | |||
| Supervalu, Inc. | 3,400 | 110,874 | |||
| Target Corp. | 21,316 | 1,159,803 | |||
| Tiffany & Co. | 3,400 | 111,384 | |||
| TJX Cos., Inc. | 11,600 | 282,460 | |||
10
Table of Contents
GARTMORE VARIABLE INSURANCE TRUST
GVIT EQUITY 500 INDEX FUND
Statement of Investments — June 30, 2005 (Unaudited) (continued)
Shares or Principal Amount | Value | ||||
| COMMON STOCKS (continued) | |||||
| Retail (continued) | |||||
| Toys “R” Us, Inc. (b) | 5,000 | $ | 132,400 | ||
| Wal-Mart Stores, Inc. | 80,688 | 3,889,161 | |||
| Walgreen Co. | 24,700 | 1,135,953 | |||
| 16,892,946 | |||||
| Semiconductors (1.1%) | |||||
| Advanced Micro Devices, Inc. (b) | 9,800 | 169,932 | |||
| Analog Devices, Inc. | 9,000 | 335,790 | |||
| Applied Materials, Inc. | 39,700 | 642,346 | |||
| Applied Micro Circuits Corp. (b) | 9,200 | 23,552 | |||
| Freescale Semiconductor, Inc. (b) | 10,046 | 212,774 | |||
| Jabil Circuit, Inc. (b) | 4,300 | 132,139 | |||
| KLA-Tencor Corp. | 4,800 | 209,760 | |||
| Linear Technology Corp. | 7,500 | 275,175 | |||
| LSI Logic Corp. (b) | 9,700 | 82,353 | |||
| Maxim Integrated Products, Inc. | 8,000 | 305,680 | |||
| Micron Technology, Inc. (b) | 14,600 | 149,066 | |||
| National Semiconductor Corp. | 8,700 | 191,661 | |||
| Novellus Systems (b) | 3,400 | 84,014 | |||
| PMC-Sierra, Inc. (b) | 4,600 | 42,918 | |||
| QLogic Corp. (b) | 2,100 | 64,827 | |||
| 2,921,987 | |||||
| Steel (0.1%) | |||||
| Allegheny Technologies, Inc. | 2,100 | 46,326 | |||
| Nucor Corp. | 4,000 | 182,480 | |||
| United States Steel Corp. | 2,900 | 99,673 | |||
| 328,479 | |||||
| Telecommunications (4.6%) | |||||
| ADC Telecomm, Inc. (b) | 3,057 | 66,551 | |||
| ALLTEL Corp. | 8,000 | 498,240 | |||
| Andrew Corp. (b) | 3,700 | 47,212 | |||
| AT&T Corp. | 19,362 | 368,652 | |||
| BellSouth Corp. | 44,200 | 1,174,394 | |||
| CenturyTel, Inc. | 3,400 | 117,742 | |||
| CIENA Corp. (b) | 16,939 | 35,403 | |||
| Citizens Communications Co. | 7,800 | 104,832 | |||
| Comverse Technology, Inc. (b) | 4,600 | 108,790 | |||
| Corning, Inc. (b) | 34,100 | 566,742 | |||
| JDS Uniphase Corp. (b) | 35,000 | 53,200 | |||
| Lucent Technologies, Inc. (b) | 108,300 | 315,153 | |||
| Motorola, Inc. | 59,200 | 1,080,992 | |||
| Nextel Communications, Inc., Class A (b) | 27,100 | 875,601 | |||
| QUALCOMM, Inc. | 39,400 | 1,300,594 | |||
Shares or Principal Amount | Value | ||||
| COMMON STOCKS (continued) | |||||
| Telecommunications (continued) | |||||
| Qwest Communications International, Inc. (b) | 39,123 | $ | 145,146 | ||
| SBC Communications, Inc. | 79,658 | 1,891,878 | |||
| Scientific-Atlanta, Inc. | 3,900 | 129,753 | |||
| Sprint Corp. | 35,650 | 894,459 | |||
| Tellabs, Inc. (b) | 11,000 | 95,700 | |||
| Univision Communications, Inc. (b) | 7,000 | 192,850 | |||
| Verizon Communications, Inc. | 66,702 | 2,304,553 | |||
| 12,368,437 | |||||
| Tire & Rubber (0.1%) | |||||
| B.F. Goodrich Co. (The) | 2,800 | 114,688 | |||
| Cooper Tire & Rubber Co. | 1,800 | 33,426 | |||
| Goodyear Tire & Rubber Co. (b) | 4,200 | 62,580 | |||
| 210,694 | |||||
| Tobacco (0.2%) | |||||
| R.J. Reynolds Tobacco, Inc. | 2,900 | 228,520 | |||
| UST, Inc. | 4,000 | 182,640 | |||
| 411,160 | |||||
| Trucking (0.9%) | |||||
| FedEx Corp. | 7,300 | 591,373 | |||
| Ryder System, Inc. | 1,500 | 54,900 | |||
| United Parcel Service, Inc., Class B | 26,900 | 1,860,404 | |||
| 2,506,677 | |||||
| Utilities (2.9%) | |||||
| AES Corp. (b) | 15,800 | 258,804 | |||
| Allegheny Energy, Inc. (b) | 3,100 | 78,182 | |||
| Ameren Corp. | 4,800 | 265,440 | |||
| American Electric Power Co., Inc. | 9,260 | 341,416 | |||
| Calpine Corp. (b) | 10,600 | 36,040 | |||
| Centerpoint Energy, Inc. | 7,600 | 100,396 | |||
| Cinergy Corp. | 4,600 | 206,172 | |||
| CMS Energy Corp. (b) | 4,900 | 73,794 | |||
| Consolidated Edison, Inc. | 5,900 | 276,356 | |||
| Constellation Energy Group, Inc. | 4,400 | 253,836 | |||
| Detroit Edison Co. | 4,300 | 201,111 | |||
| Dominion Resources, Inc. | 8,300 | 609,137 | |||
| Duke Energy Corp. | 22,400 | 665,952 | |||
| Edison International | 7,800 | 316,290 | |||
| Entergy Corp. | 5,200 | 392,860 | |||
| FirstEnergy Corp. | 7,986 | 384,206 | |||
| FPL Group, Inc. | 9,500 | 399,570 | |||
| Nisource, Inc. | 6,664 | 164,801 | |||
11
Table of Contents
GARTMORE VARIABLE INSURANCE TRUST
GVIT EQUITY 500 INDEX FUND
Statement of Investments — June 30, 2005 (Unaudited) (continued)
Shares or Principal Amount | Value | ||||
| COMMON STOCKS (continued) | |||||
| Utilities (continued) | |||||
| PG & E Corp. | 8,800 | $ | 330,352 | ||
| Pinnacle West Capital Corp. | 2,400 | 106,680 | |||
| PPL Corp. | 4,700 | 279,086 | |||
| Progress Energy, Inc. | 5,926 | 268,092 | |||
| Public Service Enterprise Group, Inc. | 5,800 | 352,756 | |||
| Southern Co. | 18,000 | 624,060 | |||
| TECO Energy, Inc. | 5,100 | 96,441 | |||
| TXU Corp. | 5,800 | 481,922 | |||
| Xcel Energy, Inc. | 9,780 | 190,906 | |||
| 7,754,658 | |||||
| Waste Management (0.2%) | |||||
| Allied Waste Industries, Inc. (b) | 5,800 | 45,994 | |||
| Waste Management, Inc. | 13,700 | 388,258 | |||
| 434,252 | |||||
| Total Common Stocks | 263,270,031 | ||||
Shares or Principal Amount | Value | ||||||
| SHORT-TERM SECURITIES HELD AS COLLATERAL FOR SECURITIES LENDING (5.0%) | |||||||
| Pool of short-term securities for Gartmore Variable Insurance Trust Funds — note 2 (Securities Lending) | $ | 13,395,658 | $ | 13,395,658 | |||
| Total Short-term Securities Held as Collateral for Securities Lending | 13,395,658 | ||||||
| Total Investments (Cost $295,783,639) (a) — 103.7% | 276,665,689 | ||||||
| Liabilities in excess of other assets — (3.7)% | (9,974,155 | ) | |||||
| NET ASSETS — 100.0% | $ | 266,691,534 | |||||
| (a) | See notes to financial statements for tax unrealized appreciation (depreciation) of securities. |
| (b) | Denotes a non-income producing security. |
At June 30, 2005 the Fund’s open futures contracts were as follows:
| Number of Contracts | Long Contracts * | Expiration | Market Value Covered by Contracts | Unrealized Appreciation/ (Depreciation) | |||||||
3 | S&P 500 Futures | 09/15/05 | $ | 896,625 | $ | (7,962 | ) | ||||
44 | S&P 500 Emini Futures | 09/16/05 | $ | 2,630,100 | $ | (23,232 | ) | ||||
| * | Cash pledged as collateral. |
See notes to financial statements.
12
Table of Contents
GARTMORE VARIABLE INSURANCE TRUST
GVIT EQUITY 500 INDEX FUND
Statement of Assets and Liabilities
June 30, 2005 (Unaudited)
Assets: | ||||
Investments, at value (cost $295,906,789) | $ | 276,665,689 | ||
Cash | 123,150 | |||
Interest and dividends receivable | 325,390 | |||
Receivable for investments sold | 3,466,050 | |||
Receivable from adviser | 40,451 | |||
Prepaid expenses and other assets | 3,637 | |||
Total Assets | 280,624,367 | |||
Liabilities: | ||||
Payable to custodian | 388,926 | |||
Payable for investments purchased | 26,976 | |||
Payable for variation margin on futures contracts | 28,782 | |||
Payable for return of collateral received for securities on loan | 13,395,658 | |||
Accrued expenses and other payables: | ||||
Investment advisory fees | 53,296 | |||
Fund administration and transfer agent fees | 9,015 | |||
Administrative servicing fees | 19,530 | |||
Other | 10,650 | |||
Total Liabilities | 13,932,833 | |||
Net Assets | $ | 266,691,534 | ||
Represented by: | ||||
Capital | $ | 343,295,619 | ||
Accumulated net investment income (loss) | 73,461 | |||
Accumulated net realized gain (losses) from investment and futures transactions | (57,528,403 | ) | ||
Net unrealized appreciation (depreciation) on investments and futures | (19,149,143 | ) | ||
Net Assets | $ | 266,691,534 | ||
Net Assets: | ||||
Class IV Shares | $ | 266,691,534 | ||
Shares outstanding (unlimited number of shares authorized): | ||||
Class IV Shares | 32,094,367 | |||
Net asset value and offering price per share:* | ||||
Class IV Shares | $ | 8.31 |
| * | Not subject to a front-end sales charge. |
For the Six Months Ended June 30, 2005 (Unaudited)
Investment Income: | ||||
Interest income | $ | 19,365 | ||
Dividend income | 2,460,418 | |||
Income from securities lending | 15,337 | |||
Total Income | 2,495,120 | |||
Expenses: | ||||
Investment advisory fees | 325,234 | |||
Fund administration and transfer agent fees | 91,703 | |||
Administrative servicing fees Class IV Shares | 132,396 | |||
Other** | 57,108 | |||
Total expenses before waived or reimbursed expenses | 606,441 | |||
Expenses waived or reimbursed | (223,357 | ) | ||
Total Expenses | 383,084 | |||
Net Investment Income (Loss) | 2,112,036 | |||
REALIZED/UNREALIZED GAINS (LOSSES) ON INVESTMENTS: | ||||
Net realized gains (losses) on investment transactions | (3,518,360 | ) | ||
Net realized gains (losses) on futures | (8,932 | ) | ||
Net realized gains (losses) on investment and futures transactions | (3,527,292 | ) | ||
Net change in unrealized appreciation/depreciation on investments and futures | (1,361,460 | ) | ||
Net realized/unrealized gains (losses) on investments and futures | (4,888,752 | ) | ||
CHANGE IN NET ASSETS RESULTING FROM OPERATIONS | $ | (2,776,716 | ) | |
| ** | Other expenses may include the following fees: audit, custody, insurance, legal, printing, trustee, and out-of-pocket expenses. |
See notes to financial statements.
13
Table of Contents
GARTMORE VARIABLE INSURANCE TRUST
GVIT EQUITY 500 INDEX FUND
Statement of Changes in Net Assets
| Six Months Ended June 30, 2005 | Year Ended December 31, 2004 | |||||||
| (Unaudited) | ||||||||
From Investment Activities: | ||||||||
Operations: | ||||||||
Net investment income (loss) | $ | 2,112,036 | $ | 4,810,067 | ||||
Net realized gains (losses) on investment and futures transactions | (3,527,292 | ) | (3,981,096 | ) | ||||
Net change in unrealized appreciation/depreciation on investments and futures | (1,361,460 | ) | 27,230,476 | |||||
Change in net assets resulting from operations | (2,776,716 | ) | 28,059,447 | |||||
Distributions to Class IV shareholders from: | ||||||||
Net investment income | (2,071,131 | ) | (7,507,988 | ) | ||||
Change in net assets from shareholder distributions | (2,071,131 | ) | (7,507,988 | ) | ||||
Change in net assets from capital transactions | (15,394,053 | ) | (14,733,002 | ) | ||||
Change in net assets | (20,241,900 | ) | 5,818,457 | |||||
Net Assets: | ||||||||
Beginning of period | 286,933,434 | 281,114,977 | ||||||
End of period | $ | 266,691,534 | $ | 286,933,434 | ||||
CAPITAL TRANSACTIONS: | ||||||||
Proceeds from shares issued | $ | 4,945,612 | $ | 12,161,407 | ||||
Dividends reinvested | 2,071,135 | 7,507,987 | ||||||
Cost of shares redeemed | (22,410,800 | ) | (34,402,396 | ) | ||||
| $ | (15,394,053 | ) | $ | (14,733,002 | ) | |||
SHARE TRANSACTIONS: | ||||||||
Issued | 598,718 | 1,536,379 | ||||||
Reinvested | 251,185 | 939,606 | ||||||
Redeemed | (2,701,917 | ) | (4,333,496 | ) | ||||
| (1,852,014 | ) | (1,857,511 | ) | |||||
See notes to financial statements.
14
Table of Contents
GARTMORE VARIABLE INSURANCE TRUST
FINANCIAL HIGHLIGHTS
Selected Data for Each Share of Capital Outstanding
GVIT Equity 500 Index Fund
| Investment Activities | Distributions | Ratios/Supplemental Data: | |||||||||||||||||||||||||||||||||||||||||
| Net Asset Value, Beginning of Period | Net Investment Income (Loss) | Net Realized and Unrealized Gains (Losses) on Investments | Total from Investment Activities | Net Investment Income | Net Realized Gains | Total Distributions | Net Asset Value, End of Period | Total Return | Net Assets at End of Period (000s) | Ratio of Expenses to Average Net Assets | Ratio of Net Investment Income (Loss) to Average Net Assets | Ratio of Expenses (Prior to Reimbursements) to Average Net Assets(a) | Ratio of Net Investment Income(Loss) (Prior to Reimbursements) to Average Net Assets(a) | Portfolio Turnover | |||||||||||||||||||||||||||||
Class IV Shares | |||||||||||||||||||||||||||||||||||||||||||
Period Ended December 31, 2000(b) | $ | 10.00 | 0.09 | (0.73 | ) | (0.64 | ) | — | — | — | $ | 9.36 | (6.40% | )(d) | $ | 366,338 | 0.28% | (e) | 0.99% | (e) | 0.40% | (e) | 0.87% | (e) | 5.00% | ||||||||||||||||||
Year Ended December 31, 2001 | $ | 9.36 | 0.09 | (1.22 | ) | (1.13 | ) | (0.09 | ) | (0.02 | ) | (0.11 | ) | $ | 8.12 | (12.24% | ) | $ | 324,915 | 0.28% | 1.06% | 0.53% | 0.81% | 6.00% | |||||||||||||||||||
Year Ended December 31, 2002 | $ | 8.12 | 0.10 | (1.89 | ) | (1.79 | ) | (0.09 | ) | — | (0.09 | ) | $ | 6.24 | (22.31% | ) | $ | 235,961 | 0.28% | 1.32% | 0.50% | 1.10% | 19.00% | ||||||||||||||||||||
Year Ended December 31, 2003(c) | $ | 6.24 | 0.11 | 1.63 | 1.74 | (0.13 | ) | — | (0.13 | ) | $ | 7.85 | 28.33% | $ | 281,115 | 0.28% | 1.51% | 0.47% | 1.32% | 2.41% | |||||||||||||||||||||||
Year Ended December 31, 2004 | $ | 7.85 | 0.14 | 0.68 | 0.82 | (0.22 | ) | — | (0.22 | ) | $ | 8.45 | 10.59% | $ | 286,933 | 0.28% | 1.74% | 0.43% | 1.59% | 3.10% | |||||||||||||||||||||||
Six Months Ended June 30, 2005 (Unaudited) | $ | 8.45 | 0.06 | (0.14 | ) | (0.08 | ) | (0.06 | ) | — | (0.06 | ) | $ | 8.31 | (0.89% | )(d) | $ | 266,692 | 0.28% | (e) | 1.56% | (e) | 0.45% | (e) | 1.39% | (e) | 1.52% | ||||||||||||||||
| (a) | During the period certain fees were waived and/or reimbursed. If such waivers/reimbursements had not occurred, the ratios would have been as indicated. |
| (b) | For the period from February 7, 2000 (commencement of operations) through December 31, 2000. |
| (c) | The GVIT Equity 500 Index Fund retained the history of Market Street Equity 500 Index Fund and the existing shares of the fund were designated Class IV Shares. |
| (d) | Not annualized. |
| (e) | Annualized. |
See notes to financial statements.
15
Table of Contents
GARTMORE VARIABLE INSURANCE TRUST
NOTES TO FINANCIAL STATEMENTS (Unaudited)
June 30, 2005
1. Organization
Gartmore Variable Insurance Trust (“GVIT” or the “Trust”) is an open-end management investment company, organized under the laws of Delaware by an amended and restated Agreement and Declaration of Trust, dated October 28, 2004, as amended to date. The Trust, originally created under the laws of Massachusetts as a Massachusetts business trust pursuant to a Declaration of Trust dated, as of June 30, 1981, was subsequently amended, redomesticated as a Delaware Statutory Trust after the close of trading on April 29, 2005, and is registered under the Investment Company Act of 1940, as amended (the “1940 Act”). The redomestication is a change in statutory status and does not affect the operations of the Trust. As of June 30, 2005, the Trust had authorized an unlimited number of shares of beneficial interest (“shares”) without par value. The Trust currently offers shares to life insurance company separate accounts to fund the benefits under variable life insurance or annuity policies. To date, only the separate accounts of Nationwide Life Insurance Company and Nationwide Life and Annuity Insurance Company (collectively, “Nationwide”) have purchased shares of the Trust’s series. The Trust operates thirty-one (31) separate series, or mutual funds, each with its own investment objectives and strategies. This report contains the financial statements and financial highlights of the GVIT Equity 500 Index Fund (the “Fund”).
Under the Trust’s organizational documents, the Trust’s officers and trustees are indemnified against certain liabilities arising out of the performance of their duties to the Trust. In addition, the Trust has entered into Indemnification Agreements with the Trust’s trustees and certain officers covering similar liabilities. In addition, in the normal course of business, the Trust enters into contracts with its vendors and others that provide for general indemnifications. The Trust’s maximum exposure under these arrangements is unknown, as this would involve future claims that may be made against the Trust. Based on experience, however, the Trust expects that risk of loss to be remote.
2. Summary of Significant Accounting Policies
The following is a summary of significant accounting policies followed by the Fund in the preparation of its financial statements. The policies are in conformity with accounting principles generally accepted in the United States of America (“GAAP”). The preparation of financial statements requires management to make estimates and assumptions that affect the reported amounts of assets and liabilities, the disclosure of contingent assets and liabilities at the date of the financial statements and the reported amounts of income and expenses for the period. Actual results could differ from those estimates.
| (a) | Security Valuation |
Securities for which market quotations are readily available are valued at current market value as of “Valuation Time.” Valuation Time is as of the close of regular trading on the New York Stock Exchange (usually 4 p.m. Eastern time). Equity securities are valued at the last quoted sale price or, if there is no sale price, the last quoted bid price provided by an independent pricing service approved by the Trust’s Board of Trustees. Securities traded on NASDAQ are valued at the NASDAQ official closing price. Prices are taken from the primary market or exchange in which each security trades. Most securities listed on a foreign exchange are valued either at fair value (see description below) or at the last sale price at the close of the exchange on which the security is principally traded. Foreign securities, currencies, and other assets and liabilities denominated in foreign currencies are translated into U.S. dollars at the exchange rate of said currencies against the U.S. Dollar, as of Valuation Time, as provided by an independent pricing service approved by the Board of Trustees.
Securities for which market quotations are not readily available, or for which an independent pricing service does not provide a value or provides a value that does not represent fair value in the judgment of the Fund’s investment adviser or designee, are valued at fair value under procedures approved by the Trust’s Board of Trustees. The “Fair Value” of these securities is determined in good faith by taking into account relevant factors and surrounding circumstances. Methods utilized to obtain a “Fair Value” may include the following non-exclusive list of SEC-acceptable methods: (i) a multiple of earnings; (ii) the discount from market value of a similar, freely traded security; (iii) the yield-to-maturity for debt issues; or (iv) a consolidation of the methods. The Gartmore Fair Value Committee considers a non-exclusive list of factors to arrive at the appropriate method upon determining “Fair Value.” For example, fair value determinations are required for securities whose value is affected by a “significant” event that materially affects the value of a domestic or foreign security which occurs subsequent to the time of the close of the principal market on which such domestic or foreign security trades and before the
16
Table of Contents
GARTMORE VARIABLE INSURANCE TRUST
NOTES TO FINANCIAL STATEMENTS (Unaudited) (Continued)
June 30, 2005
Valuation Time (i.e., a “subsequent event”). Typically, this will involve events occurring after the close of a foreign market on which a security trades and before the next Valuation Time.
| (b) | Repurchase Agreements |
The Fund may enter into repurchase agreements with an entity which is a member of the Federal Reserve System or which is a “primary dealer” (as designated by the Federal Reserve Bank of New York) in U.S. Government obligations. The repurchase price generally equals the price paid by the Fund plus interest negotiated on the basis of current short-term rates, which may be more or less than the rate on the underlying portfolio securities. The seller under a repurchase agreement is required to maintain the value of the collateral held pursuant to the agreement at a market value equal to or greater than the repurchase price (including accrued interest). Collateral subject to repurchase agreements is held by the Fund’s custodian or another qualified sub-custodian or in the Federal Reserve/Treasury book-entry system. If the counterparty defaults and the fair value of the collateral declines, realization of the collateral by the Fund may be delayed or limited. The Fund may transfer uninvested cash balances into a pooled cash account. These balances are invested in one or more repurchase agreements, which are fully collateralized by AA-rated Corporate Bonds with the counterparties of CS First Boston and Nomura Securities.
| (c) | Foreign Currency Transactions |
The accounting records of the Fund are maintained in U.S. dollars. Foreign currency amounts are translated into U.S. dollars at the current rate of exchange to determine the value of investments, assets and liabilities. The Fund may enter into foreign currency contracts in connection with purchases or sales of securities denominated in a foreign currency. Purchases and sales of securities, and income and expenses, are translated at the prevailing rate of exchange on the respective date of these transactions. The Fund does not isolate that portion of the results of operations resulting from changes in foreign exchange rates on investments from fluctuations arising from changes in market prices of securities held. These fluctuations are included with the net realized and unrealized gain or loss from investments and foreign currencies.
| (d) | Risks Associated with Foreign Securities and Currencies |
Investments in securities of foreign issuers carry certain risks not ordinarily associated with investments in securities of U.S. issuers. These risks include future political and economic developments, and the possible imposition of exchange controls or other foreign governmental laws and restrictions. In addition, with respect to certain countries, there is the possibility of expropriation of assets, confiscatory taxation, political or social instability, or diplomatic developments, which could adversely affect investments in those countries.
Certain countries also may impose substantial restrictions on investments in their capital markets by foreign entities, including restrictions on investments in issuers of industries deemed sensitive to relevant national interests. These factors may limit the investment opportunities available and result in a lack of liquidity and high price volatility with respect to securities of issuers from developing countries.
| (e) | Forward Foreign Currency Contracts |
The Fund may enter into forward foreign currency contracts in connection with planned purchases or sales of securities or to hedge the U.S. dollar value of portfolio securities denominated in a particular currency. The Fund could be exposed to risks if the counterparties to the contracts are unable to meet the terms of their contracts and from unanticipated movements in the value of a foreign currency relative to the U.S. dollar. Forward foreign currency contracts are valued at the current cost of covering these contracts, as provided by an independent pricing service approved by the Board of Trustees. The forward foreign currency contracts are adjusted by the daily exchange rate of the underlying currency and any gains or losses are recorded for financial statement purposes as unrealized gains or losses until the contract settlement date.
| (f) | Futures Contracts |
The Fund may invest in financial futures contracts (“futures contracts”) for the purpose of hedging its existing portfolio securities or securities that the Fund intends to purchase against fluctuations in value caused by changes in prevailing market interest rates or prices. Futures contracts may also be entered into for non-hedging purposes.
17
Table of Contents
GARTMORE VARIABLE INSURANCE TRUST
NOTES TO FINANCIAL STATEMENTS (Unaudited) (Continued)
June 30, 2005
Upon entering into a futures contract, the Fund is required to pledge to the broker an amount of cash and/or other assets equal to a certain percentage of the contract amount (initial margin deposit). Subsequent payments, known as “variation margin,” are made each day, depending on the daily fluctuations in the fair value/market value of the underlying assets. A gain or loss equal to the daily variation margin is recognized on a daily basis. Futures contracts are valued daily at their last quoted sale price.
A “sale” of a futures contract means a contractual obligation to deliver the securities or foreign currency called for by the contract at a fixed price at a specified time in the future. A “purchase” of a futures contract means a contractual obligation to acquire the securities or foreign currency at a fixed price at a specified time in the future.
Should market conditions change unexpectedly, the Fund may not achieve the anticipated benefits of the futures contracts and may realize a loss. The use of futures transactions for hedging purposes involves the risk of imperfect correlation in movements in the price of futures contracts, interest rates, and the value of the underlying hedged assets.
| (g) | Written Options Contracts |
The Fund may write options contracts. A written option obligates the Fund to deliver (written call) or to receive (written put) a specified quantity of an underlying asset at the contract amount upon exercise by the holder of the option. The value of the option contract is recorded as a liability and unrealized gain or loss is measured by the difference between the current value and the premium received. Options traded on an exchange are valued at the last quoted sale price, or in the absence of a sale, the bid price provided by an independent pricing service approved by the Board of Trustees. Non-exchange traded options are valued using dealer supplied quotes.
| (h) | Short Sales |
The Fund is authorized to engage in short-selling of portfolio securities which obligates the Fund to replace any security that the Fund has borrowed by purchasing the security at current market value sometime in the future. The Fund will incur a loss if the price of the security increases between the date of the short sale and the date on which the Fund replaces the borrowed security. The Fund generally will realize a gain if the price of the security declines between these dates. Until the Fund replaces the borrowed security, the Fund will maintain a segregated account with cash, U.S. Government securities and/or securities held long to sufficiently cover the Fund’s short position on a daily basis. Dividends declared on securities sold short are recorded as an expense on the ex-dividend date and paid to the counterparty on the dividend pay date. The collateral for securities sold short are recorded as an expense on the ex-dividend date and paid to the counterparty on the dividend pay date. The collateral for securities sold short includes the deposits with brokers and securities held long as shown in the Statement of Investments for the Fund.
| (i) | Security Transactions and Investment Income |
Security transactions are accounted for on the date the security is purchased or sold (“trade date”). Securities gains and losses are calculated on the identified cost basis. Interest income is recognized on the accrual basis and includes, where applicable, the amortization or accretion of premium or discount. Dividend income is recorded on the ex-dividend date.
| (j) | Securities Lending |
To generate additional income, the Fund may lend up to 33 1/3% of the Fund’s total assets pursuant to agreements, requiring that the borrower deliver cash or securities as collateral with respect to each new loan of U.S. securities, equal to at least 102% of the value of the portfolio securities loaned, and with respect to each new loan of non-U.S. securities, collateral of at least 105% of the value of the portfolio securities loaned, and thereafter requiring the borrower to mark to market the collateral on a daily basis and requiring the borrower to make up any shortfall of collateral. The Fund receives payments from borrowers equivalent to the dividends and interest that would have been earned on securities lent while simultaneously seeking to earn income on the investment of cash collateral. Collateral is marked to market daily to provide a level of collateral at least equal to the market value of securities loaned. There may be risks of delay in recovery of the securities should the borrower of the securities fail financially. Loans will be made, however, only to borrowers deemed by the Fund’s
18
Table of Contents
GARTMORE VARIABLE INSURANCE TRUST
NOTES TO FINANCIAL STATEMENTS (Unaudited) (Continued)
June 30, 2005
investment adviser to be of good standing and creditworthy under guidelines established by the Board of Trustees and when, in the judgment of the adviser, the consideration which can be earned currently from these securities loans justifies the attendant risks. Loans are subject to termination by the Fund or the borrower at any time, and, therefore, are not considered to be illiquid investments. JPMorgan Chase Bank serves as custodian for the securities lending program of the Fund. JPMorgan Chase Bank receives a custody fee based on the value of collateral received from borrowers.
The cash collateral received by the Fund was pooled and, at June 30, 2005, was invested in the following:
Security Type | Security Name | Market Value | Maturity Rate | Maturity Date | |||||
| Commercial Paper | MacQuarie Bank Ltd. | $ | 998,736 | 3.25% | 07/01/05 | ||||
| Funding Agreement | GE Life and Annutiy | 400,000 | 3.32% | 07/14/05 | |||||
| Medium Term Note — Floating | General Electric Capital Corp. | 2,000,342 | 3.37% | 09/08/05 | |||||
| Medium Term Note — Floating | Northern Rock PLC | 3,000,000 | 3.41% | 09/09/05 | |||||
| Repurchase Agreements | Nomura Securities | 6,996,581 | 3.48% | 07/01/05 | |||||
| As | of June 30, 2005, the Fund had securities with the following market values on loan: |
| Market Value of Loaned Securities | Market Value of Collateral | |||||
| $ | 13,084,297 | $ | 13,395,658 | |||
| (k) | Distributions to Shareholders |
The Fund’s dividends from net investment income, if any, are declared and paid quarterly. The Fund’s distributable net realized capital gains, if any, are declared and distributed at least annually.
Dividends and distributions to shareholders are determined in accordance with federal income tax regulations, which may differ from GAAP. These “book/tax” differences are considered either permanent or temporary in nature. In accordance with the American Institute of Certified Public Accountants (“AICPA”) Statement of Position 93-2, permanent differences (i.e., reclassification of market discounts, gain/loss, paydowns, and distributions) are reclassified within the capital accounts based on their nature for federal income tax purposes; temporary differences do not require reclassification. These reclassifications have no effect upon the net asset value of the Fund. To the extent distributions exceed current and accumulated earnings and profits for federal income tax purposes, these distributions are reported as distributions of paid-in-capital.
| (l) | Federal Income Taxes |
It is the policy of the Fund to qualify or continue to qualify as a “regulated investment company” by complying with the provisions available to certain investment companies, as defined in applicable sections of the U.S. Internal Revenue Code, and to make distributions of net investment income and net realized capital gains sufficient to relieve the Fund from all, or substantially all, federal income taxes.
As of June 30, 2005, the tax cost of securities and the breakdown of unrealized appreciation (depreciation) for the Fund is as follows:
Tax Cost of | Unrealized Appreciation | Unrealized Depreciation | Net Unrealized Appreciation (Depreciation) | ||||||||
$22,375,109 | $ | 30,750,209 | $ | (72,243,268 | ) | $ | (41,493,059 | ) | |||
| (m) | Allocation of Expenses, Income, and Gains and Losses |
Expenses directly attributable to the Fund are charged to the Fund. Expenses not directly attributable to the Fund are allocated proportionately among various or all funds within the Trust. The method used by the Fund for allocating income, fund level expenses, and realized and unrealized gains or losses is based on the fair value of shares outstanding relative to net
19
Table of Contents
GARTMORE VARIABLE INSURANCE TRUST
NOTES TO FINANCIAL STATEMENTS (Unaudited) (Continued)
June 30, 2005
assets. Under this method, each class of shares participates based on the total net asset value of that class’s shares in proportion to the total net assets of the Fund. Expenses specific to a class (such as rule 12b-1 and administrative services fees) are charged to that class.
3. Transactions with Affiliates
Under the terms of the Trust’s Investment Advisory Agreement, Gartmore Mutual Fund Capital Trust (“GMF”) manages the investment of the assets and supervises the daily business affairs of the Fund. GMF is a wholly-owned subsidiary of Gartmore Global Investments, Inc. (“GGI”), a holding company. GGI is a majority-owned subsidiary of Gartmore Global Asset Management Trust (“GGAMT”). GGAMT is a wholly-owned subsidiary of Nationwide Corporation. All of the common stock of Nationwide Corporation is held by Nationwide Mutual Insurance Company (95.2%) and Nationwide Mutual Fire Insurance Company (4.8%), each of which is a mutual company owned by its policyholders. In addition, GMF provides investment management evaluation services in initially selecting and monitoring, on an ongoing basis, the performance of the subadviser, for the Fund that GMF advises. SsgA Funds Management, Inc. (the “subadviser”), manages all of the Fund’s investments and has the responsibility for making all investment decisions for the Fund.
Under the terms of the Investment Advisory Agreement, the Fund pays GMF an investment advisory fee based on that Fund’s average daily net assets. From such fees, pursuant to the subadvisory agreement, GMF pays fees to the subadviser. Additional information regarding investment advisory fees and subadvisory fees for GMF and the subadviser is as follows for the six months ended June 30, 2005:
| Fee Schedule | Total Fees | Fees Retained | Paid to Sub-adviser | |||
Up to $200 million | 0.24% | 0.21% | 0.03% | |||
Next $500 million | 0.23% | 0.21% | 0.02% | |||
$700 million or more | 0.22% | 0.20% | 0.02% |
Effective May 1, 2005, GMF and the Fund have entered into a written contract (“Expense Limitation Agreement”) that limits operating expenses from exceeding 0.28% for Class IV shares until at least May 1, 2006.
GMF may request and receive reimbursement from the Fund of the advisory fees waived and other expenses reimbursed by GMF, respectively, pursuant to the Expense Limitation Agreement at a later date not to exceed three years from the fiscal year in which the corresponding reimbursement to the Fund was made, depending on the Fund (as described below), if the Fund has reached a sufficient asset size to permit reimbursement to be made without causing the total annual operating expense ratio of the Fund to exceed the limits set forth above. No reimbursement will be made unless: (i) the Fund’s assets exceed $100 million; (ii) the total annual expense ratio of the Class making such reimbursement is less than the limit set forth above; and (iii) the payment of such reimbursement is approved by the Board of Trustees on a quarterly basis. Except as provided for in the Expense Limitation Agreements, reimbursement of amounts previously waived or assumed by GMF is not permitted.
As of the six months ended June 30, 2005, the cumulative potential reimbursements for the Class IV shares of the Fund, based on reimbursements which expires within three years from the fiscal year in which the corresponding reimbursement to the Fund was made for expenses reimbursed by GMF would be:
Amount | Amount Fiscal Year 2004 | Amount Six Months Ended June 30, 2005 | ||||
$486,617 | $ | 414,515 | $ | 223,357 | ||
Under the terms of a Fund Administration and Transfer Agency Agreement, Gartmore SA Capital Trust (“GSA”) provides the Fund with various administrative and accounting services, and Gartmore Investors Services, Inc. (“GISI”), an indirect subsidiary of GSA, serves as Transfer and Dividend Disbursing Agent for the Fund. The fees for the services provided under
20
Table of Contents
GARTMORE VARIABLE INSURANCE TRUST
NOTES TO FINANCIAL STATEMENTS (Unaudited) (Continued)
June 30, 2005
this Agreement are calculated based on the Trust’s average daily net assets according to the fee schedule below. The fees are then allocated proportionately among all funds within the Trust in relation to the average daily net assets of each fund and are paid to GSA. GSA pays GISI from these fees for its services.
| Combined Fee Schedule* | ||
Up to $1 billion | 0.13% | |
$1 billion and more up to $3 billion | 0.08% | |
$3 billion and more up to $8 billion | 0.05% | |
$8 billion and more up to $10 billion | 0.04% | |
$10 billion and more up to $12 billion | 0.02% | |
$12 billion or more | 0.01% | |
| * | The assets of the Gartmore GVIT Investor Destinations Aggressive Fund, the Gartmore GVIT Investor Destinations Moderately Aggressive Fund, the Gartmore GVIT Investor Destinations Moderate Fund, the Gartmore GVIT Investor Destinations Moderately Conservative Fund, and the Gartmore GVIT Investor Destinations Conservative Fund (collectively, the “Investor Destinations Funds”) are excluded from the Trust asset level amount in order to calculate this asset-based fee. The Investor Destinations Funds do not pay any part of this fee. |
Effective January 1, 2005, the fee for the fund administration and transfer agency services increased as set forth below. The fees are calculated based on the Trust’s average daily net assets according to the fee schedule below. The fees are then allocated proportionately among all funds within the Trust in relation to the average daily net assets of each fund and are paid to GSA.
| Combined Fee Schedule* | ||
Up to $1 billion | 0.15% | |
$1 billion and more up to $3 billion | 0.10% | |
$3 billion and more up to $8 billion | 0.05% | |
$8 billion and more up to $10 billion | 0.04% | |
$10 billion and more up to $12 billion | 0.02% | |
$12 billion or more | 0.01% | |
| * | The assets of each of the Investor Destinations Funds are excluded from the Trust asset level amount in order to calculate this asset-based fee. The Investor Destinations Funds do not pay any part of this fee. |
GSA and GISI have entered into agreements with BISYS Fund Services Ohio, Inc. (“BISYS”), pursuant to which BISYS provides sub-administration and sub-transfer agency services, respectively, to the Fund.
Under the terms of a Distribution Plan under Rule 12b-1 of the 1940 Act, Gartmore Distribution Services, Inc. (“GDSI”), the Fund’s Distributor, is compensated by the Fund for expenses associated with the distribution of the Class II of the Fund. These fees are based on average daily net assets of Class II shares of the Fund at an annual rate not to exceed 0.25%.
Under the terms of an Administrative Services Plan, the Fund may pay fees to servicing organizations, such as broker-dealers, including Nationwide Financial Services, and financial institutions, which agree to provide administrative support services to the shareholders of certain classes. These services include, but are not limited, to the following: establishing and maintaining shareholder accounts; processing purchase and redemption transactions; arranging bank wires; performing shareholder sub-accounting; answering inquires regarding the Fund; and other such services. These fees are based on an annual rate of up to 0.25% of the average daily net assets of Class I and Class II shares of the Fund and 0.20% of Class IV shares of the Fund.
4. Investment Transactions
For the six months ended June 30, 2005, (excluding short-term securities) the Fund had purchases of $4,124,548 and sales of $21,018,718.
21
Table of Contents
GARTMORE VARIABLE INSURANCE TRUST
NOTES TO FINANCIAL STATEMENTS (Unaudited) (Continued)
June 30, 2005
5. Bank Loans
The Trust has a credit agreement of $100,000,000. Borrowings under this arrangement bear interest at the Federal Funds rate plus 0.50%. The interest costs are included in custodian fees in the Statement of Operations. No compensation balances were required under the terms of the line of credit. There were no borrowings outstanding as of June 30, 2005.
6. Shareholder Meeting
A separate shareholders meeting was held on Tuesday, December 23, 2004, for the shareholders of the Trust’s predecessor pursuant to a Proxy Statement On Schedule 14A, dated October 29, 2004, and mailed to the shareholders of the Trust’s predecessor on or around November 5, 2004.
Two Proposals: The purpose of the December 23, 2004 meeting was to allow the shareholders of the Trust’s predecessor to vote on:
| i. | Proposal One: The election of the Trust’s Board of Trustees; and |
| ii. | Proposal Two: The approval of an “Agreement and Plan of Reorganization” that provided for the reorganization of the Trust from a Massachusetts business trust into a Delaware statutory trust. |
Proposal One: As set forth in the October 29, 2004 Proxy Statement, the nominees for election as Trustees of the Trust’s predecessor were: Charles E. Allen, Michael J. Baresich, Paula H.J. Cholmondeley, C. Brent DeVore, Phyllis Kay Dryden, Robert M. Duncan, Barbara L. Hennigar, Paul J. Hondros, Barbara I Jacobs, Thomas J. Kerr IV, Douglas F. Kridler, Michael D. McCarthy, Arden L. Shisler, and David C. Wetmore.
Proposal Two: As specifically set forth in the October 29, 2004 Proxy Statement, the Reorganization proposal requested the shareholders of the Trust’s predecessor to approve the proposed “Agreement and Plan of Reorganization” of the Trust’s predecessor (on behalf of each of the its funds) into a new Delaware-domiciled Trust, whereby the Funds of the new Delaware Trust would acquire all of the assets of the corresponding funds of the Trust’s predecessor subject to the liabilities, expenses, costs, charges, and reserves of the corresponding funds of the Trust’s predecessor (contingent or otherwise), in exchange for shares of the acquiring Funds to be distributed pro rata by the Trust to the holders of the shares of the funds of the Trust’s predecessor, in a complete liquidation of the Trust’s predecessor.
| Voting | Results: |
The shareholders of the Trust’s predecessor voted to approve both Proposal One and Proposal Two, as follows:
Proposal 1: Election of a Board of Trustees of Gartmore Variable Insurance Trust
Charles E. Allen: | ||
FOR | 2,797,230,318.955 shares (96.078%) | |
WITHHOLD | 114,195,693.660 shares (3.922%) | |
TOTAL | 2,912,726,012.615 shares (100.000%) | |
Michael J. Baresich: | ||
FOR | 2,796,135,979.559 shares (96.040%) | |
WITHHOLD | 115,290,033.056 shares (3.960%) | |
TOTAL | 2,912,726,012.615 shares (100.000%) | |
Paula H.J. Cholmondeley: | ||
FOR | 2,795,095,945.396 shares (96.004%) | |
WITHHOLD | 116,330,067.219 shares (3.996%) | |
TOTAL | 2,912,726,012.615 shares (100.000%) | |
22
Table of Contents
GARTMORE VARIABLE INSURANCE TRUST
NOTES TO FINANCIAL STATEMENTS (Unaudited) (Continued)
June 30, 2005
C. Brent DeVore: | ||
FOR | 2,797,207,046.916 shares (96.077%) | |
WITHHOLD | 114,218,965.699 shares (3.923%) | |
TOTAL | 2,912,726,012.615 shares (100.000%) | |
Phyllis Kay Dryden: | ||
FOR | 2,795,587,023.994 shares (96.021%) | |
WITHHOLD | 115,838,988.621 shares (3.979%) | |
TOTAL | 2,912,726,012.615 shares (100.000%) | |
Robert M. Duncan: | ||
FOR | 2,790,191,720.503 shares (95.836%) | |
WITHHOLD | 121,234,292.112 shares (4.164%) | |
TOTAL | 2,912,726,012.615 shares (100.000%) | |
Barbara L. Hennigar: | ||
FOR | 2,792,939,848.858 shares (95.937%) | |
WITHHOLD | 118,486,163.757 shares (4.070%) | |
TOTAL | 2,912,726,012.615 shares (100.000%) | |
Paul J. Hondros: | ||
FOR | 2,797,557,404.448 shares (96.089%) | |
WITHHOLD | 113,868,608.167 shares (3.911%) | |
TOTAL | 2,912,726,012.615 shares (100.000%) | |
Barbara I. Jacobs: | ||
FOR | 2,796,306,126.654 shares (96.046%) | |
WITHHOLD | 115,119,885.961 shares (3.954%) | |
TOTAL | 2,912,726,012.615 shares (100.000%) | |
Thomas J. Kerr IV: | ||
FOR | 2,789,755,720.087 shares (95.821%) | |
WITHHOLD | 121,670,292.528 shares (4.179%) | |
TOTAL | 2,912,726,012.615 shares (100.000%) | |
Douglas F. Kridler: | ||
FOR | 2,798,065,774.375 shares (96.106%) | |
WITHHOLD | 113,360,238.240 shares (3.894%) | |
TOTAL | 2,912,726,012.615 shares (100.000%) | |
Michael D. McCarthy: | ||
FOR | 2,797,452,613.694 shares (96.085%) | |
WITHHOLD | 113,973,395.921 shares (3.915%) | |
TOTAL | 2,912,726,012.615 shares (100.000%) | |
23
Table of Contents
GARTMORE VARIABLE INSURANCE TRUST
NOTES TO FINANCIAL STATEMENTS (Unaudited) (Continued)
June 30, 2005
Arden L. Shisler: | ||
FOR | 2,796,738,454.730 shares (96.061%) | |
WITHHOLD | 114,687,557.885 shares (3.939%) | |
TOTAL | 2,912,726,012.615 shares (100.000%) | |
David C. Wetmore: | ||
FOR | 2,794,784,752.247 shares (95.994%) | |
WITHHOLD | 116,641,260.368 shares (4.006%) | |
TOTAL | 2,912,726,012.615 shares (100.000%) | |
Proposal 2: Approval of the Agreement and Plan of Reorganization of Gartmore Variable Insurance Trust
FOR | 2,561,003,822.546 shares (87.964%) | |
AGAINST | 103,593,261.010 shares (3.558%) | |
ABSTAIN | 246,828,929.059 shares (8.478%) | |
TOTAL | 2,912,726,012.615 shares (100.000%) | |
24
Table of Contents
GARTMORE VARIABLE INSURANCE TRUST
Management Information (Unaudited)
June 30, 2005
Trustees who are not Interested Persons (as defined in the 1940 Act) and Officers of the Funds June 30, 2005
| Name, Address and Date of Birth | Position(s) Held with the Trust and Length of Time Served1 | Principal Occupation(s) During Past 5 Years | Number of Portfolios in the Gartmore Fund Complex Overseen by Trustee | Other Directorships Held by Trustee or Nominee2 | ||||
Charles E. Allen
c/o Gartmore Global Investments, Inc. 1200 River Road, Suite 1000 Conshohocken, PA 19428
1948 | Trustee since July 2000 | Mr. Allen is Chairman, Chief Executive Officer and President of the Graimark Realty Advisors, Inc. (real estate development, investment and asset management). | 84 | None | ||||
Paula H.J. Cholmondeley
c/o Gartmore Global Investments, Inc. 1200 River Road, Suite 1000 Conshohocken, PA 19428
1940 | Trustee since July 2000 | Ms. Cholmondeley has been the Chairman and Chief Executive Officer of the Sorrel Group, a management consulting company, since January 2004. From March 2000 through December 2003, Ms. Cholmondeley was Vice President and General Manager of Sappi Fine Paper North America. Prior thereto, Ms. Cholmondeley was Vice President and General Manager of Residential Insulation of Owens Corning. | 84 | Director of Dentsply International, Inc., Ultralife Batteries, Inc., Terex Corporation, Minerals Technology, Inc. and Albany International Corp. | ||||
C. Brent DeVore
c/o Gartmore Global Investments, Inc. 1200 River Road, Suite 1000 Conshohocken, PA 19428
1940 | Trustee since 1990 | Dr. DeVore is President of Otterbein College. | 84 | None | ||||
Phyllis K. Dryden
c/o Gartmore Global Investments, Inc. 1200 River Road, Suite 1000 Conshohocken, PA 19428
1947 | Trustee since December 2004 | Ms. Dryden was a former Managing Partner of marchFIRST, a global management consulting firm prior to 2002. | 84 | None |
25
Table of Contents
GARTMORE VARIABLE INSURANCE TRUST
Management Information (Unaudited)
June 30, 2005
| Name, Address and Date of Birth | Position(s) Held with the Trust and Length of Time Served1 | Principal Occupation(s) During Past 5 Years | Number of Portfolios in the Gartmore Fund Complex Overseen by Trustee | Other Directorships Held by Trustee or Nominee2 | ||||
Barbara L. Hennigar*
c/o Gartmore Global Investments, Inc. 1200 River Road, Suite 1000 Conshohocken, PA 19428
1935 | Trustee since July 2000 | Retired since June 2000. Prior thereto, Ms. Hennigar was the Chairman or President and Chief Executive Officer of OppenheimerFunds Services and a member of the Executive Committee of OppenheimerFunds. | 84 | None | ||||
Barbara I. Jacobs
c/o Gartmore Global Investments, Inc. 1200 River Road, Suite 1000 Conshohocken, PA 19428
1950 | Trustee since December 2004 | Ms. Jacobs has served as Chairman of the Board of Directors of KICAP Network Fund, a European (United Kingdom) hedge fund, since December 2000. Prior to 2004, Ms. Jacobs was also a Managing Director and European Portfolio Manager with CREF Investments (Teachers Insurance Annuity Association — College Retirement Equity Fund). | 84 | None | ||||
Douglas F. Kridler
c/o Gartmore Global Investments, Inc. 1200 River Road, Suite 1000 Conshohocken, PA 19428
1955 | Trustee since September 1997 | Mr. Kridler has served as the President and Chief Executive Officer of the Columbus Foundation (a Columbus, OH-based foundation which manages over 1,300 individual endowment funds) since February 2002. Mr. Kridler was the President of the Columbus Association for the Performing Arts prior thereto and Chairman of the Greater Columbus Convention and Visitors Bureau during 2000 and 2001. | 84 | None | ||||
Michael D. McCarthy
c/o Gartmore Global Investments, Inc. 1200 River Road, Suite 1000 Conshohocken, PA 19428
1947 | Trustee since December 2004 | Mr. McCarthy serves as: the Founder and Chairman of The Eureka Foundation (which sponsors and funds the “Great Museums” series on PBS); and a Partner of Pineville Properties LLC (a commercial real estate development firm). | 843 | None |
26
Table of Contents
GARTMORE VARIABLE INSURANCE TRUST
Management Information (Unaudited)
June 30, 2005
| Name, Address and Date of Birth | Position(s) Held with the Trust and Length of Time Served1 | Principal Occupation(s) During Past 5 Years | Number of Portfolios in the Gartmore Fund Complex Overseen by Trustee | Other Directorships Held by Trustee or Nominee2 | ||||
David C. Wetmore
c/o Gartmore Global Investments, Inc. 1200 River Road, Suite 1000 Conshohocken, PA 19428
1948 | Trustee since 1995 and Chairman since February 2005 | Retired. Mr. Wetmore was formerly a Managing Director of Updata Capital, an investment banking and venture capital firm. | 84 | None |
| * | Pursuant to the Trust’s mandatory retirement policy, Ms. Hennigar is expected to retire on or about January 12, 2006. |
| 1 | The term of office length is until a trustee resigns or reaches a mandatory retirement age of 70. On March 2, 2000, the Board adopted a five-year implementation period for any Trustee 65 or older as of the adoption of this policy. Pursuant to this policy, Messrs. Duncan and Kerr retired as trustees effective as of March 12, 2005. |
| 2 | Directorships held in (1) any other investment companies registered under the 1940 Act, (2) any company with a class of securities registered pursuant to Section 12 of the Securities Exchange Act of 1934, as amended (the “Exchange Act”), or (3) any company subject to the requirements of Section 15(d) of the Exchange Act. |
| 3 | Mr. McCarthy was also an Administrative Committee Member for the Alphagen Arneb Fund, LLC, The Healthcare Fund LDC, The Leaders Long-Short Fund, LLC, and The Leaders Long-Short Fund LDC, four private investment companies (hedge funds) managed by GSA. Mr. McCarthy resigned as an Administrative Committee Member effective June 30, 2005. |
Trustees and Officers who are not Interested Persons (as defined in the 1940 Act) of the Funds received aggregate compensation of $274,882 from the Trust for the Six Months Ended June 30, 2005. Additional information regarding the Trustees and Officers may be found in the Trust’s statement of additional information, which is available without charge upon request, by calling 1-800-848-0920.
27
Table of Contents
GARTMORE VARIABLE INSURANCE TRUST
Management Information (Unaudited)
June 30, 2005
Trustees who are Interested Persons (as defined in the 1940 Act) and/or Officers of the Funds June 30, 2005
| Name, Address and Age | Position(s) Held with the Trust and Length of Time Served1 | Principal Occupation(s) During Past 5 Years | Number of Portfolios in the Gartmore Fund Complex Overseen by Trustee | Other Directorships Held by Trustee2 | ||||
Paul J. Hondros
Gartmore Global Investments, Inc. 1200 River Road, Suite 1000 Conshohocken, PA 19428
1948 | Trustee since July 2000 | Mr. Hondros has been President and Chief Executive Officer of various Gartmore entities, including Gartmore Distribution Services, Inc. (“GDSI”),3 Gartmore Investor Services, Inc. (“GISI”),3 Gartmore Morley Capital Management, Inc. (“GMCM”),3 Gartmore Morley Financial Services, Inc. (“GMFS”),3 NorthPointe Capital, LLC (“NorthPointe”),3 Gartmore Global Asset Management Trust (“GGAMT”)3, Gartmore Global Investments, Inc. (“GGI”)3, Gartmore Mutual Fund Capital Trust (“GMFCT”)3 and Gartmore SA Capital Trust (“GSA”)3; and a Director of Nationwide Securities, Inc.3, as well as several entities within Nationwide Financial Services, Inc. | 844 | None | ||||
Arden L. Shisler
c/o Gartmore Global Investments, Inc. 1200 River Road, Suite 1000 Conshohocken, PA 19428
1941 | Trustee since February 2000 | Mr. Shisler has been a consultant since January 2003. Prior thereto, he was President and Chief Executive Officer of K&B Transport, Inc., a trucking firm. Since 1992, Mr. Shisler has also been Chairman of the Board for Nationwide Mutual Insurance Company3. | 84 | Director of Nationwide Financial Services, Inc. | ||||
Gerald J. Holland
Gartmore Global Investments, Inc. 1200 River Road, Suite 1000 Conshohocken, PA 19428
1951 | Treasurer since March 2001 | Mr. Holland is Senior Vice President - Operations for GGI3, GMFCT3 , and GSA3. Prior to July 2000, Mr, Holland was Vice President for First Data Investor Services, an investment company service provider. | 84 | None |
28
Table of Contents
GARTMORE VARIABLE INSURANCE TRUST
Management Information (Unaudited)
June 30, 2005
| Name, Address and Age | Position(s) Held with the Trust and Length of Time Served1 | Principal Occupation(s) During Past 5 Years | Number of Portfolios in the Gartmore Fund Complex Overseen by Trustee | Other Directorships Held by Trustee2 | ||||
Michael A. Krulikowski
Gartmore Global Investments, Inc. 1200 River Road, Suite 1000 Conshohocken, PA 19428
1959 | Chief Compliance Officer since June 2004 | Since November 1999, Mr. Krulikowski has served as a Vice President and Chief Compliance Officer of GGI. Prior thereto, Mr. Krulikowski served as Chief Compliance Officer of 1717 Capital Management Company/Provident Mutual Insurance Company. | 84 | None | ||||
Eric E. Miller
Gartmore Global Investments, Inc. 1200 River Road, Suite 1000 Conshohocken, PA 19428
1953 | Secretary since December 2002 | Mr. Miller is Senior Vice President, Chief Counsel for GGI3, GMFCT3 and GSA3 since August 2002. From August 2000 to August 2002, Mr. Miller was a Partner with Stradley Ronan Stevens & Young, LLP. Prior to August 2000, Mr. Miller served as Senior Vice President and Deputy General Counsel at Delaware Investments. | 84 | None |
| 1 | The term of office length is until a trustee resigns or reaches a mandatory retirement age of 70. On March 2, 2000, the Board adopted a five-year implementation period for any Trustee 65 or older as of the adoption of this policy. Pursuant to this policy, Messrs. Duncan and Kerr retired as trustees effective as of March 12, 2005. |
| 2 | Directorships held in (1) any other investment companies registered under the 1940 Act, (2) any company with a class of securities registered pursuant to Section 12 of the Securities Exchange Act of 1934, as amended (the “Exchange Act”), or (3) any company subject to the requirements of Section 15(d) of the Exchange Act. |
| 3 | This position is held with an affiliated person or principal underwriter of the Trust. |
| 4 | Mr. Hondros was also an Administrative Committee Member for the Alphagen Arneb Fund, LLC, The Healthcare Fund LDC, The Leaders Long-Short Fund, LLC, and The Leaders Long-Short Fund LDC, four private investment companies (hedge funds) managed by GSA. Mr. Hondros resigned as Administrative Committee Member effective June 30, 2005. |
Federal law requires the Trust, each of its investment advisers and sub-advisers to adopt procedures for voting proxies (“Proxy Voting Guidelines”) and to provide a summary of those Proxy Voting Guidelines used to vote the securities held by the Funds. The Funds’ proxy voting policies and procedures are available without charge (i) upon request, by calling 1-800-848-0920, (ii) on the Fund’s website at www.gartmorefunds.com, or (iii) on the Securities and Exchange Commission’s website at www.sec.gov.
29
Table of Contents
Van Kampen GVIT Multi Sector Bond Fund
Semiannual Report
| | June 30, 2005 |


| Contents | ||
| 5 | Statement of Investments | |
| 20 | Statement of Assets and Liabilities | |
| 20 | Statement of Operations | |
| 21 | Statements of Changes in Net Assets | |
| 22 | Financial Highlights | |
| 23 | Notes to Financial Statements | |
Commentary provided by Gartmore Global Investments, investment adviser to Gartmore Variable Insurance Trust. All opinions and estimates included in this report constitute Gartmore Global Investments’ judgment as of the date of this report and are subject to change without notice.
Statement Regarding Availability of Quarterly Portfolio Schedule.
The Gartmore Variable Insurance Trust files complete schedules of portfolio holdings for each Fund with the Securities and Exchange Commission (the “Commission”) for the first and third quarters of each fiscal year on Form N-Q. The Funds’ Forms N-Q are available on the Commission’s website at http://www.sec.gov. The Funds’ Forms N-Q may be reviewed and copied at the Commission’s Public Reference Room in Washington, DC, and information on the operation of the Public Reference Room may be obtained by calling 800-SEC-0330; and the Funds make the information on Form N-Q available to shareholders upon request without charge.
Statement Regarding Availability of Proxy Voting Record.
Information regarding how the Fund voted proxies relating to portfolio securities held during the most recent 12-month period ended June 30, 2005 is available without charge, upon request, by calling 800-848-0920, and on the Commission’s website at http://www.sec.gov.
Table of Contents
Van Kampen GVIT Multi Sector Bond Fund
For the semiannual period ended June 30, 2005 the Van Kampen GVIT Multi Sector Bond Fund returned 1.27% (Class I at NAV) versus 1.59% for its blended benchmark, which consists of 60% Citigroup U.S. Broad Investment-Grade Bond Index, 15% Citigroup U.S. High Yield Market Index, 15% Citigroup World Government Bond Index—Unhedged and 10% J.P. Morgan Emerging Markets Bond Index. For broader comparison, the average return for the Fund’s Lipper peer category of General Bond Funds was 1.41%.
Among the larger detractors from the Fund’s performance was its overweighting relative to its blended benchmark in high-yield bonds. These securities experienced a difficult environment during the reporting period as corporate yield spreads (the added yield that compensates for additional risk) widened across the corporate credit markets. On a more positive note, the Fund benefited from having reduced exposure to the investment-grade segment of the corporate bond market, which experienced similarly unfavorable conditions during the reporting period. This beneficial positioning was driven by the low level of corporate bond spreads during much of the period.
Yield spreads were similarly uninteresting in the mortgage-backed securities market, which led to a generally underweighted position in that sector. Fortunately, those securities the Fund did hold were able to deliver performance on a par with that of the blended benchmark, even with its higher weighting.
Outside the United States, the Fund benefited from strong performance in its emerging-markets bond positions, which outperformed their index counterparts. A below-benchmark position in non-U.S. government securities also was beneficial, as the strengthening U.S. dollar was a detriment to their returns.
The Fund maintains below-benchmark interest-rate sensitivity (-1.0 year versus the blended benchmark) as U.S. Treasury rates are expected to move higher to levels more consistent with current economic growth and inflation. This approach will tend to mute the negative impact of rising interest rates, although it can potentially hamper returns during periods of declining interest rates.
PORTFOLIO MANAGERS:
Morgan Stanley Investment Management
Taxable Fixed Income Team:
W. David Armstrong
Sheila Finnerty, David S. Horowitz,
Gordon W. Loery, Abigail McKenna,
Paul F. O’Brien (lead portfolio manager)
and Robert M. Sella
Investing in mutual funds involves risk, including possible loss of principal.
There is no assurance that the investment objective of any fund will be achieved. Lipper Analytical Services, Inc. is an industry research firm whose rankings are based on total return performance and do not reflect the effects of sales charges.
Citigroup Broad Investment Grade Bond Index: An unmanaged, market capitalization-weighted, fixed-income index that includes fixed-rate U.S. Treasury, government-sponsored, mortgage and investment-grade corporate securities with maturities of one year or more, and generally represents the U.S. bond market.
Citigroup High Yield Market Index: An unmanaged index that reflects the performance of below-investment-grade debt, including cash-pay and deferred-interest securities, issued by corporations domiciled in the United States or Canada.
Citigroup World Government Bond Index (unhedged): An unmanaged, market capitalization-weighted index that reflects the performance of developed government bond markets in 20-plus countries; includes securities with maturities of one year or more that are deemed suitable for global investors, based on quality, size, pricing and currency.
J.P. Morgan Emerging Markets Bond Index: An unmanaged index that reflects the total returns for traded external debt instruments of emerging markets, including external-currency-denominated Brady bonds, loans, eurobonds and U.S. dollar-denominated local markets instruments.
The Gartmore Variable Insurance Trust Funds are available only as sub-account investment options in certain variable insurance products. Accordingly, investors are unable to invest in shares of these funds outside of an insurance product. Performance information found herein reflects only the performance of these funds, and does not indicate the performance your sub-account may experience under your variable insurance contract. Performance returns assume reinvestment of all distributions. The investment return and principal value of an investment will fluctuate so that an investor’s shares, when redeemed, may be worth more or less than their original cost. Index performance is provided for comparison purposes only; the indexes shown are unmanaged and do not reflect any fees or expenses. Investors cannot invest directly in market indexes. To obtain performance information about the sub-account option under your insurance contract that invests in one of these funds, please contact your variable insurance carrier. PAST PERFORMANCE IS NO GUARANTEE OF FUTURE RESULTS.
Commentary provided by Gartmore Global Investments. All opinions and estimates included in this report constitute Gartmore Global Investments’ judgment as of the date of this report and are subject to change without notice.
Investors should carefully consider a fund’s investment objectives, risks, fees, charges and expenses before investing any money. To obtain this and other information on Gartmore Variable Insurance Trust, please contact your variable insurance contract provider or call 800-848-0920. Please read the Trust’s prospectus carefully before investing any money.
Gartmore Funds distributed by Gartmore Distribution Services, Inc., Member NASD. 1200 River Road, Suite 1000, Conshohocken, PA 19428.
1
Table of Contents
Van Kampen GVIT Multi Sector Bond Fund | Fund Performance |
| Average | Annual Total Return1 |
(For Periods Ended June 30, 2005)
| Six months* | One year | Five years | Inception2 | |||||
| Class I3 | 1.27% | 8.45% | 6.85% | 5.46% |
| * | Not Annualized. |
| 1 | Not subject to any sales charges. |
| 2 | The Fund commenced operations on October 31, 1997. |
| 3 | The existing shares of the Fund were designated Class I shares as of May 1, 2001. |
| Performance | of a $10,000 Investment |
Investment return and principal value will fluctuate, and when redeemed, shares may be worth more or less than original cost. Past performance is no guarantee of future results and does not reflect the deduction of taxes that a shareholder would pay on fund distributions or the redemption of fund shares. Investing in mutual funds involves market risk, including loss of principal. Performance returns assume the reinvestment of all distributions.
Comparative performance of $10,000 invested in Class I shares of the Van Kampen GVIT Multi Sector Bond Fund, the Van Kampen GVIT Multi Sector Bond Composite Index (the Composite (new))(a), Citigroup US Broad Investment-Grade Bond Index (Citigroup USBIG Index)(b), Citigroup US High Yield Market Index(c), Citigroup World Government Bond Index-unhedged(d), JP Morgan Emerging Markets Bond Index(JP Morgan EMBI Global)(e), Lehman Brothers U.S. Aggregate Bond Index (LB U.S. Aggregate Bond Index (old))(f), and Consumer Price Index (CPI)(g) since inception. Unlike, the Fund, the returns for these unmanaged indexes do not reflect any fees, expenses, or sales charges. Investors cannot invest directly in market indexes.
| (a) | The Composite (new) index is a combination of Citigroup U.S. Broad Investment-Grade Bond Index (60%), Citigroup U.S. High-Yield Market Index (15%), Citigroup World Government Bond Index—unhedged (15%) and J.P. Morgan Emerging Market Bond Index (10%). Unlike mutual funds, the composite index does not include expenses. If expenses were included, the actual returns would be lower. |
| (b) | The Citigroup USBIG Index is designed to track the performance of bonds issued in the U.S. investment grade bond market. The USBIG Index includes institutionally traded U.S. Treasury, government-sponsored (US agency and supranational), mortgage, asset-backed, and investment-grade securities and provides a reliable and fair benchmark for an investment-grade portfolio manager. |
| (c) | The Citigroup U.S. High-Yield Market Index captures the performance of below-investment grade debt issued by corporations domiciled in the United States and Canada. |
| (d) | The Citigroup World Government Bond Index—unhedged includes the 21 government bond markets of Australia, Austria, Belgium, Canada, Denmark, Finland, France, Germany, Greece, Ireland, Italy, Japan, the Netherlands, Norway, Poland, Portugal, Spain, Sweden, Switzerland, the United Kingdom, and the United States. |
| (e) | The J.P. Morgan EMBI Global, which currently covers 27 emerging market countries. Included in the EMBI Global are US-dollar-denominated Brady bonds, Eurobonds, traded loans, and local market debt instruments issued by sovereign and quasi-sovereign entities. |
| (f) | LB U.S. Aggregate Bond Index (old) is an unmanaged, market value-weighted index of investment-grade, fixed-rate debt issues (including government, corporate, asset-backed, and mortgage-backed securities with maturities of one year or more) that is generally representative of the bond market as a whole. |
| (g) | The CPI represents changes in prices of a basket of goods and services purchased for consumption by urban households. |
2
Table of Contents
Shareholder
Expense Example | Van Kampen GVIT Multi Sector Bond Fund |
As a shareholder of the Fund, you incur two types of costs: (1) transaction costs, including sales charges (loads) paid on purchase payments and redemption fees; and (2) ongoing costs, including investment advisory fees, administration fees, distribution fees and other Fund expenses. The examples below are intended to help you understand your ongoing costs (in dollars) of investing in the Fund and to compare these costs with the ongoing costs of investing in other mutual funds. Per SEC requirements, the examples assume that you had a $1,000 investment in the Class at the beginning of the reporting period, January 1, 2005, and continued to hold your shares at the end of the reporting period, June 30, 2005.
Actual Expenses
For each Class of the Fund in the table below, the first line provides information about actual account values and actual expenses. You may use the information in this line, together with the amount you invested, to estimate the expenses that you paid over the period. Simply divide your account value by $1,000 (for example, an $8,600 account value divided by $1,000 = 8.6), then multiply the result by the number in the first line of each Class under the heading entitled “Expenses Paid During Period” to estimate the expenses you paid on your account during the period.
Hypothetical Example for Comparison Purposes
The second line of each Class in the table below provides information about hypothetical account values and hypothetical expenses based on the Class’ actual expense ratio and an assumed rate of return of 5% per year before expenses, which is not the Class’ actual return. The hypothetical account values and expenses may not be used to estimate the actual ending account balance or expenses you paid for the period. You may use this information to compare the ongoing costs of investing in the Class of the Fund and other funds. To do so, compare this 5% hypothetical example with the 5% hypothetical examples that appear in the shareholder reports of the other funds.
Please note that the expenses shown in the table are meant to highlight your ongoing costs only and do not reflect any transaction costs, such as sales charges (loads) or redemption fees. Therefore, the second line for each Class in the table is useful in comparing ongoing costs only, and will not help you determine the relative total costs of owning different funds. In addition, if these transaction costs were included, your costs would have been higher. The examples also assume all dividends and distributions have been reinvested.
| Beginning Account Value, January 1, 2005 | Ending Account Value, June 30, 2005 | Expenses Paid | Annualized Expense Ratio* | |||||||||||
| Multi Sector Bond Fund | ||||||||||||||
Class I | Actual | $ | 1,000 | $ | 1,013 | $ | 5.09 | 1.02% | ||||||
| Hypothetical | 1 | $ | 1,000 | $ | 1,020 | $ | 5.12 | 1.02% | ||||||
| * | Expenses are equal to the Fund’s annualized expense ratio multiplied by the average account value over the period multiplied by 181/365 (to reflect the one-half year period). The expense ratio presented represents a six month, annualized ratio in accordance with SEC guidelines. |
| 1 | Represents the hypothetical 5% return before expenses. |
3
Table of Contents
Portfolio Summary
(June 30, 2005) | Van Kampen GVIT Multi Sector Bond Fund |
The SEC adopted a requirement that Funds present their portfolio holdings in a table, chart or graph format in their annual and semiannual reports to shareholders, whether or not a statement of investments is utilized. The following tables, which present portfolio holdings as a percentage of net assets, are provided in compliance with this requirement.
| Asset Allocation | ||
| Corporate Bonds | 38.0% | |
| U.S. Treasury Obligations | 35.9% | |
| Sovereign Bonds | 13.5% | |
| Cash Equivalents | 8.1% | |
| U.S. Government Agencies | 5.8% | |
| Mortgage-Backed Obligations | 4.2% | |
| Interest Only Bonds | 0.5% | |
| Warrants | 0.0% | |
| Other Investments* | 4.6% | |
| Liabilities in excess of other assets** | -10.6% | |
| 100.0% | ||
| Top Holdings*** | ||
| U.S. Treasury Notes, 4.25%, 08/15/13 | 14.1% | |
| U.S. Treasury Notes, 3.50%, 11/15/06 | 6.0% | |
| U.S. Treasury Notes, 6.13%, 08/15/29 | 5.2% | |
| U.S. Treasury Notes, 3.13%, 05/15/07 | 3.9% | |
| Federal Home Loan Mortgage Discount Notes, 0.00%, 07/12/05 | 2.9% | |
| Federal Home Loan Bank Discount Notes, 0.00%, 08/12/05 | 2.8% | |
| U.S. Treasury Notes, 3.88%, 02/15/13 | 2.5% | |
| Bundes Republic of Deutschland, 5.63%, 01/04/28 | 2.5% | |
| Federal National Mortgage Association, 6.00%, 07/01/32 | 2.2% | |
| U.S. Treasury Notes, 8.13%, 08/15/19 | 2.0% | |
| Other Holdings | 55.9% | |
| 100.0% | ||
| Top Industries | ||
| U.S. Treasury Notes | 36.3% | |
| Financial Services | 8.5% | |
| Federal National Mortgage Association | 7.4% | |
| Asset Backed Securities | 3.9% | |
| Oil & Gas | 3.0% | |
| Federal Home Loan Mortgage Discount Notes | 2.9% | |
| Federal Home Loan Bank Discount Notes | 2.8% | |
| Federal Home Loan Mortgage Corporation | 2.4% | |
| Telecommunications | 2.4% | |
| Utilities / Power Producers | 2.1% | |
| Other Industries | 28.3% | |
| 100.0% | ||
| * | Includes value of collateral received from securities lending. |
| ** | Includes value of collateral owed from securities lending. |
| *** | For purpose of listing top holdings, repurchase agreements are considered cash equivalents and are included as part of Other Holdings. |
4
Table of Contents
GARTMORE VARIABLE INSURANCE TRUST
VAN KAMPEN GVIT MULTI SECTOR BOND FUND
Statement of Investments — June 30, 2005 (Unaudited)
| Principal Amount | Value | |||||
| CORPORATE BONDS (38.0%) | ||||||
| Advertising (0.3%) | ||||||
| Advanstar Communications, Inc., 10.77%, 08/15/08 | $ | 294,750 | $ | 316,267 | ||
| Interpublic Group Co., Inc., 5.40%, 11/15/09 | 75,000 | 71,328 | ||||
| Vertis, Inc., 13.50%, 12/07/09 | 85,000 | 63,431 | ||||
| WPP Finance (UK) Corp., 5.88%, 06/15/14 | 190,000 | 200,880 | ||||
| WPP Group, PLC, 6.00%, 06/18/08 (EUR) | 120,000 | 159,063 | ||||
| 810,969 | ||||||
| Aerospace & Defense (0.2%) | ||||||
| Northrop Grumman Corp., 4.08%, 11/16/06 | 115,000 | 114,668 | ||||
| Raytheon Co., 8.30%, 03/01/10 | 120,000 | 139,067 | ||||
| Systems 2001 Asset Trust, 6.66%, 09/15/13 (c) | 287,232 | 313,266 | ||||
| 567,001 | ||||||
| Airlines (0.1%) | ||||||
| Continental Airlines, Inc., 6.90%, 01/02/18 | 170,323 | 169,376 | ||||
| Continental Airlines, Inc. Series 991A, 6.65%, 03/15/19 | 207,202 | 204,463 | ||||
| 373,839 | ||||||
| Asset Backed Securities (3.9%) | ||||||
| Asset Backed Funding Certificates, 3.39%, 03/25/35 (e) | 1,087,025 | 1,087,099 | ||||
| Capital Auto Receivables Asset Trust, 3.47%, 04/15/08 (e) | 1,250,000 | 1,250,806 | ||||
| GSAMP Trust, 3.40%, 04/25/35 (e) | 836,202 | 836,261 | ||||
| GSAMP Trust, 3.25%, 06/25/35 (e) | 1,150,000 | 1,150,000 | ||||
| Master Asset Backed Securities Trust, 3.40%, 03/25/35 (e) | 912,014 | 912,078 | ||||
| Structured Asset Investment Loan Trust, 3.30%, 05/25/35 (e) | 1,975,000 | 1,975,000 | ||||
| Principal Amount | Value | |||||
| CORPORATE BONDS (continued) | ||||||
| Asset Backed Securities (continued) | ||||||
| Structured Asset Investment Loan Trust, 3.40%, 06/25/35 (e) | $ | 1,221,799 | $ | 1,221,776 | ||
| Structured Asset Securities Corp., 3.39%, 05/25/35 (e) | 1,638,658 | 1,637,260 | ||||
| 10,070,280 | ||||||
| Auto Parts & Equipment (0.3%) | ||||||
| Arvinmeritor, Inc., 6.80%, 02/15/09 | 150,000 | 148,500 | ||||
| Arvinmeritor, Inc., 8.75%, 03/01/12 | 145,000 | 151,163 | ||||
| Commercial Vehicle Group, 8.00%, 07/01/13 (c) | 40,000 | 40,800 | ||||
| Lear Corp., 8.11%, 05/15/09 | 105,000 | 108,574 | ||||
| TRW Automotive, Inc. Series B, 9.38%, 02/15/13 | 236,000 | 261,370 | ||||
| 710,407 | ||||||
| Automotive (0.8%) | ||||||
| Autonation, Inc., 9.00%, 08/01/08 | 250,000 | 273,125 | ||||
| DaimlerChrysler NA Holdings, 7.30%, 01/15/12 | 125,000 | 139,679 | ||||
| Ford Motor Co., 7.45%, 07/16/31 | 90,000 | 75,133 | ||||
| General Motors, 7.13%, 07/15/13 | 115,000 | 102,925 | ||||
| General Motors Corp., 8.38%, 07/05/33 (EUR) | 180,000 | 179,237 | ||||
| General Motors Corp., 8.38%, 07/15/33 (EUR) | 900,000 | 751,501 | ||||
| Sonic Automotive Inc., Series B, 8.63%, 08/15/13 | 445,000 | 449,450 | ||||
| 1,971,050 | ||||||
| Banking (0.8%) | ||||||
| Bank One Corp., 6.00%, 02/17/09 | 95,000 | 100,128 | ||||
| Chase Manhattan Corp., 7.00%, 11/15/09 | 240,000 | 263,986 | ||||
| Deutsche Bank AG, 5.13%, 01/31/13 (EUR) | 80,000 | 108,123 | ||||
| JP Morgan Chase & Co., 5.35%, 03/01/07 | 140,000 | 142,798 | ||||
5
Table of Contents
GARTMORE VARIABLE INSURANCE TRUST
VAN KAMPEN GVIT MULTI SECTOR BOND FUND
Statement of Investments — June 30, 2005 (Unaudited) (continued)
| Principal Amount | Value | |||||
| CORPORATE BONDS (continued) | ||||||
| Banking (continued) | ||||||
| KFW International Finance, 2.05%, 09/21/09 (JPY) | $ | 94,000,000 | $ | 910,766 | ||
| Marshall & Ilsley Bank, 3.80%, 02/08/08 | 605,000 | 600,184 | ||||
| 2,125,985 | ||||||
| Brewery (0.1%) | ||||||
| FBG Finance Ltd., 5.13%, 06/15/15 (c) | 250,000 | 250,978 | ||||
| Broadcast Media (0.1%) | ||||||
| Salem Communications Holding Corp., 9.00%, 07/01/11 | 184,000 | 198,260 | ||||
| Business Services (0.2%) | ||||||
| Adecco Financial Services, 6.00%, 03/15/06 (EUR) | 100,000 | 123,886 | ||||
| Iron Mountain, Inc., 8.63%, 04/01/13 | 195,000 | 201,825 | ||||
| Iron Mountain, Inc., 7.75%, 01/15/15 | 220,000 | 221,100 | ||||
| Iron Mountain, Inc., 6.63%, 01/01/16 | 90,000 | 83,250 | ||||
| 630,061 | ||||||
| Cable (1.0%) | ||||||
| Cablevision Systems Corp., 7.89%, 04/01/09 (c) | 215,000 | 215,538 | ||||
| Charter Communications, LLC, 9.63%, 11/15/09 | 465,000 | 347,588 | ||||
| Comcast Cable Communication, Inc., 6.75%, 01/30/11 | 300,000 | 330,977 | ||||
| Cox Communications, Inc., 4.63%, 01/15/10 | 195,000 | 194,485 | ||||
| Echostar DBS Corp., 6.38%, 10/01/11 | 475,000 | 470,843 | ||||
| Echostar DBS Corp., 6.63%, 10/01/14 | 70,000 | 69,125 | ||||
| General Cable Corp., 9.50%, 11/15/10 | 100,000 | 107,000 | ||||
| Kabel Deutschland GMBH, 10.63%, 07/01/14 (c) | 330,000 | 358,049 | ||||
| Renaissance Media Group, 10.00%, 04/15/08 | 120,000 | 118,800 | ||||
| Principal Amount | Value | |||||
| CORPORATE BONDS (continued) | ||||||
| Cable (continued) | ||||||
| TCI Communications, Inc., 7.88%, 02/15/26 | $ | 90,000 | $ | 112,405 | ||
| Telenet Group Holdings NV, 8.63%, 06/15/14 | 300,000 | 233,250 | ||||
| 2,558,060 | ||||||
| Chemicals & Plastics (1.4%) | ||||||
| Ashland, Inc., 7.83%, 08/15/05 | 200,000 | 200,899 | ||||
| Equistar Chemical, 10.13%, 09/01/08 | 330,000 | 357,225 | ||||
| Hexcel Corp., 6.75%, 02/01/15 (c) | 215,000 | 215,000 | ||||
| Huntsman Corp., 10.13%, 07/01/09 | 195,000 | 200,606 | ||||
| ICI Wilmington, 4.38%, 12/01/08 | 115,000 | 114,126 | ||||
| IMC Global, Inc., 10.88%, Series B 06/01/08 | 25,000 | 28,125 | ||||
| Innophos, Inc., 8.88%, 08/15/14 (c) | 320,000 | 326,400 | ||||
| ISP, Inc., 10.63%, 12/15/09 | 350,000 | 376,250 | ||||
| JohnsonDiversey, Inc., 9.63%, 05/15/12 | 180,000 | 182,700 | ||||
| Lyondell Chemicals Co., 10.50%, 06/01/13 | 200,000 | 228,750 | ||||
| Millennium America, Inc., 9.25%, 06/15/08 | 385,000 | 416,762 | ||||
| Nalco Co., 7.75%, 11/15/11 | 165,000 | 175,725 | ||||
| Nalco Co., 8.88%, 11/15/13 | 85,000 | 91,163 | ||||
| Rhodia SA, 8.88%, 06/01/11 | 250,000 | 240,625 | ||||
| Rockwood Specialities Group, 10.63%, 05/15/11 | 320,000 | 352,800 | ||||
| 3,507,156 | ||||||
| Construction & Building Materials (0.9%) | ||||||
| Associated Materials, Inc., 9.34%, 03/01/14 (c) | 660,000 | 419,100 | ||||
| Beazer Homes USA, 6.88%, 07/15/15 (c) | 155,000 | 153,450 | ||||
| Goodman Global Holdings, 6.62%, 06/15/12 (c) | 70,000 | 68,950 | ||||
| Goodman Global Holdings, 7.88%, 12/15/12 (c) | 365,000 | 337,625 | ||||
| Nortek Holdings, Inc., 8.50%, 03/01/14 | 310,000 | 145,700 | ||||
6
Table of Contents
GARTMORE VARIABLE INSURANCE TRUST
VAN KAMPEN GVIT MULTI SECTOR BOND FUND
Statement of Investments — June 30, 2005 (Unaudited) (continued)
| Principal Amount | Value | |||||
| CORPORATE BONDS (continued) | ||||||
| Construction & Building Materials (continued) | ||||||
| Nortek, Inc., 8.50%, 09/01/14 | $ | 250,000 | $ | 232,500 | ||
| Ply Gem Industries, Inc., 9.00%, 02/15/12 | 100,000 | 84,500 | ||||
| RMCC Acquisition Co., 9.50%, 11/01/12 (c) | 240,000 | 229,200 | ||||
| Technical Olympic USA, Inc., 9.00%, 07/01/10 | 200,000 | 205,750 | ||||
| Technical Olympic USA, Inc., 10.38%, 07/01/12 | 280,000 | 292,600 | ||||
| 2,169,375 | ||||||
| Consumer Products (0.1%) | ||||||
| Amscan Holdings, Inc., 8.75%, 05/01/14 | 135,000 | 123,525 | ||||
| Clorox Co., 3.53%, 12/14/07 (c) | 210,000 | 210,327 | ||||
| 333,852 | ||||||
| Cosmetic & Toiletries (0.0%) | ||||||
| Del Laboratories Inc., 8.00%, 02/01/12 (c) | 50,000 | 43,000 | ||||
| Distribution & Wholesale (0.3%) | ||||||
| Buhrmann US, Inc., 8.25%, 07/01/14 | 250,000 | 250,000 | ||||
| Buhrmann US, Inc., 7.88%, 03/01/15 | 240,000 | 234,000 | ||||
| Nebraska Book Co., 8.63%, 03/15/12 | 190,000 | 177,175 | ||||
| 661,175 | ||||||
| Diversified (0.0%) | ||||||
| Murrin Murrin Holdings, 0.00%, 08/31/07 (b) (f) (g) (i) | 125,000 | 0 | ||||
| Tyco International Group SA, 6.13%, 04/04/07 | 40,000 | 51,332 | ||||
| Drugs (0.1%) | ||||||
| Warner Chilcott Corp., 8.75%, 02/01/15 (c) | 210,000 | 204,225 | ||||
| Electronic Components (0.1%) | ||||||
| Sanmina-Sci Corp., 6.75%, 03/01/13 | 270,000 | 257,850 | ||||
| Entertainment (0.2%) | ||||||
| Isle Of Capri Casinos, 7.00%, 03/01/14 | 325,000 | 326,625 | ||||
| Principal Amount | Value | |||||
| CORPORATE BONDS (continued) | ||||||
| Entertainment (continued) | ||||||
| Marquee, Inc., 7.52%, 08/15/10 (c) | $ | 155,000 | $ | 160,231 | ||
| 486,856 | ||||||
| Environmental Controls (0.5%) | ||||||
| Allied Waste North America, Inc., 8.88%, 04/01/08 | 375,000 | 393,750 | ||||
| Allied Waste North America, Inc., 6.38%, 04/15/11 | 65,000 | 62,400 | ||||
| Allied Waste North America, Inc., Series B, 8.50%, 12/01/08 | 200,000 | 209,750 | ||||
| Waste Management, Inc., 7.13%, 10/01/07 | 450,000 | 476,048 | ||||
| 1,141,948 | ||||||
| Financial Services (8.5%) | ||||||
| AIG SunAmerica Global Finance, 6.30%, 05/10/11 (c) | 395,000 | 430,508 | ||||
| Altria Finance Ltd., 5.63%, 06/24/08 (EUR) | 90,000 | 116,956 | ||||
| American General Finance Corp., 4.63%, 05/15/09 | 95,000 | 95,486 | ||||
| AXA Financial, Inc., 7.75%, 08/01/10 | 460,000 | 528,937 | ||||
| Carrington Mortgage Loan Trust, 3.24%, 06/25/35 | 950,000 | 949,799 | ||||
| Caterpillar Financial Services Corp., 3.35%, 08/20/07 | 220,000 | 220,247 | ||||
| Caterpillar Financial Services Corp., 3.63%, 11/15/07 | 75,000 | 74,059 | ||||
| Chase Funding Mortgage Loan, 3.42%, 11/25/18 | 73,593 | 73,592 | ||||
| Chase Manhattan Auto Owner Trust, 1.45%, Series 2004-A, Class A2 10/15/06 | 126,511 | 126,325 | ||||
| CIT Group, Inc., 7.38%, 04/02/07 | 120,000 | 126,426 | ||||
| Citigroup Turkey, Inc., 0.00%, 09/28/06 | 220,000 | 231,088 | ||||
| Citigroup, Inc., 6.00%, 02/21/12 | 285,000 | 311,224 | ||||
| Citigroup, Inc., 5.63%, 08/27/12 | 245,000 | 261,692 | ||||
| Citigroup, Inc., 6.63%, 06/15/32 | 50,000 | 59,688 | ||||
7
Table of Contents
GARTMORE VARIABLE INSURANCE TRUST
VAN KAMPEN GVIT MULTI SECTOR BOND FUND
Statement of Investments — June 30, 2005 (Unaudited) (continued)
| Principal Amount | Value | |||||
| CORPORATE BONDS (continued) | ||||||
| Financial Services (continued) | ||||||
| Citigroup Mortgage Loan Trust, 3.30%, 07/25/35 (e) | $ | 1,775,000 | $ | 1,775,000 | ||
| Countrywide Home Loans, Inc., 3.25%, 05/21/08 | 220,000 | 213,612 | ||||
| Equifirst Mortgage Loan Trust, 3.37%, 04/25/35 (e) | 1,220,344 | 1,220,408 | ||||
| Farmers Exchange Capital, 7.05%, 07/15/28 (c) | 285,000 | 308,200 | ||||
| Ford Motor Credit Co., 7.38%, 10/28/09 | 70,000 | 68,403 | ||||
| Ford Motor Credit Co., 7.25%, 10/25/11 | 220,000 | 211,699 | ||||
| GE Capital Credit Card Master Note Trust, 3.27%, 06/15/10 (e) | 1,350,000 | 1,351,170 | ||||
| General Electric Capital Corp., 4.25%, 12/01/10 | 100,000 | 99,627 | ||||
| General Electric Capital Corp., 6.75%, 03/15/32 | 220,000 | 271,477 | ||||
| General Motors Acceptance Corp., 6.88%, 09/15/11 | 490,000 | 452,313 | ||||
| General Motors Acceptance Corp., 8.00%, 11/01/31 | 555,000 | 495,250 | ||||
| Goldman Sachs Group, Inc., 6.60%, 01/15/12 | 145,000 | 161,155 | ||||
| Goldman Sachs Group, Inc., 5.25%, 10/15/13 | 245,000 | 252,816 | ||||
| Household Finance Corp., 6.50%, 05/05/09 (EUR) | 140,000 | 193,031 | ||||
| Household Finance Corp., 8.00%, 07/15/10 | 250,000 | 288,466 | ||||
| John Hancock Global Funding, 7.90%, 07/02/10 | 155,000 | 180,254 | ||||
| JSG Funding, PLC, 10.13%, 10/01/12 (EUR) | 155,000 | 194,219 | ||||
| KFW International Finance, 6.25%, 07/15/05 (AUD) | 800,000 | 608,902 | ||||
| Mantis Reef, Ltd., 4.69%, 11/14/08 (c) | 425,000 | 426,285 | ||||
| MBNA Corp., 3.64%, 05/05/08 | 460,000 | 462,703 | ||||
| MBNA Corp., 6.13%, 03/01/13 | 350,000 | 381,403 | ||||
| MBNA Credit Card Master Note Trust, 3.34%, 08/16/10 | 1,750,000 | 1,754,963 | ||||
| Nationwide Building Society, 4.25%, 02/01/10 (c) | 290,000 | 289,278 | ||||
| Principal Amount | Value | |||||
| CORPORATE BONDS (continued) | ||||||
| Financial Services (continued) | ||||||
| Novastar Home Equity Loan, 3.43%, 06/25/35 (e) | $ | 1,690,630 | $ | 1,690,880 | ||
| Park Place Securities, Inc., 3.39%, 06/25/35 (e) | 1,329,504 | 1,328,925 | ||||
| Prudential Holdings, LLC, 7.25%, 12/18/23 (c) | 150,000 | 185,912 | ||||
| Refco Finance Holdings, 9.00%, 08/01/12 | 250,000 | 265,000 | ||||
| Residential Capital Corp., 6.38%, 06/30/10 (c) | 275,000 | 276,323 | ||||
| Saxon Asset Securities Trust, 3.40%, 05/25/35 (e) | 1,552,064 | 1,552,036 | ||||
| SLM Corp., 4.00%, 01/15/10 | 240,000 | 237,083 | ||||
| UCAR Finance, Inc., 10.25%, 02/15/12 | 200,000 | 210,500 | ||||
| Washington Mutual, Inc., 8.25%, 04/01/10 | 500,000 | 574,240 | ||||
| Wells Fargo Financial Auto Owner Trust Series 2004-A, 1.47%, Series 2004-A, Class A2 03/15/07 | 80,183 | 80,085 | ||||
| 21,667,645 | ||||||
| Food Products & Services (0.6%) | ||||||
| Albertson’s, Inc., 7.45%, 08/01/29 | 295,000 | 335,928 | ||||
| Kraft Foods, Inc., 5.63%, 11/01/11 | 325,000 | 344,767 | ||||
| Michael Foods, 8.00%, 11/15/13 | 120,000 | 122,100 | ||||
| Pilgrim’s Pride Corp., 9.63%, 09/15/11 | 360,000 | 393,300 | ||||
| Pilgrim’s Pride Corp., 9.25%, 11/15/13 | 95,000 | 105,450 | ||||
| Smithfield Foods, Inc., 8.00%, 10/15/09 | 90,000 | 97,200 | ||||
| 1,398,745 | ||||||
| Forestry (0.1%) | ||||||
| Tembec Industries, Inc., 8.50%, 02/01/11 | 225,000 | 173,812 | ||||
| Weyerhaeuser Co., 6.00%, 08/01/06 | 55,000 | 55,980 | ||||
| 229,792 | ||||||
8
Table of Contents
GARTMORE VARIABLE INSURANCE TRUST
VAN KAMPEN GVIT MULTI SECTOR BOND FUND
Statement of Investments — June 30, 2005 (Unaudited) (continued)
| Principal Amount | Value | |||||
| CORPORATE BONDS (continued) | ||||||
| Health Care & Health Care Services (0.7%) | ||||||
| Aetna, Inc., 7.88%, 03/01/11 | $ | 355,000 | $ | 414,374 | ||
| Community Health Systems, 6.50%, 12/15/12 | 185,000 | 188,238 | ||||
| Davita, Inc., 6.63%, 03/15/13 (c) | 145,000 | 149,713 | ||||
| HCA, Inc., 6.30%, 10/01/12 | 300,000 | 307,945 | ||||
| HCA, Inc., 7.58%, 09/15/25 | 175,000 | 184,512 | ||||
| Health Net, Inc., 9.88%, 04/15/11 | 295,000 | 350,938 | ||||
| National Nephrology Association, 9.00%, 11/01/11 (c) | 40,000 | 44,900 | ||||
| Tenet Healthcare Corp., 6.88%, 11/15/31 | 185,000 | 155,400 | ||||
| 1,796,020 | ||||||
| Hotels & Casinos (0.9%) | ||||||
| Harrah’s Operating Co., Inc., 5.63%, 06/01/15 (c) | 135,000 | 137,504 | ||||
| HMH Properties, Inc., Series B, 7.88%, 08/01/08 | 63,000 | 63,945 | ||||
| Hyatt Equities, LLC, 6.88%, 06/15/07 (c) | 130,000 | 134,145 | ||||
| MGM Mirage, Inc., 6.00%, 10/01/09 | 300,000 | 301,500 | ||||
| MGM Mirage, Inc., 8.50%, 09/15/10 | 190,000 | 210,900 | ||||
| MGM Mirage, Inc., 6.75%, 09/01/12 | 560,000 | 576,800 | ||||
| Starwood Hotels & Resorts, 7.38%, 05/01/07 | 150,000 | 156,750 | ||||
| Starwood Hotels & Resorts, 7.88%, 05/01/12 | 210,000 | 236,775 | ||||
| Station Casinos, Inc., 6.00%, 04/01/12 | 340,000 | 345,100 | ||||
| 2,163,419 | ||||||
| Insurance (0.9%) | ||||||
| Farmers Insurance Exchange, 8.63%, 05/01/24 (c) | 250,000 | 310,348 | ||||
| Hartford Financial Services Group, 2.38%, 06/01/06 | 40,000 | 39,285 | ||||
| Marsh & McLennan Cos., Inc., 5.88%, 08/01/33 | 660,000 | 629,076 | ||||
| Munich Re Finance BV, 6.75%, 06/21/23 (EUR) | 130,000 | 187,965 | ||||
| Principal Amount | Value | |||||
| CORPORATE BONDS (continued) | ||||||
| Insurance (continued) | ||||||
| Specialty Underwriting & Residential Finance, 3.19%, 12/25/35 (e) | $ | 961,963 | $ | 961,946 | ||
| St. Paul Travelers, 5.01%, 08/16/07 | 240,000 | 242,992 | ||||
| 2,371,612 | ||||||
| Internet (0.0%) | ||||||
| Exodus Communications, Inc., 0.00%, 07/15/10 (f) (g) (h) (i) | 126,186 | 0 | ||||
| Rhythms Netconnections, 0.00%, 02/15/10 (f) (g) (h) (i) | 366,692 | 0 | ||||
| Machinery, Construction & Mining (0.2%) | ||||||
| Flowserve Corp., 12.25%, 08/15/10 | 129,000 | 139,320 | ||||
| Manitowoc Co., Inc., 10.50%, 08/01/12 | 214,000 | 241,820 | ||||
| 381,140 | ||||||
| Manufacturing (0.7%) | ||||||
| Amsted Industries, Inc., 10.25%, 10/15/11 (c) | 310,000 | 334,800 | ||||
| Interface, Inc., 7.30%, 04/01/08 | 55,000 | 56,100 | ||||
| Interface, Inc., 10.38%, 02/01/10 | 60,000 | 66,000 | ||||
| Interface, Inc., 9.50%, 02/01/14 | 225,000 | 229,500 | ||||
| Koppers, Inc., 9.88%, 10/15/13 | 70,000 | 75,600 | ||||
| Levi Strauss & Co., 7.73%, 04/01/12 | 360,000 | 340,200 | ||||
| NMHG Holding Co., 10.00%, 05/15/09 | 200,000 | 210,000 | ||||
| Propex Fabrics, Inc., 10.00%, 12/01/12 | 215,000 | 204,250 | ||||
| TriMas Corp., 9.88%, 06/15/12 | 200,000 | 168,000 | ||||
| 1,684,450 | ||||||
| Medical Instruments (0.3%) | ||||||
| Fisher Scientific International, 6.75%, 08/15/14 | 365,000 | 381,425 | ||||
| Fresenius Medical Cap TR II, 7.88%, 02/01/08 | 350,000 | 365,750 | ||||
| 747,175 | ||||||
9
Table of Contents
GARTMORE VARIABLE INSURANCE TRUST
VAN KAMPEN GVIT MULTI SECTOR BOND FUND
Statement of Investments — June 30, 2005 (Unaudited) (continued)
| Principal Amount | Value | |||||
| CORPORATE BONDS (continued) | ||||||
| Medical Products (0.1%) | ||||||
| VWR International, Inc., 6.88%, 04/15/12 | $ | 95,000 | $ | 93,575 | ||
| VWR International, Inc., 8.00%, 04/15/14 | 120,000 | 114,300 | ||||
| 207,875 | ||||||
| Metals (0.2%) | ||||||
| Novelis, Inc., 7.25%, 02/15/15 | 380,000 | 381,425 | ||||
| Multimedia (0.1%) | ||||||
| AOL Time Warner, Inc., 6.63%, 05/15/29 | 220,000 | 245,138 | ||||
| AOL Time Warner, Inc., 7.63%, 04/15/31 | 105,000 | 131,133 | ||||
| 376,271 | ||||||
| Oil & Gas (3.0%) | ||||||
| Chesapeake Energy Corp., 7.50%, 09/15/13 | 240,000 | 259,800 | ||||
| Chesapeake Energy Corp., 6.63%, 01/15/16 (c) | 230,000 | 237,475 | ||||
| Citgo Petroleum Corp., 6.00%, 10/15/11 | 255,000 | 254,363 | ||||
| Consolidated Natural Gas Co., Series A, 5.00%, 03/01/14 | 165,000 | 167,374 | ||||
| El Paso Production Holdings, 7.75%, 06/01/13 | 480,000 | 512,400 | ||||
| Empresa Nacional del Petroleo, 6.75%, 11/15/12 (c) | 230,000 | 255,344 | ||||
| Empresa Nacional del Petroleo, 6.75%, 11/15/12 | 180,000 | 199,314 | ||||
| Gazprom Capital, 8.625%, 04/28/2034 | 390,000 | 485,940 | ||||
| Hanover Compressor Co., 8.63%, 12/15/10 (c) | 10,000 | 10,575 | ||||
| Hanover Equipment Trust, Series A, 8.50%, 09/01/08 | 285,000 | 296,400 | ||||
| Hilcorp Energy, 10.50%, 09/01/10 (c) | 315,000 | 348,075 | ||||
| Husky Oil Ltd., 8.90%, 08/15/28 | 525,000 | 580,552 | ||||
| Kerr-McGee Corp., 7.88%, 09/15/31 | 285,000 | 324,532 | ||||
| Magnum Hunter Resources, 9.60%, 03/15/12 | 29,000 | 32,190 | ||||
| Pemex Project Funding Master Trust, 6.63%, 04/04/10 | 250,000 | 342,736 | ||||
| Principal Amount | Value | |||||
| CORPORATE BONDS (continued) | ||||||
| Oil & Gas (continued) | ||||||
| Pemex Project Funding Master Trust, 4.71%, 06/15/10 (c) (e) | $ | 570,000 | $ | 587,955 | ||
| Pemex Project Funding Master Trust, 9.50%, 09/15/27 | 110,000 | 142,802 | ||||
| Pemex Project Funding Master Trust, 9.50%, 09/15/27 | 30,000 | 38,700 | ||||
| Petro Shopping Centre, 9.00%, 02/15/12 | 320,000 | 321,600 | ||||
| Petroleos Mexicanos, 8.63%, 12/01/23 | 250,000 | 303,750 | ||||
| Petroleos Mexicanos, 9.50%, 09/15/27 | 580,000 | 756,899 | ||||
| Plains Exploration & Company, 7.13%, 06/15/14 | 95,000 | 101,650 | ||||
| RAS Laffan Liquid Natural Gas, 8.29%, 03/15/14 (c) | 220,000 | 261,888 | ||||
| Sempra Energy, 4.62%, 05/17/07 | 155,000 | 155,732 | ||||
| Tesoro Petroleum Corp., 9.63%, 04/01/12 | 310,000 | 342,938 | ||||
| Vintage Petroleum, Inc., 7.88%, 05/15/11 (c) | 445,000 | 469,475 | ||||
| 7,790,459 | ||||||
| Packaging & Containers (0.6%) | ||||||
| Graham Packaging Co., 8.50%, 10/15/12 (c) | 120,000 | 121,200 | ||||
| Graham Packaging Co., 9.88%, 10/15/14 | 220,000 | 220,550 | ||||
| Graphic Packaging International, 9.50%, 08/15/13 | 250,000 | 251,875 | ||||
| Huntsman Packaging Corp., 13.00%, 06/01/10 | 270,000 | 218,700 | ||||
| Owens-Illinois, Inc., 7.50%, 05/15/10 | 325,000 | 341,250 | ||||
| Sealed Air Corp., 5.63%, 07/15/13 (c) | 390,000 | 400,756 | ||||
| 1,554,331 | ||||||
| Paper & Forest Products (0.9%) | ||||||
| Abitibi-Consolidated, Inc., 8.55%, 08/01/10 | 455,000 | 474,337 | ||||
| Abitibi-Consolidated, Inc., 8.85%, 08/01/30 | 125,000 | 119,688 | ||||
| Bowater, Inc., 7.95%, 11/15/11 | 300,000 | 317,625 | ||||
| Georgia-Pacific Corp., 8.88%, 02/01/10 | 360,000 | 408,600 | ||||
10
Table of Contents
GARTMORE VARIABLE INSURANCE TRUST
VAN KAMPEN GVIT MULTI SECTOR BOND FUND
Statement of Investments — June 30, 2005 (Unaudited) (continued)
| Principal Amount | Value | |||||
| CORPORATE BONDS (continued) | ||||||
| Paper & Forest Products (continued) | ||||||
| Pindo Deli Financial Mauritius, 0.00%, 10/01/07 (b) (f) | $ | 1,520,000 | $ | 471,200 | ||
| Tjiwi Kimia Finance Mauritius, 0.00%, 08/01/05 (b) (f) | 395,000 | 158,000 | ||||
| Tjiwi Kimia International BV, 0.00%, 08/01/49 (b) (f) | 610,000 | 237,900 | ||||
| 2,187,350 | ||||||
| Pharmacy Services (0.2%) | ||||||
| Amerisourcebergen Corp., 8.13%, 09/01/08 | 520,000 | 564,200 | ||||
| Pipelines (0.7%) | ||||||
| Consolidated Natural Gas, 5.00%, 12/01/14 | 310,000 | 313,603 | ||||
| Dynegy Holdings, Inc., 9.88%, 07/15/10 (c) | 450,000 | 497,249 | ||||
| Pacific Energy Partners, 7.13%, 06/15/14 | 150,000 | 156,188 | ||||
| Panhandle Eastern Pipelines Series B, 2.75%, 03/15/07 | 85,000 | 82,782 | ||||
| Southern Natural Gas Co., 8.88%, 03/15/10 | 185,000 | 202,932 | ||||
| Texas Eastern Transmission, 7.00%, 07/15/32 (c) | 85,000 | 103,937 | ||||
| The Williams Cos., Inc., 7.88%, 09/01/21 | 255,000 | 290,063 | ||||
| 1,646,754 | ||||||
| Printing & Publishing (0.4%) | ||||||
| Dex Media East, LLC, 12.13%, 11/15/12 | 104,000 | 124,540 | ||||
| Dex Media West/Finance Series B, 9.88%, 08/15/13 | 75,000 | 85,500 | ||||
| Houghton Mifflin Co., 8.25%, 02/01/11 | 40,000 | 41,500 | ||||
| Houghton Mifflin Co., 9.88%, 02/01/13 | 170,000 | 181,475 | ||||
| Houghton Mifflin Co., 11.50%, 10/15/13 | 355,000 | 259,150 | ||||
| Primedia, Inc., 8.88%, 05/15/11 | 255,000 | 267,112 | ||||
| VNU NV, 6.63%, 05/30/07 | 100,000 | 130,386 | ||||
| 1,089,663 | ||||||
| Real Estate (0.4%) | ||||||
| Brascan Corp., 7.13%, 06/15/12 | 105,000 | 118,117 | ||||
| Principal Amount | Value | |||||
| CORPORATE BONDS (continued) | ||||||
| Real Estate (continued) | ||||||
| EOP Operating, LP, 4.75%, 03/15/14 | $ | 280,000 | $ | 274,513 | ||
| World Financial, 6.91%, 09/01/13 (c) | 593,025 | 642,562 | ||||
| 1,035,192 | ||||||
| Real Estate Investment Trust (0.1%) | ||||||
| Host Marriott LP, 6.38%, 03/15/15 (c) | 235,000 | 232,650 | ||||
| Reckson Operating Partnership, 5.15%, 01/15/11 | 110,000 | 111,625 | ||||
| 344,275 | ||||||
| Rental Auto & Equipment (0.1%) | ||||||
| Hertz Corp., 7.63%, 08/15/07 | 265,000 | 269,575 | ||||
| Retail (0.8%) | ||||||
| Brown Shoe Company, Inc., 8.75%, 05/01/12 (c) | 140,000 | 145,950 | ||||
| Delhaize America, Inc., 8.13%, 04/15/11 | 215,000 | 241,141 | ||||
| General Nutrition Center, 8.50%, 12/01/10 | 275,000 | 220,000 | ||||
| JC Penney Co., Inc., 7.40%, 04/01/37 | 195,000 | �� | 210,600 | |||
| Jean Coutu Group PJC, Inc., 7.63%, 08/01/12 | 60,000 | 61,950 | ||||
| Jean Coutu Group PJC, Inc., 8.50%, Callable 08/01/14 | 450,000 | 444,375 | ||||
| Rayovac Corp., 8.50%, 10/01/13 (c) | 310,000 | 323,950 | ||||
| Rayovac Corp., 7.38%, 02/01/15 | 170,000 | 164,475 | ||||
| Rite Aid Corp., 8.13%, 05/01/10 | 55,000 | 56,650 | ||||
| Safeway, Inc., 7.25%, 02/01/31 | 110,000 | 127,376 | ||||
| 1,996,467 | ||||||
| Seismic Data Collection (0.0%) | ||||||
| Cie Gener De Geophysique, 7.50%, 05/15/15 (c) | 40,000 | 41,700 | ||||
| Special Purpose Entity (0.7%) | ||||||
| Aries Vermogenswaltung, 9.60%, 10/25/14 | 500,000 | 647,300 | ||||
| CanWest Media, Inc., 8.00%, 09/15/12 | 400,000 | 421,000 | ||||
| Innophos Investments, 11.27%, 02/15/15 (c) | 135,000 | 124,200 | ||||
11
Table of Contents
GARTMORE VARIABLE INSURANCE TRUST
VAN KAMPEN GVIT MULTI SECTOR BOND FUND
Statement of Investments — June 30, 2005 (Unaudited) (continued)
| Principal Amount | Value | |||||
| CORPORATE BONDS (continued) | ||||||
| Special Purpose Entity (continued) | ||||||
| K&F Acquisition, Inc., 7.75%, 11/15/14 | $ | 370,000 | $ | 378,325 | ||
| Medcath Holdings Corp., 9.88%, 07/15/12 | 210,000 | 234,675 | ||||
| 1,805,500 | ||||||
| Steel Manufacturing & Products (0.1%) | ||||||
| United States Steel Corp., 9.75%, 05/15/10 | 147,000 | 158,760 | ||||
| Telecommunications (2.4%) | ||||||
| American Tower Corp., 7.50%, 05/01/12 | 275,000 | 293,563 | ||||
| American Tower Corp., 7.13%, 10/15/12 | 100,000 | 105,750 | ||||
| AT&T Corp., 6.50%, 11/21/06 | 100,000 | 128,296 | ||||
| AT&T Corp., 9.75%, 11/15/31 | 295,000 | 383,869 | ||||
| AT&T Wireless Services, Inc., 8.75%, 03/01/31 | 115,000 | 161,188 | ||||
| Axtel SA, 11.00%, 12/15/13 | 285,000 | 310,650 | ||||
| Corning, Inc., 6.25%, 02/18/10 (EUR) | 60,000 | 80,266 | ||||
| Deutsche Telekom, 8.75%, 06/15/30 | 40,000 | 54,159 | ||||
| Deutsche Telekom International Finance, 8.13%, 05/29/12 (EUR) | 160,000 | 251,083 | ||||
| France Telecom, 8.75%, 03/01/31 | 85,000 | 118,508 | ||||
| France Telecom SA, 8.13%, 01/28/33 | 90,000 | 168,123 | ||||
| Intelsat Bermuda Ltd., 7.79%, 01/15/12 (c) | 190,000 | 193,325 | ||||
| Nextlink Communications, Inc., 0.00%, 06/01/09 (f) (g) (i) | 350,000 | 0 | ||||
| Nextlink Communications, Inc., 0.00%, 06/01/09 (f) (g) (i) | 500,000 | 0 | ||||
| Nortel Networks Corp., 4.25%, 09/01/08 | 190,000 | 177,175 | ||||
| Nortel Networks Ltd., 6.13%, 02/15/06 | 215,000 | 216,344 | ||||
| Panamsat Corp., 9.00%, 08/15/14 | 146,000 | 159,323 | ||||
| Panamsat Holding Corp., 10.375% 11/01/14 (c) | 175,000 | 120,313 | ||||
| Qwest Communications International, 6.77%, 02/15/09 (c) | 475,000 | 466,687 | ||||
| Principal Amount | Value | |||||
| CORPORATE BONDS (continued) | ||||||
| Telecommunications (continued) | ||||||
| Qwest Corp., 5.63%, 11/15/08 | $ | 45,000 | $ | 44,213 | ||
| Qwest Services Corp., 13.50%, 12/15/10 | 350,000 | 404,249 | ||||
| Qwest Services Corp., 14.00%, 12/15/14 | 105,000 | 127,313 | ||||
| Rogers Wireless Inc., 7.50%, 03/15/15 | 165,000 | 179,438 | ||||
| Rural Cellular Corp., 7.91%, 03/15/10 | 450,000 | 463,499 | ||||
| Satelites Mexicanos SA de CV, 10.13%, 11/01/04 | 212,000 | 112,360 | ||||
| SBA Communications Corp., 8.50%, 12/01/12 | 175,000 | 188,563 | ||||
| SBA Telecommunications, 7.67%, 12/15/11 | 330,000 | 303,600 | ||||
| Sprint Capital Corp., 8.38%, 03/15/12 | 150,000 | 180,423 | ||||
| Sprint Capital Corp., 8.75%, 03/15/32 | 40,000 | 55,644 | ||||
| Telecom Italia Capital, 4.00%, 11/15/08 (c) | 110,000 | 108,339 | ||||
| Telecom Italia Capital, 4.00%, 01/15/10 | 195,000 | 189,476 | ||||
| Ubiquitel Operating Co., 9.88%, 03/01/11 (c) | 220,000 | 241,450 | ||||
| Verizon New England, 6.50%, 09/15/11 | 10,000 | 10,876 | ||||
| 5,998,065 | ||||||
| Textiles (0.1%) | ||||||
| Mohawk Industries, Inc., Series D, 7.20%, 04/15/12 | 125,000 | 142,866 | ||||
| Oxford Industries, Inc., 8.88%, 06/01/11 | 100,000 | 107,000 | ||||
| Tempur-Pedic, Inc., 10.25%, 08/15/10 | 71,000 | 78,100 | ||||
| 327,966 | ||||||
| Tobacco (0.1%) | ||||||
| Altria Group, Inc., 7.00%, 11/04/13 | 65,000 | 72,741 | ||||
| Altria Group, Inc., 7.75%, 01/15/27 | 125,000 | 150,105 | ||||
| 222,846 | ||||||
12
Table of Contents
GARTMORE VARIABLE INSURANCE TRUST
VAN KAMPEN GVIT MULTI SECTOR BOND FUND
Statement of Investments — June 30, 2005 (Unaudited) (continued)
| Principal Amount | Value | |||||
| CORPORATE BONDS (continued) | ||||||
| Transportation Services (0.6%) | ||||||
| Burlington North Santa Fe, 4.58%, 01/15/21 | $ | 110,000 | $ | 110,913 | ||
| CHC Helicopter Corp., 7.38%, 05/01/14 | 255,000 | 254,363 | ||||
| CHC Helicopter Corp., 7.38%, 05/01/14 (c) | 95,000 | 94,763 | ||||
| CSX Corp., 2.75%, 02/15/06 | 70,000 | 69,516 | ||||
| Fedex Corp, 2.65%, 04/01/07 | 110,000 | 107,134 | ||||
| Laidlaw International, Inc., 10.75%, 06/15/11 | 275,000 | 322,211 | ||||
| Norfolk Southern Corp., 7.35%, 05/15/07 | 115,000 | 121,382 | ||||
| Union Pacific Corp., 6.79%, 11/09/07 | 100,000 | 105,821 | ||||
| Union Pacific Corp., 6.63%, 02/01/08 | 180,000 | 190,201 | ||||
| Union Pacific Corp., 6.65%, 01/15/11 | 130,000 | 144,623 | ||||
| 1,520,927 | ||||||
| Utilities & Power Producers (2.1%) | ||||||
| AES Corp., 9.38%, 09/15/10 | 53,000 | 60,023 | ||||
| AES Corp., 7.75%, 03/01/14 (c) | 95,000 | 103,075 | ||||
| AES Corp., 9.00%, 05/15/15 (c) | 305,000 | 342,363 | ||||
| Allegheny Energy, Inc., 7.75%, 08/01/05 | 200,000 | 200,600 | ||||
| Arizona Public Service Co., 5.80%, 06/30/14 | 200,000 | 214,847 | ||||
| CC Funding Trust I, 6.90%, 02/16/07 | 160,000 | 166,654 | ||||
| Cincinnati Gas & Electric Co., 5.70%, 09/15/12 | 65,000 | 69,479 | ||||
| CMS Energy Corp., 7.50%, 01/15/09 | 150,000 | 157,875 | ||||
| CMS Energy Corp., 8.50%, 04/15/11 | 455,000 | 507,325 | ||||
| Detroit Edison Co., 6.13%, 10/01/10 | 85,000 | 91,735 | ||||
| Detroit Edison Co., 4.80%, 02/15/15 | 125,000 | 125,721 | ||||
| Entergy Gulf States, 3.60%, 06/01/08 | 65,000 | 63,631 | ||||
| Entergy Gulf States, 3.73%, 12/01/09 | 105,000 | 105,221 | ||||
| Exelon Corp., 6.75%, 05/01/11 | 210,000 | 233,212 | ||||
| Principal Amount | Value | |||||
| CORPORATE BONDS (continued) | ||||||
| Utilities & Power Producers (continued) | ||||||
| Foundation PA Coal Co., 7.25%, 08/01/14 | $ | 50,000 | $ | 52,500 | ||
| Monongahela Power Co., 5.00%, 10/01/06 | 170,000 | 171,376 | ||||
| MSW Energy Holdings, 7.38%, 09/01/10 | 185,000 | 189,625 | ||||
| MSW Energy Holdings, 8.50%, 09/01/10 | 45,000 | 47,588 | ||||
| National Grid Transco, PLC, 5.00%, 07/02/18 | 110,000 | 145,840 | ||||
| Nevada Power Co., 9.00%, 08/15/13 | 415,000 | 466,875 | ||||
| NiSource Finance Corp., 7.63%, 11/15/05 | 155,000 | 157,033 | ||||
| Nisource Finance Corp., 3.85%, 11/23/09 | 120,000 | 120,445 | ||||
| Pacific Gas & Electric, 6.05%, 03/01/34 | 160,000 | 176,334 | ||||
| PSEG Energy Holdings, 7.75%, 04/16/07 | 220,000 | 227,150 | ||||
| Reliant Energy, Inc., 6.75%, 12/15/14 | 265,000 | 259,038 | ||||
| RWE Finance BV, 5.50%, 10/26/07 | 9,000 | 11,669 | ||||
| TNP Enterprises, Inc., 10.25%, 04/01/10 | 370,000 | 389,610 | ||||
| TXU Corp., 4.81%, 11/15/14 | 300,000 | 304,830 | ||||
| TXU Corp. Series J, 6.38%, 06/15/06 | 65,000 | 66,100 | ||||
| Wisconsin Electric Power Co., 3.50%, 12/01/07 | 110,000 | 108,291 | ||||
| 5,336,065 | ||||||
| Total Corporate Bonds | 96,419,323 | |||||
| U.S. TREASURY OBLIGATIONS (35.9%) | ||||||
| U.S. Treasury Bonds (0.7%) | ||||||
| 6.38%, 08/15/27 | 1,300,000 | 1,685,480 | ||||
| U.S. Treasury Notes (35.2%) | ||||||
| 3.50%, 11/15/06 | 15,200,000 | 15,182,778 | ||||
| 3.13%, 05/15/07 | 10,000,000 | 9,905,470 | ||||
| 3.88%, 02/15/13 | 6,375,000 | 6,382,720 | ||||
| 4.25%, 08/15/13 | 34,825,000 | 35,695,625 | ||||
| 8.13%, 08/15/19 | 3,625,000 | 5,136,737 | ||||
13
Table of Contents
GARTMORE VARIABLE INSURANCE TRUST
VAN KAMPEN GVIT MULTI SECTOR BOND FUND
Statement of Investments — June 30, 2005 (Unaudited) (continued)
| Principal Amount | Value | |||||
| U.S. TREASURY OBLIGATIONS (continued) | ||||||
| U.S. Treasury Notes (continued) | ||||||
| 0.00%, 02/15/25 | $ | 7,000,000 | $ | 2,985,633 | ||
| 7.63%, 02/15/25 | 500,000 | 720,352 | ||||
| 6.13%, 08/15/29 | 10,350,000 | 13,215,253 | ||||
| 89,224,568 | ||||||
| Total U.S. Treasury Obligations | 90,910,048 | |||||
| SOVEREIGN BONDS (13.5%) | ||||||
| Argentina (0.2%) | ||||||
| Republic of Argentina, 0.00%, 04/10/05 (b) | 390,000 | 113,100 | ||||
| Republic of Argentina, 11.38%, 04/07/09 (b) | 695,000 | 201,550 | ||||
| Republic of Argentina, 11.38%, 03/15/10 (b) | 140,000 | 40,600 | ||||
| Republic of Argentina, 11.75%, 06/15/15 (b) | 50,000 | 14,750 | ||||
| Republic of Argentina, 11.38%, 01/30/17 (b) | 95,000 | 27,550 | ||||
| Republic of Argentina, 12.00%, 02/01/20 (b) | 20,000 | 5,800 | ||||
| Republic Of Argentina, 8.28%, 12/31/33 (b) | 106,605 | 98,077 | ||||
| Republic of Argentina, 12.13%, 05/21/05 (b) | 220,000 | 78,100 | ||||
| 579,527 | ||||||
| Brazil (1.7%) | ||||||
| Federal Republic of Brazil, 14.50%, 10/15/09 | 520,000 | 676,000 | ||||
| Federal Republic of Brazil, 10.50%, 07/14/14 | 570,000 | 674,025 | ||||
| Federal Republic of Brazil, 8.88%, 10/14/19 | 956,000 | 1,013,360 | ||||
| Federal Republic of Brazil, 4.25%, 04/15/24 | 450,000 | 424,710 | ||||
| Federal Republic of Brazil, 6.00%, 04/15/24 | 200,000 | 192,440 | ||||
| Federal Republic of Brazil, 8.88%, 04/15/24 (e) | 470,000 | 487,860 | ||||
| Federal Republic of Brazil, 11.00%, 08/17/40 | 70,000 | 84,210 | ||||
| Federal Republic of Brazil C-Bond, 8.00%, 04/15/14 | 749,398 | 767,608 | ||||
| 4,320,213 | ||||||
| Principal Amount | Value | |||||
| SOVEREIGN BONDS (continued) | ||||||
| Bulgaria (0.2%) | ||||||
| Republic of Bulgaria, 8.25%, 01/15/15 (c) | $ | 210,000 | $ | 264,411 | ||
| Republic of Bulgaria, 8.25%, 01/15/15 | 99,000 | 124,369 | ||||
| 388,780 | ||||||
| Canada (0.2%) | ||||||
| Canadian Government, 5.25%, 06/01/12 (CAD) | 700,000 | 627,937 | ||||
| Columbia (0.1%) | ||||||
| Republic of Columbia, 9.75%, 04/09/11 | 148,822 | 169,954 | ||||
| Republic of Columbia, 11.75%, 02/25/20 | 90,000 | 118,350 | ||||
| Republic of Columbia, 10.38%, 01/28/33 | 70,000 | 83,475 | ||||
| 371,779 | ||||||
| Germany (2.5%) | ||||||
| Bundes Republic of Deutschland, 5.63%, 01/04/28 | 3,820,000 | 6,025,589 | ||||
| Italy (0.1%) | ||||||
| Buoni Poliennali Del Tesson, 5.25%, 11/01/29 (EUR) | 120,000 | 176,158 | ||||
| Ivory Coast (0.0%) | ||||||
| Ivory Coast, 0.00%, 03/29/18 (b) | 285,000 | 52,725 | ||||
| Japan (0.2%) | ||||||
| Japanese Government, 0.80%, 03/20/13 (JPY) | 50,000,000 | 450,089 | ||||
| Malaysia (0.4%) | ||||||
| Malaysia, 8.75%, 06/01/09 | 690,000 | 799,947 | ||||
| Malaysia, 7.50%, 07/15/11 | 150,000 | 173,656 | ||||
| 973,603 | ||||||
| Mexico (1.3%) | ||||||
| United Mexican States, 10.38%, 02/17/09 | 520,000 | 620,360 | ||||
| United Mexican States, 8.38%, 01/14/11 | 1,130,000 | 1,315,320 | ||||
| United Mexican States, 8.13%, 12/30/19 | 610,000 | 748,775 | ||||
| United Mexican States, 11.50%, 05/15/26 | 238,000 | 381,990 | ||||
14
Table of Contents
GARTMORE VARIABLE INSURANCE TRUST
VAN KAMPEN GVIT MULTI SECTOR BOND FUND
Statement of Investments — June 30, 2005 (Unaudited) (continued)
| Principal Amount | Value | |||||
| SOVEREIGN BONDS (continued) | ||||||
| Mexico (continued) | ||||||
| United Mexican States, 8.30%, 08/15/31 | $ | 240,000 | $ | 298,800 | ||
| 3,365,245 | ||||||
| Nigeria (0.2%) | ||||||
| Central Bank Of Nigeria, 6.25%, 11/15/20 | 500,000 | 492,500 | ||||
| Panama (0.3%) | ||||||
| Republic of Panama, 9.63%, 02/08/11 | 150,000 | 177,750 | ||||
| Republic of Panama, 10.75%, 05/15/20 | 90,000 | 121,950 | ||||
| Republic of Panama, 8.88%, 09/30/27 | 300,000 | 357,750 | ||||
| Republic of Panama, 9.38%, 04/01/29 | 140,000 | 173,250 | ||||
| 830,700 | ||||||
| Peru (0.2%) | ||||||
| Republic of Peru, 9.88%, 02/06/15 | 335,000 | 414,563 | ||||
| Republic of Peru, 8.38%, 05/03/16 | 180,000 | 202,050 | ||||
| 616,613 | ||||||
| Philippines (0.8%) | ||||||
| Republic of Philippines, 8.88%, 03/17/15 | 1,220,000 | 1,271,850 | ||||
| Republic of Philippines, 10.63%, 03/16/25 | 220,000 | 246,125 | ||||
| Republic of Philippines, 9.50%, 02/02/30 | 390,000 | 397,995 | ||||
| 1,915,970 | ||||||
| Qatar (0.1%) | ||||||
| State of Qatar, 9.75%, 06/15/30 | 170,000 | 264,384 | ||||
| Russia (1.4%) | ||||||
| Russian Federation, 8.25%, 03/31/10 | 390,000 | 425,451 | ||||
| Russian Federation, 11.00%, 07/24/18 | 621,000 | 926,346 | ||||
| Russian Federation, 12.75%, 06/24/28 | 910,000 | 1,645,825 | ||||
| Russian Federation, 5.00%, 03/31/30 | 451,948 | 504,555 | ||||
| 3,502,177 | ||||||
| Principal Amount | Value | |||||
| SOVEREIGN BONDS (continued) | ||||||
| Spain (1.4%) | ||||||
| Bonos Y Oblig Del Estado, 5.15%, 07/30/09 (EUR) | $ | 2,250,000 | $ | 3,012,929 | ||
| Bonos Y Oblig Del Estado, 6.15%, 01/31/13 (EUR) | 330,000 | 487,322 | ||||
| 3,500,251 | ||||||
| Sweden (0.2%) | ||||||
| Swedish Government, 5.00%, 01/28/09 (SEK) | 4,500,000 | 632,271 | ||||
| Tunisia (0.0%) | ||||||
| Banque Cent De Tunisie, 7.38%, 04/25/12 | 110,000 | 126,500 | ||||
| Turkey (0.7%) | ||||||
| Republic of Turkey, 0.00%, 02/23/06 (c) | 19,000 | 26,537 | ||||
| Republic of Turkey, 0.00%, 02/23/06 (c) | 280,000 | 404,964 | ||||
| Republic of Turkey, 0.00%, 02/23/06 (c) | 300,000 | 409,620 | ||||
| Republic of Turkey, 11.50%, 01/23/12 | 550,000 | 702,625 | ||||
| Republic of Turkey, 11.00%, 01/14/13 | 120,000 | 151,500 | ||||
| 1,695,246 | ||||||
| United Kingdom (0.9%) | ||||||
| United Kingdom Treasury, 8.50%, 12/07/05 (BPS) | 1,250,000 | 2,280,413 | ||||
| Venezuela (0.4%) | ||||||
| Republic of Venezuela, 10.75%, 09/19/13 | 240,000 | 280,920 | ||||
| Republic of Venezuela, 8.50%, 10/08/14 | 270,000 | 280,395 | ||||
| Republic of Venezuela, 9.38%, 01/13/34 | 340,000 | 356,150 | ||||
| 917,465 | ||||||
| Total Sovereign Bonds | 34,106,135 | |||||
| U.S. GOVERNMENT AGENCIES (5.8%) | ||||||
| Federal Home Loan Mortgage Corporation (1.5%) | ||||||
| 5.13%, 11/07/13 | 990,000 | 993,770 | ||||
| 5.50%, 07/01/18 TBA | 2,700,000 | 2,770,032 | ||||
| IOETTE, Series 1103, Class N, 1156.50%, 06/15/21 | 20 | 40 | ||||
| 3,763,842 | ||||||
15
Table of Contents
GARTMORE VARIABLE INSURANCE TRUST
VAN KAMPEN GVIT MULTI SECTOR BOND FUND
Statement of Investments — June 30, 2005 (Unaudited) (continued)
| Principal Amount | Value | |||||
| U.S. GOVERNMENT AGENCIES (continued) | ||||||
| Federal National Mortgage Association (4.3%) | ||||||
| 4.50%, 07/01/18 TBA (d) | $ | 2,150,000 | $ | 2,139,921 | ||
| 5.00%, 07/01/18 TBA (d) | 3,200,000 | 3,235,002 | ||||
| 6.00%, 07/01/32 TBA (d) | 5,350,000 | 5,483,750 | ||||
| 10,858,673 | ||||||
| Total U.S. Government Agencies | 14,622,515 | |||||
| MORTGAGE BACKED OBLIGATIONS (4.2%) | ||||||
| Federal Home Loan Mortgage Corporation (0.7%) | ||||||
| Gold, Pool # C00712, 6.50%, 02/01/29 | 48,923 | 50,834 | ||||
| Gold, Pool # C01104, 8.00%, 12/01/30 | 68,128 | 73,365 | ||||
| Gold, Pool # C01132, 8.00%, 01/01/31 | 65,137 | 70,143 | ||||
| Gold, Pool # C01150, 8.00%, 02/01/31 | 49,007 | 52,774 | ||||
| Gold, Pool # C29808, 8.00%, 08/01/29 | 36,468 | 39,292 | ||||
| Gold, Pool # C37329, 8.00%, 03/01/30 | 3,319 | 3,574 | ||||
| Gold, Pool # C39060, 8.00%, 06/01/30 | 4,321 | 4,653 | ||||
| Gold, Pool # C41333, 7.50%, 08/01/30 | 32,376 | 34,667 | ||||
| Gold, Pool # C41531, 8.00%, 08/01/30 | 22,035 | 23,729 | ||||
| Gold, Pool # C42327, 8.00%, 09/01/30 | 2,560 | 2,757 | ||||
| Gold, Pool # C44964, 7.50%, 11/01/30 | 73,900 | 79,129 | ||||
| Gold, Pool # C46763, 8.00%, 01/01/31 | 4,802 | 5,174 | ||||
| Gold, Pool # C46946, 8.00%, 01/01/31 | 19,252 | 20,732 | ||||
| Gold, Pool # C48997, 8.00%, 03/01/31 | 128,814 | 138,715 | ||||
| Gold, Pool # C49587, 8.00%, 03/01/31 | 96,454 | 103,869 | ||||
| Gold, Pool # C50477, 8.00%, 04/01/31 | 43,982 | 47,363 | ||||
| Gold, Pool # C53381, 8.00%, 06/01/31 | 6,559 | 7,063 | ||||
| Gold, Pool # C53597, 8.00%, 06/01/31 | 155,860 | 167,842 | ||||
| Principal Amount | Value | |||||
| MORTGAGE BACKED OBLIGATIONS (continued) | ||||||
| Federal Home Loan Mortgage Corporation (continued) | ||||||
| Gold, Pool # C53657, 8.00%, 06/01/31 | $ | 50,492 | $ | 54,374 | ||
| Gold, Pool # C60019, 7.50%, 11/01/31 | 14,559 | 15,589 | ||||
| Gold, Pool # C67851, 7.50%, 06/01/32 | 244,124 | 261,399 | ||||
| Gold, Pool # C69951, 6.50%, 08/01/32 | 156,633 | 162,394 | ||||
| Gold, Pool # C90381, 7.50%, 11/01/20 | 2,343 | 2,510 | ||||
| Pool # 170271, 12.00%, 08/01/15 | 408,156 | 451,055 | ||||
| 1,872,996 | ||||||
| Federal National Mortgage Association (2.8%) | ||||||
| Pool # 251752, 6.50%, 06/01/28 | 198,760 | 206,405 | ||||
| Pool # 252009, 6.50%, 07/01/28 | 463,379 | 481,202 | ||||
| Pool # 253113, 7.50%, 03/01/30 | 34,307 | 36,682 | ||||
| Pool # 253673, 7.50%, 03/01/31 | 52,978 | 56,609 | ||||
| Pool # 253674, 8.00%, 03/01/31 | 3,924 | 4,220 | ||||
| Pool # 254695, 6.50%, 04/01/33 | 494,921 | 512,515 | ||||
| Pool # 323591, 6.50%, 03/01/29 | 331,476 | 344,225 | ||||
| Pool # 346286, 6.50%, 05/01/26 | 108,950 | 113,175 | ||||
| Pool # 370191, 6.50%, 01/01/27 | 6,295 | 6,539 | ||||
| Pool # 415967, 6.50%, 10/01/28 | 189,898 | 197,202 | ||||
| Pool # 457953, 6.50%, 01/01/29 | 160,954 | 167,145 | ||||
| Pool # 482616, 6.50%, 02/01/29 | 302,234 | 313,876 | ||||
| Pool # 50946, 6.50%, 12/01/23 | 36,955 | 38,464 | ||||
| Pool # 511954, 7.50%, 10/01/29 | 31,932 | 34,139 | ||||
| Pool # 515828, 8.00%, 10/01/29 | 42,220 | 45,430 | ||||
16
Table of Contents
GARTMORE VARIABLE INSURANCE TRUST
VAN KAMPEN GVIT MULTI SECTOR BOND FUND
Statement of Investments — June 30, 2005 (Unaudited) (continued)
| Principal Amount | Value | |||||
| MORTGAGE BACKED OBLIGATIONS (continued) | ||||||
| Federal National Mortgage Association (continued) | ||||||
| Pool # 517874, 7.50%, 02/01/30 | $ | 55,211 | $ | 58,995 | ||
| Pool # 519145, 7.50%, 10/01/29 | 33,914 | 36,257 | ||||
| Pool # 523284, 7.50%, 11/01/29 | 9,130 | 9,760 | ||||
| Pool # 527589, 7.50%, 01/01/30 | 13,930 | 14,893 | ||||
| Pool # 535399, 8.00%, 07/01/30 | 54,899 | 59,044 | ||||
| Pool # 535533, 8.00%, 10/01/30 | 207,277 | 222,927 | ||||
| Pool # 540017, 8.00%, 05/01/30 | 6,184 | 6,650 | ||||
| Pool # 540091, 7.50%, 06/01/30 | 27,791 | 29,696 | ||||
| Pool # 545239, 8.00%, 09/01/31 | 81,654 | 87,819 | ||||
| Pool # 545551, 8.00%, 04/01/32 | 48,233 | 51,875 | ||||
| Pool # 545604, 8.00%, 09/01/31 | 28,795 | 30,984 | ||||
| Pool # 545759, 6.50%, 07/01/32 | 309,199 | 320,529 | ||||
| Pool # 545762, 6.50%, 07/01/32 | 1,407,018 | 1,458,574 | ||||
| Pool # 555533, 6.50%, 04/01/33 | 147,573 | 153,076 | ||||
| Pool # 555571, 6.50%, 03/01/33 | 268,713 | 278,559 | ||||
| Pool # 564363, 8.00%, 01/01/31 | 6,342 | 6,821 | ||||
| Pool # 564993, 7.50%, 03/01/31 | 43,243 | 46,207 | ||||
| Pool # 576112, 7.00%, 05/01/31 | 5,988 | 6,316 | ||||
| Pool # 577304, 7.50%, 04/01/31 | 20,058 | 21,432 | ||||
| Pool # 577407, 7.50%, 07/01/31 | 67,322 | 71,935 | ||||
| Pool # 606566, 7.50%, 10/01/31 | 74,502 | 79,607 | ||||
| Pool # 613017, 8.00%, 03/01/31 | 3,823 | 4,113 | ||||
| Principal Amount | Value | |||||
| MORTGAGE BACKED OBLIGATIONS (continued) | ||||||
| Federal National Mortgage Association (continued) | ||||||
| Pool # 630601, 7.00%, 05/01/32 | $ | 309,616 | $ | 326,597 | ||
| Pool # 642656, 7.00%, 07/01/32 | 151,985 | 160,321 | ||||
| Pool # 656557, 6.50%, 01/01/33 | 34,017 | 35,263 | ||||
| Pool # 666097, 7.00%, 10/01/32 | 190,709 | 201,168 | ||||
| Pool # 667591, 6.50%, 10/01/32 | 445,203 | 461,516 | ||||
| Pool # 741875, 6.50%, 09/01/33 | 47,805 | 49,504 | ||||
| Pool # 766095, 6.50%, 02/01/34 | 260,571 | 269,834 | ||||
| 7,118,100 | ||||||
| Government National Mortgage Association (0.7%) | ||||||
| Pool # 780141, 10.00%, 12/15/20 | 269,545 | 304,885 | ||||
| Pool # 780349, 10.00%, 09/15/21 | 329,671 | 372,485 | ||||
| Pool # 780378, 11.00%, 01/15/19 | 324,208 | 359,880 | ||||
| Pool # 780699, 9.50%, 12/15/17 | 296,886 | 327,523 | ||||
| Pool # 780709, 11.00%, 01/15/21 | 349,217 | 387,306 | ||||
| 1,752,079 | ||||||
| Total Mortgage-Backed Obligations | 10,743,175 | |||||
| INTEREST ONLY BONDS (0.5%) | ||||||
| Federal Home Loan Mortgage Corporation (0.2%) | ||||||
| 3.75%, 06/17/27 | 2,718,781 | 168,502 | ||||
| 6.00%, 04/15/32 | 1,713,026 | 193,625 | ||||
| 7.00%, 07/15/33 | 748,483 | 123,896 | ||||
| 486,023 | ||||||
| Federal National Mortgage Association (0.3%) | ||||||
| 5.50%, 05/25/27 | 1,461,301 | 93,130 | ||||
| 6.00%, 08/25/32 | 617,904 | 62,915 | ||||
| 6.00%, 05/25/33 | 670,293 | 107,379 | ||||
| 6.50%, 05/25/33 | 633,219 | 111,339 | ||||
| 6.50%, 05/25/33 | 1,560,596 | 256,711 | ||||
| 6.00%, 06/25/33 | 675,796 | 106,552 | ||||
| 6.50%, 06/25/33 | 631,971 | 111,763 | ||||
| 849,789 | ||||||
| Total Interest Only Bonds | 1,335,812 | |||||
17
Table of Contents
GARTMORE VARIABLE INSURANCE TRUST
VAN KAMPEN GVIT MULTI SECTOR BOND FUND
Statement of Investments — June 30, 2005 (Unaudited) (continued)
| Principal Amount | Value | |||||
| WARRANTS (0.0%) | ||||||
| Foreign Government (0.0%) | ||||||
| Republic of Venezuela, 04/15/20 | $ | 1,150 | $ | 0 | ||
| Total Warrants | 0 | |||||
| CASH EQUIVALENTS (8.1%) | ||||||
| Cash Sweep (1.0%) | ||||||
| Investments in repurchase agreements (collateralized by AA Corporate Bonds in a joint trading account at 3.49%, dated 06/30/05, due 07/01/05, repurchase price $2,528,173) | 2,527,928 | 2,527,928 | ||||
| Federal Home Loan Bank Discount Notes (2.8%) | ||||||
| 0.00%, 08/12/05 | 7,000,000 | 6,973,379 | ||||
| Federal Home Loan Mortgage Discount Notes (2.9%) | ||||||
| 0.00%, 07/12/05 | 7,500,000 | 7,492,687 | ||||
| US Treasury Bills (0.3%) | ||||||
| 0.00%, 07/14/05 | 700,000 | 699,282 | ||||
| US Treasury Notes (1.1%) | ||||||
| 0.00%, 02/15/27 | 7,000,000 | 2,743,069 | ||||
| Total Cash Equivalents | 20,436,345 | |||||
| Principal Amount | Value | ||||||
| SHORT-TERM SECURITIES HELD AS COLLATERAL FOR SECURITIES LENDING (4.6%) | |||||||
| Pool of short-term securities for Gartmore Variable Trust Funds — note 2 (Securities Lending) | $ | 11,753,471 | $ | 11,753,471 | |||
| Total Short-Term Securities Held as Collateral for Securities Lending | 11,753,471 | ||||||
| Total Investments (Cost $269,301,515) (a) — 110.6% | 280,326,824 | ||||||
| Liabilities in excess of other assets — (10.6%) | (26,986,182 | ) | |||||
| NET ASSETS — 100.0% | $ | 253,340,642 | |||||
| (a) | See notes to financial statements for unrealized appreciation (depreciation) of securities. |
| (b) | Denotes a non-income producing security. |
| (c) | Represents a restricted security acquired and eligible for resale under Rule 144A, which limits the resale to certain qualified buyers. |
| (d) | Mortgage Dollar Rolls. |
| (e) | Variable Rate security. The rate reflected in the Statement of Investments is the rate reflected in effect on June 30, 2005. |
| (f) | Security in default. |
| (g) | Fair Valued Security. |
| (h) | Security has filed for bankruptcy protection. |
| (i) | Security has been deemed illiquid. The pricing committee has deemed the security to have zero value based upon procedures adopted by the Board of Trustees. |
| (AUD) | Principal amount denominated in Australian Dollar. |
| (BPS) | Principal amount denominated in British Pound. |
| (CAD) | Principal amount denominated in Canadian Dollar. |
| (EUR) | Principal amount denominated in Euro. |
| (JPY) | Principal amount denominated in Japanese Yen. |
| (SEK) | Principal amount denominated in Swedish Krone. |
| C-Bond | Capitalization Bond. |
| TBA | To Be Announced |
18
Table of Contents
GARTMORE VARIABLE INSURANCE TRUST
VAN KAMPEN GVIT MULTI SECTOR BOND FUND
Statement of Investments — June 30, 2005 (Unaudited) (continued)
At June 30, 2005, the Fund’s open forward foreign currency contracts were as follows:
| Currency | Delivery Date | Contract Value | Market Value | Unrealized Appreciation/ (Depreciation) | ||||||||||
| Short Contract: | ||||||||||||||
Australian Dollar | 08/23/05 | $ | (527,765 | ) | $ | (530,939 | ) | $ | (3,174 | ) | ||||
British Pound | 09/23/05 | (744,560 | ) | (732,994 | ) | 11,566 | ||||||||
Euro | 07/26/05 | (5,360,160 | ) | (4,957,097 | ) | 403,063 | ||||||||
Swedish Krone | 09/21/05 | (399,734 | ) | (385,912 | ) | 13,822 | ||||||||
| Total Short Contracts | $ | (7,032,219 | ) | $ | (6,606,942 | ) | $ | 425,277 | ||||||
| Long Contracts: | ||||||||||||||
Euro | 07/26/05 | $ | 614,722 | $ | 581,663 | $ | (36,058 | ) | ||||||
Japanese Yen | 08/10/05 | 12,777,585 | 12,024,476 | (753,110 | ) | |||||||||
Japanese Yen | 08/10/05 | 6,830,667 | 6,428,748 | (401,919 | ) | |||||||||
Japanese Yen | 08/10/05 | 746,965 | 724,366 | (22,599 | ) | |||||||||
| Total Long Contracts | $ | 20,969,939 | $ | 19,759,253 | $ | (1,210,686 | ) | |||||||
At June 30, 2005, the Fund’s open futures contracts were as follows:
| Number of Contracts | Contracts | Expiration | Market Value Covered by Contracts | Appreciation (Depreciation) | ||||||
| Long Contracts: | ||||||||||
77 | U.S. 10 yr Note Future | 08/23/2005 | $ | 8,737,094 | $ | 103,163 | ||||
2 | JGB 10 yr Bond Future | 08/23/2005 | 282,400,000 | 1,554,000 | ||||||
| Total Long Contracts | $ | 291,137,094 | $ | 1,657,163 | ||||||
| Number of Contracts | Contracts | Expiration | Market Value Covered by Contracts | Appreciation (Depreciation) | ||||||||
| Short Contracts: | ||||||||||||
505 | U.S. 5 yr Note Future | 08/23/2005 | $ | (54,989,766 | ) | $ | (84,047 | ) | ||||
390 | U.S. 2 yr Note Future | 08/23/2005 | (80,998,125 | ) | 51,118 | |||||||
97 | U.S. Bond Futures | 08/23/2005 | (11,518,750 | ) | (190,916 | ) | ||||||
12 | Euro Bond Future | 08/23/2005 | (1,482,000 | ) | (135,285 | ) | ||||||
| Total Short Contracts | $ | (148,988,641 | ) | $ | (359,130 | ) | ||||||
See notes to financial statements.
19
Table of Contents
GARTMORE VARIABLE INSURANCE TRUST
VAN KAMPEN GVIT MULTI SECTOR BOND FUND
Statement of Assets and Liabilities
June 30, 2005 (Unaudited)
Assets: | ||||
Investments, at value (cost $266,773,587) | $ | 277,798,896 | ||
Repurchase agreements, at cost and value | 2,527,928 | |||
Total Investments | 280,326,824 | |||
Cash | 434,750 | |||
Interest and dividends receivable | 3,145,218 | |||
Receivable for investments sold | 388,006 | |||
Receivable for variation margin on futures contracts | 136,372 | |||
Unrealized appreciation on forward foreign currency contracts | 428,452 | |||
Reclaims receivable | 8,261 | |||
Prepaid expenses and other assets | 7,438 | |||
Total Assets | 284,875,321 | |||
Liabilities: | ||||
Securities sold short, at value (proceeds $94,473) | 93,632 | |||
Payable to custodian | 397,313 | |||
Payable for investments purchased | 17,729,609 | |||
Unrealized depreciation on forward foreign currency contracts | 1,216,860 | |||
Payable for variation margin on futures contracts | 143,183 | |||
Payable for return of collateral received for securities on loan | 11,753,471 | |||
Accrued expenses and other payables: | ||||
Investment advisory fees | 153,332 | |||
Fund administration and transfer agent fees | 15,044 | |||
Administrative servicing fees | 29,178 | |||
Other | 3,057 | |||
Total Liabilities | 31,534,679 | |||
Net Assets | $ | 253,340,642 | ||
Represented by: | ||||
Capital | $ | 243,324,526 | ||
Accumulated net investment income (loss) | 123,509 | |||
Accumulated net realized gain (losses) from investment, futures and foreign currency transactions | (28,086 | ) | ||
Net unrealized appreciation (depreciation) on investments, futures and translation of assets and liabilities denominated in foreign currencies | 9,920,693 | |||
Net Assets | $ | 253,340,642 | ||
Net Assets: | ||||
Class I Shares | $ | 253,340,642 | ||
Shares outstanding (unlimited number of shares authorized): | ||||
Class I Shares | 25,612,583 | |||
Net asset value and offering price per share:* | ||||
Class I Shares | $ | 9.89 |
| * | Not subject to a front-end sales charge. |
For the Six Months Ended June 30, 2005 (Unaudited)
Investment Income: | ||||
Interest income | $ | 6,387,677 | ||
Income from securities lending | 62,943 | |||
Total Income | 6,450,620 | |||
Expenses: | ||||
Investment advisory fees | 909,159 | |||
Fund administration and transfer agent fees | 111,239 | |||
Administrative servicing fees Class I Shares | 182,924 | |||
Other** | 45,767 | |||
Total Expenses | 1,249,089 | |||
Net Investment Income (Loss) | 5,201,531 | |||
REALIZED/UNREALIZED GAINS (LOSSES) ON INVESTMENTS: | ||||
Net realized gains (losses) on investment transactions | 1,773,824 | |||
Net realized gains (losses) on futures | (358,504 | ) | ||
Net realized gains (losses) on foreign currency transactions | (91,757 | ) | ||
Net realized gains (losses) on investment, futures, and foreign currency transactions | 1,323,563 | |||
Net change in unrealized appreciation/depreciation on investments, futures and translation of assets and liabilities denominated in foreign currencies | (3,403,020 | ) | ||
Net realized/unrealized gains (losses) on investments, futures and foreign currencies | (2,079,457 | ) | ||
CHANGE IN NET ASSETS RESULTING FROM OPERATIONS | $ | 3,122,074 | ||
| ** | Other expenses may include the following fees: audit, custody, insurance, legal, printing, trustee, and out-of-pocket expenses. |
See notes to financial statements.
20
Table of Contents
GARTMORE VARIABLE INSURANCE TRUST
VAN KAMPEN GVIT MULTI SECTOR BOND FUND
Statement of Changes in Net Assets
Six Months Ended June 30, 2005 | Year Ended December 31, 2004 | |||||||
| (Unaudited) | ||||||||
From Investment Activities: | ||||||||
Operations: | ||||||||
Net investment income (loss) | $ | 5,201,531 | $ | 9,828,371 | ||||
Net realized gains (losses) on investment, futures and foreign currency transactions | 1,323,563 | 4,661,687 | ||||||
Net change in unrealized appreciation/depreciation on investments, futures and translation of assets and liabilities denomintated in foreign currencies | (3,403,020 | ) | 197,528 | |||||
Change in net assets resulting from operations | 3,122,074 | 14,687,586 | ||||||
Distributions to Class I shareholders from: | ||||||||
Net investment income | (5,863,355 | ) | (11,466,227 | ) | ||||
Change in net assets from shareholder distributions | (5,863,355 | ) | (11,466,227 | ) | ||||
Change in net assets from capital transactions | 17,579,471 | 8,756,344 | ||||||
Change in net assets | 14,838,190 | 11,977,703 | ||||||
Net Assets: | ||||||||
Beginning of period | 238,502,452 | 226,524,749 | ||||||
End of period | $ | 253,340,642 | $ | 238,502,452 | ||||
CAPITAL TRANSACTIONS: | ||||||||
Class I Capital Transactions: | ||||||||
Proceeds from shares issued | $ | 29,889,029 | $ | 41,465,680 | ||||
Dividends reinvested | 5,863,367 | 11,466,245 | ||||||
Cost of shares redeemed | (18,172,925 | ) | (44,175,581 | ) | ||||
| 17,579,471 | 8,756,344 | |||||||
SHARE TRANSACTIONS: | ||||||||
Class I Share Transactions: | ||||||||
Issued | 3,001,131 | 4,199,606 | ||||||
Reinvested | 598,217 | 1,165,350 | ||||||
Redeemed | (1,830,252 | ) | (4,497,742 | ) | ||||
| 1,769,096 | 867,214 | |||||||
See notes to financial statements.
21
Table of Contents
GARTMORE VARIABLE INSURANCE TRUST
Selected Data for Each Share of Capital Outstanding
Van Kampen GVIT Multi Sector Bond Fund
| Investment Activities | Distributions | Ratios/Supplemental Data | |||||||||||||||||||||||||||||||||||||
| Net Asset Value, Beginning of Period | Net Investment Income | Net Realized and Unrealized Gains (Losses) on Investments | Total from Investment Activities | Net Investment Income | Total Distributions | Net Asset Value, End of Period | Total Return | Net Assets at End of Period (000s) | Ratio of Expenses to Average Net Assets | Ratio of Net Investment Income to Average Net Assets | Ratio of Expenses (Prior to Reimbursements) to Average Net Assets(a) | Ratio of Net Investment Income (Prior to Reimbursements) to Average Net Assets(a) | Portfolio Turnover | ||||||||||||||||||||||||||
Class I Shares | |||||||||||||||||||||||||||||||||||||||
Year Ended December 31, 2000 | $ | 9.37 | 0.61 | (0.10 | ) | 0.51 | (0.60 | ) | (0.60 | ) | $ | 9.28 | 5.65% | $ | 132,227 | 0.90% | 7.07% | 1.09% | 6.88% | 399.03% | |||||||||||||||||||
Year Ended December 31, 2001(b) | $ | 9.28 | 0.54 | (0.16 | ) | 0.38 | (0.52 | ) | (0.52 | ) | $ | 9.14 | 4.19% | $ | 177,324 | 0.90% | 5.99% | 1.04% | 5.85% | 340.77% | |||||||||||||||||||
Year Ended December 31, 2002 | $ | 9.14 | 0.42 | 0.22 | 0.64 | (0.50 | ) | (0.50 | ) | $ | 9.28 | 7.21% | $ | 209,280 | 1.01% | 4.61% | 1.02% | 4.60% | 385.94% | ||||||||||||||||||||
Year Ended December 31, 2003 | $ | 9.28 | 0.36 | 0.74 | 1.10 | (0.52 | ) | (0.52 | ) | $ | 9.86 | 12.12% | $ | 226,525 | 1.01% | 3.75% | (c | ) | (c | ) | 296.62% | ||||||||||||||||||
Year Ended December 31, 2004 | $ | 9.86 | 0.42 | 0.21 | 0.63 | (0.49 | ) | (0.49 | ) | $ | 10.00 | 6.53% | $ | 238,502 | 1.01% | 4.23% | (c | ) | (c | ) | 212.84% | ||||||||||||||||||
Six Months Ended June 30, 2005 (Unaudited) | $ | 10.00 | 0.20 | (0.08 | ) | 0.12 | (0.23 | ) | (0.23 | ) | $ | 9.89 | 1.27% | (d) | $ | 253,341 | 1.02% | (e) | 4.24% | (e) | (c | ) | (c | ) | 67.31% | ||||||||||||||
| (a) | During the period certain fees were waived and/or reimbursed. If such waivers/reimbursements had not occurred, the ratios would have been as indicated. |
| (b) | The existing shares of the Fund were designated Class I shares as of May 1, 2001. |
| (c) | There were no fee reductions during the period. |
| (d) | Not annualized. |
| (e) | Annualized. |
See notes to financial statements.
22
Table of Contents
GARTMORE VARIABLE INSURANCE TRUST
NOTES TO FINANCIAL STATEMENTS (Unaudited)
June 30, 2005
1. Organization
Gartmore Variable Insurance Trust (“GVIT” or the “Trust”) is an open-end management investment company, organized under the laws of Delaware by an amended and restated Agreement and Declaration of Trust, dated October 28, 2004, as amended to date. The Trust, originally created under the laws of Massachusetts as a Massachusetts business trust pursuant to a Declaration of Trust dated, as of June 30, 1981, was subsequently amended, redomesticated as a Delaware Statutory Trust after the close of trading on April 29, 2005, and is registered under the Investment Company Act of 1940, as amended (the “1940 Act”). The redomestication is a change in statutory status and does not affect the operations of the Trust. As of June 30, 2005, the Trust had authorized an unlimited number of shares of beneficial interest (“shares”) without par value. The Trust currently offers shares to life insurance company separate accounts to fund the benefits under variable life insurance or annuity policies. To date, only the separate accounts of Nationwide Life Insurance Company and Nationwide Life and Annuity Insurance Company (collectively, “Nationwide”) have purchased shares of the Trust’s series. The Trust operates thirty-one (31) separate series, or mutual funds, each with its own investment objectives and strategies. This report contains the financial statements and financial highlights of the Van Kampen GVIT Multi Sector Bond Fund (the “Fund”).
Under the Trust’s organizational documents, the Trust’s officers and trustees are indemnified against certain liabilities arising out of the performance of their duties to the Trust. In addition, the Trust has entered into Indemnification Agreements with the Trust’s trustees and certain officers covering similar liabilities. In addition, in the normal course of business, the Trust enters into contracts with its vendors and others that provide for general indemnifications. The Trust’s maximum exposure under these arrangements is unknown, as this would involve future claims that may be made against the Trust. Based on experience, however, the Trust expects that risk of loss to be remote.
2. Summary of Significant Accounting Policies
The following is a summary of significant accounting policies followed by the Fund in the preparation of its financial statements. The policies are in conformity with accounting principles generally accepted in the United States of America (“GAAP”). The preparation of financial statements requires management to make estimates and assumptions that affect the reported amounts of assets and liabilities, the disclosure of contingent assets and liabilities at the date of the financial statements and the reported amounts of income and expenses for the period. Actual results could differ from those estimates.
| (a) | Security Valuation |
Securities for which market quotations are readily available are valued at current market value as of “Valuation Time.” Valuation Time is as of the close of regular trading on the New York Stock Exchange (usually 4 p.m. Eastern time). Equity securities are valued at the last quoted sale price or, if there is no sale price, the last quoted bid price provided by an independent pricing service approved by the Trust’s Board of Trustees. Securities traded on NASDAQ are valued at the NASDAQ official closing price. Prices are taken from the primary market or exchange in which each security trades. Most securities listed on a foreign exchange are valued either at fair value (see description below) or at the last sale price at the close of the exchange on which the security is principally traded. Foreign securities, currencies, and other assets and liabilities denominated in foreign currencies are translated into U.S. dollars at the exchange rate of said currencies against the U.S. Dollar, as of Valuation Time, as provided by an independent pricing service approved by the Board of Trustees.
Debt (including defaulted issues) and other fixed income securities (other than short-term obligations) are valued at the last quoted bid price and/or by using a combination of daily quotes and matrix evaluations provided by an independent pricing service, the use of which has been approved by the Trust’s Board of Trustees. Short-term debt securities, such as commercial paper and U.S. Treasury Bills having a remaining maturity of 60 days or less at the time of purchase, are considered to be “short-term” and are valued at amortized cost which approximates market value.
Securities for which market quotations are not readily available, or for which an independent pricing service does not provide a value or provides a value that does not represent fair value in the judgment of the Fund’s investment adviser or designee, are valued at fair value under procedures approved by the Trust’s Board of Trustees. The “Fair Value” of these securities is
23
Table of Contents
GARTMORE VARIABLE INSURANCE TRUST
NOTES TO FINANCIAL STATEMENTS (Unaudited) (Continued)
June 30, 2005
determined in good faith by taking into account relevant factors and surrounding circumstances. Methods utilized to obtain a “Fair Value” may include the following non-exclusive list of SEC acceptable methods: (i) a multiple of earnings; (ii) the discount from market value of a similar, freely traded security; (iii) the yield-to-maturity for debt issues; or (iv) a consolidation of the methods. The Gartmore Fair Value Committee considers a non-exclusive list of factors to arrive at the appropriate method upon determining “Fair Value.” For example, fair value determinations are required for securities whose value is affected by a “significant” event that materially affects the value of a domestic or foreign security which occurs subsequent to the time of the close of the principal market on which such domestic or foreign security trades and before the Valuation Time (i.e., a “subsequent event”). Typically, this will involve events occurring after the close of a foreign market on which a security trades and before the next Valuation Time.
The Fund values foreign securities at fair value in the circumstances described below. Generally, trading in foreign securities markets is completed each day at various times prior to the Valuation Time. Due to the time differences between the closings of the relevant foreign securities exchanges and the Valuation Time for the Fund, the Fund will fair value its foreign investments when it is determined that the market quotations for the foreign investments either are not readily available or are unreliable and, therefore, do not represent fair value. When the fair value prices are utilized, these prices will attempt to reflect the impact of the U.S. financial markets’ perceptions and trading activities on the Fund’s foreign investments since the last closing prices of the foreign investments were calculated on their primary foreign securities markets or exchanges. For these purposes, the Board of Trustees of the Trust has determined that movements in relevant indices or other appropriate market indicators, after the close of the foreign securities exchanges, may demonstrate that market quotations are unreliable, and may trigger fair value pricing for certain securities. Consequently, fair valuation of portfolio securities may occur on a daily basis. In determining fair value prices, the Trust utilizes data furnished by an independent pricing service (and that data draws upon, among other information, the market values of foreign investments). The fair value prices of portfolio securities generally will be used when it is determined that the use of these prices will have a material impact on the net asset value of the Fund. When the Fund uses fair value pricing, the values assigned to the Fund’s foreign investments may not be the quoted or published prices of the investments on their primary markets or exchanges.
| (b) | Repurchase Agreements |
The Fund may enter into repurchase agreements with an entity which is a member of the Federal Reserve System or which is a “primary dealer” (as designated by the Federal Reserve Bank of New York) in U.S. Government obligations. The repurchase price generally equals the price paid by the Fund plus interest negotiated on the basis of current short-term rates, which may be more or less than the rate on the underlying portfolio securities. The seller under a repurchase agreement is required to maintain the value of the collateral held pursuant to the agreement at a market value equal to or greater than the repurchase price (including accrued interest). Collateral subject to repurchase agreements is held by the Fund’s custodian or another qualified sub-custodian or in the Federal Reserve/Treasury book-entry system. If the counterparty defaults and the fair value of the collateral declines, realization of the collateral by the Fund may be delayed or limited. The Fund may transfer uninvested cash balances into a pooled cash account. These balances are invested in one or more repurchase agreements, which are fully collateralized by AA-rated Corporate Bonds with the counterparties of CS First Boston and Nomura Securities.
| (c) | Foreign Currency Transactions |
The accounting records of the Fund are maintained in U.S. dollars. Foreign currency amounts are translated into U.S. dollars at the current rate of exchange to determine the value of investments, assets and liabilities. The Fund may enter into foreign currency contracts in connection with purchases or sales of securities denominated in a foreign currency. Purchases and sales of securities, and income and expenses, are translated at the prevailing rate of exchange on the respective date of these transactions. The Fund does not isolate that portion of the results of operations resulting from changes in foreign exchange rates on investments from fluctuations arising from changes in market prices of securities held. These fluctuations are included with the net realized and unrealized gain or loss from investments and foreign currencies.
| (d) | Risks Associated with Foreign Securities and Currencies |
Investments in securities of foreign issuers carry certain risks not ordinarily associated with investments in securities of U.S. issuers. These risks include future political and economic developments, and the possible imposition of exchange controls or
24
Table of Contents
GARTMORE VARIABLE INSURANCE TRUST
NOTES TO FINANCIAL STATEMENTS (Unaudited) (Continued)
June 30, 2005
other foreign governmental laws and restrictions. In addition, with respect to certain countries, there is the possibility of expropriation of assets, confiscatory taxation, political or social instability, or diplomatic developments, which could adversely affect investments in those countries.
Certain countries also may impose substantial restrictions on investments in their capital markets by foreign entities, including restrictions on investments in issuers of industries deemed sensitive to relevant national interests. These factors may limit the investment opportunities available and result in a lack of liquidity and high price volatility with respect to securities of issuers from developing countries.
| (e) | Forward Foreign Currency Contracts |
The Fund may enter into forward foreign currency contracts in connection with planned purchases or sales of securities or to hedge the U.S. dollar value of portfolio securities denominated in a particular currency. The Fund could be exposed to risks if the counterparties to the contracts are unable to meet the terms of their contracts and from unanticipated movements in the value of a foreign currency relative to the U.S. dollar. Forward foreign currency contracts are valued at the current cost of covering these contracts, as provided by an independent pricing service approved by the Board of Trustees. The forward foreign currency contracts are adjusted by the daily exchange rate of the underlying currency and any gains or losses are recorded for financial statement purposes as unrealized gains or losses until the contract settlement date.
| (f) | Futures Contracts |
The Fund may invest in financial futures contracts (“futures contracts”) for the purpose of hedging its existing portfolio securities or securities that the Fund intends to purchase against fluctuations in value caused by changes in prevailing market interest rates or prices. Futures contracts may also be entered into for non-hedging purposes.
Upon entering into a futures contract, the Fund is required to pledge to the broker an amount of cash and/or other assets equal to a certain percentage of the contract amount (initial margin deposit). Subsequent payments, known as “variation margin,” are made each day, depending on the daily fluctuations in the fair value/market value of the underlying assets. A gain or loss equal to the daily variation margin is recognized on a daily basis. Futures contracts are valued daily at their last quoted sale price.
A “sale” of a futures contract means a contractual obligation to deliver the securities or foreign currency called for by the contract at a fixed price at a specified time in the future. A “purchase” of a futures contract means a contractual obligation to acquire the securities or foreign currency at a fixed price at a specified time in the future.
Should market conditions change unexpectedly, the Fund may not achieve the anticipated benefits of the futures contracts and may realize a loss. The use of futures transactions for hedging purposes involves the risk of imperfect correlation in movements in the price of futures contracts, interest rates, and the value of the underlying hedged assets.
| (g) | Written Options Contracts |
The Fund may write options contracts. A written option obligates the Fund to deliver (written call) or to receive (written put) a specified quantity of an underlying asset at the contract amount upon exercise by the holder of the option. The value of the option contract is recorded as a liability and unrealized gain or loss is measured by the difference between the current value and the premium received. Options traded on an exchange are valued at the last quoted sale price, or in the absence of a sale, the bid price provided by an independent pricing service approved by the Board of Trustees. Non-exchange traded options are valued using dealer supplied quotes.
| (h) | Mortgage Dollar Rolls |
The Fund may enter into mortgage “dollar rolls” in which the Fund sells mortgage-backed securities for delivery in the current month and simultaneously contracts to repurchase substantially similar (same type, coupon, and maturity) securities on a specified future date. Mortgage dollar rolls are referred to as TBA’s on the Statement of Investments of the Fund. During the roll period, the Fund foregoes principal and interest paid on the mortgage-backed securities. The Fund is
25
Table of Contents
GARTMORE VARIABLE INSURANCE TRUST
NOTES TO FINANCIAL STATEMENTS (Unaudited) (Continued)
June 30, 2005
compensated by fee income or the difference between the current sales price and the lower forward price for the future purchase. Mortgage dollar rolls are valued at the last quoted bid price and/or by using a combination of daily quotes and matrix evaluations provided by an independent pricing service, the use of which has been approved by the Board of Trustees.
| (i) | Security Transactions and Investment Income |
Security transactions are accounted for on the date the security is purchased or sold (“trade date”). Securities gains and losses are calculated on the identified cost basis. Interest income is recognized on the accrual basis and includes, where applicable, the amortization or accretion of premium or discount.
| (j) | Securities Lending |
To generate additional income, the Fund may lend up to 33 1/3% of the Fund’s total assets pursuant to agreements, requiring that the borrower deliver cash or securities as collateral with respect to each new loan of U.S. securities, equal to at least 102% of the value of the portfolio securities loaned, and with respect to each new loan of non-U.S. securities, collateral of at least 105% of the value of the portfolio securities loaned, and thereafter requiring the borrower to mark to market the collateral on a daily basis and requiring the borrower to make up any shortfall of collateral. The Fund receives payments from borrowers equivalent to the dividends and interest that would have been earned on securities lent while simultaneously seeking to earn income on the investment of cash collateral. Collateral is marked to market daily to provide a level of collateral at least equal to the market value of securities loaned. There may be risks of delay in recovery of the securities should the borrower of the securities fail financially. Loans will be made, however, only to borrowers deemed by the Fund’s investment adviser to be of good standing and creditworthy under guidelines established by the Board of Trustees and when, in the judgment of the adviser, the consideration which can be earned currently from these securities loans justifies the attendant risks. Loans are subject to termination by the Fund or the borrower at any time, and, therefore, are not considered to be illiquid investments. JPMorgan Chase Bank serves as custodian for the securities lending program of the Fund. JPMorgan Chase Bank receives a custody fee based on the value of collateral received from borrowers.
The cash collateral received by the Fund was pooled and, at June 30, 2005, was invested in the following:
Security Type | Security Name | Market Value | Maturity Rate | Maturity Date | |||||
| Commercial Paper | MacQuarie Bank Ltd. | $ | 499,368 | 3.25% | 07/01/05 | ||||
| Funding Agreement | GE Life and Annutiy | 5,500,000 | 3.32% | 07/14/05 | |||||
| Money Market Fund | JPM S/L Collateral Investment | 400,000 | 3.26% | 07/01/05 | |||||
| Repurchase Agreements | Nomura Securities | 854,990 | 3.48% | 07/01/05 | |||||
| Yankee Certificates of Deposit — Floating | Canadian Imperial Bank NY | 4,499,112 | 3.52% | 07/01/05 | |||||
As of June 30, 2005, the Fund had securities with the following market values on loan:
Market Value of Loaned Securities | Market Value of Collateral* | ||
$77,878,721 | $ | 79,486,173 | |
| * | Includes securities and cash collateral. |
| (k) | Distributions to Shareholders |
The Fund’s dividends from net investment income, if any, are declared and paid quarterly. The Fund’s distributable net realized capital gains, if any, are declared and distributed at least annually.
Dividends and distributions to shareholders are determined in accordance with federal income tax regulations, which may differ from GAAP. These “book/tax” differences are considered either permanent or temporary in nature. In accordance with the American Institute of Certified Public Accountants (“AICPA”) Statement of Position 93-2, permanent differences (i.e., reclassification of market discounts, gain/loss, paydowns, and distributions) are reclassified within the capital accounts based
26
Table of Contents
GARTMORE VARIABLE INSURANCE TRUST
NOTES TO FINANCIAL STATEMENTS (Unaudited) (Continued)
June 30, 2005
on their nature for federal income tax purposes; temporary differences do not require reclassification. These reclassifications have no effect upon the net asset value of the Fund. To the extent distributions exceed current and accumulated earnings and profits for federal income tax purposes, these distributions are reported as distributions of paid-in-capital.
| (l) | Federal Income Taxes |
It is the policy of the Fund to qualify or continue to qualify as a “regulated investment company” by complying with the provisions available to certain investment companies, as defined in applicable sections of the U.S. Internal Revenue Code, and to make distributions of net investment income and net realized capital gains sufficient to relieve the Fund from all, or substantially all, federal income taxes.
As of June 30, 2005, the tax cost of securities and the breakdown of unrealized appreciation (depreciation) for the Fund is as follows:
Tax Cost of | Unrealized Appreciation | Unrealized Depreciation | Net Unrealized Appreciation (Depreciation) | |||||||
$52,189 | $ | 13,074,816 | $ | (2,101,696 | ) | $ | 10,973,120 | |||
| (m) | Allocation of Expenses, Income, and Gains and Losses |
Expenses directly attributable to the Fund are charged to the Fund. Expenses not directly attributable to the fund are allocated proportionately among various or all funds within the Trust. The method used by the Fund for allocating income, fund level expenses, and realized and unrealized gains or losses is based on the fair value of shares outstanding relative to net assets. Under this method, each class of shares participates based on the total net asset value of that class’s shares in proportion to the total net assets of the Fund. Expenses specific to a class (such as rule 12b-1 and administrative services fees) are charged to that class.
| 3. | Transactions with Affiliates |
Under the terms of the Trust’s Investment Advisory Agreement, Gartmore Mutual Fund Capital Trust (“GMF”) manages the investment of the assets and supervises the daily business affairs of the Fund. GMF is a wholly-owned subsidiary of Gartmore Global Investments, Inc. (“GGI”), a holding company. GGI is a majority-owned subsidiary of Gartmore Global Asset Management Trust (“GGAMT”). GGAMT is a wholly-owned subsidiary of Nationwide Corporation. All of the common stock of Nationwide Corporation is held by Nationwide Mutual Insurance Company (95.2%) and Nationwide Mutual Fire Insurance Company (4.8%), each of which is a mutual company owned by its policyholders. In addition, GMF provides investment management evaluation services in initially selecting and monitoring, on an ongoing basis, the performance of the subadviser, for the Fund that GMF advises. Morgan Stanley Investments Management, Inc. (the “subadviser”), manages all of the Fund’s investments and has the responsibility for making all investment decisions for the Fund.
Under the terms of the Investment Advisory Agreement, the Fund pays GMF an investment advisory fee based on that Fund’s average daily net assets. From such fees, pursuant to the subadvisory agreement, GMF pays fees to the subadviser. Additional information regarding investment advisory fees and subadvisory fees for GMF and the subadviser is as follows for the six months ended June 30, 2005:
| Fee Schedule | Total Fees | Fees Retained | Paid to Sub-advisor | |||
Up to $200 million | 0.75% | 0.45% | 0.30% | |||
$200 million or more | 0.70% | 0.45% | 0.25% |
Under the terms of a Fund Administration and Transfer Agency Agreement, Gartmore SA Capital Trust (“GSA”) provides the Fund with various administrative and accounting services, and Gartmore Investors Services, Inc. (“GISI”), an indirect subsidiary of GSA, serves as Transfer and Dividend Disbursing Agent for the Fund. The fees for the services provided under
27
Table of Contents
GARTMORE VARIABLE INSURANCE TRUST
NOTES TO FINANCIAL STATEMENTS (Unaudited) (Continued)
June 30, 2005
this Agreement are calculated based on the Trust’s average daily net assets according to the fee schedule below. The fees are then allocated proportionately among all funds within the Trust in relation to the average daily net assets of each fund and are paid to GSA. GSA pays GISI from these fees for its services.
| Combined Fee Schedule* | ||
Up to $1 billion | 0.13% | |
$1 billion and more up to $3 billion | 0.08% | |
$3 billion and more up to $8 billion | 0.05% | |
$8 billion and more up to $10 billion | 0.04% | |
$10 billion and more up to $12 billion | 0.02% | |
$12 billion or more | 0.01% | |
| * | The assets of the Gartmore GVIT Investor Destinations Aggressive Fund, the Gartmore GVIT Investor Destinations Moderately Aggressive Fund, the Gartmore GVIT Investor Destinations Moderate Fund, the Gartmore GVIT Investor Destinations Moderately Conservative Fund, and the Gartmore GVIT Investor Destinations Conservative Fund (collectively, the “Investor Destinations Funds”) are excluded from the Trust asset level amount in order to calculate this asset-based fee. The Investor Destinations Funds do not pay any part of this fee. |
Effective January 1, 2005, the fee for the fund administration and transfer agency services increased as set forth below. The fees are calculated based on the Trust’s average daily net assets according to the fee schedule below. The fees are then allocated proportionately among all funds within the Trust in relation to the average daily net assets of each fund and are paid to GSA.
| Combined Fee Schedule* | ||
Up to $1 billion | 0.15% | |
$1 billion and more up to $3 billion | 0.10% | |
$3 billion and more up to $8 billion | 0.05% | |
$8 billion and more up to $10 billion | 0.04% | |
$10 billion and more up to $12 billion | 0.02% | |
$12 billion or more | 0.01% | |
| * | The assets of each of the Investor Destinations Funds are excluded from the Trust asset level amount in order to calculate this asset-based fee. The Investor Destinations Funds do not pay any part of this fee. |
GSA and GISI have entered into agreements with BISYS Fund Services Ohio, Inc. (“BISYS”), pursuant to which BISYS provides sub-administration and sub-transfer agency services, respectively, to the Fund.
Under the terms of an Administrative Services Plan, the Fund may pay fees to servicing organizations, such as broker-dealers, including Nationwide Financial Services, and financial institutions, which agree to provide administrative support services to the shareholders of certain classes. These services include, but are not limited, to the following: establishing and maintaining shareholder accounts; processing purchase and redemption transactions; arranging bank wires; performing shareholder sub-accounting; answering inquires regarding the Fund; and other such services. These fees are based on an annual rate of up to 0.25% of the average daily net assets of each class of shares of the Fund.
| 4. | Investment Transactions |
For the six months ended June 30, 2005, (excluding short-term securities) the Fund had purchases of $165,291,014 and sales of $151,897,329.
| 5. | Bank Loans |
The Trust has a credit agreement of $100,000,000. Borrowings under this arrangement bear interest at the Federal Funds rate plus 0.50%. The interest costs are included in custodian fees in the Statement of Operations. No compensation balances were required under the terms of the line of credit. There were no borrowings outstanding as of June 30, 2005.
28
Table of Contents
GARTMORE VARIABLE INSURANCE TRUST
NOTES TO FINANCIAL STATEMENTS (Unaudited) (Continued)
June 30, 2005
| 6. | Shareholder Meeting |
A separate shareholders meeting was held on Tuesday, December 23, 2004, for the shareholders of the Trust’s predecessor pursuant to a Proxy Statement On Schedule 14A, dated October 29, 2004, and mailed to the shareholders of the Trust’s predecessor on or around November 5, 2004.
Two Proposals: The purpose of the December 23, 2004 meeting was to allow the shareholders of the Trust’s predecessor to vote on:
| i. | Proposal One: The election of the Trust’s Board of Trustees; and |
| ii. | Proposal Two: The approval of an “Agreement and Plan of Reorganization” that provided for the reorganization of the Trust from a Massachusetts business trust into a Delaware statutory trust. |
Proposal One: As set forth in the October 29, 2004 Proxy Statement, the nominees for election as Trustees of the Trust’s predecessor were: Charles E. Allen, Michael J. Baresich, Paula H.J. Cholmondeley, C. Brent DeVore, Phyllis Kay Dryden, Robert M. Duncan, Barbara L. Hennigar, Paul J. Hondros, Barbara I Jacobs, Thomas J. Kerr IV, Douglas F. Kridler, Michael D. McCarthy, Arden L. Shisler, and David C. Wetmore.
Proposal Two: As specifically set forth in the October 29, 2004 Proxy Statement, the Reorganization proposal requested the shareholders of the Trust’s predecessor to approve the proposed “Agreement and Plan of Reorganization” of the Trust’s predecessor (on behalf of each of the its funds) into a new Delaware-domiciled Trust, whereby the Funds of the new Delaware Trust would acquire all of the assets of the corresponding funds of the Trust’s predecessor subject to the liabilities, expenses, costs, charges, and reserves of the corresponding funds of the Trust’s predecessor (contingent or otherwise), in exchange for shares of the acquiring Funds to be distributed pro rata by the Trust to the holders of the shares of the funds of the Trust’s predecessor, in a complete liquidation of the Trust’s predecessor.
Voting Results:
The shareholders of the Trust’s predecessor voted to approve both Proposal One and Proposal Two, as follows:
Proposal 1: Election of a Board of Trustees of Gartmore Variable Insurance Trust
Charles E. Allen: | ||
FOR | 2,797,230,318.955 shares (96.078%) | |
WITHHOLD | 114,195,693.660 shares (3.922%) | |
TOTAL | 2,912,726,012.615 shares (100.000%) | |
Michael J. Baresich: | ||
FOR | 2,796,135,979.559 shares (96.040%) | |
WITHHOLD | 115,290,033.056 shares (3.960%) | |
TOTAL | 2,912,726,012.615 shares (100.000%) | |
Paula H.J. Cholmondeley: | ||
FOR | 2,795,095,945.396 shares (96.004%) | |
WITHHOLD | 116,330,067.219 shares (3.996%) | |
TOTAL | 2,912,726,012.615 shares (100.000%) | |
29
Table of Contents
GARTMORE VARIABLE INSURANCE TRUST
NOTES TO FINANCIAL STATEMENTS (Unaudited) (Continued)
June 30, 2005
C. Brent DeVore: | ||
FOR | 2,797,207,046.916 shares (96.077%) | |
WITHHOLD | 114,218,965.699 shares (3.923%) | |
TOTAL | 2,912,726,012.615 shares (100.000%) | |
Phyllis Kay Dryden: | ||
FOR | 2,795,587,023.994 shares (96.021%) | |
WITHHOLD | 115,838,988.621 shares (3.979%) | |
TOTAL | 2,912,726,012.615 shares (100.000%) | |
Robert M. Duncan: | ||
FOR | 2,790,191,720.503 shares (95.836%) | |
WITHHOLD | 121,234,292.112 shares (4.164%) | |
TOTAL | 2,912,726,012.615 shares (100.000%) | |
Barbara L. Hennigar: | ||
FOR | 2,792,939,848.858 shares (95.937%) | |
WITHHOLD | 118,486,163.757 shares (4.070%) | |
TOTAL | 2,912,726,012.615 shares (100.000%) | |
Paul J. Hondros: | ||
FOR | 2,797,557,404.448 shares (96.089%) | |
WITHHOLD | 113,868,608.167 shares (3.911%) | |
TOTAL | 2,912,726,012.615 shares (100.000%) | |
Barbara I. Jacobs: | ||
FOR | 2,796,306,126.654 shares (96.046%) | |
WITHHOLD | 115,119,885.961 shares (3.954%) | |
TOTAL | 2,912,726,012.615 shares (100.000%) | |
Thomas J. Kerr IV: | ||
FOR | 2,789,755,720.087 shares (95.821%) | |
WITHHOLD | 121,670,292.528 shares (4.179%) | |
TOTAL | 2,912,726,012.615 shares (100.000%) | |
Douglas F. Kridler: | ||
FOR | 2,798,065,774.375 shares (96.106%) | |
WITHHOLD | 113,360,238.240 shares (3.894%) | |
TOTAL | 2,912,726,012.615 shares (100.000%) | |
Michael D. McCarthy: | ||
FOR | 2,797,452,613.694 shares (96.085%) | |
WITHHOLD | 113,973,395.921 shares (3.915%) | |
TOTAL | 2,912,726,012.615 shares (100.000%) | |
30
Table of Contents
GARTMORE VARIABLE INSURANCE TRUST
NOTES TO FINANCIAL STATEMENTS (Unaudited) (Continued)
June 30, 2005
Arden L. Shisler: | ||
FOR | 2,796,738,454.730 shares (96.061%) | |
WITHHOLD | 114,687,557.885 shares (3.939%) | |
TOTAL | 2,912,726,012.615 shares (100.000%) | |
David C. Wetmore: | ||
FOR | 2,794,784,752.247 shares (95.994%) | |
WITHHOLD | 116,641,260.368 shares (4.006%) | |
TOTAL | 2,912,726,012.615 shares (100.000%) | |
Proposal 2: Approval of the Agreement and Plan of Reorganization of Gartmore Variable Insurance Trust
FOR | 2,561,003,822.546 shares (87.964%) | |
AGAINST | 103,593,261.010 shares (3.558%) | |
ABSTAIN | 246,828,929.059 shares (8.478%) | |
TOTAL | 2,912,726,012.615 shares (100.000%) | |
31
Table of Contents
GARTMORE VARIABLE INSURANCE TRUST
Management Information (Unaudited)
June 30, 2005
Trustees who are not Interested Persons (as defined in the 1940 Act) and Officers of the Funds June 30, 2005
| Name, Address and Date of Birth | Position(s) Held with the Trust and Length of Time Served1 | Principal Occupation(s) During Past 5 Years | Number of Portfolios in the Gartmore Fund Complex Overseen by Trustee | Other Directorships Held by Trustee or Nominee2 | ||||
Charles E. Allen
c/o Gartmore Global Investments, Inc. 1200 River Road, Suite 1000 Conshohocken, PA 19428
1948 | Trustee since July 2000 | Mr. Allen is Chairman, Chief Executive Officer and President of the Graimark Realty Advisors, Inc. (real estate development, investment and asset management). | 84 | None | ||||
Paula H.J. Cholmondeley
c/o Gartmore Global Investments, Inc. 1200 River Road, Suite 1000 Conshohocken, PA 19428
1940 | Trustee since July 2000 | Ms. Cholmondeley has been the Chairman and Chief Executive Officer of the Sorrel Group, a management consulting company, since January 2004. From March 2000 through December 2003, Ms. Cholmondeley was Vice President and General Manager of Sappi Fine Paper North America. Prior thereto, Ms. Cholmondeley was Vice President and General Manager of Residential Insulation of Owens Corning. | 84 | Director of Dentsply International, Inc., Ultralife Batteries, Inc., Terex Corporation, Minerals Technology, Inc. and Albany International Corp. | ||||
C. Brent DeVore
c/o Gartmore Global Investments, Inc. 1200 River Road, Suite 1000 Conshohocken, PA 19428
1940 | Trustee since 1990 | Dr. DeVore is President of Otterbein College. | 84 | None | ||||
Phyllis K. Dryden
c/o Gartmore Global Investments, Inc. 1200 River Road, Suite 1000 Conshohocken, PA 19428
1947 | Trustee since December 2004 | Ms. Dryden was a former Managing Partner of marchFIRST, a global management consulting firm prior to 2002. | 84 | None |
32
Table of Contents
GARTMORE VARIABLE INSURANCE TRUST
Management Information (Unaudited)
June 30, 2005
| Name, Address and Date of Birth | Position(s) Held with the Trust and Length of Time Served1 | Principal Occupation(s) During Past 5 Years | Number of Portfolios in the Gartmore Fund Complex Overseen by Trustee | Other Directorships Held by Trustee or Nominee2 | ||||
Barbara L. Hennigar*
c/o Gartmore Global Investments, Inc. 1200 River Road, Suite 1000 Conshohocken, PA 19428
1935 | Trustee since July 2000 | Retired since June 2000. Prior thereto, Ms. Hennigar was the Chairman or President and Chief Executive Officer of OppenheimerFunds Services and a member of the Executive Committee of OppenheimerFunds. | 84 | None | ||||
Barbara I. Jacobs
c/o Gartmore Global Investments, Inc. 1200 River Road, Suite 1000 Conshohocken, PA 19428
1950 | Trustee since December 2004 | Ms. Jacobs has served as Chairman of the Board of Directors of KICAP Network Fund, a European (United Kingdom) hedge fund, since December 2000. Prior to 2004, Ms. Jacobs was also a Managing Director and European Portfolio Manager with CREF Investments (Teachers Insurance Annuity Association — College Retirement Equity Fund). | 84 | None | ||||
Douglas F. Kridler
c/o Gartmore Global Investments, Inc. 1200 River Road, Suite 1000 Conshohocken, PA 19428
1955 | Trustee since September 1997 | Mr. Kridler has served as the President and Chief Executive Officer of the Columbus Foundation (a Columbus, OH-based foundation which manages over 1,300 individual endowment funds) since February 2002. Mr. Kridler was the President of the Columbus Association for the Performing Arts prior thereto and Chairman of the Greater Columbus Convention and Visitors Bureau during 2000 and 2001. | 84 | None | ||||
Michael D. McCarthy
c/o Gartmore Global Investments, Inc. 1200 River Road, Suite 1000 Conshohocken, PA 19428
1947 | Trustee since December 2004 | Mr. McCarthy serves as: the Founder and Chairman of The Eureka Foundation (which sponsors and funds the “Great Museums” series on PBS); and a Partner of Pineville Properties LLC (a commercial real estate development firm). | 843 | None |
33
Table of Contents
GARTMORE VARIABLE INSURANCE TRUST
Management Information (Unaudited)
June 30, 2005
| Name, Address and Date of Birth | Position(s) Held with the Trust and Length of Time Served1 | Principal Occupation(s) During Past 5 Years | Number of Portfolios in the Gartmore Fund Complex Overseen by Trustee | Other Directorships Held by Trustee or Nominee2 | ||||
David C. Wetmore
c/o Gartmore Global Investments, Inc. 1200 River Road, Suite 1000 Conshohocken, PA 19428
1948 | Trustee since 1995 and Chairman since February 2005 | Retired. Mr. Wetmore was formerly a Managing Director of Updata Capital, an investment banking and venture capital firm. | 84 | None |
| * | Pursuant to the Trust’s mandatory retirement policy, Ms. Hennigar is expected to retire on or about January 12, 2006. |
| 1 | The term of office length is until a trustee resigns or reaches a mandatory retirement age of 70. On March 2, 2000, the Board adopted a five-year implementation period for any Trustee 65 or older as of the adoption of this policy. Pursuant to this policy, Messrs. Duncan and Kerr retired as trustees effective as of March 12, 2005. |
| 2 | Directorships held in (1) any other investment companies registered under the 1940 Act, (2) any company with a class of securities registered pursuant to Section 12 of the Securities Exchange Act of 1934, as amended (the “Exchange Act”), or (3) any company subject to the requirements of Section 15(d) of the Exchange Act. |
| 3 | Mr. McCarthy was also an Administrative Committee Member for the Alphagen Arneb Fund, LLC, The Healthcare Fund LDC, The Leaders Long-Short Fund, LLC, and The Leaders Long-Short Fund LDC, four private investment companies (hedge funds) managed by GSA. Mr. McCarthy resigned as an Administrative Committee Member effective June 30, 2005. |
Trustees and Officers who are not Interested Persons (as defined in the 1940 Act) of the Funds received aggregate compensation of $274,882 from the Trust for the Six Months Ended June 30, 2005. Additional information regarding the Trustees and Officers may be found in the Trust’s statement of additional information, which is available without charge upon request, by calling 1-800-848-0920.
34
Table of Contents
GARTMORE VARIABLE INSURANCE TRUST
Management Information (Unaudited)
June 30, 2005
Trustees who are Interested Persons (as defined in the 1940 Act) and/or Officers of the Funds June 30, 2005
| Name, Address and Age | Position(s) Held with the Trust and Length of Time Served1 | Principal Occupation(s) During Past 5 Years | Number of Portfolios in the Gartmore Fund Complex Overseen by Trustee | Other Directorships Held by Trustee2 | ||||
Paul J. Hondros
Gartmore Global Investments, Inc. 1200 River Road, Suite 1000 Conshohocken, PA 19428
1948 | Trustee since July 2000 | Mr. Hondros has been President and Chief Executive Officer of various Gartmore entities, including Gartmore Distribution Services, Inc. (“GDSI”),3 Gartmore Investor Services, Inc. (“GISI”),3 Gartmore Morley Capital Management, Inc. (“GMCM”),3 Gartmore Morley Financial Services, Inc. (“GMFS”),3 NorthPointe Capital, LLC (“NorthPointe”),3 Gartmore Global Asset Management Trust (“GGAMT”)3, Gartmore Global Investments, Inc. (“GGI”)3, Gartmore Mutual Fund Capital Trust (“GMFCT”)3 and Gartmore SA Capital Trust (“GSA”)3; and a Director of Nationwide Securities, Inc.3, as well as several entities within Nationwide Financial Services, Inc. | 844 | None | ||||
Arden L. Shisler
c/o Gartmore Global Investments, Inc. 1200 River Road, Suite 1000 Conshohocken, PA 19428
1941 | Trustee since February 2000 | Mr. Shisler has been a consultant since January 2003. Prior thereto, he was President and Chief Executive Officer of K&B Transport, Inc., a trucking firm. Since 1992, Mr. Shisler has also been Chairman of the Board for Nationwide Mutual Insurance Company3. | 84 | Director of Nationwide Financial Services, Inc. | ||||
Gerald J. Holland
Gartmore Global Investments, Inc. 1200 River Road, Suite 1000 Conshohocken, PA 19428
1951 | Treasurer since March 2001 | Mr. Holland is Senior Vice President - Operations for GGI3, GMFCT3, and GSA3. Prior to July 2000, Mr, Holland was Vice President for First Data Investor Services, an investment company service provider. | 84 | None |
35
Table of Contents
GARTMORE VARIABLE INSURANCE TRUST
Management Information (Unaudited)
June 30, 2005
| Name, Address and Age | Position(s) Held with the Trust and Length of Time Served1 | Principal Occupation(s) During Past 5 Years | Number of Portfolios in the Gartmore Fund Complex Overseen by Trustee | Other Directorships Held by Trustee2 | ||||
Michael A. Krulikowski
Gartmore Global Investments, Inc. 1200 River Road, Suite 1000 Conshohocken, PA 19428
1959 | Chief Compliance Officer since June 2004 | Since November 1999, Mr. Krulikowski has served as a Vice President and Chief Compliance Officer of GGI. Prior thereto, Mr. Krulikowski served as Chief Compliance Officer of 1717 Capital Management Company/Provident Mutual Insurance Company. | 84 | None | ||||
Eric E. Miller
Gartmore Global Investments, Inc. 1200 River Road, Suite 1000 Conshohocken, PA 19428
1953 | Secretary since December 2002 | Mr. Miller is Senior Vice President, Chief Counsel for GGI3, GMFCT3 and GSA3 since August 2002. From August 2000 to August 2002, Mr. Miller was a Partner with Stradley Ronan Stevens & Young, LLP. Prior to August 2000, Mr. Miller served as Senior Vice President and Deputy General Counsel at Delaware Investments. | 84 | None |
| 1 | The term of office length is until a trustee resigns or reaches a mandatory retirement age of 70. On March 2, 2000, the Board adopted a five-year implementation period for any Trustee 65 or older as of the adoption of this policy. Pursuant to this policy, Messrs. Duncan and Kerr retired as trustees effective as of March 12, 2005. |
| 2 | Directorships held in (1) any other investment companies registered under the 1940 Act, (2) any company with a class of securities registered pursuant to Section 12 of the Securities Exchange Act of 1934, as amended (the “Exchange Act”), or (3) any company subject to the requirements of Section 15(d) of the Exchange Act. |
| 3 | This position is held with an affiliated person or principal underwriter of the Trust. |
| 4 | Mr. Hondros was also an Administrative Committee Member for the Alphagen Arneb Fund, LLC, The Healthcare Fund LDC, The Leaders Long-Short Fund, LLC, and The Leaders Long-Short Fund LDC, four private investment companies (hedge funds) managed by GSA. Mr. Hondros resigned as Administrative Committee Member effective June 30, 2005. |
Federal law requires the Trust, each of its investment advisers and sub-advisers to adopt procedures for voting proxies (“Proxy Voting Guidelines”) and to provide a summary of those Proxy Voting Guidelines used to vote the securities held by the Funds. The Funds’ proxy voting policies and procedures are available without charge (i) upon request, by calling 1-800-848-0920, (ii) on the Fund’s website at www.gartmorefunds.com, or (iii) on the Securities and Exchange Commission’s website at www.sec.gov.
36
Table of Contents
GVIT Small Cap Value Fund
Semiannual Report
| | June 30, 2005 |
| Contents | ||
| 6 | Statement of Investments | |
| 18 | Statement of Assets and Liabilities | |
| 18 | Statement of Operations | |
| 19 | Statements of Changes in Net Assets | |
| 21 | Financial Highlights | |
| 22 | Notes to Financial Statements | |
Commentary provided by Gartmore Global Investments, investment adviser to Gartmore Variable Insurance Trust. All opinions and estimates included in this report constitute Gartmore Global Investments’ judgment as of the date of this report and are subject to change without notice.
Statement Regarding Availability of Quarterly Portfolio Schedule.
The Gartmore Variable Insurance Trust files complete schedules of portfolio holdings for each Fund with the Securities and Exchange Commission (the “Commission”) for the first and third quarters of each fiscal year on Form N-Q. The Funds’ Forms N-Q are available on the Commission’s website at http://www.sec.gov. The Funds’ Forms N-Q may be reviewed and copied at the Commission’s Public Reference Room in Washington, DC, and information on the operation of the Public Reference Room may be obtained by calling 800-SEC-0330; and the Funds make the information on Form N-Q available to shareholders upon request without charge.
Statement Regarding Availability of Proxy Voting Record.
Information regarding how the Fund voted proxies relating to portfolio securities held during the most recent 12-month period ended June 30, 2005 is available without charge, upon request, by calling 800-848-0920, and on the Commission’s website at http://www.sec.gov.
Table of Contents
GVIT Small Cap Value Fund
For the semiannual period ended June 30, 2005, the GVIT Small Cap Value Fund returned -1.04% (Class I at NAV) versus 0.90% for its benchmark, the Russell 2000® Value Index. For broader comparison, the average return for the Fund’s Lipper peer category of Small-Cap Value Funds was 1.04%.
Gartmore Mutual Fund Capital Trust (GMF), The Dreyfus Corp. and J.P Morgan Investment Management Inc. each manage a portion of the Fund’s portfolio on a day-to-day basis. GMF is the Fund’s investment adviser and has selected Dreyfus and J.P Morgan as subadvisers for the Fund; the three portions, or sleeves, of the portfolio returned 0.07%, -4.34% and 2.71%, respectively. Below are the individual reports on how each sleeve of the portfolio performed.
Gartmore Mutual Fund Capital Trust
While performance was strong in the consumer staples, information technology and telecommunications sectors, weak stock selection in financials and industrials detracted from Fund performance. In the financials sector, Oriental Financial Group suffered due to the challenging margin environment of the banking industry. In the industrials sector, American Woodmark Corp.’s stock weakened when the company missed earnings expectations; the company has since made up lost ground. In contrast, the technology sector, which generally has been a poorly performing sector this year, attributed more than 100 basis points to Fund performance during the reporting period. Our focus on quality and fundamental improvement within this sector–and an overall theme applied to the entire portfolio–has benefited this space.
At this time last year, our style faced a challenging environment. However, beyond the challenges lay promise in factors that could lead to better performance. While value has remained the “preferred” style, it is no longer the market of extremes it once was. At the height of value’s run, performance was driven primarily by deep-value or high-beta (risky) stocks. We believe that this past year marked the beginning of a multi-year cycle that will provide strong returns for both value and growth stocks, with less disparity between the styles. In the past this so-called “core” market environment has been more conducive to strong stock selection for us.
The Dreyfus Corp.
Despite a strong first quarter, holdings in the energy sector underperformed throughout the second quarter. We remain bullish on energy for the long term as we maintain our slight overweight position in the sector, though we do believe many of the stocks are now fully valued due to recent price increases.
Notwithstanding a surge in May and June, our overweight position in technology underperformed. We believe that the fundamental outlook for many technology companies is robust, and in coming quarters we expect corporate capital spending to strengthen. Continued underperformance in the consumer services sector has led us to reduce our weighting in that area. Increases in energy prices and interest rates are expected to reduce consumer spending, placing earnings estimates under increased near-term pressure. Currently, our focus is on the retail industry, as well as for-profit colleges.
Conversely, our overweight position in health care continues to be attractive and is a significant contributor to the sleeve’s performance. We feel that there are still many solid health-care companies with good historical earnings growth selling at prices that do not reflect their prospects. The demand for health-related services continues to grow as the U.S. population ages, and the stocks appear to be somewhat immune to swings in the economy. Consumer non durables, transportation and utilities also were positives for the Fund. We have maintained our underweight position in consumer non durables and transportation, because these sectors are almost fully valued. Due to strong stock performance, we have increased our weight in utilities but are still comparatively underweight in the sector.
In a rising-interest-rate environment laced with fears of inflationary pressure, small-cap stocks generally are less attractive. In addition, the energy and commodities markets should continue to contribute to volatility with sustained upward demands still present in the market. We believe that significant momentum is building for a shift toward quality and away from marginal small-cap companies that have outpaced large-cap companies for 19 of the past 20 quarters. We believe that corporate capital spending will be a major driver in the near future; modest economic growth should continue for several quarters; we are confident that the sleeve is well-positioned to take advantage of this opportunity.
J.P. Morgan Investment Management Inc.
Positive stock selection in the energy and industrials sectors contributed to relative performance. Top sleeve contributors included Southwestern Energy Co. and Zenith National Insurance Corp. Southwestern Energy advanced nearly 60% during the year due to an increase in production volumes and higher natural gas prices. Its stock price rose to record highs in June after the company reported that it had successfully drilled new wells for a major Arkansas project. Zenith National Insurance benefited from positive first-quarter results based on improved net income driven by favorable trends in the company’s workers’ compensation agreement.
Despite the sleeve’s positive performance, the financials and basic materials sectors detracted from results. The largest detractors were R&G Financial Co. and Cash America Investments Inc. R&G’s shares
1
Table of Contents
GVIT Small Cap Value Fund (Continued)
declined after the company announced a 2004 restatement, which is expected to reduce the fair value of residual interests. Shares of Cash America suffered after the company withdrew its fiscal 2005 earnings forecast, based on uncertainty about more stringent requirements issued in April by the Federal Deposit Insurance Corp.
U.S. equity markets continue to trade within a fairly tight range as investors attempt to gauge the direction of economic growth, inflation and Fed policy. Up to this point, markets have had a difficult time breaking out to the high or low side, because economic news has been balanced. On the positive side, weakness in manufacturing appears to be subsiding, recent inflation data has been more benign than originally thought, and U.S. corporate balance sheets are in excellent shape. On the negative side, rising labor costs point to a deceleration in profit growth, high commodity prices are putting downward pressure on economic growth and upward pressure on inflation, and major developed economies (outside of the United States) remain sluggish.
PORTFOLIO MANAGERS:
Gartmore Mutual Fund Trust: Jeffery C. Petherick, CFA, Mary C. Champagne, CFA
The Dreyfus Corp.: Peter I. Higgins
J.P. Morgan Investment Management Inc: Christopher T. Blum, CFA
Investing in mutual funds involves risk, including possible loss of principal.
There is no assurance that the investment objective of any fund will be achieved.
Small-company stocks have higher risks than the stocks of larger, more established companies and have significant short-term price volatility.
Russell 2000® Value Index: An unmanaged index that measures the performance of the stocks of U.S. companies in the Russell 2000® Index (the largest 2,000 U.S. companies, based on market capitalization) with lower price-to-book ratios and lower forecasted growth values.
Lipper Analytical Services, Inc. is an industry research firm whose rankings are based on total return performance and do not reflect the effects of sales charges.
The Gartmore Variable Insurance Trust Funds are available only as sub-account investment options in certain variable insurance products. Accordingly, investors are unable to invest in shares of these funds outside of an insurance product. Performance information found herein reflects only the performance of these funds, and does not indicate the performance your sub-account may experience under your variable insurance contract. Performance returns assume reinvestment of all distributions. The investment return and principal value of an investment will fluctuate so that an investor’s shares, when redeemed, may be worth more or less than their original cost. Index performance is provided for comparison purposes only; the indexes shown are unmanaged and do not reflect any fees or expenses. Investors cannot invest directly in market indexes. To obtain performance information about the sub-account option under your insurance contract that invests in one of these funds, please contact your variable insurance carrier. PAST PERFORMANCE IS NO GUARANTEE OF FUTURE RESULTS.
Commentary provided by Gartmore Global Investments. All opinions and estimates included in this report constitute Gartmore Global Investments’ judgment as of the date of this report and are subject to change without notice.
Investors should carefully consider a fund’s investment objectives, risks, fees, charges and expenses before investing any money. To obtain this and other information on Gartmore Variable Insurance Trust, please contact your variable insurance contract provider or call 800-848-0920. Please read the Trust’s prospectus carefully before investing any money.
Gartmore Funds distributed by Gartmore Distribution Services, Inc., Member NASD. 1200 River Road, Suite 1000, Conshohocken, PA 19428.
2
Table of Contents
Fund Performance | GVIT Small Cap Value Fund |
| Average | Annual Total Return1 |
(For Periods Ended June 30, 2005)
| Six months* | One year | Five years | Inception2 | |||||
| Class I3 | -1.04% | 10.08% | 11.25% | 11.53% | ||||
| Class II4 | -1.20% | 9.78% | 10.99% | 11.27% | ||||
| Class III4 | -1.03% | 10.16% | 11.29% | 11.55% | ||||
| Class IV4 | -1.04% | 10.08% | 11.25% | 11.53% |
| * | Not Annualized. |
| 1 | Not subject to any sales charges. |
| 2 | The Fund commenced operations on October 31, 1997. From inception to February 5, 2001, Dreyfus managed the Fund alone. From February 5, 2001 until October 1, 2003, GMF and Dreyfus have managed the Fund together. Beginning October 1, 2003, J.P. Morgan was added as a Fund subadviser. |
| 3 | The existing shares of the Fund were designated Class I shares as of May 1, 2001. |
| 4 | These returns until the creation of the Class II shares (May 6, 2002), Class III shares (May 3, 2002) and Class IV shares (April 28, 2003) are based on the performance of the Class I shares of the Fund. Excluding the effect of any fee waivers or reimbursements, such prior performance is similar to what Class II, Class III and Class IV shares would have produced because all classes of shares invest in the same portfolio of securities. Class II shares’ annual returns have been restated to reflect the additional fees applicable to Class II shares and therefore are lower than those of Class I shares. For Class III shares, these returns do not reflect the short-term trading fees applicable to such shares; if these fees were reflected, the annual returns for Class III shares would have been lower. |
| Performance | of a $10,000 Investment |
Investment return and principal value will fluctuate, and when redeemed, shares may be worth more or less than original cost. Past performance is no guarantee of future results and does not reflect the deduction of taxes that a shareholder would pay on fund distributions or the redemption of fund shares. Investing in mutual funds involves market risk, including loss of principal. Performance returns assume the reinvestment of all distributions.
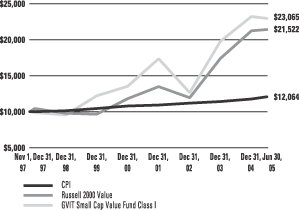
Comparative performance of $10,000 invested in Class I shares of the GVIT Small Cap Value Fund, the Russell 2000 Value Index (Russell 2000 Value)(a), and the Consumer Price Index (CPI)(b) since inception. Unlike, the Fund, the returns for these unmanaged indexes do not reflect any fees, expenses, or sales charges. Investors cannot invest directly in market indexes.
| (a) | The Russell 2000 Value measures the performance of those Russell 2000 companies with lower price-to-book ratios and lower forecasted growth values. |
| (b) | The CPI represents changes in prices of a basket of goods and services purchased for consumption by urban households. |
3
Table of Contents
Shareholder
Expense Example | GVIT Small Cap Value Fund |
As a shareholder of the Fund, you incur two types of costs: (1) transaction costs, including sales charges (loads) paid on purchase payments and redemption fees; and (2) ongoing costs, including investment advisory fees, administration fees, distribution fees and other Fund expenses. The examples below are intended to help you understand your ongoing costs (in dollars) of investing in the Fund and to compare these costs with the ongoing costs of investing in other mutual funds. Per SEC requirements, the examples assume that you had a $1,000 investment in the Class at the beginning of the reporting period, January 1, 2005, and continued to hold your shares at the end of the reporting period, June 30, 2005.
Actual Expenses
For each Class of the Fund in the table below, the first line provides information about actual account values and actual expenses. You may use the information in this line, together with the amount you invested, to estimate the expenses that you paid over the period. Simply divide your account value by $1,000 (for example, an $8,600 account value divided by $1,000 = 8.6), then multiply the result by the number in the first line of each Class under the heading entitled “Expenses Paid During Period” to estimate the expenses you paid on your account during the period.
Hypothetical Example for Comparison Purposes
The second line of each Class in the table below provides information about hypothetical account values and hypothetical expenses based on the Class’ actual expense ratio and an assumed rate of return of 5% per year before expenses, which is not the Class’ actual return. The hypothetical account values and expenses may not be used to estimate the actual ending account balance or expenses you paid for the period. You may use this information to compare the ongoing costs of investing in the Class of the Fund and other funds. To do so, compare this 5% hypothetical example with the 5% hypothetical examples that appear in the shareholder reports of the other funds.
Please note that the expenses shown in the table are meant to highlight your ongoing costs only and do not reflect any transaction costs, such as sales charges (loads) or redemption fees. Therefore, the second line for each Class in the table is useful in comparing ongoing costs only, and will not help you determine the relative total costs of owning different funds. In addition, if these transaction costs were included, your costs would have been higher. The examples also assume all dividends and distributions have been reinvested.
| Beginning Account Value, January 1, 2005 | Ending Account Value, June 30, 2005 | Expenses Paid | Annualized Expense Ratio* | |||||||||||
| Small Cap Value | ||||||||||||||
Class I | Actual | $ | 1,000 | $ | 990 | $ | 5.48 | 1.11% | ||||||
| Hypothetical | 1 | $ | 1,000 | $ | 1,019 | $ | 5.57 | 1.11% | ||||||
Class II | Actual | $ | 1,000 | $ | 988 | $ | 6.70 | 1.36% | ||||||
| Hypothetical | 1 | $ | 1,000 | $ | 1,018 | $ | 6.83 | 1.36% | ||||||
Class III | Actual | $ | 1,000 | $ | 990 | $ | 5.48 | 1.11% | ||||||
| Hypothetical | 1 | $ | 1,000 | $ | 1,019 | $ | 5.57 | 1.11% | ||||||
Class IV | Actual | $ | 1,000 | $ | 990 | $ | 5.48 | 1.11% | ||||||
| Hypothetical | 1 | $ | 1,000 | $ | 1,019 | $ | 5.57 | 1.11% | ||||||
| * | Expenses are equal to the Fund’s annualized expense ratio multiplied by the average account value over the period multiplied by 181/365 (to reflect the one-half year period). The expense ratio presented represents a six month, annualized ratio in accordance with SEC guidelines. |
| 1 | Represents the hypothetical 5% return before expenses. |
4
Table of Contents
Portfolio Summary
(June 30, 2005) | GVIT Small Cap Value Fund |
The SEC adopted a requirement that Funds present their portfolio holdings in a table, chart or graph format in their annual and semiannual reports to shareholders, whether or not a statement of investments is utilized. The following tables, which present portfolio holdings as a percentage of net assets, are provided in compliance with this requirement.
| Asset Allocation | ||
| Common Stocks | 97.1% | |
| Cash Equivalents | 2.3% | |
| U.S. Treasury Notes | 0.1% | |
| Warrants | 0.0% | |
| Other assets in excess of liabilities | 0.5% | |
| 100.0% | ||
| Top Holdings* | ||
| Cephalon, Inc. | 1.1% | |
| Dobson Communications Corp., Class A | 1.0% | |
| IVAX Corp. | 1.0% | |
| Career Education Corp. | 0.9% | |
| Westcorp | 0.8% | |
| Sanmina Corp. | 0.7% | |
| Key Energy Services, Inc. | 0.7% | |
| WCI Communities, Inc. | 0.6% | |
| Affiliated Managers Group, Inc. | 0.6% | |
| Axcelis Technologies, Inc. | 0.6% | |
| Other Holdings | 92.0% | |
| 100.0% | ||
| Top Industries | ||
| Real Estate Investment Trusts | 7.9% | |
| Oil & Gas | 5.7% | |
| Banks | 5.6% | |
| Semiconductors | 4.9% | |
| Retail | 4.9% | |
| Utilities | 4.0% | |
| Drugs & Pharmaceuticals | 3.8% | |
| Computer Software & Services | 3.5% | |
| Building | 3.2% | |
| Transportation | 3.1% | |
| Other Industries | 53.4% | |
| 100.0% | ||
| * | For purpose of listing top holdings, repurchase agreements are considered cash equivalents and are included as part of Other Holdings. |
5
Table of Contents
GARTMORE VARIABLE INSURANCE TRUST
GVIT SMALL CAP VALUE FUND
Statement of Investments — June 30, 2005 (Unaudited)
| Shares or Principal Amount | Value | ||||
| COMMON STOCKS (97.1%) | |||||
| Advertising Services (0.1%) | |||||
| R. H. Donnelley Corp. (b) | 7,300 | $ | 452,454 | ||
| Aerospace & Defense (1.0%) | |||||
| AAR Corp. (b) | 14,100 | 221,511 | |||
| BE Aerospace, Inc. (b) | 119,700 | 1,870,911 | |||
| Curtiss-Wright Corp. | 13,000 | 701,350 | |||
| Esterline Technologies Corp. (b) | 58,500 | 2,344,680 | |||
| HEICO Corp. | 7,400 | 173,234 | |||
| Kaman Corp., Class A | 26,700 | 481,668 | |||
| Moog, Inc., Class A (b) | 39,675 | 1,249,366 | |||
| Orbital Sciences Corp. (b) | 17,600 | 174,240 | |||
| Triumph Group, Inc. (b) | 8,200 | 285,032 | |||
| 7,501,992 | |||||
| Airlines (1.3%) | |||||
| Alaska Air Group, Inc. (b) | 90,900 | 2,704,275 | |||
| Continental Airlines, Inc., Class B (b) | 186,800 | 2,480,704 | |||
| ExpressJet Holdings, Inc. (b) | 167,100 | 1,422,021 | |||
| Pinnacle Airlines Co. (b) | 69,400 | 596,146 | |||
| SkyWest, Inc. | 146,900 | 2,670,642 | |||
| 9,873,788 | |||||
| Alternative Power Generation (0.3%) | |||||
| Calpine Corp. (b) | 606,940 | 2,063,596 | |||
| Apparel (0.0%) | |||||
| Russell Corp. | 12,200 | 249,490 | |||
| Applications Software (0.1%) | |||||
| Progress Software Corp. (b) | 13,200 | 397,980 | |||
| Auto Dealers (0.1%) | |||||
| Lithia Motors, Inc., Class A | 24,300 | 701,055 | |||
| United Auto Group, Inc. | 6,400 | 190,720 | |||
| 891,775 | |||||
| Auto Parts & Equipment (1.2%) | |||||
| Aftermarket Technology Corp. (b) | 21,100 | 367,773 | |||
| American Axle & Manufacturing Holding, Inc. | 85,700 | 2,165,639 | |||
| Asbury Automotive Group, Inc. (b) | 54,600 | 841,386 | |||
| Exide Technologies (b) | 80,300 | 389,455 | |||
| Hayes Lemmerz International (b) | 30,500 | 217,160 | |||
| Keystone Automotive Industries, Inc. (b) | 6,800 | 168,164 | |||
| Navistar International Corp. (b) | 121,300 | 3,881,600 | |||
| Shares or Principal Amount | Value | ||||
| COMMON STOCKS (continued) | |||||
| Auto Parts & Equipment (continued) | |||||
| Superior Industries International, Inc. | 8,200 | $ | 194,340 | ||
| Tenneco Automotive, Inc. (b) | 59,200 | 985,088 | |||
| Visteon Corp. | 26,300 | 158,589 | |||
| 9,369,194 | |||||
| Banks (5.6%) | |||||
| ABC Bancorp | 7,880 | 142,470 | |||
| Amcore Financial, Inc. | 50,200 | 1,499,976 | |||
| Americanwest Bancorp (b) | 5,000 | 99,750 | |||
| Amgey Bancorp, Inc. | 35,700 | 798,966 | |||
| BancFirst Corp. | 4,200 | 365,358 | |||
| Bank of the Ozarks, Inc. | 8,400 | 275,856 | |||
| Banner Corp. | 4,300 | 120,443 | |||
| BOK Financial Corp. | 49,770 | 2,295,392 | |||
| Capitol Bancorp Ltd. | 8,200 | 275,602 | |||
| Cathay General Bancorp | 9,300 | 313,503 | |||
| Central Pacific Financial Corp. | 78,100 | 2,780,359 | |||
| Chemical Financial Corp. | 22,655 | 750,107 | |||
| City Holding Co. | 5,400 | 197,208 | |||
| Colonial Bancgroup, Inc. | 122,200 | 2,695,731 | |||
| Columbia Banking System, Inc. | 8,330 | 205,085 | |||
| Community Bank System, Inc. | 29,500 | 719,505 | |||
| Community Trust Bancorp, Inc. | 7,870 | 257,506 | |||
| Corus Bankshares, Inc. | 33,400 | 1,853,366 | |||
| Cullen/Frost Bankers, Inc. | 19,700 | 938,705 | |||
| East West Bancorp, Inc. | 59,300 | 1,991,887 | |||
| Eurobancshares, Inc. (b) | 17,500 | 280,875 | |||
| Financial Institutions, Inc. | 2,000 | 36,040 | |||
| First BanCorp. | 62,100 | 2,493,314 | |||
| First Citizens BancShares, Class A | 2,378 | 343,740 | |||
| First Oak Brook Bank | 4,200 | 118,524 | |||
| First Republic Bancorp, Inc. | 21,250 | 750,763 | |||
| Fremont General Corp. | 26,600 | 647,178 | |||
| Gold Banc Corp. | 54,900 | 798,795 | |||
| Great Southern Bancorp, Inc. | 7,300 | 228,417 | |||
| Greater Bay Bancorp | 26,500 | 698,805 | |||
| Hanmi Financial Corp. | 90,800 | 1,516,360 | |||
| Iberiabank Corp. | 23,200 | 1,429,352 | |||
| Independent Bank Corp. (Mass.) | 26,000 | 733,460 | |||
| Independent Bank Corp. (Mich.) | 25,960 | 738,302 | |||
| Irwin Financial Corp. | 30,300 | 672,357 | |||
| Lakeland Financial Corp. | 1,100 | 44,748 | |||
| Mainsource Financial Group, Inc. | 3,496 | 63,243 | |||
6
Table of Contents
GARTMORE VARIABLE INSURANCE TRUST
GVIT SMALL CAP VALUE FUND
Statement of Investments — June 30, 2005 (Unaudited) (continued)
| Shares or Principal Amount | Value | ||||
| COMMON STOCKS (continued) | |||||
| Banks (continued) | |||||
| MB Financial, Inc. | 4,950 | $ | 197,159 | ||
| MBT Financial Corp. | 6,200 | 119,350 | |||
| Mercantile Bank Corp. | 9,490 | 417,275 | |||
| Mid-State Bancshares | 17,500 | 485,975 | |||
| Nara Bankcorp, Inc. | 2,200 | 32,296 | |||
| Old Second Bancorp, Inc. | 3,500 | 101,815 | |||
| Oriental Financial Group | 132,000 | 2,014,320 | |||
| Pacific Capital Bancorp | 3,145 | 116,617 | |||
| Peoples Bancorp, Inc. | 5,000 | 133,750 | |||
| Prosperity Bancshares, Inc. | 11,800 | 337,598 | |||
| Provident Bankshares Corp. | 17,500 | 558,425 | |||
| R & G Financial Corp., Class B | 113,550 | 2,008,700 | |||
| Republic Bancorp, Inc. | 71,047 | 1,064,284 | |||
| Republic Bancorp, Inc., Class A | 4,625 | 100,409 | |||
| Royal Bancshares of Pennsylvania, Class A | 4,853 | 115,259 | |||
| SCBT Financial Corp. | 3,995 | 126,442 | |||
| Security Bank Corp | 2,800 | 64,120 | |||
| Simmons First National Corp., Class A | 7,100 | 192,481 | |||
| Southside Bancshares, Inc. | 8,100 | 166,050 | |||
| Southwest Bancorp | 5,500 | 112,640 | |||
| State Financial Services Corp. | 10,700 | 430,782 | |||
| Sterling Bancshares, Inc. | 6,600 | 102,696 | |||
| Sterling Financial Corp. | 18,612 | 396,622 | |||
| Summit Bancshares, Inc. | 16,100 | 278,530 | |||
| Sun Bancorp, Inc. (b) | 5,071 | 104,818 | |||
| Taylor Capital Group, Inc. | 9,100 | 357,175 | |||
| Texas Regional Bancshares, Inc. | 20,300 | 618,744 | |||
| Trico Bancshares | 6,400 | 142,976 | |||
| Umpqua Holdings Corp. | 13,983 | 329,160 | |||
| United Bankshares, Inc. | 21,300 | 758,493 | |||
| W Holding Co., Inc. | 48,991 | 500,688 | |||
| West Coast Bancorp | 41,700 | 1,017,897 | |||
| Western Sierra Bancorp (b) | 3,400 | 115,090 | |||
| 43,789,684 | |||||
| Broadcast Media & Television (1.5%) | |||||
| 4Kids Entertainment, Inc. (b) | 1,800 | 35,784 | |||
| Citadel Broadcasting Corp. (b) | 164,200 | 1,880,090 | |||
| Cumulus Media, Inc. (b) | 326,200 | 3,842,636 | |||
| Emmis Communications Corp. (b) | 125,300 | 2,214,051 | |||
| Entravision Communications Corp. (b) | 7,350 | 57,257 | |||
| Mediacom Communications, Class A (b) | 24,300 | 166,941 | |||
| Shares or Principal Amount | Value | ||||
| COMMON STOCKS (continued) | |||||
| Broadcast Media & Television (continued) | |||||
| Radio One, Inc. (b) | 274,100 | $ | 3,500,257 | ||
| Saga Communications, Inc. (b) | 9,100 | 127,400 | |||
| Sinclair Broadcast Group, Inc. | 5,300 | 48,124 | |||
| 11,872,540 | |||||
| Building (3.2%) | |||||
| Apogee Enterprises, Inc. | 179,700 | 2,761,989 | |||
| Baker (Michael) Corp. (b) | 49,400 | 882,284 | |||
| Beazer Homes USA, Inc. | 5,400 | 308,610 | |||
| Building Materials Holding Corp. | 7,400 | 512,746 | |||
| Dycom Industries, Inc. (b) | 2,700 | 53,487 | |||
| Fleetwood Enterprises, Inc. (b) | 219,800 | 2,230,970 | |||
| Genlyte Group, Inc. (b) | 43,900 | 2,139,686 | |||
| Lennox International, Inc. | 42,500 | 899,725 | |||
| Levitt Corp., Class A | 13,475 | 403,172 | |||
| Meritage Corp. (b) | 8,700 | 691,650 | |||
| NCI Building Systems (b) | 14,600 | 478,880 | |||
| Texas Industries, Inc. | 34,900 | 1,962,427 | |||
| Universal Forest Products, Inc. | 30,300 | 1,255,935 | |||
| USG Corp. (b) | 15,900 | 675,750 | |||
| Watsco, Inc. | 6,800 | 289,680 | |||
| WCI Communities, Inc. (b) | 158,000 | 5,060,740 | |||
| York International Corp. | 99,410 | 3,777,580 | |||
| 24,385,311 | |||||
| Business Services (0.7%) | |||||
| BISYS Group, Inc. (The) (b) | 19,300 | 288,342 | |||
| CCC Information Services Group, Inc. (b) | 42,300 | 1,013,085 | |||
| CRA International, Inc. (b) | 4,200 | 226,170 | |||
| First Marblehead Corp. (The) (b) | 35,600 | 1,248,136 | |||
| infoUSA, Inc. | 4,300 | 50,310 | |||
| Peoplesupport, Inc. (b) | 177,654 | 1,620,204 | |||
| Spherion Corp. (b) | 46,000 | 303,600 | |||
| StarTek. | 4,100 | 67,322 | |||
| TALX. | 6,100 | 176,351 | |||
| Viad Corp | 3,700 | 104,858 | |||
| 5,098,378 | |||||
| Casinos & Gambling (0.3%) | |||||
| Alliance Gaming Corp. (b) | 86,300 | 1,209,926 | |||
| Ameristar Casinos, Inc. | 13,600 | 354,824 | |||
| Aztar Corp. (b) | 9,300 | 318,525 | |||
| Isle of Capris Casino (b) | 8,000 | 209,600 | |||
| 2,092,875 | |||||
7
Table of Contents
GARTMORE VARIABLE INSURANCE TRUST
GVIT SMALL CAP VALUE FUND
Statement of Investments — June 30, 2005 (Unaudited) (continued)
| Shares or Principal Amount | Value | ||||
| COMMON STOCKS (continued) | |||||
| Chemicals (2.3%) | |||||
| Albemarle Corp. | 45,200 | $ | 1,648,444 | ||
| Crompton Corp. | 163,400 | 2,312,110 | |||
| Cytec Industries, Inc. | 2,300 | 91,540 | |||
| FMC Corp. (b) | 33,400 | 1,875,076 | |||
| Georgia Gulf Corp. | 21,600 | 670,680 | |||
| Great Lakes Chemical Corp. | 61,100 | 1,922,817 | |||
| H. B. Fuller Co. | 25,400 | 865,124 | |||
| Hercules, Inc. (b) | 63,800 | 902,770 | |||
| Minerals Technologies, Inc. | 9,900 | 609,840 | |||
| Mykrolis Corp (b) | 5,500 | 78,155 | |||
| Newmarket Corp. (b) | 18,700 | 276,573 | |||
| Octel Corp. | 51,700 | 930,600 | |||
| PolyOne Corp. (b) | 257,500 | 1,704,650 | |||
| Terra Industries, Inc. (b) | 147,700 | 1,005,837 | |||
| Valhi, Inc. | 103,406 | 1,809,605 | |||
| W.R. Grace & Co. (b) | 53,000 | 412,870 | |||
| Wellman, Inc. | 32,600 | 332,194 | |||
| 17,448,885 | |||||
| Coal (1.0%) | |||||
| Alpha Natural Resources, Inc. (b) | 50,110 | 1,196,627 | |||
| Arch Coal, Inc. | 39,300 | 2,140,671 | |||
| Massey Energy Co. | 122,700 | 4,628,244 | |||
| 7,965,542 | |||||
| Commercial Services (0.8%) | |||||
| Arbitron, Inc. | 3,300 | 141,570 | |||
| Century Business Services, Inc. (b) | 26,300 | 106,515 | |||
| Clark, Inc. | 6,800 | 97,444 | |||
| Consolidated Graphics, Inc. (b) | 5,000 | 203,850 | |||
| LodgeNet Entertainment Corp. (b) | 35,600 | 590,604 | |||
| Maximus, Inc. | 3,400 | 119,986 | |||
| NCO Group, Inc. (b) | 7,100 | 153,573 | |||
| PHH Corp. (b) | 92,000 | 2,366,240 | |||
| Quanta Services, Inc. (b) | 177,700 | 1,563,760 | |||
| TeleTech Holdings, Inc. (b) | 36,300 | 295,845 | |||
| Vertrue, Inc. (b) | 2,100 | 81,816 | |||
| Volt Information Sciences, Inc. (b) | 5,100 | 121,023 | |||
| 5,842,226 | |||||
| Communications Technology (0.5%) | |||||
| CIENA Corp. (b) | 70,600 | 147,554 | |||
| CommScope, Inc. (b) | 22,300 | 388,243 | |||
| Digi International, Inc. (b) | 67,800 | 804,108 | |||
| Harris Corp. | 60,200 | 1,878,842 | |||
| Shares or Principal Amount | Value | ||||
| COMMON STOCKS (continued) | |||||
| Communications Technology (continued) | |||||
| Inter-Tel, Inc. | 22,000 | $ | 409,420 | ||
| Powerwave Technologies, Inc. (b) | 6,800 | 69,496 | |||
| 3,697,663 | |||||
| Computer Software & Services (3.5%) | |||||
| Agilysys, Inc. | 88,200 | 1,384,740 | |||
| Ansoft Corp. (b) | 45,200 | 1,092,032 | |||
| Black Box Corp. | 47,300 | 1,674,420 | |||
| Borland Software Corp. (b) | 185,690 | 1,273,833 | |||
| Brocade Communications Systems, Inc. (b) | 127,000 | 492,760 | |||
| CACI International, Inc. (b) | 3,700 | 233,692 | |||
| Ciber, Inc. (b) | 28,300 | 225,834 | |||
| Covansys Corp (b) | 9,300 | 119,505 | |||
| Electronics for Imaging, Inc. (b) | 12,700 | 267,208 | |||
| FactSet Research Systems, Inc. | 46,800 | 1,677,312 | |||
| Gateway, Inc. (b) | 297,900 | 983,070 | |||
| Hutchinson Technology, Inc. (b) | 54,300 | 2,091,093 | |||
| Internet Security Systems, Inc. (b) | 3,900 | 79,131 | |||
| iPass, Inc. (b) | 257,200 | 1,558,632 | |||
| Komag, Inc. (b) | 10,800 | 306,396 | |||
| Magma Design Automation, Inc. (b) | 4,100 | 34,276 | |||
| ManTech International Corp. (b) | 9,100 | 282,464 | |||
| Manugistics Group, Inc. (b) | 408,200 | 726,596 | |||
| Maxtor Corp. (b) | 437,310 | 2,274,012 | |||
| Mcdata Corp., Class A (b) | 596,100 | 2,384,400 | |||
| Mcdata Corp., Class B (b) | 5,700 | 21,204 | |||
| MTS Systems Corp. | 30,200 | 1,014,116 | |||
| NetIQ Corp. (b) | 12,100 | 137,335 | |||
| Palmone, Inc. (b) | 46,800 | 1,393,236 | |||
| Parametric Technology Corp. (b) | 79,600 | 507,848 | |||
| Perot Systems Corp., Class A (b) | 40,000 | 568,800 | |||
| Quantum Corp. (b) | 63,900 | 189,783 | |||
| RadiSys Corp. (b) | 9,100 | 146,965 | |||
| Silicon Graphics, Inc. (b) | 99,300 | 70,503 | |||
| Silicon Storage Technology, Inc. (b) | 15,700 | 63,271 | |||
| Sykes Enterprises, Inc. (b) | 206,500 | 1,957,620 | |||
| Synnex Corp. (b) | 3,000 | 52,530 | |||
| Synopsys, Inc. (b) | 66,700 | 1,111,889 | |||
| TTM Technologies (b) | 8,100 | 61,641 | |||
| Tyler Technologies, Inc. (b) | 19,300 | 145,908 | |||
| United Online, Inc. | 16,300 | 177,018 | |||
| 26,781,073 | |||||
8
Table of Contents
GARTMORE VARIABLE INSURANCE TRUST
GVIT SMALL CAP VALUE FUND
Statement of Investments — June 30, 2005 (Unaudited) (continued)
| Shares or Principal Amount | Value | ||||
| COMMON STOCKS (continued) | |||||
| Computer Technology (0.4%) | |||||
| Cray, Inc. (b) | 586,770 | $ | 727,595 | ||
| Creative Technology Ltd. ADR-SG | 114,800 | 741,608 | |||
| Intergraph Corp. (b) | 4,500 | 155,070 | |||
| Western Digital Corp. (b) | 89,300 | 1,198,406 | |||
| 2,822,679 | |||||
| Construction (0.9%) | |||||
| Comstock Homebuilding Cos., Class A (b) | 45,600 | 1,104,432 | |||
| MasTec, Inc. (b) | 165,100 | 1,452,880 | |||
| Newmark Homes Corp. | 32,400 | 786,672 | |||
| Terex Corp. (b) | 11,100 | 437,340 | |||
| Washington Group International, Inc. (b) | 55,900 | 2,857,608 | |||
| 6,638,932 | |||||
| Consulting Services (0.6%) | |||||
| Bearingpoint, Inc. (b) | 280,000 | 2,052,400 | |||
| Gartner Group, Inc., Class A (b) | 29,300 | 311,166 | |||
| Tetra Technology, Inc. (b) | 161,200 | 2,181,036 | |||
| 4,544,602 | |||||
| Consumer Products (1.2%) | |||||
| American Greetings Corp. | 18,900 | 500,850 | |||
| Applica, Inc. (b) | 13,300 | 42,959 | |||
| CSS Industries, Inc. | 3,123 | 105,682 | |||
| Department 56, Inc. (b) | 4,500 | 46,125 | |||
| Elizabeth Arden, Inc. (b) | 78,400 | 1,833,777 | |||
| Intertape Polymer Group, Inc. (b) | 163,470 | 1,665,759 | |||
| RC2 Corp. (b) | 14,700 | 552,279 | |||
| Snap-On, Inc. | 48,100 | 1,649,830 | |||
| Spectrum Brands, Inc. (b) | 22,700 | 749,100 | |||
| Toro Co. | 27,000 | 1,042,470 | |||
| Tupperware Corp. | 27,200 | 635,664 | |||
| Water Pik Technologies, Inc. (b) | 6,300 | 120,015 | |||
| 8,944,510 | |||||
| Containers & Packaging (0.6%) | |||||
| Chesapeake Corp. | 24,100 | 504,654 | |||
| Crown Holdings, Inc. (b) | 28,400 | 404,132 | |||
| Greif, Inc., Class A | 16,800 | 1,026,480 | |||
| Silgan Holdings, Inc. | 25,300 | 1,422,872 | |||
| Smurfit-Stone Container Corp. (b) | 99,000 | 1,006,830 | |||
| 4,364,968 | |||||
| Shares or Principal Amount | Value | ||||
| COMMON STOCKS (continued) | |||||
| Distribution & Wholesale (0.3%) | |||||
| Aviall, Inc. (b) | 35,400 | $ | 1,118,286 | ||
| Brightpoint, Inc. (b) | 9,400 | 208,586 | |||
| NuCo2, Inc. (b) | 19,370 | 497,228 | |||
| United Stationers, Inc. (b) | 17,500 | 859,250 | |||
| 2,683,350 | |||||
| Drugs & Pharmaceuticals (3.8%) | |||||
| Adolor Corp. (b) | 18,900 | 174,825 | |||
| Alexion Pharmaceuticals, Inc. (b) | 7,700 | 177,408 | |||
| Alpharma, Inc., Class A | 15,900 | 230,073 | |||
| Atherogenics, Inc. (b) | 21,904 | 350,026 | |||
| Auxilium Pharmaceuticals, Inc. (b) | 15,900 | 75,843 | |||
| Biovail Corp. ADR-CA (b) | 147,150 | 2,283,768 | |||
| Cephalon, Inc. (b) | 209,300 | 8,332,233 | |||
| Cypress Bioscience, Inc. (b) | 40,600 | 535,920 | |||
| Impax Laboratories, Inc. (b) | 94,500 | 1,483,650 | |||
| IVAX Corp. (b) | 343,600 | 7,387,400 | |||
| King Pharmaceuticals, Inc. (b) | 16,800 | 175,056 | |||
| Kos Pharmaceuticals, Inc. (b) | 28,500 | 1,866,750 | |||
| Par Pharmaceutical Cos., Inc. (b) | 50,270 | 1,599,089 | |||
| Rigel Pharmaceuticals, Inc. (b) | 7,600 | 151,392 | |||
| Savient Pharmaceuticals, Inc. (b) | 526,200 | 2,320,542 | |||
| Telik, Inc. (b) | 116,858 | 1,900,111 | |||
| Valeant Pharmaceuticals Intl. | 9,400 | 165,722 | |||
| 29,209,808 | |||||
| Electronics (1.7%) | |||||
| Amis Holdings, Inc. (b) | 12,100 | 161,414 | |||
| Applied Micro Circuits Corp. (b) | 84,900 | 217,344 | |||
| Ariba, Inc. (b) | 55,900 | 324,220 | |||
| Bel Fuse, Class B | 9,800 | 299,488 | |||
| Bell Microproducts (b) | 2,400 | 22,560 | |||
| Benchmark Electronics, Inc. (b) | 20,550 | 625,131 | |||
| CTS Corp. | 31,100 | 382,219 | |||
| DRS Technologies. | 9,400 | 482,032 | |||
| EarthLink, Inc. (b) | 58,200 | 504,012 | |||
| Entegris, Inc. (b) | 35,252 | 348,995 | |||
| Integrated Device Technology, Inc. (b) | 49,200 | 528,900 | |||
| LeCroy Corp. (b) | 52,100 | 716,375 | |||
| Mobility Electronics, Inc. (b) | 118,800 | 1,087,020 | |||
| Remec, Inc. (b) | 1,715 | 10,976 | |||
| Riverstone Networks, Inc. (b) | 2 | 1 | |||
| Sanmina Corp. (b) | 974,000 | 5,327,780 | |||
9
Table of Contents
GARTMORE VARIABLE INSURANCE TRUST
GVIT SMALL CAP VALUE FUND
Statement of Investments — June 30, 2005 (Unaudited) (continued)
| Shares or Principal Amount | Value | ||||
| COMMON STOCKS (continued) | |||||
| Electronics (continued) | |||||
| Stoneridge, Inc. (b) | 6,900 | $ | 45,540 | ||
| Sypris Solutions, Inc. | 11,900 | 147,203 | |||
| Trimble Navigation Ltd. (b) | 2,100 | 81,837 | |||
| Vishay Intertechnology, Inc. (b) | 61,500 | 730,005 | |||
| WESCO International, Inc. (b) | 30,800 | 966,504 | |||
| 13,009,556 | |||||
| Engineering (0.0%) | |||||
| Emcor Group, Inc. (b) | 4,200 | 205,380 | |||
| Finance (2.2%) | |||||
| Accredited Home Lenders Holding Co. (b) | 12,600 | 554,400 | |||
| Advance America Cash Advance Centers, Inc. | 223,910 | 3,582,560 | |||
| Advanta Corp., Class B | 115,922 | 3,264,364 | |||
| Capital Corp. of the West | 3,960 | 109,890 | |||
| CompuCredit Corp. (b) | 16,800 | 575,904 | |||
| Credit Acceptance Corp. (b) | 3,600 | 53,604 | |||
| Dollar Financial Corp. (b) | 9,300 | 98,673 | |||
| Doral Financial Corp. | 66,300 | 1,096,602 | |||
| eSPEED, Inc. (b) | 2,400 | 21,384 | |||
| Financial Federal Corp. | 11,200 | 432,768 | |||
| Investment Technology Group (b) | 108,900 | 2,289,078 | |||
| John H. Harland Co. | 27,700 | 1,052,600 | |||
| Metris Cos., Inc. (b) | 94,570 | 1,367,482 | |||
| New Century Financial Corp. | 8,200 | 421,890 | |||
| Svb Financial Group (b) | 8,200 | 392,780 | |||
| Triad Guaranty, Inc. (b) | 14,324 | 721,786 | |||
| World Acceptance Corp. (b) | 36,300 | 1,090,815 | |||
| 17,126,580 | |||||
| Foods (1.6%) | |||||
| Chiquita Brands International, Inc. | 58,500 | 1,606,410 | |||
| Corn Products International, Inc. | 19,300 | 458,568 | |||
| Flowers Foods, Inc. | 9,100 | 321,776 | |||
| J & J Snack Foods Corp. | 4,700 | 246,045 | |||
| Nasch-Finch Co. | 5,900 | 216,766 | |||
| NBTY, Inc. (b) | 3,400 | 88,196 | |||
| Performance Food Group Co. (b) | 68,590 | 2,072,104 | |||
| Pilgrim’s Pride Corp. | 65,800 | 2,245,754 | |||
| Ralcorp Holding, Inc. | 8,200 | 337,430 | |||
| Sanderson Farms, Inc. | 46,400 | 2,108,416 | |||
| Seaboard Corp. | 1,400 | 2,329,600 | |||
| Sensient Technologies Corp. | 5,000 | 103,050 | |||
| 12,134,115 | |||||
| Shares or Principal Amount | Value | ||||
| COMMON STOCKS (continued) | |||||
| Funeral Services (0.1%) | |||||
| Alderwoods Group, Inc. (b) | 16,700 | $ | 239,979 | ||
| Stewart Enterprises, Inc., Class A | 104,000 | 680,160 | |||
| 920,139 | |||||
| Healthcare (2.0%) | |||||
| Amedisys, Inc. (b) | 29,900 | 1,099,722 | |||
| Gentiva Health Services (b) | 10,900 | 194,674 | |||
| Healthtronics Surgical Services, Inc. (b) | 351,406 | 4,564,763 | |||
| Kindred Healthcare, Inc. (b) | 31,600 | 1,251,676 | |||
| LCA-Vision, Inc. | 9,200 | 445,832 | |||
| Magellan Health Services (b) | 6,400 | 225,984 | |||
| Odyssey Healthcare, Inc. (b) | 92,100 | 1,328,082 | |||
| Omnicare, Inc. | 29,500 | 1,251,685 | |||
| Pediatrix Medical Group, Inc. (b) | 16,500 | 1,213,410 | |||
| Res-Care, Inc. (b) | 6,600 | 89,496 | |||
| Sierra Health Services, Inc. (b) | 3,900 | 278,694 | |||
| WebMD Corp. (b) | 320,300 | 3,289,481 | |||
| Zoll Medical Corp. (b) | 20,950 | 533,178 | |||
| 15,766,677 | |||||
| Hotels & Motels (0.1%) | |||||
| Felcor Lodging Trust, Inc. (b) | 43,100 | 624,088 | |||
| Household Furnishings (0.6%) | |||||
| American Woodmark Corp. | 61,000 | 1,830,610 | |||
| Bassett Furniture Industries | 84,800 | 1,599,328 | |||
| Furniture Brands International, Inc. | 5,900 | 127,499 | |||
| Hooker Furniture Corp. | 56,000 | 978,320 | |||
| Kimball International, Inc., Class B | 17,600 | 232,320 | |||
| La-Z-Boy, Inc. | 9,500 | 138,415 | |||
| 4,906,492 | |||||
| Identification Systems (0.0%) | |||||
| American Bank Note Holograph (b) (b) | 87 | 357 | |||
| Checkpoint Systems, Inc. (b) | 13,500 | 238,950 | |||
| Paxar Corp. (b) | 3,500 | 62,125 | |||
| 301,432 | |||||
| Industrial Specialties (0.2%) | |||||
| Graftech International Ltd. (b) | 357,600 | 1,537,680 | |||
| Instruments (0.4%) | |||||
| Analogic Corp. | 11,000 | 553,520 | |||
| Photon Dynamics, Inc. (b) | 91,200 | 1,879,632 | |||
10
Table of Contents
GARTMORE VARIABLE INSURANCE TRUST
GVIT SMALL CAP VALUE FUND
Statement of Investments — June 30, 2005 (Unaudited) (continued)
| Shares or Principal Amount | Value | ||||
| COMMON STOCKS (continued) | |||||
| Instruments (continued) | |||||
| Watts Industries | 12,100 | $ | 405,229 | ||
| 2,838,381 | |||||
| Insurance (1.8%) | |||||
| American Physicians Capital, Inc. (b) | 1,409 | 52,344 | |||
| Aspen Insurance Holdings Ltd. | 102,075 | 2,813,187 | |||
| Delphi Financial Group | 32,950 | 1,454,743 | |||
| Phoenix Co., Inc. | 119,900 | 1,426,810 | |||
| Pxre Group Ltd. | 50,100 | 1,263,522 | |||
| Scottish Annuity & Life Holdings | 115,100 | 2,790,024 | |||
| U.S.I. Holdings Corp. (b) | 83,400 | 1,074,192 | |||
| UICI | 17,900 | 532,883 | |||
| United Fire & Casualty Corp. | 55,300 | 2,456,426 | |||
| Universal American Financial Corp. (b) | 15,400 | 348,348 | |||
| 14,212,479 | |||||
| Insurance: Property—Casualty (2.5%) | |||||
| Arch Capital Group Ltd. (b) | 46,500 | 2,094,825 | |||
| Argonaut Group, Inc. (b) | 23,900 | 551,851 | |||
| Baldwin & Lyons, Inc., Class B | 4,700 | 113,270 | |||
| Bristol West Holdings, Inc. | 29,300 | 536,190 | |||
| Direct General Corp. | 10,600 | 197,266 | |||
| First American Corp. | 94,400 | 3,789,216 | |||
| Infinity Property & Casualty Corp. | 13,000 | 453,440 | |||
| LandAmerica Financial Group, Inc. | 19,700 | 1,169,589 | |||
| Midland Co. | 8,800 | 309,672 | |||
| Navigators Group, Inc. (The) (b) | 2,900 | 100,253 | |||
| PMA Capital Corp., Class A (b) | 97,700 | 862,691 | |||
| ProAssurance Corp. (b) | 2,200 | 91,872 | |||
| RLI Corp. | 8,200 | 365,720 | |||
| Safety Insurance Group, Inc. | 63,000 | 2,126,880 | |||
| Selective Insurance Group, Inc. | 17,900 | 886,945 | |||
| State Auto Financial Corp. | 6,800 | 211,072 | |||
| Stewart Information Services Corp. | 24,100 | 1,012,200 | |||
| Tower Group, Inc. | 171,600 | 2,682,108 | |||
| Zenith National Insurance Co. | 28,400 | 1,927,224 | |||
| 19,482,284 | |||||
| Internet Software/Services (0.6%) | |||||
| Art Technology Group, Inc. (b) | 490,700 | 515,235 | |||
| Infospace, Inc. (b) | 4,900 | 161,357 | |||
| Redback Networks, Inc. (b) | 13,800 | 88,044 | |||
| Shares or Principal Amount | Value | ||||
| COMMON STOCKS (continued) | |||||
| Internet Software/Services (continued) | |||||
| Safeguard Scientifics, Inc. (b) | 1,800 | $ | 2,304 | ||
| Valueclick, Inc. (b) | 153,100 | 1,887,723 | |||
| Webmethods, Inc. (b) | 313,600 | 1,756,160 | |||
| 4,410,823 | |||||
| Investment Banks & Brokers (1.7%) | |||||
| Affiliated Managers Group, Inc. (b) | 72,550 | 4,957,341 | |||
| American Capital Strategies Ltd. | 62,700 | 2,264,097 | |||
| E*TRADE Group, Inc. (b) | 256,100 | 3,582,839 | |||
| Greenhill & Co., Inc. | 1,100 | 44,561 | |||
| Knight Capital Group, Inc., Class A (b) | 92,250 | 702,945 | |||
| LaBranche & Co., Inc. (b) | 110,680 | 697,284 | |||
| Piper Jaffray Cos. (b) | 5,400 | 164,322 | |||
| Technology Investment Capital Corp. | 55,437 | 820,468 | |||
| 13,233,857 | |||||
| Lasers—System & Components (0.3%) | |||||
| Coherent, Inc. (b) | 50,400 | 1,814,904 | |||
| Electro Scientific Industries, Inc. (b) | 8,900 | 159,132 | |||
| 1,974,036 | |||||
| Leisure (0.1%) | |||||
| Argosy Gaming Co. (b) | 9,100 | 424,151 | |||
| K2, Inc. (b) | 17,800 | 225,704 | |||
| Six Flags, Inc. (b) | 24,300 | 112,995 | |||
| 762,850 | |||||
| Linen Supply & Related Items (0.6%) | |||||
| Angelica Corp. | 32,700 | 801,477 | |||
| Unifirst Corp. | 86,900 | 3,522,926 | |||
| 4,324,403 | |||||
| Machinery (1.7%) | |||||
| AGCO Corp. (b) | 49,400 | 944,528 | |||
| Applied Industrial Technologies, Inc. | 82,600 | 2,667,154 | |||
| Astec Industries, Inc. (b) | 4,800 | 111,312 | |||
| Cascade Corp. | 10,300 | 445,475 | |||
| Flowserve Corp. (b) | 10,500 | 317,730 | |||
| Gardner Denver Machinery, Inc. (b) | 1,800 | 63,144 | |||
| Imation Corp. | 7,700 | 298,683 | |||
| JLG Industries, Inc. | 61,600 | 1,692,768 | |||
| Joy Global, Inc. | 10,500 | 352,695 | |||
11
Table of Contents
GARTMORE VARIABLE INSURANCE TRUST
GVIT SMALL CAP VALUE FUND
Statement of Investments — June 30, 2005 (Unaudited) (continued)
| Shares or Principal Amount | Value | ||||
| COMMON STOCKS (continued) | |||||
| Machinery (continued) | |||||
| Kadant, Inc. (b) | 1,600 | $ | 35,088 | ||
| Kennametal, Inc. | 20,100 | 921,585 | |||
| NACCO Industries, Inc., Class A | 5,000 | 536,100 | |||
| Regal-Beloit Corp. | 11,700 | 341,172 | |||
| Sauer-Danfoss, Inc. | 13,000 | 231,010 | |||
| Tecumseh Products Co. | 73,600 | 2,019,584 | |||
| Thomas Industries, Inc. | 45,000 | 1,798,200 | |||
| 12,776,228 | |||||
| Manufacturing (1.8%) | |||||
| A.O. Smith Corp. | 19,000 | 507,490 | |||
| Actuant Corp. (b) | 11,100 | 532,134 | |||
| Acuity Brands, Inc. | 18,000 | 462,420 | |||
| Ameron International Corp. | 6,500 | 243,100 | |||
| Barnes Group, Inc. | 29,100 | 963,210 | |||
| ESCO Technologies, Inc. (b) | 6,200 | 624,960 | |||
| Federal Signal Corp. | 89,300 | 1,393,080 | |||
| Griffon Corp. (b) | 17,600 | 390,720 | |||
| Jacuzzi Brands, Inc. (b) | 47,900 | 513,967 | |||
| Maverick Tube Corp. (b) | 100,170 | 2,985,066 | |||
| Quanex Corp. | 27,900 | 1,478,979 | |||
| Walter Industries, Inc. | 103,200 | 4,148,640 | |||
| 14,243,766 | |||||
| Marketing Services (0.0%) | |||||
| aQuantive, Inc. (b) | 14,500 | 256,940 | |||
| E.Piphany, Inc. (b) | 11,000 | 38,280 | |||
| 295,220 | |||||
| Medical & Dental Instruments & Supplies (0.8%) | |||||
| CONMED Corp. (b) | 21,200 | 652,324 | |||
| Invacare Corp. | 2,200 | 97,592 | |||
| Kyphon, Inc. (b) | 11,600 | 403,564 | |||
| Neurometrix, Inc. (b) | 22,100 | 442,663 | |||
| Palatin Technologies, Inc. (b) | 5,800 | 10,150 | |||
| PSS World Medical, Inc. (b) | 26,900 | 334,905 | |||
| Quidel Corp. (b) | 435,570 | 2,256,253 | |||
| STERIS Corp. | 10,700 | 275,739 | |||
| Surmodics, Inc. (b) | 1,100 | 47,707 | |||
| Viasys Healthcare, Inc. (b) | 64,200 | 1,450,278 | |||
| 5,971,175 | |||||
| Medical—Biomedical & Genetic (0.7%) | |||||
| Adeza Biomedical Corp. (b) | 64,600 | 1,096,908 | |||
| Bio-Rad Laboratories, Inc., Class A (b) | 34,700 | 2,054,587 | |||
| Shares or Principal Amount | Value | ||||
| COMMON STOCKS (continued) | |||||
| Medical—Biomedical & Genetic (continued) | |||||
| Celera Genomics Group (b) | 9,900 | $ | 108,603 | ||
| Cell Genesys, Inc. (b) | 6,500 | 34,775 | |||
| Cytokinetics, Inc. (b) | 20,500 | 142,475 | |||
| Enzon Pharmaceuticals, Inc. (b) | 272,700 | 1,767,096 | |||
| Genelabs Technologies (b) | 102,655 | 51,328 | |||
| Human Genome Sciences, Inc. (b) | 7,600 | 88,008 | |||
| 5,343,780 | |||||
| Medical Information Systems (0.5%) | |||||
| Alliance Imaging, Inc. (b) | 19,100 | 199,786 | |||
| Computer Programs & Systems, Inc. | 12,100 | 450,967 | |||
| NDCHealth Corp. | 154,730 | 2,780,498 | |||
| PER-SE Technologies, Inc. (b) | 24,800 | 521,296 | |||
| 3,952,547 | |||||
| Metals (1.1%) | |||||
| Circor International, Inc. | 11,300 | 278,771 | |||
| Cleveland-Cliffs, Inc. | 17,600 | 1,016,576 | |||
| Commercial Metals Co. | 98,200 | 2,339,124 | |||
| Mine Safety Appliances Co. | 11,700 | 540,540 | |||
| NN, Inc. | 23,800 | 301,784 | |||
| Ryerson Tull, Inc. | 102,800 | 1,466,956 | |||
| Timken Co. | 69,370 | 1,602,447 | |||
| Valmont Industries, Inc. | 29,100 | 750,780 | |||
| Wolverine Tube, Inc. (b) | 75,000 | 440,250 | |||
| 8,737,228 | |||||
| Motor Homes (0.1%) | |||||
| Winnebago Industries, Inc. | 29,500 | 966,125 | |||
| Multimedia (0.1%) | |||||
| Carmike Cinemas, Inc. | 4,113 | 126,187 | |||
| Primedia, Inc. (b) | 94,900 | 384,345 | |||
| 510,532 | |||||
| Music (0.0%) | |||||
| Steinway Musical Instruments, Inc. (b) | 12,100 | 355,256 | |||
| Networking Products (0.7%) | |||||
| Adaptec, Inc. (b) | 63,300 | 245,604 | |||
| Anixter International, Inc. (b) | 14,100 | 524,097 | |||
| Enterasys Networks, Inc. (b) | 1,197,600 | 1,077,840 | |||
| Foundry Networks, Inc. (b) | 125,780 | 1,085,481 | |||
| Hypercom Corp. (b) | 7,700 | 49,819 | |||
| Safenet, Inc. (b) | 67,045 | 2,283,553 | |||
| 5,266,394 | |||||
12
Table of Contents
GARTMORE VARIABLE INSURANCE TRUST
GVIT SMALL CAP VALUE FUND
Statement of Investments — June 30, 2005 (Unaudited) (continued)
| Shares or Principal Amount | Value | ||||
| COMMON STOCKS (continued) | |||||
| Office Equipment & Services (0.1%) | |||||
| Global Imaging Systems, Inc. (b) | 1,800 | $ | 57,348 | ||
| Imagistics International, Inc (b) | 16,100 | 450,800 | |||
| 508,148 | |||||
| Oil & Gas (5.7%) | |||||
| Airgas, Inc. | 76,400 | 1,884,788 | |||
| Cal Dive International, Inc. (b) | 4,100 | 214,717 | |||
| Chesapeake Energy Corp. | 129,400 | 2,950,320 | |||
| Cimarex Energy Co. (b) | 37,485 | 1,458,541 | |||
| Comstock Resources, Inc. (b) | 21,100 | 533,619 | |||
| Energen Corp. | 55,400 | 1,941,770 | |||
| Energy Partners Ltd. (b) | 11,900 | 311,899 | |||
| Giant Industries, Inc. (b) | 1,600 | 57,600 | |||
| Global Industries Ltd. (b) | 246,400 | 2,094,400 | |||
| Hanover Compressor Co. (b) | 11,800 | 135,818 | |||
| Harvest Natural Resources, Inc. (b) | 11,200 | 122,416 | |||
| Houston Exploration Co. (b) | 13,500 | 716,175 | |||
| KCS Energy, Inc. (b) | 125,900 | 2,186,883 | |||
| Key Energy Services, Inc. (b) | 428,255 | 5,199,015 | |||
| Lone Star Technologies, Inc. (b) | 37,000 | 1,683,500 | |||
| Meridian Resource Corp. (b) | 313,900 | 1,500,442 | |||
| New Jersey Resources Corp. | 40,100 | 1,934,825 | |||
| Northwest Natural Gas Co. | 61,200 | 2,340,288 | |||
| Oceaneering International, Inc. (b) | 6,300 | 243,495 | |||
| Oil States International, Inc. (b) | 25,600 | 644,352 | |||
| RPC Energy Services, Inc. | 13,250 | 224,190 | |||
| SEACOR Holdings, Inc. (b) | 23,900 | 1,536,770 | |||
| South Jersey Industries, Inc. | 22,200 | 1,356,864 | |||
| Stone Energy Corp. (b) | 92,600 | 4,528,140 | |||
| Swift Energy Co. (b) | 95,400 | 3,417,228 | |||
| Tesoro Petroleum Corp. | 59,000 | 2,744,680 | |||
| Todco (b) | 55,000 | 1,411,850 | |||
| Universal Compression Holdings (b) | 9,100 | 329,784 | |||
| Veritas DGC, Inc. (b) | 18,700 | 518,738 | |||
| Vintage Petroleum, Inc. | 25,300 | 770,891 | |||
| 44,993,998 | |||||
| Paints & Coatings (0.0%) | |||||
| Kronos Worldwide, Inc. | 432 | 13,042 | |||
| Paper & Related Products (0.3%) | |||||
| Glatfelter | 87,291 | 1,082,408 | |||
| Rock-Tenn Co. | 10,500 | 132,825 | |||
| Schweitzer-Mauduit International, Inc. | 24,700 | 768,911 | |||
| Shares or Principal Amount | Value | ||||
| COMMON STOCKS (continued) | |||||
| Paper & Related Products (continued) | |||||
| Wausau-Mosinee Paper Corp. | 22,400 | $ | 268,352 | ||
| 2,252,496 | |||||
| Plastics (0.2%) | |||||
| Myers Industries, Inc. | 118,800 | 1,485,000 | |||
| Poultry (0.0%) | |||||
| Gold Kist, Inc. (b) | 7,000 | 151,060 | |||
| Private Corrections (0.1%) | |||||
| Geo Group, Inc. (The) (b) | 19,200 | 480,960 | |||
| Publishing (1.1%) | |||||
| Banta Corp. | 4,200 | 190,512 | |||
| Journal Register Co. (b) | 9,100 | 159,341 | |||
| ProQuest Co. (b) | 146,325 | 4,797,997 | |||
| Scholastic Corp. (b) | 67,900 | 2,617,545 | |||
| Valassis Communications, Inc. (b) | 9,500 | 351,975 | |||
| 8,117,370 | |||||
| Racetracks (0.1%) | |||||
| Speedway Motorsports, Inc. | 28,500 | 1,041,960 | |||
| Railroads (0.1%) | |||||
| Genesee & Wyoming, Inc. (b) | 29,000 | 789,090 | |||
| Real Estate (0.1%) | |||||
| HomeStore.com, Inc. (b) | 68,000 | 138,040 | |||
| Jones Lang Lasalle, Inc. (b) | 12,600 | 557,298 | |||
| 695,338 | |||||
| Real Estate Investment Trusts (7.9%) | |||||
| Affordable Residential Communities | 33,400 | 445,890 | |||
| Alexander’s, Inc. (b) | 14,400 | 3,582,000 | |||
| Alexandria Real Estate Equities, Inc. | 8,800 | 646,360 | |||
| American Financial Realty Trust | 78,900 | 1,213,482 | |||
| American Home Mortgage Investment Corp. | 91,289 | 3,191,463 | |||
| Amli Residential Properties Trust | 33,300 | 1,040,958 | |||
| Anthracite Capital, Inc. | 94,800 | 1,123,380 | |||
| Ashford Hospitality Trust | 236,800 | 2,557,440 | |||
| Boykin Lodging Co. (b) | 10,200 | 136,680 | |||
| Capital Automotive | 34,700 | 1,324,499 | |||
| Capital Trust, Inc., Class A | 8,900 | 297,349 | |||
| CarrAmerica Realty Corp. | 91,300 | 3,303,234 | |||
| Eagle Materials, Inc. | 7,100 | 657,389 | |||
| ECC Capital Corp. | 265,200 | 1,766,232 | |||
| Equity Inns, Inc. | 206,300 | 2,743,790 | |||
13
Table of Contents
GARTMORE VARIABLE INSURANCE TRUST
GVIT SMALL CAP VALUE FUND
Statement of Investments — June 30, 2005 (Unaudited) (continued)
| Shares or Principal Amount | Value | ||||
| COMMON STOCKS (continued) | |||||
| Real Estate Investment Trusts (continued) | |||||
| Essex Property Trust, Inc. | 13,900 | $ | 1,154,534 | ||
| First Potomac Realty Trust | 8,800 | 218,240 | |||
| Gables Residential Trust | 39,400 | 1,703,262 | |||
| Glimcher Realty Trust | 117,800 | 3,268,950 | |||
| Government Properties Trust | 29,500 | 286,740 | |||
| Impac Mortgage Holdings | 39,300 | 732,945 | |||
| IndyMac Bancorp, Inc. | 93,900 | 3,824,546 | |||
| InnKeepers USA Trust | 83,400 | 1,245,996 | |||
| Kilroy Realty Corp. | 3,700 | 175,713 | |||
| Lasalle Hotel Properties | 83,800 | 2,749,478 | |||
| Lexington Corporate Properties Trust | 80,300 | 1,952,093 | |||
| LTC Properties, Inc. | 33,300 | 689,310 | |||
| Maguire Properties, Inc. | 30,600 | 867,204 | |||
| MeriStar Hospitality Corp. (b) | 130,200 | 1,119,720 | |||
| MFA Mortgage Investments, Inc. | 26,900 | 200,405 | |||
| Mid-America Apartment Communities, Inc. | 53,500 | 2,429,970 | |||
| National Health Investors, Inc. | 48,900 | 1,372,623 | |||
| Nationwide Health Properties, Inc. | 117,700 | 2,778,897 | |||
| Novastar Financial, Inc. | 12,100 | 473,715 | |||
| Parkway Properties, Inc. | 12,100 | 605,121 | |||
| Pennsylvania Real Estate Investment Trust | 33,700 | 1,600,750 | |||
| Prentiss Properties Trust | 35,600 | 1,297,264 | |||
| Rait Investment Trust | 37,600 | 1,126,120 | |||
| Saul Centers, Inc. | 23,500 | 854,225 | |||
| Senior Housing Properties Trust | 50,300 | 951,173 | |||
| Sun Communities, Inc. | 21,100 | 784,709 | |||
| Taubman Centers, Inc. | 60,900 | 2,076,081 | |||
| Urstadt Biddle Properties, Class A | 5,000 | 86,600 | |||
| Ventas, Inc. | 33,000 | 996,600 | |||
| 61,653,130 | |||||
| Rental & Leasing Services (0.4%) | |||||
| Aaron Rents, Inc. | 30,050 | 747,945 | |||
| Dollar Thrifty Automotive Group, Inc. (b) | 21,900 | 831,762 | |||
| Electro Rent Corp. (b) | 8,104 | 117,832 | |||
| Rent-A-Center, Inc. (b) | 10,300 | 239,887 | |||
| Rent-Way, Inc. (b) | 32,100 | 315,864 | |||
| United Rentals, Inc. (b) | 36,700 | 741,707 | |||
| 2,994,997 | |||||
| Research & Development (0.1%) | |||||
| PAREXEL International Corp. (b) | 7,900 | 156,815 | |||
| Shares or Principal Amount | Value | ||||
| COMMON STOCKS (continued) | |||||
| Research & Development (continued) | |||||
| URS Corp. (b) | 12,100 | $ | 451,935 | ||
| 608,750 | |||||
| Restaurants (0.8%) | |||||
| Bob Evans Farms | 1,700 | 39,644 | |||
| Cosi, Inc. (b) | 94,720 | 651,674 | |||
| Jack in the Box, Inc. (b) | 26,500 | 1,004,880 | |||
| Landry’s Seafood Restaurants, Inc. | 38,400 | 1,155,456 | |||
| Luby’s Cafeteria, Inc. (b) | 4,000 | 47,800 | |||
| O’Charleys, Inc. (b) | 13,200 | 233,112 | |||
| Papa John’s International, Inc. (b) | 6,800 | 271,796 | |||
| Ruby Tuesday, Inc. | 48,800 | 1,263,920 | |||
| Ryans Restaurant Group, Inc. (b) | 126,700 | 1,775,067 | |||
| 6,443,349 | |||||
| Retail (4.9%) | |||||
| Aeropostale, Inc. (b) | 18,200 | 611,520 | |||
| Afc Enterprises, Inc. | 59,300 | 781,574 | |||
| American Eagle Outfitters, Inc. | 41,200 | 1,262,780 | |||
| Big Lots, Inc. (b) | 152,200 | 2,015,128 | |||
| Bombay Co., Inc. (b) | 41,700 | 237,690 | |||
| Brown Shoe Co., Inc. | 12,600 | 493,290 | |||
| Build-A-Bear-Workshop, Inc. (b) | 6,800 | 159,460 | |||
| Burlington Coat Factory Warehouse Corp. | 21,200 | 903,968 | |||
| Casey’s General Stores, Inc. | 11,000 | 218,020 | |||
| Cash America International, Inc. | 158,800 | 3,195,056 | |||
| Charming Shoppes, Inc. (b) | 111,000 | 1,035,630 | |||
| Cole (Kenneth) Productions, Inc. | 10,800 | 336,096 | |||
| Cost Plus, Inc. (b) | 152,000 | 3,790,880 | |||
| CSK Auto Corp. (b) | 19,600 | 326,928 | |||
| Dollar Tree Stores, Inc. (b) | 176,600 | 4,238,399 | |||
| Dress Barn, Inc. (b) | 24,200 | 547,646 | |||
| Genesco, Inc. (b) | 34,100 | 1,264,769 | |||
| Great Atlantic & Pacific Tea Co., Inc. (The) (b) | 13,400 | 389,404 | |||
| Insight Enterprises, Inc. (b) | 11,500 | 232,070 | |||
| J. Jill Group, Inc. (b) | 158,810 | 2,183,638 | |||
| Jo-Ann Stores, Inc. (b) | 14,000 | 369,460 | |||
| Linen ‘n Things, Inc. (b) | 30,000 | 709,800 | |||
| Men’s Wearhouse, Inc. (The) (b) | 7,500 | 258,225 | |||
| Movado Group, Inc. | 10,100 | 190,688 | |||
| Movie Gallery, Inc. | 90,785 | 2,399,448 | |||
| Pantry, Inc. (b) | 5,700 | 220,761 | |||
| Pathmark Stores, Inc. (b) | 16,600 | 145,416 | |||
14
Table of Contents
GARTMORE VARIABLE INSURANCE TRUST
GVIT SMALL CAP VALUE FUND
Statement of Investments — June 30, 2005 (Unaudited) (continued)
| Shares or Principal Amount | Value | ||||
| COMMON STOCKS (continued) | |||||
| Retail (continued) | |||||
| Payless Shoesource, Inc. (b) | 21,900 | $ | 420,480 | ||
| Radioshack Corp. | 57,100 | 1,323,007 | |||
| Rex Stores Corp. (b) | 85,600 | 1,236,920 | |||
| ShopKo Stores, Inc. (b) | 74,000 | 1,798,940 | |||
| Smart & Final, Inc. (b) | 21,300 | 260,925 | |||
| Sonic Automotive, Inc. | 5,000 | 106,300 | |||
| Sports Authority, Inc. (The) (b) | 4,200 | 133,560 | |||
| Stage Stores, Inc. (b) | 15,500 | 675,800 | |||
| Systemax, Inc. (b) | 21,000 | 141,120 | |||
| Too, Inc. (b) | 19,900 | 465,063 | |||
| Trans World Entertainment Corp. (b) | 100,600 | 1,190,098 | |||
| West Marine, Inc. (b) | 66,660 | 1,203,880 | |||
| Zale Corp. (b) | 13,000 | 411,970 | |||
| 37,885,807 | |||||
| Savings & Loans (2.4%) | |||||
| Bankatlantic Bancorp, Inc. | 40,900 | 775,055 | |||
| Bankunited Financial Corp. | 13,091 | 353,981 | |||
| Commercial Capital Bancorp | 11,666 | 194,939 | |||
| Commercial Federal Corp. | 10,700 | 360,376 | |||
| Dime Community Bancshares | 16,150 | 245,480 | |||
| Downey Financial Corp. | 17,200 | 1,259,040 | |||
| First Financial Holdings, Inc. | 4,800 | 143,568 | |||
| First Niagara Financial Group, Inc. | 68,996 | 1,005,962 | |||
| First Place Financial Corp. | 1,371 | 27,543 | |||
| FirstFed Financial Corp. (b) | 35,200 | 2,098,272 | |||
| Flagstar Bancorp | 20,200 | 382,386 | |||
| Franklin Bank Corp. (b) | 114,040 | 2,139,390 | |||
| ITLA Capital Corp. (b) | 4,700 | 253,330 | |||
| MAF Bancorp, Inc. | 18,443 | 786,225 | |||
| Ocwen Financial Corp. (b) | 20,400 | 137,904 | |||
| Partners Trust Financial Group | 18,200 | 194,376 | |||
| Sterling Financial Corp. (b) | 39,270 | 1,468,698 | |||
| Tierone Corp. | 15,400 | 417,802 | |||
| Westcorp | 117,300 | 6,148,866 | |||
| WSFS Financial Corp. | 7,900 | 432,209 | |||
| 18,825,402 | |||||
| Schools (1.1%) | |||||
| Career Education Corp. (b) | 179,500 | 6,571,495 | |||
| Corinthian Colleges, Inc. (b) | 156,900 | 2,003,613 | |||
| 8,575,108 | |||||
| Seismic Data Collection (0.1%) | |||||
| Input/Output, Inc. (b) | 138,160 | 867,645 | |||
| Shares or Principal Amount | Value | ||||
| COMMON STOCKS (continued) | |||||
| Semiconductors (4.9%) | |||||
| Actel Corp. (b) | 17,200 | $ | 239,080 | ||
| Amkor Technology, Inc. (b) | 16,000 | 72,000 | |||
| Atmel Corp. (b) | 1,627,100 | 3,856,227 | |||
| Axcelis Technologies, Inc. (b) | 712,600 | 4,888,436 | |||
| Bookham, Inc. (b) | 315,550 | 1,000,294 | |||
| Brooks Automation, Inc. (b) | 212,600 | 3,157,110 | |||
| Cirrus Logic, Inc. (b) | 9,300 | 49,383 | |||
| Cohu, Inc. | 9,300 | 186,465 | |||
| Conexant Systems, Inc. (b) | 965,800 | 1,554,938 | |||
| Credence Systems Corp. (b) | 38,600 | 349,330 | |||
| Cypress Semiconductor Corp. (b) | 347,600 | 4,376,284 | |||
| Dsp Group, Inc. (b) | 11,700 | 279,279 | |||
| Emulex Corp. (b) | 10,000 | 182,600 | |||
| Exar Corp. (b) | 7,200 | 107,208 | |||
| Fairchild Semiconductor Corp. (b) | 308,875 | 4,555,906 | |||
| Genesis Microchip, Inc. (b) | 9,800 | 180,908 | |||
| Intergrated Silicon Solution (b) | 14,800 | 109,668 | |||
| Lattice Semiconductor Corp. (b) | 30,500 | 135,420 | |||
| LTX Corp. (b) | 640,800 | 3,178,368 | |||
| Mattson Technology, Inc. (b) | 127,400 | 912,184 | |||
| MKS Instruments, Inc. (b) | 22,300 | 376,647 | |||
| On Semiconductor Corp. (b) | 420,200 | 1,932,920 | |||
| Photronics, Inc. (b) | 16,200 | 378,108 | |||
| Skyworks Solutions, Inc. (b) | 27,300 | 201,201 | |||
| Standard Microsystems Corp. (b) | 6,800 | 158,984 | |||
| Veeco Instruments, Inc. (b) | 88,400 | 1,439,152 | |||
| Vitesse Semiconductor Corp. (b) | 24,500 | 51,205 | |||
| Zoran Corp. (b) | 315,100 | 4,187,679 | |||
| 38,096,984 | |||||
| Steel (0.9%) | |||||
| Allegheny Technologies, Inc. | 114,630 | 2,528,738 | |||
| NS Group, Inc. (b) | 12,100 | 393,371 | |||
| Oregon Steel Mills, Inc. (b) | 7,600 | 130,796 | |||
| Reliance Steel & Aluminum Co. | 19,600 | 726,572 | |||
| Schnitzer Steel Industries, Inc. | 7,800 | 184,860 | |||
| Shaw Group, Inc. (b) | 93,270 | 2,006,238 | |||
| Steel Dynamics | 29,400 | 771,750 | |||
| 6,742,325 | |||||
| Telecommunications (2.5%) | |||||
| Agere Systems, Inc. (b) | 102,510 | 1,230,120 | |||
| Arris Group, Inc. (b) | 14,400 | 125,424 | |||
15
Table of Contents
GARTMORE VARIABLE INSURANCE TRUST
GVIT SMALL CAP VALUE FUND
Statement of Investments — June 30, 2005 (Unaudited) (continued)
| Shares or Principal Amount | Value | ||||
| COMMON STOCKS (continued) | |||||
| Telecommunications (continued) | |||||
| Asiainfo Holdings, Inc. (b) | 5,900 | $ | 32,509 | ||
| Broadwing Corp. (b) | 30,580 | 141,280 | |||
| C-COR.net Corp. (b) | 5,600 | 38,360 | |||
| Centennial Communications (b) | 6,506 | 90,303 | |||
| Comtech Telecommunications (b) | 55,650 | 1,815,860 | |||
| Ditech Communications Corp. (b) | 13,000 | 84,370 | |||
| Dobson Communications Corp., Class A (b) | 1,780,800 | 7,586,207 | |||
| General Communication, Inc. (b) | 18,700 | 184,569 | |||
| ITC Deltacom, Inc. (b) | 43,500 | 36,975 | |||
| MRV Communications, Inc. (b) | 40,800 | 88,536 | |||
| Newport Corp. (b) | 6,500 | 90,090 | |||
| NII Holdings, Inc. (b) | 35,800 | 2,289,052 | |||
| North Pittsburgh Systems, Inc. | 9,100 | 177,996 | |||
| Premiere Global Services, Inc. (b) | 117,100 | 1,322,059 | |||
| Primus Telecommunications Group, Inc. (b) | 33,600 | 21,168 | |||
| Sycamore Networks, Inc. (b) | 29,300 | 101,085 | |||
| Talk America Holdings, Inc. (b) | 17,400 | 174,174 | |||
| UbiquiTel, Inc. (b) | 441,400 | 3,601,824 | |||
| Utstarcom, Inc. (b) | 17,800 | 133,322 | |||
| 19,365,283 | |||||
| Textiles (0.2%) | |||||
| Interface (b) | 110,000 | 885,500 | |||
| Kellwood Co. | 20,200 | 543,380 | |||
| Quiksilver, Inc. (b) | 29,600 | 473,008 | |||
| 1,901,888 | |||||
| Therapeutics (0.1%) | |||||
| Avanir Pharmaceuticals, Class A (b) | 149,200 | 417,760 | |||
| United Therapeutics Corp. (b) | 12,000 | 578,400 | |||
| 996,160 | |||||
| Tobacco (0.3%) | |||||
| Alliance One International, Inc. | 59,800 | 359,398 | |||
| Universal Corp. | 38,700 | 1,694,286 | |||
| 2,053,684 | |||||
| Toys (0.2%) | |||||
| JAKKS Pacific, Inc. (b) | 45,100 | 866,371 | |||
| Marvel Enterprises, Inc. (b) | 50,500 | 995,860 | |||
| 1,862,231 | |||||
| Shares or Principal Amount | Value | ||||
| COMMON STOCKS (continued) | |||||
| Transportation (3.1%) | |||||
| AMERCO | 5,800 | $ | 310,590 | ||
| Arkansas Best Corp. | 6,000 | 190,860 | |||
| Covenant Transport, Inc., Class A (b) | 11,700 | 154,440 | |||
| EGL, Inc. (b) | 155,100 | 3,151,632 | |||
| Gatx Corp. | 27,700 | 955,650 | |||
| Greenbrier Cos., Inc. | 6,800 | 184,280 | |||
| Hornbeck Offshore Services, Inc. (b) | 30,700 | 831,663 | |||
| Hub Group, Inc., Class A (b) | 44,400 | 1,112,220 | |||
| Interpool, Inc. | 12,500 | 268,125 | |||
| Laidlaw International (b) | 86,900 | 2,094,290 | |||
| Offshore Logistics, Inc. (b) | 73,500 | 2,413,740 | |||
| Overnite Corp. | 16,000 | 687,680 | |||
| Overseas Shipholding Group, Inc. | 29,500 | 1,759,675 | |||
| RailAmerica, Inc. (b) | 253,681 | 3,018,804 | |||
| SCS Transportation, Inc. (b) | 94,000 | 1,673,200 | |||
| Swift Transportation Co., Inc. (b) | 21,280 | 495,611 | |||
| Tidewater, Inc. | 97,000 | 3,697,640 | |||
| U.S. Xpress Enterprises, Inc. (b) | 14,600 | 173,886 | |||
| Werner Enterprises, Inc. | 23,700 | 465,468 | |||
| 23,639,454 | |||||
| Travel Services (0.0%) | |||||
| Navigant International, Inc. (b) | 19,300 | 283,517 | |||
| Utilities (4.0%) | |||||
| Allegheny Energy, Inc. (b) | 73,000 | 1,841,060 | |||
| American States Water Co. | 68,500 | 2,011,845 | |||
| Atmos Energy Corp. | 16,000 | 460,800 | |||
| Avista Corp. | 14,600 | 271,414 | |||
| Black Hills Corp. | 15,600 | 574,860 | |||
| California Water Service Group | 6,700 | 251,518 | |||
| CH Energy Group, Inc. | 10,300 | 500,889 | |||
| Charter Communications, Inc. (b) | 122,900 | 145,022 | |||
| Cincinnati Bell, Inc. (b) | 164,500 | 707,350 | |||
| Cleco Corp. | 19,700 | 424,929 | |||
| CMS Energy Corp. (b) | 177,280 | 2,669,837 | |||
| Commonwealth Telephone Enterprises, Inc. | 5,900 | 247,269 | |||
| CT Communications, Inc. | 40,100 | 523,305 | |||
| Duquesne Light Holdings. | 65,200 | 1,217,936 | |||
| El Paso Electric Co. (b) | 45,900 | 938,655 | |||
| Idacorp, Inc. | 14,400 | 441,072 | |||
| Insight Communications Co., Inc. (b) | 23,600 | 260,780 | |||
| NICOR, Inc. | 2,100 | 86,457 | |||
16
Table of Contents
GARTMORE VARIABLE INSURANCE TRUST
GVIT SMALL CAP VALUE FUND
Statement of Investments — June 30, 2005 (Unaudited) (continued)
| Shares or Principal Amount | Value | |||||
| COMMON STOCKS (continued) | ||||||
| Utilities (continued) | ||||||
| PNM Resource, Inc. | 45,650 | $ | 1,315,177 | |||
| Sierra Pacific Resources (b) | 346,700 | 4,316,414 | ||||
| SJW Corp. | 2,000 | 94,020 | ||||
| Southern Union Co. (b) | 44,900 | 1,102,295 | ||||
| Southwest Gas Corp. | 46,700 | 1,191,317 | ||||
| Southwestern Energy Co. (b) | 87,100 | 4,091,958 | ||||
| Time Warner Telecom, Inc. (b) | 28,500 | 168,720 | ||||
| Uil Holdings Corp. | 3,400 | 182,954 | ||||
| UniSource Energy Corp. | 55,000 | 1,691,250 | ||||
| Westar Energy, Inc. | 130,500 | 3,135,915 | ||||
| 30,865,018 | ||||||
| Wire and Cable Products (0.1%) | ||||||
| Encore Wire Corp. (b) | 18,450 | 213,836 | ||||
| General Cable Corp. (b) | 17,100 | 253,593 | ||||
| 467,429 | ||||||
| Total Common Stocks | 749,829,421 | |||||
| CASH EQUIVALENTS (2.3%) | ||||||
| Investments in repurchase agreements (Collateralized by AA Corporate Bonds, in a joint trading account at 3.34%, dated 06/30/05, due 07/01/05, repurchase price $17,415,930) | $ | 17,414,314 | 17,414,314 | |||
| Total Cash Equivalents | 17,414,314 | |||||
| Shares or Principal Amount | Value | ||||
| U.S. TREASURY NOTES (0.1%) | |||||
| United States Treasury Note, 1.875%, 11/30/05 (c) | 530,000 | $ | 526,915 | ||
| Total U.S. Treasury Notes | 526,915 | ||||
| WARRANT (0.0%) | |||||
| Electrical Equipment (0.0%) | |||||
| Del Global Tech Corp. | 66 | 98 | |||
| Total Warrant | 98 | ||||
| Total Investments (Cost $732,345,615) (a) — 99.5% | 767,770,748 | ||||
| Other assets in excess of liabilities — 0.5% | 3,638,478 | ||||
| NET ASSETS — 100.0% | $ | 771,409,226 | |||
| (a) | See notes to financial statements for tax unrealized appreciation (depreciation) of securities. |
| (b) | Denotes a non-income producing security. |
| (c) | Collateral for futures. |
| ADR | American Depositary Receipt |
| CA | Canada |
| SG | Singapore |
At June 30, 2005 the Fund’s open futures contracts were as follows:
Number of Contracts | Long Contracts | Expiration | Market Value Covered by Contracts | Unrealized Appreciation/ (Depreciation) | ||||||
27 | Russell 2000 Future | 09/16/05 | $ | 8,681,850 | $ | 74,272 | ||||
See notes to financial statements.
17
Table of Contents
GARTMORE VARIABLE INSURANCE TRUST
GVIT SMALL CAP VALUE FUND
Statement of Assets and Liabilities
June 30, 2005 (Unaudited)
Assets: | |||
Investments, at value (cost $714,931,300) | $ | 750,356,434 | |
Repurchase agreements, at cost and value | 17,414,314 | ||
Total Investments | 767,770,748 | ||
Interest and dividends receivable | 804,314 | ||
Receivable for investments sold | 12,845,633 | ||
Prepaid expenses and other assets | 14,347 | ||
Total Assets | 781,435,042 | ||
Liabilities: | |||
Payable to custodian | 201,172 | ||
Payable for investments purchased | 9,189,481 | ||
Payable for variation margin on futures contracts | 12,785 | ||
Accrued expenses and other payables: | |||
Investment advisory fees | 505,783 | ||
Fund administration and transfer agent fees | 25,364 | ||
Distribution fees | 9,045 | ||
Administrative servicing fees | 82,038 | ||
Other | 148 | ||
Total Liabilities | 10,025,816 | ||
Net Assets | $ | 771,409,226 | |
Represented by: | |||
Capital | $ | 693,430,680 | |
Accumulated net investment income (loss) | 739,392 | ||
Accumulated net realized gain (losses) from investment and futures transactions | 41,739,749 | ||
Net unrealized appreciation (depreciation) on investments and futures | 35,499,405 | ||
Net Assets | $ | 771,409,226 | |
Net Assets: | |||
Class I Shares | $ | 671,406,180 | |
Class II Shares | 44,642,879 | ||
Class III Shares | 1,649,943 | ||
Class IV Shares | 53,710,224 | ||
Total | $ | 771,409,226 | |
Shares outstanding (unlimited number of shares authorized): | |||
Class I Shares | 55,161,872 | ||
Class II Shares | 3,694,171 | ||
Class III Shares | 135,358 | ||
Class IV Shares | 4,412,306 | ||
Total | 63,403,707 | ||
Net asset value and offering price per share:* | |||
Class I Shares | $ | 12.17 | |
Class II Shares | $ | 12.08 | |
Class III Shares | $ | 12.19 | |
Class IV Shares | $ | 12.17 |
| * | Not subject to a front-end sales charge. |
For the Six Months Ended June 30, 2005 (Unaudited)
Investment Income: | ||||
Interest income | $ | 160,386 | ||
Dividend income | 4,908,688 | |||
Total Income | 5,069,074 | |||
Expenses: | ||||
Investment advisory fees | 3,321,111 | |||
Fund administration and transfer agent fees | 256,203 | |||
Distribution fees Class II Shares | 51,272 | |||
Administrative servicing fees | 485,580 | |||
Administrative servicing fees | 29,763 | |||
Administrative servicing fees | 1,200 | |||
Administrative servicing fees | 37,721 | |||
Other** | 146,832 | |||
Total Expenses | 4,329,682 | |||
Net Investment Income (Loss) | 739,392 | |||
REALIZED/UNREALIZED GAINS (LOSSES) ON INVESTMENTS: | ||||
Net realized gains (losses) on investment transactions | 52,416,190 | |||
Net realized gains (losses) on futures | (81,749 | ) | ||
Net realized gains (losses) on investment and futures transactions | 52,334,441 | |||
Net change in unrealized appreciation/depreciation on investments and futures | (65,209,601 | ) | ||
Net realized/unrealized gains (losses) on investments | (12,875,160 | ) | ||
CHANGE IN NET ASSETS RESULTING FROM OPERATIONS | $ | (12,135,768 | ) | |
| ** | Other expenses may include the following fees: audit, custody, insurance, legal, printing, trustee, and out-of-pocket expenses. |
See notes to financial statements.
18
Table of Contents
GARTMORE VARIABLE INSURANCE TRUST
GVIT SMALL CAP VALUE FUND
Statement of Changes in Net Assets
Six Months Ended June 30, 2005 | Year Ended December 31, 2004 | |||||||
| (Unaudited) | ||||||||
From Investment Activities: | ||||||||
Operations: | ||||||||
Net investment income (loss) | $ | 739,392 | $ | (758,959 | ) | |||
Net realized gains (losses) on investment and futures transactions | 52,334,441 | 134,254,078 | ||||||
Net change in unrealized appreciation/depreciation on investments and futures | (65,209,601 | ) | (7,929,037 | ) | ||||
Change in net assets resulting from operations | (12,135,768 | ) | 125,566,082 | |||||
Distributions to Class I shareholders from: | ||||||||
Net investment income | — | (1,502 | ) | |||||
Net realized gains on investments | (16,895,441 | ) | (52,316,633 | ) | ||||
Distributions to Class II shareholders from: | ||||||||
Net realized gains on investments | (1,132,630 | ) | (2,917,493 | ) | ||||
Distributions to Class III shareholders from: | ||||||||
Net investment income | — | (39 | ) | |||||
Net realized gains on investments | (41,489 | ) | (140,747 | ) | ||||
Distributions to Class IV shareholders from: | ||||||||
From net investment income | — | (1,114 | ) | |||||
From net realized gain on investment | (1,354,302 | ) | (4,060,239 | ) | ||||
Change in net assets from shareholder distributions | (19,423,862 | ) | (59,437,767 | ) | ||||
Change in net assets from capital transactions | (53,797,864 | ) | 699,628 | |||||
Change in net assets | (85,357,494 | ) | 66,827,943 | |||||
Net Assets: | ||||||||
Beginning of period | 856,766,720 | 789,938,777 | ||||||
End of period | $ | 771,409,226 | $ | 856,766,720 | ||||
CAPITAL TRANSACTIONS: | ||||||||
Class I Capital Transactions: | ||||||||
Proceeds from shares issued | $ | 19,383,227 | $ | 82,045,644 | ||||
Dividends reinvested | 16,895,428 | 52,318,109 | ||||||
Cost of shares redeemed | (91,442,114 | ) | (154,125,647 | ) | ||||
| (55,163,459 | ) | (19,761,894 | ) | |||||
Class II Capital Transactions: | ||||||||
Proceeds from shares issued | 8,646,401 | 22,405,469 | ||||||
Dividends reinvested | 1,132,630 | 2,917,492 | ||||||
Cost of shares redeemed | (5,450,900 | ) | (4,389,395 | ) | ||||
| 4,328,131 | 20,933,566 | |||||||
Class III Capital Transactions: | ||||||||
Proceeds from shares issued | 450,042 | 2,497,277 | ||||||
Dividends reinvested | 41,489 | 140,786 | ||||||
Cost of shares redeemed | (793,807 | ) | (3,277,456 | ) | ||||
| (302,276 | ) | (639,393 | ) | |||||
Class IV Capital Transactions: | ||||||||
Proceeds from shares issued | 1,471,871 | 7,649,124 | ||||||
Dividends reinvested | 1,354,301 | 4,061,351 | ||||||
Cost of shares redeemed | (5,486,432 | ) | (11,543,126 | ) | ||||
| (2,660,260 | ) | 167,349 | ||||||
Change in net assets from capital transactions | $ | (53,797,864 | ) | $ | 699,628 | |||
19
Table of Contents
GARTMORE VARIABLE INSURANCE TRUST
GVIT SMALL CAP VALUE FUND
Statement of Changes in Net Assets (continued)
Six Months Ended June 30, 2005 | Year Ended December 31, 2004 | |||||||
| (Unaudited) | ||||||||
SHARE TRANSACTIONS: | ||||||||
Class I Share Transactions: | ||||||||
Issued | $ | 1,592,764 | $ | 6,753,115 | ||||
Reinvested | 1,409,127 | 4,142,368 | ||||||
Redeemed | (7,607,135 | ) | (12,991,841 | ) | ||||
| (4,605,244 | ) | (2,096,358 | ) | |||||
Class II Share Transactions: | ||||||||
Issued | 720,569 | 1,868,697 | ||||||
Reinvested | 95,179 | 232,284 | ||||||
Redeemed | (452,541 | ) | (370,418 | ) | ||||
| 363,207 | 1,730,563 | |||||||
Class III Share Transactions: | ||||||||
Issued | 37,033 | 203,927 | ||||||
Reinvested | 3,457 | 11,129 | ||||||
Redeemed | (65,655 | ) | (276,458 | ) | ||||
| (25,165 | ) | (61,402 | ) | |||||
Class IV Share Transactions: | ||||||||
Issued | 121,535 | 634,685 | ||||||
Reinvested | 112,952 | 321,564 | ||||||
Redeemed | (458,048 | ) | (976,493 | ) | ||||
| (223,561 | ) | (20,244 | ) | |||||
See notes to financial statements.
20
Table of Contents
GARTMORE VARIABLE INSURANCE TRUST
Selected Data for Each Share of Capital Outstanding
GVIT Small Cap Value Fund
| Investment Activities | Distributions | Ratios/Supplemental Data | |||||||||||||||||||||||||||||||||||||||||||
| Net Asset Value, Beginning of Period | Net Investment Income (Loss) | Net Realized and Unrealized Gains (Losses) on Investments | Total from Investment Activities | Net Investment Income | Net Realized Gains (Losses) | Total Distributions | Net Asset Value, End of Period | Total Return | Net Assets at End of Period (000s) | Ratio of Expenses to Average Net Assets | Ratio of Net Investment Income (Loss) to Average Net Assets | Ratio of Expenses (Prior to Reimbursements) to Average Net Assets(a) | Ratio of Net Investment Income (Loss) (Prior to Reimbursements) to Average Net Assets(a) | Portfolio Turnover(b) | |||||||||||||||||||||||||||||||
Class I Shares | |||||||||||||||||||||||||||||||||||||||||||||
Year Ended December 31, 2000 | $ | 9.72 | (0.02 | ) | 1.06 | 1.04 | — | (2.06 | ) | (2.06 | ) | $ | 8.70 | 11.20 | % | $ | 280,110 | 1.05 | % | (0.31 | %) | 1.20 | % | (0.46 | %) | 181.85 | % | ||||||||||||||||||
Year Ended December 31, 2001(c) | $ | 8.70 | — | 2.44 | 2.44 | — | (0.78 | ) | (0.78 | ) | $ | 10.36 | 28.28 | % | $ | 697,860 | 1.05 | % | 0.04 | % | 1.15 | % | (0.06 | %) | 164.87 | % | |||||||||||||||||||
Year Ended December 31, 2002 | $ | 10.36 | — | (2.78 | ) | (2.78 | ) | — | (0.21 | ) | (0.21 | ) | $ | 7.37 | (27.16 | %) | $ | 467,165 | 1.11 | % | 0.01 | % | 1.11 | % | 0.01 | % | 127.77 | % | |||||||||||||||||
Year Ended December 31, 2003 | $ | 7.37 | (0.02 | ) | 4.21 | 4.19 | — | — | — | $ | 11.56 | 56.85 | % | $ | 715,099 | 1.11 | % | (0.18 | %) | (k) | (k) | 126.29 | % | ||||||||||||||||||||||
Year Ended December 31, 2004 | $ | 11.56 | (0.01 | ) | 2.01 | 2.00 | (h) | (0.94 | ) | (0.94 | ) | $ | 12.62 | 17.30 | % | $ | 754,412 | 1.11 | % | (0.09 | %) | (k) | (k) | 132.11 | % | ||||||||||||||||||||
Six Months Ended June 30, 2005 (Unaudited) | $ | 12.62 | 0.01 | (0.15 | ) | (0.14 | ) | — | (0.31 | ) | (0.31 | ) | $ | 12.17 | (1.04 | %)(i) | $ | 671,406 | 1.11 | %(j) | 0.11 | %(j) | (k) | (k) | 78.72 | % | |||||||||||||||||||
Class II Shares | |||||||||||||||||||||||||||||||||||||||||||||
Period Ended December 31, 2002(d) | $ | 10.26 | — | (2.68 | ) | (2.68 | ) | — | (0.21 | ) | (0.21 | ) | $ | 7.37 | (26.46 | %)(i) | $ | 1,472 | 1.32 | %(j) | 0.13 | %(j) | (k) | (k) | 127.77 | % | |||||||||||||||||||
Year Ended December 31, 2003(e) | $ | 7.37 | (0.04 | ) | 4.20 | 4.16 | — | — | — | $ | 11.53 | 56.45 | % | $ | 18,446 | 1.36 | % | (0.41 | %) | (k) | (k) | 126.29 | % | ||||||||||||||||||||||
Year Ended December 31, 2004 | $ | 11.53 | (0.03 | ) | 1.99 | 1.96 | — | (0.94 | ) | (0.94 | ) | $ | 12.55 | 17.00 | % | $ | 41,804 | 1.36 | % | (0.30 | %) | (k) | (k) | 132.11 | % | ||||||||||||||||||||
Six Months Ended June 30, 2005 (Unaudited) | $ | 12.55 | (0.01 | ) | (0.15 | ) | (0.16 | ) | — | (0.31 | ) | (0.31 | ) | $ | 12.08 | (1.20 | %)(i) | $ | 44,643 | 1.36 | %(j) | (0.13 | %)(j) | (k) | (k) | 78.72 | % | ||||||||||||||||||
Class III Shares | |||||||||||||||||||||||||||||||||||||||||||||
Period Ended December 31, 2002(f) | $ | 10.48 | — | (2.89 | ) | (2.89 | ) | — | (0.21 | ) | (0.21 | ) | $ | 7.38 | (27.88 | %)(i) | $ | 63 | 1.07 | %(j) | 0.60 | %(j) | (k) | (k) | 127.77 | % | |||||||||||||||||||
Year Ended December 31, 2003(e) | $ | 7.38 | (0.01 | ) | 4.20 | 4.19 | — | — | — | $ | 11.57 | 56.78 | % | $ | 2,568 | 1.11 | % | (0.13 | %) | (k) | (k) | 126.29 | % | ||||||||||||||||||||||
Year Ended December 31, 2004 | $ | 11.57 | (0.01 | ) | 2.02 | 2.01 | (h) | (0.94 | ) | (0.94 | ) | $ | 12.64 | 17.37 | % | $ | 2,029 | 1.11 | % | (0.09 | %) | (k) | (k) | 132.11 | % | ||||||||||||||||||||
Six Months Ended June 30, 2005 (Unaudited) | $ | 12.64 | 0.01 | (0.15 | ) | (0.14 | ) | — | (0.31 | ) | (0.31 | ) | $ | 12.19 | (1.03 | %)(i) | $ | 1,650 | 1.11 | %(j) | 0.10 | %(j) | (k) | (k) | 78.72 | % | |||||||||||||||||||
Class IV Shares | |||||||||||||||||||||||||||||||||||||||||||||
Period Ended December 31, 2003(g) | $ | 7.49 | (0.01 | ) | 4.08 | 4.07 | — | — | — | $ | 11.56 | 54.34 | %(i) | $ | 53,826 | 1.10 | %(j) | (0.18 | %)(j) | (k) | (k) | 126.29 | % | ||||||||||||||||||||||
Year Ended December 31, 2004 | $ | 11.56 | (0.01 | ) | 2.01 | 2.00 | (h) | (0.94 | ) | (0.94 | ) | $ | 12.62 | 17.30 | % | $ | 58,521 | 1.11 | % | (0.08 | %) | (k) | (k) | 132.11 | % | ||||||||||||||||||||
Six Months Ended June 30, 2005 (Unaudited) | $ | 12.62 | 0.01 | (0.15 | ) | (0.14 | ) | — | (0.31 | ) | (0.31 | ) | $ | 12.17 | (1.04 | %)(i) | $ | 53,710 | 1.11 | %(j) | 0.11 | %(j) | (k) | (k) | 78.72 | % | |||||||||||||||||||
| (a) | During the period certain fees were waived and/or reimbursed. If such waivers/reimbursements had not occurred, the ratios would have been as indicated. |
| (b) | Portfolio turnover is calculated on the basis of the Fund as a whole without distinguishing among the classes of shares. |
| (c) | The existing shares of the Fund were designated Class I shares as of May 1, 2001. |
| (d) | For the period from May 6, 2002 (commencement of operations) through December 31, 2002. |
| (e) | Net investment income (loss) is based on average shares outstanding during the period. |
| (f) | For the period from May 3, 2002 (commencement of operations) through December 31, 2002. |
| (g) | For the period from April 28, 2003 (commencement of operations) through December 31, 2003. |
| (h) | The amount is less than $0.005. |
| (i) | Not annualized. |
| (j) | Annualized. |
| (k) | There were no fee reductions during the period. |
See notes to financial statements.
21
Table of Contents
GARTMORE VARIABLE INSURANCE TRUST
NOTES TO FINANCIAL STATEMENTS (Unaudited)
June 30, 2005
1. Organization
Gartmore Variable Insurance Trust (“GVIT” or the “Trust”) is an open-end management investment company, organized under the laws of Delaware by an amended and restated Agreement and Declaration of Trust, dated October 28, 2004, as amended to date. The Trust, originally created under the laws of Massachusetts as a Massachusetts business trust pursuant to a Declaration of Trust dated, as of June 30, 1981, was subsequently amended, redomesticated as a Delaware Statutory Trust after the close of trading on April 29, 2005, and is registered under the Investment Company Act of 1940, as amended (the “1940 Act”). The redomestication is a change in statutory status and does not affect the operations of the Trust. As of June 30, 2005, the Trust had authorized an unlimited number of shares of beneficial interest (“shares”) without par value. The Trust currently offers shares to life insurance company separate accounts to fund the benefits under variable life insurance or annuity policies. To date, only the separate accounts of Nationwide Life Insurance Company and Nationwide Life and Annuity Insurance Company (collectively, “Nationwide”) have purchased shares of the Trust’s series. The Trust operates thirty-one (31) separate series, or mutual funds, each with its own investment objectives and strategies. This report contains the financial statements and financial highlights of the GVIT Small Cap Value Fund (the “Fund”).
Under the Trust’s organizational documents, the Trust’s officers and trustees are indemnified against certain liabilities arising out of the performance of their duties to the Trust. In addition, the Trust has entered into Indemnification Agreements with the Trust’s trustees and certain officers covering similar liabilities. In addition, in the normal course of business, the Trust enters into contracts with its vendors and others that provide for general indemnifications. The Trust’s maximum exposure under these arrangements is unknown, as this would involve future claims that may be made against the Trust. Based on experience, however, the Trust expects that risk of loss to be remote.
2. Summary of Significant Accounting Policies
The following is a summary of significant accounting policies followed by the Fund in the preparation of its financial statements. The policies are in conformity with accounting principles generally accepted in the United States of America (“GAAP”). The preparation of financial statements requires management to make estimates and assumptions that affect the reported amounts of assets and liabilities, the disclosure of contingent assets and liabilities at the date of the financial statements and the reported amounts of income and expenses for the period. Actual results could differ from those estimates.
| (a) | Security Valuation |
Securities for which market quotations are readily available are valued at current market value as of “Valuation Time.” Valuation Time is as of the close of regular trading on the New York Stock Exchange (usually 4 p.m. Eastern time). Equity securities are valued at the last quoted sale price or, if there is no sale price, the last quoted bid price provided by an independent pricing service approved by the Trust’s Board of Trustees. Securities traded on NASDAQ are valued at the NASDAQ official closing price. Prices are taken from the primary market or exchange in which each security trades. Most securities listed on a foreign exchange are valued either at fair value (see description below) or at the last sale price at the close of the exchange on which the security is principally traded. Foreign securities, currencies, and other assets and liabilities denominated in foreign currencies are translated into U.S. dollars at the exchange rate of said currencies against the U.S. Dollar, as of Valuation Time, as provided by an independent pricing service approved by the Board of Trustees.
Securities for which market quotations are not readily available, or for which an independent pricing service does not provide a value or provides a value that does not represent fair value in the judgment of the Fund’s investment adviser or designee, are valued at fair value under procedures approved by the Trust’s Board of Trustees. The “Fair Value” of these securities is determined in good faith by taking into account relevant factors and surrounding circumstances. Methods utilized to obtain a “Fair Value” may include the following non-exclusive list of SEC acceptable methods: (i) a multiple of earnings; (ii) the discount from market value of a similar, freely traded security; (iii) the yield-to-maturity for debt issues; or (iv) a consolidation of the methods. The Gartmore Fair Value Committee considers a non-exclusive list of factors to arrive at the appropriate method upon determining “Fair Value.” For example, fair value determinations are required for securities whose value is affected by a “significant” event that materially affects the value of a domestic or foreign security which occurs subsequent to the time of the close of the principal market on which such domestic or foreign security trades and before the
22
Table of Contents
GARTMORE VARIABLE INSURANCE TRUST
NOTES TO FINANCIAL STATEMENTS (Unaudited) (Continued)
June 30, 2005
Valuation Time (i.e., a “subsequent event”). Typically, this will involve events occurring after the close of a foreign market on which a security trades and before the next Valuation Time.
The Fund values foreign securities at fair value in the circumstances described below. Generally, trading in foreign securities markets is completed each day at various times prior to the Valuation Time. Due to the time differences between the closings of the relevant foreign securities exchanges and the Valuation Time for the Fund, the Fund will fair value its foreign investments when it is determined that the market quotations for the foreign investments either are not readily available or are unreliable and, therefore, do not represent fair value. When the fair value prices are utilized, these prices will attempt to reflect the impact of the U.S. financial markets’ perceptions and trading activities on the Fund’s foreign investments since the last closing prices of the foreign investments were calculated on their primary foreign securities markets or exchanges. For these purposes, the Board of Trustees of the Trust has determined that movements in relevant indices or other appropriate market indicators, after the close of the foreign securities exchanges, may demonstrate that market quotations are unreliable, and may trigger fair value pricing for certain securities. Consequently, fair valuation of portfolio securities may occur on a daily basis. In determining fair value prices, the Trust utilizes data furnished by an independent pricing service (and that data draws upon, among other information, the market values of foreign investments). The fair value prices of portfolio securities generally will be used when it is determined that the use of these prices will have a material impact on the net asset value of the Fund. When the Fund uses fair value pricing, the values assigned to the Fund’s foreign investments may not be the quoted or published prices of the investments on their primary markets or exchanges.
| (b) | Repurchase Agreements |
The Fund may enter into repurchase agreements with an entity which is a member of the Federal Reserve System or which is a “primary dealer” (as designated by the Federal Reserve Bank of New York) in U.S. Government obligations. The repurchase price generally equals the price paid by the Fund plus interest negotiated on the basis of current short-term rates, which may be more or less than the rate on the underlying portfolio securities. The seller under a repurchase agreement is required to maintain the value of the collateral held pursuant to the agreement at a market value equal to or greater than the repurchase price (including accrued interest). Collateral subject to repurchase agreements is held by the Fund’s custodian or another qualified sub-custodian or in the Federal Reserve/Treasury book-entry system. If the counterparty defaults and the fair value of the collateral declines, realization of the collateral by the Fund may be delayed or limited. The Fund may transfer uninvested cash balances into a pooled cash account. These balances are invested in one or more repurchase agreements, which are fully collateralized by AA-rated Corporate Bonds with the counterparties of CS First Boston and Nomura Securities.
| (c) | Futures Contracts |
The Fund may invest in financial futures contracts (“futures contracts”) for the purpose of hedging its existing portfolio securities or securities it intends to purchase against fluctuations in value caused by changes in prevailing market interest rates or prices. Futures contracts may also be entered into for non-hedging purposes.
Upon entering into a futures contract, the Fund is required to pledge to the broker an amount of cash and/or other assets equal to a certain percentage of the contract amount (initial margin deposit). Subsequent payments, known as “variation margin,” are made each day, depending on the daily fluctuations in the fair value/market value of the underlying assets. A gain or loss equal to the daily variation margin is recognized on a daily basis. Futures contracts are valued daily at their last quoted sale price.
A “sale” of a futures contract means a contractual obligation to deliver the securities or foreign currency called for by the contract at a fixed price at a specified time in the future. A “purchase” of a futures contract means a contractual obligation to acquire the securities or foreign currency at a fixed price at a specified time in the future.
Should market conditions change unexpectedly, the Fund may not achieve the anticipated benefits of the futures contracts and may realize a loss. The use of futures transactions for hedging purposes involves the risk of imperfect correlation in movements in the price of futures contracts, interest rates, and the value of the underlying hedged assets.
23
Table of Contents
GARTMORE VARIABLE INSURANCE TRUST
NOTES TO FINANCIAL STATEMENTS (Unaudited) (Continued)
June 30, 2005
| (d) | Security Transactions and Investment Income |
Security transactions are accounted for on the date the security is purchased or sold (“trade date”). Securities gains and losses are calculated on the identified cost basis. Interest income is recognized on the accrual basis and includes, where applicable, the amortization or accretion of premium or discount. Dividend income is recorded on the ex-dividend date.
| (e) | Securities Lending |
To generate additional income, the Fund may lend up to 33 1/3% of the Fund’s total assets pursuant to agreements, requiring that the borrower deliver cash or securities as collateral with respect to each new loan of U.S. securities, equal to at least 102% of the value of the portfolio securities loaned, and with respect to each new loan of non-U.S. securities, collateral of at least 105% of the value of the portfolio securities loaned, and thereafter requiring the borrower to mark to market the collateral on a daily basis and requiring the borrower to make up any shortfall of collateral. The Fund receives payments from borrowers equivalent to the dividends and interest that would have been earned on securities lent while simultaneously seeking to earn income on the investment of cash collateral. Collateral is marked to market daily to provide a level of collateral at least equal to the market value of securities loaned. There may be risks of delay in recovery of the securities should the borrower of the securities fail financially. Loans will be made, however, only to borrowers deemed by the Fund’s investment adviser to be of good standing and creditworthy under guidelines established by the Board of Trustees and when, in the judgment of the adviser, the consideration which can be earned currently from these securities loans justifies the attendant risks. Loans are subject to termination by the Fund or the borrower at any time, and, therefore, are not considered to be illiquid investments. JPMorgan Chase Bank serves as custodian for the securities lending program of the Fund. JPMorgan Chase Bank receives a custody fee based on the value of collateral received from borrowers.
| (f) | Distributions to Shareholders |
The Fund’s dividends from net investment income, if any, are declared and paid quarterly. The Fund’s distributable net realized capital gains, if any, are declared and distributed at least annually.
Dividends and distributions to shareholders are determined in accordance with federal income tax regulations, which may differ from GAAP. These “book/tax” differences are considered either permanent or temporary in nature. In accordance with the American Institute of Certified Public Accountants (“AICPA”) Statement of Position 93-2, permanent differences (i.e., reclassification of market discounts, gain/loss, paydowns, and distributions) are reclassified within the capital accounts based on their nature for federal income tax purposes; temporary differences do not require reclassification. These reclassifications have no effect upon the net asset value of the Fund. To the extent distributions exceed current and accumulated earnings and profits for federal income tax purposes, these distributions are reported as distributions of paid-in-capital.
| (g) | Federal Income Taxes |
It is the policy of the Fund to qualify or continue to qualify as a “regulated investment company” by complying with the provisions available to certain investment companies, as defined in applicable sections of the U.S. Internal Revenue Code, and to make distributions of net investment income and net realized capital gains sufficient to relieve the Fund from all, or substantially all, federal income taxes.
As of June 30, 2005, the tax cost of securities and the breakdown of unrealized appreciation (depreciation) for the Fund is as follows:
Tax Cost of | Unrealized Appreciation | Unrealized Depreciation | Net Unrealized Appreciation (Depreciation) | |||||||
$6,015,048 | $ | 87,914,389 | $ | (58,504,303 | ) | $ | 29,410,085 | |||
| (h) | Allocation of Expenses, Income, and Gains and Losses |
Expenses directly attributable to the Fund are charged to the Fund. Expenses not directly attributable to the Fund are allocated proportionately among various or all funds within the Trust. The method used by the Fund for allocating income,
24
Table of Contents
GARTMORE VARIABLE INSURANCE TRUST
NOTES TO FINANCIAL STATEMENTS (Unaudited) (Continued)
June 30, 2005
fund level expenses, and realized and unrealized gains or losses is based on the fair value of shares outstanding relative to net assets. Under this method, each class of shares participates based on the total net asset value of that class’s shares in proportion to the total net assets of the Fund. Expenses specific to a class (such as rule 12b-1 and administrative services fees) are charged to that class.
3. Transactions with Affiliates
Under the terms of the Trust’s Investment Advisory Agreement, Gartmore Mutual Fund Capital Trust (“GMF”) manages the investment of the assets and supervises the daily business affairs of the Fund. GMF is a wholly-owned subsidiary of Gartmore Global Investments, Inc. (“GGI”), a holding company. GGI is a majority-owned subsidiary of Gartmore Global Asset Management Trust (“GGAMT”). GGAMT is a wholly-owned subsidiary of Nationwide Corporation. All of the common stock of Nationwide Corporation is held by Nationwide Mutual Insurance Company (95.2%) and Nationwide Mutual Fire Insurance Company (4.8%), each of which is a mutual company owned by its policyholders. In addition, GMF provides investment management evaluation services in initially selecting and monitoring, on an ongoing basis, the performance of the subadvisers, for the Fund. The subadvisers listed below manage all or a portion of the Fund’s investments and have the responsibility for making all investment decisions for that portion of the Fund unless otherwise indicated. Below is a list of the subadvisers to the Fund:
Subadvisers* |
- The Dreyfus Corporation |
- JPMorgan Investment Management, Inc. |
| * | GMF, as investment adviser, directly manages a portion of the Fund. |
Under the terms of the Investment Advisory Agreement, the Fund pays GMF an investment advisory fee based on that Fund’s average daily net assets. From such fees, pursuant to the subadvisory agreements, GMF pays fees to the subadvisers. Additional information regarding investment advisory fees and subadvisory fees for GMF and the subadvisers is as follows for the six months ended June 30, 2005:
| Fee Schedule | Total Fees | Fees Retained | Paid to Sub-adviser | |||
Up to $200 million | 0.90% | 0.40% | 0.50% | |||
$200 million or more | 0.85% | 0.40% | 0.45% |
Under the terms of a Fund Administration and Transfer Agency Agreement, Gartmore SA Capital Trust (“GSA”) provides the Fund with various administrative and accounting services, and Gartmore Investors Services, Inc. (“GISI”), an indirect subsidiary of GSA, serves as Transfer and Dividend Disbursing Agent for the Fund. The fees for the services provided under this Agreement are calculated based on the Trust’s average daily net assets according to the fee schedule below. The fees are then allocated proportionately among all funds within the Trust in relation to the average daily net assets of each fund and are paid to GSA. GSA pays GISI from these fees for its services.
| Combined Fee Schedule* | ||
Up to $1 billion | 0.13% | |
$1 billion and more up to $3 billion | 0.08% | |
$3 billion and more up to $8 billion | 0.05% | |
$8 billion and more up to $10 billion | 0.04% | |
$10 billion and more up to $12 billion | 0.02% | |
$12 billion or more | 0.01% | |
| * | The assets of the Gartmore GVIT Investor Destinations Aggressive Fund, the Gartmore GVIT Investor Destinations Moderately Aggressive Fund, the Gartmore GVIT Investor Destinations Moderate Fund, the Gartmore GVIT Investor Destinations Moderately Conservative Fund, and the Gartmore GVIT Investor Destinations Conservative Fund (collectively, the “Investor Destinations Funds”) are excluded from the Trust asset level amount in order to calculate this asset-based fee. The Investor Destinations Funds do not pay any part of this fee. |
25
Table of Contents
GARTMORE VARIABLE INSURANCE TRUST
NOTES TO FINANCIAL STATEMENTS (Unaudited) (Continued)
June 30, 2005
Effective January 1, 2005, the fee for the fund administration and transfer agency services increased as set forth below. The fees are calculated based on the Trust’s average daily net assets according to the fee schedule below. The fees are then allocated proportionately among all funds within the Trust in relation to the average daily net assets of each fund and are paid to GSA.
| Combined Fee Schedule* | ||
Up to $1 billion | 0.15% | |
$1 billion and more up to $3 billion | 0.10% | |
$3 billion and more up to $8 billion | 0.05% | |
$8 billion and more up to $10 billion | 0.04% | |
$10 billion and more up to $12 billion | 0.02% | |
$12 billion or more | 0.01% |
| * | The assets of each of the Investor Destinations Funds are excluded from the Trust asset level amount in order to calculate this asset-based fee. The Investor Destinations Funds do not pay any part of this fee. |
GSA and GISI have entered into agreements with BISYS Fund Services Ohio, Inc. (“BISYS”), pursuant to which BISYS provides sub-administration and sub-transfer agency services, respectively, to the Fund.
Under the terms of a Distribution Plan under Rule 12b-1 of the 1940 Act, Gartmore Distribution Services, Inc. (“GDSI”), the Fund’s Distributor, is compensated by the Fund for expenses associated with the distribution of the Class II of the Fund. These fees are based on average daily net assets of Class II shares of the Fund at an annual rate not to exceed 0.25%.
Under the terms of an Administrative Services Plan, the Fund may pay fees to servicing organizations, such as broker-dealers, including Nationwide Financial Services, and financial institutions, which agree to provide administrative support services to the shareholders of certain classes. These services include, but are not limited, to the following: establishing and maintaining shareholder accounts; processing purchase and redemption transactions; arranging bank wires; performing shareholder sub-accounting; answering inquires regarding the Fund; and other such services. These fees are based on an annual rate of up to 0.25% of the average daily net assets of Class I, Class II, and Class II shares of the Fund and 0.20% of Class IV shares of the Fund.
4. Short-Term Trading Fees
The Fund reserves the right to assess a short-term trading fee on certain transactions out of Class III shares that a separate account makes on behalf of a variable insurance contract owner (the “contract owner”). A separate account that redeems Class III shares on behalf of a contract owner may be subject to a 1.00% short-term trading fee if the separate account held the Class III shares on behalf of the contract owner for 60 days or less, unless an exception applies as disclosed in the prospectus. The short-term trading fee is paid directly to the Fund and is intended to offset the cost to the Fund of excess brokerage commissions and other costs associated with fluctuations in fund asset levels and cash flow caused by short-term trading. For purposes of determining whether the short-term trading fee applies, the Class III shares that were held on behalf of the contract owner the longest will be treated as being redeemed first.
For the six months ended June 30, 2005, the Fund had no contributions to capital due to collection of redemption fees.
5. Investment Transactions
For the six months ended June 30, 2005, (excluding short-term securities) the Fund had purchases of $605,062,895 and sales of $678,376,485.
6. Bank Loans
The Trust has a credit agreement of $100,000,000. Borrowings under this arrangement bear interest at the Federal Funds rate plus 0.50%. The interest costs are included in custodian fees in the Statement of Operations. No compensation balances were required under the terms of the line of credit. There were no borrowings outstanding as of June 30, 2005.
26
Table of Contents
GARTMORE VARIABLE INSURANCE TRUST
NOTES TO FINANCIAL STATEMENTS (Unaudited) (Continued)
June 30, 2005
7. Shareholder Meeting
A separate shareholders meeting was held on Tuesday, December 23, 2004, for the shareholders of the Trust’s predecessor pursuant to a Proxy Statement On Schedule 14A, dated October 29, 2004, and mailed to the shareholders of the Trust’s predecessor on or around November 5, 2004.
Two Proposals: The purpose of the December 23, 2004 meeting was to allow the shareholders of the Trust’s predecessor to vote on:
| i. | Proposal One: The election of the Trust’s Board of Trustees; and |
| ii. | Proposal Two: The approval of an “Agreement and Plan of Reorganization” that provided for the reorganization of the Trust from a Massachusetts business trust into a Delaware statutory trust. |
Proposal One: As set forth in the October 29, 2004 Proxy Statement, the nominees for election as Trustees of the Trust’s predecessor were: Charles E. Allen, Michael J. Baresich, Paula H.J. Cholmondeley, C. Brent DeVore, Phyllis Kay Dryden, Robert M. Duncan, Barbara L. Hennigar, Paul J. Hondros, Barbara I Jacobs, Thomas J. Kerr IV, Douglas F. Kridler, Michael D. McCarthy, Arden L. Shisler, and David C. Wetmore.
Proposal Two: As specifically set forth in the October 29, 2004 Proxy Statement, the Reorganization proposal requested the shareholders of the Trust’s predecessor to approve the proposed “Agreement and Plan of Reorganization” of the Trust’s predecessor (on behalf of each of the its funds) into a new Delaware-domiciled Trust, whereby the Funds of the new Delaware Trust would acquire all of the assets of the corresponding funds of the Trust’s predecessor subject to the liabilities, expenses, costs, charges, and reserves of the corresponding funds of the Trust’s predecessor (contingent or otherwise), in exchange for shares of the acquiring Funds to be distributed pro rata by the Trust to the holders of the shares of the funds of the Trust’s predecessor, in a complete liquidation of the Trust’s predecessor.
Voting Results:
The shareholders of the Trust’s predecessor voted to approve both Proposal One and Proposal Two, as follows:
Proposal 1: Election of a Board of Trustees of Gartmore Variable Insurance Trust
Charles E. Allen: | ||
FOR | 2,797,230,318.955 shares (96.078%) | |
WITHHOLD | 114,195,693.660 shares (3.922%) | |
TOTAL | 2,912,726,012.615 shares (100.000%) | |
Michael J. Baresich: | ||
FOR | 2,796,135,979.559 shares (96.040%) | |
WITHHOLD | 115,290,033.056 shares (3.960%) | |
TOTAL | 2,912,726,012.615 shares (100.000%) | |
Paula H.J. Cholmondeley: | ||
FOR | 2,795,095,945.396 shares (96.004%) | |
WITHHOLD | 116,330,067.219 shares (3.996%) | |
TOTAL | 2,912,726,012.615 shares (100.000%) | |
C. Brent DeVore: | ||
FOR | 2,797,207,046.916 shares (96.077%) | |
WITHHOLD | 114,218,965.699 shares (3.923%) | |
TOTAL | 2,912,726,012.615 shares (100.000%) | |
27
Table of Contents
GARTMORE VARIABLE INSURANCE TRUST
NOTES TO FINANCIAL STATEMENTS (Unaudited) (Continued)
June 30, 2005
Phyllis Kay Dryden: | ||
FOR | 2,795,587,023.994 shares (96.021%) | |
WITHHOLD | 115,838,988.621 shares (3.979%) | |
TOTAL | 2,912,726,012.615 shares (100.000%) | |
Robert M. Duncan: | ||
FOR | 2,790,191,720.503 shares (95.836%) | |
WITHHOLD | 121,234,292.112 shares (4.164%) | |
TOTAL | 2,912,726,012.615 shares (100.000%) | |
Barbara L. Hennigar: | ||
FOR | 2,792,939,848.858 shares (95.937%) | |
WITHHOLD | 118,486,163.757 shares (4.070%) | |
TOTAL | 2,912,726,012.615 shares (100.000%) | |
Paul J. Hondros: | ||
FOR | 2,797,557,404.448 shares (96.089%) | |
WITHHOLD | 113,868,608.167 shares (3.911%) | |
TOTAL | 2,912,726,012.615 shares (100.000%) | |
Barbara I. Jacobs: | ||
FOR | 2,796,306,126.654 shares (96.046%) | |
WITHHOLD | 115,119,885.961 shares (3.954%) | |
TOTAL | 2,912,726,012.615 shares (100.000%) | |
Thomas J. Kerr IV: | ||
FOR | 2,789,755,720.087 shares (95.821%) | |
WITHHOLD | 121,670,292.528 shares (4.179%) | |
TOTAL | 2,912,726,012.615 shares (100.000%) | |
Douglas F. Kridler: | ||
FOR | 2,798,065,774.375 shares (96.106%) | |
WITHHOLD | 113,360,238.240 shares (3.894%) | |
TOTAL | 2,912,726,012.615 shares (100.000%) | |
Michael D. McCarthy: | ||
FOR | 2,797,452,613.694 shares (96.085%) | |
WITHHOLD | 113,973,395.921 shares (3.915%) | |
TOTAL | 2,912,726,012.615 shares (100.000%) | |
Arden L. Shisler: | ||
FOR | 2,796,738,454.730 shares (96.061%) | |
WITHHOLD | 114,687,557.885 shares (3.939%) | |
TOTAL | 2,912,726,012.615 shares (100.000%) | |
David C. Wetmore: | ||
FOR | 2,794,784,752.247 shares (95.994%) | |
WITHHOLD | 116,641,260.368 shares (4.006%) | |
TOTAL | 2,912,726,012.615 shares (100.000%) | |
28
Table of Contents
GARTMORE VARIABLE INSURANCE TRUST
NOTES TO FINANCIAL STATEMENTS (Unaudited) (Continued)
June 30, 2005
Proposal 2: Approval of the Agreement and Plan of Reorganization of Gartmore Variable Insurance Trust
FOR | 2,561,003,822.546 shares (87.964%) | |
AGAINST | 103,593,261.010 shares (3.558%) | |
ABSTAIN | 246,828,929.059 shares (8.478%) | |
TOTAL | 2,912,726,012.615 shares (100.000%) | |
29
Table of Contents
GARTMORE VARIABLE INSURANCE TRUST
Management Information (Unaudited)
June 30, 2005
Trustees who are not Interested Persons (as defined in the 1940 Act) and Officers of the Funds June 30, 2005
| Name, Address and Date of Birth | Position(s) Held with the Trust and Length of Time Served1 | Principal Occupation(s) During Past 5 Years | Number of Portfolios in the Gartmore Fund Complex Overseen by Trustee | Other Directorships Held by Trustee or Nominee2 | ||||
Charles E. Allen
c/o Gartmore Global Investments, Inc. 1200 River Road, Suite 1000 Conshohocken, PA 19428
1948 | Trustee since July 2000 | Mr. Allen is Chairman, Chief Executive Officer and President of the Graimark Realty Advisors, Inc. (real estate development, investment and asset management). | 84 | None | ||||
Paula H.J. Cholmondeley
c/o Gartmore Global Investments, Inc. 1200 River Road, Suite 1000 Conshohocken, PA 19428
1940 | Trustee since July 2000 | Ms. Cholmondeley has been the Chairman and Chief Executive Officer of the Sorrel Group, a management consulting company, since January 2004. From March 2000 through December 2003, Ms. Cholmondeley was Vice President and General Manager of Sappi Fine Paper North America. Prior thereto, Ms. Cholmondeley was Vice President and General Manager of Residential Insulation of Owens Corning. | 84 | Director of Dentsply International, Inc., Ultralife Batteries, Inc., Terex Corporation, Minerals Technology, Inc. and Albany International Corp. | ||||
C. Brent DeVore
c/o Gartmore Global Investments, Inc. 1200 River Road, Suite 1000 Conshohocken, PA 19428
1940 | Trustee since 1990 | Dr. DeVore is President of Otterbein College. | 84 | None | ||||
Phyllis K. Dryden c/o Gartmore Global Investments, Inc. 1200 River Road, Suite 1000 Conshohocken, PA 19428 1947 | Trustee since December 2004 | Ms. Dryden was a former Managing Partner of march FIRST, a global management consulting firm prior to 2002. | 84 | None |
30
Table of Contents
GARTMORE VARIABLE INSURANCE TRUST
Management Information (Unaudited)
June 30, 2005
| Name, Address and Date of Birth | Position(s) Held with the Trust and Length of Time Served1 | Principal Occupation(s) During Past 5 Years | Number of Portfolios in the Gartmore Fund Complex Overseen by Trustee | Other Directorships Held by Trustee or Nominee2 | ||||
Barbara L. Hennigar*
c/o Gartmore Global Investments, Inc. 1200 River Road, Suite 1000 Conshohocken, PA 19428
1935 | Trustee since July 2000 | Retired since June 2000. Prior thereto, Ms. Hennigar was the Chairman or President and Chief Executive Officer of OppenheimerFunds Services and a member of the Executive Committee of OppenheimerFunds. | 84 | None | ||||
Barbara I. Jacobs
c/o Gartmore Global Investments, Inc. 1200 River Road, Suite 1000 Conshohocken, PA 19428
1950 | Trustee since December 2004 | Ms. Jacobs has served as Chairman of the Board of Directors of KICAP Network Fund, a European (United Kingdom) hedge fund, since December 2000. Prior to 2004, Ms. Jacobs was also a Managing Director and European Portfolio Manager with CREF Investments (Teachers Insurance Annuity Association — College Retirement Equity Fund). | 84 | None | ||||
Douglas F. Kridler
c/o Gartmore Global Investments, Inc. 1200 River Road, Suite 1000 Conshohocken, PA 19428
1955 | Trustee since September 1997 | Mr. Kridler has served as the President and Chief Executive Officer of the Columbus Foundation (a Columbus, OH-based foundation which manages over 1,300 individual endowment funds) since February 2002. Mr. Kridler was the President of the Columbus Association for the Performing Arts prior thereto and Chairman of the Greater Columbus Convention and Visitors Bureau during 2000 and 2001. | 84 | None | ||||
Michael D. McCarthy
c/o Gartmore Global Investments, Inc. 1200 River Road, Suite 1000 Conshohocken, PA 19428
1947 | Trustee since December 2004 | Mr. McCarthy serves as: the Founder and Chairman of The Eureka Foundation (which sponsors and funds the “Great Museums” series on PBS); and a Partner of Pineville Properties LLC (a commercial real estate development firm). | 843 | None |
31
Table of Contents
GARTMORE VARIABLE INSURANCE TRUST
Management Information (Unaudited)
June 30, 2005
| Name, Address and Date of Birth | Position(s) Held with the Trust and Length of Time Served1 | Principal Occupation(s) During Past 5 Years | Number of Portfolios in the Gartmore Fund Complex Overseen by Trustee | Other Directorships Held by Trustee or Nominee2 | ||||
David C. Wetmore
c/o Gartmore Global Investments, Inc. 1200 River Road, Suite 1000 Conshohocken, PA 19428
1948 | Trustee since 1995 and Chairman since February 2005 | Retired. Mr. Wetmore was formerly a Managing Director of Updata Capital, an investment banking and venture capital firm. | 84 | None |
| * | Pursuant to the Trust’s mandatory retirement policy, Ms. Hennigar is expected to retire on or about January 12, 2006. |
| 1 | The term of office length is until a trustee resigns or reaches a mandatory retirement age of 70. On March 2, 2000, the Board adopted a five-year implementation period for any Trustee 65 or older as of the adoption of this policy. Pursuant to this policy, Messrs. Duncan and Kerr retired as trustees effective as of March 12, 2005. |
| 2 | Directorships held in (1) any other investment companies registered under the 1940 Act, (2) any company with a class of securities registered pursuant to Section 12 of the Securities Exchange Act of 1934, as amended (the “Exchange Act”), or (3) any company subject to the requirements of Section 15(d) of the Exchange Act. |
| 3 | Mr. McCarthy was also an Administrative Committee Member for the Alphagen Arneb Fund, LLC, The Healthcare Fund LDC, The Leaders Long-Short Fund, LLC, and The Leaders Long-Short Fund LDC, four private investment companies (hedge funds) managed by GSA. Mr. McCarthy resigned as an Administrative Committee Member effective June 30, 2005. |
Trustees and Officers who are not Interested Persons (as defined in the 1940 Act) of the Funds received aggregate compensation of $274,882 from the Trust for the Six Months Ended June 30, 2005. Additional information regarding the Trustees and Officers may be found in the Trust’s statement of additional information, which is available without charge upon request, by calling 1-800-848-0920.
32
Table of Contents
GARTMORE VARIABLE INSURANCE TRUST
Management Information (Unaudited)
June 30, 2005
Trustees who are Interested Persons (as defined in the 1940 Act) and/or Officers of the Funds June 30, 2005
| Name, Address and Age | Position(s) Held with the Trust and Length of Time Served1 | Principal Occupation(s) During Past 5 Years | Number of Portfolios in the Gartmore Fund Complex Overseen by Trustee | Other Directorships Held by Trustee2 | ||||
Paul J. Hondros
Gartmore Global Investments, Inc. 1200 River Road, Suite 1000 Conshohocken, PA 19428
1948 | Trustee since July 2000 | Mr. Hondros has been President and Chief Executive Officer of various Gartmore entities, including Gartmore Distribution Services, Inc. (“GDSI”),3 Gartmore Investor Services, Inc. (“GISI”),3 Gartmore Morley Capital Management, Inc. (“GMCM”),3 Gartmore Morley Financial Services, Inc. (“GMFS”),3 NorthPointe Capital, LLC (“NorthPointe”),3 Gartmore Global Asset Management Trust (“GGAMT”)3, Gartmore Global Investments, Inc. (“GGI”)3, Gartmore Mutual Fund Capital Trust (“GMFCT”)3 and Gartmore SA Capital Trust (“GSA”)3; and a Director of Nationwide Securities, Inc.3, as well as several entities within Nationwide Financial Services, Inc. | 844 | None | ||||
Arden L. Shisler
c/o Gartmore Global Investments, Inc. 1200 River Road, Suite 1000 Conshohocken, PA 19428
1941 | Trustee since February 2000 | Mr. Shisler has been a consultant since January 2003. Prior thereto, he was President and Chief Executive Officer of K&B Transport, Inc., a trucking firm. Since 1992, Mr. Shisler has also been Chairman of the Board for Nationwide Mutual Insurance Company3. | 84 | Director of Nationwide Financial Services, Inc. | ||||
Gerald J. Holland
Gartmore Global Investments, Inc. 1200 River Road, Suite 1000 Conshohocken, PA 19428
1951 | Treasurer since March 2001 | Mr. Holland is Senior Vice President - Operations for GGI3, GMFCT3 , and GSA3. Prior to July 2000, Mr. Holland was Vice President for First Data Investor Services, an investment company service provider. | 84 | None |
33
Table of Contents
GARTMORE VARIABLE INSURANCE TRUST
Management Information (Unaudited)
June 30, 2005
| Name, Address and Age | Position(s) Held with the Trust and Length of Time Served1 | Principal Occupation(s) During Past 5 Years | Number of Portfolios in the Gartmore Fund Complex Overseen by Trustee | Other Directorships Held by Trustee2 | ||||
Michael A. Krulikowski
Gartmore Global Investments, Inc. 1200 River Road, Suite 1000 Conshohocken, PA 19428
1959 | Chief Compliance Officer since June 2004 | Since November 1999, Mr. Krulikowski has served as a Vice President and Chief Compliance Officer of GGI. Prior thereto, Mr. Krulikowski served as Chief Compliance Officer of 1717 Capital Management Company/Provident Mutual Insurance Company. | 84 | None | ||||
Eric E. Miller
Gartmore Global Investments, Inc. 1200 River Road, Suite 1000 Conshohocken, PA 19428
1953 | Secretary since December 2002 | Mr. Miller is Senior Vice President, Chief Counsel for GGI3, GMFCT3 and GSA3 since August 2002. From August 2000 to August 2002, Mr. Miller was a Partner with Stradley Ronan Stevens & Young, LLP. Prior to August 2000, Mr. Miller served as Senior Vice President and Deputy General Counsel at Delaware Investments. | 84 | None |
| 1 | The term of office length is until a trustee resigns or reaches a mandatory retirement age of 70. On March 2, 2000, the Board adopted a five-year implementation period for any Trustee 65 or older as of the adoption of this policy. Pursuant to this policy, Messrs. Duncan and Kerr retired as trustees effective as of March 12, 2005. |
| 2 | Directorships held in (1) any other investment companies registered under the 1940 Act, (2) any company with a class of securities registered pursuant to Section 12 of the Securities Exchange Act of 1934, as amended (the “Exchange Act”), or (3) any company subject to the requirements of Section 15(d) of the Exchange Act. |
| 3 | This position is held with an affiliated person or principal underwriter of the Trust. |
| 4 | Mr. Hondros was also an Administrative Committee Member for the Alphagen Arneb Fund, LLC, The Healthcare Fund LDC, The Leaders Long-Short Fund, LLC, and The Leaders Long-Short Fund LDC, four private investment companies (hedge funds) managed by GSA. Mr. Hondros resigned as Administrative Committee Member effective June 30, 2005. |
Federal law requires the Trust, each of its investment advisers and sub-advisers to adopt procedures for voting proxies (“Proxy Voting Guidelines”) and to provide a summary of those Proxy Voting Guidelines used to vote the securities held by the Funds. The Funds’ proxy voting policies and procedures are available without charge (i) upon request, by calling 1-800-848-0920, (ii) on the Fund’s website at www.gartmorefunds.com, or (iii) on the Securities and Exchange Commission’s website at www.sec.gov.
34
Table of Contents
GVIT Small Cap Growth Fund
Semiannual Report
| | June 30, 2005 |
| Contents | ||
| 6 | Statement of Investments | |
| 9 | Statement of Assets and Liabilities | |
| 9 | Statement of Operations | |
| 10 | Statements of Changes in Net Assets | |
| 11 | Financial Highlights | |
| 12 | Notes to Financial Statements | |
Commentary provided by Gartmore Global Investments, investment adviser to Gartmore Variable Insurance Trust. All opinions and estimates included in this report constitute Gartmore Global Investments’ judgment as of the date of this report and are subject to change without notice.
Statement Regarding Availability of Quarterly Portfolio Schedule.
The Gartmore Variable Insurance Trust files complete schedules of portfolio holdings for each Fund with the Securities and Exchange Commission (the “Commission”) for the first and third quarters of each fiscal year on Form N-Q. The Funds’ Forms N-Q are available on the Commission’s website at http://www.sec.gov. The Funds’ Forms N-Q may be reviewed and copied at the Commission’s Public Reference Room in Washington, DC, and information on the operation of the Public Reference Room may be obtained by calling 800-SEC-0330; and the Funds make the information on Form N-Q available to shareholders upon request without charge.
Statement Regarding Availability of Proxy Voting Record.
Information regarding how the Fund voted proxies relating to portfolio securities held during the most recent 12-month period ended June 30, 2005 is available without charge, upon request, by calling 800-848-0920, and on the Commission’s website at http://www.sec.gov.
Table of Contents
GVIT Small Cap Growth Fund
For the semiannual period ended June 30, 2005, the GVIT Small Cap Growth Fund returned -0.88% (Class I at NAV) versus -3.58% for its benchmark, the Russell 2000® Growth Index. For broader comparison, the average return for the Fund’s Lipper peer category of Small-Cap Growth Funds was -0.22%.
The Fund is subadvised by Oberweis Asset Management, Inc. and Waddell & Reed Investment Management Co., which returned -3.55% and 3.07% for their respective sleeves of the Fund.
Oberweis Asset Management, Inc.
The first quarter of 2005 proved to be a challenge for small-capitalization investors. The global trade deficit, rising interest rates and an uncertain economic picture led to a swift correction during that time frame. Fortunately, the second quarter proved remarkably better, as attractive valuations and a clearer economic picture led to a rally for small caps.
The greatest detractors from sleeve performance included Altiris, Inc.; Ceradyne, Inc.; and Silicon Image, Inc. Altiris had lower-than-expected results, citing a weak environment for the company’s information technology software. The company then pre-announced lower-than-anticipated results a second time. Based on the trend in weak end-user demand for its products, we sold the stock. Ceradyne pre-announced a weaker-than-expected quarter primarily as a result of the U.S. government’s shifting its demand for a certain type of body armor earlier than had been anticipated. The company did retain the contract, however, and pushed much of the company’s results out to later quarters. We still hold the stock in the portfolio, and it has doubled in price from lows it set in April. Silicon Image missed quarterly expectations due to a weak semiconductor environment. The company also announced multiple management changes and the resignation of directors from its board; in addition, an anticipated new product has yet to lead to meaningful revenue. Because of these factors, we sold the stock.
Top contributors to sleeve performance included LCA-Vision Inc., Hansen Natural Corp. and aQuantive, Inc. LCA-Vision provides laser refractive eye surgery through 44 vision correction centers in the United States and Canada. Hansen manufactures alternative beverages, including energy drinks such as the popular Monster Energy drink. aQuantive is an online advertising agency that provides media buying, planning and campaign management to companies interested in advertising on the Internet.
From a sector perspective, our portfolios tend to be overweighted in sectors with above-average growth opportunities. With that in mind, our largest sector overweights continue to be health care, technology and consumer discretionary. Health care, with a 27.55% weighting in the Fund compared to 19.91% for the Russell 2000 Growth Index, performed well, particularly during the second quarter as returns for our health-care investments outpaced those of their counterparts in the Index. However, an overweight in technology hurt Fund performance in both the first and second quarters.
We attempt to invest in high-growth companies before these companies become well known among institutional investors. As a result, the average company size of the sleeve’s holdings tends to be somewhat smaller than that of our peers, and the average earnings growth rate of holdings tends to be higher.
Waddell & Reed Investment Management Co.
Overall, the financial markets were restrained throughout the period, primarily due to rising short-term interest rates and increasing oil prices. Unfortunately, we do not foresee those circumstances changing for the better in the near term. Investors’ hope for signs of a more tepid economy, which could potentially allow the Federal Reserve to terminate its interest-rate-increasing campaign, have not materialized, although oil prices soared to historical highs.
The second quarter of 2005 is best characterized by a rebound of some of the biggest losers from the previous quarter. Health care jumped 8.4% toward the end of the second quarter after a decline of 10.1% from January to March. Telecommunications and utilities also produced more than 10% returns after posting negative results in the first quarter. Energy was the exception, with strong positive returns throughout the six-month period. By contrast, technology remained sluggish during the same period and remains the worst sector from the 2002-2003 market trough.
The consumer discretionary sector contributed positively to the sleeve’s performance, while the consumer staples sector was the largest detractor. Given the volatility and cyclical nature of energy and technology, we remain underweight in the sectors. We believe the opportunistic nature of these groups is not in line with our larger emphasis on high, stable profitability. As we look ahead, our greater concentration remains in the health-care and consumer discretionary sectors.
Overall, our higher-quality, mainstream holdings continued to edge out lower-quality companies, defined by their negative earnings and smaller size. This is a significant point, given that in the recent past, some performance boosts resulted from a spurt of more speculative strategies rather than from higher-quality holdings that may be part of a longer-term strategy.
PORTFOLIO MANAGERS:
Oberweis Asset Management, Inc.: James W. Oberweis
Waddell & Reed Investment Management Co.: Mark G. Seferovich, Kenneth McQuade
1
Table of Contents
GVIT Small Cap Growth Fund (Continued) |
Investing in mutual funds involves risk, including possible loss of principal.
There is no assurance that the investment objective of any fund will be achieved.
Small-company stocks have higher risks than the stocks of larger, more established companies and have significant short-term price volatility.
Russell 2000® Value Index: An unmanaged index that measures the performance of the stocks of U.S. companies in the Russell 2000® Index (the largest 2,000 U.S. companies, based on market capitalization) with lower price-to-book ratios and lower forecasted growth values.
Lipper Analytical Services, Inc. is an industry research firm whose rankings are based on total return performance and do not reflect the effects of sales charges.
The Gartmore Variable Insurance Trust Funds are available only as sub-account investment options in certain variable insurance products. Accordingly, investors are unable to invest in shares of these funds outside of an insurance product. Performance information found herein reflects only the performance of these funds, and does not indicate the performance your sub-account may experience under your variable insurance contract. Performance returns assume reinvestment of all distributions. The investment return and principal value of an investment will fluctuate so that an investor’s shares, when redeemed, may be worth more or less than their original cost. Index performance is provided for comparison purposes only; the indexes shown are unmanaged and do not reflect any fees or expenses. Investors cannot invest directly in market indexes. To obtain performance information about the sub-account option under your insurance contract that invests in one of these funds, please contact your variable insurance carrier. PAST PERFORMANCE IS NO GUARANTEE OF FUTURE RESULTS.
Commentary provided by Gartmore Global Investments. All opinions and estimates included in this report constitute Gartmore Global Investments’ judgment as of the date of this report and are subject to change without notice.
Investors should carefully consider a fund’s investment objectives, risks, fees, charges and expenses before investing any money. To obtain this and other information on Gartmore Variable Insurance Trust, please contact your variable insurance contract provider or call 800-848-0920. Please read the Trust’s prospectus carefully before investing any money.
Gartmore Funds distributed by Gartmore Distribution Services, Inc., Member NASD. 1200 River Road, Suite 1000, Conshohocken, PA 19428
2
Table of Contents
Fund Performance | GVIT Small Cap Growth Fund |
| Average | Annual Total Return1 |
(For Periods Ended June 30, 2005)
| Six months* | One year | Five year | Inception2 | |||||
| Class I3 | -0.88% | 8.64% | -6.47% | 7.30% | ||||
| Class II4 | -1.03% | 8.40% | -6.71% | 7.08% | ||||
| Class III4 | -0.89% | 8.70% | -6.58% | 7.20% |
| * | Not Annualized. |
| 1 | Not subject to any sales charges. |
| 2 | The Fund commenced operations on May 1, 1999. |
| 3 | The existing shares of the Fund were designated Class I shares as of May 1, 2001. |
| 4 | These returns until the creation of the Class II shares (March 7, 2002) and Class III shares (July 5, 2002) are based on the performance of the Class I shares of the Fund. Excluding the effect of any fee waivers or reimbursements, such prior performance is similar to what Class II and Class III shares would have produced, because all classes of shares invest in the same portfolio of securities. Class II shares’ annual returns have been restated to reflect the additional fees applicable to Class II shares and therefore are lower than those of Class I shares. For Class III shares, these returns do not reflect the short-term trading fees applicable to such shares: if these fees were reflected, the annual returns for Class III shares would have been lower. |
| Performance | of a $10,000 Investment |
Investment return and principal value will fluctuate, and when redeemed, shares may be worth more or less than original cost. Past performance is no guarantee of future results and does not reflect the deduction of taxes that a shareholder would pay on fund distributions or the redemption of fund shares. Investing in mutual funds involves market risk, including loss of principal. Performance returns assume the reinvestment of all distributions.
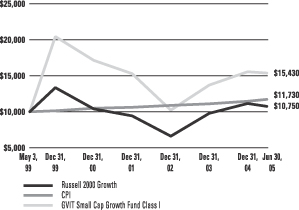
Comparative performance of $10,000 invested in Class I shares of the Gartmore GVIT Small Cap Growth Fund, the Russell 2000 Growth Index (Russell 2000 Growth)(a), and the Consumer Price Index (CPI)(b) since inception. Unlike, the Fund, the returns for these unmanaged indexes do not reflect any fees, expenses, or sales charges. Investors cannot invest directly in market indexes.
| (a) | The Russell 2000 Growth is an unmanaged index that measures the performance of the stocks of U.S. companies in the Russell 2000® Index (the smallest 2,000 U.S. companies, based on market capitalization) with higher price-to-book ratios and higher forecasted growth values. |
| (b) | The CPI represents changes in prices of a basket of goods and services purchased for consumption by urban households. |
3
Table of Contents
Shareholder
Expense Example | GVIT Small Cap Growth Fund |
As a shareholder of the Fund, you incur two types of costs: (1) transaction costs, including sales charges (loads) paid on purchase payments and redemption fees; and (2) ongoing costs, including investment advisory fees, administration fees, distribution fees and other Fund expenses. The examples below are intended to help you understand your ongoing costs (in dollars) of investing in the Fund and to compare these costs with the ongoing costs of investing in other mutual funds. Per SEC requirements, the examples assume that you had a $1,000 investment in the Class at the beginning of the reporting period, January 1, 2005, and continued to hold your shares at the end of the reporting period, June 30, 2005.
Actual Expenses
For each Class of the Fund in the table below, the first line provides information about actual account values and actual expenses. You may use the information in this line, together with the amount you invested, to estimate the expenses that you paid over the period. Simply divide your account value by $1,000 (for example, an $8,600 account value divided by $1,000 = 8.6), then multiply the result by the number in the first line of each Class under the heading entitled “Expenses Paid During Period” to estimate the expenses you paid on your account during the period.
Hypothetical Example for Comparison Purposes
The second line of each Class in the table below provides information about hypothetical account values and hypothetical expenses based on the Class’ actual expense ratio and an assumed rate of return of 5% per year before expenses, which is not the Class’ actual return. The hypothetical account values and expenses may not be used to estimate the actual ending account balance or expenses you paid for the period. You may use this information to compare the ongoing costs of investing in the Class of the Fund and other funds. To do so, compare this 5% hypothetical example with the 5% hypothetical examples that appear in the shareholder reports of the other funds.
Please note that the expenses shown in the table are meant to highlight your ongoing costs only and do not reflect any transaction costs, such as sales charges (loads) or redemption fees. Therefore, the second line for each Class in the table is useful in comparing ongoing costs only, and will not help you determine the relative total costs of owning different funds. In addition, if these transaction costs were included, your costs would have been higher. The examples also assume all dividends and distributions have been reinvested.
| Beginning Account Value, January 1, 2005 | Ending Account Value, June 30, 2005 | Expenses Paid During Period* | Annualized Expense Ratio* | |||||||||||
| Small Cap Growth | ||||||||||||||
Class I | Actual | $ | 1,000 | $ | 991 | $ | 5.97 | 1.21% | ||||||
| Hypothetical | 1 | $ | 1,000 | $ | 1,019 | $ | 6.08 | 1.21% | ||||||
Class II | Actual | $ | 1,000 | $ | 990 | $ | 7.20 | 1.46% | ||||||
| Hypothetical | 1 | $ | 1,000 | $ | 1,018 | $ | 7.33 | 1.46% | ||||||
Class III | Actual | $ | 1,000 | $ | 991 | $ | 5.92 | 1.20% | ||||||
| Hypothetical | 1 | $ | 1,000 | $ | 1,019 | $ | 6.03 | 1.20% | ||||||
| * | Expenses are equal to the Fund’s annualized expense ratio multiplied by the average account value over the period multiplied by 181/365 (to reflect the one-half year period). The expense ratio presented represents a six month, annualized ratio in accordance with SEC guidelines. |
| 1 | Represents the hypothetical 5% return before expenses. |
4
Table of Contents
Portfolio Summary
(June 30, 2005) | GVIT Small Cap Growth Fund |
The SEC adopted a requirement that Funds present their portfolio holdings in a table, chart or graph format in their annual and semiannual reports to shareholders, whether or not a statement of investments is utilized. The following tables, which present portfolio holdings as a percentage of net assets, are provided in compliance with this requirement.
| Asset Allocation | ||
| Common Stocks | 94.5% | |
| Cash Equivalents | 4.9% | |
| Other Investments* | 11.6% | |
| Liabilities in excess of other assets** | -11.0% | |
| 100.0% | ||
| Top Holdings*** | ||
| aQuantive, Inc. | 2.2% | |
| American Healthways, Inc. | 2.0% | |
| Corporate Executive Board Co. (The ) | 2.0% | |
| ITT Educational Services, Inc. | 1.9% | |
| Kos Pharmaceuticals, Inc. | 1.8% | |
| O’Reilly Automotive, Inc. | 1.8% | |
| FactSet Research Systems, Inc. | 1.7% | |
| Cerner Corp. | 1.7% | |
| Getty Images, Inc. | 1.7% | |
| Newfield Exploration Co. | 1.6% | |
| Other Holdings | 81.6% | |
| 100.0% | ||
| Top Industries | ||
| Medical Products | 5.2% | |
| Computer Software & Services | 4.6% | |
| Drugs and Pharmaceuticals | 4.4% | |
| Financial Services | 4.3% | |
| Advertising Agencies | 4.2% | |
| Auto Parts & Equipment | 4.1% | |
| Internet | 3.9% | |
| Medical & Dental Instruments & Supplies | 3.7% | |
| Health Care Facilities | 3.5% | |
| Computer Services, Software & Systems | 3.3% | |
| Other Industries | 58.8% | |
| 100.0% | ||
| * | Includes value of collateral received from securities lending. |
| ** | Includes value of collateral owed from securities lending. |
| *** | For purpose of listing top holdings, repurchase agreements are considered cash equivalents and are included as part of Other Holdings. |
5
Table of Contents
GARTMORE VARIABLE INSURANCE TRUST
GVIT SMALL CAP GROWTH FUND
Statement of Investments — June 30, 2005 (Unaudited)
| Shares or Principal Amount | Value | ||||
| COMMON STOCKS (94.5%) | |||||
| Advertising Agencies (4.2%) | |||||
| aQuantive, Inc. (b) | 188,630 | $ | 3,342,523 | ||
| Greenfield Online, Inc. (b) | 42,437 | 515,610 | |||
| ValueClick, Inc. (b) | 98,649 | 1,216,342 | |||
| Ventiv Health, Inc. (b) | 62,378 | 1,202,648 | |||
| 6,277,123 | |||||
| Advertising Services (1.7%) | |||||
| Getty Images, Inc. (b) | 33,750 | 2,506,275 | |||
| Aerospace (0.7%) | |||||
| MTC Technologies, Inc. (b) | 27,293 | 1,005,201 | |||
| Audio and Video Products (0.2%) | |||||
| Sonic Solutions (b) | 16,000 | 297,600 | |||
| Auto Parts & Equipment (4.1%) | |||||
| Gentex Corp. | 117,400 | 2,136,680 | |||
| LKQ Corp. (b) | 52,697 | 1,430,724 | |||
| O’Reilly Automotive, Inc. (b) | 89,400 | 2,665,014 | |||
| 6,232,418 | |||||
| Banks: Outside New York City (0.1%) | |||||
| Mercantile Bank Corp. | 4,000 | 175,880 | |||
| Biotechnology Research & Production (2.0%) | |||||
| Anika Therapeutics, Inc. (b) | 54,824 | 629,928 | |||
| Arthrocare Corp. (b) | 32,900 | 1,149,526 | |||
| Kensey Nash Corp. (b) | 19,433 | 587,654 | |||
| Vnus Medical Technologies (b) | 56,382 | 678,275 | |||
| 3,045,383 | |||||
| Casinos & Gambling (1.1%) | |||||
| Scientific Games Corp. (b) | 63,400 | 1,707,362 | |||
| Commercial Information Services (0.9%) | |||||
| Audible, Inc. (b) | 74,680 | 1,297,192 | |||
| Commercial Services (1.4%) | |||||
| CoStar Group, Inc. (b) | 30,800 | 1,342,880 | |||
| Vertrue, Inc. (b) | 18,150 | 707,124 | |||
| 2,050,004 | |||||
| Computer Services, Software & Systems (3.3%) | |||||
| Digital River, Inc. (b) | 13,236 | 420,243 | |||
| Merge Technologies, Inc. (b) | 40,944 | 767,700 | |||
| PDF Solutions, Inc. (b) | 51,846 | 680,220 | |||
| RightNow Technologies, Inc. (b) | 49,196 | 591,336 | |||
| Safenet, Inc. (b) | 39,279 | 1,337,843 | |||
| Synaptics, Inc. (b) | 28,106 | 600,344 | |||
| TALX Corp. | 19,531 | 564,641 | |||
| 4,962,327 | |||||
| Shares or Principal Amount | Value | ||||
| COMMON STOCKS (continued) | |||||
| Computer Software & Services (4.6%) | |||||
| Avid Technology, Inc. (b) | 34,000 | $ | 1,811,519 | ||
| Cerner Corp. (b) | 37,250 | 2,531,882 | |||
| EPIQ Systems, Inc. (b) | 44,910 | 734,728 | |||
| Intergraph Corp. (b) | 13,500 | 465,210 | |||
| MicroStrategy, Inc. (b) | 23,100 | 1,225,224 | |||
| 6,768,563 | |||||
| Computer Technology (1.0%) | |||||
| Hutchinson Technology, Inc. (b) | 18,577 | 715,400 | |||
| M-Systems Flash Disk Pioneers Ltd. (b) | 38,457 | 737,221 | |||
| 1,452,621 | |||||
| Construction & Engineering (1.1%) | |||||
| Chicago Bridge & Iron Co. | 71,200 | 1,627,632 | |||
| Consulting Services (0.7%) | |||||
| Cra International, Inc. (b) | 17,321 | 932,736 | |||
| Lecg Corp. (b) | 3,700 | 78,662 | |||
| 1,011,398 | |||||
| Consumer Products (0.6%) | |||||
| USANA Health Sciences, Inc. (b) | 22,591 | 955,599 | |||
| Diversified Financial Services (1.2%) | |||||
| Euronet Worldwide, Inc. (b) | 63,747 | 1,853,125 | |||
| Drugs & Pharmaceuticals (4.4%) | |||||
| Kos Pharmaceuticals, Inc. (b) | 42,080 | 2,756,240 | |||
| Salix Pharmaceuticals, Inc. (b) | 43,003 | 759,433 | |||
| SFBC International, Inc. (b) | 51,362 | 1,984,114 | |||
| United Therapeutics Corp. (b) | 22,886 | 1,103,105 | |||
| 6,602,892 | |||||
| E-Commerce & Products (0.6%) | |||||
| Provide Commerce, Inc. (b) | 40,900 | 883,031 | |||
| Education (1.9%) | |||||
| ITT Educational Services, Inc. (b) | 52,700 | 2,815,234 | |||
| Educational Software (0.9%) | |||||
| Blackboard, Inc. (b) | 56,200 | 1,344,304 | |||
| Electronics (1.3%) | |||||
| Cree, Inc. (b) | 75,450 | 1,921,712 | |||
| Electronics—Medical Systems (0.6%) | |||||
| Hologic, Inc. (b) | 22,956 | 912,501 | |||
6
Table of Contents
GARTMORE VARIABLE INSURANCE TRUST
GVIT SMALL CAP GROWTH FUND
Statement of Investments — June 30, 2005 (Unaudited) (continued)
| Shares or Principal Amount | Value | ||||
| COMMON STOCKS (continued) | |||||
| Electronics—Semiconductors (1.5%) | |||||
| PowerDsine Ltd. (b) | 104,235 | $ | 1,042,350 | ||
| Silicon Motion Technology Corp. ADR-TW (b) | 37,000 | 388,500 | |||
| Tessera Technologies, Inc. (b) | 23,444 | 783,264 | |||
| 2,214,114 | |||||
| Energy Miscellaneous (1.1%) | |||||
| Veritas DGC, Inc. (b) | 61,216 | 1,698,132 | |||
| Entertainment Software (1.2%) | |||||
| Take-Two Interactive Software, Inc. (b) | 72,390 | 1,842,326 | |||
| Financial (1.5%) | |||||
| Financial Federal Corp. | 60,050 | 2,320,332 | |||
| Financial & Miscellaneous (0.5%) | |||||
| Portfolio Recovery Associates, Inc. (b) | 17,995 | 756,150 | |||
| Financial Services (4.3%) | |||||
| City National Corp. | 13,200 | 946,572 | |||
| Corporate Executive Board Co. (The ) | 37,900 | 2,968,707 | |||
| FactSet Research Systems, Inc. | 72,875 | 2,611,840 | |||
| 6,527,119 | |||||
| Food & Beverage (1.1%) | |||||
| J.M. Smucker Co. (The) | 35,700 | 1,675,758 | |||
| Health Care Facilities (3.5%) | |||||
| American Healthways, Inc. (b) | 72,864 | 3,079,962 | |||
| LCA-Vision, Inc. | 45,792 | 2,219,080 | |||
| 5,299,042 | |||||
| Health Care Management Services (0.5%) | |||||
| Centene Corp. (b) | 22,827 | 766,531 | |||
| Health Care Products (0.0%) | |||||
| Adeza Biomedical Corp. (b) | 1,600 | 27,168 | |||
| Health Care Services (3.0%) | |||||
| AmSurg Corp. (b) | 78,500 | 2,173,665 | |||
| Dendrite International, Inc. (b) | 132,400 | 1,827,120 | |||
| Lhc Group, Inc (b) | 30,466 | 553,872 | |||
| 4,554,657 | |||||
| Home Building (0.8%) | |||||
| Desarrolladora Homex SA de CV (b) | 42,756 | 1,172,370 | |||
| Shares or Principal Amount | Value | ||||
| COMMON STOCKS (continued) | |||||
| Identification Systems (0.5%) | |||||
| Cogent, Inc. (b) | 28,200 | $ | 805,110 | ||
| Insurance: Multi-Line (0.3%) | |||||
| HealthExtras, Inc. (b) | 25,481 | 511,404 | |||
| Internet (3.9%) | |||||
| Jupiter Media Corp. (b) | 43,418 | 743,750 | |||
| Checkfree Corp. (b) | 66,306 | 2,258,382 | |||
| Online Resources Corp. (b) | 73,670 | 833,208 | |||
| Openwave Systems, Inc. (b) | 63,279 | 1,037,776 | |||
| Stamps.com, Inc. (b) | 53,405 | 1,001,344 | |||
| 5,874,460 | |||||
| Jewelry (0.3%) | |||||
| Charles & Colvard Ltd. | 20,075 | 492,840 | |||
| Lawn & Garden Services (1.0%) | |||||
| Scotts Co. (The) (b) | 20,200 | 1,438,442 | |||
| Machinery—Thermal Process (0.8%) | |||||
| TurboChef Technologies, Inc. (b) | 69,343 | 1,242,627 | |||
| Machinery, Equipment, & Supplies (0.5%) | |||||
| Bucyrus International, Inc. Class A | 19,000 | 721,620 | |||
| Machinery: Construction & Handling (0.9%) | |||||
| A.S.V., Inc. (b) | 33,096 | 1,341,712 | |||
| Manufacturing & Consumer Goods (0.5%) | |||||
| Parlux Fragrances, Inc. (b) | 29,042 | 803,592 | |||
| Medical (0.2%) | |||||
| Angiotech Pharmaceuticals, Inc. (b) | 21,000 | 291,060 | |||
| Medical & Dental Instruments & Supplies (3.7%) | |||||
| American Science & Engineering, Inc. (b) | 18,350 | 814,006 | |||
| Kyphon, Inc. (b) | 59,626 | 2,074,388 | |||
| Laserscope (b) | 26,847 | 1,112,540 | |||
| Lifecell Corp. (b) | 102,517 | 1,620,794 | |||
| 5,621,728 | |||||
| Medical Products (5.2%) | |||||
| Advanced Medical Optics (b) | 41,151 | 1,635,752 | |||
| Allscripts Healthcare Solutions, Inc. (b) | 98,400 | 1,634,424 | |||
| Aspect Medical Systems, Inc. (b) | 25,479 | 757,745 | |||
| Intralase Corp. (b) | 49,057 | 962,498 | |||
| Martek Biosciences Corp. (b) | 41,700 | 1,582,515 | |||
| Syneron Medical Ltd. (b) | 28,732 | 1,051,304 | |||
| 7,624,238 | |||||
7
Table of Contents
GARTMORE VARIABLE INSURANCE TRUST
GVIT SMALL CAP GROWTH FUND
Statement of Investments — June 30, 2005 (Unaudited) (continued)
| Shares or Principal Amount | Value | ||||
| COMMON STOCKS (continued) | |||||
| Miscellaneous Materials & Processing (1.0%) | |||||
| Ceradyne, Inc. (b) | 62,743 | $ | 1,510,224 | ||
| Oil & Gas (1.6%) | |||||
| Newfield Exploration Co. (b) | 62,100 | 2,477,169 | |||
| Oil: Crude Producers (2.5%) | |||||
| Atp Oil & Gas Corp. (b) | 36,391 | 851,549 | |||
| Carrizo Oil & Gas, Inc. (b) | 116,089 | 1,980,478 | |||
| Whiting Petroleum Corp. (b) | 26,012 | 944,496 | |||
| 3,776,523 | |||||
| Optical Supplies (0.2%) | |||||
| Shamir Optical Industry Ltd. (b) | 16,348 | 264,020 | |||
| Pharmaceuticals (0.3%) | |||||
| MGI Pharma, Inc. (b) | 17,400 | 378,624 | |||
| Resorts & Theme Parks (1.1%) | |||||
| Vail Resorts, Inc. (b) | 61,100 | 1,716,910 | |||
| Retail (1.0%) | |||||
| Fossil, Inc. (b) | 65,250 | 1,481,175 | |||
| Services: Commercial (1.0%) | |||||
| Ctrip.com International Ltd. ADR-KY | 28,505 | 1,450,334 | |||
| Soft Drinks (0.8%) | |||||
| Hansen Natural Corp. (b) | 15,047 | 1,274,782 | |||
| Software & Services (0.2%) | |||||
| Concur Technologies, Inc. (b) | 32,327 | 340,403 | |||
| Sporting & Recreational Goods (0.6%) | |||||
| Cabelas, Inc. (b) | 36,200 | 773,232 | |||
| Zumiez, Inc. (b) | 3,700 | 107,855 | |||
| 881,087 | |||||
| Technology (1.7%) | |||||
| AudioCodes Ltd. (b) | 99,931 | 994,313 | |||
| Ixia (b) | 83,525 | 1,623,726 | |||
| 2,618,039 | |||||
| Telecommunications (1.0%) | |||||
| Glenayre Technologies, Inc. (b) | 124,622 | 469,825 | |||
| Orckit Communications Ltd. (b) | 39,928 | 1,056,495 | |||
| 1,526,320 | |||||
| Transportation (2.4%) | |||||
| J.B. Hunt Transport Services, Inc. | 100,200 | 1,933,860 | |||
| Kansas City Southern Industries, Inc. (b) | 86,250 | 1,740,525 | |||
| 3,674,385 | |||||
| Shares or Principal Amount | Value | ||||||
| COMMON STOCKS (continued) | |||||||
| Veterinary Diagnostics (1.0%) | |||||||
| VCA Antech, Inc. (b) | 60,500 | $ | 1,467,125 | ||||
| Wholesale & International Trade (1.3%) | |||||||
| Central European Distribution Corp. (b) | 50,452 | 1,883,373 | |||||
| Wireless Telecommunication Services (1.4%) | |||||||
| Jamdat Mobile, Inc. (b) | 73,641 | 2,038,383 | |||||
| Total Common Stocks | 142,086,785 | ||||||
| CASH EQUIVALENTS (4.9%) | |||||||
| Investments in repurchase agreements (collateralized by AA Corporate Bonds in a joint trading account at 3.49%, dated 06/30/05, due 07/01/05, repurchase price $7,365,712) | $ | 7,364,997 | 7,364,997 | ||||
| Total Cash Equivalents | 7,364,997 | ||||||
| SHORT-TERM SECURITIES HELD AS COLLATERAL FOR SECURITIES LENDING (11.6%) | |||||||
| Pool of short-term securities for Gartmore Variable Trust Funds — note 2 (Securities Lending) | 17,486,673 | 17,486,673 | |||||
| Total Short-Term Securities Held as Collateral for Securities Lending | 17,486,673 | ||||||
| Total Investments (Cost $132,390,277) (a) — 111.0% | 166,938,455 | ||||||
| Liabilities in excess of other assets — (11.0)% | (16,515,699 | ) | |||||
| NET ASSETS — 100.0% | $ | 150,422,756 | |||||
| (a) | See notes to financial statements for unrealized appreciation (depreciation) of securities. |
| (b) | Denotes a non-income producing security. |
| ADR | American Depositary Receipt |
| KY | Cayman Islands |
| TW | Taiwan |
See notes to financial statements.
8
Table of Contents
GARTMORE VARIABLE INSURANCE TRUST
GVIT SMALL CAP GROWTH FUND
Statement of Assets and Liabilities
June 30, 2005 (Unaudited)
Assets: | ||||
Investments, at value (cost $125,025,280) | $ | 159,573,458 | ||
Repurchase agreements, at cost and value | 7,364,997 | |||
Total Investments | 166,938,455 | |||
Cash | 115,938 | |||
Interest and dividends receivable | 43,272 | |||
Receivable for investments sold | 1,837,990 | |||
Prepaid expenses and other assets | 21,948 | |||
Total Assets | 168,957,603 | |||
Liabilities: | ||||
Payable for investments purchased | 895,249 | |||
Payable for collateral received for securities on loan | 17,486,673 | |||
Accrued expenses and other payables: | ||||
Investment advisory fees | 116,502 | |||
Fund administration and transfer agent fees | 4,337 | |||
Distribution fees | 3,125 | |||
Administrative servicing fees | 15,715 | |||
Other | 13,246 | |||
Total Liabilities | 18,534,847 | |||
Net Assets | $ | 150,422,756 | ||
Represented by: | ||||
Capital | $ | 167,882,878 | ||
Accumulated net investment income (loss) | (634,106 | ) | ||
Accumulated net realized gain (losses) from investments | (51,374,194 | ) | ||
Net unrealized appreciation (depreciation) on investments | 34,548,178 | |||
Net Assets | $ | 150,422,756 | ||
Net Assets: | ||||
Class I Shares | $ | 133,883,473 | ||
Class II Shares | 15,636,930 | |||
Class III Shares | 902,353 | |||
Total | $ | 150,422,756 | ||
Shares outstanding (unlimited number of shares authorized): | ||||
Class I Shares | 9,180,395 | |||
Class II Shares | 1,081,273 | |||
Class III Shares | 62,233 | |||
Total | 10,323,901 | |||
Net asset value and offering price per share:* | ||||
Class I Shares | $ | 14.58 | ||
Class II Shares | $ | 14.46 | ||
Class III Shares | $ | 14.50 |
| * | Not subject to a front-end sales charge. |
For the Six Months Ended June 30, 2005 (Unaudited)
Investment Income: | ||||
Interest income | $ | 119,699 | ||
Dividend income | 121,040 | |||
Income from securities lending | 40,600 | |||
Total Income | 281,339 | |||
Expenses: | ||||
Investment advisory fees | 706,718 | |||
Fund administration and transfer agent fees | 49,907 | |||
Distribution fees Class II Shares | 18,415 | |||
Administrative servicing fees | 97,224 | |||
Administrative servicing fees | 10,662 | |||
Administrative servicing fees | 598 | |||
Other** | 31,921 | |||
Total Expenses | 915,445 | |||
Net Investment Income (Loss) | (634,106 | ) | ||
REALIZED/UNREALIZED GAINS (LOSSES) ON INVESTMENTS: | ||||
Net realized gains (losses) | 2,963,116 | |||
Net change in unrealized appreciation/depreciation on investments | (4,933,095 | ) | ||
Net realized/unrealized gains (losses) on investments | (1,969,979 | ) | ||
CHANGE IN NET ASSETS RESULTING FROM OPERATIONS | $ | (2,604,085 | ) | |
| ** | Other expenses may include the following fees: audit, custody, insurance, legal, printing, trustee, and out-of-pocket expenses. |
See notes to financial statements.
9
Table of Contents
GARTMORE VARIABLE INSURANCE TRUST
GVIT SMALL CAP GROWTH FUND
Statement of Changes in Net Assets
Six Months Ended June 30, 2005 | Year Ended December 31, 2004 | |||||||
| (Unaudited) | ||||||||
From Investment Activities: | ||||||||
Operations: | ||||||||
Net investment income (loss) | $ | (634,106 | ) | $ | (1,415,886 | ) | ||
Net realized gains (losses) on investment transactions | 2,963,116 | 11,561,717 | ||||||
Net change in unrealized appreciation/depreciation on investments | (4,933,095 | ) | 10,003,116 | |||||
Change in net assets resulting from operations | (2,604,085 | ) | 20,148,947 | |||||
Change in net assets from capital transactions | (20,421,692 | ) | (13,497,910 | ) | ||||
Change in net assets | (23,025,777 | ) | 6,651,037 | |||||
Net Assets: | ||||||||
Beginning of period | 173,448,533 | 166,797,496 | ||||||
End of period | $ | 150,422,756 | $ | 173,448,533 | ||||
CAPITAL TRANSACTIONS: | ||||||||
Class I Capital Transactions: | ||||||||
Proceeds from shares issued | $ | 24,678,686 | $ | 65,684,679 | ||||
Cost of shares redeemed | (44,916,399 | ) | (84,230,503 | ) | ||||
| (20,237,713 | ) | (18,545,824 | ) | |||||
Class II Capital Transactions: | ||||||||
Proceeds from shares issued | 2,752,244 | 8,459,820 | ||||||
Cost of shares redeemed | (2,857,997 | ) | (3,277,063 | ) | ||||
| (105,753 | ) | 5,182,757 | ||||||
Class III Capital Transactions: | ||||||||
Proceeds from shares issued | 181,307 | 768,352 | ||||||
Cost of shares redeemed | (259,533 | ) | (903,195 | ) | ||||
| (78,226 | ) | (134,843 | ) | |||||
Change in net assets from capital transactions | $ | (20,421,692 | ) | $ | (13,497,910 | ) | ||
SHARE TRANSACTIONS: | ||||||||
Class I Share Transactions: | ||||||||
Issued | 1,769,436 | 4,955,945 | ||||||
Redeemed | (3,229,368 | ) | (6,417,401 | ) | ||||
| (1,459,932 | ) | (1,461,456 | ) | |||||
Class II Share Transactions: | ||||||||
Issued | 198,374 | 657,393 | ||||||
Redeemed | (206,799 | ) | (252,516 | ) | ||||
| (8,425 | ) | 404,877 | ||||||
Class III Share Transactions: | ||||||||
Issued | 12,950 | 59,336 | ||||||
Redeemed | (18,846 | ) | (67,004 | ) | ||||
| (5,896 | ) | (7,668 | ) | |||||
See notes to financial statements.
10
Table of Contents
GARTMORE VARIABLE INSURANCE TRUST
Selected Data for Each Share of Capital Outstanding
GVIT SMALL CAP GROWTH FUND
| Investment Activities: | Distributions | Ratios/Supplemental Data: | ||||||||||||||||||||||||||||||||||||||||
| Net Asset Value, Beginning of Period | Net Investment Income (Loss) | Net Realized and Unrealized Gains (Losses) on Investments | Total from Investment Activities | Net Realized Gains (Losses) | Total Distributions | Net Asset Value, End of Period | Total Return | Net Assets at End of Period (000s) | Ratio of Expenses to Average Net Assets | Ratio of Net Investment Income (Loss) to Average Net Assets | Ratio of Expenses (Prior to Reimbursements) to Average Net Assets(a) | Ratio of Net Investment Income (Loss) (Prior to Reimbursements) to Average Net Assets(a) | Portfolio Turnover(b) | |||||||||||||||||||||||||||||
Class I Shares | ||||||||||||||||||||||||||||||||||||||||||
Year Ended December 31, 2000 | $ | 19.69 | (0.02 | ) | (3.10 | ) | (3.12 | ) | (0.33 | ) | (0.33 | ) | $ | 16.24 | (16.17 | %) | $ | 93,891 | 1.30 | % | (0.22 | %) | 1.60 | % | (0.52 | %) | 182.48 | % | ||||||||||||||
Year Ended December 31, 2001(c) | $ | 16.24 | (0.07 | ) | (1.69 | ) | (1.76 | ) | — | — | $ | 14.48 | (10.84 | %) | $ | 143,982 | 1.30 | % | (0.65 | %) | 1.43 | % | (0.78 | %) | 124.61 | % | ||||||||||||||||
Year Ended December 31, 2002 | $ | 14.48 | (0.11 | ) | (4.71 | ) | (4.82 | ) | — | — | $ | 9.66 | (33.29 | %) | $ | 100,308 | 1.35 | % | (1.03 | %) | 1.35 | % | (1.03 | %) | 165.97 | % | ||||||||||||||||
Year Ended December 31, 2003 | $ | 9.66 | (0.11 | ) | 3.42 | 3.31 | — | — | $ | 12.97 | 34.27 | % | $ | 156,978 | 1.34 | % | (1.03 | %) | (h) | (h) | 121.69 | % | ||||||||||||||||||||
Year Ended December 31, 2004 | $ | 12.97 | (0.12 | ) | 1.86 | 1.74 | — | — | $ | 14.71 | 13.42 | % | $ | 156,535 | 1.21 | % | (0.90 | %) | (h) | (h) | 112.22 | % | ||||||||||||||||||||
Six Months Ended June 30, 2005 (Unaudited) | $ | 14.71 | (0.06 | ) | (0.07 | ) | (0.13 | ) | — | — | $ | 14.58 | (0.88 | %)(f) | $ | 133,883 | 1.21 | %(g) | (0.83 | %)(g) | (h) | (h) | 27.30 | % | ||||||||||||||||||
Class II Shares | ||||||||||||||||||||||||||||||||||||||||||
Period Ended December 31, 2002(d) | $ | 13.59 | (0.04 | ) | (3.92 | ) | (3.96 | ) | — | — | $ | 9.63 | (29.14 | %)(f) | $ | 1,652 | 1.63 | %(g) | (1.33 | %)(g) | (h) | (h) | 165.97 | % | ||||||||||||||||||
Year Ended December 31, 2003 | $ | 9.63 | (0.09 | ) | 3.37 | 3.28 | — | — | $ | 12.91 | 34.06 | % | $ | 8,842 | 1.59 | % | (1.29 | %) | (h) | (h) | 121.69 | % | ||||||||||||||||||||
Year Ended December 31, 2004 | $ | 12.91 | (0.12 | ) | 1.82 | 1.70 | — | — | $ | 14.61 | 13.17 | % | $ | 15,917 | 1.47 | % | (1.16 | %) | (h) | (h) | 112.22 | % | ||||||||||||||||||||
Six Months Ended June 30, 2005 (Unaudited) | $ | 14.61 | (0.07 | ) | (0.08 | ) | (0.15 | ) | — | — | $ | 14.46 | (1.03 | %)(f) | $ | 15,637 | 1.46 | %(g) | (1.08 | %)(g) | (h) | (h) | 27.30 | % | ||||||||||||||||||
Class III Shares | ||||||||||||||||||||||||||||||||||||||||||
Period Ended December 31, 2002(e) | $ | 10.95 | (0.04 | ) | (1.29 | ) | (1.33 | ) | — | — | $ | 9.62 | (12.15 | %)(f) | $ | 17 | 1.27 | %(g) | (0.94 | %)(g) | (h) | (h) | 165.97 | % | ||||||||||||||||||
Year Ended December 31, 2003 | $ | 9.62 | (0.05 | ) | 3.33 | 3.28 | — | — | $ | 12.90 | 34.10 | % | $ | 978 | 1.34 | % | (1.04 | %) | (h) | (h) | 121.69 | % | ||||||||||||||||||||
Year Ended December 31, 2004 | $ | 12.90 | (0.14 | ) | 1.87 | 1.73 | — | — | $ | 14.63 | 13.41 | % | $ | 996 | 1.21 | % | (0.91 | %) | (h) | (h) | 112.22 | % | ||||||||||||||||||||
Six Months Ended June 30, 2005 (Unaudited) | $ | 14.63 | (0.06 | ) | (0.07 | ) | (0.13 | ) | — | — | $ | 14.50 | (0.89 | %)(f) | $ | 902 | 1.20 | %(g) | (0.82 | %)(g) | (h) | (h) | 27.30 | % | ||||||||||||||||||
| (a) | During the period certain fees were waived and/or reimbursed. If such waivers/reimbursements had not occurred, the ratios would have been as indicated. |
| (b) | Portfolio turnover is calculated on the basis of the Fund as a whole without distinguishing among the classes of shares. |
| (c) | The existing shares of the Fund were designated Class I shares as of May 1, 2001. |
| (d) | For the period from March 7, 2002 (commencement of operations) through December 31, 2002. |
| (e) | For the period from July 5, 2002 (commencement of operations) through December 31, 2002. |
| (f) | Not annualized. |
| (g) | Annualized. |
| (h) | There were no fee reductions during the period. |
See notes to financial statements.
11
Table of Contents
GARTMORE VARIABLE INSURANCE TRUST
NOTES TO FINANCIAL STATEMENTS (Unaudited)
June 30, 2005
1. Organization
Gartmore Variable Insurance Trust (“GVIT” or the “Trust”) is an open-end management investment company, organized under the laws of Delaware by an amended and restated Agreement and Declaration of Trust, dated October 28, 2004, as amended to date. The Trust, originally created under the laws of Massachusetts as a Massachusetts business trust pursuant to a Declaration of Trust dated, as of June 30, 1981, was subsequently amended, redomesticated as a Delaware Statutory Trust after the close of trading on April 29, 2005, and is registered under the Investment Company Act of 1940, as amended (the “1940 Act”). The redomestication is a change in statutory status and does not affect the operations of the Trust. As of June 30, 2005, the Trust had authorized an unlimited number of shares of beneficial interest (“shares”) without par value. The Trust currently offers shares to life insurance company separate accounts to fund the benefits under variable life insurance or annuity policies. To date, only the separate accounts of Nationwide Life Insurance Company and Nationwide Life and Annuity Insurance Company (collectively, “Nationwide”) have purchased shares of the Trust’s series. The Trust operates thirty-one (31) separate series, or mutual funds, each with its own investment objectives and strategies. This report contains the financial statements and financial highlights of the GVIT Small Cap Growth Fund (the “Fund”).
Under the Trust’s organizational documents, the Trust’s officers and trustees are indemnified against certain liabilities arising out of the performance of their duties to the Trust. In addition, the Trust has entered into Indemnification Agreements with the Trust’s trustees and certain officers covering similar liabilities. In addition, in the normal course of business, the Trust enters into contracts with its vendors and others that provide for general indemnifications. The Trust’s maximum exposure under these arrangements is unknown, as this would involve future claims that may be made against the Trust. Based on experience, however, the Trust expects that risk of loss to be remote.
2. Summary of Significant Accounting Policies
The following is a summary of significant accounting policies followed by the Fund in the preparation of its financial statements. The policies are in conformity with accounting principles generally accepted in the United States of America (“GAAP”). The preparation of financial statements requires management to make estimates and assumptions that affect the reported amounts of assets and liabilities, the disclosure of contingent assets and liabilities at the date of the financial statements and the reported amounts of income and expenses for the period. Actual results could differ from those estimates.
| (a) | Security Valuation |
Securities for which market quotations are readily available are valued at current market value as of “Valuation Time.” Valuation Time is as of the close of regular trading on the New York Stock Exchange (usually 4 p.m. Eastern time). Equity securities are valued at the last quoted sale price or, if there is no sale price, the last quoted bid price provided by an independent pricing service approved by the Trust’s Board of Trustees. Securities traded on NASDAQ are valued at the NASDAQ official closing price. Prices are taken from the primary market or exchange in which each security trades. Most securities listed on a foreign exchange are valued either at fair value (see description below) or at the last sale price at the close of the exchange on which the security is principally traded. Foreign securities, currencies, and other assets and liabilities denominated in foreign currencies are translated into U.S. dollars at the exchange rate of said currencies against the U.S. Dollar, as of Valuation Time, as provided by an independent pricing service approved by the Board of Trustees.
Debt (including defaulted issues) and other fixed income securities (other than short-term obligations) are valued at the last quoted bid price and/or by using a combination of daily quotes and matrix evaluations provided by an independent pricing service, the use of which has been approved by the Trust’s Board of Trustees. Short-term debt securities, such as commercial paper and U.S. Treasury Bills having a remaining maturity of 60 days or less at the time of purchase, are considered to be “short-term” and are valued at amortized cost which approximates market value.
Securities for which market quotations are not readily available, or for which an independent pricing service does not provide a value or provides a value that does not represent fair value in the judgment of the Fund’s investment adviser or designee, are valued at fair value under procedures approved by the Trust’s Board of Trustees. The “Fair Value” of these securities is
12
Table of Contents
GARTMORE VARIABLE INSURANCE TRUST
NOTES TO FINANCIAL STATEMENTS (Unaudited) (Continued)
June 30, 2005
determined in good faith by taking into account relevant factors and surrounding circumstances. Methods utilized to obtain a “Fair Value” may include the following non-exclusive list of SEC acceptable methods: (i) a multiple of earnings; (ii) the discount from market value of a similar, freely traded security; (iii) the yield-to-maturity for debt issues; or (iv) a consolidation of the methods. The Gartmore Fair Value Committee considers a non-exclusive list of factors to arrive at the appropriate method upon determining “Fair Value.” For example, fair value determinations are required for securities whose value is affected by a “significant” event that materially affects the value of a domestic or foreign security which occurs subsequent to the time of the close of the principal market on which such domestic or foreign security trades and before the Valuation Time (i.e., a “subsequent event”). Typically, this will involve events occurring after the close of a foreign market on which a security trades and before the next Valuation Time.
The Fund values foreign securities at fair value in the circumstances described below. Generally, trading in foreign securities markets is completed each day at various times prior to the Valuation Time. Due to the time differences between the closings of the relevant foreign securities exchanges and the Valuation Time for the Fund, the Fund will fair value its foreign investments when it is determined that the market quotations for the foreign investments either are not readily available or are unreliable and, therefore, do not represent fair value. When the fair value prices are utilized, these prices will attempt to reflect the impact of the U.S. financial markets’ perceptions and trading activities on the Fund’s foreign investments since the last closing prices of the foreign investments were calculated on their primary foreign securities markets or exchanges. For these purposes, the Board of Trustees of the Trust has determined that movements in relevant indices or other appropriate market indicators, after the close of the foreign securities exchanges, may demonstrate that market quotations are unreliable, and may trigger fair value pricing for certain securities. Consequently, fair valuation of portfolio securities may occur on a daily basis. In determining fair value prices, the Trust utilizes data furnished by an independent pricing service (and that data draws upon, among other information, the market values of foreign investments). The fair value prices of portfolio securities generally will be used when it is determined that the use of these prices will have a material impact on the net asset value of the Fund. When the Fund uses fair value pricing, the values assigned to the Fund’s foreign investments may not be the quoted or published prices of the investments on their primary markets or exchanges.
| (b) | Repurchase Agreements |
The Fund may enter into repurchase agreements with an entity which is a member of the Federal Reserve System or which is a “primary dealer” (as designated by the Federal Reserve Bank of New York) in U.S. Government obligations. The repurchase price generally equals the price paid by the Fund plus interest negotiated on the basis of current short-term rates, which may be more or less than the rate on the underlying portfolio securities. The seller under a repurchase agreement is required to maintain the value of the collateral held pursuant to the agreement at a market value equal to or greater than the repurchase price (including accrued interest). Collateral subject to repurchase agreements is held by the Fund’s custodian or another qualified sub-custodian or in the Federal Reserve/Treasury book-entry system. If the counterparty defaults and the fair value of the collateral declines, realization of the collateral by the Fund may be delayed or limited. The Fund may transfer uninvested cash balances into a pooled cash account. These balances are invested in one or more repurchase agreements, which are fully collateralized by AA-rated Corporate Bonds with the counterparties of CS First Boston and Nomura Securities.
| (c) | Foreign Currency Transactions |
The accounting records of the Fund are maintained in U.S. dollars. Foreign currency amounts are translated into U.S. dollars at the current rate of exchange to determine the value of investments, assets and liabilities. The Fund may enter into foreign currency contracts in connection with purchases or sales of securities denominated in a foreign currency. Purchases and sales of securities, and income and expenses, are translated at the prevailing rate of exchange on the respective date of these transactions. The Fund does not isolate that portion of the results of operations resulting from changes in foreign exchange rates on investments from fluctuations arising from changes in market prices of securities held. These fluctuations are included with the net realized and unrealized gain or loss from investments and foreign currencies.
13
Table of Contents
GARTMORE VARIABLE INSURANCE TRUST
NOTES TO FINANCIAL STATEMENTS (Unaudited) (Continued)
June 30, 2005
| (d) | Risks Associated with Foreign Securities and Currencies |
Investments in securities of foreign issuers carry certain risks not ordinarily associated with investments in securities of U.S. issuers. These risks include future political and economic developments, and the possible imposition of exchange controls or other foreign governmental laws and restrictions. In addition, with respect to certain countries, there is the possibility of expropriation of assets, confiscatory taxation, political or social instability, or diplomatic developments, which could adversely affect investments in those countries.
Certain countries also may impose substantial restrictions on investments in their capital markets by foreign entities, including restrictions on investments in issuers of industries deemed sensitive to relevant national interests. These factors may limit the investment opportunities available and result in a lack of liquidity and high price volatility with respect to securities of issuers from developing countries.
| (e) | Forward Foreign Currency Contracts |
The Fund may enter into forward foreign currency contracts in connection with planned purchases or sales of securities or to hedge the U.S. dollar value of portfolio securities denominated in a particular currency. The Fund could be exposed to risks if the counterparties to the contracts are unable to meet the terms of their contracts and from unanticipated movements in the value of a foreign currency relative to the U.S. dollar. Forward foreign currency contracts are valued at the current cost of covering these contracts, as provided by an independent pricing service approved by the Board of Trustees. The forward foreign currency contracts are adjusted by the daily exchange rate of the underlying currency and any gains or losses are recorded for financial statement purposes as unrealized gains or losses until the contract settlement date.
| (f) | Futures Contracts |
The Fund may invest in financial futures contracts (“futures contracts”) for the purpose of hedging its existing portfolio securities or securities that the Fund intends to purchase against fluctuations in value caused by changes in prevailing market interest rates or prices. Futures contracts may also be entered into for non-hedging purposes.
Upon entering into a futures contract, the Fund is required to pledge to the broker an amount of cash and/or other assets equal to a certain percentage of the contract amount (initial margin deposit). Subsequent payments, known as “variation margin,” are made each day, depending on the daily fluctuations in the fair value/market value of the underlying assets. A gain or loss equal to the daily variation margin is recognized on a daily basis. Futures contracts are valued daily at their last quoted sale price.
A “sale” of a futures contract means a contractual obligation to deliver the securities or foreign currency called for by the contract at a fixed price at a specified time in the future. A “purchase” of a futures contract means a contractual obligation to acquire the securities or foreign currency at a fixed price at a specified time in the future.
Should market conditions change unexpectedly, the Fund may not achieve the anticipated benefits of the futures contracts and may realize a loss. The use of futures transactions for hedging purposes involves the risk of imperfect correlation in movements in the price of futures contracts, interest rates, and the value of the underlying hedged assets.
| (g) | Written Options Contracts |
The Fund may write options contracts. A written option obligates the Fund to deliver (written call) or to receive (written put) a specified quantity of an underlying asset at the contract amount upon exercise by the holder of the option. The value of the option contract is recorded as a liability and unrealized gain or loss is measured by the difference between the current value and the premium received. Options traded on an exchange are valued at the last quoted sale price, or in the absence of a sale, the bid price provided by an independent pricing service approved by the Board of Trustees. Non-exchange traded options are valued using dealer supplied quotes.
| (h) | Security Transactions and Investment Income |
Security transactions are accounted for on the date the security is purchased or sold (“trade date”). Securities gains and losses are calculated on the identified cost basis. Interest income is recognized on the accrual basis and includes, where applicable, the amortization or accretion of premium or discount. Dividend income is recorded on the ex-dividend date.
14
Table of Contents
GARTMORE VARIABLE INSURANCE TRUST
NOTES TO FINANCIAL STATEMENTS (Unaudited) (Continued)
June 30, 2005
| (i) | Securities Lending |
To generate additional income, the Fund may lend up to 33 1/3% of the Fund’s total assets pursuant to agreements, requiring that the borrower deliver cash or securities as collateral with respect to each new loan of U.S. securities, equal to at least 102% of the value of the portfolio securities loaned, and with respect to each new loan of non-U.S. securities, collateral of at least 105% of the value of the portfolio securities loaned, and thereafter requiring the borrower to mark to market the collateral on a daily basis and requiring the borrower to make up any shortfall of collateral. The Fund receives payments from borrowers equivalent to the dividends and interest that would have been earned on securities lent while simultaneously seeking to earn income on the investment of cash collateral. Collateral is marked to market daily to provide a level of collateral at least equal to the market value of securities loaned. There may be risks of delay in recovery of the securities should the borrower of the securities fail financially. Loans will be made, however, only to borrowers deemed by the Fund’s investment adviser to be of good standing and creditworthy under guidelines established by the Board of Trustees and when, in the judgment of the adviser, the consideration which can be earned currently from these securities loans justifies the attendant risks. Loans are subject to termination by the Fund or the borrower at any time, and, therefore, are not considered to be illiquid investments. JPMorgan Chase Bank serves as custodian for the securities lending program of the Fund. JPMorgan Chase Bank receives a custody fee based on the value of collateral received from borrowers.
The cash collateral received by the Fund was pooled and, at June 30, 2005, was invested in the following:
Security Type | Security Name | Market Value | Maturity Rate | Maturity Date | |||||
| Commercial Paper | MacQuarie Bank Ltd. | $ | 998,736 | 3.25% | 07/01/05 | ||||
| Domestic Certificates of Deposit — Fixed | Washington Mutual Bank FA | 1,700,443 | 3.15% | 08/01/05 | |||||
| Funding Agreement | GE Life and Annuity | 1,000,000 | 3.32% | 07/14/05 | |||||
| Master Note — Floating | CDC Financial Product Inc. | 6,500,000 | 3.54% | 07/01/05 | |||||
| Medium Term Note — Floating | General Electric Capital Corp. | 1,000,171 | 3.37% | 09/08/05 | |||||
| Repurchase Agreements | Nomura Securities | 6,287,323 | 3.48% | 07/01/05 | |||||
As of June 30, 2005, the Fund had securities with the following market values on loan:
Market Value of | Market Value of Collateral | |
$17,214,143 | $17,486,673 |
| (j) | Distributions to Shareholders |
The Fund’s dividends from net investment income, if any, are declared and paid quarterly. The Fund’s distributable net realized capital gains, if any, are declared and distributed at least annually.
Dividends and distributions to shareholders are determined in accordance with federal income tax regulations, which may differ from GAAP. These “book/tax” differences are considered either permanent or temporary in nature. In accordance with the American Institute of Certified Public Accountants (“AICPA”) Statement of Position 93-2, permanent differences (i.e., reclassification of market discounts, gain/loss, paydowns, and distributions) are reclassified within the capital accounts based on their nature for federal income tax purposes; temporary differences do not require reclassification. These reclassifications have no effect upon the net asset value of the Fund. To the extent distributions exceed current and accumulated earnings and profits for federal income tax purposes, these distributions are reported as distributions of paid-in-capital.
| (k) | Federal Income Taxes |
It is the policy of the Fund to qualify or continue to qualify as a “regulated investment company” by complying with the provisions available to certain investment companies, as defined in applicable sections of the U.S. Internal Revenue Code, and to make distributions of net investment income and net realized capital gains sufficient to relieve the Fund from all, or substantially all, federal income taxes.
15
Table of Contents
GARTMORE VARIABLE INSURANCE TRUST
NOTES TO FINANCIAL STATEMENTS (Unaudited) (Continued)
June 30, 2005
As of June 30, 2005, the tax cost of securities and the breakdown of unrealized appreciation (depreciation) for the Fund is as follows:
Tax Cost of | Unrealized Appreciation | Unrealized Depreciation | Net Unrealized Appreciation (Depreciation) | |||||||
$589,177 | $ | 36,783,917 | $ | (2,824,916 | ) | $ | 33,959,001 | |||
| (l) | Allocation of Expenses, Income, and Gains and Losses |
Expenses directly attributable to the Fund are charged to the Fund. Expenses not directly attributable to the Fund are allocated proportionately among various or all funds within the Trust. The method used by the Fund for allocating income, fund level expenses, and realized and unrealized gains or losses is based on the fair value of shares outstanding relative to net assets. Under this method, each class of shares participates based on the total net asset value of that class’s shares in proportion to the total net assets of the Fund. Expenses specific to a class (such as rule 12b-1 and administrative services fees) are charged to that class.
3. Transactions with Affiliates
Under the terms of the Trust’s Investment Advisory Agreement, Gartmore Mutual Fund Capital Trust (“GMF”) manages the investment of the assets and supervises the daily business affairs of the Fund. GMF is a wholly-owned subsidiary of Gartmore Global Investments, Inc. (“GGI”), a holding company. GGI is a majority-owned subsidiary of Gartmore Global Asset Management Trust (“GGAMT”). GGAMT is a wholly-owned subsidiary of Nationwide Corporation. All of the common stock of Nationwide Corporation is held by Nationwide Mutual Insurance Company (95.2%) and Nationwide Mutual Fire Insurance Company (4.8%), each of which is a mutual company owned by its policyholders. In addition, GMF provides investment management evaluation services in initially selecting and monitoring, on an ongoing basis, the performance of the subadvisers, for the Fund. The subadvisers listed below manage all or a portion of the Fund’s investments and have the responsibility for making all investment decisions for that portion of the Fund unless otherwise indicated. Below is a list of the subadvisers to the Fund:
Subadvisers |
- Waddell & Reed Investment Management Company |
- Oberweis Asset Management, Inc. |
Under the terms of the Investment Advisory Agreement, the Fund pays GMF an investment advisory fee of 0.95% based on that Fund’s average daily net assets. From such fees, pursuant to the subadvisory agreements, GMF pays fees of 0.60% to the subadvisers.
Under the terms of a Fund Administration and Transfer Agency Agreement, Gartmore SA Capital Trust (“GSA”) provides the Fund with various administrative and accounting services, and Gartmore Investors Services, Inc. (“GISI”), an indirect subsidiary of GSA, serves as Transfer and Dividend Disbursing Agent for the Fund. The fees for the services provided under this Agreement are calculated based on the Trust’s average daily net assets according to the fee schedule below. The fees are then allocated proportionately among all funds within the Trust in relation to the average daily net assets of each fund and are paid to GSA. GSA pays GISI from these fees for its services.
| Combined Fee Schedule* | ||
Up to $1 billion | 0.13% | |
$1 billion and more up to $3 billion | 0.08% | |
$3 billion and more up to $8 billion | 0.05% | |
$8 billion and more up to $10 billion | 0.04% | |
$10 billion and more up to $12 billion | 0.02% | |
$12 billion or more | 0.01% | |
| * | The assets of the Gartmore GVIT Investor Destinations Aggressive Fund, the Gartmore GVIT Investor Destinations Moderately Aggressive Fund, the Gartmore GVIT Investor Destinations Moderate Fund, the Gartmore GVIT Investor Destinations Moderately Conservative Fund, and the Gartmore GVIT Investor Destinations Conservative Fund (collectively, the “Investor Destinations Funds”) are excluded from the Trust asset level amount in order to calculate this asset-based fee. The Investor Destinations Funds do not pay any part of this fee. |
16
Table of Contents
GARTMORE VARIABLE INSURANCE TRUST
NOTES TO FINANCIAL STATEMENTS (Unaudited) (Continued)
June 30, 2005
Effective January 1, 2005, the fee for the fund administration and transfer agency services increased as set forth below. The fees are calculated based on the Trust’s average daily net assets according to the fee schedule below. The fees are then allocated proportionately among all funds within the Trust in relation to the average daily net assets of each fund and are paid to GSA.
| Combined Fee Schedule* | ||
Up to $1 billion | 0.15% | |
$1 billion and more up to $3 billion | 0.10% | |
$3 billion and more up to $8 billion | 0.05% | |
$8 billion and more up to $10 billion | 0.04% | |
$10 billion and more up to $12 billion | 0.02% | |
$12 billion or more | 0.01% | |
| * | The assets of each of the Investor Destinations Funds are excluded from the Trust asset level amount in order to calculate this asset-based fee. The Investor Destinations Funds do not pay any part of this fee. |
GSA and GISI have entered into agreements with BISYS Fund Services Ohio, Inc. (“BISYS”), pursuant to which BISYS provides sub-administration and sub-transfer agency services, respectively, to the Fund.
Under the terms of a Distribution Plan under Rule 12b-1 of the 1940 Act, Gartmore Distribution Services, Inc. (“GDSI”), the Fund’s Distributor, is compensated by the Fund for expenses associated with the distribution of the Class II of the Fund. These fees are based on average daily net assets of Class II shares of the Fund at an annual rate not to exceed 0.25%.
Under the terms of an Administrative Services Plan, the Fund may pay fees to servicing organizations, such as broker-dealers, including Nationwide Financial Services, and financial institutions, which agree to provide administrative support services to the shareholders of certain classes. These services include, but are not limited, to the following: establishing and maintaining shareholder accounts; processing purchase and redemption transactions; arranging bank wires; performing shareholder sub-accounting; answering inquires regarding the Fund; and other such services. These fees are based on an annual rate of up to 0.25% of the average daily net assets of each class of shares of the Fund.
4. Short-Term Trading Fees
The Fund reserves the right to assess a short-term trading fee on certain transactions out of Class III shares that a separate account makes on behalf of a variable insurance contract owner (the “contract owner”). A separate account that redeems Class III shares on behalf of a contract owner may be subject to a 1.00% short-term trading fee if the separate account held the Class III shares on behalf of the contract owner for 60 days or less, unless an exception applies as disclosed in the prospectus. The short-term trading fee is paid directly to the Fund and is intended to offset the cost to the Fund of excess brokerage commissions and other costs associated with fluctuations in fund asset levels and cash flow caused by short-term trading. For purposes of determining whether the short-term trading fee applies, the Class III shares that were held on behalf of the contract owner the longest will be treated as being redeemed first.
For the six months ended June 30, 2005, the Fund had no contributions to capital due to collection of redemption fees.
5. Investment Transactions
For the six months ended June 30, 2005, (excluding short-term securities) the Fund had purchases of $39,292,526 and sales of $59,373,882.
6. Bank Loans
The Trust has a credit agreement of $100,000,000. Borrowings under this arrangement bear interest at the Federal Funds rate plus 0.50%. The interest costs are included in custodian fees in the Statement of Operations. No compensation balances were required under the terms of the line of credit. There were no borrowings outstanding as of June 30, 2005.
17
Table of Contents
GARTMORE VARIABLE INSURANCE TRUST
NOTES TO FINANCIAL STATEMENTS (Unaudited) (Continued)
June 30, 2005
7. Shareholder Meeting
A separate shareholders meeting was held on Tuesday, December 23, 2004, for the shareholders of the Trust’s predecessor pursuant to a Proxy Statement On Schedule 14A, dated October 29, 2004, and mailed to the shareholders of the Trust’s predecessor on or around November 5, 2004.
Two Proposals: The purpose of the December 23, 2004 meeting was to allow the shareholders of the Trust’s predecessor to vote on:
| i. | Proposal One: The election of the Trust’s Board of Trustees; and |
| ii. | Proposal Two: The approval of an “Agreement and Plan of Reorganization” that provided for the reorganization of the Trust from a Massachusetts business trust into a Delaware statutory trust. |
Proposal One: As set forth in the October 29, 2004 Proxy Statement, the nominees for election as Trustees of the Trust’s predecessor were: Charles E. Allen, Michael J. Baresich, Paula H.J. Cholmondeley, C. Brent DeVore, Phyllis Kay Dryden, Robert M. Duncan, Barbara L. Hennigar, Paul J. Hondros, Barbara I Jacobs, Thomas J. Kerr IV, Douglas F. Kridler, Michael D. McCarthy, Arden L. Shisler, and David C. Wetmore.
Proposal Two: As specifically set forth in the October 29, 2004 Proxy Statement, the Reorganization proposal requested the shareholders of the Trust’s predecessor to approve the proposed “Agreement and Plan of Reorganization” of the Trust’s predecessor (on behalf of each of the its funds) into a new Delaware-domiciled Trust, whereby the Funds of the new Delaware Trust would acquire all of the assets of the corresponding funds of the Trust’s predecessor subject to the liabilities, expenses, costs, charges, and reserves of the corresponding funds of the Trust’s predecessor (contingent or otherwise), in exchange for shares of the acquiring Funds to be distributed pro rata by the Trust to the holders of the shares of the funds of the Trust’s predecessor, in a complete liquidation of the Trust’s predecessor.
Voting Results:
The shareholders of the Trust’s predecessor voted to approve both Proposal One and Proposal Two, as follows:
Proposal 1: Election of a Board of Trustees of Gartmore Variable Insurance Trust
Charles E. Allen: | ||
FOR | 2,797,230,318.955 shares (96.078%) | |
WITHHOLD | 114,195,693.660 shares (3.922%) | |
TOTAL | 2,912,726,012.615 shares (100.000%) | |
Michael J. Baresich: | ||
FOR | 2,796,135,979.559 shares (96.040%) | |
WITHHOLD | 115,290,033.056 shares (3.960%) | |
TOTAL | 2,912,726,012.615 shares (100.000%) | |
Paula H.J. Cholmondeley: | ||
FOR | 2,795,095,945.396 shares (96.004%) | |
WITHHOLD | 116,330,067.219 shares (3.996%) | |
TOTAL | 2,912,726,012.615 shares (100.000%) | |
18
Table of Contents
GARTMORE VARIABLE INSURANCE TRUST
NOTES TO FINANCIAL STATEMENTS (Unaudited) (Continued)
June 30, 2005
C. Brent DeVore: | ||
FOR | 2,797,207,046.916 shares (96.077%) | |
WITHHOLD | 114,218,965.699 shares (3.923%) | |
TOTAL | 2,912,726,012.615 shares (100.000%) | |
Phyllis Kay Dryden: | ||
FOR | 2,795,587,023.994 shares (96.021%) | |
WITHHOLD | 115,838,988.621 shares (3.979%) | |
TOTAL | 2,912,726,012.615 shares (100.000%) | |
Robert M. Duncan: | ||
FOR | 2,790,191,720.503 shares (95.836%) | |
WITHHOLD | 121,234,292.112 shares (4.164%) | |
TOTAL | 2,912,726,012.615 shares (100.000%) | |
Barbara L. Hennigar: | ||
FOR | 2,792,939,848.858 shares (95.937%) | |
WITHHOLD | 118,486,163.757 shares (4.070%) | |
TOTAL | 2,912,726,012.615 shares (100.000%) | |
Paul J. Hondros: | ||
FOR | 2,797,557,404.448 shares (96.089%) | |
WITHHOLD | 113,868,608.167 shares (3.911%) | |
TOTAL | 2,912,726,012.615 shares (100.000%) | |
Barbara I. Jacobs: | ||
FOR | 2,796,306,126.654 shares (96.046%) | |
WITHHOLD | 115,119,885.961 shares (3.954%) | |
TOTAL | 2,912,726,012.615 shares (100.000%) | |
Thomas J. Kerr IV: | ||
FOR | 2,789,755,720.087 shares (95.821%) | |
WITHHOLD | 121,670,292.528 shares (4.179%) | |
TOTAL | 2,912,726,012.615 shares (100.000%) | |
Douglas F. Kridler: | ||
FOR | 2,798,065,774.375 shares (96.106%) | |
WITHHOLD | 113,360,238.240 shares (3.894%) | |
TOTAL | 2,912,726,012.615 shares (100.000%) | |
Michael D. McCarthy: | ||
FOR | 2,797,452,613.694 shares (96.085%) | |
WITHHOLD | 113,973,395.921 shares (3.915%) | |
TOTAL | 2,912,726,012.615 shares (100.000%) | |
19
Table of Contents
GARTMORE VARIABLE INSURANCE TRUST
NOTES TO FINANCIAL STATEMENTS (Unaudited) (Continued)
June 30, 2005
Arden L. Shisler: | ||
FOR | 2,796,738,454.730 shares (96.061%) | |
WITHHOLD | 114,687,557.885 shares (3.939%) | |
TOTAL | 2,912,726,012.615 shares (100.000%) | |
David C. Wetmore: | ||
FOR | 2,794,784,752.247 shares (95.994%) | |
WITHHOLD | 116,641,260.368 shares (4.006%) | |
TOTAL | 2,912,726,012.615 shares (100.000%) | |
Proposal 2: Approval of the Agreement and Plan of Reorganization of Gartmore Variable Insurance Trust
FOR | 2,561,003,822.546 shares (87.964%) | |
AGAINST | 103,593,261.010 shares (3.558%) | |
ABSTAIN | 246,828,929.059 shares (8.478%) | |
TOTAL | 2,912,726,012.615 shares (100.000%) | |
20
Table of Contents
GARTMORE VARIABLE INSURANCE TRUST
Management Information (Unaudited)
June 30, 2005
Trustees who are not Interested Persons (as defined in the 1940 Act) and Officers of the Funds June 30, 2005
| Name, Address and Date of Birth | Position(s) Held with the Trust and Length of Time Served1 | Principal Occupation(s) During Past Five Years | Number of Portfolios in the Gartmore Fund Complex Overseen by Trustee | Other Directorships Held by Trustee or Nominee2 | ||||
Charles E. Allen
c/o Gartmore Global Investments, Inc. 1200 River Road, Suite 1000 Conshohocken, PA 19428
1948 | Trustee since July 2000 | Mr. Allen is Chairman, Chief Executive Officer and President of the Graimark Realty Advisors, Inc. (real estate development, investment and asset management). | 84 | None | ||||
Paula H.J. Cholmondeley
c/o Gartmore Global Investments, Inc. 1200 River Road, Suite 1000 Conshohocken, PA 19428
1940 | Trustee since July 2000 | Ms. Cholmondeley has been the Chairman and Chief Executive Officer of the Sorrel Group, a management consulting company, since January 2004. From March 2000 through December 2003, Ms. Cholmondeley was Vice President and General Manager of Sappi Fine Paper North America. Prior thereto, Ms. Cholmondeley was Vice President and General Manager of Residential Insulation of Owens Corning. | 84 | Director of Dentsply International, Inc., Ultralife Batteries, Inc., Terex Corporation, Minerals Technology, Inc. and Albany International Corp. | ||||
C. Brent DeVore
c/o Gartmore Global Investments, Inc. 1200 River Road, Suite 1000 Conshohocken, PA 19428
1940 | Trustee since 1990 | Dr. DeVore is President of Otterbein College. | 84 | None | ||||
Phyllis K. Dryden
c/o Gartmore Global Investments, Inc. 1200 River Road, Suite 1000 Conshohocken, PA 19428
1947 | Trustee since December 2004 | Ms. Dryden was a former Managing Partner of marchFIRST, a global management consulting firm prior to 2002. | 84 | None |
21
Table of Contents
GARTMORE VARIABLE INSURANCE TRUST
Management Information (Unaudited)
December 31, 2004
| Name, Address and Date of Birth | Position(s) Held with the Trust and Length of Time Served1 | Principal Occupation(s) During Past 5 Years | Number of Portfolios in the Gartmore Fund Complex Overseen by Trustee | Other Directorships Held by Trustee or Nominee2 | ||||
Barbara L. Hennigar*
c/o Gartmore Global Investments, Inc. 1200 River Road, Suite 1000 Conshohocken, PA 19428
1935 | Trustee since July 2000 | Retired since June 2000. Prior thereto, Ms. Hennigar was the Chairman or President and Chief Executive Officer of OppenheimerFunds Services and a member of the Executive Committee of OppenheimerFunds. | 84 | None | ||||
Barbara I. Jacobs
c/o Gartmore Global Investments, Inc. 1200 River Road, Suite 1000 Conshohocken, PA 19428
1950 | Trustee since December 2004 | Ms. Jacobs has served as Chairman of the Board of Directors of KICAP Network Fund, a European (United Kingdom) hedge fund, since December 2000. Prior to 2004, Ms. Jacobs was also a Managing Director and European Portfolio Manager with CREF Investments (Teachers Insurance Annuity Association — College Retirement Equity Fund). | 84 | None | ||||
Douglas F. Kridler
c/o Gartmore Global Investments, Inc. 1200 River Road, Suite 1000 Conshohocken, PA 19428
1955 | Trustee since September 1997 | Mr. Kridler has served as the President and Chief Executive Officer of the Columbus Foundation (a Columbus, OH-based foundation which manages over 1,300 individual endowment funds) since February 2002. Mr. Kridler was the President of the Columbus Association for the Performing Arts prior thereto and Chairman of the Greater Columbus Convention and Visitors Bureau during 2000 and 2001. | 84 | None | ||||
Michael D. McCarthy
c/o Gartmore Global Investments, Inc. 1200 River Road, Suite 1000 Conshohocken, PA 19428
1947 | Trustee since December 2004 | Mr. McCarthy serves as: the Founder and Chairman of The Eureka Foundation (which sponsors and funds the “Great Museums” series on PBS); and a Partner of Pineville Properties LLC (a commercial real estate development firm). | 843 | None |
22
Table of Contents
GARTMORE VARIABLE INSURANCE TRUST
Management Information (Unaudited)
December 31, 2004
| Name, Address and Date of Birth | Position(s) Held with the Trust and Length of Time Served1 | Principal Occupation(s) During Past 5 Years | Number of Portfolios in the Gartmore Fund Complex Overseen by Trustee | Other Directorships Held by Trustee or Nominee2 | ||||
David C. Wetmore
c/o Gartmore Global Investments, Inc. 1200 River Road, Suite 1000 Conshohocken, PA 19428
1948 | Trustee since 1995 and Chairman since February 2005 | Retired. Mr. Wetmore was formerly a Managing Director of Updata Capital, an investment banking and venture capital firm. | 84 | None |
| * | Pursuant to the Trust’s mandatory retirement policy, Ms. Hennigar is expected to retire on or about January 12, 2006. |
| 1 | The term of office length is until a trustee resigns or reaches a mandatory retirement age of 70. On March 2, 2000, the Board adopted a five-year implementation period for any Trustee 65 or older as of the adoption of this policy. Pursuant to this policy, Messrs. Duncan and Kerr retired as trustees effective as of March 12, 2005. |
| 2 | Directorships held in (1) any other investment companies registered under the 1940 Act, (2) any company with a class of securities registered pursuant to Section 12 of the Securities Exchange Act of 1934, as amended (the “Exchange Act”), or (3) any company subject to the requirements of Section 15(d) of the Exchange Act. |
| 3 | Mr. McCarthy was also an Administrative Committee Member for the Alphagen Arneb Fund, LLC, The Healthcare Fund LDC, The Leaders Long-Short Fund, LLC, and The Leaders Long-Short Fund LDC, four private investment companies (hedge funds) managed by GSA. Mr. McCarthy resigned as an Administrative Committee Member effective June 30, 2005. |
Trustees and Officers who are not Interested Persons (as defined in the 1940 Act) of the Funds received aggregate compensation of $274,882 from the Trust for the Six Months Ended June 30, 2005. Additional information regarding the Trustees and Officers may be found in the Trust’s statement of additional information, which is available without charge upon request, by calling 1-800-848-0920.
23
Table of Contents
GARTMORE VARIABLE INSURANCE TRUST
Management Information (Unaudited)
June 30, 2005
Trustees who are Interested Persons (as defined in the 1940 Act) and/or Officers of the Funds June 30, 2005
| Name, Address and Age | Position(s) Held with the Trust and Length of Time Served1 | Principal Occupation(s) During Past Five Years | Number of Portfolios in the Gartmore Fund Complex Overseen by Trustee | Other Directorships Held by Trustee2 | ||||
Paul J. Hondros
Gartmore Global Investments, Inc. 1200 River Road, Suite 1000 Conshohocken, PA 19428
1948 | Trustee since July 2000 | Mr. Hondros has been President and Chief Executive Officer of various Gartmore entities, including Gartmore Distribution Services, Inc. (“GDSI”),3 Gartmore Investor Services, Inc. (“GISI”),3 Gartmore Morley Capital Management, Inc. (“GMCM”),3 Gartmore Morley Financial Services, Inc. (“GMFS”),3 NorthPointe Capital, LLC (“NorthPointe”),3 Gartmore Global Asset Management Trust (“GGAMT”)3, Gartmore Global Investments, Inc. (“GGI”)3, Gartmore Mutual Fund Capital Trust (“GMFCT”)3 and Gartmore SA Capital Trust (“GSA”)3; and a Director of Nationwide Securities, Inc.3, as well as several entities within Nationwide Financial Services, Inc. | 844 | None | ||||
Arden L. Shisler
c/o Gartmore Global Investments, Inc. 1200 River Road, Suite 1000 Conshohocken, PA 19428
1941 | Trustee since February 2000 | Mr. Shisler has been a consultant since January 2003. Prior thereto, he was President and Chief Executive Officer of K&B Transport, Inc., a trucking firm. Since 1992, Mr. Shisler has also been Chairman of the Board for Nationwide Mutual Insurance Company3. | 84 | Director of Nationwide Financial Services, Inc. | ||||
Gerald J. Holland
Gartmore Global Investments, Inc. 1200 River Road, Suite 1000 Conshohocken, PA 19428
1951 | Treasurer since March 2001 | Mr. Holland is Senior Vice President – Operations for GGI3, GMFCT3 , and GSA3. Prior to July 2000, Mr, Holland was Vice President for First Data Investor Services, an investment company service provider. | 84 | None |
24
Table of Contents
GARTMORE VARIABLE INSURANCE TRUST
Management Information (Unaudited)
December 31, 2004
| Name, Address and Age | Position(s) Held with the Trust and Length of Time Served1 | Principal Occupation(s) During Past 5 Years | Number of Portfolios in the Gartmore Fund Complex Overseen by Trustee | Other Directorships Held by Trustee2 | ||||
Michael A. Krulikowski
Gartmore Global Investments, Inc. 1200 River Road, Suite 1000 Conshohocken, PA 19428
1959 | Chief Compliance Officer since June 2004 | Since November 1999, Mr. Krulikowski has served as a Vice President and Chief Compliance Officer of GGI. Prior thereto, Mr. Krulikowski served as Chief Compliance Officer of 1717 Capital Management Company/Provident Mutual Insurance Company. | 84 | None | ||||
Eric E. Miller
Gartmore Global Investments, Inc. 1200 River Road, Suite 1000 Conshohocken, PA 19428
1953 | Secretary since December 2002 | Mr. Miller is Senior Vice President, Chief Counsel for GGI3, GMFCT3 and GSA3 since August 2002. From August 2000 to August 2002, Mr. Miller was a Partner with Stradley Ronan Stevens & Young, LLP. Prior to August 2000, Mr. Miller served as Senior Vice President and Deputy General Counsel at Delaware Investments. | 84 | None |
| 1 | The term of office length is until a trustee resigns or reaches a mandatory retirement age of 70. On March 2, 2000, the Board adopted a five-year implementation period for any Trustee 65 or older as of the adoption of this policy. Pursuant to this policy, Messrs. Duncan and Kerr retired as trustees effective as of March 12, 2005. |
| 2 | Directorships held in (1) any other investment companies registered under the 1940 Act, (2) any company with a class of securities registered pursuant to Section 12 of the Securities Exchange Act of 1934, as amended (the “Exchange Act”), or (3) any company subject to the requirements of Section 15(d) of the Exchange Act. |
| 3 | This position is held with an affiliated person or principal underwriter of the Trust. |
| 4 | Mr. Hondros was also an Administrative Committee Member for the Alphagen Arneb Fund, LLC, The Healthcare Fund LDC, The Leaders Long-Short Fund, LLC, and The Leaders Long-Short Fund LDC, four private investment companies (hedge funds) managed by GSA. Mr. Hondros resigned as Administrative Committee Member effective June 30, 2005. |
Federal law requires the Trust, each of its investment advisers and sub-advisers to adopt procedures for voting proxies (“Proxy Voting Guidelines”) and to provide a summary of those Proxy Voting Guidelines used to vote the securities held by the Funds. The Funds’ proxy voting policies and procedures are available without charge (i) upon request, by calling 1-800-848-0920, (ii) on the Fund’s website at www.gartmorefunds.com, or (iii) on the Securities and Exchange Commission’s website at www.sec.gov.
25
Table of Contents
Gartmore GVIT Worldwide Leaders Fund
Semiannual Report
| | June 30, 2005 |
| Contents | ||
| 6 | Statement of Investments | |
| 8 | Statement of Assets and Liabilities | |
| 8 | Statement of Operations | |
| 9 | Statements of Changes in Net Assets | |
| 10 | Financial Highlights | |
| 11 | Notes to Financial Statements | |
Commentary provided by Gartmore Global Investments, investment adviser to Gartmore Variable Insurance Trust. All opinions and estimates included in this report constitute Gartmore Global Investments’ judgment as of the date of this report and are subject to change without notice.
Statement Regarding Availability of Quarterly Portfolio Schedule.
The Gartmore Variable Insurance Trust files complete schedules of portfolio holdings for each Fund with the Securities and Exchange Commission (the “Commission”) for the first and third quarters of each fiscal year on Form N-Q. The Funds’ Forms N-Q are available on the Commission’s website at http://www.sec.gov. The Funds’ Forms N-Q may be reviewed and copied at the Commission’s Public Reference Room in Washington, DC, and information on the operation of the Public Reference Room may be obtained by calling 800-SEC-0330; and the Funds make the information on Form N-Q available to shareholders upon request without charge.
Statement Regarding Availability of Proxy Voting Record.
Information regarding how the Fund voted proxies relating to portfolio securities held during the most recent 12-month period ended June 30, 2005 is available without charge, upon request, by calling 800-848-0920, and on the Commission’s website at http://www.sec.gov.
Table of Contents
Gartmore GVIT Worldwide Leaders Fund
For the semiannual period ended June 30, 2005, the Gartmore GVIT Worldwide Leaders Fund returned 0.60% (Class I at NAV) versus -0.40% for its benchmark, the Morgan Stanley Capital International (MSCI) World Index. For broader comparison, the average return for the Fund’s Lipper peer category of Global Core Funds was - -0.59%.
In local currency terms, international stock markets significantly outperformed their U.S. counterparts during the first six months of the year. However, a surge in the U.S. dollar during the second quarter offset much of the rise in international markets. Increases in the value of the U.S. dollar undercut market gains abroad when transactions are converted from weaker foreign currencies to U.S. dollars.
The Fund was helped most by favorable stock selection in information technology, along with stock picking in materials and energy. In technology, Apple Computer, Inc. was a standout. Sales of the iPod, the company’s portable digital music player, continued to be robust, and multimedia applications related to the iPod drove brisk sales of Apple’s computers. However, we felt that the stock’s valuation had become stretched, and we liquidated our position to lock in profits. Also turning in a strong performance was South Korea’s Hynix Semiconductor Inc., which surged by more than 40% due to improving demand for its chips as well as positive investor sentiment, triggered in part by industry bellwether Intel Corp., which in June raised its second-quarter revenue and earnings estimates.
In the materials sector, the Fund was helped by its exposure to U.K. mining stock Rio Tinto Ltd., which has projects in Australia and New Zealand, among other locations. Another strong contributor was Australian coal mining stock BHP Billiton, one of the Fund’s largest holdings, on average, during the period. Demand for coal from China and the United States continued to drive this stock’s performance. In energy, ConocoPhillips and Canada’s Suncor Energy Inc. were two of the Fund’s strongest contributors; both companies particularly benefited from their refining operations.
On the negative side, stock selection in financials and industrials detracted from the Fund’s returns versus the Index. Nomura Holdings, Inc. also detracted from Fund results, because the company’s brokerage revenues suffered from Japan’s stagnant stock market. Meanwhile, German industrial conglomerate Siemens AG was hampered by investors’ uncertainty about management’s efforts to streamline and revitalize the company.
Among individual holdings, media conglomerate The News Corp. Ltd. was one of the Fund’s largest detractors. Although the stock lost ground during the period, in our opinion News Corp. remained financially strong.
We anticipate a reasonably favorable backdrop for the balance of 2005. That said, we believe that stock selection will be important due to sluggish economic growth in many developed countries and uneven gains in corporate profits. When economic growth is sluggish, it takes careful research and analysis to find companies with the potential for above-average earnings gains. Often, the stocks of these promising companies are driven by product cycles and other factors that are less dependent on overall economic conditions. Accordingly, we will continue to spend the majority of our time on bottom-up, fundamental analysis of individual companies, and allow that process to drive the Fund’s country and sector allocations.
PORTFOLIO MANAGER: Neil Rogan
Investing in mutual funds involves risk, including possible loss of principal.
There is no assurance that the investment objective of any fund will be achieved.
Funds that concentrate on specific sectors or a relatively small number of securities may be subject to greater volatility than a more diversified investment.
International investing involves additional risks, including currency fluctuations, differences in accounting standards, political instability and foreign regulations, all of which are magnified in emerging markets.
Morgan Stanley Capital International (MSCI) World IndexSM: An unmanaged, free float-adjusted, market-capitalization index that is designed to measure the performance of global developed-market equities.
Lipper Analytical Services, Inc. is an industry research firm whose rankings are based on total return performance and do not reflect the effects of sales charges.
The Gartmore Variable Insurance Trust Funds are available only as sub-account investment options in certain variable insurance products. Accordingly, investors are unable to invest in shares of these funds outside of an insurance product. Performance information found herein reflects only the performance of these funds, and does not indicate the performance your sub-account may experience under your variable insurance contract. Performance returns assume reinvestment of all distributions. The investment return and principal value of an investment will fluctuate so that an investor’s shares, when redeemed, may be worth more or less than their original cost. Index performance is provided for comparison purposes only; the indexes shown are unmanaged and do not reflect any fees or expenses. Investors cannot invest directly in market
1
Table of Contents
Gartmore GVIT Worldwide Leaders Fund (Continued) |
indexes. To obtain performance information about the sub-account option under your insurance contract that invests in one of these funds, please contact your variable insurance carrier. PAST PERFORMANCE IS NO GUARANTEE OF FUTURE RESULTS.
Commentary provided by Gartmore Global Investments. All opinions and estimates included in this report constitute Gartmore Global Investments’ judgment as of the date of this report and are subject to change without notice.
Investors should carefully consider a fund’s investment objectives, risks, fees, charges and expenses before investing any money. To obtain this and other information on Gartmore Variable Insurance Trust, please contact your variable insurance contract provider or call 800-848-0920. Please read the Trust’s prospectus carefully before investing any money.
Gartmore Funds distributed by Gartmore Distribution Services, Inc., Member NASD. 1200 River Road, Suite 1000, Conshohocken, PA 19428.
2
Table of Contents
Gartmore GVIT Worldwide Leaders Fund
| Average | Annual Total Return1 |
(For Periods Ended June 30, 2005)
| Six months* | One year | Five years | Inception2 | |||||||||
| Class I3 | 0.60 | % | 17.62 | % | -3.28 | % | 2.91 | % | ||||
| Class III4 | 0.60 | % | 17.63 | % | -3.28 | % | 2.91 | % |
| * | Not Annualized. |
| 1 | Not subject to any sales charges. |
| 2 | Fund commenced operations on October 31, 1997. |
| 3 | The existing shares of the Fund were designated Class I shares as of May 1, 2001. |
| 4 | These returns until Class III shares (July 5, 2002) are based on the performance of the Class I shares of the Fund. Excluding the effect of any fee waivers or reimbursements, such prior performance is similar to what Class III shares would have produced, because all classes of shares invest in the same portfolio of securities. For Class III shares, these returns do not reflect the short-term trading fees applicable to such shares: if these fees were reflected, the annual returns for Class III shares would have been lower |
| Performance | of a $10,000 Investment |
Investment return and principal value will fluctuate, and when redeemed, shares may be worth more or less than original cost. Past performance is no guarantee of future results and does not reflect the deduction of taxes that a shareholder would pay on fund distributions or the redemption of fund shares. Investing in mutual funds involves market risk, including loss of principal. Performance returns assume the reinvestment of all distributions.
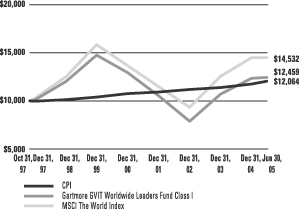
Comparative performance of $10,000 invested in Class I shares of the Gartmore GVIT Worldwide Leaders Fund, the Morgan Stanley Capital International World Index (MSCI World)(a), and the Consumer Price Index (CPI)(b) since inception. Unlike the Fund, the returns for these unmanaged indexes do not reflect any fees, expenses, or sales charges. Investors cannot invest directly in market indexes.
| (a) | The MSCI World is an unmanaged, free float-adjusted, market capitalization-weighted index that is designed to measure the performance of global developed-market equities. |
| (b) | The CPI represents changes in prices of a basket of goods and services purchased for consumption by urban households. |
3
Table of Contents
Shareholder
Expense Example | Gartmore GVIT Worldwide Leaders Fund |
As a shareholder of the Fund, you incur two types of costs: (1) transaction costs, including sales charges (loads) paid on purchase payments and redemption fees; and (2) ongoing costs, including investment advisory fees, administration fees, distribution fees and other Fund expenses. The examples below are intended to help you understand your ongoing costs (in dollars) of investing in the Fund and to compare these costs with the ongoing costs of investing in other mutual funds. Per SEC requirements, the examples assume that you had a $1,000 investment in the Class at the beginning of the reporting period, January 1, 2005, and continued to hold your shares at the end of the reporting period, June 30, 2005.
Actual Expenses
For each Class of the Fund in the table below, the first line provides information about actual account values and actual expenses. You may use the information in this line, together with the amount you invested, to estimate the expenses that you paid over the period. Simply divide your account value by $1,000 (for example, an $8,600 account value divided by $1,000 = 8.6), then multiply the result by the number in the first line of each Class under the heading entitled “Expenses Paid During Period” to estimate the expenses you paid on your account during the period.
Hypothetical Example for Comparison Purposes
The second line of each Class in the table below provides information about hypothetical account values and hypothetical expenses based on the Class’ actual expense ratio and an assumed rate of return of 5% per year before expenses, which is not the Class’ actual return. The hypothetical account values and expenses may not be used to estimate the actual ending account balance or expenses you paid for the period. You may use this information to compare the ongoing costs of investing in the Class of the Fund and other funds. To do so, compare this 5% hypothetical example with the 5% hypothetical examples that appear in the shareholder reports of the other funds.
Please note that the expenses shown in the table are meant to highlight your ongoing costs only and do not reflect any transaction costs, such as sales charges (loads) or redemption fees. Therefore, the second line for each Class in the table is useful in comparing ongoing costs only, and will not help you determine the relative total costs of owning different funds. In addition, if these transaction costs were included, your costs would have been higher. The examples also assume all dividends and distributions have been reinvested.
| Beginning Account Value, January 1, 2005 | Ending Account Value, June 30, 2005 | Expenses Paid During Period* | Annualized Expense Ratio* | |||||||||||
| Worldwide Leaders Fund | ||||||||||||||
Class I | Actual | $ | 1,000 | $ | 1,006 | $ | 6.47 | 1.30% | ||||||
| Hypothetical | 1 | $ | 1,000 | $ | 1,019 | $ | 6.53 | 1.30% | ||||||
Class III | Actual | $ | 1,000 | $ | 1,006 | $ | 6.52 | 1.31% | ||||||
| Hypothetical | 1 | $ | 1,000 | $ | 1,019 | $ | 6.58 | 1.31% | ||||||
| * | Expenses are equal to the Fund’s annualized expense ratio multiplied by the average account value over the period multiplied by 181/365 (to reflect the one-half year period). The expense ratio presented represents a six month, annualized ratio in accordance with SEC guidelines. |
| 1 | Represents the hypothetical 5% return before expenses. |
4
Table of Contents
Portfolio Summary
(June 30, 2005) | Gartmore GVIT Worldwide Leaders Fund |
The SEC adopted a requirement that Funds present their portfolio holdings in a table, chart or graph format in their annual and semiannual reports to shareholders, whether or not a statement of investments is utilized. The following tables, which present portfolio holdings as a percentage of net assets, are provided in compliance with this requirement.
| Asset Allocation | ||
| Common Stocks | 97.1% | |
| Cash Equivalents | 0.2% | |
| Other assets in excess of liabilities | 2.7% | |
| 100.0% | ||
| Top Holdings* | ||
| Fortum Oyj | 5.4% | |
| ConocoPhillips | 5.4% | |
| BHP Billiton PLC | 5.2% | |
| Starwood Hotels & Resorts Worldwide, Inc. | 4.9% | |
| Caterpillar, Inc. | 4.7% | |
| Microsoft Corp. | 4.2% | |
| Cheung Kong (Holdings) Ltd. | 4.1% | |
| Motorola, Inc. | 4.1% | |
| ABN AMRO Holdings NV | 4.0% | |
| UniCredito Italiano | 4.0% | |
| Other Holdings | 54.0% | |
| 100.0% | ||
| Top Industries | ||
| Oil & Gas | 14.7% | |
| Computer Software & Services | 12.9% | |
| Banking | 11.0% | |
| Financial Services | 6.5% | |
| Real Estate | 6.5% | |
| Transportation | 6.4% | |
| Mining | 5.2% | |
| Hotel & Gaming | 4.9% | |
| Machinery & Equipment | 4.7% | |
| Telecommunications | 4.1% | |
| Other Industries | 23.1% | |
| 100.0% | ||
| * | For purpose of listing top holdings, repurchase agreements are considered cash equivalents and are included as part of Other Holdings. |
5
Table of Contents
GARTMORE VARIABLE INSURANCE TRUST
GARTMORE GVIT WORLDWIDE LEADERS FUND
Statement of Investments — June 30, 2005 (Unaudited)
| Shares or Principle Amount | Value | ||||
| COMMON STOCKS (97.1%) | |||||
| AUSTRALIA (4.8%) | |||||
| Coal (1.8%) | |||||
| Excel Coal Ltd. (c) | 109,031 | $ | 618,444 | ||
| Computer Software & Services (3.0%) | |||||
| Computershare Ltd. (c) | 243,670 | 1,079,605 | |||
| 1,698,049 | |||||
| CANADA (3.9%) | |||||
| Oil & Gas (3.9%) | |||||
| Suncor Energy, Inc. (c) | 29,330 | 1,386,997 | |||
| FINLAND (5.4%) | |||||
| Oil & Gas (5.4%) | |||||
| Fortum Oyj (c) | 119,520 | 1,917,240 | |||
| FRANCE (3.0%) | |||||
| Banking (3.0%) | |||||
| BNP Paribas SA (c) | 15,300 | 1,045,420 | |||
| HONG KONG (4.1%) | |||||
| Real Estate (4.1%) | |||||
| Cheung Kong (Holdings) Ltd. (c) | 150,000 | 1,455,026 | |||
| �� | |||||
| IRELAND (3.5%) | |||||
| Transportation (3.5%) | |||||
| Ryanair Holdings PLC ADR (b) (c) | 27,900 | 1,251,036 | |||
| ITALY (4.0%) | |||||
| Banking (4.0%) | |||||
| UniCredito Italiano (c) | 267,000 | 1,408,275 | |||
| JAPAN (3.4%) | |||||
| Internet (1.0%) | |||||
| Livedoor Co. Ltd (b) (c) | 100,000 | 356,202 | |||
| Real Estate (2.4%) | |||||
| Mitsui Fudosan Co. Ltd. (c) | 77,000 | 858,967 | |||
| 1,215,169 | |||||
| NETHERLANDS (4.0%) | |||||
| Banking (4.0%) | |||||
| ABN AMRO Holdings NV (c) | 58,200 | 1,430,437 | |||
| SOUTH KOREA (1.7%) | |||||
| Electronics (1.7%) | |||||
| Hynix Semiconductor, Inc. (b) (c) | 36,100 | 584,450 | |||
| Shares or Principle Amount | Value | ||||
| COMMON STOCKS (continued) | |||||
| UNITED KINGDOM (12.2%) | |||||
| Gambling (1.0%) | |||||
| PartyGaming PLC (b) | 125,993 | $ | 336,493 | ||
| Mining (5.2%) | |||||
| BHP Billiton PLC (c) | 143,100 | 1,824,950 | |||
| Television (1.6%) | |||||
| ITV PLC (c) | 251,000 | 551,539 | |||
| Transportation (2.9%) | |||||
| BAA PLC (c) | 92,240 | 1,022,423 | |||
| Water & Sewerage Services (1.5%) | |||||
| Pennon Group PLC (c) | 29,100 | 541,966 | |||
| 4,277,371 | |||||
| UNITED STATES (47.1%) | |||||
| Computer Software & Services (9.9%) | |||||
| Alliance Data Systems Corp. (b) | 22,400 | 908,544 | |||
| Microsoft Corp. | 60,270 | 1,497,106 | |||
| Symantec Corp. (b) | 50,900 | 1,106,566 | |||
| 3,512,216 | |||||
| Cosmetics & Toiletries (3.8%) | |||||
| Gillette Co. (The) | 26,530 | 1,343,214 | |||
| Financial Services (6.5%) | |||||
| Goldman Sachs Group, Inc. (The) | 12,432 | 1,268,312 | |||
| Merrill Lynch & Co., Inc. | 18,500 | 1,017,685 | |||
| 2,285,997 | |||||
| Healthcare Services (2.5%) | |||||
| Health Net, Inc. (b) | 22,800 | 870,048 | |||
| Hotel & Gaming (4.9%) | |||||
| Starwood Hotels & Resorts Worldwide, Inc. | 29,800 | 1,745,386 | |||
| Insurance (1.6%) | |||||
| American International Group, Inc. | 9,600 | 557,760 | |||
| Machinery & Equipment (4.7%) | |||||
| Caterpillar, Inc. | 17,300 | 1,648,863 | |||
| Oil & Gas (5.4%) | |||||
| ConocoPhillips | 32,940 | 1,893,721 | |||
| Retail (3.7%) | |||||
| Federated Department Stores, Inc. | 18,000 | 1,319,040 | |||
6
Table of Contents
GARTMORE VARIABLE INSURANCE TRUST
GARTMORE GVIT WORLDWIDE LEADERS FUND
Statement of Investments — June 30, 2005 (Unaudited) (continued)
| Shares or Principle Amount | Value | |||||
| COMMON STOCKS (continued) | ||||||
| UNITED STATES (continued) | ||||||
| Telecommunications (4.1%) | ||||||
| Motorola, Inc. | 78,500 | $ | 1,433,410 | |||
| 16,609,655 | ||||||
| Total Common Stocks | 34,279,125 | |||||
| Cash Equivalents (0.2%) | ||||||
| Investments in repurchase agreements (collateralized by AA Corporate Bonds in a joint trading account at 3.49%, dated 06/30/05, due 07/01/05, repurchase price $87,554) | $ | 87,546 | 87,546 | |||
| Total Cash Equivalents | 87,546 | |||||
| Total Investments (Cost $32,404,521) (a) — 97.3% | 34,366,671 | |||||
| Other assets in excess of liabilities — 2.7% | 961,391 | |||||
| NET ASSETS — 100.0% | $ | 35,328,062 | ||||
| (a) | See Notes to financial statements for tax unrealized appreciation (depreciation) of securities. |
| (b) | Denotes a non-income producing security |
| (c) | Fair Valued Security |
| ADR | American Depository Receipt |
At June 30, 2005, the Fund’s open forward foreign currency contracts were as follows:
| Currency | Delivery Date | Contract Value | Market Value | Unrealized Appreciation (Depreciation) | ||||||||||
| Short Contracts: | ||||||||||||||
Hong Kong Dollar | 07/05/05 | $ | (166,648 | ) | $ | (166,722 | ) | $ | (74 | ) | ||||
Japanese Yen | 07/05/05 | (669,063 | ) | (665,813 | ) | 3,250 | ||||||||
Swiss Franc | 07/05/05 | (1,321,679 | ) | (1,325,686 | ) | (4,008 | ) | |||||||
| Total Short Contracts: | $ | (2,157,390 | ) | $ | (2,158,221 | ) | $ | (832 | ) | |||||
| Long Contract: | ||||||||||||||
Euro | 07/01/05 | $ | 311,221 | $ | 311,867 | $ | 647 | |||||||
Japanese Yen | 07/05/05 | 355,445 | 354,842 | (604 | ) | |||||||||
| Total Long Contracts: | $ | 666,666 | $ | 666,709 | $ | 43 | ||||||||
See notes to financial statements.
7
Table of Contents
GARTMORE VARIABLE INSURANCE TRUST
GARTMORE GVIT WORLDWIDE LEADERS FUND
Statement of Assets and Liabilities
June 30, 2005 (Unaudited)
Assets: | ||||
Investments, at value (cost $32,316,975) | $ | 34,279,125 | ||
Repurchase agreements, at cost and value | 87,546 | |||
Total Investments | 34,366,671 | |||
Cash | 669,061 | |||
Foreign currencies, at value (cost $18,650) | 14,249 | |||
Interest and dividends receivable | 44,870 | |||
Receivable for capital shares issued | 15 | |||
Receivable for investments sold | 4,313,305 | |||
Unrealized appreciation on forward foreign currency contracts | 3,897 | |||
Reclaims receivable | 26,272 | |||
Prepaid expenses and other assets | 3,036 | |||
Total Assets | 39,441,376 | |||
Liabilities: | ||||
Payable for investments purchased | 4,071,248 | |||
Unrealized depreciation on forward foreign currency contracts | 4,685 | |||
Accrued expenses and other payables: | ||||
Investment advisory fees | 28,937 | |||
Fund administration and transfer agent fees | 580 | |||
Administrative servicing fees | 3,912 | |||
Other | 3,952 | |||
Total Liabilities | 4,113,314 | |||
Net Assets | $ | 35,328,062 | ||
Represented by: | ||||
Capital | $ | 50,020,731 | ||
Accumulated net investment income (loss) | (5,795 | ) | ||
Accumulated net realized gains (losses) from investment | (16,645,675 | ) | ||
Net unrealized appreciation (depreciation) on investments and translation of assets and liabilities denominated in foreign currencies | 1,958,801 | |||
Net Assets | $ | 35,328,062 | ||
Net Assets: | ||||
Class I Shares | $ | 26,969,834 | ||
Class III Shares | 8,358,228 | |||
Total | $ | 35,328,062 | ||
Shares outstanding (unlimited number of shares authorized): | ||||
Class I Shares | 2,510,729 | |||
Class III Shares | 778,272 | |||
Total | 3,289,001 | |||
Net asset value and offering price per share:* | ||||
Class I Shares | $ | 10.74 | ||
Class III Shares | $ | 10.74 |
| * | Not subject to a front-end sales charge. |
For the Six Months Ended June 30, 2005 (Unaudited)
Investment Income: | ||||
Interest income | $ | 14,695 | ||
Dividend income (net of foreign withholding tax of $20,806) | 289,316 | |||
Income from securities lending | 7,144 | |||
Total Income | 311,155 | |||
Expenses: | ||||
Investment advisory fees | 176,738 | |||
Fund administration and transfer agent fees | 17,047 | |||
Administrative servicing fees Class I Shares | 20,067 | |||
Administrative servicing fees Class III Shares | 5,980 | |||
Other** | 10,416 | |||
Total Expenses | 230,248 | |||
Net Investment Income (Loss) | 80,907 | |||
REALIZED/UNREALIZED GAINS (LOSSES) ON INVESTMENTS: | ||||
Net realized gains (losses) on investment transactions | 2,903,478 | |||
Net realized gains (losses) on foreign currency transactions | 1,141 | |||
Net realized gains (losses) on investment and foreign currency transactions | 2,904,619 | |||
Net change in unrealized appreciation/depreciation on investments and translation of assets and liabilities denominated in foreign currencies | (2,738,270 | ) | ||
Net realized/unrealized gains (losses) on investments and foreign currencies | 166,349 | |||
CHANGE IN NET ASSETS RESULTING FROM OPERATIONS | $ | 247,256 | ||
| ** | Other expenses may include the following fees: audit, custody, insurance, legal, printing, trustee, and out-of-pocket expenses. |
See notes to financial statements.
8
Table of Contents
GARTMORE VARIABLE INSURANCE TRUST
GARTMORE GVIT WORLDWIDE LEADERS FUND
Statement of Changes in Net Assets
Six Months Ended June 30, 2005 | Year Ended December 31, 2004 | |||||||
| (Unaudited) | ||||||||
From Investment Activities: | ||||||||
Operations: | ||||||||
Net investment income (loss) | $ | 80,907 | $ | 312,821 | ||||
Net realized gains (losses) on investment and foreign currency transactions | 2,904,619 | 3,086,877 | ||||||
Net change in unrealized appreciation/depreciation on investments and translation of assets and liabilities denominated in foreign currencies | (2,738,270 | ) | 1,426,071 | |||||
Change in net assets resulting from operations | 247,256 | 4,825,769 | ||||||
Distributions to Class I shareholders from: | ||||||||
Net investment income | (270,433 | ) | — | |||||
Distributions to Class III shareholders from: | ||||||||
Net investment income | (79,754 | ) | — | |||||
Change in net assets from shareholder distributions | (350,187 | ) | — | |||||
Change in net assets from capital transactions | (721,229 | ) | (2,150,118 | ) | ||||
Change in net assets | (824,160 | ) | 2,675,651 | |||||
Net Assets: | ||||||||
Beginning of period | 36,152,222 | 33,476,571 | ||||||
End of period | $ | 35,328,062 | $ | 36,152,222 | ||||
CAPITAL TRANSACTIONS: | ||||||||
Class I Capital Transactions: | ||||||||
Proceeds from shares issued | $ | 2,045,967 | $ | 1,810,036 | ||||
Dividends reinvested | 270,433 | — | ||||||
Cost of shares redeemed | (4,045,831 | ) | (4,522,861 | ) | ||||
| (1,729,431 | ) | (2,712,825 | ) | |||||
Class III Capital Transactions: | ||||||||
Proceeds from shares issued | 1,729,823 | 3,923,836 | ||||||
Dividends reinvested | 79,754 | — | ||||||
Cost of shares redeemed | (801,375 | ) | (3,361,129 | ) | ||||
| 1,008,202 | 562,707 | |||||||
Change in net assets from capital transactions | $ | (721,229 | ) | $ | (2,150,118 | ) | ||
SHARE TRANSACTIONS: | ||||||||
Class I Share Transactions: | ||||||||
Issued | 192,427 | 183,254 | ||||||
Reinvested | 25,257 | — | ||||||
Redeemed | (376,184 | ) | (477,235 | ) | ||||
| (158,500 | ) | (293,981 | ) | |||||
Class III Share Transactions: | ||||||||
Issued | 161,528 | 419,365 | ||||||
Reinvested | 7,448 | — | ||||||
Redeemed | (75,087 | ) | (362,870 | ) | ||||
| 93,889 | 56,495 | |||||||
See notes to financial statements.
9
Table of Contents
GARTMORE VARIABLE INSURANCE TRUST
Selected Data for Each Share of Capital Outstanding
Gartmore GVIT Worldwide Leaders Fund
| Investment Activities: | Distributions | Ratios/Supplemental Data: | ||||||||||||||||||||||||||||||||||||||||||||||
| Net Asset Value, Beginning of Period | Net Investment Income (Loss) | Net Realized and Unrealized Gains (Losses) on Investments | Total from Investment Activities | Net Investment Income | Net Realized Gains (Losses) | Tax Return of Capital | Total Distributions | Net Asset Value, End of Period | Total Return | Net Assets at End of Period (000s) | Ratio of Expenses to Average Net Assets | Ratio of Net Investment Income (Loss) to Average Net Assets | Ratio of Expenses (Prior to Reimbursements) to Average Net Assets(a) | Ratio of Net Investment Income (Loss) (Prior to Reimbursements) to Average Net Assets(a) | Portfolio Turnover(b) | |||||||||||||||||||||||||||||||||
Class I Shares | ||||||||||||||||||||||||||||||||||||||||||||||||
Year Ended December 31, 2000 | $ | 13.89 | 0.13 | (1.81 | ) | (1.68 | ) | (0.11 | ) | (0.44 | ) | (0.01 | ) | (0.56 | ) | $ | 11.65 | (12.32 | %) | $ | 81,359 | 1.20 | % | 1.01 | % | 1.42 | % | 0.79 | % | 184.98 | % | |||||||||||||||||
Year Ended December 31, 2001(c) | $ | 11.65 | 0.07 | (2.26 | ) | (2.19 | ) | (0.18 | ) | — | — | (0.18 | ) | $ | 9.28 | (18.81 | %) | $ | 70,469 | 1.20 | % | 0.66 | % | 1.30 | % | 0.56 | % | 128.06 | % | |||||||||||||||||||
Year Ended December 31, 2002 | $ | 9.28 | (0.04 | ) | (2.29 | ) | (2.33 | ) | (0.08 | ) | — | (0.02 | ) | (0.10 | ) | $ | 6.85 | (25.39 | %) | $ | 26,467 | 1.32 | % | 0.29 | % | 1.32 | % | 0.29 | % | 529.97 | % | |||||||||||||||||
Year Ended December 31, 2003 | $ | 6.85 | 0.01 | 2.46 | 2.47 | — | — | — | — | $ | 9.32 | 36.06 | % | $ | 27,624 | 1.32 | % | 0.30 | % | (g) | (g) | 603.34 | % | |||||||||||||||||||||||||
Year Ended December 31, 2004 | $ | 9.32 | 0.09 | 1.37 | 1.46 | — | — | — | — | $ | 10.78 | 15.67 | % | $ | 28,776 | 1.25 | % | 0.95 | % | (g) | (g) | 452.01 | % | |||||||||||||||||||||||||
Six Months Ended June 30, 2005 (Unaudited) | $ | 10.78 | 0.02 | 0.04 | 0.06 | (0.10 | ) | — | — | (0.10 | ) | $ | 10.74 | 0.60 | %(e) | $ | 26,970 | 1.30 | %(f) | 0.46 | %(f) | (g) | (g) | 191.74 | % | |||||||||||||||||||||||
Class III Shares | ||||||||||||||||||||||||||||||||||||||||||||||||
Period Ended December 31, 2003(d) | $ | 6.89 | (0.01 | ) | 2.44 | 2.43 | — | — | — | — | $ | 9.32 | 35.27 | %(e) | $ | 5,853 | 1.35 | %(f) | (0.31 | %)(f) | (g) | (g) | 603.34 | % | ||||||||||||||||||||||||
Year Ended December 31, 2004 | $ | 9.32 | 0.09 | 1.37 | 1.46 | — | — | — | — | $ | 10.78 | 15.67 | % | $ | 7,376 | 1.25 | % | 0.94 | % | (g) | (g) | 452.01 | % | |||||||||||||||||||||||||
Six Months Ended June 30, 2005 (Unaudited) | $ | 10.78 | 0.01 | 0.05 | 0.06 | (0.10 | ) | — | — | (0.10 | ) | $ | 10.74 | 0.60 | %(e) | $ | 8,358 | 1.31 | %(f) | 0.46 | %(f) | (g) | (g) | 191.74 | % | |||||||||||||||||||||||
| (a) | During the period certain fees were waived and/or reimbursed. If such waivers/reimbursements had not occurred, the ratios would have been as indicated. |
| (b) | Portfolio turnover is calculated on the basis of the Fund as a whole without distinguishing among the classes of shares. |
| (c) | The existing shares of the Fund were designated Class I shares as of May 1, 2001. |
| (d) | For the period May 2, 2003 (commencement of operations) through December 31, 2003. |
| (e) | Not annualized. |
| (f) | Annualized. |
| (g) | There were no fee reductions during the period. |
See notes to financial statements.
10
Table of Contents
GARTMORE VARIABLE INSURANCE TRUST
NOTES TO FINANCIAL STATEMENTS (Unaudited)
June 30, 2005
1. Organization
Gartmore Variable Insurance Trust (“GVIT” or the “Trust”) is an open-end management investment company, organized under the laws of Delaware by an amended and restated Agreement and Declaration of Trust, dated October 28, 2004, as amended to date. The Trust, originally created under the laws of Massachusetts as a Massachusetts business trust pursuant to a Declaration of Trust dated, as of June 30, 1981, as subsequently amended, redomesticated as a Delaware Statutory Trust after the close of trading on April 30, 2005, and is registered under the Investment Company Act of 1940, as amended (the “1940 Act”). The redomestication is a change in statutory status and does not affect the operations of the Trust. As of June 30, 2005, the Trust had authorized an unlimited number of shares of beneficial interest (“shares”) without par value. The Trust currently offers shares to life insurance company separate accounts to fund the benefits under variable life insurance or annuity policies. To date, only the separate accounts of Nationwide Life Insurance Company and Nationwide Life and Annuity Insurance Company (collectively, “Nationwide”) have purchased shares of the Trust’s series. The Trust operates thirty-one (31) separate series, or mutual funds, each with its own investment objectives and strategies. This report contains the financial statements and financial highlights of the Gartmore GVIT Worldwide Leaders Fund (the “Fund”).
Under the Trust’s organizational documents, the Trust’s officers and trustees are indemnified against certain liabilities arising out of the performance of their duties to the Trust. In addition, the Trust has entered into Indemnification Agreements with the Trust’s trustees and certain officers covering similar liabilities. In addition, in the normal course of business, the Trust enters into contracts with its vendors and others that provide for general indemnifications. The Trust’s maximum exposure under these arrangements is unknown, as this would involve future claims that may be made against the Trust. Based on experience, however, the Trust expects that risk of loss to be remote.
2. Summary of Significant Accounting Policies
The following is a summary of significant accounting policies followed by the Fund in the preparation of its financial statements. The policies are in conformity with accounting principles generally accepted in the United States of America (“GAAP”). The preparation of financial statements requires management to make estimates and assumptions that affect the reported amounts of assets and liabilities, the disclosure of contingent assets and liabilities at the date of the financial statements and the reported amounts of income and expenses for the period. Actual results could differ from those estimates.
| (a) | Security Valuation |
Securities for which market quotations are readily available are valued at current market value as of “Valuation Time.” Valuation Time is as of the close of regular trading on the New York Stock Exchange (usually 4 p.m. Eastern time). Equity securities are valued at the last quoted sale price or, if there is no sale price, the last quoted bid price provided by an independent pricing service approved by the Trust’s Board of Trustees. Securities traded on NASDAQ are valued at the NASDAQ official closing price. Prices are taken from the primary market or exchange in which each security trades. Most securities listed on a foreign exchange are valued either at fair value (see description below) or at the last sale price at the close of the exchange on which the security is principally traded. Foreign securities, currencies, and other assets and liabilities denominated in foreign currencies are translated into U.S. dollars at the exchange rate of said currencies against the U.S. Dollar, as of Valuation Time, as provided by an independent pricing service approved by the Board of Trustees.
Securities for which market quotations are not readily available, or for which an independent pricing service does not provide a value or provides a value that does not represent fair value in the judgment of the Fund’s investment adviser or designee, are valued at fair value under procedures approved by the Trust’s Board of Trustees. The “Fair Value” of these securities is determined in good faith by taking into account relevant factors and surrounding circumstances. Methods utilized to obtain a “Fair Value” may include the following non-exclusive list of SEC acceptable methods: (i) a multiple of earnings; (ii) the discount from market value of a similar, freely traded security; (iii) the yield-to-maturity for debt issues; or (iv) a consolidation of the methods. The Gartmore Fair Value Committee considers a non-exclusive list of factors to arrive at the appropriate method upon determining “Fair Value.” For example, fair value determinations are required for securities whose value is affected by a “significant” event that materially affects the value of a domestic or foreign security which occurs
11
Table of Contents
GARTMORE VARIABLE INSURANCE TRUST
NOTES TO FINANCIAL STATEMENTS (Unaudited) (Continued)
June 30, 2005
subsequent to the time of the close of the principal market on which such domestic or foreign security trades and before the Valuation Time (i.e., a “subsequent event”). Typically, this will involve events occurring after the close of a foreign market on which a security trades and before the next Valuation Time.
The Fund values foreign securities at fair value in the circumstances described below. Generally, trading in foreign securities markets is completed each day at various times prior to the Valuation Time. Due to the time differences between the closings of the relevant foreign securities exchanges and the Valuation Time for the Fund, the Fund will fair value its foreign investments when it is determined that the market quotations for the foreign investments either are not readily available or are unreliable and, therefore, do not represent fair value. When the fair value prices are utilized, these prices will attempt to reflect the impact of the U.S. financial markets’ perceptions and trading activities on the Fund’s foreign investments since the last closing prices of the foreign investments were calculated on their primary foreign securities markets or exchanges. For these purposes, the Board of Trustees of the Trust has determined that movements in relevant indices or other appropriate market indicators, after the close of the foreign securities exchanges, may demonstrate that market quotations are unreliable, and may trigger fair value pricing for certain securities. Consequently, fair valuation of portfolio securities may occur on a daily basis. In determining fair value prices, the Trust utilizes data furnished by an independent pricing service (and that data draws upon, among other information, the market values of foreign investments). The fair value prices of portfolio securities generally will be used when it is determined that the use of these prices will have a material impact on the net asset value of the Fund. When the Fund uses fair value pricing, the values assigned to the Fund’s foreign investments may not be the quoted or published prices of the investments on their primary markets or exchanges.
| (b) | Repurchase Agreements |
The Fund may enter into repurchase agreements with an entity which is a member of the Federal Reserve System or which is a “primary dealer” (as designated by the Federal Reserve Bank of New York) in U.S. Government obligations. The repurchase price generally equals the price paid by the Fund plus interest negotiated on the basis of current short-term rates, which may be more or less than the rate on the underlying portfolio securities. The seller under a repurchase agreement is required to maintain the value of the collateral held pursuant to the agreement at a market value equal to or greater than the repurchase price (including accrued interest). Collateral subject to repurchase agreements is held by the Fund’s custodian or another qualified sub-custodian or in the Federal Reserve/Treasury book-entry system. If the counterparty defaults and the fair value of the collateral declines, realization of the collateral by the Fund may be delayed or limited. The Fund may transfer uninvested cash balances into a pooled cash account. These balances are invested in one or more repurchase agreements, which are fully collateralized by AA-rated Corporate Bonds with the counterparties of CS First Boston and Nomura Securities.
(c) Foreign Currency Transactions
The accounting records of the Fund are maintained in U.S. dollars. Foreign currency amounts are translated into U.S. dollars at the current rate of exchange to determine the value of investments, assets and liabilities. The Fund may enter into foreign currency contracts in connection with purchases or sales of securities denominated in a foreign currency. Purchases and sales of securities, and income and expenses, are translated at the prevailing rate of exchange on the respective date of these transactions. The Fund does not isolate that portion of the results of operations resulting from changes in foreign exchange rates on investments from fluctuations arising from changes in market prices of securities held. These fluctuations are included with the net realized and unrealized gain or loss from investments and foreign currencies.
(d) Risks Associated with Foreign Securities and Currencies
Investments in securities of foreign issuers carry certain risks not ordinarily associated with investments in securities of U.S. issuers. These risks include future political and economic developments, and the possible imposition of exchange controls or other foreign governmental laws and restrictions. In addition, with respect to certain countries, there is the possibility of expropriation of assets, confiscatory taxation, political or social instability, or diplomatic developments, which could adversely affect investments in those countries.
12
Table of Contents
GARTMORE VARIABLE INSURANCE TRUST
NOTES TO FINANCIAL STATEMENTS (Unaudited) (Continued)
June 30, 2005
Certain countries also may impose substantial restrictions on investments in their capital markets by foreign entities, including restrictions on investments in issuers of industries deemed sensitive to relevant national interests. These factors may limit the investment opportunities available and result in a lack of liquidity and high price volatility with respect to securities of issuers from developing countries.
(e) Forward Foreign Currency Contracts
The Fund may enter into forward foreign currency contracts in connection with planned purchases or sales of securities or to hedge the U.S. dollar value of portfolio securities denominated in a particular currency. The Fund could be exposed to risks if the counterparties to the contracts are unable to meet the terms of their contracts and from unanticipated movements in the value of a foreign currency relative to the U.S. dollar. Forward foreign currency contracts are valued at the current cost of covering these contracts, as provided by an independent pricing service approved by the Board of Trustees. The forward foreign currency contracts are adjusted by the daily exchange rate of the underlying currency and any gains or losses are recorded for financial statement purposes as unrealized gains or losses until the contract settlement date.
(f) Futures Contracts
The Fund may invest in financial futures contracts (“futures contracts”) for the purpose of hedging its existing portfolio securities or securities that the Fund intends to purchase against fluctuations in value caused by changes in prevailing market interest rates or prices. Futures contracts may also be entered into for non-hedging purposes.
Upon entering into a futures contract, the Fund is required to pledge to the broker an amount of cash and/or other assets equal to a certain percentage of the contract amount (initial margin deposit). Subsequent payments, known as “variation margin,” are made each day, depending on the daily fluctuations in the fair value/market value of the underlying assets. A gain or loss equal to the daily variation margin is recognized on a daily basis. Futures contracts are valued daily at their last quoted sale price.
A “sale” of a futures contract means a contractual obligation to deliver the securities or foreign currency called for by the contract at a fixed price at a specified time in the future. A “purchase” of a futures contract means a contractual obligation to acquire the securities or foreign currency at a fixed price at a specified time in the future.
Should market conditions change unexpectedly, the Fund may not achieve the anticipated benefits of the futures contracts and may realize a loss. The use of futures transactions for hedging purposes involves the risk of imperfect correlation in movements in the price of futures contracts, interest rates, and the value of the underlying hedged assets.
(g) Written Options Contracts
The Fund may write options contracts. A written option obligates the Fund to deliver (written call) or to receive (written put) a specified quantity of an underlying asset at the contract amount upon exercise by the holder of the option. The value of the option contract is recorded as a liability and unrealized gain or loss is measured by the difference between the current value and the premium received. Options traded on an exchange are valued at the last quoted sale price, or in the absence of a sale, the bid price provided by an independent pricing service approved by the Board of Trustees. Non-exchange traded options are valued using dealer supplied quotes.
(h) Short Sales
The Fund is authorized to engage in short-selling of portfolio securities which obligates the Fund to replace any security that the Fund has borrowed by purchasing the security at current market value sometime in the future. The Fund will incur a loss if the price of the security increases between the date of the short sale and the date on which the Fund replaces the borrowed security. The Fund generally will realize a gain if the price of the security declines between these dates. Until the Fund replaces the borrowed security, the Fund will maintain a segregated account with cash, U.S. Government securities and/or securities held long to sufficiently cover the Fund’s short position on a daily basis. Dividends declared on securities sold short are recorded as an expense on the ex-dividend date and paid to the counterparty on the dividend pay date. The collateral
13
Table of Contents
GARTMORE VARIABLE INSURANCE TRUST
NOTES TO FINANCIAL STATEMENTS (Unaudited) (Continued)
June 30, 2005
for securities sold short are recorded as an expense on the ex-dividend date and paid to the counterparty on the dividend pay date. The collateral for securities sold short includes the deposits with brokers and securities held long as shown in the Statement of Investments for the Fund.
(i) Security Transactions and Investment Income
Security transactions are accounted for on the date the security is purchased or sold (“trade date”). Securities gains and losses are calculated on the identified cost basis. Interest income is recognized on the accrual basis and includes, where applicable, the amortization or accretion of premium or discount. Dividend income is recorded on the ex-dividend date.
(j) Securities Lending
To generate additional income, the Fund may lend up to 33 1/3% of the Fund’s total assets pursuant to agreements, requiring that the borrower deliver cash or securities as collateral with respect to each new loan of U.S. securities, equal to at least 102% of the value of the portfolio securities loaned, and with respect to each new loan of non-U.S. securities, collateral of at least 105% of the value of the portfolio securities loaned, and thereafter requiring the borrower to mark to market the collateral on a daily basis and requiring the borrower to make up any shortfall of collateral. The Fund receives payments from borrowers equivalent to the dividends and interest that would have been earned on securities lent while simultaneously seeking to earn income on the investment of cash collateral. Collateral is marked to market daily to provide a level of collateral at least equal to the market value of securities loaned. There may be risks of delay in recovery of the securities should the borrower of the securities fail financially. Loans will be made, however, only to borrowers deemed by the Fund’s investment adviser to be of good standing and creditworthy under guidelines established by the Board of Trustees and when, in the judgment of the adviser, the consideration which can be earned currently from these securities loans justifies the attendant risks. Loans are subject to termination by the Fund or the borrower at any time, and, therefore, are not considered to be illiquid investments. JPMorgan Chase Bank serves as custodian for the securities lending program of the Fund. JPMorgan Chase Bank receives a custody fee based on the value of collateral received from borrowers.
(k) Distributions to Shareholders
The Fund’s dividends from net investment income, if any, are declared and paid quarterly. The Fund’s distributable net realized capital gains, if any, are declared and distributed at least annually.
Dividends and distributions to shareholders are determined in accordance with federal income tax regulations, which may differ from GAAP. These “book/tax” differences are considered either permanent or temporary in nature. In accordance with the American Institute of Certified Public Accountants (“AICPA”) Statement of Position 93-2, permanent differences (i.e., reclassification of market discounts, gain/loss, paydowns, and distributions) are reclassified within the capital accounts based on their nature for federal income tax purposes; temporary differences do not require reclassification. These reclassifications have no effect upon the net asset value of the Fund. To the extent distributions exceed current and accumulated earnings and profits for federal income tax purposes, these distributions are reported as distributions of paid-in-capital.
(l) Federal Income Taxes
It is the policy of the Fund to qualify or continue to qualify as a “regulated investment company” by complying with the provisions available to certain investment companies, as defined in applicable sections of the U.S. Internal Revenue Code, and to make distributions of net investment income and net realized capital gains sufficient to relieve the Fund from all, or substantially all, federal income taxes.
As of June 30, 2005, the tax cost of securities and the breakdown of unrealized appreciation (depreciation) for the Fund is as follows:
Tax Cost of | Unrealized Appreciation | Unrealized Depreciation | Net Unrealized Appreciation (Depreciation) | |||||||
$223,251 | $ | 1,862,121 | $ | (123,222 | ) | $ | 1,738,899 | |||
14
Table of Contents
GARTMORE VARIABLE INSURANCE TRUST
NOTES TO FINANCIAL STATEMENTS (Unaudited) (Continued)
June 30, 2005
(m) Allocation of Expenses, Income, and Gains and Losses
Expenses directly attributable to the Fund are charged to the Fund. Expenses not directly attributable to the Fund are allocated proportionately among various or all funds within the Trust. The method used by the Fund for allocating income, fund level expenses, and realized and unrealized gains or losses is based on the fair value of shares outstanding relative to net assets. Under this method, each class of shares participates based on the total net asset value of that class’s shares in proportion to the total net assets of the Fund. Expenses specific to a class (such as rule 12b-1 and administrative services fees) are charged to that class. Included in the statement of operations under the caption “Other” are expense offsets of $67 arising from credits offset of fees on Demand Deposit Accounts.
3. Transactions with Affiliates
Under the terms of the Trust’s Investment Advisory Agreement, Gartmore Mutual Fund Capital Trust (“GMF”) manages the investment of the assets and supervises the daily business affairs of the Fund. GMF is a wholly-owned subsidiary of Gartmore Global Investments, Inc. (“GGI”), a holding company. GGI is a majority-owned subsidiary of Gartmore Global Asset Management Trust (“GGAMT”). GGAMT is a wholly-owned subsidiary of Nationwide Corporation. All of the common stock of Nationwide Corporation is held by Nationwide Mutual Insurance Company (95.2%) and Nationwide Mutual Fire Insurance Company (4.8%), each of which is a mutual company owned by its policyholders. In addition, GMF provides investment management evaluation services in initially selecting and monitoring, on an ongoing basis, the performance of the subadviser, for the Fund. Gartmore Global Partners (the “subadviser”) manages all of the Fund’s investments and has the responsibility for making all investment decisions for the Fund. The subadviser is an affiliate of GMF and GGAMT.
Under the terms of the Investment Advisory Agreement, the Fund pays GMF an investment advisory fee based on that Fund’s average daily net assets. From such fees, pursuant to the subadvisory agreement, GMF pays fees to the subadviser. Additional information regarding investment advisory fees and subadvisory fees for GMF and the subadviser is as follows for the six months ended June 30, 2005:
| Fee Schedule | Total Fees | Fees Retained | Paid to Sub-adviser | |||
Up to $50 million | 1.00% | 0.40% | 0.60% | |||
$50 million or more | 0.95% | 0.40% | 0.55% |
Under the terms of a Fund Administration and Transfer Agency Agreement, Gartmore SA Capital Trust (“GSA”) provides the Fund with various administrative and accounting services, and Gartmore Investors Services, Inc. (“GISI”), an indirect subsidiary of GSA, serves as Transfer and Dividend Disbursing Agent for the Fund. The fees for the services provided under this Agreement are calculated based on the Trust’s average daily net assets according to the fee schedule below. The fees are then allocated proportionately among all funds within the Trust in relation to the average daily net assets of each fund and are paid to GSA. GSA pays GISI from these fees for its services.
| Combined Fee Schedule* | ||
Up to $1 billion | 0.13% | |
$1 billion and more up to $3 billion | 0.08% | |
$3 billion and more up to $8 billion | 0.05% | |
$8 billion and more up to $10 billion | 0.04% | |
$10 billion and more up to $12 billion | 0.02% | |
$12 billion or more | 0.01% | |
| * | The assets of the Gartmore GVIT Investor Destinations Aggressive Fund, the Gartmore GVIT Investor Destinations Moderately Aggressive Fund, the Gartmore GVIT Investor Destinations Moderate Fund, the Gartmore GVIT Investor Destinations Moderately Conservative Fund, and the Gartmore GVIT Investor Destinations Conservative Fund (collectively, the “Investor Destinations Funds”) are excluded from the Trust asset level amount in order to calculate this asset-based fee. The Investor Destinations Funds do not pay any part of this fee. |
15
Table of Contents
GARTMORE VARIABLE INSURANCE TRUST
NOTES TO FINANCIAL STATEMENTS (Unaudited) (Continued)
June 30, 2005
Effective January 1, 2005, the fee for the fund administration and transfer agency services increased as set forth below. The fees are calculated based on the Trust’s average daily net assets according to the fee schedule below. The fees are then allocated proportionately among all funds within the Trust in relation to the average daily net assets of each fund and are paid to GSA.
| Combined Fee Schedule* | ||
Up to $1 billion | 0.15% | |
$1 billion and more up to $3 billion | 0.10% | |
$3 billion and more up to $8 billion | 0.05% | |
$8 billion and more up to $10 billion | 0.04% | |
$10 billion and more up to $12 billion | 0.02% | |
$12 billion or more | 0.01% | |
| * | The assets of each of the Investor Destinations Funds are excluded from the Trust asset level amount in order to calculate this asset-based fee. The Investor Destinations Funds do not pay any part of this fee. |
GSA and GISI have entered into agreements with BISYS Fund Services Ohio, Inc. (“BISYS”), pursuant to which BISYS provides sub-administration and sub-transfer agency services, respectively, to the Fund.
Under the terms of a Distribution Plan under Rule 12b-1 of the 1940 Act, Gartmore Distribution Services, Inc. (“GDSI”), the Fund’s Distributor, is compensated by the Fund for expenses associated with the distribution of the Class II shares of the Fund. These fees are based on average daily net assets of Class II shares of the Fund at an annual rate not to exceed 0.25%.
Under the terms of an Administrative Services Plan, the Fund may pay fees to servicing organizations, such as broker-dealers, including Nationwide Financial Services, and financial institutions, which agree to provide administrative support services to the shareholders of certain classes. These services include, but are not limited, to the following: establishing and maintaining shareholder accounts; processing purchase and redemption transactions; arranging bank wires; performing shareholder sub-accounting; answering inquires regarding the Fund; and other such services. These fees are based on an annual rate of up to 0.25% of the average daily net assets of each class of shares of the Fund.
4. Short-Term Trading Fees
The Fund reserves the right to assess a short-term trading fee on certain transactions out of Class III shares that a separate account makes on behalf of a variable insurance contract owner (the “contract owner”). A separate account that redeems Class III shares on behalf of a contract owner may be subject to a 1.00% short-term trading fee if the separate account held the Class III shares on behalf of the contract owner for 60 days or less, unless an exception applies as disclosed in the prospectus. The short-term trading fee is paid directly to the Fund and is intended to offset the cost to the Fund of excess brokerage commissions and other costs associated with fluctuations in fund asset levels and cash flow caused by short-term trading. For purposes of determining whether the short-term trading fee applies, the Class III shares that were held on behalf of the contract owner the longest will be treated as being redeemed first.
For the six months ended June 30, 2005, the Fund had no contributions to capital due to collection of redemption fees.
5. Investment Transactions
For the six months ended June 30, 2005, (excluding short-term securities) the Fund had purchases of $66,108,823 and sales of $67,130,771.
6. Bank Loans
The Trust has a credit agreement of $100,000,000. Borrowings under this arrangement bear interest at the Federal Funds rate plus 0.50%. The interest costs are included in custodian fees in the Statement of Operations. No compensation balances were required under the terms of the line of credit. There were no borrowings outstanding as of June 30, 2005.
16
Table of Contents
GARTMORE VARIABLE INSURANCE TRUST
NOTES TO FINANCIAL STATEMENTS (Unaudited) (Continued)
June 30, 2005
7. Shareholder Meeting
A separate shareholders meeting was held on Tuesday, December 23, 2004, for the shareholders of the Trust’s predecessor pursuant to a Proxy Statement On Schedule 14A, dated October 29, 2004, and mailed to the shareholders of the Trust’s predecessor on or around November 5, 2004.
Two Proposals: The purpose of the December 23, 2004 meeting was to allow the shareholders of the Trust’s predecessor to vote on:
| i. | Proposal One: The election of the Trust’s Board of Trustees; and |
| ii. | Proposal Two: The approval of an “Agreement and Plan of Reorganization” that provided for the reorganization of the Trust from a Massachusetts business trust into a Delaware statutory trust. |
Proposal One: As set forth in the October 29, 2004 Proxy Statement, the nominees for election as Trustees of the Trust’s predecessor were: Charles E. Allen, Michael J. Baresich, Paula H.J. Cholmondeley, C. Brent DeVore, Phyllis Kay Dryden, Robert M. Duncan, Barbara L. Hennigar, Paul J. Hondros, Barbara I Jacobs, Thomas J. Kerr IV, Douglas F. Kridler, Michael D. McCarthy, Arden L. Shisler, and David C. Wetmore.
Proposal Two: As specifically set forth in the October 29, 2004 Proxy Statement, the Reorganization proposal requested the shareholders of the Trust’s predecessor to approve the proposed “Agreement and Plan of Reorganization” of the Trust’s predecessor (on behalf of each of the its funds) into a new Delaware-domiciled Trust, whereby the Funds of the new Delaware Trust would acquire all of the assets of the corresponding funds of the Trust’s predecessor subject to the liabilities, expenses, costs, charges, and reserves of the corresponding funds of the Trust’s predecessor (contingent or otherwise), in exchange for shares of the acquiring Funds to be distributed pro rata by the Trust to the holders of the shares of the funds of the Trust’s predecessor, in a complete liquidation of the Trust’s predecessor.
Voting Results:
The shareholders of the Trust’s predecessor voted to approve both Proposal One and Proposal Two, as follows:
Proposal 1: Election of a Board of Trustees of Gartmore Variable Insurance Trust
Charles E. Allen: | ||
FOR | 2,797,230,318.955 shares (96.078%) | |
WITHHOLD | 114,195,693.660 shares (3.922%) | |
TOTAL | 2,912,726,012.615 shares (100.000%) | |
Michael J. Baresich: | ||
FOR | 2,796,135,979.559 shares (96.040%) | |
WITHHOLD | 115,290,033.056 shares (3.960%) | |
TOTAL | 2,912,726,012.615 shares (100.000%) | |
Paula H.J. Cholmondeley: | ||
FOR | 2,795,095,945.396 shares (96.004%) | |
WITHHOLD | 116,330,067.219 shares (3.996%) | |
TOTAL | 2,912,726,012.615 shares (100.000%) | |
C. Brent DeVore: | ||
FOR | 2,797,207,046.916 shares (96.077%) | |
WITHHOLD | 114,218,965.699 shares (3.923%) | |
TOTAL | 2,912,726,012.615 shares (100.000%) | |
17
Table of Contents
GARTMORE VARIABLE INSURANCE TRUST
NOTES TO FINANCIAL STATEMENTS (Unaudited) (Continued)
June 30, 2005
Phyllis Kay Dryden: | ||
FOR | 2,795,587,023.994 shares (96.021%) | |
WITHHOLD | 115,838,988.621 shares (3.979%) | |
TOTAL | 2,912,726,012.615 shares (100.000%) | |
Robert M. Duncan: | ||
FOR | 2,790,191,720.503 shares (95.836%) | |
WITHHOLD | 121,234,292.112 shares (4.164%) | |
TOTAL | 2,912,726,012.615 shares (100.000%) | |
Barbara L. Hennigar: | ||
FOR | 2,792,939,848.858 shares (95.937%) | |
WITHHOLD | 118,486,163.757 shares (4.070%) | |
TOTAL | 2,912,726,012.615 shares (100.000%) | |
Paul J. Hondros: | ||
FOR | 2,797,557,404.448 shares (96.089%) | |
WITHHOLD | 113,868,608.167 shares (3.911%) | |
TOTAL | 2,912,726,012.615 shares (100.000%) | |
Barbara I. Jacobs: | ||
FOR | 2,796,306,126.654 shares (96.046%) | |
WITHHOLD | 115,119,885.961 shares (3.954%) | |
TOTAL | 2,912,726,012.615 shares (100.000%) | |
Thomas J. Kerr IV: | ||
FOR | 2,789,755,720.087 shares (95.821%) | |
WITHHOLD | 121,670,292.528 shares (4.179%) | |
TOTAL | 2,912,726,012.615 shares (100.000%) | |
Douglas F. Kridler: | ||
FOR | 2,798,065,774.375 shares (96.106%) | |
WITHHOLD | 113,360,238.240 shares (3.894%) | |
TOTAL | 2,912,726,012.615 shares (100.000%) | |
Michael D. McCarthy: | ||
FOR | 2,797,452,613.694 shares (96.085%) | |
WITHHOLD | 113,973,395.921 shares (3.915%) | |
TOTAL | 2,912,726,012.615 shares (100.000%) | |
Arden L. Shisler: | ||
FOR | 2,796,738,454.730 shares (96.061%) | |
WITHHOLD | 114,687,557.885 shares (3.939%) | |
TOTAL | 2,912,726,012.615 shares (100.000%) | |
18
Table of Contents
GARTMORE VARIABLE INSURANCE TRUST
NOTES TO FINANCIAL STATEMENTS (Unaudited) (Continued)
June 30, 2005
David C. Wetmore: | ||
FOR | 2,794,784,752.247 shares (95.994%) | |
WITHHOLD | 116,641,260.368 shares (4.006%) | |
TOTAL | 2,912,726,012.615 shares (100.000%) | |
Proposal 2: Approval of the Agreement and Plan of Reorganization of Gartmore Variable Insurance Trust
FOR | 2,561,003,822.546 shares (87.964%) | |
AGAINST | 103,593,261.010 shares (3.558%) | |
ABSTAIN | 246,828,929.059 shares (8.478%) | |
TOTAL | 2,912,726,012.615 shares (100.000%) | |
8. Subsequent Event
On July 29, 2005, the Trust filed a Post-Effective Amendment to its Registration Statement on Form N-1A to change the structure of the Fund’s investment advisory fee and sub-advisory fee from the current asset-based fee structure to a performance based fee structure on or about October 1, 2005. On that date, or, if later, upon SEC effectiveness, the Fund will immediately lower its base advisory fee by 0.10% at each breakpoint. Beginning one year after implementation of the new performance fee structure, the Fund’s base advisory fee may be adjusted proportionately upward or downward if the Fund outperforms or underperforms its stated benchmark by the following amounts:
Out or Underperformance | Change in Fees | |
+/– 1 percentage point | +/– 0.02% | |
+/– 2 percentage points | +/– 0.04% | |
+/– 3 percentage points | +/– 0.06% | |
+/– 4 percentage points | +/– 0.08% | |
+/– 5 percentage points | +/– 0.10% |
The prospectus describing the above Fund will be supplemented upon the effectiveness of the Post-Effective Amendment to the Trust’s Registration Statement. Please refer to the prospectus, as supplemented by a notice you will receive after the effectiveness of the Post-Effective Amendment, for further information about this new fee structure.
19
Table of Contents
GARTMORE VARIABLE INSURANCE TRUST
Management Information (Unaudited)
June 30, 2005
Trustees who are not Interested Persons (as defined in the 1940 Act) and Officers of the Funds June 30, 2005
| Name, Address and Date of Birth | Position(s) Held with the Trust and Length of Time Served1 | Principal Occupation(s) During Past 5 Years | Number of Portfolios in the Gartmore Fund Complex Overseen by Trustee | Other Directorships Held by Trustee or Nominee2 | ||||
Charles E. Allen
c/o Gartmore Global Investments, Inc. 1200 River Road, Suite 1000 Conshohocken, PA 19428
1948 | Trustee since July 2000 | Mr. Allen is Chairman, Chief Executive Officer and President of the Graimark Realty Advisors, Inc. (real estate development, investment and asset management). | 84 | None | ||||
Paula H.J. Cholmondeley
c/o Gartmore Global Investments, Inc. 1200 River Road, Suite 1000 Conshohocken, PA 19428
1940 | Trustee since July 2000 | Ms. Cholmondeley has been the Chairman and Chief Executive Officer of the Sorrel Group, a management consulting company, since January 2004. From March 2000 through December 2003, Ms. Cholmondeley was Vice President and General Manager of Sappi Fine Paper North America. Prior thereto, Ms. Cholmondeley was Vice President and General Manager of Residential Insulation of Owens Corning. | 84 | Director of Dentsply International, Inc., Ultralife Batteries, Inc., Terex Corporation, Minerals Technology, Inc. and Albany International Corp. | ||||
C. Brent DeVore
c/o Gartmore Global Investments, Inc. 1200 River Road, Suite 1000 Conshohocken, PA 19428
1940 | Trustee since 1990 | Dr. DeVore is President of Otterbein College. | 84 | None | ||||
Phyllis K. Dryden
c/o Gartmore Global Investments, Inc. 1200 River Road, Suite 1000 Conshohocken, PA 19428 1947 | Trustee since December 2004 | Ms. Dryden was a former Managing Partner of marchFIRST, a global management consulting firm prior to 2002. | 84 | None |
20
Table of Contents
GARTMORE VARIABLE INSURANCE TRUST
Management Information (Unaudited)
June 30, 2005
| Name, Address and Date of Birth | Position(s) Held with the Trust and Length of Time Served1 | Principal Occupation(s) During Past 5 Years | Number of Portfolios in the Gartmore Fund Complex Overseen by Trustee | Other Directorships Held by Trustee or Nominee2 | ||||
Barbara L. Hennigar*
c/o Gartmore Global Investments, Inc. 1200 River Road, Suite 1000 Conshohocken, PA 19428
1935 | Trustee since July 2000 | Retired since June 2000. Prior thereto, Ms. Hennigar was the Chairman or President and Chief Executive Officer of OppenheimerFunds Services and a member of the Executive Committee of OppenheimerFunds. | 84 | None | ||||
Barbara I. Jacobs
c/o Gartmore Global Investments, Inc. 1200 River Road, Suite 1000 Conshohocken, PA 19428
1950 | Trustee since December 2004 | Ms. Jacobs has served as Chairman of the Board of Directors of KICAP Network Fund, a European (United Kingdom) hedge fund, since December 2000. Prior to 2004, Ms. Jacobs was also a Managing Director and European Portfolio Manager with CREF Investments (Teachers Insurance Annuity Association — College Retirement Equity Fund). | 84 | None | ||||
Douglas F. Kridler
c/o Gartmore Global Investments, Inc. 1200 River Road, Suite 1000 Conshohocken, PA 19428
1955 | Trustee since September 1997 | Mr. Kridler has served as the President and Chief Executive Officer of the Columbus Foundation (a Columbus, OH-based foundation which manages over 1,300 individual endowment funds) since February 2002. Mr. Kridler was the President of the Columbus Association for the Performing Arts prior thereto and Chairman of the Greater Columbus Convention and Visitors Bureau during 2000 and 2001. | 84 | None | ||||
Michael D. McCarthy
c/o Gartmore Global Investments, Inc. 1200 River Road, Suite 1000 Conshohocken, PA 19428
1947 | Trustee since December 2004 | Mr. McCarthy serves as: the Founder and Chairman of The Eureka Foundation (which sponsors and funds the “Great Museums” series on PBS); and a Partner of Pineville Properties LLC (a commercial real estate development firm). | 843 | None |
21
Table of Contents
GARTMORE VARIABLE INSURANCE TRUST
Management Information (Unaudited)
June 30, 2005
| Name, Address and Date of Birth | Position(s) Held with the Trust and Length of Time Served1 | Principal Occupation(s) During Past 5 Years | Number of Portfolios in the Gartmore Fund Complex Overseen by Trustee | Other Directorships Held by Trustee or Nominee2 | ||||
David C. Wetmore
c/o Gartmore Global Investments, Inc. 1200 River Road, Suite 1000 Conshohocken, PA 19428
1948 | Trustee since 1995 and Chairman since February 2005 | Retired. Mr. Wetmore was formerly a Managing Director of Updata Capital, an investment banking and venture capital firm. | 84 | None |
| * | Pursuant to the Trust’s mandatory retirement policy, Ms. Hennigar is expected to retire on or about January 12, 2006. |
| 1 | The term of office length is until a trustee resigns or reaches a mandatory retirement age of 70. On March 2, 2000, the Board adopted a five-year implementation period for any Trustee 65 or older as of the adoption of this policy. Pursuant to this policy, Messrs. Duncan and Kerr retired as trustees effective as of March 12, 2005. |
| 2 | Directorships held in (1) any other investment companies registered under the 1940 Act, (2) any company with a class of securities registered pursuant to Section 12 of the Securities Exchange Act of 1934, as amended (the “Exchange Act”), or (3) any company subject to the requirements of Section 15(d) of the Exchange Act. |
| 3 | Mr. McCarthy was also an Administrative Committee Member for the Alphagen Arneb Fund, LLC, The Healthcare Fund LDC, The Leaders Long-Short Fund, LLC, and The Leaders Long-Short Fund LDC, four private investment companies (hedge funds) managed by GSA. Mr. McCarthy resigned as an Administrative Committee Member effective June 30, 2005. |
Trustees and Officers who are not Interested Persons (as defined in the 1940 Act) of the Funds received aggregate compensation of $274,882 from the Trust for the Six Months Ended June 30, 2005. Additional information regarding the Trustees and Officers may be found in the Trust’s statement of additional information, which is available without charge upon request, by calling 1-800-848-0920.
22
Table of Contents
GARTMORE VARIABLE INSURANCE TRUST
Management Information (Unaudited)
June 30, 2005
Trustees who are Interested Persons (as defined in the 1940 Act) and/or Officers of the Funds June 30, 2005
| Name, Address and Age | Position(s) Held with the Trust and Length of Time Served1 | Principal Occupation(s) During Past 5 Years | Number of Portfolios in the Gartmore Fund Complex Overseen by Trustee | Other Directorships Held by Trustee2 | ||||
Paul J. Hondros
Gartmore Global Investments, Inc. 1200 River Road, Suite 1000 Conshohocken, PA 19428
1948 | Trustee since July 2000 | Mr. Hondros has been President and Chief Executive Officer of various Gartmore entities, including Gartmore Distribution Services, Inc. (“GDSI”),3 Gartmore Investor Services, Inc. (“GISI”),3 Gartmore Morley Capital Management, Inc. (“GMCM”),3 Gartmore Morley Financial Services, Inc. (“GMFS”),3 NorthPointe Capital, LLC (“NorthPointe”),3 Gartmore Global Asset Management Trust (“GGAMT”)3, Gartmore Global Investments, Inc. (“GGI”)3, Gartmore Mutual Fund Capital Trust (“GMFCT”)3 and Gartmore SA Capital Trust (“GSA”)3; and a Director of Nationwide Securities, Inc.3, as well as several entities within Nationwide Financial Services, Inc. | 844 | None | ||||
Arden L. Shisler
c/o Gartmore Global Investments, Inc. 1200 River Road, Suite 1000 Conshohocken, PA 19428
1941 | Trustee since February 2000 | Mr. Shisler has been a consultant since January 2003. Prior thereto, he was President and Chief Executive Officer of K&B Transport, Inc., a trucking firm. Since 1992, Mr. Shisler has also been Chairman of the Board for Nationwide Mutual Insurance Company3. | 84 | Director of Nationwide Financial Services, Inc. | ||||
Gerald J. Holland
Gartmore Global Investments, Inc. 1200 River Road, Suite 1000 Conshohocken, PA 19428
1951 | Treasurer since March 2001 | Mr. Holland is Senior Vice President – Operations for GGI3, GMFCT3 , and GSA3. Prior to July 2000, Mr, Holland was Vice President for First Data Investor Services, an investment company service provider. | 84 | None |
23
Table of Contents
GARTMORE VARIABLE INSURANCE TRUST
Management Information (Unaudited)
June 30, 2005
| Name, Address and Age | Position(s) Held with the Trust and Length of Time Served1 | Principal Occupation(s) During Past 5 Years | Number of Portfolios in the Gartmore Fund Complex Overseen by Trustee | Other Directorships Held by Trustee2 | ||||
Michael A. Krulikowski
Gartmore Global Investments, Inc. 1200 River Road, Suite 1000 Conshohocken, PA 19428
1959 | Chief Compliance Officer since June 2004 | Since November 1999, Mr. Krulikowski has served as a Vice President and Chief Compliance Officer of GGI. Prior thereto, Mr. Krulikowski served as Chief Compliance Officer of 1717 Capital Management Company/Provident Mutual Insurance Company. | 84 | None | ||||
Eric E. Miller
Gartmore Global Investments, Inc. 1200 River Road, Suite 1000 Conshohocken, PA 19428
1953 | Secretary since December 2002 | Mr. Miller is Senior Vice President, Chief Counsel for GGI3, GMFCT3 and GSA3 since August 2002. From August 2000 to August 2002, Mr. Miller was a Partner with Stradley Ronan Stevens & Young, LLP. Prior to August 2000, Mr. Miller served as Senior Vice President and Deputy General Counsel at Delaware Investments. | 84 | None |
| 1 | The term of office length is until a trustee resigns or reaches a mandatory retirement age of 70. On March 2, 2000, the Board adopted a five-year implementation period for any Trustee 65 or older as of the adoption of this policy. Pursuant to this policy, Messrs. Duncan and Kerr retired as trustees effective as of March 12, 2005. |
| 2 | Directorships held in (1) any other investment companies registered under the 1940 Act, (2) any company with a class of securities registered pursuant to Section 12 of the Securities Exchange Act of 1934, as amended (the “Exchange Act”), or (3) any company subject to the requirements of Section 15(d) of the Exchange Act. |
| 3 | This position is held with an affiliated person or principal underwriter of the Trust. |
| 4 | Mr. Hondros was also an Administrative Committee Member for the Alphagen Arneb Fund, LLC, The Healthcare Fund LDC, The Leaders Long-Short Fund, LLC, and The Leaders Long-Short Fund LDC, four private investment companies (hedge funds) managed by GSA. Mr. Hondros resigned as Administrative Committee Member effective June 30, 2005. |
Federal law requires the Trust, each of its investment advisers and sub-advisers to adopt procedures for voting proxies (“Proxy Voting Guidelines”) and to provide a summary of those Proxy Voting Guidelines used to vote the securities held by the Funds. The Funds’ proxy voting policies and procedures are available without charge (i) upon request, by calling 1-800-848-0920, (ii) on the Fund’s website at www.gartmorefunds.com, or (iii) on the Securities and Exchange Commission’s website at www.sec.gov.
24
Table of Contents
Dreyfus GVIT Mid Cap Index Fund
Semiannual Report
| | June 30, 2005 |
| Contents | ||
| 5 | Statement of Investments | |
| 12 | Statement of Assets and Liabilities | |
| 12 | Statement of Operations | |
| 13 | Statements of Changes in Net Assets | |
| 14 | Financial Highlights | |
| 15 | Notes to Financial Statements | |
Commentary provided by Gartmore Global Investments, investment adviser to Gartmore Variable Insurance Trust. All opinions and estimates included in this report constitute Gartmore Global Investments’ judgment as of the date of this report and are subject to change without notice.
Statement Regarding Availability of Quarterly Portfolio Schedule.
The Gartmore Variable Insurance Trust files complete schedules of portfolio holdings for each Fund with the Securities and Exchange Commission (the “Commission”) for the first and third quarters of each fiscal year on Form N-Q. The Funds’ Forms N-Q are available on the Commission’s website at http://www.sec.gov. The Funds’ Forms N-Q may be reviewed and copied at the Commission’s Public Reference Room in Washington, DC, and information on the operation of the Public Reference Room may be obtained by calling 800-SEC-0330; and the Funds make the information on Form N-Q available to shareholders upon request without charge.
Statement Regarding Availability of Proxy Voting Record.
Information regarding how the Fund voted proxies relating to portfolio securities held during the most recent 12-month period ended June 30, 2005 is available without charge, upon request, by calling 800-848-0920, and on the Commission’s website at http://www.sec.gov.
Table of Contents
Dreyfus GVIT Mid Cap Index Fund
For the semiannual period ended June 30, 2005, the Dreyfus GVIT Mid Cap Index Fund returned 3.67% (Class I at NAV) versus 3.85% for its benchmark, the S&P MidCap 400 Index. For broader comparison, the average return for the Fund’s Lipper peer category of Mid-Cap Core Funds was 3.18%.
The Fund tracked the return of its benchmark index during the reporting period with Fund expenses and trading costs primarily accounting for the difference between the Fund’s performance and that of the Index.
The U.S. equity market traded in a narrow range during the reporting period with the economy showing signs of strength as the employment picture steadily improved and interest rates remained surprisingly low. The market was held in check, because many investors were uncertain about the effect on the economy of rising energy prices and multiple Federal Reserve Board short-term interest-rate increases. The mid-capitalization portion of the stock market continued to outperform large-capitalization stocks as represented by the S&P 500® Index.
In the technology sector, the computer hardware industry experienced a difficult year as profit margins began to erode due to increased competition. At the end of 2004, most technology stocks had risen sharply and were not able to hold onto their gains due to lofty expectations that were not achieved. Companies that supply parts to the domestic auto manufacturers also experienced a difficult year as sales for new domestic cars and trucks proved to be disappointing.
Among the top-performing industries in the benchmark and therefore the Fund were energy, medical providers, construction and clothing stores. The top-performing securities during the reporting period were: Legg Mason, Inc.; D.R. Horton, Inc.; Toll Brothers, Inc.; Murphy Oil Corp.; and Chico’s FAS, Inc.
Broad-based gains were reported by most of the companies in the energy sector. Higher prices for crude oil and natural gas, increased demand from developing markets, and limited refining capacity drove the prices of these companies higher. Medical providers such as hospitals and HMOs also experienced strong gains as the price for health care continued to rise and the improving employment situation added new participants. Construction stocks continued their strong run as interest rates remained low and housing prices continued to soar in some parts of the country.
The Fund experienced no significant changes during the reporting period, and continues to passively replicate the mid-capitalization U.S. equity market, as represented by the S&P MidCap 400 Index. The portfolio employs a strategy of full replication, which entails holding each stock in direct proportion to its weight in the Index. S&P MidCap 400 futures are used to efficiently manage cash flows.
PORTFOLIO MANAGER: Tom Durante
Investing in mutual funds involves risk, including possible loss of principal.
There is no assurance that the investment objective of any fund will be achieved.
Standard & Poor’s (S&P) MidCap 400 Index: An unmanaged index that measures the performance of 400 stocks of medium-sized U.S. companies.
Lipper Analytical Services, Inc. is an industry research firm whose rankings are based on total return performance and do not reflect the effects of sales charges.
The Gartmore Variable Insurance Trust Funds are available only as sub-account investment options in certain variable insurance products. Accordingly, investors are unable to invest in shares of these funds outside of an insurance product. Performance information found herein reflects only the performance of these funds, and does not indicate the performance your sub-account may experience under your variable insurance contract. Performance returns assume reinvestment of all distributions. The investment return and principal value of an investment will fluctuate so that an investor’s shares, when redeemed, may be worth more or less than their original cost. Index performance is provided for comparison purposes only; the indexes shown are unmanaged and do not reflect any fees or expenses. Investors cannot invest directly in market indexes. To obtain performance information about the sub-account option under your insurance contract that invests in one of these funds, please contact your variable insurance carrier. PAST PERFORMANCE IS NO GUARANTEE OF FUTURE RESULTS.
Commentary provided by Gartmore Global Investments. All opinions and estimates included in this report constitute Gartmore Global Investments’ judgment as of the date of this report and are subject to change without notice.
Investors should carefully consider a fund’s investment objectives, risks, fees, charges and expenses before investing any money. To obtain this and other information on Gartmore Variable Insurance Trust, please contact your variable insurance contract provider or call 800-848-0920. Please read the Trust’s prospectus carefully before investing any money.
Gartmore Funds distributed by Gartmore Distribution Services, Inc., Member NASD. 1200 River Road, Suite 1000, Conshohocken, PA 19428.
1
Table of Contents
Fund Performance | Dreyfus GVIT Mid Cap Index Fund |
| Average | Annual Total Return1 |
(For Periods Ended June 30, 2005)
| Six months* | One year | Five years | Inception2 | |||||||||
| Class I2 | 3.67 | % | 13.47 | % | 7.53 | % | 10.01 | % | ||||
| Class II3 | 3.60 | % | 13.26 | % | 7.28 | % | 9.74 | % |
| * | Not Annualized. |
| 1 | Not subject to any sales charges. |
| 2 | The Fund commenced operations on October 31, 1997. Until September 27, 1999, the Fund was actively managed by three subadvisers; since that date, the Fund has been managed as an index fund, and its returns may have been affected by this change in investment strategy. |
| 3 | These returns until the creation of the Class II shares (May 6, 2002), are based on the performance of the Class I shares of the Fund. Excluding the effect of any fee waivers or reimbursements, such prior performance is similar to what Class II shares would have produced because all classes of shares invest in the same portfolio of securities. Class II shares’ annual returns have been restated to reflect the additional fees applicable to Class II shares and therefore are lower than those of Class I. |
| Performance | of a $10,000 Investment |
Investment return and principal value will fluctuate, and when redeemed, shares may be worth more or less than original cost. Past performance is no guarantee of future results and does not reflect the deduction of taxes that a shareholder would pay on fund distributions or the redemption of fund shares. Investing in mutual funds involves market risk, including loss of principal. Performance returns assume the reinvestment of all distributions.
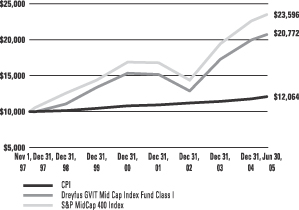
Comparative performance of $10,000 invested in Class I shares of the Dreyfus GVIT Mid Cap Index Fund, Standard & Poor’s Midcap 400 Index (S&P Midcap 400)(a), and Consumer Price Index (CPI)(b) since inception. Unlike, the Fund, the returns for these unmanaged indexes do not reflect any fees, expenses, or sales charges. Investors cannot invest directly in market indexes.
| (a) | S&P Midcap 400 is an unmanaged index that measures the performance of 400 stocks of medium-sized U.S. companies. |
| (b) | The CPI represents changes in prices of a basket of goods and services purchased for consumption by urban households. |
2
Table of Contents
Shareholder
Expense Example | Dreyfus GVIT Mid Cap Index Fund |
As a shareholder of the Fund, you incur two types of costs: (1) transaction costs, including sales charges (loads) paid on purchase payments and redemption fees; and (2) ongoing costs, including investment advisory fees, administration fees, distribution fees and other Fund expenses. The examples below are intended to help you understand your ongoing costs (in dollars) of investing in the Fund and to compare these costs with the ongoing costs of investing in other mutual funds. Per SEC requirements, the examples assume that you had a $1,000 investment in the Class at the beginning of the reporting period, January 1, 2005, and continued to hold your shares at the end of the reporting period, June 30, 2005.
Actual Expenses
For each Class of the Fund in the table below, the first line provides information about actual account values and actual expenses. You may use the information in this line, together with the amount you invested, to estimate the expenses that you paid over the period. Simply divide your account value by $1,000 (for example, an $8,600 account value divided by $1,000 = 8.6), then multiply the result by the number in the first line of each Class under the heading entitled “Expenses Paid During Period” to estimate the expenses you paid on your account during the period.
Hypothetical Example for Comparison Purposes
The second line of each Class in the table below provides information about hypothetical account values and hypothetical expenses based on the Class’ actual expense ratio and an assumed rate of return of 5% per year before expenses, which is not the Class’ actual return. The hypothetical account values and expenses may not be used to estimate the actual ending account balance or expenses you paid for the period. You may use this information to compare the ongoing costs of investing in the Class of the Fund and other funds. To do so, compare this 5% hypothetical example with the 5% hypothetical examples that appear in the shareholder reports of the other funds.
Please note that the expenses shown in the table are meant to highlight your ongoing costs only and do not reflect any transaction costs, such as sales charges (loads) or redemption fees. Therefore, the second line for each Class in the table is useful in comparing ongoing costs only, and will not help you determine the relative total costs of owning different funds. In addition, if these transaction costs were included, your costs would have been higher. The examples also assume all dividends and distributions have been reinvested.
| Beginning Account Value, January 1, 2005 | Ending Account Value, June 30, 2005 | Expenses Paid During Period* | Annualized Expense Ratio* | ||||||||||
| Mid Cap Index Fund | |||||||||||||
Class I | Actual | $ | 1,000 | $ | 1,037 | $ | 2.68 | 0.53% | |||||
| Hypothetical1 | $ | 1,000 | $ | 1,022 | $ | 2.66 | 0.53% | ||||||
Class II | Actual | $ | 1,000 | $ | 1,036 | $ | 3.63 | 0.72% | |||||
| Hypothetical1 | $ | 1,000 | $ | 1,021 | $ | 3.62 | 0.72% | ||||||
| * | Expenses are equal to the Fund’s annualized expense ratio multiplied by the average account value over the period multiplied by 181/365 (to reflect the one-half year period). The expense ratio presented represents a six month, annualized ratio in accordance with SEC guidelines. |
| 1 | Represents the hypothetical 5% return before expenses. |
3
Table of Contents
Portfolio Summary
(June 30, 2005) | Dreyfus GVIT Mid Cap Index Fund |
The SEC adopted a requirement that Funds present their portfolio holdings in a table, chart or graph format in their annual and semiannual reports to shareholders, whether or not a statement of investments is utilized. The following tables, which present portfolio holdings as a percentage of net assets, are provided in compliance with this requirement.
| Asset Allocation | ||
| Common Stocks | 98.4% | |
| Cash Equivalents | 1.4% | |
| Treasury Bills | 0.1% | |
| Other Investments* | 21.6% | |
| Liabilities in excess of other assets** | -21.5% | |
| 100.0% | ||
| Top Industries | ||
| Healthcare | 8.4 % | |
| Retail | 7.7 % | |
| Utilities | 7.5 % | |
| Oil & Gas | 7.2 % | |
| Insurance | 5.1 % | |
| Banks | 4.9 % | |
| Computer Software & Services | 4.8 % | |
| Financial Services | 4.5 % | |
| Electronics | 4.4 % | |
| Construction | 4.0 % | |
| Other Industries | 41.5 % | |
| 100.0% | ||
| Top Holdings*** | ||
| Legg Mason, Inc. | 1.1% | |
| D.R. Horton, Inc. | 1.0% | |
| Lennar Corp. | 0.8% | |
| Murphy Oil Corp. | 0.8% | |
| Weatherford International Ltd. | 0.8% | |
| Whole Foods Market, Inc. | 0.7% | |
| Coventry Health Care, Inc. | 0.7% | |
| Smith International, Inc. | 0.6% | |
| Noble Energy, Inc. | 0.6% | |
| Cognizant Technology Solutions Corp. | 0.6% | |
| Other Holdings | 92.3% | |
| 100.0% | ||
| * | Includes value of collateral received from securities lending. |
| ** | Includes value of collateral owed from securities lending. |
| *** | For purpose of listing top holdings, repurchase agreements are considered cash equivalents and are included as part of Other Holdings. |
4
Table of Contents
GARTMORE VARIABLE INSURANCE TRUST
DREYFUS GVIT MID CAP INDEX FUND
Statement of Investments — June 30, 2005 (Unaudited)
Shares or Principal Amount | Value | ||||
| COMMON STOCKS (98.4%) | |||||
| Aerospace & Defense (0.8%) | |||||
| Alliant Techsystems, Inc. (b) | 18,800 | $ | 1,327,280 | ||
| Precision Castparts Corp. | 33,700 | 2,625,230 | |||
| Sequa Corp. (b) | 4,300 | 284,531 | |||
| 4,237,041 | |||||
| Agricultural Products (0.1%) | |||||
| Universal Corp. | 13,100 | 573,518 | |||
| Airlines (0.3%) | |||||
| AirTran Holdings, Inc. (b) | 44,300 | 408,889 | |||
| Alaska Air Group, Inc. (b) | 13,200 | 392,700 | |||
| Jetblue Airways Corp. (b) | 50,100 | 1,024,044 | |||
| 1,825,633 | |||||
| Amusement & Recreation (0.3%) | |||||
| Callaway Golf Co. | 36,200 | 558,566 | |||
| International Speedway Corp. | 22,500 | 1,265,850 | |||
| 1,824,416 | |||||
| Auction House & Art Dealer (0.2%) | |||||
| Adesa, Inc. | 45,500 | 990,535 | |||
| Auto Parts & Equipment (1.5%) | |||||
| Advance Auto Parts, Inc. (b) | 36,500 | 2,356,075 | |||
| Arvinmeritor, Inc. | 35,725 | 635,548 | |||
| Bandag, Inc. | 8,000 | 368,400 | |||
| BorgWarner Automotive, Inc. | 28,800 | 1,545,696 | |||
| Gentex Corp. | 79,500 | 1,446,900 | |||
| Lear Corp. | 34,200 | 1,244,196 | |||
| Modine Manufacturing Co. | 16,600 | 540,496 | |||
| 8,137,311 | |||||
| Automotive (0.3%) | |||||
| Carmax, Inc. (b) | 53,100 | 1,415,115 | |||
| Banks (4.9%) | |||||
| Associated Banc Corp. | 65,115 | 2,191,771 | |||
| Astoria Financial Corp. | 51,250 | 1,459,088 | |||
| City National Corp. | 23,000 | 1,649,330 | |||
| Colonial Bancgroup, Inc. | 79,100 | 1,744,946 | |||
| Cullen/Frost Bankers, Inc. | 24,800 | 1,181,720 | |||
| FirstMerit Corp. | 42,600 | 1,112,286 | |||
| Greater Bay Bancorp | 26,100 | 688,257 | |||
| Hibernia Corp. | 80,000 | 2,654,399 | |||
| Independence Community Bank Corp. | 39,800 | 1,469,814 | |||
| IndyMac Bancorp, Inc. | 31,900 | 1,299,287 | |||
| Mercantile Bankshare Corp. | 40,500 | 2,086,965 | |||
Shares or Principal Amount | Value | ||||
| COMMON STOCKS (continued) | |||||
| Banks (continued) | |||||
| New York Community Bancorp, Inc. | 124,588 | $ | 2,257,535 | ||
| SVB Financial Group (b) | 18,100 | 866,990 | |||
| TCF Financial Corp. | 64,100 | 1,658,908 | |||
| Texas Regional Bancshares, Inc. | 21,000 | 640,080 | |||
| Washington Federal, Inc. | 44,189 | 1,039,325 | |||
| Webster Financial Corp. | 27,400 | 1,279,306 | |||
| West America Bancorp | 16,700 | 881,927 | |||
| Wilmington Trust Corp. | 34,400 | 1,238,744 | |||
| 27,400,678 | |||||
| Biotechnology (0.8%) | |||||
| Millenium Pharmaceuticals, Inc. (b) | 156,787 | 1,453,415 | |||
| Protein Design Labs, Inc. (b) | 54,100 | 1,093,361 | |||
| Valeant Pharmaceuticals International | 47,200 | 832,136 | |||
| Vertex Pharmaceuticals, Inc. (b) | 47,400 | 798,216 | |||
| 4,177,128 | |||||
| Broadcasting (0.3%) | |||||
| Emmis Communications Corp. (b) | 17,000 | 300,390 | |||
| Entercom Communications Corp. (b) | 21,500 | 715,735 | |||
| Westwood One, Inc. | 43,400 | 886,662 | |||
| 1,902,787 | |||||
| Business Services (2.3%) | |||||
| Acxiom Corp. | 44,800 | 935,424 | |||
| Catalina Marketing Corp. | 24,200 | 614,922 | |||
| Ceridian Corp. (b) | 76,400 | 1,488,272 | |||
| CheckFree Corp. (b) | 43,300 | 1,474,798 | |||
| ChoicePoint, Inc. (b) | 46,033 | 1,843,621 | |||
| CSG Systems International, Inc. (b) | 25,700 | 487,786 | |||
| Fair Issac Corp. | 34,400 | 1,255,600 | |||
| Gartner Group, Inc. (b) | 44,000 | 467,280 | |||
| Harte-Hanks, Inc. | 36,150 | 1,074,740 | |||
| Kelly Services, Inc. | 14,000 | 400,960 | |||
| Korn/Ferry International (b) | 17,900 | 317,725 | |||
| Manpower, Inc. | 45,900 | 1,825,902 | |||
| MPS Group, Inc. (b) | 52,900 | 498,318 | |||
| 12,685,348 | |||||
5
Table of Contents
GARTMORE VARIABLE INSURANCE TRUST
DREYFUS GVIT MID CAP INDEX FUND
Statement of Investments — June 30, 2005 (Unaudited) (continued)
Shares or Principal Amount | Value | ||||
| COMMON STOCKS (continued) | |||||
| Chemicals (2.5%) | |||||
| Airgas, Inc. | 36,100 | $ | 890,587 | ||
| Albemarle Corp. | 23,700 | 864,339 | |||
| Cabot Corp. | 32,100 | 1,059,300 | |||
| Crompton Corp. | 59,900 | 847,585 | |||
| Cytec Industries, Inc. | 22,000 | 875,600 | |||
| Ferro Corp. | 21,400 | 425,004 | |||
| FMC Corp. (b) | 19,100 | 1,072,274 | |||
| Lubrizol Corp. | 34,600 | 1,453,546 | |||
| Lyondell Chemical Co. | 112,700 | 2,977,534 | |||
| Minerals Technologies, Inc. | 10,500 | 646,800 | |||
| Olin Corp. | 36,300 | 662,112 | |||
| RPM, Inc. | 59,900 | 1,093,774 | |||
| Valspar Corp. | 26,000 | 1,255,540 | |||
| 14,123,995 | |||||
| Communication Equipment (2.1%) | |||||
| Adtran, Inc. | 34,900 | 865,171 | |||
| Cincinnati Bell, Inc. (b) | 125,300 | 538,790 | |||
| CommScope, Inc. (b) | 26,100 | 454,401 | |||
| Harman International Industries, Inc. | 32,600 | 2,652,336 | |||
| Harris Corp. | 68,100 | 2,125,401 | |||
| Plantronics, Inc. | 24,000 | 872,640 | |||
| Polycom, Inc. (b) | 50,000 | 745,500 | |||
| Powerwave Technologies, Inc. (b) | 50,800 | 519,176 | |||
| Telephone & Data Systems, Inc. | 48,700 | 1,987,447 | |||
| Telephone & Data Systems, Inc. | 7,000 | 268,380 | |||
| Special Shares Utstarcom, Inc. (b) | 53,300 | 399,217 | |||
| 11,428,459 | |||||
| Computer Hardware (0.8%) | |||||
| Keane, Inc. (b) | 28,600 | 391,820 | |||
| National Instruments Corp. | 34,050 | 721,860 | |||
| Storage Technology Corp. (b) | 54,700 | 1,985,063 | |||
| Western Digital Corp. (b) | 108,500 | 1,456,070 | |||
| 4,554,813 | |||||
| Computer Software & Services (4.8%) | |||||
| 3COM Corp. (b) | 195,600 | 711,984 | |||
| Activision, Inc. (b) | 102,900 | 1,699,908 | |||
| Advent Software, Inc. (b) | 13,600 | 275,536 | |||
| Anteon International Corp. (b) | 16,400 | 748,168 | |||
| Avocent Corp. (b) | 25,300 | 661,342 | |||
Shares or Principal Amount | Value | ||||
| COMMON STOCKS (continued) | |||||
| Computer Software & Services (continued) | |||||
| Cadence Design Systems, Inc. (b) | 139,900 | $ | 1,911,034 | ||
| CDW Corp. | 37,000 | 2,112,330 | |||
| Cognizant Technology Solutions Corp. (b) | 69,000 | 3,251,970 | |||
| DST Systems, Inc. (b) | 38,700 | 1,811,160 | |||
| F5 Networks, Inc. (b) | 19,200 | 906,912 | |||
| Henry ( Jack) & Associates, Inc. | 41,500 | 759,865 | |||
| Macromedia, Inc. (b) | 38,300 | 1,463,826 | |||
| Macrovision Corp. (b) | 25,700 | 579,278 | |||
| McAfee, Inc. (b) | 83,000 | 2,172,940 | |||
| McData Corp. (b) | 80,400 | 321,600 | |||
| Mentor Graphics Corp. (b) | 39,800 | 407,950 | |||
| RSA Security, Inc. (b) | 36,300 | 416,724 | |||
| SanDisk Corp. (b) | 92,400 | 2,192,652 | |||
| Sybase, Inc. (b) | 45,700 | 838,595 | |||
| Synopsys, Inc. (b) | 73,300 | 1,221,911 | |||
| Titan Corp. (The) (b) | 43,500 | 989,190 | |||
| Transaction Systems Architects, Inc. (b) | 18,100 | 445,803 | |||
| Wind River Systems, Inc. (b) | 40,300 | 631,904 | |||
| 26,532,582 | |||||
| Construction (4.0%) | |||||
| D.R. Horton, Inc. | 149,666 | 5,628,938 | |||
| Dycom Industries, Inc. (b) | 24,900 | 493,269 | |||
| Granite Construction, Inc. | 18,950 | 532,495 | |||
| Hovnanian Enterprises, Inc. (b) | 24,900 | 1,623,480 | |||
| Jacobs Engineering Group, Inc. (b) | 29,200 | 1,642,792 | |||
| Lennar Corp. | 73,780 | 4,681,341 | |||
| Martin Marietta Materials, Inc. | 23,800 | 1,645,056 | |||
| Ryland Group, Inc. (The) | 24,000 | 1,820,880 | |||
| Thor Industries, Inc. | 23,400 | 735,462 | |||
| Toll Brothers, Inc. (b) | 32,000 | 3,249,600 | |||
| 22,053,313 | |||||
| Consumer & Commercial Services (2.1%) | |||||
| Alliance Data Systems Corp. (b) | 34,000 | 1,379,040 | |||
| Career Education Corp. (b) | 52,400 | 1,918,364 | |||
| Corinthian Colleges, Inc. (b) | 46,400 | 592,528 | |||
| Deluxe Corp. | 25,800 | 1,047,480 | |||
| DeVry, Inc. (b) | 33,000 | 656,700 | |||
| Dun & Bradstreet Corp. (b) | 34,700 | 2,139,255 | |||
| MoneyGram International, Inc. | 44,000 | 841,280 | |||
| Quanta Services, Inc. (b) | 49,800 | 438,240 | |||
6
Table of Contents
GARTMORE VARIABLE INSURANCE TRUST
DREYFUS GVIT MID CAP INDEX FUND
Statement of Investments — June 30, 2005 (Unaudited) (continued)
Shares or Principal Amount | Value | ||||
| COMMON STOCKS (continued) | |||||
| Consumer & Commercial Services (continued) | |||||
| Rent-A-Center, Inc. (b) | 35,800 | $ | 833,782 | ||
| Rollins, Inc. | 25,100 | 503,004 | |||
| Sotheby’s Holdings, Inc. (b) | 24,500 | 335,650 | |||
| United Rentals, Inc. (b) | 36,900 | 745,749 | |||
| 11,431,072 | |||||
| Consumer Products (1.9%) | |||||
| Blyth Industries, Inc. | 18,000 | 504,900 | |||
| Church & Dwight, Inc. | 32,350 | 1,171,070 | |||
| Energizer Holdings, Inc. (b) | 36,400 | 2,262,988 | |||
| Furniture Brands International, Inc. | 27,100 | 585,631 | |||
| Lancaster Colony Corp. | 15,400 | 660,968 | |||
| Mohawk Industries Co. (b) | 30,300 | 2,499,750 | |||
| Scotts Co. (The) (b) | 14,200 | 1,011,182 | |||
| Timberland Co., Class A (b) | 30,800 | 1,192,576 | |||
| Tupperware Corp. | 28,800 | 673,056 | |||
| 10,562,121 | |||||
| Containers & Packaging (0.4%) | |||||
| Packaging Corp. of America | 43,300 | 911,465 | |||
| Sonoco Products Co. | 50,600 | 1,340,900 | |||
| 2,252,365 | |||||
| Electronics (4.4%) | |||||
| Amphenol Corp., Class A | 45,000 | 1,807,650 | |||
| Arrow Electronics, Inc. (b) | 60,000 | 1,629,600 | |||
| Atmel Corp. (b) | 230,300 | 545,811 | |||
| Avnet, Inc. (b) | 61,500 | 1,385,595 | |||
| Cabot Microelectronics Corp. (b) | 12,582 | 364,752 | |||
| Credence Systems Corp. (b) | 46,600 | 421,730 | |||
| Cree, Inc. (b) | 38,400 | 978,048 | |||
| Cypress Semiconductor Corp. (b) | 67,200 | 846,048 | |||
| Hubbell, Inc. | 31,400 | 1,384,740 | |||
| Integrated Device Technology, Inc. (b) | 53,600 | 576,200 | |||
| International Rectifier Corp. (b) | 32,900 | 1,569,988 | |||
| Intersil Corp. | 77,900 | 1,462,183 | |||
| Kemet Corp. (b) | 44,200 | 278,460 | |||
| Lam Research Corp. (b) | 70,700 | 2,046,058 | |||
| Lattice Semiconductor Corp. (b) | 57,900 | 257,076 | |||
| LTX Corp. (b) | 31,300 | 155,248 | |||
| Micrel, Inc. (b) | 39,200 | 451,584 | |||
| Microchip Technology, Inc. | 106,300 | 3,148,606 | |||
| Newport Corp. (b) | 22,000 | 304,920 | |||
Shares or Principal Amount | Value | ||||
| COMMON STOCKS (continued) | |||||
| Electronics (continued) | |||||
| Plexus Corp. (b) | 22,100 | $ | 314,483 | ||
| RF Micro Devices, Inc. (b) | 95,900 | 520,737 | |||
| SPX Corp. | 38,300 | 1,761,034 | |||
| Thomas & Betts Corp. (b) | 30,600 | 864,144 | |||
| TriQuint Semiconductor, Inc. (b) | 70,791 | 235,734 | |||
| Vishay Intertechnology, Inc. (b) | 91,750 | 1,089,073 | |||
| 24,399,502 | |||||
| Financial Services (4.5%) | |||||
| Americredit Corp. (b) | 75,300 | 1,920,150 | |||
| Bank of Hawaii Corp. | 26,700 | 1,355,025 | |||
| BISYS Group, Inc. (The) (b) | 61,600 | 920,304 | |||
| Certegy, Inc. | 31,500 | 1,203,930 | |||
| Commerce Bancorp, Inc. | 82,600 | 2,503,606 | |||
| Eaton Vance Corp. | 67,100 | 1,604,361 | |||
| Edwards (A.G.), Inc. | 39,300 | 1,774,395 | |||
| Investors Financial Services Corp. | 34,100 | 1,289,662 | |||
| Jefferies Group, Inc. | 26,500 | 1,004,085 | |||
| Labranche & Co., Inc. (b) | 29,400 | 185,220 | |||
| Legg Mason, Inc. | 56,100 | 5,840,571 | |||
| PMI Group, Inc. | 47,700 | 1,859,346 | |||
| Raymond James Financial, Inc. | 33,950 | 959,088 | |||
| SEI Investments Co. | 42,300 | 1,579,905 | |||
| Waddell & Reed Financial, Inc. | 42,700 | 789,950 | |||
| 24,789,598 | |||||
| Food & Beverage (3.5%) | |||||
| Constellation Brands, Inc. (b) | 106,500 | 3,141,750 | |||
| Dean Foods Co. (b) | 76,733 | 2,704,071 | |||
| Hormel Foods Corp. | 53,600 | 1,572,088 | |||
| J.M. Smucker Co. | 29,767 | 1,397,263 | |||
| Krispy Kreme Doughnuts, Inc. (b) | 31,500 | 219,240 | |||
| PepsiAmericas, Inc. | 53,200 | 1,365,112 | |||
| Sensient Technologies Corp. | 24,100 | 496,701 | |||
| Smithfield Foods, Inc. (b) | 51,100 | 1,393,497 | |||
| Tootsie Roll Industries, Inc. | 21,573 | 631,010 | |||
| Treehouse Foods, Inc. (b) | 1 | 17 | |||
| Tyson Foods, Inc. | 155,081 | 2,760,442 | |||
| Whole Foods Market, Inc. | 33,300 | 3,939,390 | |||
| 19,620,581 | |||||
| Gaming (0.6%) | |||||
| Boyd Gaming Corp. | 34,200 | 1,748,646 | |||
| GTECH Holdings Corp. | 58,600 | 1,713,464 | |||
| 3,462,110 | |||||
7
Table of Contents
GARTMORE VARIABLE INSURANCE TRUST
DREYFUS GVIT MID CAP INDEX FUND
Statement of Investments — June 30, 2005 (Unaudited) (continued)
Shares or Principal Amount | Value | ||||
| COMMON STOCKS (continued) | |||||
| Healthcare (8.4%) | |||||
| Apria Healthcare Group, Inc. (b) | 25,000 | $ | 866,000 | ||
| Barr Laboratories, Inc. (b) | 47,375 | 2,309,058 | |||
| Beckman Coulter, Inc. | 31,500 | 2,002,455 | |||
| Cephalon, Inc. (b) | 29,600 | 1,178,376 | |||
| Community Health Systems, Inc. (b) | 34,600 | 1,307,534 | |||
| Covance, Inc. (b) | 32,100 | 1,440,327 | |||
| Coventry Health Care, Inc. (b) | 54,699 | 3,869,953 | |||
| Cytyc Corp. (b) | 58,100 | 1,281,686 | |||
| Dentsply International, Inc. | 38,500 | 2,079,000 | |||
| Edwards Lifesciences Corp. (b) | 30,400 | 1,307,808 | |||
| Health Net, Inc. (b) | 57,400 | 2,190,384 | |||
| Henry Schein, Inc. (b) | 44,200 | 1,835,184 | |||
| LifePoint Hospitals, Inc. (b) | 26,200 | 1,323,624 | |||
| Lincare Holdings, Inc. (b) | 50,500 | 2,062,420 | |||
| Omnicare, Inc. | 53,500 | 2,270,005 | |||
| PacifiCare Health Systems, Inc. (b) | 44,400 | 3,172,380 | |||
| Par Pharmaceutical Cos., Inc. (b) | 17,400 | 553,494 | |||
| Patterson Cos., Inc. (b) | 70,100 | 3,160,108 | |||
| Perrigo Co. | 45,500 | 634,270 | |||
| Renal Care Group, Inc. (b) | 34,700 | 1,599,670 | |||
| Sepracor, Inc. (b) | 53,400 | 3,204,534 | |||
| Steris Corp. | 35,300 | 909,681 | |||
| Triad Hospitals, Inc. (b) | 41,208 | 2,251,605 | |||
| Universal Health Services, Inc. | 29,600 | 1,840,528 | |||
| Varian Medical Systems, Inc. (b) | 67,400 | 2,516,042 | |||
| 47,166,126 | |||||
| Insurance (5.1%) | |||||
| Allmerica Financial Corp. (b) | 27,200 | 1,008,848 | |||
| American Financial Group, Inc. | 29,900 | 1,002,248 | |||
| AmerUs Group Co. | 20,000 | 961,000 | |||
| Arthur J. Gallagher & Co. | 47,500 | 1,288,675 | |||
| Brown & Brown, Inc. | 31,700 | 1,424,598 | |||
| Everest Re Group Ltd. | 28,700 | 2,669,100 | |||
| Fidelity National Financial, Inc. | 88,083 | 3,143,681 | |||
| First American Financial Corp. | 43,800 | 1,758,132 | |||
| HCC Insurance Holdings, Inc. | 35,600 | 1,348,172 | |||
| Horace Mann Educators Corp. | 21,900 | 412,158 | |||
| Leucadia National Corp. | 48,250 | 1,863,898 | |||
| Ohio Casualty Corp. | 31,900 | 771,342 | |||
| Old Republic International Corp. | 93,150 | 2,355,764 | |||
| Protective Life Corp. | 35,500 | 1,498,810 | |||
| Radian Group, Inc. | 43,900 | 2,072,958 | |||
Shares or Principal Amount | Value | ||||
| COMMON STOCKS (continued) | |||||
| Insurance (continued) | |||||
| Stancorp Financial Group, Inc. | 14,300 | $ | 1,095,094 | ||
| Unitrin, Inc. | 29,600 | 1,453,360 | |||
| W.R. Berkley Corp. | 60,800 | 2,169,344 | |||
| 28,297,182 | |||||
| Machinery (0.7%) | |||||
| AGCO Corp. (b) | 46,100 | 881,432 | |||
| Graco, Inc. | 35,250 | 1,200,968 | |||
| Tecumseh Products Co. | 9,400 | 257,936 | |||
| Zebra Technologies Corp., Class A (b) | 36,700 | 1,607,093 | |||
| 3,947,429 | |||||
| Manufacturing (3.1%) | |||||
| Ametek, Inc. | 35,500 | 1,485,675 | |||
| Brink’s Co. (The) | 28,900 | 1,040,400 | |||
| Carlisle Cos., Inc. | 15,900 | 1,091,217 | |||
| Crane Co. | 28,200 | 741,660 | |||
| Diebold, Inc. | 36,400 | 1,642,004 | |||
| Donaldson Co., Inc. | 38,800 | 1,176,804 | |||
| Federal Signal Corp. | 24,700 | 385,320 | |||
| Flowserve Corp. (b) | 28,200 | 853,332 | |||
| Harsco Corp. | 21,200 | 1,156,460 | |||
| Hillenbrand Industry, Inc. | 29,800 | 1,506,390 | |||
| Nordson Corp. | 16,700 | 572,476 | |||
| Pentair, Inc. | 51,800 | 2,217,558 | |||
| Teleflex, Inc. | 19,700 | 1,169,589 | |||
| Trinity Industries, Inc. | 21,700 | 695,051 | |||
| Varian, Inc. (b) | 17,400 | 657,546 | |||
| York International Corp. | 21,400 | 813,200 | |||
| 17,204,682 | |||||
| Medical Products (0.9%) | |||||
| Gen-Probe, Inc. (b) | 25,800 | 934,734 | |||
| INAMED Corp. (b) | 18,400 | 1,232,248 | |||
| Invitrogen Corp. (b) | 26,500 | 2,207,185 | |||
| Techne Corp. (b) | 19,600 | 899,836 | |||
| 5,274,003 | |||||
| Medical Services (0.4%) | |||||
| Charles River Laboratories International, Inc. (b) | 34,000 | 1,640,500 | |||
| Martek Biosciences Corp. (b) | 16,100 | 610,995 | |||
| 2,251,495 | |||||
| Metals (0.2%) | |||||
| Kennametal, Inc. | 19,400 | 889,490 | |||
8
Table of Contents
GARTMORE VARIABLE INSURANCE TRUST
DREYFUS GVIT MID CAP INDEX FUND
Statement of Investments — June 30, 2005 (Unaudited) (continued)
Shares or Principal Amount | Value | ||||
| COMMON STOCKS (continued) | |||||
| Mining (0.9%) | |||||
| Arch Coal, Inc. | 32,300 | $ | 1,759,381 | ||
| Peabody Energy Corp. | 60,700 | 3,158,828 | |||
| 4,918,209 | |||||
| Office Equipment & Supplies (0.6%) | |||||
| Hni Corp. | 26,400 | 1,350,360 | |||
| Miller (Herman), Inc. | 35,900 | 1,107,156 | |||
| Reynolds & Reynolds Co. | 29,400 | 794,682 | |||
| 3,252,198 | |||||
| Oil & Gas (7.2%) | |||||
| Cooper Cameron Corp. (b) | 28,000 | 1,737,400 | |||
| ENSCO International, Inc. | 77,400 | 2,767,050 | |||
| FMC Technologies, Inc. (b) | 35,221 | 1,126,015 | |||
| Forest Oil Corp. (b) | 28,800 | 1,209,600 | |||
| Grant Prideco, Inc. (b) | 63,500 | 1,679,575 | |||
| Hanover Compressor Co. (b) | 39,900 | 459,249 | |||
| Helmerich & Payne, Inc. | 26,100 | 1,224,612 | |||
| Murphy Oil Corp. | 89,300 | 4,664,139 | |||
| Newfield Exploration Co. (b) | 64,400 | 2,568,916 | |||
| Noble Energy, Inc. | 44,400 | 3,358,860 | |||
| Patterson-UTI Energy, Inc. | 86,500 | 2,407,295 | |||
| Pioneer Natural Resources Co. | 73,400 | 3,088,672 | |||
| Plains Exploration & Production Co. (b) | 39,500 | 1,403,435 | |||
| Pogo Producing Co. | 31,100 | 1,614,712 | |||
| Pride International, Inc. (b) | 74,900 | 1,924,930 | |||
| Smith International, Inc. | 54,100 | 3,446,170 | |||
| Tidewater, Inc. | 31,000 | 1,181,720 | |||
| Weatherford International Ltd. (b) | 70,500 | 4,087,590 | |||
| 39,949,940 | |||||
| Optical Supplies (0.2%) | |||||
| Advanced Medical Optics, Inc. (b) | 33,186 | 1,319,144 | |||
| Paper & Forest Products (0.7%) | |||||
| Bowater, Inc. | 28,500 | 922,545 | |||
| Glatfelter | 19,100 | 236,840 | |||
| Longview Fibre Co. | 26,000 | 534,300 | |||
| Potlatch Corp. | 14,800 | 774,484 | |||
| Rayonier, Inc. | 25,618 | 1,358,523 | |||
| 3,826,692 | |||||
| Pharmaceuticals (0.5%) | |||||
| IVAX Corp. (b) | 118,206 | 2,541,429 | |||
Shares or Principal Amount | Value | ||||
| COMMON STOCKS (continued) | |||||
| Photography & Imaging (0.1%) | |||||
| Imation Corp. | 17,100 | $ | 663,309 | ||
| Publishing & Printing (1.8%) | |||||
| American Greetings Corp., Class A | 34,900 | 924,850 | |||
| Banta Corp. | 12,600 | 571,536 | |||
| Belo Corp., Class A | 54,500 | 1,306,365 | |||
| Lee Enterprises, Inc. | 23,100 | 926,079 | |||
| Media General, Inc. | 12,200 | 790,072 | |||
| Readers Digest Association | 50,800 | 838,200 | |||
| Scholastic Corp. (b) | 19,100 | 736,305 | |||
| Valassis Communications, Inc. (b) | 25,500 | 944,775 | |||
| Washington Post Co. | 3,570 | 2,981,057 | |||
| 10,019,239 | |||||
| Real Estate Investment Trusts (3.0%) | |||||
| AMB Property Corp. | 42,900 | 1,863,147 | |||
| Developers Diversified Realty Corp. | 55,400 | 2,546,184 | |||
| Highwood Properties, Inc. | 27,400 | 815,424 | |||
| Hospitality Properties Trust | 34,400 | 1,516,008 | |||
| Liberty Property Trust | 44,400 | 1,967,364 | |||
| Mack-Cali Realty Corp. | 28,900 | 1,309,170 | |||
| New Plan Excel Realty Trust | 52,600 | 1,429,142 | |||
| Regency Centers Corp. | 32,200 | 1,841,840 | |||
| United Dominion Realty Trust, Inc. | 69,800 | 1,678,690 | |||
| Weingarten Realty Investors | 43,200 | 1,694,304 | |||
| 16,661,273 | |||||
| Restaurants (1.4%) | |||||
| Applebee’s International, Inc. | 41,350 | 1,095,362 | |||
| Bob Evans Farms, Inc. | 18,000 | 419,760 | |||
| Brinker International, Inc. (b) | 45,200 | 1,810,259 | |||
| CBRL Group, Inc. | 23,900 | 928,754 | |||
| Cheesecake Factory, Inc. (The) (b) | 39,850 | 1,383,991 | |||
| Outback Steakhouse, Inc. | 34,700 | 1,569,828 | |||
| Ruby Tuesday, Inc. | 32,900 | 852,110 | |||
| 8,060,064 | |||||
| Retail (7.7%) | |||||
| 99 Cents Only Stores (b) | 30,100 | 382,571 | |||
| Abercrombie & Fitch Co. | 44,000 | 3,022,800 | |||
| Aeropostale, Inc. (b) | 28,300 | 950,880 | |||
| American Eagle Outfitters Ltd. | 70,700 | 2,166,955 | |||
| Anntaylor Stores Corp. (b) | 37,200 | 903,216 | |||
| Barnes & Noble, Inc. (b) | 32,200 | 1,249,360 | |||
| BJ’s Wholesale Club, Inc. (b) | 34,900 | 1,133,901 | |||
9
Table of Contents
GARTMORE VARIABLE INSURANCE TRUST
DREYFUS GVIT MID CAP INDEX FUND
Statement of Investments — June 30, 2005 (Unaudited) (continued)
Shares or Principal Amount | Value | ||||
| COMMON STOCKS (continued) | |||||
| Retail (continued) | |||||
| Borders Group, Inc. | 36,200 | $ | 916,222 | ||
| Chico’s FAS, Inc. (b) | 92,000 | 3,153,760 | |||
| Claire’s Stores, Inc. | 50,600 | 1,216,930 | |||
| Copart, Inc. (b) | 40,900 | 973,420 | |||
| Dollar Tree Stores, Inc. (b) | 55,350 | 1,328,400 | |||
| Fastenal Co. | 34,800 | 2,131,848 | |||
| Foot Locker, Inc. | 79,900 | 2,174,878 | |||
| Michael’s Stores, Inc. | 69,100 | 2,858,667 | |||
| Nieman Marcus Group, Inc. | 25,000 | 2,423,000 | |||
| O’Reilly Automotive, Inc. (b) | 53,900 | 1,606,759 | |||
| Pacific Sunwear of California, Inc. (b) | 38,300 | 880,517 | |||
| Payless Shoesource, Inc. (b) | 34,400 | 660,480 | |||
| PETsMART, Inc. | 73,200 | 2,221,620 | |||
| Pier 1 Imports, Inc. | 43,900 | 622,941 | |||
| Regis Corp. | 22,900 | 894,932 | |||
| Ross Stores, Inc. | 75,100 | 2,171,141 | |||
| Ruddick Corp. | 23,000 | 587,190 | |||
| Saks, Inc. (b) | 71,200 | 1,350,664 | |||
| Tech Data Corp. (b) | 30,000 | 1,098,300 | |||
| Urban Outfitters, Inc. (b) | 33,400 | 1,893,446 | |||
| Williams Sonoma, Inc. (b) | 59,100 | 2,338,587 | |||
| 43,313,385 | |||||
| Schools (0.7%) | |||||
| Education Management Corp. (b) | 34,900 | 1,177,177 | |||
| ITT Educational Services, Inc. (b) | 23,500 | 1,255,370 | |||
| Laureate Education, Inc. (b) | 25,200 | 1,206,072 | |||
| 3,638,619 | |||||
| Semiconductors (0.5%) | |||||
| Fairchild Semiconductor International, Inc. (b) | 61,000 | 899,750 | |||
| Integrated Circuit Systems, Inc. (b) | 35,700 | 736,848 | |||
| Semtech Corp. (b) | 37,700 | 627,705 | |||
| Silicon Laboratories, Inc. (b) | 23,200 | 608,072 | |||
| 2,872,375 | |||||
| Shipping & Transportation (2.4%) | |||||
| Alexander & Baldwin, Inc. | 22,300 | 1,033,605 | |||
| CNF Transportation, Inc. | 26,800 | 1,203,320 | |||
| Expeditors International of Washington, Inc. | 54,400 | 2,709,664 | |||
| GATX Corp. | 25,500 | 879,750 | |||
| Hunt (J.B.) Transport Services, Inc. | 69,500 | 1,341,350 | |||
| Overseas Shipholding Group, Inc. | 17,700 | 1,055,805 | |||
Shares or Principal Amount | Value | ||||
| COMMON STOCKS (continued) | |||||
| Shipping & Transportation (continued) | |||||
| Robinson (C.H.) Worldwide, Inc. | 43,700 | $ | 2,543,340 | ||
| Swift Transportation Co., Inc. (b) | 31,700 | 738,293 | |||
| Werner Enterprises, Inc. | 32,350 | 635,354 | |||
| Yellow Roadway Corp. (b) | 29,300 | 1,488,440 | |||
| 13,628,921 | |||||
| Steel (0.2%) | |||||
| Steel Dynamics, Inc. | 21,000 | 551,250 | |||
| Worthington Industries, Inc. | 40,800 | 644,640 | |||
| 1,195,890 | |||||
| Utilities (7.5%) | |||||
| AGL Resources, Inc. | 39,300 | 1,518,945 | |||
| Alliant Energy Corp. | 59,300 | 1,669,295 | |||
| Aqua America, Inc. | 48,800 | 1,451,312 | |||
| Aquila, Inc. (b) | 123,300 | 445,113 | |||
| Black Hills Corp. | 16,600 | 611,710 | |||
| DPL, Inc. | 64,500 | 1,770,525 | |||
| Duquesne Light Holdings, Inc. | 39,500 | 737,860 | |||
| Energy East Corp. | 75,100 | 2,176,398 | |||
| Equitable Resources, Inc. | 31,100 | 2,114,800 | |||
| Great Plains Energy, Inc. | 38,000 | 1,211,820 | |||
| Hawaiian Electric Industries, Inc. | 41,200 | 1,104,572 | |||
| Idacorp, Inc. | 21,500 | 658,545 | |||
| MDU Resources Group, Inc. | 60,400 | 1,701,468 | |||
| National Fuel Gas Co. | 40,000 | 1,156,400 | |||
| Northeast Utilities | 66,000 | 1,376,760 | |||
| NSTAR | 54,400 | 1,677,152 | |||
| Oklahoma Gas & Electric Co. | 46,000 | 1,331,240 | |||
| Oneok, Inc. | 52,000 | 1,697,800 | |||
| Pepco Holdings, Inc. | 96,238 | 2,303,938 | |||
| PNM, Inc. | 35,150 | 1,012,672 | |||
| Puget Energy, Inc. | 51,000 | 1,192,380 | |||
| Questar Corp. | 43,200 | 2,846,879 | |||
| Scana Corp. | 57,900 | 2,472,909 | |||
| Sierra Pacific Resources (b) | 59,900 | 745,755 | |||
| Vectren Corp. | 38,800 | 1,114,724 | |||
| Westar Energy, Inc. | 44,200 | 1,062,126 | |||
| Western Gas Resources, Inc. | 32,900 | 1,148,210 | |||
| WGL Holdings, Inc. | 24,800 | 834,272 | |||
| Wisconsin Energy Corp. | 59,600 | 2,324,401 | |||
| WPS Resources Corp. | 19,300 | 1,085,625 | |||
| 42,555,606 | |||||
| Veterinary Diagnostics (0.2%) | |||||
| VCA Antech, Inc. (b) | 39,000 | 945,750 | |||
10
Table of Contents
GARTMORE VARIABLE INSURANCE TRUST
DREYFUS GVIT MID CAP INDEX FUND
Statement of Investments — June 30, 2005 (Unaudited) (continued)
Shares or Principal Amount | Value | |||||
| COMMON STOCKS (continued) | ||||||
| Waste Disposal (0.6%) | ||||||
| Republic Services, Inc. | 65,800 | $ | 2,369,458 | |||
| Stericycle, Inc. (b) | 22,500 | 1,132,200 | ||||
| 3,501,658 | ||||||
| Total Common Stocks | 548,274,129 | |||||
| TREASURY BILL (0.1%) | ||||||
| US Treasuries (0.1%) | ||||||
| U.S. Treasury Bill, 2.97%, 09/22/05 | $ | 360,000 | 357,503 | |||
| Total Treasury Bill | 357,503 | |||||
| CASH EQUIVALENTS (1.4%) | ||||||
| Investments in repurchase agreements (Collateralized by AA Corporate Bonds, in a joint trading account at 3.34%, dated 06/30/05, due 07/01/05, repurchase price $7,889,460) | 7,888,728 | 7,888,728 | ||||
| Total Cash Equivalents | 7,888,728 | |||||
Shares or Principal Amount | Value | ||||||
| SHORT-TERM SECURITIES HELD AS COLLATERAL FOR SECURITIES LENDING (21.6%) | |||||||
| Pool of short-term securities for Gartmore Variable Trust Funds — note 2 (Securities Lending) | $ | 120,005,144 | $ | 120,005,144 | |||
| Total Short-Term Securities Held as Collateral for Securities Lending | 120,005,144 | ||||||
| Total Investments (Cost $573,638,443) (a) — 121.5% | 676,525,504 | ||||||
| Liabilities in excess of other assets — (21.5)% | (119,719,505 | ) | |||||
| NET ASSETS — 100.0% | $ | 556,805,999 | |||||
| (a) | See notes to financial statements for tax unrealized appreciation (depreciation) of securities. |
| (b) | Denotes a non-income producing security |
| (c) | Pledged as collateral for futures. |
At June 30, 2005 the Fund’s open futures contracts were as follows:
Number of Contracts | Long Contract | Expiration | Market Value Covered by Contracts | Unrealized Depreciation at 06/30/05 | |||||||
128 | S&P 400 Mini Midcap 400 Future | 09/22/05 | $ | 8,810,880.00 | $ | (14,570 | ) | ||||
See notes to financial statements.
11
Table of Contents
GARTMORE VARIABLE INSURANCE TRUST
DREYFUS GVIT MID CAP INDEX FUND
Statement of Assets and Liabilities
June 30, 2005 (Unaudited)
Assets: | ||||
Investments, at value (cost $565,749,715) | $ | 668,636,776 | ||
Repurchase agreements, at cost and value | 7,888,728 | |||
Total Investments | 676,525,504 | |||
Cash | 4,910 | |||
Interest and dividends receivable | 361,649 | |||
Receivable for investments sold | 142,999 | |||
Prepaid expenses and other assets | 35,622 | |||
Total Assets | 677,070,684 | |||
Liabilities: | ||||
Payable for variation margin on futures contracts | 30,830 | |||
Payable for return of collateral received for securities on loan | 120,005,144 | |||
Accrued expenses and other payables: | ||||
Investment advisory fees | 129,850 | |||
Fund administration and transfer agent fees | 16,837 | |||
Distribution fees | 3,907 | |||
Administrative servicing fees | 62,225 | |||
Other | 15,892 | |||
Total Liabilities | 120,264,685 | |||
Net Assets | $ | 556,805,999 | ||
Represented by: | ||||
Capital | $ | 456,176,559 | ||
Accumulated net investment income (loss) | 812,126 | |||
Accumulated net realized gain (losses) from investment and futures transactions | (3,055,173 | ) | ||
Net unrealized appreciation (depreciation) on investments and futures | 102,872,487 | |||
Net Assets | $ | 556,805,999 | ||
Net Assets: | ||||
Class I Shares | $ | 537,233,189 | ||
Class II Shares | 19,572,810 | |||
Total | $ | 556,805,999 | ||
Shares outstanding (unlimited number of shares authorized): | ||||
Class I Shares | 31,595,250 | |||
Class II Shares | 1,154,790 | |||
Total | 32,750,040 | |||
Net asset value and offering price per share:* | ||||
Class I Shares | $ | 17.00 | ||
Class II Shares | $ | 16.95 |
| * | Not subject to a front-end sales charge. |
For the Six Months Ended June 30, 2005 (Unaudited)
Investment Income: | ||||
Interest income | $ | 92,119 | ||
Dividend income | 3,923,094 | |||
Income from securities lending | 118,692 | |||
Total Income | 4,133,905 | |||
Expenses: | ||||
Investment advisory fees | 767,840 | |||
Fund administration and transfer agent fees | 175,402 | |||
Distribution fees Class II Shares | 20,235 | |||
Administrative servicing fees Class I Shares | 379,675 | |||
Administrative servicing fees Class II Shares | 7,237 | |||
Other** | 88,886 | |||
Total Expenses | 1,439,275 | |||
Net Investment Income (Loss) | 2,694,630 | |||
REALIZED/UNREALIZED GAINS (LOSSES) ON INVESTMENTS: | ||||
Net realized gains (losses) on investment transactions | 9,599,191 | |||
Net realized gains (losses) on futures | (199,531 | ) | ||
Net realized gains (losses) on investment and futures transactions | 9,399,660 | |||
Net change in unrealized appreciation/depreciation on investments and futures | 6,172,636 | |||
Net realized/unrealized gains (losses) on investments and futures | 15,572,296 | |||
CHANGE IN NET ASSETS RESULTING FROM OPERATIONS | $ | 18,266,926 | ||
| ** | Other expenses may include the following fees: audit, custody, insurance, legal, printing, trustee, and out-of-pocket expenses. |
See notes to financial statements.
12
Table of Contents
GARTMORE VARIABLE INSURANCE TRUST
DREYFUS GVIT MID CAP INDEX FUND
Statement of Changes in Net Assets
Six Months Ended June 30, 2005 | Year Ended December 31, 2004 | |||||||
| (Unaudited) | ||||||||
From Investment Activities: | ||||||||
Operations: | ||||||||
Net investment income (loss) | $ | 2,694,630 | $ | 2,968,699 | ||||
Net realized gains (losses) on investment and futures transactions | 9,399,660 | 20,689,475 | ||||||
Net change in unrealized appreciation /depreciation on investments and futures | 6,172,636 | 48,685,578 | ||||||
Change in net assets resulting from operations | 18,266,926 | 72,343,752 | ||||||
Distributions to Class I shareholders from: | ||||||||
Net investment income | (2,151,250 | ) | (2,597,273 | ) | ||||
Net realized gains on investments | (4,309,837 | ) | (12,427,707 | ) | ||||
Distributions to Class II shareholders from: | ||||||||
Net investment income | (56,885 | ) | (46,325 | ) | ||||
Net realized gains on investments | (157,445 | ) | (357,541 | ) | ||||
Change in net assets from shareholder distributions | (6,675,417 | ) | (15,428,846 | ) | ||||
Change in net assets from capital transactions | (2,626,554 | ) | 50,287,716 | |||||
Change in net assets | 8,964,955 | 107,202,622 | ||||||
Net Assets: | ||||||||
Beginning of period | 547,841,044 | 440,638,422 | ||||||
End of period | $ | 556,805,999 | $ | 547,841,044 | ||||
CAPITAL TRANSACTIONS: | ||||||||
Class I Capital Transactions: | ||||||||
Proceeds from shares issued | $ | 43,542,780 | $ | 92,861,658 | ||||
Dividends reinvested | 6,461,063 | 15,024,967 | ||||||
Cost of shares redeemed | (56,380,413 | ) | (63,446,695 | ) | ||||
| (6,376,570 | ) | 44,439,930 | ||||||
Class II Capital Transactions: | ||||||||
Proceeds from shares issued | 5,783,335 | 9,656,717 | ||||||
Dividends reinvested | 214,330 | 403,865 | ||||||
Cost of shares redeemed | (2,247,649 | ) | (4,212,796 | ) | ||||
| 3,750,016 | 5,847,786 | |||||||
Change in net assets from capital transactions | $ | (2,626,554 | ) | $ | 50,287,716 | |||
SHARE TRANSACTIONS: | ||||||||
Class I Share Transactions: | ||||||||
Issued | 2,621,537 | 6,041,748 | ||||||
Reinvested | 385,875 | 915,623 | ||||||
Redeemed | (3,462,960 | ) | (4,194,943 | ) | ||||
| (455,548 | ) | 2,762,428 | ||||||
Class II Share Transactions: | ||||||||
Issued | 351,952 | 634,817 | ||||||
Reinvested | 12,830 | 24,589 | ||||||
Redeemed | (137,793 | ) | (278,161 | ) | ||||
| 226,989 | 381,245 | |||||||
See notes to financial statements.
13
Table of Contents
GARTMORE VARIABLE INSURANCE TRUST
Selected Data for Each Share of Capital Outstanding
Dreyfus GVIT Mid Cap Index Fund
| Investment Activities | Distributions | Ratios/Supplemental Data | |||||||||||||||||||||||||||||||||||||||||
| Net Asset Value, Beginning of Period | Net Investment Income (Loss) | Net Realized and Unrealized Gains (Losses) on Investments | Total from Investment Activities | Net Investment Income | Net Realized Gains (Losses) | Total Distributions | Net Asset Value, End of Period | Total Return | Net Assets at End of Period (000s) | Ratio of Expenses to Average Net Assets | Ratio of Net Investment Income (Loss) to Average Net Assets | Ratio of (Prior to Net Assets(a) | Ratio of Net Net Assets(a) | Portfolio Turnover(b) | |||||||||||||||||||||||||||||
Class I Shares | |||||||||||||||||||||||||||||||||||||||||||
Year Ended December 31, 2000 | $ | 12.32 | 0.07 | 1.79 | 1.86 | (0.09 | ) | (0.54 | ) | (0.63 | ) | $ | 13.55 | 15.21% | $ | 145,350 | 0.65% | 0.68% | 0.90% | 0.43% | 83.45% | ||||||||||||||||||||||
Year Ended December 31, 2001(c) | $ | 13.55 | 0.07 | (0.25 | ) | (0.18 | ) | (0.07 | ) | (0.13 | ) | (0.20 | ) | $ | 13.17 | (1.30% | ) | $ | 257,623 | 0.65% | 0.53% | 0.78% | 0.40% | 28.43% | |||||||||||||||||||
Year Ended December 31, 2002 | $ | 13.17 | 0.04 | (2.05 | ) | (2.01 | ) | (0.04 | ) | (0.10 | ) | (0.14 | ) | $ | 11.02 | (15.30% | ) | $ | 285,970 | 0.74% | 0.37% | 0.75% | 0.36% | 27.32% | |||||||||||||||||||
Year Ended December 31, 2003 | $ | 11.02 | 0.06 | 3.75 | 3.81 | (0.06 | ) | (e | ) | (0.06 | ) | $ | 14.77 | 34.65% | $ | 432,589 | 0.74% | 0.49% | (h | ) | (h | ) | 11.58% | ||||||||||||||||||||
Year Ended December 31, 2004 | $ | 14.77 | 0.09 | 2.23 | 2.32 | (0.08 | ) | (0.40 | ) | (0.48 | ) | $ | 16.61 | 15.73% | $ | 532,474 | 0.60% | 0.62% | (h | ) | (h | ) | 15.90% | ||||||||||||||||||||
Six Months Ended June 30, 2005 (Unaudited) | $ | 16.61 | 0.09 | 0.51 | 0.60 | (0.07 | ) | (0.14 | ) | (0.21 | ) | $ | 17.00 | 3.67% | (f) | $ | 537,233 | 0.53% | (g) | 1.02% | (g) | (h | ) | (h | ) | 7.36% | |||||||||||||||||
Class II Shares | |||||||||||||||||||||||||||||||||||||||||||
Period Ended December 31, 2002(d) | $ | 13.64 | 0.02 | (2.53 | ) | (2.51 | ) | (0.03 | ) | (0.10 | ) | (0.13 | ) | $ | 11.00 | (18.44% | )(f) | $ | 1,232 | 0.96% | (g) | 0.25% | (g) | (h | ) | (h | ) | 27.32% | |||||||||||||||
Year Ended December 31, 2003 | $ | 11.00 | 0.03 | 3.74 | 3.77 | (0.04 | ) | (e | ) | (0.04 | ) | $ | 14.73 | 34.30% | $ | 8,049 | 0.98% | 0.27% | (h | ) | (h | ) | 11.58% | ||||||||||||||||||||
Year Ended December 31, 2004 | $ | 14.73 | 0.07 | 2.22 | 2.29 | (0.06 | ) | (0.40 | ) | (0.46 | ) | $ | 16.56 | 15.50% | $ | 15,367 | 0.78% | 0.45% | (h | ) | (h | ) | 15.90% | ||||||||||||||||||||
Six Months Ended June 30, 2005 (Unaudited) | $ | 16.56 | 0.06 | 0.52 | 0.58 | (0.05 | ) | (0.14 | ) | (0.19 | ) | $ | 16.95 | 3.60% | (f) | $ | 19,573 | 0.72% | (g) | 0.82% | (g) | (h | ) | (h | ) | 7.36% | |||||||||||||||||
| (a) | During the period certain fees were waived and/or reimbursed. If such waivers/reimbursements had not occurred, the ratios would have been as indicated. |
| (b) | Portfolio turnover is calculated on the basis of the Fund as a whole without distinguishing among the classes of shares. |
| (c) | The existing shares of the Fund were designated Class I shares as of May 1, 2001. |
| (d) | For the period from May 6, 2002 (commencement of operations) through December 31, 2002. |
| (e) | The amount is less than $0.005. |
| (f) | Not annualized. |
| (g) | Annualized. |
| (h) | There were no fee reductions during the period. |
See notes to financial statements.
14
Table of Contents
GARTMORE VARIABLE INSURANCE TRUST
NOTES TO FINANCIAL STATEMENTS (Unaudited)
June 30, 2005
1. Organization
Gartmore Variable Insurance Trust (“GVIT” or the “Trust”) is an open-end management investment company, organized under the laws of Delaware by an amended and restated Agreement and Declaration of Trust, dated October 28, 2004, as amended to date. The Trust, originally created under the laws of Massachusetts as a Massachusetts business trust pursuant to a Declaration of Trust dated, as of June 30, 1981, as subsequently amended, redomesticated as a Delaware Statutory Trust after the close of trading on April 29, 2005, and is registered under the Investment Company Act of 1940, as amended (the “1940 Act”). The redomestication is a change in statutory status and does not affect the operations of the Trust. As of June 30, 2005, the Trust had authorized an unlimited number of shares of beneficial interest (“shares”) without par value. The Trust currently offers shares to life insurance company separate accounts to fund the benefits under variable life insurance or annuity policies. To date, only the separate accounts of Nationwide Life Insurance Company and Nationwide Life and Annuity Insurance Company (collectively, “Nationwide”) and Great West Life & Annuity Insurance Company have purchased shares of the Trust’s series. The Trust operates thirty-one (31) separate series, or mutual funds, each with its own investment objectives and strategies. This report contains the financial statements and financial highlights of the Dreyfus GVIT Mid Cap Index Fund (the “Fund”).
Under the Trust’s organizational documents, the Trust’s officers and trustees are indemnified against certain liabilities arising out of the performance of their duties to the Trust. In addition, the Trust has entered into Indemnification Agreements with the Trust’s trustees and certain officers covering similar liabilities. In addition, in the normal course of business, the Trust enters into contracts with its vendors and others that provide for general indemnifications. The Trust’s maximum exposure under these arrangements is unknown, as this would involve future claims that may be made against the Trust. Based on experience, however, the Trust expects that risk of loss to be remote.
2. Summary of Significant Accounting Policies
The following is a summary of significant accounting policies followed by the Fund in the preparation of its financial statements. The policies are in conformity with accounting principles generally accepted in the United States of America (“GAAP”). The preparation of financial statements requires management to make estimates and assumptions that affect the reported amounts of assets and liabilities, the disclosure of contingent assets and liabilities at the date of the financial statements, and the reported amounts of income and expenses for the period. Actual results could differ from those estimates.
| (a) | Security Valuation |
Securities for which market quotations are readily available are valued at current market value as of “Valuation Time.” Valuation Time is as of the close of regular trading on the New York Stock Exchange (usually 4 p.m. Eastern time). Equity securities are valued at the last quoted sale price or, if there is no sale price, the last quoted bid price provided by an independent pricing service approved by the Trust’s Board of Trustees. Securities traded on NASDAQ are valued at the NASDAQ official closing price. Prices are taken from the primary market or exchange in which each security trades. Most securities listed on a foreign exchange are valued either at fair value (see description below) or at the last sale price at the close of the exchange on which the security is principally traded. Foreign securities, currencies and other assets and liabilities denominated in foreign currencies are translated into U.S. dollars at the exchange rate of said currencies against the U.S. Dollar, as of Valuation Time, as provided by an independent pricing service approved by the Board of Trustees.
Debt and other fixed income securities (other than short-term obligations) are valued at the last quoted bid price and/or by using a combination of daily quotes and matrix evaluations provided by an independent pricing service, the use of which has been approved by the Trust’s Board of Trustees. Short-term debt securities, such as commercial paper and U.S. Treasury Bills having a remaining maturity of 60 days or less at the time of purchase, are considered to be “short-term” and are valued at amortized cost which approximates market value.
Securities for which market quotations are not readily available, or for which an independent pricing service does not provide a value or provides a value that does not represent fair value in the judgment of the Fund’s investment adviser or designee,
15
Table of Contents
GARTMORE VARIABLE INSURANCE TRUST
NOTES TO FINANCIAL STATEMENTS (Unaudited) (Continued)
June 30, 2005
are valued at fair value under procedures approved by the Fund’s Board of Trustees. The “Fair Value” of these securities is determined in good faith by taking into account the relevant factors and surrounding circumstances. Information utilized to obtain a “Fair Value” may include the following non-exclusive list of SEC acceptable methods: (i) a multiple of earnings; (ii) the discount from market value of a similar, freely traded security; (iii) the yield-to-maturity for debt issues; or (iv) a consolidation of the methods. The Gartmore Fair Value Committee considers a non-exclusive list of factors to arrive at the appropriate method upon determining “Fair Value”. For example, fair value determinations are required for securities for which market quotations are not reliable or readily available and for securities whose value is affected by a “significant” event that will materially affect the value of a domestic or foreign security which occurs subsequent to the time of the close of the principal market on which such domestic or foreign security trades and before the Valuation Time (i.e. a “subsequent event”). Typically this will involve events occurring after the close of a foreign market on which a security trades and before the next Valuation Time.
The Fund values foreign securities at fair value in the circumstances described below. Generally, trading in foreign securities markets is completed each day at various times prior to the Valuation Time. Due to the time differences between the closings of the relevant foreign securities exchanges and the Valuation Time for the Fund, the Fund will fair value its foreign investments when it is determined that the market quotations for the foreign investments either are not readily available or are unreliable and, therefore, do not represent fair value. When the fair value prices are utilized, these prices will attempt to reflect the impact of the U.S. financial markets’ perceptions and trading activities on the Fund’s foreign investments since the last closing prices of the foreign investments were calculated on their primary foreign securities markets or exchanges. For these purposes, the Board of Trustees of the Trust has determined that movements in relevant indices or other appropriate market indicators, after the close of the foreign securities exchanges, may demonstrate that market quotations are unreliable, and may trigger fair value pricing for certain securities. Consequently, fair valuation of portfolio securities may occur on a daily basis. In determining fair value prices, the Trust utilizes data furnished by an independent pricing service (and that data draws upon, among other information, the market values of foreign investments). The fair value prices of portfolio securities generally will be used when it is determined that the use of these prices will have a material impact on the net asset value of the Fund. When the Fund uses fair value pricing, the values assigned to the Fund’s foreign investments may not be the quoted or published prices of the investments on their primary markets or exchanges.
| (b) | Repurchase Agreements |
The Fund may enter into repurchase agreements with an entity which is a member of the Federal Reserve System or which is a “primary dealer” (as designated by the Federal Reserve Bank of New York) in U.S. Government obligations. The repurchase price generally equals the price paid by the Fund plus interest negotiated on the basis of current short-term rates, which may be more or less than the rate on the underlying portfolio securities. The seller under a repurchase agreement is required to maintain the value of the collateral held pursuant to the agreement at a market value equal to or greater than the repurchase price (including accrued interest). Collateral subject to repurchase agreements is held by the Fund’s custodian or another qualified sub-custodian or in the Federal Reserve/Treasury book-entry system. If the counterparty defaults and the fair value of the collateral declines, realization of the collateral by the Fund may be delayed or limited. The Fund may transfer uninvested cash balances into a pooled cash account. These balances are invested in one or more repurchase agreements, which are fully collateralized by AA-rated Corporate Bonds with the counterparties of CS First Boston and Nomura Securities.
| (c) | Foreign Currency Transactions |
The accounting records of the Fund are maintained in U.S. dollars. Foreign currency amounts are translated into U.S. dollars at the current rate of exchange to determine the value of investments, assets and liabilities. The Fund may enter into foreign currency contracts in connection with purchases or sales of securities denominated in a foreign currency. Purchases and sales of securities, and income and expenses, are translated at the prevailing rate of exchange on the respective date of these transactions. The Fund does not isolate that portion of the results of operations resulting from changes in foreign exchange rates on investments from fluctuations arising from changes in market prices of securities held. These fluctuations are included with the net realized and unrealized gain or loss from investments and foreign currencies.
16
Table of Contents
GARTMORE VARIABLE INSURANCE TRUST
NOTES TO FINANCIAL STATEMENTS (Unaudited) (Continued)
June 30, 2005
| (d) | Risks Associated with Foreign Securities and Currencies |
Investments in securities of foreign issuers carry certain risks not ordinarily associated with investments in securities of U.S. issuers. These risks include future political and economic developments, and the possible imposition of exchange controls or other foreign governmental laws and restrictions. In addition, with respect to certain countries, there is the possibility of expropriation of assets, confiscatory taxation, political or social instability, or diplomatic developments, which could adversely affect investments in those countries.
Certain countries also may impose substantial restrictions on investments in their capital markets by foreign entities, including restrictions on investments in issuers of industries deemed sensitive to relevant national interests. These factors may limit the investment opportunities available and result in a lack of liquidity and high price volatility with respect to securities of issuers from developing countries.
| (e) | Futures Contracts |
The Fund may invest in financial futures contracts (“futures contracts”) for the purpose of hedging its existing portfolio securities or securities that the Fund intends to purchase against fluctuations in value caused by changes in prevailing market interest rates or prices. Futures contracts may also be entered into for non-hedging purposes.
Upon entering into a futures contract, the Fund is required to pledge to the broker an amount of cash and/or other assets equal to a certain percentage of the contract amount (initial margin deposit). Subsequent payments, known as “variation margin,” are made each day, depending on the daily fluctuations in the fair value/market value of the underlying assets. A gain or loss equal to the daily variation margin is recognized on a daily basis. Futures contracts are valued daily at their last quoted sale price.
A “sale” of a futures contract means a contractual obligation to deliver the securities or foreign currency called for by the contract at a fixed price at a specified time in the future. A “purchase” of a futures contract means a contractual obligation to acquire the securities or foreign currency at a fixed price at a specified time in the future.
Should market conditions change unexpectedly, the Fund may not achieve the anticipated benefits of the futures contracts and may realize a loss. The use of futures transactions for hedging purposes involves the risk of imperfect correlation in movements in the price of futures contracts, interest rates, and the value of the underlying hedged assets.
| (f) | Written Options Contracts |
The Fund may write options contracts. A written option obligates the Fund to deliver (written call) or to receive (written put) a specified quantity of an underlying asset at the contract amount upon exercise by the holder of the option. The value of the option contract is recorded as a liability and unrealized gain or loss is measured by the difference between the current value and the premium received. Options traded on an exchange are valued at the last quoted sale price, or in the absence of a sale, the bid price provided by an independent pricing service approved by the Board of Trustees. Non-exchange traded options are valued using dealer supplied quotes.
| (g) | Short Sales |
The Fund is authorized to engage in short-selling of portfolio securities which obligates the Fund to replace any security that the Fund has borrowed by purchasing the security at current market value sometime in the future. The Fund will incur a loss if the price of the security increases between the date of the short sale and the date on which the Fund replaces the borrowed security. The Fund generally will realize a gain if the price of the security declines between these dates. Until the Fund replaces the borrowed security, the Fund will maintain a segregated account with cash, U.S. Government securities and/or securities held long to sufficiently cover the Fund’s short position on a daily basis. Dividends declared on securities sold short are recorded as an expense on the ex-dividend date and paid to the counterparty on the dividend pay date. The collateral for securities sold short are recorded as an expense on the ex-dividend date and paid to the counterparty on the dividend pay date. The collateral for securities sold short includes the deposits with brokers and securities held long as shown in the Statement of Investments for the Fund.
17
Table of Contents
GARTMORE VARIABLE INSURANCE TRUST
NOTES TO FINANCIAL STATEMENTS (Unaudited) (Continued)
June 30, 2005
| (h) | Security Transactions and Investment Income |
Security transactions are accounted for on the date the security is purchased or sold (“trade date”). Securities gains and losses are calculated on the identified cost basis. Interest income is recognized on the accrual basis and includes, where applicable, the amortization or accretion of premium or discount. Dividend income is recorded on the ex-dividend date.
| (i) | Securities Lending |
To generate additional income, the Fund may lend up to 33 1/3% of the Fund’s total assets pursuant to agreements, requiring that the borrower deliver cash or securities as collateral with respect to each new loan of U.S. securities, equal to at least 102% of the value of the portfolio securities loaned, and with respect to each new loan of non-U.S. securities, collateral of at least 105% of the value of the portfolio securities loaned, and thereafter requiring the borrower to mark to market the collateral on a daily basis and requiring the borrower to make up any shortfall of collateral. The Fund receives payments from borrowers equivalent to the dividends and interest that would have been earned on securities lent while simultaneously seeking to earn income on the investment of cash collateral. Collateral is marked to market daily to provide a level of collateral at least equal to the market value of securities loaned. There may be risks of delay in recovery of the securities should the borrower of the securities fail financially. Loans will be made, however, only to borrowers deemed by the Fund’s investment adviser to be of good standing and creditworthy under guidelines established by the Board of Trustees and when, in the judgment of the adviser, the consideration which can be earned currently from these securities loans justifies the attendant risks. Loans are subject to termination by the Fund or the borrower at any time, and, therefore, are not considered to be illiquid investments. JPMorgan Chase Bank serves as custodian for the securities lending program of the Fund. JPMorgan Chase Bank receives a custody fee based on the value of collateral received from borrowers.
The cash collateral received by the Fund was pooled and, at June 30, 2005, was invested in the following:
Security Type | Security Name | Market Value | Maturity Rate | Maturity Date | ||||||
| Commercial Paper | HSBC Finance Corp. | $ | 13,937,600 | 3.14 | % | 07/05/05 | ||||
| Commercial Paper | MacQuarie Bank Ltd. | 24,968,403 | 3.25 | % | 07/01/05 | |||||
| Commercial Paper | Master Fund LLC Series B | 4,983,761 | 3.17 | % | 07/14/05 | |||||
| Domestic Certificates of Deposit — Fixed | Washington Mutual Bank FA | 12,002,605 | 3.15 | % | 08/01/05 | |||||
| Funding Agreement | GE Life and Annuity | 3,500,000 | 3.32 | % | 07/14/05 | |||||
| Funding Agreement | Protective Life Insurance Company | 15,000,000 | 3.31 | % | 07/29/05 | |||||
| Master Note — Floating | CDC Financial Product Inc. | 3,100,000 | 3.54 | % | 07/01/05 | |||||
| Medium Term Note — Floating | General Electric Capital Corp. | 10,501,793 | 3.37 | % | 09/08/05 | |||||
| Money Market Fund | JPM S/L Collateral Investment | 1,000,000 | 3.26 | % | 07/01/05 | |||||
| Repurchase Agreements | Nomura Securities | 25,996,839 | 3.48 | % | 07/01/05 | |||||
| Yankee Certificates of Deposit — Floating | Canadian Imperial Bank NY | 4,999,112 | 3.52 | % | 07/01/05 | |||||
| As | of June 30, 2005, the Fund had securities with the following market values on loan: |
Market Value of | Market Value of Collateral | ||
$116,938,934 | $ | 120,005,144 | |
| (j) | Distributions to Shareholders |
Dividends from net investment income, if any, are declared and paid quarterly. Distributable net realized capital gains, if any, are declared and distributed at least annually.
Dividends and distributions to shareholders are determined in accordance with federal income tax regulations, which may differ from GAAP. These “book/tax” differences are considered either permanent or temporary in nature. In accordance with the American Institute of Certified Public Accountants (“AICPA”) Statement of Position 93-2, permanent differences (i.e., reclassification of market discounts, gain/loss, paydowns and distributions) are reclassified within the capital accounts based
18
Table of Contents
GARTMORE VARIABLE INSURANCE TRUST
NOTES TO FINANCIAL STATEMENTS (Unaudited) (Continued)
June 30, 2005
on their nature for federal income tax purposes; temporary differences do not require reclassification. These reclassifications have no effect upon the net asset value of the Fund. To the extent distributions exceed current and accumulated earnings and profits for federal income tax purposes, these distributions are reported as distributions of paid-in-capital.
| (k) | Federal Income Taxes |
It is the policy of each Fund to qualify or continue to qualify as a “regulated investment company” by complying with the provisions available to certain investment companies, as defined in applicable sections of the U.S. Internal Revenue Code, and to make distributions of net investment income and net realized capital gains sufficient to relieve the Fund from all, or substantially all, federal income taxes.
As of June 30, 2005, the tax cost of securities and the breakdown of unrealized appreciation (depreciation) for the Fund is as follows:
Tax Cost of | Unrealized Appreciation | Unrealized Depreciation | Net Unrealized Appreciation (Depreciation) | |||
$13,151,144 | $126,250,290 | $(36,514,377) | $89,735,913 |
| (l) | Allocation of Expenses, Income, and Gains and Losses |
Expenses directly attributable to the Fund are charged to the Fund. Expenses not directly attributable to the Fund are allocated proportionately among various or all funds within the Trust. For the Equity Funds, the method for allocating income, fund level expenses, and realized and unrealized gains or losses is based on the fair value of shares outstanding relative to net assets. Under this method, each class of shares participates based on the total net asset value of that class’s shares in proportion to the total net assets of the Fund. Expenses specific to a class (such as rule 12b-1 and administrative services fees) are charged to that class.
3. Transactions with Affiliates
Under the terms of the Trust’s Investment Advisory Agreement, Gartmore Mutual Fund Capital Trust (“GMF”) manages the investment of the assets and supervises the daily business affairs of the Fund. GMF is a wholly-owned subsidiary of Gartmore Global Investments, Inc. (“GGI”), a holding company. GGI is a majority-owned subsidiary of Gartmore Global Asset Management Trust (“GGAMT”). GGAMT is a wholly-owned subsidiary of Nationwide Corporation. All of the common stock of Nationwide Corporation is held by Nationwide Mutual Insurance Company (95.2%) and Nationwide Mutual Fire Insurance Company (4.8%), each of which is a mutual company owned by its policyholders. In addition, GMF provides investment management evaluation services in initially selecting and monitoring, on an ongoing basis, the performance of the Dreyfus Corporation, the Fund’s subadviser (the “subadviser”). The subadviser manages the Fund’s investments and has responsibility for making all investment decisions for the Fund.
Under the terms of the Investment Advisory Agreement, the Fund pays GMF an investment advisory fee based on that Fund’s average daily net assets. From such fees, pursuant to the subadvisory agreement, GMF pays fees to the subadviser. Additional information regarding investment advisory fees and subadvisory fees for GMF and the subadviser is as follows for the six months ended June 30, 2005:
| Fee Schedule | Total Fees | Fees Retained | Paid to Sub-adviser | |||
$0 up to $250 million | 0.30% | 0.20% | 0.10% | |||
$250 million up to $500 million | 0.29% | 0.20% | 0.09% | |||
$500 million up to $750 million | 0.28% | 0.20% | 0.08% | |||
$750 million up to $1 billion | 0.27% | 0.20% | 0.07% | |||
$1 billion and more | 0.25% | 0.20% | 0.05% |
19
Table of Contents
GARTMORE VARIABLE INSURANCE TRUST
NOTES TO FINANCIAL STATEMENTS (Unaudited) (Continued)
June 30, 2005
Under the terms of a Fund Administration and Transfer Agency Agreement, Gartmore SA Capital Trust (“GSA”) provides the Fund with various administrative and accounting services, and Gartmore Investors Services, Inc. (“GISI”), an indirect subsidiary of GSA, serves as Transfer and Dividend Disbursing Agent for the Fund. The fees for the services provided under this Agreement are calculated based on the Trust’s average daily net assets according to the fee schedule below. The fees are then allocated proportionately among all Funds within the Trust in relation to the average daily net assets of each Fund and are paid to GSA. GSA pays GISI from these fees for its services.
| Combined Fee Schedule* | ||
Up to $1 billion | 0.13% | |
$1 billion and more up to $3 billion | 0.08% | |
$3 billion and more up to $8 billion | 0.05% | |
$8 billion and more up to $10 billion | 0.04% | |
$10 billion and more up to $12 billion | 0.02% | |
$12 billion or more | 0.01% | |
| * | The assets of the Gartmore GVIT Investor Destinations Aggressive Fund, the Gartmore GVIT Investor Destinations Moderately Aggressive Fund, the Gartmore GVIT Investor Destinations Moderate Fund, the Gartmore GVIT Investor Destinations Moderately Conservative Fund, and the Gartmore GVIT Investor Destinations Conservative Fund (collectively, the “Investor Destinations Funds”) are excluded from the Trust asset level amount in order to calculate this asset-based fee. The Investor Destinations Funds do not pay any part of this fee. |
Effective January 1, 2005, the fee for the fund administration and transfer agency services increased as set forth below. The fees are calculated based on the Trust’s average daily net assets according to the fee schedule below. The fees are then allocated proportionately among all funds within the Trust in relation to the average daily net assets of each fund and are paid to GSA.
| Combined Fee Schedule* | ||
Up to $1 billion | 0.15% | |
$1 billion and more up to $3 billion | 0.10% | |
$3 billion and more up to $8 billion | 0.05% | |
$8 billion and more up to $10 billion | 0.04% | |
$10 billion and more up to $12 billion | 0.02% | |
$12 billion or more | 0.01% | |
| * | The assets of the Investor Destinations Funds are excluded from the Trust asset level amount in order to calculate this asset-based fee. The Investor Destinations Funds do not pay any part of this fee. |
GSA and GISI have entered into agreements with BISYS Fund Services Ohio, Inc. (“BISYS”), pursuant to which BISYS provides sub-administration and sub-transfer agency services, respectively, to the Fund.
Under the terms of a Distribution Plan under Rule 12b-1 of the 1940 Act, Gartmore Distribution Services, Inc. (“GDSI”), the Fund’s Distributor, is compensated by the Fund for expenses associated with the distribution of Class II shares of the Fund. These fees are based on an annual rate not to exceed 0.25% of the average daily net assets of the Class II shares of the Fund.
Under the terms of an Administrative Services Plan, the Fund may pay fees to servicing organizations, such as broker-dealers, including Nationwide Financial Services, and financial institutions, which agree to provide administrative support services to the shareholders of certain classes. These services include, but are not limited, to the following: establishing and maintaining shareholder accounts; processing purchase and redemption transactions; arranging bank wires; performing shareholder sub-accounting; answering inquires regarding the Fund; and other such services. These fees are based on an annual rate of up to 0.25% of the average daily net assets of each class of shares of the Fund.
4. Investment Transactions
For the six months ended June 30, 2005, (excluding short-term securities) the Fund had purchases of $39,154,174 and sales of $41,065,628.
20
Table of Contents
GARTMORE VARIABLE INSURANCE TRUST
NOTES TO FINANCIAL STATEMENTS (Unaudited) (Continued)
June 30, 2005
5. Bank Loans
The Trust has a credit agreement of $100,000,000. Borrowings under this arrangement bear interest at the Federal Funds rate plus 0.50%. The interest costs are included in custodian fees in the Statement of Operations. No compensation balances were required under the terms of the line of credit. There were no borrowings outstanding as of June 30, 2005.
6. Shareholder Meeting
A separate shareholders meeting was held on Tuesday, December 23, 2004, for the shareholders of the Trust’s predecessor pursuant to a Proxy Statement On Schedule 14A, dated October 29, 2004, and mailed to the shareholders of the Trust’s predecessor on or around November 5, 2004.
Two Proposals: The purpose of the December 23, 2004 meeting was to allow the shareholders of the Trust’s predecessor to vote on:
| i. | Proposal One: The election of the Trust’s Board of Trustees; and |
| ii. | Proposal Two: The approval of an “Agreement and Plan of Reorganization” that provided for the reorganization of the Trust from a Massachusetts business trust into a Delaware statutory trust. |
Proposal One: As set forth in the October 29, 2004 Proxy Statement, the nominees for election as Trustees of the Trust’s predecessor were: Charles E. Allen, Michael J. Baresich, Paula H.J. Cholmondeley, C. Brent DeVore, Phyllis Kay Dryden, Robert M. Duncan, Barbara L. Hennigar, Paul J. Hondros, Barbara I Jacobs, Thomas J. Kerr IV, Douglas F. Kridler, Michael D. McCarthy, Arden L. Shisler, and David C. Wetmore.
Proposal Two: As specifically set forth in the October 29, 2004 Proxy Statement, the Reorganization proposal requested the shareholders of the Trust’s predecessor to approve the proposed “Agreement and Plan of Reorganization” of the Trust’s predecessor (on behalf of each of the its funds) into a new Delaware-domiciled Trust, whereby the Funds of the new Delaware Trust would acquire all of the assets of the corresponding funds of the Trust’s predecessor subject to the liabilities, expenses, costs, charges, and reserves of the corresponding funds of the Trust’s predecessor (contingent or otherwise), in exchange for shares of the acquiring Funds to be distributed pro rata by the Trust to the holders of the shares of the funds of the Trust’s predecessor, in a complete liquidation of the Trust’s predecessor.
| Voting | Results: |
The shareholders of the Trust’s predecessor voted to approve both Proposal One and Proposal Two, as follows:
Proposal 1: Election of a Board of Trustees of Gartmore Variable Insurance Trust
Charles E. Allen: | ||
FOR | 2,797,230,318.955 shares (96.078%) | |
WITHHOLD | 114,195,693.660 shares (3.922%) | |
TOTAL | 2,912,726,012.615 shares (100.000%) | |
Michael J. Baresich: | ||
FOR | 2,796,135,979.559 shares (96.040%) | |
WITHHOLD | 115,290,033.056 shares (3.960%) | |
TOTAL | 2,912,726,012.615 shares (100.000%) | |
Paula H.J. Cholmondeley: | ||
FOR | 2,795,095,945.396 shares (96.004%) | |
WITHHOLD | 116,330,067.219 shares (3.996%) | |
TOTAL | 2,912,726,012.615 shares (100.000%) | |
21
Table of Contents
GARTMORE VARIABLE INSURANCE TRUST
NOTES TO FINANCIAL STATEMENTS (Unaudited) (Continued)
June 30, 2005
C. Brent DeVore: | ||
FOR | 2,797,207,046.916 shares (96.077%) | |
WITHHOLD | 114,218,965.699 shares (3.923%) | |
TOTAL | 2,912,726,012.615 shares (100.000%) | |
Phyllis Kay Dryden: | ||
FOR | 2,795,587,023.994 shares (96.021%) | |
WITHHOLD | 115,838,988.621 shares (3.979%) | |
TOTAL | 2,912,726,012.615 shares (100.000%) | |
Robert M. Duncan: | ||
FOR | 2,790,191,720.503 shares (95.836%) | |
WITHHOLD | 121,234,292.112 shares (4.164%) | |
TOTAL | 2,912,726,012.615 shares (100.000%) | |
Barbara L. Hennigar: | ||
FOR | 2,792,939,848.858 shares (95.937%) | |
WITHHOLD | 118,486,163.757 shares (4.070%) | |
TOTAL | 2,912,726,012.615 shares (100.000%) | |
Paul J. Hondros: | ||
FOR | 2,797,557,404.448 shares (96.089%) | |
WITHHOLD | 113,868,608.167 shares (3.911%) | |
TOTAL | 2,912,726,012.615 shares (100.000%) | |
Barbara I. Jacobs: | ||
FOR | 2,796,306,126.654 shares (96.046%) | |
WITHHOLD | 115,119,885.961 shares (3.954%) | |
TOTAL | 2,912,726,012.615 shares (100.000%) | |
Thomas J. Kerr IV: | ||
FOR | 2,789,755,720.087 shares (95.821%) | |
WITHHOLD | 121,670,292.528 shares (4.179%) | |
TOTAL | 2,912,726,012.615 shares (100.000%) | |
Douglas F. Kridler: | ||
FOR | 2,798,065,774.375 shares (96.106%) | |
WITHHOLD | 113,360,238.240 shares (3.894%) | |
TOTAL | 2,912,726,012.615 shares (100.000%) | |
Michael D. McCarthy: | ||
FOR | 2,797,452,613.694 shares (96.085%) | |
WITHHOLD | 113,973,395.921 shares (3.915%) | |
TOTAL | 2,912,726,012.615 shares (100.000%) | |
22
Table of Contents
GARTMORE VARIABLE INSURANCE TRUST
NOTES TO FINANCIAL STATEMENTS (Unaudited) (Continued)
June 30, 2005
Arden L. Shisler: | ||
FOR | 2,796,738,454.730 shares (96.061%) | |
WITHHOLD | 114,687,557.885 shares (3.939%) | |
TOTAL | 2,912,726,012.615 shares (100.000%) | |
David C. Wetmore: | ||
FOR | 2,794,784,752.247 shares (95.994%) | |
WITHHOLD | 116,641,260.368 shares (4.006%) | |
TOTAL | 2,912,726,012.615 shares (100.000%) | |
Proposal 2: Approval of the Agreement and Plan of Reorganization of Gartmore Variable Insurance Trust
FOR | 2,561,003,822.546 shares (87.964%) | |
AGAINST | 103,593,261.010 shares (3.558%) | |
ABSTAIN | 246,828,929.059 shares (8.478%) | |
TOTAL | 2,912,726,012.615 shares (100.000%) | |
23
Table of Contents
GARTMORE VARIABLE INSURANCE TRUST
NOTES TO FINANCIAL STATEMENTS (Unaudited) (Continued)
June 30, 2005
Trustees who are not Interested Persons (as defined in the 1940 Act) and Officers of the Funds June 30, 2005
| Name, Address and Date of Birth | Position(s) Held with the Trust and Length of Time Served1 | Principal Occupation(s) During Past 5 Years | Number of Portfolios in the Gartmore Fund Complex Overseen by Trustee | Other Directorships Held by Trustee or Nominee2 | ||||
Charles E. Allen
c/o Gartmore Global Investments, Inc. 1200 River Road, Suite 1000 Conshohocken, PA 19428
1948 | Trustee since July 2000 | Mr. Allen is Chairman, Chief Executive Officer and President of the Graimark Realty Advisors, Inc. (real estate development, investment and asset management). | 84 | None | ||||
Paula H.J. Cholmondeley
c/o Gartmore Global Investments, Inc. 1200 River Road, Suite 1000 Conshohocken, PA 19428
1940 | Trustee since July 2000 | Ms. Cholmondeley has been the Chairman and Chief Executive Officer of the Sorrel Group, a management consulting company, since January 2004. From March 2000 through December 2003, Ms. Cholmondeley was Vice President and General Manager of Sappi Fine Paper North America. Prior thereto, Ms. Cholmondeley was Vice President and General Manager of Residential Insulation of Owens Corning. | 84 | Director of Dentsply International, Inc., Ultralife Batteries, Inc., Terex Corporation, Minerals Technology, Inc. and Albany International Corp. | ||||
C. Brent DeVore
c/o Gartmore Global Investments, Inc. 1200 River Road, Suite 1000 Conshohocken, PA 19428
1940 | Trustee since 1990 | Dr. DeVore is President of Otterbein College. | 84 | None | ||||
Phyllis K. Dryden
c/o Gartmore Global Investments, Inc. 1200 River Road, Suite 1000 Conshohocken, PA 19428
1947 | Trustee since December 2004 | Ms. Dryden was a former Managing Partner of marchFIRST, a global management consulting firm prior to 2002. | 84 | None |
24
Table of Contents
GARTMORE VARIABLE INSURANCE TRUST
Management Information (Unaudited)
June 30, 2005
| Name, Address and Date of Birth | Position(s) Held with the Trust and Length of Time Served1 | Principal Occupation(s) During Past 5 Years | Number of Portfolios in the Gartmore Fund Complex Overseen by Trustee | Other Directorships Held by Trustee or Nominee2 | ||||
Barbara L. Hennigar*
c/o Gartmore Global Investments, Inc. 1200 River Road, Suite 1000 Conshohocken, PA 19428
1935 | Trustee since July 2000 | Retired since June 2000. Prior thereto, Ms. Hennigar was the Chairman or President and Chief Executive Officer of OppenheimerFunds Services and a member of the Executive Committee of OppenheimerFunds. | 84 | None | ||||
Barbara I. Jacobs
c/o Gartmore Global Investments, Inc. 1200 River Road, Suite 1000 Conshohocken, PA 19428
1950 | Trustee since December 2004 | Ms. Jacobs has served as Chairman of the Board of Directors of KICAP Network Fund, a European (United Kingdom) hedge fund, since December 2000. Prior to 2004, Ms. Jacobs was also a Managing Director and European Portfolio Manager with CREF Investments (Teachers Insurance Annuity Association — College Retirement Equity Fund). | 84 | None | ||||
Douglas F. Kridler
c/o Gartmore Global Investments, Inc. 1200 River Road, Suite 1000 Conshohocken, PA 19428
1955 | Trustee since September 1997 | Mr. Kridler has served as the President and Chief Executive Officer of the Columbus Foundation (a Columbus, OH-based foundation which manages over 1,300 individual endowment funds) since February 2002. Mr. Kridler was the President of the Columbus Association for the Performing Arts prior thereto and Chairman of the Greater Columbus Convention and Visitors Bureau during 2000 and 2001. | 84 | None | ||||
Michael D. McCarthy
c/o Gartmore Global Investments, Inc. 1200 River Road, Suite 1000 Conshohocken, PA 19428
1947 | Trustee since December 2004 | Mr. McCarthy serves as: the Founder and Chairman of The Eureka Foundation (which sponsors and funds the “Great Museums” series on PBS); and a Partner of Pineville Properties LLC (a commercial real estate development firm). | 843 | None |
25
Table of Contents
GARTMORE VARIABLE INSURANCE TRUST
Management Information (Unaudited)
June 30, 2005
| Name, Address and Date of Birth | Position(s) Held with the Trust and Length of Time Served1 | Principal Occupation(s) During Past 5 Years | Number of Portfolios in the Gartmore Fund Complex Overseen by Trustee | Other Directorships Held by Trustee or Nominee2 | ||||
David C. Wetmore
c/o Gartmore Global Investments, Inc. 1200 River Road, Suite 1000 Conshohocken, PA 19428
1948 | Trustee since 1995 and Chairman since February 2005 | Retired. Mr. Wetmore was formerly a Managing Director of Updata Capital, an investment banking and venture capital firm. | 84 | None |
| * | Pursuant to the Trust’s mandatory retirement policy, Ms. Hennigar is expected to retire on or about January 12, 2006. |
| 1 | The term of office length is until a trustee resigns or reaches a mandatory retirement age of 70. On March 2, 2000, the Board adopted a five-year implementation period for any Trustee 65 or older as of the adoption of this policy. Pursuant to this policy, Messrs. Duncan and Kerr retired as trustees effective as of March 12, 2005. |
| 2 | Directorships held in (1) any other investment companies registered under the 1940 Act, (2) any company with a class of securities registered pursuant to Section 12 of the Securities Exchange Act of 1934, as amended (the “Exchange Act”), or (3) any company subject to the requirements of Section 15(d) of the Exchange Act. |
| 3 | Mr. McCarthy was also an Administrative Committee Member for the Alphagen Arneb Fund, LLC, The Healthcare Fund LDC, The Leaders Long-Short Fund, LLC, and The Leaders Long-Short Fund LDC, four private investment companies (hedge funds) managed by GSA. Mr. McCarthy resigned as an Administrative Committee Member effective June 30, 2005. |
Trustees and Officers who are not Interested Persons (as defined in the 1940 Act) of the Funds received aggregate compensation of $274,882 from the Trust for the Six Months Ended June 30, 2005. Additional information regarding the Trustees and Officers may be found in the Trust’s statement of additional information, which is available without charge upon request, by calling 1-800-848-0920.
26
Table of Contents
GARTMORE VARIABLE INSURANCE TRUST
Management Information (Unaudited)
June 30, 2005
Trustees who are Interested Persons (as defined in the 1940 Act) and/or Officers of the Funds June 30, 2005
| Name, Address and Age | Position(s) Held with the Trust and Length of Time Served1 | Principal Occupation(s) During Past 5 Years | Number of Portfolios in the Gartmore Fund Complex Overseen by Trustee | Other Directorships Held by Trustee2 | ||||
Paul J. Hondros
Gartmore Global Investments, Inc. 1200 River Road, Suite 1000 Conshohocken, PA 19428
1948 | Trustee since July 2000 | Mr. Hondros has been President and Chief Executive Officer of various Gartmore entities, including Gartmore Distribution Services, Inc. (“GDSI”),3 Gartmore Investor Services, Inc. (“GISI”),3 Gartmore Morley Capital Management, Inc. (“GMCM”),3 Gartmore Morley Financial Services, Inc. (“GMFS”),3 NorthPointe Capital, LLC (“NorthPointe”),3 Gartmore Global Asset Management Trust (“GGAMT”)3, Gartmore Global Investments, Inc. (“GGI”)3, Gartmore Mutual Fund Capital Trust (“GMFCT”)3 and Gartmore SA Capital Trust (“GSA”)3; and a Director of Nationwide Securities, Inc.3, as well as several entities within Nationwide Financial Services, Inc. | 844 | None | ||||
Arden L. Shisler
c/o Gartmore Global Investments, Inc. 1200 River Road, Suite 1000 Conshohocken, PA 19428
1941 | Trustee since February 2000 | Mr. Shisler has been a consultant since January 2003. Prior thereto, he was President and Chief Executive Officer of K&B Transport, Inc., a trucking firm. Since 1992, Mr. Shisler has also been Chairman of the Board for Nationwide Mutual Insurance Company3. | 84 | Director of Nationwide Financial Services, Inc. | ||||
Gerald J. Holland
Gartmore Global Investments, Inc. 1200 River Road, Suite 1000 Conshohocken, PA 19428
1951 | Treasurer since March 2001 | Mr. Holland is Senior Vice President - Operations for GGI3, GMFCT3, and GSA3. Prior to July 2000, Mr, Holland was Vice President for First Data Investor Services, an investment company service provider. | 84 | None |
27
Table of Contents
GARTMORE VARIABLE INSURANCE TRUST
Management Information (Unaudited)
June 30, 2005
| Name, Address and Age | Position(s) Held with the Trust and Length of Time Served1 | Principal Occupation(s) During Past 5 Years | Number of Portfolios in the Gartmore Fund Complex Overseen by Trustee | Other Directorships Held by Trustee2 | ||||
Michael A. Krulikowski
Gartmore Global Investments, Inc. 1200 River Road, Suite 1000 Conshohocken, PA 19428
1959 | Chief Compliance Officer since June 2004 | Since November 1999, Mr. Krulikowski has served as a Vice President and Chief Compliance Officer of GGI. Prior thereto, Mr. Krulikowski served as Chief Compliance Officer of 1717 Capital Management Company/Provident Mutual Insurance Company. | 84 | None | ||||
Eric E. Miller
Gartmore Global Investments, Inc. 1200 River Road, Suite 1000 Conshohocken, PA 19428
1953 | Secretary since December 2002 | Mr. Miller is Senior Vice President, Chief Counsel for GGI3, GMFCT3 and GSA3 since August 2002. From August 2000 to August 2002, Mr. Miller was a Partner with Stradley Ronan Stevens & Young, LLP. Prior to August 2000, Mr. Miller served as Senior Vice President and Deputy General Counsel at Delaware Investments. | 84 | None |
| 1 | The term of office length is until a trustee resigns or reaches a mandatory retirement age of 70. On March 2, 2000, the Board adopted a five-year implementation period for any Trustee 65 or older as of the adoption of this policy. Pursuant to this policy, Messrs. Duncan and Kerr retired as trustees effective as of March 12, 2005. |
| 2 | Directorships held in (1) any other investment companies registered under the 1940 Act, (2) any company with a class of securities registered pursuant to Section 12 of the Securities Exchange Act of 1934, as amended (the “Exchange Act”), or (3) any company subject to the requirements of Section 15(d) of the Exchange Act. |
| 3 | This position is held with an affiliated person or principal underwriter of the Trust. |
| 4 | Mr. Hondros was also an Administrative Committee Member for the Alphagen Arneb Fund, LLC, The Healthcare Fund LDC, The Leaders Long-Short Fund, LLC, and The Leaders Long-Short Fund LDC, four private investment companies (hedge funds) managed by GSA. Mr. Hondros resigned as Administrative Committee Member effective June 30, 2005. |
Federal law requires the Trust, each of its investment advisers and sub-advisers to adopt procedures for voting proxies (“Proxy Voting Guidelines”) and to provide a summary of those Proxy Voting Guidelines used to vote the securities held by the Funds. The Funds’ proxy voting policies and procedures are available without charge (i) upon request, by calling 1-800-848-0920, (ii) on the Fund’s website at www.gartmorefunds.com, or (iii) on the Securities and Exchange Commission’s website at www.sec.gov.
28
Table of Contents
Gartmore GVIT Global Technology and Communications Fund
Semiannual Report
| | June 30, 2005 |


| Contents | ||
| 6 | Statement of Investments | |
| 8 | Statement of Assets and Liabilities | |
| 8 | Statement of Operations | |
| 9 | Statements of Changes in Net Assets | |
| 10 | Financial Highlights | |
| 11 | Notes to Financial Statements | |
Commentary provided by Gartmore Global Investments, investment adviser to Gartmore Variable Insurance Trust. All opinions and estimates included in this report constitute Gartmore Global Investments’ judgment as of the date of this report and are subject to change without notice.
Statement Regarding Availability of Quarterly Portfolio Schedule.
The Gartmore Variable Insurance Trust files complete schedules of portfolio holdings for each Fund with the Securities and Exchange Commission (the “Commission”) for the first and third quarters of each fiscal year on Form N-Q. The Funds’ Forms N-Q are available on the Commission’s website at http://www.sec.gov. The Funds’ Forms N-Q may be reviewed and copied at the Commission’s Public Reference Room in Washington, DC, and information on the operation of the Public Reference Room may be obtained by calling 800-SEC-0330; and the Funds make the information on Form N-Q available to shareholders upon request without charge.
Statement Regarding Availability of Proxy Voting Record.
Information regarding how the Fund voted proxies relating to portfolio securities held during the most recent 12-month period ended June 30, 2005 is available without charge, upon request, by calling 800-848-0920, and on the Commission’s website at http://www.sec.gov.
Table of Contents
Gartmore GVIT Global Technology and Communications Fund
On Jan. 4, 2005, Portfolio Manager Chip Zhu took over full responsibility of the Fund due to the departure of former co-Portfolio Manager Aaron Harris. The Fund has been repositioned to have a small- to mid-cap bias with stock selection focused on more valuation-sensitive securities. The industry risk, tracking error and beta—the measurement of the fund’s volatility as compared to that of the fund’s benchmark index—have been reduced, and the emphasis is on stock selection to add value.
For the semiannual period ended June 30, 2005, the Gartmore GVIT Global Technology and Communications Fund returned -11.89% (Class I at NAV) versus -7.55% for its benchmark, the Goldman Sachs Technology Composite Index (GSTI®).
Global technology and communications stocks struggled during the reporting period, even a decent rally in May was not enough to overcome declines suffered in January, March and April. In relation to the Fund’s benchmark, the biggest negative was the Fund’s significant overweighting in the Internet software and services group. In the first week of 2005, the prices of stocks in this group suddenly fell, putting the Fund’s performance behind that of the benchmark by almost five percentage points. On the positive side, Fund performance benefited from the Fund’s underweight positions in the communications equipment group as well as in Internet and catalog retailing.
In January, with the change in portfolio management noted above, the Fund’s holdings began to be restructured to implement an investment strategy which should improve results for the long term. A shift occurred from a thematic management style, which uses a top-down approach focusing on various themes or ideas offering potentially above-average growth, to a greater emphasis on fundamental, bottom-up stock selection. This transition led to the sale of certain stocks that appeared overvalued or that lacked superior growth characteristics. One liquidated position that nevertheless detracted significantly from the Fund’s performance was Sonus Networks, Inc. Also hurting performance were TIBCO Software Inc. and eBay Inc., one of the stocks in which the Fund carried an overweight exposure early in the reporting period, when Internet shares suffered steep declines.
After missing its fourth-quarter earnings estimates, eBay lowered its guidance for the first quarter and all of 2005, citing higher advertising costs as the major factor cutting into profits. Toward the end of the period the Fund purchased more eBay, but it remained an underweight position, which reflected concern about the stock’s valuation.
The share price of security software provider Symantec Corp., another of the Fund’s detractors, sank due to investors’ skepticism about the company’s plan to acquire VERITAS Software Corp.
Although the Fund’s emphasis on mid- and small-cap stocks increased during the reporting period, two large-cap stalwarts were particularly beneficial to performance: Intel Corp. and Hewlett-Packard Co. In both cases, the Fund moved to an overweight position by the end of the period, in large part because of a change in CEO and an accompanying favorable shift in strategic direction. Also aiding performance was ARRIS Group, Inc., a provider of communication equipment to major cable television companies worldwide. Aggressive investment by cable firms to expand their broadband capabilities helped the stock to post a return of more than 30% during the reporting period. Another holding boosting the Fund’s performance was 24/7 Real Media, Inc., a provider of interactive marketing and technology solutions. The 24/7 stock experienced a respectable rally near the end of the period after the company announced better-than-expected earnings in May and raised full-year profit guidance.
Given widespread expectations for the economy to slow and the current tepid level of information technology spending, the Fund is positioned for greater sensitivity to valuations. The Fund is likely to maintain a focus on less-widely followed names in the small- and mid-cap segments, where more opportunity appears to exist for uncovering hidden growth stories that other investors have not yet discovered. Finally, the Fund will continue striving to add value through careful bottom-up, fundamental stock selection—an investment strategy that involves considering companies simply on their own merit, without regard to their given industries/sectors or the current economic conditions.
PORTFOLIO MANAGER: Chip Zhu
International investing involves additional risks, including currency fluctuations, differences in accounting standards, political instability and foreign regulations, all of which are magnified in emerging markets.
Investing in mutual funds involves risk, including possible loss of principal.
There is no assurance that the investment objective of any fund will be achieved.
Funds that concentrate on specific sectors or a relatively small number of securities may be subject to greater volatility than a more diversified investment.
1
Table of Contents
Gartmore GVIT Global Technology and Communications Fund (continued)
Goldman Sachs Technology Composite Index (GSTI®): An unmanaged, market capitalization-weighted index that is designed to measure the performance of companies in the technology sector.
Lipper Analytical Services, Inc. is an industry research firm whose rankings are based on total return performance and do not reflect the effects of sales charges.
The Gartmore Variable Insurance Trust Funds are available only as sub-account investment options in certain variable insurance products. Accordingly, investors are unable to invest in shares of these funds outside of an insurance product.
Performance information found herein reflects only the performance of these funds, and does not indicate the performance your sub-account may experience under your variable insurance contract. Performance returns assume reinvestment of all distributions. The investment return and principal value of an investment will fluctuate so that an investor’s shares, when redeemed, may be worth more or less than their original cost. Index performance is provided for comparison purposes only; the indexes shown are unmanaged and do not reflect any fees or expenses. Investors cannot invest directly in market indexes. To obtain performance information about the sub-account option under your insurance contract that invests in one of these funds, please contact your variable insurance carrier. PAST PERFORMANCE IS NO GUARANTEE OF FUTURE RESULTS.
Commentary provided by Gartmore Global Investments. All opinions and estimates included in this report constitute Gartmore Global Investments’ judgment as of the date of this report and are subject to change without notice.
Investors should carefully consider a fund’s investment objectives, risks, fees, charges and expenses before investing any money. To obtain this and other information on Gartmore Variable Insurance Trust, please contact your variable insurance contract provider or call 800-848-0920. Please read the Trust’s prospectus carefully before investing any money.
Gartmore Funds distributed by Gartmore Distribution Services, Inc., Member NASD. 1200 River Road, Suite 1000, Conshohocken, PA 19428.
2
Table of Contents
Fund Performance | Gartmore GVIT Global Technology and Communications Fund |
| Average | Annual Total Return1 |
(For Periods Ended June 30, 2005)
| Six months* | One year | Five years | Inception2 | |||||
| Class I | -11.89% | -8.82% | -18.90% | -18.90% | ||||
| Class II3 | -12.14% | -9.09% | -18.94% | -18.94% | ||||
| Class III3 | -11.79% | -8.75% | -18.75% | -18.75% | ||||
| Class VI3 | -12.14% | -9.09% | -18.97% | -18.97% |
| * | Not Annualized. |
| 1 | Not subject to any sales charges. |
| 2 | Fund commenced operations on June 30, 2000. |
| 3 | These returns until the creation of the Class II shares (March 28, 2003) and Class III shares (May 2, 2002) and through December 31, 2003 for the Class VI shares are based on the performance of the Class I shares of the Fund. Excluding the effect of any fee waivers or reimbursements, such prior performance is similar to what Class II, Class III and Class VI shares would have produced because all classes of shares invest in the same portfolio of securities. Class II and Class VI shares’ annual returns have been restated to reflect the additional fees applicable to Class II and Class VI shares and therefore are lower than those of Class I. For Class III and Class VI shares, these returns do not reflect the short-term trading fees applicable to such shares; if these fees were reflected, the annual returns for Class III shares would have been lower. |
| Performance | of a $10,000 Investment |
Investment return and principal value will fluctuate, and when redeemed, shares may be worth more or less than original cost. Past performance is no guarantee of future results and does not reflect the deduction of taxes that a shareholder would pay on fund distributions or the redemption of fund shares. Investing in mutual funds involves market risk, including loss of principal. Performance returns assume the reinvestment of all distributions.
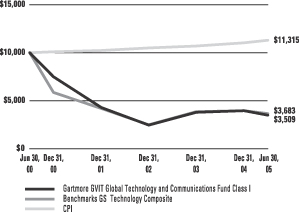
Comparative performance of $10,000 invested in Class I shares of the Gartmore GVIT Global Technology and Communications Fund, Goldman Sachs Technology Composite Index (GSTI)(a) and the Consumer Price Index (CPI)(b) since inception. Unlike the Fund, the returns for these unmanaged indexes do not reflect any fees, expenses, or sales charges. Investors cannot invest directly in market indexes.
| (a) | GSTI (new) is an unmanaged, modified, market capitalization-weighted index that is designed to measure the performance of companies in the technology sector. |
| (b) | The CPI represents changes in prices of a basket of goods and services purchased for consumption by urban households. |
3
Table of Contents
Shareholder
Expense Example | Gartmore GVIT Global Technology and Communications Fund |
As a shareholder of the Fund, you incur two types of costs: (1) transaction costs, including sales charges (loads) paid on purchase payments and redemption fees; and (2) ongoing costs, including investment advisory fees, administration fees, distribution fees and other Fund expenses. The examples below are intended to help you understand your ongoing costs (in dollars) of investing in the Fund and to compare these costs with the ongoing costs of investing in other mutual funds. Per SEC requirements, the examples assume that you had a $1,000 investment in the Class at the beginning of the reporting period, January 1, 2005, and continued to hold your shares at the end of the reporting period, June 30, 2005.
Actual Expenses
For each Class of the Fund in the table below, the first line provides information about actual account values and actual expenses. You may use the information in this line, together with the amount you invested, to estimate the expenses that you paid over the period. Simply divide your account value by $1,000 (for example, an $8,600 account value divided by $1,000 = 8.6), then multiply the result by the number in the first line of each Class under the heading entitled “Expenses Paid During Period” to estimate the expenses you paid on your account during the period.
Hypothetical Example for Comparison Purposes
The second line of each Class in the table below provides information about hypothetical account values and hypothetical expenses based on the Class’ actual expense ratio and an assumed rate of return of 5% per year before expenses, which is not the Class’ actual return. The hypothetical account values and expenses may not be used to estimate the actual ending account balance or expenses you paid for the period. You may use this information to compare the ongoing costs of investing in the Class of the Fund and other funds. To do so, compare this 5% hypothetical example with the 5% hypothetical examples that appear in the shareholder reports of the other funds.
Please note that the expenses shown in the table are meant to highlight your ongoing costs only and do not reflect any transaction costs, such as sales charges (loads) or redemption fees. Therefore, the second line for each Class in the table is useful in comparing ongoing costs only, and will not help you determine the relative total costs of owning different funds. In addition, if these transaction costs were included, your costs would have been higher. The examples also assume all dividends and distributions have been reinvested.
| Beginning Account Value, January 1, 2005 | Ending Account Value, June 30, 2005 | Expenses Paid During Period* | Annualized Expense Ratio* | ||||||||||
| Global Technology and Communications Fund | |||||||||||||
Class I | Actual | $ | 1,000 | $ | 881 | $ | 6.02 | 1.29% | |||||
| Hypothetical1 | $ | 1,000 | $ | 1,019 | $ | 6.48 | 1.29% | ||||||
Class II | Actual | $ | 1,000 | $ | 879 | $ | 7.22 | 1.55% | |||||
| Hypothetical1 | $ | 1,000 | $ | 1,017 | $ | 7.78 | 1.55% | ||||||
Class III | Actual | $ | 1,000 | $ | 882 | $ | 6.07 | 1.30% | |||||
| Hypothetical1 | $ | 1,000 | $ | 1,019 | $ | 6.53 | 1.30% | ||||||
Class VI | Actual | $ | 1,000 | $ | 879 | $ | 6.52 | 1.40% | |||||
| Hypothetical1 | $ | 1,000 | $ | 1,018 | $ | 7.03 | 1.40% | ||||||
| * | Expenses are equal to the Fund’s annualized expense ratio multiplied by the average account value over the period multiplied by 181/365 (to reflect the one-half year period). The expense ratio presented represents a six month, annualized ratio in accordance with SEC guidelines. |
| 1 | Represents the hypothetical 5% return before expenses. |
4
Table of Contents
Portfolio Summary
(June 30, 2005) | Gartmore GVIT Global Technology and Communications Fund |
The SEC adopted a requirement that Funds present their portfolio holdings in a table, chart or graph format in their annual and semiannual reports to shareholders, whether or not a statement of investments is utilized. The following tables, which present portfolio holdings as a percentage of net assets, are provided in compliance with this requirement.
| Asset Allocation | ||
| Common Stocks | 96.0% | |
| Cash Equivalents | 1.9% | |
| Other Investments* | 13.6% | |
| Liabilities in excess of other assets** | -11.5% | |
| 100.0% | ||
| Top Holdings*** | ||
| Microsoft Corp. | 7.8% | |
| Intel Corp. | 6.8% | |
| International Business Machines Corp. | 5.8% | |
| Cisco Systems, Inc. | 5.3% | |
| Dell, Inc. | 4.3% | |
| Sonic Solutions | 4.1% | |
| TTM Technologies, Inc. | 3.4% | |
| Hewlett Packard Co. | 3.3% | |
| Oracle Corp. | 3.3% | |
| ATI Technologies, Inc. | 2.9% | |
| Other Holdings | 53.0% | |
| 100.0% | ||
| Top Industries | ||
| Electronic Components | 18.1% | |
| Computer Software | 15.6% | |
| Computer Hardware | 14.5% | |
| Telecommunication Equipment | 8.5 % | |
| Computer Services | 7.2 % | |
| Networking | 6.4 % | |
| Semiconductors | 5.2 % | |
| Wireless Equipment | 3.9 % | |
| Internet Services/Software | 3.8 % | |
| Computers — Peripheral Equipment | 3.7 % | |
| Other Industries | 13.1% | |
| 100.0% | ||
| * | Includes value of collateral received from securities lending. |
| ** | Includes value of collateral owed from securities lending. |
| *** | For purpose of listing top holdings, repurchase agreements are considered cash equivalents and are included as part of other holdings. |
5
Table of Contents
GARTMORE VARIABLE INSURANCE TRUST
GARTMORE GVIT GLOBAL TECHNOLOGY AND COMMUNICATIONS FUND
Statement of Investments — June 30, 2005 (Unaudited)
Shares or Principal Amount | Value | ||||
| COMMON STOCKS (96.0%) | |||||
| Advertising (1.0%) | |||||
| 24/7 Real Media, Inc. | 85,200 | $ | 348,468 | ||
| Amusement & Recreation (0.8%) | |||||
| Movie Gallery | 10,400 | 274,872 | |||
| Computer Hardware (14.5%) | |||||
| Dell, Inc. (b) | 37,900 | 1,497,429 | |||
| EMC Corp. (b) | 27,400 | 375,654 | |||
| Hewlett Packard Co. | 48,800 | 1,147,288 | |||
| International Business Machines Corp. | 26,800 | 1,988,560 | |||
| 5,008,931 | |||||
| Computer Services (7.2%) | |||||
| ATI Technologies, Inc. (b) | 84,700 | 1,003,695 | |||
| Cognizant Technology Solutions Corp., | 21,200 | 999,156 | |||
| Class A (b) | |||||
| Unisys Corp. (b) | 77,500 | 490,575 | |||
| 2,493,426 | |||||
| Computer Software (15.2%) | |||||
| AutoDesk, Inc. | 4,700 | 161,539 | |||
| Emulex Corp. (b) | 8,900 | 162,514 | |||
| Microsoft Corp. | 108,600 | 2,697,624 | |||
| Oracle Corp. (b) | 85,400 | 1,127,280 | |||
| Packeteer, Inc. (b) | 13,800 | 194,580 | |||
| Siebel Systems, Inc. (b) | 58,900 | 524,210 | |||
| Synaptics, Inc. (b) | 17,000 | 363,120 | |||
| 5,230,867 | |||||
| Computers—Peripheral Equipment (3.7%) | |||||
| BMC Software, Inc. | 38,900 | 698,255 | |||
| M-Systems Flash Disk Pioneers, Ltd. | 30,400 | 582,768 | |||
| 1,281,023 | |||||
| E-Commerce (1.3%) | |||||
| eBay, Inc. (b) | 13,500 | 445,635 | |||
| Electronic Components (18.1%) | |||||
| Broadcom Corp., Class A (b) | 4,700 | 166,897 | |||
| Catapult Communications Corp. | 26,300 | 448,678 | |||
| Emcore Corp. | 53,600 | 221,368 | |||
| Intel Corp. | 90,300 | 2,353,218 | |||
| Sonic Solutions (b) | 75,200 | 1,398,720 | |||
| TTM Technologies, Inc. (b) | 151,500 | 1,152,915 | |||
| Xilinx, Inc. | 18,000 | 459,000 | |||
| 6,200,796 | |||||
Shares or Principal Amount | Value | ||||
| COMMON STOCKS (continued) | |||||
| Electronic Equipment (1.6%) | |||||
| Novatel Inc. | 8,900 | $ | 238,787 | ||
| Rambus Inc. (b) | 23,800 | 318,444 | |||
| 557,231 | |||||
| Instruments—Scientific (0.7%) | |||||
| PerkinElmer, Inc. | 12,000 | 226,800 | |||
| Internet Services/Software (3.8%) | |||||
| Blue Coat Systems, Inc. | 6,600 | 197,208 | |||
| Sapient Corp. (b) | 84,500 | 670,085 | |||
| Tibco Software, Inc. (b) | 25,000 | 163,500 | |||
| VeriSign, Inc. (b) | 10,200 | 293,352 | |||
| 1,324,145 | |||||
| Networking (6.4%) | |||||
| Cisco Systems, Inc. (b) | 95,700 | 1,828,827 | |||
| Juniper Networks, Inc. (b) | 14,700 | 370,146 | |||
| 2,198,973 | |||||
| Office machines (1.2%) | |||||
| Xerox Corp. | 29,600 | 408,184 | |||
| Semiconductors (5.2%) | |||||
| Analog Devices, Inc. | 14,000 | 522,340 | |||
| Cymer, Inc. (b) | 6,100 | 160,735 | |||
| KLA-Tencor Corp. | 10,900 | 476,330 | |||
| Texas Instruments, Inc. | 23,000 | 645,610 | |||
| 1,805,015 | |||||
| Telecommunication Equipment (8.5%) | |||||
| Adc Telecomm, Inc. | 15,700 | 341,789 | |||
| Adtran, Inc. | 6,700 | 166,093 | |||
| Arris Group, Inc. (b) | 96,700 | 842,257 | |||
| AudioCodes LTD (Israel) | 15,600 | 155,220 | |||
| Lucent Technologies, Inc. (b) | 115,800 | 336,978 | |||
| Neustar, Inc. | 16,700 | 427,520 | |||
| Tekelec (b) | 10,100 | 169,680 | |||
| Westell Technologies, Inc. | 81,700 | 488,566 | |||
| 2,928,103 | |||||
| Telephone communication (2.9%) | |||||
| Motorola, Inc. | 36,700 | 670,142 | |||
| Nokia Corp. ADR FI | 9,800 | 163,072 | |||
| Redback Networks, Inc. | 25,100 | 160,138 | |||
| 993,352 | |||||
| Wireless Equipment (3.9%) | |||||
| Qualcomm, Inc. | 28,900 | 953,989 | |||
| RF Micro Devices, Inc. | 70,900 | 384,987 | |||
| 1,338,976 | |||||
| Total Common Stocks | 33,064,797 | ||||
6
Table of Contents
GARTMORE VARIABLE INSURANCE TRUST
GARTMORE GVIT GLOBAL TECHNOLOGY AND COMMUNICATIONS FUND
Statement of Investments — June 30, 2005 (Unaudited) (continued)
Shares or Principal Amount | Value | |||||
| CASH EQUIVALENTS (1.9%) | ||||||
| Investments in repurchase agreements (collateralized by AA Corporate Bonds in a joint trading account at 3.49%, dated 06/30/05, due 07/01/05, repurchase price $660,358) | $ | 660,293 | $ | 660,293 | ||
| Total Cash Equivalents | 660,293 | |||||
| SHORT-TERM SECURITIES HELD AS COLLATERAL FOR SECURITIES LENDING (13.6%) | ||||||
| Pool of short-term securities for Gartmore Variable Trust Funds — note 2 (Securities Lending) | 4,693,903 | 4,693,903 | ||||
| Total Short-Term Securities Held as Collateral for Securities Lending | 4,693,903 | |||||
Shares or Principal Amount | Value | |||||
| Total Investments (Cost $38,284,033) (a) — 111.5% | $ | 38,418,993 | ||||
| Liabilities in excess of other assets — (11.5%) | (3,955,690 | ) | ||||
| NET ASSETS — 100.0% | $ | 34,463,303 | ||||
| (a) | See notes to financial statements for tax unrealized appreciation (depreciation) of securities. |
| (b) | Non-income producing securities. |
| ADR | American Depository Receipt |
| FI | Finland |
See notes to financial statements.
7
Table of Contents
GARTMORE VARIABLE INSURANCE TRUST
GARTMORE GVIT GLOBAL TECHNOLOGY AND COMMUNICATIONS FUND
Statement of Assets and Liabilities
June 30, 2005 (Unaudited)
Assets: | ||||
Investments, at value (cost $37,623,740) | $ | 37,758,700 | ||
Repurchase agreements, at cost and value | 660,293 | |||
Total Investments | 38,418,993 | |||
Foreign currencies, at value (cost $896,169) | 944,541 | |||
Receivable for capital shares issued | 6 | |||
Interest and dividends receivable | 12,742 | |||
Receivable for investments sold | 338,710 | |||
Prepaid expenses and other assets | 333 | |||
Total Assets | 39,715,325 | |||
Liabilities: | ||||
Payable for investments purchased | 512,600 | |||
Payable for return of collateral received for securities on loan | 4,693,903 | |||
Accrued expenses and other payables: | ||||
Investment advisory fees | 27,732 | |||
Fund administration and transfer agent fees | 433 | |||
Distribution fees | 902 | |||
Administrative servicing fees | 2,982 | |||
Other | 13,470 | |||
Total Liabilities | 5,252,022 | |||
Net Assets | $ | 34,463,303 | ||
Represented by: | ||||
Capital | $ | 49,010,894 | ||
Accumulated net investment income (loss) | (123,219 | ) | ||
Accumulated net realized gains (losses) from investment and foreign currency transactions | (14,607,705 | ) | ||
Net unrealized appreciation (depreciation) on investments and translation of assets and liabilities denominated in foreign currencies | 183,333 | |||
Net Assets | $ | 34,463,303 | ||
Net Assets: | ||||
Class I Shares | $ | 14,072,764 | ||
Class II Shares | 1,615,848 | |||
Class III Shares | 16,038,942 | |||
Class VI Shares | 2,735,749 | |||
Total | $ | 34,463,303 | ||
Shares outstanding (unlimited number of shares authorized): | ||||
Class I Shares | 4,129,120 | |||
Class II Shares | 475,128 | |||
Class III Shares | 4,669,255 | |||
Class VI Shares | 803,544 | |||
Total | 10,077,047 | |||
Net asset value and offering price per share:* | ||||
Class I Shares | $ | 3.41 | ||
Class II Shares | $ | 3.40 | ||
Class III Shares | $ | 3.44 | ||
Class VI Shares | $ | 3.40 |
| * | Not subject to a front-end sales charge. |
For the Six Months Ended June 30, 2005 (Unaudited)
Investment Income: | ||||
Interest income | $ | 10,675 | ||
Dividend income | 77,993 | |||
Income from securities lending | 17,136 | |||
Total Income | 105,804 | |||
Expenses: | ||||
Investment advisory fees | 170,721 | |||
Fund administration and transfer agent fees | 12,405 | |||
Distribution fees Class II Shares | 2,259 | |||
Distribution fees Class VI Shares | 2,994 | |||
Administrative servicing fees Class I Shares | 9,779 | |||
Administrative servicing fees Class II Shares | 1,313 | |||
Administrative servicing fees | 12,526 | |||
Other** | 17,026 | |||
Total Expenses | 229,023 | |||
Net Investment Income (Loss) | (123,219 | ) | ||
REALIZED/UNREALIZED GAINS (LOSSES) ON INVESTMENTS: | ||||
Net realized gains (losses) on investment transactions | (2,219,585 | ) | ||
Net realized gains (losses) on foreign currency transactions | 83 | |||
Net realized gains (losses) on investment and foreign currency transactions | (2,219,502 | ) | ||
Net change in unrealized appreciation/depreciation on investments and translation of assets and liabilities denominated in foreign currencies | (3,266,885 | ) | ||
Net realized/unrealized gains (losses) on investments and foreign currencies | (5,486,387 | ) | ||
CHANGE IN NET ASSETS RESULTING FROM OPERATIONS | $ | (5,609,606 | ) | |
| ** | Other expenses may include the following fees: audit, custody, insurance, legal, printing, trustee, and out-of-pocket expenses. |
See notes to financial statements.
8
Table of Contents
GARTMORE VARIABLE INSURANCE TRUST
GARTMORE GVIT GLOBAL TECHNOLOGY AND COMMUNICATIONS FUND
Statement of Changes in Net Assets
| Six Months Ended June 30, 2005 | Year Ended December 31, 2004 | |||||||
| (Unaudited) | ||||||||
From Investment Activities: | ||||||||
Operations: | ||||||||
Net investment income (loss) | $ | (123,219 | ) | $ | (358,914 | ) | ||
Net realized gains (losses) on investment and foreign currency transactions | (2,219,502 | ) | (2,493,186 | ) | ||||
Net change in unrealized appreciation/depreciation on investments and translation of assets and liabilities denominated in foreign currencies | (3,266,885 | ) | 2,092,250 | |||||
Change in net assets resulting from operations | (5,609,606 | ) | (759,850 | ) | ||||
Change in net assets from capital transactions | (7,828,646 | ) | (2,824,060 | ) | ||||
Change in net assets | (13,438,252 | ) | (3,583,910 | ) | ||||
Net Assets: | ||||||||
Beginning of period | 47,901,555 | 51,485,465 | ||||||
End of period | $ | 34,463,303 | $ | 47,901,555 | ||||
CAPITAL TRANSACTIONS: | ||||||||
Class I Shares | ||||||||
Proceeds from shares issued | $ | 3,788,613 | $ | 13,348,148 | ||||
Cost of shares redeemed | (7,561,936 | ) | (9,682,763 | ) | ||||
| (3,773,323 | ) | 3,665,385 | ||||||
Class II Shares | ||||||||
Proceeds from shares issued | 849 | 4,248,694 | ||||||
Cost of shares redeemed | (495,848 | ) | (3,829,138 | ) | ||||
| (494,999 | ) | 419,556 | ||||||
Class III Shares | ||||||||
Proceeds from shares issued | 2,052,967 | 12,911,950 | ||||||
Cost of shares redeemed | (5,976,049 | ) | (22,278,002 | ) | ||||
| (3,923,082 | ) | (9,366,052 | ) | |||||
Class VI Shares | ||||||||
Proceeds from shares issued | 934,711 | 2,727,660 | (a) | |||||
Cost of shares redeemed | (571,953 | ) | (270,609 | )(a) | ||||
| 362,758 | 2,457,051 | |||||||
Change net assets from capital transactions | $ | (7,828,646 | ) | $ | (2,824,060 | ) | ||
SHARE TRANSACTIONS: | ||||||||
Class I Shares | ||||||||
Issued | 1,122,450 | 3,535,990 | ||||||
Redeemed | (2,196,911 | ) | (2,633,623 | ) | ||||
| (1,074,461 | ) | 902,367 | ||||||
Class II Shares | ||||||||
Issued | 220 | 1,084,304 | ||||||
Redeemed | (147,889 | ) | (1,034,233 | ) | ||||
| (147,669 | ) | 50,071 | ||||||
Class III Shares | ||||||||
Issued | 617,269 | 3,334,188 | ||||||
Redeemed | (1,753,958 | ) | (6,455,511 | ) | ||||
| (1,136,689 | ) | (3,121,323 | ) | |||||
Class VI Shares | ||||||||
Issued | 278,120 | 775,393 | (a) | |||||
Redeemed | (170,529 | ) | (79,440 | )(a) | ||||
| 107,591 | 695,953 | |||||||
| (a) | For the period from April 28, 2004 (commencement of operations) through December 31, 2004. |
See notes to financial statements.
9
Table of Contents
GARTMORE VARIABLE INSURANCE TRUST
FINANCIAL HIGHLIGHTS
Selected Data for Each Share of Capital Outstanding
Gartmore GVIT Global Technology and Communications Fund
| Investment Activities | Distributions | Ratios/Supplemental Data | ||||||||||||||||||||||||||||||||||||||||||
| Net Asset Value, Beginning of Period | Net Investment Income (Loss) | Net Realized and Unrealized Gains (Losses) on Investments | Total from Investment Activities | Net Realized Gains | Return of Capital | Total Distributions | Net Asset Value, End of Period | Total Return | Net Assets at End of Period (000s) | Ratio of Expenses to Average Net Assets | Ratio of Net Investment Income (Loss) to Average Net Assets | Ratio of Expenses (Prior to Reimbursements) to Average Net Assets(a) | Ratio of Net Investment Income (Loss) (Prior to Reimbursements) to Average Net Assets(a) | Portfolio Turnover(b) | ||||||||||||||||||||||||||||||
Class I Shares | ||||||||||||||||||||||||||||||||||||||||||||
Period Ended December 31, 2000(c) | $ | 10.00 | (0.01 | ) | (2.48 | ) | (2.49 | ) | (0.16 | ) | — | (0.16 | ) | $ | 7.35 | (24.96% | )(g) | $ | 12,127 | 1.35% | (h) | (0.44% | )(h) | 2.57% | (h) | (1.66% | )(h) | 305.36% | ||||||||||||||||
Year Ended December 31, 2001(d) | $ | 7.35 | (0.03 | ) | (3.11 | ) | (3.14 | ) | — | — | — | $ | 4.21 | (42.72% | ) | $ | 15,585 | 1.35% | (0.88% | ) | 2.02% | (1.55% | ) | 894.05% | ||||||||||||||||||||
Year Ended December 31, 2002 | $ | 4.21 | (0.03 | ) | (1.77 | ) | (1.80 | ) | — | (0.02 | ) | (0.02 | ) | $ | 2.39 | (42.78% | ) | $ | 7,791 | 1.34% | (0.65% | ) | 1.39% | (0.70% | ) | 879.28% | ||||||||||||||||||
Year Ended December 31, 2003 | $ | 2.39 | (0.03 | ) | 1.35 | 1.32 | — | — | — | $ | 3.71 | 55.23% | $ | 15,960 | 1.24% | (0.94% | ) | (i | ) | (i | ) | 1045.37% | ||||||||||||||||||||||
Year Ended December 31, 2004 | $ | 3.71 | (0.02 | ) | 0.18 | 0.16 | — | — | — | $ | 3.87 | 4.31% | $ | 20,144 | 1.30% | (0.69% | ) | (i | ) | (i | ) | 728.29% | ||||||||||||||||||||||
Six Months Ended June 30, 2005 (Unaudited) | $ | 3.87 | (0.01 | ) | (0.45 | ) | (0.46 | ) | — | — | — | $ | 3.41 | (11.89% | )(g) | $ | 14,073 | 1.29% | (h) | (0.68% | )(h) | (i | ) | (i | ) | 319.44% | ||||||||||||||||||
Class II Shares | ||||||||||||||||||||||||||||||||||||||||||||
Period Ended December 31, 2003(e) | $ | 2.45 | (0.01 | ) | 1.28 | 1.27 | — | — | — | $ | 3.72 | 51.84% | (g) | $ | 2,128 | 1.49% | (h) | (1.27% | )(h) | (i | ) | (i | ) | 1045.37% | ||||||||||||||||||||
Year Ended December 31, 2004 | $ | 3.72 | (0.05 | ) | 0.20 | 0.15 | — | — | — | $ | 3.87 | 4.03% | $ | 2,409 | 1.53% | (0.98% | ) | (i | ) | (i | ) | 728.29% | ||||||||||||||||||||||
Six Months Ended June 30, 2005 (Unaudited) | $ | 3.87 | (0.02 | ) | (0.45 | ) | (0.47 | ) | — | — | — | $ | 3.40 | (12.14% | )(g) | $ | 1,616 | 1.55% | (h) | (0.94% | )(h) | (i | ) | (i | ) | 319.44% | ||||||||||||||||||
Class III Shares | ||||||||||||||||||||||||||||||||||||||||||||
Period Ended December 31, 2002(f) | $ | 3.29 | (0.01 | ) | (0.85 | ) | (0.86 | ) | — | (0.02 | ) | (0.02 | ) | $ | 2.41 | (26.14% | )(g) | $ | 5,822 | 1.37% | (h) | (3.49% | )(h) | 1.79% | (3.91% | ) | 879.28% | |||||||||||||||||
Year Ended December 31, 2003 | $ | 2.41 | (0.02 | ) | 1.35 | 1.33 | — | — | — | $ | 3.74 | 55.19% | $ | 33,398 | 1.25% | (1.00% | ) | (i | ) | (i | ) | 1045.37% | ||||||||||||||||||||||
Year Ended December 31, 2004 | $ | 3.74 | (0.04 | ) | 0.20 | 0.16 | — | — | — | $ | 3.90 | 4.28% | $ | 22,656 | 1.28% | (0.73% | ) | (i | ) | (i | ) | 728.29% | ||||||||||||||||||||||
Six Months Ended June 30, 2005 (Unaudited) | $ | 3.90 | (0.01 | ) | (0.45 | ) | (0.46 | ) | — | — | — | $ | 3.44 | (11.79% | )(g) | $ | 16,039 | 1.30% | (h) | (0.69% | )(h) | (i | ) | (i | ) | 319.44% | ||||||||||||||||||
Class VI Shares | ||||||||||||||||||||||||||||||||||||||||||||
Period Ended December 31, 2004(j) | $ | 3.59 | (0.01 | ) | 0.29 | 0.28 | — | — | — | $ | 3.87 | 7.80% | (g) | $ | 2,693 | 1.46% | (h) | (0.44% | )(h) | (i | ) | (i | ) | 728.29% | ||||||||||||||||||||
Six Months Ended June 30, 2005 (Unaudited) | $ | 3.87 | (0.01 | ) | (0.46 | ) | (0.47 | ) | — | — | — | $ | 3.40 | (12.14% | )(g) | $ | 2,736 | 1.40% | (h) | (0.79% | )(h) | (i | ) | (i | ) | 319.44% | ||||||||||||||||||
| (a) | During the period certain fees were waived and/or reimbursed. If such waivers/reimbursements had not occurred, the ratios would have been as indicated. |
| (b) | Portfolio turnover is calculated on the basis of the Fund as whole without distinguishing among the classes of shares. |
| (c) | For the period from June 30, 2000 (commencement of operations) through December 31, 2000. |
| (d) | The existing shares of the Fund were designated Class I shares as of May 1, 2001. |
| (e) | For the period from March 28, 2003 (commencement of operations) through December 31, 2003. |
| (f) | For the period from May 2, 2002 (commencement of operations) through December 31, 2002. |
| (g) | Not annualized. |
| (h) | Annualized. |
| (i) | There were no fee reductions during the period. |
| (j) | For the period from April 28, 2004 (commencement of operations) through December 31, 2004. |
See notes to financial statements.
10
Table of Contents
GARTMORE VARIABLE INSURANCE TRUST
NOTES TO FINANCIAL STATEMENTS (Unaudited)
June 30, 2005
1. Organization
Gartmore Variable Insurance Trust (“GVIT” or the “Trust”) is an open-end management investment company, organized under the laws of Delaware by an amended and restated Agreement and Declaration of Trust, dated October 28, 2004, as amended to date. The Trust, originally created under the laws of Massachusetts as a Massachusetts business trust pursuant to a Declaration of Trust dated, as of June 30, 1981, as subsequently amended, redomesticated as a Delaware Statutory Trust after the close of trading on April 29, 2005, and is registered under the Investment Company Act of 1940, as amended (the “1940 Act”). The redomestication is a change in statutory status and does not affect the operations of the Trust. As of June 30, 2005, the Trust had authorized an unlimited number of shares of beneficial interest (“shares”) without par value. The Trust currently offers shares to life insurance company separate accounts to fund the benefits under variable life insurance or annuity policies. To date, only the separate accounts of Nationwide Life Insurance Company and Nationwide Life and Annuity Insurance Company (collectively, “Nationwide”) have purchased shares of the Trust’s series. The Trust operates thirty-one (31) separate series, or mutual funds, each with its own investment objectives and strategies. This report contains the financial statements and financial highlights of the Gartmore GVIT Global Technology and Communications Fund (the “Fund”).
Under the Trust’s organizational documents, the Trust’s officers and trustees are indemnified against certain liabilities arising out of the performance of their duties to the Trust. In addition, the Trust has entered into Indemnification Agreements with the Trust’s trustees and certain officers covering similar liabilities. In addition, in the normal course of business, the Trust enters into contracts with its vendors and others that provide for general indemnifications. The Trust’s maximum exposure under these arrangements is unknown, as this would involve future claims that may be made against the Trust. Based on experience, however, the Trust expects that risk of loss to be remote.
2. Summary of Significant Accounting Policies
The following is a summary of significant accounting policies followed by the Fund in the preparation of its financial statements. The policies are in conformity with accounting principles generally accepted in the United States of America (“GAAP”). The preparation of financial statements requires management to make estimates and assumptions that affect the reported amounts of assets and liabilities, the disclosure of contingent assets and liabilities at the date of the financial statements and the reported amounts of income and expenses for the period. Actual results could differ from those estimates.
| (a) | Security Valuation |
Securities for which market quotations are readily available are valued at current market value as of “Valuation Time.” Valuation Time is as of the close of regular trading on the New York Stock Exchange (usually 4 p.m. Eastern time). Equity securities are valued at the last quoted sale price or, if there is no sale price, the last quoted bid price provided by an independent pricing service approved by the Trust’s Board of Trustees. Securities traded on NASDAQ are valued at the NASDAQ official closing price. Prices are taken from the primary market or exchange in which each security trades. Most securities listed on a foreign exchange are valued either at fair value (see description below) or at the last sale price at the close of the exchange on which the security is principally traded. Foreign securities, currencies, and other assets and liabilities denominated in foreign currencies are translated into U.S. dollars at the exchange rate of said currencies against the U.S. Dollar, as of Valuation Time, as provided by an independent pricing service approved by the Board of Trustees.
Securities for which market quotations are not readily available, or for which an independent pricing service does not provide a value or provides a value that does not represent fair value in the judgment of the Fund’s investment adviser or designee, are valued at fair value under procedures approved by the Trust’s Board of Trustees. The “Fair Value” of these securities is determined in good faith by taking into account relevant factors and surrounding circumstances. Methods utilized to obtain a “Fair Value” may include the following non-exclusive list of SEC-acceptable methods: (i) a multiple of earnings; (ii) the discount from market value of a similar, freely traded security; (iii) the yield-to-maturity for debt issues; or (iv) a consolidation of the methods. The Gartmore Fair Value Committee considers a non-exclusive list of factors to arrive at the appropriate method upon determining “Fair Value.” For example, fair value determinations are required for securities whose value is affected by a “significant” event that materially affects the value of a domestic or foreign security which occurs
11
Table of Contents
GARTMORE VARIABLE INSURANCE TRUST
NOTES TO FINANCIAL STATEMENTS (Unaudited) (Continued)
June 30, 2005
subsequent to the time of the close of the principal market on which such domestic or foreign security trades and before the Valuation Time (i.e., a “subsequent event”). Typically, this will involve events occurring after the close of a foreign market on which a security trades and before the next Valuation Time.
The Fund values foreign securities at fair value in the circumstances described below. Generally, trading in foreign securities markets is completed each day at various times prior to the Valuation Time. Due to the time differences between the closings of the relevant foreign securities exchanges and the Valuation Time for the Fund, the Fund will fair value its foreign investments when it is determined that the market quotations for the foreign investments either are not readily available or are unreliable and, therefore, do not represent fair value. When the fair value prices are utilized, these prices will attempt to reflect the impact of the U.S. financial markets’ perceptions and trading activities on the Fund’s foreign investments since the last closing prices of the foreign investments were calculated on their primary foreign securities markets or exchanges. For these purposes, the Board of Trustees of the Trust has determined that movements in relevant indices or other appropriate market indicators, after the close of the foreign securities exchanges, may demonstrate that market quotations are unreliable, and may trigger fair value pricing for certain securities. Consequently, fair valuation of portfolio securities may occur on a daily basis. In determining fair value prices, the Trust utilizes data furnished by an independent pricing service (and that data draws upon, among other information, the market values of foreign investments). The fair value prices of portfolio securities generally will be used when it is determined that the use of these prices will have a material impact on the net asset value of the Fund. When the Fund uses fair value pricing, the values assigned to the Fund’s foreign investments may not be the quoted or published prices of the investments on their primary markets or exchanges.
| (b) | Repurchase Agreements |
The Fund may enter into repurchase agreements with an entity which is a member of the Federal Reserve System or which is a “primary dealer” (as designated by the Federal Reserve Bank of New York) in U.S. Government obligations. The repurchase price generally equals the price paid by the Fund plus interest negotiated on the basis of current short-term rates, which may be more or less than the rate on the underlying portfolio securities. The seller under a repurchase agreement is required to maintain the value of the collateral held pursuant to the agreement at a market value equal to or greater than the repurchase price (including accrued interest). Collateral subject to repurchase agreements is held by the Fund’s custodian or another qualified sub-custodian or in the Federal Reserve/Treasury book-entry system. If the counterparty defaults and the fair value of the collateral declines, realization of the collateral by the Fund may be delayed or limited. The Fund may transfer uninvested cash balances into a pooled cash account. These balances are invested in one or more repurchase agreements, which are fully collateralized by AA-rated Corporate Bonds with the counterparties of CS First Boston and Nomura Securities.
| (c) | Foreign Currency Transactions |
The accounting records of the Fund are maintained in U.S. dollars. Foreign currency amounts are translated into U.S. dollars at the current rate of exchange to determine the value of investments, assets and liabilities. The Fund may enter into foreign currency contracts in connection with purchases or sales of securities denominated in a foreign currency. Purchases and sales of securities, and income and expenses, are translated at the prevailing rate of exchange on the respective date of these transactions. The Fund does not isolate that portion of the results of operations resulting from changes in foreign exchange rates on investments from fluctuations arising from changes in market prices of securities held. These fluctuations are included with the net realized and unrealized gain or loss from investments and foreign currencies.
| (d) | Risks Associated with Foreign Securities and Currencies |
Investments in securities of foreign issuers carry certain risks not ordinarily associated with investments in securities of U.S. issuers. These risks include future political and economic developments, and the possible imposition of exchange controls or other foreign governmental laws and restrictions. In addition, with respect to certain countries, there is the possibility of expropriation of assets, confiscatory taxation, political or social instability, or diplomatic developments, which could adversely affect investments in those countries.
12
Table of Contents
GARTMORE VARIABLE INSURANCE TRUST
NOTES TO FINANCIAL STATEMENTS (Unaudited) (Continued)
June 30, 2005
Certain countries also may impose substantial restrictions on investments in their capital markets by foreign entities, including restrictions on investments in issuers of industries deemed sensitive to relevant national interests. These factors may limit the investment opportunities available and result in a lack of liquidity and high price volatility with respect to securities of issuers from developing countries.
| (e) | Forward Foreign Currency Contracts |
The Fund may enter into forward foreign currency contracts in connection with planned purchases or sales of securities or to hedge the U.S. dollar value of portfolio securities denominated in a particular currency. The Fund could be exposed to risks if the counterparties to the contracts are unable to meet the terms of their contracts and from unanticipated movements in the value of a foreign currency relative to the U.S. dollar. Forward foreign currency contracts are valued at the current cost of covering these contracts, as provided by an independent pricing service approved by the Board of Trustees. The forward foreign currency contracts are adjusted by the daily exchange rate of the underlying currency and any gains or losses are recorded for financial statement purposes as unrealized gains or losses until the contract settlement date.
| (f) | Futures Contracts |
The Fund may invest in financial futures contracts (“futures contracts”) for the purpose of hedging its existing portfolio securities or securities that the Fund intends to purchase against fluctuations in value caused by changes in prevailing market interest rates or prices. Futures contracts may also be entered into for non-hedging purposes.
Upon entering into a futures contract, the Fund is required to pledge to the broker an amount of cash and/or other assets equal to a certain percentage of the contract amount (initial margin deposit). Subsequent payments, known as “variation margin,” are made each day, depending on the daily fluctuations in the fair value/market value of the underlying assets. A gain or loss equal to the daily variation margin is recognized on a daily basis. Futures contracts are valued daily at their last quoted sale price.
A “sale” of a futures contract means a contractual obligation to deliver the securities or foreign currency called for by the contract at a fixed price at a specified time in the future. A “purchase” of a futures contract means a contractual obligation to acquire the securities or foreign currency at a fixed price at a specified time in the future.
Should market conditions change unexpectedly, the Fund may not achieve the anticipated benefits of the futures contracts and may realize a loss. The use of futures transactions for hedging purposes involves the risk of imperfect correlation in movements in the price of futures contracts, interest rates, and the value of the underlying hedged assets.
| (g) | Written Options Contracts |
The Fund may write options contracts. A written option obligates the Fund to deliver (written call) or to receive (written put) a specified quantity of an underlying asset at the contract amount upon exercise by the holder of the option. The value of the option contract is recorded as a liability and unrealized gain or loss is measured by the difference between the current value and the premium received. Options traded on an exchange are valued at the last quoted sale price, or in the absence of a sale, the bid price provided by an independent pricing service approved by the Board of Trustees. Non-exchange traded options are valued using dealer supplied quotes.
| (h) | Short Sales |
The Fund is authorized to engage in short-selling of portfolio securities which obligates the Fund to replace any security that the Fund has borrowed by purchasing the security at current market value sometime in the future. The Fund will incur a loss if the price of the security increases between the date of the short sale and the date on which the Fund replaces the borrowed security. The Fund generally will realize a gain if the price of the security declines between these dates. Until the Fund replaces the borrowed security, the Fund will maintain a segregated account with cash, U.S. Government securities and/or securities held long to sufficiently cover the Fund’s short position on a daily basis. Dividends declared on securities sold
13
Table of Contents
GARTMORE VARIABLE INSURANCE TRUST
NOTES TO FINANCIAL STATEMENTS (Unaudited) (Continued)
June 30, 2005
short are recorded as an expense on the ex-dividend date and paid to the counterparty on the dividend pay date. The collateral for securities sold short are recorded as an expense on the ex-dividend date and paid to the counterparty on the dividend pay date. The collateral for securities sold short includes the deposits with brokers and securities held long as shown in the Statement of Investments for the Fund.
| (i) | Security Transactions and Investment Income |
Security transactions are accounted for on the date the security is purchased or sold (“trade date”). Securities gains and losses are calculated on the identified cost basis. Interest income is recognized on the accrual basis and includes, where applicable, the amortization or accretion of premium or discount. Dividend income is recorded on the ex-dividend date.
| (j) | Securities Lending |
To generate additional income, the Fund may lend up to 33 1/3% of the Fund’s total assets pursuant to agreements, requiring that the borrower deliver cash or securities as collateral with respect to each new loan of U.S. securities, equal to at least 102% of the value of the portfolio securities loaned, and with respect to each new loan of non-U.S. securities, collateral of at least 105% of the value of the portfolio securities loaned, and thereafter requiring the borrower to mark to market the collateral on a daily basis and requiring the borrower to make up any shortfall of collateral. The Fund receives payments from borrowers equivalent to the dividends and interest that would have been earned on securities lent while simultaneously seeking to earn income on the investment of cash collateral. Collateral is marked to market daily to provide a level of collateral at least equal to the market value of securities loaned. There may be risks of delay in recovery of the securities should the borrower of the securities fail financially. Loans will be made, however, only to borrowers deemed by the Fund’s investment adviser to be of good standing and creditworthy under guidelines established by the Board of Trustees and when, in the judgment of the adviser, the consideration which can be earned currently from these securities loans justifies the attendant risks. Loans are subject to termination by the Fund or the borrower at any time, and, therefore, are not considered to be illiquid investments. JPMorgan Chase Bank serves as custodian for the securities lending program of the Fund. JPMorgan Chase Bank receives a custody fee based on the value of collateral received from borrowers.
Security Type | Security Name | Market Value | Maturity Rate | Maturity Date | |||||
| Funding Agreement | GE Life and Annuity | $ | 400,000 | 3.32% | 07/14/05 | ||||
| Master Note — Floating | CDC Financial Product Inc. | 1,000,000 | 3.54% | 07/01/05 | |||||
| Repurchase Agreements | Nomura Securities | 3,293,903 | 3.48% | 07/01/05 | |||||
The cash collateral received by the Fund was pooled and, at June 30, 2005, was invested in the following:
As of June 30, 2005, the Fund had securities with the following market values on loan:
Market Value of | Market Value of Collateral | ||
$4,536,732 | $ | 4,693,903 | |
| (k) | Distributions to Shareholders |
The Fund’s dividends from net investment income, if any, are declared and paid quarterly. The Fund’s distributable net realized capital gains, if any, are declared and distributed at least annually.
Dividends and distributions to shareholders are determined in accordance with federal income tax regulations, which may differ from GAAP. These “book/tax” differences are considered either permanent or temporary in nature. In accordance with the American Institute of Certified Public Accountants (“AICPA”) Statement of Position 93-2, permanent differences (i.e., reclassification of market discounts, gain/loss, paydowns, and distributions) are reclassified within the capital accounts based on their nature for federal income tax purposes; temporary differences do not require reclassification. These reclassifications have no effect upon the net asset value of the Fund. To the extent distributions exceed current and accumulated earnings and profits for federal income tax purposes, these distributions are reported as distributions of paid-in-capital.
14
Table of Contents
GARTMORE VARIABLE INSURANCE TRUST
NOTES TO FINANCIAL STATEMENTS (Unaudited) (Continued)
June 30, 2005
| (l) | Federal Income Taxes |
It is the policy of the Fund to qualify or continue to qualify as a “regulated investment company” by complying with the provisions available to certain investment companies, as defined in applicable sections of the U.S. Internal Revenue Code, and to make distributions of net investment income and net realized capital gains sufficient to relieve the Fund from all, or substantially all, federal income taxes.
As of June 30, 2005, the tax cost of securities and the breakdown of unrealized appreciation (depreciation) for the Fund is as follows:
Tax Cost of | Unrealized Appreciation | Unrealized Depreciation | Net Unrealized Appreciation (Depreciation) | ||||||||
$509,051 | $ | 1,011,864 | $ | (1,385,955 | ) | $ | (374,091 | ) | |||
| (m) | Allocation of Expenses, Income, and Gains and Losses |
Expenses directly attributable to the Fund are charged to the Fund. Expenses not directly attributable to the Fund are allocated proportionately among various or all funds within the Trust. The method used by the Fund for allocating income, fund level expenses, and realized and unrealized gains or losses is based on the fair value of shares outstanding relative to net assets. Under this method, each class of shares participates based on the total net asset value of that class’s shares in proportion to the total net assets of the Fund. Expenses specific to a class (such as rule 12b-1 and administrative services fees) are charged to that class.
| 3. | Transactions with Affiliates |
Under the terms of the Trust’s Investment Advisory Agreement, Gartmore Mutual Fund Capital Trust (“GMF”) manages the investment of the assets and supervises the daily business affairs of the Fund. GMF is a wholly-owned subsidiary of Gartmore Global Investments, Inc. (“GGI”), a holding company. GGI is a majority-owned subsidiary of Gartmore Global Asset Management Trust (“GGAMT”). GGAMT is a wholly-owned subsidiary of Nationwide Corporation. All of the common stock of Nationwide Corporation is held by Nationwide Mutual Insurance Company (95.2%) and Nationwide Mutual Fire Insurance Company (4.8%), each of which is a mutual company owned by its policyholders
Under the terms of the Investment Advisory Agreement, the Fund pays GMF an investment advisory fee based on the Fund’s average daily net assets and the following schedule:
| Fee Schedule | Fees | |
$0 up to $500 million | 0.98% | |
$500 million up to $2 billion | 0.93% | |
$2 billion and more | 0.88% |
GMF and the Fund have entered into a written contract (“Expense Limitation Agreement”) that limits operating expenses (excluding any taxes, interest, brokerage fees, extraordinary expenses, short sale dividend expenses, Rule 12b-1 fees, and administrative service fees) from exceeding 1.23% for all classes until at least May 1, 2006.
GMF may request and receive reimbursement from the Fund of the advisory fees waived and other expenses reimbursed by GMF, respectively, pursuant to the Expense Limitation Agreement at a later date not to exceed three years from the fiscal year in which the corresponding reimbursement to the Fund was made, depending on the Fund (as described below), if the Fund has reached a sufficient asset size to permit reimbursement to be made without causing the total annual operating expense ratio of the Fund to exceed the limits set forth above. No reimbursement will be made unless: (i) the Fund’s assets exceed $100 million; (ii) the total annual expense ratio of the Class making such reimbursement is less than the limit set forth above; and (iii) the payment of such reimbursement is approved by the Board of Trustees on a quarterly basis. Except as provided for in the Expense Limitation Agreements, reimbursement of amounts previously waived or assumed by GMF is not permitted.
15
Table of Contents
GARTMORE VARIABLE INSURANCE TRUST
NOTES TO FINANCIAL STATEMENTS (Unaudited) (Continued)
June 30, 2005
As of the six months ended June 30, 2005, there were no cumulative potential reimbursements for all classes of shares of the Fund, based on reimbursements which expires within three years from the fiscal year in which the corresponding reimbursement to the Fund was made for expenses reimbursed by GMF.
Under the terms of a Fund Administration and Transfer Agency Agreement, Gartmore SA Capital Trust (“GSA”) provides the Fund with various administrative and accounting services, and Gartmore Investors Services, Inc. (“GISI”), an indirect subsidiary of GSA, serves as Transfer and Dividend Disbursing Agent for the Fund. The fees for the services provided under this Agreement are calculated based on the Trust’s average daily net assets according to the fee schedule below. The fees are then allocated proportionately among all funds within the Trust in relation to the average daily net assets of each fund and are paid to GSA. GSA pays GISI from these fees for its services.
| Combined Fee Schedule* | ||
Up to $1 billion | 0.13% | |
$1 billion and more up to $3 billion | 0.08% | |
$3 billion and more up to $8 billion | 0.05% | |
$8 billion and more up to $10 billion | 0.04% | |
$10 billion and more up to $12 billion | 0.02% | |
$12 billion or more | 0.01% | |
| * | The assets of the Gartmore GVIT Investor Destinations Aggressive Fund, the Gartmore GVIT Investor Destinations Moderately Aggressive Fund, the Gartmore GVIT Investor Destinations Moderate Fund, the Gartmore GVIT Investor Destinations Moderately Conservative Fund, and the Gartmore GVIT Investor Destinations Conservative Fund (collectively, the “Investor Destinations Funds”) are excluded from the Trust asset level amount in order to calculate this asset-based fee. The Investor Destinations Funds do not pay any part of this fee. |
Effective January 1, 2005, the fee for the fund administration and transfer agency services increased as set forth below. The fees are calculated based on the Trust’s average daily net assets according to the fee schedule below. The fees are then allocated proportionately among all funds within the Trust in relation to the average daily net assets of each fund and are paid to GSA.
| Combined Fee Schedule* | ||
Up to $1 billion | 0.15% | |
$1 billion and more up to $3 billion | 0.10% | |
$3 billion and more up to $8 billion | 0.05% | |
$8 billion and more up to $10 billion | 0.04% | |
$10 billion and more up to $12 billion | 0.02% | |
$12 billion or more | 0.01% |
| * | The assets of each of the Investor Destinations Funds are excluded from the Trust asset level amount in order to calculate this asset-based fee. The Investor Destinations Funds do not pay any part of this fee. |
GSA and GISI have entered into agreements with BISYS Fund Services Ohio, Inc. (“BISYS”), pursuant to which BISYS provides sub-administration and sub-transfer agency services, respectively, to the Fund.
Under the terms of a Distribution Plan under Rule 12b-1 of the 1940 Act, Gartmore Distribution Services, Inc. (“GDSI”), the Fund’s Distributor, is compensated by the Fund for expenses associated with the distribution of the Class II and Class VI shares of the Fund. These fees are based on average daily net assets of Class II and Class VI shares of the Fund at an annual rate not to exceed 0.25%.
Under the terms of an Administrative Services Plan, the Fund may pay fees to servicing organizations, such as broker-dealers, including Nationwide Financial Services, and financial institutions, which agree to provide administrative support services to the shareholders of certain classes. These services include, but are not limited, to the following: establishing and maintaining shareholder accounts; processing purchase and redemption transactions; arranging bank wires; performing
16
Table of Contents
GARTMORE VARIABLE INSURANCE TRUST
NOTES TO FINANCIAL STATEMENTS (Unaudited) (Continued)
June 30, 2005
shareholder sub-accounting; answering inquires regarding the Fund; and other such services. These fees are based on an annual rate of up to 0.25% of the average daily net assets of each class of shares of the Fund.
| 4. | Short-Term Trading Fees |
The Fund reserves the right to assess a short-term trading fee on certain transactions out of Class III and Class VI shares that a separate account makes on behalf of a variable insurance contract owner (the “contract owner”). A separate account that redeems Class III or Class VI shares on behalf of a contract owner may be subject to a 1.00% short-term trading fee if the separate account held the Class III or Class VI shares on behalf of the contract owner for 60 days or less, unless an exception applies as disclosed in the prospectus. The short-term trading fee is paid directly to the Fund and is intended to offset the cost to the Fund of excess brokerage commissions and other costs associated with fluctuations in fund asset levels and cash flow caused by short-term trading. For purposes of determining whether the short-term trading fee applies, the Class III or Class VI shares that were held on behalf of the contract owner the longest will be treated as being redeemed first.
For the six months ended June 30, 2005, the Fund had no contributions to capital due to collection of redemption fees.
| 5. | Investment Transactions |
For the six months ended June 30, 2005, (excluding short-term securities) the Fund had purchases of $113,663,791 and sales of $121,790,111.
| 6. | Bank Loans |
The Trust has a credit agreement of $100,000,000. Borrowings under this arrangement bear interest at the Federal Funds rate plus 0.50%. The interest costs are included in custodian fees in the Statement of Operations. No compensation balances were required under the terms of the line of credit. There were no borrowings outstanding as of June 30, 2005.
| 7. | Shareholder Meeting |
A separate shareholders meeting was held on Tuesday, December 23, 2004, for the shareholders of the Trust’s predecessor pursuant to a Proxy Statement On Schedule 14A, dated October 29, 2004, and mailed to the shareholders of the Trust’s predecessor on or around November 5, 2004.
Two Proposals: The purpose of the December 23, 2004 meeting was to allow the shareholders of the Trust’s predecessor to vote on:
| i. | Proposal One: The election of the Trust’s Board of Trustees; and |
| ii. | Proposal Two: The approval of an “Agreement and Plan of Reorganization” that provided for the reorganization of the Trust from a Massachusetts business trust into a Delaware statutory trust. |
Proposal One: As set forth in the October 29, 2004 Proxy Statement, the nominees for election as Trustees of the Trust’s predecessor were: Charles E. Allen, Michael J. Baresich, Paula H.J. Cholmondeley, C. Brent DeVore, Phyllis Kay Dryden, Robert M. Duncan, Barbara L. Hennigar, Paul J. Hondros, Barbara I Jacobs, Thomas J. Kerr IV, Douglas F. Kridler, Michael D. McCarthy, Arden L. Shisler, and David C. Wetmore.
Proposal Two: As specifically set forth in the October 29, 2004 Proxy Statement, the Reorganization proposal requested the shareholders of the Trust’s predecessor to approve the proposed “Agreement and Plan of Reorganization” of the Trust’s predecessor (on behalf of each of the its funds) into a new Delaware-domiciled Trust, whereby the Funds of the new Delaware Trust would acquire all of the assets of the corresponding funds of the Trust’s predecessor subject to the liabilities, expenses, costs, charges, and reserves of the corresponding funds of the Trust’s predecessor (contingent or otherwise), in exchange for shares of the acquiring Funds to be distributed pro rata by the Trust to the holders of the shares of the funds of the Trust’s predecessor, in a complete liquidation of the Trust’s predecessor.
17
Table of Contents
GARTMORE VARIABLE INSURANCE TRUST
NOTES TO FINANCIAL STATEMENTS (Unaudited) (Continued)
June 30, 2005
Voting Results:
The shareholders of the Trust’s predecessor voted to approve both Proposal One and Proposal Two, as follows:
Proposal 1: Election of a Board of Trustees of Gartmore Variable Insurance Trust
Charles E. Allen: | ||
FOR | 2,797,230,318.955 shares (96.078%) | |
WITHHOLD | 114,195,693.660 shares (3.922%) | |
TOTAL | 2,912,726,012.615 shares (100.000%) | |
Michael J. Baresich: | ||
FOR | 2,796,135,979.559 shares (96.040%) | |
WITHHOLD | 115,290,033.056 shares (3.960%) | |
TOTAL | 2,912,726,012.615 shares (100.000%) | |
Paula H.J. Cholmondeley: | ||
FOR | 2,795,095,945.396 shares (96.004%) | |
WITHHOLD | 116,330,067.219 shares (3.996%) | |
TOTAL | 2,912,726,012.615 shares (100.000%) | |
C. Brent DeVore: | ||
FOR | 2,797,207,046.916 shares (96.077%) | |
WITHHOLD | 114,218,965.699 shares (3.923%) | |
TOTAL | 2,912,726,012.615 shares (100.000%) | |
Phyllis Kay Dryden: | ||
FOR | 2,795,587,023.994 shares (96.021%) | |
WITHHOLD | 115,838,988.621 shares (3.979%) | |
TOTAL | 2,912,726,012.615 shares (100.000%) | |
Robert M. Duncan: | ||
FOR | 2,790,191,720.503 shares (95.836%) | |
WITHHOLD | 121,234,292.112 shares (4.164%) | |
TOTAL | 2,912,726,012.615 shares (100.000%) | |
Barbara L. Hennigar: | ||
FOR | 2,792,939,848.858 shares (95.937%) | |
WITHHOLD | 118,486,163.757 shares (4.070%) | |
TOTAL | 2,912,726,012.615 shares (100.000%) | |
Paul J. Hondros: | ||
FOR | 2,797,557,404.448 shares (96.089%) | |
WITHHOLD | 113,868,608.167 shares (3.911%) | |
TOTAL | 2,912,726,012.615 shares (100.000%) | |
18
Table of Contents
GARTMORE VARIABLE INSURANCE TRUST
NOTES TO FINANCIAL STATEMENTS (Unaudited) (Continued)
June 30, 2005
Barbara I. Jacobs: | ||
FOR | 2,796,306,126.654 shares (96.046%) | |
WITHHOLD | 115,119,885.961 shares (3.954%) | |
TOTAL | 2,912,726,012.615 shares (100.000%) | |
Thomas J. Kerr IV: | ||
FOR | 2,789,755,720.087 shares (95.821%) | |
WITHHOLD | 121,670,292.528 shares (4.179%) | |
TOTAL | 2,912,726,012.615 shares (100.000%) | |
Douglas F. Kridler: | ||
FOR | 2,798,065,774.375 shares (96.106%) | |
WITHHOLD | 113,360,238.240 shares (3.894%) | |
TOTAL | 2,912,726,012.615 shares (100.000%) | |
Michael D. McCarthy: | ||
FOR | 2,797,452,613.694 shares (96.085%) | |
WITHHOLD | 113,973,395.921 shares (3.915%) | |
TOTAL | 2,912,726,012.615 shares (100.000%) | |
Arden L. Shisler: | ||
FOR | 2,796,738,454.730 shares (96.061%) | |
WITHHOLD | 114,687,557.885 shares (3.939%) | |
TOTAL | 2,912,726,012.615 shares (100.000%) | |
David C. Wetmore: | ||
FOR | 2,794,784,752.247 shares (95.994%) | |
WITHHOLD | 116,641,260.368 shares (4.006%) | |
TOTAL | 2,912,726,012.615 shares (100.000%) | |
Proposal 2: Approval of the Agreement and Plan of Reorganization of Gartmore Variable Insurance Trust
FOR | 2,561,003,822.546 shares (87.964%) | |
AGAINST | 103,593,261.010 shares (3.558%) | |
ABSTAIN | 246,828,929.059 shares (8.478%) | |
TOTAL | 2,912,726,012.615 shares (100.000%) | |
19
Table of Contents
GARTMORE VARIABLE INSURANCE TRUST
NOTES TO FINANCIAL STATEMENTS (Unaudited) (Continued)
June 30, 2005
| 8. | Subsequent Event |
On July 29, 2005, the Trust filed a Post-Effective Amendment to its Registration Statement on Form N-1A to change the structure of the Fund’s investment advisory fee from the current asset-based fee structure to a performance based fee structure on or about October 1, 2005. On that date, or, if later, upon SEC effectiveness, the Fund will immediately lower its base advisory fee by 0.10% at each breakpoint. Beginning one year after implementation of the new performance fee structure, the Fund’s base advisory fee may be adjusted proportionately upward or downward if the Fund outperforms or underperforms its stated benchmark by the following amounts:
| Out or Underperformance | Change in Fees | |
+/- 1 percentage point | +/- 0.02% | |
+/- 2 percentage points | +/- 0.04% | |
+/- 3 percentage points | +/- 0.06% | |
+/- 4 percentage points | +/- 0.08% | |
+/- 5 percentage points | +/- 0.10% |
The prospectus describing the above Fund will be supplemented upon the effectiveness of the Post-Effective Amendment to the Trust’s Registration Statement. Please refer to the prospectus, as supplemented by a notice you will receive after the effectiveness of the Post-Effective Amendment, for further information about this new fee structure.
20
Table of Contents
GARTMORE VARIABLE INSURANCE TRUST
Management Information (Unaudited)
June 30, 2005
Trustees who are not Interested Persons (as defined in the 1940 Act) and Officers of the Funds June 30, 2005
| Name, Address and Date of Birth | Position(s) Held with the Trust and Length of Time Served1 | Principal Occupation(s) During Past 5 Years | Number of Portfolios in the Gartmore Fund Complex Overseen by Trustee | Other Directorships Held by Trustee or Nominee2 | ||||
Charles E. Allen
c/o Gartmore Global Investments, Inc. 1200 River Road, Suite 1000 Conshohocken, PA 19428
1948 | Trustee since July 2000 | Mr. Allen is Chairman, Chief Executive Officer and President of the Graimark Realty Advisors, Inc. (real estate development, investment and asset management). | 84 | None | ||||
Paula H.J. Cholmondeley
c/o Gartmore Global Investments, Inc. 1200 River Road, Suite 1000 Conshohocken, PA 19428
1940 | Trustee since July 2000 | Ms. Cholmondeley has been the Chairman and Chief Executive Officer of the Sorrel Group, a management consulting company, since January 2004. From March 2000 through December 2003, Ms. Cholmondeley was Vice President and General Manager of Sappi Fine Paper North America. Prior thereto, Ms. Cholmondeley was Vice President and General Manager of Residential Insulation of Owens Corning. | 84 | Director of Dentsply International, Inc., Ultralife Batteries, Inc., Terex Corporation, Minerals Technology, Inc. and Albany International Corp. | ||||
C. Brent DeVore
c/o Gartmore Global Investments, Inc. 1200 River Road, Suite 1000 Conshohocken, PA 19428
1940 | Trustee since 1990 | Dr. DeVore is President of Otterbein College. | 84 | None | ||||
Phyllis K. Dryden
c/o Gartmore Global Investments, Inc. 1200 River Road, Suite 1000 Conshohocken, PA 19428
1947 | Trustee since December 2004 | Ms. Dryden was a former Managing Partner of marchFIRST, a global management consulting firm prior to 2002. | 84 | None |
21
Table of Contents
GARTMORE VARIABLE INSURANCE TRUST
Management Information (Unaudited)
June 30, 2005
| Name, Address and Date of Birth | Position(s) Held with the Trust and Length of Time Served1 | Principal Occupation(s) During Past 5 Years | Number of Portfolios in the Gartmore Fund Complex Overseen by Trustee | Other Directorships Held by Trustee or Nominee2 | ||||
Barbara L. Hennigar*
c/o Gartmore Global Investments, Inc. 1200 River Road, Suite 1000 Conshohocken, PA 19428
1935 | Trustee since July 2000 | Retired since June 2000. Prior thereto, Ms. Hennigar was the Chairman or President and Chief Executive Officer of OppenheimerFunds Services and a member of the Executive Committee of OppenheimerFunds. | 84 | None | ||||
Barbara I. Jacobs
c/o Gartmore Global Investments, Inc. 1200 River Road, Suite 1000 Conshohocken, PA 19428
1950 | Trustee since December 2004 | Ms. Jacobs has served as Chairman of the Board of Directors of KICAP Network Fund, a European (United Kingdom) hedge fund, since December 2000. Prior to 2004, Ms. Jacobs was also a Managing Director and European Portfolio Manager with CREF Investments (Teachers Insurance Annuity Association — College Retirement Equity Fund). | 84 | None | ||||
Douglas F. Kridler
c/o Gartmore Global Investments, Inc. 1200 River Road, Suite 1000 Conshohocken, PA 19428
1955 | Trustee since September 1997 | Mr. Kridler has served as the President and Chief Executive Officer of the Columbus Foundation (a Columbus, OH-based foundation which manages over 1,300 individual endowment funds) since February 2002. Mr. Kridler was the President of the Columbus Association for the Performing Arts prior thereto and Chairman of the Greater Columbus Convention and Visitors Bureau during 2000 and 2001. | 84 | None | ||||
Michael D. McCarthy
c/o Gartmore Global Investments, Inc. 1200 River Road, Suite 1000 Conshohocken, PA 19428
1947 | Trustee since December 2004 | Mr. McCarthy serves as: the Founder and Chairman of The Eureka Foundation (which sponsors and funds the “Great Museums” series on PBS); and a Partner of Pineville Properties LLC (a commercial real estate development firm). | 843 | None |
22
Table of Contents
GARTMORE VARIABLE INSURANCE TRUST
Management Information (Unaudited)
June 30, 2005
| Name, Address and Date of Birth | Position(s) Held with the Trust and Length of Time Served1 | Principal Occupation(s) During Past 5 Years | Number of Portfolios in the Gartmore Fund Complex Overseen by Trustee | Other Directorships Held by Trustee or Nominee2 | ||||
David C. Wetmore
c/o Gartmore Global Investments, Inc. 1200 River Road, Suite 1000 Conshohocken, PA 19428
1948 | Trustee since 1995 and Chairman since February 2005 | Retired. Mr. Wetmore was formerly a Managing Director of Updata Capital, an investment banking and venture capital firm. | 84 | None |
| * | Pursuant to the Trust’s mandatory retirement policy, Ms. Hennigar is expected to retire on or about January 12, 2006. |
| 1 | The term of office length is until a trustee resigns or reaches a mandatory retirement age of 70. On March 2, 2000, the Board adopted a five-year implementation period for any Trustee 65 or older as of the adoption of this policy. Pursuant to this policy, Messrs. Duncan and Kerr retired as trustees effective as of March 12, 2005. |
| 2 | Directorships held in (1) any other investment companies registered under the 1940 Act, (2) any company with a class of securities registered pursuant to Section 12 of the Securities Exchange Act of 1934, as amended (the “Exchange Act”), or (3) any company subject to the requirements of Section 15(d) of the Exchange Act. |
| 3 | Mr. McCarthy was also an Administrative Committee Member for the Alphagen Arneb Fund, LLC, The Healthcare Fund LDC, The Leaders Long-Short Fund, LLC, and The Leaders Long-Short Fund LDC, four private investment companies (hedge funds) managed by GSA. Mr. McCarthy resigned as an Administrative Committee Member effective June 30, 2005. |
Trustees and Officers who are not Interested Persons (as defined in the 1940 Act) of the Funds received aggregate compensation of $274,882 from the Trust for the Six Months Ended June 30, 2005. Additional information regarding the Trustees and Officers may be found in the Trust’s statement of additional information, which is available without charge upon request, by calling 1-800-848-0920.
23
Table of Contents
GARTMORE VARIABLE INSURANCE TRUST
Management Information (Unaudited)
June 30, 2005
Trustees who are Interested Persons (as defined in the 1940 Act) and/or Officers of the Funds June 30, 2005
| Name, Address and Age | Position(s) Held with the Trust and Length of Time Served1 | Principal Occupation(s) During Past 5 Years | Number of Portfolios in the Gartmore Fund Complex Overseen by Trustee | Other Directorships Held by Trustee2 | ||||
Paul J. Hondros
Gartmore Global Investments, Inc. 1200 River Road, Suite 1000 Conshohocken, PA 19428
1948 | Trustee since July 2000 | Mr. Hondros has been President and Chief Executive Officer of various Gartmore entities, including Gartmore Distribution Services, Inc. (“GDSI”),3 Gartmore Investor Services, Inc. (“GISI”),3 Gartmore Morley Capital Management, Inc. (“GMCM”),3 Gartmore Morley Financial Services, Inc. (“GMFS”),3 NorthPointe Capital, LLC (“NorthPointe”),3 Gartmore Global Asset Management Trust (“GGAMT”)3, Gartmore Global Investments, Inc. (“GGI”)3, Gartmore Mutual Fund Capital Trust (“GMFCT”)3 and Gartmore SA Capital Trust (“GSA”)3; and a Director of Nationwide Securities, Inc.3, as well as several entities within Nationwide Financial Services, Inc. | 844 | None | ||||
Arden L. Shisler
c/o Gartmore Global Investments, Inc. 1200 River Road, Suite 1000 Conshohocken, PA 19428
1941 | Trustee since February 2000 | Mr. Shisler has been a consultant since January 2003. Prior thereto, he was President and Chief Executive Officer of K&B Transport, Inc., a trucking firm. Since 1992, Mr. Shisler has also been Chairman of the Board for Nationwide Mutual Insurance Company3. | 84 | Director of Nationwide Financial Services, Inc. | ||||
Gerald J. Holland
Gartmore Global Investments, Inc. 1200 River Road, Suite 1000 Conshohocken, PA 19428
1951 | Treasurer since March 2001 | Mr. Holland is Senior Vice President — Operations for GGI3, GMFCT3, and GSA3. Prior to July 2000, Mr, Holland was Vice President for First Data Investor Services, an investment company service provider. | 84 | None |
24
Table of Contents
GARTMORE VARIABLE INSURANCE TRUST
Management Information (Unaudited)
June 30, 2005
| Name, Address and Age | Position(s) Held with the Trust and Length of Time Served1 | Principal Occupation(s) During Past 5 Years | Number of Portfolios in the Gartmore Fund Complex Overseen by Trustee | Other Directorships Held by Trustee2 | ||||
Michael A. Krulikowski
Gartmore Global Investments, Inc. 1200 River Road, Suite 1000 Conshohocken, PA 19428
1959 | Chief Compliance Officer since June 2004 | Since November 1999, Mr. Krulikowski has served as a Vice President and Chief Compliance Officer of GGI. Prior thereto, Mr. Krulikowski served as Chief Compliance Officer of 1717 Capital Management Company/Provident Mutual Insurance Company. | 84 | None | ||||
Eric E. Miller
Gartmore Global Investments, Inc. 1200 River Road, Suite 1000 Conshohocken, PA 19428
1953 | Secretary since December 2002 | Mr. Miller is Senior Vice President, Chief Counsel for GGI3, GMFCT3 and GSA3 since August 2002. From August 2000 to August 2002, Mr. Miller was a Partner with Stradley Ronan Stevens & Young, LLP. Prior to August 2000, Mr. Miller served as Senior Vice President and Deputy General Counsel at Delaware Investments. | 84 | None |
| 1 | The term of office length is until a trustee resigns or reaches a mandatory retirement age of 70. On March 2, 2000, the Board adopted a five-year implementation period for any Trustee 65 or older as of the adoption of this policy. Pursuant to this policy, Messrs. Duncan and Kerr retired as trustees effective as of March 12, 2005. |
| 2 | Directorships held in (1) any other investment companies registered under the 1940 Act, (2) any company with a class of securities registered pursuant to Section 12 of the Securities Exchange Act of 1934, as amended (the “Exchange Act”), or (3) any company subject to the requirements of Section 15(d) of the Exchange Act. |
| 3 | This position is held with an affiliated person or principal underwriter of the Trust. |
| 4 | Mr. Hondros was also an Administrative Committee Member for the Alphagen Arneb Fund, LLC, The Healthcare Fund LDC, The Leaders Long-Short Fund, LLC, and The Leaders Long-Short Fund LDC, four private investment companies (hedge funds) managed by GSA. Mr. Hondros resigned as Administrative Committee Member effective June 30, 2005. |
Federal law requires the Trust, each of its investment advisers and sub-advisers to adopt procedures for voting proxies (“Proxy Voting Guidelines”) and to provide a summary of those Proxy Voting Guidelines used to vote the securities held by the Funds. The Funds’ proxy voting policies and procedures are available without charge (i) upon request, by calling 1-800-848-0920, (ii) on the Fund’s website at www.gartmorefunds.com, or (iii) on the Securities and Exchange Commission’s website at www.sec.gov.
25
Table of Contents
Gartmore GVIT Global Health Sciences Fund
Semiannual Report
| | June 30, 2005 |
| Contents | ||
| 6 | Statement of Investments | |
| 8 | Statement of Assets and Liabilities | |
| 8 | Statement of Operations | |
| 9 | Statements of Changes in Net Assets | |
| 11 | Financial Highlights | |
| 12 | Notes to Financial Statements | |
Commentary provided by Gartmore Global Investments, investment adviser to Gartmore Variable Insurance Trust. All opinions and estimates included in this report constitute Gartmore Global Investments’ judgment as of the date of this report and are subject to change without notice.
Statement Regarding Availability of Quarterly Portfolio Schedule.
The Gartmore Variable Insurance Trust files complete schedules of portfolio holdings for each Fund with the Securities and Exchange Commission (the “Commission”) for the first and third quarters of each fiscal year on Form N-Q. The Funds’ Forms N-Q are available on the Commission’s website at http://www.sec.gov. The Funds’ Forms N-Q may be reviewed and copied at the Commission’s Public Reference Room in Washington, DC, and information on the operation of the Public Reference Room may be obtained by calling 800-SEC-0330; and the Funds make the information on Form N-Q available to shareholders upon request without charge.
Statement Regarding Availability of Proxy Voting Record.
Information regarding how the Fund voted proxies relating to portfolio securities held during the most recent 12-month period ended June 30, 2005 is available without charge, upon request, by calling 800-848-0920, and on the Commission’s website at http://www.sec.gov.
Table of Contents
Gartmore GVIT Global Health Sciences Fund
For the semiannual period ended June 30, 2005, the Gartmore GVIT Global Health Sciences Fund returned 3.03% (Class I at NAV) versus 5.95% for its benchmark, the Goldman Sachs Healthcare Index.
Health-care stocks experienced a mediocre first quarter, as product controversies continued to dog the pharmaceuticals and biotechnology industries. However, investor sentiment turned more positive in the second quarter, and the health-care sector strongly outperformed the rest of the market, especially in April. Compared with the benchmark, the Fund’s most negative performance factor was its overweighting and unfavorable stock selection in biotechnology. Unfavorable stock selection in the pharmaceuticals group and an underweight position in the health-care providers and services industry, by far the health-care sector’s best-performing segment during the reporting period, also hurt Fund returns relative to the benchmark.
Among individual holdings, one of the biggest detractors to Fund performance was Biogen Idec Inc., one of the two companies that jointly developed Tysabri, a biotechnology treatment for multiple sclerosis. The drug was a subject of controversy during the first quarter after two patients taking the medication developed a rare and fatal brain disease. In February, the two companies voluntarily removed Tysabri from the market, the first such setback for the biotechnology industry. Due to our uncertainty about Tysabri’s chances for returning to market, we sold Biogen Idec. Also turning in a disappointing performance for the Fund was Valeant Pharmaceuticals Inc., one of the Fund’s mid-cap holdings. Increasing competition in the market for hepatitis B drugs, one area of focus for the company, led us to sell our position at a loss in the first quarter. Relative to the benchmark, our underweighting in Genentech, Inc. hurt Fund returns, because the stock gained almost 50% during the reporting period.
On the positive side, the Fund’s performance was helped by biotechnology stock Gilead Sciences, Inc., marketer of a new HIV drug that was capturing market share. Another strong performer was HMO UnitedHealth Group Inc., whose profits were boosted by a widening spread between premiums charged and costs incurred. Furthermore, investors became increasingly positive on the HMO sector as the likelihood increased that a prescription drug benefit favorable to the industry would be added to Medicare in 2006. Partly in response to this development, we added significantly to the Fund’s position in PacifiCare Health Systems, Inc., another HMO that aided Fund performance; the company derives about 50% of its revenues from Medicare reimbursements.
Looking ahead, we are more positive on the health-care sector than we have been in quite some time. Valuations in the group are attractive and sentiment is negative, a combination that often coincides with a bottoming in share prices. Given our positive outlook, we have been adding to the Fund’s biotechnology holdings, a move designed to provide the Fund with more upside potential. In addition, we are reducing the Fund’s average capitalization size, buying more small- and mid-cap names because of their more attractive valuations. Accompanying this shift, we are increasing the number of stocks in the Fund for diversification purposes.
PORTFOLIO MANAGER: Paul Cluskey
International investing involves additional risks, including currency fluctuations, differences in accounting standards, political instability and foreign regulations, all of which are magnified in emerging markets.
Investing in mutual funds involves risk, including possible loss of principal.
There is no assurance that the investment objective of any fund will be achieved.
Funds that concentrate on specific sectors or a relatively small number of securities may be subject to greater volatility than a more diversified investment.
There is no assurance that a diversified portfolio will produce better results than a nondiversified one.
Goldman Sachs Healthcare Index: An unmanaged, market capitalization-weighted index that is generally representative of the stocks in the health-care sector.
Lipper Analytical Services, Inc. is an industry research firm whose rankings are based on total return performance and do not reflect the effects of sales charges.
The Gartmore Variable Insurance Trust Funds are available only as sub-account investment options in certain variable insurance products. Accordingly, investors are unable to invest in shares of these funds outside of an insurance product. Performance information found herein reflects only the performance of these funds, and does not indicate the performance your sub-account may experience under your variable insurance contract. Performance returns assume reinvestment of all distributions. The investment return and principal value of an investment will fluctuate so that an investor’s shares, when redeemed, may be worth more or less than their original cost. Index performance is provided for comparison purposes only; the indexes shown are unmanaged and do not reflect any fees or expenses. Investors cannot invest directly in market indexes. To obtain performance information about the sub-account option under your insurance contract that invests
1
Table of Contents
Gartmore GVIT Global Health Sciences Fund (continued)
in one of these funds, please contact your variable insurance carrier. PAST PERFORMANCE IS NO GUARANTEE OF FUTURE RESULTS.
Commentary provided by Gartmore Global Investments. All opinions and estimates included in this report constitute Gartmore Global Investments’ judgment as of the date of this report and are subject to change without notice.
Investors should carefully consider a fund’s investment objectives, risks, fees, charges and expenses before investing any money. To obtain this and other information on Gartmore Variable Insurance Trust, please contact your variable insurance contract provider or call 800-848-0920. Please read the Trust’s prospectus carefully before investing any money.
Gartmore Funds distributed by Gartmore Distribution Services, Inc., Member NASD. 1200 River Road, Suite 1000, Conshohocken, PA 19428.
2
Table of Contents
Fund Performance | Gartmore GVIT Global Health Sciences Fund |
| Average | Annual Total Return1 |
(For Periods Ended June 30, 2005)
| Six months* | One year | Inception2 | ||||
| Class I3 | 3.03% | 4.70% | 5.02% | |||
| Class II3 | 2.95% | 4.52% | 4.92% | |||
| Class III3 | 3.03% | 4.69% | 5.06% | |||
| Class VI4 | 2.93% | 4.59% | 5.00% |
| * | Not Annualized. |
| 1 | Not subject to any sales charges. |
| 2 | Fund commenced operations on December 29, 2000. |
| 3 | These returns until the creation of the Class II shares (March 28, 2003) are based on the performance of the Class I shares of the Fund until December 28, 2001 and on the performance of Class III shares of the Fund for the remainder of the period. These returns for Class I shares from December 29, 2001 until May 5, 2002 are based on the performance of Class III shares because no Class I shares were outstanding during that period. These returns until the creation of Class III shares (December 29, 2001) are based on the performance of Class I shares. Excluding the effect of any fee waivers or reimbursements, such prior performance is similar to what each class would have produced because all classes of shares invest in the same portfolio of securities. For Class II shares, these returns have been restated to reflect the additional fees applicable to Class II shares and therefore are lower than those of Class I. For Class III shares, these returns do not reflect the short-term trading fees applicable to such shares; if these fees were reflected, the annual returns for Class III shares would have been lower. If these fees were reflected, returns would be less than those shown. |
| 4 | These returns through December 31, 2003 were achieved prior to the creation of Class VI shares and include the performance of the Fund’s Class I shares, from December 29, 2000 to December 28, 2001 and the performance of Class III shares for the remainder of that period. Excluding the effect of any fee waivers or reimbursements, such prior performance is similar to what Class VI shares would have produced because Class VI shares invest in the same portfolio of securities. Class VI shares’ annual returns have been restated to reflect the additional fees applicable to Class VI shares and are therefore lower than Class I shares. Additionally, Class VI shares’ returns do not reflect the short-term trading fees applicable to such shares; if these fees were deducted, the annual returns for Class VI shares earned by the variable contract owner would have been lower. |
| Performance | of a $10,000 Investment |
Investment return and principal value will fluctuate, and when redeemed, shares may be worth more or less than original cost. Past performance is no guarantee of future results and does not reflect the deduction of taxes that a shareholder would pay on fund distributions or the redemption of fund shares. Investing in mutual funds involves market risk, including loss of principal. Performance returns assume the reinvestment of all distributions.
Comparative performance of $10,000 invested in Class III shares of the Gartmore GVIT Global Health Sciences Fund, the Goldman Sachs Healthcare Index (GS Healthcare)(a), and the Consumer Price Index (CPI)(b) since inception. Unlike the Fund, the returns for these unmanaged indexes do not reflect any fees, expenses, or sales charges. Investors cannot invest directly in market indexes.
| (a) | The GS Healthcare is an unmanaged market capitalization-weighted index that is generally representative of the stocks in the health-care sector. |
| (b) | The CPI represents changes in prices of a basket of goods and services purchased for consumption by urban households. |
3
Table of Contents
Shareholder
Expense Example | Gartmore GVIT Global Health Sciences Fund |
As a shareholder of the Fund, you incur two types of costs: (1) transaction costs, including sales charges (loads) paid on purchase payments and redemption fees; and (2) ongoing costs, including investment advisory fees, administration fees, distribution fees and other Fund expenses. The examples below are intended to help you understand your ongoing costs (in dollars) of investing in the Fund and to compare these costs with the ongoing costs of investing in other mutual funds. Per SEC requirements, the examples assume that you had a $1,000 investment in the Class at the beginning of the reporting period, January 1, 2005, and continued to hold your shares at the end of the reporting period, June 30, 2005.
Actual Expenses
For each Class of the Fund in the table below, the first line provides information about actual account values and actual expenses. You may use the information in this line, together with the amount you invested, to estimate the expenses that you paid over the period. Simply divide your account value by $1,000 (for example, an $8,600 account value divided by $1,000 = 8.6), then multiply the result by the number in the first line of each Class under the heading entitled “Expenses Paid During Period” to estimate the expenses you paid on your account during the period.
Hypothetical Example for Comparison Purposes
The second line of each Class in the table below provides information about hypothetical account values and hypothetical expenses based on the Class’ actual expense ratio and an assumed rate of return of 5% per year before expenses, which is not the Class’ actual return. The hypothetical account values and expenses may not be used to estimate the actual ending account balance or expenses you paid for the period. You may use this information to compare the ongoing costs of investing in the Class of the Fund and other funds. To do so, compare this 5% hypothetical example with the 5% hypothetical examples that appear in the shareholder reports of the other funds.
Please note that the expenses shown in the table are meant to highlight your ongoing costs only and do not reflect any transaction costs, such as sales charges (loads) or redemption fees. Therefore, the second line for each Class in the table is useful in comparing ongoing costs only, and will not help you determine the relative total costs of owning different funds. In addition, if these transaction costs were included, your costs would have been higher. The examples also assume all dividends and distributions have been reinvested.
| Beginning Account Value, January 1, 2005 | Ending Account Value, June 30, 2005 | Expenses Paid During Period* | Annualized Expense Ratio* | ||||||||||
| Global Health Sciences Fund | |||||||||||||
Class I | Actual | $ | 1,000 | $ | 1,030 | $ | 6.29 | 1.25% | |||||
| Hypothetical1 | $ | 1,000 | $ | 1,019 | $ | 6.28 | 1.25% | ||||||
Class II | Actual | $ | 1,000 | $ | 1,030 | $ | 7.55 | 1.50% | |||||
| Hypothetical1 | $ | 1,000 | $ | 1,018 | $ | 7.53 | 1.50% | ||||||
Class III | Actual | $ | 1,000 | $ | 1,030 | $ | 6.29 | 1.25% | |||||
| Hypothetical1 | $ | 1,000 | $ | 1,019 | $ | 6.28 | 1.25% | ||||||
Class VI | Actual | $ | 1,000 | $ | 1,029 | $ | 6.84 | 1.36% | |||||
| Hypothetical1 | $ | 1,000 | $ | 1,018 | $ | 6.83 | 1.36% | ||||||
| * | Expenses are equal to the Fund’s annualized expense ratio multiplied by the average account value over the period multiplied by 181/365 (to reflect the one-half year period). The expense ratio presented represents a six month, annualized ratio in accordance with SEC guidelines. |
| 1 | Represents the hypothetical 5% return before expenses. |
4
Table of Contents
Portfolio Summary
(June 30, 2005) | Gartmore GVIT Global Health Sciences Fund |
The SEC adopted a requirement that Funds present their portfolio holdings in a table, chart or graph format in their annual and semiannual reports to shareholders, whether or not a statement of investments is utilized. The following tables, which present portfolio holdings as a percentage of net assets, are provided in compliance with this requirement.
| Asset Allocation | ||
| Common Stocks | 93.7% | |
| Cash Equivalents | 7.7% | |
| Mutual Fund | 4.9% | |
| Other Investments* | 11.1% | |
| Liabilities in excess of other assets** | -17.4% | |
| 100.0% | ||
| Top Holdings*** | ||
| Johnson & Johnson | 8.6% | |
| Pfizer, Inc. | 5.2% | |
| UnitedHealth Group, Inc. | 5.0% | |
| NASDAQ Biotechnology Index Fund | 4.9% | |
| Genentech, Inc. | 4.7% | |
| Amgen, Inc. | 4.6% | |
| Abbott Laboratories | 4.4% | |
| Wyeth | 3.8% | |
| Eli Lilly & Co. | 3.6% | |
| Medtronic, Inc. | 3.4% | |
| Other Holdings | 51.8% | |
| 100.0% | ||
| Top Industries | ||
| Drugs | 28.6% | |
| Medical Products | 17.8% | |
| Insurance | 16.6% | |
| Therapeutics | 7.3 % | |
| Medical Instruments | 6.8 % | |
| Medical Services | 6.3 % | |
| Exchange Traded Funds | 4.9 % | |
| Medical — Biomedical/Genetic | 3.8 % | |
| Hospitals | 3.4 % | |
| Medical Supplies | 1.1 % | |
| Other Industries | 3.4 % | |
| 100.0% | ||
| * | Includes value of collateral received from securities lending. |
| ** | Includes value of collateral owed from securities lending. |
| *** | For purpose of listing top holdings, repurchase agreements are considered cash equivalents and are included as part of Other Holdings. |
5
Table of Contents
GARTMORE VARIABLE INSURANCE TRUST
GARTMORE GVIT GLOBAL HEALTH SCIENCES FUND
Statement of Investments — June 30, 2005 (Unaudited)
Shares or Principal Amount | Value | ||||
| COMMON STOCKS (93.7%) | |||||
| Drugs (28.6%) | |||||
| Abbott Laboratories | 59,280 | $2,905,313 | |||
| Allion Healthcare, Inc. (b) | 11,910 | 195,348 | |||
| Amgen, Inc. (b) | 51,010 | 3,084,065 | |||
| Eli Lilly & Co. | 42,770 | 2,382,717 | |||
| Forest Laboratories, Inc. (b) | 17,500 | 679,875 | |||
| GlaxoSmithKline PLC ADR — GB | 24,970 | 1,211,295 | |||
| Pfizer, Inc. | 125,298 | 3,455,719 | |||
| Roche Holding AG — CH | 10,190 | 1,285,744 | |||
| Schering-Plough Corp. | 34,200 | 651,852 | |||
| Sepracor, Inc. (b) | 10,945 | 656,809 | |||
| Wyeth | 56,730 | 2,524,485 | |||
| 19,033,222 | |||||
| Hospitals (3.4%) | |||||
| Community Health Systems, Inc. (b) | 16,360 | 618,244 | |||
| LifePoint Hospitals, Inc. (b) | 19,380 | 979,078 | |||
| Triad Hospitals, Inc. (b) | 12,510 | 683,546 | |||
| 2,280,868 | |||||
| Insurance (16.6%) | |||||
| CIGNA Corp. | 10,810 | 1,156,994 | |||
| Coventry Health Care, Inc. (b) | 10,300 | 728,725 | |||
| Humana, Inc. (b) | 23,430 | 931,108 | |||
| PacifiCare Health Systems, Inc. (b) | 30,340 | 2,167,793 | |||
| UnitedHealth Group, Inc. | 63,720 | 3,322,361 | |||
| Universal American Financial Corp (b) | 29,000 | 655,980 | |||
| WellPoint, Inc. (b) | 29,720 | 2,069,701 | |||
| 11,032,662 | |||||
| Medical—Biomedical & Genetic (3.8%) | |||||
| Affymetrix, Inc. (b) | 12,740 | 687,068 | |||
| Alexion Pharmaceuticals, Inc. (b) | 16,110 | 371,174 | |||
| Encysive Pharmaceuticals, Inc. (b) | 32,920 | 355,865 | |||
| Invitrogen Corp. (b) | 8,860 | 737,950 | |||
| Protein Design Labs, Inc. (b) | 17,670 | 357,111 | |||
| 2,509,168 | |||||
| Medical Instruments (6.8%) | |||||
| Beckman Coulter, Inc. | 20,300 | 1,290,471 | |||
| Guidant Corp. | 20,420 | 1,374,266 | |||
Shares or Principal Amount | Value | ||||
| COMMON STOCKS (continued) | |||||
| Medical Instruments (continued) | |||||
| St. Jude Medical, Inc. (b) | 43,410 | $ | 1,893,110 | ||
| 4,557,847 | |||||
| Medical Laboratories (1.0%) | |||||
| Laboratory Corporation of America Holdings (b) | 13,290 | 663,171 | |||
| Medical Products (17.8%) | |||||
| Bard (C.R.), Inc. | 20,260 | 1,347,493 | |||
| Baxter International, Inc. | 33,300 | 1,235,430 | |||
| Diagnostic Products Corp. | 5,710 | 270,254 | |||
| Immucor, Inc. (b) | 12,040 | 348,558 | |||
| Johnson & Johnson | 88,230 | 5,734,949 | |||
| Medtronic, Inc. | 43,840 | 2,270,474 | |||
| ResMed, Inc. (b) | 10,310 | 680,357 | |||
| 11,887,515 | |||||
| Medical Products & Services (1.0%) | |||||
| Caremark Rx, Inc. (b) | 14,910 | 663,793 | |||
| Medical Services (6.3%) | |||||
| Amedisys, Inc. (b) | 6,840 | 251,575 | |||
| Fisher Scientific International, Inc. (b) | 11,100 | 720,390 | |||
| Hythiam, Inc. (b) | 19,800 | 110,880 | |||
| Manor Care, Inc. | 17,940 | 712,756 | |||
| McKesson Corp. | 18,020 | 807,116 | |||
| Medco Health Solutions, Inc. (b) | 16,030 | 855,361 | |||
| Priority Healthcare Corp. (b) | 28,930 | 733,665 | |||
| 4,191,743 | |||||
| Medical Supplies (1.1%) | |||||
| PRA International (b) | 27,560 | 738,057 | |||
| Therapeutics (7.3%) | |||||
| Genentech, Inc. (b) | 39,270 | 3,152,595 | |||
| Genzyme Corp. (b) | 10,300 | 618,927 | |||
| Gilead Sciences, Inc. (b) | 24,650 | 1,084,354 | |||
| 4,855,876 | |||||
| Total Common Stocks | 62,413,922 | ||||
| MUTUAL FUND (4.9%) | |||||
| Exchange Traded Funds (4.9%) | |||||
| NASDAQ Biotechnology Index Fund (b) | 48,110 | 3,266,669 | |||
| Total Mutual Fund | 3,266,669 | ||||
6
Table of Contents
GARTMORE VARIABLE INSURANCE TRUST
GARTMORE GVIT GLOBAL HEALTH SCIENCES FUND
Statement of Investments — June 30, 2005 (Unaudited) (continued)
Shares or Principal Amount | Value | |||||
| CASH EQUIVALENTS (7.7%) | ||||||
| Investments in repurchase agreements (collaterized by AA Corporate Bonds, in a joint trading account at 3.49%, dated 06/30/05, due 07/01/05, repurchase price $5,150,653) | $ | 5,150,175 | $ | 5,150,175 | ||
| Total Cash Equivalents | 5,150,175 | |||||
| SHORT-TERM SECURITIES HELD AS COLLATERAL FOR SECURITIES LENDING (11.1%) | ||||||
| Pool of short-term securities for Gartmore Variable Trust Funds — note 2 (Securities Lending) | 7,378,770 | 7,378,770 | ||||
| Total Short-Term Securities Held as Collateral for Securities Lending | 7,378,770 | |||||
Shares or Principal Amount | Value | |||||
| Total Investments (Cost $74,149,958) (a) — 117.4% | $ | 78,209,536 | ||||
| Liabilities in excess of other assets — (17.4%) | (11,579,306 | ) | ||||
| NET ASSETS — 100.0% | $ | 66,630,230 | ||||
| (a) | See notes to financial statements for tax unrealized appreciation (depreciation) of securities. |
| (b) | Non-income producing securities |
| ADR | American Depositary Receipt |
| CH | Switzerland |
| GB | United Kingdom |
See notes to financial statements.
7
Table of Contents
GARTMORE VARIABLE INSURANCE TRUST
GARTMORE GVIT GLOBAL HEALTH SCIENCES FUND
Statement of Assets and Liabilities
June 30, 2005 (Unaudited)
Assets: | ||||
Investments, at value (cost $68,999,783) | $ | 73,059,361 | ||
Repurchase agreements, at cost and value | 5,150,175 | |||
Total Investments | 78,209,536 | |||
Interest and dividends receivable | 69,393 | |||
Receivable for capital shares issued | 67 | |||
Receivable for investments sold | 2,902,335 | |||
Prepaid expenses and other assets | 807 | |||
Total Assets | 81,182,138 | |||
Liabilities: | ||||
Payable for investments purchased | 7,104,643 | |||
Payable for return of collateral received for securities on loan | 7,378,770 | |||
Accrued expenses and other payables: | ||||
Investment advisory fees | 54,385 | |||
Fund administration and transfer agent fees | 1,865 | |||
Distribution fees | 2,064 | |||
Administrative servicing fees | 6,239 | |||
Other | 3,942 | |||
Total Liabilities | 14,551,908 | |||
Net Assets | $ | 66,630,230 | ||
Represented by: | ||||
Capital | $ | 62,300,105 | ||
Accumulated net investment income (loss) | (19,305 | ) | ||
Accumulated net realized gains (losses) from investment and foreign currency transactions | 289,919 | |||
Net unrealized appreciation (depreciation) on investments and translation of assets and liabilities denominated in foreign currencies | 4,059,511 | |||
Net Assets | $ | 66,630,230 | ||
Net Assets: | ||||
Class I Shares | $ | 10,231,152 | ||
Class II Shares | 2,769,723 | |||
Class III Shares | 46,120,566 | |||
Class VI Shares | 7,508,789 | |||
Total | $ | 66,630,230 | ||
Shares outstanding (unlimited number of shares authorized): | ||||
Class I Shares | 951,493 | |||
Class II Shares | 258,901 | |||
Class III Shares | 4,281,774 | |||
Class VI Shares | 697,742 | |||
Total | 6,189,910 | |||
Net asset value and offering price per share:* | ||||
Class I Shares | $ | 10.75 | ||
Class II Shares | $ | 10.70 | ||
Class III Shares | $ | 10.77 | ||
Class VI Shares | $ | 10.76 |
| * | Not subject to a front-end sales charge. |
For the Six Months Ended June 30, 2005 (Unaudited)
Investment Income: | ||||
Interest income | $ | 41,682 | ||
Dividend income | 301,646 | |||
Income from securities lending | 7,384 | |||
Total Income | 350,712 | |||
Expenses: | ||||
Investment advisory fees | 290,031 | |||
Fund administration and transfer agent fees | 19,816 | |||
Distribution fees Class II Shares | 3,661 | |||
Distribution fees Class VI Shares | 7,384 | |||
Administrative servicing fees Class I Shares | 6,420 | |||
Administrative servicing fees Class II Shares | 2,120 | |||
Administrative servicing fees Class III Shares | 28,795 | |||
Other** | 11,790 | |||
Total Expenses | 370,017 | |||
Net Investment Income (Loss) | (19,305 | ) | ||
REALIZED/UNREALIZED GAINS (LOSSES) ON INVESTMENTS: | ||||
Net realized gains (losses) on investment transactions | 1,477,458 | |||
Net realized gains (losses) on foreign currency transactions | (2,653 | ) | ||
Net realized gains (losses) on investment and foreign currency transactions | 1,474,805 | |||
Net change in unrealized appreciation/depreciation on investments and translation of assets and liabilities denominated in foreign currencies | 320,412 | |||
Net realized/unrealized gains (losses) on investments and foreign currencies | 1,795,217 | |||
CHANGE IN NET ASSETS RESULTING FROM OPERATIONS | $ | 1,775,912 | ||
| ** | Other expenses may include the following fees: audit, custody, insurance, legal, printing, trustee, and out-of-pocket expenses. |
See notes to financial statements.
8
Table of Contents
GARTMORE VARIABLE INSURANCE TRUST
GARTMORE GVIT GLOBAL HEALTH SCIENCES FUND
Statement of Changes in Net Assets
| Six Months Ended June 30, 2005 | Year Ended December 31, 2004 | |||||||
| (Unaudited) | ||||||||
From Investment Activities: | ||||||||
Operations: | ||||||||
Net investment income (loss) | $ | (19,305 | ) | $ | (149,451 | ) | ||
Net realized gains (losses) on investment and foreign currency transactions | 1,474,805 | 1,055,705 | ||||||
Net change in unrealized appreciation/depreciation on investments and translation of assets and liabilities denominated in foreign currencies | 320,412 | 1,414,602 | ||||||
Change in net assets resulting from operations | 1,775,912 | 2,320,856 | ||||||
Distributions to Class I shareholders from: | ||||||||
Net realized gains on investments | (243,285 | ) | (28,764 | ) | ||||
Distributions to Class II shareholders from: | ||||||||
Net realized gains on investments | (66,452 | ) | (18,194 | ) | ||||
Distributions to Class III shareholders from: | ||||||||
Net realized gains on investments | (1,104,561 | ) | (148,723 | ) | ||||
Distributions to Class VI shareholders from: | ||||||||
From net realized gain on investment | (176,585 | ) | — | |||||
Change in net assets from shareholder distributions | (1,590,883 | ) | (195,681 | ) | ||||
Change in net assets from capital transactions | 10,622,736 | 20,004,854 | ||||||
Change in net assets | 10,807,765 | 22,130,029 | ||||||
Net Assets: | ||||||||
Beginning of period | 55,822,465 | 33,692,436 | ||||||
End of period | $ | 66,630,230 | $ | 55,822,465 | ||||
CAPITAL TRANSACTIONS: | ||||||||
Class I Shares | ||||||||
Proceeds from shares issued | $ | 5,221,841 | $ | 7,063,842 | ||||
Dividends reinvested | 243,285 | 28,764 | ||||||
Cost of shares redeemed | (3,195,609 | ) | (4,003,735 | ) | ||||
| 2,269,517 | 3,088,871 | |||||||
Class II Shares | ||||||||
Proceeds from shares issued | 1,912 | 2,408,238 | ||||||
Dividends reinvested | 66,452 | 18,194 | ||||||
Cost of shares redeemed | (516,993 | ) | (1,599,362 | ) | ||||
| (448,629 | ) | 827,070 | ||||||
Class III Shares | ||||||||
Proceeds from shares issued | 11,700,562 | 31,609,821 | ||||||
Dividends reinvested | 1,104,560 | 148,722 | ||||||
Cost of shares redeemed | (6,512,093 | ) | (20,508,099 | ) | ||||
| 6,293,029 | 11,250,444 | |||||||
Class VI Shares | ||||||||
Proceeds from shares issued | 2,690,224 | 5,746,069 | (a) | |||||
Dividends reinvested | 176,584 | — | ||||||
Cost of shares redeemed | (357,989 | ) | (907,600 | )(a) | ||||
| 2,508,819 | 4,838,469 | |||||||
Change net assets from capital transactions | $ | 10,622,736 | $ | 20,004,854 | ||||
9
Table of Contents
GARTMORE VARIABLE INSURANCE TRUST
GARTMORE GVIT GLOBAL HEALTH SCIENCES FUND
Statement of Changes in Net Assets (continued)
| Six Months Ended June 30, 2005 | Year Ended December 31, 2004 | |||||
| (Unaudited) | ||||||
SHARE TRANSACTIONS: | ||||||
Class I Shares | ||||||
Issued | 486,087 | 682,900 | ||||
Reinvested | 22,737 | 2,817 | ||||
Redeemed | (297,090 | ) | (390,960 | ) | ||
| 211,734 | 294,757 | |||||
Class II Shares | ||||||
Issued | 137 | 231,007 | ||||
Reinvested | 6,246 | 1,785 | ||||
Redeemed | (48,628 | ) | (155,966 | ) | ||
| (42,245 | ) | 76,826 | ||||
Class III Shares | ||||||
Issued | 1,080,342 | 3,030,056 | ||||
Reinvested | 103,037 | 14,537 | ||||
Redeemed | (610,220 | ) | (2,043,885 | ) | ||
| 573,159 | 1,000,708 | |||||
Class VI Shares | ||||||
Issued | 249,697 | 557,949 | (a) | |||
Reinvested | 16,488 | — | ||||
Redeemed | (33,653 | ) | (92,739 | )(a) | ||
| 232,532 | 465,210 | |||||
| (a) | For the period from April 28, 2004 (commencement of operations) through December 31, 2004. |
See notes to financial statements.
10
Table of Contents
GARTMORE VARIABLE INSURANCE TRUST
FINANCIAL HIGHLIGHTS
Selected Data for Each Share of Capital Outstanding
Gartmore GVIT Global Health Sciences Fund
| Investment Activities | Distributions | Ratios/Supplemental Data | ||||||||||||||||||||||||||||||||||||||||||||
| Net Asset Value, Beginning of Period | Net Investment Income (Loss) | Redemption Fees | Net Realized and Unrealized Gains (Losses) on Investments | Total from Investment Activities | Net Investment Income | Net Realized Gains | Total Distributions | Net Asset Value, End of Period | Total Return | Net Assets at End of Period (000s) | Ratio of Expenses to Average Net Assets | Ratio of Net Investment Income (Loss) to Average Net Assets | Ratio of Expenses (Prior to Reimbursements) to Average Net Assets(a) | Ratio of Net Investment Income (Loss) (Prior to Reimbursements) to Average Net Assets(a) | Portfolio Turnover(b) | |||||||||||||||||||||||||||||||
Class I Shares | ||||||||||||||||||||||||||||||||||||||||||||||
Period Ended December 31, 2000(c) | $ | 10.00 | — | — | (0.17 | ) | (0.17 | ) | — | — | — | $ | 9.83 | (1.70% | )(h) | $ | 2,458 | 1.00% | (i) | (1.00% | )(i) | 28.69% | (i) | (28.69% | )(i) | 0.00% | ||||||||||||||||||||
Period Ended December 27, 2001(d)(e) | $ | 9.83 | (0.03 | ) | — | 0.39 | 0.36 | (0.02 | ) | — | (0.02 | ) | $ | 10.17 | 3.67% | (h) | $ | 2,549 | 1.24% | (i) | (0.32% | )(i) | 5.51% | (i) | (4.59% | )(i) | 892.96% | |||||||||||||||||||
Period Ended December 31, 2002(f) | $ | 9.51 | (0.02 | ) | 0.01 | (1.31 | ) | (1.32 | ) | — | — | — | $ | 8.19 | (13.88% | )(h) | $ | 370 | 1.22% | (i) | (0.25% | )(i) | (j | ) | (j | ) | 764.93% | |||||||||||||||||||
Year Ended December 31, 2003 | $ | 8.19 | (0.02 | ) | 0.01 | 3.01 | 3.00 | — | (1.23 | ) | (1.23 | ) | $ | 9.96 | 36.69% | $ | 4,434 | 1.24% | (0.36% | ) | (j | ) | (j | ) | 542.89% | |||||||||||||||||||||
Year Ended December 31, 2004 | $ | 9.96 | (0.03 | ) | 0.01 | 0.80 | 0.78 | — | (0.05 | ) | (0.05 | ) | $ | 10.69 | 7.86% | $ | 7,910 | 1.26% | (0.28% | ) | (j | ) | (j | ) | 424.94% | |||||||||||||||||||||
Six Months Ended June 30, 2005 (Unaudited) | $ | 10.69 | — | 0.01 | 0.31 | 0.32 | — | (0.26 | ) | (0.26 | ) | $ | 10.75 | 3.03% | (h) | $ | 10,231 | 1.25% | (i) | (0.02% | )(i) | (j | ) | (j | ) | 191.29% | ||||||||||||||||||||
Class II Shares | ||||||||||||||||||||||||||||||||||||||||||||||
Period Ended December 31, 2003(g) | $ | 8.72 | (0.01 | ) | 0.01 | 2.46 | 2.46 | — | (1.23 | ) | (1.23 | ) | $ | 9.95 | 28.27% | (h) | $ | 2,232 | 1.49% | (i) | (0.59% | )(i) | (j | ) | (j | ) | 542.89% | |||||||||||||||||||
Year Ended December 31, 2004 | $ | 9.95 | (0.06 | ) | 0.01 | 0.80 | 0.75 | — | (0.05 | ) | (0.05 | ) | $ | 10.65 | 7.56% | $ | 3,208 | 1.50% | (0.54% | ) | (j | ) | (j | ) | 424.94% | |||||||||||||||||||||
Six Months Ended June 30, 2005 (Unaudited) | $ | 10.65 | (0.02 | ) | 0.01 | 0.32 | 0.31 | — | (0.26 | ) | (0.26 | ) | $ | 10.70 | 2.95% | (h) | $ | 2,770 | 1.50% | (i) | (0.30% | )(i) | (j | ) | (j | ) | 191.29% | |||||||||||||||||||
Class III Shares | ||||||||||||||||||||||||||||||||||||||||||||||
Period Ended December 31, 2001(e) | $ | 10.17 | — | — | (0.03 | ) | (0.03 | ) | — | — | — | $ | 10.14 | (0.30% | )(h) | $ | 2,540 | 1.35% | (i) | (1.13% | )(i) | 1.35% | (i) | (1.13% | )(i) | 892.96% | ||||||||||||||||||||
Year Ended December 31, 2002 | $ | 10.14 | (0.03 | ) | 0.01 | (1.92 | ) | (1.94 | ) | — | — | — | $ | 8.20 | 19.13% | $ | 11,652 | 1.23% | (0.37% | ) | 1.24% | (0.38% | ) | 764.93% | ||||||||||||||||||||||
Year Ended December 31, 2003 | $ | 8.20 | (0.03 | ) | 0.01 | 3.03 | 3.01 | — | (1.23 | ) | (1.23 | ) | $ | 9.98 | 36.77% | $ | 27,026 | 1.22% | (0.39% | ) | (j | ) | (j | ) | 542.89% | |||||||||||||||||||||
Year Ended December 31, 2004 | $ | 9.98 | (0.03 | ) | 0.01 | 0.80 | 0.78 | — | (0.05 | ) | (0.05 | ) | $ | 10.71 | 7.84% | $ | 39,723 | 1.26% | (0.29% | ) | (j | ) | (j | ) | 424.94% | |||||||||||||||||||||
Six Months Ended June 30, 2005 (Unaudited) | $ | 10.71 | — | 0.01 | 0.31 | 0.32 | — | (0.26 | ) | (0.26 | ) | $ | 10.77 | 3.03% | (h) | $ | 46,121 | 1.25% | (i) | (0.04% | )(i) | (j | ) | (j | ) | 191.29% | ||||||||||||||||||||
Class VI Shares | ||||||||||||||||||||||||||||||||||||||||||||||
Period Ended December 31, 2004(k) | $ | 10.70 | (0.02 | ) | 0.01 | 0.02 | 0.01 | — | — | — | $ | 10.71 | 0.09% | (h) | $ | 4,981 | 1.35% | (i) | (0.36% | )(i) | (j | ) | (j | ) | 424.94% | |||||||||||||||||||||
Six Months Ended June 30, 2005 (Unaudited) | $ | 10.71 | (0.01 | ) | 0.01 | 0.31 | 0.31 | — | (0.26 | ) | (0.26 | ) | $ | 10.76 | 2.93% | (h) | $ | 7,509 | 1.36% | (i) | (0.17% | )(i) | (j | ) | (j | ) | 191.29% | |||||||||||||||||||
| (a) | During the period certain fees were waived and/or reimbursed. If such waivers/reimbursements had not occurred, the ratios would have been as indicated. |
| (b) | Portfolio turnover is calculated on the basis of the Fund as whole without distinguishing among the classes of shares. |
| (c) | For the period from December 29, 2000 (commencement of operations) through December 31, 2000. |
| (d) | The existing shares of the Fund were designated Class I shares as of May 1, 2001. |
| (e) | Class I shares were exchanged into Class III shares effective December 28, 2001. |
| (f) | For the period from May 6, 2002 (recommencement of sales to the public) through December 31, 2002. |
| (g) | For the period from March 28, 2003 (commencement of operations) through December 31, 2003. |
| (h) | Not annualized. |
| (i) | Annualized. |
| (j) | There were no fee reductions during the period. |
| (k) | For the period from April 28, 2004 (commencement of operations) through December 31, 2004. |
See notes to financial statements.
11
Table of Contents
GARTMORE VARIABLE INSURANCE TRUST
NOTES TO FINANCIAL STATEMENTS (Unaudited)
June 30, 2005
1. Organization
Gartmore Variable Insurance Trust (“GVIT” or the “Trust”) is an open-end management investment company, organized under the laws of Delaware by an amended and restated Agreement and Declaration of Trust, dated October 28, 2004, as amended to date. The Trust, originally created under the laws of Massachusetts as a Massachusetts business trust pursuant to a Declaration of Trust dated, as of June 30, 1981, as subsequently amended, redomesticated as a Delaware Statutory Trust after the close of trading on April 29, 2005, and is registered under the Investment Company Act of 1940, as amended (the “1940 Act”). The redomestication is a change in statutory status and does not affect the operations of the Trust. As of June 30, 2005, the Trust had authorized an unlimited number of shares of beneficial interest (“shares”) without par value. The Trust currently offers shares to life insurance company separate accounts to fund the benefits under variable life insurance or annuity policies. To date, only the separate accounts of Nationwide Life Insurance Company and Nationwide Life and Annuity Insurance Company (collectively, “Nationwide”) have purchased shares of the Trust’s series. The Trust operates thirty-one (31) separate series, or mutual funds, each with its own investment objectives and strategies. This report contains the financial statements and financial highlights of the Gartmore GVIT Global Health Sciences Fund (the “Fund”).
Under the Trust’s organizational documents, the Trust’s officers and trustees are indemnified against certain liabilities arising out of the performance of their duties to the Trust. In addition, the Trust has entered into Indemnification Agreements with the Trust’s trustees and certain officers covering similar liabilities. In addition, in the normal course of business, the Trust enters into contracts with its vendors and others that provide for general indemnifications. The Trust’s maximum exposure under these arrangements is unknown, as this would involve future claims that may be made against the Trust. Based on experience, however, the Trust expects that risk of loss to be remote.
2. Summary of Significant Accounting Policies
The following is a summary of significant accounting policies followed by the Fund in the preparation of its financial statements. The policies are in conformity with accounting principles generally accepted in the United States of America (“GAAP”). The preparation of financial statements requires management to make estimates and assumptions that affect the reported amounts of assets and liabilities, the disclosure of contingent assets and liabilities at the date of the financial statements and the reported amounts of income and expenses for the period. Actual results could differ from those estimates.
| (a) | Security Valuation |
Securities for which market quotations are readily available are valued at current market value as of “Valuation Time.” Valuation Time is as of the close of regular trading on the New York Stock Exchange (usually 4 p.m. Eastern time). Equity securities are valued at the last quoted sale price or, if there is no sale price, the last quoted bid price provided by an independent pricing service approved by the Trust’s Board of Trustees. Securities traded on NASDAQ are valued at the NASDAQ official closing price. Prices are taken from the primary market or exchange in which each security trades. Most securities listed on a foreign exchange are valued either at fair value (see description below) or at the last sale price at the close of the exchange on which the security is principally traded. Foreign securities, currencies, and other assets and liabilities denominated in foreign currencies are translated into U.S. dollars at the exchange rate of said currencies against the U.S. Dollar, as of Valuation Time, as provided by an independent pricing service approved by the Board of Trustees.
Securities for which market quotations are not readily available, or for which an independent pricing service does not provide a value or provides a value that does not represent fair value in the judgment of the Fund’s investment adviser or designee, are valued at fair value under procedures approved by the Trust’s Board of Trustees. The “Fair Value” of these securities is determined in good faith by taking into account relevant factors and surrounding circumstances. Methods utilized to obtain a “Fair Value” may include the following non-exclusive list of SEC-acceptable methods: (i) a multiple of earnings; (ii) the discount from market value of a similar, freely traded security; (iii) the yield-to-maturity for debt issues; or (iv) a consolidation of the methods. The Gartmore Fair Value Committee considers a non-exclusive list of factors to arrive at the appropriate method upon determining “Fair Value.” For example, fair value determinations are required for securities whose value is affected by a “significant” event that materially affects the value of a domestic or foreign security which occurs subsequent to the time of the close of the principal market on which such domestic or foreign security trades and before the
12
Table of Contents
GARTMORE VARIABLE INSURANCE TRUST
NOTES TO FINANCIAL STATEMENTS (Unaudited) (Continued)
June 30, 2005
Valuation Time (i.e., a “subsequent event”). Typically, this will involve events occurring after the close of a foreign market on which a security trades and before the next Valuation Time.
The Fund values foreign securities at fair value in the circumstances described below. Generally, trading in foreign securities markets is completed each day at various times prior to the Valuation Time. Due to the time differences between the closings of the relevant foreign securities exchanges and the Valuation Time for the Fund, the Fund will fair value its foreign investments when it is determined that the market quotations for the foreign investments either are not readily available or are unreliable and, therefore, do not represent fair value. When the fair value prices are utilized, these prices will attempt to reflect the impact of the U.S. financial markets’ perceptions and trading activities on the Fund’s foreign investments since the last closing prices of the foreign investments were calculated on their primary foreign securities markets or exchanges. For these purposes, the Board of Trustees of the Trust has determined that movements in relevant indices or other appropriate market indicators, after the close of the foreign securities exchanges, may demonstrate that market quotations are unreliable, and may trigger fair value pricing for certain securities. Consequently, fair valuation of portfolio securities may occur on a daily basis. In determining fair value prices, the Trust utilizes data furnished by an independent pricing service (and that data draws upon, among other information, the market values of foreign investments). The fair value prices of portfolio securities generally will be used when it is determined that the use of these prices will have a material impact on the net asset value of the Fund. When the Fund uses fair value pricing, the values assigned to the Fund’s foreign investments may not be the quoted or published prices of the investments on their primary markets or exchanges.
| (b) | Repurchase Agreements |
The Fund may enter into repurchase agreements with an entity which is a member of the Federal Reserve System or which is a “primary dealer” (as designated by the Federal Reserve Bank of New York) in U.S. Government obligations. The repurchase price generally equals the price paid by the Fund plus interest negotiated on the basis of current short-term rates, which may be more or less than the rate on the underlying portfolio securities. The seller under a repurchase agreement is required to maintain the value of the collateral held pursuant to the agreement at a market value equal to or greater than the repurchase price (including accrued interest). Collateral subject to repurchase agreements is held by the Fund’s custodian or another qualified sub-custodian or in the Federal Reserve/Treasury book-entry system. If the counterparty defaults and the fair value of the collateral declines, realization of the collateral by the Fund may be delayed or limited. The Fund may transfer uninvested cash balances into a pooled cash account. These balances are invested in one or more repurchase agreements, which are fully collateralized by AA-rated Corporate Bonds with the counterparties of CS First Boston and Nomura Securities.
| (c) | Foreign Currency Transactions |
The accounting records of the Fund are maintained in U.S. dollars. Foreign currency amounts are translated into U.S. dollars at the current rate of exchange to determine the value of investments, assets and liabilities. The Fund may enter into foreign currency contracts in connection with purchases or sales of securities denominated in a foreign currency. Purchases and sales of securities, and income and expenses, are translated at the prevailing rate of exchange on the respective date of these transactions. The Fund does not isolate that portion of the results of operations resulting from changes in foreign exchange rates on investments from fluctuations arising from changes in market prices of securities held. These fluctuations are included with the net realized and unrealized gain or loss from investments and foreign currencies.
| (d) | Risks Associated with Foreign Securities and Currencies |
Investments in securities of foreign issuers carry certain risks not ordinarily associated with investments in securities of U.S. issuers. These risks include future political and economic developments, and the possible imposition of exchange controls or other foreign governmental laws and restrictions. In addition, with respect to certain countries, there is the possibility of expropriation of assets, confiscatory taxation, political or social instability, or diplomatic developments, which could adversely affect investments in those countries.
13
Table of Contents
GARTMORE VARIABLE INSURANCE TRUST
NOTES TO FINANCIAL STATEMENTS (Unaudited) (Continued)
June 30, 2005
Certain countries also may impose substantial restrictions on investments in their capital markets by foreign entities, including restrictions on investments in issuers of industries deemed sensitive to relevant national interests. These factors may limit the investment opportunities available and result in a lack of liquidity and high price volatility with respect to securities of issuers from developing countries.
| (e) | Forward Foreign Currency Contracts |
The Fund may enter into forward foreign currency contracts in connection with planned purchases or sales of securities or to hedge the U.S. dollar value of portfolio securities denominated in a particular currency. The Fund could be exposed to risks if the counterparties to the contracts are unable to meet the terms of their contracts and from unanticipated movements in the value of a foreign currency relative to the U.S. dollar. Forward foreign currency contracts are valued at the current cost of covering these contracts, as provided by an independent pricing service approved by the Board of Trustees. The forward foreign currency contracts are adjusted by the daily exchange rate of the underlying currency and any gains or losses are recorded for financial statement purposes as unrealized gains or losses until the contract settlement date.
| (f) | Futures Contracts |
The Fund may invest in financial futures contracts (“futures contracts”) for the purpose of hedging its existing portfolio securities or securities that the Fund intends to purchase against fluctuations in value caused by changes in prevailing market interest rates or prices. Futures contracts may also be entered into for non-hedging purposes.
Upon entering into a futures contract, the Fund is required to pledge to the broker an amount of cash and/or other assets equal to a certain percentage of the contract amount (initial margin deposit). Subsequent payments, known as “variation margin,” are made each day, depending on the daily fluctuations in the fair value/market value of the underlying assets. A gain or loss equal to the daily variation margin is recognized on a daily basis. Futures contracts are valued daily at their last quoted sale price.
A “sale” of a futures contract means a contractual obligation to deliver the securities or foreign currency called for by the contract at a fixed price at a specified time in the future. A “purchase” of a futures contract means a contractual obligation to acquire the securities or foreign currency at a fixed price at a specified time in the future.
Should market conditions change unexpectedly, the Fund may not achieve the anticipated benefits of the futures contracts and may realize a loss. The use of futures transactions for hedging purposes involves the risk of imperfect correlation in movements in the price of futures contracts, interest rates, and the value of the underlying hedged assets.
| (g) | Short Sales |
The Fund is authorized to engage in short-selling of portfolio securities which obligates the Fund to replace any security that the Fund has borrowed by purchasing the security at current market value sometime in the future. The Fund will incur a loss if the price of the security increases between the date of the short sale and the date on which the Fund replaces the borrowed security. The Fund generally will realize a gain if the price of the security declines between these dates. Until the Fund replaces the borrowed security, the Fund will maintain a segregated account with cash, U.S. Government securities and/or securities held long to sufficiently cover the Fund’s short position on a daily basis. Dividends declared on securities sold short are recorded as an expense on the ex-dividend date and paid to the counterparty on the dividend pay date. The collateral for securities sold short are recorded as an expense on the ex-dividend date and paid to the counterparty on the dividend pay date. The collateral for securities sold short includes the deposits with brokers and securities held long as shown in the Statement of Investments for the Fund.
| (h) | Security Transactions and Investment Income |
Security transactions are accounted for on the date the security is purchased or sold (“trade date”). Securities gains and losses are calculated on the identified cost basis. Interest income is recognized on the accrual basis and includes, where applicable, the amortization or accretion of premium or discount. Dividend income is recorded on the ex-dividend date.
14
Table of Contents
GARTMORE VARIABLE INSURANCE TRUST
NOTES TO FINANCIAL STATEMENTS (Unaudited) (Continued)
June 30, 2005
| (i) | Securities Lending |
To generate additional income, the Fund may lend up to 33 1/3% of the Fund’s total assets pursuant to agreements, requiring that the borrower deliver cash or securities as collateral with respect to each new loan of U.S. securities, equal to at least 102% of the value of the portfolio securities loaned, and with respect to each new loan of non-U.S. securities, collateral of at least 105% of the value of the portfolio securities loaned, and thereafter requiring the borrower to mark to market the collateral on a daily basis and requiring the borrower to make up any shortfall of collateral. The Fund receives payments from borrowers equivalent to the dividends and interest that would have been earned on securities lent while simultaneously seeking to earn income on the investment of cash collateral. Collateral is marked to market daily to provide a level of collateral at least equal to the market value of securities loaned. There may be risks of delay in recovery of the securities should the borrower of the securities fail financially. Loans will be made, however, only to borrowers deemed by the Fund’s investment adviser to be of good standing and creditworthy under guidelines established by the Board of Trustees and when, in the judgment of the adviser, the consideration which can be earned currently from these securities loans justifies the attendant risks. Loans are subject to termination by the Fund or the borrower at any time, and, therefore, are not considered to be illiquid investments. JPMorgan Chase Bank serves as custodian for the securities lending program of the Fund. JPMorgan Chase Bank receives a custody fee based on the value of collateral received from borrowers.
Security Type | Security Name | Market Value | Maturity Rate | Maturity Date | |||||
| Commercial Paper | MacQuarie Bank Ltd. | $ | 998,736 | 3.25% | 07/01/05 | ||||
| Repurchase Agreements | Nomura Securities | 6,380,034 | 3.48% | 07/01/05 | |||||
As of June 30, 2005, the Fund had securities with the following market values on loan:
Market Value of | Market Value of Collateral | ||
$7,263,845 | $ | 7,378,770 | |
| (j) | Distributions to Shareholders |
The Fund’s dividends from net investment income, if any, are declared and paid quarterly. The Fund’s distributable net realized capital gains, if any, are declared and distributed at least annually.
Dividends and distributions to shareholders are determined in accordance with federal income tax regulations, which may differ from GAAP. These “book/tax” differences are considered either permanent or temporary in nature. In accordance with the American Institute of Certified Public Accountants (“AICPA”) Statement of Position 93-2, permanent differences (i.e., reclassification of market discounts, gain/loss, paydowns, and distributions) are reclassified within the capital accounts based on their nature for federal income tax purposes; temporary differences do not require reclassification. These reclassifications have no effect upon the net asset value of the Fund. To the extent distributions exceed current and accumulated earnings and profits for federal income tax purposes, these distributions are reported as distributions of paid-in-capital.
| (k) | Federal Income Taxes |
It is the policy of the Fund to qualify or continue to qualify as a “regulated investment company” by complying with the provisions available to certain investment companies, as defined in applicable sections of the U.S. Internal Revenue Code, and to make distributions of net investment income and net realized capital gains sufficient to relieve the Fund from all, or substantially all, federal income taxes.
As of June 30, 2005, the tax cost of securities and the breakdown of unrealized appreciation (depreciation) for the Fund is as follows:
Tax Cost of | Unrealized Appreciation | Unrealized Depreciation | Net Unrealized Appreciation (Depreciation) | |||||||
$322,679 | $ | 4,579,389 | $ | (842,490 | ) | $ | 3,736,899 | |||
15
Table of Contents
GARTMORE VARIABLE INSURANCE TRUST
NOTES TO FINANCIAL STATEMENTS (Unaudited) (Continued)
June 30, 2005
| (l) | Allocation of Expenses, Income, and Gains and Losses |
Expenses directly attributable to the Fund are charged to the Fund. Expenses not directly attributable to the Fund are allocated proportionately among various or all funds within the Trust. The method used by the Fund for allocating income, fund level expenses, and realized and unrealized gains or losses is based on the fair value of shares outstanding relative to net assets. Under this method, each class of shares participates based on the total net asset value of that class’s shares in proportion to the total net assets of the Fund. Expenses specific to a class (such as rule 12b-1 and administrative services fees) are charged to that class.
3. Transactions with Affiliates
Under the terms of the Trust’s Investment Advisory Agreement, Gartmore Mutual Fund Capital Trust (“GMF”) manages the investment of the assets and supervises the daily business affairs of the Fund. GMF is a wholly-owned subsidiary of Gartmore Global Investments, Inc. (“GGI”), a holding company. GGI is a majority-owned subsidiary of Gartmore Global Asset Management Trust (“GGAMT”). GGAMT is a wholly-owned subsidiary of Nationwide Corporation. All of the common stock of Nationwide Corporation is held by Nationwide Mutual Insurance Company (95.2%) and Nationwide Mutual Fire Insurance Company (4.8%), each of which is a mutual company owned by its policyholders
Under the terms of the Investment Advisory Agreement, the Fund pays GMF an investment advisory fee based on the Fund’s average daily net assets and the following schedule:
| Fee Schedule | Fees | |
$0 up to $500 million | 1.00% | |
$500 million up to $2 billion | 0.95% | |
$2 billion and more | 0.90% |
Under the terms of a Fund Administration and Transfer Agency Agreement, Gartmore SA Capital Trust (“GSA”) provides the Fund with various administrative and accounting services, and Gartmore Investors Services, Inc. (“GISI”), an indirect subsidiary of GSA, serves as Transfer and Dividend Disbursing Agent for the Fund. The fees for the services provided under this Agreement are calculated based on the Trust’s average daily net assets according to the fee schedule below. The fees are then allocated proportionately among all funds within the Trust in relation to the average daily net assets of each fund and are paid to GSA. GSA pays GISI from these fees for its services.
| Combined Fee Schedule* | ||
Up to $1 billion | 0.13% | |
$1 billion and more up to $3 billion | 0.08% | |
$3 billion and more up to $8 billion | 0.05% | |
$8 billion and more up to $10 billion | 0.04% | |
$10 billion and more up to $12 billion | 0.02% | |
$12 billion or more | 0.01% | |
| * | The assets of the Gartmore GVIT Investor Destinations Aggressive Fund, the Gartmore GVIT Investor Destinations Moderately Aggressive Fund, the Gartmore GVIT Investor Destinations Moderate Fund, the Gartmore GVIT Investor Destinations Moderately Conservative Fund, and the Gartmore GVIT Investor Destinations Conservative Fund (collectively, the “Investor Destinations Funds”) are excluded from the Trust asset level amount in order to calculate this asset-based fee. The Investor Destinations Funds do not pay any part of this fee. |
Effective January 1, 2005, the fee for the fund administration and transfer agency services increased as set forth below. The fees are calculated based on the Trust’s average daily net assets according to the fee schedule below. The fees are then allocated proportionately among all funds within the Trust in relation to the average daily net assets of each fund and are paid to GSA.
16
Table of Contents
GARTMORE VARIABLE INSURANCE TRUST
NOTES TO FINANCIAL STATEMENTS (Unaudited) (Continued)
June 30, 2005
| Combined Fee Schedule* | ||
Up to $1 billion | 0.15% | |
$1 billion and more up to $3 billion | 0.10% | |
$3 billion and more up to $8 billion | 0.05% | |
$8 billion and more up to $10 billion | 0.04% | |
$10 billion and more up to $12 billion | 0.02% | |
$12 billion or more | 0.01% | |
| * | The assets of each of the Investor Destinations Funds are excluded from the Trust asset level amount in order to calculate this asset-based fee. The Investor Destinations Funds do not pay any part of this fee. |
GSA and GISI have entered into agreements with BISYS Fund Services Ohio, Inc. (“BISYS”), to provide sub-administration and sub-transfer agency services, respectively, to the Fund.
Under the terms of a Distribution Plan under Rule 12b-1 of the 1940 Act, Gartmore Distribution Services, Inc. (“GDSI”), the Fund’s Distributor, is compensated by the Fund for expenses associated with the distribution of the Class II and Class VI shares of the Fund. These fees are based on average daily net assets of Class II and Class VI shares of the Fund at an annual rate not to exceed 0.25%.
Under the terms of an Administrative Services Plan, the Fund may pay fees to servicing organizations, such as broker-dealers, including Nationwide Financial Services, and financial institutions, which agree to provide administrative support services to the shareholders of certain classes. These services include, but are not limited, to the following: establishing and maintaining shareholder accounts; processing purchase and redemption transactions; arranging bank wires; performing shareholder sub-accounting; answering inquires regarding the Fund; and other such services. These fees are based on an annual rate of up to 0.25% of the average daily net assets of each class of shares of the Fund.
4. Short-Term Trading Fees
The Fund reserves the right to assess a short-term trading fee on certain transactions out of Class III and Class VI shares that a separate account makes on behalf of a variable insurance contract owner (the “contract owner”). A separate account that redeems Class III and Class VI shares on behalf of a contract owner may be subject to a 1.00% short-term trading fee if the separate account held the Class III and Class VI shares on behalf of the contract owner for 60 days or less, unless an exception applies as disclosed in the prospectus. The short-term trading fee is paid directly to the Fund and is intended to offset the cost to the Fund of excess brokerage commissions and other costs associated with fluctuations in fund asset levels and cash flow caused by short-term trading. For purposes of determining whether the short-term trading fee applies, the Class III and Class VI shares that were held on behalf of the contract owner the longest will be treated as being redeemed first.
For the six months ended June 30, 2005, the Fund had no contributions to capital due to collection of redemption fees.
5. Investment Transactions
For the six months ended June 30, 2005, (excluding short-term securities) the Fund had purchases of $116,890,906 and sales of $104,419,982.
6. Bank Loans
The Trust has a credit agreement of $100,000,000. Borrowings under this arrangement bear interest at the Federal Funds rate plus 0.50%. The interest costs are included in custodian fees in the Statement of Operations. No compensation balances were required under the terms of the line of credit. There were no borrowings outstanding as of June 30, 2005.
7. Shareholder Meeting
A separate shareholders meeting was held on Tuesday, December 23, 2004, for the shareholders of the Trust’s predecessor pursuant to a Proxy Statement On Schedule 14A, dated October 29, 2004, and mailed to the shareholders of the Trust’s predecessor on or around November 5, 2004.
17
Table of Contents
GARTMORE VARIABLE INSURANCE TRUST
NOTES TO FINANCIAL STATEMENTS (Unaudited) (Continued)
June 30, 2005
Two Proposals: The purpose of the December 23, 2004 meeting was to allow the shareholders of the Trust’s predecessor to vote on:
| i. | Proposal One: The election of the Trust’s Board of Trustees; and |
| ii. | Proposal Two: The approval of an “Agreement and Plan of Reorganization” that provided for the reorganization of the Trust from a Massachusetts business trust into a Delaware statutory trust. |
Proposal One: As set forth in the October 29, 2004 Proxy Statement, the nominees for election as Trustees of the Trust’s predecessor were: Charles E. Allen, Michael J. Baresich, Paula H.J. Cholmondeley, C. Brent DeVore, Phyllis Kay Dryden, Robert M. Duncan, Barbara L. Hennigar, Paul J. Hondros, Barbara I Jacobs, Thomas J. Kerr IV, Douglas F. Kridler, Michael D. McCarthy, Arden L. Shisler, and David C. Wetmore.
Proposal Two: As specifically set forth in the October 29, 2004 Proxy Statement, the Reorganization proposal requested the shareholders of the Trust’s predecessor to approve the proposed “Agreement and Plan of Reorganization” of the Trust’s predecessor (on behalf of each of the its funds) into a new Delaware-domiciled Trust, whereby the Funds of the new Delaware Trust would acquire all of the assets of the corresponding funds of the Trust’s predecessor subject to the liabilities, expenses, costs, charges, and reserves of the corresponding funds of the Trust’s predecessor (contingent or otherwise), in exchange for shares of the acquiring Funds to be distributed pro rata by the Trust to the holders of the shares of the funds of the Trust’s predecessor, in a complete liquidation of the Trust’s predecessor.
Voting Results:
The shareholders of the Trust’s predecessor voted to approve both Proposal One and Proposal Two, as follows:
Proposal 1: Election of a Board of Trustees of Gartmore Variable Insurance Trust
Charles E. Allen: | ||
FOR | 2,797,230,318.955 shares (96.078%) | |
WITHHOLD | 114,195,693.660 shares (3.922%) | |
TOTAL | 2,912,726,012.615 shares (100.000%) | |
Michael J. Baresich: | ||
FOR | 2,796,135,979.559 shares (96.040%) | |
WITHHOLD | 115,290,033.056 shares (3.960%) | |
TOTAL | 2,912,726,012.615 shares (100.000%) | |
Paula H.J. Cholmondeley: | ||
FOR | 2,795,095,945.396 shares (96.004%) | |
WITHHOLD | 116,330,067.219 shares (3.996%) | |
TOTAL | 2,912,726,012.615 shares (100.000%) | |
C. Brent DeVore: | ||
FOR | 2,797,207,046.916 shares (96.077%) | |
WITHHOLD | 114,218,965.699 shares (3.923%) | |
TOTAL | 2,912,726,012.615 shares (100.000%) | |
18
Table of Contents
GARTMORE VARIABLE INSURANCE TRUST
NOTES TO FINANCIAL STATEMENTS (Unaudited) (Continued)
June 30, 2005
Phyllis Kay Dryden: | ||
FOR | 2,795,587,023.994 shares (96.021%) | |
WITHHOLD | 115,838,988.621 shares (3.979%) | |
TOTAL | 2,912,726,012.615 shares (100.000%) | |
Robert M. Duncan: | ||
FOR | 2,790,191,720.503 shares (95.836%) | |
WITHHOLD | 121,234,292.112 shares (4.164%) | |
TOTAL | 2,912,726,012.615 shares (100.000%) | |
Barbara L. Hennigar: | ||
FOR | 2,792,939,848.858 shares (95.937%) | |
WITHHOLD | 118,486,163.757 shares (4.070%) | |
TOTAL | 2,912,726,012.615 shares (100.000%) | |
Paul J. Hondros: | ||
FOR | 2,797,557,404.448 shares (96.089%) | |
WITHHOLD | 113,868,608.167 shares (3.911%) | |
TOTAL | 2,912,726,012.615 shares (100.000%) | |
Barbara I. Jacobs: | ||
FOR | 2,796,306,126.654 shares (96.046%) | |
WITHHOLD | 115,119,885.961 shares (3.954%) | |
TOTAL | 2,912,726,012.615 shares (100.000%) | |
Thomas J. Kerr IV: | ||
FOR | 2,789,755,720.087 shares (95.821%) | |
WITHHOLD | 121,670,292.528 shares (4.179%) | |
TOTAL | 2,912,726,012.615 shares (100.000%) | |
Douglas F. Kridler: | ||
FOR | 2,798,065,774.375 shares (96.106%) | |
WITHHOLD | 113,360,238.240 shares (3.894%) | |
TOTAL | 2,912,726,012.615 shares (100.000%) | |
Michael D. McCarthy: | ||
FOR | 2,797,452,613.694 shares (96.085%) | |
WITHHOLD | 113,973,395.921 shares (3.915%) | |
TOTAL | 2,912,726,012.615 shares (100.000%) | |
Arden L. Shisler: | ||
FOR | 2,796,738,454.730 shares (96.061%) | |
WITHHOLD | 114,687,557.885 shares (3.939%) | |
TOTAL | 2,912,726,012.615 shares (100.000%) | |
19
Table of Contents
GARTMORE VARIABLE INSURANCE TRUST
NOTES TO FINANCIAL STATEMENTS (Unaudited) (Continued)
June 30, 2005
David C. Wetmore: | ||
FOR | 2,794,784,752.247 shares (95.994%) | |
WITHHOLD | 116,641,260.368 shares (4.006%) | |
TOTAL | 2,912,726,012.615 shares (100.000%) | |
Proposal 2: Approval of the Agreement and Plan of Reorganization of Gartmore Variable Insurance Trust
FOR | 2,561,003,822.546 shares (87.964%) | |
AGAINST | 103,593,261.010 shares (3.558%) | |
ABSTAIN | 246,828,929.059 shares (8.478%) | |
TOTAL | 2,912,726,012.615 shares (100.000%) | |
8. Subsequent Event
On July 29, 2005, the Trust filed a Post-Effective Amendment to its Registration Statement on Form N-1A to change the structure of the Fund’s investment advisory fee from the current asset-based fee structure to a performance based fee structure on or about October 1, 2005. On that date, or, if later, upon SEC effectiveness, the Fund will immediately lower its base advisory fee by 0.10% at each breakpoint. Beginning one year after implementation of the new performance fee structure, the Fund’s base advisory fee may be adjusted proportionately upward or downward if the Fund outperforms or uderperforms its stated benchmark by the following amounts:
| Out or Underperformance | Change in Fees | |
+/- 1 percentage point | +/- 0.02% | |
+/- 2 percentage points | +/- 0.04% | |
+/- 3 percentage points | +/- 0.06% | |
+/- 4 percentage points | +/- 0.08% | |
+/- 5 percentage points | +/- 0.10% |
The prospectus describing the above Fund will be supplemented upon the effectiveness of the Post-Effective Amendment to the Trust’s Registration Statement. Please refer to the prospectus, as supplemented by a notice you will receive after the effectiveness of the Post-Effective Amendment, for further information about this new fee structure.
20
Table of Contents
GARTMORE VARIABLE INSURANCE TRUST
Management Information (Unaudited)
June 30, 2005
Trustees who are not Interested Persons (as defined in the 1940 Act) and Officers of the Funds June 30, 2005
| Name, Address and Date of Birth | Position(s) Held with the Trust and Length of Time Served1 | Principal Occupation(s) During Past 5 Years | Number of Portfolios in the Gartmore Fund Complex Overseen by Trustee | Other Directorships Held by Trustee or Nominee2 | ||||
Charles E. Allen
c/o Gartmore Global Investments, Inc. 1200 River Road, Suite 1000 Conshohocken, PA 19428
1948 | Trustee since July 2000 | Mr. Allen is Chairman, Chief Executive Officer and President of the Graimark Realty Advisors, Inc. (real estate development, investment and asset management). | 84 | None | ||||
Paula H.J. Cholmondeley
c/o Gartmore Global Investments, Inc. 1200 River Road, Suite 1000 Conshohocken, PA 19428
1940 | Trustee since July 2000 | Ms. Cholmondeley has been the Chairman and Chief Executive Officer of the Sorrel Group, a management consulting company, since January 2004. From March 2000 through December 2003, Ms. Cholmondeley was Vice President and General Manager of Sappi Fine Paper North America. Prior thereto, Ms. Cholmondeley was Vice President and General Manager of Residential Insulation of Owens Corning. | 84 | Director of Dentsply International, Inc., Ultralife Batteries, Inc., Terex Corporation, Minerals Technology, Inc. and Albany International Corp. | ||||
C. Brent DeVore
c/o Gartmore Global Investments, Inc. 1200 River Road, Suite 1000 Conshohocken, PA 19428
1940 | Trustee since 1990 | Dr. DeVore is President of Otterbein College. | 84 | None | ||||
Phyllis K. Dryden
c/o Gartmore Global Investments, Inc. 1200 River Road, Suite 1000 Conshohocken, PA 19428
1947 | Trustee since December 2004 | Ms. Dryden was a former Managing Partner of marchFIRST, a global management consulting firm prior to 2002. | 84 | None |
21
Table of Contents
GARTMORE VARIABLE INSURANCE TRUST
Management Information (Unaudited)
June 30, 2005
| Name, Address and Date of Birth | Position(s) Held with the Trust and Length of Time Served1 | Principal Occupation(s) During Past 5 Years | Number of Portfolios in the Gartmore Fund Complex Overseen by Trustee | Other Directorships Held by Trustee or Nominee2 | ||||
Barbara L. Hennigar*
c/o Gartmore Global Investments, Inc. 1200 River Road, Suite 1000 Conshohocken, PA 19428
1935 | Trustee since July 2000 | Retired since June 2000. Prior thereto, Ms. Hennigar was the Chairman or President and Chief Executive Officer of OppenheimerFunds Services and a member of the Executive Committee of OppenheimerFunds. | 84 | None | ||||
Barbara I. Jacobs
c/o Gartmore Global Investments, Inc. 1200 River Road, Suite 1000 Conshohocken, PA 19428
1950 | Trustee since December 2004 | Ms. Jacobs has served as Chairman of the Board of Directors of KICAP Network Fund, a European (United Kingdom) hedge fund, since December 2000. Prior to 2004, Ms. Jacobs was also a Managing Director and European Portfolio Manager with CREF Investments (Teachers Insurance Annuity Association — College Retirement Equity Fund). | 84 | None | ||||
Douglas F. Kridler
c/o Gartmore Global Investments, Inc. 1200 River Road, Suite 1000 Conshohocken, PA 19428
1955 | Trustee since September 1997 | Mr. Kridler has served as the President and Chief Executive Officer of the Columbus Foundation (a Columbus, OH-based foundation which manages over 1,300 individual endowment funds) since February 2002. Mr. Kridler was the President of the Columbus Association for the Performing Arts prior thereto and Chairman of the Greater Columbus Convention and Visitors Bureau during 2000 and 2001. | 84 | None | ||||
Michael D. McCarthy
c/o Gartmore Global Investments, Inc. 1200 River Road, Suite 1000 Conshohocken, PA 19428
1947 | Trustee since December 2004 | Mr. McCarthy serves as: the Founder and Chairman of The Eureka Foundation (which sponsors and funds the “Great Museums” series on PBS); and a Partner of Pineville Properties LLC (a commercial real estate development firm). | 843 | None |
22
Table of Contents
GARTMORE VARIABLE INSURANCE TRUST
Management Information (Unaudited)
June 30, 2005
| Name, Address and Date of Birth | Position(s) Held with the Trust and Length of Time Served1 | Principal Occupation(s) During Past 5 Years | Number of Portfolios in the Gartmore Fund Complex Overseen by Trustee | Other Directorships Held by Trustee or Nominee2 | ||||
David C. Wetmore
c/o Gartmore Global Investments, Inc. 1200 River Road, Suite 1000 Conshohocken, PA 19428
1948 | Trustee since 1995 and Chairman since February 2005 | Retired. Mr. Wetmore was formerly a Managing Director of Updata Capital, an investment banking and venture capital firm. | 84 | None |
| * | Pursuant to the Trust’s mandatory retirement policy, Ms. Hennigar is expected to retire on or about January 12, 2006. |
| 1 | The term of office length is until a trustee resigns or reaches a mandatory retirement age of 70. On March 2, 2000, the Board adopted a five-year implementation period for any Trustee 65 or older as of the adoption of this policy. Pursuant to this policy, Messrs. Duncan and Kerr retired as trustees effective as of March 12, 2005. |
| 2 | Directorships held in (1) any other investment companies registered under the 1940 Act, (2) any company with a class of securities registered pursuant to Section 12 of the Securities Exchange Act of 1934, as amended (the “Exchange Act”), or (3) any company subject to the requirements of Section 15(d) of the Exchange Act. |
| 3 | Mr. McCarthy was also an Administrative Committee Member for the Alphagen Arneb Fund, LLC, The Healthcare Fund LDC, The Leaders Long-Short Fund, LLC, and The Leaders Long-Short Fund LDC, four private investment companies (hedge funds) managed by GSA. Mr. McCarthy resigned as an Administrative Committee Member effective June 30, 2005. |
Trustees and Officers who are not Interested Persons (as defined in the 1940 Act) of the Funds received aggregate compensation of $274,882 from the Trust for the Six Months Ended June 30, 2005. Additional information regarding the Trustees and Officers may be found in the Trust’s statement of additional information, which is available without charge upon request, by calling 1-800-848-0920.
23
Table of Contents
GARTMORE VARIABLE INSURANCE TRUST
Management Information (Unaudited)
June 30, 2005
Trustees who are Interested Persons (as defined in the 1940 Act) and/or Officers of the Funds June 30, 2005
| Name, Address and Age | Position(s) Held with the Trust and Length of Time Served1 | Principal Occupation(s) During Past 5 Years | Number of Portfolios in the Gartmore Fund Complex Overseen by Trustee | Other Directorships Held by Trustee2 | ||||
Paul J. Hondros
Gartmore Global Investments, Inc. 1200 River Road, Suite 1000 Conshohocken, PA 19428
1948 | Trustee since July 2000 | Mr. Hondros has been President and Chief Executive Officer of various Gartmore entities, including Gartmore Distribution Services, Inc. (“GDSI”),3 Gartmore Investor Services, Inc. (“GISI”),3 Gartmore Morley Capital Management, Inc. (“GMCM”),3 Gartmore Morley Financial Services, Inc. (“GMFS”),3 NorthPointe Capital, LLC (“NorthPointe”),3 Gartmore Global Asset Management Trust (“GGAMT”)3, Gartmore Global Investments, Inc. (“GGI”)3, Gartmore Mutual Fund Capital Trust (“GMFCT”)3 and Gartmore SA Capital Trust (“GSA”)3; and a Director of Nationwide Securities, Inc.3, as well as several entities within Nationwide Financial Services, Inc. | 844 | None | ||||
Arden L. Shisler
c/o Gartmore Global Investments, Inc. 1200 River Road, Suite 1000 Conshohocken, PA 19428
1941 | Trustee since February 2000 | Mr. Shisler has been a consultant since January 2003. Prior thereto, he was President and Chief Executive Officer of K&B Transport, Inc., a trucking firm. Since 1992, Mr. Shisler has also been Chairman of the Board for Nationwide Mutual Insurance Company3. | 84 | Director of Nationwide Financial Services, Inc. | ||||
Gerald J. Holland
Gartmore Global Investments, Inc. 1200 River Road, Suite 1000 Conshohocken, PA 19428
1951 | Treasurer since March 2001 | Mr. Holland is Senior Vice President — Operations for GGI3, GMFCT3, and GSA3. Prior to July 2000, Mr, Holland was Vice President for First Data Investor Services, an investment company service provider. | 84 | None |
24
Table of Contents
GARTMORE VARIABLE INSURANCE TRUST
Management Information (Unaudited)
June 30, 2005
| Name, Address and Age | Position(s) Held with the Trust and Length of Time Served1 | Principal Occupation(s) During Past 5 Years | Number of Portfolios in the Gartmore Fund Complex Overseen by Trustee | Other Directorships Held by Trustee2 | ||||
Michael A. Krulikowski
Gartmore Global Investments, Inc. 1200 River Road, Suite 1000 Conshohocken, PA 19428
1959 | Chief Compliance Officer since June 2004 | Since November 1999, Mr. Krulikowski has served as a Vice President and Chief Compliance Officer of GGI. Prior thereto, Mr. Krulikowski served as Chief Compliance Officer of 1717 Capital Management Company/Provident Mutual Insurance Company. | 84 | None | ||||
Eric E. Miller
Gartmore Global Investments, Inc. 1200 River Road, Suite 1000 Conshohocken, PA 19428
1953 | Secretary since December 2002 | Mr. Miller is Senior Vice President, Chief Counsel for GGI3, GMFCT3 and GSA3 since August 2002. From August 2000 to August 2002, Mr. Miller was a Partner with Stradley Ronan Stevens & Young, LLP. Prior to August 2000, Mr. Miller served as Senior Vice President and Deputy General Counsel at Delaware Investments. | 84 | None |
| 1 | The term of office length is until a trustee resigns or reaches a mandatory retirement age of 70. On March 2, 2000, the Board adopted a five-year implementation period for any Trustee 65 or older as of the adoption of this policy. Pursuant to this policy, Messrs. Duncan and Kerr retired as trustees effective as of March 12, 2005. |
| 2 | Directorships held in (1) any other investment companies registered under the 1940 Act, (2) any company with a class of securities registered pursuant to Section 12 of the Securities Exchange Act of 1934, as amended (the “Exchange Act”), or (3) any company subject to the requirements of Section 15(d) of the Exchange Act. |
| 3 | This position is held with an affiliated person or principal underwriter of the Trust. |
| 4 | Mr. Hondros was also an Administrative Committee Member for the Alphagen Arneb Fund, LLC, The Healthcare Fund LDC, The Leaders Long-Short Fund, LLC, and The Leaders Long-Short Fund LDC, four private investment companies (hedge funds) managed by GSA. Mr. Hondros resigned as Administrative Committee Member effective June 30, 2005. |
Federal law requires the Trust, each of its investment advisers and sub-advisers to adopt procedures for voting proxies (“Proxy Voting Guidelines”) and to provide a summary of those Proxy Voting Guidelines used to vote the securities held by the Funds. The Funds’ proxy voting policies and procedures are available without charge (i) upon request, by calling 1-800-848-0920, (ii) on the Fund’s website at www.gartmorefunds.com, or (iii) on the Securities and Exchange Commission’s website at www.sec.gov.
25
Table of Contents
Gartmore GVIT Nationwide Leaders Fund
Semiannual Report
| | June 30, 2005 |
| Contents | ||
| 6 | Statement of Investments | |
| 7 | Statement of Assets and Liabilities | |
| 7 | Statement of Operations | |
| 8 | Statements of Changes in Net Assets | |
| 9 | Financial Highlights | |
| 10 | Notes to Financial Statements | |
Commentary provided by Gartmore Global Investments, investment adviser to Gartmore Variable Insurance Trust. All opinions and estimates included in this report constitute Gartmore Global Investments’ judgment as of the date of this report and are subject to change without notice.
Statement Regarding Availability of Quarterly Portfolio Schedule.
The Gartmore Variable Insurance Trust files complete schedules of portfolio holdings for each Fund with the Securities and Exchange Commission (the “Commission”) for the first and third quarters of each fiscal year on Form N-Q. The Funds’ Forms N-Q are available on the Commission’s website at http://www.sec.gov. The Funds’ Forms N-Q may be reviewed and copied at the Commission’s Public Reference Room in Washington, DC, and information on the operation of the Public Reference Room may be obtained by calling 800-SEC-0330; and the Funds make the information on Form N-Q available to shareholders upon request without charge.
Statement Regarding Availability of Proxy Voting Record.
Information regarding how the Fund voted proxies relating to portfolio securities held during the most recent 12-month period ended June 30, 2005 is available without charge, upon request, by calling 800-848-0920, and on the Commission’s website at http://www.sec.gov.
Table of Contents
Gartmore GVIT Nationwide Leaders Fund
For the semiannual period ended June 30, 2005, the Gartmore GVIT Nationwide Leaders Fund returned 1.21% (Class I at NAV) versus -0.81% for its benchmark, the S&P 500® Index. For broader comparison, the average return for the Fund’s Lipper peer category of Multi-Cap Core Funds was -0.59%.
Against the backdrop of a range-bound market, we added significant value through stock selection during the reporting period. Sectors that added most to performance relative to the benchmark were consumer discretionary, information technology and health care. In the latter two cases, favorable stock selection accounted for all or virtually all of the relative contribution. In the consumer discretionary sector, our stock selections were the driving force, but underweighting the sector also helped. On the other hand, unfavorable stock selection and a large overweighting in the industrials sector, along with an underweighting and disappointing stock selection in the strongly performing utilities sector, hampered Fund performance.
Stocks that aided Fund performance in the consumer discretionary sector included homebuilder Lennar Corp. Although this stock was somewhat overlooked prior to the reporting period, it benefited from an attractive valuation and continued strength in housing, particularly in the robust Florida market. Also providing a boost to the Fund’s results was office supplies retailer Staples, Inc. While the company’s financial results continued to be strong, the stock drifted lower from January through the end of April, providing us with an attractive buying opportunity. Department store chain Nordstrom, Inc. was another retailer whose stock performed well, because robust sales enabled the company’s profit margins to expand beyond their historical peak. In information technology, one of the Fund’s strongest contributors was disk drive maker Seagate Technology, which continued to experience growing demand from consumer applications such as portable digital music players, television set-top boxes and cellular handsets.
On the negative side, the Fund experienced poor performance from railroad Norfolk Southern Corp., one of the Fund’s largest holdings at the end of the reporting period. Concerns about increasing freight capacity at a time when demand could falter caused the stock to retreat. A large position in PACCAR Inc., a manufacturer of heavy trucks, also put downward pressure on the Fund’s return; a slight weakening in orders pushed the stock’s price lower.
Our outlook is fairly positive for the balance of 2005, because we believe that stock valuations are generally reasonable, and global economic growth, while not spectacular, should allow for pockets of strong earnings gains. At $60 per barrel, crude oil represents a significant challenge for both consumer and business spending. However, we think that high oil prices should not prevent the U.S. economy from continuing to grow at a moderate pace, if perhaps at a somewhat slower rate than it did in the first half of the year. Rising short-term interest rates also could inhibit growth, but it is important to remember that, from a historical standpoint, these rates remain low. At the company level, we are still finding opportunities with strong earnings prospects, along with good dividend yields.
PORTFOLIO MANAGER: Gary Haubold, CFA
Standard & Poor’s 500 (S&P 500) Index: An unmanaged, capitalization-weighted index of 500 widely held stocks of large-cap U.S. companies that gives a broad look at how the stock prices of those companies have performed.
Investing in mutual funds involves risk, including possible loss of principal.
There is no assurance that the investment objective of any fund will be achieved.
Funds that concentrate on specific sectors or a relatively small number of securities may be subject to greater volatility than a more diversified investment.
Lipper Analytical Services, Inc. is an industry research firm whose rankings are based on total return performance and do not reflect the effects of sales charges.
The Gartmore Variable Insurance Trust Funds are available only as sub-account investment options in certain variable insurance products. Accordingly, investors are unable to invest in shares of these funds outside of an insurance product. Performance information found herein reflects only the performance of these funds, and does not indicate the performance your sub-account may experience under your variable insurance contract. Performance returns assume reinvestment of all distributions. The investment return and principal value of an investment will fluctuate so that an investor’s shares, when redeemed, may be worth more or less than their original cost. Index performance is provided for comparison purposes only; the indexes shown are unmanaged and do not reflect any fees or expenses. Investors cannot invest directly in market indexes. To obtain performance information about the sub-account option under your insurance contract that invests in one of these funds, please contact your variable insurance carrier. PAST PERFORMANCE IS NO GUARANTEE OF FUTURE RESULTS.
Commentary provided by Gartmore Global Investments. All opinions and estimates included in this report constitute Gartmore Global Investments’ judgment as of the date of this report and are subject to change without notice.
1
Table of Contents
Gartmore GVIT Nationwide Leaders Fund (continued)
Investors should carefully consider a fund’s investment objectives, risks, fees, charges and expenses before investing any money. To obtain this and other information on Gartmore Variable Insurance Trust, please contact your variable insurance contract provider or call 800-848-0920. Please read the Trust’s prospectus carefully before investing any money.
Gartmore Funds distributed by Gartmore Distribution Services, Inc., Member NASD. 1200 River Road, Suite 1000, Conshohocken, PA 19428.
2
Table of Contents
Fund Performance | Gartmore GVIT Nationwide Leaders Fund |
| Average | Annual Total Return1 |
(For Periods Ended June 30, 2005)
| Six months* | One year | Inception2 | ||||
| Class I3 | 1.21% | 15.25% | 10.58% | |||
| Class III4 | 1.21% | 15.24% | 10.61% |
| * | Not Annualized. |
| 1 | Not subject to any sales charges. |
| 2 | Fund commenced operations on December 31, 2001. |
| 3 | These returns until the creation of the Class I shares (May 9, 2002) are based on the performance of the Class III shares of the Fund. Excluding the effect of any fee waivers or reimbursements, such prior performance is similar to what Class I and Class III shares would have produced because all classes of shares invest in the same portfolio of securities. |
| 4 | For Class III shares, these returns do not reflect the short-term trading fees applicable to such shares; if these fees were reflected, the annual returns for Class III shares would have been lower. |
| Performance | of a $10,000 Investment |
Investment return and principal value will fluctuate, and when redeemed, shares may be worth more or less than original cost. Past performance is no guarantee of future results and does not reflect the deduction of taxes that a shareholder would pay on fund distributions or the redemption of fund shares. Investing in mutual funds involves market risk, including loss of principal. Performance returns assume the reinvestment of all distributions.
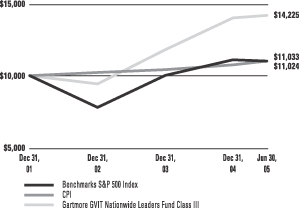
Comparative performance of $10,000 invested in Class III shares of the Gartmore Nationwide Leaders Fund, Standard & Poor’s 500 Index (S&P 500)(a) and the Consumer Price Index (CPI)(b) since inception. Unlike the Fund, the returns for these unmanaged indexes do not reflect any fees, expenses, or sales charges. Investors cannot invest directly in market indexes.
| (a) | The S&P 500 is an unmanaged, market capitalization-weighted index of 500 widely held stocks of large-cap U.S. companies that gives a broad look at how the stock prices of those companies have performed. |
| (b) | The CPI represents changes in prices of a basket of goods and services purchased for consumption by urban households. |
3
Table of Contents
Shareholder
Expense Example | Gartmore GVIT Nationwide Leaders Fund |
As a shareholder of the Fund, you incur two types of costs: (1) transaction costs, including sales charges (loads) paid on purchase payments and redemption fees; and (2) ongoing costs, including investment advisory fees, administration fees, distribution fees and other Fund expenses. The examples below are intended to help you understand your ongoing costs (in dollars) of investing in the Fund and to compare these costs with the ongoing costs of investing in other mutual funds. Per SEC requirements, the examples assume that you had a $1,000 investment in the Class at the beginning of the reporting period, January 1, 2005, and continued to hold your shares at the end of the reporting period, June 30, 2005.
Actual Expenses
For each Class of the Fund in the table below, the first line provides information about actual account values and actual expenses. You may use the information in this line, together with the amount you invested, to estimate the expenses that you paid over the period. Simply divide your account value by $1,000 (for example, an $8,600 account value divided by $1,000 = 8.6), then multiply the result by the number in the first line of each Class under the heading entitled “Expenses Paid During Period” to estimate the expenses you paid on your account during the period.
Hypothetical Example for Comparison Purposes
The second line of each Class in the table below provides information about hypothetical account values and hypothetical expenses based on the Class’ actual expense ratio and an assumed rate of return of 5% per year before expenses, which is not the Class’ actual return. The hypothetical account values and expenses may not be used to estimate the actual ending account balance or expenses you paid for the period. You may use this information to compare the ongoing costs of investing in the Class of the Fund and other funds. To do so, compare this 5% hypothetical example with the 5% hypothetical examples that appear in the shareholder reports of the other funds.
Please note that the expenses shown in the table are meant to highlight your ongoing costs only and do not reflect any transaction costs, such as sales charges (loads) or redemption fees. Therefore, the second line for each Class in the table is useful in comparing ongoing costs only, and will not help you determine the relative total costs of owning different funds. In addition, if these transaction costs were included, your costs would have been higher. The examples also assume all dividends and distributions have been reinvested.
| Beginning Account Value, January 1, 2005 | Ending Account Value, June 30, 2005 | Expenses Paid During Period* | Annualized Expense Ratio* | ||||||||||
| Nationwide Leaders Fund | |||||||||||||
Class I | Actual | $ | 1,000 | $ | 1,012 | $ | 5.84 | 1.17% | |||||
| Hypothetical1 | $ | 1,000 | $ | 1,019 | $ | 5.87 | 1.17% | ||||||
Class III | Actual | $ | 1,000 | $ | 1,012 | $ | 5.79 | 1.16% | |||||
| Hypothetical1 | $ | 1,000 | $ | 1,019 | $ | 5.82 | 1.16% | ||||||
| * | Expenses are equal to the Fund’s annualized expense ratio multiplied by the average account value over the period multiplied by 181/365 (to reflect the one-half year period). The expense ratio presented represents a six month, annualized ratio in accordance with SEC guidelines. |
| 1 | Represents the hypothetical 5% return before expenses. |
4
Table of Contents
Portfolio Summary
(June 30, 2005) | Gartmore GVIT Nationwide Leaders Fund |
The SEC adopted a requirement that Funds present their portfolio holdings in a table, chart or graph format in their annual and semiannual reports to shareholders, whether or not a statement of investments is utilized. The following tables, which present portfolio holdings as a percentage of net assets, are provided in compliance with this requirement.
| Asset Allocation | ||
| Common Stocks | 88.6% | |
| Cash Equivalents | 14.7% | |
| Liabilities in excess of other assets | -3.3% | |
| 100.0% | ||
| Top Holdings* | ||
Ball Corp. | 6.2% | |
Norfolk Southern Corp. | 5.7% | |
Oracle Corp. | 4.8% | |
Burlington Northern Santa Fe Corp. | 4.7% | |
Albemarle Corp. | 4.5% | |
Deere & Co. | 4.5% | |
American Standard Cos., Inc. | 4.4% | |
Progress Energy, Inc. | 4.0% | |
Bank of America Corp. | 4.0% | |
Reynolds American, Inc. | 3.9% | |
Other Holdings | 53.3% | |
| 100.0% | ||
| Top Industries | ||
| Computer Software & Services | 10.8% | |
| Oil & Gas | 8.7% | |
| Metals & Glass Packing | 6.1% | |
| Railroads | 5.7% | |
| Financial Services | 5.5% | |
| Transportation Services | 4.7% | |
| Chemicals | 4.5% | |
| Farm & Garden Machinery | 4.5% | |
| Manufacturing | 4.4% | |
| Energy Equipment & Services | 4.0% | |
| Other Industries | 41.1% | |
| 100.0% | ||
| * | For purpose of listing top holdings, repurchase agreements are considered cash equivalents and are included as part of Other Holdings. |
5
Table of Contents
GARTMORE VARIABLE INSURANCE TRUST
GARTMORE GVIT NATIONWIDE LEADERS FUND
Statement of Investments — June 30, 2005 (Unaudited)
| Shares or Principal Amount | Value | ||||
| COMMON STOCKS (88.6%) | |||||
| Auto—Medium & Heavy Duty Trucks (3.5%) | |||||
| PACCAR, Inc. | 10,500 | $ | 714,000 | ||
| Building—Residential (3.3%) | |||||
| Lennar Corp. | 10,600 | 672,570 | |||
| Chemicals (4.5%) | |||||
| Albemarle Corp. | 25,200 | 919,044 | |||
| Coal (1.1%) | |||||
| Peabody Energy Corp. | 4,400 | 228,976 | |||
| Communication Services (2.8%) | |||||
| Citizens Communications Co. | 42,400 | 569,856 | |||
| Computer Software & Services (10.8%) | |||||
| Oracle Corp. (b) | 74,000 | 976,800 | |||
| Seagate Technology | 34,100 | 598,455 | |||
| Yahoo! Inc. (b) | 17,600 | 609,840 | |||
| 2,185,095 | |||||
| Electronics (1.5%) | |||||
| Intel Corp. | 12,000 | 312,720 | |||
| Energy Equipment & Services (4.0%) | |||||
| Progress Energy, Inc. | 18,000 | 814,320 | |||
| Farm & Garden Machinery (4.5%) | |||||
| Deere & Co. | 13,900 | 910,311 | |||
| Financial Services (5.5%) | |||||
| Bank of America Corp. | 17,700 | 807,297 | |||
| Goldman Sachs Group, Inc. | 3,000 | 306,060 | |||
| 1,113,357 | |||||
| Health Care (2.5%) | |||||
| Aetna, Inc. | 6,200 | 513,484 | |||
| Information Technology Services (3.4%) | |||||
| Total System Services, Inc. | 11,900 | 286,790 | |||
| Westwood One, Inc. | 19,800 | 404,514 | |||
| 691,304 | |||||
| Insurance: Multi-Line (2.7%) | |||||
| Old Republic International Corp. | 22,000 | 556,380 | |||
| Manufacturing (4.4%) | |||||
| American Standard Cos., Inc. | 21,400 | 897,088 | |||
| Metals (1.0%) | |||||
| Phelps Dodge Corp. | 2,200 | 203,500 | |||
| Shares or Principal Amount | Value | ||||||
| COMMON STOCKS (continued) | |||||||
| Metals & Glass Packing (6.1%) | |||||||
| Ball Corp. | 34,800 | $ | 1,251,408 | ||||
| Oil & Gas (8.7%) | |||||||
| ChevronTexaco Corp. | 10,400 | 581,568 | |||||
| Exxon Mobil Corp. | 13,400 | 770,098 | |||||
| Kerr-Mcgee Corp. | 5,300 | 404,443 | |||||
| 1,756,109 | |||||||
| Railroads (5.7%) | |||||||
| Norfolk Southern Corp. | 37,800 | 1,170,288 | |||||
| Retail—Office Supplies (3.0%) | |||||||
| Staples, Inc. | 28,200 | 601,224 | |||||
| Semiconductors (1.0%) | |||||||
| Advanced Micro Devices, Inc. (b) | 12,000 | 208,080 | |||||
| Tobacco (3.9%) | |||||||
| Reynolds American, Inc. | 10,100 | 795,880 | |||||
| Transportation Services (4.7%) | |||||||
| Burlington Northern Santa Fe Corp. | 20,500 | 965,140 | |||||
| Total Common Stocks | 18,050,134 | ||||||
| CASH EQUIVALENTS (14.7%) | |||||||
| Investments in repurchase agreements (collateralized by AA Corporate Bonds in a joint trading account at 3.49%, dated 06/30/05, due 07/01/05, repurchase price $2,991,944) | $ | 2,991,653 | 2,991,653 | ||||
| Total Cash Equivalents | 2,991,653 | ||||||
| Total Investments (Cost $21,226,338) (a) — 103.3% | 21,041,787 | ||||||
| Liabilities in excess of other assets — (3.3%) | (679,452 | ) | |||||
| NET ASSETS — 100.0% | $ | 20,362,335 | |||||
| (a) | See notes to financial statements for unrealized appreciation (depreciation) of securities. |
| (b) | Denotes a non-income producing security. |
| ADR | American Depositary Receipt |
See notes to financial statements.
6
Table of Contents
GARTMORE VARIABLE INSURANCE TRUST
GARTMORE GVIT NATIONWIDE LEADERS FUND
Statement of Assets and Liabilities
June 30, 2005 (Unaudited)
Assets: | ||||
Investments, at value (cost $18,234,685) | $ | 18,050,134 | ||
Repurchase agreements, at cost and value | 2,991,653 | |||
Total Investments | 21,041,787 | |||
Cash | 367 | |||
Interest and dividends receivable | 19,974 | |||
Receivable for investments sold | 804,236 | |||
Prepaid expenses and other assets | 227 | |||
Total Assets | 21,866,591 | |||
Liabilities: | ||||
Payable for investments purchased | 1,484,767 | |||
Accrued expenses and other payables: | ||||
Investment advisory fees | 15,080 | |||
Fund administration and transfer agent fees | 328 | |||
Administrative servicing fees | 2,073 | |||
Other | 2,008 | |||
Total Liabilities | 1,504,256 | |||
Net Assets | $ | 20,362,335 | ||
Represented by: | ||||
Capital | $ | 19,259,761 | ||
Accumulated net investment income (loss) | (310 | ) | ||
Accumulated net realized gains (losses) from investment transactions | 1,287,435 | |||
Net unrealized appreciation (depreciation) on investments | (184,551 | ) | ||
Net Assets | $ | 20,362,335 | ||
Net Assets: | ||||
Class I Shares | $ | 1,688,338 | ||
Class III Shares | 18,673,997 | |||
Total | $ | 20,362,335 | ||
Shares outstanding (unlimited number of shares authorized): | ||||
Class I Shares | 126,617 | |||
Class III Shares | 1,398,511 | |||
Total | 1,525,128 | |||
Net asset value and offering price per share:* | ||||
Class I Shares | $ | 13.33 | ||
Class III Shares | $ | 13.35 |
| * | Not subject to a front-end sales charge. |
For the Six Months Ended June 30, 2005 (Unaudited)
Investment Income: | ||||
Interest income | $ | 14,328 | ||
Dividend income | 121,866 | |||
Total Income | 136,194 | |||
Expenses: | ||||
Investment advisory fees | 71,369 | |||
Fund administration and transfer agent fees | 6,241 | |||
Administrative servicing fees Class I Shares | 938 | |||
Administrative servicing fees | 9,670 | |||
Other** | 3,593 | |||
Total Expenses | 91,811 | |||
Net Investment Income (Loss) | 44,383 | |||
REALIZED/UNREALIZED GAINS (LOSSES) ON INVESTMENTS: | ||||
Net realized gains (losses) on investment transactions | 1,287,435 | |||
Net change in unrealized appreciation/depreciation on investments | (1,015,599 | ) | ||
Net realized/unrealized gains (losses) on investments | 271,836 | |||
CHANGE IN NET ASSETS RESULTING FROM OPERATIONS | $ | 316,219 | ||
| ** | Other expenses may include the following fees: audit, custody, insurance, legal, printing, trustee, and out-of-pocket expenses. |
See notes to financial statements.
7
Table of Contents
GARTMORE VARIABLE INSURANCE TRUST
GARTMORE GVIT NATIONWIDE LEADERS FUND
Statement of Changes in Net Assets
| Six Months Ended June 30, 2005 | Year Ended December 31, 2004 | |||||||
| (Unaudited) | ||||||||
From Investment Activities: | ||||||||
Operations: | ||||||||
Net investment income (loss) | $ | 44,383 | $ | 44,596 | ||||
Net realized gains (losses) on investment transactions | 1,287,435 | 1,537,844 | ||||||
Net change in unrealized appreciation/depreciation on investments | (1,015,599 | ) | (54,369 | ) | ||||
Change in net assets resulting from operations | 316,219 | 1,528,071 | ||||||
Distributions to Class I shareholders from: | ||||||||
Net investment income | (4,054 | ) | (3,421 | ) | ||||
Net realized gains on investments | (69,962 | ) | (12,728 | ) | ||||
Distributions to Class III shareholders from: | ||||||||
Net investment income | (45,024 | ) | (36,790 | ) | ||||
Net realized gains on investments | (764,857 | ) | (133,932 | ) | ||||
Change in net assets from shareholder distributions | (883,897 | ) | (186,871 | ) | ||||
Change in net assets from capital transactions | 10,386,130 | (128,469 | ) | |||||
Change in net assets | 9,818,452 | 1,212,731 | ||||||
Net Assets: | ||||||||
Beginning of period | 10,543,883 | 9,331,152 | ||||||
End of period | $ | 20,362,335 | $ | 10,543,883 | ||||
CAPITAL TRANSACTIONS: | ||||||||
Class I Shares | ||||||||
Proceeds from shares issued | $ | 1,294,827 | $ | 778,642 | ||||
Dividends reinvested | 74,016 | 16,148 | ||||||
Cost of shares redeemed | (538,698 | ) | (514,245 | ) | ||||
| 830,145 | 280,545 | |||||||
Class III Shares | ||||||||
Proceeds from shares issued | 10,315,110 | 2,975,997 | ||||||
Dividends reinvested | 809,879 | 170,723 | ||||||
Cost of shares redeemed | (1,569,004 | ) | (3,555,734 | ) | ||||
| 9,555,985 | (409,014 | ) | ||||||
Change net assets from capital transactions | $ | 10,386,130 | $ | (128,469 | ) | |||
SHARE TRANSACTIONS: | ||||||||
Class I Shares | ||||||||
Issued | 92,866 | 62,651 | ||||||
Reinvested | 5,570 | 1,169 | ||||||
Redeemed | (39,074 | ) | (41,447 | ) | ||||
| 59,362 | 22,373 | |||||||
Class III Shares | ||||||||
Issued | 753,525 | 234,709 | ||||||
Reinvested | 60,853 | 12,344 | ||||||
Redeemed | (112,873 | ) | (294,264 | ) | ||||
| 701,505 | (47,211 | ) | ||||||
See notes to financial statements.
8
Table of Contents
GARTMORE VARIABLE INSURANCE TRUST
FINANCIAL HIGHLIGHTS
Selected Data for Each Share of Capital Outstanding
Gartmore GVIT Nationwide Leaders Fund
| Investment Activities | Distributions | Ratios/Supplemental Data | |||||||||||||||||||||||||||||||||||||||||||
| Net Asset Value, Beginning of Period | Net Investment Income (Loss) | Redemption Fees | Net Realized and Unrealized Gains (Losses) on Investments | Total from Investment Activities | Net Investment Income | Net Realized Gains | Total Distributions | Net Asset Value, End of Period | Total Return | Net Assets at End of Period (000s) | Ratio of Expenses to Average Net Assets | Ratio of Net Investment Income (Loss) to Average Net Assets | Ratio of Expenses (Prior to Reimbursements) to Average Net Assets(a) | Ratio of Net Investment Income (Loss) (Prior to Reimbursements) to Average Net Assets(a) | Portfolio Turnover(b) | ||||||||||||||||||||||||||||||
Class I Shares | |||||||||||||||||||||||||||||||||||||||||||||
Period Ended December 31, 2002(c) | $ | 11.20 | 0.03 | 0.02 | (1.75 | ) | (1.70 | ) | (0.06 | ) | — | (0.06 | ) | $ | 9.44 | (15.17% | )(e) | $ | 247 | 1.12% | (f) | 1.03% | (f) | (g | ) | (g | ) | 105.28% | |||||||||||||||||
Year Ended December 31, 2003 | $ | 9.44 | 0.01 | 0.01 | 2.37 | 2.39 | (0.02 | ) | — | (0.02 | ) | $ | 11.81 | 25.38% | $ | 530 | 1.14% | 0.05% | (g | ) | (g | ) | 244.94% | ||||||||||||||||||||||
Year Ended December 31, 2004 | $ | 11.81 | 0.06 | 0.01 | 2.15 | 2.22 | (0.05 | ) | (0.20 | ) | (0.25 | ) | $ | 13.78 | 18.79% | $ | 927 | 1.19% | 0.55% | (g | ) | (g | ) | 259.37% | |||||||||||||||||||||
Six Months Ended June 30, 2005 (Unaudited) | $ | 13.78 | 0.03 | 0.01 | 0.13 | 0.17 | (0.04 | ) | (0.58 | ) | (0.62 | ) | $ | 13.33 | 1.21% | (e) | $ | 1,688 | 1.17% | (f) | 0.56% | (f) | (g | ) | (g | ) | 266.73% | ||||||||||||||||||
Class III Shares | |||||||||||||||||||||||||||||||||||||||||||||
Period Ended December 31, 2001(d) | $ | 10.00 | — | — | 0.08 | 0.08 | — | — | — | $ | 10.08 | 0.80% | (e) | $ | 1,008 | 1.25% | (f) | (0.16% | )(f) | 20.55% | (f) | (19.46% | )(f) | 0.00% | |||||||||||||||||||||
Year Ended December 31, 2002 | $ | 10.08 | 0.04 | 0.02 | (0.64 | ) | (0.58 | ) | (0.06 | ) | — | (0.06 | ) | $ | 9.44 | (5.78% | ) | $ | 8,463 | 1.15% | 0.80% | 1.16% | 0.79% | 105.28% | |||||||||||||||||||||
Year Ended December 31, 2003 | $ | 9.44 | 0.01 | 0.01 | 2.39 | 2.41 | (0.02 | ) | — | (0.02 | ) | $ | 11.83 | 25.59% | $ | 8,801 | 1.13% | 0.16% | (g | ) | (g | ) | 244.94% | ||||||||||||||||||||||
Year Ended December 31, 2004 | $ | 11.83 | 0.06 | 0.01 | 2.15 | 2.22 | (0.05 | ) | (0.20 | ) | (0.25 | ) | $ | 13.80 | 18.77% | $ | 9,617 | 1.17% | 0.48% | (g | ) | (g | ) | 259.37% | |||||||||||||||||||||
Six Months Ended June 30, 2005 (Unaudited) | $ | 13.80 | 0.03 | 0.01 | 0.13 | 0.17 | (0.04 | ) | (0.58 | ) | (0.62 | ) | $ | 13.35 | 1.21% | (e) | $ | 18,674 | 1.16% | (f) | 0.56% | (f) | (g | ) | (g | ) | 266.73% | ||||||||||||||||||
| (a) | During the period certain fees were waived and/or reimbursed. If such waivers/reimbursements had not occurred, the ratios would have been as indicated. |
| (b) | Portfolio turnover is calculated on the basis of the Fund as whole without distinguishing among the classes of shares. |
| (c) | For the period from May 9, 2002 (recommencement of operations) through December 31, 2002. |
| (d) | For the period from December 18, 2001 (commencement of operations) through December 31, 2001. Registration of shares effective with the Securities and Exchange Commission on December 31, 2001. On the effective date, the net asset value was $10.08 per share. |
| (e) | Not annualized. |
| (f) | Annualized. |
| (g) | There were no fee reductions during the period. |
See notes to financial statements.
9
Table of Contents
GARTMORE VARIABLE INSURANCE TRUST
NOTES TO FINANCIAL STATEMENTS (Unaudited)
June 30, 2005
1. Organization
Gartmore Variable Insurance Trust (“GVIT” or the “Trust”) is an open-end management investment company, organized under the laws of Delaware by an amended and restated Agreement and Declaration of Trust, dated October 28, 2004, as amended to date. The Trust, originally created under the laws of Massachusetts as a Massachusetts business trust pursuant to a Declaration of Trust dated, as of June 30, 1981,was subsequently amended, redomesticated as a Delaware Statutory Trust after the close of trading on April 29, 2005, and is registered under the Investment Company Act of 1940, as amended (the “1940 Act”). The redomestication is a change in statutory status and does not affect the operations of the Trust. As of June 30, 2005, the Trust had authorized an unlimited number of shares of beneficial interest (“shares”) without par value. The Trust currently offers shares to life insurance company separate accounts to fund the benefits under variable life insurance or annuity policies. To date, only the separate accounts of Nationwide Life Insurance Company and Nationwide Life and Annuity Insurance Company (collectively, “Nationwide”) have purchased shares of the Trust’s series. The Trust operates thirty-one (31) separate series, or mutual funds, each with its own investment objectives and strategies. This report contains the financial statements and financial highlights of the Gartmore GVIT Nationwide Leaders Fund (the “Fund”).
Under the Trust’s organizational documents, the Trust’s officers and trustees are indemnified against certain liabilities arising out of the performance of their duties to the Trust. In addition, the Trust has entered into Indemnification Agreements with the Trust’s trustees and certain officers covering similar liabilities. In addition, in the normal course of business, the Trust enters into contracts with its vendors and others that provide for general indemnifications. The Trust’s maximum exposure under these arrangements is unknown, as this would involve future claims that may be made against the Trust. Based on experience, however, the Trust expects that risk of loss to be remote.
2. Summary of Significant Accounting Policies
The following is a summary of significant accounting policies followed by the Fund in the preparation of its financial statements. The policies are in conformity with accounting principles generally accepted in the United States of America (“GAAP”). The preparation of financial statements requires management to make estimates and assumptions that affect the reported amounts of assets and liabilities, the disclosure of contingent assets and liabilities at the date of the financial statements and the reported amounts of income and expenses for the period. Actual results could differ from those estimates.
| (a) | Security Valuation |
Securities for which market quotations are readily available are valued at current market value as of “Valuation Time.” Valuation Time is as of the close of regular trading on the New York Stock Exchange (usually 4 p.m. Eastern time). Equity securities are valued at the last quoted sale price or, if there is no sale price, the last quoted bid price provided by an independent pricing service approved by the Trust’s Board of Trustees. Securities traded on NASDAQ are valued at the NASDAQ official closing price. Prices are taken from the primary market or exchange in which each security trades. Most securities listed on a foreign exchange are valued either at fair value (see description below) or at the last sale price at the close of the exchange on which the security is principally traded. Foreign securities, currencies, and other assets and liabilities denominated in foreign currencies are translated into U.S. dollars at the exchange rate of said currencies against the U.S. Dollar, as of Valuation Time, as provided by an independent pricing service approved by the Board of Trustees.
Securities for which market quotations are not readily available, or for which an independent pricing service does not provide a value or provides a value that does not represent fair value in the judgment of the Fund’s investment adviser or designee, are valued at fair value under procedures approved by the Trust’s Board of Trustees. The “Fair Value” of these securities is determined in good faith by taking into account relevant factors and surrounding circumstances. Methods utilized to obtain a “Fair Value” may include the following non-exclusive list of SEC acceptable methods: (i) a multiple of earnings; (ii) the discount from market value of a similar, freely traded security; (iii) the yield-to-maturity for debt issues; or (iv) a consolidation of the methods. The Gartmore Fair Value Committee considers a non-exclusive list of factors to arrive at the appropriate method upon determining “Fair Value.” For example, fair value determinations are required for securities whose value is affected by a “significant” event that materially affects the value of a domestic or foreign security which occurs subsequent to the time of the close of the principal market on which such domestic or foreign security trades and before the
10
Table of Contents
GARTMORE VARIABLE INSURANCE TRUST
NOTES TO FINANCIAL STATEMENTS (Unaudited) (Continued)
June 30, 2005
Valuation Time (i.e., a “subsequent event”). Typically, this will involve events occurring after the close of a foreign market on which a security trades and before the next Valuation Time.
| (b) | Repurchase Agreements |
The Fund may enter into repurchase agreements with an entity which is a member of the Federal Reserve System or which is a “primary dealer” (as designated by the Federal Reserve Bank of New York) in U.S. Government obligations. The repurchase price generally equals the price paid by the Fund plus interest negotiated on the basis of current short-term rates, which may be more or less than the rate on the underlying portfolio securities. The seller under a repurchase agreement is required to maintain the value of the collateral held pursuant to the agreement at a market value equal to or greater than the repurchase price (including accrued interest). Collateral subject to repurchase agreements is held by the Fund’s custodian or another qualified sub-custodian or in the Federal Reserve/Treasury book-entry system. If the counterparty defaults and the fair value of the collateral declines, realization of the collateral by the Fund may be delayed or limited. The Fund may transfer uninvested cash balances into a pooled cash account. These balances are invested in one or more repurchase agreements, which are fully collateralized by AA-rated Corporate Bonds with the counterparties of CS First Boston and Nomura Securities.
| (c) | Futures Contracts |
The Fund may invest in financial futures contracts (“futures contracts”) for the purpose of hedging its existing portfolio securities or securities that the Fund intends to purchase against fluctuations in value caused by changes in prevailing market interest rates or prices. Futures contracts may also be entered into for non-hedging purposes.
Upon entering into a futures contract, the Fund is required to pledge to the broker an amount of cash and/or other assets equal to a certain percentage of the contract amount (initial margin deposit). Subsequent payments, known as “variation margin,” are made each day, depending on the daily fluctuations in the fair value/market value of the underlying assets. A gain or loss equal to the daily variation margin is recognized on a daily basis. Futures contracts are valued daily at their last quoted sale price.
A “sale” of a futures contract means a contractual obligation to deliver the securities or foreign currency called for by the contract at a fixed price at a specified time in the future. A “purchase” of a futures contract means a contractual obligation to acquire the securities or foreign currency at a fixed price at a specified time in the future.
Should market conditions change unexpectedly, the Fund may not achieve the anticipated benefits of the futures contracts and may realize a loss. The use of futures transactions for hedging purposes involves the risk of imperfect correlation in movements in the price of futures contracts, interest rates, and the value of the underlying hedged assets.
| (d) | Written Options Contracts |
The Fund may write options contracts. A written option obligates the Fund to deliver (written call) or to receive (written put) a specified quantity of an underlying asset at the contract amount upon exercise by the holder of the option. The value of the option contract is recorded as a liability and unrealized gain or loss is measured by the difference between the current value and the premium received. Options traded on an exchange are valued at the last quoted sale price, or in the absence of a sale, the bid price provided by an independent pricing service approved by the Board of Trustees. Non-exchange traded options are valued using dealer supplied quotes.
| (e) | Short Sales |
The Fund is authorized to engage in short-selling of portfolio securities which obligates the Fund to replace any security that the Fund has borrowed by purchasing the security at current market value sometime in the future. The Fund will incur a loss if the price of the security increases between the date of the short sale and the date on which the Fund replaces the borrowed security. The Fund generally will realize a gain if the price of the security declines between these dates. Until the Fund replaces the borrowed security, the Fund will maintain a segregated account with cash, U.S. Government securities and/or securities held long to sufficiently cover the Fund’s short position on a daily basis. Dividends declared on securities sold
11
Table of Contents
GARTMORE VARIABLE INSURANCE TRUST
NOTES TO FINANCIAL STATEMENTS (Unaudited) (Continued)
June 30, 2005
short are recorded as an expense on the ex-dividend date and paid to the counterparty on the dividend pay date. The collateral for securities sold short are recorded as an expense on the ex-dividend date and paid to the counterparty on the dividend pay date. The collateral for securities sold short includes the deposits with brokers and securities held long as shown in the Statement of Investments for the Fund.
| (f) | Security Transactions and Investment Income |
Security transactions are accounted for on the date the security is purchased or sold (“trade date”). Securities gains and losses are calculated on the identified cost basis. Interest income is recognized on the accrual basis and includes, where applicable, the amortization or accretion of premium or discount. Dividend income is recorded on the ex-dividend date.
| (g) | Securities Lending |
To generate additional income, the Fund may lend up to 33 1/3% of the Fund’s total assets pursuant to agreements, requiring that the borrower deliver cash or securities as collateral with respect to each new loan of U.S. securities, equal to at least 102% of the value of the portfolio securities loaned, and with respect to each new loan of non-U.S. securities, collateral of at least 105% of the value of the portfolio securities loaned, and thereafter requiring the borrower to mark to market the collateral on a daily basis and requiring the borrower to make up any shortfall of collateral. The Fund receives payments from borrowers equivalent to the dividends and interest that would have been earned on securities lent while simultaneously seeking to earn income on the investment of cash collateral. Collateral is marked to market daily to provide a level of collateral at least equal to the market value of securities loaned. There may be risks of delay in recovery of the securities should the borrower of the securities fail financially. Loans will be made, however, only to borrowers deemed by the Fund’s investment adviser to be of good standing and creditworthy under guidelines established by the Board of Trustees and when, in the judgment of the adviser, the consideration which can be earned currently from these securities loans justifies the attendant risks. Loans are subject to termination by the Fund or the borrower at any time, and, therefore, are not considered to be illiquid investments. JPMorgan Chase Bank serves as custodian for the securities lending program of the Fund. JPMorgan Chase Bank receives a custody fee based on the value of collateral received from borrowers.
| (h) | Distributions to Shareholders |
The Fund’s dividends from net investment income, if any, are declared and paid quarterly. The Fund’s distributable net realized capital gains, if any, are declared and distributed at least annually.
Dividends and distributions to shareholders are determined in accordance with federal income tax regulations, which may differ from GAAP. These “book/tax” differences are considered either permanent or temporary in nature. In accordance with the American Institute of Certified Public Accountants (“AICPA”) Statement of Position 93-2, permanent differences (i.e., reclassification of market discounts, gain/loss, paydowns, and distributions) are reclassified within the capital accounts based on their nature for federal income tax purposes; temporary differences do not require reclassification. These reclassifications have no effect upon the net asset value of the Fund. To the extent distributions exceed current and accumulated earnings and profits for federal income tax purposes, these distributions are reported as distributions of paid-in-capital.
| (i) | Federal Income Taxes |
It is the policy of the Fund to qualify or continue to qualify as a “regulated investment company” by complying with the provisions available to certain investment companies, as defined in applicable sections of the U.S. Internal Revenue Code, and to make distributions of net investment income and net realized capital gains sufficient to relieve the Fund from all, or substantially all, federal income taxes.
As of June 30, 2005, the tax cost of securities and the breakdown of unrealized appreciation (depreciation) for the Fund is as follows:
Tax Cost of | Unrealized Appreciation | Unrealized Depreciation | Net Unrealized Appreciation (Depreciation) | |||||||||
$158,107 | $118,053 | $(460,711) | $(342,658) | |||||||||
12
Table of Contents
GARTMORE VARIABLE INSURANCE TRUST
NOTES TO FINANCIAL STATEMENTS (Unaudited) (Continued)
June 30, 2005
| (j) | Allocation of Expenses, Income, and Gains and Losses |
Expenses directly attributable to the Fund are charged to the Fund. Expenses not directly attributable to the Fund are allocated proportionately among various or all funds within the Trust. The method used by the Fund for allocating income, fund level expenses, and realized and unrealized gains or losses is based on the fair value of shares outstanding relative to net assets. Under this method, each class of shares participates based on the total net asset value of that class’s shares in proportion to the total net assets of the Fund. Expenses specific to a class (such as rule 12b-1 and administrative services fees) are charged to that class.
3. Transactions with Affiliates
Under the terms of the Trust’s Investment Advisory Agreement, Gartmore Mutual Fund Capital Trust (“GMF”) manages the investment of the assets and supervises the daily business affairs of the Fund. GMF is a wholly-owned subsidiary of Gartmore Global Investments, Inc. (“GGI”), a holding company. GGI is a majority-owned subsidiary of Gartmore Global Asset Management Trust (“GGAMT”). GGAMT is a wholly-owned subsidiary of Nationwide Corporation. All of the common stock of Nationwide Corporation is held by Nationwide Mutual Insurance Company (95.2%) and Nationwide Mutual Fire Insurance Company (4.8%), each of which is a mutual company owned by its policyholders.
Under the terms of the Investment Advisory Agreement, the Fund pays GMF an investment advisory fee based on the Fund’s average daily net assets and the following schedule:
| Fee Schedule | Fees | |
Up to $500 million | 0.90% | |
$500 million up to $2 billion | 0.80% | |
$2 billion or more | 0.75% |
GMF and the Fund have entered into a written contract (“Expense Limitation Agreement”) that limits operating expenses (excluding any taxes, interest, brokerage fees, extraordinary expenses, short sale dividend expenses, Rule 12b-1 fees, and administrative service fees) from exceeding 1.10% for all classes until at least May 1, 2006.
GMF may request and receive reimbursement from the Fund of the advisory fees waived and other expenses reimbursed by GMF, respectively, pursuant to the Expense Limitation Agreement at a later date not to exceed three years from the fiscal year in which the corresponding reimbursement to the Fund was made, depending on the Fund (as described below), if the Fund has reached a sufficient asset size to permit reimbursement to be made without causing the total annual operating expense ratio of the Fund to exceed the limits set forth above. No reimbursement will be made unless: (i) the Fund’s assets exceed $100 million; (ii) the total annual expense ratio of the Class making such reimbursement is less than the limit set forth above; and (iii) the payment of such reimbursement is approved by the Board of Trustees on a quarterly basis. Except as provided for in the Expense Limitation Agreements, reimbursement of amounts previously waived or assumed by GMF is not permitted.
As of the six months ended June 30, 2005, the cumulative potential reimbursements for all classes of shares of the Fund, based on reimbursements which expires within three years from the fiscal year in which the corresponding reimbursement to the Fund was made for expenses reimbursed by GMF would be:
Amount | Amount Fiscal Year 2003 | Amount Fiscal Year 2004 | Amount Six Months Ended June 30, 2005 | |||
$155 | $— | $— | $— |
Under the terms of a Fund Administration and Transfer Agency Agreement, Gartmore SA Capital Trust (“GSA”) provides the Fund with various administrative and accounting services, and Gartmore Investors Services, Inc. (“GISI”), an indirect subsidiary of GSA, serves as Transfer and Dividend Disbursing Agent for the Fund. The fees for the services provided under
13
Table of Contents
GARTMORE VARIABLE INSURANCE TRUST
NOTES TO FINANCIAL STATEMENTS (Unaudited) (Continued)
June 30, 2005
this Agreement are calculated based on the Trust’s average daily net assets according to the fee schedule below. The fees are then allocated proportionately among all funds within the Trust in relation to the average daily net assets of each fund and are paid to GSA. GSA pays GISI from these fees for its services.
| Combined Fee Schedule* | ||
Up to $1 billion | 0.13% | |
$1 billion and more up to $3 billion | 0.08% | |
$3 billion and more up to $8 billion | 0.05% | |
$8 billion and more up to $10 billion | 0.04% | |
$10 billion and more up to $12 billion | 0.02% | |
$12 billion or more | 0.01% | |
| * | The assets of the Gartmore GVIT Investor Destinations Aggressive Fund, the Gartmore GVIT Investor Destinations Moderately Aggressive Fund, the Gartmore GVIT Investor Destinations Moderate Fund, the Gartmore GVIT Investor Destinations Moderately Conservative Fund, and the Gartmore GVIT Investor Destinations Conservative Fund (collectively, the “Investor Destinations Funds”) are excluded from the Trust asset level amount in order to calculate this asset-based fee. The Investor Destinations Funds do not pay any part of this fee. |
Effective January 1, 2005, the fee for the fund administration and transfer agency services increased as set forth below. The fees are calculated based on the Trust’s average daily net assets according to the fee schedule below. The fees are then allocated proportionately among all funds within the Trust in relation to the average daily net assets of each fund and are paid to GSA.
| Combined Fee Schedule* | ||
Up to $1 billion | 0.15% | |
$1 billion and more up to $3 billion | 0.10% | |
$3 billion and more up to $8 billion | 0.05% | |
$8 billion and more up to $10 billion | 0.04% | |
$10 billion and more up to $12 billion | 0.02% | |
$12 billion or more | 0.01% | |
| * | The assets of each of the Investor Destinations Funds are excluded from the Trust asset level amount in order to calculate this asset-based fee. The Investor Destinations Funds do not pay any part of this fee. |
GSA and GISI have entered into agreements with BISYS Fund Services Ohio, Inc. (“BISYS”), pursuant to which BISYS provides sub-administration and sub-transfer agency services, respectively, to the Fund.
Under the terms of a Distribution Plan under Rule 12b-1 of the 1940 Act, Gartmore Distribution Services, Inc. (“GDSI”), the Fund’s Distributor, is compensated by the Fund for expenses associated with the distribution of the Class II shares of the Fund. These fees are based on average daily net assets of Class II shares of the Fund at an annual rate not to exceed 0.25%.
Under the terms of an Administrative Services Plan, the Fund may pay fees to servicing organizations, such as broker-dealers, including Nationwide Financial Services, and financial institutions, which agree to provide administrative support services to the shareholders of certain classes. These services include, but are not limited, to the following: establishing and maintaining shareholder accounts; processing purchase and redemption transactions; arranging bank wires; performing shareholder sub-accounting; answering inquires regarding the Fund; and other such services. These fees are based on an annual rate of up to 0.25% of the average daily net assets of each class of shares of the Fund.
4. Short-Term Trading Fees
The Fund reserves the right to assess a short-term trading fee on certain transactions out of Class III shares that a separate account makes on behalf of a variable insurance contract owner (the “contract owner”). A separate account that redeems
14
Table of Contents
GARTMORE VARIABLE INSURANCE TRUST
NOTES TO FINANCIAL STATEMENTS (Unaudited) (Continued)
June 30, 2005
Class III shares on behalf of a contract owner may be subject to a 1.00% short-term trading fee if the separate account held the Class III shares on behalf of the contract owner for 60 days or less, unless an exception applies as disclosed in the prospectus. The short-term trading fee is paid directly to the Fund and is intended to offset the cost to the Fund of excess brokerage commissions and other costs associated with fluctuations in fund asset levels and cash flow caused by short-term trading in Class III shares. For purposes of determining whether the short-term trading fee applies, the Class III shares that were held on behalf of the contract owner the longest will be treated as being redeemed first.
For the six months ended June 30, 2005, the Fund had no contributions to capital due to collection of redemption fees.
5. Investment Transactions
For the six months ended June 30, 2005, (excluding short-term securities) the Fund had purchases of $47,470,439 and sales of $40,149,563.
6. Bank Loans
The Trust has a credit agreement of $100,000,000. Borrowings under this arrangement bear interest at the Federal Funds rate plus 0.50%. The interest costs are included in custodian fees in the Statement of Operations. No compensation balances were required under the terms of the line of credit. There were no borrowings outstanding as of June 30, 2005.
7. Shareholder Meeting
A separate shareholders meeting was held on Tuesday, December 23, 2004, for the shareholders of the Trust’s predecessor pursuant to a Proxy Statement On Schedule 14A, dated October 29, 2004, and mailed to the shareholders of the Trust’s predecessor on or around November 5, 2004.
Two Proposals: The purpose of the December 23, 2004 meeting was to allow the shareholders of the Trust’s predecessor to vote on:
| i. | Proposal One: The election of the Trust’s Board of Trustees; and |
| ii. | Proposal Two: The approval of an “Agreement and Plan of Reorganization” that provided for the reorganization of the Trust from a Massachusetts business trust into a Delaware statutory trust. |
Proposal One: As set forth in the October 29, 2004 Proxy Statement, the nominees for election as Trustees of the Trust’s predecessor were: Charles E. Allen, Michael J. Baresich, Paula H.J. Cholmondeley, C. Brent DeVore, Phyllis Kay Dryden, Robert M. Duncan, Barbara L. Hennigar, Paul J. Hondros, Barbara I Jacobs, Thomas J. Kerr IV, Douglas F. Kridler, Michael D. McCarthy, Arden L. Shisler, and David C. Wetmore.
Proposal Two: As specifically set forth in the October 29, 2004 Proxy Statement, the Reorganization proposal requested the shareholders of the Trust’s predecessor to approve the proposed “Agreement and Plan of Reorganization” of the Trust’s predecessor (on behalf of each of the its funds) into a new Delaware-domiciled Trust, whereby the Funds of the new Delaware Trust would acquire all of the assets of the corresponding funds of the Trust’s predecessor subject to the liabilities, expenses, costs, charges, and reserves of the corresponding funds of the Trust’s predecessor (contingent or otherwise), in exchange for shares of the acquiring Funds to be distributed pro rata by the Trust to the holders of the shares of the funds of the Trust’s predecessor, in a complete liquidation of the Trust’s predecessor.
15
Table of Contents
GARTMORE VARIABLE INSURANCE TRUST
NOTES TO FINANCIAL STATEMENTS (Unaudited) (Continued)
June 30, 2005
Voting Results:
The shareholders of the Trust’s predecessor voted to approve both Proposal One and Proposal Two, as follows:
Proposal 1: Election of a Board of Trustees of Gartmore Variable Insurance Trust
Charles E. Allen: | ||
FOR | 2,797,230,318.955 shares (96.078%) | |
WITHHOLD | 114,195,693.660 shares (3.922%) | |
TOTAL | 2,912,726,012.615 shares (100.000%) | |
Michael J. Baresich: | ||
FOR | 2,796,135,979.559 shares (96.040%) | |
WITHHOLD | 115,290,033.056 shares (3.960%) | |
TOTAL | 2,912,726,012.615 shares (100.000%) | |
Paula H.J. Cholmondeley: | ||
FOR | 2,795,095,945.396 shares (96.004%) | |
WITHHOLD | 116,330,067.219 shares (3.996%) | |
TOTAL | 2,912,726,012.615 shares (100.000%) | |
C. Brent DeVore: | ||
FOR | 2,797,207,046.916 shares (96.077%) | |
WITHHOLD | 114,218,965.699 shares (3.923%) | |
TOTAL | 2,912,726,012.615 shares (100.000%) | |
Phyllis Kay Dryden: | ||
FOR | 2,795,587,023.994 shares (96.021%) | |
WITHHOLD | 115,838,988.621 shares (3.979%) | |
TOTAL | 2,912,726,012.615 shares (100.000%) | |
Robert M. Duncan: | ||
FOR | 2,790,191,720.503 shares (95.836%) | |
WITHHOLD | 121,234,292.112 shares (4.164%) | |
TOTAL | 2,912,726,012.615 shares (100.000%) | |
Barbara L. Hennigar: | ||
FOR | 2,792,939,848.858 shares (95.937%) | |
WITHHOLD | 118,486,163.757 shares (4.070%) | |
TOTAL | 2,912,726,012.615 shares (100.000%) | |
Paul J. Hondros: | ||
FOR | 2,797,557,404.448 shares (96.089%) | |
WITHHOLD | 113,868,608.167 shares (3.911%) | |
TOTAL | 2,912,726,012.615 shares (100.000%) | |
16
Table of Contents
GARTMORE VARIABLE INSURANCE TRUST
NOTES TO FINANCIAL STATEMENTS (Unaudited) (Continued)
June 30, 2005
Barbara I. Jacobs: | ||
FOR | 2,796,306,126.654 shares (96.046%) | |
WITHHOLD | 115,119,885.961 shares (3.954%) | |
TOTAL | 2,912,726,012.615 shares (100.000%) | |
Thomas J. Kerr IV: | ||
FOR | 2,789,755,720.087 shares (95.821%) | |
WITHHOLD | 121,670,292.528 shares (4.179%) | |
TOTAL | 2,912,726,012.615 shares (100.000%) | |
Douglas F. Kridler: | ||
FOR | 2,798,065,774.375 shares (96.106%) | |
WITHHOLD | 113,360,238.240 shares (3.894%) | |
TOTAL | 2,912,726,012.615 shares (100.000%) | |
Michael D. McCarthy: | ||
FOR | 2,797,452,613.694 shares (96.085%) | |
WITHHOLD | 113,973,395.921 shares (3.915%) | |
TOTAL | 2,912,726,012.615 shares (100.000%) | |
Arden L. Shisler: | ||
FOR | 2,796,738,454.730 shares (96.061%) | |
WITHHOLD | 114,687,557.885 shares (3.939%) | |
TOTAL | 2,912,726,012.615 shares (100.000%) | |
David C. Wetmore: | ||
FOR | 2,794,784,752.247 shares (95.994%) | |
WITHHOLD | 116,641,260.368 shares (4.006%) | |
TOTAL | 2,912,726,012.615 shares (100.000%) | |
Proposal 2: Approval of the Agreement and Plan of Reorganization of Gartmore Variable Insurance Trust
FOR | 2,561,003,822.546 shares (87.964%) | |
AGAINST | 103,593,261.010 shares (3.558%) | |
ABSTAIN | 246,828,929.059 shares (8.478%) | |
TOTAL | 2,912,726,012.615 shares (100.000%) | |
17
Table of Contents
GARTMORE VARIABLE INSURANCE TRUST
NOTES TO FINANCIAL STATEMENTS (Unaudited) (Continued)
June 30, 2005
8. Subsequent Event
On July 29, 2005, the Trust filed a Post-Effective Amendment to its Registration Statement on Form N-1A to change the structure of the Fund’s investment advisory fee from the current asset-based fee structure to a performance based fee structure on or about October 1, 2005. On that date, or, if later, upon SEC effectiveness, the Fund will immediately lower its base advisory fee by 0.10% at each breakpoint. Beginning one year after implementation of the new performance fee structure, the Fund’s base advisory fee may be adjusted proportionately upward or downward if the Fund outperforms or underperforms its stated benchmark by the following amounts:
| Out or Underperformance | Change in Fees | |
+/- 1 percentage point | +/- 0.02% | |
+/- 2 percentage points | +/- 0.04% | |
+/- 3 percentage points | +/- 0.06% | |
+/- 4 percentage points | +/- 0.08% | |
+/- 5 percentage points | +/- 0.10% |
The prospectus describing the above Fund will be supplemented upon the effectiveness of the Post-Effective Amendment to the Trust’s Registration Statement. Please refer to the prospectus, as supplemented by a notice you will receive after the effectiveness of the Post-Effective Amendment, for further information about this new fee structure.
18
Table of Contents
GARTMORE VARIABLE INSURANCE TRUST
Management Information (Unaudited)
June 30, 2005
Trustees who are not Interested Persons (as defined in the 1940 Act) and Officers of the Funds June 30, 2005
| Name, Address and Date of Birth | Position(s) Held with the Trust and Length of Time Served1 | Principal Occupation(s) During Past 5 Years | Number of Portfolios in the Gartmore Fund Complex Overseen by Trustee | Other Directorships Held by Trustee or Nominee2 | ||||
Charles E. Allen
c/o Gartmore Global Investments, Inc. 1200 River Road, Suite 1000 Conshohocken, PA 19428
1948 | Trustee since July 2000 | Mr. Allen is Chairman, Chief Executive Officer and President of the Graimark Realty Advisors, Inc. (real estate development, investment and asset management). | 84 | None | ||||
Paula H.J. Cholmondeley
c/o Gartmore Global Investments, Inc. 1200 River Road, Suite 1000 Conshohocken, PA 19428
1940 | Trustee since July 2000 | Ms. Cholmondeley has been the Chairman and Chief Executive Officer of the Sorrel Group, a management consulting company, since January 2004. From March 2000 through December 2003, Ms. Cholmondeley was Vice President and General Manager of Sappi Fine Paper North America. Prior thereto, Ms. Cholmondeley was Vice President and General Manager of Residential Insulation of Owens Corning. | 84 | Director of Dentsply International, Inc., Ultralife Batteries, Inc., Terex Corporation, Minerals Technology, Inc. and Albany International Corp. | ||||
C. Brent DeVore
c/o Gartmore Global Investments, Inc. 1200 River Road, Suite 1000 Conshohocken, PA 19428
1940 | Trustee since 1990 | Dr. DeVore is President of Otterbein College. | 84 | None | ||||
Phyllis K. Dryden c/o Gartmore Global Investments, Inc. 1200 River Road, Suite 1000 Conshohocken, PA 19428 1947 | Trustee since December 2004 | Ms. Dryden was a former Managing Partner of marchFIRST, a global management consulting firm prior to 2002. | 84 | None |
19
Table of Contents
GARTMORE VARIABLE INSURANCE TRUST
Management Information (Unaudited)
June 30, 2005
| Name, Address and Date of Birth | Position(s) Held with the Trust and Length of Time Served1 | Principal Occupation(s) During Past 5 Years | Number of Portfolios in the Gartmore Fund Complex Overseen by Trustee | Other Directorships Held by Trustee or Nominee2 | ||||
Barbara L. Hennigar*
c/o Gartmore Global Investments, Inc. 1200 River Road, Suite 1000 Conshohocken, PA 19428
1935 | Trustee since July 2000 | Retired since June 2000. Prior thereto, Ms. Hennigar was the Chairman or President and Chief Executive Officer of OppenheimerFunds Services and a member of the Executive Committee of OppenheimerFunds. | 84 | None | ||||
Barbara I. Jacobs
c/o Gartmore Global Investments, Inc. 1200 River Road, Suite 1000 Conshohocken, PA 19428
1950 | Trustee since December 2004 | Ms. Jacobs has served as Chairman of the Board of Directors of KICAP Network Fund, a European (United Kingdom) hedge fund, since December 2000. Prior to 2004, Ms. Jacobs was also a Managing Director and European Portfolio Manager with CREF Investments (Teachers Insurance Annuity Association — College Retirement Equity Fund). | 84 | None | ||||
Douglas F. Kridler
c/o Gartmore Global Investments, Inc. 1200 River Road, Suite 1000 Conshohocken, PA 19428
1955 | Trustee since September 1997 | Mr. Kridler has served as the President and Chief Executive Officer of the Columbus Foundation (a Columbus, OH-based foundation which manages over 1,300 individual endowment funds) since February 2002. Mr. Kridler was the President of the Columbus Association for the Performing Arts prior thereto and Chairman of the Greater Columbus Convention and Visitors Bureau during 2000 and 2001. | 84 | None | ||||
Michael D. McCarthy
c/o Gartmore Global Investments, Inc. 1200 River Road, Suite 1000 Conshohocken, PA 19428
1947 | Trustee since December 2004 | Mr. McCarthy serves as: the Founder and Chairman of The Eureka Foundation (which sponsors and funds the “Great Museums” series on PBS); and a Partner of Pineville Properties LLC (a commercial real estate development firm). | 843 | None |
20
Table of Contents
GARTMORE VARIABLE INSURANCE TRUST
Management Information (Unaudited)
June 30, 2005
| Name, Address and Date of Birth | Position(s) Held with the Trust and Length of Time Served1 | Principal Occupation(s) During Past 5 Years | Number of Portfolios in the Gartmore Fund Complex Overseen by Trustee | Other Directorships Held by Trustee or Nominee2 | ||||
David C. Wetmore
c/o Gartmore Global Investments, Inc. 1200 River Road, Suite 1000 Conshohocken, PA 19428
1948 | Trustee since 1995 and Chairman since February 2005 | Retired. Mr. Wetmore was formerly a Managing Director of Updata Capital, an investment banking and venture capital firm. | 84 | None |
| * | Pursuant to the Trust’s mandatory retirement policy, Ms. Hennigar is expected to retire on or about January 12, 2006. |
| 1 | The term of office length is until a trustee resigns or reaches a mandatory retirement age of 70. On March 2, 2000, the Board adopted a five-year implementation period for any Trustee 65 or older as of the adoption of this policy. Pursuant to this policy, Messrs. Duncan and Kerr retired as trustees effective as of March 12, 2005. |
| 2 | Directorships held in (1) any other investment companies registered under the 1940 Act, (2) any company with a class of securities registered pursuant to Section 12 of the Securities Exchange Act of 1934, as amended (the “Exchange Act”), or (3) any company subject to the requirements of Section 15(d) of the Exchange Act. |
| 3 | Mr. McCarthy was also an Administrative Committee Member for the Alphagen Arneb Fund, LLC, The Healthcare Fund LDC, The Leaders Long-Short Fund, LLC, and The Leaders Long-Short Fund LDC, four private investment companies (hedge funds) managed by GSA. Mr. McCarthy resigned as an Administrative Committee Member effective June 30, 2005. |
Trustees and Officers who are not Interested Persons (as defined in the 1940 Act) of the Funds received aggregate compensation of $274,882 from the Trust for the Six Months Ended June 30, 2005. Additional information regarding the Trustees and Officers may be found in the Trust’s statement of additional information, which is available without charge upon request, by calling 1-800-848-0920.
21
Table of Contents
GARTMORE VARIABLE INSURANCE TRUST
Management Information (Unaudited)
June 30, 2005
Trustees who are Interested Persons (as defined in the 1940 Act) and/or Officers of the Funds June 30, 2005
| Name, Address and Age | Position(s) Held with the Trust and Length of Time Served1 | Principal Occupation(s) During Past 5 Years | Number of Portfolios in the Gartmore Fund Complex Overseen by Trustee | Other Directorships Held by Trustee2 | ||||
Paul J. Hondros
Gartmore Global Investments, Inc. 1200 River Road, Suite 1000 Conshohocken, PA 19428
1948 | Trustee since July 2000 | Mr. Hondros has been President and Chief Executive Officer of various Gartmore entities, including Gartmore Distribution Services, Inc. (“GDSI”),3 Gartmore Investor Services, Inc. (“GISI”),3 Gartmore Morley Capital Management, Inc. (“GMCM”),3 Gartmore Morley Financial Services, Inc. (“GMFS”),3 NorthPointe Capital, LLC (“NorthPointe”),3 Gartmore Global Asset Management Trust (“GGAMT”)3, Gartmore Global Investments, Inc. (“GGI”)3, Gartmore Mutual Fund Capital Trust (“GMFCT”)3 and Gartmore SA Capital Trust (“GSA”)3; and a Director of Nationwide Securities, Inc.3, as well as several entities within Nationwide Financial Services, Inc. | 844 | None | ||||
Arden L. Shisler
c/o Gartmore Global Investments, Inc. 1200 River Road, Suite 1000 Conshohocken, PA 19428
1941 | Trustee since February 2000 | Mr. Shisler has been a consultant since January 2003. Prior thereto, he was President and Chief Executive Officer of K&B Transport, Inc., a trucking firm. Since 1992, Mr. Shisler has also been Chairman of the Board for Nationwide Mutual Insurance Company3. | 84 | Director of Nationwide Financial Services, Inc. | ||||
Gerald J. Holland
Gartmore Global Investments, Inc. 1200 River Road, Suite 1000 Conshohocken, PA 19428
1951 | Treasurer since March 2001 | Mr. Holland is Senior Vice President — Operations for GGI3, GMFCT3, and GSA3. Prior to July 2000, Mr, Holland was Vice President for First Data Investor Services, an investment company service provider. | 84 | None |
22
Table of Contents
GARTMORE VARIABLE INSURANCE TRUST
Management Information (Unaudited)
June 30, 2005
| Name, Address and Age | Position(s) Held with the Trust and Length of Time Served1 | Principal Occupation(s) During Past 5 Years | Number of Portfolios in the Gartmore Fund Complex Overseen by Trustee | Other Directorships Held by Trustee2 | ||||
Michael A. Krulikowski
Gartmore Global Investments, Inc. 1200 River Road, Suite 1000 Conshohocken, PA 19428
1959 | Chief Compliance Officer since June 2004 | Since November 1999, Mr. Krulikowski has served as a Vice President and Chief Compliance Officer of GGI. Prior thereto, Mr. Krulikowski served as Chief Compliance Officer of 1717 Capital Management Company/Provident Mutual Insurance Company. | 84 | None | ||||
Eric E. Miller
Gartmore Global Investments, Inc. 1200 River Road, Suite 1000 Conshohocken, PA 19428
1953 | Secretary since December 2002 | Mr. Miller is Senior Vice President, Chief Counsel for GGI3, GMFCT3 and GSA3 since August 2002. From August 2000 to August 2002, Mr. Miller was a Partner with Stradley Ronan Stevens & Young, LLP. Prior to August 2000, Mr. Miller served as Senior Vice President and Deputy General Counsel at Delaware Investments. | 84 | None |
| 1 | The term of office length is until a trustee resigns or reaches a mandatory retirement age of 70. On March 2, 2000, the Board adopted a five-year implementation period for any Trustee 65 or older as of the adoption of this policy. Pursuant to this policy, Messrs. Duncan and Kerr retired as trustees effective as of March 12, 2005. |
| 2 | Directorships held in (1) any other investment companies registered under the 1940 Act, (2) any company with a class of securities registered pursuant to Section 12 of the Securities Exchange Act of 1934, as amended (the “Exchange Act”), or (3) any company subject to the requirements of Section 15(d) of the Exchange Act. |
| 3 | This position is held with an affiliated person or principal underwriter of the Trust. |
| 4 | Mr. Hondros was also an Administrative Committee Member for the Alphagen Arneb Fund, LLC, The Healthcare Fund LDC, The Leaders Long-Short Fund, LLC, and The Leaders Long-Short Fund LDC, four private investment companies (hedge funds) managed by GSA. Mr. Hondros resigned as Administrative Committee Member effective June 30, 2005. |
Federal law requires the Trust, each of its investment advisers and sub-advisers to adopt procedures for voting proxies (“Proxy Voting Guidelines”) and to provide a summary of those Proxy Voting Guidelines used to vote the securities held by the Funds. The Funds’ proxy voting policies and procedures are available without charge (i) upon request, by calling 1-800-848-0920, (ii) on the Fund’s website at www.gartmorefunds.com, or (iii) on the Securities and Exchange Commission’s website at www.sec.gov.
23
Table of Contents
Gartmore GVIT Emerging Markets Fund
Semiannual Report
| | June 30, 2005 |
| Contents | ||
| 6 | Statement of Investments | |
| 10 | Statement of Assets and Liabilities | |
| 10 | Statement of Operations | |
| 11 | Statements of Changes in Net Assets | |
| 13 | Financial Highlights | |
| 14 | Notes to Financial Statements | |
Commentary provided by Gartmore Global Investments, investment adviser to Gartmore Variable Insurance Trust. All opinions and estimates included in this report constitute Gartmore Global Investments’ judgment as of the date of this report and are subject to change without notice.
Statement Regarding Availability of Quarterly Portfolio Schedule.
The Gartmore Variable Insurance Trust files complete schedules of portfolio holdings for each Fund with the Securities and Exchange Commission (the “Commission”) for the first and third quarters of each fiscal year on Form N-Q. The Funds’ Forms N-Q are available on the Commission’s website at http://www.sec.gov. The Funds’ Forms N-Q may be reviewed and copied at the Commission’s Public Reference Room in Washington, DC, and information on the operation of the Public Reference Room may be obtained by calling 800-SEC-0330; and the Funds make the information on Form N-Q available to shareholders upon request without charge.
Statement Regarding Availability of Proxy Voting Record.
Information regarding how the Fund voted proxies relating to portfolio securities held during the most recent 12-month period ended June 30, 2005 is available without charge, upon request, by calling 800-848-0920, and on the Commission’s website at http://www.sec.gov.
Table of Contents
Gartmore GVIT Emerging Markets Fund
For the semiannual period ended June 30, 2005, the Gartmore GVIT Emerging Markets Fund returned 6.57% (Class I at NAV) versus 6.26% for the Fund’s benchmark, the Morgan Stanley Capital International Emerging Markets (MSCI EM) Index. For broader comparison, the average return for the Fund’s Lipper peer category of Emerging Markets Funds was 5.88%.
An emphasis on growth stocks was one factor that enabled the Fund to keep pace with the benchmark during the reporting period, as that segment of the market had a strong run during May and much of June. On a country basis, favorable stock selection in South Korea, Turkey and South Africa was also helpful to performance. Conversely, our selections in Taiwan, China and Russia hurt performance.
Regarding sectors, the Fund was particularly helped by stock selection in financials, information technology and consumer discretionary. Our financial holdings gained materially from the Fund’s position in Turkish bank DenizBank, whose share price almost doubled during the reporting period. The company benefited from several factors, including: 1) a strong management team; 2) increased interest in Turkish stocks ahead of further discussions about the country’s possible inclusion in the European Union; and 3) speculation that the bank could be a takeover candidate.
In technology, performance was aided by Solomon Systech Ltd., a leading Asian maker of integrated circuit products used in cellular phones, handheld devices and LCD (liquid-crystal display) televisions. South Korean holdings Seoul Semiconductor Co., Ltd. and LG Electronics, a leading maker of LCDs, cellular handsets and electrical appliances, also contributed to performance. In the consumer discretionary sector, CJ Home Shopping Co., Ltd. benefited from South Korea’s ongoing recovery in domestic spending.
Sectors that detracted from performance versus the benchmark included energy and telecommunication services. Despite turning in the highest return among all of the Fund’s sectors, our energy holdings lagged relative to the benchmark because we were under-represented in some stocks that performed well, including PetroChina Co. Ltd. and Russia-based LUKOIL. High valuations made us reluctant to take meaningful positions in these and a number of other exploration and production stocks. Instead, we chose to emphasize the services side of the energy group, where we thought the fundamentals were even stronger.
In telecommunication services, the Fund was hampered by overweighted positions in lackluster performers Telekom Malaysia Berhad, SK Telecom Co., Ltd. and Vimpel-Communications, the stocks of companies based in Malaysia, South Korea and Russia, respectively.
For the balance of 2005, we anticipate maintaining our emphasis on domestic consumption in a number of emerging markets where consumer spending trends have been constructive. However, we also think technology stocks could perform well and have recently increased the Fund’s positions in some globally competitive exporters of technology based in South Korea, Taiwan and elsewhere. These purchases were funded mainly from the sale of materials stocks, many of which we believe could underperform due to new capacity coming on line and volatility in commodity prices. Overall, we like the emerging markets sector, as we believe that valuations remain attractive compared with developed markets. Profitability has improved significantly, a development we think represents the early stages of an important long-term trend.
PORTFOLIO MANAGERS: Philip Ehrmann and Peter Dalgliesh
Investing in mutual funds involves risk, including possible loss of principal.
There is no assurance that the investment objective of any fund will be achieved.
International investing involves additional risks, including currency fluctuations, differences in accounting standards, political instability and foreign regulations, all of which are magnified in emerging markets.
Morgan Stanley Capital International (MSCI) Emerging Markets IndexSM: An unmanaged, free float-adjusted, market-capitalization index that is designed to measure the performance of the stocks in emerging-country markets.
Lipper Analytical Services, Inc. is an industry research firm whose rankings are based on total return performance and do not reflect the effects of sales charges.
The Gartmore Variable Insurance Trust Funds are available only as sub-account investment options in certain variable insurance products. Accordingly, investors are unable to invest in shares of these funds outside of an insurance product. Performance information found herein reflects only the performance of these funds, and does not indicate the performance your sub-account may experience under your variable insurance contract. Performance returns assume reinvestment of all distributions. The investment return and principal value of an investment will fluctuate so that an investor’s shares, when redeemed, may be worth more or less than their original cost. Index performance is provided for comparison purposes only; the indexes shown are unmanaged and do not reflect any fees or expenses. Investors cannot invest directly in market indexes. To obtain performance information about the sub-account option under your insurance contract that invests in
1
Table of Contents
Gartmore GVIT Emerging Markets Fund (continued)
one of these funds, please contact your variable insurance carrier. PAST PERFORMANCE IS NO GUARANTEE OF FUTURE RESULTS.
Commentary provided by Gartmore Global Investments. All opinions and estimates included in this report constitute Gartmore Global Investments’ judgment as of the date of this report and are subject to change without notice.
Investors should carefully consider a fund’s investment objectives, risks, fees, charges and expenses before investing any money. To obtain this and other information on Gartmore Variable Insurance Trust, please contact your variable insurance contract provider or call 800-848-0920. Please read the Trust’s prospectus carefully before investing any money.
Gartmore Funds distributed by Gartmore Distribution Services, Inc., Member NASD. 1200 River Road, Suite 1000, Conshohocken, PA 19428.
2
Table of Contents
Fund Performance | Gartmore GVIT Emerging Markets Fund |
| Average | Annual Total Return1 |
(For Periods Ended June 30, 2005)
| Six months* | One year | Inception2 | ||||
| Class I3 | 6.57% | 30.31% | 5.32% | |||
| Class II4 | 6.46% | 30.05% | 5.07% | |||
| Class III4 | 6.58% | 30.33% | 5.33% | |||
| Class VI4 | 6.54% | 30.25% | 5.11% |
| * | Not Annualized. |
| 1 | Not subject to any sales charges. |
| 2 | Fund commenced operations on August 30, 2000. |
| 3 | The existing shares of the Fund were designated Class I shares as of May 1, 2001. |
| 4 | These returns until the creation of Class II shares (March 4, 2002), Class III shares (May 2, 2002) and through December 31, 2003 for Class VI shares are based on the performance of the Class I shares of the Fund. Excluding the effect of fee waivers or reimbursements, such prior performance is similar to what Class II, Class III and Class VI shares would have produced because all classes of shares invest in the same portfolio of securities. Class II and Class VI shares’ annual returns have been restated to reflect the additional fees applicable to Class II and Class VI shares and therefore are lower than those of Class I. For Class III and Class VI shares, these returns do not reflect the short-term trading fees applicable to such shares; if these fees were reflected, the annual returns for Class III and Class VI shares would have been lower. |
| Performance | of a $10,000 Investment |
Investment return and principal value will fluctuate, and when redeemed, shares may be worth more or less than original cost. Past performance is no guarantee of future results and does not reflect the deduction of taxes that a shareholder would pay on fund distributions or the redemption of fund shares. Investing in mutual funds involves market risk, including loss of principal. Performance returns assume the reinvestment of all distributions.

Comparative performance of $10,000 invested in Class I shares of the Gartmore GVIT Emerging Markets Fund, Morgan Stanley Capital International Emerging Markets Free Index (MSCI Emerging Markets (new))(a) and the Consumer Price Index (CPI)(b) since inception. Unlike the Fund, the returns for these unmanaged indexes do not reflect any fees, expenses, or sales charges. Investors cannot invest directly in market indexes.
| (a) | The MSCI Emerging Markets (new) is an unmanaged, free float-adjusted, market capitalization-weighted index that is designed to measure the performance of the stocks in emerging-country markets. |
| (b) | The CPI represents changes in prices of a basket of goods and services purchased for consumption by urban households. |
3
Table of Contents
Shareholder
Expense Example | Gartmore GVIT Emerging Markets Fund |
As a shareholder of the Fund, you incur two types of costs: (1) transaction costs, including sales charges (loads) paid on purchase payments and redemption fees; and (2) ongoing costs, including investment advisory fees, administration fees, distribution fees and other Fund expenses. The examples below are intended to help you understand your ongoing costs (in dollars) of investing in the Fund and to compare these costs with the ongoing costs of investing in other mutual funds. Per SEC requirements, the examples assume that you had a $1,000 investment in the Class at the beginning of the reporting period, January 1, 2005, and continued to hold your shares at the end of the reporting period, June 30, 2005.
Actual Expenses
For each Class of the Fund in the table below, the first line provides information about actual account values and actual expenses. You may use the information in this line, together with the amount you invested, to estimate the expenses that you paid over the period. Simply divide your account value by $1,000 (for example, an $8,600 account value divided by $1,000 = 8.6), then multiply the result by the number in the first line of each Class under the heading entitled “Expenses Paid During Period” to estimate the expenses you paid on your account during the period.
Hypothetical Example for Comparison Purposes
The second line of each Class in the table below provides information about hypothetical account values and hypothetical expenses based on the Class’ actual expense ratio and an assumed rate of return of 5% per year before expenses, which is not the Class’ actual return. The hypothetical account values and expenses may not be used to estimate the actual ending account balance or expenses you paid for the period. You may use this information to compare the ongoing costs of investing in the Class of the Fund and other funds. To do so, compare this 5% hypothetical example with the 5% hypothetical examples that appear in the shareholder reports of the other funds.
Please note that the expenses shown in the table are meant to highlight your ongoing costs only and do not reflect any transaction costs, such as sales charges (loads) or redemption fees. Therefore, the second line for each Class in the table is useful in comparing ongoing costs only, and will not help you determine the relative total costs of owning different funds. In addition, if these transaction costs were included, your costs would have been higher. The examples also assume all dividends and distributions have been reinvested.
| Beginning Account Value, January 1, 2005 | Ending Account Value, June 30, 2005 | Expenses Paid During Period* | Annualized Expense Ratio* | ||||||||||
| Emerging Markets Fund | |||||||||||||
Class I | Actual | $ | 1,000 | $ | 1,066 | $ | 7.02 | 1.37% | |||||
| Hypothetical1 | $ | 1,000 | $ | 1,018 | $ | 6.88 | 1.37% | ||||||
Class II | Actual | $ | 1,000 | $ | 1,065 | $ | 8.19 | 1.60% | |||||
| Hypothetical1 | $ | 1,000 | $ | 1,017 | $ | 8.03 | 1.60% | ||||||
Class III | Actual | $ | 1,000 | $ | 1,066 | $ | 6.97 | 1.36% | |||||
| Hypothetical1 | $ | 1,000 | $ | 1,018 | $ | 6.83 | 1.36% | ||||||
Class VI | Actual | $ | 1,000 | $ | 1,065 | $ | 7.63 | 1.49% | |||||
| Hypothetical1 | $ | 1,000 | $ | 1,018 | $ | 7.48 | 1.49% | ||||||
| * | Expenses are equal to the Fund’s annualized expense ratio multiplied by the average account value over the period multiplied by 181/365 (to reflect the one-half year period). The expense ratio presented represents a six month, annualized ratio in accordance with SEC guidelines. |
| 1 | Represents the hypothetical 5% return before expenses. |
4
Table of Contents
Portfolio Summary
(June 30, 2005) | Gartmore GVIT Emerging Markets Fund |
The SEC adopted a requirement that Funds present their portfolio holdings in a table, chart or graph format in their annual and semiannual reports to shareholders, whether or not a statement of investments is utilized. The following tables, which present portfolio holdings as a percentage of net assets, are provided in compliance with this requirement.
| Asset Allocation | ||
| Common Stocks | 91.1% | |
| Participation Notes | 5.9% | |
| Cash Equivalents | 2.9% | |
| Other Investments* | 1.8% | |
| Liabilities in excess of other assets** | -1.7% | |
| 100.0% | ||
| Top Holdings*** | ||
| Samsung Electronics GDR | 4.1% | |
| Au Optronics Corp. | 2.7% | |
| Denizbank AS | 2.3% | |
| Companhia Vale do Rio Doce, Class A | 2.0% | |
| Surgutneftgaz ADR | 1.9% | |
| China Telecom Corp. Ltd. | 1.9% | |
| Solomon Systech International Ltd. | 1.9% | |
| Taiwan Semiconductor Manufacturing Co., Ltd. | 1.8% | |
| Shin Kong Financial Holding Co., Ltd. | 1.8% | |
| Oil and Natural Gas Corp. Ltd., 10/31/05 | 1.7% | |
| Other Holdings | 77.9% | |
| 100.0% | ||
| Top Industries | ||
| Telecommunications | 9.7% | |
| Electronics | 9.1% | |
| Banking | 8.7% | |
| Oil & Gas | 8.6% | |
| Financial Services | 6.7% | |
| Retail | 6.3% | |
| Semiconductors | 5.9% | |
| Metals & Mining | 3.4% | |
| Diversified Operations | 2.9% | |
| Steel | 2.4% | |
| Other Industries | 36.3% | |
| 100.0% | ||
| * | Includes value of collateral received from securities lending. |
| ** | Includes value of collateral owed from securities lending. |
| *** | For purpose of listing top holdings, repurchase agreements are considered cash equivalents and are included as part of Other Holdings. |
5
Table of Contents
GARTMORE VARIABLE INSURANCE TRUST
GARTMORE GVIT EMERGING MARKETS FUND
Statement of Investments — June 30, 2005 (Unaudited)
| Shares or Principal Amount | Value | ||||
| COMMON STOCKS (91.1%) | |||||
| ARGENTINA (1.0%) | |||||
| Steel (1.0%) | |||||
| Tenaris SA | 15,700 | $ | 1,228,839 | ||
| BERMUDA (1.4%) | |||||
| Television (1.4%) | |||||
| Central European Media Enterprises Ltd. (b) | 37,600 | 1,819,088 | |||
| BRAZIL (12.2%) | |||||
| Banking (1.5%) | |||||
| Banco Itau Holding Financeira SA ADR | 21,400 | 1,979,500 | |||
| Brewery (1.1%) | |||||
| Ambev Cia Bebid (b) | 585,180 | 150,690 | |||
| Ambev Cia Bebid | 3,991,900 | 1,239,339 | |||
| 1,390,029 | |||||
| Electric Utility (0.9%) | |||||
| Companhia Energetica de Minas Gerais | 37,452,894 | 1,192,706 | |||
| Insurance (0.8%) | |||||
| Porto Seguro SA (b) | 115,300 | 1,039,185 | |||
| Metals & Mining (2.0%) | |||||
| Companhia Vale do Rio Doce, Class A | 103,700 | 2,637,006 | |||
| Oil & Gas (3.1%) | |||||
| Petroleo Brasileiro SA | 10,200 | 471,039 | |||
| Petroleo Brasileiro SA ADR | 28,000 | 1,459,640 | |||
| Petroleo Brasileiro SA ADR | 45,319 | 2,086,486 | |||
| 4,017,165 | |||||
| Paper Products (0.8%) | |||||
| Klabin SA | 585,867 | 1,013,324 | |||
| Retail (0.8%) | |||||
| Companhia Brasileira de Distribuicao Pao de Acucar ADR | 50,600 | 1,006,434 | |||
| Telecommunications (1.2%) | |||||
| Tele Norte Leste Participacoes SA ADR | 89,300 | 1,486,845 | |||
| 15,762,194 | |||||
| CHINA (6.3%) | |||||
| Coal Mining (0.7%) | |||||
| Yanzhou Coal Mining Co., Ltd. | 1,132,800 | 893,432 | |||
| Shares or Principal Amount | Value | ||||
| COMMON STOCKS (continued) | |||||
| CHINA (continued) | |||||
| Manufacturing (1.0%) | |||||
| Shanghai Electric Group Co., Ltd. (b) | 5,556,000 | $ | 1,258,470 | ||
| Oilfield Services & Equipment (0.9%) | |||||
| China Oilfield Services Ltd. | 3,156,000 | 1,162,130 | |||
| Semiconductors (1.8%) | |||||
| Solomon Systech International Ltd. | 6,716,000 | 2,368,098 | |||
| Telecommunications (1.9%) | |||||
| China Telecom Corp. Ltd. | 6,762,000 | 2,415,118 | |||
| 8,097,248 | |||||
| HUNGARY (1.0%) | |||||
| Oil & Gas (1.0%) | |||||
| MOL Magyar Olaj-es Gazipari | 15,097 | 1,266,870 | |||
| INDIA (0.5%) | |||||
| Financial Services (0.5%) | |||||
| ICICI Bank Ltd. ADR | 31,376 | 685,566 | |||
| INDONESIA (0.9%) | |||||
| Coal Mining (0.9%) | |||||
| PT Bumi Resources (b) | 13,781,900 | 1,170,486 | |||
| ISRAEL (1.9%) | |||||
| Electronic Measuring Instruction (0.9%) | |||||
| Orbotech Ltd. (b) | 54,700 | 1,175,503 | |||
| Software & Computer Services (1.0%) | |||||
| Retalix Ltd. (b) | 58,000 | 1,247,000 | |||
| 2,422,503 | |||||
| KOREA (17.2%) | |||||
| Automotive (1.2%) | |||||
| Hyundai Motor Co. | 27,600 | 1,520,477 | |||
| Construction (1.5%) | |||||
| Hyundai Development Co. | 35,400 | 821,637 | |||
| Kumho Industrial Co., Ltd. | 62,300 | 1,100,063 | |||
| 1,921,700 | |||||
| Diversified Operations (1.3%) | |||||
| GS Holdings Corp. | 72,700 | 1,708,233 | |||
| Electronic Components (1.7%) | |||||
| Hynix Semiconductor, Inc. (b) | 71,500 | 1,157,567 | |||
| Seoul Semiconductor Co., Ltd. | 34,918 | 1,042,498 | |||
| 2,200,065 | |||||
6
Table of Contents
GARTMORE VARIABLE INSURANCE TRUST
GARTMORE GVIT EMERGING MARKETS FUND
Statement of Investments — June 30, 2005 (Unaudited) (continued)
| Shares or Principal Amount | Value | ||||
| COMMON STOCKS (continued) | |||||
| KOREA (continued) | |||||
| Electronics (5.5%) | |||||
| KH Vatec Co., Ltd. | 39,780 | $ | 760,544 | ||
| Samsung Electronics | 2,100 | 994,598 | |||
| Samsung Electronics GDR | 32,000 | 5,200,001 | |||
| 6,955,143 | |||||
| Financial Services (3.1%) | |||||
| Korea Investment Holdings Co., Ltd. | 70,500 | 1,252,318 | |||
| LG Card Co., Ltd. (b) | 34,000 | 1,131,832 | |||
| Woori Finance Holdings Co., Ltd. | 168,630 | 1,663,561 | |||
| 4,047,711 | |||||
| Retail (2.3%) | |||||
| CJ Home Shopping | 17,029 | 1,267,827 | |||
| Hyundai Department Store Co., Ltd. | 38,100 | 1,744,146 | |||
| 3,011,973 | |||||
| Telecommunication Services (0.6%) | |||||
| KT Freetel Co., Ltd. | 35,600 | 820,285 | |||
| 22,185,587 | |||||
| MALAYSIA (3.6%) | |||||
| Foreign Banking (0.1%) | |||||
| Commerce Asset Holdings Berhad | 101,800 | 135,120 | |||
| Real Estate (1.0%) | |||||
| SP Setia Berhad | 1,157,100 | 1,242,523 | |||
| Telecommunications (1.1%) | |||||
| Telekom Malaysia Berhad | 589,300 | 1,547,939 | |||
| Transportation (0.8%) | |||||
| Malaysai & Services Holdings Berhad (b) | 1,093,000 | 1,005,201 | |||
| Transportation & Marine (0.6%) | |||||
| Malaysia International Shipping Corp. | 164,600 | 774,653 | |||
| 4,705,436 | |||||
| MEXICO (7.1%) | |||||
| Building Materials (1.2%) | |||||
| Cemex SA ADR | 35,700 | 1,514,394 | |||
| Diversified Operations (0.8%) | |||||
| Grupo Carso SA de CV | 530,600 | 1,027,414 | |||
| Shares or Principal Amount | Value | ||||
| COMMON STOCKS (continued) | |||||
| MEXICO (continued) | |||||
| Financial Services (1.3%) | |||||
| Grupo Financiero Banorte SA de CV | 266,200 | $ | 1,759,468 | ||
| Real Estate (0.8%) | |||||
| Urbi, Desarrolloas Urbanos SA de CV (b) | 178,200 | 981,245 | |||
| Retail (1.0%) | |||||
| Wal-Mart de Mexico SA de CV | 318,930 | 1,298,641 | |||
| Steel Manufacturing/Products (0.7%) | |||||
| Industrias CH SA (b) | 426,200 | 906,597 | |||
| Telecommunications (1.3%) | |||||
| America Movil SA de CV ADR | 27,217 | 1,622,405 | |||
| 9,110,164 | |||||
| NETHERLANDS (1.2%) | |||||
| Retail—Food Products (1.2%) | |||||
| Pyaterochka Holding NV GDR (b) | 104,296 | 1,501,862 | |||
| POLAND (0.2%) | |||||
| Real Estate Development (0.2%) | |||||
| Globe Trade Centre SA (b) | 7,900 | 267,324 | |||
| RUSSIA (5.4%) | |||||
| Automobile Manufacturers (0.7%) | |||||
| JSC Severstal-Avto (b) | 60,500 | 877,250 | |||
| Brewery (1.2%) | |||||
| Efes Breweries International GDR (b) | 45,600 | 1,543,560 | |||
| Metals (0.6%) | |||||
| Norilsk Nickel ADR | 12,000 | 732,000 | |||
| Oil & Gas (1.9%) | |||||
| Surgutneftgaz ADR | 69,200 | 2,586,004 | |||
| Telecommunications (1.0%) | |||||
| AO VimpelCom ADR (b) | 37,300 | 1,269,319 | |||
| 7,008,133 | |||||
| SOUTH AFRICA (7.7%) | |||||
| Banking (1.6%) | |||||
| ABSA Group Ltd. | 155,738 | 1,926,340 | |||
7
Table of Contents
GARTMORE VARIABLE INSURANCE TRUST
GARTMORE GVIT EMERGING MARKETS FUND
Statement of Investments — June 30, 2005 (Unaudited) (continued)
| Shares or Principal Amount | Value | ||||
| COMMON STOCKS (continued) | |||||
| SOUTH AFRICA (continued) | |||||
| Diversified Operations (0.8%) | |||||
| Barloworld Ltd. | 70,300 | $ | 1,001,133 | ||
| Foreign Banking (0.7%) | |||||
| Standard Bank Group Ltd. | 99,500 | 963,189 | |||
| Metals & Mining (1.4%) | |||||
| Anglo American PLC | 43,300 | 1,014,365 | |||
| Anglogold Ashanti Ltd. | 23,500 | 840,914 | |||
| 1,855,279 | |||||
| Oil & Gas (0.9%) | |||||
| Sasol Ltd. | 44,731 | 1,208,693 | |||
| Retail (1.0%) | |||||
| Lewis Group Ltd. | 225,757 | 1,236,896 | |||
| Telecommunications (1.3%) | |||||
| MTN Group Ltd. | 263,176 | 1,743,240 | |||
| 9,934,770 | |||||
| TAIWAN (17.0%) | |||||
| Banking (1.7%) | |||||
| E.Sun Financial Holding Co., Ltd. (b) | 1,444,000 | 1,153,826 | |||
| TA Chong Bank Ltd. (b) | 3,527,748 | 1,096,026 | |||
| 2,249,852 | |||||
| Chemicals (1.4%) | |||||
| Taiwan Fertilizer Co., Ltd. (b) | 1,363,000 | 1,796,372 | |||
| Computer (2.0%) | |||||
| Compal Electronics, Inc. | 1,472,000 | 1,457,552 | |||
| Foxconn Technology Co., Ltd. (b) | 307,000 | 1,156,363 | |||
| 2,613,915 | |||||
| Electronics (3.6%) | |||||
| Au Optronics Corp. | 2,074,000 | 3,452,528 | |||
| Ichia Technologies, Inc. (b) | 474 | 481 | |||
| MediaTek, Inc. | 135,000 | 1,166,186 | |||
| 4,619,195 | |||||
| Financial Services (1.8%) | |||||
| Shin Kong Financial Holding Co., Ltd. (b) | 2,259,000 | 2,270,873 | |||
| Photographic Products (0.9%) | |||||
| Largan Precision Co., Ltd. | 176,000 | 1,155,198 | |||
| Shares or Principal Amount | Value | ||||
| COMMON STOCKS (continued) | |||||
| TAIWAN (continued) | |||||
| Semiconductors (4.1%) | |||||
| Powerchip Semiconductor Corp. | 1,367,000 | $ | 953,069 | ||
| Taiwan Semiconductor Manufacturing Co., Ltd. | 1,359,405 | 2,367,580 | |||
| Taiwan Semiconductor Manufacturing Co., Ltd. ADR | 106,170 | 968,270 | |||
| United Microelectronics Corp. ADR (b) | 233,000 | 957,630 | |||
| 5,246,549 | |||||
| Steel (0.7%) | |||||
| China Steel Corp. (b) | 943,000 | 951,206 | |||
| Textiles (0.8%) | |||||
| Far Eastern Textile Co., Ltd. | 1,516,408 | 1,079,075 | |||
| 21,982,235 | |||||
| THAILAND (3.5%) | |||||
| Banking (1.4%) | |||||
| Kasikornbank Public Co., Ltd. | 1,309,800 | 1,798,883 | |||
| Chemicals (0.9%) | |||||
| Aromatics Public Co., Ltd. NVDR | 979,200 | 1,213,901 | |||
| Electric Utility (0.7%) | |||||
| Ratchaburi Electricity Generating Holding Public Co., Ltd. | 922,100 | 901,621 | |||
| Telecommunications (0.5%) | |||||
| Shin Corporation Public Co., Ltd. | 737,300 | 666,124 | |||
| 4,580,529 | |||||
| TURKEY (3.0%) | |||||
| Banking (2.3%) | |||||
| Denizbank AS (b) | 717,654 | 2,913,707 | |||
| Financial Investments (0.7%) | |||||
| Haci Omer Sabanci Holding AS | 234,640 | 898,553 | |||
| 3,812,260 | |||||
| Total Common Stocks | 117,541,094 | ||||
8
Table of Contents
GARTMORE VARIABLE INSURANCE TRUST
GARTMORE GVIT EMERGING MARKETS FUND
Statement of Investments — June 30, 2005 (Unaudited) (continued)
| Shares or Principal Amount | Value | |||||
| PARTICIPATION NOTES (5.9%) | ||||||
| INDIA (5.9%) | ||||||
| Banking (0.2%) | ||||||
| ICICI Bank Ltd., 03/30/07 | $ | 7,762 | $ | 76,068 | ||
| ICICI Bank Ltd., 03/30/07 | 19,016 | 186,356 | ||||
| 262,424 | ||||||
| Computer Service (1.0%) | ||||||
| Tata Consultancy Services Ltd. | 41,700 | 1,303,542 | ||||
| Engineering Services (1.2%) | ||||||
| Larsen & Toubro Ltd., 10/09/19 | 59,700 | 1,555,782 | ||||
| Oil & Gas (1.7%) | ||||||
| Oil and Natural Gas Corp. Ltd., 10/31/05 | 95,000 | 2,246,750 | ||||
| Telecommunication Services (0.8%) | ||||||
| Bharti Televentures Ltd. (b) | 187,600 | 1,048,684 | ||||
| Tobacco (1.0%) | ||||||
| ITC Ltd., 04/07/30 | 33,100 | 1,266,075 | ||||
| Total Participation Notes | 7,683,257 | |||||
| CASH EQUIVALENTS (2.9%) | ||||||
| Investments in repurchase agreements (collateralized by AA Corporate Bonds in a joint trading account at 3.49%, dated 06/30/05, due 07/01/05, repurchase price $3,772,744) | 3,772,378 | 3,772,378 | ||||
| Total Cash Equivalents | 3,772,378 | |||||
| Shares or Principal Amount | Value | ||||||
| SHORT-TERM SECURITIES HELD AS COLLATERAL FOR SECURITIES LENDING (1.8%) | |||||||
| Pool of short-term securities for Gartmore Variable Trust Funds — note 2 (Securities Lending) | $ | 2,342,692 | $ | 2,342,692 | |||
| Total Short-Term Securities Held as Collateral for Securities Lending | 2,342,692 | ||||||
| Total Investments (Cost $117,151,438) (a) — 101.7% | 131,339,421 | ||||||
| Liabilities in excess of other assets — (1.7%) | (2,182,893 | ) | |||||
| NET ASSETS — 100.0% | $ | 129,156,528 | |||||
| (a) | See notes to financial statements for unrealized appreciation (depreciation) of securities. |
| (b) | Denotes a non-income producing security. |
| ADR | American Depository Receipt |
| GDR | Global Depositary Receipt |
| Currency | Delivery Date | Contract Value | Market Value | Unrealized Appreciation (Depreciation) | |||||||||
| Short Contracts: | |||||||||||||
U.S Dollar | 07/05/05 | $ | (204,443 | ) | $ | (204,443 | ) | $ | 0 | ||||
U.S Dollar | 07/06/05 | (81,300 | ) | (81,300 | ) | 0 | |||||||
| Total Short Contracts | $ | (285,742 | ) | $ | (285,742 | ) | $ | 0 | |||||
| Currency | Delivery Date | Contract Value | Market Value | Unrealized Appreciation (Depreciation) | |||||||
| Long Contracts: | |||||||||||
Hong Kong Dollar | 07/05/05 | $ | 204,443 | $ | 204,526 | $ | 83 | ||||
South African Rand | 07/06/05 | 81,300 | 81,961 | 661 | |||||||
| Total Long Contracts | $ | 285,743 | $ | 286,487 | $ | 744 | |||||
See notes to financial statements.
9
Table of Contents
GARTMORE VARIABLE INSURANCE TRUST
GARTMORE GVIT EMERGING MARKETS FUND
Statement of Assets and Liabilities
June 30, 2005 (Unaudited)
Assets: | |||
Investments, at value (cost $113,379,060) | $ | 127,567,043 | |
Repurchase agreements, at cost and value | 3,772,378 | ||
Total Investments | 131,339,421 | ||
Foreign currencies, at value (cost $935,909) | 933,043 | ||
Interest and dividends receivable | 309,757 | ||
Receivable for capital shares issued | 1,787 | ||
Receivable for investments sold | 130,150 | ||
Unrealized appreciation on forward foreign currency contracts | 744 | ||
Reclaims receivable | 913 | ||
Prepaid expenses and other assets | 1,888 | ||
Total Assets | 132,717,703 | ||
Liabilities: | |||
Payable to adviser | 532 | ||
Payable to custodian | 97,612 | ||
Payable for investments purchased | 976,837 | ||
Payable for return of collateral received for securities on loan | 2,342,692 | ||
Accrued expenses and other payables: | |||
Investment advisory fees | 119,082 | ||
Fund administration and transfer agent fees | 980 | ||
Distribution fees | 5,032 | ||
Administrative servicing fees | 11,826 | ||
Other | 6,582 | ||
Total Liabilities | 3,561,175 | ||
Net Assets | $ | 129,156,528 | |
Represented by: | |||
Capital | $ | 108,394,703 | |
Accumulated net investment income (loss) | 223,762 | ||
Accumulated net realized gains (losses) from investment and foreign currency transactions | 6,345,834 | ||
Net unrealized appreciation (depreciation) on investments and translation of assets and liabilities denominated in foreign currencies | 14,192,229 | ||
Net Assets | $ | 129,156,528 | |
Net Assets: | |||
Class I Shares | $ | 22,888,075 | |
Class II Shares | 7,386,221 | ||
Class III Shares | 80,616,272 | ||
Class VI Shares | 18,265,960 | ||
Total | $ | 129,156,528 | |
Shares outstanding (unlimited number of shares authorized): | |||
Class I Shares | 2,019,686 | ||
Class II Shares | 654,378 | ||
Class III Shares | 7,117,274 | ||
Class VI Shares | 1,612,324 | ||
Total | 11,403,662 | ||
Net asset value and offering price per share:* | |||
Class I Shares | $ | 11.33 | |
Class II Shares | $ | 11.29 | |
Class III Shares | $ | 11.33 | |
Class VI Shares | $ | 11.33 |
| * | Not subject to a front-end sales charge. |
For the Six Months Ended June 30, 2005 (Unaudited)
Investment Income: | ||||
Interest income | $ | 62,513 | ||
Dividend income (net of foreign withholding tax of $102,311) | 1,539,836 | |||
Income from securities lending | 71,388 | |||
Total Income | 1,673,737 | |||
Expenses: | ||||
Investment advisory fees | 687,282 | |||
Fund administration and transfer agent fees | 45,086 | |||
Distribution fees Class II Shares | 9,647 | |||
Distribution fees Class VI Shares | 16,843 | |||
Administrative servicing fees Class I Shares | 17,244 | |||
Administrative servicing fees Class II Shares | 5,608 | |||
Administrative servicing fees Class III Shares | 54,535 | |||
Other** | 38,297 | |||
Total Expenses | 874,542 | |||
Net Investment Income (Loss) | 799,195 | |||
REALIZED/UNREALIZED GAINS (LOSSES) ON INVESTMENTS: | ||||
Net realized gains (losses) on investment transactions | 6,673,981 | |||
Net realized gains (losses) on foreign currency transactions | (197,721 | ) | ||
Net realized gains (losses) on investment and foreign currency transactions | 6,476,260 | |||
Net change in unrealized appreciation/depreciation on investments and translation of assets and liabilities denominated in foreign currencies | (683,624 | ) | ||
Net realized/unrealized gains (losses) on investments and foreign currencies | 5,792,636 | |||
CHANGE IN NET ASSETS RESULTING FROM OPERATIONS | $ | 6,591,831 | ||
| ** | Other expenses may include the following fees: audit, custody, insurance, legal, printing, trustee, and out-of-pocket expenses. |
See notes to financial statements.
10
Table of Contents
GARTMORE VARIABLE INSURANCE TRUST
GARTMORE GVIT EMERGING MARKETS FUND
Statement of Changes in Net Assets
| Six Months Ended June 30, 2005 | Year Ended December 31, 2004 | |||||||
| (Unaudited) | ||||||||
From Investment Activities: | ||||||||
Operations: | ||||||||
Net investment income (loss) | $ | 799,195 | $ | 936,624 | ||||
Net realized gains (losses) on investment and foreign currency transactions | 6,476,260 | 9,445,319 | ||||||
Net change in unrealized appreciation/depreciation on investments and translation of assets and liabilities denominated in foreign currencies | (683,624 | ) | 1,774,140 | |||||
Change in net assets resulting from operations | 6,591,831 | 12,156,083 | ||||||
Distributions to Class I shareholders from: | ||||||||
Net investment income | (109,777 | ) | (185,714 | ) | ||||
Net realized gains on investments | (314,979 | ) | (1,606,981 | ) | ||||
Distributions to Class II shareholders from: | ||||||||
Net investment income | (24,818 | ) | (65,733 | ) | ||||
Net realized gains on investments | (102,734 | ) | (661,796 | ) | ||||
Distributions to Class III shareholders from: | ||||||||
Net investment income | (367,254 | ) | (611,941 | ) | ||||
Net realized gains on investments | (1,111,396 | ) | (5,276,397 | ) | ||||
Distributions to Class VI shareholders from: | ||||||||
Net investment income | (73,584 | ) | (73,446 | )(a) | ||||
Net realized gain on investment | (251,276 | ) | (630,691 | )(a) | ||||
Change in net assets from shareholder distributions | (2,355,818 | ) | (9,112,699 | ) | ||||
Change in net assets from capital transactions | 20,757,392 | 30,915,102 | ||||||
Change in net assets | 24,993,405 | 33,958,486 | ||||||
Net Assets: | ||||||||
Beginning of period | 104,163,123 | 70,204,637 | ||||||
End of period | $ | 129,156,528 | $ | 104,163,123 | ||||
CAPITAL TRANSACTIONS: | ||||||||
Class I Shares | ||||||||
Proceeds from shares issued | $ | 12,619,085 | $ | 17,689,956 | ||||
Dividends reinvested | 424,753 | 1,792,695 | ||||||
Cost of shares redeemed | (10,821,469 | ) | (16,936,351 | ) | ||||
| 2,222,369 | 2,546,300 | |||||||
Class II Shares | ||||||||
Proceeds from shares issued | 38,897 | 11,140,398 | ||||||
Dividends reinvested | 127,551 | 727,528 | ||||||
Cost of shares redeemed | (1,314,198 | ) | (10,346,782 | ) | ||||
| (1,147,750 | ) | 1,521,144 | ||||||
Class III Shares | ||||||||
Proceeds from shares issued | 16,346,951 | 46,954,657 | ||||||
Dividends reinvested | 1,478,640 | 5,888,335 | ||||||
Cost of shares redeemed | (7,053,801 | ) | (34,383,311 | ) | ||||
| 10,771,790 | 18,459,681 | |||||||
Class VI Shares | ||||||||
Proceeds from shares issued | 9,609,614 | 9,280,798 | (a) | |||||
Dividends reinvested | 324,858 | 704,137 | (a) | |||||
Cost of shares redeemed | (1,023,489 | ) | (1,596,958 | )(a) | ||||
| 8,910,983 | 8,387,977 | |||||||
Change in net assets from capital transactions | $ | 20,757,392 | $ | 30,915,102 | ||||
11
Table of Contents
GARTMORE VARIABLE INSURANCE TRUST
GARTMORE GVIT EMERGING MARKETS FUND
Statement of Changes in Net Assets (continued)
| Six Months Ended June 30, 2005 | Year Ended December 31, 2004 | |||||
| (Unaudited) | ||||||
SHARE TRANSACTIONS: | ||||||
Class I Shares | ||||||
Issued | 1,106,204 | 1,694,553 | ||||
Reinvested | 37,502 | 167,436 | ||||
Redeemed | (996,517 | ) | (1,716,002 | ) | ||
| 147,189 | 145,987 | |||||
Class II Shares | ||||||
Issued | 3,303 | 1,053,978 | ||||
Reinvested | 11,291 | 68,201 | ||||
Redeemed | (118,416 | ) | (1,011,686 | ) | ||
| (103,822 | ) | 110,493 | ||||
Class III Shares | ||||||
Issued | 1,457,670 | 4,439,140 | ||||
Reinvested | 130,577 | 550,472 | ||||
Redeemed | (646,540 | ) | (3,581,855 | ) | ||
| 941,707 | 1,407,757 | |||||
Class VI Shares | ||||||
Issued | 858,111 | 920,316 | (a) | |||
Reinvested | 28,645 | 65,746 | (a) | |||
Redeemed | (92,877 | ) | (167,617 | )(a) | ||
| 793,879 | 818,445 | |||||
| (a) | For the period from April 28, 2004 (commencement of operations) through December 31, 2004. |
See notes to financial statements.
12
Table of Contents
GARTMORE VARIABLE INSURANCE TRUST
FINANCIAL HIGHLIGHTS
Selected Data for Each Share of Capital Outstanding
Gartmore GVIT Emerging Markets Fund
| Investment Activities | Distributions | Ratios/Supplemental Data | |||||||||||||||||||||||||||||||||||||||||||
| Net Asset Value, Beginning of Period | Net Investment Income (Loss) | Redemption Fees | Net Realized and Unrealized Gains (Losses) on Investments | Total from Investment Activities | Net Investment Income | Net Realized Gains | Total Distributions | Net Asset Value, End of Period | Total Return | Net Assets at End of Period (000s) | Ratio of Expenses to Average Net Assets | Ratio of Net Investment Income (Loss) to Average Net Assets | Ratio of Expenses (Prior to Reimbursements) to Average Net Assets(a) | Ratio of Net Investment Income (Loss) (Prior to Reimbursements) to Average Net Assets(a) | Portfolio Turnover(b) | ||||||||||||||||||||||||||||||
Class I Shares | |||||||||||||||||||||||||||||||||||||||||||||
Period Ended December 31, 2000(c) | $ | 10.00 | — | — | (2.48 | ) | (2.48 | ) | (0.01 | ) | — | (0.01 | ) | $ | 7.51 | (24.83% | )(g) | $ | 3,991 | 1.75% | (h) | (0.21% | )(h) | 4.09% | (h) | (2.55% | )(h) | 43.33% | |||||||||||||||||
Year Ended December 31, 2001(d) | $ | 7.51 | 0.06 | — | (0.45 | ) | (0.39 | ) | (0.04 | ) | — | (0.04 | ) | $ | 7.08 | (5.18% | ) | $ | 15,974 | 1.70% | 0.57% | 2.39% | (0.12% | ) | 140.18% | ||||||||||||||||||||
Year Ended December 31, 2002 | $ | 7.08 | 0.05 | 0.01 | (1.14 | ) | (1.08 | ) | (0.01 | ) | — | (0.01 | ) | $ | 5.99 | (15.23% | ) | $ | 10,005 | 1.43% | 0.63% | (i | ) | (i | ) | 219.84% | |||||||||||||||||||
Year Ended December 31, 2003 | $ | 5.99 | 0.09 | 0.01 | 3.80 | 3.90 | (0.05 | ) | — | (0.05 | ) | $ | 9.84 | 65.26% | $ | 16,993 | 1.39% | 1.17% | (i | ) | (i | ) | 133.49% | ||||||||||||||||||||||
Year Ended December 31, 2004 | $ | 9.84 | 0.13 | 0.01 | 1.89 | 2.03 | (0.11 | ) | (0.93 | ) | (1.04 | ) | $ | 10.83 | 20.74% | $ | 20,280 | 1.47% | 1.08% | (i | ) | (i | ) | 151.18% | |||||||||||||||||||||
Six Months Ended June 30, 2005 (Unaudited) | $ | 10.83 | 0.07 | 0.01 | 0.63 | 0.71 | (0.05 | ) | (0.16 | ) | (0.21 | ) | $ | 11.33 | 6.57% | (g) | $ | 22,888 | 1.37% | (h) | 1.33% | (h) | (i | ) | (i | ) | 64.72% | ||||||||||||||||||
Class II Shares | |||||||||||||||||||||||||||||||||||||||||||||
Period Ended December 31, 2002(e) | $ | 7.71 | 0.01 | 0.01 | (1.73 | ) | (1.71 | ) | (0.01 | ) | (0.01 | ) | $ | 5.99 | (22.23% | )(g) | $ | 454 | 1.71% | (h) | 0.44% | (h) | (i | ) | (i | ) | 219.84% | ||||||||||||||||||
Year Ended December 31, 2003 | $ | 5.99 | 0.04 | 0.01 | 3.81 | 3.86 | (0.03 | ) | — | (0.03 | ) | $ | 9.82 | 64.66% | $ | 6,360 | 1.66% | 0.35% | (i | ) | (i | ) | 133.49% | ||||||||||||||||||||||
Year Ended December 31, 2004 | $ | 9.82 | 0.11 | 0.01 | 1.87 | 1.99 | (0.09 | ) | (0.93 | ) | (1.02 | ) | $ | 10.79 | 20.44% | $ | 8,178 | 1.72% | 0.87% | (i | ) | (i | ) | 151.18% | |||||||||||||||||||||
Six Months Ended June 30, 2005 (Unaudited) | $ | 10.79 | 0.05 | 0.01 | 0.64 | 0.70 | (0.04 | ) | (0.16 | ) | (0.20 | ) | $ | 11.29 | 6.46% | (g) | $ | 7,386 | 1.60% | (h) | 0.90% | (h) | (i | ) | (i | ) | 64.72% | ||||||||||||||||||
Class III Shares | |||||||||||||||||||||||||||||||||||||||||||||
Period Ended December 31, 2002(f) | $ | 7.90 | 0.01 | 0.01 | (1.91 | ) | (1.89 | ) | (0.02 | ) | — | (0.02 | ) | $ | 5.99 | (23.99% | )(g) | $ | 11,435 | 1.39% | (h) | 0.61% | (h) | (i | ) | (i | ) | 219.84% | |||||||||||||||||
Year Ended December 31, 2003 | $ | 5.99 | 0.06 | 0.01 | 3.82 | 3.89 | (0.04 | ) | — | (0.04 | ) | $ | 9.84 | 65.22% | $ | 46,902 | 1.42% | 0.89% | (i | ) | (i | ) | 133.49% | ||||||||||||||||||||||
Year Ended December 31, 2004 | $ | 9.84 | 0.12 | 0.01 | 1.90 | 2.03 | (0.11 | ) | (0.93 | ) | (1.04 | ) | $ | 10.83 | 20.76% | $ | 66,844 | 1.48% | 1.08% | (i | ) | (i | ) | 151.18% | |||||||||||||||||||||
Six Months Ended June 30, 2005 (Unaudited) | $ | 10.83 | 0.06 | 0.01 | 0.64 | 0.71 | (0.05 | ) | (0.16 | ) | (0.21 | ) | $ | 11.33 | 6.58% | (g) | $ | 80,616 | 1.36% | (h) | 1.21% | (h) | (i | ) | (i | ) | 64.72% | ||||||||||||||||||
Class VI Shares | |||||||||||||||||||||||||||||||||||||||||||||
Period Ended December 31, 2004(j) | $ | 10.11 | 0.05 | 0.01 | 1.62 | 1.68 | (0.10 | ) | (0.86 | ) | (0.96 | ) | $ | 10.83 | 16.70% | (g) | $ | 8,862 | 1.68% | (h) | 0.97% | (h) | (i | ) | (i | ) | 151.18% | ||||||||||||||||||
Six Months Ended June 30, 2005 (Unaudited) | $ | 10.83 | 0.05 | 0.01 | 0.65 | 0.71 | (0.05 | ) | (0.16 | ) | (0.21 | ) | $ | 11.33 | 6.54% | (g) | $ | 18,266 | 1.49% | (h) | 1.15% | (h) | (i | ) | (i | ) | 64.72% | ||||||||||||||||||
| (a) | During the period certain fees were waived and/or reimbursed. If such waivers/reimbursements had not occurred, the ratios would have been as indicated. |
| (b) | Portfolio turnover is calculated on the basis of the Fund as whole without distinguishing among the classes of shares. |
| (c) | For the period from August 30, 2000 (commencement of operations) through December 31, 2000. |
| (d) | The existing shares of the Fund were designated Class I shares as of May 1, 2001. |
| (e) | For the period from March 4, 2002 (commencement of operations) through December 31, 2002. |
| (f) | For the period from May 2, 2002 (commencement of operations) through December 31, 2002. |
| (g) | Not annualized. |
| (h) | Annualized. |
| (i) | There were no fee reductions during the period. |
| (j) | For the period from April 28, 2004 (commencement of operations) December 31, 2004. |
See notes to financial statements.
13
Table of Contents
GARTMORE VARIABLE INSURANCE TRUST
NOTES TO FINANCIAL STATEMENTS (Unaudited)
June 30, 2005
1. Organization
Gartmore Variable Insurance Trust (“GVIT” or the “Trust”) is an open-end management investment company, organized under the laws of Delaware by an amended and restated Agreement and Declaration of Trust, dated October 28, 2004, as amended to date. The Trust, originally created under the laws of Massachusetts as a Massachusetts business trust pursuant to a Declaration of Trust dated, as of June 30, 1981, as subsequently amended, redomesticated as a Delaware Statutory Trust after the close of trading on April 29, 2005, and is registered under the Investment Company Act of 1940, as amended (the “1940 Act”). The redomestication is a change in statutory status and does not affect the operations of the Trust. As of June 30, 2005, the Trust had authorized an unlimited number of shares of beneficial interest (“shares”) without par value. The Trust currently offers shares to life insurance company separate accounts to fund the benefits under variable life insurance or annuity policies. To date, only the separate accounts of Nationwide Life Insurance Company and Nationwide Life and Annuity Insurance Company (collectively, “Nationwide”) have purchased shares of the Trust’s series. The Trust operates thirty-one (31) separate series, or mutual funds, each with its own investment objectives and strategies. This report contains the financial statements and financial highlights of the Gartmore GVIT Emerging Markets Fund (the “Fund”).
Under the Trust’s organizational documents, the Trust’s officers and trustees are indemnified against certain liabilities arising out of the performance of their duties to the Trust. In addition, the Trust has entered into Indemnification Agreements with the Trust’s trustees and certain officers covering similar liabilities. In addition, in the normal course of business, the Trust enters into contracts with its vendors and others that provide for general indemnifications. The Trust’s maximum exposure under these arrangements is unknown, as this would involve future claims that may be made against the Trust. Based on experience, however, the Trust expects that risk of loss to be remote.
2. Summary of Significant Accounting Policies
The following is a summary of significant accounting policies followed by the Fund in the preparation of its financial statements. The policies are in conformity with accounting principles generally accepted in the United States of America (“GAAP”). The preparation of financial statements requires management to make estimates and assumptions that affect the reported amounts of assets and liabilities, the disclosure of contingent assets and liabilities at the date of the financial statements and the reported amounts of income and expenses for the period. Actual results could differ from those estimates.
| (a) | Security Valuation |
Securities for which market quotations are readily available are valued at current market value as of “Valuation Time.” Valuation Time is as of the close of regular trading on the New York Stock Exchange (usually 4 p.m. Eastern time). Equity securities are valued at the last quoted sale price or, if there is no sale price, the last quoted bid price provided by an independent pricing service approved by the Trust’s Board of Trustees. Securities traded on NASDAQ are valued at the NASDAQ official closing price. Prices are taken from the primary market or exchange in which each security trades. Most securities listed on a foreign exchange are valued either at fair value (see description below) or at the last sale price at the close of the exchange on which the security is principally traded. Foreign securities, currencies, and other assets and liabilities denominated in foreign currencies are translated into U.S. dollars at the exchange rate of said currencies against the U.S. Dollar, as of Valuation Time, as provided by an independent pricing service approved by the Board of Trustees.
Securities for which market quotations are not readily available, or for which an independent pricing service does not provide a value or provides a value that does not represent fair value in the judgment of the Fund’s investment adviser or designee, are valued at fair value under procedures approved by the Trust’s Board of Trustees. The “Fair Value” of these securities is determined in good faith by taking into account relevant factors and surrounding circumstances. Methods utilized to obtain a “Fair Value” may include the following non-exclusive list of SEC-acceptable methods: (i) a multiple of earnings; (ii) the discount from market value of a similar, freely traded security; (iii) the yield-to-maturity for debt issues; or (iv) a consolidation of the methods. The Gartmore Fair Value Committee considers a non-exclusive list of factors to arrive at the appropriate method upon determining “Fair Value.” For example, fair value determinations are required for securities whose value is affected by a “significant” event that materially affects the value of a domestic or foreign security which occurs subsequent to the time of the close of the principal market on which such domestic or foreign security trades and before the
14
Table of Contents
GARTMORE VARIABLE INSURANCE TRUST
NOTES TO FINANCIAL STATEMENTS (Unaudited) (Continued)
June 30, 2005
Valuation Time (i.e., a “subsequent event”). Typically, this will involve events occurring after the close of a foreign market on which a security trades and before the next Valuation Time.
The Fund values foreign securities at fair value in the circumstances described below. Generally, trading in foreign securities markets is completed each day at various times prior to the Valuation Time. Due to the time differences between the closings of the relevant foreign securities exchanges and the Valuation Time for the Fund, the Fund will fair value its foreign investments when it is determined that the market quotations for the foreign investments either are not readily available or are unreliable and, therefore, do not represent fair value. When the fair value prices are utilized, these prices will attempt to reflect the impact of the U.S. financial markets’ perceptions and trading activities on the Fund’s foreign investments since the last closing prices of the foreign investments were calculated on their primary foreign securities markets or exchanges. For these purposes, the Board of Trustees of the Trust has determined that movements in relevant indices or other appropriate market indicators, after the close of the foreign securities exchanges, may demonstrate that market quotations are unreliable, and may trigger fair value pricing for certain securities. Consequently, fair valuation of portfolio securities may occur on a daily basis. In determining fair value prices, the Trust utilizes data furnished by an independent pricing service (and that data draws upon, among other information, the market values of foreign investments). The fair value prices of portfolio securities generally will be used when it is determined that the use of these prices will have a material impact on the net asset value of the Fund. When the Fund uses fair value pricing, the values assigned to the Fund’s foreign investments may not be the quoted or published prices of the investments on their primary markets or exchanges.
| (b) | Repurchase Agreements |
The Funds may enter into repurchase agreements with an entity which is a member of the Federal Reserve System or which is a “primary dealer” (as designated by the Federal Reserve Bank of New York) in U.S. Government obligations. The repurchase price generally equals the price paid by the Fund plus interest negotiated on the basis of current short-term rates, which may be more or less than the rate on the underlying portfolio securities. The seller under a repurchase agreement is required to maintain the value of the collateral held pursuant to the agreement at a market value equal to or greater than the repurchase price (including accrued interest). Collateral subject to repurchase agreements is held by the Fund’s custodian or another qualified sub-custodian or in the Federal Reserve/Treasury book-entry system. If the counterparty defaults and the fair value of the collateral declines, realization of the collateral by the Fund may be delayed or limited. The Fund may transfer uninvested cash balances into a pooled cash account. These balances are invested in one or more repurchase agreements, which are fully collateralized by AA-rated Corporate Bonds with the counterparties of CS First Boston and Nomura Securities.
| (c) | Foreign Currency Transactions |
The accounting records of the Fund are maintained in U.S. dollars. Foreign currency amounts are translated into U.S. dollars at the current rate of exchange to determine the value of investments, assets and liabilities. The Fund may enter into foreign currency contracts in connection with purchases or sales of securities denominated in a foreign currency. Purchases and sales of securities, and income and expenses, are translated at the prevailing rate of exchange on the respective date of these transactions. The Fund does not isolate that portion of the results of operations resulting from changes in foreign exchange rates on investments from fluctuations arising from changes in market prices of securities held. These fluctuations are included with the net realized and unrealized gain or loss from investments and foreign currencies.
| (d) | Risks Associated with Foreign Securities and Currencies |
Investments in securities of foreign issuers carry certain risks not ordinarily associated with investments in securities of U.S. issuers. These risks include future political and economic developments, and the possible imposition of exchange controls or other foreign governmental laws and restrictions. In addition, with respect to certain countries, there is the possibility of expropriation of assets, confiscatory taxation, political or social instability, or diplomatic developments, which could adversely affect investments in those countries.
Certain countries also may impose substantial restrictions on investments in their capital markets by foreign entities, including restrictions on investments in issuers of industries deemed sensitive to relevant national interests. These factors
15
Table of Contents
GARTMORE VARIABLE INSURANCE TRUST
NOTES TO FINANCIAL STATEMENTS (Unaudited) (Continued)
June 30, 2005
may limit the investment opportunities available and result in a lack of liquidity and high price volatility with respect to securities of issuers from developing countries.
| (e) | Forward Foreign Currency Contracts |
The Fund may enter into forward foreign currency contracts in connection with planned purchases or sales of securities or to hedge the U.S. dollar value of portfolio securities denominated in a particular currency. The Fund could be exposed to risks if the counterparties to the contracts are unable to meet the terms of their contracts and from unanticipated movements in the value of a foreign currency relative to the U.S. dollar. Forward foreign currency contracts are valued at the current cost of covering these contracts, as provided by an independent pricing service approved by the Board of Trustees. The forward foreign currency contracts are adjusted by the daily exchange rate of the underlying currency and any gains or losses are recorded for financial statement purposes as unrealized gains or losses until the contract settlement date.
| (f) | Futures Contracts |
The Fund may invest in financial futures contracts (“futures contracts”) for the purpose of hedging its existing portfolio securities or securities that the Fund intends to purchase against fluctuations in value caused by changes in prevailing market interest rates or prices. Futures contracts may also be entered into for non-hedging purposes.
Upon entering into a futures contract, the Fund is required to pledge to the broker an amount of cash and/or other assets equal to a certain percentage of the contract amount (initial margin deposit). Subsequent payments, known as “variation margin,” are made each day, depending on the daily fluctuations in the fair value/market value of the underlying assets. A gain or loss equal to the daily variation margin is recognized on a daily basis. Futures contracts are valued daily at their last quoted sale price.
A “sale” of a futures contract means a contractual obligation to deliver the securities or foreign currency called for by the contract at a fixed price at a specified time in the future. A “purchase” of a futures contract means a contractual obligation to acquire the securities or foreign currency at a fixed price at a specified time in the future.
Should market conditions change unexpectedly, the Fund may not achieve the anticipated benefits of the futures contracts and may realize a loss. The use of futures transactions for hedging purposes involves the risk of imperfect correlation in movements in the price of futures contracts, interest rates, and the value of the underlying hedged assets.
| (g) | Written Options Contracts |
The Fund may write options contracts. A written option obligates the Fund to deliver (written call) or to receive (written put) a specified quantity of an underlying asset at the contract amount upon exercise by the holder of the option. The value of the option contract is recorded as a liability and unrealized gain or loss is measured by the difference between the current value and the premium received. Options traded on an exchange are valued at the last quoted sale price, or in the absence of a sale, the bid price provided by an independent pricing service approved by the Board of Trustees. Non-exchange traded options are valued using dealer supplied quotes.
| (h) | Security Transactions and Investment Income |
Security transactions are accounted for on the date the security is purchased or sold (“trade date”). Securities gains and losses are calculated on the identified cost basis. Interest income is recognized on the accrual basis and includes, where applicable, the amortization or accretion of premium or discount. Dividend income is recorded on the ex-dividend date.
| (i) | Securities Lending |
To generate additional income, the Fund may lend up to 33 1/3% of the Fund’s total assets pursuant to agreements, requiring that the borrower deliver cash or securities as collateral with respect to each new loan of U.S. securities, equal to at least 102% of the value of the portfolio securities loaned, and with respect to each new loan of non-U.S. securities, collateral of at least 105% of the value of the portfolio securities loaned, and thereafter requiring the borrower to mark to market the
16
Table of Contents
GARTMORE VARIABLE INSURANCE TRUST
NOTES TO FINANCIAL STATEMENTS (Unaudited) (Continued)
June 30, 2005
collateral on a daily basis and requiring the borrower to make up any shortfall of collateral. The Fund receives payments from borrowers equivalent to the dividends and interest that would have been earned on securities lent while simultaneously seeking to earn income on the investment of cash collateral. Collateral is marked to market daily to provide a level of collateral at least equal to the market value of securities loaned. There may be risks of delay in recovery of the securities should the borrower of the securities fail financially. Loans will be made, however, only to borrowers deemed by the Fund’s investment adviser to be of good standing and creditworthy under guidelines established by the Board of Trustees and when, in the judgment of the adviser, the consideration which can be earned currently from these securities loans justifies the attendant risks. Loans are subject to termination by the Fund or the borrower at any time, and, therefore, are not considered to be illiquid investments. JPMorgan Chase Bank serves as custodian for the securities lending program of the Fund. JPMorgan Chase Bank receives a custody fee based on the value of collateral received from borrowers.
The cash collateral received by the Fund was pooled and, at June 30, 2005, was invested in the following:
Security Type | Security Name | Market Value | Maturity Rate | Maturity Date | ||||||
| Master Note — Floating | Merrill Lynch Mortgage Capital | $ | 2,000,000 | 3.54 | % | 07/01/05 | ||||
| Repurchase Agreements | Nomura Securities | 342,692 | 3.48 | % | 07/01/05 | |||||
As of June 30, 2005, the Fund had securities with the following market values on loan:
Market Value of | Market Value of Collateral | ||
$2,008,782 | $ | 2,342,692 | |
| (j) | Distributions to Shareholders |
The Fund’s dividends from net investment income, if any, are declared and paid quarterly. The Fund’s distributable net realized capital gains, if any, are declared and distributed at least annually.
Dividends and distributions to shareholders are determined in accordance with federal income tax regulations, which may differ from GAAP. These “book/tax” differences are considered either permanent or temporary in nature. In accordance with the American Institute of Certified Public Accountants (“AICPA”) Statement of Position 93-2, permanent differences (i.e., reclassification of market discounts, gain/loss, paydowns, and distributions) are reclassified within the capital accounts based on their nature for federal income tax purposes; temporary differences do not require reclassification. These reclassifications have no effect upon the net asset value of the Fund. To the extent distributions exceed current and accumulated earnings and profits for federal income tax purposes, these distributions are reported as distributions of paid-in-capital.
| (k) | Federal Income Taxes |
It is the policy of the Fund to qualify or continue to qualify as a “regulated investment company” by complying with the provisions available to certain investment companies, as defined in applicable sections of the U.S. Internal Revenue Code, and to make distributions of net investment income and net realized capital gains sufficient to relieve the Fund from all, or substantially all, federal income taxes.
As of June 30, 2005, the tax cost of securities and the breakdown of unrealized appreciation (depreciation) for the Fund is as follows:
Tax Cost of | Unrealized Appreciation | Unrealized Depreciation | Net Unrealized Appreciation (Depreciation) | |||
$286,714 | $16,051,398 | $(2,150,129) | $13,901,269 |
| (l) | Allocation of Expenses, Income, and Gains and Losses |
Expenses directly attributable to the Fund are charged to the Fund. Expenses not directly attributable to the Fund are allocated proportionately among various or all funds within the Trust. The method used by the Fund for allocating income,
17
Table of Contents
GARTMORE VARIABLE INSURANCE TRUST
NOTES TO FINANCIAL STATEMENTS (Unaudited) (Continued)
June 30, 2005
fund level expenses, and realized and unrealized gains or losses is based on the fair value of shares outstanding relative to net assets. Under this method, each class of shares participates based on the total net asset value of that class’s shares in proportion to the total net assets of the Fund. Expenses specific to a class (such as rule 12b-1 and administrative services fees) are charged to that class.
3. Transactions with Affiliates
Under the terms of the Trust’s Investment Advisory Agreement, Gartmore Global Asset Management Trust (“GGAMT”) manages the investment of the assets and supervises the daily business affairs of the Fund. GGAMT is a wholly-owned subsidiary of Nationwide Corporation. All of the common stock of Nationwide Corporation is held by Nationwide Mutual Insurance Company (95.2%) and Nationwide Mutual Fire Insurance Company (4.8%), each of which is a mutual company owned by its policyholders. In addition, GGAMT provides investment management evaluation services in initially selecting and monitoring, on an ongoing basis, the performance of the subadviser, for the Fund that GGAMT advises. Gartmore Global Partners (the “subadviser”), an affiliate of GGAMT, manages all of the Fund’s investments and has the responsibility for making all investment decisions for the Fund.
Under the terms of the Investment Advisory Agreement, the Fund pays the Fund’s adviser an investment advisory fee based on the Fund’s average daily net assets. From such fees, pursuant to the subadvisory agreements, the adviser pays fees to the subadviser. Additional information regarding investment advisory fees and subadvisory fees for GGAMT and the subadviser is as follows for the six months ended June 30, 2005:
| Fee Schedule | Total Fees | Fees Retained | Paid to Sub-adviser | |||
Up to $500 million | 1.15% | 0.575% | 0.575% | |||
Next $1.5 billion | 1.10% | 0.525% | 0.575% | |||
Next $2 billion or more | 1.05% | 0.475% | 0.575% |
GGAMT and the Fund have entered into a written contract (“Expense Limitation Agreement”) that limits operating expenses (excluding any taxes, interest, brokerage fees, extraordinary expenses, short sale dividend expenses, Rule 12b-1 fees, and administrative service fees) from exceeding 1.40% for all classes until at least May 1, 2006.
GGAMT may request and receive reimbursement from the Fund of the advisory fees waived and other expenses reimbursed by GGAMT, respectively, pursuant to the Expense Limitation Agreement at a later date not to exceed three years from the fiscal year in which the corresponding reimbursement to the Fund was made, depending on the Fund (as described below), if the Fund has reached a sufficient asset size to permit reimbursement to be made without causing the total annual operating expense ratio of the Fund to exceed the limits set forth above. No reimbursement will be made unless: (i) the Fund’s assets exceed $100 million; (ii) the total annual expense ratio of the Class making such reimbursement is less than the limit set forth above; and (iii) the payment of such reimbursement is approved by the Board of Trustees on a quarterly basis. Except as provided for in the Expense Limitation Agreements, reimbursement of amounts previously waived or assumed by GGAMT is not permitted.
As of the six months ended June 30, 2005, there were no cumulative potential reimbursements for all classes of the Fund, based on reimbursements which expires within three years from the fiscal year in which the corresponding reimbursement to the Fund was made for expenses reimbursed by GGAMT.
Under the terms of a Fund Administration and Transfer Agency Agreement, Gartmore SA Capital Trust (“GSA”) provides the Fund with various administrative and accounting services, and Gartmore Investors Services, Inc. (“GISI”), an indirect subsidiary of GSA, serves as Transfer and Dividend Disbursing Agent for the Fund. The fees for the services provided under this Agreement are calculated based on the Trust’s average daily net assets according to the fee schedule below. The fees are then allocated proportionately among all funds within the Trust in relation to the average daily net assets of each fund and are paid to GSA. GSA pays GISI from these fees for its services.
18
Table of Contents
GARTMORE VARIABLE INSURANCE TRUST
NOTES TO FINANCIAL STATEMENTS (Unaudited) (Continued)
June 30, 2005
| Combined Fee Schedule* | ||
Up to $1 billion | 0.13% | |
$1 billion and more up to $3 billion | 0.08% | |
$3 billion and more up to $8 billion | 0.05% | |
$8 billion and more up to $10 billion | 0.04% | |
$10 billion and more up to $12 billion | 0.02% | |
$12 billion or more | 0.01% | |
| * | The assets of the Gartmore GVIT Investor Destinations Aggressive Fund, the Gartmore GVIT Investor Destinations Moderately Aggressive Fund, the Gartmore GVIT Investor Destinations Moderate Fund, the Gartmore GVIT Investor Destinations Moderately Conservative Fund, and the Gartmore GVIT Investor Destinations Conservative Fund (collectively, the “Investor Destinations Funds”) are excluded from the Trust asset level amount in order to calculate this asset-based fee. The Investor Destinations Funds do not pay any part of this fee. |
Effective January 1, 2005, the fee for the fund administration and transfer agency services increased as set forth below. The fees are calculated based on the Trust’s average daily net assets according to the fee schedule below. The fees are then allocated proportionately among all funds within the Trust in relation to the average daily net assets of each fund and are paid to GSA.
| Combined Fee Schedule* | ||
Up to $1 billion | 0.15% | |
$1 billion and more up to $3 billion | 0.10% | |
$3 billion and more up to $8 billion | 0.05% | |
$8 billion and more up to $10 billion | 0.04% | |
$10 billion and more up to $12 billion | 0.02% | |
$12 billion or more | 0.01% | |
| * | The assets of each of the Investor Destinations Funds are excluded from the Trust asset level amount in order to calculate this asset-based fee. The Investor Destinations Funds do not pay any part of this fee. |
GSA and GISI have entered into agreements with BISYS Fund Services Ohio, Inc. (“BISYS”), pursuant to which BISYS provides sub-administration and sub-transfer agency services, respectively, to the Fund.
Under the terms of a Distribution Plan under Rule 12b-1 of the 1940 Act, Gartmore Distribution Services, Inc. (“GDSI”), the Fund’s Distributor, is compensated by the Fund for expenses associated with the distribution of the Class II and Class VI shares of the Fund. These fees are based on average daily net assets of Class II and Class VI shares of the Fund at an annual rate not to exceed 0.25%.
Under the terms of an Administrative Services Plan, the Fund may pay fees to servicing organizations, such as broker-dealers, including Nationwide Financial Services, and financial institutions, which agree to provide administrative support services to the shareholders of certain classes. These services include, but are not limited, to the following: establishing and maintaining shareholder accounts; processing purchase and redemption transactions; arranging bank wires; performing shareholder sub-accounting; answering inquires regarding the Fund; and other such services. These fees are based on an annual rate of up to 0.25% of the average daily net assets of each class of shares of the Fund.
4. Short-Term Trading Fees
The Fund reserves the right to assess a short-term trading fee on certain transactions out of Class III and Class VI shares that a separate account makes on behalf of a variable insurance contract owner (the “contract owner”). A separate account that redeems Class III and Class VI shares on behalf of a contract owner may be subject to a 1.00% short-term trading fee if the separate account held the Class III and Class VI shares on behalf of the contract owner for 60 days or less, unless an exception applies as disclosed in the prospectus. The short-term trading fee is paid directly to the Fund and is designed to offset the cost to the Fund of excess brokerage commissions and other costs associated with fluctuations in fund asset levels
19
Table of Contents
GARTMORE VARIABLE INSURANCE TRUST
NOTES TO FINANCIAL STATEMENTS (Unaudited) (Continued)
June 30, 2005
and cash flow caused by short-term trading. For purposes of determining whether the short-term trading fee applies, the Class III and Class VI shares that were held on behalf of the contract owner the longest will be treated as being redeemed first.
For the six months ended June 30, 2005, the Fund had no contributions to capital due to collection of redemption fees.
5. Investment Transactions
For the six months ended June 30, 2005, (excluding short-term securities) the Fund had purchases of $95,441,353 and sales of $74,042,302.
6. Portfolio Investment Risks
Credit and Market Risk. The Fund invests in emerging market instruments that are subject to certain additional credit and market risks. The yields of emerging market debt obligations reflect, among other things, perceived credit risk. The Fund’s investment in securities rated below investment grade typically involve risks not associated with higher rated securities including, among others, greater risk of not receiving timely and/or ultimate payment of interest and principal, greater market price volatility, and less liquid secondary market trading. The consequences of political, social, economic, or diplomatic changes may have disruptive effects on the market prices of emerging markets investments held by the Fund.
7. Bank Loans
The Trust has a credit agreement of $100,000,000. Borrowings under this arrangement bear interest at the Federal Funds rate plus 0.50%. The interest costs are included in custodian fees in the Statement of Operations. No compensation balances were required under the terms of the line of credit. There were no borrowings outstanding as of June 30, 2005.
8. Shareholder Meeting
A separate shareholders meeting was held on Tuesday, December 23, 2004, for the shareholders of the Trust’s predecessor pursuant to a Proxy Statement On Schedule 14A, dated October 29, 2004, and mailed to the shareholders of the Trust’s predecessor on or around November 5, 2004.
Two Proposals: The purpose of the December 23, 2004 meeting was to allow the shareholders of the Trust’s predecessor to vote on:
| i. | Proposal One: The election of the Trust’s Board of Trustees; and |
| ii. | Proposal Two: The approval of an “Agreement and Plan of Reorganization” that provided for the reorganization of the Trust from a Massachusetts business trust into a Delaware statutory trust. |
Proposal One: As set forth in the October 29, 2004 Proxy Statement, the nominees for election as Trustees of the Trust’s predecessor were: Charles E. Allen, Michael J. Baresich, Paula H.J. Cholmondeley, C. Brent DeVore, Phyllis Kay Dryden, Robert M. Duncan, Barbara L. Hennigar, Paul J. Hondros, Barbara I Jacobs, Thomas J. Kerr IV, Douglas F. Kridler, Michael D. McCarthy, Arden L. Shisler, and David C. Wetmore.
Proposal Two: As specifically set forth in the October 29, 2004 Proxy Statement, the Reorganization proposal requested the shareholders of the Trust’s predecessor to approve the proposed “Agreement and Plan of Reorganization” of the Trust’s predecessor (on behalf of each of the its funds) into a new Delaware-domiciled Trust, whereby the Funds of the new Delaware Trust would acquire all of the assets of the corresponding funds of the Trust’s predecessor subject to the liabilities, expenses, costs, charges, and reserves of the corresponding funds of the Trust’s predecessor (contingent or otherwise), in exchange for shares of the acquiring Funds to be distributed pro rata by the Trust to the holders of the shares of the funds of the Trust’s predecessor, in a complete liquidation of the Trust’s predecessor.
20
Table of Contents
GARTMORE VARIABLE INSURANCE TRUST
NOTES TO FINANCIAL STATEMENTS (Unaudited) (Continued)
June 30, 2005
Voting Results:
The shareholders of the Trust’s predecessor voted to approve both Proposal One and Proposal Two, as follows:
Proposal 1: Election of a Board of Trustees of Gartmore Variable Insurance Trust
Charles E. Allen: | ||
FOR | 2,797,230,318.955 shares (96.078%) | |
WITHHOLD | 114,195,693.660 shares (3.922%) | |
TOTAL | 2,912,726,012.615 shares (100.000%) | |
Michael J. Baresich: | ||
FOR | 2,796,135,979.559 shares (96.040%) | |
WITHHOLD | 115,290,033.056 shares (3.960%) | |
TOTAL | 2,912,726,012.615 shares (100.000%) | |
Paula H.J. Cholmondeley: | ||
FOR | 2,795,095,945.396 shares (96.004%) | |
WITHHOLD | 116,330,067.219 shares (3.996%) | |
TOTAL | 2,912,726,012.615 shares (100.000%) | |
C. Brent DeVore: | ||
FOR | 2,797,207,046.916 shares (96.077%) | |
WITHHOLD | 114,218,965.699 shares (3.923%) | |
TOTAL | 2,912,726,012.615 shares (100.000%) | |
Phyllis Kay Dryden: | ||
FOR | 2,795,587,023.994 shares (96.021%) | |
WITHHOLD | 115,838,988.621 shares (3.979%) | |
TOTAL | 2,912,726,012.615 shares (100.000%) | |
Robert M. Duncan: | ||
FOR | 2,790,191,720.503 shares (95.836%) | |
WITHHOLD | 121,234,292.112 shares (4.164%) | |
TOTAL | 2,912,726,012.615 shares (100.000%) | |
Barbara L. Hennigar: | ||
FOR | 2,792,939,848.858 shares (95.937%) | |
WITHHOLD | 118,486,163.757 shares (4.070%) | |
TOTAL | 2,912,726,012.615 shares (100.000%) | |
Paul J. Hondros: | ||
FOR | 2,797,557,404.448 shares (96.089%) | |
WITHHOLD | 113,868,608.167 shares (3.911%) | |
TOTAL | 2,912,726,012.615 shares (100.000%) | |
21
Table of Contents
GARTMORE VARIABLE INSURANCE TRUST
NOTES TO FINANCIAL STATEMENTS (Unaudited) (Continued)
June 30, 2005
Barbara I. Jacobs: | ||
FOR | 2,796,306,126.654 shares (96.046%) | |
WITHHOLD | 115,119,885.961 shares (3.954%) | |
TOTAL | 2,912,726,012.615 shares (100.000%) | |
Thomas J. Kerr IV: | ||
FOR | 2,789,755,720.087 shares (95.821%) | |
WITHHOLD | 121,670,292.528 shares (4.179%) | |
TOTAL | 2,912,726,012.615 shares (100.000%) | |
Douglas F. Kridler: | ||
FOR | 2,798,065,774.375 shares (96.106%) | |
WITHHOLD | 113,360,238.240 shares (3.894%) | |
TOTAL | 2,912,726,012.615 shares (100.000%) | |
Michael D. McCarthy: | ||
FOR | 2,797,452,613.694 shares (96.085%) | |
WITHHOLD | 113,973,395.921 shares (3.915%) | |
TOTAL | 2,912,726,012.615 shares (100.000%) | |
Arden L. Shisler: | ||
FOR | 2,796,738,454.730 shares (96.061%) | |
WITHHOLD | 114,687,557.885 shares (3.939%) | |
TOTAL | 2,912,726,012.615 shares (100.000%) | |
David C. Wetmore: | ||
FOR | 2,794,784,752.247 shares (95.994%) | |
WITHHOLD | 116,641,260.368 shares (4.006%) | |
TOTAL | 2,912,726,012.615 shares (100.000%) | |
Proposal 2: Approval of the Agreement and Plan of Reorganization of Gartmore Variable Insurance Trust
FOR | 2,561,003,822.546 shares (87.964%) | |
AGAINST | 103,593,261.010 shares (3.558%) | |
ABSTAIN | 246,828,929.059 shares (8.478%) | |
TOTAL | 2,912,726,012.615 shares (100.000%) | |
22
Table of Contents
GARTMORE VARIABLE INSURANCE TRUST
NOTES TO FINANCIAL STATEMENTS (Unaudited) (Continued)
June 30, 2005
9. Subsequent Event
On July 29, 2005, the Trust filed a Post-Effective Amendment to its Registration Statement on Form N-1A to change the structure of the Fund’s investment advisory fee and sub-advisory fee from the current asset-based fee structure to a performance based fee structure on or about October 1, 2005. On that date, or, if later, upon SEC effectiveness, the Fund will immediately lower its base advisory fee by 0.10% at each breakpoint. Beginning one year after implementation of the new performance fee structure, the Fund’s base advisory fee may be adjusted proportionately upward or downward if the Fund outperforms or underperforms its stated benchmark by the following amounts:
| Out or Underperformance | Change in Fees | |
+/- 1 percentage point | +/- 0.02% | |
+/- 2 percentage points | +/- 0.04% | |
+/- 3 percentage points | +/- 0.06% | |
+/- 4 percentage points | +/- 0.08% | |
+/- 5 percentage points | +/- 0.10% |
The prospectus describing the above Fund will be supplemented upon the effectiveness of the Post-Effective Amendment to the Trust’s Registration Statement. Please refer to the prospectus, as supplemented by a notice you will receive after the effectiveness of the Post-Effective Amendment, for further information about this new fee structure.
23
Table of Contents
GARTMORE VARIABLE INSURANCE TRUST
Management Information (Unaudited)
June 30, 2005
Trustees who are not Interested Persons (as defined in the 1940 Act) and Officers of the Funds June 30, 2005
| Name, Address and Date of Birth | Position(s) Held with the Trust and Length of Time Served1 | Principal Occupation(s) During Past 5 Years | Number of Portfolios in the Gartmore Fund Complex Overseen by Trustee | Other Directorships Held by Trustee or Nominee2 | ||||
Charles E. Allen
c/o Gartmore Global Investments, Inc. 1200 River Road, Suite 1000 Conshohocken, PA 19428
1948 | Trustee since July 2000 | Mr. Allen is Chairman, Chief Executive Officer and President of the Graimark Realty Advisors, Inc. (real estate development, investment and asset management). | 84 | None | ||||
Paula H.J. Cholmondeley
c/o Gartmore Global Investments, Inc. 1200 River Road, Suite 1000 Conshohocken, PA 19428
1940 | Trustee since July 2000 | Ms. Cholmondeley has been the Chairman and Chief Executive Officer of the Sorrel Group, a management consulting company, since January 2004. From March 2000 through December 2003, Ms. Cholmondeley was Vice President and General Manager of Sappi Fine Paper North America. Prior thereto, Ms. Cholmondeley was Vice President and General Manager of Residential Insulation of Owens Corning. | 84 | Director of Dentsply International, Inc., Ultralife Batteries, Inc., Terex Corporation, Minerals Technology, Inc. and Albany International Corp. | ||||
C. Brent DeVore
c/o Gartmore Global Investments, Inc. 1200 River Road, Suite 1000 Conshohocken, PA 19428
1940 | Trustee since 1990 | Dr. DeVore is President of Otterbein College. | 84 | None | ||||
Phyllis K. Dryden
c/o Gartmore Global Investments, Inc. 1200 River Road, Suite 1000 Conshohocken, PA 19428
1947 | Trustee since December 2004 | Ms. Dryden was a former Managing Partner of marchFIRST, a global management consulting firm prior to 2002. | 84 | None |
24
Table of Contents
GARTMORE VARIABLE INSURANCE TRUST
Management Information (Unaudited)
June 30, 2005
| Name, Address and Date of Birth | Position(s) Held with the Trust and Length of Time Served1 | Principal Occupation(s) During Past 5 Years | Number of Portfolios in the Gartmore Fund Complex Overseen by Trustee | Other Directorships Held by Trustee or Nominee2 | ||||
Barbara L. Hennigar*
c/o Gartmore Global Investments, Inc. 1200 River Road, Suite 1000 Conshohocken, PA 19428
1935 | Trustee since July 2000 | Retired since June 2000. Prior thereto, Ms. Hennigar was the Chairman or President and Chief Executive Officer of OppenheimerFunds Services and a member of the Executive Committee of OppenheimerFunds. | 84 | None | ||||
Barbara I. Jacobs
c/o Gartmore Global Investments, Inc. 1200 River Road, Suite 1000 Conshohocken, PA 19428
1950 | Trustee since December 2004 | Ms. Jacobs has served as Chairman of the Board of Directors of KICAP Network Fund, a European (United Kingdom) hedge fund, since December 2000. Prior to 2004, Ms. Jacobs was also a Managing Director and European Portfolio Manager with CREF Investments (Teachers Insurance Annuity Association — College Retirement Equity Fund). | 84 | None | ||||
Douglas F. Kridler
c/o Gartmore Global Investments, Inc. 1200 River Road, Suite 1000 Conshohocken, PA 19428
1955 | Trustee since September 1997 | Mr. Kridler has served as the President and Chief Executive Officer of the Columbus Foundation (a Columbus, OH-based foundation which manages over 1,300 individual endowment funds) since February 2002. Mr. Kridler was the President of the Columbus Association for the Performing Arts prior thereto and Chairman of the Greater Columbus Convention and Visitors Bureau during 2000 and 2001. | 84 | None | ||||
Michael D. McCarthy
c/o Gartmore Global Investments, Inc. 1200 River Road, Suite 1000 Conshohocken, PA 19428
1947 | Trustee since December 2004 | Mr. McCarthy serves as: the Founder and Chairman of The Eureka Foundation (which sponsors and funds the “Great Museums” series on PBS); and a Partner of Pineville Properties LLC (a commercial real estate development firm). | 843 | None |
25
Table of Contents
GARTMORE VARIABLE INSURANCE TRUST
Management Information (Unaudited)
June 30, 2005
| Name, Address and Date of Birth | Position(s) Held with the Trust and Length of Time Served1 | Principal Occupation(s) During Past 5 Years | Number of Portfolios in the Gartmore Fund Complex Overseen by Trustee | Other Directorships Held by Trustee or Nominee2 | ||||
David C. Wetmore
c/o Gartmore Global Investments, Inc. 1200 River Road, Suite 1000 Conshohocken, PA 19428
1948 | Trustee since 1995 and Chairman since February 2005 | Retired. Mr. Wetmore was formerly a Managing Director of Updata Capital, an investment banking and venture capital firm. | 84 | None |
| * | Pursuant to the Trust’s mandatory retirement policy, Ms. Hennigar is expected to retire on or about January 12, 2006. |
| 1 | The term of office length is until a trustee resigns or reaches a mandatory retirement age of 70. On March 2, 2000, the Board adopted a five-year implementation period for any Trustee 65 or older as of the adoption of this policy. Pursuant to this policy, Messrs. Duncan and Kerr retired as trustees effective as of March 12, 2005. |
| 2 | Directorships held in (1) any other investment companies registered under the 1940 Act, (2) any company with a class of securities registered pursuant to Section 12 of the Securities Exchange Act of 1934, as amended (the “Exchange Act”), or (3) any company subject to the requirements of Section 15(d) of the Exchange Act. |
| 3 | Mr. McCarthy was also an Administrative Committee Member for the Alphagen Arneb Fund, LLC, The Healthcare Fund LDC, The Leaders Long-Short Fund, LLC, and The Leaders Long-Short Fund LDC, four private investment companies (hedge funds) managed by GSA. Mr. McCarthy resigned as an Administrative Committee Member effective June 30, 2005. |
Trustees and Officers who are not Interested Persons (as defined in the 1940 Act) of the Funds received aggregate compensation of $274,882 from the Trust for the Six Months Ended June 30, 2005. Additional information regarding the Trustees and Officers may be found in the Trust’s statement of additional information, which is available without charge upon request, by calling 1-800-848-0920.
26
Table of Contents
GARTMORE VARIABLE INSURANCE TRUST
Management Information (Unaudited)
June 30, 2005
Trustees who are Interested Persons (as defined in the 1940 Act) and/or Officers of the Funds June 30, 2005
| Name, Address and Age | Position(s) Held with the Trust and Length of Time Served1 | Principal Occupation(s) During Past 5 Years | Number of Portfolios in the Gartmore Fund Complex Overseen by Trustee | Other Directorships Held by Trustee2 | ||||
Paul J. Hondros
Gartmore Global Investments, Inc. 1200 River Road, Suite 1000 Conshohocken, PA 19428
1948 | Trustee since July 2000 | Mr. Hondros has been President and Chief Executive Officer of various Gartmore entities, including Gartmore Distribution Services, Inc. (“GDSI”),3 Gartmore Investor Services, Inc. (“GISI”),3 Gartmore Morley Capital Management, Inc. (“GMCM”),3 Gartmore Morley Financial Services, Inc. (“GMFS”),3 NorthPointe Capital, LLC (“NorthPointe”),3 Gartmore Global Asset Management Trust (“GGAMT”)3, Gartmore Global Investments, Inc. (“GGI”)3, Gartmore Mutual Fund Capital Trust (“GMFCT”)3 and Gartmore SA Capital Trust (“GSA”)3; and a Director of Nationwide Securities, Inc.3, as well as several entities within Nationwide Financial Services, Inc. | 844 | None | ||||
Arden L. Shisler
c/o Gartmore Global Investments, Inc. 1200 River Road, Suite 1000 Conshohocken, PA 19428
1941 | Trustee since February 2000 | Mr. Shisler has been a consultant since January 2003. Prior thereto, he was President and Chief Executive Officer of K&B Transport, Inc., a trucking firm. Since 1992, Mr. Shisler has also been Chairman of the Board for Nationwide Mutual Insurance Company3. | 84 | Director of Nationwide Financial Services, Inc. | ||||
Gerald J. Holland
Gartmore Global Investments, Inc. 1200 River Road, Suite 1000 Conshohocken, PA 19428
1951 | Treasurer since March 2001 | Mr. Holland is Senior Vice President — Operations for GGI3, GMFCT3, and GSA3. Prior to July 2000, Mr, Holland was Vice President for First Data Investor Services, an investment company service provider. | 84 | None |
27
Table of Contents
GARTMORE VARIABLE INSURANCE TRUST
Management Information (Unaudited)
June 30, 2005
| Name, Address and Age | Position(s) Held with the Trust and Length of Time Served1 | Principal Occupation(s) During Past 5 Years | Number of Portfolios in the Gartmore Fund Complex Overseen by Trustee | Other Directorships Held by Trustee2 | ||||
Michael A. Krulikowski
Gartmore Global Investments, Inc. 1200 River Road, Suite 1000 Conshohocken, PA 19428
1959 | Chief Compliance Officer since June 2004 | Since November 1999, Mr. Krulikowski has served as a Vice President and Chief Compliance Officer of GGI. Prior thereto, Mr. Krulikowski served as Chief Compliance Officer of 1717 Capital Management Company/Provident Mutual Insurance Company. | 84 | None | ||||
Eric E. Miller
Gartmore Global Investments, Inc. 1200 River Road, Suite 1000 Conshohocken, PA 19428
1953 | Secretary since December 2002 | Mr. Miller is Senior Vice President, Chief Counsel for GGI3, GMFCT3 and GSA3 since August 2002. From August 2000 to August 2002, Mr. Miller was a Partner with Stradley Ronan Stevens & Young, LLP. Prior to August 2000, Mr. Miller served as Senior Vice President and Deputy General Counsel at Delaware Investments. | 84 | None |
| 1 | The term of office length is until a trustee resigns or reaches a mandatory retirement age of 70. On March 2, 2000, the Board adopted a five-year implementation period for any Trustee 65 or older as of the adoption of this policy. Pursuant to this policy, Messrs. Duncan and Kerr retired as trustees effective as of March 12, 2005. |
| 2 | Directorships held in (1) any other investment companies registered under the 1940 Act, (2) any company with a class of securities registered pursuant to Section 12 of the Securities Exchange Act of 1934, as amended (the “Exchange Act”), or (3) any company subject to the requirements of Section 15(d) of the Exchange Act. |
| 3 | This position is held with an affiliated person or principal underwriter of the Trust. |
| 4 | Mr. Hondros was also an Administrative Committee Member for the Alphagen Arneb Fund, LLC, The Healthcare Fund LDC, The Leaders Long-Short Fund, LLC, and The Leaders Long-Short Fund LDC, four private investment companies (hedge funds) managed by GSA. Mr. Hondros resigned as Administrative Committee Member effective June 30, 2005. |
Federal law requires the Trust, each of its investment advisers and sub-advisers to adopt procedures for voting proxies (“Proxy Voting Guidelines”) and to provide a summary of those Proxy Voting Guidelines used to vote the securities held by the Funds. The Funds’ proxy voting policies and procedures are available without charge (i) upon request, by calling 1-800-848-0920, (ii) on the Fund’s website at www.gartmorefunds.com, or (iii) on the Securities and Exchange Commission’s website at www.sec.gov.
28
Table of Contents
Gartmore GVIT International Growth Fund
Semiannual Report
| | June 30, 2005 |
| Contents | ||
| 6 | Statement of Investments | |
| 10 | Statement of Assets and Liabilities | |
| 10 | Statement of Operations | |
| 11 | Statements of Changes in Net Assets | |
| 12 | Financial Highlights | |
| 13 | Notes to Financial Statements | |
Commentary provided by Gartmore Global Investments, investment adviser to Gartmore Variable Insurance Trust. All opinions and estimates included in this report constitute Gartmore Global Investments’ judgment as of the date of this report and are subject to change without notice.
Statement Regarding Availability of Quarterly Portfolio Schedule.
The Gartmore Variable Insurance Trust files complete schedules of portfolio holdings for each Fund with the Securities and Exchange Commission (the “Commission”) for the first and third quarters of each fiscal year on Form N-Q. The Funds’ Forms N-Q are available on the Commission’s website at http://www.sec.gov. The Funds’ Forms N-Q may be reviewed and copied at the Commission’s Public Reference Room in Washington, DC, and information on the operation of the Public Reference Room may be obtained by calling 800-SEC-0330; and the Funds make the information on Form N-Q available to shareholders upon request without charge.
Statement Regarding Availability of Proxy Voting Record.
Information regarding how the Fund voted proxies relating to portfolio securities held during the most recent 12-month period ended June 30, 2005 is available without charge, upon request, by calling 800-848-0920, and on the Commission’s website at http://www.sec.gov.
Table of Contents
Gartmore GVIT International Growth Fund
For the semiannual period ended June 30, 2005, the Gartmore GVIT International Growth Fund returned 2.69% (Class I at NAV) versus 0.32% for its benchmark, the Morgan Stanley Capital International (MSCI) All Country World Ex-United States Index. For broader comparison, the average return for the Fund’s Lipper peer category of International Core Funds was -0.80%.
On an absolute basis, the returns of both the Fund and its benchmark were limited by strength in the U.S. dollar, especially in the second quarter. A stronger greenback works against gains in foreign stock markets because those gains are diminished when converted from the weaker foreign currency into U.S. dollars. While we do not make investment decisions based on anticipated currency movements, we believe that this dollar strength is probably temporary, and the primary trend of the U.S. currency is most likely still down.
Relative to its benchmark, the Fund was helped by a huge overweighting and solid stock selection in the energy sector. The big story for the Fund was rising crude oil prices, which reached $60 per barrel near the end of the reporting period. Secondarily, the Fund benefited from an overweighting and stock selection in the materials and utilities sectors. On a country basis, Australia, Canada and Austria were particularly strong contributors. These positive factors were offset to some extent by an underweighting and unfavorable stock selection in health care, along with disappointing picks in the financials sector. Among countries, Switzerland, France and Belgium were some of the biggest negative influences.
Regarding individual holdings, most of the Fund’s top contributors were from the energy, materials or utilities sectors. For example, one of our best-performing holdings was Excel Coal Ltd., an Australian coal mining company whose stock was aided by a modest valuation and strong demand for coal from China and the United States. Also providing a boost to Fund performance was Suncor Energy Inc., a Canadian exploration and production (E&P) company. Other strong Fund performers included the shares of Austrian E&P firm OMV AG, Norwegian drilling and equipment provider Stolt Offshore S.A. and Finnish utility Fortum OYJ. In the energy and materials groups, we favored smaller and mid-sized companies, which we thought might benefit more from strong commodity prices.
Stocks that detracted from Fund performance included Belgian telecommunications services provider Belgacom SA, which fell sharply after announcing in May that its wireless revenues could drop in 2005 due to stiffer competition. Also turning in disappointing performances were Mitsubishi Tokyo Financial Group, Inc., Japan’s second-largest bank, and rival UFJ Holdings, Inc. Both sustained double-digit losses amid investor doubts about a proposed merger between the two companies.
While our longer-term outlook remains positive, over the near term we believe that international markets could take a breather to consolidate their recent gains, especially given the fact that a number of these markets are near multi-year highs. Additional short-term concerns are lackluster economic growth and high consumer debt in many European economies, high oil prices and the threat of further terrorist incidents. That said, we think valuations remain reasonable, interest rates are low, and many opportunities exist to find attractively valued stocks of companies capable of dynamic earnings growth.
PORTFOLIO MANAGERS: Brian O’Neill, Ben Walker
International investing involves additional risks, including currency fluctuations, differences in accounting standards, political instability and foreign regulations, all of which are magnified in emerging markets.
Investing in mutual funds involves risk, including possible loss of principal.
There is no assurance that the investment objective of any fund will be achieved.
Morgan Stanley Capital International (MSCI) All Country World excluding U.S. Index: An unmanaged, free float-adjusted, market-capitalization index that is designed to measure the performance of the stocks in companies in all countries except the United States.
Lipper Analytical Services, Inc. is an industry research firm whose rankings are based on total return performance and do not reflect the effects of sales charges.
The Gartmore Variable Insurance Trust Funds are available only as sub-account investment options in certain variable insurance products. Accordingly, investors are unable to invest in shares of these funds outside of an insurance product. Performance information found herein reflects only the performance of these funds, and does not indicate the performance your sub-account may experience under your variable insurance contract. Performance returns assume reinvestment of all distributions. The investment return and principal value of an investment will fluctuate so that an investor’s shares, when redeemed, may be worth more or less than their original cost. Index performance is provided for comparison purposes only; the indexes shown are unmanaged and do not reflect any fees or expenses. Investors cannot invest directly in market indexes. To obtain performance information about the sub-account option under your insurance contract that invests in one of these funds, please contact your variable insurance carrier. PAST PERFORMANCE IS NO GUARANTEE OF FUTURE RESULTS.
1
Table of Contents
Gartmore GVIT International Growth Fund (continued)
Commentary provided by Gartmore Global Investments. All opinions and estimates included in this report constitute Gartmore Global Investments’ judgment as of the date of this report and are subject to change without notice.
Investors should carefully consider a fund’s investment objectives, risks, fees, charges and expenses before investing any money. To obtain this and other information on Gartmore Variable Insurance Trust, please contact your variable insurance contract provider or call 800-848-0920. Please read the Trust’s prospectus carefully before investing any money.
Gartmore Funds distributed by Gartmore Distribution Services, Inc., Member NASD. 1200 River Road, Suite 1000, Conshohocken, PA 19428.
2
Table of Contents
Fund Performance | Gartmore GVIT International Growth Fund |
| Average | Annual Total Return1 |
(For Periods Ended June 30, 2005)
| Six months* | One year | Inception2 | ||||
| Class I3 | 2.69% | 18.20% | -5.96% | |||
| Class III4 | 2.68% | 18.35% | -5.93% |
| * | Not Annualized. |
| 1 | Not subject to any sales charges. |
| 2 | Fund commenced operations on August 30, 2000. |
| 3 | The existing shares of the Fund were designated Class I shares as of May 1, 2001. |
| 4 | These returns until the creation of Class III shares (May 2, 2002) are based on the performance of the Class I shares of the Fund. Excluding the effect of fee waivers or reimbursements, such prior performance is similar to what Class III shares would have produced because all classes of shares invest in the same portfolio of securities. For Class III shares, these returns do not reflect the short-term trading fees applicable to such shares; if these fees were reflected, the annual returns for Class III shares would have been lower. |
| Performance | of a $10,000 Investment |
Investment return and principal value will fluctuate, and when redeemed, shares may be worth more or less than original cost. Past performance is no guarantee of future results and does not reflect the deduction of taxes that a shareholder would pay on fund distributions or the redemption of fund shares. Investing in mutual funds involves market risk, including loss of principal. Performance returns assume the reinvestment of all distributions.
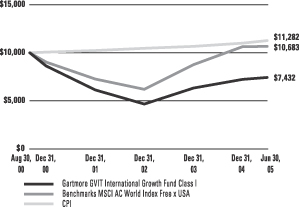
Comparative performance of $10,000 invested in Class I shares of the Gartmore GVIT International Growth Fund, the Morgan Stanley Capital International All Country World Free ex U.S. Index (MSCI AC World ex U.S.)(a), and the Consumer Price Index (CPI)(b) since inception. Unlike the Fund, the returns for these unmanaged indexes do not reflect any fees, expenses, or sales charges. Investors cannot invest directly in market indexes.
| (a) | The MSCI AC World Free ex U.S. is an unmanaged, free float-adjusted, market-capitalization weighted index that is designed to measure the performance of the stocks in companies in all countries except the United States. |
| (b) | The CPI represents changes in prices of a basket of goods and services purchased for consumption by urban households. |
3
Table of Contents
Shareholder
Expense Example | Gartmore GVIT International Growth Fund |
As a shareholder of the Fund, you incur two types of costs: (1) transaction costs, including sales charges (loads) paid on purchase payments and redemption fees; and (2) ongoing costs, including investment advisory fees, administration fees, distribution fees and other Fund expenses. The examples below are intended to help you understand your ongoing costs (in dollars) of investing in the Fund and to compare these costs with the ongoing costs of investing in other mutual funds. Per SEC requirements, the examples assume that you had a $1,000 investment in the Class at the beginning of the reporting period, January 1, 2005, and continued to hold your shares at the end of the reporting period, June 30, 2005.
Actual Expenses
For each Class of the Fund in the table below, the first line provides information about actual account values and actual expenses. You may use the information in this line, together with the amount you invested, to estimate the expenses that you paid over the period. Simply divide your account value by $1,000 (for example, an $8,600 account value divided by $1,000 = 8.6), then multiply the result by the number in the first line of each Class under the heading entitled “Expenses Paid During Period” to estimate the expenses you paid on your account during the period.
Hypothetical Example for Comparison Purposes
The second line of each Class in the table below provides information about hypothetical account values and hypothetical expenses based on the Class’ actual expense ratio and an assumed rate of return of 5% per year before expenses, which is not the Class’ actual return. The hypothetical account values and expenses may not be used to estimate the actual ending account balance or expenses you paid for the period. You may use this information to compare the ongoing costs of investing in the Class of the Fund and other funds. To do so, compare this 5% hypothetical example with the 5% hypothetical examples that appear in the shareholder reports of the other funds.
Please note that the expenses shown in the table are meant to highlight your ongoing costs only and do not reflect any transaction costs, such as sales charges (loads) or redemption fees. Therefore, the second line for each Class in the table is useful in comparing ongoing costs only, and will not help you determine the relative total costs of owning different funds. In addition, if these transaction costs were included, your costs would have been higher. The examples also assume all dividends and distributions have been reinvested.
| Beginning Account Value, January 1, 2005 | Ending Account Value, June 30, 2005 | Expenses Paid During Period* | Annualized Expense Ratio* | ||||||||||
| International Growth Fund | |||||||||||||
Class I | Actual | $ | 1,000 | $ | 1,027 | $ | 6.78 | 1.35% | |||||
| Hypothetical1 | $ | 1,000 | $ | 1,018 | $ | 6.78 | 1.35% | ||||||
Class III | Actual | $ | 1,000 | $ | 1,027 | $ | 6.78 | 1.35% | |||||
| Hypothetical1 | $ | 1,000 | $ | 1,018 | $ | 6.78 | 1.35% | ||||||
| * | Expenses are equal to the Fund’s annualized expense ratio multiplied by the average account value over the period multiplied by 181/365 (to reflect the one-half year period). The expense ratio presented represents a six month, annualized ratio in accordance with SEC guidelines. |
| 1 | Represents the hypothetical 5% return before expenses. |
4
Table of Contents
Portfolio Summary
(June 30, 2005) | Gartmore GVIT International Growth Fund |
The SEC adopted a requirement that Funds present their portfolio holdings in a table, chart or graph format in their annual and semiannual reports to shareholders, whether or not a statement of investments is utilized. The following tables, which present portfolio holdings as a percentage of net assets, are provided in compliance with this requirement.
| Asset Allocation | ||
| Common Stocks | 99.8% | |
| Cash Equivalents | 0.0% | |
| Other assets in excess of liabilities | 0.2% | |
| 100.0% | ||
| Top Holdings* | ||
| BP PLC | 2.8% | |
| Fortum Oyj | 2.2% | |
| Credit Saison Co. Ltd. | 2.1% | |
| Suncor Energy, Inc. | 2.1% | |
| Nokia Oyj | 2.0% | |
| ENI SPA | 2.0% | |
| E.ON AG | 2.0% | |
| OMV AG | 2.0% | |
| LM Ericsson, Class B | 2.0% | |
| Excel Coal Ltd. | 2.0% | |
| Other Holdings | 78.8% | |
| 100.0% | ||
| Top Industries | ||
| Oil & Gas | 17.2% | |
| Banking | 13.5% | |
| Financial Services | 7.9% | |
| Transportation | 4.8% | |
| Telecommunications | 4.3% | |
| Real Estate | 4.2% | |
| Aerospace & Defense | 4.0% | |
| Chemicals | 3.7% | |
| Electronics | 3.5% | |
| Coal | 2.8% | |
| Other Industries | 34.1% | |
| 100.0% | ||
| * | For purpose of listing top holdings, repurchase agreements are considered cash equivalents and are included as part of Other Holdings. |
5
Table of Contents
GARTMORE VARIABLE INSURANCE TRUST
GARTMORE GVIT INTERNATIONAL GROWTH FUND
Statement of Investments — June 30, 2005 (Unaudited)
| Shares or Principal Amount | Value | ||||
| COMMON STOCKS (99.8%) | |||||
| AUSTRALIA (4.1%) | |||||
| Coal (2.8%) | |||||
| Excel Coal Ltd. (c) | 66,587 | $ | 377,694 | ||
| Felix Resources Ltd. (b) (c) | 71,136 | 154,140 | |||
| 531,834 | |||||
| Minerals (1.3%) | |||||
| BHP Billiton Ltd. (c) | 18,493 | 252,481 | |||
| 784,315 | |||||
| AUSTRIA (2.0%) | |||||
| Oil & Gas (2.0%) | |||||
| OMV AG (c) | 873 | 379,992 | |||
| CANADA (3.2%) | |||||
| Oil & Gas (3.2%) | |||||
| Encana Corp. (c) | 5,568 | 219,711 | |||
| Suncor Energy, Inc. (c) | 8,231 | 389,238 | |||
| 608,949 | |||||
| DENMARK (0.3%) | |||||
| Telecommunications (0.3%) | |||||
| TDC A/S (c) | 1,320 | 56,520 | |||
| FINLAND (4.9%) | |||||
| Electric Utility (2.2%) | |||||
| Fortum Oyj (c) | 26,284 | 421,626 | |||
| Oil & Gas (0.7%) | |||||
| Neste Oil (b) (c) | 4,882 | 126,483 | |||
| Telecommunications (2.0%) | |||||
| Nokia Oyj (c) | 22,980 | 382,524 | |||
| 930,633 | |||||
| FRANCE (9.8%) | |||||
| Automotive (1.0%) | |||||
| Renault SA (c) | 2,240 | 196,825 | |||
| Banking (3.0%) | |||||
| BNP Paribas SA (c) | 3,903 | 266,684 | |||
| Societe Generale (c) | 2,784 | 282,424 | |||
| 549,108 | |||||
| Building & Construction (0.7%) | |||||
| Bouygues SA (c) | 3,161 | 130,726 | |||
| Diversified Operations (1.5%) | |||||
| LVMH Moet Hennessy SA (c) | 3,720 | 286,507 | |||
| Shares or Principal Amount | Value | ||||
| COMMON STOCKS (continued) | |||||
| FRANCE (continued) | |||||
| Food—Diversified (0.7%) | |||||
| Groupe Danone (b) (c) | 1,600 | $ | 140,244 | ||
| Multimedia (0.5%) | |||||
| Vivendi Universal SA (b) (c) | 3,059 | 95,904 | |||
| Oil & Gas (1.1%) | |||||
| Total SA (c) | 885 | 207,173 | |||
| Utilities (1.3%) | |||||
| Suez SA (c) | 9,260 | 250,404 | |||
| 1,856,891 | |||||
| GERMANY (7.0%) | |||||
| Chemicals (1.2%) | |||||
| Bayer AG (c) | 6,900 | 229,674 | |||
| Electric (1.9%) | |||||
| E.ON AG (c) | 4,284 | 380,463 | |||
| Financial Services (1.5%) | |||||
| Deutsche Bank AG (c) | 3,536 | 275,300 | |||
| Gas & Electric Utility (1.3%) | |||||
| RWE AG (c) | 3,729 | 239,649 | |||
| Manufacturing—Consumer Goods (1.1%) | |||||
| Adidas Salomon (c) | 1,220 | 204,014 | |||
| 1,329,100 | |||||
| HONG KONG (3.5%) | |||||
| Diversified Operations (0.8%) | |||||
| Hutchison Whampoa Ltd. (c) | 16,000 | 144,022 | |||
| Real Estate (2.7%) | |||||
| Cheung Kong (Holdings) Ltd. (c) | 23,000 | 223,105 | |||
| New World Development Co. Ltd. (c) | 128,000 | 156,304 | |||
| Sun Hung Kai Properties Ltd. (c) | 14,000 | 137,711 | |||
| 517,120 | |||||
| 661,142 | |||||
| IRELAND (2.5%) | |||||
| Beverages (1.0%) | |||||
| C&C Group PLC (c) | 44,000 | 199,052 | |||
| Transportation (1.5%) | |||||
| Ryanair Holdings PLC ADR | 6,130 | 274,870 | |||
| 473,922 | |||||
6
Table of Contents
GARTMORE VARIABLE INSURANCE TRUST
GARTMORE GVIT INTERNATIONAL GROWTH FUND
Statement of Investments — June 30, 2005 (Unaudited) (continued)
| Shares��or Principal Amount | Value | ||||
| COMMON STOCKS (continued) | |||||
| ITALY (4.8%) | |||||
| Banking (2.8%) | |||||
| Banca Intesa SPA (c) | 30,901 | $ | 141,127 | ||
| Banca Nazionale del Lavoro SPA (b) (c) | 45,243 | 155,977 | |||
| UniCredito Italiano (b) (c) | 44,950 | 237,086 | |||
| 534,190 | |||||
| Oil & Gas (2.0%) | |||||
| ENI SPA (c) | 14,825 | 381,081 | |||
| 915,271 | |||||
| JAPAN (9.9%) | |||||
| Financial Services (6.4%) | |||||
| Credit Saison Co. Ltd. (c) | 12,000 | 397,293 | |||
| Matsui Securities Co. Ltd. (c) | 25,600 | 273,106 | |||
| Mitsubishi Tokyo Financial Group, Inc. (c) | 28 | 236,093 | |||
| Sumitomo Mitsui Financial Group, Inc. (c) | 20 | 134,529 | |||
| UFJ Holdings, Inc. (c) | 29 | 150,070 | |||
| 1,191,091 | |||||
| Import & Export (1.5%) | |||||
| Mitsubishi Corp. (c) | 21,100 | 285,433 | |||
| Real Estate (1.5%) | |||||
| Mitsui Fudosan Co. Ltd. (c) | 26,000 | 290,041 | |||
| Transportation—Marine (0.5%) | |||||
| Nippon Yusen Kabushiki Kaisha (c) | 17,000 | 97,209 | |||
| 1,863,774 | |||||
| KOREA (3.5%) | |||||
| Electronics (3.5%) | |||||
| Hynix Semiconductor, Inc. (b) (c) | 17,500 | 283,320 | |||
| Samsung Electronics Co. Ltd. ADR | 1,560 | 372,840 | |||
| 656,160 | |||||
| NETHERLANDS (3.8%) | |||||
| Banking (1.4%) | |||||
| ABN AMRO Holding NV (c) | 11,700 | 287,562 | |||
| Food (1.2%) | |||||
| Koninlijke Numico NV (b) (c) | 5,583 | 223,011 | |||
| Shares or Principal Amount | Value | ||||
| COMMON STOCKS (continued) | |||||
| NETHERLANDS (continued) | |||||
| Oil & Gas (1.2%) | |||||
| Royal Dutch Petroleum Co. (c) | 3,370 | $ | 219,171 | ||
| 729,744 | |||||
| NORWAY (4.8%) | |||||
| Chemicals (1.3%) | |||||
| Yara International ASA (b) (c) | 15,600 | 246,576 | |||
| Oil & Gas (1.7%) | |||||
| Statoil ASA (c) | 15,700 | 319,680 | |||
| Oil—Field Services (1.8%) | |||||
| Stolt Offshore SA (b) (c) | 37,637 | 341,385 | |||
| 907,641 | |||||
| SOUTH AFRICA (1.5%) | |||||
| Oil & Gas (1.5%) | |||||
| Sasol Ltd. (c) | 10,670 | 288,318 | |||
| SPAIN (2.3%) | |||||
| Building & Construction (1.1%) | |||||
| Acciona SA (c) | 2,200 | 218,019 | |||
| Construction & Engineering (1.2%) | |||||
| Abengoa, SA (c) | 18,920 | 219,295 | |||
| 437,314 | |||||
| SWEDEN (3.2%) | |||||
| Banking (1.2%) | |||||
| Skandiaviska Enskilda Banken AB, Series A (b) (c) | 13,400 | 222,414 | |||
| Telecommunications (2.0%) | |||||
| LM Ericsson, Class B (b) (c) | 119,050 | 379,933 | |||
| 602,347 | |||||
| SWITZERLAND (5.5%) | |||||
| Banking (2.0%) | |||||
| Credit Suisse Group (c) | 3,400 | 133,272 | |||
| UBS AG (c) | 3,239 | 252,497 | |||
| 385,769 | |||||
| Chemicals (1.2%) | |||||
| Syngenta AG (c) | 2,137 | 218,646 | |||
| Food—Diversified (0.7%) | |||||
| Nestle SA (c) | 510 | 130,286 | |||
| Pharmaceuticals (1.6%) | |||||
| Novartis AG (c) | 6,510 | 309,073 | |||
| 1,043,774 | |||||
7
Table of Contents
GARTMORE VARIABLE INSURANCE TRUST
GARTMORE GVIT INTERNATIONAL GROWTH FUND
Statement of Investments — June 30, 2005 (Unaudited) (continued)
| Shares or Principal Amount | Value | ||||
| COMMON STOCKS (continued) | |||||
| UNITED KINGDOM (23.2%) | |||||
| Aerospace & Defense (4.0%) | |||||
| BAE Systems (c) | 73,230 | $ | 375,355 | ||
| Rolls-Royce Group PLC (b) (c) | 71,250 | 365,693 | |||
| 741,048 | |||||
| Banking (3.1%) | |||||
| Barclays PLC (c) | 17,660 | 175,123 | |||
| HSBC Holdings PLC (c) | 11,310 | 179,932 | |||
| Royal Bank of Scotland Group PLC (c) | 7,480 | 225,307 | |||
| 580,362 | |||||
| Beverages (0.7%) | |||||
| Diageo PLC (c) | 8,850 | 130,246 | |||
| Food & Household Products (1.1%) | |||||
| Cadbury Schweppes PLC (c) | 22,790 | 216,969 | |||
| Gambling (0.8%) | |||||
| PartyGaming PLC (c) | 56,452 | 150,768 | |||
| Gas & Electric Utility (1.1%) | |||||
| Scottish Power PLC (c) | 24,340 | 216,060 | |||
| Mining (2.0%) | |||||
| BHP Billiton PLC (c) | 14,550 | 185,556 | |||
| Rio Tinto PLC (c) | 6,483 | 197,493 | |||
| 383,049 | |||||
| Oil & Gas (3.8%) | |||||
| BP PLC (c) | 50,851 | 529,052 | |||
| Shell Transport & Trading Co. PLC (c) | 19,009 | 184,133 | |||
| 713,185 | |||||
| Pharmaceuticals (0.9%) | |||||
| AstraZeneca PLC | 1,360 | 56,093 | |||
| GlaxoSmithKline PLC | 4,990 | 120,626 | |||
| 176,719 | |||||
| Shares or Principal Amount | Value | |||||
| COMMON STOCKS (continued) | ||||||
| UNITED KINGDOM (continued) | ||||||
| Transportation (3.3%) | ||||||
| BAA PLC (c) | 31,250 | $ | 346,387 | |||
| British Airways PLC (b) (c) | 59,140 | 277,602 | ||||
| 623,989 | ||||||
| Utilities (1.0%) | ||||||
| AWG PLC (c) | 11,110 | 190,916 | ||||
| Water & Sewerage Services (1.4%) | ||||||
| Pennon Group PLC (c) | 14,270 | 265,768 | ||||
| 4,389,079 | ||||||
| UNITED STATES (0.0%) | ||||||
| Multi-Media (0.0%) | ||||||
| News Corp. Ltd. (The), Class B | 330 | 5,564 | ||||
| Total Common Stocks | 18,920,450 | |||||
| CASH EQUIVALENTS (0.0%) | ||||||
| Investments in repurchase agreements (Collateralized by AA Corporate Bonds, in a joint trading account at 3.34%, dated 06/30/05, due 07/01/05, repurchase price $8,208) | $ | 8,207 | 8,207 | |||
| Total Cash Equivalents | 8,207 | |||||
| Total Investments (Cost $18,004,676) (a) — 99.8% | 18,928,657 | |||||
| Other assets in excess of liabilities — 0.2% | 37,199 | |||||
| NET ASSETS — 100.0% | $ | 18,965,856 | ||||
| (a) | See notes to financial statements for tax unrealized appreciation (depreciation) of securities. |
| (b) | Denotes a non-income producing security. |
| (c) | Fair Valued Security. |
| ADR | American Depositary Receipt |
8
Table of Contents
GARTMORE VARIABLE INSURANCE TRUST
GARTMORE GVIT INTERNATIONAL GROWTH FUND
Statement of Investments — June 30, 2005 (Unaudited) (continued)
At June 30, 2005, the Fund’s open forward foreign currency contracts were as follows:
| Currency | Delivery Date | Contract Value | Market Value | Unrealized Appreciation/ (Depreciation) | ||||||||
| Short Contracts: | ||||||||||||
Euro Dollar | 07/01/05 | $ | 240,801 | $ | 241,791 | $ | (990 | ) | ||||
British Pound | 07/05/05 | 56,001 | 55,991 | 10 | ||||||||
| Total Short Contracts | $ | 296,802 | $ | 297,782 | $ | (980 | ) | |||||
| Long Contracts: | ||||||||||||
Euro Dollar | 07/01/05 | $ | 105,866 | $ | 106,505 | $ | (639 | ) | ||||
British Pound | 07/01/05 | 251,846 | 249,734 | 2,112 | ||||||||
| Total Long Contracts | $ | 357,712 | $ | 356,239 | $ | 1,473 | ||||||
See notes to financial statements.
9
Table of Contents
GARTMORE VARIABLE INSURANCE TRUST
GARTMORE GVIT INTERNATIONAL GROWTH FUND
Statement of Assets and Liabilities
June 30, 2005 (Unaudited)
Assets: | ||||
Investments, at value (cost $17,996,469) | $ | 18,920,450 | ||
Repurchase agreements, at cost and value | 8,207 | |||
Total Investments | 18,928,657 | |||
Foreign currencies, at value (cost $156,487) | 162,453 | |||
Interest and dividends receivable | 30,656 | |||
Receivable for investments sold | 894,833 | |||
Unrealized appreciation on forward foreign currency contracts | 11 | |||
Reclaims receivable | 22,856 | |||
Prepaid expenses and other assets | 4,284 | |||
Total Assets | 20,043,750 | |||
Liabilities: | ||||
Payable to custodian | 53,623 | |||
Payable for investments purchased | 1,005,082 | |||
Accrued expenses and other payables: | ||||
Investment advisory fees | 15,480 | |||
Fund administration and transfer agent fees | 142 | |||
Administrative servicing fees | 1,966 | |||
Other | 1,601 | |||
Total Liabilities | 1,077,894 | |||
Net Assets | $ | 18,965,856 | ||
Represented by: | ||||
Capital | $ | 19,054,085 | ||
Accumulated net investment income (loss) | 77,785 | |||
Accumulated net realized gain (losses) from investment and foreign currency transactions | (1,095,231 | ) | ||
Net unrealized appreciation (depreciation) on investments and translation of assets and liabilities denominated in foreign currencies | 929,217 | |||
Net Assets | $ | 18,965,856 | ||
Net Assets: | ||||
Class I Shares | $ | 4,640,501 | ||
Class III Shares | 14,325,355 | |||
Total | $ | 18,965,856 | ||
Shares outstanding (unlimited number of shares authorized): | ||||
Class I Shares | 634,896 | |||
Class III Shares | 1,957,836 | |||
Total | 2,592,732 | |||
Net asset value and offering price per share:* | ||||
Class I Shares | $ | 7.31 | ||
Class III Shares | $ | 7.32 |
| * | Not subject to a front-end sales charge. |
For the Six Months Ended June 30, 2005 (Unaudited)
Investment Income: | ||||
Interest income | $ | 9,581 | ||
Dividend income (net of foreign withholding tax of $43,366) | 293,363 | |||
Total Income | 302,944 | |||
Expenses: | ||||
Investment advisory fees | 86,671 | |||
Fund administration and transfer agent fees | 12,916 | |||
Administrative servicing fees Class I Shares | 2,999 | |||
Administrative servicing fees Class III Shares | 9,415 | |||
Other** | 4,724 | |||
Total Expenses | 116,725 | |||
Net Investment Income (Loss) | 186,219 | |||
REALIZED/UNREALIZED GAINS (LOSSES) ON INVESTMENTS: | ||||
Net realized gains (losses) on investment transactions | 1,052,508 | |||
Net realized gains (losses) on foreign currency transactions | 17,415 | |||
Net realized gains (losses) on investment and foreign currency transactions | 1,069,923 | |||
Net change in unrealized appreciation/depreciation on investments and translation of assets and liabilities denominated in foreign currencies | (874,431 | ) | ||
Net realized/unrealized gains (losses) on investments, and foreign currencies | 195,492 | |||
CHANGE IN NET ASSETS RESULTING FROM OPERATIONS | 381,711 | |||
| ** | Other expenses may include the following fees: audit, custody, insurance, legal, printing, trustee, and out-of-pocket expenses. |
See notes to financial statements.
10
Table of Contents
GARTMORE VARIABLE INSURANCE TRUST
GARTMORE GVIT INTERNATIONAL GROWTH FUND
Statement of Changes in Net Assets
| Six Months Ended June 30, 2005 | Year Ended December 31, 2004 | |||||||
| (Unaudited) | ||||||||
From Investment Activities: | ||||||||
Operations: | ||||||||
Net investment income (loss) | $ | 186,219 | $ | 113,685 | ||||
Net realized gains (losses) on investment and foreign currency transactions | 1,069,923 | 1,030,071 | ||||||
Net change in unrealized appreciation/depreciation on investments and translation of assets and liabilities denominated in foreign currencies | (874,431 | ) | 611,065 | |||||
Change in net assets resulting from operations | 381,711 | 1,754,821 | ||||||
Distributions to Class I shareholders from: | ||||||||
Net investment income | (26,518 | ) | (28,665 | ) | ||||
Distributions to Class III shareholders from: | ||||||||
Net investment income | (81,407 | ) | (94,733 | ) | ||||
Change in net assets from shareholder distributions | (107,925 | ) | (123,398 | ) | ||||
Change in net assets from capital transactions | 3,022,109 | 3,449,179 | ||||||
Change in net assets | 3,295,895 | 5,080,602 | ||||||
Net Assets: | ||||||||
Beginning of period | 15,669,961 | 10,589,359 | ||||||
End of period | $ | 18,965,856 | $ | 15,669,961 | ||||
CAPITAL TRANSACTIONS: | ||||||||
Class I Shares | ||||||||
Proceeds from shares issued | $ | 1,852,112 | $ | 1,857,450 | ||||
Dividends reinvested | 26,518 | 28,665 | ||||||
Cost of shares redeemed | (923,733 | ) | (2,343,099 | ) | ||||
| 954,897 | (456,984 | ) | ||||||
Class III Shares | ||||||||
Proceeds from shares issued | 4,059,477 | 6,765,019 | ||||||
Dividends reinvested | 81,407 | 94,733 | ||||||
Cost of shares redeemed | (2,073,672 | ) | (2,953,589 | ) | ||||
| 2,067,212 | 3,906,163 | |||||||
Change in net assets from capital transactions | $ | 3,022,109 | $ | 3,449,179 | ||||
SHARE TRANSACTIONS: | ||||||||
Class I Shares | ||||||||
Issued | 249,009 | 282,973 | ||||||
Reinvested | 3,639 | 4,026 | ||||||
Redeemed | (127,151 | ) | (359,719 | ) | ||||
| 125,497 | (72,720 | ) | ||||||
Class III Shares | ||||||||
Issued | 554,069 | 1,036,648 | ||||||
Reinvested | 11,157 | 13,287 | ||||||
Redeemed | (285,049 | ) | (465,078 | ) | ||||
| 280,177 | 584,857 | |||||||
See notes to financial statements.
11
Table of Contents
GARTMORE VARIABLE INSURANCE TRUST
FINANCIAL HIGHLIGHTS
Selected Data for Each Share of Capital Outstanding
Gartmore GVIT International Growth Fund
| Investment Activities | Distributions | Ratios/Supplemental Data | |||||||||||||||||||||||||||||||||||||||||
| Net Asset Value, Beginning of Period | Net Investment Income (Loss) | Redemption Fees | Net Realized and Unrealized Gains (Losses) on Investments | Total from Investment Activities | Net Investment Income | Total Distributions | Net Asset Value, End of Period | Total Return | Net Assets at End of Period (000s) | Ratio of Expenses to Average Net Assets | Ratio of Net Investment Income (Loss) to Average Net Assets | Ratio of Expenses (Prior to Reimbursements) to Average Net Assets(a) | Ratio of Net Investment Income (Loss) (Prior to Reimbursements) to Average Net Assets(a) | Portfolio Turnover(b) | |||||||||||||||||||||||||||||
Class I Shares | |||||||||||||||||||||||||||||||||||||||||||
Period Ended December 31, 2000(c) | $ | 10.00 | (0.01 | ) | — | (1.37 | ) | (1.38 | ) | — | — | $ | 8.62 | (13.70% | )(f) | $ | 9,239 | 1.60% | (g) | (0.17% | )(g) | 2.88% | (g) | (1.45% | )(g) | 93.02% | |||||||||||||||||
Year Ended December 31, 2001(d) | $ | 8.62 | 0.01 | — | (2.47 | ) | (2.46 | ) | (0.02 | ) | (0.02 | ) | $ | 6.14 | (28.65% | ) | $ | 9,448 | 1.58% | 0.05% | 2.69% | (1.06% | ) | 245.96% | |||||||||||||||||||
Year Ended December 31, 2002 | $ | 6.14 | 0.01 | 0.01 | (1.50 | ) | (1.48 | ) | — | — | $ | 4.66 | (24.10% | ) | $ | 6,859 | 1.29% | 0.53% | 1.33% | 0.49% | 257.38% | ||||||||||||||||||||||
Year Ended December 31, 2003 | $ | 4.66 | 0.07 | — | 1.59 | 1.66 | — | — | $ | 6.32 | 35.62% | $ | 3,678 | 1.25% | 0.83% | (h | ) | (h | ) | 331.02% | |||||||||||||||||||||||
Year Ended December 31, 2004 | $ | 6.32 | 0.07 | — | 0.83 | 0.90 | (0.06 | ) | (0.06 | ) | $ | 7.16 | 14.19% | $ | 3,647 | 1.33% | 0.98% | (h | ) | (h | ) | 262.03% | |||||||||||||||||||||
Six Months Ended June 30, 2005 (Unaudited) | $ | 7.16 | 0.07 | — | 0.12 | 0.19 | (0.04 | ) | (0.04 | ) | $ | 7.31 | 2.69% | (f) | $ | 4,641 | 1.35% | (g) | 2.23% | (g) | (h | ) | (h | ) | 134.58% | ||||||||||||||||||
Class III Shares | |||||||||||||||||||||||||||||||||||||||||||
Period Ended December 31, 2002(e) | $ | 5.95 | (0.01 | ) | 0.01 | (1.28 | ) | (1.28 | ) | — | — | $ | 4.67 | (21.51% | )(f) | $ | 2,232 | 1.32% | (g) | 0.08% | (g) | (h | ) | (h | ) | 257.38% | |||||||||||||||||
Year Ended December 31, 2003 | $ | 4.67 | 0.02 | — | 1.63 | 1.65 | — | — | $ | 6.32 | 35.33% | $ | 6,912 | 1.33% | 0.24% | (h | ) | (h | ) | 331.02% | |||||||||||||||||||||||
Year Ended December 31, 2004 | $ | 6.32 | 0.05 | — | 0.86 | 0.91 | (0.06 | ) | (0.06 | ) | $ | 7.17 | 14.35% | $ | 12,023 | 1.35% | 0.98% | (h | ) | (h | ) | 262.03% | |||||||||||||||||||||
Six Months Ended June 30, 2005 (Unaudited) | $ | 7.17 | 0.07 | — | 0.12 | 0.19 | (0.04 | ) | (0.04 | ) | $ | 7.32 | 2.68% | (f) | $ | 14,325 | 1.35% | (g) | 2.12% | (g) | (h | ) | (h | ) | 134.58% | ||||||||||||||||||
| (a) | During the period certain fees were waived and/or reimbursed. If such waivers/reimbursements had not occurred, the ratios would have been as indicated. |
| (b) | Portfolio turnover is calculated on the basis of the Fund as whole without distinguishing among the classes of shares. |
| (c) | For the period from August 30, 2000 (commencement of operations) through December 31, 2000. |
| (d) | The existing shares of the Fund were designated Class I shares as of May 1, 2001. |
| (e) | For the period from May 2, 2002 (commencement of operations) through December 31, 2002. |
| (f) | Not annualized. |
| (g) | Annualized. |
| (h) | There were no fee reductions during the period. |
See notes to financial statements.
12
Table of Contents
GARTMORE VARIABLE INSURANCE TRUST
NOTES TO FINANCIAL STATEMENTS (Unaudited)
June 30, 2005
1. Organization
Gartmore Variable Insurance Trust (“GVIT” or the “Trust”) is an open-end management investment company, organized under the laws of Delaware by an amended and restated Agreement and Declaration of Trust, dated October 28, 2004, as amended to date. The Trust, originally created under the laws of Massachusetts as a Massachusetts business trust pursuant to a Declaration of Trust dated, as of June 30, 1981, as subsequently amended, redomesticated as a Delaware Statutory Trust after the close of trading on April 29, 2005, and is registered under the Investment Company Act of 1940, as amended (the “1940 Act”). The redomestication is a change in statutory status and does not affect the operations of the Trust. As of June 30, 2005, the Trust had authorized an unlimited number of shares of beneficial interest (“shares”) without par value. The Trust currently offers shares to life insurance company separate accounts to fund the benefits under variable life insurance or annuity policies. To date, only the separate accounts of Nationwide Life Insurance Company and Nationwide Life and Annuity Insurance Company (collectively, “Nationwide”) have purchased shares of the Trust’s series. The Trust operates thirty-one (31) separate series, or mutual funds, each with its own investment objectives and strategies. This report contains the financial statements and financial highlights of the Gartmore GVIT International Growth Fund (the “Fund”).
Under the Trust’s organizational documents, the Trust’s officers and trustees are indemnified against certain liabilities arising out of the performance of their duties to the Trust. In addition, the Trust has entered into Indemnification Agreements with the Trust’s trustees and certain officers covering similar liabilities. In addition, in the normal course of business, the Trust enters into contracts with its vendors and others that provide for general indemnifications. The Trust’s maximum exposure under these arrangements is unknown, as this would involve future claims that may be made against the Trust. Based on experience, however, the Trust expects that risk of loss to be remote.
2. Summary of Significant Accounting Policies
The following is a summary of significant accounting policies followed by the Fund in the preparation of its financial statements. The policies are in conformity with accounting principles generally accepted in the United States of America (“GAAP”). The preparation of financial statements requires management to make estimates and assumptions that affect the reported amounts of assets and liabilities, the disclosure of contingent assets and liabilities at the date of the financial statements and the reported amounts of income and expenses for the period. Actual results could differ from those estimates.
| (a) | Security Valuation |
Securities for which market quotations are readily available are valued at current market value as of “Valuation Time.” Valuation Time is as of the close of regular trading on the New York Stock Exchange (usually 4 p.m. Eastern time). Equity securities are valued at the last quoted sale price or, if there is no sale price, the last quoted bid price provided by an independent pricing service approved by the Trust’s Board of Trustees. Securities traded on NASDAQ are valued at the NASDAQ official closing price. Prices are taken from the primary market or exchange in which each security trades. Most securities listed on a foreign exchange are valued either at fair value (see description below) or at the last sale price at the close of the exchange on which the security is principally traded. Foreign securities, currencies, and other assets and liabilities denominated in foreign currencies are translated into U.S. dollars at the exchange rate of said currencies against the U.S. Dollar, as of Valuation Time, as provided by an independent pricing service approved by the Board of Trustees.
Securities for which market quotations are not readily available, or for which an independent pricing service does not provide a value or provides a value that does not represent fair value in the judgment of the Fund’s investment adviser or designee, are valued at fair value under procedures approved by the Trust’s Board of Trustees. The “Fair Value” of these securities is determined in good faith by taking into account relevant factors and surrounding circumstances. Methods utilized to obtain a “Fair Value” may include the following non-exclusive list of SEC acceptable methods: (i) a multiple of earnings; (ii) the discount from market value of a similar, freely traded security; (iii) the yield-to-maturity for debt issues; or (iv) a consolidation of the methods. The Gartmore Fair Value Committee considers a non-exclusive list of factors to arrive at the appropriate method upon determining “Fair Value.” For example, fair value determinations are required for securities whose value is affected by a “significant” event that materially affects the value of a domestic or foreign security which occurs subsequent to the time of the close of the principal market on which such domestic or foreign security trades and before the
13
Table of Contents
GARTMORE VARIABLE INSURANCE TRUST
NOTES TO FINANCIAL STATEMENTS (Unaudited) (Continued)
June 30, 2005
Valuation Time (i.e., a “subsequent event”). Typically, this will involve events occurring after the close of a foreign market on which a security trades and before the next Valuation Time.
The Fund values foreign securities at fair value in the circumstances described below. Generally, trading in foreign securities markets is completed each day at various times prior to the Valuation Time. Due to the time differences between the closings of the relevant foreign securities exchanges and the Valuation Time for the Fund, the Fund will fair value its foreign investments when it is determined that the market quotations for the foreign investments either are not readily available or are unreliable and, therefore, do not represent fair value. When the fair value prices are utilized, these prices will attempt to reflect the impact of the U.S. financial markets’ perceptions and trading activities on the Fund’s foreign investments since the last closing prices of the foreign investments were calculated on their primary foreign securities markets or exchanges. For these purposes, the Board of Trustees of the Trust has determined that movements in relevant indices or other appropriate market indicators, after the close of the foreign securities exchanges, may demonstrate that market quotations are unreliable, and may trigger fair value pricing for certain securities. Consequently, fair valuation of portfolio securities may occur on a daily basis. In determining fair value prices, the Trust utilizes data furnished by an independent pricing service (and that data draws upon, among other information, the market values of foreign investments). The fair value prices of portfolio securities generally will be used when it is determined that the use of these prices will have a material impact on the net asset value of the Fund. When the Fund uses fair value pricing, the values assigned to the Fund’s foreign investments may not be the quoted or published prices of the investments on their primary markets or exchanges.
| (b) | Repurchase Agreements |
The Fund may enter into repurchase agreements with an entity which is a member of the Federal Reserve System or which is a “primary dealer” (as designated by the Federal Reserve Bank of New York) in U.S. Government obligations. The repurchase price generally equals the price paid by the Fund plus interest negotiated on the basis of current short-term rates, which may be more or less than the rate on the underlying portfolio securities. The seller under a repurchase agreement is required to maintain the value of the collateral held pursuant to the agreement at a market value equal to or greater than the repurchase price (including accrued interest). Collateral subject to repurchase agreements is held by the Fund’s custodian or another qualified sub-custodian or in the Federal Reserve/Treasury book-entry system. If the counterparty defaults and the fair value of the collateral declines, realization of the collateral by the Fund may be delayed or limited. The Fund may transfer uninvested cash balances into a pooled cash account. These balances are invested in one or more repurchase agreements, which are fully collateralized by AA-rated Corporate Bonds with the counterparties of CS First Boston and Nomura Securities.
| (c) | Foreign Currency Transactions |
The accounting records of the Fund are maintained in U.S. dollars. Foreign currency amounts are translated into U.S. dollars at the current rate of exchange to determine the value of investments, assets and liabilities. The Fund may enter into foreign currency contracts in connection with purchases or sales of securities denominated in a foreign currency. Purchases and sales of securities, and income and expenses, are translated at the prevailing rate of exchange on the respective date of these transactions. The Fund does not isolate that portion of the results of operations resulting from changes in foreign exchange rates on investments from fluctuations arising from changes in market prices of securities held. These fluctuations are included with the net realized and unrealized gain or loss from investments and foreign currencies.
| (d) | Risks Associated with Foreign Securities and Currencies |
Investments in securities of foreign issuers carry certain risks not ordinarily associated with investments in securities of U.S. issuers. These risks include future political and economic developments, and the possible imposition of exchange controls or other foreign governmental laws and restrictions. In addition, with respect to certain countries, there is the possibility of expropriation of assets, confiscatory taxation, political or social instability, or diplomatic developments, which could adversely affect investments in those countries.
Certain countries also may impose substantial restrictions on investments in their capital markets by foreign entities, including restrictions on investments in issuers of industries deemed sensitive to relevant national interests. These factors
14
Table of Contents
GARTMORE VARIABLE INSURANCE TRUST
NOTES TO FINANCIAL STATEMENTS (Unaudited) (Continued)
June 30, 2005
may limit the investment opportunities available and result in a lack of liquidity and high price volatility with respect to securities of issuers from developing countries.
| (e) | Forward Foreign Currency Contracts |
The Fund may enter into forward foreign currency contracts in connection with planned purchases or sales of securities or to hedge the U.S. dollar value of portfolio securities denominated in a particular currency. The Fund could be exposed to risks if the counterparties to the contracts are unable to meet the terms of their contracts and from unanticipated movements in the value of a foreign currency relative to the U.S. dollar. Forward foreign currency contracts are valued at the current cost of covering these contracts, as provided by an independent pricing service approved by the Board of Trustees. The forward foreign currency contracts are adjusted by the daily exchange rate of the underlying currency and any gains or losses are recorded for financial statement purposes as unrealized gains or losses until the contract settlement date.
| (f) | Futures Contracts |
The Fund may invest in financial futures contracts (“futures contracts”) for the purpose of hedging its existing portfolio securities or securities that the Fund intends to purchase against fluctuations in value caused by changes in prevailing market interest rates or prices. Futures contracts may also be entered into for non-hedging purposes.
Upon entering into a futures contract, the Fund is required to pledge to the broker an amount of cash and/or other assets equal to a certain percentage of the contract amount (initial margin deposit). Subsequent payments, known as “variation margin,” are made each day, depending on the daily fluctuations in the fair value/market value of the underlying assets. A gain or loss equal to the daily variation margin is recognized on a daily basis. Futures contracts are valued daily at their last quoted sale price.
A “sale” of a futures contract means a contractual obligation to deliver the securities or foreign currency called for by the contract at a fixed price at a specified time in the future. A “purchase” of a futures contract means a contractual obligation to acquire the securities or foreign currency at a fixed price at a specified time in the future.
Should market conditions change unexpectedly, the Fund may not achieve the anticipated benefits of the futures contracts and may realize a loss. The use of futures transactions for hedging purposes involves the risk of imperfect correlation in movements in the price of futures contracts, interest rates, and the value of the underlying hedged assets.
| (g) | Written Options Contracts |
The Fund may write options contracts. A written option obligates the Fund to deliver (written call) or to receive (written put) a specified quantity of an underlying asset at the contract amount upon exercise by the holder of the option. The value of the option contract is recorded as a liability and unrealized gain or loss is measured by the difference between the current value and the premium received. Options traded on an exchange are valued at the last quoted sale price, or in the absence of a sale, the bid price provided by an independent pricing service approved by the Board of Trustees. Non-exchange traded options are valued using dealer supplied quotes.
| (h) | Short Sales |
The Fund is authorized to engage in short-selling of portfolio securities which obligates the Fund to replace any security that the Fund has borrowed by purchasing the security at current market value sometime in the future. The Fund will incur a loss if the price of the security increases between the date of the short sale and the date on which the Fund replaces the borrowed security. The Fund generally will realize a gain if the price of the security declines between these dates. Until the Fund replaces the borrowed security, the Fund will maintain a segregated account with cash, U.S. Government securities and/or securities held long to sufficiently cover the Fund’s short position on a daily basis. Dividends declared on securities sold short are recorded as an expense on the ex-dividend date and paid to the counterparty on the dividend pay date. The collateral for securities sold short are recorded as an expense on the ex-dividend date and paid to the counterparty on the dividend pay date. The collateral for securities sold short includes the deposits with brokers and securities held long as shown in the Statement of Investments for the Fund.
15
Table of Contents
GARTMORE VARIABLE INSURANCE TRUST
NOTES TO FINANCIAL STATEMENTS (Unaudited) (Continued)
June 30, 2005
| (i) | Security Transactions and Investment Income |
Security transactions are accounted for on the date the security is purchased or sold (“trade date”). Securities gains and losses are calculated on the identified cost basis. Interest income is recognized on the accrual basis and includes, where applicable, the amortization or accretion of premium or discount. Dividend income is recorded on the ex-dividend date.
| (j) | Securities Lending |
To generate additional income, the Fund may lend up to 33 1/3% of the Fund’s total assets pursuant to agreements, requiring that the borrower deliver cash or securities as collateral with respect to each new loan of U.S. securities, equal to at least 102% of the value of the portfolio securities loaned, and with respect to each new loan of non-U.S. securities, collateral of at least 105% of the value of the portfolio securities loaned, and thereafter requiring the borrower to mark to market the collateral on a daily basis and requiring the borrower to make up any shortfall of collateral. The Fund receives payments from borrowers equivalent to the dividends and interest that would have been earned on securities lent while simultaneously seeking to earn income on the investment of cash collateral. Collateral is marked to market daily to provide a level of collateral at least equal to the market value of securities loaned. There may be risks of delay in recovery of the securities should the borrower of the securities fail financially. Loans will be made, however, only to borrowers deemed by the Fund’s investment adviser to be of good standing and creditworthy under guidelines established by the Board of Trustees and when, in the judgment of the adviser, the consideration which can be earned currently from these securities loans justifies the attendant risks. Loans are subject to termination by the Fund or the borrower at any time, and, therefore, are not considered to be illiquid investments. JPMorgan Chase Bank serves as custodian for the securities lending program of the Fund. JPMorgan Chase Bank receives a custody fee based on the value of collateral received from borrowers.
| (k) | Distributions to Shareholders |
The Fund’s dividends from net investment income, if any, are declared and paid quarterly. The Fund’s distributable net realized capital gains, if any, are declared and distributed at least annually.
Dividends and distributions to shareholders are determined in accordance with federal income tax regulations, which may differ from GAAP. These “book/tax” differences are considered either permanent or temporary in nature. In accordance with the American Institute of Certified Public Accountants (“AICPA”) Statement of Position 93-2, permanent differences (i.e., reclassification of market discounts, gain/loss, paydowns, and distributions) are reclassified within the capital accounts based on their nature for federal income tax purposes; temporary differences do not require reclassification. These reclassifications have no effect upon the net asset value of the Fund. To the extent distributions exceed current and accumulated earnings and profits for federal income tax purposes, these distributions are reported as distributions of paid-in-capital.
| (l) | Federal Income Taxes |
It is the policy of the Fund to qualify or continue to qualify as a “regulated investment company” by complying with the provisions available to certain investment companies, as defined in applicable sections of the U.S. Internal Revenue Code, and to make distributions of net investment income and net realized capital gains sufficient to relieve the Fund from all, or substantially all, federal income taxes.
As of June 30, 2005, the tax cost of securities and the breakdown of unrealized appreciation (depreciation) for the Fund is as follows:
Tax Cost of | Unrealized Appreciation | Unrealized Depreciation | Net Unrealized Appreciation (Depreciation) | |||||||
$99,183 | $ | 1,106,746 | $ | (281,948 | ) | $ | 824,798 | |||
| (m) | Allocation of Expenses, Income, and Gains and Losses |
Expenses directly attributable to the Fund are charged to the Fund. Expenses not directly attributable to the Fund are allocated proportionately among various or all funds within the Trust. The method used by the Fund for allocating income,
16
Table of Contents
GARTMORE VARIABLE INSURANCE TRUST
NOTES TO FINANCIAL STATEMENTS (Unaudited) (Continued)
June 30, 2005
fund level expenses, and realized and unrealized gains or losses is based on the fair value of shares outstanding relative to net assets. Under this method, each class of shares participates based on the total net asset value of that class’s shares in proportion to the total net assets of the Fund. Expenses specific to a class (such as rule 12b-1 and administrative services fees) are charged to that class.
3. Transactions with Affiliates
Under the terms of the Trust’s Investment Advisory Agreement, Gartmore Global Asset Management Trust (“GGAMT”) manages the investment of the assets and supervises the daily business affairs of the Fund. GGAMT is a wholly-owned subsidiary of Nationwide Corporation. All of the common stock of Nationwide Corporation is held by Nationwide Mutual Insurance Company (95.2%) and Nationwide Mutual Fire Insurance Company (4.8%), each of which is a mutual company owned by its policyholders. In addition, GGAMT provides investment management evaluation services in initially selecting and monitoring, on an ongoing basis, the performance of the subadviser, for the Fund that GGAMT advises. Gartmore Global Partners (the “subadviser”), an affiliate of GGAMT, manages all of the Fund’s investments and has the responsibility for making all investment decisions for the Fund.
Under the terms of the Investment Advisory Agreement, the Fund pays GGAMT an investment advisory fee based on that Fund’s average daily net assets. From such fees, pursuant to the subadvisory agreement, GGAMT pays fees to the subadviser. Additional information regarding investment advisory fees and subadvisory fees for GGAMT and the subadviser is as follows for the six months ended June 30, 2005:
| Fee Schedule | Total Fees | Fees Retained | Paid to Sub-adviser | |||
Up to $500 million | 1.00% | 0.50% | 0.50% | |||
$500 million up to $2 billion | 0.95% | 0.45% | 0.50% | |||
Next $2 billion or more | 0.90% | 0.40% | 0.50% |
GGAMT and the Fund have entered into a written contract (“Expense Limitation Agreement”) that limits operating expenses (excluding any taxes, interest, brokerage fees, extraordinary expenses, short sale dividend expenses, Rule 12b-1 fees, and administrative service fees) from exceeding 1.25% for all classes until at least May 1, 2006.
GGAMT may request and receive reimbursement from the Fund of the advisory fees waived and other expenses reimbursed by GGAMT, respectively, pursuant to the Expense Limitation Agreement at a later date not to exceed three years from the fiscal year in which the corresponding reimbursement to the Fund was made, depending on the Fund (as described below), if the Fund has reached a sufficient asset size to permit reimbursement to be made without causing the total annual operating expense ratio of the Fund to exceed the limits set forth above. No reimbursement will be made unless: (i) the Fund’s assets exceed $100 million; (ii) the total annual expense ratio of the Class making such reimbursement is less than the limit set forth above; and (iii) the payment of such reimbursement is approved by the Board of Trustees on a quarterly basis. Except as provided for in the Expense Limitation Agreements, reimbursement of amounts previously waived or assumed by GGAMT is not permitted.
As of the six months ended June 30, 2005, there were no cumulative potential reimbursements for all classes of the Fund, based on reimbursements which expires within three years from the fiscal year in which the corresponding reimbursement to the Fund was made for expenses reimbursed by GGAMT.
Under the terms of a Fund Administration and Transfer Agency Agreement, Gartmore SA Capital Trust (“GSA”) provides the Fund with various administrative and accounting services, and Gartmore Investors Services, Inc. (“GISI”), an indirect subsidiary of GSA, serves as Transfer and Dividend Disbursing Agent for the Fund. The fees for the services provided under this Agreement are calculated based on the Trust’s average daily net assets according to the fee schedule below. The fees are then allocated proportionately among all funds within the Trust in relation to the average daily net assets of each fund and are paid to GSA. GSA pays GISI from these fees for its services.
17
Table of Contents
GARTMORE VARIABLE INSURANCE TRUST
NOTES TO FINANCIAL STATEMENTS (Unaudited) (Continued)
June 30, 2005
| Combined Fee Schedule* | ||
Up to $1 billion | 0.13% | |
$1 billion and more up to $3 billion | 0.08% | |
$3 billion and more up to $8 billion | 0.05% | |
$8 billion and more up to $10 billion | 0.04% | |
$10 billion and more up to $12 billion | 0.02% | |
$12 billion or more | 0.01% | |
| * | The assets of the Gartmore GVIT Investor Destinations Aggressive Fund, the Gartmore GVIT Investor Destinations Moderately Aggressive Fund, the Gartmore GVIT Investor Destinations Moderate Fund, the Gartmore GVIT Investor Destinations Moderately Conservative Fund, and the Gartmore GVIT Investor Destinations Conservative Fund (collectively, the “Investor Destinations Funds”) are excluded from the Trust asset level amount in order to calculate this asset-based fee. The Investor Destinations Funds do not pay any part of this fee. |
Effective January 1, 2005, the fee for the fund administration and transfer agency services increased as set forth below. The fees are calculated based on the Trust’s average daily net assets according to the fee schedule below. The fees are then allocated proportionately among all funds within the Trust in relation to the average daily net assets of each fund and are paid to GSA.
| Combined Fee Schedule* | ||
Up to $1 billion | 0.15% | |
$1 billion and more up to $3 billion | 0.10% | |
$3 billion and more up to $8 billion | 0.05% | |
$8 billion and more up to $10 billion | 0.04% | |
$10 billion and more up to $12 billion | 0.02% | |
$12 billion or more | 0.01% | |
| * | The assets of each of the Investor Destinations Funds are excluded from the Trust asset level amount in order to calculate this asset-based fee. The Investor Destinations Funds do not pay any part of this fee. |
GSA and GISI have entered into agreements with BISYS Fund Services Ohio, Inc. (“BISYS”), pursuant to which BISYS provides sub-administration and sub-transfer agency services, respectively, to the Fund.
Under the terms of a Distribution Plan under Rule 12b-1 of the 1940 Act, Gartmore Distribution Services, Inc. (“GDSI”), the Fund’s Distributor, is compensated by the Fund for expenses associated with the distribution of the Class II shares of the Fund. These fees are based on average daily net assets of Class II shares of the Fund at an annual rate not to exceed 0.25%.
Under the terms of an Administrative Services Plan, the Fund may pay fees to servicing organizations, such as broker-dealers, including Nationwide Financial Services, and financial institutions, which agree to provide administrative support services to the shareholders of certain classes. These services include, but are not limited, to the following: establishing and maintaining shareholder accounts; processing purchase and redemption transactions; arranging bank wires; performing shareholder sub-accounting; answering inquires regarding the Fund; and other such services. These fees are based on an annual rate of up to 0.25% of the average daily net assets of each class of shares of the Fund.
4. Short-Term Trading Fees
The Fund reserves the right to assess a short-term trading fee on certain transactions out of Class III shares that a separate account makes on behalf of a variable insurance contract owner (the “contract owner”). A separate account that redeems Class III shares on behalf of a contract owner may be subject to a 1.00% short-term trading fee if the separate account held the Class III shares on behalf of the contract owner for 60 days or less, unless an exception applies as disclosed in the prospectus. The short-term trading fee is paid directly to the Fund and is designed to offset the cost to the Fund of excess brokerage commissions and other costs associated with fluctuations in fund asset levels and cash flow caused by short-term trading. For purposes of determining whether the short-term trading fee applies, the Class III shares that were held on behalf of the contract owner the longest will be treated as being redeemed first.
18
Table of Contents
GARTMORE VARIABLE INSURANCE TRUST
NOTES TO FINANCIAL STATEMENTS (Unaudited) (Continued)
June 30, 2005
For the six months ended June 30, 2005, the Fund had no contributions to capital due to collection of redemption fees.
5. Investment Transactions
For the six months ended June 30, 2005, (excluding short-term securities) the Fund had purchases of $25,817,043 and sales of $22,593,071.
6. Bank Loans
The Trust has a credit agreement of $100,000,000. Borrowings under this arrangement bear interest at the Federal Funds rate plus 0.50%. The interest costs are included in custodian fees in the Statement of Operations. No compensation balances were required under the terms of the line of credit. There were no borrowings outstanding as of June 30, 2005.
7. Shareholder Meeting
A separate shareholders meeting was held on Tuesday, December 23, 2004, for the shareholders of the Trust’s predecessor pursuant to a Proxy Statement On Schedule 14A, dated October 29, 2004, and mailed to the shareholders of the Trust’s predecessor on or around November 5, 2004.
Two Proposals: The purpose of the December 23, 2004 meeting was to allow the shareholders of the Trust’s predecessor to vote on:
| i. | Proposal One: The election of the Trust’s Board of Trustees; and |
| ii. | Proposal Two: The approval of an “Agreement and Plan of Reorganization” that provided for the reorganization of the Trust from a Massachusetts business trust into a Delaware statutory trust. |
Proposal One: As set forth in the October 29, 2004 Proxy Statement, the nominees for election as Trustees of the Trust’s predecessor were: Charles E. Allen, Michael J. Baresich, Paula H.J. Cholmondeley, C. Brent DeVore, Phyllis Kay Dryden, Robert M. Duncan, Barbara L. Hennigar, Paul J. Hondros, Barbara I Jacobs, Thomas J. Kerr IV, Douglas F. Kridler, Michael D. McCarthy, Arden L. Shisler, and David C. Wetmore.
Proposal Two: As specifically set forth in the October 29, 2004 Proxy Statement, the Reorganization proposal requested the shareholders of the Trust’s predecessor to approve the proposed “Agreement and Plan of Reorganization” of the Trust’s predecessor (on behalf of each of the its funds) into a new Delaware-domiciled Trust, whereby the Funds of the new Delaware Trust would acquire all of the assets of the corresponding funds of the Trust’s predecessor subject to the liabilities, expenses, costs, charges, and reserves of the corresponding funds of the Trust’s predecessor (contingent or otherwise), in exchange for shares of the acquiring Funds to be distributed pro rata by the Trust to the holders of the shares of the funds of the Trust’s predecessor, in a complete liquidation of the Trust’s predecessor.
Voting Results:
The shareholders of the Trust’s predecessor voted to approve both Proposal One and Proposal Two, as follows:
Proposal 1: Election of a Board of Trustees of Gartmore Variable Insurance Trust
Charles E. Allen: | ||
FOR | 2,797,230,318.955 shares (96.078%) | |
WITHHOLD | 114,195,693.660 shares (3.922%) | |
TOTAL | 2,912,726,012.615 shares (100.000%) | |
19
Table of Contents
GARTMORE VARIABLE INSURANCE TRUST
NOTES TO FINANCIAL STATEMENTS (Unaudited) (Continued)
June 30, 2005
Michael J. Baresich: | ||
FOR | 2,796,135,979.559 shares (96.040%) | |
WITHHOLD | 115,290,033.056 shares (3.960%) | |
TOTAL | 2,912,726,012.615 shares (100.000%) | |
Paula H.J. Cholmondeley: | ||
FOR | 2,795,095,945.396 shares (96.004%) | |
WITHHOLD | 116,330,067.219 shares (3.996%) | |
TOTAL | 2,912,726,012.615 shares (100.000%) | |
C. Brent DeVore: | ||
FOR | 2,797,207,046.916 shares (96.077%) | |
WITHHOLD | 114,218,965.699 shares (3.923%) | |
TOTAL | 2,912,726,012.615 shares (100.000%) | |
Phyllis Kay Dryden: | ||
FOR | 2,795,587,023.994 shares (96.021%) | |
WITHHOLD | 115,838,988.621 shares (3.979%) | |
TOTAL | 2,912,726,012.615 shares (100.000%) | |
Robert M. Duncan: | ||
FOR | 2,790,191,720.503 shares (95.836%) | |
WITHHOLD | 121,234,292.112 shares (4.164%) | |
TOTAL | 2,912,726,012.615 shares (100.000%) | |
Barbara L. Hennigar: | ||
FOR | 2,792,939,848.858 shares (95.937%) | |
WITHHOLD | 118,486,163.757 shares (4.070%) | |
TOTAL | 2,912,726,012.615 shares (100.000%) | |
Paul J. Hondros: | ||
FOR | 2,797,557,404.448 shares (96.089%) | |
WITHHOLD | 113,868,608.167 shares (3.911%) | |
TOTAL | 2,912,726,012.615 shares (100.000%) | |
Barbara I. Jacobs: | ||
FOR | 2,796,306,126.654 shares (96.046%) | |
WITHHOLD | 115,119,885.961 shares (3.954%) | |
TOTAL | 2,912,726,012.615 shares (100.000%) | |
Thomas J. Kerr IV: | ||
FOR | 2,789,755,720.087 shares (95.821%) | |
WITHHOLD | 121,670,292.528 shares (4.179%) | |
TOTAL | 2,912,726,012.615 shares (100.000%) | |
Douglas F. Kridler: | ||
FOR | 2,798,065,774.375 shares (96.106%) | |
WITHHOLD | 113,360,238.240 shares (3.894%) | |
TOTAL | 2,912,726,012.615 shares (100.000%) | |
20
Table of Contents
GARTMORE VARIABLE INSURANCE TRUST
NOTES TO FINANCIAL STATEMENTS (Unaudited) (Continued)
June 30, 2005
Michael D. McCarthy: | ||
FOR | 2,797,452,613.694 shares (96.085%) | |
WITHHOLD | 113,973,395.921 shares (3.915%) | |
TOTAL | 2,912,726,012.615 shares (100.000%) | |
Arden L. Shisler: | ||
FOR | 2,796,738,454.730 shares (96.061%) | |
WITHHOLD | 114,687,557.885 shares (3.939%) | |
TOTAL | 2,912,726,012.615 shares (100.000%) | |
David C. Wetmore: | ||
FOR | 2,794,784,752.247 shares (95.994%) | |
WITHHOLD | 116,641,260.368 shares (4.006%) | |
TOTAL | 2,912,726,012.615 shares (100.000%) | |
Proposal 2: Approval of the Agreement and Plan of Reorganization of Gartmore Variable Insurance Trust
FOR | 2,561,003,822.546 shares (87.964%) | |
AGAINST | 103,593,261.010 shares (3.558%) | |
ABSTAIN | 246,828,929.059 shares (8.478%) | |
TOTAL | 2,912,726,012.615 shares (100.000%) |
8. Subsequent Event
On July 29, 2005, the Trust filed a Post-Effective Amendment to its Registration Statement on Form N-1A to change the structure of the Fund’s investment advisory fee and sub-advisory fee from the current asset-based fee structure to a performance based fee structure on or about October 1, 2005. On that date, or, if later, upon SEC effectiveness, the Fund will immediately lower its base advisory fee by 0.10% at each breakpoint. Beginning one year after implementation of the new performance fee structure, the Fund’s base advisory fee may be adjusted proportionately upward or downward if the Fund outperforms or uderperforms its stated benchmark by the following amounts:
| Out or Underperformance | Change in Fees | |
+/- 1 percentage point | +/- 0.02% | |
+/- 2 percentage points | +/- 0.04% | |
+/- 3 percentage points | +/- 0.06% | |
+/- 4 percentage points | +/- 0.08% | |
+/- 5 percentage points | +/- 0.10% |
The prospectus describing the above Fund will be supplemented upon the effectiveness of the Post-Effective Amendment to the Trust’s Registration Statement. Please refer to the prospectus, as supplemented by a notice you will receive after the effectiveness of the Post-Effective Amendment, for further information about this new fee structure.
21
Table of Contents
GARTMORE VARIABLE INSURANCE TRUST
Management Information (Unaudited)
June 30, 2005
Trustees who are not Interested Persons (as defined in the 1940 Act) and Officers of the Funds June 30, 2005
| Name, Address and Date of Birth | Position(s) Held with the Trust and Length of Time Served1 | Principal Occupation(s) During Past 5 Years | Number of Portfolios in the Gartmore Fund Complex Overseen by Trustee | Other Directorships Held by Trustee or Nominee2 | ||||
Charles E. Allen
c/o Gartmore Global Investments, Inc. 1200 River Road, Suite 1000 Conshohocken, PA 19428
1948 | Trustee since July 2000 | Mr. Allen is Chairman, Chief Executive Officer and President of the Graimark Realty Advisors, Inc. (real estate development, investment and asset management). | 84 | None | ||||
Paula H.J. Cholmondeley
c/o Gartmore Global Investments, Inc. 1200 River Road, Suite 1000 Conshohocken, PA 19428
1940 | Trustee since July 2000 | Ms. Cholmondeley has been the Chairman and Chief Executive Officer of the Sorrel Group, a management consulting company, since January 2004. From March 2000 through December 2003, Ms. Cholmondeley was Vice President and General Manager of Sappi Fine Paper North America. Prior thereto, Ms. Cholmondeley was Vice President and General Manager of Residential Insulation of Owens Corning. | 84 | Director of Dentsply International, Inc., Ultralife Batteries, Inc., Terex Corporation, Minerals Technology, Inc. and Albany International Corp. | ||||
C. Brent DeVore
c/o Gartmore Global Investments, Inc. 1200 River Road, Suite 1000 Conshohocken, PA 19428
1940 | Trustee since 1990 | Dr. DeVore is President of Otterbein College. | 84 | None | ||||
Phyllis K. Dryden
c/o Gartmore Global Investments, Inc. 1200 River Road, Suite 1000 Conshohocken, PA 19428
1947 | Trustee since December 2004 | Ms. Dryden was a former Managing Partner of marchFIRST, a global management consulting firm prior to 2002. | 84 | None |
22
Table of Contents
GARTMORE VARIABLE INSURANCE TRUST
Management Information (Unaudited)
June 30, 2005
| Name, Address and Date of Birth | Position(s) Held with the Trust and Length of Time Served1 | Principal Occupation(s) During Past 5 Years | Number of Portfolios in the Gartmore Fund Complex Overseen by Trustee | Other Directorships Held by Trustee or Nominee2 | ||||
Barbara L. Hennigar*
c/o Gartmore Global Investments, Inc. 1200 River Road, Suite 1000 Conshohocken, PA 19428
1935 | Trustee since July 2000 | Retired since June 2000. Prior thereto, Ms. Hennigar was the Chairman or President and Chief Executive Officer of OppenheimerFunds Services and a member of the Executive Committee of OppenheimerFunds. | 84 | None | ||||
Barbara I. Jacobs
c/o Gartmore Global Investments, Inc. 1200 River Road, Suite 1000 Conshohocken, PA 19428
1950 | Trustee since December 2004 | Ms. Jacobs has served as Chairman of the Board of Directors of KICAP Network Fund, a European (United Kingdom) hedge fund, since December 2000. Prior to 2004, Ms. Jacobs was also a Managing Director and European Portfolio Manager with CREF Investments (Teachers Insurance Annuity Association — College Retirement Equity Fund). | 84 | None | ||||
Douglas F. Kridler
c/o Gartmore Global Investments, Inc. 1200 River Road, Suite 1000 Conshohocken, PA 19428
1955 | Trustee since September 1997 | Mr. Kridler has served as the President and Chief Executive Officer of the Columbus Foundation (a Columbus, OH-based foundation which manages over 1,300 individual endowment funds) since February 2002. Mr. Kridler was the President of the Columbus Association for the Performing Arts prior thereto and Chairman of the Greater Columbus Convention and Visitors Bureau during 2000 and 2001. | 84 | None | ||||
Michael D. McCarthy
c/o Gartmore Global Investments, Inc. 1200 River Road, Suite 1000 Conshohocken, PA 19428
1947 | Trustee since December 2004 | Mr. McCarthy serves as: the Founder and Chairman of The Eureka Foundation (which sponsors and funds the “Great Museums” series on PBS); and a Partner of Pineville Properties LLC (a commercial real estate development firm). | 843 | None |
23
Table of Contents
GARTMORE VARIABLE INSURANCE TRUST
Management Information (Unaudited)
June 30, 2005
| Name, Address and Date of Birth | Position(s) Held with the Trust and Length of Time Served1 | Principal Occupation(s) During Past 5 Years | Number of Portfolios in the Gartmore Fund Complex Overseen by Trustee | Other Directorships Held by Trustee or Nominee2 | ||||
David C. Wetmore
c/o Gartmore Global Investments, Inc. 1200 River Road, Suite 1000 Conshohocken, PA 19428
1948 | Trustee since 1995 and Chairman since February 2005 | Retired. Mr. Wetmore was formerly a Managing Director of Updata Capital, an investment banking and venture capital firm. | 84 | None |
| * | Pursuant to the Trust’s mandatory retirement policy, Ms. Hennigar is expected to retire on or about January 12, 2006. |
| 1 | The term of office length is until a trustee resigns or reaches a mandatory retirement age of 70. On March 2, 2000, the Board adopted a five-year implementation period for any Trustee 65 or older as of the adoption of this policy. Pursuant to this policy, Messrs. Duncan and Kerr retired as trustees effective as of March 12, 2005. |
| 2 | Directorships held in (1) any other investment companies registered under the 1940 Act, (2) any company with a class of securities registered pursuant to Section 12 of the Securities Exchange Act of 1934, as amended (the “Exchange Act”), or (3) any company subject to the requirements of Section 15(d) of the Exchange Act. |
| 3 | Mr. McCarthy was also an Administrative Committee Member for the Alphagen Arneb Fund, LLC, The Healthcare Fund LDC, The Leaders Long-Short Fund, LLC, and The Leaders Long-Short Fund LDC, four private investment companies (hedge funds) managed by GSA. Mr. McCarthy resigned as an Administrative Committee Member effective June 30, 2005. |
Trustees and Officers who are not Interested Persons (as defined in the 1940 Act) of the Funds received aggregate compensation of $274,882 from the Trust for the Six Months Ended June 30, 2005. Additional information regarding the Trustees and Officers may be found in the Trust’s statement of additional information, which is available without charge upon request, by calling 1-800-848-0920.
24
Table of Contents
GARTMORE VARIABLE INSURANCE TRUST
Management Information (Unaudited)
June 30, 2005
Trustees who are Interested Persons (as defined in the 1940 Act) and/or Officers of the Funds June 30, 2005
| Name, Address and Age | Position(s) Held with the Trust and Length of Time Served1 | Principal Occupation(s) During Past 5 Years | Number of Portfolios in the Gartmore Fund Complex Overseen by Trustee | Other Directorships Held by Trustee2 | ||||
Paul J. Hondros
Gartmore Global Investments, Inc. 1200 River Road, Suite 1000 Conshohocken, PA 19428
1948 | Trustee since July 2000 | Mr. Hondros has been President and Chief Executive Officer of various Gartmore entities, including Gartmore Distribution Services, Inc. (“GDSI”),3 Gartmore Investor Services, Inc. (“GISI”),3 Gartmore Morley Capital Management, Inc. (“GMCM”),3 Gartmore Morley Financial Services, Inc. (“GMFS”),3 NorthPointe Capital, LLC (“NorthPointe”),3 Gartmore Global Asset Management Trust (“GGAMT”)3, Gartmore Global Investments, Inc. (“GGI”)3, Gartmore Mutual Fund Capital Trust (“GMFCT”)3 and Gartmore SA Capital Trust (“GSA”)3; and a Director of Nationwide Securities, Inc.3, as well as several entities within Nationwide Financial Services, Inc. | 844 | None | ||||
Arden L. Shisler
c/o Gartmore Global Investments, Inc. 1200 River Road, Suite 1000 Conshohocken, PA 19428
1941 | Trustee since February 2000 | Mr. Shisler has been a consultant since January 2003. Prior thereto, he was President and Chief Executive Officer of K&B Transport, Inc., a trucking firm. Since 1992, Mr. Shisler has also been Chairman of the Board for Nationwide Mutual Insurance Company3. | 84 | Director of Nationwide Financial Services, Inc. | ||||
Gerald J. Holland
Gartmore Global Investments, Inc. 1200 River Road, Suite 1000 Conshohocken, PA 19428
1951 | Treasurer since March 2001 | Mr. Holland is Senior Vice President — Operations for GGI3, GMFCT3, and GSA3. Prior to July 2000, Mr, Holland was Vice President for First Data Investor Services, an investment company service provider. | 84 | None |
25
Table of Contents
GARTMORE VARIABLE INSURANCE TRUST
Management Information (Unaudited)
June 30, 2005
| Name, Address and Age | Position(s) Held with the Trust and Length of Time Served1 | Principal Occupation(s) During Past 5 Years | Number of Portfolios in the Gartmore Fund Complex Overseen by Trustee | Other Directorships Held by Trustee2 | ||||
Michael A. Krulikowski
Gartmore Global Investments, Inc. 1200 River Road, Suite 1000 Conshohocken, PA 19428
1959 | Chief Compliance Officer since June 2004 | Since November 1999, Mr. Krulikowski has served as a Vice President and Chief Compliance Officer of GGI. Prior thereto, Mr. Krulikowski served as Chief Compliance Officer of 1717 Capital Management Company/Provident Mutual Insurance Company. | 84 | None | ||||
Eric E. Miller
Gartmore Global Investments, Inc. 1200 River Road, Suite 1000 Conshohocken, PA 19428
1953 | Secretary since December 2002 | Mr. Miller is Senior Vice President, Chief Counsel for GGI3, GMFCT3 and GSA3 since August 2002. From August 2000 to August 2002, Mr. Miller was a Partner with Stradley Ronan Stevens & Young, LLP. Prior to August 2000, Mr. Miller served as Senior Vice President and Deputy General Counsel at Delaware Investments. | 84 | None |
| 1 | The term of office length is until a trustee resigns or reaches a mandatory retirement age of 70. On March 2, 2000, the Board adopted a five-year implementation period for any Trustee 65 or older as of the adoption of this policy. Pursuant to this policy, Messrs. Duncan and Kerr retired as trustees effective as of March 12, 2005. |
| 2 | Directorships held in (1) any other investment companies registered under the 1940 Act, (2) any company with a class of securities registered pursuant to Section 12 of the Securities Exchange Act of 1934, as amended (the “Exchange Act”), or (3) any company subject to the requirements of Section 15(d) of the Exchange Act. |
| 3 | This position is held with an affiliated person or principal underwriter of the Trust. |
| 4 | Mr. Hondros was also an Administrative Committee Member for the Alphagen Arneb Fund, LLC, The Healthcare Fund LDC, The Leaders Long-Short Fund, LLC, and The Leaders Long-Short Fund LDC, four private investment companies (hedge funds) managed by GSA. Mr. Hondros resigned as Administrative Committee Member effective June 30, 2005. |
Federal law requires the Trust, each of its investment advisers and sub-advisers to adopt procedures for voting proxies (“Proxy Voting Guidelines”) and to provide a summary of those Proxy Voting Guidelines used to vote the securities held by the Funds. The Funds’ proxy voting policies and procedures are available without charge (i) upon request, by calling 1-800-848-0920, (ii) on the Fund’s website at www.gartmorefunds.com, or (iii) on the Securities and Exchange Commission’s website at www.sec.gov.
26
Table of Contents
Dreyfus GVIT International Value Fund
Semiannual Report
| | June 30, 2005 |
| Contents | ||
| 6 | Statement of Investments | |
| 11 | Statement of Assets and Liabilities | |
| 11 | Statement of Operations | |
| 12 | Statements of Changes in Net Assets | |
| 14 | Financial Highlights | |
| 15 | Notes to Financial Statements | |
Commentary provided by Gartmore Global Investments, investment adviser to Gartmore Variable Insurance Trust. All opinions and estimates included in this report constitute Gartmore Global Investments’ judgment as of the date of this report and are subject to change without notice.
Statement Regarding Availability of Quarterly Portfolio Schedule.
The Gartmore Variable Insurance Trust files complete schedules of portfolio holdings for each Fund with the Securities and Exchange Commission (the “Commission”) for the first and third quarters of each fiscal year on Form N-Q. The Funds’ Forms N-Q are available on the Commission’s website at http://www.sec.gov. The Funds’ Forms N-Q may be reviewed and copied at the Commission’s Public Reference Room in Washington, DC, and information on the operation of the Public Reference Room may be obtained by calling 800-SEC-0330; and the Funds make the information on Form N-Q available to shareholders upon request without charge.
Statement Regarding Availability of Proxy Voting Record.
Information regarding how the Fund voted proxies relating to portfolio securities held during the most recent 12-month period ended June 30, 2005 is available without charge, upon request, by calling 800-848-0920, and on the Commission’s website at http://www.sec.gov.
Table of Contents
Dreyfus GVIT International Value Fund
For the semiannual period ended June 30, 2005, the Dreyfus GVIT International Value Fund returned -1.47% (Class I at NAV) versus -0.85% for its benchmark, the Morgan Stanley Capital International Europe, Australasia and Far East (MSCI EAFE®) Index. For broader comparison, the average return for the Fund’s Lipper peer category of International Value Funds was -1.38%.
The first half of 2005 was a difficult trading environment dominated by currency moves, surging oil prices and the U.S. Federal Reserve Board’s tightening cycle entering its late stages. Corporate borrowing costs continue to remain at historic lows in both the United States and Europe, with the long bond below 4% in both regions. The recent sell-off of the euro versus the U.S. dollar has helped European exporters, and many are now looking for the European Central Bank to cut rates later this year as inflation remains quite low, and high unemployment rates as well as slow growth persist (Italy is now in a mild recession).
Despite Mr. Greenspan’s words of caution in March, inflation remains historically low, corporate balance sheets are healthy, hiring is expected to pick up, and China has successfully avoided a significant production decline thus far. Although the Japanese stock market had a difficult second quarter, more positive trends are surfacing in consumer spending and property values. The weakening yen in recent weeks also has assisted exporters. Any signal that Japan is transitioning from a deflationary to a slightly inflationary environment would be positive to the domestic demand-oriented sectors, where we run an overweight position versus the benchmark.
The international markets were driven down in the first half of 2005 by factors such as rising energy prices, tighter U.S. monetary policy, a strengthening U.S. dollar, and continued concern that earnings and gross domestic product (GDP) growth have peaked. China continues to dominate headlines as its growth persists. Recently, the country has been shopping for Western assets; Chinese companies are keen on building national brands, gaining management expertise and securing natural resources.
The emerging markets region continues to attract investors wary that developed economies are approaching an economic slowdown; thus, our emerging markets exposure yielded positive results.
As evidenced by the Fund’s holdings in Funai Electric Co. Ltd, Nippon Express Co., and Swiss Reinsurance Co., weaker stock selection tended to be stock-specific rather than driven by sectors or macroeconomics during the period. Funai Electric Co. Ltd, maker of DVDs and TVs, recently received a directive from the Osaka tax office to amend its last two years of back taxes. Transportation and logistics provider Nippon Express Co., Ltd. is expected to deliver in line with management guidance this year. However, concern over rising fuel costs, declining global growth and the potential impact on freight carriers has weakened the stock price. Finally, Swiss Reinsurance Co. is highly exposed to global interest rates and benefits from tighter monetary policy. As Organisation for Economic Co-operation and Development indicators pointed to slower growth, the bond market rallied and analysts moved to a neutral position on the stock. The company has since reported a higher-than-expected internal rate of return on new business due to product mix and duration.
Fund holding Mabuchi Motor Co., Ltd. lowered guidance due to pricing pressure in conventional motors. The company is working to diversify its product line by expanding mass production of brushless motors and increasing automotive motor exposure. Continued consumer weakness in Italy led to lower casual apparel sales at Benetton Group S.p.A., one of the country’s leading apparel retailers. The company has begun a substantial restructuring program to boost offshore sourcing, streamline logistics and revitalize merchandise content. Benetton has a strong balance sheet, high cash flow and valuable property assets. The brand is highly popular in Italy and well positioned for a rebound in consumer spending. Singapore-based DBS Group Holdings Ltd. reported a decline in the net interest margin due to higher funding costs and an increase in longer-term deposits. Hong Kong margins were expected to come under pressure from heightened competition. With loan growth up 15% for the year against 5% for the industry, the bank has executed a successful strategy to gain market share.
Many market commentators believe that Fed Chairman Alan Greenspan will conclude the tightening cycle at 3.75% by the end of the year. As always, our disciplined approach to our value investment process uncovers interesting new opportunities for the strategy. We recently added HSBC Holdings plc and BP p.l.c. to the portfolio due to these two companies’ share price weakness and lagging performance relative to that of their firms’ industry peers. In both cases, we have been able to pay value multiples for traditionally premium-rated securities. After close analysis, we determined that the long-term positive fundamentals outweighed the short-term negative trading news for both stocks. Regardless of macroeconomic trends or geopolitical events, we will continue to search for high-quality companies that we believe have been overlooked by the market.
PORTFOLIO MANAGER: D. Kirk Henry
International investing involves additional risks, including currency fluctuations, differences in accounting standards, political instability and foreign regulations, all of which are magnified in emerging markets.
1
Table of Contents
Dreyfus GVIT International Value Fund (continued)
Investing in mutual funds involves risk, including possible loss of principal.
There is no assurance that the investment objective of any fund will be achieved.
Morgan Stanley Capital International Europe, Australasia and Far East (MSCI EAFE®) Index: An unmanaged, free float-adjusted, market capitalization-weighted index that is designed to measure the performance of stocks in developed markets outside the United States and Canada.
Lipper Analytical Services, Inc. is an industry research firm whose rankings are based on total return performance and do not reflect the effects of sales charges.
The Gartmore Variable Insurance Trust Funds are available only as sub-account investment options in certain variable insurance products. Accordingly, investors are unable to invest in shares of these funds outside of an insurance product. Performance information found herein reflects only the performance of these funds, and does not indicate the performance your sub-account may experience under your variable insurance contract. Performance returns assume reinvestment of all distributions. The investment return and principal value of an investment will fluctuate so that an investor’s shares, when redeemed, may be worth more or less than their original cost. Index performance is provided for comparison purposes only; the indexes shown are unmanaged and do not reflect any fees or expenses. Investors cannot invest directly in market indexes. To obtain performance information about the sub-account option under your insurance contract that invests in one of these funds, please contact your variable insurance carrier. PAST PERFORMANCE IS NO GUARANTEE OF FUTURE RESULTS.
Commentary provided by Gartmore Global Investments. All opinions and estimates included in this report constitute Gartmore Global Investments’ judgment as of the date of this report and are subject to change without notice.
Investors should carefully consider a fund’s investment objectives, risks, fees, charges and expenses before investing any money. To obtain this and other information on Gartmore Variable Insurance Trust, please contact your variable insurance contract provider or call 800-848-0920. Please read the Trust’s prospectus carefully before investing any money.
Gartmore Funds distributed by Gartmore Distribution Services, Inc., Member NASD. 1200 River Road, Suite 1000, Conshohocken, PA 19428.
2
Table of Contents
Fund Performance | Dreyfus GVIT International Value Fund |
| Average | Annual Total Return1 |
(For Periods Ended June 30, 2005)
| Six months* | One year | Five year | Ten year | Inception | ||||||
| Class I2 | -1.47% | 10.18% | 4.60% | 8.67% | 8.47% | |||||
| Class II2 | -1.53% | 9.94% | 4.33% | 8.39% | 8.19% | |||||
| Class III2 | -1.41% | 10.20% | 4.56% | 8.65% | 8.45% | |||||
| Class IV3 | -1.48% | 10.02% | 4.56% | 8.64% | 8.45% | |||||
| Class VI2 | -1.58% | 9.84% | 4.31% | 8.38% | 8.19% |
| * | Not Annualized. |
| 1 | Not subject to any sales charges. |
| 2 | These returns until the creation of the Class I, Class II and Class III shares (April 28, 2003) and through December 31, 2003 for the Class VI shares are based on the performance of the Class IV shares of the Fund (which was based on the performance of the Fund’s predecessor until April 28, 2003). Excluding the effect of any fee waivers or reimbursements, such prior performance is similar to what Class I, Class II, Class III and Class VI shares would have produced, because all classes of shares invest in the same portfolio of securities. Class II and Class VI share’s annual returns have been restated to reflect the additional fees applicable to Class II and Class VI shares and therefore are lower than those of Class I. For Class III and Class VI shares, these returns do not reflect the short-term trading fees applicable to such shares; if these fees were reflected, the annual returns for Class III and Class VI shares would have been lower. |
| 3 | The Fund’s predecessor, the Market Street International Portfolio, commenced operation on November 1, 1991. As of April 28, 2003, the Dreyfus GVIT International Value Fund (which previously had not commenced operations) acquired all the assets, subject to stated liabilities, of the Market Street International Portfolio. At that time the Dreyfus GVIT International Value Fund took on the performance of the Market Street International Portfolio. |
| Performance | of a $10,000 Investment |
Investment return and principal value will fluctuate, and when redeemed, shares may be worth more or less than original cost. Past performance is no guarantee of future results and does not reflect the deduction of taxes that a shareholder would pay on fund distributions or the redemption of fund shares. Investing in mutual funds involves market risk, including loss of principal. Performance returns assume the reinvestment of all distributions.
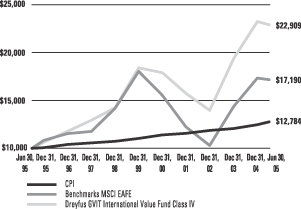
Comparative performance of $10,000 invested in Class IV shares of the Dreyfus GVIT International Value Fund, the Morgan Stanley Capital International Europe, Australasia Far East Index(MSCI EAFE)(a), and the Consumer Price Index (CPI)(b) over a 10-year period ended 06/30/05. Unlike the Fund, the returns for these unmanaged indexes
| (a) | The MSCI EAFE is a free float-adjusted market capitalization index that is designed to measure developed market equity performance, excluding the US & Canada. As of December 2003 the MSCI EAFE Index consisted of the following 21 developed market country indices: Australia, Austria, Belgium, Denmark, Finland, France, Germany, Greece, Hong Kong, Ireland, Italy, Japan, the Netherlands, New Zealand, Norway, Portugal, Singapore, Spain, Sweden, Switzerland and the United Kingdom. |
| (b) | The CPI represents changes in prices of a basket of goods and services purchased for consumption by urban households. |
3
Table of Contents
Shareholder
Expense Example | Dreyfus GVIT International Value Fund |
As a shareholder of the Fund, you incur two types of costs: (1) transaction costs, including sales charges (loads) paid on purchase payments and redemption fees; and (2) ongoing costs, including investment advisory fees, administration fees, distribution fees and other Fund expenses. The examples below are intended to help you understand your ongoing costs (in dollars) of investing in the Fund and to compare these costs with the ongoing costs of investing in other mutual funds. Per SEC requirements, the examples assume that you had a $1,000 investment in the Class at the beginning of the reporting period, January 1, 2005, and continued to hold your shares at the end of the reporting period, June 30, 2005.
Actual Expenses
For each Class of the Fund in the table below, the first line provides information about actual account values and actual expenses. You may use the information in this line, together with the amount you invested, to estimate the expenses that you paid over the period. Simply divide your account value by $1,000 (for example, an $8,600 account value divided by $1,000 = 8.6), then multiply the result by the number in the first line of each Class under the heading entitled “Expenses Paid During Period” to estimate the expenses you paid on your account during the period.
Hypothetical Example for Comparison Purposes
The second line of each Class in the table below provides information about hypothetical account values and hypothetical expenses based on the Class’ actual expense ratio and an assumed rate of return of 5% per year before expenses, which is not the Class’ actual return. The hypothetical account values and expenses may not be used to estimate the actual ending account balance or expenses you paid for the period. You may use this information to compare the ongoing costs of investing in the Class of the Fund and other funds. To do so, compare this 5% hypothetical example with the 5% hypothetical examples that appear in the shareholder reports of the other funds.
Please note that the expenses shown in the table are meant to highlight your ongoing costs only and do not reflect any transaction costs, such as sales charges (loads) or redemption fees. Therefore, the second line for each Class in the table is useful in comparing ongoing costs only, and will not help you determine the relative total costs of owning different funds. In addition, if these transaction costs were included, your costs would have been higher. The examples also assume all dividends and distributions have been reinvested.
| Beginning Account Value, January 1, 2005 | Ending Account Value, June 30, 2005 | Expenses Paid During Period* | Annualized Expense Ratio* | ||||||||||
| International Value Fund | |||||||||||||
Class I | Actual | $ | 1,000 | $ | 985 | $ | 4.23 | 0.86% | |||||
| Hypothetical1 | $ | 1,000 | $ | 1,021 | $ | 4.32 | 0.86% | ||||||
Class II | Actual | $ | 1,000 | $ | 985 | $ | 5.46 | 1.11% | |||||
| Hypothetical1 | $ | 1,000 | $ | 1,019 | $ | 5.57 | 1.11% | ||||||
Class III | Actual | $ | 1,000 | $ | 986 | $ | 4.23 | 0.86% | |||||
| Hypothetical1 | $ | 1,000 | $ | 1,021 | $ | 4.32 | 0.86% | ||||||
Class IV | Actual | $ | 1,000 | $ | 985 | $ | 4.97 | 1.01% | |||||
| Hypothetical1 | $ | 1,000 | $ | 1,020 | $ | 5.07 | 1.01% | ||||||
Class VI | Actual | $ | 1,000 | $ | 984 | $ | 5.51 | 1.12% | |||||
| Hypothetical1 | $ | 1,000 | $ | 1,019 | $ | 5.62 | 1.12% | ||||||
| * | Expenses are equal to the Fund’s annualized expense ratio multiplied by the average account value over the period multiplied by 181/365 (to reflect the one-half year period). The expense ratio presented represents a six month, annualized ratio in accordance with SEC guidelines. |
| 1 | Represents the hypothetical 5% return before expenses. |
4
Table of Contents
Portfolio Summary
(June 30, 2005) | Dreyfus GVIT International Value Fund |
The SEC adopted a requirement that Funds present their portfolio holdings in a table, chart or graph format in their annual and semiannual reports to shareholders, whether or not a statement of investments is utilized. The following tables, which present portfolio holdings as a percentage of net assets, are provided in compliance with this requirement.
| Asset Allocation | ||
| Common Stock | 94.9% | |
| Cash Equivalents | 3.2% | |
| Other Investments* | 16.9% | |
| Liabilities in excess of other assets** | -15.0% | |
| 100.0% | ||
| Top Holdings*** | ||
| Vodafone Group PLC | 1.7% | |
| GlaxoSmithKline PLC | 1.7% | |
| Bank of Ireland | 1.5% | |
| Sumitomo Mitsui Financial Group, Inc. | 1.5% | |
| Novartis AG | 1.4% | |
| Royal Bank of Scotland Group PLC | 1.3% | |
| France Telecom SA | 1.3% | |
| TotalFinaElf SA | 1.3% | |
| BP PLC | 1.3% | |
| UniCredito Italiano SpA | 1.2% | |
| Other Holdings | 85.8% | |
| 100.0% | ||
| Top Industries | ||
| Banking | 20.5% | |
| Telecommunications | 8.6% | |
| Oil & Gas | 7.7% | |
| Food & Beverages | 5.7% | |
| Chemicals | 4.3% | |
| Pharmaceuticals | 3.9% | |
| Automotive | 3.4% | |
| Electronics | 3.1% | |
| Insurance | 2.6% | |
| Transportation | 2.5% | |
| Other Industries | 37.7% | |
| 100.0% | ||
| * | Includes value of collateral received from securities lending. |
| ** | Includes value of collateral owed from securities lending. |
| *** | For purpose of listing top holdings, repurchase agreements are considered cash equivalents and are included as part of Other Holdings. |
5
Table of Contents
GARTMORE VARIABLE INSURANCE TRUST
DREYFUS GVIT INTERNATIONAL VALUE FUND
Statement of Investments — June 30, 2005 (Unaudited)
| Shares or Principal Amount | Value | ||||
| COMMON STOCKS (94.9%) | |||||
| AUSTRALIA (1.6%) | |||||
| Banking (0.9%) | |||||
| National Australia Bank Ltd. | 82,132 | $ | 1,918,745 | ||
| Containers (0.7%) | |||||
| Amcor Ltd. | 309,096 | 1,571,520 | |||
| 3,490,265 | |||||
| BRAZIL (1.2%) | |||||
| Oil & Gas (0.7%) | |||||
| Petroleo Brasileiro SA ADR | 5,500 | 253,220 | |||
| Petroleo Brasileiro SA ADR | 23,650 | 1,232,874 | |||
| 1,486,094 | |||||
| Telecommunications (0.5%) | |||||
| Telecomunicacoes Brasileiras SA ADR | 37,611 | 1,147,136 | |||
| 2,633,230 | |||||
| CHINA (0.4%) | |||||
| Telecommunications (0.4%) | |||||
| China Mobile (Hong Kong) Ltd. | 246,100 | 912,033 | |||
| FINLAND (1.6%) | |||||
| Paper Products (1.2%) | |||||
| M-Real Oyj B Shares | 246,100 | 1,333,542 | |||
| UPM-Kymmene Oyj | 60,939 | 1,166,822 | |||
| 2,500,364 | |||||
| Telecommunications (0.4%) | |||||
| Nokia Oyj | 34,300 | 570,956 | |||
| Nokia Oyj ADR | 21,626 | 359,857 | |||
| 930,813 | |||||
| 3,431,177 | |||||
| FRANCE (8.4%) | |||||
| Auto Parts & Equipment (0.9%) | |||||
| Valeo SA | 40,411 | 1,999,526 | |||
| Banking (1.9%) | |||||
| Banque Nationale de Paris SA | 34,020 | 2,324,520 | |||
| Credit Agricole SA | 77,760 | 1,965,433 | |||
| 4,289,953 | |||||
| Food & Beverages (1.2%) | |||||
| Carrefour SA | 51,210 | 2,477,666 | |||
| Shares or Principal Amount | Value | ||||
| COMMON STOCKS (continued) | |||||
| FRANCE (continued) | |||||
| Machinery (0.6%) | |||||
| Schneider Electric SA | 16,170 | $ | 1,216,460 | ||
| Medical (0.9%) | |||||
| Sanofi-Synthelabo SA | 22,460 | 1,840,190 | |||
| Oil & Gas (1.6%) | |||||
| TotalFinaElf SA | 11,610 | 2,717,823 | |||
| TotalFinaElf SA ADR | 5,541 | 647,466 | |||
| 3,365,289 | |||||
| Telecommunications (1.3%) | |||||
| France Telecom SA | 93,840 | 2,732,066 | |||
| 17,921,150 | |||||
| GERMANY (8.2%) | |||||
| Airlines (0.7%) | |||||
| Deutsche Lufthansa AG (b) | 117,182 | 1,432,487 | |||
| Automotive (1.1%) | |||||
| Volkswagen AG | 49,880 | 2,270,037 | |||
| Banking (1.7%) | |||||
| Deutsche Bank AG | 27,515 | 2,142,218 | |||
| Deutsche Postbank AG (b) | 26,520 | 1,298,727 | |||
| 3,440,945 | |||||
| Distribution & Wholesale (0.1%) | |||||
| Medion AG | 15,200 | 252,868 | |||
| Electric & Gas (0.8%) | |||||
| E.On AG | 19,027 | 1,689,788 | |||
| Insurance (0.7%) | |||||
| Allianz AG | 13,460 | 1,539,657 | |||
| Machinery & Print Trade (0.4%) | |||||
| Heidelberger Druckmaschinen AG (b) | 32,000 | 931,380 | |||
| Retail (0.2%) | |||||
| KarstadtQuelle AG | 33,454 | 445,181 | |||
| Semiconductors (0.6%) | |||||
| Infineon Technologies AG (b) | 145,100 | 1,349,510 | |||
| Telecommunications (0.7%) | |||||
| Deutsche Telecom AG | 84,700 | 1,561,173 | |||
| Transportation (1.2%) | |||||
| Deutsche Post AG | 108,190 | 2,516,372 | |||
| 17,429,398 | |||||
6
Table of Contents
GARTMORE VARIABLE INSURANCE TRUST
DREYFUS GVIT INTERNATIONAL VALUE FUND
Statement of Investments — June 30, 2005 (Unaudited) (continued)
| Shares or Principal Amount | Value | ||||
| COMMON STOCKS (continued) | |||||
| HONG KONG (0.7%) | |||||
| Banking (0.6%) | |||||
| Bank of East Asia Ltd. | 464,329 | $ | 1,367,806 | ||
| Diversified Operations (0.1%) | |||||
| Citic Pacific Ltd. | 50,000 | 145,913 | |||
| 1,513,719 | |||||
| IRELAND (1.5%) | |||||
| Banking (1.5%) | |||||
| Bank of Ireland | 200,155 | 3,227,344 | |||
| ITALY (4.0%) | |||||
| Aerospace & Defense (0.6%) | |||||
| Finmeccanica SpA | 1,479,680 | 1,378,299 | |||
| Apparel (0.5%) | |||||
| Benetton Group SpA | 106,020 | 973,321 | |||
| Banking (1.8%) | |||||
| Banche Popolari Unite Scrl | 23,030 | 456,779 | |||
| Banco Popolare di Verona e Novara Scrl | 43,160 | 734,968 | |||
| UniCredito Italiano SpA | 504,600 | 2,661,481 | |||
| 3,853,228 | |||||
| Oil & Gas (1.1%) | |||||
| Eni SpA | 93,460 | 2,402,420 | |||
| 8,607,268 | |||||
| JAPAN (25.2%) | |||||
| Advertising (0.4%) | |||||
| Dentsu, Inc. | 377 | 928,252 | |||
| Appliances (0.6%) | |||||
| Rinnai Corp. | �� | 56,000 | 1,375,803 | ||
| Automotive (2.3%) | |||||
| Fuji Heavy Industries Ltd. | 346,100 | 1,435,125 | |||
| Toyoda Gosei | 75,300 | 1,208,909 | |||
| Toyota Motor Corp. | 40,200 | 1,434,957 | |||
| Yamaha Motor Co. Ltd. | 44,600 | 815,721 | |||
| 4,894,712 | |||||
| Banking (3.0%) | |||||
| Mitsubishi Tokyo Financial Group, Inc. | 171 | 1,441,854 | |||
| Sumitomo Mitsui Financial Group, Inc. | 479 | 3,221,958 | |||
| The 77 Bank Ltd. | 233,700 | 1,433,870 | |||
| 6,097,682 | |||||
| Shares or Principal Amount | Value | ||||
| COMMON STOCKS (continued) | |||||
| JAPAN (continued) | |||||
| Building & Construction (1.2%) | |||||
| JS Group Corp. | 61,700 | $ | 1,042,712 | ||
| Sekisui House Ltd. | 153,900 | 1,547,146 | |||
| 2,589,858 | |||||
| Chemicals (2.1%) | |||||
| Shin-Etsu Chemical Co. Ltd. | 52,700 | 1,994,506 | |||
| Sumitomo Bakelite Co. Ltd. | 183,300 | 1,181,926 | |||
| Sumitomo Chemical Co. Ltd. | 271,500 | 1,243,139 | |||
| 4,419,571 | |||||
| Computers (0.4%) | |||||
| TDK Corp. | 11,500 | 781,871 | |||
| Convenience Stores (0.3%) | |||||
| Lawson, Inc. | 18,800 | 654,197 | |||
| Cosmetics & Toiletries (0.9%) | |||||
| Kao Corp. | 82,200 | 1,931,873 | |||
| Drugstores (0.4%) | |||||
| Matsumotokiyoshi Co. Ltd. | 28,000 | 762,367 | |||
| Electronic Components (2.0%) | |||||
| Mabuchi Motor Co. Ltd. | 31,300 | 1,800,937 | |||
| Minebea Co. Ltd. | 295,000 | 1,187,401 | |||
| Murata Manufacturing Co. Ltd. | 25,300 | 1,282,120 | |||
| 4,270,458 | |||||
| Electronics (1.9%) | |||||
| ALPS ELECTRIC CO. LTD. | 58,000 | 884,560 | |||
| Funai Electric Co. Ltd. | 13,600 | 1,387,954 | |||
| Rohm Co. Ltd. | 19,000 | 1,821,828 | |||
| 4,094,342 | |||||
| Finance (0.7%) | |||||
| Orix Corp. (b) | 9,900 | 1,478,666 | |||
| Financial Services (1.6%) | |||||
| Credit Saison Co. | 40,600 | 1,344,175 | |||
| Takefuji Corp. | 30,540 | 2,056,048 | |||
| 3,400,223 | |||||
| Office Automation & Equipment (0.9%) | |||||
| Canon, Inc. | 36,900 | 1,934,619 | |||
| Pharmaceuticals (0.8%) | |||||
| Takeda Chemical Industries Ltd. | 36,500 | 1,805,333 | |||
7
Table of Contents
GARTMORE VARIABLE INSURANCE TRUST
DREYFUS GVIT INTERNATIONAL VALUE FUND
Statement of Investments — June 30, 2005 (Unaudited) (continued)
| Shares or Principal Amount | Value | ||||
| COMMON STOCKS (continued) | |||||
| JAPAN (continued) | |||||
| Photographic Products (0.7%) | |||||
| Fuji Photo Film Co. Ltd. | 48,100 | $ | 1,554,889 | ||
| Restaurants (0.7%) | |||||
| Skylark Co. Ltd. | 91,400 | 1,389,161 | |||
| Retail (0.8%) | |||||
| Aeon Co. Ltd. | 113,100 | 1,720,601 | |||
| Security Services (0.3%) | |||||
| Sohgo Security Services Co. Ltd. | 42,394 | 560,139 | |||
| Telecommunications (1.5%) | |||||
| KDDI Corp. | 415 | 1,915,866 | |||
| Nippon Telegraph & Telephone Corp. | 310 | 1,325,908 | |||
| 3,241,774 | |||||
| Textile Products (0.5%) | |||||
| Kuraray Co. Ltd. | 112,600 | 1,063,491 | |||
| Transportation (1.2%) | |||||
| Nippon Express Co. Ltd. | 601,600 | 2,601,658 | |||
| 53,551,540 | |||||
| KOREA (1.1%) | |||||
| Telecommunications (0.6%) | |||||
| KT Corp. SP ADR | 56,600 | 1,216,900 | |||
| Utilities (0.5%) | |||||
| Korea Electric Power Corp. ADR | 74,700 | 1,170,549 | |||
| 2,387,449 | |||||
| MEXICO (1.4%) | |||||
| Food & Beverages (0.7%) | |||||
| Coca-Cola Femsa SA de CV ADR | 55,300 | 1,477,063 | |||
| Telecommunications (0.7%) | |||||
| Telefonos de Mexico SA de CV ADR | 79,232 | 1,496,692 | |||
| 2,973,755 | |||||
| NETHERLANDS (7.1%) | |||||
| Banking (1.8%) | |||||
| ABN AMRO Holding NV | 67,935 | 1,669,704 | |||
| Fortis NV | 81,560 | 2,257,035 | |||
| 3,926,739 | |||||
| Shares or Principal Amount | Value | ||||
| COMMON STOCKS (continued) | |||||
| NETHERLANDS (continued) | |||||
| Electronics (1.2%) | |||||
| Koninklijke (Royal) Philips Electronics NV | 82,450 | $ | 2,077,630 | ||
| Koninklijke (Royal) Philips Electronics NV ADR | 17,050 | 429,490 | |||
| 2,507,120 | |||||
| Food & Beverages (1.0%) | |||||
| Heineken NV | 67,601 | 2,086,390 | |||
| Insurance (0.9%) | |||||
| Aegon NV | 146,327 | 1,885,043 | |||
| Oil & Gas (1.1%) | |||||
| Royal Dutch Petroleum Co. | 37,290 | 2,425,192 | |||
| Printing & Publishing (0.9%) | |||||
| Wolters Kluwer NV | 99,890 | 1,907,420 | |||
| Publishing (0.2%) | |||||
| VNU NV (b) | 15,610 | 398,200 | |||
| 15,136,104 | |||||
| NEW ZEALAND (0.1%) | |||||
| Paper & Related Products (0.1%) | |||||
| Carter Holt Harvey Ltd. | 195,360 | 308,528 | |||
| PORTUGAL (0.8%) | |||||
| Utilities (0.8%) | |||||
| Electricidade de Portugal SA | 660,680 | 1,660,406 | |||
| SINGAPORE (2.0%) | |||||
| Banking (2.0%) | |||||
| DBS Group Holdings Ltd. | 303,340 | 2,567,131 | |||
| United Overseas Land Ltd. (b) | 19,820 | 26,768 | |||
| United Overseas Bank Ltd. | 198,200 | 1,667,294 | |||
| 4,261,193 | |||||
| SOUTH AFRICA (0.5%) | |||||
| Banking (0.5%) | |||||
| Nedcor Ltd. | 87,059 | 971,811 | |||
| SPAIN (2.6%) | |||||
| Banking (0.4%) | |||||
| Banco de Sabadell SA | 34,160 | 882,280 | |||
8
Table of Contents
GARTMORE VARIABLE INSURANCE TRUST
DREYFUS GVIT INTERNATIONAL VALUE FUND
Statement of Investments — June 30, 2005 (Unaudited) (continued)
| Shares or Principal Amount | Value | ||||
| COMMON STOCKS (continued) | |||||
| SPAIN (continued) | |||||
| Oil & Gas (1.0%) | |||||
| Repsol YPF SA | 42,600 | $ | 1,081,554 | ||
| Repsol YPF SA ADR | 43,270 | 1,087,375 | |||
| 2,168,929 | |||||
| Utilities (1.2%) | |||||
| Endesa SA | 110,646 | 2,572,981 | |||
| 5,624,190 | |||||
| SWEDEN (1.0%) | |||||
| Paper & Related Products (1.0%) | |||||
| Svenska Cellusoa AB | 63,810 | 2,039,231 | |||
| SWITZERLAND (6.4%) | |||||
| Banking (1.2%) | |||||
| United Bank of Switzerland AG | 32,090 | 2,501,581 | |||
| Chemicals (1.6%) | |||||
| Ciba Specialty Chemicals AG | 37,748 | 2,194,953 | |||
| Clariant AG | 55,810 | 739,335 | |||
| Lonza Group AG | 12,520 | 691,610 | |||
| 3,625,898 | |||||
| Food & Beverages (1.2%) | |||||
| Nestle SA | 9,960 | 2,544,409 | |||
| Insurance (1.0%) | |||||
| Swiss Re | 33,720 | 2,067,678 | |||
| Pharmaceuticals (1.4%) | |||||
| Novartis AG | 63,030 | 2,992,453 | |||
| 13,732,019 | |||||
| TAIWAN (0.6%) | |||||
| Semiconductor Components (0.6%) | |||||
| United Microelectronics Corp. ADR (b) | 302,862 | 1,244,763 | |||
| UNITED KINGDOM (18.5%) | |||||
| Aerospace & Defense (0.6%) | |||||
| British Aerospace PLC | 267,966 | 1,373,517 | |||
| Airport (0.6%) | |||||
| BAA PLC | 120,200 | 1,332,342 | |||
| Auto Parts & Equipment (0.8%) | |||||
| GKN PLC | 383,190 | 1,766,992 | |||
| Banking (3.2%) | |||||
| Barclays PLC | 230,222 | 2,282,959 | |||
| Shares or Principal Amount | Value | ||||
| COMMON STOCKS (continued) | |||||
| UNITED KINGDOM (continued) | |||||
| HSBC Holdings PLC (b) | 97,210 | $ | 1,546,524 | ||
| Royal Bank of Scotland Group PLC | 92,496 | 2,786,097 | |||
| 6,615,580 | |||||
| Business Services (0.1%) | |||||
| Bunzl PLC | 24,585 | 228,222 | |||
| Chemicals (0.6%) | |||||
| BOC Group PLC | 62,903 | 1,129,143 | |||
| Filtrona PLC | 28,854 | 125,679 | |||
| 1,254,822 | |||||
| Containers–Metal & Glass (0.4%) | |||||
| Rexam PLC | 98,326 | 846,638 | |||
| Food & Beverages (1.6%) | |||||
| Diageo PLC | 149,262 | 2,196,696 | |||
| Sainsbury (J) PLC | 231,928 | 1,182,725 | |||
| 3,379,421 | |||||
| Food & Household Products (1.1%) | |||||
| Unilever PLC | 234,210 | 2,254,143 | |||
| Mining (1.8%) | |||||
| Anglo American PLC | 83,354 | 1,950,019 | |||
| Rio Tinto PLC | 61,470 | 1,872,569 | |||
| 3,822,588 | |||||
| Oil & Gas (2.2%) | |||||
| BP PLC (b) | 260,100 | 2,706,076 | |||
| Centrica PLC (b) | 494,630 | 2,049,097 | |||
| 4,755,173 | |||||
| Pharmaceuticals (1.7%) | |||||
| GlaxoSmithKline PLC | 147,544 | 3,566,648 | |||
| Retail (1.3%) | |||||
| Boots Group PLC | 189,900 | 2,068,845 | |||
| Marks & Spencer Group PLC | 121,100 | 780,292 | |||
| 2,849,137 | |||||
| Telecommunications (2.5%) | |||||
| BT Group PLC | 449,089 | 1,850,218 | |||
| Vodafone Group PLC | 1,467,796 | 3,570,062 | |||
| 5,420,280 | |||||
| 39,465,503 | |||||
| Total Common Stocks | 202,522,076 | ||||
9
Table of Contents
GARTMORE VARIABLE INSURANCE TRUST
DREYFUS GVIT INTERNATIONAL VALUE FUND
Statement of Investments — June 30, 2005 (Unaudited) (continued)
| Shares or Principal Amount | Value | |||||
| CASH EQUIVALENTS (3.2%) | ||||||
| Investments in repurchase agreements (collateralized by AA Corporate Bonds in a joint trading account at 3.49%, dated 06/30/05, due 07/01/05, repurchase price $6,730,423) | $ | 6,729,770 | $ | 6,729,770 | ||
| Total Cash Equivalents | 6,729,770 | |||||
| SHORT-TERM SECURITIES HELD AS COLLATERAL FOR SECURITIES LENDING (16.9%) | ||||||
| Pool of short-term securities for Gartmore Variable Trust Funds — note 2 (Securities Lending) | 36,086,037 | 36,086,037 | ||||
| Total Short-Term Securities Held as Collateral for Securities Lending | 36,086,037 | |||||
| Shares or Principal Amount | Value | |||||
| Total Investments (Cost $234,384,524) (a) — 115.0% | $ | 245,337,883 | ||||
| Liabilities in excess of other assets — (15.0%) | (32,079,746 | ) | ||||
| NET ASSETS — 100.0% | $ | 213,258,137 | ||||
| (a) | See notes to financial statements for tax unrealized appreciation (depreciation) of securities. |
| (b) | Represents a non-income producing security. |
| (c) | Fair Valued Security. |
| ADR | American Depositary Receipt |
| Currency | Delivery Date | Contract Value | Market Value | Unrealized Appreciation (Depreciation) | ||||||||||
| Short Contracts: | ||||||||||||||
New Zealand Dollar | 07/05/05 | $ | (64,498 | ) | $ | (64,605 | ) | $ | (107 | ) | ||||
Japanese Yen | 07/05/05 | (122,674 | ) | (122,709 | ) | (35 | ) | |||||||
| Total Short Contracts | $ | (187,172 | ) | $ | (187,314 | ) | $ | (142 | ) | |||||
| Currency | Delivery Date | Contract Value | Market Value | Unrealized Appreciation (Depreciation) | |||||||
| Long Contracts: | |||||||||||
U.S. Dollar | 07/05/05 | $ | 122,674 | $ | 122,674 | $ | 0 | ||||
U.S. Dollar | 07/05/05 | 64,498 | 64,498 | 0 | |||||||
| Total Long Contracts | $ | 187,172 | $ | 187,172 | $ | 0 | |||||
See notes to financial statements.
10
Table of Contents
GARTMORE VARIABLE INSURANCE TRUST
DREYFUS GVIT INTERNATIONAL VALUE FUND
Statement of Assets and Liabilities
June 30, 2005 (Unaudited)
Assets: | |||
Investments, at value (cost $227,654,754) | $ | 238,608,113 | |
Repurchase agreements, at cost and value | 6,729,770 | ||
Total Investments | 245,337,883 | ||
Cash | 333,601 | ||
Foreign currencies, at value (cost $2,726,513) | 2,643,431 | ||
Interest and dividends receivable | 532,413 | ||
Receivable for investments sold | 1,171,895 | ||
Reclaims receivable | 125,180 | ||
Prepaid expenses and other assets | 18,682 | ||
Total Assets | 250,163,085 | ||
Liabilities: | |||
Payable for investments purchased | 662,605 | ||
Unrealized depreciation on forward foreign currency contracts | 142 | ||
Payable for return of collateral received for securities on loan | 36,086,037 | ||
Accrued expenses and other payables: | |||
Investment advisory fees | 130,959 | ||
Fund administration and transfer agent fees | 7,178 | ||
Distribution fees | 7,637 | ||
Administrative servicing fees | 8,320 | ||
Other | 2,070 | ||
Total Liabilities | 36,904,948 | ||
Net Assets | $ | 213,258,137 | |
Represented by: | |||
Capital | $ | 197,012,152 | |
Accumulated net investment income (loss) | 1,374,867 | ||
Accumulated net realized gains (losses) from investment and foreign currency transactions | 4,003,295 | ||
Net unrealized appreciation (depreciation) on investments and translation of assets and liabilities denominated in foreign currencies | 10,867,823 | ||
Net Assets | $ | 213,258,137 | |
Net Assets: | |||
Class I Shares | $ | 5,980,469 | |
Class II Shares | 2,835,678 | ||
Class III Shares | 104,808,994 | ||
Class IV Shares | 64,336,180 | ||
Class VI Shares | 35,296,816 | ||
Total | $ | 213,258,137 | |
Shares outstanding (unlimited number of shares authorized): | |||
Class I Shares | 407,040 | ||
Class II Shares | 193,589 | ||
Class III Shares | 7,150,948 | ||
Class IV Shares | 4,379,729 | ||
Class VI Shares | 2,406,961 | ||
Total | 14,538,267 | ||
Net asset value and offering price per share:* | |||
Class I Shares | $ | 14.69 | |
Class II Shares | $ | 14.65 | |
Class III Shares | $ | 14.66 | |
Class IV Shares | $ | 14.69 | |
Class VI Shares | $ | 14.66 |
| * | Not subject to a front-end sales charge. |
For the Six Months Ended June 30, 2005 (Unaudited)
Investment Income: | ||||
Interest income | $ | 105,401 | ||
Dividend income (net of foreign withholding tax of $308,573) | 3,452,744 | |||
Income from securities lending | 144,430 | |||
Total Income | 3,702,575 | |||
Expenses: | ||||
Investment advisory fees | 718,676 | |||
Fund administration and transfer agent fees | 76,075 | |||
Distribution fees Class II Shares | 3,826 | |||
Distribution fees Class III Shares | 811 | |||
Distribution fees Class VI Shares | 30,218 | |||
Administrative servicing fees | 49,499 | |||
Other** | 30,496 | |||
Total Expenses | 909,601 | |||
Net Investment Income (Loss) | 2,792,974 | |||
REALIZED/UNREALIZED GAINS (LOSSES) ON INVESTMENTS: | ||||
Net realized gains (losses) on investment transactions | 7,792,551 | |||
Net realized gains (losses) on foreign currency transactions | (265,894 | ) | ||
Net realized gains (losses) on investment and foreign currency transactions | 7,526,657 | |||
Net change in unrealized appreciation/depreciation on investments and translation of assets and liabilities denominated in foreign currencies | (13,547,124 | ) | ||
Net realized/unrealized gains (losses) on investments and foreign currencies | (6,020,467 | ) | ||
CHANGE IN NET ASSETS RESULTING FROM OPERATIONS | $ | (3,227,493 | ) | |
| ** | Other expenses may include the following fees: audit, custody, insurance, legal, printing, trustee, and out-of-pocket expenses. |
See notes to financial statements.
11
Table of Contents
GARTMORE VARIABLE INSURANCE TRUST
DREYFUS GVIT INTERNATIONAL VALUE FUND
Statement of Changes in Net Assets
| Six Months Ended June 30, 2005 | Year Ended December 31, 2004 | |||||||
| (Unaudited) | ||||||||
From Investment Activities: | ||||||||
Operations: | ||||||||
Net investment income (loss) | $ | 2,792,974 | $ | 1,760,624 | ||||
Net realized gains (losses) on investment and foreign currency transactions | 7,526,657 | 12,178,705 | ||||||
Net change in unrealized appreciation/depreciation on investments and translation of assets and liabilities denominated in foreign currencies | (13,547,124 | ) | 10,242,162 | |||||
Change in net assets resulting from operations | (3,227,493 | ) | 24,181,491 | |||||
Distributions to Class I shareholders from: | ||||||||
Net investment income | (47,125 | ) | (50,082 | ) | ||||
Net realized gains on investments | (217,911 | ) | — | |||||
Distributions to Class II shareholders from: | ||||||||
Net investment income | (18,209 | ) | (75,409 | ) | ||||
Net realized gains on investments | (101,702 | ) | — | |||||
Distributions to Class III shareholders from: | ||||||||
Net investment income | (750,755 | ) | (732,954 | ) | ||||
Net realized gains on investments | (3,745,272 | ) | — | |||||
Distributions to Class IV shareholders from: | ||||||||
Net investment income | (439,245 | ) | (1,686,812 | ) | ||||
Net realized gain on investment | (2,306,987 | ) | — | |||||
Distributions to Class VI shareholders from: | ||||||||
Net investment income | (197,451 | ) | (54,819 | )(a) | ||||
Net realized gain on investment | (1,258,216 | ) | — | |||||
Change in net assets from shareholder distributions | (9,082,873 | ) | (2,600,076 | ) | ||||
Change in net assets from capital transactions | 59,841,249 | 55,113,898 | ||||||
Change in net assets | 47,530,883 | 76,695,313 | ||||||
Net Assets: | ||||||||
Beginning of period | 165,727,254 | 89,031,941 | ||||||
End of period | $ | 213,258,137 | $ | 165,727,254 | ||||
CAPITAL TRANSACTIONS: | ||||||||
Class I Shares | ||||||||
Proceeds from shares issued | $ | 2,457,176 | $ | 6,048,733 | ||||
Dividends reinvested | 265,036 | 50,082 | ||||||
Cost of shares redeemed | (2,624,071 | ) | (1,044,136 | ) | ||||
| 98,141 | 5,054,679 | |||||||
Class II Shares | ||||||||
Proceeds from shares issued | 108,625 | 7,826,097 | ||||||
Dividends reinvested | 119,911 | 75,408 | ||||||
Cost of shares redeemed | (588,371 | ) | (6,496,630 | ) | ||||
| (359,835 | ) | 1,404,875 | ||||||
Class III Shares | ||||||||
Proceeds from shares issued | 41,727,850 | 57,309,558 | ||||||
Dividends reinvested | 4,496,021 | 732,953 | ||||||
Cost of shares redeemed | (4,461,757 | ) | (6,188,891 | ) | ||||
| 41,762,114 | 51,853,620 | |||||||
Class IV Shares | ||||||||
Proceeds from shares issued | 725,174 | 4,137,833 | ||||||
Dividends reinvested | 2,746,229 | 1,686,821 | ||||||
Cost of shares redeemed | (9,285,098 | ) | (20,851,756 | ) | ||||
| (5,813,695 | ) | (15,027,102 | ) | |||||
Class VI Shares | ||||||||
Proceeds from shares issued | 23,154,632 | 12,222,388 | (a) | |||||
Dividends reinvested | 1,455,664 | 54,819 | (a) | |||||
Cost of shares redeemed | (455,772 | ) | (449,381 | )(a) | ||||
| 24,154,524 | 11,827,826 | |||||||
Change in net assets from capital transactions | $ | 59,841,249 | $ | 55,113,898 | ||||
12
Table of Contents
GARTMORE VARIABLE INSURANCE TRUST
DREYFUS GVIT INTERNATIONAL VALUE FUND
Statement of Changes in Net Assets (continued)
| Six Months Ended June 30, 2005 | Year Ended December 31, 2004 | |||||
| (Unaudited) | ||||||
SHARE TRANSACTIONS: | ||||||
Class I Shares | ||||||
Issued | 158,109 | 431,831 | ||||
Reinvested | 17,969 | 3,527 | ||||
Redeemed | (169,835 | ) | (75,465 | ) | ||
| 6,243 | 359,893 | |||||
Class II Shares | ||||||
Issued | 6,814 | 573,792 | ||||
Reinvested | 8,159 | 5,443 | ||||
Redeemed | (38,113 | ) | (476,865 | ) | ||
| (23,140 | ) | 102,370 | ||||
Class III Shares | ||||||
Issued | 2,697,156 | 4,113,554 | ||||
Reinvested | 305,664 | 52,134 | ||||
Redeemed | (292,256 | ) | (453,452 | ) | ||
| 2,710,564 | 3,712,236 | |||||
Class IV Shares | ||||||
Issued | 46,579 | 260,036 | ||||
Reinvested | 186,311 | 121,246 | ||||
Redeemed | (599,057 | ) | (1,470,619 | ) | ||
| (366,167 | ) | (1,089,337 | ) | |||
Class VI Shares | ||||||
Issued | 1,494,858 | 872,132 | (a) | |||
Reinvested | 99,085 | 3,811 | (a) | |||
Redeemed | (29,898 | ) | (33,027 | )(a) | ||
| 1,564,045 | 842,916 | |||||
| (a) | For the period from April 28, 2004 (commencement of operations) through December 31, 2004. |
See notes to financial statements.
13
Table of Contents
GARTMORE VARIABLE INSURANCE TRUST
FINANCIAL HIGHLIGHTS
Selected Data for Each Share of Capital Outstanding
Dreyfus GVIT International Value Fund
| Investment Activities | Distributions | Ratios/Supplemental Data | |||||||||||||||||||||||||||||||||||||
| Net Asset Value, Beginning of Period | Net Investment Income (Loss) | Redemption Fees | Net Realized and Unrealized Gains (Losses) on Investments | Total from Investment Activities | Net Investment Income | Net Realized Gains | Total Distributions | Net Asset Value, End of Period | Total Return | Net Assets at End of Period (000s) | Ratio of Expenses to Average Net Assets | Ratio of Net Investment Income (Loss) to Average Net Assets | Portfolio Turnover(a) | ||||||||||||||||||||||||||
Class I Shares | |||||||||||||||||||||||||||||||||||||||
Period Ended December 31, 2003(b) | $ | 9.25 | 0.02 | 0.09 | 3.90 | 4.01 | — | — | — | $ | 13.26 | 45.08% | (d) | $ | 542 | 1.20% | (e) | 0.56% | (e) | 91.20% | |||||||||||||||||||
Year Ended December 31, 2004 | $ | 13.26 | 0.18 | 0.01 | 2.46 | 2.65 | (0.33 | ) | — | (0.33 | ) | $ | 15.58 | 20.29% | $ | 6,247 | 0.86% | 1.33% | 42.68% | ||||||||||||||||||||
Six Months Ended June 30, 2005 (Unaudited) | $ | 15.58 | 0.24 | 0.01 | (0.48 | ) | (0.23 | ) | (0.11 | ) | (0.55 | ) | (0.66 | ) | $ | 14.69 | (1.47% | )(d) | $ | 5,980 | 0.86% | (e) | 2.93% | (e) | 20.26% | ||||||||||||||
Class II Shares | |||||||||||||||||||||||||||||||||||||||
Period Ended December 31, 2003(b) | $ | 9.25 | 0.01 | 0.09 | 3.87 | 3.97 | — | — | — | $ | 13.22 | 44.64% | (d) | $ | 1,523 | 1.45% | (e) | 0.20% | (e) | 91.20% | |||||||||||||||||||
Year Ended December 31, 2004 | $ | 13.22 | 0.14 | 0.01 | 2.46 | 2.61 | (0.30 | ) | — | (0.30 | ) | $ | 15.53 | 20.00% | $ | 3,368 | 1.10% | 1.69% | 42.68% | ||||||||||||||||||||
Six Months Ended June 30, 2005 (Unaudited) | $ | 15.53 | 0.21 | 0.01 | (0.45 | ) | (0.23 | ) | (0.10 | ) | (0.55 | ) | (0.65 | ) | $ | 14.65 | (1.53% | )(d) | $ | 2,836 | 1.11% | (e) | 2.53% | (e) | 20.26% | ||||||||||||||
Class III Shares | |||||||||||||||||||||||||||||||||||||||
Period Ended December 31, 2003(b) | $ | 9.25 | 0.05 | 0.09 | 3.84 | 3.98 | — | — | — | $ | 13.23 | 44.75% | (d) | $ | 9,620 | 1.13% | (e) | 1.30% | (e) | 91.20% | |||||||||||||||||||
Year Ended December 31, 2004 | $ | 13.23 | 0.18 | 0.01 | 2.45 | 2.64 | (0.33 | ) | — | (0.33 | ) | $ | 15.54 | 20.26% | $ | 69,043 | 0.86% | 1.42% | 42.68% | ||||||||||||||||||||
Six Months Ended June 30, 2005 (Unaudited) | $ | 15.54 | 0.20 | 0.01 | (0.43 | ) | (0.22 | ) | (0.11 | ) | (0.55 | ) | (0.66 | ) | $ | 14.66 | (1.41% | )(d) | $ | 104,809 | 0.86% | (e) | 3.04% | (e) | 20.26% | ||||||||||||||
Class IV Shares(c) | |||||||||||||||||||||||||||||||||||||||
Year Ended December 31, 2000 | $ | 16.68 | 0.17 | — | (0.61 | ) | (0.44 | ) | (0.19 | ) | (1.91 | ) | (2.10 | ) | $ | 14.14 | (2.75% | ) | $ | 78,501 | 0.95% | 1.33% | 37.00% | ||||||||||||||||
Year Ended December 31, 2001 | $ | 14.14 | 0.12 | — | (1.67 | ) | (1.55 | ) | (0.17 | ) | (1.22 | ) | (1.39 | ) | $ | 11.20 | (12.20% | ) | $ | 68,746 | 1.08% | 1.04% | 36.00% | ||||||||||||||||
Year Ended December 31, 2002 | $ | 11.20 | 0.18 | — | (1.41 | ) | (1.23 | ) | (0.12 | ) | — | (0.12 | ) | $ | 9.85 | (11.10% | ) | $ | 59,335 | 1.00% | 1.63% | 35.00% | |||||||||||||||||
Year Ended December 31, 2003 | $ | 9.85 | 0.18 | 0.09 | 3.41 | 3.68 | (0.27 | ) | — | (0.27 | ) | $ | 13.26 | 38.52% | $ | 77,347 | 1.12% | 1.62% | 91.20% | ||||||||||||||||||||
Year Ended December 31, 2004 | $ | 13.26 | 0.22 | 0.01 | 2.39 | 2.62 | (0.31 | ) | — | (0.31 | ) | $ | 15.57 | 20.04% | $ | 73,953 | 1.00% | 1.56% | 42.68% | ||||||||||||||||||||
Six Months Ended June 30, 2005 (Unaudited) | $ | 15.57 | 0.21 | 0.01 | (0.45 | ) | (0.23 | ) | (0.10 | ) | (0.55 | ) | (0.65 | ) | $ | 14.69 | (1.48% | )(d) | $ | 64,336 | 1.01% | (e) | 2.68% | (e) | 20.26% | ||||||||||||||
Class VI Shares | |||||||||||||||||||||||||||||||||||||||
Period Ended December 31, 2004(f) | $ | 13.63 | 0.13 | 0.01 | 1.95 | 2.09 | (0.17 | ) | — | (0.17 | ) | $ | 15.55 | 15.45% | (d) | $ | 13,117 | 1.11% | (e) | 0.63% | (e) | 42.68% | |||||||||||||||||
Six Months Ended June 30, 2005 (Unaudited) | $ | 15.55 | 0.18 | 0.01 | (0.43 | ) | (0.24 | ) | (0.10 | ) | (0.55 | ) | (0.65 | ) | $ | 14.66 | (1.58% | )(d) | $ | 35,297 | 1.12% | (e) | 3.15% | (e) | 20.26% | ||||||||||||||
| (a) | Portfolio turnover is calculated on the basis of the Fund as whole without distinguishing among the classes of shares. |
| (b) | For the period from April 28, 2003 (commencement of operations) through December 31, 2003. |
| (c) | The Dreyfus GVIT International Value Fund retained the history of the Market Street International Fund and the existing shares of the Fund were designated Class IV shares. |
| (d) | Not annualized. |
| (e) | Annualized. |
| (f) | For the period from April 28, 2004 (commencement of operations) through December 31, 2004. |
See notes to financial statements.
14
Table of Contents
GARTMORE VARIABLE INSURANCE TRUST
NOTES TO FINANCIAL STATEMENTS (Unaudited)
June 30, 2005
1. Organization
Gartmore Variable Insurance Trust (“GVIT” or the “Trust”) is an open-end management investment company, organized under the laws of Delaware by an amended and restated Agreement and Declaration of Trust, dated October 28, 2004, as amended to date. The Trust, originally created under the laws of Massachusetts as Massachusetts business trust pursuant to a Declaration of Trust dated, as of June 30, 1981, as subsequently amended, redomesticated as a Delaware Statutory Trust after the close of trading on April 29, 2005, and is registered under the Investment Company Act of 1940, as amended (the “1940 Act”). The redomestication is a change in statutory status and does not affect the operations of the Trust. As of June 30, 2005, the Trust had authorized an unlimited number of shares of beneficial interest (“shares”) without par value. The Trust currently offers shares to life insurance company separate accounts to fund the benefits under variable life insurance or annuity policies. To date, only the separate accounts of Nationwide Life Insurance Company and Nationwide Life and Annuity Insurance Company (collectively, “Nationwide”) have purchased shares of the Trust’s series. The Trust operates thirty-one (31) separate series, or mutual funds, each with its own investment objectives and strategies. This report contains the financial statements and financial highlights of the Dreyfus GVIT International Value Fund (the “Fund”).
Under the Trust’s organizational documents, the Trust’s officers and trustees are indemnified against certain liabilities arising out of the performance of their duties to the Trust. In addition, the Trust has entered into Indemnification Agreements with the Trust’s trustees and certain officers covering similar liabilities. In addition, in the normal course of business, the Trust enters into contracts with its vendors and others that provide for general indemnifications. The Trust’s maximum exposure under these arrangements is unknown, as this would involve future claims that may be made against the Trust. Based on experience, however, the Trust expects that risk of loss to be remote.
2. Summary of Significant Accounting Policies
The following is a summary of significant accounting policies followed by the Fund in the preparation of its financial statements. The policies are in conformity with accounting principles generally accepted in the United States of America (“GAAP”). The preparation of financial statements requires management to make estimates and assumptions that affect the reported amounts of assets and liabilities, the disclosure of contingent assets and liabilities at the date of the financial statements and the reported amounts of income and expenses for the period. Actual results could differ from those estimates.
| (a) | Security Valuation |
Securities for which market quotations are readily available are valued at current market value as of “Valuation Time.” Valuation Time is as of the close of regular trading on the New York Stock Exchange (usually 4 p.m. Eastern time). Equity securities are valued at the last quoted sale price or, if there is no sale price, the last quoted bid price provided by an independent pricing service approved by the Trust’s Board of Trustees. Securities traded on NASDAQ are valued at the NASDAQ official closing price. Prices are taken from the primary market or exchange in which each security trades. Most securities listed on a foreign exchange are valued either at fair value (see description below) or at the last sale price at the close of the exchange on which the security is principally traded. Foreign securities, currencies, and other assets and liabilities denominated in foreign currencies are translated into U.S. dollars at the exchange rate of said currencies against the U.S. Dollar, as of Valuation Time, as provided by an independent pricing service approved by the Board of Trustees.
Securities for which market quotations are not readily available, or for which an independent pricing service does not provide a value or provides a value that does not represent fair value in the judgment of the Fund’s investment adviser or designee, are valued at fair value under procedures approved by the Trust’s Board of Trustees. The “Fair Value” of these securities is determined in good faith by taking into account relevant factors and surrounding circumstances. Methods utilized to obtain a “Fair Value” may include the following non-exclusive list of SEC acceptable methods: (i) a multiple of earnings; (ii) the discount from market value of a similar, freely traded security; (iii) the yield-to-maturity for debt issues; or (iv) a consolidation of the methods. The Gartmore Fair Value Committee considers a non-exclusive list of factors to arrive at the appropriate method upon determining “Fair Value.” For example, fair value determinations are required for securities whose value is affected by a “significant” event that materially affects the value of a domestic or foreign security which occurs subsequent to the time of the close of the principal market on which such domestic or foreign security trades and before the
15
Table of Contents
GARTMORE VARIABLE INSURANCE TRUST
NOTES TO FINANCIAL STATEMENTS (Unaudited) (Continued)
June 30, 2005
Valuation Time (i.e., a “subsequent event”). Typically, this will involve events occurring after the close of a foreign market on which a security trades and before the next Valuation Time.
The Fund values foreign securities at fair value in the circumstances described below. Generally, trading in foreign securities markets is completed each day at various times prior to the Valuation Time. Due to the time differences between the closings of the relevant foreign securities exchanges and the Valuation Time for the Fund, the Fund will fair value its foreign investments when it is determined that the market quotations for the foreign investments either are not readily available or are unreliable and, therefore, do not represent fair value. When the fair value prices are utilized, these prices will attempt to reflect the impact of the U.S. financial markets’ perceptions and trading activities on the Fund’s foreign investments since the last closing prices of the foreign investments were calculated on their primary foreign securities markets or exchanges. For these purposes, the Board of Trustees of the Trust has determined that movements in relevant indices or other appropriate market indicators, after the close of the foreign securities exchanges, may demonstrate that market quotations are unreliable, and may trigger fair value pricing for certain securities. Consequently, fair valuation of portfolio securities may occur on a daily basis. In determining fair value prices, the Trust utilizes data furnished by an independent pricing service (and that data draws upon, among other information, the market values of foreign investments). The fair value prices of portfolio securities generally will be used when it is determined that the use of these prices will have a material impact on the net asset value of the Fund. When the Fund uses fair value pricing, the values assigned to the Fund’s foreign investments may not be the quoted or published prices of the investments on their primary markets or exchanges.
| (b) | Repurchase Agreements |
The Fund may enter into repurchase agreements with an entity which is a member of the Federal Reserve System or which is a “primary dealer” (as designated by the Federal Reserve Bank of New York) in U.S. Government obligations. The repurchase price generally equals the price paid by the Fund plus interest negotiated on the basis of current short-term rates, which may be more or less than the rate on the underlying portfolio securities. The seller under a repurchase agreement is required to maintain the value of the collateral held pursuant to the agreement at a market value equal to or greater than the repurchase price (including accrued interest). Collateral subject to repurchase agreements is held by the Fund’s custodian or another qualified sub-custodian or in the Federal Reserve/Treasury book-entry system. If the counterparty defaults and the fair value of the collateral declines, realization of the collateral by the Fund may be delayed or limited. The Fund may transfer uninvested cash balances into a pooled cash account. These balances are invested in one or more repurchase agreements, which are fully collateralized by AA-rated Corporate Bonds with the counterparties of CS First Boston and Nomura Securities.
| (c) | Foreign Currency Transactions |
The accounting records of the Fund are maintained in U.S. dollars. Foreign currency amounts are translated into U.S. dollars at the current rate of exchange to determine the value of investments, assets and liabilities. The Fund may enter into foreign currency contracts in connection with purchases or sales of securities denominated in a foreign currency. Purchases and sales of securities, and income and expenses, are translated at the prevailing rate of exchange on the respective date of these transactions. The Fund does not isolate that portion of the results of operations resulting from changes in foreign exchange rates on investments from fluctuations arising from changes in market prices of securities held. These fluctuations are included with the net realized and unrealized gain or loss from investments and foreign currencies.
| (d) | Risks Associated with Foreign Securities and Currencies |
Investments in securities of foreign issuers carry certain risks not ordinarily associated with investments in securities of U.S. issuers. These risks include future political and economic developments, and the possible imposition of exchange controls or other foreign governmental laws and restrictions. In addition, with respect to certain countries, there is the possibility of expropriation of assets, confiscatory taxation, political or social instability, or diplomatic developments, which could adversely affect investments in those countries.
Certain countries also may impose substantial restrictions on investments in their capital markets by foreign entities, including restrictions on investments in issuers of industries deemed sensitive to relevant national interests. These factors
16
Table of Contents
GARTMORE VARIABLE INSURANCE TRUST
NOTES TO FINANCIAL STATEMENTS (Unaudited) (Continued)
June 30, 2005
may limit the investment opportunities available and result in a lack of liquidity and high price volatility with respect to securities of issuers from developing countries.
| (e) | Forward Foreign Currency Contracts |
The Fund may enter into forward foreign currency contracts in connection with planned purchases or sales of securities or to hedge the U.S. dollar value of portfolio securities denominated in a particular currency. The Fund could be exposed to risks if the counterparties to the contracts are unable to meet the terms of their contracts and from unanticipated movements in the value of a foreign currency relative to the U.S. dollar. Forward foreign currency contracts are valued at the current cost of covering these contracts, as provided by an independent pricing service approved by the Board of Trustees. The forward foreign currency contracts are adjusted by the daily exchange rate of the underlying currency and any gains or losses are recorded for financial statement purposes as unrealized gains or losses until the contract settlement date.
| (f) | Futures Contracts |
The Fund may invest in financial futures contracts (“futures contracts”) for the purpose of hedging its existing portfolio securities or securities that the Fund intends to purchase against fluctuations in value caused by changes in prevailing market interest rates or prices. Futures contracts may also be entered into for non-hedging purposes.
Upon entering into a futures contract, the Fund is required to pledge to the broker an amount of cash and/or other assets equal to a certain percentage of the contract amount (initial margin deposit). Subsequent payments, known as “variation margin,” are made each day, depending on the daily fluctuations in the fair value/market value of the underlying assets. A gain or loss equal to the daily variation margin is recognized on a daily basis. Futures contracts are valued daily at their last quoted sale price.
A “sale” of a futures contract means a contractual obligation to deliver the securities or foreign currency called for by the contract at a fixed price at a specified time in the future. A “purchase” of a futures contract means a contractual obligation to acquire the securities or foreign currency at a fixed price at a specified time in the future.
Should market conditions change unexpectedly, the Fund may not achieve the anticipated benefits of the futures contracts and may realize a loss. The use of futures transactions for hedging purposes involves the risk of imperfect correlation in movements in the price of futures contracts, interest rates, and the value of the underlying hedged assets.
| (g) | Written Options Contracts |
The Fund may write options contracts. A written option obligates the Fund to deliver (written call) or to receive (written put) a specified quantity of an underlying asset at the contract amount upon exercise by the holder of the option. The value of the option contract is recorded as a liability and unrealized gain or loss is measured by the difference between the current value and the premium received. Options traded on an exchange are valued at the last quoted sale price, or in the absence of a sale, the bid price provided by an independent pricing service approved by the Board of Trustees. Non-exchange traded options are valued using dealer supplied quotes.
| (h) | Short Sales |
The Fund is authorized to engage in short-selling of portfolio securities which obligates the Fund to replace any security that the Fund has borrowed by purchasing the security at current market value sometime in the future. The Fund will incur a loss if the price of the security increases between the date of the short sale and the date on which the Fund replaces the borrowed security. The Fund generally will realize a gain if the price of the security declines between these dates. Until the Fund replaces the borrowed security, the Fund will maintain a segregated account with cash, U.S. Government securities and/or securities held long to sufficiently cover the Fund’s short position on a daily basis. Dividends declared on securities sold short are recorded as an expense on the ex-dividend date and paid to the counterparty on the dividend pay date. The collateral for securities sold short are recorded as an expense on the ex-dividend date and paid to the counterparty on the dividend pay date. The collateral for securities sold short includes the deposits with brokers and securities held long as shown in the Statement of Investments for the Fund.
17
Table of Contents
GARTMORE VARIABLE INSURANCE TRUST
NOTES TO FINANCIAL STATEMENTS (Unaudited) (Continued)
June 30, 2005
| (i) | Security Transactions and Investment Income |
Security transactions are accounted for on the date the security is purchased or sold (“trade date”). Securities gains and losses are calculated on the identified cost basis. Interest income is recognized on the accrual basis and includes, where applicable, the amortization or accretion of premium or discount. Dividend income is recorded on the ex-dividend date.
| (j) | Securities Lending |
To generate additional income, the Fund may lend up to 33 1/3% of the Fund’s total assets pursuant to agreements, requiring that the borrower deliver cash or securities as collateral with respect to each new loan of U.S. securities, equal to at least 102% of the value of the portfolio securities loaned, and with respect to each new loan of non-U.S. securities, collateral of at least 105% of the value of the portfolio securities loaned, and thereafter requiring the borrower to mark to market the collateral on a daily basis and requiring the borrower to make up any shortfall of collateral. The Fund receives payments from borrowers equivalent to the dividends and interest that would have been earned on securities lent while simultaneously seeking to earn income on the investment of cash collateral. Collateral is marked to market daily to provide a level of collateral at least equal to the market value of securities loaned. There may be risks of delay in recovery of the securities should the borrower of the securities fail financially. Loans will be made, however, only to borrowers deemed by the Fund’s investment adviser to be of good standing and creditworthy under guidelines established by the Board of Trustees and when, in the judgment of the adviser, the consideration which can be earned currently from these securities loans justifies the attendant risks. Loans are subject to termination by the Fund or the borrower at any time, and, therefore, are not considered to be illiquid investments. JPMorgan Chase Bank serves as custodian for the securities lending program of the Fund. JPMorgan Chase Bank receives a custody fee based on the value of collateral received from borrowers.
The cash collateral received by the Fund was pooled and, at June 30, 2005, was invested in the following:
Security Type | Security Name | Market Value | Maturity Rate | Maturity Date | ||||||
| Bank Note — Floating Rate | U.S. Bank N.A. | $ | 1,998,465 | 3.12 | % | 07/05/05 | ||||
| Commercial Paper | MacQuarie Bank Ltd. | 2,996,208 | 3.25 | % | 07/01/05 | |||||
| Domestic Certificates of Deposit — Fixed | Washington Mutual Bank FA | 5,001,303 | 3.15 | % | 08/01/05 | |||||
| Funding Agreement | GE Life and Annuity | 1,000,000 | 3.32 | % | 07/14/05 | |||||
| Master Note — Floating | CDC Financial Product Inc. | 1,000,000 | 3.54 | % | 07/01/05 | |||||
| Master Note — Floating | CITIGroup Global Markets Inc. | 14,300,000 | 3.51 | % | 07/01/05 | |||||
| Medium Term Note — Floating | General Electric Capital Corp. | 3,000,512 | 3.37 | % | 09/08/05 | |||||
| Repurchase Agreements | Nomura Securities | 6,789,549 | 3.48 | % | 07/01/05 | |||||
| As | of June 30, 2005, the Fund had securities with the following market values on loan: |
Market Value of | Market Value of Collateral | ||
$34,426,179 | $ | 36,086,037 | |
| (k) | Distributions to Shareholders |
The Fund’s dividends from net investment income, if any, are declared and paid quarterly. The Fund’s distributable net realized capital gains, if any, are declared and distributed at least annually.
Dividends and distributions to shareholders are determined in accordance with federal income tax regulations, which may differ from GAAP. These “book/tax” differences are considered either permanent or temporary in nature. In accordance with the American Institute of Certified Public Accountants (“AICPA”) Statement of Position 93-2, permanent differences (i.e., reclassification of market discounts, gain/loss, paydowns, and distributions) are reclassified within the capital accounts based on their nature for federal income tax purposes; temporary differences do not require reclassification. These reclassifications have no effect upon the net asset value of the Fund. To the extent distributions exceed current and accumulated earnings and profits for federal income tax purposes, these distributions are reported as distributions of paid-in-capital.
18
Table of Contents
GARTMORE VARIABLE INSURANCE TRUST
NOTES TO FINANCIAL STATEMENTS (Unaudited) (Continued)
June 30, 2005
| (l) | Federal Income Taxes |
It is the policy of the Fund to qualify or continue to qualify as a “regulated investment company” by complying with the provisions available to certain investment companies, as defined in applicable sections of the U.S. Internal Revenue Code, and to make distributions of net investment income and net realized capital gains sufficient to relieve the Fund from all, or substantially all, federal income taxes.
As of June 30, 2005, the tax cost of securities and the breakdown of unrealized appreciation (depreciation) for the Fund is as follows:
Tax Cost of | Unrealized Appreciation | Unrealized Depreciation | Net Unrealized Appreciation (Depreciation) | |||||||
$277,803 | $ | 15,460,541 | $ | (4,784,985 | ) | $ | 10,675,556 | |||
| (m) | Allocation of Expenses, Income, and Gains and Losses |
Expenses directly attributable to the Fund are charged to the Fund. Expenses not directly attributable to the Fund are allocated proportionately among various or all funds within the Trust. The method used by the Fund for allocating income, fund level expenses, and realized and unrealized gains or losses is based on the fair value of shares outstanding relative to net assets. Under this method, each class of shares participates based on the total net asset value of that class’s shares in proportion to the total net assets of the Fund. Expenses specific to a class (such as rule 12b-1 and administrative services fees) are charged to that class.
3. Transactions with Affiliates
Under the terms of the Trust’s Investment Advisory Agreement, Gartmore Mutual Fund Capital Trust (“GMF”) manages the investment of the assets and supervises the daily business affairs of the Fund. GMF is a wholly-owned subsidiary of Gartmore Global Investments, Inc. (“GGI”), a holding company. GGI is a majority-owned subsidiary of Gartmore Global Asset Management Trust (“GGAMT”). GGAMT is a wholly-owned subsidiary of Nationwide Corporation. All of the common stock of Nationwide Corporation is held by Nationwide Mutual Insurance Company (95.2%) and Nationwide Mutual Fire Insurance Company (4.8%), each of which is a mutual company owned by its policyholders. In addition, GMF provides investment management evaluation services in initially selecting and monitoring, on an ongoing basis, the performance of the subadviser, for the Fund. The Dreyfus Corporation (the “subadviser”) manages all of the Fund’s investments and has the responsibility for making all investment decisions for the Fund. The subadviser is an affiliate of GMF and GGAMT.
Under the terms of the Investment Advisory Agreement, the Fund pays GMF an investment advisory fee based on that Fund’s average daily net assets. From such fees, pursuant to the subadvisory agreement, GMF pays fees to the subadviser. Additional information regarding investment advisory fees and subadvisory fees for GMF and the subadviser is as follows for the six months ended June 30, 2005:
| Fee Schedule | Total Fees | Fees Retained | Paid to Sub-adviser | |||
Up to $500 million | 0.75% | 0.375% | 0.375% | |||
$500 million up to $2 billion | 0.70% | 0.40% | 0.30% | |||
$2 billion or more | 0.65% | 0.35% | 0.30% |
Under the terms of a Fund Administration and Transfer Agency Agreement, Gartmore SA Capital Trust (“GSA”) provides the Fund with various administrative and accounting services, and Gartmore Investors Services, Inc. (“GISI”), an indirect subsidiary of GSA, serves as Transfer and Dividend Disbursing Agent for the Fund. The fees for the services provided under this Agreement are calculated based on the Trust’s average daily net assets according to the fee schedule below. The fees are
19
Table of Contents
GARTMORE VARIABLE INSURANCE TRUST
NOTES TO FINANCIAL STATEMENTS (Unaudited) (Continued)
June 30, 2005
then allocated proportionately among all funds within the Trust in relation to the average daily net assets of each fund and are paid to GSA. GSA pays GISI from these fees for its services.
| Combined Fee Schedule* | ||
Up to $1 billion | 0.13% | |
$1 billion and more up to $3 billion | 0.08% | |
$3 billion and more up to $8 billion | 0.05% | |
$8 billion and more up to $10 billion | 0.04% | |
$10 billion and more up to $12 billion | 0.02% | |
$12 billion or more | 0.01% | |
| * | The assets of the Gartmore GVIT Investor Destinations Aggressive Fund, the Gartmore GVIT Investor Destinations Moderately Aggressive Fund, the Gartmore GVIT Investor Destinations Moderate Fund, the Gartmore GVIT Investor Destinations Moderately Conservative Fund, and the Gartmore GVIT Investor Destinations Conservative Fund (collectively, the “Investor Destinations Funds”) are excluded from the Trust asset level amount in order to calculate this asset-based fee. The Investor Destinations Funds do not pay any part of this fee. |
Effective January 1, 2005, the fee for the fund administration and transfer agency services increased as set forth below. The fees are calculated based on the Trust’s average daily net assets according to the fee schedule below. The fees are then allocated proportionately among all funds within the Trust in relation to the average daily net assets of each fund and are paid to GSA.
| Combined Fee Schedule* | ||
Up to $1 billion | 0.15% | |
$1 billion and more up to $3 billion | 0.10% | |
$3 billion and more up to $8 billion | 0.05% | |
$8 billion and more up to $10 billion | 0.04% | |
$10 billion and more up to $12 billion | 0.02% | |
$12 billion or more | 0.01% | |
| * | The assets of each of the Investor Destinations Funds are excluded from the Trust asset level amount in order to calculate this asset-based fee. The Investor Destinations Funds do not pay any part of this fee. |
GSA and GISI have entered into agreements with BISYS Fund Services Ohio, Inc. (“BISYS”), pursuant to which BISYS provides sub-administration and sub-transfer agency services, respectively, to the Fund.
Under the terms of a Distribution Plan under Rule 12b-1 of the 1940 Act, Gartmore Distribution Services, Inc. (“GDSI”), the Fund’s Distributor, is compensated by the Fund for expenses associated with the distribution of the Class II and Class VI shares of the Fund. These fees are based on average daily net assets of Class II and Class VI shares of the Fund at an annual rate not to exceed 0.25%.
Under the terms of an Administrative Services Plan, the Fund may pay fees to servicing organizations, such as broker-dealers, including Nationwide Financial Services, and financial institutions, which agree to provide administrative support services to the shareholders of certain classes. These services include, but are not limited, to the following: establishing and maintaining shareholder accounts; processing purchase and redemption transactions; arranging bank wires; performing shareholder sub-accounting; answering inquires regarding the Fund; and other such services. These fees are based on an annual rate of up to 0.25% of the average daily net assets of Class I, Class II, Class III, and Class VI shares of the Fund and 0.20% of Class IV shares of the Fund.
4. Short-Term Trading Fees
The Fund reserves the right to assess a short-term trading fee on certain transactions out of Class III and Class VI shares that a separate account makes on behalf of a variable insurance contract owner (the “contract owner”). A separate account that redeems Class III or Class VI shares on behalf of a contract owner may be subject to a 1.00% short-term trading fee if the
20
Table of Contents
GARTMORE VARIABLE INSURANCE TRUST
NOTES TO FINANCIAL STATEMENTS (Unaudited) (Continued)
June 30, 2005
separate account held the Class III or Class VI shares on behalf of the contract owner for 60 days or less, unless an exception applies as disclosed in the prospectus. The short-term trading fee is paid directly to the Fund and is intended to offset the cost to the Fund of excess brokerage commissions and other costs associated with fluctuations in fund asset levels and cash flow caused by short-term trading. For purposes of determining whether the short-term trading fee applies, the Class III or Class VI shares that were held on behalf of the contract owner the longest will be treated as being redeemed first.
For the six months ended June 30, 2005, the Fund had no contributions to capital due to collection of redemption fees.
5. Investment Transactions
For the six months ended June 30, 2005, (excluding short-term securities) the Fund had purchases of $86,062,262 and sales of $36,981,812.
6. Portfolio Investment Risks
Credit and Market Risk. The Fund invests in emerging market instruments that are subject to certain additional credit and market risks. The yields of emerging market debt obligations reflect, among other things, perceived credit risk. The Fund’s investment in securities rated below investment grade typically involve risks not associated with higher rated securities including, among others, greater risk of not receiving timely and/or ultimate payment of interest and principal, greater market price volatility, and less liquid secondary market trading. The consequences of political, social, economic, or diplomatic changes may have disruptive effects on the market prices of emerging markets investments held by the Fund.
7. Bank Loans
The Trust has a credit agreement of $100,000,000. Borrowings under this arrangement bear interest at the Federal Funds rate plus 0.50%. The interest costs are included in custodian fees in the Statement of Operations. No compensation balances were required under the terms of the line of credit. There were no borrowings outstanding as of June 30, 2005.
8. Shareholder Meeting
A separate shareholders meeting was held on Tuesday, December 23, 2004, for the shareholders of the Trust’s predecessor pursuant to a Proxy Statement On Schedule 14A, dated October 29, 2004, and mailed to the shareholders of the Trust’s predecessor on or around November 5, 2004.
Two Proposals: The purpose of the December 23, 2004 meeting was to allow the shareholders of the Trust’s predecessor to vote on:
| i. | Proposal One: The election of the Trust’s Board of Trustees; and |
| ii. | Proposal Two: The approval of an “Agreement and Plan of Reorganization” that provided for the reorganization of the Trust from a Massachusetts business trust into a Delaware statutory trust. |
Proposal One: As set forth in the October 29, 2004 Proxy Statement, the nominees for election as Trustees of the Trust’s predecessor were: Charles E. Allen, Michael J. Baresich, Paula H.J. Cholmondeley, C. Brent DeVore, Phyllis Kay Dryden, Robert M. Duncan, Barbara L. Hennigar, Paul J. Hondros, Barbara I Jacobs, Thomas J. Kerr IV, Douglas F. Kridler, Michael D. McCarthy, Arden L. Shisler, and David C. Wetmore.
Proposal Two: As specifically set forth in the October 29, 2004 Proxy Statement, the Reorganization proposal requested the shareholders of the Trust’s predecessor to approve the proposed “Agreement and Plan of Reorganization” of the Trust’s predecessor (on behalf of each of the its funds) into a new Delaware-domiciled Trust, whereby the Funds of the new Delaware Trust would acquire all of the assets of the corresponding funds of the Trust’s predecessor subject to the liabilities, expenses, costs, charges, and reserves of the corresponding funds of the Trust’s predecessor (contingent or otherwise), in exchange for shares of the acquiring Funds to be distributed pro rata by the Trust to the holders of the shares of the funds of the Trust’s predecessor, in a complete liquidation of the Trust’s predecessor.
21
Table of Contents
GARTMORE VARIABLE INSURANCE TRUST
NOTES TO FINANCIAL STATEMENTS (Unaudited) (Continued)
June 30, 2005
Voting Results:
The shareholders of the Trust’s predecessor voted to approve both Proposal One and Proposal Two, as follows:
Proposal 1: Election of a Board of Trustees of Gartmore Variable Insurance Trust
Charles E. Allen: | ||
FOR | 2,797,230,318.955 shares (96.078%) | |
WITHHOLD | 114,195,693.660 shares (3.922%) | |
TOTAL | 2,912,726,012.615 shares (100.000%) | |
Michael J. Baresich: | ||
FOR | 2,796,135,979.559 shares (96.040%) | |
WITHHOLD | 115,290,033.056 shares (3.960%) | |
TOTAL | 2,912,726,012.615 shares (100.000%) | |
Paula H.J. Cholmondeley: | ||
FOR | 2,795,095,945.396 shares (96.004%) | |
WITHHOLD | 116,330,067.219 shares (3.996%) | |
TOTAL | 2,912,726,012.615 shares (100.000%) | |
C. Brent DeVore: | ||
FOR | 2,797,207,046.916 shares (96.077%) | |
WITHHOLD | 114,218,965.699 shares (3.923%) | |
TOTAL | 2,912,726,012.615 shares (100.000%) | |
Phyllis Kay Dryden: | ||
FOR | 2,795,587,023.994 shares (96.021%) | |
WITHHOLD | 115,838,988.621 shares (3.979%) | |
TOTAL | 2,912,726,012.615 shares (100.000%) | |
Robert M. Duncan: | ||
FOR | 2,790,191,720.503 shares (95.836%) | |
WITHHOLD | 121,234,292.112 shares (4.164%) | |
TOTAL | 2,912,726,012.615 shares (100.000%) | |
Barbara L. Hennigar: | ||
FOR | 2,792,939,848.858 shares (95.937%) | |
WITHHOLD | 118,486,163.757 shares (4.070%) | |
TOTAL | 2,912,726,012.615 shares (100.000%) | |
Paul J. Hondros: | ||
FOR | 2,797,557,404.448 shares (96.089%) | |
WITHHOLD | 113,868,608.167 shares (3.911%) | |
TOTAL | 2,912,726,012.615 shares (100.000%) | |
Barbara I. Jacobs: | ||
FOR | 2,796,306,126.654 shares (96.046%) | |
WITHHOLD | 115,119,885.961 shares (3.954%) | |
TOTAL | 2,912,726,012.615 shares (100.000%) | |
22
Table of Contents
GARTMORE VARIABLE INSURANCE TRUST
NOTES TO FINANCIAL STATEMENTS (Unaudited) (Continued)
June 30, 2005
Thomas J. Kerr IV: | ||
FOR | 2,789,755,720.087 shares (95.821%) | |
WITHHOLD | 121,670,292.528 shares (4.179%) | |
TOTAL | 2,912,726,012.615 shares (100.000%) | |
Douglas F. Kridler: | ||
FOR | 2,798,065,774.375 shares (96.106%) | |
WITHHOLD | 113,360,238.240 shares (3.894%) | |
TOTAL | 2,912,726,012.615 shares (100.000%) | |
Michael D. McCarthy: | ||
FOR | 2,797,452,613.694 shares (96.085%) | |
WITHHOLD | 113,973,395.921 shares (3.915%) | |
TOTAL | 2,912,726,012.615 shares (100.000%) | |
Arden L. Shisler: | ||
FOR | 2,796,738,454.730 shares (96.061%) | |
WITHHOLD | 114,687,557.885 shares (3.939%) | |
TOTAL | 2,912,726,012.615 shares (100.000%) | |
David C. Wetmore: | ||
FOR | 2,794,784,752.247 shares (95.994%) | |
WITHHOLD | 116,641,260.368 shares (4.006%) | |
TOTAL | 2,912,726,012.615 shares (100.000%) | |
Proposal 2: Approval of the Agreement and Plan of Reorganization of Gartmore Variable Insurance Trust
FOR | 2,561,003,822.546 shares (87.964%) | |
AGAINST | 103,593,261.010 shares (3.558%) | |
ABSTAIN | 246,828,929.059 shares (8.478%) | |
TOTAL | 2,912,726,012.615 shares (100.000%) |
23
Table of Contents
GARTMORE VARIABLE INSURANCE TRUST
Management Information (Unaudited)
June 30, 2005
Trustees who are not Interested Persons (as defined in the 1940 Act) and Officers of the Funds June 30, 2005
| Name, Address and Date of Birth | Position(s) Held with the Trust and Length of Time Served1 | Principal Occupation(s) During Past 5 Years | Number of Portfolios in the Gartmore Fund Complex Overseen by Trustee | Other Directorships Held by Trustee or Nominee2 | ||||
Charles E. Allen
c/o Gartmore Global Investments, Inc. 1200 River Road, Suite 1000 Conshohocken, PA 19428
1948 | Trustee since July 2000 | Mr. Allen is Chairman, Chief Executive Officer and President of the Graimark Realty Advisors, Inc. (real estate development, investment and asset management). | 84 | None | ||||
Paula H.J. Cholmondeley
c/o Gartmore Global Investments, Inc. 1200 River Road, Suite 1000 Conshohocken, PA 19428
1940 | Trustee since July 2000 | Ms. Cholmondeley has been the Chairman and Chief Executive Officer of the Sorrel Group, a management consulting company, since January 2004. From March 2000 through December 2003, Ms. Cholmondeley was Vice President and General Manager of Sappi Fine Paper North America. Prior thereto, Ms. Cholmondeley was Vice President and General Manager of Residential Insulation of Owens Corning. | 84 | Director of Dentsply International, Inc., Ultralife Batteries, Inc., Terex Corporation, Minerals Technology, Inc. and Albany International Corp. | ||||
C. Brent DeVore
c/o Gartmore Global Investments, Inc. 1200 River Road, Suite 1000 Conshohocken, PA 19428
1940 | Trustee since 1990 | Dr. DeVore is President of Otterbein College. | 84 | None | ||||
Phyllis K. Dryden
c/o Gartmore Global Investments, Inc. 1200 River Road, Suite 1000 Conshohocken, PA 19428
1947 | Trustee since December 2004 | Ms. Dryden was a former Managing Partner of marchFIRST, a global management consulting firm prior to 2002. | 84 | None |
24
Table of Contents
GARTMORE VARIABLE INSURANCE TRUST
Management Information (Unaudited)
June 30, 2005
| Name, Address and Date of Birth | Position(s) Held with the Trust and Length of Time Served1 | Principal Occupation(s) During Past 5 Years | Number of Portfolios in the Gartmore Fund Complex Overseen by Trustee | Other Directorships Held by Trustee or Nominee2 | ||||
Barbara L. Hennigar*
c/o Gartmore Global Investments, Inc. 1200 River Road, Suite 1000 Conshohocken, PA 19428
1935 | Trustee since July 2000 | Retired since June 2000. Prior thereto, Ms. Hennigar was the Chairman or President and Chief Executive Officer of OppenheimerFunds Services and a member of the Executive Committee of OppenheimerFunds. | 84 | None | ||||
Barbara I. Jacobs
c/o Gartmore Global Investments, Inc. 1200 River Road, Suite 1000 Conshohocken, PA 19428
1950 | Trustee since December 2004 | Ms. Jacobs has served as Chairman of the Board of Directors of KICAP Network Fund, a European (United Kingdom) hedge fund, since December 2000. Prior to 2004, Ms. Jacobs was also a Managing Director and European Portfolio Manager with CREF Investments (Teachers Insurance Annuity Association — College Retirement Equity Fund). | 84 | None | ||||
Douglas F. Kridler
c/o Gartmore Global Investments, Inc. 1200 River Road, Suite 1000 Conshohocken, PA 19428
1955 | Trustee since September 1997 | Mr. Kridler has served as the President and Chief Executive Officer of the Columbus Foundation (a Columbus, OH-based foundation which manages over 1,300 individual endowment funds) since February 2002. Mr. Kridler was the President of the Columbus Association for the Performing Arts prior thereto and Chairman of the Greater Columbus Convention and Visitors Bureau during 2000 and 2001. | 84 | None | ||||
Michael D. McCarthy
c/o Gartmore Global Investments, Inc. 1200 River Road, Suite 1000 Conshohocken, PA 19428
1947 | Trustee since December 2004 | Mr. McCarthy serves as: the Founder and Chairman of The Eureka Foundation (which sponsors and funds the “Great Museums” series on PBS); and a Partner of Pineville Properties LLC (a commercial real estate development firm). | 843 | None |
25
Table of Contents
GARTMORE VARIABLE INSURANCE TRUST
Management Information (Unaudited)
June 30, 2005
| Name, Address and Date of Birth | Position(s) Held with the Trust and Length of Time Served1 | Principal Occupation(s) During Past 5 Years | Number of Portfolios in the Gartmore Fund Complex Overseen by Trustee | Other Directorships Held by Trustee or Nominee2 | ||||
David C. Wetmore
c/o Gartmore Global Investments, Inc. 1200 River Road, Suite 1000 Conshohocken, PA 19428
1948 | Trustee since 1995 and Chairman since February 2005 | Retired. Mr. Wetmore was formerly a Managing Director of Updata Capital, an investment banking and venture capital firm. | 84 | None |
| * | Pursuant to the Trust’s mandatory retirement policy, Ms. Hennigar is expected to retire on or about January 12, 2006. |
| 1 | The term of office length is until a trustee resigns or reaches a mandatory retirement age of 70. On March 2, 2000, the Board adopted a five-year implementation period for any Trustee 65 or older as of the adoption of this policy. Pursuant to this policy, Messrs. Duncan and Kerr retired as trustees effective as of March 12, 2005. |
| 2 | Directorships held in (1) any other investment companies registered under the 1940 Act, (2) any company with a class of securities registered pursuant to Section 12 of the Securities Exchange Act of 1934, as amended (the “Exchange Act”), or (3) any company subject to the requirements of Section 15(d) of the Exchange Act. |
| 3 | Mr. McCarthy was also an Administrative Committee Member for the Alphagen Arneb Fund, LLC, The Healthcare Fund LDC, The Leaders Long-Short Fund, LLC, and The Leaders Long-Short Fund LDC, four private investment companies (hedge funds) managed by GSA. Mr. McCarthy resigned as an Administrative Committee Member effective June 30, 2005. |
Trustees and Officers who are not Interested Persons (as defined in the 1940 Act) of the Funds received aggregate compensation of $274,882 from the Trust for the Six Months Ended June 30, 2005. Additional information regarding the Trustees and Officers may be found in the Trust’s statement of additional information, which is available without charge upon request, by calling 1-800-848-0920.
26
Table of Contents
GARTMORE VARIABLE INSURANCE TRUST
Management Information (Unaudited)
June 30, 2005
Trustees who are Interested Persons (as defined in the 1940 Act) and/or Officers of the Funds June 30, 2005
| Name, Address and Age | Position(s) Held with the Trust and Length of Time Served1 | Principal Occupation(s) During Past 5 Years | Number of Portfolios in the Gartmore Fund Complex Overseen by Trustee | Other Directorships Held by Trustee2 | ||||
Paul J. Hondros
Gartmore Global Investments, Inc. 1200 River Road, Suite 1000 Conshohocken, PA 19428
1948 | Trustee since July 2000 | Mr. Hondros has been President and Chief Executive Officer of various Gartmore entities, including Gartmore Distribution Services, Inc. (“GDSI”),3 Gartmore Investor Services, Inc. (“GISI”),3 Gartmore Morley Capital Management, Inc. (“GMCM”),3 Gartmore Morley Financial Services, Inc. (“GMFS”),3 NorthPointe Capital, LLC (“NorthPointe”),3 Gartmore Global Asset Management Trust (“GGAMT”)3, Gartmore Global Investments, Inc. (“GGI”)3, Gartmore Mutual Fund Capital Trust (“GMFCT”)3 and Gartmore SA Capital Trust (“GSA”)3; and a Director of Nationwide Securities, Inc.3, as well as several entities within Nationwide Financial Services, Inc. | 844 | None | ||||
Arden L. Shisler
c/o Gartmore Global Investments, Inc. 1200 River Road, Suite 1000 Conshohocken, PA 19428
1941 | Trustee since February 2000 | Mr. Shisler has been a consultant since January 2003. Prior thereto, he was President and Chief Executive Officer of K&B Transport, Inc., a trucking firm. Since 1992, Mr. Shisler has also been Chairman of the Board for Nationwide Mutual Insurance Company3. | 84 | Director of Nationwide Financial Services, Inc. | ||||
Gerald J. Holland
Gartmore Global Investments, Inc. 1200 River Road, Suite 1000 Conshohocken, PA 19428
1951 | Treasurer since March 2001 | Mr. Holland is Senior Vice President — Operations for GGI3, GMFCT3, and GSA3. Prior to July 2000, Mr, Holland was Vice President for First Data Investor Services, an investment company service provider. | 84 | None |
27
Table of Contents
GARTMORE VARIABLE INSURANCE TRUST
Management Information (Unaudited)
June 30, 2005
| Name, Address and Age | Position(s) Held with the Trust and Length of Time Served1 | Principal Occupation(s) During Past 5 Years | Number of Portfolios in the Gartmore Fund Complex Overseen by Trustee | Other Directorships Held by Trustee2 | ||||
Michael A. Krulikowski
Gartmore Global Investments, Inc. 1200 River Road, Suite 1000 Conshohocken, PA 19428
1959 | Chief Compliance Officer since June 2004 | Since November 1999, Mr. Krulikowski has served as a Vice President and Chief Compliance Officer of GGI. Prior thereto, Mr. Krulikowski served as Chief Compliance Officer of 1717 Capital Management Company/Provident Mutual Insurance Company. | 84 | None | ||||
Eric E. Miller
Gartmore Global Investments, Inc. 1200 River Road, Suite 1000 Conshohocken, PA 19428
1953 | Secretary since December 2002 | Mr. Miller is Senior Vice President, Chief Counsel for GGI3, GMFCT3 and GSA3 since August 2002. From August 2000 to August 2002, Mr. Miller was a Partner with Stradley Ronan Stevens & Young, LLP. Prior to August 2000, Mr. Miller served as Senior Vice President and Deputy General Counsel at Delaware Investments. | 84 | None |
| 1 | The term of office length is until a trustee resigns or reaches a mandatory retirement age of 70. On March 2, 2000, the Board adopted a five-year implementation period for any Trustee 65 or older as of the adoption of this policy. Pursuant to this policy, Messrs. Duncan and Kerr retired as trustees effective as of March 12, 2005. |
| 2 | Directorships held in (1) any other investment companies registered under the 1940 Act, (2) any company with a class of securities registered pursuant to Section 12 of the Securities Exchange Act of 1934, as amended (the “Exchange Act”), or (3) any company subject to the requirements of Section 15(d) of the Exchange Act. |
| 3 | This position is held with an affiliated person or principal underwriter of the Trust. |
| 4 | Mr. Hondros was also an Administrative Committee Member for the Alphagen Arneb Fund, LLC, The Healthcare Fund LDC, The Leaders Long-Short Fund, LLC, and The Leaders Long-Short Fund LDC, four private investment companies (hedge funds) managed by GSA. Mr. Hondros resigned as Administrative Committee Member effective June 30, 2005. |
Federal law requires the Trust, each of its investment advisers and sub-advisers to adopt procedures for voting proxies (“Proxy Voting Guidelines”) and to provide a summary of those Proxy Voting Guidelines used to vote the securities held by the Funds. The Funds’ proxy voting policies and procedures are available without charge (i) upon request, by calling 1-800-848-0920, (ii) on the Fund’s website at www.gartmorefunds.com, or (iii) on the Securities and Exchange Commission’s website at www.sec.gov.
28
Table of Contents
Gartmore GVIT Investor Destinations Aggressive Fund
Semiannual Report
| | June 30, 2005 |


| Contents | ||
| 6 | Statement of Investments | |
| 7 | Statement of Assets and Liabilities | |
| 7 | Statement of Operations | |
| 8 | Statements of Changes in New Assets | |
| 9 | Financial Highlights | |
| 10 | Notes to Financial Statements | |
Commentary provided by Gartmore Global Investments, investment adviser to Gartmore Variable Insurance Trust. All opinions and estimates included in this report constitute Gartmore Global Investments’ judgment as of the date of this report and are subject to change without notice.
Statement Regarding Availability of Quarterly Portfolio Schedule.
The Gartmore Variable Insurance Trust files complete schedules of portfolio holdings for each Fund with the Securities and Exchange Commission (the “Commission”) for the first and third quarters of each fiscal year on Form N-Q. The Funds’ Forms N-Q are available on the Commission’s website at http://www.sec.gov. The Funds’ Forms N-Q may be reviewed and copied at the Commission’s Public Reference Room in Washington, DC, and information on the operation of the Public Reference Room may be obtained by calling 800-SEC-0330; and the Funds make the information on Form N-Q available to shareholders upon request without charge.
Statement Regarding Availability of Proxy Voting Record.
Information regarding how the Fund voted proxies relating to portfolio securities held during the most recent 12-month period ended June 30, 2005 is available without charge, upon request, by calling 800-848-0920, and on the Commission’s website at http://www.sec.gov.
Table of Contents
Gartmore GVIT Investor Destinations Aggressive Fund
For the semiannual period ended June 30, 2005, the Gartmore GVIT Investor Destinations Aggressive Fund returned -0.47% (Class II at NAV) versus -0.64% for its benchmark, which consists of 95% S&P 500® Index and 5% Lehman Brothers U.S. Aggregate Index. For broader comparison, the average return for the Fund’s Lipper peer category of Global Core Funds was - -0.59%.
The year began with a slide after the strong fourth quarter of 2004, with cyclical and small-capitalization stocks among the worst performers. January was characterized by mixed economic data, increasing interest rates, disappointing earnings reports and climbing oil prices. In addition, gross domestic product (GDP) growth for the fourth quarter of 2004 was released in January, and it came in weaker than expected at 3.1%, primarily as a result of the foreign trade deficit. The markets were able to reverse course in February, even as oil prices continued to climb and the productivity report showed a continued slowdown. In March, the markets resumed their downward slide due to a combination of the trade deficit, mixed economic news, high oil prices and rising interest rates.
For most of April, equity markets were dogged by continuing inflation concerns as the price of oil climbed above $57 per barrel. April closed with the announcement of one of the biggest jumps in the Consumer Price Index (CPI) in several months—the CPI had risen 0.6% in March. May featured the announcement of continued weak first quarter GDP growth of 3.1%. Despite concerns about economic deceleration, slowing profit growth, and continued high oil prices, first quarter earnings reports remained strong. June brought a slowdown in the equity market rally that had begun in May as the specter of economic deceleration dampened markets. In addition, the price of oil continued to pressure equity markets as it climbed to a record high of $60 per barrel.
As expected, short-term interest rates moved upward during the period, causing the yield curve to flatten dramatically. The Federal Reserve Board through the Federal Open Market Committee continued its “measured pace” of monetary tightening by raising the federal funds rate 25 basis points on four occasions during the reporting period; the rate rose from 2.25% to 3.25%.
The chart below illustrates how each of the Fund’s underlying funds contributed to or detracted from overall performance.
| Underlying Fund | Six-Month Return* | Target Allocation | ||
| Gartmore S&P 500 Index Fund | -0.89% | 30% | ||
| Gartmore International Index Fund | -1.34% | 30% | ||
| Gartmore Mid Cap Market Index Fund | 3.80% | 15% | ||
| J.P. Morgan Equity Index Fund | -0.91% | 10% | ||
| Gartmore Small Cap Index Fund | -1.24% | 10% | ||
| Gartmore Bond Index Fund | 2.39% | 5% | ||
| Gartmore GVIT Investor Destinations Aggressive Fund — Class II | -0.47% | 100% |
| * | Index returns represented by Institutional Share Class (except J.P. Morgan-Select). |
The Fund will continue to pursue its primary goal of maximizing total investment return by seeking growth of capital and income. The Fund will remain weighted toward stock investments while including a position in bonds, with the goal of adding income and reducing volatility.
PORTFOLIO MANAGERS: Young Chin, Co-Global Chief Investment Officer-Equities, heads the Fund’s portfolio management team and is responsible for the day-to-day management of the allocation of the Fund’s assets among the asset classes and Underlying Funds.
When discussing asset allocation theory and the three major asset classes, short-term investments typically are represented by an investment in 90-day Treasury bills. The short-term investments component of the Gartmore GVIT Investor Destinations Funds comprises an investment in one or a combination of the following: the Gartmore Morley Enhanced Income Fund (a short-term fixed-income fund), the Gartmore Money Market Fund and/or the Nationwide Contract (a fixed-interest contract issued and guaranteed by the Nationwide Life Insurance Company). While there can be no guarantee, it is believed that this strategy will provide a return in excess of the 90-day T-bill without substantially increasing risk.
The Gartmore GVIT Investor Destinations Funds are designed to provide diversification and asset allocation across several types of investments and asset classes, primarily by investing in underlying funds. Therefore, in addition to the expenses of the Gartmore GVIT Investor Destinations Funds, you are indirectly paying a proportionate share of the applicable fees and expenses of the underlying funds. International investing involves additional risks, including currency fluctuations, differences in accounting standards, political instability and foreign regulations, all of which are magnified in emerging markets. Small-company stocks have higher
1
Table of Contents
Gartmore GVIT Investor Destinations Aggressive Fund (continued)
risks than the stocks of larger, more established companies and have significant short-term price volatility.
Investing in mutual funds involves risk, including possible loss of principal.
There is no assurance that the investment objective of any fund will be achieved.
The Gartmore GVIT Investor Destinations Aggressive Fund benchmark consists of 95% S&P 500 Index and 5% Lehman Brothers U.S. Aggregate Bond Index.
Lehman Brothers U.S. Aggregate Bond Index: An unmanaged, market value-weighted index of investment-grade, fixed-rate debt issues (including government, corporate, asset-backed, and mortgage-backed securities with maturities of one year or more) that is generally representative of the bond market as a whole.
Standard & Poor’s 500 (S&P 500) Index: An unmanaged, capitalization-weighted index of 500 widely held stocks of large-cap U.S. companies that gives a broad look at how the stock prices of those companies have performed.
Lipper Analytical Services, Inc. is an industry research firm whose rankings are based on total return performance and do not reflect the effects of sales charges.
The Gartmore Variable Insurance Trust Funds are available only as sub-account investment options in certain variable insurance products. Accordingly, investors are unable to invest in shares of these funds outside of an insurance product. Performance information found herein reflects only the performance of these funds, and does not indicate the performance your sub-account may experience under your variable insurance contract. Performance returns assume reinvestment of all distributions. The investment return and principal value of an investment will fluctuate so that an investor’s shares, when redeemed, may be worth more or less than their original cost. Index performance is provided for comparison purposes only; the indexes shown are unmanaged and do not reflect any fees or expenses. Investors cannot invest directly in market indexes. To obtain performance information about the sub-account option under your insurance contract that invests in one of these funds, please contact your variable insurance carrier. PAST PERFORMANCE IS NO GUARANTEE OF FUTURE RESULTS.
Commentary provided by Gartmore Global Investments. All opinions and estimates included in this report constitute Gartmore Global Investments’ judgment as of the date of this report and are subject to change without notice.
Investors should carefully consider a fund’s investment objectives, risks, fees, charges and expenses before investing any money. To obtain this and other information on Gartmore Variable Insurance Trust, please contact your variable insurance contract provider or call 800-848-0920. Please read the Trust’s prospectus carefully before investing any money.
Gartmore Funds distributed by Gartmore Distribution Services, Inc., Member NASD. 1200 River Road, Suite 1000, Conshohocken, PA 19428.
2
Table of Contents
Fund Performance | Gartmore GVIT Investor Destinations Aggressive Fund |
| Average Annual Total Return1 |
(For Periods Ended June 30, 2005)
| Six months* | One year | Inception2 | ||||
| Class II3 | -0.47% | 9.15% | 6.15% | |||
| Class VI4 | -0.38% | 9.34% | 6.22% |
| * | Not Annualized. |
| 1 | Not subject to any sales charges. |
| 2 | Fund commenced operations on December 12, 2001. |
| 3 | Existing shares were designated Class II shares as of April 29, 2004. |
| 4 | These returns through December 31, 2003 were achieved prior to the creation of Class VI shares and include the performance of the Fund’s Class II shares. Excluding the effect of periodic fee waivers or reimbursements, such prior performance is substantially similar to what Class VI shares would have produced because Class VI shares invest in the same portfolio of securities as Class II shares and have the same expenses. Class VI shares’ returns do not reflect the short-term trading fees applicable to such shares; if these fees were deducted, the annual returns for Class VI shares earned by the variable contract owner would have been lower. |
| Performance | of a $10,000 Investment |
Investment return and principal value will fluctuate, and when redeemed, shares may be worth more or less than original cost. Past performance is no guarantee of future results and does not reflect the deduction of taxes that a shareholder would pay on fund distributions or the redemption of fund shares. Investing in mutual funds involves market risk, including loss of principal. Performance returns assume the reinvestment of all distributions.
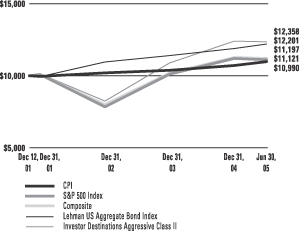
Comparative performance of $10,000 invested in Class II shares of the Gartmore GVIT Investor Destinations Aggressive Fund, Lehman Brothers U.S. Aggregate Bond Index (LB U.S. Aggregate Bond Index)(a), S&P 500 Index (S&P 500)(b), the Aggressive Composite Index (c), and the Consumer Price Index (CPI)(d) since inception. Unlike the Fund, the returns for these unmanaged indexes do not reflect any fees, expenses, or sales charges. Investors cannot invest directly in market indexes.
| (a) | LB U.S. Aggregate Bond Index is an unmanaged, market value-weighted index of investment-grade, fixed-rate debt issues (including government, corporate, asset-backed, and mortgage-backed securities with maturities of one year or more) that is generally representative of the bond market as a whole. |
| (b) | S&P 500 is an unmanaged, market capitalization-weighted index of 500 widely held stocks of large-cap U.S. companies that gives a broad look at how the stock prices of those companies have performed. |
| (c) | The Aggressive Composite Index is an unmanaged, hypothetical representation of the performance of each of the Fund’s asset classes according to their respective weightings. The Aggressive Composite is a combination of the S&P 500 (95%) and the LB U.S. Aggregate Bond (5%). |
| (d) | The CPI represents changes in prices of a basket of goods and services purchased for consumption by urban households. |
3
Table of Contents
Shareholder
Expense Example | Gartmore GVIT Investor Destinations Aggressive Fund |
As a shareholder of the Fund, you incur two types of costs: (1) transaction costs, including sales charges (loads) paid on purchase payments and redemption fees; and (2) ongoing costs, including investment advisory fees, administration fees, distribution fees and other Fund expenses. The examples below are intended to help you understand your ongoing costs (in dollars) of investing in the Fund and to compare these costs with the ongoing costs of investing in other mutual funds. Per SEC requirements, the examples assume that you had a $1,000 investment in the Class at the beginning of the reporting period, January 1, 2005, and continued to hold your shares at the end of the reporting period, June 30, 2005.
Actual Expenses
For each Class of the Fund in the table below, the first line provides information about actual account values and actual expenses. You may use the information in this line, together with the amount you invested, to estimate the expenses that you paid over the period. Simply divide your account value by $1,000 (for example, an $8,600 account value divided by $1,000 = 8.6), then multiply the result by the number in the first line of each Class under the heading entitled “Expenses Paid During Period” to estimate the expenses you paid on your account during the period.
Hypothetical Example for Comparison Purposes
The second line of each Class in the table below provides information about hypothetical account values and hypothetical expenses based on the Class’ actual expense ratio and an assumed rate of return of 5% per year before expenses, which is not the Class’ actual return. The hypothetical account values and expenses may not be used to estimate the actual ending account balance or expenses you paid for the period. You may use this information to compare the ongoing costs of investing in the Class of the Fund and other funds. To do so, compare this 5% hypothetical example with the 5% hypothetical examples that appear in the shareholder reports of the other funds.
Please note that the expenses shown in the table are meant to highlight your ongoing costs only and do not reflect any transaction costs, such as sales charges (loads) or redemption fees. Therefore, the second line for each Class in the table is useful in comparing ongoing costs only, and will not help you determine the relative total costs of owning different funds. In addition, if these transaction costs were included, your costs would have been higher. The examples also assume all dividends and distributions have been reinvested.
| Beginning Account Value, January 1, 2005 | Ending Account Value, June 30, 2005 | Expenses Paid During Period* | Annualized Expense Ratio* | ||||||||||
| Investor Destinations Aggressive Fund | |||||||||||||
Class II | Actual | $ | 1,000 | $ | 995 | $ | 2.72 | 0.55% | |||||
| Hypothetical1 | $ | 1,000 | $ | 1,022 | $ | 2.76 | 0.55% | ||||||
Class VI | Actual | $ | 1,000 | $ | 996 | $ | 2.03 | 0.41% | |||||
| Hypothetical1 | $ | 1,000 | $ | 1,023 | $ | 2.06 | 0.41% | ||||||
| * | Expenses are equal to the Fund’s annualized expense ratio multiplied by the average account value over the period multiplied by 181/365 (to reflect the one-half year period). The expense ratio presented represents a six month, annualized ratio in accordance with SEC guidelines. |
| 1 | Represents the hypothetical 5% return before expenses. |
4
Table of Contents
Portfolio Summary
June 30, 2005 | Gartmore GVIT Investor Destinations Aggressive Fund |
The SEC adopted a requirement that Funds present their portfolio holdings in a table, chart or graph format in their annual and semiannual reports to shareholders, whether or not a statement of investments is utilized. The following tables, which present portfolio holdings as a percentage of net assets, are provided in compliance with this requirement.
| Asset Allocation | ||
| Mutual Funds | 100.0% | |
| 100.0% | ||
| Asset Allocation Detail | ||
| Equity Funds | 95.0% | |
| Fixed Income Funds | 5.0% | |
| 100.0% | ||
| Top Holdings | ||
Gartmore International Index Fund, Institutional Class | 30.1% | |
| Gartmore S&P 500 Index Fund, Institutional Class | 29.9% | |
Gartmore Mid Cap Market Index Fund, Institutional Class | 15.0% | |
| Gartmore Small Cap Index Fund, Institutional Class | 10.0% | |
| JP Morgan Equity Index Fund | 10.0% | |
| Gartmore Bond Index Fund, Institutional Class | 5.0% | |
| 100.0% | ||
5
Table of Contents
GARTMORE VARIABLE INSURANCE TRUST
GARTMORE GVIT INVESTOR DESTINATIONS AGGRESSIVE FUND
Statement of Investments — June 30, 2005 (Unaudited)
| Shares | Value | ||||
| MUTUAL FUNDS (100.0%) | |||||
| Equity Funds (95.0%) | |||||
| Gartmore International Index Fund, Institutional Class (b) | 16,643,924 | $ | 134,815,784 | ||
| Gartmore Mid Cap Market Index Fund, Institutional Class (b) | 4,657,087 | 67,294,906 | |||
| Gartmore S&P 500 Index Fund, Institutional Class (b) | 13,070,470 | 134,233,729 | |||
| Gartmore Small Cap Index Fund, Institutional Class (b) | 3,782,498 | 44,860,429 | |||
| JP Morgan Equity Index Fund | 1,645,510 | 44,626,222 | |||
| 425,831,070 | |||||
| Fixed Income Funds (5.0%) | |||||
| Gartmore Bond Index Fund, Institutional Class (b) | 2,034,759 | 22,565,472 | |||
| Total Mutual Funds | 448,396,542 | ||||
| Total Investments (Cost $422,965,466) (a) — 100.0% | 448,396,542 | ||||
| Other assets in excess of liabilities — 0.0% | 72,128 | ||||
| NET ASSETS — 100.0% | $ | 448,468,670 | |||
| (a) | See notes to financial statements for tax unrealized appreciation (depreciation) of securities. |
| (b) | Investment in affiliate. |
See notes to financial statements.
6
Table of Contents
GARTMORE VARIABLE INSURANCE TRUST
GARTMORE GVIT INVESTOR DESTINATIONS AGGRESSIVE FUND
Statement of Assets and Liabilities
June 30, 2005 (Unaudited)
Assets: | |||
Investments in affiliated securities, at value (cost $422,965,466) | $ | 448,396,542 | |
Cash | 71 | ||
Interest and dividends receivable | 236,775 | ||
Prepaid expenses and other assets | 23,559 | ||
Total Assets | 448,656,947 | ||
Liabilities: | |||
Accrued expenses and other payables: | |||
Investment advisory fees | 46,785 | ||
Distribution fees | 89,972 | ||
Administrative servicing fees | 48,053 | ||
Other | 3,467 | ||
Total Liabilities | 188,277 | ||
Net Assets | $ | 448,468,670 | |
Represented by: | |||
Capital | $ | 419,845,154 | |
Accumulated net investment income (loss) | 136,224 | ||
Accumulated net realized gain (losses) from investment transactions | 3,056,216 | ||
Net unrealized appreciation (depreciation) on investments | 25,431,076 | ||
Net Assets | $ | 448,468,670 | |
Net Assets: | |||
Class II Shares | $ | 447,036,333 | |
Class VI Shares | 1,432,337 | ||
Total | $ | 448,468,670 | |
Shares outstanding (unlimited number of shares authorized): | |||
Class II Shares | 39,616,732 | ||
Class VI Shares | 127,004 | ||
Total | 39,743,736 | ||
Net asset value and offering price per share:* | |||
Class II Shares | $ | 11.28 | |
Class VI Shares | $ | 11.28 |
| * | Not subject to a front-end sales charge. |
For the Six Months Ended June 30, 2005 (Unaudited)
Investment Income: | ||||
Interest income | $ | 35 | ||
Dividend income from affiliates | 4,145,106 | |||
Total Income | 4,145,141 | |||
Expenses: | ||||
Investment advisory fees | 246,663 | |||
Distribution Fees Class II | 473,192 | |||
Distribution Fees Class VI | 1,165 | |||
Administrative servicing fees Class II Shares | 275,261 | |||
Other** | 54,981 | |||
Total Expenses | 1,051,262 | |||
Net Investment Income (Loss) | 3,093,879 | |||
REALIZED/UNREALIZED GAINS (LOSSES) ON INVESTMENTS: | ||||
Net realized gains (losses) on investment transactions | 3,079,395 | |||
Net change in unrealized appreciation/depreciation on investments | (6,258,767 | ) | ||
Net realized/unrealized gains (losses) on investments | (3,179,372 | ) | ||
CHANGE IN NET ASSETS RESULTING FROM OPERATIONS | $ | (85,493 | ) | |
| ** | Other expenses may include the following fees: audit, custody, insurance, legal, printing, trustee, and out-of-pocket expenses. |
See notes to financial statements.
7
Table of Contents
GARTMORE VARIABLE INSURANCE TRUST
GARTMORE GVIT INVESTOR DESTINATIONS AGGRESSIVE FUND
Statement of Changes in Net Assets
| Six Months Ended June 30, 2005 | Year Ended December 31, 2004 | |||||||
| (Unaudited) | ||||||||
From Investment Activities: | ||||||||
Operations: | ||||||||
Net investment income (loss) | $ | 3,093,879 | $ | 4,294,188 | ||||
Net realized gains (losses) on investment transactions | 3,079,395 | 8,242,112 | ||||||
Net change in unrealized appreciation/depreciation on investments | (6,258,767 | ) | 20,999,025 | |||||
Change in net assets resulting from operations | (85,493 | ) | 33,535,325 | |||||
Distributions to Class II Shareholders from: | ||||||||
Net investment income | (3,106,793 | ) | (4,128,694 | )(a) | ||||
Net realized gains on investments | (3,861,098 | ) | (5,584,330 | )(a) | ||||
Distributions to Class VI Shareholders from: | ||||||||
Net investment income | (10,387 | ) | (5,161 | )(b) | ||||
Net realized gains on investments | (12,377 | ) | (5,660 | )(b) | ||||
Change in net assets from shareholder distributions | (6,990,655 | ) | (9,723,845 | ) | ||||
Change in net assets from capital transactions | 123,007,283 | 214,226,118 | ||||||
Change in net assets | 115,931,135 | 238,037,598 | ||||||
Net Assets: | ||||||||
Beginning of period | 332,537,535 | 94,499,937 | ||||||
End of period | $ | 448,468,670 | $ | 332,537,535 | ||||
CAPITAL TRANSACTIONS: | ||||||||
Class II Shares | ||||||||
Proceeds from shares issued | $ | 127,938,933 | $ | 234,106,970 | (a) | |||
Dividends reinvested | 6,967,856 | 9,712,979 | (a) | |||||
Cost of shares redeemed | (12,910,015 | ) | (30,005,562 | )(a) | ||||
| 121,996,774 | 213,814,387 | |||||||
Class VI Shares | ||||||||
Proceeds from shares issued | 1,004,530 | 425,539 | (b) | |||||
Dividends reinvested | 22,764 | 10,821 | (b) | |||||
Cost of shares redeemed | (16,785 | ) | (24,629 | )(b) | ||||
| 1,010,509 | 411,731 | |||||||
Change in net assets from capital transactions | $ | 123,007,283 | $ | 214,226,118 | ||||
SHARE TRANSACTIONS: | ||||||||
Class II Shares | ||||||||
Issued | 11,316,819 | 21,830,654 | (a) | |||||
Reinvested | 619,916 | 863,349 | (a) | |||||
Redeemed | (1,145,745 | ) | (2,872,548 | )(a) | ||||
| 10,790,990 | 19,821,455 | |||||||
Class VI Shares | ||||||||
Issued | 88,218 | 39,729 | (b) | |||||
Reinvested | 2,027 | 950 | (b) | |||||
Redeemed | (1,481 | ) | (2,439 | )(b) | ||||
| 88,764 | 38,240 | |||||||
| (a) | On April 30, 2004, the existing share Class of the Fund’s was renamed Class II Shares. |
| (b) | For the period from April 30, 2004 (commencement of operations) through December 31, 2004. |
See notes to financial statements.
8
Table of Contents
GARTMORE VARIABLE INSURANCE TRUST
Selected Data for Each Share of Capital Outstanding
Gartmore GVIT Investor Destinations Aggressive Fund
| Investment Activities | Distributions | Ratios/Supplemental Data | |||||||||||||||||||||||||||||||||||||||||
| Net Asset Value, Beginning of Period | Net Investment Income | Net Realized and Unrealized Gains (Losses) on Investments | Total from Investment Activities | Net Investment Income | Net Realized Gains | Total Distributions | Net Asset Value, End of Period | Total Return | Net Assets at End of Period (000s) | Ratio of Expenses to Average Net Assets | Ratio of Net Investment Income (Loss) to Average Net Assets | Ratio of Expenses (Prior to Reimbursements) to Average Net Assets(a) | Ratio of Net Investment Income (Loss) (Prior to Reimbursements) to Average Net Assets(a) | Portfolio Turnover(b) | |||||||||||||||||||||||||||||
Class II Shares | |||||||||||||||||||||||||||||||||||||||||||
Period Ended December 31, 2001(c) | $ | 10.00 | 0.02 | 0.11 | 0.13 | (0.02 | ) | — | (0.02 | ) | $ | 10.11 | 1.31% | (e) | $ | 506 | 0.61% | (f) | 4.36% | (f) | 24.83% | (f) | (19.86% | )(f) | 10.90% | ||||||||||||||||||
Year Ended December 31, 2002 | $ | 10.11 | 0.09 | (1.96 | ) | (1.87 | ) | (0.09 | ) | — | (0.09 | ) | $ | 8.15 | (18.50% | ) | $ | 19,493 | 0.56% | 1.41% | (g | ) | (g | ) | 111.74% | ||||||||||||||||||
Year Ended December 31, 2003 | $ | 8.15 | 0.12 | 2.46 | 2.58 | (0.12 | ) | (0.12 | ) | (0.24 | ) | $ | 10.49 | 31.87% | $ | 94,500 | 0.55% | 1.60% | (g | ) | (g | ) | 49.13% | ||||||||||||||||||||
Year Ended December 31, 2004(d) | $ | 10.49 | 0.17 | 1.28 | 1.45 | (0.17 | ) | (0.25 | ) | (0.42 | ) | $ | 11.52 | 14.03% | $ | 332,097 | 0.56% | 2.13% | (g | ) | (g | ) | 18.26% | ||||||||||||||||||||
Six Months Ended June 30, 2005 (Unaudited) | $ | 11.52 | 0.09 | (0.15 | ) | (0.06 | ) | (0.09 | ) | (0.10 | ) | (0.18 | ) | $ | 11.28 | (0.47% | )(e) | $ | 447,036 | 0.55% | (f) | 1.63% | (f) | (g | ) | (g | ) | 5.39% | |||||||||||||||
Class VI Shares | |||||||||||||||||||||||||||||||||||||||||||
Period Ended December 31, 2004(h) | $ | 10.52 | 0.17 | 1.15 | 1.32 | (0.17 | ) | (0.15 | ) | (0.32 | ) | $ | 11.52 | 12.58% | (e) | $ | 440 | 0.41% | (f) | 3.59% | (f) | (g | ) | (g | ) | 18.26% | |||||||||||||||||
Six Months Ended June 30, 2005 (Unaudited) | $ | 11.52 | 0.08 | (0.13 | ) | (0.05 | ) | (0.09 | ) | (0.10 | ) | (0.19 | ) | $ | 11.28 | (0.38% | )(e) | $ | 1,432 | 0.41% | (f) | 2.23% | (f) | (g | ) | (g | ) | 5.39% | |||||||||||||||
| (a) | During the period certain fees were waived and/or reimbursed. If such waivers/reimbursements had not occurred, the ratios would have been as indicated. |
| (b) | Portfolio turnover is calculated on the basis of the Fund as a whole without distinguishing among the classes of shares. |
| (c) | For the period from December 12, 2001 (commencement of operations) through December 31, 2001. |
| (d) | On April 30, 2004, the existing share Class of the Fund was renamed Class II Shares. |
| (e) | Not annualized. |
| (f) | Annualized. |
| (g) | There were no fee reductions during the period. |
| (h) | For the period from April 30, 2004 (commencement of operations) through December 31, 2004. |
See notes to financial statements.
9
Table of Contents
GARTMORE VARIABLE INSURANCE TRUST
NOTES TO FINANCIAL STATEMENTS (Unaudited)
June 30, 2005
1. Organization
Gartmore Variable Insurance Trust (“GVIT” or the “Trust”) is an open-end management investment company, organized under the laws of Delaware by an amended and restated Agreement and Declaration of Trust, dated October 28, 2004, as amended to date. The Trust, originally created under the laws of Massachusetts as a Massachusetts business trust pursuant to a Declaration of Trust dated, as of June 30, 1981, as subsequently amended, redomesticated as a Delaware Statutory Trust after the close of trading on April 29, 2005, and is registered under the Investment Company Act of 1940, as amended (the “1940 Act”). The redomestication is a change in statutory status and does not affect the operations of the Trust. As of June 30, 2005, the Trust had authorized an unlimited number of shares of beneficial interest (“shares”) without par value. The Trust currently offers shares to life insurance company separate accounts to fund the benefits under variable life insurance or annuity policies. To date, only the separate accounts of Nationwide Life Insurance Company and Nationwide Life and Annuity Insurance Company (collectively, “Nationwide”) have purchased shares of the Trust’s series. The Trust operates thirty-one (31) separate series, or mutual funds, each with its own investment objectives and strategies. This report contains the financial statements and financial highlights of the Gartmore GVIT Investor Destinations Aggressive Fund (the “Fund”).
The Fund is constructed as a “fund of funds,” which means that the Fund pursues its investment objective primarily by allocating the Fund’s investments among other mutual funds (the “Underlying Funds”). The Underlying Funds typically invest, either directly or indirectly, in stocks, bonds, and other securities including the Nationwide Contract. The Nationwide Contract is a fixed interest contract issued and guaranteed by Nationwide. This contract has a stable principal value and will pay the Fund a fixed rate of interest. The fixed interest rate must be at least 3.50% (on an annual basis), but may be higher and is currently adjusted on a quarterly basis. Nationwide will calculate the interest rate in the same way that it calculates guaranteed interest rates for similar contracts. Because the contract is not guaranteed by Nationwide, assuming no default, the Fund receives no more or less than the guaranteed amount and will not directly participate in the actual experience of the assets underlying the contract. Although under certain market conditions the Fund’s performance may be hurt by its investment in the Nationwide Contract, the portfolio management team believes that the relatively stable nature of the Nationwide Contract should reduce the Fund’s volatility and overall risk, especially when the bond and stock markets decline simultaneously. The Fund’s target allocation range is 0-10%.
Under the Trust’s organizational documents, the Trust’s officers and trustees are indemnified against certain liabilities arising out of the performance of their duties to the Trust. In addition, the Trust has entered into Indemnification Agreements with the Trust’s trustees and certain officers covering similar liabilities. In addition, in the normal course of business, the Trust enters into contracts with its vendors and others that provide for general indemnifications. The Trust’s maximum exposure under these arrangements is unknown, as this would involve future claims that may be made against the Trust. Based on experience, however, the Trust expects that risk of loss to be remote.
2. Summary of Significant Accounting Policies
The following is a summary of significant accounting policies followed by the Fund in the preparation of its financial statements. The policies are in conformity with accounting principles generally accepted in the United States of America (“GAAP”). The preparation of financial statements requires management to make estimates and assumptions that affect the reported amounts of assets and liabilities, the disclosure of contingent assets and liabilities at the date of the financial statements and the reported amounts of income and expenses for the period. Actual results could differ from those estimates.
| (a) | Security Valuation |
Shares of the Underlying Funds in which the Fund invests are valued at their respective net asset values as reported by the Underlying Funds. The securities in the Underlying Funds generally are valued as of the close of business of the regular session of trading on the New York Stock Exchange (usually at 4 p.m. Eastern time). The Underlying Funds generally value securities and assets at current market value. Under most circumstances, the fixed interest contract is valued at par value each day, which is deemed to be fair value. The par value is calculated each day by the summation of the following factors: prior day’s par value; prior day’s interest accrued (par multiplied by guaranteed fixed rate); and current day net purchase or redemption.
10
Table of Contents
GARTMORE VARIABLE INSURANCE TRUST
NOTES TO FINANCIAL STATEMENTS (Unaudited) (Continued)
June 30, 2005
| (b) | Repurchase Agreements |
The Fund may enter into repurchase agreements with an entity which is a member of the Federal Reserve System or which is a “primary dealer” (as designated by the Federal Reserve Bank of New York) in U.S. Government obligations. The repurchase price generally equals the price paid by the Fund plus interest negotiated on the basis of current short-term rates, which may be more or less than the rate on the underlying portfolio securities. The seller under a repurchase agreement is required to maintain the value of the collateral held pursuant to the agreement at a market value equal to or greater than the repurchase price (including accrued interest). Collateral subject to repurchase agreements is held by the Fund’s custodian or another qualified sub-custodian or in the Federal Reserve/Treasury book-entry system. If the counterparty defaults and the fair value of the collateral declines, realization of the collateral by the Fund may be delayed or limited. The Fund may transfer uninvested cash balances into a pooled cash account. These balances are invested in one or more repurchase agreements, which are fully collateralized by AA-rated Corporate Bonds with the counterparties of CS First Boston and Nomura Securities.
| (c) | Foreign Currency Transactions |
The accounting records of the Fund are maintained in U.S. dollars. Foreign currency amounts are translated into U.S. dollars at the current rate of exchange to determine the value of investments, assets and liabilities. The Fund may enter into foreign currency contracts in connection with purchases or sales of securities denominated in a foreign currency. Purchases and sales of securities, and income and expenses, are translated at the prevailing rate of exchange on the respective date of these transactions. The Fund does not isolate that portion of the results of operations resulting from changes in foreign exchange rates on investments from fluctuations arising from changes in market prices of securities held. These fluctuations are included with the net realized and unrealized gain or loss from investments and foreign currencies.
| (d) | Risks Associated with Foreign Securities and Currencies |
Investments in securities of foreign issuers carry certain risks not ordinarily associated with investments in securities of U.S. issuers. These risks include future political and economic developments, and the possible imposition of exchange controls or other foreign governmental laws and restrictions. In addition, with respect to certain countries, there is the possibility of expropriation of assets, confiscatory taxation, political or social instability, or diplomatic developments, which could adversely affect investments in those countries.
Certain countries also may impose substantial restrictions on investments in their capital markets by foreign entities, including restrictions on investments in issuers of industries deemed sensitive to relevant national interests. These factors may limit the investment opportunities available and result in a lack of liquidity and high price volatility with respect to securities of issuers from developing countries.
| (e) | Forward Foreign Currency Contracts |
The Fund may enter into forward foreign currency contracts in connection with planned purchases or sales of securities or to hedge the U.S. dollar value of portfolio securities denominated in a particular currency. The Fund could be exposed to risks if the counterparties to the contracts are unable to meet the terms of their contracts and from unanticipated movements in the value of a foreign currency relative to the U.S. dollar. Forward foreign currency contracts are valued at the current cost of covering these contracts, as provided by an independent pricing service approved by the Board of Trustees. The forward foreign currency contracts are adjusted by the daily exchange rate of the underlying currency and any gains or losses are recorded for financial statement purposes as unrealized gains or losses until the contract settlement date.
| (f) | Futures Contracts |
The Fund may invest in financial futures contracts (“futures contracts”) for the purpose of hedging its existing portfolio securities or securities that the Fund intends to purchase against fluctuations in value caused by changes in prevailing market interest rates or prices. Futures contracts may also be entered into for non-hedging purposes.
11
Table of Contents
GARTMORE VARIABLE INSURANCE TRUST
NOTES TO FINANCIAL STATEMENTS (Unaudited) (Continued)
June 30, 2005
Upon entering into a futures contract, the Fund is required to pledge to the broker an amount of cash and/or other assets equal to a certain percentage of the contract amount (initial margin deposit). Subsequent payments, known as “variation margin,” are made each day, depending on the daily fluctuations in the fair value/market value of the underlying assets. A gain or loss equal to the daily variation margin is recognized on a daily basis. Futures contracts are valued daily at their last quoted sale price.
A “sale” of a futures contract means a contractual obligation to deliver the securities or foreign currency called for by the contract at a fixed price at a specified time in the future. A “purchase” of a futures contract means a contractual obligation to acquire the securities or foreign currency at a fixed price at a specified time in the future.
Should market conditions change unexpectedly, the Fund may not achieve the anticipated benefits of the futures contracts and may realize a loss. The use of futures transactions for hedging purposes involves the risk of imperfect correlation in movements in the price of futures contracts, interest rates, and the value of the underlying hedged assets.
| (g) | Written Options Contracts |
The Fund may write options contracts. A written option obligates the Fund to deliver (written call) or to receive (written put) a specified quantity of an underlying asset at the contract amount upon exercise by the holder of the option. The value of the option contract is recorded as a liability and unrealized gain or loss is measured by the difference between the current value and the premium received. Options traded on an exchange are valued at the last quoted sale price, or in the absence of a sale, the bid price provided by an independent pricing service approved by the Board of Trustees. Non-exchange traded options are valued using dealer supplied quotes.
| (h) | Mortgage Dollar Rolls |
The Fund may enter into mortgage “dollar rolls” in which the Fund sells mortgage-backed securities for delivery in the current month and simultaneously contracts to repurchase substantially similar (same type, coupon, and maturity) securities on a specified future date. Mortgage dollar rolls are referred to as TBA’s on the Statement of Investments of the Fund. During the roll period, the Fund foregoes principal and interest paid on the mortgage-backed securities. The Fund is compensated by fee income or the difference between the current sales price and the lower forward price for the future purchase. Mortgage dollar rolls are valued at the last quoted bid price and/or by using a combination of daily quotes and matrix evaluations provided by an independent pricing service, the use of which has been approved by the Board of Trustees.
| (i) | Short Sales |
The Fund is authorized to engage in short-selling of portfolio securities which obligates the Fund to replace any security that the Fund has borrowed by purchasing the security at current market value sometime in the future. The Fund will incur a loss if the price of the security increases between the date of the short sale and the date on which the Fund replaces the borrowed security. The Fund generally will realize a gain if the price of the security declines between these dates. Until the Fund replaces the borrowed security, the Fund will maintain a segregated account with cash, U.S. Government securities and/or securities held long to sufficiently cover the Fund’s short position on a daily basis. Dividends declared on securities sold short are recorded as an expense on the ex-dividend date and paid to the counterparty on the dividend pay date. The collateral for securities sold short are recorded as an expense on the ex-dividend date and paid to the counterparty on the dividend pay date. The collateral for securities sold short includes the deposits with brokers and securities held long as shown in the Statement of Investments for the Fund.
| (j) | Security Transactions and Investment Income |
Security transactions are accounted for on the date the security is purchased or sold (“trade date”). Securities gains and losses are calculated on the identified cost basis. Interest income is recognized on the accrual basis and includes, where applicable, the amortization or accretion of premium or discount. Dividend income is recorded on the ex-dividend date.
12
Table of Contents
GARTMORE VARIABLE INSURANCE TRUST
NOTES TO FINANCIAL STATEMENTS (Unaudited) (Continued)
June 30, 2005
| (k) | Distributions to Shareholders |
The Fund’s dividends from net investment income, if any, are declared and paid quarterly. The Fund’s distributable net realized capital gains, if any, are declared and distributed at least annually.
Dividends and distributions to shareholders are determined in accordance with federal income tax regulations, which may differ from GAAP. These “book/tax” differences are considered either permanent or temporary in nature. In accordance with the American Institute of Certified Public Accountants (“AICPA”) Statement of Position 93-2, permanent differences (i.e., reclassification of market discounts, gain/loss, paydowns, and distributions) are reclassified within the capital accounts based on their nature for federal income tax purposes; temporary differences do not require reclassification. These reclassifications have no effect upon the net asset value of the Fund. To the extent distributions exceed current and accumulated earnings and profits for federal income tax purposes, these distributions are reported as distributions of paid-in-capital.
| (l) | Federal Income Taxes |
It is the policy of the Fund to qualify or continue to qualify as a “regulated investment company” by complying with the provisions available to certain investment companies, as defined in applicable sections of the U.S. Internal Revenue Code, and to make distributions of net investment income and net realized capital gains sufficient to relieve the Fund from all, or substantially all, federal income taxes.
As of June 30, 2005, the tax cost of securities and the breakdown of unrealized appreciation (depreciation) for the Fund is as follows:
Tax Cost | Unrealized Appreciation | Unrealized Depreciation | Net Unrealized Appreciation (Depreciation) | |||||||||
$28,009 | $25,403,067 | $— | $25,403,067 | |||||||||
| (m) | Allocation of Expenses, Income, and Gains and Losses |
Expenses directly attributable to the Fund are charged to the Fund. Expenses not directly attributable to the Fund are allocated proportionately among various or all funds within the Trust. The method used by the Fund for allocating income, fund level expenses, and realized and unrealized gains or losses is based on the fair value of shares outstanding relative to net assets. Under this method, each class of shares participates based on the total net asset value of that class’s shares in proportion to the total net assets of the Fund. Expenses specific to a class (such as rule 12b-1 and administrative services fees) are charged to that class.
3. Transactions with Affiliates
Under the terms of the Trust’s Investment Advisory Agreement, Gartmore Mutual Fund Capital Trust (“GMF”) manages the investment of the assets and supervises the daily business affairs of the Fund. GMF is a wholly-owned subsidiary of Gartmore Global Investments, Inc. (“GGI”), a holding company. GGI is a majority-owned subsidiary of Gartmore Global Asset Management Trust (“GGAMT”). GGAMT is a wholly-owned subsidiary of Nationwide Corporation. All of the common stock of Nationwide Corporation is held by Nationwide Mutual Insurance Company (95.2%) and Nationwide Mutual Fire Insurance Company (4.8%), each of which is a mutual company owned by its policyholders.
Under the terms of the Investment Advisory Agreement, the Fund pays GMF an investment advisory fee of 0.13% based on the Fund’s average daily net assets.
Gartmore SA Capital Trust (“GSA”) provides the Fund with various administrative and accounting services, and Gartmore Investors Services, Inc. (“GISI”), an indirect subsidiary of GSA, serves as Transfer and Dividend Disbursing Agent for the Fund. GSA and GISI have entered into agreements with BISYS Fund Services Ohio, Inc. (“BISYS”), pursuant to which BISYS provides sub-administration and sub-transfer agency services, respectively, to the Fund.
13
Table of Contents
GARTMORE VARIABLE INSURANCE TRUST
NOTES TO FINANCIAL STATEMENTS (Unaudited) (Continued)
June 30, 2005
Under the terms of a Distribution Plan under Rule 12b-1 of the 1940 Act, Gartmore Distribution Services, Inc. (“GDSI”), the Funds’ Distributor, is compensated by the Funds for expenses associated with the distribution of the shares of the Funds. These fees are based on average daily net assets of each class of shares of the Fund at an annual rate not to exceed 0.25%.
Under the terms of an Administrative Services Plan, the Fund may pay fees to servicing organizations, such as broker-dealers, including Nationwide Financial Services, and financial institutions, which agree to provide administrative support services to the shareholders of the Fund. These services include, but are not limited, to the following: establishing and maintaining shareholder accounts; processing purchase and redemption transactions; arranging bank wires; performing shareholder sub-accounting; answering inquires regarding the Fund; and other such services. These fees are based on an annual rate of up to 0.25% of the average daily net assets of each class of shares of the Fund.
Because the Fund invests primarily in other Gartmore Funds, the Fund is a shareholder of those Underlying Funds. The Underlying Funds and the Nationwide Contract do not charge the Fund any sales charge for buying or selling shares. However, the Fund indireclty pays a portion of the operating expenses, including management fees of the Underlying Funds and short-term investments the Fund holds. These expenses are deducted from the Underlying Funds before their share prices are calculated and are in addition to the fees and expenses of the Fund. Actual indirect expenses vary depending on how the Fund’s assets are spread among the underlying investments.
4. Short-Term Trading Fees
The Fund reserves the right to assess a short-term trading fee on certain transactions out of Class VI shares that a separate account makes on behalf of a variable insurance contract owner (the “contract owner”). A separate account that redeems Class VI shares on behalf of a contract owner may be subject to a 1.00% short-term trading fee if the separate account held the Class VI shares on behalf of the contract owner for 60 days or less, unless an exception applies as disclosed in the prospectus. The short-term trading fee is paid directly to the Fund and is intended to offset the cost to the Fund of excess brokerage commissions and other costs associated with fluctuations in fund asset levels and cash flow caused by short-term trading. For purposes of determining whether the short-term trading fee applies, the Class VI shares that were held on behalf of the contract owner the longest will be treated as being redeemed first.
For the six months ended June 30, 2005, the Fund had no contributions to capital due to collection of redemption fees.
5. Investment Transactions
For the six months ended June 30, 2005, (excluding short-term securities) the Fund had purchases of $139,844,149 and sales of $20,673,216.
6. Bank Loans
The Trust has a credit agreement of $100,000,000. Borrowings under this arrangement bear interest at the Federal Funds rate plus 0.50%. The interest costs are included in custodian fees in the Statement of Operations. No compensation balances were required under the terms of the line of credit. There were no borrowings outstanding as of June 30, 2005.
7. Shareholder Meeting
A separate shareholders meeting was held on Tuesday, December 23, 2004, for the shareholders of the Trust’s predecessor pursuant to a Proxy Statement On Schedule 14A, dated October 29, 2004, and mailed to the shareholders of the Trust’s predecessor on or around November 5, 2004.
Two Proposals: The purpose of the December 23, 2004 meeting was to allow the shareholders of the Trust’s predecessor to vote on:
| i. | Proposal One: The election of the Trust’s Board of Trustees; and |
| ii. | Proposal Two: The approval of an “Agreement and Plan of Reorganization” that provided for the reorganization of the Trust from a Massachusetts business trust into a Delaware statutory trust. |
14
Table of Contents
GARTMORE VARIABLE INSURANCE TRUST
NOTES TO FINANCIAL STATEMENTS (Unaudited) (Continued)
June 30, 2005
Proposal One: As set forth in the October 29, 2004 Proxy Statement, the nominees for election as Trustees of the Trust’s predecessor were: Charles E. Allen, Michael J. Baresich, Paula H.J. Cholmondeley, C. Brent DeVore, Phyllis Kay Dryden, Robert M. Duncan, Barbara L. Hennigar, Paul J. Hondros, Barbara I Jacobs, Thomas J. Kerr IV, Douglas F. Kridler, Michael D. McCarthy, Arden L. Shisler, and David C. Wetmore.
Proposal Two: As specifically set forth in the October 29, 2004 Proxy Statement, the Reorganization proposal requested the shareholders of the Trust’s predecessor to approve the proposed “Agreement and Plan of Reorganization” of the Trust’s predecessor (on behalf of each of the its funds) into a new Delaware-domiciled Trust, whereby the Funds of the new Delaware Trust would acquire all of the assets of the corresponding funds of the Trust’s predecessor subject to the liabilities, expenses, costs, charges, and reserves of the corresponding funds of the Trust’s predecessor (contingent or otherwise), in exchange for shares of the acquiring Funds to be distributed pro rata by the Trust to the holders of the shares of the funds of the Trust’s predecessor, in a complete liquidation of the Trust’s predecessor.
Voting Results:
The shareholders of the Trust’s predecessor voted to approve both Proposal One and Proposal Two, as follows:
Proposal 1: Election of a Board of Trustees of Gartmore Variable Insurance Trust
Charles E. Allen: | ||
FOR | 2,797,230,318.955 shares (96.078%) | |
WITHHOLD | 114,195,693.660 shares (3.922%) | |
TOTAL | 2,912,726,012.615 shares (100.000%) | |
Michael J. Baresich: | ||
FOR | 2,796,135,979.559 shares (96.040%) | |
WITHHOLD | 115,290,033.056 shares (3.960%) | |
TOTAL | 2,912,726,012.615 shares (100.000%) | |
Paula H.J. Cholmondeley: | ||
FOR | 2,795,095,945.396 shares (96.004%) | |
WITHHOLD | 116,330,067.219 shares (3.996%) | |
TOTAL | 2,912,726,012.615 shares (100.000%) | |
C. Brent DeVore: | ||
FOR | 2,797,207,046.916 shares (96.077%) | |
WITHHOLD | 114,218,965.699 shares (3.923%) | |
TOTAL | 2,912,726,012.615 shares (100.000%) | |
Phyllis Kay Dryden: | ||
FOR | 2,795,587,023.994 shares (96.021%) | |
WITHHOLD | 115,838,988.621 shares (3.979%) | |
TOTAL | 2,912,726,012.615 shares (100.000%) | |
Robert M. Duncan: | ||
FOR | 2,790,191,720.503 shares (95.836%) | |
WITHHOLD | 121,234,292.112 shares (4.164%) | |
TOTAL | 2,912,726,012.615 shares (100.000%) | |
15
Table of Contents
GARTMORE VARIABLE INSURANCE TRUST
NOTES TO FINANCIAL STATEMENTS (Unaudited) (Continued)
June 30, 2005
Barbara L. Hennigar: | ||
FOR | 2,792,939,848.858 shares (95.937%) | |
WITHHOLD | 118,486,163.757 shares (4.070%) | |
TOTAL | 2,912,726,012.615 shares (100.000%) | |
Paul J. Hondros: | ||
FOR | 2,797,557,404.448 shares (96.089%) | |
WITHHOLD | 113,868,608.167 shares (3.911%) | |
TOTAL | 2,912,726,012.615 shares (100.000%) | |
Barbara I. Jacobs: | ||
FOR | 2,796,306,126.654 shares (96.046%) | |
WITHHOLD | 115,119,885.961 shares (3.954%) | |
TOTAL | 2,912,726,012.615 shares (100.000%) | |
Thomas J. Kerr IV: | ||
FOR | 2,789,755,720.087 shares (95.821%) | |
WITHHOLD | 121,670,292.528 shares (4.179%) | |
TOTAL | 2,912,726,012.615 shares (100.000%) | |
Douglas F. Kridler: | ||
FOR | 2,798,065,774.375 shares (96.106%) | |
WITHHOLD | 113,360,238.240 shares (3.894%) | |
TOTAL | 2,912,726,012.615 shares (100.000%) | |
Michael D. McCarthy: | ||
FOR | 2,797,452,613.694 shares (96.085%) | |
WITHHOLD | 113,973,395.921 shares (3.915%) | |
TOTAL | 2,912,726,012.615 shares (100.000%) | |
Arden L. Shisler: | ||
FOR | 2,796,738,454.730 shares (96.061%) | |
WITHHOLD | 114,687,557.885 shares (3.939%) | |
TOTAL | 2,912,726,012.615 shares (100.000%) | |
David C. Wetmore: | ||
FOR | 2,794,784,752.247 shares (95.994%) | |
WITHHOLD | 116,641,260.368 shares (4.006%) | |
TOTAL | 2,912,726,012.615 shares (100.000%) | |
Proposal 2: Approval of the Agreement and Plan of Reorganization of Gartmore Variable Insurance Trust
FOR | 2,561,003,822.546 shares (87.964%) | |
AGAINST | 103,593,261.010 shares (3.558%) | |
ABSTAIN | 246,828,929.059 shares (8.478%) | |
TOTAL | 2,912,726,012.615 shares (100.000%) | |
16
Table of Contents
GARTMORE VARIABLE INSURANCE TRUST
Management Information (Unaudited)
June 30, 2005
Trustees who are not Interested Persons (as defined in the 1940 Act) and Officers of the Funds June 30, 2005
| Name, Address and Date of Birth | Position(s) Held with the Trust and Length of Time Served1 | Principal Occupation(s) During Past 5 Years | Number of Portfolios in the Gartmore Fund Complex Overseen by Trustee | Other Directorships Held by Trustee or Nominee2 | ||||
Charles E. Allen
c/o Gartmore Global Investments, Inc. 1200 River Road, Suite 1000 Conshohocken, PA 19428
1948 | Trustee since July 2000 | Mr. Allen is Chairman, Chief Executive Officer and President of the Graimark Realty Advisors, Inc. (real estate development, investment and asset management). | 84 | None | ||||
Paula H.J. Cholmondeley
c/o Gartmore Global Investments, Inc. 1200 River Road, Suite 1000 Conshohocken, PA 19428
1940 | Trustee since July 2000 | Ms. Cholmondeley has been the Chairman and Chief Executive Officer of the Sorrel Group, a management consulting company, since January 2004. From March 2000 through December 2003, Ms. Cholmondeley was Vice President and General Manager of Sappi Fine Paper North America. Prior thereto, Ms. Cholmondeley was Vice President and General Manager of Residential Insulation of Owens Corning. | 84 | Director of Dentsply International, Inc., Ultralife Batteries, Inc., Terex Corporation, Minerals Technology, Inc. and Albany International Corp. | ||||
C. Brent DeVore
c/o Gartmore Global Investments, Inc. 1200 River Road, Suite 1000 Conshohocken, PA 19428
1940 | Trustee since 1990 | Dr. DeVore is President of Otterbein College. | 84 | None | ||||
Phyllis K. Dryden
c/o Gartmore Global Investments, Inc. 1200 River Road, Suite 1000 Conshohocken, PA 19428
1947 | Trustee since December 2004 | Ms. Dryden was a former Managing Partner of marchFIRST, a global management consulting firm prior to 2002. | 84 | None |
17
Table of Contents
GARTMORE VARIABLE INSURANCE TRUST
Management Information (Unaudited)
June 30, 2005
| Name, Address and Date of Birth | Position(s) Held with the Trust and Length of Time Served1 | Principal Occupation(s) During Past 5 Years | Number of Portfolios in the Gartmore Fund Complex Overseen by Trustee | Other Directorships Held by Trustee or Nominee2 | ||||
Barbara L. Hennigar*
c/o Gartmore Global Investments, Inc. 1200 River Road, Suite 1000 Conshohocken, PA 19428
1935 | Trustee since July 2000 | Retired since June 2000. Prior thereto, Ms. Hennigar was the Chairman or President and Chief Executive Officer of OppenheimerFunds Services and a member of the Executive Committee of OppenheimerFunds. | 84 | None | ||||
Barbara I. Jacobs
c/o Gartmore Global Investments, Inc. 1200 River Road, Suite 1000 Conshohocken, PA 19428
1950 | Trustee since December 2004 | Ms. Jacobs has served as Chairman of the Board of Directors of KICAP Network Fund, a European (United Kingdom) hedge fund, since December 2000. Prior to 2004, Ms. Jacobs was also a Managing Director and European Portfolio Manager with CREF Investments (Teachers Insurance Annuity Association — College Retirement Equity Fund). | 84 | None | ||||
Douglas F. Kridler
c/o Gartmore Global Investments, Inc. 1200 River Road, Suite 1000 Conshohocken, PA 19428
1955 | Trustee since September 1997 | Mr. Kridler has served as the President and Chief Executive Officer of the Columbus Foundation (a Columbus, OH-based foundation which manages over 1,300 individual endowment funds) since February 2002. Mr. Kridler was the President of the Columbus Association for the Performing Arts prior thereto and Chairman of the Greater Columbus Convention and Visitors Bureau during 2000 and 2001. | 84 | None | ||||
Michael D. McCarthy
c/o Gartmore Global Investments, Inc. 1200 River Road, Suite 1000 Conshohocken, PA 19428
1947 | Trustee since December 2004 | Mr. McCarthy serves as: the Founder and Chairman of The Eureka Foundation (which sponsors and funds the “Great Museums” series on PBS); and a Partner of Pineville Properties LLC (a commercial real estate development firm). | 843 | None |
18
Table of Contents
GARTMORE VARIABLE INSURANCE TRUST
Management Information (Unaudited)
June 30, 2005
| Name, Address and Date of Birth | Position(s) Held with the Trust and Length of Time Served1 | Principal Occupation(s) During Past 5 Years | Number of Portfolios in the Gartmore Fund Complex Overseen by Trustee | Other Directorships Held by Trustee or Nominee2 | ||||
David C. Wetmore
c/o Gartmore Global Investments, Inc. 1200 River Road, Suite 1000 Conshohocken, PA 19428
1948 | Trustee since 1995 and Chairman since February 2005 | Retired. Mr. Wetmore was formerly a Managing Director of Updata Capital, an investment banking and venture capital firm. | 84 | None |
| * | Pursuant to the Trust’s mandatory retirement policy, Ms. Hennigar is expected to retire on or about January 12, 2006. |
| 1 | The term of office length is until a trustee resigns or reaches a mandatory retirement age of 70. On March 2, 2000, the Board adopted a five-year implementation period for any Trustee 65 or older as of the adoption of this policy. Pursuant to this policy, Messrs. Duncan and Kerr retired as trustees effective as of March 12, 2005. |
| 2 | Directorships held in (1) any other investment companies registered under the 1940 Act, (2) any company with a class of securities registered pursuant to Section 12 of the Securities Exchange Act of 1934, as amended (the “Exchange Act”), or (3) any company subject to the requirements of Section 15(d) of the Exchange Act. |
| 3 | Mr. McCarthy was also an Administrative Committee Member for the Alphagen Arneb Fund, LLC, The Healthcare Fund LDC, The Leaders Long-Short Fund, LLC, and The Leaders Long-Short Fund LDC, four private investment companies (hedge funds) managed by GSA. Mr. McCarthy resigned as an Administrative Committee Member effective June 30, 2005. |
Trustees and Officers who are not Interested Persons (as defined in the 1940 Act) of the Funds received aggregate compensation of $274,882 from the Trust for the Six Months Ended June 30, 2005. Additional information regarding the Trustees and Officers may be found in the Trust’s statement of additional information, which is available without charge upon request, by calling 1-800-848-0920.
19
Table of Contents
GARTMORE VARIABLE INSURANCE TRUST
Management Information (Unaudited)
June 30, 2005
Trustees who are Interested Persons (as defined in the 1940 Act) and/or Officers of the Funds June 30, 2005
| Name, Address and Age | Position(s) Held with the Trust and Length of Time Served1 | Principal Occupation(s) During Past 5 Years | Number of Portfolios in the Gartmore Fund Complex Overseen by Trustee | Other Directorships Held by Trustee2 | ||||
Paul J. Hondros
Gartmore Global Investments, Inc. 1200 River Road, Suite 1000 Conshohocken, PA 19428
1948 | Trustee since July 2000 | Mr. Hondros has been President and Chief Executive Officer of various Gartmore entities, including Gartmore Distribution Services, Inc. (“GDSI”),3 Gartmore Investor Services, Inc. (“GISI”),3 Gartmore Morley Capital Management, Inc. (“GMCM”),3 Gartmore Morley Financial Services, Inc. (“GMFS”),3 NorthPointe Capital, LLC (“NorthPointe”),3 Gartmore Global Asset Management Trust (“GGAMT”)3, Gartmore Global Investments, Inc. (“GGI”)3, Gartmore Mutual Fund Capital Trust (“GMFCT”)3 and Gartmore SA Capital Trust (“GSA”)3; and a Director of Nationwide Securities, Inc.3, as well as several entities within Nationwide Financial Services, Inc. | 844 | None | ||||
Arden L. Shisler
c/o Gartmore Global Investments, Inc. 1200 River Road, Suite 1000 Conshohocken, PA 19428
1941 | Trustee since February 2000 | Mr. Shisler has been a consultant since January 2003. Prior thereto, he was President and Chief Executive Officer of K&B Transport, Inc., a trucking firm. Since 1992, Mr. Shisler has also been Chairman of the Board for Nationwide Mutual Insurance Company3. | 84 | Director of Nationwide Financial Services, Inc. | ||||
Gerald J. Holland Gartmore Global Investments, Inc. 1200 River Road, Suite 1000 Conshohocken, PA 19428 1951 | Treasurer since March 2001 | Mr. Holland is Senior Vice President – Operations for GGI3, GMFCT3 , and GSA3. Prior to July 2000, Mr, Holland was Vice President for First Data Investor Services, an investment company service provider. | 84 | None |
20
Table of Contents
GARTMORE VARIABLE INSURANCE TRUST
Management Information (Unaudited)
June 30, 2005
| Name, Address and Age | Position(s) Held with the Trust and Length of Time Served1 | Principal Occupation(s) During Past 5 Years | Number of Portfolios in the Gartmore Fund Complex Overseen by Trustee | Other Directorships Held by Trustee2 | ||||
Michael A. Krulikowski
Gartmore Global Investments, Inc. 1200 River Road, Suite 1000 Conshohocken, PA 19428
1959 | Chief Compliance Officer since June 2004 | Since November 1999, Mr. Krulikowski has served as a Vice President and Chief Compliance Officer of GGI. Prior thereto, Mr. Krulikowski served as Chief Compliance Officer of 1717 Capital Management Company/Provident Mutual Insurance Company. | 84 | None | ||||
Eric E. Miller
Gartmore Global Investments, Inc. 1200 River Road, Suite 1000 Conshohocken, PA 19428
1953 | Secretary since December 2002 | Mr. Miller is Senior Vice President, Chief Counsel for GGI3, GMFCT3 and GSA3 since August 2002. From August 2000 to August 2002, Mr. Miller was a Partner with Stradley Ronan Stevens & Young, LLP. Prior to August 2000, Mr. Miller served as Senior Vice President and Deputy General Counsel at Delaware Investments. | 84 | None |
| 1 | The term of office length is until a trustee resigns or reaches a mandatory retirement age of 70. On March 2, 2000, the Board adopted a five-year implementation period for any Trustee 65 or older as of the adoption of this policy. Pursuant to this policy, Messrs. Duncan and Kerr retired as trustees effective as of March 12, 2005. |
| 2 | Directorships held in (1) any other investment companies registered under the 1940 Act, (2) any company with a class of securities registered pursuant to Section 12 of the Securities Exchange Act of 1934, as amended (the “Exchange Act”), or (3) any company subject to the requirements of Section 15(d) of the Exchange Act. |
| 3 | This position is held with an affiliated person or principal underwriter of the Trust. |
| 4 | Mr. Hondros was also an Administrative Committee Member for the Alphagen Arneb Fund, LLC, The Healthcare Fund LDC, The Leaders Long-Short Fund, LLC, and The Leaders Long-Short Fund LDC, four private investment companies (hedge funds) managed by GSA. Mr. Hondros resigned as Administrative Committee Member effective June 30, 2005. |
Federal law requires the Trust, each of its investment advisers and sub-advisers to adopt procedures for voting proxies (“Proxy Voting Guidelines”) and to provide a summary of those Proxy Voting Guidelines used to vote the securities held by the Funds. The Funds’ proxy voting policies and procedures are available without charge (i) upon request, by calling 1-800-848-0920, (ii) on the Fund’s website at www.gartmorefunds.com, or (iii) on the Securities and Exchange Commission’s website at www.sec.gov.
21
Table of Contents
Gartmore GVIT Investor Destinations Moderately Aggressive Fund
Semiannual Report
| | June 30, 2005 |
| Contents | ||
| 6 | Statement of Investments | |
| 7 | Statement of Assets and Liabilities | |
| 7 | Statement of Operations | |
| 8 | Statements of Changes in New Assets | |
| 9 | Financial Highlights | |
| 10 | Notes to Financial Statements | |
Commentary provided by Gartmore Global Investments, investment adviser to Gartmore Variable Insurance Trust. All opinions and estimates included in this report constitute Gartmore Global Investments’ judgment as of the date of this report and are subject to change without notice.
Statement Regarding Availability of Quarterly Portfolio Schedule.
The Gartmore Variable Insurance Trust files complete schedules of portfolio holdings for each Fund with the Securities and Exchange Commission (the “Commission”) for the first and third quarters of each fiscal year on Form N-Q. The Funds’ Forms N-Q are available on the Commission’s website at http://www.sec.gov. The Funds’ Forms N-Q may be reviewed and copied at the Commission’s Public Reference Room in Washington, DC, and information on the operation of the Public Reference Room may be obtained by calling 800-SEC-0330; and the Funds make the information on Form N-Q available to shareholders upon request without charge.
Statement Regarding Availability of Proxy Voting Record.
Information regarding how the Fund voted proxies relating to portfolio securities held during the most recent 12-month period ended June 30, 2005 is available without charge, upon request, by calling 800-848-0920, and on the Commission’s website at http://www.sec.gov.
Table of Contents
Gartmore GVIT Investor Destinations Moderately Aggressive Fund
For the semiannual reporting period ended June 30, 2005, the Gartmore GVIT Investor Destinations Moderately Aggressive Fund returned 0.05% (Class II at NAV) versus -0.21% for its benchmark, which consists of 80% S&P 500® Index, 15% Lehman Brothers U.S. Aggregate Index and 5% Citigroup 3-Month T-Bill Index. For broader comparison, the average return for the Fund’s Lipper peer category of Global Flexible Portfolio Funds was -0.17%.
The year began with a slide after the strong fourth quarter of 2004, with cyclical and small-capitalization stocks among the worst performers. January was characterized by mixed economic data, increasing interest rates, disappointing earnings reports and climbing oil prices. In addition, gross domestic product (GDP) growth for the fourth quarter of 2004 was released in January, and it came in weaker than expected at 3.1%, primarily as a result of the foreign trade deficit. The markets were able to reverse course in February, even as oil prices continued to climb and the productivity report showed a continued slowdown. In March, the markets resumed their downward slide due to a combination of the trade deficit, mixed economic news, high oil prices and rising interest rates.
For most of April, equity markets were dogged by continuing inflation concerns as the price of oil climbed above $57 per barrel. April closed with the announcement of one of the biggest jumps in the Consumer Price Index (CPI) in several months—the CPI had risen 0.6% in March. May featured the announcement of continued weak first quarter GDP growth of 3.1%. Despite concerns about economic deceleration, slowing profit growth, and continued high oil prices, first quarter earnings reports remained strong. June brought a slowdown in the equity market rally that had begun in May as the specter of economic deceleration dampened markets. In addition, the price of oil continued to pressure equity markets as it climbed to a record high of $60 per barrel.
As expected, short-term interest rates moved upward during the period, causing the yield curve to flatten dramatically. The Federal Reserve Board through the Federal Open Market Committee continued its “measured pace” of monetary tightening by raising the federal funds rate 25 basis points on four occasions during the reporting period; the rate rose from 2.25% to 3.25%.
The chart below illustrates how each of the Fund’s underlying funds contributed to or detracted from overall performance.
| Underlying Fund | Six-Month Return* | Target Allocation | ||
| Gartmore S&P 500 Index Fund | -0.89% | 25% | ||
| Gartmore International Index Fund | -1.34% | 25% | ||
| Gartmore Mid Cap Market Index Fund | 3.80% | 15% | ||
| Gartmore Bond Index Fund | 2.39% | 15% | ||
| J.P. Morgan Equity Index Fund | -0.91% | 10% | ||
| Gartmore Small Cap Index Fund | -1.24% | 5% | ||
| Short-Term Investments | 2.31% | 5% | ||
| Gartmore GVIT Investor Destinations Moderately Aggressive Fund — Class II | 0.05% | 100% |
| * | Index returns represented by Institutional Share Class (except J.P. Morgan-Select). |
The Fund will continue to pursue its primary goal of maximizing total investment return by seeking growth of capital and income. The Fund will remain weighted toward stock investments while including a sizable position in bonds and short-term investments, with the goal of adding income and reducing volatility.
PORTFOLIO MANAGERS: Young Chin, Co-Global Chief Investment Officer-Equities, heads the Fund’s portfolio management team and is responsible for the day-to-day management of the allocation of the Fund’s assets among the asset classes and Underlying Funds.
When discussing asset allocation theory and the three major asset classes, short-term investments typically are represented by an investment in 90-day Treasury bills. The short-term investments component of the Gartmore GVIT Investor Destinations Funds comprises an investment in one or a combination of the following: the Gartmore Morley Enhanced Income Fund (a short-term fixed-income fund), the Gartmore Money Market Fund and/or the Nationwide Contract (a fixed-interest contract issued and guaranteed by the Nationwide Life Insurance Company). While there can be no guarantee, it is believed that this strategy will provide a return in excess of the 90-day T-bill without substantially increasing risk.
The Gartmore GVIT Investor Destinations Funds are designed to provide diversification and asset allocation across several types of investments and asset classes, primarily by investing in underlying funds. Therefore, in addition to the expenses of the Gartmore GVIT Investor Destinations Funds, you are indirectly paying a proportionate share of the applicable fees and expenses of the underlying funds. International investing involves additional risks, including currency fluctuations, differences in accounting standards, political instability and foreign regulations, all of which are
1
Table of Contents
Gartmore GVIT Investor Destinations Moderately Aggressive Fund (continued)
magnified in emerging markets. Small-company stocks have higher risks than the stocks of larger, more established companies and have significant short-term price volatility.
Investing in mutual funds involves risk, including possible loss of principal.
There is no assurance that the investment objective of any fund will be achieved.
The Gartmore GVIT Investor Destinations Moderately Aggressive Fund benchmark consists of 80% S&P 500 Index, 25% Lehman Brothers U.S. Aggregate Bond Index, and 5% Citigroup 3-Month T-Bill Index.
Citigroup 3-Month T-Bill Index: An unmanaged index that is generally representative of 3-month Treasury bills; consists of an average of the last 3-month Treasury bill issues (excluding the current month-end bill).
Lehman Brothers U.S. Aggregate Bond Index: An unmanaged, market value-weighted index of investment-grade, fixed-rate debt issues (including government, corporate, asset-backed, and mortgage-backed securities with maturities of one year or more) that is generally representative of the bond market as a whole.
Standard & Poor’s 500 (S&P 500) Index: An unmanaged, capitalization-weighted index of 500 widely held stocks of large-cap U.S. companies that gives a broad look at how the stock prices of those companies have performed.
Lipper Analytical Services, Inc. is an industry research firm whose rankings are based on total return performance and do not reflect the effects of sales charges.
The Gartmore Variable Insurance Trust Funds are available only as sub-account investment options in certain variable insurance products. Accordingly, investors are unable to invest in shares of these funds outside of an insurance product. Performance information found herein reflects only the performance of these funds, and does not indicate the performance your sub-account may experience under your variable insurance contract. Performance returns assume reinvestment of all distributions. The investment return and principal value of an investment will fluctuate so that an investor’s shares, when redeemed, may be worth more or less than their original cost. Index performance is provided for comparison purposes only; the indexes shown are unmanaged and do not reflect any fees or expenses. Investors cannot invest directly in market indexes. To obtain performance information about the sub-account option under your insurance contract that invests in one of these funds, please contact your variable insurance carrier. PAST PERFORMANCE IS NO GUARANTEE OF FUTURE RESULTS.
Commentary provided by Gartmore Global Investments. All opinions and estimates included in this report constitute Gartmore Global Investments’ judgment as of the date of this report and are subject to change without notice.
Investors should carefully consider a fund’s investment objectives, risks, fees, charges and expenses before investing any money. To obtain this and other information on Gartmore Variable Insurance Trust, please contact your variable insurance contract provider or call 800-848-0920. Please read the Trust’s prospectus carefully before investing any money.
Gartmore Funds distributed by Gartmore Distribution Services, Inc., Member NASD. 1200 River Road, Suite 1000, Conshohocken, PA 19428.
2
Table of Contents
Fund Performance | Gartmore GVIT Investor Destinations Moderately Aggressive Fund |
| Average | Annual Total Return1 |
(For Periods Ended June 30, 2005)
| Six months* | One year | Inception2 | ||||
| Class II3 | 0.05% | 8.65% | 5.93% | |||
| Class VI4 | 0.04% | 8.75% | 5.95% |
| * | Not Annualized. |
| 1 | Not subject to any sales charges. |
| 2 | Fund commenced operations on December 12, 2001. |
| 3 | Existing shares were designated Class II shares as of April 29, 2004. |
| 4 | These returns through December 31, 2003 were achieved prior to the creation of Class VI shares and include the performance of the Fund’s Class II shares. Excluding the effect of periodic fee waivers or reimbursements, such prior performance is substantially similar to what Class VI shares would have produced because Class VI shares invest in the same portfolio of securities as Class II shares and have the same expenses. Class VI shares’ returns do not reflect the short-term trading fees applicable to such shares; if these fees were deducted, the annual returns for Class VI shares earned by the variable contract owner would have been lower. |
| Performance | of a $10,000 Investment |
Investment return and principal value will fluctuate, and when redeemed, shares may be worth more or less than original cost. Past performance is no guarantee of future results and does not reflect the deduction of taxes that a shareholder would pay on fund distributions or the redemption of fund shares. Investing in mutual funds involves market risk, including loss of principal. Performance returns assume the reinvestment of all distributions.
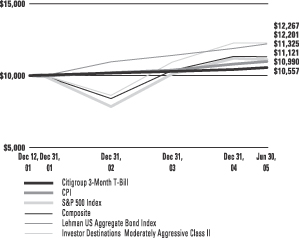
Comparative performance of $10,000 invested in Class II shares of the Gartmore GVIT Investor Destinations Moderately Aggressive Fund, Lehman Brothers Aggregate Bond Index (LB Aggregate Bond)(a), S&P 500 Index (S&P 500)(b), the Citigroup 3-Month T Bill Index(c), the Moderately Aggressive Composite Index(d), and the Consumer Price Index (CPI)(e) since inception. Unlike the Fund, the returns for these unmanaged indexes do not reflect any fees, expenses, or sales charges. Investors cannot invest directly in market indexes.
| (a) | LB U.S. Aggregate Bond Index is an unmanaged, market value-weighted index of investment-grade, fixed-rate debt issues (including government, corporate, asset-backed, and mortgage-backed securities with maturities of one year or more) that is generally representative of the bond market as a whole. |
| (b) | S&P 500 is an unmanaged, market capitalization-weighted index of 500 widely held stocks of large-cap U.S. companies that gives a broad look at how the stock prices of those companies have performed. |
| (c) | The Citigroup 3-Month T Bill Index is an average of the last 3-month treasury bill issues (excluding the current month-end bill). |
| (d) | The Moderately Aggressive Composite is an unmanaged, hypothetical representation of the performance of each of the Fund’s asset classes according to their respective weightings. The Moderately Aggressive Composite is a combination of the S&P 500 (80%), the LB Aggregate Bond (15%), and the Citigroup 3-Month T Bill Index (5%). |
| (e) | The CPI represents changes in prices of a basket of goods and services purchased for consumption by urban households. |
3
Table of Contents
Shareholder
Expense Example | Gartmore GVIT Investor Destinations Moderately Aggressive Fund |
As a shareholder of the Fund, you incur two types of costs: (1) transaction costs, including sales charges (loads) paid on purchase payments and redemption fees; and (2) ongoing costs, including investment advisory fees, administration fees, distribution fees and other Fund expenses. The examples below are intended to help you understand your ongoing costs (in dollars) of investing in the Fund and to compare these costs with the ongoing costs of investing in other mutual funds. Per SEC requirements, the examples assume that you had a $1,000 investment in the Class at the beginning of the reporting period, January 1, 2005, and continued to hold your shares at the end of the reporting period, June 30, 2005.
Actual Expenses
For each Class of the Fund in the table below, the first line provides information about actual account values and actual expenses. You may use the information in this line, together with the amount you invested, to estimate the expenses that you paid over the period. Simply divide your account value by $1,000 (for example, an $8,600 account value divided by $1,000 = 8.6), then multiply the result by the number in the first line of each Class under the heading entitled “Expenses Paid During Period” to estimate the expenses you paid on your account during the period.
Hypothetical Example for Comparison Purposes
The second line of each Class in the table below provides information about hypothetical account values and hypothetical expenses based on the Class’ actual expense ratio and an assumed rate of return of 5% per year before expenses, which is not the Class’ actual return. The hypothetical account values and expenses may not be used to estimate the actual ending account balance or expenses you paid for the period. You may use this information to compare the ongoing costs of investing in the Class of the Fund and other funds. To do so, compare this 5% hypothetical example with the 5% hypothetical examples that appear in the shareholder reports of the other funds.
Please note that the expenses shown in the table are meant to highlight your ongoing costs only and do not reflect any transaction costs, such as sales charges (loads) or redemption fees. Therefore, the second line for each Class in the table is useful in comparing ongoing costs only, and will not help you determine the relative total costs of owning different funds. In addition, if these transaction costs were included, your costs would have been higher. The examples also assume all dividends and distributions have been reinvested.
| Beginning Account Value, January 1, 2005 | Ending Account Value, June 30, 2005 | Expenses Paid During Period* | Annualized Expense Ratio* | ||||||||||
| Investor Destinations Moderately Aggressive Fund | |||||||||||||
Class II | Actual | $ | 1,000 | $ | 1,001 | $ | 2.78 | 0.56% | |||||
| Hypothetical1 | $ | 1,000 | $ | 1,022 | $ | 2.81 | 0.56% | ||||||
Class VI | Actual | $ | 1,000 | $ | 1,000 | $ | 2.03 | 0.41% | |||||
| Hypothetical1 | $ | 1,000 | $ | 1,023 | $ | 2.06 | 0.41% | ||||||
| * | Expenses are equal to the Fund’s annualized expense ratio multiplied by the average account value over the period multiplied by 181/365 (to reflect the one-half year period). The expense ratio presented represents a six month, annualized ratio in accordance with SEC guidelines. |
| 1 | Represents the hypothetical 5% return before expenses. |
4
Table of Contents
Portfolio Summary
June 30, 2005 | Gartmore GVIT Investor Destinations Moderately Aggressive Fund |
The SEC adopted a requirement that Funds present their portfolio holdings in a table, chart or graph format in their annual and semiannual reports to shareholders, whether or not a statement of investments is utilized. The following tables, which present portfolio holdings as a percentage of net assets, are provided in compliance with this requirement.
| Asset Allocation | ||
| Mutual Funds | 97.4% | |
| Fixed Contract | 2.5% | |
| Other assets in excess of liabilities | 0.1% | |
| 100.0% | ||
| Asset Allocation Detail | ||
| Equity Funds | 79.8% | |
| Fixed Income Funds | 17.6% | |
| Fixed Contract | 2.5% | |
| Other | 0.1% | |
| 100.0% | ||
| Top Holdings | ||
Gartmore International Index Fund, Institutional Class | 25.0% | |
| Gartmore S&P 500 Index Fund, Institutional Class | 24.9% | |
| Gartmore Bond Index Fund, Institutional Class | 15.1% | |
Gartmore Mid Cap Market Index Fund, Institutional Class | 15.0% | |
| JP Morgan Equity Index Fund | 9.9% | |
| Gartmore Small Cap Index Fund, Institutional Class | 5.0% | |
| Nationwide Fixed Contract, 3.50% | 2.5% | |
Gartmore Morley Enhanced Income Fund, Institutional Class | 2.5% | |
| Other Holdings | 0.1% | |
| 100.0% | ||
5
Table of Contents
GARTMORE VARIABLE INSURANCE TRUST
GARTMORE GVIT INVESTOR DESTINATIONS MODERATELY AGGRESSIVE FUND
Statement of Investments — June 30, 2005 (Unaudited)
| Shares or Principal Amount | Value | |||||
| MUTUAL FUNDS (97.4%) | ||||||
| Equity Funds (79.8%) | ||||||
| Gartmore International Index Fund, Institutional Class (b) | 29,487,649 | $ | 238,849,961 | |||
| Gartmore Mid Cap Market Index Fund, Institutional Class (b) | 9,901,022 | 143,069,767 | ||||
| Gartmore S&P 500 Index Fund, Institutional Class (b) | 23,156,645 | 237,818,748 | ||||
| Gartmore Small Cap Index Fund, Institutional Class (b) | 4,020,818 | 47,686,902 | ||||
| JP Morgan Equity Index Fund | 3,497,650 | 94,856,279 | ||||
| 762,281,657 | ||||||
| Fixed Income Funds (17.6%) | ||||||
| Gartmore Bond Index Fund, Institutional Class (b) | 12,977,762 | 143,923,384 | ||||
| Gartmore Morley Enhanced Income Fund, Institutional Class (b) | 2,625,435 | 23,943,971 | ||||
| 167,867,355 | ||||||
| Total Mutual Funds | 930,149,012 | |||||
| FIXED CONTRACT (2.5%) | ||||||
| Nationwide Fixed Contract, 3.50% (b) (c) | $ | 23,946,231 | 23,946,231 | |||
| Total Fixed Contract | 23,946,231 | |||||
| Total Investments (Cost $887,512,100) (a) — 99.9% | 954,095,243 | |||||
| Other assets in excess of liabilities — 0.1% | 565,597 | |||||
| NET ASSETS — 100.0% | $ | 954,660,840 | ||||
| (a) | See notes to financial statements for tax unrealized appreciation (depreciation) of securities. |
| (b) | Investment in affiliate. |
| (c) | The Nationwide Fixed Contract rate changes quarterly. The security is restricted and as the affiliated counterparty is required by contract to redeem within five days upon request, and it has been deemed liquid pursuant to procedures approved by the Board of Trustees in accordance with rule 144A under the Securities Act of 1933, as amended. |
See notes to financial statements.
6
Table of Contents
GARTMORE VARIABLE INSURANCE TRUST
GARTMORE GVIT INVESTOR DESTINATIONS MODERATELY AGGRESSIVE FUND
Statement of Assets and Liabilities
June 30, 2005 (Unaudited)
Assets: | |||
Investments in affiliated securities, at value (cost $887,512,100) | $ | 954,095,243 | |
Cash | 107 | ||
Interest and dividends receivable | 919,123 | ||
Prepaid expenses and other assets | 52,237 | ||
Total Assets | 955,066,710 | ||
Liabilities: | |||
Accrued expenses and other payables: | |||
Investment advisory fees | 99,946 | ||
Distribution fees | 192,207 | ||
Administrative servicing fees | 104,357 | ||
Other | 9,360 | ||
Total Liabilities | 405,870 | ||
Net Assets | $ | 954,660,840 | |
Represented by: | |||
Capital | $ | 882,993,583 | |
Accumulated net investment income (loss) | 363,741 | ||
Accumulated net realized gain (losses) from investment transactions | 4,720,373 | ||
Net unrealized appreciation (depreciation) on investments | 66,583,143 | ||
Net Assets | $ | 954,660,840 | |
Net Assets: | |||
Class II Shares | $ | 950,334,396 | |
Class VI Shares | 4,326,444 | ||
Total | $ | 954,660,840 | |
Shares outstanding (unlimited number of shares authorized): | |||
Class II Shares | 83,952,856 | ||
Class VI Shares | 382,712 | ||
Total | 84,335,568 | ||
Net asset value and offering price per share:* | |||
Class II Shares | $ | 11.32 | |
Class VI Shares | $ | 11.30 |
| * | Not subject to a front-end sales charge. |
For the Six Months Ended June 30, 2005 (Unaudited)
Investment Income: | ||||
Interest income from affiliates | $ | 354,971 | ||
Interest income | 53 | |||
Dividend income from affiliates | 9,714,477 | |||
Total Income | 10,069,501 | |||
Expenses: | ||||
Investment advisory fees | 534,177 | |||
Distribution Fees Class II | 1,023,126 | |||
Distribution Fees Class VI | 4,148 | |||
Administrative servicing fees Class II Shares | 601,805 | |||
Other** | 121,162 | |||
Total Expenses | 2,284,418 | |||
Net Investment Income (Loss) | 7,785,083 | |||
REALIZED/UNREALIZED GAINS (LOSSES) ON INVESTMENTS: | ||||
Net realized gains (losses) on investment transactions | 5,499,739 | |||
Net change in unrealized appreciation/depreciation on investments | (10,485,421 | ) | ||
Net realized/unrealized gains (losses) on investments | (4,985,682 | ) | ||
CHANGE IN NET ASSETS RESULTING FROM OPERATIONS | $ | 2,799,401 | ||
| ** | Other expenses may include the following fees: audit, custody, insurance, legal, printing, trustee, and out-of-pocket expenses. |
See notes to financial statements.
7
Table of Contents
GARTMORE VARIABLE INSURANCE TRUST
GARTMORE GVIT INVESTOR DESTINATIONS MODERATELY AGGRESSIVE FUND
Statement of Changes in Net Assets
| Six Months Ended June 30, 2005 | Year Ended December 31, 2004 | |||||||
| (Unaudited) | ||||||||
From Investment Activities: | ||||||||
Operations: | ||||||||
Net investment income (loss) | $ | 7,785,083 | $ | 10,402,110 | ||||
Net realized gains (losses) on investment transactions | 5,499,739 | 15,503,898 | ||||||
Net change in unrealized appreciation/depreciation on investments | (10,485,421 | ) | 42,316,372 | |||||
Change in net assets resulting from operations | 2,799,401 | 68,222,380 | ||||||
Distributions to Class II Shareholders from: | ||||||||
Net investment income | (7,798,156 | ) | (10,125,084 | )(a) | ||||
Net realized gains on investments | (8,532,694 | ) | (8,314,679 | )(a) | ||||
Distributions to Class VI Shareholders from: | ||||||||
Net investment income | (37,523 | ) | (28,613 | )(b) | ||||
Net realized gains on investments | (39,145 | ) | (23,581 | )(b) | ||||
Change in net assets from shareholder distributions | (16,407,518 | ) | (18,491,957 | ) | ||||
Change in net assets from capital transactions | 231,273,726 | 396,598,479 | ||||||
Change in net assets | 217,665,609 | 446,328,902 | ||||||
Net Assets: | ||||||||
Beginning of period | 736,995,231 | 290,666,329 | ||||||
End of period | $ | 954,660,840 | $ | 736,995,231 | ||||
CAPITAL TRANSACTIONS: | ||||||||
Class II Shares | ||||||||
Proceeds from shares issued | $ | 229,521,947 | $ | 398,084,101 | (a) | |||
Dividends reinvested | 16,330,796 | 18,439,685 | (a) | |||||
Cost of shares redeemed | (16,227,974 | ) | (22,518,213 | )(a) | ||||
| 229,624,769 | 394,005,573 | |||||||
Class VI Shares | ||||||||
Proceeds from shares issued | 1,867,272 | 2,680,602 | (b) | |||||
Dividends reinvested | 76,668 | 52,194 | (b) | |||||
Cost of shares redeemed | (294,983 | ) | (139,890 | )(b) | ||||
| 1,648,957 | 2,592,906 | |||||||
Change in net assets from capital transactions | $ | 231,273,726 | $ | 396,598,479 | ||||
SHARE TRANSACTIONS: | ||||||||
Class II Shares | ||||||||
Issued | 20,206,509 | 36,764,518 | (a) | |||||
Reinvested | 1,446,980 | 1,643,064 | (a) | |||||
Redeemed | (1,430,623 | ) | (2,100,549 | )(a) | ||||
| 20,222,866 | 36,307,033 | |||||||
Class VI Shares | ||||||||
Issued | 162,966 | 247,307 | (b) | |||||
Reinvested | 6,804 | 4,580 | (b) | |||||
Redeemed | (26,177 | ) | (12,768 | )(b) | ||||
| 143,593 | 239,119 | |||||||
| (a) | On April 30, 2004, the existing share Class of the Fund’s was renamed Class II Shares. |
| (b) | For the period from April 30, 2004 (commencement of operations) through December 31, 2004. |
See notes to financial statements.
8
Table of Contents
GARTMORE GVIT INVESTOR DESTINATIONS MODERATELY AGGRESSIVE FUND
Selected Data for Each Share of Capital Outstanding
Gartmore GVIT Investor Destinations Moderately Aggressive Fund
| Investment Activities | Distributions | Ratios/Supplemental Data | |||||||||||||||||||||||||||||||||||||||||
| Net Asset Value, Beginning of Period | Net Investment Income | Net Realized and Unrealized Gains (Losses) on Investments | Total from Investment Activities | Net Investment Income | Net Realized Gains | Total Distributions | Net Asset Value, End of Period | Total Return | Net Assets at End of Period (000s) | Ratio of Expenses to Average Net Assets | Ratio of Net Investment Income (Loss) to Average Net Assets | Ratio of Expenses (Prior to Reimbursements) to Average Net Assets(a) | Ratio of Net Investment Income (Loss) (Prior to Reimbursements) to Average Net Assets(a) | Portfolio Turnover(b) | |||||||||||||||||||||||||||||
Class II Shares | |||||||||||||||||||||||||||||||||||||||||||
Period Ended December 31, 2001(c) | $ | 10.00 | 0.02 | 0.09 | 0.11 | (0.02 | ) | — | (0.02 | ) | $ | 10.09 | 1.12% | (e) | $ | 505 | 0.61% | (f) | 4.56% | (f) | 24.85% | (f) | (19.68% | )(f) | 11.10% | ||||||||||||||||||
Year Ended December 31, 2002 | $ | 10.09 | 0.12 | (1.59 | ) | (1.47 | ) | (0.12 | ) | (0.01 | ) | (0.13 | ) | $ | 8.49 | (14.59% | ) | $ | 71,962 | 0.56% | 1.89% | (g | ) | (g | ) | 43.38% | |||||||||||||||||
Year Ended December 31, 2003 | $ | 8.49 | 0.14 | 2.10 | 2.24 | (0.13 | ) | — | (0.13 | ) | $ | 10.60 | 26.64% | $ | 290,666 | 0.56% | 1.73% | (g | ) | (g | ) | 22.22% | |||||||||||||||||||||
Year Ended December 31, 2004(d) | $ | 10.60 | 0.19 | 1.08 | 1.27 | (0.19 | ) | (0.16 | ) | (0.35 | ) | $ | 11.52 | 12.09% | $ | 734,244 | 0.55% | 2.11% | (g | ) | (g | ) | 11.44% | ||||||||||||||||||||
Six Months Ended June 30, 2005 (Unaudited) | $ | 11.52 | 0.10 | (0.10 | ) | — | (0.10 | ) | (0.10 | ) | (0.20 | ) | $ | 11.32 | 0.05% | (e) | $ | 950,334 | 0.56% | (f) | 1.89% | (f) | (g | ) | (g | ) | 3.48% | ||||||||||||||||
Class VI Shares | |||||||||||||||||||||||||||||||||||||||||||
Period Ended December 31 2004(h) | $ | 10.63 | 0.17 | 0.98 | 1.15 | (0.17 | ) | (0.10 | ) | (0.27 | ) | $ | 11.51 | 10.92% | (e) | $ | 2,751 | 0.41% | (f) | 4.26% | (f) | (g | ) | (g | ) | 11.44% | |||||||||||||||||
Six Months Ended June 30, 2005 (Unaudited) | $ | 11.51 | 0.10 | (0.10 | ) | — | (0.11 | ) | (0.10 | ) | (0.21 | ) | $ | 11.30 | 0.04% | (e) | $ | 4,326 | 0.41% | (f) | 2.19% | (f) | (g | ) | (g | ) | 3.48% | ||||||||||||||||
| (a) | During the period certain fees were waived and/or reimbursed. If such waivers/reimbursements had not occurred, the ratios would have been as indicated. |
| (b) | Portfolio turnover is calculated on the basis of the Fund as a whole without distinguishing among the classes of shares. |
| (c) | For the period from December 12, 2001 (commencement of operations) through December 31, 2001. |
| (d) | On April 30, 2004, the existing share Class of the Fund was renamed Class II Shares. |
| (e) | Not annualized. |
| (f) | Annualized. |
| (g) | There were no fee reductions during the period. |
| (h) | For the period from April 30, 2004 (commencement of operations) through December 31, 2004. |
See notes to financial statements.
9
Table of Contents
GARTMORE VARIABLE INSURANCE TRUST
NOTES TO FINANCIAL STATEMENTS (Unaudited)
June 30, 2005
1. Organization
Gartmore Variable Insurance Trust (“GVIT” or the “Trust”) is an open-end management investment company, organized under the laws of Delaware by an amended and restated Agreement and Declaration of Trust, dated October 28, 2004, as amended to date. The Trust, originally created under the laws of Massachusetts as a Massachusetts business trust pursuant to a Declaration of Trust dated, as of June 30, 1981, as subsequently amended, redomesticated as a Delaware Statutory Trust after the close of trading on April 29, 2005, and is registered under the Investment Company Act of 1940, as amended (the “1940 Act”). The redomestication is a change in statutory status and does not affect the operations of the Trust. As of June 30, 2005, the Trust had authorized an unlimited number of shares of beneficial interest (“shares”) without par value. The Trust currently offers shares to life insurance company separate accounts to fund the benefits under variable life insurance or annuity policies. To date, only the separate accounts of Nationwide Life Insurance Company and Nationwide Life and Annuity Insurance Company (collectively, “Nationwide”) have purchased shares of the Trust’s series. The Trust operates thirty-one (31) separate series, or mutual funds, each with its own investment objectives and strategies. This report contains the financial statements and financial highlights of the Gartmore GVIT Investor Destinations Moderately Aggressive Fund (the “Fund”).
The Fund is constructed as a “fund of funds,” which means that the Fund pursues its investment objective primarily by allocating the Fund’s investments among other mutual funds (the “Underlying Funds”). The Underlying Funds typically invest, either directly or indirectly, in stocks, bonds, and other securities including the Nationwide Contract. The Nationwide Contract is a fixed interest contract issued and guaranteed by Nationwide. This contract has a stable principal value and will pay the Fund a fixed rate of interest. The fixed interest rate must be at least 3.50% (on an annual basis), but may be higher and is currently adjusted on a quarterly basis. Nationwide will calculate the interest rate in the same way that it calculates guaranteed interest rates for similar contracts. Because the contract is not guaranteed by Nationwide, assuming no default, the Fund receives no more or less than the guaranteed amount and will not directly participate in the actual experience of the assets underlying the contract. Although under certain market conditions the Fund’s performance may be hurt by its investment in the Nationwide Contract, the portfolio management team believes that the relatively stable nature of the Nationwide Contract should reduce the Fund’s volatility and overall risk, especially when the bond and stock markets decline simultaneously. The Fund’s target allocation range is 0-10%.
Under the Trust’s organizational documents, the Trust’s officers and trustees are indemnified against certain liabilities arising out of the performance of their duties to the Trust. In addition, the Trust has entered into Indemnification Agreements with the Trust’s trustees and certain officers covering similar liabilities. In addition, in the normal course of business, the Trust enters into contracts with its vendors and others that provide for general indemnifications. The Trust’s maximum exposure under these arrangements is unknown, as this would involve future claims that may be made against the Trust. Based on experience, however, the Trust expects that risk of loss to be remote.
2. Summary of Significant Accounting Policies
The following is a summary of significant accounting policies followed by the Funds in the preparation of its financial statements. The policies are in conformity with accounting principles generally accepted in the United States of America (“GAAP”). The preparation of financial statements requires management to make estimates and assumptions that affect the reported amounts of assets and liabilities, the disclosure of contingent assets and liabilities at the date of the financial statements and the reported amounts of income and expenses for the period. Actual results could differ from those estimates.
| (a) | Security Valuation |
Shares of the Underlying Funds in which the Fund invests are valued at their respective net asset values as reported by the Underlying Funds. The securities in the Underlying Funds generally are valued as of the close of business of the regular session of trading on the New York Stock Exchange (usually at 4 p.m. Eastern time). The Underlying Funds generally value securities and assets at current market value. Under most circumstances, the fixed interest contract is valued at par value each day, which is deemed to be fair value. The par value is calculated each day by the summation of the following factors: prior day’s par value; prior day’s interest accrued (par multiplied by guaranteed fixed rate); and current day net purchase or redemption.
10
Table of Contents
GARTMORE VARIABLE INSURANCE TRUST
NOTES TO FINANCIAL STATEMENTS (Unaudited) (Continued)
June 30, 2005
| (b) | Repurchase Agreements |
The Fund may enter into repurchase agreements with an entity which is a member of the Federal Reserve System or which is a “primary dealer” (as designated by the Federal Reserve Bank of New York) in U.S. Government obligations. The repurchase price generally equals the price paid by the Fund plus interest negotiated on the basis of current short-term rates, which may be more or less than the rate on the underlying portfolio securities. The seller under a repurchase agreement is required to maintain the value of the collateral held pursuant to the agreement at a market value equal to or greater than the repurchase price (including accrued interest). collateral subject to repurchase agreements is held by the Fund’s custodian or another qualified sub-custodian or in the Federal Reserve/Treasury book-entry system. If the counterparty defaults and the fair value of the collateral declines, realization of the collateral by the Fund may be delayed or limited. The Fund may transfer uninvested cash balances into a pooled cash account. These balances are invested in one or more repurchase agreements, which are fully collateralized by AA-rated Corporate Bonds with the counterparties of CS First Boston and Nomura Securities.
| (c) | Foreign Currency Transactions |
The accounting records of the Fund are maintained in U.S. dollars. Foreign currency amounts are translated into U.S. dollars at the current rate of exchange to determine the value of investments, assets and liabilities. The Fund may enter into foreign currency contracts in connection with purchases or sales of securities denominated in a foreign currency. Purchases and sales of securities, and income and expenses, are translated at the prevailing rate of exchange on the respective date of these transactions. The Fund does not isolate that portion of the results of operations resulting from changes in foreign exchange rates on investments from fluctuations arising from changes in market prices of securities held. These fluctuations are included with the net realized and unrealized gain or loss from investments and foreign currencies.
| (d) | Risks Associated with Foreign Securities and Currencies |
Investments in securities of foreign issuers carry certain risks not ordinarily associated with investments in securities of U.S. issuers. These risks include future political and economic developments, and the possible imposition of exchange controls or other foreign governmental laws and restrictions. In addition, with respect to certain countries, there is the possibility of expropriation of assets, confiscatory taxation, political or social instability, or diplomatic developments, which could adversely affect investments in those countries.
Certain countries also may impose substantial restrictions on investments in their capital markets by foreign entities, including restrictions on investments in issuers of industries deemed sensitive to relevant national interests. These factors may limit the investment opportunities available and result in a lack of liquidity and high price volatility with respect to securities of issuers from developing countries.
| (e) | Forward Foreign Currency Contracts |
The Fund may enter into forward foreign currency contracts in connection with planned purchases or sales of securities or to hedge the U.S. dollar value of portfolio securities denominated in a particular currency. The Fund could be exposed to risks if the counterparties to the contracts are unable to meet the terms of their contracts and from unanticipated movements in the value of a foreign currency relative to the U.S. dollar. Forward foreign currency contracts are valued at the current cost of covering these contracts, as provided by an independent pricing service approved by the Board of Trustees. The forward foreign currency contracts are adjusted by the daily exchange rate of the underlying currency and any gains or losses are recorded for financial statement purposes as unrealized gains or losses until the contract settlement date.
| (f) | Futures Contracts |
The Fund may invest in financial futures contracts (“futures contracts”) for the purpose of hedging its existing portfolio securities or securities that the Fund intends to purchase against fluctuations in value caused by changes in prevailing market interest rates or prices. Futures contracts may also be entered into for non-hedging purposes.
11
Table of Contents
GARTMORE VARIABLE INSURANCE TRUST
NOTES TO FINANCIAL STATEMENTS (Unaudited) (Continued)
June 30, 2005
Upon entering into a futures contract, the Fund is required to pledge to the broker an amount of cash and/or other assets equal to a certain percentage of the contract amount (initial margin deposit). Subsequent payments, known as “variation margin,” are made each day, depending on the daily fluctuations in the fair value/market value of the underlying assets. A gain or loss equal to the daily variation margin is recognized on a daily basis. Futures contracts are valued daily at their last quoted sale price.
A “sale” of a futures contract means a contractual obligation to deliver the securities or foreign currency called for by the contract at a fixed price at a specified time in the future. A “purchase�� of a futures contract means a contractual obligation to acquire the securities or foreign currency at a fixed price at a specified time in the future.
Should market conditions change unexpectedly, the Fund may not achieve the anticipated benefits of the futures contracts and may realize a loss. The use of futures transactions for hedging purposes involves the risk of imperfect correlation in movements in the price of futures contracts, interest rates, and the value of the underlying hedged assets.
| (g) | Written Options Contracts |
The Fund may write options contracts. A written option obligates the Fund to deliver (written call) or to receive (written put) a specified quantity of an underlying asset at the contract amount upon exercise by the holder of the option. The value of the option contract is recorded as a liability and unrealized gain or loss is measured by the difference between the current value and the premium received. Options traded on an exchange are valued at the last quoted sale price, or in the absence of a sale, the bid price provided by an independent pricing service approved by the Board of Trustees. Non-exchange traded options are valued using dealer supplied quotes.
| (h) | Mortgage Dollar Rolls |
The Fund may enter into mortgage “dollar rolls” in which the Fund sells mortgage-backed securities for delivery in the current month and simultaneously contracts to repurchase substantially similar (same type, coupon, and maturity) securities on a specified future date. Mortgage dollar rolls are referred to as TBA’s on the Statement of Investments of the Fund. During the roll period, the Fund foregoes principal and interest paid on the mortgage-backed securities. The Fund is compensated by fee income or the difference between the current sales price and the lower forward price for the future purchase. Mortgage dollar rolls are valued at the last quoted bid price and/or by using a combination of daily quotes and matrix evaluations provided by an independent pricing service, the use of which has been approved by the Board of Trustees.
| (i) | Short Sales |
The Fund is authorized to engage in short-selling of portfolio securities which obligates the Fund to replace any security that the Fund has borrowed by purchasing the security at current market value sometime in the future. The Fund will incur a loss if the price of the security increases between the date of the short sale and the date on which the Fund replaces the borrowed security. The Fund generally will realize a gain if the price of the security declines between these dates. Until the Fund replaces the borrowed security, the Fund will maintain a segregated account with cash, U.S. Government securities and/or securities held long to sufficiently cover the Fund’s short position on a daily basis. Dividends declared on securities sold short are recorded as an expense on the ex-dividend date and paid to the counterparty on the dividend pay date. The collateral for securities sold short are recorded as an expense on the ex-dividend date and paid to the counterparty on the dividend pay date. The collateral for securities sold short includes the deposits with brokers and securities held long as shown in the Statement of Investments for the Fund.
| (j) | Security Transactions and Investment Income |
Security transactions are accounted for on the date the security is purchased or sold (“trade date”). Securities gains and losses are calculated on the identified cost basis. Interest income is recognized on the accrual basis and includes, where applicable, the amortization or accretion of premium or discount. Dividend income is recorded on the ex-dividend date.
12
Table of Contents
GARTMORE VARIABLE INSURANCE TRUST
NOTES TO FINANCIAL STATEMENTS (Unaudited) (Continued)
June 30, 2005
(k) Distributions to Shareholders
The Fund’s dividends from net investment income, if any, are declared and paid quarterly. The Fund’s distributable net realized capital gains, if any, are declared and distributed at least annually.
Dividends and distributions to shareholders are determined in accordance with federal income tax regulations, which may differ from GAAP. These “book/tax” differences are considered either permanent or temporary in nature. In accordance with the American Institute of Certified Public Accountants (“AICPA”) Statement of Position 93-2, permanent differences (i.e., reclassification of market discounts, gain/loss, paydowns, and distributions) are reclassified within the capital accounts based on their nature for federal income tax purposes; temporary differences do not require reclassification. These reclassifications have no effect upon the net asset value of the Fund. To the extent distributions exceed current and accumulated earnings and profits for federal income tax purposes, these distributions are reported as distributions of paid-in-capital.
| (l) | Federal Income Taxes |
It is the policy of the Fund to qualify or continue to qualify as a “regulated investment company” by complying with the provisions available to certain investment companies, as defined in applicable sections of the U.S. Internal Revenue Code, and to make distributions of net investment income and net realized capital gains sufficient to relieve the Fund from all, or substantially all, federal income taxes.
As of June 30, 2005, the tax cost of securities and the breakdown of unrealized appreciation (depreciation) for the Fund is as follows:
Tax Cost | Unrealized Appreciation | Unrealized Depreciation | Net Unrealized Appreciation (Depreciation) | |||
$709,552 | $66,119,014 | $(245,423) | $65,873,591 |
| (m) | Allocation of Expenses, Income, and Gains and Losses |
Expenses directly attributable to the Fund are charged to the Fund. Expenses not directly attributable to the Fund are allocated proportionately among various or all funds within the Trust. The method used by the Fund for allocating income, fund level expenses, and realized and unrealized gains or losses is based on the fair value of shares outstanding relative to net assets. Under this method, each class of shares participates based on the total net asset value of that class’s shares in proportion to the total net assets of the Fund. Expenses specific to a class (such as rule 12b-1 and administrative services fees) are charged to that class.
3. Transactions with Affiliates
Under the terms of the Trust’s Investment Advisory Agreement, Gartmore Mutual Fund Capital Trust (“GMF”) manages the investment of the assets and supervises the daily business affairs of the Fund. GMF is a wholly-owned subsidiary of Gartmore Global Investments, Inc. (“GGI”), a holding company. GGI is a majority-owned subsidiary of Gartmore Global Asset Management Trust (“GGAMT”). GGAMT is a wholly-owned subsidiary of Nationwide Corporation. All of the common stock of Nationwide Corporation is held by Nationwide Mutual Insurance Company (95.2%) and Nationwide Mutual Fire Insurance Company (4.8%), each of which is a mutual company owned by its policyholders.
Under the terms of the Investment Advisory Agreement, the Fund pays GMF an investment advisory fee of 0.13% based on the Fund’s average daily net assets.
Gartmore SA Capital Trust (“GSA”) provides the Fund with various administrative and accounting services, and Gartmore Investors Services, Inc. (“GISI”), an indirect subsidiary of GSA, serves as Transfer and Dividend Disbursing Agent for the Fund. GSA and GISI have entered into agreements with BISYS Fund Services Ohio, Inc. (“BISYS”), pursuant to which BISYS provides sub-administration and sub-transfer agency services, respectively, to the Fund.
13
Table of Contents
GARTMORE VARIABLE INSURANCE TRUST
NOTES TO FINANCIAL STATEMENTS (Unaudited) (Continued)
June 30, 2005
Under the terms of a Distribution Plan under Rule 12b-1 of the 1940 Act, Gartmore Distribution Services, Inc. (“GDSI”), the Fund’s Distributor, is compensated by the Fund for expenses associated with the distribution of the shares of the Fund. These fees are based on average daily net assets of each class of shares of the Fund at an annual rate not to exceed 0.25%.
Under the terms of an Administrative Services Plan, the Fund may pay fees to servicing organizations, such as broker-dealers, including Nationwide Financial Services, and financial institutions, which agree to provide administrative support services to the shareholders of the Fund. These services include, but are not limited, to the following: establishing and maintaining shareholder accounts; processing purchase and redemption transactions; arranging bank wires; performing shareholder sub-accounting; answering inquires regarding the Funds; and other such services. These fees are based on an annual rate of up to 0.25% of the average daily net assets of each class of shares of the Fund.
Because the Fund invests primarily in other Gartmore Funds, the Fund is a shareholder of those Underlying Funds. The Underlying Funds and the Nationwide Contract do not charge the Fund any sales charge for buying or selling shares. However, the Fund indirectly pays a portion of the operating expenses, including management fees of the Underlying Funds and short-term investments the Fund holds. These expenses are deducted from the Underlying Funds before their share prices are calculated and are in addition to the fees and expenses of the Fund. Actual indirect expenses vary depending on how the Fund’s assets are spread among the underlying investments.
4. Short-Term Trading Fees
The Fund reserves the right to assess a short-term trading fee on certain transactions out of Class VI shares that a separate account makes on behalf of a variable insurance contract owner (the “contract owner”). A separate account that redeems Class VI shares on behalf of a contract owner may be subject to a 1.00% short-term trading fee if the separate account held the Class VI shares on behalf of the contract owner for 60 days or less, unless an exception applies as disclosed in the prospectus. The short-term trading fee is paid directly to the Fund and is intended to offset the cost to the Fund of excess brokerage commissions and other costs associated with fluctuations in fund asset levels and cash flow caused by short-term trading. For purposes of determining whether the short-term trading fee applies, the Class VI shares that were held on behalf of the contract owner the longest will be treated as being redeemed first.
For the six months ended June 30, 2005, the Fund had no contributions to capital due to collection of redemption fees.
5. Investment Transactions
For the six months ended June 30, 2005, (excluding short-term securities) the Fund had purchases of $245,250,184 and sales of $28,159,207.
6. Bank Loans
The Trust has a credit agreement of $100,000,000. Borrowings under this arrangement bear interest at the Federal Funds rate plus 0.50%. The interest costs are included in custodian fees in the Statement of Operations. No compensation balances were required under the terms of the line of credit. There were no borrowings outstanding as of June 30, 2005.
7. Shareholder Meeting
A separate shareholders meeting was held on Tuesday, December 23, 2004, for the shareholders of the Trust’s predecessor pursuant to a Proxy Statement On Schedule 14A, dated October 29, 2004, and mailed to the shareholders of the Trust’s predecessor on or around November 5, 2004.
Two Proposals: The purpose of the December 23, 2004 meeting was to allow the shareholders of the Trust’s predecessor to vote on:
| i. | Proposal One: The election of the Trust’s Board of Trustees; and |
| ii. | Proposal Two: The approval of an “Agreement and Plan of Reorganization” that provided for the reorganization of the Trust from a Massachusetts business trust into a Delaware statutory trust. |
14
Table of Contents
GARTMORE VARIABLE INSURANCE TRUST
NOTES TO FINANCIAL STATEMENTS (Unaudited) (Continued)
June 30, 2005
Proposal One: As set forth in the October 29, 2004 Proxy Statement, the nominees for election as Trustees of the Trust’s predecessor were: Charles E. Allen, Michael J. Baresich, Paula H.J. Cholmondeley, C. Brent DeVore, Phyllis Kay Dryden, Robert M. Duncan, Barbara L. Hennigar, Paul J. Hondros, Barbara I Jacobs, Thomas J. Kerr IV, Douglas F. Kridler, Michael D. McCarthy, Arden L. Shisler, and David C. Wetmore.
Proposal Two: As specifically set forth in the October 29, 2004 Proxy Statement, the Reorganization proposal requested the shareholders of the Trust’s predecessor to approve the proposed “Agreement and Plan of Reorganization” of the Trust’s predecessor (on behalf of each of the its funds) into a new Delaware-domiciled Trust, whereby the Funds of the new Delaware Trust would acquire all of the assets of the corresponding funds of the Trust’s predecessor subject to the liabilities, expenses, costs, charges, and reserves of the corresponding funds of the Trust’s predecessor (contingent or otherwise), in exchange for shares of the acquiring Funds to be distributed pro rata by the Trust to the holders of the shares of the funds of the Trust’s predecessor, in a complete liquidation of the Trust’s predecessor.
Voting Results:
The shareholders of the Trust’s predecessor voted to approve both Proposal One and Proposal Two, as follows:
Proposal 1: Election of a Board of Trustees of Gartmore Variable Insurance Trust
| Charles E. Allen: | ||
FOR | 2,797,230,318.955 shares (96.078%) | |
WITHHOLD | 114,195,693.660 shares (3.922%) | |
TOTAL | 2,912,726,012.615 shares (100.000%) | |
Michael J. Baresich: | ||
FOR | 2,796,135,979.559 shares (96.040%) | |
WITHHOLD | 115,290,033.056 shares (3.960%) | |
TOTAL | 2,912,726,012.615 shares (100.000%) | |
Paula H.J. Cholmondeley: | ||
FOR | 2,795,095,945.396 shares (96.004%) | |
WITHHOLD | 116,330,067.219 shares (3.996%) | |
TOTAL | 2,912,726,012.615 shares (100.000%) | |
C. Brent DeVore: | ||
FOR | 2,797,207,046.916 shares (96.077%) | |
WITHHOLD | 114,218,965.699 shares (3.923%) | |
TOTAL | 2,912,726,012.615 shares (100.000%) | |
Phyllis Kay Dryden: | ||
FOR | 2,795,587,023.994 shares (96.021%) | |
WITHHOLD | 115,838,988.621 shares (3.979%) | |
TOTAL | 2,912,726,012.615 shares (100.000%) | |
Robert M. Duncan: | ||
FOR | 2,790,191,720.503 shares (95.836%) | |
WITHHOLD | 121,234,292.112 shares (4.164%) | |
TOTAL | 2,912,726,012.615 shares (100.000%) | |
15
Table of Contents
GARTMORE VARIABLE INSURANCE TRUST
NOTES TO FINANCIAL STATEMENTS (Unaudited) (Continued)
June 30, 2005
Barbara L. Hennigar: | ||
FOR | 2,792,939,848.858 shares (95.937%) | |
WITHHOLD | 118,486,163.757 shares (4.070%) | |
TOTAL | 2,912,726,012.615 shares (100.000%) | |
Paul J. Hondros: | ||
FOR | 2,797,557,404.448 shares (96.089%) | |
WITHHOLD | 113,868,608.167 shares (3.911%) | |
TOTAL | 2,912,726,012.615 shares (100.000%) | |
Barbara I. Jacobs: | ||
FOR | 2,796,306,126.654 shares (96.046%) | |
WITHHOLD | 115,119,885.961 shares (3.954%) | |
TOTAL | 2,912,726,012.615 shares (100.000%) | |
Thomas J. Kerr IV: | ||
FOR | 2,789,755,720.087 shares (95.821%) | |
WITHHOLD | 121,670,292.528 shares (4.179%) | |
TOTAL | 2,912,726,012.615 shares (100.000%) | |
Douglas F. Kridler: | ||
FOR | 2,798,065,774.375 shares (96.106%) | |
WITHHOLD | 113,360,238.240 shares (3.894%) | |
TOTAL | 2,912,726,012.615 shares (100.000%) | |
Michael D. McCarthy: | ||
FOR | 2,797,452,613.694 shares (96.085%) | |
WITHHOLD | 113,973,395.921 shares (3.915%) | |
TOTAL | 2,912,726,012.615 shares (100.000%) | |
Arden L. Shisler: | ||
FOR | 2,796,738,454.730 shares (96.061%) | |
WITHHOLD | 114,687,557.885 shares (3.939%) | |
TOTAL | 2,912,726,012.615 shares (100.000%) | |
David C. Wetmore: | ||
FOR | 2,794,784,752.247 shares (95.994%) | |
WITHHOLD | 116,641,260.368 shares (4.006%) | |
TOTAL | 2,912,726,012.615 shares (100.000%) | |
Proposal 2: Approval of the Agreement and Plan of Reorganization of Gartmore Variable Insurance Trust
FOR | 2,561,003,822.546 shares (87.964%) | |
AGAINST | 103,593,261.010 shares (3.558%) | |
ABSTAIN | 246,828,929.059 shares (8.478%) | |
TOTAL | 2,912,726,012.615 shares (100.000%) | |
16
Table of Contents
GARTMORE VARIABLE INSURANCE TRUST
Management Information (Unaudited)
June 30, 2005
Trustees who are not Interested Persons (as defined in the 1940 Act) and Officers of the Funds June 30, 2005
| Name, Address and Date of Birth | Position(s) Held with the Trust and Length of Time Served1 | Principal Occupation(s) During Past 5 Years | Number of Portfolios in the Gartmore Fund Complex Overseen by Trustee | Other Directorships Held by Trustee or Nominee2 | ||||
Charles E. Allen
c/o Gartmore Global Investments, Inc. 1200 River Road, Suite 1000 Conshohocken, PA 19428
1948 | Trustee since July 2000 | Mr. Allen is Chairman, Chief Executive Officer and President of the Graimark Realty Advisors, Inc. (real estate development, investment and asset management). | 84 | None | ||||
Paula H.J. Cholmondeley
c/o Gartmore Global Investments, Inc. 1200 River Road, Suite 1000 Conshohocken, PA 19428
1940 | Trustee since July 2000 | Ms. Cholmondeley has been the Chairman and Chief Executive Officer of the Sorrel Group, a management consulting company, since January 2004. From March 2000 through December 2003, Ms. Cholmondeley was Vice President and General Manager of Sappi Fine Paper North America. Prior thereto, Ms. Cholmondeley was Vice President and General Manager of Residential Insulation of Owens Corning. | 84 | Director of Dentsply International, Inc., Ultralife Batteries, Inc., Terex Corporation, Minerals Technology, Inc. and Albany International Corp. | ||||
C. Brent DeVore
c/o Gartmore Global Investments, Inc. 1200 River Road, Suite 1000 Conshohocken, PA 19428
1940 | Trustee since 1990 | Dr. DeVore is President of Otterbein College. | 84 | None | ||||
Phyllis K. Dryden
c/o Gartmore Global Investments, Inc. 1200 River Road, Suite 1000 Conshohocken, PA 19428
1947 | Trustee since December 2004 | Ms. Dryden was a former Managing Partner of marchFIRST, a global management consulting firm prior to 2002. | 84 | None |
17
Table of Contents
GARTMORE VARIABLE INSURANCE TRUST
Management Information (Unaudited)
June 30, 2005
| Name, Address and Date of Birth | Position(s) Held with the Trust and Length of Time Served1 | Principal Occupation(s) During Past 5 Years | Number of Portfolios in the Gartmore Fund Complex Overseen by Trustee | Other Directorships Held by Trustee or Nominee2 | ||||
Barbara L. Hennigar*
c/o Gartmore Global Investments, Inc. 1200 River Road, Suite 1000 Conshohocken, PA 19428
1935 | Trustee since July 2000 | Retired since June 2000. Prior thereto, Ms. Hennigar was the Chairman or President and Chief Executive Officer of OppenheimerFunds Services and a member of the Executive Committee of OppenheimerFunds. | 84 | None | ||||
Barbara I. Jacobs
c/o Gartmore Global Investments, Inc. 1200 River Road, Suite 1000 Conshohocken, PA 19428
1950 | Trustee since December 2004 | Ms. Jacobs has served as Chairman of the Board of Directors of KICAP Network Fund, a European (United Kingdom) hedge fund, since December 2000. Prior to 2004, Ms. Jacobs was also a Managing Director and European Portfolio Manager with CREF Investments (Teachers Insurance Annuity Association — College Retirement Equity Fund). | 84 | None | ||||
Douglas F. Kridler
c/o Gartmore Global Investments, Inc. 1200 River Road, Suite 1000 Conshohocken, PA 19428
1955 | Trustee since September 1997 | Mr. Kridler has served as the President and Chief Executive Officer of the Columbus Foundation (a Columbus, OH-based foundation which manages over 1,300 individual endowment funds) since February 2002. Mr. Kridler was the President of the Columbus Association for the Performing Arts prior thereto and Chairman of the Greater Columbus Convention and Visitors Bureau during 2000 and 2001. | 84 | None | ||||
Michael D. McCarthy
c/o Gartmore Global Investments, Inc. 1200 River Road, Suite 1000 Conshohocken, PA 19428
1947 | Trustee since December 2004 | Mr. McCarthy serves as: the Founder and Chairman of The Eureka Foundation (which sponsors and funds the “Great Museums” series on PBS); and a Partner of Pineville Properties LLC (a commercial real estate development firm). | 843 | None |
18
Table of Contents
GARTMORE VARIABLE INSURANCE TRUST
Management Information (Unaudited)
June 30, 2005
| Name, Address and Date of Birth | Position(s) Held with the Trust and Length of Time Served1 | Principal Occupation(s) During Past 5 Years | Number of Portfolios in the Gartmore Fund Complex Overseen by Trustee | Other Directorships Held by Trustee or Nominee2 | ||||
David C. Wetmore
c/o Gartmore Global Investments, Inc. 1200 River Road, Suite 1000 Conshohocken, PA 19428
1948 | Trustee since 1995 and Chairman since February 2005 | Retired. Mr. Wetmore was formerly a Managing Director of Updata Capital, an investment banking and venture capital firm. | 84 | None |
| * | Pursuant to the Trust’s mandatory retirement policy, Ms. Hennigar is expected to retire on or about January 12, 2006. |
| 1 | The term of office length is until a trustee resigns or reaches a mandatory retirement age of 70. On March 2, 2000, the Board adopted a five-year implementation period for any Trustee 65 or older as of the adoption of this policy. Pursuant to this policy, Messrs. Duncan and Kerr retired as trustees effective as of March 12, 2005. |
| 2 | Directorships held in (1) any other investment companies registered under the 1940 Act, (2) any company with a class of securities registered pursuant to Section 12 of the Securities Exchange Act of 1934, as amended (the “Exchange Act”), or (3) any company subject to the requirements of Section 15(d) of the Exchange Act. |
| 3 | Mr. McCarthy was also an Administrative Committee Member for the Alphagen Arneb Fund, LLC, The Healthcare Fund LDC, The Leaders Long-Short Fund, LLC, and The Leaders Long-Short Fund LDC, four private investment companies (hedge funds) managed by GSA. Mr. McCarthy resigned as an Administrative Committee Member effective June 30, 2005. |
Trustees and Officers who are not Interested Persons (as defined in the 1940 Act) of the Funds received aggregate compensation of $274,882 from the Trust for the Six Months Ended June 30, 2005. Additional information regarding the Trustees and Officers may be found in the Trust’s statement of additional information, which is available without charge upon request, by calling 1-800-848-0920.
19
Table of Contents
GARTMORE VARIABLE INSURANCE TRUST
Management Information (Unaudited)
June 30, 2005
Trustees who are Interested Persons (as defined in the 1940 Act) and/or Officers of the Funds June 30, 2005
| Name, Address and Age | Position(s) Held with the Trust and Length of Time Served1 | Principal Occupation(s) During Past 5 Years | Number of Portfolios in the Gartmore Fund Complex Overseen by Trustee | Other Directorships Held by Trustee2 | ||||
Paul J. Hondros
Gartmore Global Investments, Inc. 1200 River Road, Suite 1000 Conshohocken, PA 19428
1948 | Trustee since July 2000 | Mr. Hondros has been President and Chief Executive Officer of various Gartmore entities, including Gartmore Distribution Services, Inc. (“GDSI”),3 Gartmore Investor Services, Inc. (“GISI”),3 Gartmore Morley Capital Management, Inc. (“GMCM”),3 Gartmore Morley Financial Services, Inc. (“GMFS”),3 NorthPointe Capital, LLC (“NorthPointe”),3 Gartmore Global Asset Management Trust (“GGAMT”)3, Gartmore Global Investments, Inc. (“GGI”)3, Gartmore Mutual Fund Capital Trust (“GMFCT”)3 and Gartmore SA Capital Trust (“GSA”)3; and a Director of Nationwide Securities, Inc.3, as well as several entities within Nationwide Financial Services, Inc. | 844 | None | ||||
Arden L. Shisler
c/o Gartmore Global Investments, Inc. 1200 River Road, Suite 1000 Conshohocken, PA 19428
1941 | Trustee since February 2000 | Mr. Shisler has been a consultant since January 2003. Prior thereto, he was President and Chief Executive Officer of K&B Transport, Inc., a trucking firm. Since 1992, Mr. Shisler has also been Chairman of the Board for Nationwide Mutual Insurance Company3. | 84 | Director of Nationwide Financial Services, Inc. | ||||
Gerald J. Holland Gartmore Global Investments, Inc. 1200 River Road, Suite 1000 Conshohocken, PA 19428 1951 | Treasurer since March 2001 | Mr. Holland is Senior Vice President – Operations for GGI3, GMFCT3 , and GSA3. Prior to July 2000, Mr, Holland was Vice President for First Data Investor Services, an investment company service provider. | 84 | None |
20
Table of Contents
GARTMORE VARIABLE INSURANCE TRUST
Management Information (Unaudited)
June 30, 2005
| Name, Address and Age | Position(s) Held with the Trust and Length of Time Served1 | Principal Occupation(s) During Past 5 Years | Number of Portfolios in the Gartmore Fund Complex Overseen by Trustee | Other Directorships Held by Trustee2 | ||||
Michael A. Krulikowski
Gartmore Global Investments, Inc. 1200 River Road, Suite 1000 Conshohocken, PA 19428
1959 | Chief Compliance Officer since June 2004 | Since November 1999, Mr. Krulikowski has served as a Vice President and Chief Compliance Officer of GGI. Prior thereto, Mr. Krulikowski served as Chief Compliance Officer of 1717 Capital Management Company/Provident Mutual Insurance Company. | 84 | None | ||||
Eric E. Miller
Gartmore Global Investments, Inc. 1200 River Road, Suite 1000 Conshohocken, PA 19428
1953 | Secretary since December 2002 | Mr. Miller is Senior Vice President, Chief Counsel for GGI3, GMFCT3 and GSA3 since August 2002. From August 2000 to August 2002, Mr. Miller was a Partner with Stradley Ronan Stevens & Young, LLP. Prior to August 2000, Mr. Miller served as Senior Vice President and Deputy General Counsel at Delaware Investments. | 84 | None |
| 1 | The term of office length is until a trustee resigns or reaches a mandatory retirement age of 70. On March 2, 2000, the Board adopted a five-year implementation period for any Trustee 65 or older as of the adoption of this policy. Pursuant to this policy, Messrs. Duncan and Kerr retired as trustees effective as of March 12, 2005. |
| 2 | Directorships held in (1) any other investment companies registered under the 1940 Act, (2) any company with a class of securities registered pursuant to Section 12 of the Securities Exchange Act of 1934, as amended (the “Exchange Act”), or (3) any company subject to the requirements of Section 15(d) of the Exchange Act. |
| 3 | This position is held with an affiliated person or principal underwriter of the Trust. |
| 4 | Mr. Hondros was also an Administrative Committee Member for the Alphagen Arneb Fund, LLC, The Healthcare Fund LDC, The Leaders Long-Short Fund, LLC, and The Leaders Long-Short Fund LDC, four private investment companies (hedge funds) managed by GSA. Mr. Hondros resigned as Administrative Committee Member effective June 30, 2005. |
Federal law requires the Trust, each of its investment advisers and sub-advisers to adopt procedures for voting proxies (“Proxy Voting Guidelines”) and to provide a summary of those Proxy Voting Guidelines used to vote the securities held by the Funds. The Funds’ proxy voting policies and procedures are available without charge (i) upon request, by calling 1-800-848-0920, (ii) on the Fund’s website at www.gartmorefunds.com, or (iii) on the Securities and Exchange Commission’s website at www.sec.gov.
21
Table of Contents
Gartmore GVIT Investor Destinations Moderate Fund
Semiannual Report
| | June 30, 2005 |
| Contents | ||
| 6 | Statement of Investments | |
| 7 | Statement of Assets and Liabilities | |
| 7 | Statement of Operations | |
| 8 | Statements of Changes in New Assets | |
| 9 | Financial Highlights | |
| 10 | Notes to Financial Statements | |
Commentary provided by Gartmore Global Investments, investment adviser to Gartmore Variable Insurance Trust. All opinions and estimates included in this report constitute Gartmore Global Investments’ judgment as of the date of this report and are subject to change without notice.
Statement Regarding Availability of Quarterly Portfolio Schedule.
The Gartmore Variable Insurance Trust files complete schedules of portfolio holdings for each Fund with the Securities and Exchange Commission (the “Commission”) for the first and third quarters of each fiscal year on Form N-Q. The Funds’ Forms N-Q are available on the Commission’s website at http://www.sec.gov. The Funds’ Forms N-Q may be reviewed and copied at the Commission’s Public Reference Room in Washington, DC, and information on the operation of the Public Reference Room may be obtained by calling 800-SEC-0330; and the Funds make the information on Form N-Q available to shareholders upon request without charge.
Statement Regarding Availability of Proxy Voting Record.
Information regarding how the Fund voted proxies relating to portfolio securities held during the most recent 12-month period ended June 30, 2005 is available without charge, upon request, by calling 800-848-0920, and on the Commission’s website at http://www.sec.gov.
Table of Contents
Gartmore GVIT Investor Destinations Moderate Fund
For the semiannual period ended June 30, 2005, the Gartmore GVIT Investor Destinations Moderate Fund returned 0.36% (Class II at NAV) versus 0.33% for its benchmark, which consists of 60% S&P 500® Index, 25% Lehman Brothers U.S. Aggregate Index and 15% Citigroup 3-Month T-Bill Index. For broader comparison, the average return for the Fund’s Lipper peer category of Balanced Funds was 0.51%.
The year began with a slide after the strong fourth quarter of 2004, with cyclical and small-capitalization stocks among the worst performers. January was characterized by mixed economic data, increasing interest rates, disappointing earnings reports and climbing oil prices. In addition, gross domestic product (GDP) growth for the fourth quarter of 2004 was released in January, and it came in weaker than expected at 3.1%, primarily as a result of the foreign trade deficit. The markets were able to reverse course in February, even as oil prices continued to climb and the productivity report showed a continued slowdown. In March, the markets resumed their downward slide due to a combination of the trade deficit, mixed economic news, high oil prices and rising interest rates.
For most of April, equity markets were dogged by continuing inflation concerns as the price of oil climbed above $57 per barrel. April closed with the announcement of one of the biggest jumps in the Consumer Price Index (CPI) in several months—the CPI had risen 0.6% in March. May featured the announcement of continued weak first quarter GDP growth of 3.1%. Despite concerns about economic deceleration, slowing profit growth, and continued high oil prices, first quarter earnings reports remained strong. June brought a slowdown in the equity market rally that had begun in May as the specter of economic deceleration dampened markets. In addition, the price of oil continued to pressure equity markets as it climbed to a record high of $60 per barrel.
As expected, short-term interest rates moved upward during the period, causing the yield curve to flatten dramatically. The Federal Reserve Board through the Federal Open Market Committee continued its “measured pace” of monetary tightening by raising the federal funds rate 25 basis points on four occasions during the reporting period; the rate rose from 2.25% to 3.25%.
The chart below illustrates how each of the Fund’s underlying funds contributed to or detracted from overall performance.
| Underlying Fund | Six-Month Return* | Target Allocation | ||
| Gartmore S&P 500 Index Fund | -0.89% | 30% | ||
| Gartmore Bond Index Fund | 2.39% | 25% | ||
| Short-Term Investments | 2.31% | 15% | ||
| Gartmore International Index Fund | -1.34% | 15% | ||
| Gartmore Mid Cap Market Index Fund | 3.80% | 10% | ||
| Gartmore Small Cap Index Fund | -1.24% | 5% | ||
| Gartmore GVIT Investor Destinations Moderate Fund — Class II | 0.36% | 100% |
| * | Index returns represented by Institutional Share Class. |
The Fund will continue to pursue its primary goal of maximizing total investment return by seeking growth of capital and income. The Fund will remain weighted toward stock investments while including a sizable position in bonds and short-term investments, with the goal of adding income and reducing volatility.
PORTFOLIO MANAGERS: Young Chin, Co-Global Chief Investment Officer-Equities, heads the Fund’s portfolio management team and is responsible for the day-to-day management of the allocation of the Fund’s assets among the asset classes and Underlying Funds.
When discussing asset allocation theory and the three major asset classes, short-term investments typically are represented by an investment in 90-day Treasury bills. The short-term investments component of the Gartmore GVIT Investor Destinations Funds comprises an investment in one or a combination of the following: the Gartmore Morley Enhanced Income Fund (a short-term fixed-income fund), the Gartmore Money Market Fund and/or the Nationwide Contract (a fixed-interest contract issued and guaranteed by the Nationwide Life Insurance Company). While there can be no guarantee, it is believed that this strategy will provide a return in excess of the 90-day T-bill without substantially increasing risk.
The Gartmore GVIT Investor Destinations Funds are designed to provide diversification and asset allocation across several types of investments and asset classes, primarily by investing in underlying funds. Therefore, in addition to the expenses of the Gartmore GVIT Investor Destinations Funds, you are indirectly paying a proportionate share of the applicable fees and expenses of the underlying funds. International investing involves additional risks, including currency fluctuations, differences in accounting standards, political instability and foreign regulations, all of which are magnified in emerging markets. Small-company stocks have higher risks than the stocks of larger, more established companies and have significant short-term price volatility.
1
Table of Contents
Gartmore GVIT Investor Destinations Moderate Fund (continued)
Investing in mutual funds involves risk, including possible loss of principal.
There is no assurance that the investment objective of any fund will be achieved.
The Gartmore GVIT Investor Destinations Moderate Fund benchmark consists of 60% S&P 500 Index, 25% Lehman Brothers U.S. Aggregate Bond Index, and 15% Citigroup 3-Month T-Bill Index.
Citigroup 3-Month T-Bill Index: An unmanaged index that is generally representative of 3-month Treasury bills; consists of an average of the last 3-month Treasury bill issues (excluding the current month-end bill).
Lehman Brothers U.S. Aggregate Bond Index: An unmanaged, market value-weighted index of investment-grade, fixed-rate debt issues (including government, corporate, asset-backed, and mortgage-backed securities with maturities of one year or more) that is generally representative of the bond market as a whole.
Standard & Poor’s 500 (S&P 500) Index: An unmanaged, capitalization-weighted index of 500 widely held stocks of large-cap U.S. companies that gives a broad look at how the stock prices of those companies have performed.
Lipper Analytical Services, Inc. is an industry research firm whose rankings are based on total return performance and do not reflect the effects of sales charges.
The Gartmore Variable Insurance Trust Funds are available only as sub-account investment options in certain variable insurance products. Accordingly, investors are unable to invest in shares of these funds outside of an insurance product. Performance information found herein reflects only the performance of these funds, and does not indicate the performance your sub-account may experience under your variable insurance contract. Performance returns assume reinvestment of all distributions. The investment return and principal value of an investment will fluctuate so that an investor’s shares, when redeemed, may be worth more or less than their original cost. Index performance is provided for comparison purposes only; the indexes shown are unmanaged and do not reflect any fees or expenses. Investors cannot invest directly in market indexes. To obtain performance information about the sub-account option under your insurance contract that invests in one of these funds, please contact your variable insurance carrier. PAST PERFORMANCE IS NO GUARANTEE OF FUTURE RESULTS.
Commentary provided by Gartmore Global Investments. All opinions and estimates included in this report constitute Gartmore Global Investments’ judgment as of the date of this report and are subject to change without notice.
Investors should carefully consider a fund’s investment objectives, risks, fees, charges and expenses before investing any money. To obtain this and other information on Gartmore Variable Insurance Trust, please contact your variable insurance contract provider or call 800-848-0920. Please read the Trust’s prospectus carefully before investing any money.
Gartmore Funds distributed by Gartmore Distribution Services, Inc., Member NASD. 1200 River Road, Suite 1000, Conshohocken, PA 19428.
2
Table of Contents
Fund Performance | Gartmore GVIT Investor Destinations Moderate Fund |
| Average | Annual Total Return1 |
(For Periods Ended June 30, 2005)
| Six months* | One year | Inception2 | ||||
| Class II3 | 0.36% | 7.29% | 5.35% | |||
| Class VI4 | 0.52% | 7.59% | 5.40% |
| * | Not Annualized. |
| 1 | Not subject to any sales charges. |
| 2 | Fund commenced operations on December 12, 2001. |
| 3 | Existing shares were designated Class II shares as of April 29, 2004. |
| 4 | These returns through December 31, 2003 were achieved prior to the creation of Class VI shares and include the performance of the Fund’s Class II shares. Excluding the effect of periodic fee waivers or reimbursements, such prior performance is substantially similar to what Class VI shares would have produced because Class VI shares invest in the same portfolio of securities as Class II shares and have the same expenses. Class VI shares’ returns do not reflect the short-term trading fees applicable to such shares; if these fees were deducted, the annual returns for Class VI shares earned by the variable contract owner would have been lower. |
| Performance | of a $10,000 Investment |
Investment return and principal value will fluctuate, and when redeemed, shares may be worth more or less than original cost. Past performance is no guarantee of future results and does not reflect the deduction of taxes that a shareholder would pay on fund distributions or the redemption of fund shares. Investing in mutual funds involves market risk, including loss of principal. Performance returns assume the reinvestment of all distributions.
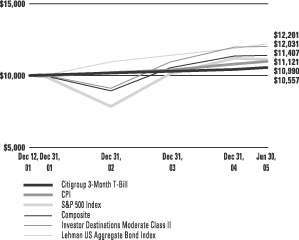
Comparative performance of $10,000 invested in Class II shares of the Gartmore GVIT Investor Destinations Moderate Fund, Lehman Brothers Aggregate Bond Index (LB Aggregate Bond)(a), S&P 500 Index (S&P 500)(b), the Citigroup 3-Month T Bill Index(c), the Moderate Composite Index(d), and the Consumer Price Index (CPI)(e) since inception. Unlike the Fund, the returns for these unmanaged indexes do not reflect any fees, expenses, or sales charges. Investors cannot invest directly in market indexes.
| (a) | LB U.S. Aggregate Bond Index is an unmanaged, market value-weighted index of investment-grade, fixed-rate debt issues (including government, corporate, asset-backed, and mortgage-backed securities with maturities of one year or more) that is generally representative of the bond market as a whole. |
| (b) | S&P 500 is an unmanaged, market capitalization-weighted index of 500 widely held stocks of large-cap U.S. companies that gives a broad look at how the stock prices of those companies have performed. |
| (c) | The Citigroup 3-Month T Bill Index is an average of the last 3-month treasury bill issues (excluding the current month-end bill). |
| (d) | The Moderate Composite is an unmanaged, hypothetical representation of the performance of each of the Fund’s asset classes according to their respective weightings. The Moderate Composite is a combination of S&P 500 (60%), LB Aggregate Bond (25%) and Citigroup 3-Month T Bill Index (15%). |
| (e) | The CPI represents changes in prices of a basket of goods and services purchased for consumption by urban households. |
3
Table of Contents
Shareholder
Expense Example | Gartmore GVIT Investor Destinations Moderate Fund |
As a shareholder of the Fund, you incur two types of costs: (1) transaction costs, including sales charges (loads) paid on purchase payments and redemption fees; and (2) ongoing costs, including investment advisory fees, administration fees, distribution fees and other Fund expenses. The examples below are intended to help you understand your ongoing costs (in dollars) of investing in the Fund and to compare these costs with the ongoing costs of investing in other mutual funds. Per SEC requirements, the examples assume that you had a $1,000 investment in the Class at the beginning of the reporting period, January 1, 2005, and continued to hold your shares at the end of the reporting period, June 30, 2005.
Actual Expenses
For each Class of the Fund in the table below, the first line provides information about actual account values and actual expenses. You may use the information in this line, together with the amount you invested, to estimate the expenses that you paid over the period. Simply divide your account value by $1,000 (for example, an $8,600 account value divided by $1,000 = 8.6), then multiply the result by the number in the first line of each Class under the heading entitled “Expenses Paid During Period” to estimate the expenses you paid on your account during the period.
Hypothetical Example for Comparison Purposes
The second line of each Class in the table below provides information about hypothetical account values and hypothetical expenses based on the Class’ actual expense ratio and an assumed rate of return of 5% per year before expenses, which is not the Class’ actual return. The hypothetical account values and expenses may not be used to estimate the actual ending account balance or expenses you paid for the period. You may use this information to compare the ongoing costs of investing in the Class of the Fund and other funds. To do so, compare this 5% hypothetical example with the 5% hypothetical examples that appear in the shareholder reports of the other funds.
Please note that the expenses shown in the table are meant to highlight your ongoing costs only and do not reflect any transaction costs, such as sales charges (loads) or redemption fees. Therefore, the second line for each Class in the table is useful in comparing ongoing costs only, and will not help you determine the relative total costs of owning different funds. In addition, if these transaction costs were included, your costs would have been higher. The examples also assume all dividends and distributions have been reinvested.
| Beginning Account Value, January 1, 2005 | Ending Account Value, June 30, 2005 | Expenses Paid During Period* | Annualized Expense Ratio* | ||||||||||
| Investor Destinations Moderate Fund | |||||||||||||
Class II | Actual | $ | 1,000 | $ | 1,004 | $ | 2.78 | 0.56% | |||||
| Hypothetical1 | $ | 1,000 | $ | 1,022 | $ | 2.81 | 0.56% | ||||||
Class VI | Actual | $ | 1,000 | $ | 1,005 | $ | 2.04 | 0.41% | |||||
| Hypothetical1 | $ | 1,000 | $ | 1,023 | $ | 2.06 | 0.41% | ||||||
| * | Expenses are equal to the Fund’s annualized expense ratio multiplied by the average account value over the period multiplied by 181/365 (to reflect the one-half year period). The expense ratio presented represents a six month, annualized ratio in accordance with SEC guidelines. |
| 1 | Represents the hypothetical 5% return before expenses. |
4
Table of Contents
Portfolio Summary
June 30, 2005 | Gartmore GVIT Investor Destinations Moderate Fund |
The SEC adopted a requirement that Funds present their portfolio holdings in a table, chart or graph format in their annual and semiannual reports to shareholders, whether or not a statement of investments is utilized. The following tables, which present portfolio holdings as a percentage of net assets, are provided in compliance with this requirement.
| Asset Allocation | ||
| Mutual Funds | 92.4% | |
| Fixed Contract | 7.5% | |
| Other assets in excess of liabilities | 0.1 % | |
| 100.0% | ||
| Asset Allocation Detail | ||
| Equity Funds | 59.8% | |
| Fixed Income Funds | 32.6% | |
| Fixed Contract | 7.5% | |
| Other | 0.1% | |
| 100.0% | ||
| Top Holdings | ||
| Gartmore S&P 500 Index Fund, Institutional Class | 29.8% | |
| Gartmore Bond Index Fund, Institutional Class | 25.1% | |
Gartmore International Index Fund, Institutional Class | 15.0% | |
Gartmore Mid Cap Market Index Fund, Institutional Class | 10.0% | |
| Nationwide Fixed Contract, 3.50% | 7.5% | |
Gartmore Morley Enhanced Income Fund, Institutional Class | 7.5% | |
| Gartmore Small Cap Index Fund, Institutional Class | 5.0% | |
| Other Holdings | 0.1% | |
| 100.0% | ||
5
Table of Contents
GARTMORE VARIABLE INSURANCE TRUST
GARTMORE GVIT INVESTOR DESTINATIONS MODERATE FUND
Statement of Investments — June 30, 2005 (Unaudited)
| Shares or Principal Amount | Value | |||||
| MUTUAL FUNDS (92.4%) | ||||||
| Equity Funds (59.8%) | ||||||
| Gartmore International Index Fund, Institutional Class (b) | 24,389,414 | $ | 197,554,254 | |||
| Gartmore Mid Cap Market Index Fund, Institutional Class (b) | 9,099,106 | 131,482,082 | ||||
| Gartmore S&P 500 Index Fund, Institutional Class (b) | 38,306,004 | 393,402,664 | ||||
| Gartmore Small Cap Index Fund, Institutional Class (b) | 5,542,738 | 65,736,877 | ||||
| 788,175,877 | ||||||
| Fixed Income Funds (32.6%) | ||||||
| Gartmore Bond Index Fund, Institutional Class (b) | 29,816,628 | 330,666,403 | ||||
| Gartmore Morley Enhanced Income Fund, Institutional Class (b) | 10,857,568 | 99,021,021 | ||||
| 429,687,424 | ||||||
| Total Mutual Funds | 1,217,863,301 | |||||
| FIXED CONTRACT (7.5%) | ||||||
| Nationwide Fixed Contract, 3.50% (b) (c) | $ | 99,030,366 | 99,030,366 | |||
| Total Fixed Contract | 99,030,366 | |||||
| Total Investments (Cost $1,214,618,431) (a) — 99.9% | 1,316,893,667 | |||||
| Other assets in excess of liabilities — 0.1% | 977,721 | |||||
| NET ASSETS — 100.0% | $ | 1,317,871,388 | ||||
| (a) | See notes to financial statements for unrealized appreciation (depreciation) of securities. |
| (b) | Investment in affiliate. |
| (c) | The Nationwide Fixed Contract rate changes quarterly. The security is restricted and as the affiliated counterparty is required by contract to redeem within five days upon request, and it has been deemed liquid pursuant to procedures approved by the Board of Trustees in accordance with rule 144A under the Securities Act of 1933, as amended. |
See notes to financial statements
6
Table of Contents
GARTMORE VARIABLE INSURANCE TRUST
GARTMORE GVIT INVESTOR DESTINATIONS MODERATE FUND
Statement of Assets and Liabilities
June 30, 2005 (Unaudited)
Assets: | |||
Investments in affiliated securities, at value (cost $1,214,618,431) | $ | 1,316,893,667 | |
Cash | 263 | ||
Interest and dividends receivable | 1,464,582 | ||
Prepaid expenses and other assets | 79,928 | ||
Total Assets | 1,318,438,440 | ||
Liabilities: | |||
Accrued expenses and other payables: | |||
Investment advisory fees | 139,702 | ||
Distribution fees | 268,660 | ||
Administrative servicing fees | 139,469 | ||
Other | 19,221 | ||
Total Liabilities | 567,052 | ||
Net Assets | $ | 1,317,871,388 | |
Represented by: | |||
Capital | $ | 1,214,891,943 | |
Accumulated net investment income (loss) | 148,435 | ||
Accumulated net realized gain (losses) from investment transactions | 555,774 | ||
Net unrealized appreciation (depreciation) on investments | 102,275,236 | ||
Net Assets | $ | 1,317,871,388 | |
Net Assets: | |||
Class II Shares | $ | 1,305,686,441 | |
Class VI Shares | 12,184,947 | ||
Total | $ | 1,317,871,388 | |
Shares outstanding (unlimited number of shares authorized): | |||
Class II Shares | 117,819,769 | ||
Class VI Shares | 1,100,936 | ||
Total | 118,920,705 | ||
Net asset value and offering price per share:* | |||
Class II Shares | $ | 11.08 | |
Class VI Shares | $ | 11.07 |
| * | Not subject to a front-end sales charge. |
For the Six Months Ended June 30, 2005 (Unaudited)
Investment Income: | ||||
Interest income from affiliates | $ | 1,557,590 | ||
Interest income | 132 | |||
Dividend income from affiliates | 14,613,373 | |||
Total Income | 16,171,095 | |||
Expenses: | ||||
Investment advisory fees | 783,239 | |||
Distribution Fees Class II | 1,493,038 | |||
Distribution Fees Class VI | 13,205 | |||
Administrative servicing fees Class II Shares | 867,336 | |||
Other** | 184,524 | |||
Total Expenses | 3,341,342 | |||
Net Investment Income (Loss) | 12,829,753 | |||
REALIZED/UNREALIZED GAINS (LOSSES) ON INVESTMENTS: | ||||
Net realized gains (losses) on investment transactions | 2,979,114 | |||
Net change in unrealized appreciation/depreciation on investments | (8,908,990 | ) | ||
Net realized/unrealized gains (losses) on investments | (5,929,876 | ) | ||
CHANGE IN NET ASSETS RESULTING FROM OPERATIONS | $ | 6,899,877 | ||
| ** | Other expenses may include the following fees: audit, custody, insurance, legal, printing, trustee, and out-of-pocket expenses. |
See notes to financial statements.
7
Table of Contents
GARTMORE VARIABLE INSURANCE TRUST
GARTMORE GVIT INVESTOR DESTINATIONS MODERATE FUND
Statement of Changes in Net Assets
| Six Months Ended June 30, 2005 | Year Ended December 31, 2004 | |||||||
| (Unaudited) | ||||||||
From Investment Activities: | ||||||||
Operations: | ||||||||
Net investment income (loss) | $ | 12,829,753 | $ | 18,507,538 | ||||
Net realized gains (losses) on investment transactions | 2,979,114 | 14,877,254 | ||||||
Net change in unrealized appreciation/depreciation on investments | (8,908,990 | ) | 53,755,760 | |||||
Change in net assets resulting from operations | 6,899,877 | 87,140,552 | ||||||
Distributions to Class II Shareholders from: | ||||||||
Net investment income | (12,559,365 | ) | (18,487,818 | )(a) | ||||
Net realized gains on investments | (12,358,854 | ) | (4,603,467 | )(a) | ||||
Distributions to Class VI Shareholders from: | ||||||||
Net investment income | (121,953 | ) | (120,802 | )(b) | ||||
Net realized gains on investments | (115,029 | ) | (15,162 | )(b) | ||||
Change in net assets from shareholder distributions | (25,155,201 | ) | (23,227,249 | ) | ||||
Change in net assets from capital transactions | 208,626,492 | 496,671,032 | ||||||
Change in net assets | 190,371,168 | 560,584,335 | ||||||
Net Assets: | ||||||||
Beginning of period | 1,127,500,220 | 566,915,885 | ||||||
End of period | $ | 1,317,871,388 | $ | 1,127,500,220 | ||||
CAPITAL TRANSACTIONS: | ||||||||
Class II Shares | ||||||||
Proceeds from shares issued | $ | 202,652,163 | $ | 492,446,066 | (a) | |||
Dividends reinvested | 24,918,089 | 23,091,113 | (a) | |||||
Cost of shares redeemed | (21,902,892 | ) | (27,752,291 | )(a) | ||||
| 205,667,360 | 487,784,888 | |||||||
Class VI Shares | ||||||||
Proceeds from shares issued | 5,363,683 | 9,284,226 | (b) | |||||
Dividends reinvested | 236,981 | 135,964 | (b) | |||||
Cost of shares redeemed | (2,641,532 | ) | (534,046 | )(b) | ||||
| 2,959,132 | 8,886,144 | |||||||
Change in net assets from capital transactions | $ | 208,626,492 | $ | 496,671,032 | ||||
SHARE TRANSACTIONS: | ||||||||
Class II Shares | ||||||||
Issued | 18,205,702 | 46,046,676 | (a) | |||||
Reinvested | 2,254,340 | 2,117,183 | (a) | |||||
Redeemed | (1,966,659 | ) | (2,611,054 | )(a) | ||||
| 18,493,383 | 45,552,805 | |||||||
Class VI Shares | ||||||||
Issued | 482,310 | 873,389 | (b) | |||||
Reinvested | 21,463 | 12,350 | (b) | |||||
Redeemed | (237,535 | ) | (51,041 | )(b) | ||||
| 266,238 | 834,698 | |||||||
| (a) | On April 30, 2004, the existing share Class of the Fund’s was renamed Class II Shares. |
| (b) | For the period from April 30, 2004 (commencement of operations) through December 31, 2004. |
See notes to financial statements.
8
Table of Contents
GARTMORE GVIT INVESTOR DESTINATIONS MODERATE FUND
Selected Data for Each Share of Capital Outstanding
Gartmore GVIT Investor Destinations Moderate Fund
| Investment Activities | Distributions | Ratios/Supplemental Data | |||||||||||||||||||||||||||||||||||||||||
| Net Asset Value, Beginning of Period | Net Investment Income | Net Realized and Unrealized Gains (Losses) on Investments | Total from Investment Activities | Net Investment Income | Net Realized Gains | Total Distributions | Net Asset Value, End of Period | Total Return | Net Assets at End of Period (000s) | Ratio of Expenses to Average Net Assets | Ratio of Net Investment Income (Loss) to Average Net Assets | Ratio of Expenses (Prior to Reimbursements) to Average Net Assets(a) | Ratio of Net Investment Income (Loss) (Prior to Reimbursements) to Average Net Assets(a) | Portfolio Turnover(b) | |||||||||||||||||||||||||||||
Class II Shares | |||||||||||||||||||||||||||||||||||||||||||
Period Ended December 31, 2001(c) | $ | 10.00 | 0.02 | 0.06 | 0.08 | (0.02 | ) | — | (0.02 | ) | $ | 10.06 | 0.84% | (e) | $ | 504 | 0.61% | (f) | 4.42% | (f) | 24.86% | (f) | (19.83% | )(f) | 0.74% | ||||||||||||||||||
Year Ended December 31, 2002 | $ | 10.06 | 0.15 | (1.11 | ) | (0.96 | ) | (0.15 | ) | (0.01 | ) | (0.16 | ) | $ | 8.94 | (9.60% | ) | $ | 165,555 | 0.56% | 2.41% | (g | ) | (g | ) | 21.58% | |||||||||||||||||
Year Ended December 31, 2003 | $ | 8.94 | 0.17 | 1.60 | 1.77 | (0.17 | ) | — | (0.17 | ) | $ | 10.54 | 20.05% | $ | 566,916 | 0.56% | 2.01% | (g | ) | (g | ) | 9.90% | |||||||||||||||||||||
Year Ended December 31, 2004(d) | $ | 10.54 | 0.21 | 0.78 | 0.99 | (0.21 | ) | (0.06 | ) | (0.27 | ) | $ | 11.26 | 9.54% | $ | 1,118,116 | 0.56% | 2.19% | (g | ) | (g | ) | 5.54% | ||||||||||||||||||||
Six Months Ended June 30, 2005 (Unaudited) | $ | 11.26 | 0.11 | (0.07 | ) | 0.04 | (0.11 | ) | (0.11 | ) | (0.22 | ) | $ | 11.08 | 0.36% | (e) | $ | 1,305,686 | 0.56% | (f) | 2.13% | (f) | (g | ) | (g | ) | 1.18% | ||||||||||||||||
Class VI Shares | |||||||||||||||||||||||||||||||||||||||||||
Period Ended December 31 2004(h) | $ | 10.54 | 0.19 | 0.72 | 0.91 | (0.19 | ) | (0.02 | ) | (0.21 | ) | $ | 11.24 | 8.72% | (e) | $ | 9,384 | 0.41% | (f) | 3.84% | (f) | (g | ) | (g | ) | 5.54% | |||||||||||||||||
Six Months Ended June 30, 2005 (Unaudited) | $ | 11.24 | 0.12 | (0.06 | ) | 0.06 | (0.12 | ) | (0.11 | ) | (0.23 | ) | $ | 11.07 | 0.52% | (e) | $ | 12,185 | 0.41% | (f) | 2.30% | (f) | (g | ) | (g | ) | 1.18% | ||||||||||||||||
| (a) | During the period certain fees were waived and/or reimbursed. If such waivers/reimbursements had not occurred, the ratios would have been as indicated. |
| (b) | Portfolio turnover is calculated on the basis of the Fund as a whole without distinguishing among the classes of shares. |
| (c) | For the period from December 12, 2001 (commencement of operations) through December 31, 2001. |
| (d) | On April 30, 2004, the existing share Class of the Fund was renamed Class II Shares. |
| (e) | Not annualized. |
| (f) | Annualized. |
| (g) | There were no fee reductions during the period. |
| (h) | For the period from April 30, 2004 (commencement of operations) through December 31, 2004. |
See notes to financial statements.
9
Table of Contents
GARTMORE VARIABLE INSURANCE TRUST
NOTES TO FINANCIAL STATEMENTS (Unaudited)
June 30, 2005
1. Organization
Gartmore Variable Insurance Trust (“GVIT” or the “Trust”) is an open-end management investment company, organized under the laws of Delaware by an amended and restated Agreement and Declaration of Trust, dated October 28, 2004, as amended to date. The Trust, originally created under the laws of Massachusetts as a Massachusetts business trust pursuant to a Declaration of Trust dated, as of June 30, 1981, as subsequently amended, redomesticated as a Delaware Statutory Trust after the close of trading on April 29, 2005, and is registered under the Investment Company Act of 1940, as amended (the “1940 Act”). The redomestication is a change in statutory status and does not affect the operations of the Trust. As of June 30, 2005, the Trust had authorized an unlimited number of shares of beneficial interest (“shares”) without par value. The Trust currently offers shares to life insurance company separate accounts to fund the benefits under variable life insurance or annuity policies. To date, only the separate accounts of Nationwide Life Insurance Company and Nationwide Life and Annuity Insurance Company (collectively, “Nationwide”) have purchased shares of the Trust’s series. The Trust operates thirty-one (31) separate series, or mutual funds, each with its own investment objectives and strategies. This report contains the financial statements and financial highlights of the Gartmore GVIT Investor Destinations Moderate Fund (the “Fund”).
The Fund is constructed as a “fund of funds,” which means that the Fund pursues its investment objective primarily by allocating the Fund’s investments among other mutual funds (the “Underlying Funds”). The Underlying Funds typically invest, either directly or indirectly, in stocks, bonds, and other securities including the Nationwide Contract. The Nationwide Contract is a fixed interest contract issued and guaranteed by Nationwide. This contract has a stable principal value and will pay the Fund a fixed rate of interest. The fixed interest rate must be at least 3.50% (on an annual basis), but may be higher and is currently adjusted on a quarterly basis. Nationwide will calculate the interest rate in the same way that it calculates guaranteed interest rates for similar contracts. Because the contract is not guaranteed by Nationwide, assuming no default, the Fund receives no more or less than the guaranteed amount and will not directly participate in the actual experience of the assets underlying the contract. Although under certain market conditions the Fund’s performance may be hurt by its investment in the Nationwide Contract, the portfolio management team believes that the relatively stable nature of the Nationwide Contract should reduce the Fund’s volatility and overall risk, especially when the bond and stock markets decline simultaneously. The Fund’s target allocation range is 5-15%.
Under the Trust’s organizational documents, the Trust’s officers and trustees are indemnified against certain liabilities arising out of the performance of their duties to the Trust. In addition, the Trust has entered into Indemnification Agreements with the Trust’s trustees and certain officers covering similar liabilities. In addition, in the normal course of business, the Trust enters into contracts with its vendors and others that provide for general indemnifications. The Trust’s maximum exposure under these arrangements is unknown, as this would involve future claims that may be made against the Trust. Based on experience, however, the Trust expects that risk of loss to be remote.
2. Summary of Significant Accounting Policies
The following is a summary of significant accounting policies followed by the Fund in the preparation of its financial statements. The policies are in conformity with accounting principles generally accepted in the United States of America (“GAAP”). The preparation of financial statements requires management to make estimates and assumptions that affect the reported amounts of assets and liabilities, the disclosure of contingent assets and liabilities at the date of the financial statements and the reported amounts of income and expenses for the period. Actual results could differ from those estimates.
(a) Security Valuation
Shares of the Underlying Funds in which the Fund invests are valued at their respective net asset values as reported by the Underlying Funds. The securities in the Underlying Funds generally are valued as of the close of business of the regular session of trading on the New York Stock Exchange (usually at 4 p.m. Eastern Time). The Underlying Funds generally value securities and assets at current market value. Under most circumstances, the fixed interest contract is valued at par value each day, which is deemed to be fair value. The par value is calculated each day by the summation of the following factors: prior day’s par value; prior day’s interest accrued (par multiplied by guaranteed fixed rate); and current day net purchase or redemption.
10
Table of Contents
GARTMORE VARIABLE INSURANCE TRUST
NOTES TO FINANCIAL STATEMENTS (Unaudited) (Continued)
June 30, 2005
| (b) | Repurchase Agreements |
The Fund may enter into repurchase agreements with an entity which is a member of the Federal Reserve System or which is a “primary dealer” (as designated by the Federal Reserve Bank of New York) in U.S. Government obligations. The repurchase price generally equals the price paid by the Fund plus interest negotiated on the basis of short-term rates, which may be more or less than the rate on the underlying portfolio securities. The seller under a repurchase agreement is required to maintain the value of the collateral held pursuant to the agreement at a market value equal to or greater than the repurchase price (including accrued interest). Collateral subject to repurchase agreements is held by the Fund’s custodian or another qualified sub-custodian or in the Federal Reserve/Treasury book-entry system. If the counterparty defaults and the fair value of the collateral declines, realization of the collateral by the Fund may be delayed or limited. The Fund may transfer uninvested cash balances into a pooled cash account. These balances are invested in one or more repurchase agreements, which are fully collateralized by AA-rated Corporate Bonds with the counterparties of CS First Boston and Nomura Securities.
| (c) | Foreign Currency Transactions |
The accounting records of the Fund are maintained in U.S. dollars. Foreign currency amounts are translated into U.S. dollars at the current rate of exchange to determine the value of investments, assets and liabilities. The Fund may enter into foreign currency contracts in connection with purchases or sales of securities denominated in a foreign currency. Purchases and sales of securities, and income and expenses, are translated at the prevailing rate of exchange on the respective date of these transactions. The Fund does not isolate that portion of the results of operations resulting from changes in foreign exchange rates on investments from fluctuations arising from changes in market prices of securities held. These fluctuations are included with the net realized and unrealized gain or loss from investments and foreign currencies.
| (d) | Risks Associated with Foreign Securities and Currencies |
Investments in securities of foreign issuers carry certain risks not ordinarily associated with investments in securities of U.S. issuers. These risks include future political and economic developments, and the possible imposition of exchange controls or other foreign governmental laws and restrictions. In addition, with respect to certain countries, there is the possibility of expropriation of assets, confiscatory taxation, political or social instability, or diplomatic developments, which could adversely affect investments in those countries.
Certain countries also may impose substantial restrictions on investments in their capital markets by foreign entities, including restrictions on investments in issuers of industries deemed sensitive to relevant national interests. These factors may limit the investment opportunities available and result in a lack of liquidity and high price volatility with respect to securities of issuers from developing countries.
| (e) | Forward Foreign Currency Contracts |
The Fund may enter into forward foreign currency contracts in connection with planned purchases or sales of securities or to hedge the U.S. dollar value of portfolio securities denominated in a particular currency. The Fund could be exposed to risks if the counterparties to the contracts are unable to meet the terms of their contracts and from unanticipated movements in the value of a foreign currency relative to the U.S. dollar. Forward foreign currency contracts are valued at the current cost of covering these contracts, as provided by an independent pricing service approved by the Board of Trustees. The forward foreign currency contracts are adjusted by the daily exchange rate of the underlying currency and any gains or losses are recorded for financial statement purposes as unrealized gains or losses until the contract settlement date.
| (f) | Futures Contracts |
The Fund may invest in financial futures contracts (“futures contracts”) for the purpose of hedging its existing portfolio securities or securities that the Fund intends to purchase against fluctuations in value caused by changes in prevailing market interest rates or prices. Futures contracts may also be entered into for non-hedging purposes.
11
Table of Contents
GARTMORE VARIABLE INSURANCE TRUST
NOTES TO FINANCIAL STATEMENTS (Unaudited) (Continued)
June 30, 2005
Upon entering into a futures contract, the Fund is required to pledge to the broker an amount of cash and/or other assets equal to a certain percentage of the contract amount (initial margin deposit). Subsequent payments, known as “variation margin,” are made each day, depending on the daily fluctuations in the fair value/market value of the underlying assets. A gain or loss equal to the daily variation margin is recognized on a daily basis. Futures contracts are valued daily at their last quoted sale price.
A “sale” of a futures contract means a contractual obligation to deliver the securities or foreign currency called for by the contract at a fixed price at a specified time in the future. A “purchase” of a futures contract means a contractual obligation to acquire the securities or foreign currency at a fixed price at a specified time in the future.
Should market conditions change unexpectedly, the Fund may not achieve the anticipated benefits of the futures contracts and may realize a loss. The use of futures transactions for hedging purposes involves the risk of imperfect correlation in movements in the price of futures contracts, interest rates, and the value of the underlying hedged assets.
| (g) | Written Options Contracts |
The Fund may write options contracts. A written option obligates the Fund to deliver (written call) or to receive (written put) a specified quantity of an underlying asset at the contract amount upon exercise by the holder of the option. The value of the option contract is recorded as a liability and unrealized gain or loss is measured by the difference between the current value and the premium received. Options traded on an exchange are valued at the last quoted sale price, or in the absence of a sale, the bid price provided by an independent pricing service approved by the Board of Trustees. Non-exchange traded options are valued using dealer supplied quotes.
| (h) | Mortgage Dollar Rolls |
The Fund may enter into mortgage “dollar rolls” in which the Fund sells mortgage-backed securities for delivery in the current month and simultaneously contracts to repurchase substantially similar (same type, coupon, and maturity) securities on a specified future date. Mortgage dollar rolls are referred to as TBA’s on the Statement of Investments of the Fund. During the roll period, the Fund foregoes principal and interest paid on the mortgage-backed securities. The Fund is compensated by fee income or the difference between the current sales price and the lower forward price for the future purchase. Mortgage dollar rolls are valued at the last quoted bid price and/or by using a combination of daily quotes and matrix evaluations provided by an independent pricing service, the use of which has been approved by the Board of Trustees.
| (i) | Short Sales |
The Fund is authorized to engage in short-selling of portfolio securities which obligates the Fund to replace any security that the Fund has borrowed by purchasing the security at current market value sometime in the future. The Fund will incur a loss if the price of the security increases between the date of the short sale and the date on which the Fund replaces the borrowed security. The Fund generally will realize a gain if the price of the security declines between these dates. Until the Fund replaces the borrowed security, the Fund will maintain a segregated account with cash, U.S. Government securities and/or securities held long to suffciently cover the Fund’s short position on a daily basis. Dividends declared on securities sold short are recorded as an expense on the ex-dividend date and paid to the counterparty on the dividend pay date. The collateral for securities sold short are recorded as an expense on the ex-dividend date and paid to the counterparty on the dividend pay date. The collateral for securities sold short includes the deposits with brokers and securities held long as shown in the Statement of Investments for the Fund.
| (j) | Security Transactions and Investment Income |
Security transactions are accounted for on the date the security is purchased or sold (“trade date”). Securities gains and losses are calculated on the identified cost basis. Interest income is recognized on the accrual basis and includes, where applicable, the amortization or accretion of premium or discount. Dividend income is recorded on the ex-dividend date.
12
Table of Contents
GARTMORE VARIABLE INSURANCE TRUST
NOTES TO FINANCIAL STATEMENTS (Unaudited) (Continued)
June 30, 2005
| (k) | Distributions to Shareholders |
The Fund’s dividends from net investment income, if any, are declared and paid quarterly. The Fund’s distributable net realized capital gains, if any, are declared and distributed at least annually.
Dividends and distributions to shareholders are determined in accordance with federal income tax regulations, which may differ from GAAP. These “book/tax” differences are considered either permanent or temporary in nature. In accordance with the American Institute of Certified Public Accountants (“AICPA”) Statement of Position 93-2, permanent differences (i.e., reclassification of market discounts, gain/loss, paydowns, and distributions) are reclassified within the capital accounts based on their nature for federal income tax purposes; temporary differences do not require reclassification. These reclassifications have no effect upon the net asset value of the Fund. To the extent distributions exceed current and accumulated earnings and profits for federal income tax purposes, these distributions are reported as distributions of paid-in-capital.
| (l) | Federal Income Taxes |
It is the policy of the Fund to qualify or continue to qualify as a “regulated investment company” by complying with the provisions available to certain investment companies, as defined in applicable sections of the U.S. Internal Revenue Code, and to make distributions of net investment income and net realized capital gains sufficient to relieve the Fund from all, or substantially all, federal income taxes.
As of June 30, 2005, the tax cost of securities and the breakdown of unrealized appreciation (depreciation) for the Fund is as follows:
Tax Cost | Unrealized Appreciation | Unrealized Depreciation | Net Unrealized Appreciation (Depreciation) | |||
$2,262,960 | $101,407,457 | $(1,395,181) | $100,012,276 |
| (m) | Allocation of Expenses, Income, and Gains and Losses |
Expenses directly attributable to the Fund are charged to the Fund. Expenses not directly attributable to the Fund are allocated proportionately among various or all funds within the Trust. The method used by the Fund for allocating income, fund level expenses, and realized and unrealized gains or losses is based on the fair value of shares outstanding relative to net assets. Under this method, each class of shares participates based on the total net asset value of that class’s shares in proportion to the total net assets of the Fund. Expenses specific to a class (such as rule 12b-1 and administrative services fees) are charged to that class.
3. Transactions with Affiliates
Under the terms of the Trust’s Investment Advisory Agreement, Gartmore Mutual Fund Capital Trust (“GMF”) manages the investment of the assets and supervises the daily business affairs of the Fund. GMF is a wholly-owned subsidiary of Gartmore Global Investments, Inc. (“GGI”), a holding company. GGI is a majority-owned subsidiary of Gartmore Global Asset Management Trust (“GGAMT”). GGAMT is a wholly-owned subsidiary of Nationwide Corporation. All of the common stock of Nationwide Corporation is held by Nationwide Mutual Insurance Company (95.2%) and Nationwide Mutual Fire Insurance Company (4.8%), each of which is a mutual company owned by its policyholders.
Under the terms of the Investment Advisory Agreement, the Fund pays GMF an investment advisory fee of 0.13% based on the Fund’s average daily net assets.
Gartmore SA Capital Trust (“GSA”) provides the Fund with various administrative and accounting services, and Gartmore Investors Services, Inc. (“GISI”), an indirect subsidiary of GSA, serves as Transfer and Dividend Disbursing Agent for the Fund. GSA and GISI have entered into agreements with BISYS Fund Services Ohio, Inc. (“BISYS”), pursuant to which BISYS provides sub-administration and sub-transfer agency services, respectively, to the Fund.
13
Table of Contents
GARTMORE VARIABLE INSURANCE TRUST
NOTES TO FINANCIAL STATEMENTS (Unaudited) (Continued)
June 30, 2005
Under the terms of a Distribution Plan under Rule 12b-1 of the 1940 Act, Gartmore Distribution Services, Inc. (“GDSI”), the Fund’s Distributor, is compensated by the Fund for expenses associated with the distribution of the shares of the Fund. These fees are based on average daily net assets of each class of shares of the Fund at an annual rate not to exceed 0.25%.
Under the terms of an Administrative Services Plan, the Fund may pay fees to servicing organizations, such as broker-dealers, including Nationwide Financial Services, and financial institutions, which agree to provide administrative support services to the shareholders of the Fund. These services include, but are not limited, to the following: establishing and maintaining shareholder accounts; processing purchase and redemption transactions; arranging bank wires; performing shareholder sub-accounting; answering inquires regarding the Fund; and other such services. These fees are based on an annual rate of up to 0.25% of the average daily net assets of each class of shares of the Fund.
Because the Fund invests primarily in other Gartmore Funds, the Fund is a shareholder of those Underlying Funds. The Underlying Funds and the Nationwide Contract do not charge the Fund any sales charge for buying or selling shares. However, the Fund indirectly pays a portion of the operating expenses, including management fees of the Underlying Funds and short-term investments the Fund holds. These expenses are deducted from the Underlying Funds before their share prices are calculated and are in addition to the fees and expenses of the Fund. Actual indirect expenses vary depending on how the Fund’s assets are spread among the underlying investments.
4. Short-Term Trading Fees
The Fund reserves the right to assess a short-term trading fee on certain transactions out of Class VI shares that a separate account makes on behalf of a variable insurance contract owner (“contract owner”). A separate account that redeems Class VI shares on behalf of a contact owner may be subject to a 1.00% short-term trading fee if the separate account held the Class VI shares on behalf of the contract owner for 60 days or less, unless an exception applies as disclosed in the prospectus. The short-term trading fee is paid directly to the Fund and is intended to offset the cost to the Fund of excess brokerage commissions and other costs associated with fluctuations in fund asset levels and cash flow caused by short-term trading. For purposes of determining whether the short-term trading fee applies, the Class VI shares that were held on behalf of the contract owner the longest will be treated as being redeemed first.
For the six months ended June 30, 2005, the Fund had no contributions to capital due to collection of redemption fees.
5. Investment Transactions
For the six months ended June 30, 2005, (excluding short-term securities) the Fund had purchases of $194,455,568 and sales of $13,239,591.
6. Bank Loans
The Trust has a credit agreement of $100,000,000. Borrowings under this arrangement bear interest at the Federal Funds rate plus 0.50%. The interest costs are included in custodian fees in the Statement of Operations. No compensation balances were required under the terms of the line of credit. There were no borrowings outstanding as of June 30, 2005.
7. Shareholder Meeting
A separate shareholders meeting was held on Tuesday, December 23, 2004, for the shareholders of the Trust’s predecessor pursuant to a Proxy Statement On Schedule 14A, dated October 29, 2004, and mailed to the shareholders of the Trust’s predecessor on or around November 5, 2004.
Two Proposals: The purpose of the December 23, 2004 meeting was to allow the shareholders of the Trust’s predecessor to vote on:
| i. | Proposal One: The election of the Trust’s Board of Trustees; and |
| ii. | Proposal Two: The approval of an “Agreement and Plan of Reorganization” that provided for the reorganization of the Trust from a Massachusetts business trust into a Delaware statutory trust. |
14
Table of Contents
GARTMORE VARIABLE INSURANCE TRUST
NOTES TO FINANCIAL STATEMENTS (Unaudited) (Continued)
June 30, 2005
Proposal One: As set forth in the October 29, 2004 Proxy Statement, the nominees for election as Trustees of the Trust’s predecessor were: Charles E. Allen, Michael J. Baresich, Paula H.J. Cholmondeley, C. Brent DeVore, Phyllis Kay Dryden, Robert M. Duncan, Barbara L. Hennigar, Paul J. Hondros, Barbara I Jacobs, Thomas J. Kerr IV, Douglas F. Kridler, Michael D. McCarthy, Arden L. Shisler, and David C. Wetmore.
Proposal Two: As specifically set forth in the October 29, 2004 Proxy Statement, the Reorganization proposal requested the shareholders of the Trust’s predecessor to approve the proposed “Agreement and Plan of Reorganization” of the Trust’s predecessor (on behalf of each of the its funds) into a new Delaware-domiciled Trust, whereby the Funds of the new Delaware Trust would acquire all of the assets of the corresponding funds of the Trust’s predecessor subject to the liabilities, expenses, costs, charges, and reserves of the corresponding funds of the Trust’s predecessor (contingent or otherwise), in exchange for shares of the acquiring Funds to be distributed pro rata by the Trust to the holders of the shares of the funds of the Trust’s predecessor, in a complete liquidation of the Trust’s predecessor.
Voting Results:
The shareholders of the Trust’s predecessor voted to approve both Proposal One and Proposal Two, as follows:
Proposal 1: Election of a Board of Trustees of Gartmore Variable Insurance Trust
Charles E. Allen: | ||
FOR | 2,797,230,318.955 shares (96.078%) | |
WITHHOLD | 114,195,693.660 shares (3.922%) | |
TOTAL | 2,912,726,012.615 shares (100.000%) | |
Michael J. Baresich: | ||
FOR | 2,796,135,979.559 shares (96.040%) | |
WITHHOLD | 115,290,033.056 shares (3.960%) | |
TOTAL | 2,912,726,012.615 shares (100.000%) | |
Paula H.J. Cholmondeley: | ||
FOR | 2,795,095,945.396 shares (96.004%) | |
WITHHOLD | 116,330,067.219 shares (3.996%) | |
TOTAL | 2,912,726,012.615 shares (100.000%) | |
C. Brent DeVore: | ||
FOR | 2,797,207,046.916 shares (96.077%) | |
WITHHOLD | 114,218,965.699 shares (3.923%) | |
TOTAL | 2,912,726,012.615 shares (100.000%) | |
Phyllis Kay Dryden: | ||
FOR | 2,795,587,023.994 shares (96.021%) | |
WITHHOLD | 115,838,988.621 shares (3.979%) | |
TOTAL | 2,912,726,012.615 shares (100.000%) | |
Robert M. Duncan: | ||
FOR | 2,790,191,720.503 shares (95.836%) | |
WITHHOLD | 121,234,292.112 shares (4.164%) | |
TOTAL | 2,912,726,012.615 shares (100.000%) | |
15
Table of Contents
GARTMORE VARIABLE INSURANCE TRUST
NOTES TO FINANCIAL STATEMENTS (Unaudited) (Continued)
June 30, 2005
Barbara L. Hennigar: | ||
FOR | 2,792,939,848.858 shares (95.937%) | |
WITHHOLD | 118,486,163.757 shares (4.070%) | |
TOTAL | 2,912,726,012.615 shares (100.000%) | |
Paul J. Hondros: | ||
FOR | 2,797,557,404.448 shares (96.089%) | |
WITHHOLD | 113,868,608.167 shares (3.911%) | |
TOTAL | 2,912,726,012.615 shares (100.000%) | |
Barbara I. Jacobs: | ||
FOR | 2,796,306,126.654 shares (96.046%) | |
WITHHOLD | 115,119,885.961 shares (3.954%) | |
TOTAL | 2,912,726,012.615 shares (100.000%) | |
Thomas J. Kerr IV: | ||
FOR | 2,789,755,720.087 shares (95.821%) | |
WITHHOLD | 121,670,292.528 shares (4.179%) | |
TOTAL | 2,912,726,012.615 shares (100.000%) | |
Douglas F. Kridler: | ||
FOR | 2,798,065,774.375 shares (96.106%) | |
WITHHOLD | 113,360,238.240 shares (3.894%) | |
TOTAL | 2,912,726,012.615 shares (100.000%) | |
Michael D. McCarthy: | ||
FOR | 2,797,452,613.694 shares (96.085%) | |
WITHHOLD | 113,973,395.921 shares (3.915%) | |
TOTAL | 2,912,726,012.615 shares (100.000%) | |
Arden L. Shisler: | ||
FOR | 2,796,738,454.730 shares (96.061%) | |
WITHHOLD | 114,687,557.885 shares (3.939%) | |
TOTAL | 2,912,726,012.615 shares (100.000%) | |
David C. Wetmore: | ||
FOR | 2,794,784,752.247 shares (95.994%) | |
WITHHOLD | 116,641,260.368 shares (4.006%) | |
TOTAL | 2,912,726,012.615 shares (100.000%) | |
Proposal 2: Approval of the Agreement and Plan of Reorganization of Gartmore Variable Insurance Trust
FOR | 2,561,003,822.546 shares (87.964%) | |
AGAINST | 103,593,261.010 shares (3.558%) | |
ABSTAIN | 246,828,929.059 shares (8.478%) | |
TOTAL | 2,912,726,012.615 shares (100.000%) | |
16
Table of Contents
GARTMORE VARIABLE INSURANCE TRUST
Management Information (Unaudited)
June 30, 2005
Trustees who are not Interested Persons (as defined in the 1940 Act) and Officers of the Funds June 30, 2005
| Name, Address and Date of Birth | Position(s) Held with the Trust and Length of Time Served1 | Principal Occupation(s) During Past 5 Years | Number of Portfolios in the Gartmore Fund Complex Overseen by Trustee | Other Directorships Held by Trustee or Nominee2 | ||||
Charles E. Allen
c/o Gartmore Global Investments, Inc. 1200 River Road, Suite 1000 Conshohocken, PA 19428
1948 | Trustee since July 2000 | Mr. Allen is Chairman, Chief Executive Officer and President of the Graimark Realty Advisors, Inc. (real estate development, investment and asset management). | 84 | None | ||||
Paula H.J. Cholmondeley
c/o Gartmore Global Investments, Inc. 1200 River Road, Suite 1000 Conshohocken, PA 19428
1940 | Trustee since July 2000 | Ms. Cholmondeley has been the Chairman and Chief Executive Officer of the Sorrel Group, a management consulting company, since January 2004. From March 2000 through December 2003, Ms. Cholmondeley was Vice President and General Manager of Sappi Fine Paper North America. Prior thereto, Ms. Cholmondeley was Vice President and General Manager of Residential Insulation of Owens Corning. | 84 | Director of Dentsply International, Inc., Ultralife Batteries, Inc., Terex Corporation, Minerals Technology, Inc. and Albany International Corp. | ||||
C. Brent DeVore
c/o Gartmore Global Investments, Inc. 1200 River Road, Suite 1000 Conshohocken, PA 19428
1940 | Trustee since 1990 | Dr. DeVore is President of Otterbein College. | 84 | None | ||||
Phyllis K. Dryden
c/o Gartmore Global Investments, Inc. 1200 River Road, Suite 1000 Conshohocken, PA 19428
1947 | Trustee since December 2004 | Ms. Dryden was a former Managing Partner of marchFIRST, a global management consulting firm prior to 2002. | 84 | None |
17
Table of Contents
GARTMORE VARIABLE INSURANCE TRUST
Management Information (Unaudited)
June 30, 2005
| Name, Address and Date of Birth | Position(s) Held with the Trust and Length of Time Served1 | Principal Occupation(s) During Past 5 Years | Number of Portfolios in the Gartmore Fund Complex Overseen by Trustee | Other Directorships Held by Trustee or Nominee2 | ||||
Barbara L. Hennigar*
c/o Gartmore Global Investments, Inc. 1200 River Road, Suite 1000 Conshohocken, PA 19428
1935 | Trustee since July 2000 | Retired since June 2000. Prior thereto, Ms. Hennigar was the Chairman or President and Chief Executive Officer of OppenheimerFunds Services and a member of the Executive Committee of OppenheimerFunds. | 84 | None | ||||
Barbara I. Jacobs
c/o Gartmore Global Investments, Inc. 1200 River Road, Suite 1000 Conshohocken, PA 19428
1950 | Trustee since December 2004 | Ms. Jacobs has served as Chairman of the Board of Directors of KICAP Network Fund, a European (United Kingdom) hedge fund, since December 2000. Prior to 2004, Ms. Jacobs was also a Managing Director and European Portfolio Manager with CREF Investments (Teachers Insurance Annuity Association — College Retirement Equity Fund). | 84 | None | ||||
Douglas F. Kridler
c/o Gartmore Global Investments, Inc. 1200 River Road, Suite 1000 Conshohocken, PA 19428
1955 | Trustee since September 1997 | Mr. Kridler has served as the President and Chief Executive Officer of the Columbus Foundation (a Columbus, OH-based foundation which manages over 1,300 individual endowment funds) since February 2002. Mr. Kridler was the President of the Columbus Association for the Performing Arts prior thereto and Chairman of the Greater Columbus Convention and Visitors Bureau during 2000 and 2001. | 84 | None | ||||
Michael D. McCarthy
c/o Gartmore Global Investments, Inc. 1200 River Road, Suite 1000 Conshohocken, PA 19428
1947 | Trustee since December 2004 | Mr. McCarthy serves as: the Founder and Chairman of The Eureka Foundation (which sponsors and funds the “Great Museums” series on PBS); and a Partner of Pineville Properties LLC (a commercial real estate development firm). | 843 | None |
18
Table of Contents
GARTMORE VARIABLE INSURANCE TRUST
Management Information (Unaudited)
June 30, 2005
| Name, Address and Date of Birth | Position(s) Held with the Trust and Length of Time Served1 | Principal Occupation(s) During Past 5 Years | Number of Portfolios in the Gartmore Fund Complex Overseen by Trustee | Other Directorships Held by Trustee or Nominee2 | ||||
David C. Wetmore
c/o Gartmore Global Investments, Inc. 1200 River Road, Suite 1000 Conshohocken, PA 19428
1948 | Trustee since 1995 and Chairman since February 2005 | Retired. Mr. Wetmore was formerly a Managing Director of Updata Capital, an investment banking and venture capital firm. | 84 | None |
| * | Pursuant to the Trust’s mandatory retirement policy, Ms. Hennigar is expected to retire on or about January 12, 2006. |
| 1 | The term of office length is until a trustee resigns or reaches a mandatory retirement age of 70. On March 2, 2000, the Board adopted a five-year implementation period for any Trustee 65 or older as of the adoption of this policy. Pursuant to this policy, Messrs. Duncan and Kerr retired as trustees effective as of March 12, 2005. |
| 2 | Directorships held in (1) any other investment companies registered under the 1940 Act, (2) any company with a class of securities registered pursuant to Section 12 of the Securities Exchange Act of 1934, as amended (the “Exchange Act”), or (3) any company subject to the requirements of Section 15(d) of the Exchange Act. |
| 3 | Mr. McCarthy was also an Administrative Committee Member for the Alphagen Arneb Fund, LLC, The Healthcare Fund LDC, The Leaders Long-Short Fund, LLC, and The Leaders Long-Short Fund LDC, four private investment companies (hedge funds) managed by GSA. Mr. McCarthy resigned as an Administrative Committee Member effective June 30, 2005. |
Trustees and Officers who are not Interested Persons (as defined in the 1940 Act) of the Funds received aggregate compensation of $274,882 from the Trust for the Six Months Ended June 30, 2005. Additional information regarding the Trustees and Officers may be found in the Trust’s statement of additional information, which is available without charge upon request, by calling 1-800-848-0920.
19
Table of Contents
GARTMORE VARIABLE INSURANCE TRUST
Management Information (Unaudited)
June 30, 2005
Trustees who are Interested Persons (as defined in the 1940 Act) and/or Officers of the Funds June 30, 2005
| Name, Address and Age | Position(s) Held with the Trust and Length of Time Served1 | Principal Occupation(s) During Past 5 Years | Number of Portfolios in the Gartmore Fund Complex Overseen by Trustee | Other Directorships Held by Trustee2 | ||||
Paul J. Hondros
Gartmore Global Investments, Inc. 1200 River Road, Suite 1000 Conshohocken, PA 19428
1948 | Trustee since July 2000 | Mr. Hondros has been President and Chief Executive Officer of various Gartmore entities, including Gartmore Distribution Services, Inc. (“GDSI”),3 Gartmore Investor Services, Inc. (“GISI”),3 Gartmore Morley Capital Management, Inc. (“GMCM”),3 Gartmore Morley Financial Services, Inc. (“GMFS”),3 NorthPointe Capital, LLC (“NorthPointe”),3 Gartmore Global Asset Management Trust (“GGAMT”)3, Gartmore Global Investments, Inc. (“GGI”)3, Gartmore Mutual Fund Capital Trust (“GMFCT”)3 and Gartmore SA Capital Trust (“GSA”)3; and a Director of Nationwide Securities, Inc.3, as well as several entities within Nationwide Financial Services, Inc. | 844 | None | ||||
Arden L. Shisler
c/o Gartmore Global Investments, Inc. 1200 River Road, Suite 1000 Conshohocken, PA 19428
1941 | Trustee since February 2000 | Mr. Shisler has been a consultant since January 2003. Prior thereto, he was President and Chief Executive Officer of K&B Transport, Inc., a trucking firm. Since 1992, Mr. Shisler has also been Chairman of the Board for Nationwide Mutual Insurance Company3. | 84 | Director of Nationwide Financial Services, Inc. | ||||
Gerald J. Holland Gartmore Global Investments, Inc. 1200 River Road, Suite 1000 Conshohocken, PA 19428 1951 | Treasurer since March 2001 | Mr. Holland is Senior Vice President – Operations for GGI3, GMFCT3 , and GSA3. Prior to July 2000, Mr, Holland was Vice President for First Data Investor Services, an investment company service provider. | 84 | None |
20
Table of Contents
GARTMORE VARIABLE INSURANCE TRUST
Management Information (Unaudited)
June 30, 2005
| Name, Address and Age | Position(s) Held with the Trust and Length of Time Served1 | Principal Occupation(s) During Past 5 Years | Number of Portfolios in the Gartmore Fund Complex Overseen by Trustee | Other Directorships Held by Trustee2 | ||||
Michael A. Krulikowski
Gartmore Global Investments, Inc. 1200 River Road, Suite 1000 Conshohocken, PA 19428
1959 | Chief Compliance Officer since June 2004 | Since November 1999, Mr. Krulikowski has served as a Vice President and Chief Compliance Officer of GGI. Prior thereto, Mr. Krulikowski served as Chief Compliance Officer of 1717 Capital Management Company/Provident Mutual Insurance Company. | 84 | None | ||||
Eric E. Miller
Gartmore Global Investments, Inc. 1200 River Road, Suite 1000 Conshohocken, PA 19428
1953 | Secretary since December 2002 | Mr. Miller is Senior Vice President, Chief Counsel for GGI3, GMFCT3 and GSA3 since August 2002. From August 2000 to August 2002, Mr. Miller was a Partner with Stradley Ronan Stevens & Young, LLP. Prior to August 2000, Mr. Miller served as Senior Vice President and Deputy General Counsel at Delaware Investments. | 84 | None |
| 1 | The term of office length is until a trustee resigns or reaches a mandatory retirement age of 70. On March 2, 2000, the Board adopted a five-year implementation period for any Trustee 65 or older as of the adoption of this policy. Pursuant to this policy, Messrs. Duncan and Kerr retired as trustees effective as of March 12, 2005. |
| 2 | Directorships held in (1) any other investment companies registered under the 1940 Act, (2) any company with a class of securities registered pursuant to Section 12 of the Securities Exchange Act of 1934, as amended (the “Exchange Act”), or (3) any company subject to the requirements of Section 15(d) of the Exchange Act. |
| 3 | This position is held with an affiliated person or principal underwriter of the Trust. |
| 4 | Mr. Hondros was also an Administrative Committee Member for the Alphagen Arneb Fund, LLC, The Healthcare Fund LDC, The Leaders Long-Short Fund, LLC, and The Leaders Long-Short Fund LDC, four private investment companies (hedge funds) managed by GSA. Mr. Hondros resigned as Administrative Committee Member effective June 30, 2005. |
Federal law requires the Trust, each of its investment advisers and sub-advisers to adopt procedures for voting proxies (“Proxy Voting Guidelines”) and to provide a summary of those Proxy Voting Guidelines used to vote the securities held by the Funds. The Funds’ proxy voting policies and procedures are available without charge (i) upon request, by calling 1-800-848-0920, (ii) on the Fund’s website at www.gartmorefunds.com, or (iii) on the Securities and Exchange Commission’s website at www.sec.gov.
21
Table of Contents
Gartmore GVIT Investor Destinations Moderately Conservative Fund
Semiannual Report
| | June 30, 2005 |
| Contents | ||
| 6 | Statement of Investments | |
| 7 | Statement of Assets and Liabilities | |
| 7 | Statement of Operations | |
| 8 | Statements of Changes in New Assets | |
| 9 | Financial Highlights | |
| 10 | Notes to Financial Statements | |
Commentary provided by Gartmore Global Investments, investment adviser to Gartmore Variable Insurance Trust. All opinions and estimates included in this report constitute Gartmore Global Investments’ judgment as of the date of this report and are subject to change without notice.
Statement Regarding Availability of Quarterly Portfolio Schedule.
The Gartmore Variable Insurance Trust files complete schedules of portfolio holdings for each Fund with the Securities and Exchange Commission (the “Commission”) for the first and third quarters of each fiscal year on Form N-Q. The Funds’ Forms N-Q are available on the Commission’s website at http://www.sec.gov. The Funds’ Forms N-Q may be reviewed and copied at the Commission’s Public Reference Room in Washington, DC, and information on the operation of the Public Reference Room may be obtained by calling 800-SEC-0330; and the Funds make the information on Form N-Q available to shareholders upon request without charge.
Statement Regarding Availability of Proxy Voting Record.
Information regarding how the Fund voted proxies relating to portfolio securities held during the most recent 12-month period ended June 30, 2005 is available without charge, upon request, by calling 800-848-0920, and on the Commission’s website at http://www.sec.gov.
Table of Contents
Gartmore GVIT Investor Destinations Moderately Conservative Fund
For the semiannual reporting period ended June 30, 2005, the Gartmore GVIT Investor Destinations Moderately Conservative Fund returned 1.01% (Class II at NAV) versus 0.87% for its benchmark, which consists of 40% S&P 500® Index, 35% Lehman Brothers U.S. Aggregate Index and 25% Citigroup 3-Month T-Bill Index. For broader comparison, the average return for the Fund’s Lipper peer category of Income Funds was 1.30%.
The year began with a slide after the strong fourth quarter of 2004, with cyclical and small-capitalization stocks among the worst performers. January was characterized by mixed economic data, increasing interest rates, disappointing earnings reports and climbing oil prices. In addition, gross domestic product (GDP) growth for the fourth quarter of 2004 was released in January, and it came in weaker than expected at 3.1%, primarily as a result of the foreign trade deficit. The markets were able to reverse course in February, even as oil prices continued to climb and the productivity report showed a continued slowdown. In March, the markets resumed their downward slide due to a combination of the trade deficit, mixed economic news, high oil prices and rising interest rates.
For most of April, equity markets were dogged by continuing inflation concerns as the price of oil climbed above $57 per barrel. April closed with the announcement of one of the biggest jumps in the Consumer Price Index (CPI) in several months—the CPI had risen 0.6% in March. May featured the announcement of continued weak first quarter GDP growth of 3.1%. Despite concerns about economic deceleration, slowing profit growth, and continued high oil prices, first quarter earnings reports remained strong. June brought a slowdown in the equity market rally that had begun in May as the specter of economic deceleration dampened markets. In addition, the price of oil continued to pressure equity markets as it climbed to a record high of $60 per barrel.
As expected, short-term interest rates moved upward during the period, causing the yield curve to flatten dramatically. The Federal Reserve Board through the Federal Open Market Committee continued its “measured pace” of monetary tightening by raising the federal funds rate 25 basis points on four occasions during the reporting period; the rate rose from 2.25% to 3.25%.
The chart below illustrates how each of the Fund’s underlying funds contributed to or detracted from overall performance.
| Underlying Fund | Six-Month Return* | Target Allocation | ||
| Gartmore Bond Index Fund | 2.39% | 35% | ||
| Short-Term Investments | 2.31% | 25% | ||
| Gartmore S&P 500 Index Fund | -0.89% | 20% | ||
| Gartmore International Index Fund | -1.34% | 10% | ||
| Gartmore Mid Cap Market Index Fund | 3.80% | 10% | ||
| Gartmore GVIT Investor Destinations Moderately Conservative Fund — Class II | 1.01% | 100% |
| * | Index returns represented by Institutional Share Class. |
The Fund will continue to pursue its primary goal of maximizing total investment return by seeking income and, secondarily, long-term growth of capital. The Fund will remain weighted toward bonds and short-term investments while including substantial stock investments for long-term growth.
PORTFOLIO MANAGERS: Young Chin, Co-Global Chief Investment Officer-Equities, heads the Fund’s portfolio management team and is responsible for the day-to-day management of the allocation of the Fund’s assets among the asset classes and Underlying Funds.
When discussing asset allocation theory and the three major asset classes, short-term investments typically are represented by an investment in 90-day Treasury bills. The short-term investments component of the Gartmore GVIT Investor Destinations Funds comprises an investment in one or a combination of the following: the Gartmore Morley Enhanced Income Fund (a short-term fixed-income fund), the Gartmore Money Market Fund and/or the Nationwide Contract (a fixed-interest contract issued and guaranteed by the Nationwide Life Insurance Company). While there can be no guarantee, it is believed that this strategy will provide a return in excess of the 90-day T-bill without substantially increasing risk.
The Gartmore GVIT Investor Destinations Funds are designed to provide diversification and asset allocation across several types of investments and asset classes, primarily by investing in underlying funds. Therefore, in addition to the expenses of the Gartmore GVIT Investor Destinations Funds, you are indirectly paying a proportionate share of the applicable fees and expenses of the underlying funds. International investing involves additional risks, including currency fluctuations, differences in accounting standards, political instability and foreign regulations, all of which are magnified in emerging markets. Small-company stocks have higher risks than the stocks of larger, more established companies and have significant short-term price volatility.
1
Table of Contents
Gartmore GVIT Investor Destinations Moderately Conservative Fund (continued)
Investing in mutual funds involves risk, including possible loss of principal.
There is no assurance that the investment objective of any fund will be achieved.
The Gartmore GVIT Investor Destinations Moderately Conservative Fund benchmark consists of 40% S&P 500 Index, 35% Lehman Brothers U.S. Aggregate Bond Index, and 25% Citigroup 3-Month T-Bill Index.
Citigroup 3-Month T-Bill Index: An unmanaged index that is generally representative of 3-month Treasury bills; consists of an average of the last 3-month Treasury bill issues (excluding the current month-end bill).
Lehman Brothers U.S. Aggregate Bond Index: An unmanaged, market value-weighted index of investment-grade, fixed-rate debt issues (including government, corporate, asset-backed, and mortgage-backed securities with maturities of one year or more) that is generally representative of the bond market as a whole.
Standard & Poor’s 500 (S&P 500) Index: An unmanaged, capitalization-weighted index of 500 widely held stocks of large-cap U.S. companies that gives a broad look at how the stock prices of those companies have performed.
Lipper Analytical Services, Inc. is an industry research firm whose rankings are based on total return performance and do not reflect the effects of sales charges.
The Gartmore Variable Insurance Trust Funds are available only as sub-account investment options in certain variable insurance products. Accordingly, investors are unable to invest in shares of these funds outside of an insurance product. Performance information found herein reflects only the performance of these funds, and does not indicate the performance your sub-account may experience under your variable insurance contract. Performance returns assume reinvestment of all distributions. The investment return and principal value of an investment will fluctuate so that an investor’s shares, when redeemed, may be worth more or less than their original cost. Index performance is provided for comparison purposes only; the indexes shown are unmanaged and do not reflect any fees or expenses. Investors cannot invest directly in market indexes. To obtain performance information about the sub-account option under your insurance contract that invests in one of these funds, please contact your variable insurance carrier. PAST PERFORMANCE IS NO GUARANTEE OF FUTURE RESULTS.
Commentary provided by Gartmore Global Investments. All opinions and estimates included in this report constitute Gartmore Global Investments’ judgment as of the date of this report and are subject to change without notice.
Investors should carefully consider a fund’s investment objectives, risks, fees, charges and expenses before investing any money. To obtain this and other information on Gartmore Variable Insurance Trust, please contact your variable insurance contract provider or call 800-848-0920. Please read the Trust’s prospectus carefully before investing any money.
Gartmore Funds distributed by Gartmore Distribution Services, Inc., Member NASD. 1200 River Road, Suite 1000, Conshohocken, PA 19428.
2
Table of Contents
Fund Performance | Gartmore GVIT Investor Destinations Moderately Conservative Fund |
| Average | Annual Total Return1 |
(For Periods Ended June 30, 2005)
| Six months* | One year | Inception2 | ||||
| Class II3 | 1.01% | 6.56% | 4.96% | |||
| Class VI4 | 1.11% | 6.68% | 5.01% |
| * | Not Annualized. |
| 1 | Not subject to any sales charges. |
| 2 | Fund commenced operations on December 12, 2001. |
| 3 | Existing shares were designated Class II shares as of April 29, 2004. |
| 4 | These returns through December 31, 2003 were achieved prior to the creation of Class VI shares and include the performance of the Fund’s Class II shares. Excluding the effect of periodic fee waivers or reimbursements, such prior performance is substantially similar to what Class VI shares would have produced because Class VI shares invest in the same portfolio of securities as Class II shares and have the same expenses. Class VI shares’ returns do not reflect the short-term trading fees applicable to such shares; if these fees were deducted, the annual returns for Class VI shares earned by the variable contract owner would have been lower. |
| Performance | of a $10,000 Investment |
Investment return and principal value will fluctuate, and when redeemed, shares may be worth more or less than original cost. Past performance is no guarantee of future results and does not reflect the deduction of taxes that a shareholder would pay on fund distributions or the redemption of fund shares. Investing in mutual funds involves market risk, including loss of principal. Performance returns assume the reinvestment of all distributions.
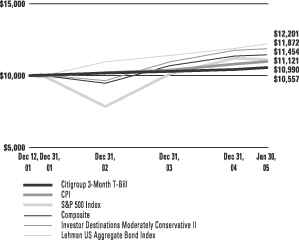
Comparative performance of $10,000 invested in Class II shares of the Gartmore GVIT Investor Destinations Moderately Conservative Fund, Lehman Brothers Aggregate Bond Index (LB Aggregate Bond)(a), S&P 500 Index (S&P 500)(b), the Citigroup 3-Month T Bill Index(c), the Moderately Conservative Composite Index(d), and the Consumer Price Index (CPI)(e) since inception. Unlike the Fund, the returns for these unmanaged indexes do not reflect any fees, expenses, or sales charges. Investors cannot invest directly in market indexes.
| (a) | LB U.S. Aggregate Bond Index is an unmanaged, market value-weighted index of investment-grade, fixed-rate debt issues (including government, corporate, asset-backed, and mortgage-backed securities with maturities of one year or more) that is generally representative of the bond market as a whole. |
| (b) | S&P 500 is an unmanaged, market capitalization-weighted index of 500 widely held stocks of large-cap U.S. companies that gives a broad look at how the stock prices of those companies have performed. |
| (c) | The Citigroup 3-Month T Bill Index is an average of the last 3-month treasury bill issues (excluding the current month-end bill). |
| (d) | The Moderately Conservative Composite is an unmanaged, hypothetical representation of the performance of each of the Fund’s asset classes according to their respective weightings. The Moderate Composite is a combination of LB Aggregate Bond (35%), S&P 500 (40%), and Citigroup 3-Month T Bill Index (25%). |
| (e) | The CPI represents changes in prices of a basket of goods and services purchased for consumption by urban households. |
3
Table of Contents
Shareholder
Expense Example | Gartmore GVIT Investor Destinations Moderately Conservative Fund |
As a shareholder of the Fund, you incur two types of costs: (1) transaction costs, including sales charges (loads) paid on purchase payments and redemption fees; and (2) ongoing costs, including investment advisory fees, administration fees, distribution fees and other Fund expenses. The examples below are intended to help you understand your ongoing costs (in dollars) of investing in the Fund and to compare these costs with the ongoing costs of investing in other mutual funds. Per SEC requirements, the examples assume that you had a $1,000 investment in the Class at the beginning of the reporting period, January 1, 2005, and continued to hold your shares at the end of the reporting period, June 30, 2005.
Actual Expenses
For each Class of the Fund in the table below, the first line provides information about actual account values and actual expenses. You may use the information in this line, together with the amount you invested, to estimate the expenses that you paid over the period. Simply divide your account value by $1,000 (for example, an $8,600 account value divided by $1,000 = 8.6), then multiply the result by the number in the first line of each Class under the heading entitled “Expenses Paid During Period” to estimate the expenses you paid on your account during the period.
Hypothetical Example for Comparison Purposes
The second line of each Class in the table below provides information about hypothetical account values and hypothetical expenses based on the Class’ actual expense ratio and an assumed rate of return of 5% per year before expenses, which is not the Class’ actual return. The hypothetical account values and expenses may not be used to estimate the actual ending account balance or expenses you paid for the period. You may use this information to compare the ongoing costs of investing in the Class of the Fund and other funds. To do so, compare this 5% hypothetical example with the 5% hypothetical examples that appear in the shareholder reports of the other funds.
Please note that the expenses shown in the table are meant to highlight your ongoing costs only and do not reflect any transaction costs, such as sales charges (loads) or redemption fees. Therefore, the second line for each Class in the table is useful in comparing ongoing costs only, and will not help you determine the relative total costs of owning different funds. In addition, if these transaction costs were included, your costs would have been higher. The examples also assume all dividends and distributions have been reinvested.
| Beginning Account Value, January 1, 2005 | Ending Account Value, June 30, 2005 | Expenses Paid During Period* | Annualized Expense Ratio* | ||||||||||
| Investor Destinations Moderately Conservative Fund | |||||||||||||
Class II | Actual | $ | 1,000 | $ | 1,010 | $ | 2.79 | 0.56% | |||||
| Hypothetical1 | $ | 1,000 | $ | 1,022 | $ | 2.81 | 0.56% | ||||||
Class VI | Actual | $ | 1,000 | $ | 1,011 | $ | 2.04 | 0.41% | |||||
| Hypothetical1 | $ | 1,000 | $ | 1,023 | $ | 2.06 | 0.41% | ||||||
| * | Expenses are equal to the Fund’s annualized expense ratio multiplied by the average account value over the period multiplied by 181/365 (to reflect the one-half year period). The expense ratio presented represents a six month, annualized ratio in accordance with SEC guidelines. |
| 1 | Represents the hypothetical 5% return before expenses. |
4
Table of Contents
Portfolio Summary
June 30, 2005 | Gartmore GVIT Investor Destinations Moderately Conservative Fund |
The SEC adopted a requirement that Funds present their portfolio holdings in a table, chart or graph format in their annual and semiannual reports to shareholders, whether or not a statement of investments is utilized. The following tables, which present portfolio holdings as a percentage of net assets, are provided in compliance with this requirement.
| Asset Allocation | ||
| Mutual Funds | 87.4% | |
| Fixed Contract | 12.5% | |
| Other assets in excess of liabilities | 0.1% | |
| 100.0% | ||
| Asset Allocation Detail | ||
| Fixed Income Funds | 47.6% | |
| Equity Funds | 39.8% | |
| Fixed Contract | 12.5% | |
| Other | 0.1% | |
| 100.0% | ||
| Top Holdings | ||
| Gartmore Bond Index Fund, Institutional Class | 35.1% | |
| Gartmore S&P 500 Index Fund, Institutional Class | 19.8% | |
| Nationwide Fixed Contract, 3.50% | 12.5% | |
Gartmore Morley Enhanced Income Fund, Institutional Class | 12.5% | |
Gartmore International Index Fund, Institutional Class | 10.0% | |
Gartmore Mid Cap Market Index Fund, Institutional Class | 10.0% | |
| Other Holdings | 0.1% | |
| 100.0% | ||
5
Table of Contents
GARTMORE VARIABLE INSURANCE TRUST
GARTMORE GVIT INVESTOR DESTINATIONS MODERATELY CONSERVATIVE FUND
Statement of Investments — June 30, 2005 (Unaudited)
| Shares or Principal Amount | Value | |||||
| MUTUAL FUNDS (87.4%) | ||||||
| Equity Funds (39.8%) | ||||||
| Gartmore International Index Fund, Institutional Class (b) | 5,893,805 | $ | 47,739,823 | |||
| Gartmore Mid Cap Market Index Fund, Institutional Class (b) | 3,298,256 | 47,659,804 | ||||
| Gartmore S&P 500 Index Fund, Institutional Class (b) | 9,256,808 | 95,067,421 | ||||
| 190,467,048 | ||||||
| Fixed Income Funds (47.6%) | ||||||
| Gartmore Bond Index Fund, Institutional Class (b) | 15,131,160 | 167,804,568 | ||||
| Gartmore Morley Enhanced Income Fund, Institutional Class (b) | 6,559,443 | 59,822,124 | ||||
| 227,626,692 | ||||||
| Total Mutual Funds | 418,093,740 | |||||
| FIXED CONTRACT (12.5%) | ||||||
| Nationwide Fixed Contract, 3.50% (b) (c) | $ | 59,827,779 | 59,827,779 | |||
| Total Fixed Contract | 59,827,779 | |||||
| Total Investments (Cost $448,797,660) (a) — 99.9% | 477,921,519 | |||||
| Other assets in excess of liabilities — 0.1% | 589,555 | |||||
| NET ASSETS — 100.0% | $ | 478,511,074 | ||||
| (a) | See notes to financial statements for unrealized appreciation (depreciation) of securities. |
| (b) | Investment in affiliate. |
| (c) | The Nationwide Fixed Contract rate changes quarterly. The security is restricted and as the affiliated counterparty is required by contract to redeem within five days upon request, and it has been deemed liquid pursuant to procedures approved by the Board of Trustees in accordance with rule 144A under the Securities Act of 1933, as amended. |
See notes to financial statements.
6
Table of Contents
GARTMORE VARIABLE INSURANCE TRUST
GARTMORE GVIT INVESTOR DESTINATIONS MODERATELY CONSERVATIVE FUND
Statement of Assets and Liabilities
June 30, 2005 (Unaudited)
Assets: | |||
Investments in affiliated securities, at value (cost $448,797,660) | $ | 477,921,519 | |
Cash | 42 | ||
Interest and dividends receivable | 768,152 | ||
Prepaid expenses and other assets | 29,938 | ||
Total Assets | 478,719,651 | ||
Liabilities: | |||
Accrued expenses and other payables: | |||
Investment advisory fees | 50,769 | ||
Distribution fees | 97,634 | ||
Administrative servicing fees | 52,063 | ||
Other | 8,111 | ||
Total Liabilities | 208,577 | ||
Net Assets | $ | 478,511,074 | |
Represented by: | |||
Capital | $ | 448,013,710 | |
Accumulated net investment income (loss) | 95,123 | ||
Accumulated net realized gain (losses) from investment transactions | 1,278,382 | ||
Net unrealized appreciation (depreciation) on investments | 29,123,859 | ||
Net Assets | $ | 478,511,074 | |
Net Assets: | |||
Class II Shares | $ | 476,244,605 | |
Class VI Shares | 2,266,469 | ||
Total | $ | 478,511,074 | |
Shares outstanding (unlimited number of shares authorized): | |||
Class II Shares | 44,093,218 | ||
Class VI Shares | 210,057 | ||
Total | 44,303,275 | ||
Net asset value and offering price per share:* | |||
Class II Shares | $ | 10.80 | |
Class VI Shares | $ | 10.79 |
| * | Not subject to a front-end sales charge. |
For the Six Months Ended June 30, 2005 (Unaudited)
Investment Income: | ||||
Interest income from affiliates | $ | 958,826 | ||
Interest income | 21 | |||
Dividend income from affiliates | 5,824,532 | |||
Total Income | 6,783,379 | |||
Expenses: | ||||
Investment advisory fees | 290,439 | |||
Distribution Fees Class II | 557,043 | |||
Distribution Fees Class VI | 1,499 | |||
Administrative servicing fees Class II Shares | 325,593 | |||
Other** | 70,776 | |||
Total Expenses | 1,245,350 | |||
Net Investment Income (Loss) | 5,538,029 | |||
REALIZED/UNREALIZED GAINS (LOSSES) ON INVESTMENTS: | ||||
Net realized gains (losses) on investment transactions | 1,976,933 | |||
Net change in unrealized appreciation/depreciation on investments | (2,640,808 | ) | ||
Net realized/unrealized gains (losses) on investments | (663,875 | ) | ||
CHANGE IN NET ASSETS RESULTING FROM OPERATIONS | $ | 4,874,154 | ||
| ** | Other expenses may include the following fees: audit, custody, insurance, legal, printing, trustee, and out-of-pocket expenses. |
See notes to financial statements.
7
Table of Contents
GARTMORE VARIABLE INSURANCE TRUST
GARTMORE GVIT INVESTOR DESTINATIONS MODERATELY CONSERVATIVE FUND
Statement of Changes in Net Assets
| Six Months Ended June 30, 2005 | Year Ended December 31, 2004 | |||||||
| (Unaudited) | ||||||||
From Investment Activities: | ||||||||
Operations: | ||||||||
Net investment income (loss) | $ | 5,538,029 | $ | 8,096,593 | ||||
Net realized gains (losses) on investment transactions | 1,976,933 | 5,515,979 | ||||||
Net change in unrealized appreciation/depreciation on investments | (2,640,808 | ) | 12,674,367 | |||||
Change in net assets resulting from operations | 4,874,154 | 26,286,939 | ||||||
Distributions to Class II Shareholders from: | ||||||||
Net investment income | (5,420,576 | ) | (8,143,739 | )(a) | ||||
Net realized gains on investments | (3,944,963 | ) | (2,371,530 | )(a) | ||||
Distributions to Class VI Shareholders from: | ||||||||
Net investment income | (22,330 | ) | (9,518 | )(b) | ||||
Net realized gains on investments | (18,823 | ) | (1,641 | )(b) | ||||
Change in net assets from shareholder distributions | (9,406,692 | ) | (10,526,428 | ) | ||||
Change in net assets from capital transactions | 57,258,610 | 151,495,887 | ||||||
Change in net assets | 52,726,072 | 167,256,398 | ||||||
Net Assets: | ||||||||
Beginning of period | 425,785,002 | 258,528,604 | ||||||
End of period | $ | 478,511,074 | $ | 425,785,002 | ||||
CAPITAL TRANSACTIONS: | ||||||||
Class II Shares | ||||||||
Proceeds from shares issued | $ | 70,171,329 | $ | 166,759,578 | (a) | |||
Dividends reinvested | 9,365,519 | 10,515,242 | (a) | |||||
Cost of shares redeemed | (23,844,104 | ) | (26,475,605 | )(a) | ||||
| 55,692,744 | 150,799,215 | |||||||
Class VI Shares | ||||||||
Proceeds from shares issued | 1,548,085 | 817,280 | (b) | |||||
Dividends reinvested | 41,153 | 11,159 | (b) | |||||
Cost of shares redeemed | (23,372 | ) | (131,767 | )(b) | ||||
| 1,565,866 | 696,672 | |||||||
Change in net assets from capital transactions | $ | 57,258,610 | $ | 151,495,887 | ||||
SHARE TRANSACTIONS: | ||||||||
Class II Shares | ||||||||
Issued | 6,470,940 | 15,804,279 | (a) | |||||
Reinvested | 869,265 | 986,049 | (a) | |||||
Redeemed | (2,202,821 | ) | (2,503,232 | )(a) | ||||
| 5,137,384 | 14,287,096 | |||||||
Class VI Shares | ||||||||
Issued | 142,441 | 77,407 | (b) | |||||
Reinvested | 3,821 | 1,038 | (b) | |||||
Redeemed | (2,163 | ) | (12,487 | )(b) | ||||
| 144,099 | 65,958 | |||||||
| (a) | On April 30, 2004, the existing share Class of the Fund’s was renamed Class II Shares. |
| (b) | For the period from April 30, 2004 (commencement of operations) through December 31, 2004. |
See notes to financial statements.
8
Table of Contents
GARTMORE GVIT INVESTOR DESTINATIONS MODERATELY CONSERVATIVE FUND
Selected Data for Each Share of Capital Outstanding
Gartmore GVIT Investor Destinations Moderately Conservative Fund
| Investment Activities | Distributions | Ratios/Supplemental Data | |||||||||||||||||||||||||||||||||||||||||
| Net Asset Value, Beginning of Period | Net Investment Income | Net Realized and Unrealized Gains (Losses) on Investments | Total from Investment Activities | Net Investment Income | Net Realized Gains | Total Distributions | Net Asset Value, End of Period | Total Return | Net Assets at End of Period (000s) | Ratio of Expenses to Average Net Assets | Ratio of Net Investment Income (Loss) to Average Net Assets | Ratio of Expenses (Prior to Reimbursements) to Average Net Assets(a) | Ratio of Net Investment Income (Loss) (Prior to Reimbursements) to Average Net Assets(a) | Portfolio Turnover(b) | |||||||||||||||||||||||||||||
Class II Shares | |||||||||||||||||||||||||||||||||||||||||||
Period Ended December 31, 2001(c) | $ | 10.00 | 0.03 | 0.04 | 0.07 | (0.03 | ) | — | (0.03 | ) | $ | 10.04 | 0.65% | (e) | $ | 503 | 0.61% | (f) | 4.56% | (f) | 24.88% | (f) | (19.71% | )(f) | 0.60% | ||||||||||||||||||
Year Ended December 31, 2002 | $ | 10.04 | 0.18 | (0.60 | ) | (0.42 | ) | (0.18 | ) | (0.01 | ) | (0.19 | ) | $ | 9.43 | (4.15% | ) | $ | 95,669 | 0.56% | 2.96% | (g | ) | (g | ) | 35.19% | |||||||||||||||||
Year Ended December 31, 2003 | $ | 9.43 | 0.21 | 1.07 | 1.28 | (0.21 | ) | (0.02 | ) | (0.23 | ) | $ | 10.48 | 13.70% | $ | 258,529 | 0.56% | 2.32% | (g | ) | (g | ) | 12.61% | ||||||||||||||||||||
Year Ended December 31, 2004(d) | $ | 10.48 | 0.23 | 0.50 | 0.73 | (0.23 | ) | (0.07 | ) | (0.30 | ) | $ | 10.91 | 7.16% | $ | 425,066 | 0.56% | 2.35% | (g | ) | (g | ) | 7.18% | ||||||||||||||||||||
Six Months Ended June 30, 2005 (Unaudited) | $ | 10.91 | 0.13 | (0.02 | ) | 0.11 | (0.13 | ) | (0.09 | ) | (0.22 | ) | $ | 10.80 | 1.01% | (e) | $ | 476,245 | 0.56% | (f) | 2.48% | (f) | (g | ) | (g | ) | 3.54% | ||||||||||||||||
Class VI Shares | |||||||||||||||||||||||||||||||||||||||||||
Period Ended December 31, 2004(h) | $ | 10.44 | 0.20 | 0.49 | 0.69 | (0.20 | ) | (0.03 | ) | (0.23 | ) | $ | 10.90 | 6.67% | (e) | $ | 719 | 0.41% | (f) | 3.37% | (f) | (g | ) | (g | ) | 7.18% | |||||||||||||||||
Six Months Ended June 30, 2005 (Unaudited) | $ | 10.90 | 0.14 | (0.02 | ) | 0.12 | (0.14 | ) | (0.09 | ) | (0.23 | ) | $ | 10.79 | 1.11% | (e) | $ | 2,266 | 0.41% | (f) | 2.84% | (f) | (g | ) | (g | ) | 3.54% | ||||||||||||||||
| (a) | During the period certain fees were waived and/or reimbursed. If such waivers/reimbursements had not occurred, the ratios would have been as indicated. |
| (b) | Portfolio turnover is calculated on the basis of the Fund as a whole without distinguishing among the classes of shares. |
| (c) | For the period from December 12, 2001 (commencement of operations) through December 31, 2001. |
| (d) | On April 30, 2004, the existing share Class of the Fund was renamed Class II Shares. |
| (e) | Not annualized. |
| (f) | Annualized. |
| (g) | There were no fee reductions during the period. |
| (h) | For the period from April 30, 2004 (commencement of operations) through December 31, 2004. |
See notes to financial statements.
9
Table of Contents
GARTMORE VARIABLE INSURANCE TRUST
NOTES TO FINANCIAL STATEMENTS (Unaudited)
June 30, 2005
1. Organization
Gartmore Variable Insurance Trust (“GVIT” or the “Trust”) is an open-end management investment company, organized under the laws of Delaware by an amended and restated Agreement and Declaration of Trust, dated October 28, 2004, as amended to date. The Trust, originally created under the laws of Massachusetts as a Massachusetts business trust pursuant to a Declaration of Trust dated, as of June 30, 1981, as subsequently amended, redomesticated as a Delaware Statutory Trust after the close of trading on April 29, 2005, and is registered under the Investment Company Act of 1940, as amended (the “1940 Act”). The redomestication is a change in statutory status and does not affect the operations of the Trust. As of June 30, 2005, the Trust had authorized an unlimited number of shares of beneficial interest (“shares”) without par value. The Trust currently offers shares to life insurance company separate accounts to fund the benefits under variable life insurance or annuity policies. To date, only the separate accounts of Nationwide Life Insurance Company and Nationwide Life and Annuity Insurance Company (collectively, “Nationwide”) have purchased shares of the Trust’s series. The Trust operates thirty-one (31) separate series, or mutual funds, each with its own investment objectives and strategies. This report contains the financial statements and financial highlights of the Gartmore GVIT Investor Destinations Moderately Conservative Fund (the “Fund”).
The Fund is constructed as a “fund of funds,” which means that the Fund pursues its investment objective primarily by allocating the Fund’s investments among other mutual funds (the “Underlying Funds”). The Underlying Funds typically invest, either directly or indirectly, in stocks, bonds, and other securities including the Nationwide Contract. The Nationwide Contract is a fixed interest contract issued and guaranteed by Nationwide. This contract has a stable principal value and will pay the Fund a fixed rate of interest. The fixed interest rate must be at least 3.50% (on an annual basis), but may be higher and is currently adjusted on a quarterly basis. Nationwide will calculate the interest rate in the same way that it calculates guaranteed interest rates for similar contracts. Because the contract is not guaranteed by Nationwide, assuming no default, the Fund receives no more or less than the guaranteed amount and will not directly participate in the actual experience of the assets underlying the contract. Although under certain market conditions the Fund’s performance may be hurt by its investment in the Nationwide Contract, the portfolio management team believes that the relatively stable nature of the Nationwide Contract should reduce the Fund’s volatility and overall risk, especially when the bond and stock markets decline simultaneously. The Fund’s target allocation range is 10-20%.
Under the Trust’s organizational documents, the Trust’s officers and trustees are indemnified against certain liabilities arising out of the performance of their duties to the Trust. In addition, the Trust has entered into Indemnification Agreements with the Trust’s trustees and certain officers covering similar liabilities. In addition, in the normal course of business, the Trust enters into contracts with its vendors and. others that provide for general indemnifications The Trust’s maximum exposure under these arrangements is unknown, as this would involve future claims that may be made against the Trust. Based on experience, however, the Trust expects that risk of loss to be remote.
2. Summary of Significant Accounting Policies
The following is a summary of significant accounting policies followed by the Funds in the preparation of its financial statements. The policies are in conformity with accounting principles generally accepted in the United States of America (“GAAP”). The preparation of financial statements requires management to make estimates and assumptions that affect the reported amounts of assets and liabilities, the disclosure of contingent assets and liabilities at the date of the financial statements and the reported amounts of income and expenses for the period. Actual results could differ from those estimates.
| (a) | Security Valuation |
Shares of the Underlying Funds in which the Fund invests are valued at their respective net asset values as reported by the Underlying Funds. The securities in the Underlying Funds generally are valued as of the close of business of the regular session of trading on the New York Stock Exchange (usually at 4 p.m. Eastern time). The Underlying Funds generally value securities and assets at current market value. Under most circumstances, the fixed interest contract is valued at par value each day, which is deemed to be fair value. The par value is calculated each day by the summation of the following factors: prior day’s par value; prior day’s interest accrued (par multiplied by guaranteed fixed rate); and current day net purchase or redemption.
10
Table of Contents
GARTMORE VARIABLE INSURANCE TRUST
NOTES TO FINANCIAL STATEMENTS (Unaudited) (Continued)
June 30, 2005
| (b) | Repurchase Agreements |
The Fund may enter into repurchase agreements with an entity which is a member of the Federal Reserve System or which is a “primary dealer” (as designated by the Federal Reserve Bank of New York) in U.S. Government obligations. The repurchase price generally equals the price paid by the Fund plus interest negotiated on the basis of current short-term rates, which may be more or less than the rate on the underlying portfolio securities. The seller under a repurchase agreement is required to maintain the value of the collateral held pursuant to the agreement at a market value equal to or greater than the repurchase price (including accrued interest). Collateral subject to repurchase agreements is held by the Fund’s custodian or another qualified sub-custodian or in the Federal Reserve/Treasury book-entry system. If the counterparty defaults and the fair value of the collateral declines, realization of the collateral by the Fund may be delayed or limited. The Fund may transfer uninvested cash balances into a pooled cash account. These balances are invested in one or more repurchase agreements, which are fully collateralized by AA-rated Corporate Bonds with the counterparties of CS First Boston and Nomura Securities.
| (c) | Foreign Currency Transactions |
The accounting records of the Fund are maintained in U.S. dollars. Foreign currency amounts are translated into U.S. dollars at the current rate of exchange to determine the value of investments, assets and liabilities. The Fund may enter into foreign currency contracts in connection with purchases or sales of securities denominated in a foreign currency. Purchases and sales of securities, and income and expenses, are translated at the prevailing rate of exchange on the respective date of these transactions. The Fund does not isolate that portion of the results of operations resulting from changes in foreign exchange rates on investments from fluctuations arising from changes in market prices of securities held. These fluctuations are included with the net realized and unrealized gain or loss from investments and foreign currencies.
| (d) | Risks Associated with Foreign Securities and Currencies |
Investments in securities of foreign issuers carry certain risks not ordinarily associated with investments in securities of U.S. issuers. These risks include future political and economic developments, and the possible imposition of exchange controls or other foreign governmental laws and restrictions. In addition, with respect to certain countries, there is the possibility of expropriation of assets, confiscatory taxation, political or social instability, or diplomatic developments, which could adversely affect investments in those countries.
Certain countries also may impose substantial restrictions on investments in their capital markets by foreign entities, including restrictions on investments in issuers of industries deemed sensitive to relevant national interests. These factors may limit the investment opportunities available and result in a lack of liquidity and high price volatility with respect to securities of issuers from developing countries.
| (e) | Forward Foreign Currency Contracts |
The Fund may enter into forward foreign currency contracts in connection with planned purchases or sales of securities or to hedge the U.S. dollar value of portfolio securities denominated in a particular currency. The Fund could be exposed to risks if the counterparties to the contracts are unable to meet the terms of their contracts and from unanticipated movements in the value of a foreign currency relative to the U.S. dollar. Forward foreign currency contracts are valued at the current cost of covering these contracts, as provided by an independent pricing service approved by the Board of Trustees. The forward foreign currency contracts are adjusted by the daily exchange rate of the underlying currency and any gains or losses are recorded for financial statement purposes as unrealized gains or losses until the contract settlement date.
| (f) | Futures Contracts |
The Fund may invest in financial futures contracts (“futures contracts”) for the purpose of hedging its existing portfolio securities or securities that the Fund intends to purchase against fluctuations in value caused by changes in prevailing market interest rates or prices. Futures contracts may also be entered into for non-hedging purposes.
11
Table of Contents
GARTMORE VARIABLE INSURANCE TRUST
NOTES TO FINANCIAL STATEMENTS (Unaudited) (Continued)
June 30, 2005
Upon entering into a futures contract, the Fund is required to pledge to the broker an amount of cash and/or other assets equal to a certain percentage of the contract amount (initial margin deposit). Subsequent payments, known as “variation margin,” are made each day, depending on the daily fluctuations in the fair value/market value of the underlying assets. A gain or loss equal to the daily variation margin is recognized on a daily basis. Futures contracts are valued daily at their last quoted sale price.
A “sale” of a futures contract means a contractual obligation to deliver the securities or foreign currency called for by the contract at a fixed price at a specified time in the future. A “purchase” of a futures contract means a contractual obligation to acquire the securities or foreign currency at a fixed price at a specified time in the future.
Should market conditions change unexpectedly, the Fund may not achieve the anticipated benefits of the futures contracts and may realize a loss. The use of futures transactions for hedging purposes involves the risk of imperfect correlation in movements in the price of futures contracts, interest rates, and the value of the underlying hedged assets.
| (g) | Written Options Contracts |
The Fund may write options contracts. A written option obligates the Fund to deliver (written call) or to receive (written put) a specified quantity of an underlying asset at the contract amount upon exercise by the holder of the option. The value of the option contract is recorded as a liability and unrealized gain or loss is measured by the difference between the current value and the premium received. Options traded on an exchange are valued at the last quoted sale price, or in the absence of a sale, the bid price provided by an independent pricing service approved by the Board of Trustees. Non-exchange traded options are valued using dealer supplied quotes.
| (h) | Mortgage Dollar Rolls |
The Fund may enter into mortgage “dollar rolls” in which the Fund sells mortgage-backed securities for delivery in the current month and simultaneously contracts to repurchase substantially similar (same type, coupon, and maturity) securities on a specified future date. Mortgage dollar rolls are referred to as TBA’s on the Statement of Investments of the Fund. During the roll period, the Fund foregoes principal and interest paid on the mortgage-backed securities. The Fund is compensated by fee income or the difference between the current sales price and the lower forward price for the future purchase. Mortgage dollar rolls are valued at the last quoted bid price and/or by using a combination of daily quotes and matrix evaluations provided by an independent pricing service, the use of which has been approved by the Board of Trustees.
| (i) | Short Sales |
The Fund is authorized to engage in short-selling of portfolio securities which obligates the Fund to replace any security that the Fund has borrowed by purchasing the security at current market value sometime in the future. The Fund will incur a loss if the price of the security increases between the date of the short sale and the date on which the Fund replaces the borrowed security. The Fund generally will realize a gain if the price of the security declines between these dates. Until the Fund replaces the borrowed security, the Fund will maintain a segregated account with cash, U.S. Government securities and/or securities held long to sufficiently cover the Fund’s short position on a daily basis. Dividends declared on securities sold short are recorded as an expense on the ex-dividend date and paid to the counterparty on the dividend pay date. The collateral for securities sold short are recorded as an expense on the ex-dividend date and paid to the counterparty on the dividend pay date. The collateral for securities sold short includes the deposits with brokers and securities held long as shown in the Statement of Investments for the Fund.
| (j) | Security Transactions and Investment Income |
Security transactions are accounted for on the date the security is purchased or sold (“trade date”). Securities gains and losses are calculated on the identified cost basis. Interest income is recognized on the accrual basis and includes, where applicable, the amortization or accretion of premium or discount. Dividend income is recorded on the ex-dividend date.
12
Table of Contents
GARTMORE VARIABLE INSURANCE TRUST
NOTES TO FINANCIAL STATEMENTS (Unaudited) (Continued)
June 30, 2005
| (k) | Distributions to Shareholders |
The Fund’s dividends from net investment income, if any, are declared and paid quarterly. The Fund’s distributable net realized capital gains, if any, are declared and distributed at least annually.
Dividends and distributions to shareholders are determined in accordance with federal income tax regulations, which may differ from GAAP. These “book/tax” differences are considered either permanent or temporary in nature. In accordance with the American Institute of Certified Public Accountants (“AICPA”) Statement of Position 93-2, permanent differences (i.e., reclassification of market discounts, gain/loss, paydowns, and distributions) are reclassified within the capital accounts based on their nature for federal income tax purposes; temporary differences do not require reclassification. These reclassifications have no effect upon the net asset value of the Fund. To the extent distributions exceed current and accumulated earnings and profits for federal income tax purposes, these distributions are reported as distributions of paid-in-capital.
| (l) | Federal Income Taxes |
It is the policy of the Fund to qualify or continue to qualify as a “regulated investment company” by complying with the provisions available to certain investment companies, as defined in applicable sections of the U.S. Internal Revenue Code, and to make distributions of net investment income and net realized capital gains sufficient to relieve the Fund from all, or substantially all, federal income taxes.
As of June 30, 2005, the tax cost of securities and the breakdown of unrealized appreciation (depreciation) for the Fund is as follows:
Tax Cost | Unrealized Appreciation | Unrealized Depreciation | Net Unrealized Appreciation (Depreciation) | |||
$690,124 | $29,429,590 | $(995,855) | $28,433,735 |
| (m) | Allocation of Expenses, Income, and Gains and Losses |
Expenses directly attributable to the Fund are charged to the Fund. Expenses not directly attributable to the Fund are allocated proportionately among various or all funds within the Trust. The method used by the Fund for allocating income, fund level expenses, and realized and unrealized gains or losses is based on the fair value of shares outstanding relative to net assets. Under this method, each class of shares participates based on the total net asset value of that class’s shares in proportion to the total net assets of the Fund. Expenses specific to a class (such as rule 12b-1 and administrative services fees) are charged to that class.
3. Transactions with Affiliates
Under the terms of the Trust’s Investment Advisory Agreement, Gartmore Mutual Fund Capital Trust (“GMF”) manages the investment of the assets and supervises the daily business affairs of the Fund. GMF is a wholly-owned subsidiary of Gartmore Global Investments, Inc. (“GGI”), a holding company. GGI is a majority-owned subsidiary of Gartmore Global Asset Management Trust (“GGAMT”). GGAMT is a wholly-owned subsidiary of Nationwide Corporation. All of the common stock of Nationwide Corporation is held by Nationwide Mutual Insurance Company (95.2%) and Nationwide Mutual Fire Insurance Company (4.8%), each of which is a mutual company owned by its policyholders.
Under the terms of the Investment Advisory Agreement, the Fund pays GMF an investment advisory fee of 0.13% based on the Fund’s average daily net assets.
Gartmore SA Capital Trust (“GSA”) provides the Fund with various administrative and accounting services, and Gartmore Investors Services, Inc. (“GISI”), an indirect subsidiary of GSA, serves as Transfer and Dividend Disbursing Agent for the Fund. GSA and GISI have entered into agreements with BISYS Fund Services Ohio, Inc. (“BISYS”), pursuant to which BISYS provides sub-administration and sub-transfer agency services, respectively, to the Fund.
13
Table of Contents
GARTMORE VARIABLE INSURANCE TRUST
NOTES TO FINANCIAL STATEMENTS (Unaudited) (Continued)
June 30, 2005
Under the terms of a Distribution Plan under Rule 12b-1 of the 1940 Act, Gartmore Distribution Services, Inc. (“GDSI”), the Funds’ Distributor, is compensated by the Fund for expenses associated with the distribution of the shares of the Fund. These fees are based on average daily net assets of each class of shares of the Fund at an annual rate not to exceed 0.25%.
Under the terms of an Administrative Services Plan, the Fund may pay fees to servicing organizations, such as broker-dealers, including Nationwide Financial Services, and financial institutions, which agree to provide administrative support services to the shareholders of the Fund. These services include, but are not limited, to the following: establishing and maintaining shareholder accounts; processing purchase and redemption transactions; arranging bank wires; performing shareholder sub-accounting; answering inquires regarding the Fund; and other such services. These fees are based on an annual rate of up to 0.25% of the average daily net assets of each class of shares of the Fund.
Because the Fund invests primarily in other Gartmore Funds, the Fund is a shareholder of those Underlying Funds. The Underlying Funds and the Nationwide Contract do not charge the Fund any sales charge for buying or selling shares. However, the Fund indireclty pays a portion of the operating expenses, including management fees of the Underlying Funds and short-term investments the Fund holds. These expenses are deducted from the Underlying Funds before their share prices are calculated and are in addition to the fees and expenses of the Fund. Actual indirect expenses vary depending on how the Fund’s assets are spread among the underlying investments.
4. Short-Term Trading Fees
The Fund reserves the right to assess a short-term trading fee on certain transactions out of Class VI shares that a separate account makes on behalf of a variable insurance contract owner (the “contract owner”). A separate account that redeems Class VI shares on behalf of a contract owner may be subject to a 1.00% short-term trading fee if the separate account held the Class VI shares on behalf of the contract owner for 60 days or less, unless an exception applies as disclosed in the prospectus. The short-term trading fee is paid directly to the Fund and is intended to offset the cost to the Fund of excess brokerage commissions and other costs associated with fluctuations in fund asset levels and cash flow caused by short-term trading. For purposes of determining whether the short-term trading fee applies, the Class VI shares that were held on behalf of the contract owner the longest will be treated as being redeemed first.
For the six months ended June 30, 2005, the Fund had no contributions to capital due to collection of redemption fees.
5. Investment Transactions
For the six months ended June 30, 2005, (excluding short-term securities) the Fund had purchases of $60,387,519 and sales of $13,942,100.
6. Bank Loans
The Trust has a credit agreement of $100,000,000. Borrowings under this arrangement bear interest at the Federal Funds rate plus 0.50%. The interest costs are included in custodian fees in the Statement of Operations. No compensation balances were required under the terms of the line of credit. There were no borrowings outstanding as of June 30, 2005.
7. Shareholder Meeting
A separate shareholders meeting was held on Tuesday, December 23, 2004, for the shareholders of the Trust’s predecessor pursuant to a Proxy Statement On Schedule 14A, dated October 29, 2004, and mailed to the shareholders of the Trust’s predecessor on or around November 5, 2004.
Two Proposals: The purpose of the December 23, 2004 meeting was to allow the shareholders of the Trust’s predecessor to vote on:
| i. | Proposal One: The election of the Trust’s Board of Trustees; and |
| ii. | Proposal Two: The approval of an “Agreement and Plan of Reorganization” that provided for the reorganization of the Trust from a Massachusetts business trust into a Delaware statutory trust. |
14
Table of Contents
GARTMORE VARIABLE INSURANCE TRUST
NOTES TO FINANCIAL STATEMENTS (Unaudited) (Continued)
June 30, 2005
Proposal One: As set forth in the October 29, 2004 Proxy Statement, the nominees for election as Trustees of the Trust’s predecessor were: Charles E. Allen, Michael J. Baresich, Paula H.J. Cholmondeley, C. Brent DeVore, Phyllis Kay Dryden, Robert M. Duncan, Barbara L. Hennigar, Paul J. Hondros, Barbara I Jacobs, Thomas J. Kerr IV, Douglas F. Kridler, Michael D. McCarthy, Arden L. Shisler, and David C. Wetmore.
Proposal Two: As specifically set forth in the October 29, 2004 Proxy Statement, the Reorganization proposal requested the shareholders of the Trust’s predecessor to approve the proposed “Agreement and Plan of Reorganization” of the Trust’s predecessor (on behalf of each of the its funds) into a new Delaware-domiciled Trust, whereby the Funds of the new Delaware Trust would acquire all of the assets of the corresponding funds of the Trust’s predecessor subject to the liabilities, expenses, costs, charges, and reserves of the corresponding funds of the Trust’s predecessor (contingent or otherwise), in exchange for shares of the acquiring Funds to be distributed pro rata by the Trust to the holders of the shares of the funds of the Trust’s predecessor, in a complete liquidation of the Trust’s predecessor.
Voting Results:
The shareholders of the Trust’s predecessor voted to approve both Proposal One and Proposal Two, as follows:
Proposal 1: Election of a Board of Trustees of Gartmore Variable Insurance Trust
Charles E. Allen: | ||
FOR | 2,797,230,318.955 shares (96.078%) | |
WITHHOLD | 114,195,693.660 shares (3.922%) | |
TOTAL | 2,912,726,012.615 shares (100.000%) | |
Michael J. Baresich: | ||
FOR | 2,796,135,979.559 shares (96.040%) | |
WITHHOLD | 115,290,033.056 shares (3.960%) | |
TOTAL | 2,912,726,012.615 shares (100.000%) | |
Paula H.J. Cholmondeley: | ||
FOR | 2,795,095,945.396 shares (96.004%) | |
WITHHOLD | 116,330,067.219 shares (3.996%) | |
TOTAL | 2,912,726,012.615 shares (100.000%) | |
C. Brent DeVore: | ||
FOR | 2,797,207,046.916 shares (96.077%) | |
WITHHOLD | 114,218,965.699 shares (3.923%) | |
TOTAL | 2,912,726,012.615 shares (100.000%) | |
Phyllis Kay Dryden: | ||
FOR | 2,795,587,023.994 shares (96.021%) | |
WITHHOLD | 115,838,988.621 shares (3.979%) | |
TOTAL | 2,912,726,012.615 shares (100.000%) | |
Robert M. Duncan: | ||
FOR | 2,790,191,720.503 shares (95.836%) | |
WITHHOLD | 121,234,292.112 shares (4.164%) | |
TOTAL | 2,912,726,012.615 shares (100.000%) | |
15
Table of Contents
GARTMORE VARIABLE INSURANCE TRUST
NOTES TO FINANCIAL STATEMENTS (Unaudited) (Continued)
June 30, 2005
Barbara L. Hennigar: | ||
FOR | 2,792,939,848.858 shares (95.937%) | |
WITHHOLD | 118,486,163.757 shares (4.070%) | |
TOTAL | 2,912,726,012.615 shares (100.000%) | |
Paul J. Hondros: | ||
FOR | 2,797,557,404.448 shares (96.089%) | |
WITHHOLD | 113,868,608.167 shares (3.911%) | |
TOTAL | 2,912,726,012.615 shares (100.000%) | |
Barbara I. Jacobs: | ||
FOR | 2,796,306,126.654 shares (96.046%) | |
WITHHOLD | 115,119,885.961 shares (3.954%) | |
TOTAL | 2,912,726,012.615 shares (100.000%) | |
Thomas J. Kerr IV: | ||
FOR | 2,789,755,720.087 shares (95.821%) | |
WITHHOLD | 121,670,292.528 shares (4.179%) | |
TOTAL | 2,912,726,012.615 shares (100.000%) | |
Douglas F. Kridler: | ||
FOR | 2,798,065,774.375 shares (96.106%) | |
WITHHOLD | 113,360,238.240 shares (3.894%) | |
TOTAL | 2,912,726,012.615 shares (100.000%) | |
Michael D. McCarthy: | ||
FOR | 2,797,452,613.694 shares (96.085%) | |
WITHHOLD | 113,973,395.921 shares (3.915%) | |
TOTAL | 2,912,726,012.615 shares (100.000%) | |
Arden L. Shisler: | ||
FOR | 2,796,738,454.730 shares (96.061%) | |
WITHHOLD | 114,687,557.885 shares (3.939%) | |
TOTAL | 2,912,726,012.615 shares (100.000%) | |
David C. Wetmore: | ||
FOR | 2,794,784,752.247 shares (95.994%) | |
WITHHOLD | 116,641,260.368 shares (4.006%) | |
TOTAL | 2,912,726,012.615 shares (100.000%) | |
Proposal 2: Approval of the Agreement and Plan of Reorganization of Gartmore Variable Insurance Trust
FOR | 2,561,003,822.546 shares (87.964%) | |
AGAINST | 103,593,261.010 shares (3.558%) | |
ABSTAIN | 246,828,929.059 shares (8.478%) | |
TOTAL | 2,912,726,012.615 shares (100.000%) | |
16
Table of Contents
GARTMORE VARIABLE INSURANCE TRUST
Management Information (Unaudited)
June 30, 2005
Trustees who are not Interested Persons (as defined in the 1940 Act) and Officers of the Funds June 30, 2005
| Name, Address and Date of Birth | Position(s) Held with the Trust and Length of Time Served1 | Principal Occupation(s) During Past 5 Years | Number of Portfolios in the Gartmore Fund Complex Overseen by Trustee | Other Directorships Held by Trustee or Nominee2 | ||||
Charles E. Allen
c/o Gartmore Global Investments, Inc. 1200 River Road, Suite 1000 Conshohocken, PA 19428
1948 | Trustee since July 2000 | Mr. Allen is Chairman, Chief Executive Officer and President of the Graimark Realty Advisors, Inc. (real estate development, investment and asset management). | 84 | None | ||||
Paula H.J. Cholmondeley
c/o Gartmore Global Investments, Inc. 1200 River Road, Suite 1000 Conshohocken, PA 19428
1940 | Trustee since July 2000 | Ms. Cholmondeley has been the Chairman and Chief Executive Officer of the Sorrel Group, a management consulting company, since January 2004. From March 2000 through December 2003, Ms. Cholmondeley was Vice President and General Manager of Sappi Fine Paper North America. Prior thereto, Ms. Cholmondeley was Vice President and General Manager of Residential Insulation of Owens Corning. | 84 | Director of Dentsply International, Inc., Ultralife Batteries, Inc., Terex Corporation, Minerals Technology, Inc. and Albany International Corp. | ||||
C. Brent DeVore
c/o Gartmore Global Investments, Inc. 1200 River Road, Suite 1000 Conshohocken, PA 19428
1940 | Trustee since 1990 | Dr. DeVore is President of Otterbein College. | 84 | None | ||||
Phyllis K. Dryden
c/o Gartmore Global Investments, Inc. 1200 River Road, Suite 1000 Conshohocken, PA 19428
1947 | Trustee since December 2004 | Ms. Dryden was a former Managing Partner of marchFIRST, a global management consulting firm prior to 2002. | 84 | None |
17
Table of Contents
GARTMORE VARIABLE INSURANCE TRUST
Management Information (Unaudited)
June 30, 2005
| Name, Address and Date of Birth | Position(s) Held with the Trust and Length of Time Served1 | Principal Occupation(s) During Past 5 Years | Number of Portfolios in the Gartmore Fund Complex Overseen by Trustee | Other Directorships Held by Trustee or Nominee2 | ||||
Barbara L. Hennigar*
c/o Gartmore Global Investments, Inc. 1200 River Road, Suite 1000 Conshohocken, PA 19428
1935 | Trustee since July 2000 | Retired since June 2000. Prior thereto, Ms. Hennigar was the Chairman or President and Chief Executive Officer of OppenheimerFunds Services and a member of the Executive Committee of OppenheimerFunds. | 84 | None | ||||
Barbara I. Jacobs
c/o Gartmore Global Investments, Inc. 1200 River Road, Suite 1000 Conshohocken, PA 19428
1950 | Trustee since December 2004 | Ms. Jacobs has served as Chairman of the Board of Directors of KICAP Network Fund, a European (United Kingdom) hedge fund, since December 2000. Prior to 2004, Ms. Jacobs was also a Managing Director and European Portfolio Manager with CREF Investments (Teachers Insurance Annuity Association — College Retirement Equity Fund). | 84 | None | ||||
Douglas F. Kridler
c/o Gartmore Global Investments, Inc. 1200 River Road, Suite 1000 Conshohocken, PA 19428
1955 | Trustee since September 1997 | Mr. Kridler has served as the President and Chief Executive Officer of the Columbus Foundation (a Columbus, OH-based foundation which manages over 1,300 individual endowment funds) since February 2002. Mr. Kridler was the President of the Columbus Association for the Performing Arts prior thereto and Chairman of the Greater Columbus Convention and Visitors Bureau during 2000 and 2001. | 84 | None | ||||
Michael D. McCarthy
c/o Gartmore Global Investments, Inc. 1200 River Road, Suite 1000 Conshohocken, PA 19428
1947 | Trustee since December 2004 | Mr. McCarthy serves as: the Founder and Chairman of The Eureka Foundation (which sponsors and funds the “Great Museums” series on PBS); and a Partner of Pineville Properties LLC (a commercial real estate development firm). | 843 | None |
18
Table of Contents
GARTMORE VARIABLE INSURANCE TRUST
Management Information (Unaudited)
June 30, 2005
| Name, Address and Date of Birth | Position(s) Held with the Trust and Length of Time Served1 | Principal Occupation(s) During Past 5 Years | Number of Portfolios in the Gartmore Fund Complex Overseen by Trustee | Other Directorships Held by Trustee or Nominee2 | ||||
David C. Wetmore
c/o Gartmore Global Investments, Inc. 1200 River Road, Suite 1000 Conshohocken, PA 19428
1948 | Trustee since 1995 and Chairman since February 2005 | Retired. Mr. Wetmore was formerly a Managing Director of Updata Capital, an investment banking and venture capital firm. | 84 | None |
| * | Pursuant to the Trust’s mandatory retirement policy, Ms. Hennigar is expected to retire on or about January 12, 2006. |
| 1 | The term of office length is until a trustee resigns or reaches a mandatory retirement age of 70. On March 2, 2000, the Board adopted a five-year implementation period for any Trustee 65 or older as of the adoption of this policy. Pursuant to this policy, Messrs. Duncan and Kerr retired as trustees effective as of March 12, 2005. |
| 2 | Directorships held in (1) any other investment companies registered under the 1940 Act, (2) any company with a class of securities registered pursuant to Section 12 of the Securities Exchange Act of 1934, as amended (the “Exchange Act”), or (3) any company subject to the requirements of Section 15(d) of the Exchange Act. |
| 3 | Mr. McCarthy was also an Administrative Committee Member for the Alphagen Arneb Fund, LLC, The Healthcare Fund LDC, The Leaders Long-Short Fund, LLC, and The Leaders Long-Short Fund LDC, four private investment companies (hedge funds) managed by GSA. Mr. McCarthy resigned as an Administrative Committee Member effective June 30, 2005. |
Trustees and Officers who are not Interested Persons (as defined in the 1940 Act) of the Funds received aggregate compensation of $274,882 from the Trust for the Six Months Ended June 30, 2005. Additional information regarding the Trustees and Officers may be found in the Trust’s statement of additional information, which is available without charge upon request, by calling 1-800-848-0920.
19
Table of Contents
GARTMORE VARIABLE INSURANCE TRUST
Management Information (Unaudited)
June 30, 2005
Trustees who are Interested Persons (as defined in the 1940 Act) and/or Officers of the Funds June 30, 2005
| Name, Address and Age | Position(s) Held with the Trust and Length of Time Served1 | Principal Occupation(s) During Past 5 Years | Number of Portfolios in the Gartmore Fund Complex Overseen by Trustee | Other Directorships Held by Trustee2 | ||||
Paul J. Hondros
Gartmore Global Investments, Inc. 1200 River Road, Suite 1000 Conshohocken, PA 19428
1948 | Trustee since July 2000 | Mr. Hondros has been President and Chief Executive Officer of various Gartmore entities, including Gartmore Distribution Services, Inc. (“GDSI”),3 Gartmore Investor Services, Inc. (“GISI”),3 Gartmore Morley Capital Management, Inc. (“GMCM”),3 Gartmore Morley Financial Services, Inc. (“GMFS”),3 NorthPointe Capital, LLC (“NorthPointe”),3 Gartmore Global Asset Management Trust (“GGAMT”)3, Gartmore Global Investments, Inc. (“GGI”)3, Gartmore Mutual Fund Capital Trust (“GMFCT”)3 and Gartmore SA Capital Trust (“GSA”)3; and a Director of Nationwide Securities, Inc.3, as well as several entities within Nationwide Financial Services, Inc. | 844 | None | ||||
Arden L. Shisler
c/o Gartmore Global Investments, Inc. 1200 River Road, Suite 1000 Conshohocken, PA 19428
1941 | Trustee since February 2000 | Mr. Shisler has been a consultant since January 2003. Prior thereto, he was President and Chief Executive Officer of K&B Transport, Inc., a trucking firm. Since 1992, Mr. Shisler has also been Chairman of the Board for Nationwide Mutual Insurance Company3. | 84 | Director of Nationwide Financial Services, Inc. | ||||
Gerald J. Holland Gartmore Global Investments, Inc. 1200 River Road, Suite 1000 Conshohocken, PA 19428 1951 | Treasurer since March 2001 | Mr. Holland is Senior Vice President – Operations for GGI3, GMFCT3 , and GSA3. Prior to July 2000, Mr, Holland was Vice President for First Data Investor Services, an investment company service provider. | 84 | None |
20
Table of Contents
GARTMORE VARIABLE INSURANCE TRUST
Management Information (Unaudited)
June 30, 2005
| Name, Address and Age | Position(s) Held with the Trust and Length of Time Served1 | Principal Occupation(s) During Past 5 Years | Number of Portfolios in the Gartmore Fund Complex Overseen by Trustee | Other Directorships Held by Trustee2 | ||||
Michael A. Krulikowski
Gartmore Global Investments, Inc. 1200 River Road, Suite 1000 Conshohocken, PA 19428
1959 | Chief Compliance Officer since June 2004 | Since November 1999, Mr. Krulikowski has served as a Vice President and Chief Compliance Officer of GGI. Prior thereto, Mr. Krulikowski served as Chief Compliance Officer of 1717 Capital Management Company/Provident Mutual Insurance Company. | 84 | None | ||||
Eric E. Miller
Gartmore Global Investments, Inc. 1200 River Road, Suite 1000 Conshohocken, PA 19428
1953 | Secretary since December 2002 | Mr. Miller is Senior Vice President, Chief Counsel for GGI3, GMFCT3 and GSA3 since August 2002. From August 2000 to August 2002, Mr. Miller was a Partner with Stradley Ronan Stevens & Young, LLP. Prior to August 2000, Mr. Miller served as Senior Vice President and Deputy General Counsel at Delaware Investments. | 84 | None |
| 1 | The term of office length is until a trustee resigns or reaches a mandatory retirement age of 70. On March 2, 2000, the Board adopted a five-year implementation period for any Trustee 65 or older as of the adoption of this policy. Pursuant to this policy, Messrs. Duncan and Kerr retired as trustees effective as of March 12, 2005. |
| 2 | Directorships held in (1) any other investment companies registered under the 1940 Act, (2) any company with a class of securities registered pursuant to Section 12 of the Securities Exchange Act of 1934, as amended (the “Exchange Act”), or (3) any company subject to the requirements of Section 15(d) of the Exchange Act. |
| 3 | This position is held with an affiliated person or principal underwriter of the Trust. |
| 4 | Mr. Hondros was also an Administrative Committee Member for the Alphagen Arneb Fund, LLC, The Healthcare Fund LDC, The Leaders Long-Short Fund, LLC, and The Leaders Long-Short Fund LDC, four private investment companies (hedge funds) managed by GSA. Mr. Hondros resigned as Administrative Committee Member effective June 30, 2005. |
Federal law requires the Trust, each of its investment advisers and sub-advisers to adopt procedures for voting proxies (“Proxy Voting Guidelines”) and to provide a summary of those Proxy Voting Guidelines used to vote the securities held by the Funds. The Funds’ proxy voting policies and procedures are available without charge (i) upon request, by calling 1-800-848-0920, (ii) on the Fund’s website at www.gartmorefunds.com, or (iii) on the Securities and Exchange Commission’s website at www.sec.gov.
21
Table of Contents
Gartmore GVIT Investor Destinations Conservative Fund
Semiannual Report
| | June 30, 2005 |
| Contents | ||
| 6 | Statement of Investments | |
| 7 | Statement of Assets and Liabilities | |
| 7 | Statement of Operations | |
| 8 | Statements of Changes in New Assets | |
| 9 | Financial Highlights | |
| 10 | Notes to Financial Statements | |
Commentary provided by Gartmore Global Investments, investment adviser to Gartmore Variable Insurance Trust. All opinions and estimates included in this report constitute Gartmore Global Investments’ judgment as of the date of this report and are subject to change without notice.
Statement Regarding Availability of Quarterly Portfolio Schedule.
The Gartmore Variable Insurance Trust files complete schedules of portfolio holdings for each Fund with the Securities and Exchange Commission (the “Commission”) for the first and third quarters of each fiscal year on Form N-Q. The Funds’ Forms N-Q are available on the Commission’s website at http://www.sec.gov. The Funds’ Forms N-Q may be reviewed and copied at the Commission’s Public Reference Room in Washington, DC, and information on the operation of the Public Reference Room may be obtained by calling 800-SEC-0330; and the Funds make the information on Form N-Q available to shareholders upon request without charge.
Statement Regarding Availability of Proxy Voting Record.
Information regarding how the Fund voted proxies relating to portfolio securities held during the most recent 12-month period ended June 30, 2005 is available without charge, upon request, by calling 800-848-0920, and on the Commission’s website at http://www.sec.gov.
Table of Contents
Gartmore GVIT Investor Destinations Conservative Fund
For the semiannual period ended June 30, 2005, the Gartmore GVIT Investor Destinations Conservative Fund returned 1.23% (Class II at NAV) versus 1.29% for its benchmark. The benchmark which consists of 45% Citigroup 3-Month T-Bill Index, 35% Lehman Brothers U.S. Aggregate Index and 20% S&P 500® Index. For broader comparison, the average return for the Fund’s Lipper peer category of Income Funds was 1.30%.
The year began with a slide after the strong fourth quarter of 2004, with cyclical and small-capitalization stocks among the worst performers. January was characterized by mixed economic data, increasing interest rates, disappointing earnings reports and climbing oil prices. In addition, gross domestic product (GDP) growth for the fourth quarter of 2004 was released in January, and it came in weaker than expected at 3.1%, primarily as a result of the foreign trade deficit. The markets were able to reverse course in February, even as oil prices continued to climb and the productivity report showed a continued slowdown. In March, the markets resumed their downward slide due to a combination of the trade deficit, mixed economic news, high oil prices and rising interest rates.
For most of April, equity markets were dogged by continuing inflation concerns as the price of oil climbed above $57 per barrel. April closed with the announcement of one of the biggest jumps in the Consumer Price Index (CPI) in several months—the CPI had risen 0.6% in March. May featured the announcement of continued weak first quarter GDP growth of 3.1%. Despite concerns about economic deceleration, slowing profit growth, and continued high oil prices, first quarter earnings reports remained strong. June brought a slowdown in the equity market rally that had begun in May as the specter of economic deceleration dampened markets. In addition, the price of oil continued to pressure equity markets as it climbed to a record high of $60 per barrel.
As expected, short-term interest rates moved upward during the period, causing the yield curve to flatten dramatically. The Federal Reserve Board through the Federal Open Market Committee continued its “measured pace” of monetary tightening by raising the federal funds rate 25 basis points on four occasions during the reporting period; the rate rose from 2.25% to 3.25%.
The chart below illustrates how each of the Fund’s underlying funds contributed to or detracted from overall performance.
| Underlying Fund | Six-Month Return* | Target Allocation | ||
| Short-Term Investments | 2.31% | 40% | ||
| Gartmore Bond Index Fund | 2.39% | 35% | ||
| Gartmore S&P 500 Index Fund | -0.89% | 10% | ||
| Gartmore International Index Fund | -1.34% | 5% | ||
| Gartmore Mid Cap Market Index Fund | 3.80% | 5% | ||
| Gartmore Money Market Fund | 1.10% | 5% | ||
| Gartmore GVIT Investor Destinations Conservative Fund — Class II | 1.23% | 100% |
| * | Index returns represented by Institutional Share Class. |
The Fund will continue to pursue its primary goal of maximizing total investment return by seeking income and, secondarily, long-term growth of capital. The Fund will remain weighted toward bonds and short-term investments while including some stock investments for long-term growth.
PORTFOLIO MANAGERS: Young Chin, Co-Global Chief Investment Officer-Equities, heads the Fund’s portfolio management team and is responsible for the day-to-day management of the allocation of the Fund’s assets among the asset classes and Underlying Funds.
When discussing asset allocation theory and the three major asset classes, short-term investments typically are represented by an investment in 90-day Treasury bills. The short-term investments component of the Gartmore GVIT Investor Destinations Funds comprises an investment in one or a combination of the following: the Gartmore Morley Enhanced Income Fund (a short-term fixed-income fund), the Gartmore Money Market Fund and/or the Nationwide Contract (a fixed-interest contract issued and guaranteed by the Nationwide Life Insurance Company). While there can be no guarantee, it is believed that this strategy will provide a return in excess of the 90-day T-bill without substantially increasing risk.
The Gartmore GVIT Investor Destinations Funds are designed to provide diversification and asset allocation across several types of investments and asset classes, primarily by investing in underlying funds. Therefore, in addition to the expenses of the Gartmore GVIT Investor Destinations Funds, you are indirectly paying a proportionate share of the applicable fees and expenses of the underlying funds. International investing involves additional risks, including currency fluctuations, differences in accounting standards, political instability and foreign regulations, all of which are magnified in emerging markets. Small-company stocks have higher risks than the stocks of larger, more established companies and have significant short-term price volatility.
1
Table of Contents
Gartmore GVIT Investor Destinations Conservative Fund (continued)
Investing in mutual funds involves risk, including possible loss of principal.
There is no assurance that the investment objective of any fund will be achieved.
The Gartmore GVIT Investor Destinations Conservative Fund benchmark consists of 45% Citigroup 3-Month T-Bill Index, 35% Lehman Brothers U.S. Aggregate Bond Index, and 20% S&P 500 Index.
Citigroup 3-Month T-Bill Index: An unmanaged index that is generally representative of 3-month Treasury bills; consists of an average of the last 3-month Treasury bill issues (excluding the current month-end bill).
Lehman Brothers U.S. Aggregate Bond Index: An unmanaged, market value-weighted index of investment-grade, fixed-rate debt issues (including government, corporate, asset-backed, and mortgage-backed securities with maturities of one year or more) that is generally representative of the bond market as a whole.
Standard & Poor’s 500 (S&P 500) Index: An unmanaged, capitalization-weighted index of 500 widely held stocks of large-cap U.S. companies that gives a broad look at how the stock prices of those companies have performed.
Lipper Analytical Services, Inc. is an industry research firm whose rankings are based on total return performance and do not reflect the effects of sales charges.
The Gartmore Variable Insurance Trust Funds are available only as sub-account investment options in certain variable insurance products. Accordingly, investors are unable to invest in shares of these funds outside of an insurance product. Performance information found herein reflects only the performance of these funds, and does not indicate the performance your sub-account may experience under your variable insurance contract. Performance returns assume reinvestment of all distributions. The investment return and principal value of an investment will fluctuate so that an investor’s shares, when redeemed, may be worth more or less than their original cost. Index performance is provided for comparison purposes only; the indexes shown are unmanaged and do not reflect any fees or expenses. Investors cannot invest directly in market indexes. To obtain performance information about the sub-account option under your insurance contract that invests in one of these funds, please contact your variable insurance carrier. PAST PERFORMANCE IS NO GUARANTEE OF FUTURE RESULTS.
Commentary provided by Gartmore Global Investments. All opinions and estimates included in this report constitute Gartmore Global Investments’ judgment as of the date of this report and are subject to change without notice.
Investors should carefully consider a fund’s investment objectives, risks, fees, charges and expenses before investing any money. To obtain this and other information on Gartmore Variable Insurance Trust, please contact your variable insurance contract provider or call 800-848-0920. Please read the Trust’s prospectus carefully before investing any money.
Gartmore Funds distributed by Gartmore Distribution Services, Inc., Member NASD. 1200 River Road, Suite 1000, Conshohocken, PA 19428.
2
Table of Contents
Fund Performance | Gartmore GVIT Investor Destinations Conservative Fund |
| Average | Annual Total Return1 |
(For Periods Ended June 30, 2005)
| Six months* | One year | Inception2 | ||||
| Class II3 | 1.23% | 4.94% | 4.06% | |||
| Class VI4 | 1.23% | 5.14% | 4.11% |
| * | Not Annualized. |
| 1 | Not subject to any sales charges. |
| 2 | Fund commenced operations on December 12, 2001. |
| 3 | Existing shares were designated Class II shares as of April 29, 2004. |
| 4 | These returns through December 31, 2003 were achieved prior to the creation of Class VI shares and include the performance of the Fund’s Class II shares. Excluding the effect of periodic fee waivers or reimbursements, such prior performance is substantially similar to what Class VI shares would have produced because Class VI shares invest in the same portfolio of securities as Class II shares and have the same expenses. Class VI shares’ returns do not reflect the short-term trading fees applicable to such shares; if these fees were deducted, the annual returns for Class VI shares earned by the variable contract owner would have been lower. |
| Performance | of a $10,000 Investment |
Investment return and principal value will fluctuate, and when redeemed, shares may be worth more or less than original cost. Past performance is no guarantee of future results and does not reflect the deduction of taxes that a shareholder would pay on fund distributions or the redemption of fund shares. Investing in mutual funds involves market risk, including loss of principal. Performance returns assume the reinvestment of all distributions.
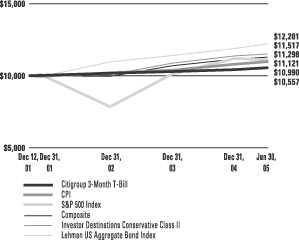
Comparative performance of $10,000 invested in Class II shares of the Gartmore GVIT Investor Destinations Conservative Fund, Lehman Brothers Aggregate Bond Index (LB Aggregate Bond)(a), S&P 500 Index (S&P 500)(b), the Citigroup 3-Month T Bill Index(c), the Conservative Composite Index(d), and the Consumer Price Index (CPI)(e) since inception. Unlike the Fund, the returns for these unmanaged indexes do not reflect any fees, expenses, or sales charges. Investors cannot invest directly in market indexes.
| (a) | LB U.S. Aggregate Bond Index is an unmanaged, market value-weighted index of investment-grade, fixed-rate debt issues (including government, corporate, asset-backed, and mortgage-backed securities with maturities of one year or more) that is generally representative of the bond market as a whole. |
| (b) | S&P 500 is an unmanaged, market capitalization-weighted index of 500 widely held stocks of large-cap U.S. companies that gives a broad look at how the stock prices of those companies have performed. |
| (c) | The Citigroup 3-Month T Bill Index is an average of the last 3-month treasury bill issues (excluding the current month-end bill). |
| (d) | The Conservative Composite is an unmanaged, hypothetical representation of the performance of each of the Fund’s asset classes according to their respective weightings. The Conservative Composite is a combination of LB Aggregate Bond (35%), S&P 500 (20%), and Citigroup 3-Month T Bill Index (45%). |
| (e) | The CPI represents changes in prices of a basket of goods and services purchased for consumption by urban households. |
3
Table of Contents
Shareholder
Expense Example | Gartmore GVIT Investor Destinations Conservative Fund |
As a shareholder of the Fund, you incur two types of costs: (1) transaction costs, including sales charges (loads) paid on purchase payments and redemption fees; and (2) ongoing costs, including investment advisory fees, administration fees, distribution fees and other Fund expenses. The examples below are intended to help you understand your ongoing costs (in dollars) of investing in the Fund and to compare these costs with the ongoing costs of investing in other mutual funds. Per SEC requirements, the examples assume that you had a $1,000 investment in the Class at the beginning of the reporting period, January 1, 2005, and continued to hold your shares at the end of the reporting period, June 30, 2005.
Actual Expenses
For each Class of the Fund in the table below, the first line provides information about actual account values and actual expenses. You may use the information in this line, together with the amount you invested, to estimate the expenses that you paid over the period. Simply divide your account value by $1,000 (for example, an $8,600 account value divided by $1,000 = 8.6), then multiply the result by the number in the first line of each Class under the heading entitled “Expenses Paid During Period” to estimate the expenses you paid on your account during the period.
Hypothetical Example for Comparison Purposes
The second line of each Class in the table below provides information about hypothetical account values and hypothetical expenses based on the Class’ actual expense ratio and an assumed rate of return of 5% per year before expenses, which is not the Class’ actual return. The hypothetical account values and expenses may not be used to estimate the actual ending account balance or expenses you paid for the period. You may use this information to compare the ongoing costs of investing in the Class of the Fund and other funds. To do so, compare this 5% hypothetical example with the 5% hypothetical examples that appear in the shareholder reports of the other funds.
Please note that the expenses shown in the table are meant to highlight your ongoing costs only and do not reflect any transaction costs, such as sales charges (loads) or redemption fees. Therefore, the second line for each Class in the table is useful in comparing ongoing costs only, and will not help you determine the relative total costs of owning different funds. In addition, if these transaction costs were included, your costs would have been higher. The examples also assume all dividends and distributions have been reinvested.
Beginning Account Value, | Ending June 30, 2005 | Expenses Paid During Period* | Annualized Expense Ratio* | ||||||||||
| Investor Destinations Conservative Fund | |||||||||||||
Class II | Actual | $ | 1,000 | $ | 1,012 | $ | 2.79 | 0.56% | |||||
| Hypothetical1 | $ | 1,000 | $ | 1,022 | $ | 2.81 | 0.56% | ||||||
Class VI | Actual | $ | 1,000 | $ | 1,012 | $ | 2.05 | 0.41% | |||||
| Hypothetical1 | $ | 1,000 | $ | 1,023 | $ | 2.06 | 0.41% | ||||||
| * | Expenses are equal to the Fund’s annualized expense ratio multiplied by the average account value over the period multiplied by 181/365 (to reflect the one-half year period). The expense ratio presented represents a six month, annualized ratio in accordance with SEC guidelines. |
| 1 | Represents the hypothetical 5% return before expenses. |
4
Table of Contents
Portfolio Summary
June 30, 2005 | Gartmore GVIT Investor Destinations Conservative Fund |
The SEC adopted a requirement that Funds present their portfolio holdings in a table, chart or graph format in their annual and semiannual reports to shareholders, whether or not a statement of investments is utilized. The following tables, which present portfolio holdings as a percentage of net assets, are provided in compliance with this requirement.
| Asset Allocation | ||
| Mutual Funds | 79.8% | |
| Fixed Contract | 20.0% | |
| Other assets in excess of liabilities | 0.2% | |
| 100.0% | ||
| Asset Allocation Detail | ||
| Fixed Income Funds | 54.9% | |
| Fixed Contract | 20.0% | |
| Equity Funds | 19.9% | |
| Money Market Fund | 5.0% | |
| Other | 0.2% | |
| 100.0% | ||
| Top Holdings | ||
| Gartmore Bond Index Fund, Institutional Class | 34.9% | |
| Nationwide Fixed Contract, 3.50% | 20.0% | |
Gartmore Morley Enhanced Income Fund, Institutional Class | 20.0% | |
| Gartmore S&P 500 Index Fund, Institutional Class | 9.9% | |
| Gartmore Money Market Fund, Institutional Class | 5.0% | |
Gartmore International Index Fund, Institutional Class | 5.0% | |
Gartmore Mid Cap Market Index Fund, Institutional Class | 5.0% | |
| Other Holdings | 0.2% | |
| 100.0% | ||
5
Table of Contents
GARTMORE VARIABLE INSURANCE TRUST
GARTMORE GVIT INVESTOR DESTINATIONS CONSERVATIVE FUND
Statement of Investments — June 30, 2005 (Unaudited)
| Shares or Principal Amount | Value | ||||
| MUTUAL FUNDS (79.8%) | |||||
| Equity Funds (19.9%) | |||||
| Gartmore International Index Fund, Institutional Class (b) | 1,704,959 | $ | 13,810,167 | ||
| Gartmore Mid Cap Market Index Fund, Institutional Class (b) | 954,119 | 13,787,019 | |||
| Gartmore S&P 500 Index Fund, Institutional Class (b) | 2,677,808 | 27,501,084 | |||
| 55,098,270 | |||||
| Fixed Income Funds (54.9%) | |||||
| Gartmore Bond Index Fund, Institutional Class (b) | 8,754,278 | 97,084,946 | |||
| Gartmore Morley Enhanced Income Fund, Institutional Class (b) | 6,072,046 | 55,377,063 | |||
| 152,462,009 | |||||
| Money Market Fund (5.0%) | |||||
| Gartmore Money Market Fund, Institutional Class* | 13,844,266 | 13,844,266 | |||
| Total Mutual Funds | 221,404,545 | ||||
| FIXED CONTRACT (20.0%) | |||||
| Nationwide Fixed Contract, 3.50% (b) (c) | 55,382,307 | 55,382,307 | |||
| Total Fixed Contract | 55,382,307 | ||||
| Total Investments (Cost $269,861,831) (a) — 99.8% | 276,786,852 | ||||
| Other assets in excess of liabilities — 0.2% | 432,402 | ||||
| NET ASSETS — 100.0% | $ | 277,219,254 | |||
| (a) | See notes to financial statements for unrealized appreciation (depreciation) of securities. |
| (b) | Investment in affiliate. |
| (c) | The Nationwide Fixed Contract rate changes quarterly. The security is restricted and as the affiliated counterparty is required by contract to redeem within five days upon request, and it has been deemed liquid pursuant to procedures approved by the Board of Trustees in accordance with rule 144A under the Securities Act of 1933, as amended. |
See notes to financial statements.
6
Table of Contents
GARTMORE VARIABLE INSURANCE TRUST
GARTMORE GVIT INVESTOR DESTINATIONS CONSERVATIVE FUND
Statement of Assets and Liabilities
June 30, 2005 (Unaudited)
Assets: | |||
Investments in affiliated securities, at value (cost $269,861,831) | $ | 276,786,852 | |
Cash | 10 | ||
Interest and dividends receivable | 541,203 | ||
Prepaid expenses and other assets | 17,945 | ||
Total Assets | 277,346,010 | ||
Liabilities: | |||
Accrued expenses and other payables: | |||
Investment advisory fees | 30,342 | ||
Distribution fees | 58,351 | ||
Administrative servicing fees | 30,853 | ||
Other | 7,210 | ||
Total Liabilities | 126,756 | ||
Net Assets | $ | 277,219,254 | |
Represented by: | |||
Capital | $ | 268,468,789 | |
Accumulated net investment income (loss) | 72,666 | ||
Accumulated net realized gain (losses) from investment transactions | 1,752,778 | ||
Net unrealized appreciation (depreciation) on investments | 6,925,021 | ||
Net Assets | $ | 277,219,254 | |
Net Assets: | |||
Class II Shares | $ | 273,441,018 | |
Class VI Shares | 3,778,236 | ||
Total | $ | 277,219,254 | |
Shares outstanding (unlimited number of shares authorized): | |||
Class II Shares | 26,358,459 | ||
Class VI Shares | 364,581 | ||
Total | 26,723,040 | ||
Net asset value and offering price per share:* | |||
Class II Shares | $ | 10.37 | |
Class VI Shares | $ | 10.36 |
| * | Not subject to a front-end sales charge. |
For the Six Months Ended June 30, 2005 (Unaudited)
Investment Income: | ||||
Interest income from affiliates | $ | 930,781 | ||
Interest income | 5 | |||
Dividend income from affiliates | 3,454,533 | |||
Total Income | 4,385,319 | |||
Expenses: | ||||
Investment advisory fees | 176,541 | |||
Distribution Fees Class II | 336,402 | |||
Distribution Fees Class VI | 3,103 | |||
Administrative servicing fees Class II Shares | 197,009 | |||
Other** | 43,326 | |||
Total Expenses | 756,381 | |||
Net Investment Income (Loss) | 3,628,938 | |||
REALIZED/UNREALIZED GAINS (LOSSES) ON INVESTMENTS: | ||||
Net realized gains (losses) on investment transactions | 2,177,218 | |||
Net change in unrealized appreciation/depreciation on investments | (2,206,589 | ) | ||
Net realized/unrealized gains (losses) on investments | (29,371 | ) | ||
CHANGE IN NET ASSETS RESULTING FROM OPERATIONS | $ | 3,599,567 | ||
| ** | Other expenses may include the following fees: audit, custody, insurance, legal, printing, trustee, and out-of-pocket expenses. |
See notes to financial statements.
7
Table of Contents
GARTMORE VARIABLE INSURANCE TRUST
GARTMORE GVIT INVESTOR DESTINATIONS CONSERVATIVE FUND
Statement of Changes in Net Assets
| Six Months Ended June 30, 2005 | Year Ended December 31, 2004 | |||||||
| (Unaudited) | ||||||||
From Investment Activities: | ||||||||
Operations: | ||||||||
Net investment income (loss) | $ | 3,628,938 | $ | 5,473,143 | ||||
Net realized gains (losses) on investment transactions | 2,177,218 | 3,444,495 | ||||||
Net change in unrealized appreciation/depreciation on investments | (2,206,589 | ) | 2,030,361 | |||||
Change in net assets resulting from operations | 3,599,567 | 10,947,999 | ||||||
Distributions to Class II Shareholders from: | ||||||||
Net investment income | (3,513,470 | ) | (5,494,511 | )(a) | ||||
Net realized gains on investments | (1,877,420 | ) | (2,320,988 | )(a) | ||||
Distributions to Class VI Shareholders from: | ||||||||
Net investment income | (42,802 | ) | (19,759 | )(b) | ||||
Net realized gains on investments | (25,268 | ) | (7,932 | )(b) | ||||
Change in net assets from shareholder distributions | (5,458,960 | ) | (7,843,190 | ) | ||||
Change in net assets from capital transactions | 21,347,123 | 64,003,212 | ||||||
Change in net assets | 19,487,730 | 67,108,021 | ||||||
Net Assets: | ||||||||
Beginning of period | 257,731,524 | 190,623,503 | ||||||
End of period | $ | 277,219,254 | $ | 257,731,524 | ||||
CAPITAL TRANSACTIONS: | ||||||||
Class II Shares | ||||||||
Proceeds from shares issued | $ | 53,371,214 | $ | 100,983,002 | (a) | |||
Dividends reinvested | 5,390,885 | 7,815,483 | (a) | |||||
Cost of shares redeemed | (39,762,383 | ) | (46,226,403 | )(a) | ||||
| 18,999,716 | 62,572,082 | |||||||
Class VI Shares | ||||||||
Proceeds from shares issued | 2,633,344 | 1,645,576 | (b) | |||||
Dividends reinvested | 68,070 | 27,690 | (b) | |||||
Cost of shares redeemed | (354,007 | ) | (242,136 | )(b) | ||||
| 2,347,407 | 1,431,130 | |||||||
Change in net assets from capital transactions | $ | 21,347,123 | $ | 64,003,212 | ||||
SHARE TRANSACTIONS: | ||||||||
Class II Shares | ||||||||
Issued | 5,119,859 | 9,753,470 | (a) | |||||
Reinvested | 520,615 | 754,197 | (a) | |||||
Redeemed | (3,800,095 | ) | (4,462,685 | )(a) | ||||
| 1,840,379 | 6,044,982 | |||||||
Class VI Shares | ||||||||
Issued | 252,759 | 160,003 | (b) | |||||
Reinvested | 6,578 | 2,667 | (b) | |||||
Redeemed | (33,979 | ) | (23,447 | )(b) | ||||
| 225,358 | 139,223 | |||||||
| (a) | On April 30, 2004, the existing share Class of the Fund’s was renamed Class II Shares. |
| (b) | For the period from April 30, 2004 (commencement of operations) through December 31, 2004. |
See notes to financial statements.
8
Table of Contents
GARTMORE GVIT INVESTOR DESTINATIONS CONSERVATIVE FUND
Selected Data for Each Share of Capital Outstanding
Gartmore GVIT Investor Destinations Conservative Fund
| Investment Activities | Distributions | Ratios/Supplemental Data | ||||||||||||||||||||||||||||||||||||||||
| Net Asset Value, Beginning of Period | Net Investment Income | Net Realized and Unrealized Gains (Losses) on Investments | Total from Investment Activities | Net Investment Income | Net Realized Gains | Total Distributions | Net Asset Value, End of Period | Total Return | Net Assets at End of Period (000s) | Ratio of Expenses to Average Net Assets | Ratio of Net Investment Income (Loss) to Average Net Assets | Ratio of Expenses (Prior to Reimbursements) to Average Net Assets(a) | Ratio of Net Investment Income (Loss) (Prior to Reimbursements) to Average Net Assets(a) | Portfolio Turnover(b) | ||||||||||||||||||||||||||||
Class II Shares | ||||||||||||||||||||||||||||||||||||||||||
Period Ended December 31, 2001(c) | $ | 10.00 | 0.02 | 0.01 | 0.03 | (0.02 | ) | — | (0.02 | ) | $ | 10.01 | 0.34% | (e) | $ | 502 | 0.61% | (f) | 4.39% | (f) | 24.89% | (f) | (19.89% | )(f) | 0.40% | |||||||||||||||||
Year Ended December 31, 2002 | $ | 10.01 | 0.21 | (0.18 | ) | 0.03 | (0.21 | ) | — | (0.21 | ) | $ | 9.83 | 0.40% | $ | 90,358 | 0.56% | 3.30% | (g | ) | (g | ) | 28.70% | |||||||||||||||||||
Year Ended December 31, 2003 | $ | 9.83 | 0.24 | 0.53 | 0.77 | (0.24 | ) | (0.04 | ) | (0.28 | ) | $ | 10.32 | 7.91% | $ | 90,624 | 0.56% | 2.55% | (g | ) | (g | ) | 24.84% | |||||||||||||||||||
Year Ended December 31, 2004(d) | $ | 10.32 | 0.24 | 0.23 | 0.47 | (0.24 | ) | (0.10 | ) | (0.34 | ) | $ | 10.45 | 4.65% | $ | 256,277 | 0.56% | 2.39% | (g | ) | (g | ) | 15.34% | |||||||||||||||||||
Six Months Ended June 30, 2005 (Unaudited) | $ | 10.45 | 0.14 | (0.01 | ) | 0.13 | (0.14 | ) | (0.07 | ) | (0.21 | ) | $ | 10.37 | 1.23% | (e) | $ | 273,441 | 0.56% | (f) | 2.67% | (f) | (g | ) | (g | ) | 12.48% | |||||||||||||||
Class VI Shares | ||||||||||||||||||||||||||||||||||||||||||
Period Ended December 31, 2004(h) | $ | 10.26 | 0.21 | 0.25 | 0.46 | (0.21 | ) | (0.06 | ) | (0.27 | ) | $ | 10.45 | 4.48% | (e) | $ | 1,454 | 0.41% | (f) | 3.00% | (f) | (g | ) | (g | ) | 15.34% | ||||||||||||||||
Six Months Ended June 30, 2005 (Unaudited) | $ | 10.45 | 0.14 | (0.02 | ) | 0.12 | (0.14 | ) | (0.07 | ) | (0.21 | ) | $ | 10.36 | 1.23% | (e) | $ | 3,778 | 0.41% | (f) | 2.91% | (f) | (g | ) | (g | ) | 12.48% | |||||||||||||||
| (a) | During the period certain fees were waived and/or reimbursed. If such waivers/reimbursements had not occurred, the ratios would have been as indicated. |
| (b) | Portfolio turnover is calculated on the basis of the Fund as a whole without distinguishing among the classes of shares. |
| (c) | For the period from December 12, 2001 (commencement of operations) through December 31, 2001. |
| (d) | On April 30, 2004, the existing share Class of the Fund was renamed Class II Shares. |
| (e) | Not annualized. |
| (f) | Annualized. |
| (g) | There were no fee reductions during the period. |
| (h) | For the period from April 30, 2004 (commencement of operations) through December 31, 2004. |
See notes to financial statements.
9
Table of Contents
GARTMORE VARIABLE INSURANCE TRUST
NOTES TO FINANCIAL STATEMENTS (Unaudited)
June 30, 2005
1. Organization
Gartmore Variable Insurance Trust (“GVIT” or the “Trust”) is an open-end management investment company, organized under the laws of Delaware by an amended and restated Agreement and Declaration of Trust, dated October 28, 2004, as amended to date. The Trust, originally created under the laws of Massachusetts as a Massachusetts business trust pursuant to a Declaration of Trust dated, as of June 30, 1981, as subsequently amended, redomesticated as a Delaware Statutory Trust after the close of trading on April 29, 2005, and is registered under the Investment Company Act of 1940, as amended (the “1940 Act”). The redomestication is a change in statutory status and does not affect the operations of the Trust. As of June 30, 2005, the Trust had authorized an unlimited number of shares of beneficial interest (“shares”) without par value. The Trust currently offers shares to life insurance company separate accounts to fund the benefits under variable life insurance or annuity policies. To date, only the separate accounts of Nationwide Life Insurance Company and Nationwide Life and Annuity Insurance Company (collectively, “Nationwide”) have purchased shares of the Trust’s series. The Trust operates thirty-one (31) separate series, or mutual funds, each with its own investment objectives and strategies. This report contains the financial statements and financial highlights of the Gartmore GVIT Investor Destinations Conservative Fund (the “Fund”).
The Fund is constructed as “fund of funds,” which means that the Fund pursues its investment objective primarily by allocating the Fund’s investments among other mutual funds (the “Underlying Funds”). The Underlying Funds typically invest, either directly or indirectly, in stocks, bonds, and other securities including the Nationwide Contract. The Nationwide Contract is a fixed interest contract issued and guaranteed by Nationwide. This contract has a stable principal value and will pay the Fund a fixed rate of interest. The fixed interest rate must be at least 3.50% (on an annual basis), but may be higher and is currently adjusted on a quarterly basis. Nationwide will calculate the interest rate in the same way that it calculates guaranteed interest rates for similar contracts. Because the contract is not guaranteed by Nationwide, assuming no default, the Fund receives no more or less than the guaranteed amount and will not directly participate in the actual experience of the assets underlying the contract. Although under certain market conditions the Fund’s performance may be hurt by its investment in the Nationwide Contract, the portfolio management team believes that the relatively stable nature of the Nationwide Contract should reduce the Fund’s volatility and overall risk, especially when the bond and stock markets decline simultaneously. The Fund’s target allocation range is 15-25%.
Under the Trust’s organizational documents, the Trust’s officers and trustees are indemnified against certain liabilities arising out of the performance of their duties to the Trust. In addition, the Trust has entered into Indemnification Agreements with the Trust’s trustees and certain officers covering similar liabilities. In addition, in the normal course of business, the Trust enters into contracts with its vendors and others that provide for general indemnifications. The Trust’s maximum exposure under these arrangements is unknown, as this would involve future claims that may be made against the Trust. Based on experience, however, the Trust expects that risk of loss to be remote.
2. Summary of Significant Accounting Policies
The following is a summary of significant accounting policies followed by the Funds in the preparation of its financial statements. The policies are in conformity with accounting principles generally accepted in the United States of America (“GAAP”). The preparation of financial statements requires management to make estimates and assumptions that affect the reported amounts of assets and liabilities, the disclosure of contingent assets and liabilities at the date of the financial statements and the reported amounts of income and expenses for the period. Actual results could differ from those estimates.
| (a) | Security Valuation |
Shares of the Underlying Funds in which the Fund invests are valued at their respective net asset values as reported by the Underlying Funds. The securities in the Underlying Funds generally are valued as of the close of business of the regular session of trading on the New York Stock Exchange (usually at 4 p.m. Eastern time). The Underlying Funds generally value securities and assets at current market value. Under most circumstances, the fixed interest contract is valued at par value each day, which is deemed to be fair value. The par value is calculated each day by the summation of the following factors: prior day’s par value; prior day’s interest accrued (par multiplied by guaranteed fixed rate); and current day net purchase or redemption.
10
Table of Contents
GARTMORE VARIABLE INSURANCE TRUST
NOTES TO FINANCIAL STATEMENTS (Unaudited) (Continued)
June 30, 2005
| (b) | Repurchase Agreements |
The Fund may enter into repurchase agreements with an entity which is a member of the Federal Reserve System or which is a “primary dealer” (as designated by the Federal Reserve Bank of New York) in U.S. Government obligations. The repurchase price generally equals the price paid by the Fund plus interest negotiated on the basis of current short-term rates, which may be more or less than the rate on the underlying portfolio securities. The seller under a repurchase agreement is required to maintain the value of the collateral held pursuant to the agreement at a market value equal to or greater than the repurchase price (including accrued interest). Collateral subject to repurchase agreements is held by the Fund’s custodian or another qualified sub-custodian or in the Federal Reserve/Treasury book-entry system. If the counterparty defaults and the fair value of the collateral declines, realization of the collateral by the Fund may be delayed or limited. The Fund may transfer uninvested cash balances into a pooled cash account. These balances are invested in one or more repurchase agreements, which are fully collateralized by AA-rated Corporate Bonds with the counterparties of CS First Boston and Nomura Securities.
| (c) | Foreign Currency Transactions |
The accounting records of the Fund are maintained in U.S. dollars. Foreign currency amounts are translated into U.S. dollars at the current rate of exchange to determine the value of investments, assets and liabilities. The Fund may enter into foreign currency contracts in connection with purchase or sales of securities denominated in a foreign currency. Purchases and sales of securities, and income and expenses, are translated at the prevailing rate of exchange on the respective date of these transactions. The Fund does not isolate that portion of the results of operations resulting from changes in foreign exchange rates on investments from fluctuations arising from changes in market prices of securities held. These fluctuations are included with the net realized and unrealized gain or loss from investments and foreign currencies.
| (d) | Risks Associated with Foreign Securities and Currencies |
Investments in securities of foreign issuers carry certain risks not ordinarily associated with investments in securities of U.S. issuers. These risks include future political and economic developments, and the possible imposition of exchange controls or other foreign governmental laws and restrictions. In addition, with respect to certain countries, there is the possibility of expropriation of assets, confiscatory taxation, political or social instability, or diplomatic developments, which could adversely affect investments in those countries.
Certain countries also may impose substantial restrictions on investments in their capital markets by foreign entities, including restrictions on investments in issuers of industries deemed sensitive to relevant national interests. These factors may limit the investment opportunities available and result in a lack of liquidity and high price volatility with respect to securities of issuers from developing countries.
| (e) | Forward Foreign Currency Contracts |
The Fund may enter into forward foreign currency contracts in connection with planned purchases or sales of securities or to hedge the U.S. dollar value of portfolio securities denominated in a particular currency. The Fund could be exposed to risks if the counterparties to the contracts are unable to meet the terms of their contracts and from unanticipated movements in the value of a foreign currency relative to the U.S. dollar. Forward foreign currency contracts are valued at the current cost of covering these contracts, as provided by an independent pricing service approved by the Board of Trustees. The forward foreign currency contracts are adjusted by the daily exchange rate of the underlying currency and any gains or losses are recorded for financial statement purposes as unrealized gains or losses until the contract settlement date.
| (f) | Futures Contracts |
The Fund may invest in financial futures contracts (“futures contracts”) for the purpose of hedging its existing portfolio securities or securities that the Fund intends to purchase against fluctuations in value caused by changes in prevailing market interest rates or prices. Futures contracts may also be entered into for non-hedging purposes.
11
Table of Contents
GARTMORE VARIABLE INSURANCE TRUST
NOTES TO FINANCIAL STATEMENTS (Unaudited) (Continued)
June 30, 2005
Upon entering into a futures contract, the Fund is required to pledge to the broker an amount of cash and/or other assets equal to a certain percentage of the contract amount (initial margin deposit). Subsequent payments, known as “variation margin,” are made each day, depending on the daily fluctuations in the fair value/market value of the underlying assets. A gain or loss equal to the daily variation margin is recognized on a daily basis. Futures contracts are valued daily at their last quoted sale price.
A “sale” of a futures contract means a contractual obligation to deliver the securities or foreign currency called for by the contract at a fixed price at a specified time in the future. A “purchase” of a futures contract means a contractual obligation to acquire the securities or foreign currency at a fixed price at a specified time in the future.
Should market conditions change unexpectedly, the Fund may not achieve the anticipated benefits of the futures contracts and may realize a loss. The use of futures transactions for hedging purposes involves the risk of imperfect correlation in movements in the price of futures contracts, interest rates, and the value of the underlying hedged assets.
| (g) | Written Options Contracts |
The Fund may write options contracts. A written option obligates the Fund to deliver (written call) or to receive (written put) a specified quantity of an underlying asset at the contract amount upon exercise by the holder of the option. The value of the option contract is recorded as a liability and unrealized gain or loss is measured by the difference between the current value and the premium received. Options traded on an exchange are valued at the last quoted sale price, or in the absence of a sale, the bid price provided by an independent pricing service approved by the Board of Trustees. Non-exchange traded options are valued using dealer supplied quotes.
| (h) | Mortgage Dollar Rolls |
The Fund may enter into mortgage “dollar rolls” in which the Fund sells mortgage-backed securities for delivery in the current month and simultaneously contracts to repurchase substantially similar (same type, coupon, and maturity) securities on a specified future date. Mortgage dollar rolls are referred to as TBA’s on the Statement of Investments of the Fund. During the roll period, the Fund foregoes principal and interest paid on the mortgage-backed securities. The Fund is compensated by fee income or the difference between the current sales price and the lower forward price for the future purchase. Mortgage dollar rolls are valued at the last quoted bid price and/or by using a combination of daily quotes and matrix evaluations provided by an independent pricing service, the use of which has been approved by the Board of Trustees.
| (i) | Short Sales |
The Fund is authorized to engage in short-selling of portfolio securities which obligates the Fund to replace any security that the Fund has borrowed by purchasing the security at current market value sometime in the future. The Fund will incur a loss if the price of the security increases between the date of the short sale and the date on which the Fund replaces the borrowed security. The Fund generally will realize a gain if the price of the security declines between these dates. Until the Fund replaces the borrowed security, the Fund will maintain a segregated account with cash, U.S. Government securities and/or securities held long to sufficiently cover the Fund’s short position on a daily basis. Dividends declared on securities sold short are recorded as an expense on the ex-dividend date and paid to the counterparty on the dividend pay date. The collateral for securities sold short are recorded as an expense on the ex-dividend date and paid to the counterparty on the dividend pay date. The collateral for securities sold short includes the deposits with brokers and securities held long as shown in the Statement of Investments for the Fund.
| (j) | Security Transactions and Investment Income |
Security transactions are accounted for on the date the security is purchased or sold (“trade date”). Securities gains and losses are calculated on the identified cost basis. Interest income is recognized on the accrual basis and includes, where applicable, the amortization or accretion of premium or discount. Dividend income is recorded on the ex-dividend date.
12
Table of Contents
GARTMORE VARIABLE INSURANCE TRUST
NOTES TO FINANCIAL STATEMENTS (Unaudited) (Continued)
June 30, 2005
| (k) | Distributions to Shareholders |
The Fund’s dividends from net investment income, if any, are declared and paid quarterly. The Fund’s distributable net realized capital gains, if any, are declared and distributed at least annually.
Dividends and distributions to shareholders are determined in accordance with federal income tax regulations, which may differ from GAAP. These “book/tax” differences are considered either permanent or temporary in nature. In accordance with the American Institute of Certified Public Accountants (“AICPA”) Statement of Position 93-2, permanent differences (i.e., reclassification of market discounts, gain/loss, paydowns, and distributions) are reclassified within the capital accounts based on their nature for federal income tax purposes; temporary differences do not require reclassification. These reclassifications have no effect upon the net asset value of the Fund. To the extent distributions exceed current and accumulated earnings and profits for federal income tax purposes, these distributions are reported as distributions of paid-in-capital.
| (l) | Federal Income Taxes |
It is the policy of the Fund to qualify or continue to qualify as a “regulated investment company” by complying with the provisions available to certain investment companies, as defined in applicable sections of the U.S. Internal Revenue Code, and to make distributions of net investment income and net realized capital gains sufficient to relieve the Fund from all, or substantially all, federal income taxes.
As of June 30, 2005, the tax cost of securities and the breakdown of unrealized appreciation (depreciation) for the Fund is as follows:
Tax Cost | Unrealized Appreciation | Unrealized Depreciation | Net Unrealized Appreciation (Depreciation) | |||
$617,492 | $7,179,083 | $(871,555) | $6,307,529 |
| (m) | Allocation of Expenses, Income, and Gains and Losses |
Expenses directly attributable to the Fund are charged to the Fund. Expenses not directly attributable to the Fund are allocated proportionately among various or all funds within the Trust. The method used by the Fund for allocating income, fund level expenses, and realized and unrealized gains or losses is based on the fair value of shares outstanding relative to net assets. Under this method, each class of shares participates based on the total net asset value of that class’s shares in proportion to the total net assets of the Fund. Expenses specific to a class (such as rule 12b-1 and administrative services fees) are charged to that class.
3. Transactions with Affiliates
Under the terms of the Trust’s Investment Advisory Agreement, Gartmore Mutual Fund Capital Trust (“GMF”) manages the investment of the assets and supervises the daily business affairs of the Fund. GMF is a wholly-owned subsidiary of Gartmore Global Investments, Inc. (“GGI”), a holding company. GGI is a majority-owned subsidiary of Gartmore Global Asset Management Trust (“GGAMT”). GGAMT is a wholly-owned subsidiary of Nationwide Corporation. All of the common stock of Nationwide Corporation is held by Nationwide Mutual Insurance Company (95.2%) and Nationwide Mutual Fire Insurance Company (4.8%), each of which is a mutual company owned by its policyholders.
Under the terms of the Investment Advisory Agreement, the Fund pays GMF an investment advisory fee of 0.13% based on the Fund’s average daily net assets.
Gartmore SA Capital Trust (“GSA”) provides the Fund with various administrative and accounting services, and Gartmore Investors Services, Inc. (“GISI”), an indirect subsidiary of GSA, serves as Transfer and Dividend Disbursing Agent for the Fund. GSA and GISI have entered into agreements with BISYS Fund Services Ohio, Inc. (“BISYS”), pursuant to which BISYS provides sub-administration and sub-transfer agency services, respectively, to the Fund.
13
Table of Contents
GARTMORE VARIABLE INSURANCE TRUST
NOTES TO FINANCIAL STATEMENTS (Unaudited) (Continued)
June 30, 2005
Under the terms of a Distribution Plan under Rule 12b-1 of the 1940 Act, Gartmore Distribution Services, Inc. (“GDSI”), the Funds’ Distributor, is compensated by the Fund for expenses associated with the distribution of the shares of the Fund. These fees are based on average daily net assets of each class of shares of the Fund at an annual rate not to exceed 0.25%.
Under the terms of an Administrative Services Plan, the Fund may pay fees to servicing organizations, such as broker-dealers, including Nationwide Financial Services, and financial institutions, which agree to provide administrative support services to the shareholders of the Fund. These services include, but are not limited, to the following: establishing and maintaining shareholder accounts; processing purchase and redemption transactions; arranging bank wires; performing shareholder sub-accounting; answering inquires regarding the Fund; and other such services. These fees are based on an annual rate of up to 0.25% of the average daily net assets of each class of shares of the Fund.
Because the Fund invests primarily in other Gartmore Funds, the Fund is a shareholder of those Underlying Funds. The Underlying Funds and the Nationwide Contract do not charge the Fund any sales charge for buying or selling shares. However, the Fund indirectly pays a portion of the operating expenses, including management fees of the Underlying Funds and short-term investments the Fund holds. These expenses are deducted from the Underlying Funds before their share prices are calculated and are in addition to the fees and expenses of the Fund. Actual indirect expenses vary depending on how the Fund’s assets are spread among the underlying investments.
4. Short-Term Trading Fees
The Fund reserves the right to assess a short-term trading fee on certain transactions out of Class VI shares that a separate account makes on behalf of a variable insurance contract owner (the “contract owner”). A separate account that redeems Class VI shares on behalf of a contract owner may be subject to a 1.00% short-term trading fee if the separate account held the Class VI shares on behalf of the contract owner for 60 days or less, unless an exception applies as disclosed in the prospectus. The short-term trading fee is paid directly to the Fund and is intended to offset the cost to the Fund of excess brokerage commissions and other costs associated with fluctuations in fund asset levels and cash flow caused by short-term trading. For purposes of determining whether the short-term trading fee applies, the Class VI shares that were held on behalf of the contract owner the longest will be treated as being redeemed first.
For the six months ended June 30, 2005, the Fund had no contributions to capital due to collection of redemption fees.
5. Investment Transactions
For the six months ended June 30, 2005, (excluding short-term securities) the Fund had purchases of $42,609,076 and sales of $27,196,594.
6. Bank Loans
The Trust has a credit agreement of $100,000,000. Borrowings under this arrangement bear interest at the Federal Funds rate plus 0.50%. The interest costs are included in custodian fees in the Statement of Operations. No compensation balances were required under the terms of the line of credit. There were no borrowings outstanding as of June 30, 2005.
7. Shareholder Meeting
A separate shareholders meeting was held on Tuesday, December 23, 2004, for the shareholders of the Trust’s predecessor pursuant to a Proxy Statement On Schedule 14A, dated October 29, 2004, and mailed to the shareholders of the Trust’s predecessor on or around November 5, 2004.
Two Proposals: The purpose of the December 23, 2004 meeting was to allow the shareholders of the Trust’s predecessor to vote on:
| i. | Proposal One: The election of the Trust’s Board of Trustees; and |
| ii. | Proposal Two: The approval of an “Agreement and Plan of Reorganization” that provided for the reorganization of the Trust from a Massachusetts business trust into a Delaware statutory trust. |
14
Table of Contents
GARTMORE VARIABLE INSURANCE TRUST
NOTES TO FINANCIAL STATEMENTS (Unaudited) (Continued)
June 30, 2005
Proposal One: As set forth in the October 29, 2004 Proxy Statement, the nominees for election as Trustees of the Trust’s predecessor were: Charles E. Allen, Michael J. Baresich, Paula H.J. Cholmondeley, C. Brent DeVore, Phyllis Kay Dryden, Robert M. Duncan, Barbara L. Hennigar, Paul J. Hondros, Barbara I Jacobs, Thomas J. Kerr IV, Douglas F. Kridler, Michael D. McCarthy, Arden L. Shisler, and David C. Wetmore.
Proposal Two: As specifically set forth in the October 29, 2004 Proxy Statement, the Reorganization proposal requested the shareholders of the Trust’s predecessor to approve the proposed “Agreement and Plan of Reorganization” of the Trust’s predecessor (on behalf of each of the its funds) into a new Delaware-domiciled Trust, whereby the Funds of the new Delaware Trust would acquire all of the assets of the corresponding funds of the Trust’s predecessor subject to the liabilities, expenses, costs, charges, and reserves of the corresponding funds of the Trust’s predecessor (contingent or otherwise), in exchange for shares of the acquiring Funds to be distributed pro rata by the Trust to the holders of the shares of the funds of the Trust’s predecessor, in a complete liquidation of the Trust’s predecessor.
Voting Results:
The shareholders of the Trust’s predecessor voted to approve both Proposal One and Proposal Two, as follows:
Proposal 1: Election of a Board of Trustees of Gartmore Variable Insurance Trust
Charles E. Allen: | ||
FOR | 2,797,230,318.955 shares (96.078%) | |
WITHHOLD | 114,195,693.660 shares (3.922%) | |
TOTAL | 2,912,726,012.615 shares (100.000%) | |
Michael J. Baresich: | ||
FOR | 2,796,135,979.559 shares (96.040%) | |
WITHHOLD | 115,290,033.056 shares (3.960%) | |
TOTAL | 2,912,726,012.615 shares (100.000%) | |
Paula H.J. Cholmondeley: | ||
FOR | 2,795,095,945.396 shares (96.004%) | |
WITHHOLD | 116,330,067.219 shares (3.996%) | |
TOTAL | 2,912,726,012.615 shares (100.000%) | |
C. Brent DeVore: | ||
FOR | 2,797,207,046.916 shares (96.077%) | |
WITHHOLD | 114,218,965.699 shares (3.923%) | |
TOTAL | 2,912,726,012.615 shares (100.000%) | |
Phyllis Kay Dryden: | ||
FOR | 2,795,587,023.994 shares (96.021%) | |
WITHHOLD | 115,838,988.621 shares (3.979%) | |
TOTAL | 2,912,726,012.615 shares (100.000%) | |
Robert M. Duncan: | ||
FOR | 2,790,191,720.503 shares (95.836%) | |
WITHHOLD | 121,234,292.112 shares (4.164%) | |
TOTAL | 2,912,726,012.615 shares (100.000%) | |
15
Table of Contents
GARTMORE VARIABLE INSURANCE TRUST
NOTES TO FINANCIAL STATEMENTS (Unaudited) (Continued)
June 30, 2005
Barbara L. Hennigar: | ||
FOR | 2,792,939,848.858 shares (95.937%) | |
WITHHOLD | 118,486,163.757 shares (4.070%) | |
TOTAL | 2,912,726,012.615 shares (100.000%) | |
Paul J. Hondros: | ||
FOR | 2,797,557,404.448 shares (96.089%) | |
WITHHOLD | 113,868,608.167 shares (3.911%) | |
TOTAL | 2,912,726,012.615 shares (100.000%) | |
Barbara I. Jacobs: | ||
FOR | 2,796,306,126.654 shares (96.046%) | |
WITHHOLD | 115,119,885.961 shares (3.954%) | |
TOTAL | 2,912,726,012.615 shares (100.000%) | |
Thomas J. Kerr IV: | ||
FOR | 2,789,755,720.087 shares (95.821%) | |
WITHHOLD | 121,670,292.528 shares (4.179%) | |
TOTAL | 2,912,726,012.615 shares (100.000%) | |
Douglas F. Kridler: | ||
FOR | 2,798,065,774.375 shares (96.106%) | |
WITHHOLD | 113,360,238.240 shares (3.894%) | |
TOTAL | 2,912,726,012.615 shares (100.000%) | |
Michael D. McCarthy: | ||
FOR | 2,797,452,613.694 shares (96.085%) | |
WITHHOLD | 113,973,395.921 shares (3.915%) | |
TOTAL | 2,912,726,012.615 shares (100.000%) | |
Arden L. Shisler: | ||
FOR | 2,796,738,454.730 shares (96.061%) | |
WITHHOLD | 114,687,557.885 shares (3.939%) | |
TOTAL | 2,912,726,012.615 shares (100.000%) | |
David C. Wetmore: | ||
FOR | 2,794,784,752.247 shares (95.994%) | |
WITHHOLD | 116,641,260.368 shares (4.006%) | |
TOTAL | 2,912,726,012.615 shares (100.000%) | |
Proposal 2: Approval of the Agreement and Plan of Reorganization of Gartmore Variable Insurance Trust
FOR | 2,561,003,822.546 shares (87.964%) | |
AGAINST | 103,593,261.010 shares (3.558%) | |
ABSTAIN | 246,828,929.059 shares (8.478%) | |
TOTAL | 2,912,726,012.615 shares (100.000%) | |
16
Table of Contents
GARTMORE VARIABLE INSURANCE TRUST
Management Information (Unaudited)
June 30, 2005
Trustees who are not Interested Persons (as defined in the 1940 Act) and Officers of the Funds June 30, 2005
| Name, Address and Date of Birth | Position(s) Held with the Trust and Length of Time Served1 | Principal Occupation(s) During Past 5 Years | Number of Portfolios in the Gartmore Fund Complex Overseen by Trustee | Other Directorships Held by Trustee or Nominee2 | ||||
Charles E. Allen
c/o Gartmore Global Investments, Inc. 1200 River Road, Suite 1000 Conshohocken, PA 19428
1948 | Trustee since July 2000 | Mr. Allen is Chairman, Chief Executive Officer and President of the Graimark Realty Advisors, Inc. (real estate development, investment and asset management). | 84 | None | ||||
Paula H.J. Cholmondeley
c/o Gartmore Global Investments, Inc. 1200 River Road, Suite 1000 Conshohocken, PA 19428
1940 | Trustee since July 2000 | Ms. Cholmondeley has been the Chairman and Chief Executive Officer of the Sorrel Group, a management consulting company, since January 2004. From March 2000 through December 2003, Ms. Cholmondeley was Vice President and General Manager of Sappi Fine Paper North America. Prior thereto, Ms. Cholmondeley was Vice President and General Manager of Residential Insulation of Owens Corning. | 84 | Director of Dentsply International, Inc., Ultralife Batteries, Inc., Terex Corporation, Minerals Technology, Inc. and Albany International Corp. | ||||
C. Brent DeVore
c/o Gartmore Global Investments, Inc. 1200 River Road, Suite 1000 Conshohocken, PA 19428
1940 | Trustee since 1990 | Dr. DeVore is President of Otterbein College. | 84 | None | ||||
Phyllis K. Dryden
c/o Gartmore Global Investments, Inc. 1200 River Road, Suite 1000 Conshohocken, PA 19428
1947 | Trustee since December 2004 | Ms. Dryden was a former Managing Partner of marchFIRST, a global management consulting firm prior to 2002. | 84 | None |
17
Table of Contents
GARTMORE VARIABLE INSURANCE TRUST
Management Information (Unaudited)
June 30, 2005
| Name, Address and Date of Birth | Position(s) Held with the Trust and Length of Time Served1 | Principal Occupation(s) During Past 5 Years | Number of Portfolios in the Gartmore Fund Complex Overseen by Trustee | Other Directorships Held by Trustee or Nominee2 | ||||
Barbara L. Hennigar*
c/o Gartmore Global Investments, Inc. 1200 River Road, Suite 1000 Conshohocken, PA 19428
1935 | Trustee since July 2000 | Retired since June 2000. Prior thereto, Ms. Hennigar was the Chairman or President and Chief Executive Officer of OppenheimerFunds Services and a member of the Executive Committee of OppenheimerFunds. | 84 | None | ||||
Barbara I. Jacobs
c/o Gartmore Global Investments, Inc. 1200 River Road, Suite 1000 Conshohocken, PA 19428
1950 | Trustee since December 2004 | Ms. Jacobs has served as Chairman of the Board of Directors of KICAP Network Fund, a European (United Kingdom) hedge fund, since December 2000. Prior to 2004, Ms. Jacobs was also a Managing Director and European Portfolio Manager with CREF Investments (Teachers Insurance Annuity Association — College Retirement Equity Fund). | 84 | None | ||||
Douglas F. Kridler
c/o Gartmore Global Investments, Inc. 1200 River Road, Suite 1000 Conshohocken, PA 19428
1955 | Trustee since September 1997 | Mr. Kridler has served as the President and Chief Executive Officer of the Columbus Foundation (a Columbus, OH-based foundation which manages over 1,300 individual endowment funds) since February 2002. Mr. Kridler was the President of the Columbus Association for the Performing Arts prior thereto and Chairman of the Greater Columbus Convention and Visitors Bureau during 2000 and 2001. | 84 | None | ||||
Michael D. McCarthy
c/o Gartmore Global Investments, Inc. 1200 River Road, Suite 1000 Conshohocken, PA 19428
1947 | Trustee since December 2004 | Mr. McCarthy serves as: the Founder and Chairman of The Eureka Foundation (which sponsors and funds the “Great Museums” series on PBS); and a Partner of Pineville Properties LLC (a commercial real estate development firm). | 843 | None |
18
Table of Contents
GARTMORE VARIABLE INSURANCE TRUST
Management Information (Unaudited)
June 30, 2005
| Name, Address and Date of Birth | Position(s) Held with the Trust and Length of Time Served1 | Principal Occupation(s) During Past 5 Years | Number of Portfolios in the Gartmore Fund Complex Overseen by Trustee | Other Directorships Held by Trustee or Nominee2 | ||||
David C. Wetmore
c/o Gartmore Global Investments, Inc. 1200 River Road, Suite 1000 Conshohocken, PA 19428
1948 | Trustee since 1995 and Chairman since February 2005 | Retired. Mr. Wetmore was formerly a Managing Director of Updata Capital, an investment banking and venture capital firm. | 84 | None |
| * | Pursuant to the Trust’s mandatory retirement policy, Ms. Hennigar is expected to retire on or about January 12, 2006. |
| 1 | The term of office length is until a trustee resigns or reaches a mandatory retirement age of 70. On March 2, 2000, the Board adopted a five-year implementation period for any Trustee 65 or older as of the adoption of this policy. Pursuant to this policy, Messrs. Duncan and Kerr retired as trustees effective as of March 12, 2005. |
| 2 | Directorships held in (1) any other investment companies registered under the 1940 Act, (2) any company with a class of securities registered pursuant to Section 12 of the Securities Exchange Act of 1934, as amended (the “Exchange Act”), or (3) any company subject to the requirements of Section 15(d) of the Exchange Act. |
| 3 | Mr. McCarthy was also an Administrative Committee Member for the Alphagen Arneb Fund, LLC, The Healthcare Fund LDC, The Leaders Long-Short Fund, LLC, and The Leaders Long-Short Fund LDC, four private investment companies (hedge funds) managed by GSA. Mr. McCarthy resigned as an Administrative Committee Member effective June 30, 2005. |
Trustees and Officers who are not Interested Persons (as defined in the 1940 Act) of the Funds received aggregate compensation of $274,882 from the Trust for the Six Months Ended June 30, 2005. Additional information regarding the Trustees and Officers may be found in the Trust’s statement of additional information, which is available without charge upon request, by calling 1-800-848-0920.
19
Table of Contents
GARTMORE VARIABLE INSURANCE TRUST
Management Information (Unaudited)
June 30, 2005
Trustees who are Interested Persons (as defined in the 1940 Act) and/or Officers of the Funds June 30, 2005
| Name, Address and Age | Position(s) Held with the Trust and Length of Time Served1 | Principal Occupation(s) During Past 5 Years | Number of Portfolios in the Gartmore Fund Complex Overseen by Trustee | Other Directorships Held by Trustee2 | ||||
Paul J. Hondros
Gartmore Global Investments, Inc. 1200 River Road, Suite 1000 Conshohocken, PA 19428
1948 | Trustee since July 2000 | Mr. Hondros has been President and Chief Executive Officer of various Gartmore entities, including Gartmore Distribution Services, Inc. (“GDSI”),3 Gartmore Investor Services, Inc. (“GISI”),3 Gartmore Morley Capital Management, Inc. (“GMCM”),3 Gartmore Morley Financial Services, Inc. (“GMFS”),3 NorthPointe Capital, LLC (“NorthPointe”),3 Gartmore Global Asset Management Trust (“GGAMT”)3, Gartmore Global Investments, Inc. (“GGI”)3, Gartmore Mutual Fund Capital Trust (“GMFCT”)3 and Gartmore SA Capital Trust (“GSA”)3; and a Director of Nationwide Securities, Inc.3, as well as several entities within Nationwide Financial Services, Inc. | 844 | None | ||||
Arden L. Shisler
c/o Gartmore Global Investments, Inc. 1200 River Road, Suite 1000 Conshohocken, PA 19428
1941 | Trustee since February 2000 | Mr. Shisler has been a consultant since January 2003. Prior thereto, he was President and Chief Executive Officer of K&B Transport, Inc., a trucking firm. Since 1992, Mr. Shisler has also been Chairman of the Board for Nationwide Mutual Insurance Company3. | 84 | Director of Nationwide Financial Services, Inc. | ||||
Gerald J. Holland Gartmore Global Investments, Inc. 1200 River Road, Suite 1000 Conshohocken, PA 19428 1951 | Treasurer since March 2001 | Mr. Holland is Senior Vice President – Operations for GGI3, GMFCT3 , and GSA3. Prior to July 2000, Mr, Holland was Vice President for First Data Investor Services, an investment company service provider. | 84 | None |
20
Table of Contents
GARTMORE VARIABLE INSURANCE TRUST
Management Information (Unaudited)
June 30, 2005
| Name, Address and Age | Position(s) Held with the Trust and Length of Time Served1 | Principal Occupation(s) During Past 5 Years | Number of Portfolios in the Gartmore Fund Complex Overseen by Trustee | Other Directorships Held by Trustee2 | ||||
Michael A. Krulikowski
Gartmore Global Investments, Inc. 1200 River Road, Suite 1000 Conshohocken, PA 19428
1959 | Chief Compliance Officer since June 2004 | Since November 1999, Mr. Krulikowski has served as a Vice President and Chief Compliance Officer of GGI. Prior thereto, Mr. Krulikowski served as Chief Compliance Officer of 1717 Capital Management Company/Provident Mutual Insurance Company. | 84 | None | ||||
Eric E. Miller
Gartmore Global Investments, Inc. 1200 River Road, Suite 1000 Conshohocken, PA 19428
1953 | Secretary since December 2002 | Mr. Miller is Senior Vice President, Chief Counsel for GGI3, GMFCT3 and GSA3 since August 2002. From August 2000 to August 2002, Mr. Miller was a Partner with Stradley Ronan Stevens & Young, LLP. Prior to August 2000, Mr. Miller served as Senior Vice President and Deputy General Counsel at Delaware Investments. | 84 | None |
| 1 | The term of office length is until a trustee resigns or reaches a mandatory retirement age of 70. On March 2, 2000, the Board adopted a five-year implementation period for any Trustee 65 or older as of the adoption of this policy. Pursuant to this policy, Messrs. Duncan and Kerr retired as trustees effective as of March 12, 2005. |
| 2 | Directorships held in (1) any other investment companies registered under the 1940 Act, (2) any company with a class of securities registered pursuant to Section 12 of the Securities Exchange Act of 1934, as amended (the “Exchange Act”), or (3) any company subject to the requirements of Section 15(d) of the Exchange Act. |
| 3 | This position is held with an affiliated person or principal underwriter of the Trust. |
| 4 | Mr. Hondros was also an Administrative Committee Member for the Alphagen Arneb Fund, LLC, The Healthcare Fund LDC, The Leaders Long-Short Fund, LLC, and The Leaders Long-Short Fund LDC, four private investment companies (hedge funds) managed by GSA. Mr. Hondros resigned as Administrative Committee Member effective June 30, 2005. |
Federal law requires the Trust, each of its investment advisers and sub-advisers to adopt procedures for voting proxies (“Proxy Voting Guidelines”) and to provide a summary of those Proxy Voting Guidelines used to vote the securities held by the Funds. The Funds’ proxy voting policies and procedures are available without charge (i) upon request, by calling 1-800-848-0920, (ii) on the Fund’s website at www.gartmorefunds.com, or (iii) on the Securities and Exchange Commission’s website at www.sec.gov.
21
Table of Contents
Gartmore GVIT U.S. Growth Leaders Fund
SemiannualReport
| | June 30, 2005 |


| Contents | ||
| 6 | Statement of Investments | |
| 8 | Statement of Assets and Liabilities | |
| 8 | Statement of Operations | |
| 9 | Statements of Changes in New Assets | |
| 10 | Financial Highlights | |
| 11 | Notes to Financial Statements | |
Commentary provided by Gartmore Global Investments, investment adviser to Gartmore Variable Insurance Trust. All opinions and estimates included in this report constitute Gartmore Global Investments’ judgment as of the date of this report and are subject to change without notice.
Statement Regarding Availability of Quarterly Portfolio Schedule.
The Gartmore Variable Insurance Trust files complete schedules of portfolio holdings for each Fund with the Securities and Exchange Commission (the “Commission”) for the first and third quarters of each fiscal year on Form N-Q. The Funds’ Forms N-Q are available on the Commission’s website at http://www.sec.gov. The Funds’ Forms N-Q may be reviewed and copied at the Commission’s Public Reference Room in Washington, DC, and information on the operation of the Public Reference Room may be obtained by calling 800-SEC-0330; and the Funds make the information on Form N-Q available to shareholders upon request without charge.
Statement Regarding Availability of Proxy Voting Record.
Information regarding how the Fund voted proxies relating to portfolio securities held during the most recent 12-month period ended June 30, 2005 is available without charge, upon request, by calling 800-848-0920, and on the Commission’s website at http://www.sec.gov.
Table of Contents
Gartmore GVIT U.S. Growth Leaders Fund
For the semiannual period ended June 30, 2005, the Gartmore GVIT U.S. Growth Leaders Fund returned 2.05% (Class I at NAV) versus -0.81% for its benchmark, the Standard & Poor’s 500® (S&P 500) Index. For broader comparison, the average return for the Fund’s Lipper peer category of Multi-Cap Growth Funds was -0.33%.
The Fund’s outperformance was driven by strong stock selection, particularly in the information technology and consumer discretionary sectors. In technology, the Fund benefited from its holdings in Internet search engine Google Inc., which rewarded investors with upwardly revised earnings, increasing market share and robust paid-search revenues. Another technology holding boosting the Fund’s results was design software maker Autodesk, Inc., whose healthy sales of licenses and subscriptions for its products enabled the company to deliver double-digit revenue and earnings growth for the first quarter of 2005. The company also lifted its outlook for the second quarter and the entire fiscal year.
In the consumer discretionary sector, Nordstrom, Inc. was a key contributor to Fund performance. The share price of the department store chain benefited from solid increases in same-store sales. Home products retailer Kohl’s Corp. also helped performance, as stronger-than-expected same-store sales for May gave the stock a big boost during the second half of the reporting period. We added to this position, gradually building it into one of the Fund’s largest holdings.
Investors Financial Services, a provider of back-office services to asset management companies, was one holding that detracted from the Fund’s performance. The stock struggled in part because a flattening yield curve, a condition in which the difference between long-term interest rates and short-term rates narrows, cut into the company’s earnings. Another stock that held back Fund performance was Quest Software Inc., which makes application and database management software designed to guarantee application performance and monitor the delivery of information by means of corporate networks and the Internet. Quest Software reported solid gains in first-quarter revenue and earnings but issued full-year guidance that disappointed analysts, reflecting the costs associated with the company’s proposed acquisition of Imceda Software Inc.
Important changes during the period included a reduction in the Fund’s industrials weighting, which went from an overweighting to an underweighting versus the benchmark. In our opinion, sentiment regarding this sector had been overly optimistic, and we did not see that optimism justified in the capital spending we were observing for industrial products. Conversely, we increased the Fund’s weighting in consumer discretionary stocks, especially in the retail area and the hotels, restaurants & leisure segment.
While the U.S. economy could slow from its recent pace, we should keep in mind that for the past two quarters, economists have had to revise gross domestic product growth upward from initial estimates. Similarly, personal disposable income continues to be surprisingly strong, buoyed in part by a robust housing market. At present, therefore, we are comfortable with the Fund’s modest overweightings in the technology and consumer discretionary sectors, and we anticipate a reasonably favorable near-term environment for applying our disciplined brand of bottom-up stock picking—a strategy that involves considering companies simply on their own merit, without regard to their given industries/sectors or the current economic conditions.
Portfolio Managers: Christopher Baggini, CFA and Douglas Burtnick, CFA
Investing in mutual funds involves risk, including possible loss of principal.
There is no assurance that the investment objective of any fund will be achieved.
Funds that concentrate on specific sectors or a relatively small number of securities may be subject to greater volatility than a more diversified investment.
Standard & Poor’s 500 (S&P 500) Index: An unmanaged, capitalization-weighted index of 500 widely held stocks of large-cap U.S. companies that gives a broad look at how the stock prices of those companies have performed.
Lipper Analytical Services, Inc. is an industry research firm whose rankings are based on total return performance and do not reflect the effects of sales charges.
The Gartmore Variable Insurance Trust Funds are available only as sub-account investment options in certain variable insurance products. Accordingly, investors are unable to invest in shares of these funds outside of an insurance product. Performance information found herein reflects only the performance of these funds, and does not indicate the performance your sub-account may experience under your variable insurance contract. Performance returns assume reinvestment of all distributions. The investment return and principal value of an investment will fluctuate so that an investor’s shares, when redeemed, may be worth more or less than their original cost. Index performance is provided for comparison purposes only; the indexes shown are unmanaged and do not reflect any fees or expenses. Investors cannot invest directly in market indexes. To obtain performance information about the sub-account option under your insurance contract that invests in one of these funds, please contact your variable insurance
1
Table of Contents
Gartmore GVIT U.S. Growth Leaders Fund
carrier. PAST PERFORMANCE IS NO GUARANTEE OF FUTURE RESULTS.
Commentary provided by Gartmore Global Investments. All opinions and estimates included in this report constitute Gartmore Global Investments’ judgment as of the date of this report and are subject to change without notice.
Investors should carefully consider a fund’s investment objectives, risks, fees, charges and expenses before investing any money. To obtain this and other information on Gartmore Variable Insurance Trust, please contact your variable insurance contract provider or call 800-848-0920. Please read the Trust’s prospectus carefully before investing any money.
Gartmore Funds distributed by Gartmore Distribution Services, Inc., Member NASD. 1200 River Road, Suite 1000, Conshohocken, PA 19428.
2
Table of Contents
Fund Performance | Gartmore GVIT U.S. Growth Leaders Fund |
Average Annual Total Return1
(For Periods Ended June 30, 2005)
| Six Months* | 1 Yr. | Inception2 | ||||
| Class I3 | 2.05% | 11.97% | 8.50% | |||
| Class II3 | 1.87% | 11.57% | 8.41% | |||
| Class III4 | 1.95% | 11.91% | 8.61% |
| * | Not Annualized. |
| 1 | Not subject to any sales charges. |
| 2 | Fund commenced operations on December 31, 2001. |
| 3 | These returns until the creation of the Class I shares (June 3, 2002) and Class II shares (March 21, 2003) are based on the performance of the Class III shares of the Fund. Excluding the effect of any fee waivers or reimbursements, such prior performance is similar to what Class I and Class II shares would have produced because all classes of shares invest in the same portfolio of securities. Class II shares’ annual returns have been restated to reflect the additional fees applicable to Class II shares and therefore are lower than those of Class I. |
| 4 | For Class III shares, these returns do not reflect the short-term trading fees applicable to such shares; if these fees were reflected, the annual returns for Class III shares would have been lower. |
Performance of a $10,000 Investment
Investment return and principal value will fluctuate, and when redeemed, shares may be worth more or less than original cost. Past performance is no guarantee of future results and does not reflect the deduction of taxes that a shareholder would pay on fund distributions or the redemption of fund shares. Investing in mutual funds involves market risk, including loss of principal. Performance returns assume the reinvestment of all distributions.
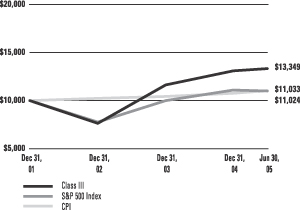
Comparative performance of $10,000 invested in Class III shares of the Gartmore GVIT U.S. Growth Leaders Fund, Standard & Poor’s 500 Index (S&P 500)(a), and the Consumer Price Index (CPI)(b) since inception. Unlike the Fund, the returns for these unmanaged indexes do not reflect any fees, expenses, or sales charges. Investors cannot invest directly in market indexes.
| (a) | S&P 500 is an unmanaged, market capitalization-weighted index of 500 widely held stocks of large-cap U.S. companies that gives a broad look at how the stock prices of those companies have performed. |
| (b) | The CPI represents changes in prices of a basket of goods and services purchased for consumption by urban households. |
3
Table of Contents
Shareholder
Expense Example | Gartmore GVIT U.S. Growth Leaders Fund |
As a shareholder of the Fund, you incur two types of costs: (1) transaction costs, including sales charges (loads) paid on purchase payments and redemption fees; and (2) ongoing costs, including investment advisory fees, administration fees, distribution fees and other Fund expenses. The examples below are intended to help you understand your ongoing costs (in dollars) of investing in the Fund and to compare these costs with the ongoing costs of investing in other mutual funds. Per SEC requirements, the examples assume that you had a $1,000 investment in the Class at the beginning of the reporting period, January 1, 2005, and continued to hold your shares at the end of the reporting period, June 30, 2005.
Actual Expenses
For each Class of the Fund in the table below, the first line provides information about actual account values and actual expenses. You may use the information in this line, together with the amount you invested, to estimate the expenses that you paid over the period. Simply divide your account value by $1,000 (for example, an $8,600 account value divided by $1,000 = 8.6), then multiply the result by the number in the first line of each Class under the heading entitled “Expenses Paid During Period” to estimate the expenses you paid on your account during the period.
Hypothetical Example for Comparison Purposes
The second line of each Class in the table below provides information about hypothetical account values and hypothetical expenses based on the Class’ actual expense ratio and an assumed rate of return of 5% per year before expenses, which is not the Class’ actual return. The hypothetical account values and expenses may not be used to estimate the actual ending account balance or expenses you paid for the period. You may use this information to compare the ongoing costs of investing in the Class of the Fund and other funds. To do so, compare this 5% hypothetical example with the 5% hypothetical examples that appear in the shareholder reports of the other funds.
Please note that the expenses shown in the table are meant to highlight your ongoing costs only and do not reflect any transaction costs, such as sales charges (loads) or redemption fees. Therefore, the second line for each Class in the table is useful in comparing ongoing costs only, and will not help you determine the relative total costs of owning different funds. In addition, if these transaction costs were included, your costs would have been higher. The examples also assume all dividends and distributions have been reinvested.
| Beginning Account Value, January 1, 2005 | Ending Account Value, June 30, 2005 | Expenses Paid During Period* | Annualized Expense Ratio* | ||||||||||
| U.S Growth Leaders Fund | |||||||||||||
Class I | Actual | $ | 1,000 | $ | 1,021 | $ | 5.91 | 1.18% | |||||
| Hypothetical1 | $ | 1,000 | $ | 1,019 | $ | 5.92 | 1.18% | ||||||
Class II | Actual | $ | 1,000 | $ | 1,019 | $ | 7.16 | 1.43% | |||||
| Hypothetical1 | $ | 1,000 | $ | 1,018 | $ | 7.18 | 1.43% | ||||||
Class III | Actual | $ | 1,000 | $ | 1,020 | $ | 5.91 | 1.18% | |||||
| Hypothetical1 | $ | 1,000 | $ | 1,019 | $ | 5.92 | 1.18% | ||||||
| * | Expenses are equal to the Fund’s annualized expense ratio multiplied by the average account value over the period multiplied by 181/365 (to reflect the one-half year period). The expense ratio presented represents a six month, annualized ratio in accordance with SEC guidelines. |
| 1 | Represents the hypothetical 5% return before expenses. |
4
Table of Contents
Portfolio Summary
(June 30, 2005) | Gartmore GVIT U.S. Growth Leaders Fund |
The SEC adopted a requirement that Funds present their portfolio holdings in a table, chart or graph format in their annual and semiannual reports to shareholders, whether or not a statement of investments is utilized. The following tables, which present portfolio holdings as a percentage of net assets, are provided in compliance with this requirement.
| Asset Allocation | ||
| Common Stocks | 96.2% | |
| Cash Equivalents | 5.7% | |
| Other Investments* | 3.5% | |
| Liabilities in excess of other assets** | -5.4 % | |
| 100.0% | ||
| Top Holdings*** | ||
| Verisign, Inc. | 5.0% | |
| Franklin Resources, Inc. | 4.3% | |
| Kohl’s Corp. | 4.2% | |
| Wellpoint, Inc. | 4.0% | |
| Juniper Networks, Inc. | 3.8% | |
| Capital One Financial Corp. | 3.8% | |
| St. Jude Medical, Inc. | 3.7% | |
| Comverse Technology, Inc. | 3.7% | |
| Brinker International, Inc. | 3.5% | |
| Invitrogen Corp. | 3.5% | |
| Other Holdings | 60.5% | |
| 100.0% | ||
| Top Industries | ||
| Computer Software & Services | 14.8% | |
| Financial Services | 14.2% | |
| Retail | 10.4% | |
| Telecommunications | 10.1% | |
| Healthcare | 10.1% | |
| Semiconductors | 6.4% | |
| Oil & Gas | 6.0% | |
| Restaurants | 3.5% | |
| Medical Products | 3.5% | |
| Hotels & Motels | 3.3% | |
| Other Industries | 17.7% | |
| 100.0% | ||
| * | Includes value of collateral received from securities lending. |
| ** | Includes value of collateral owed from securities lending. |
| *** | For purpose of listing top holdings, repurchase agreements are considered cash equivalents and are included as part of Other Holdings. |
5
Table of Contents
GARTMORE VARIABLE INSURANCE TRUST
GARTMORE GVIT U.S. GROWTH LEADERS FUND
Statement of Investments — June 30, 2005 (Unaudited)
Shares or Principal Amount | Value | ||||
| COMMON STOCKS (96.2%) | |||||
| Building & Construction (3.2%) | |||||
| Pulte Corp. | 20,030 | $ | 1,687,528 | ||
| Casino Hotels (2.5%) | |||||
| Station Casinos, Inc. | 19,420 | 1,289,488 | |||
| Coal (2.0%) | |||||
| Peabody Energy Corp. | 19,500 | 1,014,780 | |||
| Computer Software & Services (14.8%) | |||||
| Activision, Inc. (b) | 46,420 | 766,858 | |||
| AutoDesk, Inc. | 38,240 | 1,314,309 | |||
| Cognizant Technology Solutions Corp. (b) | 22,040 | 1,038,745 | |||
| Juniper Networks, Inc. (b) | 78,620 | 1,979,652 | |||
| Verisign, Inc. (b) | 89,840 | 2,583,797 | |||
| 7,683,361 | |||||
| Financial Services (14.2%) | |||||
| Capital One Financial Corp. | 24,700 | 1,976,247 | |||
| Countrywide Credit Industries, Inc. | 40,700 | 1,571,427 | |||
| Franklin Resources, Inc. | 28,800 | 2,217,023 | |||
| Goldman Sachs Group, Inc. | 15,600 | 1,591,512 | |||
| 7,356,209 | |||||
| Food & Beverage (3.0%) | |||||
| PepsiCo, Inc. | 28,820 | 1,554,263 | |||
| Healthcare (10.1%) | |||||
| Ivax Corp. (b) | 55,850 | 1,200,775 | |||
| St. Jude Medical, Inc. (b) | 44,350 | 1,934,104 | |||
| Wellpoint, Inc. (b) | 30,080 | 2,094,771 | |||
| 5,229,650 | |||||
| Hotels & Motels (3.3%) | |||||
| Starwood Hotels & Resorts Worldwide | 29,110 | 1,704,973 | |||
| Manufacturing (3.2%) | |||||
| Textron, Inc. | 22,070 | 1,674,010 | |||
Shares or Principal Amount | Value | |||||
| COMMON STOCKS (continued) | ||||||
| Medical Products (3.5%) | ||||||
| Invitrogen Corp. (b) | 21,900 | $ | 1,824,051 | |||
| Oil & Gas (6.0%) | ||||||
| Praxair, Inc. | 35,600 | 1,658,960 | ||||
| Transocean, Inc. (b) | 27,000 | 1,457,190 | ||||
| 3,116,150 | ||||||
| Restaurants (3.5%) | ||||||
| Brinker International, Inc. (b) | 45,820 | 1,835,091 | ||||
| Retail (10.4%) | ||||||
| American Eagle Outfitters, Inc. | 46,450 | 1,423,693 | ||||
| CVS Corp. | 62,050 | 1,803,794 | ||||
| Kohl’s Corp. (b) | 39,140 | 2,188,316 | ||||
| 5,415,803 | ||||||
| Semiconductors (6.4%) | ||||||
| Broadcom Corp. (b) | 45,600 | 1,619,256 | ||||
| National Semiconductor Corp. | 76,850 | 1,693,006 | ||||
| 3,312,262 | ||||||
| Telecommunications (10.1%) | ||||||
| Comverse Technology, Inc. (b) | 80,160 | 1,895,784 | ||||
| Corning, Inc. (b) | 108,400 | 1,801,608 | ||||
| Nokia Corp. ADR-FI | 93,350 | 1,553,344 | ||||
| 5,250,736 | ||||||
| Total Common Stocks | 49,948,355 | |||||
| CASH EQUIVALENTS (5.7%) | ||||||
| Investments in repurchase agreements (Collateralized by AA Corporate Bonds, in a joint trading account at 3.34%, dated 06/30/05, due 07/01/05, repurchase price $2,975,077) | $ | 2,974,801 | 2,974,801 | |||
| Total Cash Equivalents | 2,974,801 | |||||
6
Table of Contents
GARTMORE VARIABLE INSURANCE TRUST
GARTMORE GVIT U.S. GROWTH LEADERS FUND
Statement of Investments — June 30, 2005 (Unaudited) (continued)
| Shares or Principal Amount | Value | ||||||
| SHORT-TERM SECURITIES HELD AS COLLATERAL FOR SECURITIES LENDING (3.5%) | |||||||
| Pool of short-term securities for Gartmore Variable Insurance Trust Funds — note 2 | |||||||
| (Securities Lending) | $ | 1,795,200 | $ | 1,795,200 | |||
| Total Short-Term Securities Held as Collateral for Securities Lending | 1,795,200 | ||||||
| Total Investments (Cost $52,331,256) (a) — 105.4% | 54,718,356 | ||||||
| Liabilities in excess of other assets — (5.4%) | (2,774,940 | ) | |||||
| NET ASSETS — 100.0% | $ | 51,943,416 | |||||
| (a) | See notes to financial statements for tax unrealized appreciation (depreciation) of securities. |
| (b) | Denotes a non-income producing security. |
| ADR | American Depositary Receipt |
| FI | Finland |
See notes to financial statements.
7
Table of Contents
GARTMORE VARIABLE INSURANCE TRUST
GARTMORE GVIT U.S. GROWTH LEADERS FUND
Statement of Assets and Liabilities
June 30, 2005 (Unaudited)
Assets: | ||||
Investments, at value (cost $49,356,455) | $ | 51,743,555 | ||
Repurchase agreements, at cost and value | 2,974,801 | |||
Total Investments | 54,718,356 | |||
Interest and dividends receivable | 21,378 | |||
Receivable for investments sold | 4,032,859 | |||
Prepaid expenses and other assets | 578 | |||
Total Assets | 58,773,171 | |||
Liabilities: | ||||
Payable for investments purchased | 4,961,513 | |||
Payable for return of collateral received for securities on loan | 1,795,200 | |||
Accrued expenses and other payables: | ||||
Investment advisory fees | 58,969 | |||
Fund administration and transfer agent fees | 1,140 | |||
Distribution fees | 2,688 | |||
Administrative servicing fees | 5,503 | |||
Other | 4,742 | |||
Total Liabilities | 58,768,429 | |||
Net Assets | $ | 51,943,416 | ||
Represented by: | ||||
Capital | $ | 46,542,254 | ||
Accumulated net investment income (loss) | (78,423 | ) | ||
Accumulated net realized gain (losses) from investments | 3,092,485 | |||
Net unrealized appreciation (depreciation) | 2,387,100 | |||
Net Assets | $ | 51,943,416 | ||
Net Assets: | ||||
Class I Shares | $ | 7,102,033 | ||
Class II Shares | 13,531,127 | |||
Class III Shares | 31,310,256 | |||
Total | $ | 51,943,416 | ||
Shares outstanding (unlimited number of shares authorized): | ||||
Class I Shares | 656,578 | |||
Class II Shares | 1,253,756 | |||
Class III Shares | 2,879,776 | |||
Total | 4,790,110 | |||
Net asset value and offering price per share:* | ||||
Class I Shares | $ | 10.82 | ||
Class II Shares | $ | 10.79 | ||
Class III Shares | $ | 10.87 |
| * | Not subject to a front-end sales charge. |
For the Six Months Ended June 30, 2005 (Unaudited)
Investment Income: | ||||
Interest income | $ | 18,128 | ||
Dividend income | 199,529 | |||
Income from securities lending | 2,073 | |||
Total Income | 219,730 | |||
Expenses: | ||||
Investment advisory fees | 217,153 | |||
Fund administration and transfer agent fees | 16,678 | |||
Distribution fees Class II Shares | 14,285 | |||
Administrative servicing fees | 4,318 | |||
Administrative servicing fees | 8,242 | |||
Administrative servicing fees | 22,748 | |||
Other** | 14,729 | |||
Total Expenses | 298,153 | |||
Net Investment Income (Loss) | (78,423 | ) | ||
REALIZED/UNREALIZED GAINS | ||||
Net realized gains (losses) on investment transactions | 3,110,759 | |||
Net change in unrealized appreciation/depreciation on investments | (2,084,388 | ) | ||
Net realized/unrealized gains (losses) on investments | 1,026,371 | |||
CHANGE IN NET ASSETS RESULTING FROM OPERATIONS | $ | 947,948 | ||
| ** | Other expenses may include the following fees: audit, custody, insurance, legal, printing, trustee, and out-of-pocket expenses. |
See notes to financial statements.
8
Table of Contents
GARTMORE VARIABLE INSURANCE TRUST
GARTMORE GVIT U.S. GROWTH LEADERS FUND
Statement of Changes in Net Assets
| Six Months Ended June 30, 2005 | Year Ended December 31, 2004 | |||||||
| (Unaudited) | ||||||||
From Investment Activities: | ||||||||
Operations: | ||||||||
Net investment income (loss) | $ | (78,423 | ) | $ | (424,063 | ) | ||
Net realized gains (losses) on investment transactions | 3,110,759 | 4,929,661 | ||||||
Net change in unrealized appreciation/depreciation on investments | (2,084,388 | ) | 337,121 | |||||
Change in net assets resulting from operations | 947,948 | 4,842,719 | ||||||
Distributions to Class I shareholders from: | ||||||||
Net realized gains on investments | (583,903 | ) | (254,356 | ) | ||||
Distributions to Class II shareholders from: | ||||||||
Net realized gains on investments | (1,107,845 | ) | (299,998 | ) | ||||
Distributions to Class III shareholders from: | ||||||||
Net realized gains on investments | (2,532,029 | ) | (1,881,512 | ) | ||||
Change in net assets from shareholder distributions | (4,223,777 | ) | (2,435,866 | ) | ||||
Change in net assets from capital transactions | 5,099,031 | (17,545,981 | ) | |||||
Change in net assets | 1,823,202 | (15,139,128 | ) | |||||
Net Assets: | ||||||||
Beginning of period | 50,120,214 | 65,259,342 | ||||||
End of period | $ | 51,943,416 | $ | 50,120,214 | ||||
CAPITAL TRANSACTIONS: | ||||||||
Class I Shares | ||||||||
Proceeds from shares issued | $ | 2,642,718 | $ | 5,960,920 | ||||
Dividends reinvested | 583,903 | 254,355 | ||||||
Cost of shares redeemed | (2,025,857 | ) | (6,400,463 | ) | ||||
| 1,200,764 | (185,188 | ) | ||||||
Class II Shares | ||||||||
Proceeds from shares issued | 3,498,407 | 7,795,254 | ||||||
Dividends reinvested | 1,107,844 | 299,997 | ||||||
Cost of shares redeemed | (836,954 | ) | (2,317,336 | ) | ||||
| 3,769,297 | 5,777,915 | |||||||
Class III Shares | ||||||||
Proceeds from shares issued | 2,974,187 | 8,789,593 | ||||||
Dividends reinvested | 2,532,027 | 1,881,507 | ||||||
Cost of shares redeemed | (5,377,244 | ) | (33,809,808 | ) | ||||
| 128,970 | (23,138,708 | ) | ||||||
Change in net assets from capital transactions | $ | 5,099,031 | $ | (17,545,981 | ) | |||
SHARE TRANSACTIONS: | ||||||||
Class I Shares | ||||||||
Issued | 231,375 | 563,139 | ||||||
Reinvested | 54,519 | 24,253 | ||||||
Redeemed | (180,261 | ) | (613,428 | ) | ||||
| 105,633 | (26,036 | ) | ||||||
Class II Shares | ||||||||
Issued | 306,949 | 734,900 | ||||||
Reinvested | 103,634 | 28,516 | ||||||
Redeemed | (73,871 | ) | (227,455 | ) | ||||
| 336,712 | 535,961 | |||||||
Class III Shares | ||||||||
Issued | 261,245 | 810,698 | ||||||
Reinvested | 235,100 | 178,838 | ||||||
Redeemed | (471,173 | ) | (3,226,633 | ) | ||||
| 25,172 | (2,237,097 | ) | ||||||
See notes to financial statements.
9
Table of Contents
GARTMORE VARIABLE INSURANCE TRUST
Selected Data for Each Share of Capital Outstanding
Gartmore GVIT U.S. Growth Leaders Fund
| Investment Activities | Distributions | Ratios/Supplemental Data | |||||||||||||||||||||||||||||||||||||||||
| Net Asset Value, Beginning of Period | Net Investment Income (Loss) | Redemption fees | Net Realized and Unrealized Gains (Losses) on Investments | Total from Investment Activities | Net Realized Gains | Total Distributions | Net Asset Value, End of Period | Total Return | Net Assets at End of Period (000s) | Ratio of Expenses to Average Net Assets | Ratio of Net Investment Income (Loss) to Average Net Assets | Ratio of Expenses (Prior to Reimbursements) to Average Net Assets(a) | Ratio of Net Investment Income (Loss) (Prior to Reimbursements) to Average Net Assets(a) | Portfolio Turnover(b) | |||||||||||||||||||||||||||||
Class I Shares | |||||||||||||||||||||||||||||||||||||||||||
Period Ended December 31, 2002(c) | $ | 8.64 | (0.02 | ) | 0.01 | (1.07 | ) | (1.08 | ) | — | — | $ | 7.56 | (12.50% | )(f) | $ | 476 | 1.16% | (g) | (0.56% | )(g) | (h | ) | (h | ) | 754.41% | |||||||||||||||||
Year Ended December 31, 2003 | $ | 7.56 | (0.02 | ) | 0.01 | 3.95 | 3.94 | (0.76 | ) | (0.76 | ) | $ | 10.74 | 52.14% | $ | 6,199 | 1.19% | (0.50% | ) | (h | ) | (h | ) | 580.71% | |||||||||||||||||||
Year Ended December 31, 2004 | $ | 10.74 | (0.08 | ) | — | 1.36 | 1.28 | (0.46 | ) | (0.46 | ) | $ | 11.56 | 12.41% | $ | 6,369 | 1.29% | (0.77% | ) | (h | ) | (h | ) | 520.00% | |||||||||||||||||||
Six Months Ended June 30, 2005 (Unaudited) | $ | 11.56 | (0.01 | ) | — | 0.24 | 0.23 | (0.97 | ) | (0.97 | ) | $ | 10.82 | 2.05% | (f) | $ | 7,102 | 1.18% | (g) | (0.28% | )(g) | (h | ) | (h | ) | 242.14% | |||||||||||||||||
Class II Shares | |||||||||||||||||||||||||||||||||||||||||||
Period Ended December 31, 2003(d) | $ | 8.17 | (0.02 | ) | 0.01 | 3.36 | 3.35 | (0.76 | ) | (0.76 | ) | $ | 10.76 | 41.02% | (f) | $ | 4,101 | 1.43% | (g) | (0.66% | )(g) | (h | ) | (h | ) | 580.71% | |||||||||||||||||
Year Ended December 31, 2004 | $ | 10.76 | (0.08 | ) | — | 1.33 | 1.25 | (0.46 | ) | (0.46 | ) | $ | 11.55 | 12.10% | $ | 10,593 | 1.53% | (1.03% | ) | (h | ) | (h | ) | 520.00% | |||||||||||||||||||
Six Months Ended June 30, 2005 (Unaudited) | $ | 11.55 | (0.02 | ) | — | 0.23 | 0.21 | (0.97 | ) | (0.97 | ) | $ | 10.79 | 1.87% | (f) | $ | 13,531 | 1.43% | (g) | (0.51% | )(g) | (h | ) | (h | ) | 242.14% | |||||||||||||||||
Class III Shares | |||||||||||||||||||||||||||||||||||||||||||
Period Ended December 31, 2001(e) | $ | 10.00 | — | — | (0.08 | ) | (0.08 | ) | — | — | $ | 9.92 | (0.80% | )(f) | $ | 2,976 | 1.25% | (g) | (0.40% | )(g) | 7.56% | (g) | (6.71% | )(g) | 9.71% | ||||||||||||||||||
Year Ended December 31, 2002 | $ | 9.92 | (0.05 | ) | 0.01 | (2.30 | ) | (2.34 | ) | — | — | $ | 7.58 | (23.59% | ) | $ | 6,501 | 1.10% | (0.64% | ) | (h | ) | (h | ) | 754.41% | ||||||||||||||||||
Year Ended December 31, 2003 | $ | 7.58 | (0.03 | ) | 0.01 | 3.99 | 3.97 | (0.76 | ) | (0.76 | ) | $ | 10.79 | 52.39% | $ | 54,959 | 1.19% | (0.50% | ) | (h | ) | (h | ) | 580.71% | |||||||||||||||||||
Year Ended December 31, 2004 | $ | 10.79 | (0.11 | ) | — | 1.40 | 1.29 | (0.46 | ) | (0.46 | ) | $ | 11.62 | 12.45% | $ | 33,158 | 1.29% | (0.77% | ) | (h | ) | (h | ) | 520.00% | |||||||||||||||||||
Six Months Ended June 30, 2005 (Unaudited) | $ | 11.62 | (0.01 | ) | — | 0.23 | 0.22 | (0.97 | ) | (0.97 | ) | $ | 10.87 | 1.95% | (f) | $ | 31,310 | 1.18% | (g) | (0.27% | )(g) | (h | ) | (h | ) | 242.14% | |||||||||||||||||
| (a) | During the period certain fees were waived and/or reimbursed. If such waivers/reimbursements had not occurred, the ratios would have been as indicated. |
| (b) | Portfolio turnover is calculated on the basis of the Fund as a whole without distinguishing among the classes of shares. |
| (c) | For the period from June 3, 2002 (commencement of operations) through December 31, 2002. |
| (d) | For the period from March 21, 2003 (commencement of operations) through December 31, 2003. |
| (e) | For the period from December 18, 2001 (commencement of operations) through December 31, 2001. Registration of shares effective with the Securities and Exchange Commission on December 28, 2001. On the effective date, the net asset value was $9.92 per share. |
| (f) | Not annualized. |
| (g) | Annualized. |
| (h) | There were no fee reductions during the period. |
See notes to financial statements.
10
Table of Contents
GARTMORE VARIABLE INSURANCE TRUST
June 30, 2005 (Unaudited)
1. Organization
Gartmore Variable Insurance Trust (“GVIT” or the “Trust”) is an open-end management investment company, organized under the laws of Delaware by an amended and restated Agreement and Declaration of Trust, dated October 28, 2004, as amended to date. The Trust, originally created under the laws of Massachusetts as a Massachusetts business trust pursuant to a Declaration of Trust dated, as of June 30, 1981, was subsequently amended, redomesticated as a Delaware Statutory Trust after the close of trading on April 29, 2005, and is registered under the Investment Company Act of 1940, as amended (the “1940 Act”). The redomestication is a change in statutory status and does not affect the operations of the Trust. As of June 30, 2005, the Trust had authorized an unlimited number of shares of beneficial interest (“shares”) without par value. The Trust currently offers shares to life insurance company separate accounts to fund the benefits under variable life insurance or annuity policies. To date, only the separate accounts of Nationwide Life Insurance Company and Nationwide Life and Annuity Insurance Company (collectively, “Nationwide”) have purchased shares of the Trust’s series. The Trust operates thirty-one (31) separate series, or mutual funds, each with its own investment objectives and strategies. This report contains the financial statements and financial highlights of the Gartmore GVIT U.S. Growth Leaders Fund (the “Fund”).
Under the Trust’s organizational documents, the Trust’s officers and trustees are indemnified against certain liabilities arising out of the performance of their duties to the Trust. In addition, the Trust has entered into Indemnification Agreements with the Trust’s trustees and certain officers covering similar liabilities. In addition, in the normal course of business, the Trust enters into contracts with its vendors and others that provide for general indemnifications. The Trust’s maximum exposure under these arrangements is unknown, as this would involve future claims that may be made against the Trust. Based on experience, however, the Trust expects that risk of loss to be remote.
2. Summary of Significant Accounting Policies
The following is a summary of significant accounting policies followed by the Fund in the preparation of its financial statements. The policies are in conformity with accounting principles generally accepted in the United States of America (“GAAP”). The preparation of financial statements requires management to make estimates and assumptions that affect the reported amounts of assets and liabilities, the disclosure of contingent assets and liabilities at the date of the financial statements and the reported amounts of income and expenses for the period. Actual results could differ from those estimates.
| (a) | Security Valuation |
Securities for which market quotations are readily available are valued at current market value as of “Valuation Time.” Valuation Time is as of the close of regular trading on the New York Stock Exchange (usually 4 p.m. Eastern time). Equity securities are valued at the last quoted sale price or, if there is no sale price, the last quoted bid price provided by an independent pricing service approved by the Trust’s Board of Trustees. Securities traded on NASDAQ are valued at the NASDAQ official closing price. Prices are taken from the primary market or exchange in which each security trades. Most securities listed on a foreign exchange are valued either at fair value (see description below) or at the last sale price at the close of the exchange on which the security is principally traded. Foreign securities, currencies, and other assets and liabilities denominated in foreign currencies are translated into U.S. dollars at the exchange rate of such currencies against the U.S. Dollar, as of Valuation Time, as provided by an independent pricing service approved by the Board of Trustees.
Securities for which market quotations are not readily available, or for which an independent pricing service does not provide a value or provides a value that does not represent fair value in the judgment of the Fund’s investment adviser or designee, are valued at fair value under procedures approved by the Trust’s Board of Trustees. The “Fair Value” of these securities is determined in good faith by taking into account relevant factors and surrounding circumstances. Methods utilized to obtain a “Fair Value” may include the following non-exclusive list of SEC acceptable methods: (i) a multiple of earnings; (ii) the discount from market value of a similar, freely traded security; (iii) the yield-to-maturity for debt issues; or (iv) a consolidation of the methods. The Gartmore Fair Value Committee considers a non-exclusive list of factors to arrive at the appropriate method upon determining “Fair Value.” For example, fair value determinations are required for securities whose value is affected by a “significant” event that materially affects the value of a domestic or foreign security which occurs
11
Table of Contents
GARTMORE VARIABLE INSURANCE TRUST
NOTES TO FINANCIAL STATEMENTS (Continued)
June 30, 2005 (Unaudited)
subsequent to the time of the close of the principal market on which such domestic or foreign security trades and before the Valuation Time (i.e., a “subsequent event”). Typically, this will involve events occurring after the close of a foreign market on which a security trades and before the next Valuation Time.
| (b) | Repurchase Agreements |
The Fund may enter into repurchase agreements with an entity which is a member of the Federal Reserve System or which is a “primary dealer” (as designated by the Federal Reserve Bank of New York) in U.S. Government obligations. The repurchase price generally equals the price paid by the Fund plus interest negotiated on the basis of current short-term rates, which may be more or less than the rate on the underlying portfolio securities. The seller under a repurchase agreement is required to maintain the value of the collateral held pursuant to the agreement at a market value equal to or greater than the repurchase price (including accrued interest). Collateral subject to repurchase agreements is held by the Fund’s custodian or another qualified sub-custodian or in the Federal Reserve/Treasury book-entry system. If the counterparty defaults and the fair value of the collateral declines, realization of the collateral by the Fund may be delayed or limited. The Fund may transfer uninvested cash balances into a pooled cash account. These balances are invested in one or more repurchase agreements, which are fully collateralized by AA-rated Corporate Bonds with the counterparties of CS First Boston and Nomura Securities.
| (c) | Foreign Currency Transactions |
The accounting records of the Fund are maintained in U.S. dollars. Foreign currency amounts are translated into U.S. dollars at the current rate of exchange to determine the value of investments, assets and liabilities. The Fund may enter into foreign currency contracts in connection with purchases or sales of securities denominated in a foreign currency. Purchases and sales of securities, and income and expenses, are translated at the prevailing rate of exchange on the respective date of these transactions. The Fund does not isolate that portion of the results of operations resulting from changes in foreign exchange rates on investments from fluctuations arising from changes in market prices of securities held. These fluctuations are included with the net realized and unrealized gain or loss from investments and foreign currencies.
| (d) | Risks Associated with Foreign Securities and Currencies |
Investments in securities of foreign issuers carry certain risks not ordinarily associated with investments in securities of U.S. issuers. These risks include future political and economic developments, and the possible imposition of exchange controls or other foreign governmental laws and restrictions. In addition, with respect to certain countries, there is the possibility of expropriation of assets, confiscatory taxation, political or social instability, or diplomatic developments, which could adversely affect investments in those countries.
Certain countries also may impose substantial restrictions on investments in their capital markets by foreign entities, including restrictions on investments in issuers of industries deemed sensitive to relevant national interests. These factors may limit the investment opportunities available and result in a lack of liquidity and high price volatility with respect to securities of issuers from developing countries.
| (e) | Forward Foreign Currency Contracts |
The Fund may enter into forward foreign currency contracts in connection with planned purchases or sales of securities or to hedge the U.S. dollar value of portfolio securities denominated in a particular currency. The Fund could be exposed to risks if the counterparties to the contracts are unable to meet the terms of their contracts and from unanticipated movements in the value of a foreign currency relative to the U.S. dollar. Forward foreign currency contracts are valued at the current cost of covering these contracts, as provided by an independent pricing service approved by the Board of Trustees. The forward foreign currency contracts are adjusted by the daily exchange rate of the underlying currency and any gains or losses are recorded for financial statement purposes as unrealized gains or losses until the contract settlement date.
12
Table of Contents
GARTMORE VARIABLE INSURANCE TRUST
NOTES TO FINANCIAL STATEMENTS (Continued)
June 30, 2005 (Unaudited)
| (f) | Futures Contracts |
The Fund may invest in financial futures contracts (“futures contracts”) for the purpose of hedging its existing portfolio securities or securities that the Fund intends to purchase against fluctuations in value caused by changes in prevailing market interest rates or prices. Futures contracts may also be entered into for non-hedging purposes.
Upon entering into a futures contract, the Fund is required to pledge to the broker an amount of cash and/or other assets equal to a certain percentage of the contract amount (initial margin deposit). Subsequent payments, known as “variation margin,” are made each day, depending on the daily fluctuations in the fair value/market value of the underlying assets. A gain or loss equal to the daily variation margin is recognized on a daily basis. Futures contracts are valued daily at their last quoted sale price.
A “sale” of a futures contract means a contractual obligation to deliver the securities or foreign currency called for by the contract at a fixed price at a specified time in the future. A “purchase” of a futures contract means a contractual obligation to acquire the securities or foreign currency at a fixed price at a specified time in the future.
Should market conditions change unexpectedly, the Fund may not achieve the anticipated benefits of the futures contracts and may realize a loss. The use of futures transactions for hedging purposes involves the risk of imperfect correlation in movements in the price of futures contracts, interest rates, and the value of the underlying hedged assets.
| (g) | Written Options Contracts |
The Fund may write options contracts. A written option obligates the Fund to deliver (written call) or to receive (written put) a specified quantity of an underlying asset at the contract amount upon exercise by the holder of the option. The value of the option contract is recorded as a liability and unrealized gain or loss is measured by the difference between the current value and the premium received. Options traded on an exchange are valued at the last quoted sale price, or in the absence of a sale, the bid price provided by an independent pricing service approved by the Board of Trustees. Non-exchange traded options are valued using dealer supplied quotes.
| (h) | Short Sales |
The Fund is authorized to engage in short-selling of portfolio securities which obligates the Fund to replace any security that the Fund has borrowed by purchasing the security at current market value sometime in the future. The Fund will incur a loss if the price of the security increases between the date of the short sale and the date on which the Fund replaces the borrowed security. The Fund generally will realize a gain if the price of the security declines between these dates. Until the Fund replaces the borrowed security, the Fund will maintain a segregated account with cash, U.S. Government securities and/or securities held long to sufficiently cover the Fund’s short position on a daily basis. Dividends declared on securities sold short are recorded as an expense on the ex-dividend date and paid to the counterparty on the dividend pay date. The collateral for securities sold short are recorded as an expense on the ex-dividend date and paid to the counterparty on the dividend pay date. The collateral for securities sold short includes the deposits with brokers and securities held long as shown in the Statement of Investments for the Fund.
| (i) | Security Transactions and Investment Income |
Security transactions are accounted for on the date the security is purchased or sold (“trade date”). Securities gains and losses are calculated on the identified cost basis. Interest income is recognized on the accrual basis and includes, where applicable, the amortization or accretion of premium or discount. Dividend income is recorded on the ex-dividend date.
| (j) | Securities Lending |
To generate additional income, the Fund may lend up to 33 1/3% of the Fund’s total assets pursuant to agreements, requiring that the borrower deliver cash or securities as collateral with respect to each new loan of U.S. securities, equal to at least 102% of the value of the portfolio securities loaned, and with respect to each new loan of non-U.S. securities, collateral of at
13
Table of Contents
GARTMORE VARIABLE INSURANCE TRUST
NOTES TO FINANCIAL STATEMENTS (Continued)
June 30, 2005 (Unaudited)
least 105% of the value of the portfolio securities loaned, and thereafter requiring the borrower to mark to market the collateral on a daily basis and requiring the borrower to make up any shortfall of collateral. The Fund receives payments from borrowers equivalent to the dividends and interest that would have been earned on securities lent while simultaneously seeking to earn income on the investment of cash collateral. Collateral is marked to market daily to provide a level of collateral at least equal to the market value of securities loaned. There may be risks of delay in recovery of the securities should the borrower of the securities fail financially. Loans will be made, however, only to borrowers deemed by the Fund’s investment adviser to be of good standing and creditworthy under guidelines established by the Board of Trustees and when, in the judgment of the adviser, the consideration which can be earned currently from these securities loans justifies the attendant risks. Loans are subject to termination by the Fund or the borrower at any time, and, therefore, are not considered to be illiquid investments. JPMorgan Chase Bank serves as custodian for the securities lending program of the Fund. JPMorgan Chase Bank receives a custody fee based on the value of collateral received from borrowers.
The cash collateral received by the Fund was pooled and, at June 30, 2005, was invested in the following:
Security Type | Security Name | Market Value | Maturity Rate | Maturity Date | |||||
| Commercial Paper | MacQuarie Bank Ltd. | $ | 499,368 | 3.25% | 07/01/05 | ||||
| Repurchase Agreements | Nomura Securities | 1,295,832 | 3.48% | 07/01/05 | |||||
As of June 30, 2005, the Fund had securities with the following market values on loan:
Market Value of Loaned | Market Value of Collateral | |||
| $ | 1,759,085 | $ | 1,795,200 | |
| (k) | Distributions to Shareholders |
The Fund’s dividends from net investment income, if any, are declared and paid quarterly. The Fund’s distributable net realized capital gains, if any, are declared and distributed at least annually.
Dividends and distributions to shareholders are determined in accordance with federal income tax regulations, which may differ from GAAP. These “book/tax” differences are considered either permanent or temporary in nature. In accordance with the American Institute of Certified Public Accountants (“AICPA”) Statement of Position 93-2, permanent differences (i.e., reclassification of market discounts, gain/loss, paydowns, and distributions) are reclassified within the capital accounts based on their nature for federal income tax purposes; temporary differences do not require reclassification. These reclassifications have no effect upon the net asset value of the Fund. To the extent distributions exceed current and accumulated earnings and profits for federal income tax purposes, these distributions are reported as distributions of paid-in-capital.
| (l) | Federal Income Taxes |
It is the policy of the Fund to qualify or continue to qualify as a “regulated investment company” by complying with the provisions available to certain investment companies, as defined in applicable sections of the U.S. Internal Revenue Code, and to make distributions of net investment income and net realized capital gains sufficient to relieve the Fund from all, or substantially all, federal income taxes.
As of June 30, 2005, the tax cost of securities and the breakdown of unrealized appreciation (depreciation) for the Fund is as follows:
| Tax Cost of Securities | Unrealized Appreciation | Unrealized Depreciation | Net Unrealized Appreciation (Depreciation) | |||||||
| $274,938 | $ | 2,357,938 | $ | (245,777 | ) | $ | 2,112,162 | |||
14
Table of Contents
GARTMORE VARIABLE INSURANCE TRUST
NOTES TO FINANCIAL STATEMENTS (Continued)
June 30, 2005 (Unaudited)
| (m) | Allocation of Expenses, Income, and Gains and Losses |
Expenses directly attributable to the Fund are charged to the Fund. Expenses not directly attributable to the Fund are allocated proportionately among various or all funds within the Trust. The method used by the Fund for allocating income, fund level expenses, and realized and unrealized gains or losses is based on the fair value of shares outstanding relative to net assets. Under this method, each class of shares participates based on the total net asset value of that class’s shares in proportion to the total net assets of the Fund. Expenses specific to a class (such as rule 12b-1 and administrative services fees) are charged to that class.
3. Transactions with Affiliates
Under the terms of the Trust’s Investment Advisory Agreement, Gartmore Mutual Fund Capital Trust (“GMF”) manages the investment of the assets and supervises the daily business affairs of the Fund. GMF is a wholly-owned subsidiary of Gartmore Global Investments, Inc. (“GGI”), a holding company. GGI is a majority-owned subsidiary of Gartmore Global Asset Management Trust (“GGAMT”). GGAMT is a wholly-owned subsidiary of Nationwide Corporation. All of the common stock of Nationwide Corporation is held by Nationwide Mutual Insurance Company (95.2%) and Nationwide Mutual Fire Insurance Company (4.8%), each of which is a mutual company owned by its policyholders.
Under the terms of the Investment Advisory Agreement, the Fund pays GMF a base investment advisory fee that can vary depending on the Fund’s performance relative to its benchmark, the S&P 500 Index, as follows:
Fee Schedule* | Fees | |
Up to $500 million | 0.90% | |
$500 million up to $2 billion | 0.80% | |
$2 billion or more | 0.75% |
| * | The US Growth Leaders Fund pays GMF a base management fee (as shown above) which may be adjusted upward or downward depending on the Fund’s performance relative to its benchmark, the S&P 500 Index for the US Growth Leaders Fund. Thus, if the Fund outperforms its benchmark by 12% or more over a 36 month period, the Fund will pay higher management fees. Conversely, if the Fund underperforms its benchmark by 12% or more over a 36 month period, the Fund will pay lower management fees. No adjustment will take place if the under or overperformance is less than 12% and GMF will receive the applicable base fee. The base rate and the performance rate are applied separately. The base rate (as may be reduced by any applicable base advisory fee breakpoints) is applied to the Fund’s average net assets over the current quarter, while the performance adjustment percentage is applied to the Fund’s average net assets over the rolling 36-month performance period. The corresponding dollar values are then added to arrive at the overall GMF advisory fee for the current period. The base fee is either increased or decreased by the following amounts at each breakpoint: |
Fee Schedule | Fee Adjustment | |
Up to $500 million | +/- 0.22% | |
$500 million up to $2 billion | +/- 0.18% | |
$2 billion or more | +/- 0.16% |
On September 21, 2004, the Enforcement Staff of the Commission’s Fort Worth District Office (the “Staff”) contacted Gartmore Mutual Fund Capital Trust (the “Adviser”), the investment adviser to the U.S. Growth Leaders Fund (the “Fund”), a series of Gartmore Variable Insurance Trust (“GVIT”). The Staff asserted that the methodology used to calculate the performance fee for the Fund did not comply with the requirements of Rule 205-2 under the Investment Advisers Act of 1940 (the “Advisers Act”). The Adviser agreed temporarily to forego the collection of any performance fees pending an evaluation of the Staff’s assertion. Discussions with the Staff are ongoing, and the outcome of those discussions will determine the remedial steps, if any, to be taken.
GMF and the Fund have entered into a written contract (“Expense Limitation Agreement”) limiting operating expenses (excluding any taxes, interest, brokerage fees, extraordinary expenses, short sale dividend expenses, Rule 12b-1 fees, and administrative service fees) from exceeding 1.15% for all classes until at least May 1, 2006.
15
Table of Contents
GARTMORE VARIABLE INSURANCE TRUST
NOTES TO FINANCIAL STATEMENTS (Continued)
June 30, 2005 (Unaudited)
GMF may request and receive reimbursement from the Fund of the advisory fees waived and other expenses reimbursed by GMF, respectively, pursuant to the Expense Limitation Agreement at a later date not to exceed three years from the fiscal year in which the corresponding reimbursement to the Fund was made, depending on the Fund (as described below), if the Fund has reached a sufficient asset size to permit reimbursement to be made without causing the total annual operating expense ratio of the Fund to exceed the limits set forth above. No reimbursement will be made unless: (i) the Fund’s assets exceed $100 million; (ii) the total annual expense ratio of the Class making such reimbursement is less than the limit set forth above; and (iii) the payment of such reimbursement is approved by the Board of Trustees on a quarterly basis. Except as provided for in the Expense Limitation Agreements, reimbursement of amounts previously waived or assumed by GMF is not permitted.
As of the six months ended June 30, 2005, there were no cumulative potential reimbursements for all classes of shares of the Fund, based on reimbursements which expires within three years from the fiscal year in which the corresponding reimbursement to the Fund was made for expenses reimbursed by GMF.
Under the terms of a Fund Administration and Transfer Agency Agreement, Gartmore SA Capital Trust (“GSA”) provides the Fund with various administrative and accounting services, and Gartmore Investors Services, Inc. (“GISI”), an indirect subsidiary of GSA, serves as Transfer and Dividend Disbursing Agent for the Fund. The fees for the services provided under this Agreement are calculated based on the Trust’s average daily net assets according to the fee schedule below. The fees are then allocated proportionately among all funds within the Trust in relation to the average daily net assets of each fund and are paid to GSA. GSA pays GISI from these fees for its services.
| Combined Fee Schedule* | ||
Up to $1 billion | 0.13% | |
$1 billion and more up to $3 billion | 0.08% | |
$3 billion and more up to $8 billion | 0.05% | |
$8 billion and more up to $10 billion | 0.04% | |
$10 billion and more up to $12 billion | 0.02% | |
$12 billion or more | 0.01% | |
| * | The assets of the Gartmore GVIT Investor Destinations Aggressive Fund, the Gartmore GVIT Investor Destinations Moderately Aggressive Fund, the Gartmore GVIT Investor Destinations Moderate Fund, the Gartmore GVIT Investor Destinations Moderately Conservative Fund, and the Gartmore GVIT Investor Destinations Conservative Fund (collectively, the “Investor Destinations Funds”) are excluded from the Trust asset level amount in order to calculate this asset-based fee. The Investor Destinations Funds do not pay any part of this fee. |
Effective January 1, 2005, the fee for the fund administration and transfer agency services increased as set forth below. The fees are calculated based on the Trust’s average daily net assets according to the fee schedule below. The fees are then allocated proportionately among all funds within the Trust in relation to the average daily net assets of each fund and are paid to GSA.
| Combined Fee Schedule* | ||
Up to $1 billion | 0.15% | |
$1 billion and more up to $3 billion | 0.10% | |
$3 billion and more up to $8 billion | 0.05% | |
$8 billion and more up to $10 billion | 0.04% | |
$10 billion and more up to $12 billion | 0.02% | |
$12 billion or more | 0.01% | |
| * | The assets of each of the Investor Destinations Funds are excluded from the Trust asset level amount in order to calculate this asset-based fee. The Investor Destinations Funds do not pay any part of this fee. |
GSA and GISI have entered into agreements with BISYS Fund Services Ohio, Inc. (”BISYS”), pursuant to which BISYS provides sub-administration and sub-transfer agency services, respectively, to the Fund.
Under the terms of a Distribution Plan under Rule 12b-1 of the 1940 Act, Gartmore Distribution Services, Inc. (“GDSI”), the Fund’s Distributor, is compensated by the Fund for expenses associated with the distribution of the Class II of the Fund. These fees are based on average daily net assets of Class II shares of the Fund at an annual rate not to exceed 0.25%.
16
Table of Contents
GARTMORE VARIABLE INSURANCE TRUST
NOTES TO FINANCIAL STATEMENTS (Continued)
June 30, 2005 (Unaudited)
Under the terms of an Administrative Services Plan, the Fund may pay fees to servicing organizations, such as broker-dealers, including Nationwide Financial Services, and financial institutions, which agree to provide administrative support services to the shareholders of certain classes. These services include, but are not limited, to the following: establishing and maintaining shareholder accounts; processing purchase and redemption transactions; arranging bank wires; performing shareholder sub-accounting; answering inquires regarding the Fund; and other such services. These fees are based on an annual rate of up to 0.25% of the average daily net assets of each class of shares of the Fund.
4. Short-Term Trading Fees
The Fund reserves the right to assess a short-term trading fee on certain transactions out of Class III shares that a separate account makes on behalf of a variable insurance contract owner (the “contract owner”). A separate account that redeems Class III shares on behalf of a contract owner may be subject to a 1.00% short-term trading fee if the separate account held the Class III shares on behalf of the contract owner for 60 days or less, unless an exception applies as disclosed in the prospectus. The short-term trading fee is paid directly to the Fund and is intended to offset the cost to the Fund of excess brokerage commissions and other costs associated with fluctuations in fund asset levels and cash flow caused by short-term trading. For purposes of determining whether the short-term trading fee applies, the Class III shares that were held on behalf of the contract owner the longest will be treated as being redeemed first.
For the six months ended June 30, 2005, the Fund had no contributions to capital due to collection of redemption fees.
5. Investment Transactions
For the six months ended June 30, 2005, (excluding short-term securities) the Fund had purchases of $116,188,397 and sales of $115,475,823.
6. Bank Loans
The Trust has a credit agreement of $100,000,000. Borrowings under this arrangement bear interest at the Federal Funds rate plus 0.50%. The interest costs are included in custodian fees in the Statement of Operations. No compensation balances were required under the terms of the line of credit. There were no borrowings outstanding as of June 30, 2005.
7. Shareholder Meeting
A separate shareholders meeting was held on Tuesday, December 23, 2004, for the shareholders of the Trust’s predecessor pursuant to a Proxy Statement On Schedule 14A, dated October 29, 2004, and mailed to the shareholders of the Trust’s predecessor on or around November 5, 2004.
Two Proposals: The purpose of the December 23, 2004 meeting was to allow the shareholders of the Trust’s predecessor to vote on:
| i. | Proposal One: The election of the Trust’s Board of Trustees; and |
| ii. | Proposal Two: The approval of an “Agreement and Plan of Reorganization” that provided for the reorganization of the Trust from a Massachusetts business trust into a Delaware statutory trust. |
Proposal One: As set forth in the October 29, 2004 Proxy Statement, the nominees for election as Trustees of the Trust’s predecessor were: Charles E. Allen, Michael J. Baresich, Paula H.J. Cholmondeley, C. Brent DeVore, Phyllis Kay Dryden, Robert M. Duncan, Barbara L. Hennigar, Paul J. Hondros, Barbara I Jacobs, Thomas J. Kerr IV, Douglas F. Kridler, Michael D. McCarthy, Arden L. Shisler, and David C. Wetmore.
Proposal Two: As specifically set forth in the October 29, 2004 Proxy Statement, the Reorganization proposal requested the shareholders of the Trust’s predecessor to approve the proposed “Agreement and Plan of Reorganization” of the Trust’s predecessor (on behalf of each of the its funds) into a new Delaware-domiciled Trust, whereby the Funds of the new Delaware Trust would acquire all of the assets of the corresponding funds of the Trust’s predecessor subject to the liabilities,
17
Table of Contents
GARTMORE VARIABLE INSURANCE TRUST
NOTES TO FINANCIAL STATEMENTS (Continued)
June 30, 2005 (Unaudited)
expenses, costs, charges, and reserves of the corresponding funds of the Trust’s predecessor (contingent or otherwise), in exchange for shares of the acquiring Funds to be distributed pro rata by the Trust to the holders of the shares of the funds of the Trust’s predecessor, in a complete liquidation of the Trust’s predecessor.
Voting Results:
The shareholders of the Trust’s predecessor voted to approve both Proposal One and Proposal Two, as follows:
Proposal 1: Election of a Board of Trustees of Gartmore Variable Insurance Trust | ||||||||||
Charles E. Allen: | ||||||||||
FOR | 2,797,230,318.955 shares | (96.078%) | ||||||||
WITHHOLD | 114,195,693.660 shares | (3.922%) | ||||||||
TOTAL | 2,912,726,012.615 shares | (100.000%) | ||||||||
Michael J. Baresich: | ||||||||||
FOR | 2,796,135,979.559 shares | (96.040%) | ||||||||
WITHHOLD | 115,290,033.056 shares | (3.960%) | ||||||||
TOTAL | 2,912,726,012.615 shares | (100.000%) | ||||||||
Paula H.J. Cholmondeley: | ||||||||||
FOR | 2,795,095,945.396 shares | (96.004%) | ||||||||
WITHHOLD | 116,330,067.219 shares | (3.996%) | ||||||||
TOTAL | 2,912,726,012.615 shares | (100.000%) | ||||||||
C. Brent DeVore: | ||||||||||
FOR | 2,797,207,046.916 shares | (96.077%) | ||||||||
WITHHOLD | 114,218,965.699 shares | (3.923%) | ||||||||
TOTAL | 2,912,726,012.615 shares | (100.000%) | ||||||||
Phyllis Kay Dryden: | ||||||||||
FOR | 2,795,587,023.994 shares | (96.021%) | ||||||||
WITHHOLD | 115,838,988.621 shares | (3.979%) | ||||||||
TOTAL | 2,912,726,012.615 shares | (100.000%) | ||||||||
Robert M. Duncan: | ||||||||||
FOR | 2,790,191,720.503 shares | (95.836%) | ||||||||
WITHHOLD | 121,234,292.112 shares | (4.164%) | ||||||||
TOTAL | 2,912,726,012.615 shares | (100.000%) | ||||||||
Barbara L. Hennigar: | ||||||||||
FOR | 2,792,939,848.858 shares | (95.937%) | ||||||||
WITHHOLD | 118,486,163.757 shares | (4.070%) | ||||||||
TOTAL | 2,912,726,012.615 shares | (100.000%) | ||||||||
Paul J. Hondros: | ||||||||||
FOR | 2,797,557,404.448 shares | (96.089%) | ||||||||
WITHHOLD | 113,868,608.167 shares | (3.911%) | ||||||||
TOTAL | 2,912,726,012.615 shares | (100.000%) | ||||||||
18
Table of Contents
GARTMORE VARIABLE INSURANCE TRUST
NOTES TO FINANCIAL STATEMENTS (Continued)
June 30, 2005 (Unaudited)
Barbara I. Jacobs: | ||||||||||
FOR | 2,796,306,126.654 shares | (96.046%) | ||||||||
WITHHOLD | 115,119,885.961 shares | (3.954%) | ||||||||
TOTAL | 2,912,726,012.615 shares | (100.000%) | ||||||||
Thomas J. Kerr IV: | ||||||||||
FOR | 2,789,755,720.087 shares | (95.821%) | ||||||||
WITHHOLD | 121,670,292.528 shares | (4.179%) | ||||||||
TOTAL | 2,912,726,012.615 shares | (100.000%) | ||||||||
Douglas F. Kridler: | ||||||||||
FOR | 2,798,065,774.375 shares | (96.106%) | ||||||||
WITHHOLD | 113,360,238.240 shares | (3.894%) | ||||||||
TOTAL | 2,912,726,012.615 shares | (100.000%) | ||||||||
Michael D. McCarthy: | ||||||||||
FOR | 2,797,452,613.694 shares | (96.085%) | ||||||||
WITHHOLD | 113,973,395.921 shares | (3.915%) | ||||||||
TOTAL | 2,912,726,012.615 shares | (100.000%) | ||||||||
Arden L. Shisler: | ||||||||||
FOR | 2,796,738,454.730 shares | (96.061%) | ||||||||
WITHHOLD | 114,687,557.885 shares | (3.939%) | ||||||||
TOTAL | 2,912,726,012.615 shares | (100.000%) | ||||||||
David C. Wetmore: | ||||||||||
FOR | 2,794,784,752.247 shares | (95.994%) | ||||||||
WITHHOLD | 116,641,260.368 shares | (4.006%) | ||||||||
TOTAL | 2,912,726,012.615 shares | (100.000%) | ||||||||
Proposal 2: Approval of the Agreement and Plan of Reorganization of Gartmore Variable Insurance Trust | ||||||||||
FOR | 2,561,003,822.546 shares | (87.964%) | ||||||||
AGAINST | 103,593,261.010 shares | (3.558%) | ||||||||
ABSTAIN | 246,828,929.059 shares | (8.478%) | ||||||||
TOTAL | 2,912,726,012.615 shares | (100.000%) | ||||||||
19
Table of Contents
GARTMORE VARIABLE INSURANCE TRUST
Management Information (Unaudited)
June 30, 2005
Trustees who are not Interested Persons (as defined in the 1940 Act) and Officers of the Funds June 30, 2005
Name, Address and Date of Birth | Position(s) Held with the Trust and Length of Time Served1 | Principal Occupation(s) During Past Five Years | Number of Portfolios in the Gartmore Fund Complex Overseen by Trustee | Other Directorships Held by Trustee or Nominee2 | ||||
Charles E. Allen
c/o Gartmore Global Investments, Inc. 1200 River Road, Suite 1000 Conshohocken, PA 19428
1948 | Trustee since July 2000 | Mr. Allen is Chairman, Chief Executive Officer and President of the Graimark Realty Advisors, Inc. (real estate development, investment and asset management). | 84 | None | ||||
Paula H.J. Cholmondeley
c/o Gartmore Global Investments, Inc. 1200 River Road, Suite 1000 Conshohocken, PA 19428
1940 | Trustee since July 2000 | Ms. Cholmondeley has been the Chairman and Chief Executive Officer of the Sorrel Group, a management consulting company, since January 2004. From March 2000 through December 2003, Ms. Cholmondeley was Vice President and General Manager of Sappi Fine Paper North America. Prior thereto, Ms. Cholmondeley was Vice President and General Manager of Residential Insulation of Owens Corning. | 84 | Director of Dentsply International, Inc., Ultralife Batteries, Inc., Terex Corporation, Minerals Technology, Inc. and Albany International Corp. | ||||
C. Brent DeVore
c/o Gartmore Global Investments, Inc. 1200 River Road, Suite 1000 Conshohocken, PA 19428
1940 | Trustee since 1990 | Dr. DeVore is President of Otterbein College. | 84 | None | ||||
Phyllis K. Dryden
c/o Gartmore Global Investments, Inc. 1200 River Road, Suite 1000 Conshohocken, PA 19428
1947 | Trustee since December 2004 | Ms. Dryden was a former Managing Partner of marchFIRST, a global management consulting firm prior to 2002. | 84 | None |
20
Table of Contents
GARTMORE VARIABLE INSURANCE TRUST
Management Information (Unaudited)
June 30, 2005
| Name, Address and Date of Birth | Position(s) Held with the Trust and Length of Time Served1 | Principal Occupation(s) During Past 5 Years | Number of Portfolios in the Gartmore Fund Complex Overseen by Trustee | Other Directorships Held by Trustee or Nominee2 | ||||
Barbara L. Hennigar*
c/o Gartmore Global Investments, Inc. 1200 River Road, Suite 1000 Conshohocken, PA 19428
1935 | Trustee since July 2000 | Retired since June 2000. Prior thereto, Ms. Hennigar was the Chairman or President and Chief Executive Officer of OppenheimerFunds Services and a member of the Executive Committee of OppenheimerFunds. | 84 | None | ||||
Barbara I. Jacobs
c/o Gartmore Global Investments, Inc. 1200 River Road, Suite 1000 Conshohocken, PA 19428
1950 | Trustee since December 2004 | Ms. Jacobs has served as Chairman of the Board of Directors of KICAP Network Fund, a European (United Kingdom) hedge fund, since December 2000. Prior to 2004, Ms. Jacobs was also a Managing Director and European Portfolio Manager with CREF Investments (Teachers Insurance Annuity Association — College Retirement Equity Fund). | 84 | None | ||||
Douglas F. Kridler
c/o Gartmore Global Investments, Inc. 1200 River Road, Suite 1000 Conshohocken, PA 19428
1955 | Trustee since September 1997 | Mr. Kridler has served as the President and Chief Executive Officer of the Columbus Foundation (a Columbus, OH-based foundation which manages over 1,300 individual endowment funds) since February 2002. Mr. Kridler was the President of the Columbus Association for the Performing Arts prior thereto and Chairman of the Greater Columbus Convention and Visitors Bureau during 2000 and 2001. | 84 | None | ||||
Michael D. McCarthy
c/o Gartmore Global Investments, Inc. 1200 River Road, Suite 1000 Conshohocken, PA 19428
1947 | Trustee since December 2004 | Mr. McCarthy serves as: the Founder and Chairman of The Eureka Foundation (which sponsors and funds the “Great Museums” series on PBS); and a Partner of Pineville Properties LLC (a commercial real estate development firm). | 843 | None |
21
Table of Contents
GARTMORE VARIABLE INSURANCE TRUST
Management Information (Unaudited)
June 30, 2005
| Name, Address and Date of Birth | Position(s) Held with the Trust and Length of Time Served1 | Principal Occupation(s) During Past 5 Years | Number of Portfolios in the Gartmore Fund Complex Overseen by Trustee | Other Directorships Held by Trustee or Nominee2 | ||||
David C. Wetmore
c/o Gartmore Global Investments, Inc. 1200 River Road, Suite 1000 Conshohocken, PA 19428
1948 | Trustee since 1995 and Chairman since February 2005 | Retired. Mr. Wetmore was formerly a Managing Director of Updata Capital, an investment banking and venture capital firm. | 84 | None |
| * | Pursuant to the Trust’s mandatory retirement policy, Ms. Hennigar is expected to retire on or about January 12, 2006. |
| 1 | The term of office length is until a trustee resigns or reaches a mandatory retirement age of 70. On March 2, 2000, the Board adopted a five-year implementation period for any Trustee 65 or older as of the adoption of this policy. Pursuant to this policy, Messrs. Duncan and Kerr retired as trustees effective as of March 12, 2005. |
| 2 | Directorships held in (1) any other investment companies registered under the 1940 Act, (2) any company with a class of securities registered pursuant to Section 12 of the Securities Exchange Act of 1934, as amended (the “Exchange Act”), or (3) any company subject to the requirements of Section 15(d) of the Exchange Act. |
| 3 | Mr. McCarthy was also an Administrative Committee Member for the Alphagen Arneb Fund, LLC, The Healthcare Fund LDC, The Leaders Long-Short Fund, LLC, and The Leaders Long-Short Fund LDC, four private investment companies (hedge funds) managed by GSA. Mr. McCarthy resigned as an Administrative Committee Member effective June 30, 2005. |
Trustees and Officers who are not Interested Persons (as defined in the 1940 Act) of the Funds received aggregate compensation of $274,882 from the Trust for the Six Months Ended June 30, 2005. Additional information regarding the Trustees and Officers may be found in the Trust’s statement of additional information, which is available without charge upon request, by calling 1-800-848-0920.
22
Table of Contents
GARTMORE VARIABLE INSURANCE TRUST
Management Information (Unaudited)
June 30, 2005
Trustees who are Interested Persons (as defined in the 1940 Act) and/or Officers of the Funds June 30, 2005
Name, Address and Age | Position(s) Held with the Trust and Length of Time Served1 | Principal Occupation(s) During Past Five Years | Number of Portfolios in the Gartmore Fund Complex Overseen by Trustee | Other Directorships Held by Trustee2 | ||||
Paul J. Hondros
Gartmore Global Investments, Inc. 1200 River Road, Suite 1000 Conshohocken, PA 19428
1948 | Trustee since July 2000 | Mr. Hondros has been President and Chief Executive Officer of various Gartmore entities, including Gartmore Distribution Services, Inc. (“GDSI”),3 Gartmore Investor Services, Inc. (“GISI”),3 Gartmore Morley Capital Management, Inc. (“GMCM”),3 Gartmore Morley Financial Services, Inc. (“GMFS”), 3 NorthPointe Capital, LLC (“NorthPointe”),3 Gartmore Global Asset Management Trust (“GGAMT”)3,, Gartmore Global Investments, Inc. (“GGI”)3, Gartmore Mutual Fund Capital Trust (“GMFCT”)3 and Gartmore SA Capital Trust (“GSA”)3; and a Director of Nationwide Securities, Inc.3, as well as several entities within Nationwide Financial Services, Inc. | 844 | None | ||||
Arden L. Shisler
c/o Gartmore Global Investments, Inc. 1200 River Road, Suite 1000 Conshohocken, PA 19428
1941 | Trustee since February 2000 | Mr. Shisler has been a consultant since January 2003. Prior thereto, he was President and Chief Executive Officer of K&B Transport, Inc., a trucking firm. Since 1992, Mr. Shisler has also been Chairman of the Board for Nationwide Mutual Insurance Company3. | 84 | Director of Nationwide Financial Services, Inc. | ||||
Gerald J. Holland
Gartmore Global Investments, Inc. 1200 River Road, Suite 1000 Conshohocken, PA 19428
1951 | Treasurer since March 2001 | Mr. Holland is Senior Vice President—Operations for GGI3, GMFCT3 , and GSA3. Prior to July 2000, Mr, Holland was Vice President for First Data Investor Services, an investment company service provider. | 84 | None |
23
Table of Contents
GARTMORE VARIABLE INSURANCE TRUST
Management Information (Unaudited)
June 30, 2005
| Name, Address and Age | Position(s) Held with the Trust and Length of Time Served1 | Principal Occupation(s) During Past 5 Years | Number of Portfolios in the Gartmore Fund Complex Overseen by Trustee | Other Directorships Held by Trustee2 | ||||
Michael A. Krulikowski
Gartmore Global Investments, Inc. 1200 River Road, Suite 1000 Conshohocken, PA 19428
1959 | Chief Compliance Officer since June 2004 | Since November 1999, Mr. Krulikowski has served as a Vice President and Chief Compliance Officer of GGI. Prior thereto, Mr. Krulikowski served as Chief Compliance Officer of 1717 Capital Management Company/Provident Mutual Insurance Company. | 84 | None | ||||
Eric E. Miller
Gartmore Global Investments, Inc. 1200 River Road, Suite 1000 Conshohocken, PA 19428
1953 | Secretary since December 2002 | Mr. Miller is Senior Vice President, Chief Counsel for GGI3, GMFCT3 and GSA3 since August 2002. From August 2000 to August 2002, Mr. Miller was a Partner with Stradley Ronan Stevens & Young, LLP. Prior to August 2000, Mr. Miller served as Senior Vice President and Deputy General Counsel at Delaware Investments. | 84 | None |
| 1 | The term of office length is until a trustee resigns or reaches a mandatory retirement age of 70. On March 2, 2000, the Board adopted a five-year implementation period for any Trustee 65 or older as of the adoption of this policy. Pursuant to this policy, Messrs. Duncan and Kerr retired as trustees effective as of March 12, 2005. |
| 2 | Directorships held in (1) any other investment companies registered under the 1940 Act, (2) any company with a class of securities registered pursuant to Section 12 of the Securities Exchange Act of 1934, as amended (the “Exchange Act”), or (3) any company subject to the requirements of Section 15(d) of the Exchange Act. |
| 3 | This position is held with an affiliated person or principal underwriter of the Trust. |
| 4 | Mr. Hondros was also an Administrative Committee Member for the Alphagen Arneb Fund, LLC, The Healthcare Fund LDC, The Leaders Long-Short Fund, LLC, and The Leaders Long-Short Fund LDC, four private investment companies (hedge funds) managed by GSA. Mr. Hondros resigned as Administrative Committee Member effective June 30, 2005. |
Federal law requires the Trust, each of its investment advisers and sub-advisers to adopt procedures for voting proxies (“Proxy Voting Guidelines”) and to provide a summary of those Proxy Voting Guidelines used to vote the securities held by the Funds. The Funds’ proxy voting policies and procedures are available without charge (i) upon request, by calling 1-800-848-0920, (ii) on the Fund’s website at www.gartmorefunds.com, or (iii) on the Securities and Exchange Commission’s website at www.sec.gov.
24
Table of Contents
Gartmore GVIT Global Utilities Fund
SemiannualReport
| | June 30, 2005 |
| Contents | ||
| 6 | Statement of Investments | |
| 9 | Statement of Assets and Liabilities | |
| 9 | Statement of Operations | |
| 10 | Statements of Changes in New Assets | |
| 12 | Financial Highlights | |
| 13 | Notes to Financial Statements | |
Commentary provided by Gartmore Global Investments, investment adviser to Gartmore Variable Insurance Trust. All opinions and estimates included in this report constitute Gartmore Global Investments’ judgment as of the date of this report and are subject to change without notice.
Statement Regarding Availability of Quarterly Portfolio Schedule.
The Gartmore Variable Insurance Trust files complete schedules of portfolio holdings for each Fund with the Securities and Exchange Commission (the “Commission”) for the first and third quarters of each fiscal year on Form N-Q. The Funds’ Forms N-Q are available on the Commission’s website at http://www.sec.gov. The Funds’ Forms N-Q may be reviewed and copied at the Commission’s Public Reference Room in Washington, DC, and information on the operation of the Public Reference Room may be obtained by calling 800-SEC-0330; and the Funds make the information on Form N-Q available to shareholders upon request without charge.
Statement Regarding Availability of Proxy Voting Record.
Information regarding how the Fund voted proxies relating to portfolio securities held during the most recent 12-month period ended June 30, 2005 is available without charge, upon request, by calling 800-848-0920, and on the Commission’s website at http://www.sec.gov.
Table of Contents
Gartmore GVIT Global Utilities Fund
For the semiannual period ended June 30, 2005, the Gartmore GVIT Global Utilities Fund returned 3.09% (Class I at NAV) versus -1.36% for its blended benchmark, which consists of 60% Morgan Stanley Capital International (MSCI) World Telecommunication Services IndexSM and 40% MSCI World Utilities IndexSM.
Led by power utilities, global utilities performed well during the reporting period. A key factor contributing to the Fund’s outperformance versus the benchmark was a large overweighting in a number of the oil- and gas-related stocks of companies that supply the power utility industry. Also helping Fund returns from an industry standpoint were overweightings in independent power producers and water utilities, along with favorable stock selection in electric utilities. Looking at country allocations, stock selection in the United States, the United Kingdom and Italy was especially helpful, together with an overweighting in Finland. Conversely, stock selection in Belgium was the primary drawback relative to the benchmark.
Among individual Fund holdings, EOG Resources, Inc., an oil and natural gas producer based in Houston, was a top contributor. In April, the company reported stronger-than-expected profits and reaffirmed its previously stated 13.5% production growth target for 2005. Other energy holdings making meaningful contributions to Fund performance were ConocoPhillips, Canada’s Suncor Energy Inc. and Sunoco, Inc. In the utility segment, Finnish power producer Fortum OYJ turned in a strong performance; the company was able to raise its prices while benefiting from stable production costs because of its hydroelectric production facilities. Water utility Northumbrian Water Group plc posted strong first-quarter earnings following favorable regulatory developments in December 2004. All of the previously mentioned contributors, except Fortum OYJ, were stocks not held by the benchmark index.
Many of the Fund’s biggest detractors were on the telecommunications side of the portfolio. For example, the stock of Belgian telecommunications services provider Belgacom SA weakened in May after the company scaled back revenue growth projections for its wireless unit due to competitive pressures. Another service provider in the telecommunications area, France Telecom SA, performed poorly during the reporting period despite announcing a proposed doubling of its dividend and making progress in its plans to cut costs and streamline its service plans.
We continue to believe that the global utilities space offers attractive opportunities. However, the mix of the Fund’s holdings could change as we try to find stocks with the most attractive valuations and strongest growth prospects. For example, we already have reduced our energy-related holdings to some extent and may do so further as the year progresses. Conversely, we have increased the Fund’s weighting in telecommunications stocks, with a primary focus on Europe, where wireline competition is less intense than in the United States and where fewer customers substitute wireless for wireline service.
Overall, we like the utilities sector’s combination of attractive dividend yields plus earnings growth prospects, with industry consolidation another factor likely to have a net positive effect on share prices in the sector for the near term.
Portfolio Manager: Ben Walker
Investing in mutual funds involves risk, including possible loss of principal.
There is no assurance that the investment objective of any fund will be achieved.
Funds that concentrate on specific sectors or a relatively small number of securities may be subject to greater volatility than a more diversified investment.
International investing involves additional risks, including currency fluctuations, differences in accounting standards, political instability and foreign regulations, all of which are magnified in emerging markets.
Morgan Stanley Capital International (MSCI) World Utilities IndexSM: An unmanaged index that is based on developed-market country indexes and is generally representative of the stocks in the utilities sector, which includes industry groups such as electric, gas, multi-utilities, and unregulated power and water.
Morgan Stanley Capital International (MSCI) World Telecommunication Services IndexSM: An unmanaged index that is based on developed-market country indexes and is generally representative of the stocks in the global utilities sector.
Lipper Analytical Services, Inc. is an industry research firm whose rankings are based on total return performance and do not reflect the effects of sales charges.
The Gartmore Variable Insurance Trust Funds are available only as sub-account investment options in certain variable insurance products. Accordingly, investors are unable to invest in shares of these funds outside of an insurance product. Performance information found herein reflects only the performance of these funds, and does not indicate the performance your sub-account may experience under your variable insurance contract. Performance returns assume reinvestment of all distributions. The investment return and principal value of an investment will fluctuate so that an investor’s shares, when redeemed, may be worth more or less than their original cost. Index performance is provided for comparison
1
Table of Contents
Gartmore GVIT Global Utilities Fund |
purposes only; the indexes shown are unmanaged and do not reflect any fees or expenses. Investors cannot invest directly in market indexes. To obtain performance information about the sub-account option under your insurance contract that invests in one of these funds, please contact your variable insurance carrier. PAST PERFORMANCE IS NO GUARANTEE OF FUTURE RESULTS.
Commentary provided by Gartmore Global Investments. All opinions and estimates included in this report constitute Gartmore Global Investments’ judgment as of the date of this report and are subject to change without notice.
Investors should carefully consider a fund’s investment objectives, risks, fees, charges and expenses before investing any money. To obtain this and other information on Gartmore Variable Insurance Trust, please contact your variable insurance contract provider or call 800-848-0920. Please read the Trust’s prospectus carefully before investing any money.
Gartmore Funds distributed by Gartmore Distribution Services, Inc., Member NASD. 1200 River Road, Suite 1000, Conshohocken, PA 19428.
2
Table of Contents
Fund Performance | Gartmore GVIT Global Utilities Fund |
Average Annual Total Return1
(For Periods Ended June 30, 2005)
| Six Months* | 1 Yr. | Inception2 | ||||
| Class I3 | 3.09% | 27.11% | 6.54% | |||
| Class II3 | 3.04% | 26.81% | 6.34% | |||
| Class III4 | 3.09% | 27.05% | 6.57% |
| * | Not Annualized. |
| 1 | Not subject to any sales charges. |
| 2 | Fund commenced operations on December 28, 2001. |
| 3 | These returns until the creation of the Class I shares (May 10, 2002) and Class II shares (March 28, 2003) are based on the performance of the Class III shares of the Fund. Excluding the effect of any fee waivers or reimbursements, such prior performance is similar to what Class I and Class II shares would have produced because all classes of shares invest in the same portfolio of securities. Class II shares’ annual returns have been restated to reflect the additional fees applicable to Class II shares and therefore are lower than those of Class I. |
| 4 | For Class III shares, these returns do not reflect the short-term trading fees applicable to such shares; if these fees were reflected, the annual returns for Class III shares would have been lower. |
Performance of a $10,000 Investment
Investment return and principal value will fluctuate, and when redeemed, shares may be worth more or less than original cost. Past performance is no guarantee of future results and does not reflect the deduction of taxes that a shareholder would pay on fund distributions or the redemption of fund shares. Investing in mutual funds involves market risk, including loss of principal. Performance returns assume the reinvestment of all distributions.
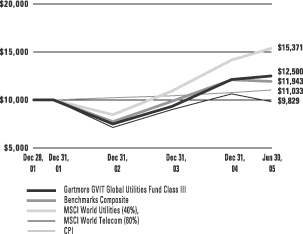
Comparative performance of $10,000 invested in Class III shares of the Gartmore GVIT Global Utilities Fund, Morgan Stanley Capital International (MSCI) World Telecommunication Services IndexSM(MSCI World Telecommunication Services )(a),Morgan Stanley Capital International World Utilities Index (MSCI World Utilities)(b), the Gartmore GVIT Global Utilities Composite Index (Composite)(c) and the Consumer Price Index (CPI)(d) since inception. Unlike the Fund, the returns for these unmanaged indexes do not reflect any fees, expenses, or sales charges. Investors cannot invest directly in market indexes.
| (a) | MSCI World Telecommunication Services is an unmanaged index that is based on developed-market country indexes and is generally representative of the stocks in the global utilities sector. |
| (b) | MSCI World Utilities is an unmanaged index that is based on developed-market country indexes and is generally representative of the stocks in the utilities sector, which includes industry groups such as electric, gas, multi-utilities, and unregulated power and water. |
| (c) | The Composite is a combination of MSCI World Telecom (60%) and MSCI World Utilities (40%). |
| (d) | The CPI represents changes in prices of a basket of goods and services purchased for consumption by urban households. |
3
Table of Contents
Shareholder
Expense Example | Gartmore GVIT Global Utilities Fund |
As a shareholder of the Fund, you incur two types of costs: (1) transaction costs, including sales charges (loads) paid on purchase payments and redemption fees; and (2) ongoing costs, including investment advisory fees, administration fees, distribution fees and other Fund expenses. The examples below are intended to help you understand your ongoing costs (in dollars) of investing in the Fund and to compare these costs with the ongoing costs of investing in other mutual funds. Per SEC requirements, the examples assume that you had a $1,000 investment in the Class at the beginning of the reporting period, January 1, 2005, and continued to hold your shares at the end of the reporting period, June 30, 2005.
Actual Expenses
For each Class of the Fund in the table below, the first line provides information about actual account values and actual expenses. You may use the information in this line, together with the amount you invested, to estimate the expenses that you paid over the period. Simply divide your account value by $1,000 (for example, an $8,600 account value divided by $1,000 = 8.6), then multiply the result by the number in the first line of each Class under the heading entitled “Expenses Paid During Period” to estimate the expenses you paid on your account during the period.
Hypothetical Example for Comparison Purposes
The second line of each Class in the table below provides information about hypothetical account values and hypothetical expenses based on the Class’ actual expense ratio and an assumed rate of return of 5% per year before expenses, which is not the Class’ actual return. The hypothetical account values and expenses may not be used to estimate the actual ending account balance or expenses you paid for the period. You may use this information to compare the ongoing costs of investing in the Class of the Fund and other funds. To do so, compare this 5% hypothetical example with the 5% hypothetical examples that appear in the shareholder reports of the other funds.
Please note that the expenses shown in the table are meant to highlight your ongoing costs only and do not reflect any transaction costs, such as sales charges (loads) or redemption fees. Therefore, the second line for each Class in the table is useful in comparing ongoing costs only, and will not help you determine the relative total costs of owning different funds. In addition, if these transaction costs were included, your costs would have been higher. The examples also assume all dividends and distributions have been reinvested.
| Beginning Account Value, January 1, 2005 | Ending Account Value, June 30, 2005 | Expenses Paid During Period* | Annualized Expense Ratio* | ||||||||||
| Global Utilities Fund | |||||||||||||
Class I | Actual | $ | 1,000 | $ | 1,031 | $ | 5.44 | 1.08% | |||||
| Hypothetical1 | $ | 1,000 | $ | 1,020 | $ | 5.42 | 1.08% | ||||||
Class II | Actual | $ | 1,000 | $ | 1,030 | $ | 6.70 | 1.33% | |||||
| Hypothetical1 | $ | 1,000 | $ | 1,018 | $ | 6.68 | 1.33% | ||||||
Class III | Actual | $ | 1,000 | $ | 1,031 | $ | 5.39 | 1.07% | |||||
| Hypothetical1 | $ | 1,000 | $ | 1,020 | $ | 5.37 | 1.07% | ||||||
| * | Expenses are equal to the Fund’s annualized expense ratio multiplied by the average account value over the period multiplied by 181/365 (to reflect the one-half year period). The expense ratio presented represents a six month, annualized ratio in accordance with SEC guidelines. |
| 1 | Represents the hypothetical 5% return before expenses. |
4
Table of Contents
Portfolio Summary
(June 30, 2005) | Gartmore GVIT Global Utilities Fund |
The SEC adopted a requirement that Funds present their portfolio holdings in a table, chart or graph format in their annual and semiannual reports to shareholders, whether or not a statement of investments is utilized. The following tables, which present portfolio holdings as a percentage of net assets, are provided in compliance with this requirement.
| Asset Allocation | ||
| Common Stocks | 99.3% | |
| Other assets in excess of liabilities | 0.7% | |
| 100.0% | ||
| Top Industries | ||
| Telecommunications | 33.4% | |
| Gas & Electric Utility | 23.8% | |
| Electric Utility | 18.4% | |
| Oil & Gas Utility | 12.3% | |
| Water Utility | 7.7% | |
| Gas Utility | 1.8% | |
| Oil & Gas | 1.4% | |
| Building & Construction | 0.5% | |
| Other Industries | 0.7% | |
| 100.0% | ||
| Top Holdings | ||
| Verizon Communications, Inc. | 5.8% | |
| Vodafone Group PLC | 5.4% | |
| SBC Communications, Inc. | 4.6% | |
| Exelon Corp. | 3.2% | |
| E. ON AG | 3.0% | |
| BellSouth Corp. | 3.0% | |
| TXU Corp. | 2.6% | |
| Fortum Oyj | 2.6% | |
| Scottish Power PLC | 2.6% | |
| Sprint Corp. | 2.5% | |
| Other Holdings | 64.7% | |
| 100.0% | ||
5
Table of Contents
GARTMORE VARIABLE INSURANCE TRUST
GARTMORE GVIT GLOBAL UTILITIES FUND
Statement of Investments — June 30, 2005 (Unaudited)
| Shares or Principal Amount | Value | ||||
| COMMON STOCKS (99.3%) | |||||
| BELGIUM (0.8%) | |||||
| Electric Utility (0.6%) | |||||
| Elia System Operator SA/NV (b) | 8,370 | $ | 287,782 | ||
| Telecommunications (0.2%) | |||||
| Mobistar SA (c) | 810 | 67,676 | |||
| 355,458 | |||||
| CANADA (1.9%) | |||||
| Oil & Gas Utility (1.6%) | |||||
| Suncor Energy, Inc. | 16,000 | 756,629 | |||
| Telecommunications (0.3%) | |||||
| BCE, Inc. | 5,093 | 120,589 | |||
| 877,218 | |||||
| DENMARK (0.4%) | |||||
| Telecommunications (0.4%) | |||||
| TDC (c) | 4,270 | 182,834 | |||
| FINLAND (3.4%) | |||||
| Oil & Gas Utility (3.4%) | |||||
| Fortum Oyj (c) | 73,735 | 1,182,796 | |||
| Neste Oil Oyj (b) | 12,853 | 332,995 | |||
| 1,515,791 | |||||
| FRANCE (4.0%) | |||||
| Building & Construction (0.5%) | |||||
| Bouygues SA (c) | 5,070 | 209,675 | |||
| Telecommunications (1.4%) | |||||
| France Telecom SA (c) | 21,782 | 634,163 | |||
| Water Utility (2.1%) | |||||
| Suez SA (c) | 35,000 | 946,450 | |||
| 1,790,288 | |||||
| GERMANY (6.3%) | |||||
| Gas & Electric Utility (5.3%) | |||||
| E. ON AG (c) | 15,000 | 1,332,151 | |||
| Rwe AG (c) | 16,562 | 1,064,380 | |||
| 2,396,531 | |||||
| Telecommunications (1.0%) | |||||
| Deutsche Telekom AG (c) | 24,787 | 456,869 | |||
| 2,853,400 | |||||
| Shares or Principal Amount | Value | ||||
| COMMON STOCKS (continued) | |||||
| GREECE (1.9%) | |||||
| Electric Utility (0.2%) | |||||
| Public Power Corp. (c) | 3,040 | $ | 75,788 | ||
| Telecommunications (1.7%) | |||||
| Hellenic Telecommunications Organization SA (OTE) (b) (c) | 34,019 | 659,259 | |||
| Tim Hellas Telecommunications SA ADR | 7,046 | 133,663 | |||
| 792,922 | |||||
| 868,710 | |||||
| HONG KONG (0.2%) | |||||
| Electric Utility (0.2%) | |||||
| CLP Holdings Ltd. (c) | 12,000 | 68,763 | |||
| ITALY (2.9%) | |||||
| Electric Utility (1.4%) | |||||
| Enel SpA (c) | 74,000 | 646,045 | |||
| Oil & Gas (1.4%) | |||||
| Eni SpA (c) | 21,670 | 557,034 | |||
| Snam Rete Gas SpA (c) | 14,885 | 79,589 | |||
| 636,623 | |||||
| Telecommunications (0.1%) | |||||
| Telecom Italia SpA (c) | 7,519 | 23,457 | |||
| 1,306,125 | |||||
| JAPAN (5.3%) | |||||
| Electric Utility (2.1%) | |||||
| Chubu Electric Power Co., Inc. (c) | 8,600 | 206,146 | |||
| Kansai Electric Power Co., Inc. (c) | 7,400 | 148,638 | |||
| Kyushu Electric Power Co., Inc. (c) | 6,000 | 130,315 | |||
| Tohoku Electric Power Co., Inc. (c) | 5,600 | 119,345 | |||
| Tokyo Electric Power Co., Inc. (c) | 14,000 | 333,562 | |||
| 938,006 | |||||
6
Table of Contents
GARTMORE VARIABLE INSURANCE TRUST
GARTMORE GVIT GLOBAL UTILITIES FUND
Statement of Investments — June 30, 2005 (Unaudited) (continued)
| Shares or Principal Amount | Value | ||||
| COMMON STOCKS (continued) | |||||
| JAPAN (continued) | |||||
| Gas Utility (0.5%) | |||||
| Osaka Gas Co. Ltd. (c) | 34,000 | $ | 106,849 | ||
| Tokyo Gas Co. Ltd. (c) | 26,000 | 97,120 | |||
| 203,969 | |||||
| Telecommunications (2.7%) | |||||
| Nippon Telegraph & Telephone Corp. (c) | 126 | 538,917 | |||
| NTT DoCoMo, Inc. (c) | 470 | 692,662 | |||
| 1,231,579 | |||||
| 2,373,554 | |||||
| LUXEMBURG (0.4%) | |||||
| Oil & Gas Utility (0.4%) | |||||
| Stolt Offshore SA (b) (c) | 22,310 | 202,362 | |||
| NORWAY (1.4%) | |||||
| Oil & Gas Utility (1.4%) | |||||
| Statoil ASA (c) | 30,000 | 610,853 | |||
| SINGAPORE (0.6%) | |||||
| Telecommunications (0.6%) | |||||
| Singapore Telecommunications Ltd. (b) (c) | 161,114 | 264,204 | |||
| SOUTH AFRICA (0.5%) | |||||
| Oil & Gas Utility (0.5%) | |||||
| Sasol Ltd. (c) | 8,700 | 235,086 | |||
| SPAIN (3.5%) | |||||
| Electric Utility (1.0%) | |||||
| Iberdrola SA (c) | 16,880 | 444,699 | |||
| Gas & Electric Utility (1.5%) | |||||
| Endesa SA (c) | 21,530 | 500,663 | |||
| Union Fenosa SA (c) | 6,654 | 202,570 | |||
| 703,233 | |||||
| Telecommunications (1.0%) | |||||
| Telefonica SA (c) | 27,193 | 443,794 | |||
| 1,591,726 | |||||
| UNITED KINGDOM (17.4%) | |||||
| Electric Utility (6.4%) | |||||
| International Power PLC (c) | 250,000 | 921,036 | |||
| Shares or Principal Amount | Value | ||||
| COMMON STOCKS (continued) | |||||
| UNITED KINGDOM (continued) | |||||
| National Grid Transco PLC (c) | 59,302 | $ | 573,395 | ||
| Scottish & Southern Energy PLC (c) | 12,082 | 218,731 | |||
| Scottish Power PLC (c) | 129,702 | 1,151,334 | |||
| 2,864,496 | |||||
| Telecommunications (5.4%) | |||||
| Vodafone Group PLC (c) | 1,000,000 | 2,432,260 | |||
| Water Utility (5.6%) | |||||
| AWG PLC (c) | 42,451 | 729,485 | |||
| Northumbrian Water Group PLC (c) | 179,478 | 721,139 | |||
| Pennon Group PLC (c) | 38,199 | 711,429 | |||
| United Utilities PLC (c) | 6,800 | 80,236 | |||
| United Utilities PLC, Class A (c) | 47,490 | 280,018 | |||
| 2,522,307 | |||||
| 7,819,063 | |||||
| UNITED STATES (48.4%) | |||||
| Electric Utility (6.5%) | |||||
| Dominion Resources, Inc. | 5,743 | 421,479 | |||
| Dpl, Inc. | 28,540 | 783,423 | |||
| Edison International | 20,566 | 833,951 | |||
| PPL Corp. | 14,407 | 855,488 | |||
| Southern Co. (The) | 1,179 | 40,876 | |||
| 2,935,217 | |||||
| Gas & Electric Utility (17.0%) | |||||
| Centerpoint Energy, Inc. | 65,370 | 863,537 | |||
| Duke Energy Corp. | 18,987 | 564,484 | |||
| Energy East Corp | 19,870 | 575,833 | |||
| Exelon Corp. | 28,435 | 1,459,568 | |||
| FirstEnergy Corp. | 15,960 | 767,836 | |||
| NiSource, Inc. | 25,600 | 633,088 | |||
| PG&E Corp. | 19,340 | 726,024 | |||
| SCANA Corp. | 10,280 | 439,059 | |||
| TXU Corp. | 14,285 | 1,186,940 | |||
| Wisconsin Energy Corp. | 11,700 | 456,300 | |||
| 7,672,669 | |||||
| Gas Utility (1.3%) | |||||
| The Williams Companies, Inc. | 30,000 | 570,000 | |||
7
Table of Contents
GARTMORE VARIABLE INSURANCE TRUST
GARTMORE GVIT GLOBAL UTILITIES FUND
Statement of Investments — June 30, 2005 (Unaudited) (continued)
| Shares or Principal Amount | Value | ||||
| COMMON STOCKS (continued) | |||||
| UNITED STATES (continued) | |||||
| Oil & Gas Utility (5.0%) | |||||
| Burlington Resources, Inc. | 12,000 | $ | 662,880 | ||
| ConocoPhillips | 11,686 | 671,828 | |||
| EOG Resources, Inc. | 4,489 | 254,975 | |||
| Valero Energy Corp. | 8,600 | 680,346 | |||
| 2,270,029 | |||||
| Telecommunications (18.6%) | |||||
| AT&T Corp. | 4,977 | 94,762 | |||
| BellSouth Corp. | 49,964 | 1,327,543 | |||
| Nextel Communications, Inc., Class A (b) | 34,964 | 1,129,687 | |||
| SBC Communications, Inc. | 87,203 | 2,071,071 | |||
| Sprint Corp. | 45,230 | 1,134,821 | |||
| Shares or Principal Amount | Value | ||||
| COMMON STOCKS (continued) | |||||
| UNITED STATES (continued) | |||||
| Verizon Communications, Inc. | 76,070 | $ | 2,628,218 | ||
| 8,386,102 | |||||
| 21,834,017 | |||||
| Total Common Stocks | 44,749,452 | ||||
| Total Investments (Cost $43,157,903) (a) — 99.3% | 44,749,452 | ||||
| Other assets in excess of liabilities — 0.7% | 297,697 | ||||
| NET ASSETS — 100.0% | $ | 45,047,149 | |||
| (a) | See notes to Statement of Investments for tax unrealized (depreciation) of securities. |
| (b) | Denotes a non-income producing security. |
| (c) | Fair Value Security |
At June 30, 2005, the Fund’s open forward foreign currency contracts were as follows:
| Currency | Delivery Date | Contract Value | Market Value | Unrealized Appreciation/ (Depreciation) | ||||||||||
| Short Contracts | ||||||||||||||
British Pound | 07/05/05 | $ | (763,457 | ) | $ | (763,296 | ) | $ | 161 | |||||
Euro | 07/05/05 | (286,987 | ) | (287,503 | ) | (516 | ) | |||||||
| Total Short Contracts | $ | (1,050,444 | ) | $ | (1,050,799 | ) | $ | (355 | ) | |||||
| Currency | Delivery Date | Contract Value | Market Value | Unrealized Appreciation/ (Depreciation) | ||||||||||
| Long Contracts | ||||||||||||||
US Dollar | 07/05/05 | $ | 1,050,444 | $ | 1,050,444 | $ | 0 | |||||||
| Total Long Contracts | $ | (1,050,444 | ) | $ | 1,050,444 | $ | 0 | |||||||
See notes to financial statements.
8
Table of Contents
GARTMORE VARIABLE INSURANCE TRUST
GARTMORE GVIT GLOBAL UTILITIES FUND
Statement of Assets and Liabilities
June 30, 2005 (Unaudited)
Assets: | |||
Investments, at value (cost $43,157,903) | $ | 44,749,452 | |
Interest and dividends receivable | 121,988 | ||
Receivable for investments sold | 2,054,251 | ||
Unrealized appreciation on forward foreign currency contracts | 161 | ||
Reclaims receivable | 40,107 | ||
Prepaid expenses and other assets | 4,702 | ||
Total Assets | 46,970,661 | ||
Liabilities: | |||
Payable to custodian | 550,511 | ||
Payable to foreign currencies, at value (cost $46,116) | 45,706 | ||
Payable for investments purchased | 1,291,748 | ||
Unrealized depreciation on forward foreign currency contracts | 516 | ||
Accrued expenses and other payables: | |||
Investment advisory fees | 29,000 | ||
Fund administration and transfer agent fees | 1,080 | ||
Distribution fees | 195 | ||
Administrative servicing fees | 4,306 | ||
Other | 450 | ||
Total Liabilities | 1,923,512 | ||
Net Assets | $ | 45,047,149 | |
Represented by: | |||
Capital | $ | 40,417,201 | |
Accumulated net investment income (loss) | 265,451 | ||
Accumulated net realized gains (losses) from investment and foreign currency transactions | 2,775,234 | ||
Net unrealized appreciation (depreciation) on investments and translation of assets and liabilities denominated in foreign currencies | 1,589,263 | ||
Net Assets | $ | 45,047,149 | |
Net Assets: | |||
Class I Shares | $ | 5,333,530 | |
Class II Shares | 961,489 | ||
Class III Shares | 38,752,130 | ||
Total | $ | 45,047,149 | |
Shares outstanding (unlimited number of shares authorized): | |||
Class I Shares | 477,988 | ||
Class II Shares | 85,957 | ||
Class III Shares | 3,465,066 | ||
Total | 4,029,011 | ||
Net asset value and offering price per share:* | |||
Class I Shares | $ | 11.16 | |
Class II Shares | $ | 11.19 | |
Class III Shares | $ | 11.18 |
| * | Not subject to a front-end sales charge. |
For the Six Months Ended June 30, 2005 (Unaudited)
Investment Income: | ||||
Interest income | $ | 9,446 | ||
Dividend income (net of foreign | 798,134 | |||
Total Income | 807,580 | |||
Expenses: | ||||
Investment advisory fees | 160,908 | |||
Fund administration and transfer agent fees | 19,376 | |||
Distribution fees Class II Shares | 1,241 | |||
Administrative servicing fees | 3,235 | |||
Administrative servicing fees | 722 | |||
Administrative servicing fees | 21,901 | |||
Other** | 8,738 | |||
Total Expenses | 216,121 | |||
Net Investment Income (Loss) | 591,459 | |||
REALIZED/UNREALIZED GAINS (LOSSES) ON INVESTMENTS: | ||||
Net realized gains (losses) on investment transactions | 2,882,680 | |||
Net realized gains (losses) on foreign currency transactions | 6,679 | |||
Net realized gains (losses) on investment and foreign currency transactions | 2,889,359 | |||
Net change in unrealized appreciation/depreciation on investments and translation of assets and liabilities denominated in foreign currencies | (2,180,261 | ) | ||
Net realized/unrealized gains (losses) on investments and foreign currencies | 709,098 | |||
CHANGE IN NET ASSETS RESULTING FROM OPERATIONS | $ | 1,300,557 | ||
| ** | Other expenses may include the following fees: audit, custody, insurance, legal, printing, trustee, and out-of-pocket expenses. |
See notes to financial statements.
9
Table of Contents
GARTMORE VARIABLE INSURANCE TRUST
GARTMORE GVIT GLOBAL UTILITIES FUND
Statement of Changes in Net Assets
| Six Months Ended June 30, 2005 | Year Ended December 31, 2004 | |||||||
| (Unaudited) | ||||||||
From Investment Activities: | ||||||||
Operations: | ||||||||
Net investment income (loss) | $ | 591,459 | $ | 311,174 | ||||
Net realized gains (losses) on investment and foreign currency transactions | 2,889,359 | 3,623,572 | ||||||
Net change in unrealized appreciation/depreciation on investments and translation of assets and liabilities denominated in foreign currencies | (2,180,261 | ) | 2,431,310 | |||||
Change in net assets resulting from operations | 1,300,557 | 6,366,056 | ||||||
Distributions to Class I shareholders from: | ||||||||
Net investment income | (38,862 | ) | (35,204 | ) | ||||
Net realized gains on investments | (161,171 | ) | (195,255 | ) | ||||
Distributions to Class II shareholders from: | ||||||||
Net investment income | (6,227 | ) | (10,770 | ) | ||||
Net realized gains on investments | (29,377 | ) | (44,745 | ) | ||||
Distributions to Class III shareholders from: | ||||||||
Net investment income | (289,510 | ) | (249,205 | ) | ||||
Net realized gains on investments | (1,186,768 | ) | (1,318,457 | ) | ||||
Change in net assets from shareholder distributions | (1,711,915 | ) | (1,853,636 | ) | ||||
Change in net assets from capital transactions | 8,233,047 | 23,464,032 | ||||||
Change in net assets | 7,821,689 | 27,976,452 | ||||||
Net Assets: | ||||||||
Beginning of period | 37,225,460 | 9,249,008 | ||||||
End of period | $ | 45,047,149 | $ | 37,225,460 | ||||
CAPITAL TRANSACTIONS: | ||||||||
Class I Shares | ||||||||
Proceeds from shares issued | $ | 2,041,094 | $ | 4,019,864 | ||||
Dividends reinvested | 200,033 | 230,459 | ||||||
Cost of shares redeemed | (1,544,453 | ) | (1,096,781 | ) | ||||
| 696,674 | 3,153,542 | |||||||
Class II Shares | ||||||||
Proceeds from shares issued | 95 | 387,374 | ||||||
Dividends reinvested | 35,604 | 55,513 | ||||||
Cost of shares redeemed | (135,410 | ) | (680,957 | ) | ||||
| (99,711 | ) | (238,070 | ) | |||||
Class III Shares | ||||||||
Proceeds from shares issued | 10,427,586 | 22,718,673 | ||||||
Dividends reinvested | 1,476,278 | 1,567,660 | ||||||
Cost of shares redeemed | (4,267,780 | ) | (3,737,773 | ) | ||||
| 7,636,084 | 20,548,560 | |||||||
Change in net assets from capital transactions | $ | 8,233,047 | $ | 23,464,032 | ||||
10
Table of Contents
GARTMORE VARIABLE INSURANCE TRUST
GARTMORE GVIT GLOBAL UTILITIES FUND
Statement of Changes in Net Assets (continued)
| Six Months Ended June 30, 2005 | Year Ended December 31, 2004 | |||||
| (Unaudited) | ||||||
SHARE TRANSACTIONS: | ||||||
Class I Shares | ||||||
Issued | 180,460 | 384,984 | ||||
Reinvested | 18,106 | 20,666 | ||||
Redeemed | (136,277 | ) | (110,400 | ) | ||
| 62,289 | 295,250 | |||||
Class II Shares | ||||||
Issued | — | 41,123 | ||||
Reinvested | 3,214 | 5,018 | ||||
Redeemed | (11,964 | ) | (70,325 | ) | ||
| (8,750 | ) | (24,184 | ) | |||
Class III Shares | ||||||
Issued | 918,711 | 2,253,756 | ||||
Reinvested | 133,258 | 140,330 | ||||
Redeemed | (377,427 | ) | (371,975 | ) | ||
| 674,542 | 2,022,111 | |||||
See notes to financial statements.
11
Table of Contents
GARTMORE VARIABLE INSURANCE TRUST
Selected Data for Each Share of Capital Outstanding
Gartmore GVIT Global Utilities Fund
| Investment Activities | Distributions | Ratios/Supplemental Data | |||||||||||||||||||||||||||||||||||||||||||
| Net Asset Value, Beginning of Period | Net Investment Income (Loss) | Redemption Fees | Net Realized and Unrealized Gains (Losses) on Investments | Total from Investment Activities | Net Investment Income | Net Realized Gains | Total Distributions | Net Asset Value, End of Period | Total Return | Net Assets at End of Period (000s) | Ratio of Expenses to Average Net Assets | Ratio of Net Investment Income (Loss) to Average Net Assets | Ratio of Expenses (Prior to Reimbursements) to Average Net Assets(a) | Ratio of Net Investment Income (Loss) (Prior to Reimbursements) to Average Net Assets(a) | Portfolio Turnover(b) | ||||||||||||||||||||||||||||||
Class I Shares | |||||||||||||||||||||||||||||||||||||||||||||
Period Ended December 31, 2002(c) | $ | 8.38 | 0.08 | 0.01 | (0.96 | ) | (0.87 | ) | (0.09 | ) | — | (0.09 | ) | $ | 7.42 | (10.36% | )(f) | $ | 169 | 1.20% | (g) | 1.83% | (g) | (h | ) | (h | ) | 153.83% | |||||||||||||||||
Year Ended December 31, 2003 | $ | 7.42 | 0.06 | 0.01 | 1.71 | 1.78 | (0.04 | ) | — | (0.04 | ) | $ | 9.16 | 24.05% | $ | 1,104 | 1.11% | 1.28% | (h | ) | (h | ) | 116.62% | ||||||||||||||||||||||
Year Ended December 31, 2004 | $ | 9.16 | 0.13 | — | 2.60 | 2.73 | (0.13 | ) | (0.50 | ) | (0.63 | ) | $ | 11.26 | 29.97% | $ | 4,679 | 1.08% | 1.78% | (h | ) | (h | ) | 358.63% | |||||||||||||||||||||
Six Months Ended June 30, 2005 (Unaudited) | $ | 11.26 | 0.15 | — | 0.19 | 0.34 | (0.09 | ) | (0.35 | ) | (0.44 | ) | $ | 11.16 | 3.09% | (f) | $ | 5,334 | 1.08% | (g) | 2.93% | (g) | (h | ) | (h | ) | 126.58% | ||||||||||||||||||
Class II Shares | |||||||||||||||||||||||||||||||||||||||||||||
Period Ended December 31, 2003(d) | $ | 7.08 | 0.03 | 0.01 | 2.09 | 2.13 | (0.03 | ) | — | (0.03 | ) | $ | 9.18 | 30.16% | (f) | $ | 1,092 | 1.36% | (g) | 0.76% | (g) | (h | ) | (h | ) | 116.62% | |||||||||||||||||||
Year Ended December 31, 2004 | $ | 9.18 | 0.18 | — | 2.53 | 2.71 | (0.11 | ) | (0.50 | ) | (0.61 | ) | $ | 11.28 | 29.56% | $ | 1,069 | 1.33% | 1.58% | (h | ) | (h | ) | 358.63% | |||||||||||||||||||||
Six Months Ended June 30, 2005 (Unaudited) | $ | 11.28 | 0.15 | — | 0.18 | 0.33 | (0.07 | ) | (0.35 | ) | (0.42 | ) | $ | 11.19 | 3.04% | (f) | $ | 961 | 1.33% | (g) | 2.53% | (g) | (h | ) | (h | ) | 126.58% | ||||||||||||||||||
Class III Shares | |||||||||||||||||||||||||||||||||||||||||||||
Period Ended December 31, 2001(e) | $ | 10.00 | — | — | 0.01 | 0.01 | — | — | — | $ | 10.01 | 0.10% | (f) | $ | 3,002 | 1.15% | (g) | (0.12% | )(g) | 8.45% | (g) | (7.42% | )(g) | 0.00% | |||||||||||||||||||||
Year Ended December 31, 2002 | $ | 10.01 | 0.12 | 0.01 | (2.62 | ) | (2.49 | ) | (0.09 | ) | — | (0.09 | ) | $ | 7.43 | (24.85% | ) | $ | 3,571 | 1.10% | 1.79% | 1.11% | 1.78% | 153.83% | |||||||||||||||||||||
Year Ended December 31, 2003 | $ | 7.43 | 0.10 | 0.01 | 1.68 | 1.79 | (0.04 | ) | — | (0.04 | ) | $ | 9.18 | 24.17% | $ | 7,054 | 1.04% | 1.39% | (h | ) | (h | ) | 116.62% | ||||||||||||||||||||||
Year Ended December 31, 2004 | $ | 9.18 | 0.14 | — | 2.60 | 2.74 | (0.14 | ) | (0.50 | ) | (0.64 | ) | $ | 11.28 | 29.95% | $ | 31,478 | 1.05% | 1.73% | (h | ) | (h | ) | 358.63% | |||||||||||||||||||||
Six Months Ended June 30, 2005 (Unaudited) | $ | 11.28 | 0.16 | — | 0.18 | 0.34 | (0.09 | ) | (0.35 | ) | (0.44 | ) | $ | 11.18 | 3.09% | (f) | $ | 38,752 | 1.07% | (g) | 2.95% | (g) | (h | ) | (h | ) | 126.58% | ||||||||||||||||||
| (a) | During the period certain fees were waived and/or reimbursed. If such waivers/reimbursements had not occurred, the ratios would have been as indicated. |
| (b) | Portfolio turnover is calculated on the basis of the Fund as a whole without distinguishing among the classes of shares. |
| (c) | For the period from May 10, 2002 (commencement of operations) through December 31, 2002. |
| (d) | For the period from March 28, 2003 (commencement of operations) through December 31, 2003. |
| (e) | For the period from December 18, 2001 (commencement of operations) through December 31, 2001. Registration of shares effective with the Securities and Exchange Commission on December 28, 2001. On the effective date, the net asset value was $10.01 per share. |
| (f) | Not annualized. |
| (g) | Annualized. |
| (h) | There were no fee reductions during the period. |
See notes to financial statements.
12
Table of Contents
GARTMORE VARIABLE INSURANCE TRUST
June 30, 2005 (Unaudited)
1. Organization
Gartmore Variable Insurance Trust (“GVIT” or the “Trust”) is an open-end management investment company, organized under the laws of Delaware by an amended and restated Agreement and Declaration of Trust, dated October 28, 2004, as amended to date. The Trust, originally created under the laws of Massachusetts as a Massachusetts business trust pursuant to a Declaration of Trust dated, as of June 30, 1981, as subsequently amended, redomesticated as a Delaware Statutory Trust after the close of trading on April 29, 2005, and is registered under the Investment Company Act of 1940, as amended (the “1940 Act”). The redomestication is a change in statutory status and does not affect the operations of the Trust. As of June 30, 2005, the Trust had authorized an unlimited number of shares of beneficial interest (“shares”) without par value. The Trust currently offers shares to life insurance company separate accounts to fund the benefits under variable life insurance or annuity policies. To date, only the separate accounts of Nationwide Life Insurance Company and Nationwide Life and Annuity Insurance Company (collectively, “Nationwide”) have purchased shares of the Trust’s series. The Trust operates thirty-one (31) separate series, or mutual funds, each with its own investment objectives and strategies. This report contains the financial statements and financial highlights of the Gartmore GVIT Global Utilities Fund (the “Fund”).
Under the Trust’s organizational documents, the Trust’s officers and trustees are indemnified against certain liabilities arising out of the performance of their duties to the Trust. In addition, the Trust has entered into Indemnification Agreements with the Trust’s trustees and certain officers covering similar liabilities. In addition, in the normal course of business, the Trust enters into contracts with its vendors and others that provide for general indemnifications. The Trust’s maximum exposure under these arrangements is unknown, as this would involve future claims that may be made against the Trust. Based on experience, however, the Trust expects that risk of loss to be remote.
2. Summary of Significant Accounting Policies
The following is a summary of significant accounting policies followed by the Fund in the preparation of its financial statements. The policies are in conformity with accounting principles generally accepted in the United States of America (“GAAP”). The preparation of financial statements requires management to make estimates and assumptions that affect the reported amounts of assets and liabilities, the disclosure of contingent assets and liabilities at the date of the financial statements and the reported amounts of income and expenses for the period. Actual results could differ from those estimates.
| (a) | Security Valuation |
Securities for which market quotations are readily available are valued at current market value as of “Valuation Time.” Valuation Time is as of the close of regular trading on the New York Stock Exchange (usually 4 p.m. Eastern time). Equity securities are valued at the last quoted sale price or, if there is no sale price, the last quoted bid price provided by an independent pricing service approved by the Trust’s Board of Trustees. Securities traded on NASDAQ are valued at the NASDAQ official closing price. Prices are taken from the primary market or exchange in which each security trades. Most securities listed on a foreign exchange are valued either at fair value (see description below) or at the last sale price at the close of the exchange on which the security is principally traded. Foreign securities, currencies, and other assets and liabilities denominated in foreign currencies are translated into U.S. dollars at the exchange rate of said currencies against the U.S. Dollar, as of Valuation Time, as provided by an independent pricing service approved by the Board of Trustees.
Securities for which market quotations are not readily available, or for which an independent pricing service does not provide a value or provides a value that does not represent fair value in the judgment of the Fund’s investment adviser or designee, are valued at fair value under procedures approved by the Trust’s Board of Trustees. The “Fair Value” of these securities is determined in good faith by taking into account relevant factors and surrounding circumstances. Methods utilized to obtain a “Fair Value” may include the following non-exclusive list of SEC-acceptable methods: (i) a multiple of earnings; (ii) the discount from market value of a similar, freely traded security; (iii) the yield-to-maturity for debt issues; or (iv) a consolidation of the methods. The Gartmore Fair Value Committee considers a non-exclusive list of factors to arrive at the appropriate method upon determining “Fair Value.” For example, fair value determinations are required for securities whose value is affected by a “significant” event that materially affects the value of a domestic or foreign security which occurs subsequent to the time of the close of the principal market on which such domestic or foreign security trades and before the
13
Table of Contents
GARTMORE VARIABLE INSURANCE TRUST
NOTES TO FINANCIAL STATEMENTS (Continued)
June 30, 2005 (Unaudited)
Valuation Time (i.e., a “subsequent event”). Typically, this will involve events occurring after the close of a foreign market on which a security trades and before the next Valuation Time.
The Fund values foreign securities at fair value in the circumstances described below. Generally, trading in foreign securities markets is completed each day at various times prior to the Valuation Time. Due to the time differences between the closings of the relevant foreign securities exchanges and the Valuation Time for the Fund, the Fund will fair value its foreign investments when it is determined that the market quotations for the foreign investments either are not readily available or are unreliable and, therefore, do not represent fair value. When the fair value prices are utilized, these prices will attempt to reflect the impact of the U.S. financial markets’ perceptions and trading activities on the Fund’s foreign investments since the last closing prices of the foreign investments were calculated on their primary foreign securities markets or exchanges. For these purposes, the Board of Trustees of the Trust has determined that movements in relevant indices or other appropriate market indicators, after the close of the foreign securities exchanges, may demonstrate that market quotations are unreliable, and may trigger fair value pricing for certain securities. Consequently, fair valuation of portfolio securities may occur on a daily basis. In determining fair value prices, the Trust utilizes data furnished by an independent pricing service (and that data draws upon, among other information, the market values of foreign investments). The fair value prices of portfolio securities generally will be used when it is determined that the use of these prices will have a material impact on the net asset value of the Fund. When the Fund uses fair value pricing, the values assigned to the Fund’s foreign investments may not be the quoted or published prices of the investments on their primary markets or exchanges.
| (b) | Repurchase Agreements |
The Fund may enter into repurchase agreements with an entity which is a member of the Federal Reserve System or which is a “primary dealer” (as designated by the Federal Reserve Bank of New York) in U.S. Government obligations. The repurchase price generally equals the price paid by the Fund plus interest negotiated on the basis of current short-term rates, which may be more or less than the rate on the underlying portfolio securities. The seller under a repurchase agreement is required to maintain the value of the collateral held pursuant to the agreement at a market value equal to or greater than the repurchase price (including accrued interest). Collateral subject to repurchase agreements is held by the Fund’s custodian or another qualified sub-custodian or in the Federal Reserve/Treasury book-entry system. If the counterparty defaults and the fair value of the collateral declines, realization of the collateral by the Fund may be delayed or limited. The Fund may transfer uninvested cash balances into a pooled cash account. These balances are invested in one or more repurchase agreements, which are fully collateralized by AA-rated Corporate Bonds with the counterparties of CS First Boston and Nomura Securities.
| (c) | Foreign Currency Transactions |
The accounting records of the Fund are maintained in U.S. dollars. Foreign currency amounts are translated into U.S. dollars at the current rate of exchange to determine the value of investments, assets and liabilities. The Fund may enter into foreign currency contracts in connection with purchases or sales of securities denominated in a foreign currency. Purchases and sales of securities, and income and expenses, are translated at the prevailing rate of exchange on the respective date of these transactions. The Fund does not isolate that portion of the results of operations resulting from changes in foreign exchange rates on investments from fluctuations arising from changes in market prices of securities held. These fluctuations are included with the net realized and unrealized gain or loss from investments and foreign currencies.
| (d) | Risks Associated with Foreign Securities and Currencies |
Investments in securities of foreign issuers carry certain risks not ordinarily associated with investments in securities of U.S. issuers. These risks include future political and economic developments, and the possible imposition of exchange controls or other foreign governmental laws and restrictions. In addition, with respect to certain countries, there is the possibility of expropriation of assets, confiscatory taxation, political or social instability, or diplomatic developments, which could adversely affect investments in those countries.
Certain countries also may impose substantial restrictions on investments in their capital markets by foreign entities, including restrictions on investments in issuers of industries deemed sensitive to relevant national interests. These factors
14
Table of Contents
GARTMORE VARIABLE INSURANCE TRUST
NOTES TO FINANCIAL STATEMENTS (Continued)
June 30, 2005 (Unaudited)
may limit the investment opportunities available and result in a lack of liquidity and high price volatility with respect to securities of issuers from developing countries.
| (e) | Forward Foreign Currency Contracts |
The Fund may enter into forward foreign currency contracts in connection with planned purchases or sales of securities or to hedge the U.S. dollar value of portfolio securities denominated in a particular currency. The Fund could be exposed to risks if the counterparties to the contracts are unable to meet the terms of their contracts and from unanticipated movements in the value of a foreign currency relative to the U.S. dollar. Forward foreign currency contracts are valued at the current cost of covering these contracts, as provided by an independent pricing service approved by the Board of Trustees. The forward foreign currency contracts are adjusted by the daily exchange rate of the underlying currency and any gains or losses are recorded for financial statement purposes as unrealized gains or losses until the contract settlement date.
| (f) | Futures Contracts |
The Fund may invest in financial futures contracts (“futures contracts”) for the purpose of hedging its existing portfolio securities or securities that the Fund intends to purchase against fluctuations in value caused by changes in prevailing market interest rates or prices. Futures contracts may also be entered into for non-hedging purposes.
Upon entering into a futures contract, the Fund is required to pledge to the broker an amount of cash and/or other assets equal to a certain percentage of the contract amount (initial margin deposit). Subsequent payments, known as “variation margin,” are made each day, depending on the daily fluctuations in the fair value/market value of the underlying assets. A gain or loss equal to the daily variation margin is recognized on a daily basis. Futures contracts are valued daily at their last quoted sale price.
A “sale” of a futures contract means a contractual obligation to deliver the securities or foreign currency called for by the contract at a fixed price at a specified time in the future. A “purchase” of a futures contract means a contractual obligation to acquire the securities or foreign currency at a fixed price at a specified time in the future.
Should market conditions change unexpectedly, the Fund may not achieve the anticipated benefits of the futures contracts and may realize a loss. The use of futures transactions for hedging purposes involves the risk of imperfect correlation in movements in the price of futures contracts, interest rates, and the value of the underlying hedged assets.
| (g) | Written Options Contracts |
The Fund may write options contracts. A written option obligates the Fund to deliver (written call) or to receive (written put) a specified quantity of an underlying asset at the contract amount upon exercise by the holder of the option. The value of the option contract is recorded as a liability and unrealized gain or loss is measured by the difference between the current value and the premium received. Options traded on an exchange are valued at the last quoted sale price, or in the absence of a sale, the bid price provided by an independent pricing service approved by the Board of Trustees. Non-exchange traded options are valued using dealer supplied quotes.
| (h) | Short Sales |
The Fund is authorized to engage in short-selling of portfolio securities which obligates the Fund to replace any security that the Fund has borrowed by purchasing the security at current market value sometime in the future. The Fund will incur a loss if the price of the security increases between the date of the short sale and the date on which the Fund replaces the borrowed security. The Fund generally will realize a gain if the price of the security declines between these dates. Until the Fund replaces the borrowed security, the Fund will maintain a segregated account with cash, U.S. Government securities and/or securities held long to sufficiently cover the Fund’s short position on a daily basis. Dividends declared on securities sold short are recorded as an expense on the ex-dividend date and paid to the counterparty on the dividend pay date. The collateral for securities sold short are recorded as an expense on the ex-dividend date and paid to the counterparty on the dividend pay
15
Table of Contents
GARTMORE VARIABLE INSURANCE TRUST
NOTES TO FINANCIAL STATEMENTS (Continued)
June 30, 2005 (Unaudited)
date. The collateral for securities sold short includes the deposits with brokers and securities held long as shown in the Statement of Investments for the Fund.
| (i) | Security Transactions and Investment Income |
Security transactions are accounted for on the date the security is purchased or sold (“trade date”). Securities gains and losses are calculated on the identified cost basis. Interest income is recognized on the accrual basis and includes, where applicable, the amortization or accretion of premium or discount. Dividend income is recorded on the ex-dividend date.
| (j) | Securities Lending |
To generate additional income, the Fund may lend up to 33 1/3% of the Fund’s total assets pursuant to agreements, requiring that the borrower deliver cash or securities as collateral with respect to each new loan of U.S. securities, equal to at least 102% of the value of the portfolio securities loaned, and with respect to each new loan of non-U.S. securities, collateral of at least 105% of the value of the portfolio securities loaned, and thereafter requiring the borrower to mark to market the collateral on a daily basis and requiring the borrower to make up any shortfall of collateral. The Fund receives payments from borrowers equivalent to the dividends and interest that would have been earned on securities lent while simultaneously seeking to earn income on the investment of cash collateral. Collateral is marked to market daily to provide a level of collateral at least equal to the market value of securities loaned. There may be risks of delay in recovery of the securities should the borrower of the securities fail financially. Loans will be made, however, only to borrowers deemed by the Fund’s investment adviser to be of good standing and creditworthy under guidelines established by the Board of Trustees and when, in the judgment of the adviser, the consideration which can be earned currently from these securities loans justifies the attendant risks. Loans are subject to termination by the Fund or the borrower at any time, and, therefore, are not considered to be illiquid investments. JPMorgan Chase Bank serves as custodian for the securities lending program of the Fund. JPMorgan Chase Bank receives a custody fee based on the value of collateral received from borrowers.
| (k) | Distributions to Shareholders |
The Fund’s dividends from net investment income, if any, are declared and paid quarterly. The Fund’s distributable net realized capital gains, if any, are declared and distributed at least annually.
Dividends and distributions to shareholders are determined in accordance with federal income tax regulations, which may differ from GAAP. These “book/tax” differences are considered either permanent or temporary in nature. In accordance with the American Institute of Certified Public Accountants (“AICPA”) Statement of Position 93-2, permanent differences (i.e., reclassification of market discounts, gain/loss, paydowns, and distributions) are reclassified within the capital accounts based on their nature for federal income tax purposes; temporary differences do not require reclassification. These reclassifications have no effect upon the net asset value of the Fund. To the extent distributions exceed current and accumulated earnings and profits for federal income tax purposes, these distributions are reported as distributions of paid-in-capital.
| (l) | Federal Income Taxes |
It is the policy of the Fund to qualify or continue to qualify as a “regulated investment company” by complying with the provisions available to certain investment companies, as defined in applicable sections of the U.S. Internal Revenue Code, and to make distributions of net investment income and net realized capital gains sufficient to relieve the Fund from all, or substantially all, federal income taxes.
As of June 30, 2005, the tax cost of securities and the breakdown of unrealized appreciation (depreciation) for the Fund is as follows:
| Tax Cost of Securities | Unrealized Appreciation | Unrealized Depreciation | Net Unrealized Appreciation (Depreciation) | |||
$439,478 | $1,848,071 | $(696,000) | $1,152,071 |
16
Table of Contents
GARTMORE VARIABLE INSURANCE TRUST
NOTES TO FINANCIAL STATEMENTS (Continued)
June 30, 2005 (Unaudited)
| (m) | Allocation of Expenses, Income, and Gains and Losses |
Expenses directly attributable to the Fund are charged to the Fund. Expenses not directly attributable to the Fund are allocated proportionately among various or all funds within the Trust. The method used by the Fund for allocating income, fund level expenses, and realized and unrealized gains or losses is based on the fair value of shares outstanding relative to net assets. Under this method, each class of shares participates based on the total net asset value of that class’s shares in proportion to the total net assets of the Fund. Expenses specific to a class (such as rule 12b-1 and administrative services fees) are charged to that class.
3. Transactions with Affiliates
Under the terms of the Trust’s Investment Advisory Agreement, Gartmore Global Asset Management Trust (“GGAMT”) manages the investment of the assets and supervises the daily business affairs of the Fund. GGAMT is a wholly-owned subsidiary of Nationwide Corporation. All of the common stock of Nationwide Corporation is held by Nationwide Mutual Insurance Company (95.2%) and Nationwide Mutual Fire Insurance Company (4.8%), each of which is a mutual company owned by its policyholders. In addition, GGAMT provides investment management evaluation services in initially selecting and monitoring, on an ongoing basis, the performance of the subadviser, for the Fund that GGAMT advises. Gartmore Global Partners (the “subadviser”), an affiliate of GGAMT, manages all of the Fund’s investments and has the responsibility for making all investment decisions for the Fund.
Under the terms of the Investment Advisory Agreement, the Fund pays GGAMT an investment advisory fee based on that Fund’s average daily net assets. From such fees, pursuant to the subadvisory agreement, GGAMT pays fees to the subadviser. Additional information regarding investment advisory fees and subadvisory fees for GGAMT and the subadviser is as follows for the six months ended June 30, 2005:
| Fee Schedule | Total Fees | Fees Retained | Paid to Sub-adviser | |||
Up to $500 million | 0.80% | 0.40% | 0.40% | |||
$500 million up to $2 billion | 0.75% | 0.35% | 0.40% | |||
Over $2 billion | 0.70% | 0.30% | 0.40% |
Under the terms of a Fund Administration and Transfer Agency Agreement, Gartmore SA Capital Trust (“GSA”) provides the Fund with various administrative and accounting services, and Gartmore Investors Services, Inc. (“GISI”), an indirect subsidiary of GSA, serves as Transfer and Dividend Disbursing Agent for the Fund. The fees for the services provided under this Agreement are calculated based on the Trust’s average daily net assets according to the fee schedule below. The fees are then allocated proportionately among all funds within the Trust in relation to the average daily net assets of each fund and are paid to GSA. GSA pays GISI from these fees for its services.
| Combined Fee Schedule* | ||
Up to $1 billion | 0.13% | |
$1 billion and more up to $3 billion | 0.08% | |
$3 billion and more up to $8 billion | 0.05% | |
$8 billion and more up to $10 billion | 0.04% | |
$10 billion and more up to $12 billion | 0.02% | |
$12 billion or more | 0.01% | |
| * | The assets of the Gartmore GVIT Investor Destinations Aggressive Fund, the Gartmore GVIT Investor Destinations Moderately Aggressive Fund, the Gartmore GVIT Investor Destinations Moderate Fund, the Gartmore GVIT Investor Destinations Moderately Conservative Fund, and the Gartmore GVIT Investor Destinations Conservative Fund (collectively, the “Investor Destinations Funds”) are excluded from the Trust asset level amount in order to calculate this asset-based fee. The Investor Destinations Funds do not pay any part of this fee. |
17
Table of Contents
GARTMORE VARIABLE INSURANCE TRUST
NOTES TO FINANCIAL STATEMENTS (Continued)
June 30, 2005 (Unaudited)
Effective January 1, 2005, the fee for the fund administration and transfer agency services increased as set forth below. The fees are calculated based on the Trust’s average daily net assets according to the fee schedule below. The fees are then allocated proportionately among all funds within the Trust in relation to the average daily net assets of each fund and are paid to GSA.
| Combined Fee Schedule* | ||
Up to $1 billion | 0.15% | |
$1 billion and more up to $3 billion | 0.10% | |
$3 billion and more up to $8 billion | 0.05% | |
$8 billion and more up to $10 billion | 0.04% | |
$10 billion and more up to $12 billion | 0.02% | |
$12 billion or more | 0.01% | |
| * | The assets of each of the Investor Destinations Funds are excluded from the Trust asset level amount in order to calculate this asset-based fee. The Investor Destinations Funds do not pay any part of this fee. |
GSA and GISI have entered into agreements with BISYS Fund Services Ohio, Inc. (“BISYS”), pursuant to which BISYS provides sub-administration and sub-transfer agency services, respectively, to the Fund.
Under the terms of a Distribution Plan under Rule 12b-1 of the 1940 Act, Gartmore Distribution Services, Inc. (“GDSI”), the Fund’s Distributor, is compensated by the Fund for expenses associated with the distribution of the Class II shares of the Fund. These fees are based on average daily net assets of Class II shares of the Fund at an annual rate not to exceed 0.25%.
Under the terms of an Administrative Services Plan, the Fund may pay fees to servicing organizations, such as broker-dealers, including Nationwide Financial Services, and financial institutions, which agree to provide administrative support services to the shareholders of certain classes. These services include, but are not limited, to the following: establishing and maintaining shareholder accounts; processing purchase and redemption transactions; arranging bank wires; performing shareholder sub-accounting; answering inquires regarding the Fund; and other such services. These fees are based on an annual rate of up to 0.25% of the average daily net assets of each class of shares of the Fund.
4. Short-Term Trading Fees
The Fund reserves the right to assess a short-term trading fee on certain transactions out of Class III shares that a separate account makes on behalf of a variable insurance contract owner (the “contract owner”). A separate account that redeems Class III shares on behalf of a contract owner may be subject to a 1.00% short-term trading fee if the separate account held the Class III shares on behalf of the contract owner for 60 days or less, unless an exception applies as disclosed in the prospectus. The short-term trading fee is paid directly to the Fund and is intended to offset the cost to the Fund of excess brokerage commissions and other costs associated with fluctuations in fund asset levels and cash flow caused by short-term trading. For purposes of determining whether the short-term trading fee applies, the Class III shares that were held on behalf of the contract owner the longest will be treated as being redeemed first.
For the six months ended June 30, 2005, the Fund had no contributions to capital due to collection of redemption fees.
5. Investment Transactions
For the six months ended June 30, 2005, (excluding short-term securities) the Fund had purchases of $57,109,447 and sales of $51,755,501.
18
Table of Contents
GARTMORE VARIABLE INSURANCE TRUST
NOTES TO FINANCIAL STATEMENTS (Continued)
June 30, 2005 (Unaudited)
6. Bank Loans
The Trust has a credit agreement of $100,000,000. Borrowings under this arrangement bear interest at the Federal Funds rate plus 0.50%. The interest costs are included in custodian fees in the Statement of Operations. No compensation balances were required under the terms of the line of credit. There were no borrowings outstanding as of June 30, 2005.
7. Shareholder Meeting
A separate shareholders meeting was held on Tuesday, December 23, 2004, for the shareholders of the Trust’s predecessor pursuant to a Proxy Statement On Schedule 14A, dated October 29, 2004, and mailed to the shareholders of the Trust’s predecessor on or around November 5, 2004.
Two Proposals: The purpose of the December 23, 2004 meeting was to allow the shareholders of the Trust’s predecessor to vote on:
| i. | Proposal One: The election of the Trust’s Board of Trustees; and |
| ii. | Proposal Two: The approval of an “Agreement and Plan of Reorganization” that provided for the reorganization of the Trust from a Massachusetts business trust into a Delaware statutory trust. |
Proposal One: As set forth in the October 29, 2004 Proxy Statement, the nominees for election as Trustees of the Trust’s predecessor were: Charles E. Allen, Michael J. Baresich, Paula H.J. Cholmondeley, C. Brent DeVore, Phyllis Kay Dryden, Robert M. Duncan, Barbara L. Hennigar, Paul J. Hondros, Barbara I Jacobs, Thomas J. Kerr IV, Douglas F. Kridler, Michael D. McCarthy, Arden L. Shisler, and David C. Wetmore.
Proposal Two: As specifically set forth in the October 29, 2004 Proxy Statement, the Reorganization proposal requested the shareholders of the Trust’s predecessor to approve the proposed “Agreement and Plan of Reorganization” of the Trust’s predecessor (on behalf of each of the its funds) into a new Delaware-domiciled Trust, whereby the Funds of the new Delaware Trust would acquire all of the assets of the corresponding funds of the Trust’s predecessor subject to the liabilities, expenses, costs, charges, and reserves of the corresponding funds of the Trust’s predecessor (contingent or otherwise), in exchange for shares of the acquiring Funds to be distributed pro rata by the Trust to the holders of the shares of the funds of the Trust’s predecessor, in a complete liquidation of the Trust’s predecessor.
Voting Results:
The shareholders of the Trust’s predecessor voted to approve both Proposal One and Proposal Two, as follows:
Proposal 1: Election of a Board of Trustees of Gartmore Variable Insurance Trust | ||||||||||
Charles E. Allen: | ||||||||||
FOR | 2,797,230,318.955 shares | (96.078%) | ||||||||
WITHHOLD | 114,195,693.660 shares | (3.922%) | ||||||||
TOTAL | 2,912,726,012.615 shares | (100.000%) | ||||||||
Michael J. Baresich: | ||||||||||
FOR | 2,796,135,979.559 shares | (96.040%) | ||||||||
WITHHOLD | 115,290,033.056 shares | (3.960%) | ||||||||
TOTAL | 2,912,726,012.615 shares | (100.000%) | ||||||||
Paula H.J. Cholmondeley: | ||||||||||
FOR | 2,795,095,945.396 shares | (96.004%) | ||||||||
WITHHOLD | 116,330,067.219 shares | (3.996%) | ||||||||
TOTAL | 2,912,726,012.615 shares | (100.000%) | ||||||||
19
Table of Contents
GARTMORE VARIABLE INSURANCE TRUST
NOTES TO FINANCIAL STATEMENTS (Continued)
June 30, 2005 (Unaudited)
C. Brent DeVore: | ||||||||||
FOR | 2,797,207,046.916 shares | (96.077%) | ||||||||
WITHHOLD | 114,218,965.699 shares | (3.923%) | ||||||||
TOTAL | 2,912,726,012.615 shares | (100.000%) | ||||||||
Phyllis Kay Dryden: | ||||||||||
FOR | 2,795,587,023.994 shares | (96.021%) | ||||||||
WITHHOLD | 115,838,988.621 shares | (3.979%) | ||||||||
TOTAL | 2,912,726,012.615 shares | (100.000%) | ||||||||
Robert M. Duncan: | ||||||||||
FOR | 2,790,191,720.503 shares | (95.836%) | ||||||||
WITHHOLD | 121,234,292.112 shares | (4.164%) | ||||||||
TOTAL | 2,912,726,012.615 shares | (100.000%) | ||||||||
Barbara L. Hennigar: | ||||||||||
FOR | 2,792,939,848.858 shares | (95.937%) | ||||||||
WITHHOLD | 118,486,163.757 shares | (4.070%) | ||||||||
TOTAL | 2,912,726,012.615 shares | (100.000%) | ||||||||
Paul J. Hondros: | ||||||||||
FOR | 2,797,557,404.448 shares | (96.089%) | ||||||||
WITHHOLD | 113,868,608.167 shares | (3.911%) | ||||||||
TOTAL | 2,912,726,012.615 shares | (100.000%) | ||||||||
Barbara I. Jacobs: | ||||||||||
FOR | 2,796,306,126.654 shares | (96.046%) | ||||||||
WITHHOLD | 115,119,885.961 shares | (3.954%) | ||||||||
TOTAL | 2,912,726,012.615 shares | (100.000%) | ||||||||
Thomas J. Kerr IV: | ||||||||||
FOR | 2,789,755,720.087 shares | (95.821%) | ||||||||
WITHHOLD | 121,670,292.528 shares | (4.179%) | ||||||||
TOTAL | 2,912,726,012.615 shares | (100.000%) | ||||||||
Douglas F. Kridler: | ||||||||||
FOR | 2,798,065,774.375 shares | (96.106%) | ||||||||
WITHHOLD | 113,360,238.240 shares | (3.894%) | ||||||||
TOTAL | 2,912,726,012.615 shares | (100.000%) | ||||||||
Michael D. McCarthy: | ||||||||||
FOR | 2,797,452,613.694 shares | (96.085%) | ||||||||
WITHHOLD | 113,973,395.921 shares | (3.915%) | ||||||||
TOTAL | 2,912,726,012.615 shares | (100.000%) | ||||||||
Arden L. Shisler: | ||||||||||
FOR | 2,796,738,454.730 shares | (96.061%) | ||||||||
WITHHOLD | 114,687,557.885 shares | (3.939%) | ||||||||
TOTAL | 2,912,726,012.615 shares | (100.000%) | ||||||||
20
Table of Contents
GARTMORE VARIABLE INSURANCE TRUST
NOTES TO FINANCIAL STATEMENTS (Continued)
June 30, 2005 (Unaudited)
David C. Wetmore: | ||||||||||
FOR | 2,794,784,752.247 shares | (95.994%) | ||||||||
WITHHOLD | 116,641,260.368 shares | (4.006%) | ||||||||
TOTAL | 2,912,726,012.615 shares | (100.000%) | ||||||||
Proposal 2: Approval of the Agreement and Plan of Reorganization of Gartmore Variable Insurance Trust | ||||||||||
FOR | 2,561,003,822.546 shares | (87.964%) | ||||||||
AGAINST | 103,593,261.010 shares | (3.558%) | ||||||||
ABSTAIN | 246,828,929.059 shares | (8.478%) | ||||||||
TOTAL | 2,912,726,012.615 shares | (100.000%) | ||||||||
8. Subsequent Event
On July 29, 2005, the Trust filed a Post-Effective Amendment to its Registration Statement on Form N-1A to change the structure of the Fund’s investment advisory fee and sub-advisory fee from the current asset-based fee structure to a performance based fee structure on or about October 1, 2005. On that date, or, if later, upon SEC effectiveness, the Fund will immediately lower its base advisory fee by 0.10% at each breakpoint. Beginning one year after implementation of the new performance fee structure, the Fund’s base advisory fee may be adjusted proportionately upward or downward if the Fund outperforms or uderperforms its stated benchmark by the following amounts:
Out or Underperformance | Change in Fees | |
+/- 1 percentage point | +/- 0.02% | |
+/- 2 percentage points | +/- 0.04% | |
+/- 3 percentage points | +/- 0.06% | |
+/- 4 percentage points | +/- 0.08% | |
+/- 5 percentage points | +/- 0.10% |
The prospectus describing the above Fund will be supplemented upon the effectiveness of the Post-Effective Amendment to the Trust’s Registration Statement. Please refer to the prospectus, as supplemented by a notice you will receive after the effectiveness of the Post-Effective Amendment, for further information about this new fee structure.
21
Table of Contents
GARTMORE VARIABLE INSURANCE TRUST
Management Information (Unaudited)
June 30, 2005
Trustees who are not Interested Persons (as defined in the 1940 Act) and Officers of the Funds June 30, 2005
| Name, Address and Date of Birth | Position(s) Held with the Trust and Length of Time Served1 | Principal Occupation(s) During Past Five Years | Number of Portfolios in the Gartmore Fund Complex Overseen by Trustee | Other Directorships Held by Trustee or Nominee2 | ||||
Charles E. Allen
c/o Gartmore Global Investments, Inc. 1200 River Road, Suite 1000 Conshohocken, PA 19428
1948 | Trustee since July 2000 | Mr. Allen is Chairman, Chief Executive Officer and President of the Graimark Realty Advisors, Inc. (real estate development, investment and asset management). | 84 | None | ||||
Paula H.J. Cholmondeley
c/o Gartmore Global Investments, Inc. 1200 River Road, Suite 1000 Conshohocken, PA 19428
1940 | Trustee since July 2000 | Ms. Cholmondeley has been the Chairman and Chief Executive Officer of the Sorrel Group, a management consulting company, since January 2004. From March 2000 through December 2003, Ms. Cholmondeley was Vice President and General Manager of Sappi Fine Paper North America. Prior thereto, Ms. Cholmondeley was Vice President and General Manager of Residential Insulation of Owens Corning. | 84 | Director of Dentsply International, Inc., Ultralife Batteries, Inc. , Terex Corporation, Minerals Technology, Inc. and Albany International Corp. | ||||
C. Brent DeVore
c/o Gartmore Global Investments, Inc. 1200 River Road, Suite 1000 Conshohocken, PA 19428
1940 | Trustee since 1990 | Dr. DeVore is President of Otterbein College. | 84 | None | ||||
Phyllis K. Dryden
c/o Gartmore Global Investments, Inc. 1200 River Road, Suite 1000 Conshohocken, PA 19428
1947 | Trustee since December 2004 | Ms. Dryden was a former Managing Partner of marchFIRST, a global management consulting firm prior to 2002. | 84 | None |
22
Table of Contents
GARTMORE VARIABLE INSURANCE TRUST
Management Information (Unaudited)
June 30, 2005
| Name, Address and Date of Birth | Position(s) Held with the Trust and Length of Time Served1 | Principal Occupation(s) During Past 5 Years | Number of Portfolios in the Gartmore Fund Complex Overseen by Trustee | Other Directorships Held by Trustee or Nominee2 | ||||
Barbara L. Hennigar*
c/o Gartmore Global Investments, Inc. 1200 River Road, Suite 1000 Conshohocken, PA 19428
1935 | Trustee since July 2000 | Retired since June 2000. Prior thereto, Ms. Hennigar was the Chairman or President and Chief Executive Officer of OppenheimerFunds Services and a member of the Executive Committee of OppenheimerFunds. | 84 | None | ||||
Barbara I. Jacobs
c/o Gartmore Global Investments, Inc. 1200 River Road, Suite 1000 Conshohocken, PA 19428
1950 | Trustee since December 2004 | Ms. Jacobs has served as Chairman of the Board of Directors of KICAP Network Fund, a European (United Kingdom) hedge fund, since December 2000. Prior to 2004, Ms. Jacobs was also a Managing Director and European Portfolio Manager with CREF Investments (Teachers Insurance Annuity Association — College Retirement Equity Fund). | 84 | None | ||||
Douglas F. Kridler
c/o Gartmore Global Investments, Inc. 1200 River Road, Suite 1000 Conshohocken, PA 19428
1955 | Trustee since September 1997 | Mr. Kridler has served as the President and Chief Executive Officer of the Columbus Foundation (a Columbus, OH-based foundation which manages over 1,300 individual endowment funds) since February 2002. Mr. Kridler was the President of the Columbus Association for the Performing Arts prior thereto and Chairman of the Greater Columbus Convention and Visitors Bureau during 2000 and 2001. | 84 | None | ||||
Michael D. McCarthy
c/o Gartmore Global Investments, Inc. 1200 River Road, Suite 1000 Conshohocken, PA 19428
1947 | Trustee since December 2004 | Mr. McCarthy serves as: the Founder and Chairman of The Eureka Foundation (which sponsors and funds the “Great Museums” series on PBS); and a Partner of Pineville Properties LLC (a commercial real estate development firm). | 843 | None |
23
Table of Contents
GARTMORE VARIABLE INSURANCE TRUST
Management Information (Unaudited)
June 30, 2005
| Name, Address and Date of Birth | Position(s) Held with the Trust and Length of Time Served1 | Principal Occupation(s) During Past 5 Years | Number of Portfolios in the Gartmore Fund Complex Overseen by Trustee | Other Directorships Held by Trustee or Nominee2 | ||||
David C. Wetmore
c/o Gartmore Global Investments, Inc. 1200 River Road, Suite 1000 Conshohocken, PA 19428
1948 | Trustee since 1995 and Chairman since February 2005 | Retired. Mr. Wetmore was formerly a Managing Director of Updata Capital, an investment banking and venture capital firm. | 84 | None |
| * | Pursuant to the Trust’s mandatory retirement policy, Ms. Hennigar is expected to retire on or about January 12, 2006. |
| 1 | The term of office length is until a trustee resigns or reaches a mandatory retirement age of 70. On March 2, 2000, the Board adopted a five-year implementation period for any Trustee 65 or older as of the adoption of this policy. Pursuant to this policy, Messrs. Duncan and Kerr retired as trustees effective as of March 12, 2005. |
| 2 | Directorships held in (1) any other investment companies registered under the 1940 Act, (2) any company with a class of securities registered pursuant to Section 12 of the Securities Exchange Act of 1934, as amended (the “Exchange Act”), or (3) any company subject to the requirements of Section 15(d) of the Exchange Act. |
| 3 | Mr. McCarthy was also an Administrative Committee Member for the Alphagen Arneb Fund, LLC, The Healthcare Fund LDC, The Leaders Long-Short Fund, LLC, and The Leaders Long-Short Fund LDC, four private investment companies (hedge funds) managed by GSA. Mr. McCarthy resigned as an Administrative Committee Member effective June 30, 2005. |
Trustees and Officers who are not Interested Persons (as defined in the 1940 Act) of the Funds received aggregate compensation of $274,882 from the Trust for the Six Months Ended June 30, 2005. Additional information regarding the Trustees and Officers may be found in the Trust’s statement of additional information, which is available without charge upon request, by calling 1-800-848-0920.
24
Table of Contents
GARTMORE VARIABLE INSURANCE TRUST
Management Information (Unaudited)
June 30, 2005
Trustees who are Interested Persons (as defined in the 1940 Act) and/or Officers of the Funds June 30, 2005
| Name, Address and Age | Position(s) Held with the Trust and Length of Time Served1 | Principal Occupation(s) During Past Five Years | Number of Portfolios in the Gartmore Fund Complex Overseen by Trustee | Other Directorships Held by Trustee2 | ||||
Paul J. Hondros
Gartmore Global Investments, Inc. 1200 River Road, Suite 1000 Conshohocken, PA 19428
1948 | Trustee since July 2000 | Mr. Hondros has been President and Chief Executive Officer of various Gartmore entities, including Gartmore Distribution Services, Inc. (“GDSI”),3 Gartmore Investor Services, Inc. (“GISI”),3 Gartmore Morley Capital Management, Inc. (“GMCM”),3 Gartmore Morley Financial Services, Inc. (“GMFS”), 3 NorthPointe Capital, LLC (“NorthPointe”),3 Gartmore Global Asset Management Trust (“GGAMT”)3,, Gartmore Global Investments, Inc. (“GGI”)3, Gartmore Mutual Fund Capital Trust (“GMFCT”)3 and Gartmore SA Capital Trust (“GSA”)3; and a Director of Nationwide Securities, Inc.3, as well as several entities within Nationwide Financial Services, Inc. | 844 | None | ||||
Arden L. Shisler
c/o Gartmore Global Investments, Inc. 1200 River Road, Suite 1000 Conshohocken, PA 19428
1941 | Trustee since February 2000 | Mr. Shisler has been a consultant since January 2003. Prior thereto, he was President and Chief Executive Officer of K&B Transport, Inc., a trucking firm. Since 1992, Mr. Shisler has also been Chairman of the Board for Nationwide Mutual Insurance Company3. | 84 | Director of Nationwide Financial Services, Inc. | ||||
Gerald J. Holland Gartmore Global Investments, Inc. 1200 River Road, Suite 1000 Conshohocken, PA 19428 1951 | Treasurer since March 2001 | Mr. Holland is Senior Vice President— Operations for GGI3, GMFCT3 , and GSA3. Prior to July 2000, Mr, Holland was Vice President for First Data Investor Services, an investment company service provider. | 84 | None |
25
Table of Contents
GARTMORE VARIABLE INSURANCE TRUST
Management Information (Unaudited)
June 30, 2005
| Name, Address and Age | Position(s) Held with the Trust and Length of Time Served1 | Principal Occupation(s) During Past 5 Years | Number of Portfolios in the Gartmore Fund Complex Overseen by Trustee | Other Directorships Held by Trustee2 | ||||
Michael A. Krulikowski
Gartmore Global Investments, Inc. 1200 River Road, Suite 1000 Conshohocken, PA 19428
1959 | Chief Compliance Officer since June 2004 | Since November 1999, Mr. Krulikowski has served as a Vice President and Chief Compliance Officer of GGI. Prior thereto, Mr. Krulikowski served as Chief Compliance Officer of 1717 Capital Management Company/Provident Mutual Insurance Company. | 84 | None | ||||
Eric E. Miller
Gartmore Global Investments, Inc. 1200 River Road, Suite 1000 Conshohocken, PA 19428
1953 | Secretary since December 2002 | Mr. Miller is Senior Vice President, Chief Counsel for GGI3, GMFCT3 and GSA3 since August 2002. From August 2000 to August 2002, Mr. Miller was a Partner with Stradley Ronan Stevens & Young, LLP. Prior to August 2000, Mr. Miller served as Senior Vice President and Deputy General Counsel at Delaware Investments. | 84 | None |
| 1 | The term of office length is until a trustee resigns or reaches a mandatory retirement age of 70. On March 2, 2000, the Board adopted a five-year implementation period for any Trustee 65 or older as of the adoption of this policy. Pursuant to this policy, Messrs. Duncan and Kerr retired as trustees effective as of March 12, 2005. |
| 2 | Directorships held in (1) any other investment companies registered under the 1940 Act, (2) any company with a class of securities registered pursuant to Section 12 of the Securities Exchange Act of 1934, as amended (the “Exchange Act”), or (3) any company subject to the requirements of Section 15(d) of the Exchange Act. |
| 3 | This position is held with an affiliated person or principal underwriter of the Trust. |
| 4 | Mr. Hondros was also an Administrative Committee Member for the Alphagen Arneb Fund, LLC, The Healthcare Fund LDC, The Leaders Long-Short Fund, LLC, and The Leaders Long-Short Fund LDC, four private investment companies (hedge funds) managed by GSA. Mr. Hondros resigned as Administrative Committee Member effective June 30, 2005. |
Federal law requires the Trust, each of its investment advisers and sub-advisers to adopt procedures for voting proxies (“Proxy Voting Guidelines”) and to provide a summary of those Proxy Voting Guidelines used to vote the securities held by the Funds. The Funds’ proxy voting policies and procedures are available without charge (i) upon request, by calling 1-800-848-0920, (ii) on the Fund’s website at www.gartmorefunds.com, or (iii) on the Securities and Exchange Commission’s website at www.sec.gov.
26
Table of Contents
Gartmore GVIT Global Financial Services Fund
SemiannualReport
| | June 30, 2005 |
| Contents | ||
| 6 | Statement of Investments | |
| 8 | Statement of Assets and Liabilities | |
| 8 | Statement of Operations | |
| 9 | Statements of Changes in New Assets | |
| 11 | Financial Highlights | |
| 12 | Notes to Financial Statements | |
Commentary provided by Gartmore Global Investments, investment adviser to Gartmore Variable Insurance Trust. All opinions and estimates included in this report constitute Gartmore Global Investments’ judgment as of the date of this report and are subject to change without notice.
Statement Regarding Availability of Quarterly Portfolio Schedule.
The Gartmore Variable Insurance Trust files complete schedules of portfolio holdings for each Fund with the Securities and Exchange Commission (the “Commission”) for the first and third quarters of each fiscal year on Form N-Q. The Funds’ Forms N-Q are available on the Commission’s website at http://www.sec.gov. The Funds’ Forms N-Q may be reviewed and copied at the Commission’s Public Reference Room in Washington, DC, and information on the operation of the Public Reference Room may be obtained by calling 800-SEC-0330; and the Funds make the information on Form N-Q available to shareholders upon request without charge.
Statement Regarding Availability of Proxy Voting Record.
Information regarding how the Fund voted proxies relating to portfolio securities held during the most recent 12-month period ended June 30, 2005 is available without charge, upon request, by calling 800-848-0920, and on the Commission’s website at http://www.sec.gov.
Table of Contents
Gartmore GVIT Global Financial Services Fund
For the semiannual period ended June 30, 2005, the Gartmore GVIT Global Financial Services Fund returned -2.87% (Class I at NAV), versus -2.08% for its benchmark, the Morgan Stanley Capital International (MSCI) World Financials Index(sm).
Financial services stocks marginally underperformed the broader market, which was essentially flat during the period. Compared with its benchmark, the Fund was hurt by unfavorable stock selection and an underweighting in the real estate group. Our view was that real estate stocks were expensive and, with short-term interest rates on the rise, we thought that long-term rates would shortly follow suit, thereby causing a slowdown in homebuilding and related industries. However, long-term rates actually fell during the period, enabling real estate stocks in the Index to collectively post a modest gain, and making real estate one of the benchmark’s better-performing subsectors. The Fund’s results also were hampered by the Fund’s position in a Hong Kong real estate stock, Hang Lung Group Ltd., that underperformed its counterpart in the Index.
Elsewhere, stocks that detracted from the Fund’s performance included Investors Financial Services Corp., a provider of back-office services to asset management companies. Despite the company’s first-quarter earnings gain of 12%, its stock slumped badly in April, as investors expected even better results. Meanwhile, the share price of Mitsubishi Tokyo Financial Group, Inc., Japan’s second-largest bank, sustained a double-digit loss amid investor doubts about a proposed merger with rival UFJ Holdings, Inc. The merger was approved by shareholders near the end of the reporting period and is scheduled to take effect Oct. 1, 2005.
Counterbalancing these detractors to Fund performance extent was favorable stock selection in the insurance industry. The strongest contributor in the group was The Allstate Corp., which was aided by news of better-than-expected first-quarter earnings. Allstate also reaffirmed its earnings targets for all of 2005. In the thrifts and mortgage finance area, the Fund benefited from its holdings in Countrywide Financial Corp., which was helped by low long-term interest rates, and the resulting strong demand for mortgages and home equity loans. Capital market Fund holding American Capital Strategies, Ltd. was another strong performer, as the company continued to execute its business model effectively.
The U.S. economy appears to be doing moderately well and is even providing some positive surprises. Reasonably healthy economic growth, together with recent strength in the U.S. dollar, is likely to prompt us to maintain the Fund’s overweighting in U.S. stocks. The situation in the United Kingdom and in Europe is less appealing. In particular, recently we have seen a distinct deterioration in U.K. credit conditions, and Europe could be ready to follow suit. As a result, we are inclined to limit the Fund’s exposure in those regions to larger, more defensive stocks that might offer better protection if conditions worsen. We continue to favor capital market stocks, because we believe that merger and acquisition activity could proceed at a healthy pace, barring any unforeseen drag on economic growth, especially in the United States.
PORTFOLIO MANAGER: Douglas Burtnick, CFA and Stuart Quint, CFA, equity research analyst
Investing in mutual funds involves risk, including possible loss of principal.
There is no assurance that the investment objective of any fund will be achieved.
Funds that concentrate on specific sectors or a relatively small number of securities may be subject to greater volatility than a more diversified investment.
International investing involves additional risks, including currency fluctuations, differences in accounting standards, political instability and foreign regulations, all of which are magnified in emerging markets.
Morgan Stanley Capital International (MSCI) World Financials IndexSM: An unmanaged index that is based on developed-market country indexes and is generally representative of the stocks in the global financial services sector.
Lipper Analytical Services, Inc. is an industry research firm whose rankings are based on total return performance and do not reflect the effects of sales charges.
The Gartmore Variable Insurance Trust Funds are available only as sub-account investment options in certain variable insurance products. Accordingly, investors are unable to invest in shares of these funds outside of an insurance product. Performance information found herein reflects only the performance of these funds, and does not indicate the performance your sub-account may experience under your variable insurance contract. Performance returns assume reinvestment of all distributions. The investment return and principal value of an investment will fluctuate so that an investor’s shares, when redeemed, may be worth more or less than their original cost. Index performance is provided for comparison purposes only; the indexes shown are unmanaged and do not reflect any fees or expenses. Investors cannot invest directly in market indexes. To obtain performance information about the sub-account option under your insurance contract that invests in one of these funds, please contact your variable insurance carrier. PAST PERFORMANCE IS NO GUARANTEE OF FUTURE RESULTS.
1
Table of Contents
Gartmore GVIT Global Financial Services Fund (continued)
Commentary provided by Gartmore Global Investments. All opinions and estimates included in this report constitute Gartmore Global Investments’ judgment as of the date of this report and are subject to change without notice.
Investors should carefully consider a fund’s investment objectives, risks, fees, charges and expenses before investing any money. To obtain this and other information on Gartmore Variable Insurance Trust, please contact your variable insurance contract provider or call 800-848-0920. Please read the Trust’s prospectus carefully before investing any money.
Gartmore Funds distributed by Gartmore Distribution Services, Inc., Member NASD. 1200 River Road, Suite 1000, Conshohocken, PA 19428.
2
Table of Contents
Fund Performance | Gartmore GVIT Global Financial Services Fund |
Average Annual Total Return1
(For Periods Ended June 30, 2005)
| Six months* | One year | Inception2 | ||||
| Class I3 | -2.87% | 12.25% | 11.69% | |||
| Class II3 | -2.99% | 11.99% | 11.42% | |||
| Class III4 | -2.93% | 12.29% | 11.70% |
| * | Not Annualized. |
| 1 | Not subject to any sales charges. |
| 2 | Fund commenced operations on December 28, 2001. |
| 3 | These returns until the creation of the Class I shares (May 10, 2002) and Class II shares (March 28, 2003) are based on the performance of the Class shares of the Fund. Excluding the effect of any fee waivers or reimbursements, such prior performance is similar to what Class I and Class shares would have produced because all classes of shares invest in the same portfolio of securities. Class II shares’ annual returns have been restated to reflect the additional fees applicable to Class II shares and therefore are lower than those of Class I. |
| 4 | For Class III shares, these returns do not reflect the short-term trading fees applicable to such shares; if these fees were reflected, the annual returns for Class III shares would have been lower. |
Performance of a $10,000 Investment
Investment return and principal value will fluctuate, and when redeemed, shares may be worth more or less than original cost. Past performance is no guarantee of future results and does not reflect the deduction of taxes that a shareholder would pay on fund distributions or the redemption of fund shares. Investing in mutual funds involves market risk, including loss of principal. Performance returns assume the reinvestment of all distributions.
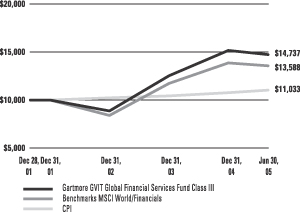
Comparative performance of $10,000 invested in Class III shares of the Gartmore GVIT Global Financial Services Fund, Morgan Stanley Capital International World Financials Index (MSCI World Financials)(a), and the Consumer Price Index (CPI)(b) since inception. Unlike the Fund, the returns for these unmanaged indexes do not reflect any fees, expenses, or sales charges. Investors cannot invest directly in market indexes.
| (a) | The MSCI World Financials is an an unmanaged index that is based on developed-market country indexes and is generally representative of the stocks in the global financial services sector. |
| (b) | The CPI represents changes in prices of a basket of goods and services purchased for consumption by urban households. |
3
Table of Contents
Shareholder
Expense Example | Gartmore GVIT Global Financial Services Fund |
As a shareholder of the Fund, you incur two types of costs: (1) transaction costs, including sales charges (loads) paid on purchase payments and redemption fees; and (2) ongoing costs, including investment advisory fees, administration fees, distribution fees and other Fund expenses. The examples below are intended to help you understand your ongoing costs (in dollars) of investing in the Fund and to compare these costs with the ongoing costs of investing in other mutual funds. Per SEC requirements, the examples assume that you had a $1,000 investment in the Class at the beginning of the reporting period, January 1, 2005, and continued to hold your shares at the end of the reporting period, June 30, 2005.
Actual Expenses
For each Class of the Fund in the table below, the first line provides information about actual account values and actual expenses. You may use the information in this line, together with the amount you invested, to estimate the expenses that you paid over the period. Simply divide your account value by $1,000 (for example, an $8,600 account value divided by $1,000 = 8.6), then multiply the result by the number in the first line of each Class under the heading entitled “Expenses Paid During Period” to estimate the expenses you paid on your account during the period.
Hypothetical Example for Comparison Purposes
The second line of each Class in the table below provides information about hypothetical account values and hypothetical expenses based on the Class’ actual expense ratio and an assumed rate of return of 5% per year before expenses, which is not the Class’ actual return. The hypothetical account values and expenses may not be used to estimate the actual ending account balance or expenses you paid for the period. You may use this information to compare the ongoing costs of investing in the Class of the Fund and other funds. To do so, compare this 5% hypothetical example with the 5% hypothetical examples that appear in the shareholder reports of the other funds.
Please note that the expenses shown in the table are meant to highlight your ongoing costs only and do not reflect any transaction costs, such as sales charges (loads) or redemption fees. Therefore, the second line for each Class in the table is useful in comparing ongoing costs only, and will not help you determine the relative total costs of owning different funds. In addition, if these transaction costs were included, your costs would have been higher. The examples also assume all dividends and distributions have been reinvested.
| Beginning Account Value, January 1, 2005 | Ending Account Value, June 30, 2005 | Expenses Paid | Annualized Expense Ratio* | ||||||||||
| Global Financial Services Fund | |||||||||||||
Class I | Actual | $ | 1,000 | $ | 971 | $ | 6.40 | 1.31% | |||||
| Hypothetical1 | $ | 1,000 | $ | 1,019 | $ | 6.58 | 1.31% | ||||||
Class II | Actual | $ | 1,000 | $ | 970 | $ | 7.62 | 1.56% | |||||
| Hypothetical1 | $ | 1,000 | $ | 1,017 | $ | 7.83 | 1.56% | ||||||
Class III | Actual | $ | 1,000 | $ | 971 | $ | 6.21 | 1.27% | |||||
| Hypothetical1 | $ | 1,000 | $ | 1,019 | $ | 6.38 | 1.27% | ||||||
| * | Expenses are equal to the Fund’s annualized expense ratio multiplied by the average account value over the period multiplied by 181/365 (to reflect the one-half year period). The expense ratio presented represents a six month, annualized ratio in accordance with SEC guidelines. |
| 1 | Represents the hypothetical 5% return before expenses. |
4
Table of Contents
Portfolio Summary
(June 30, 2005) | Gartmore GVIT Global Financial Services Fund |
The SEC adopted a requirement that Funds present their portfolio holdings in a table, chart or graph format in their annual and semiannual reports to shareholders, whether or not a statement of investments is utilized. The following tables, which present portfolio holdings as a percentage of net assets, are provided in compliance with this requirement.
| Asset Allocation | ||
| Common Stocks | 98.2% | |
| Cash Equivalents | 1.8% | |
| 100.0% | ||
| Top Holdings* | ||
| Bank of America Corp. | 4.8% | |
| Citigroup, Inc. | 4.0% | |
| UBS AG | 3.6% | |
| Wells Fargo & Co. | 3.2% | |
| HSBC Holdings PLC | 2.9% | |
| American Express Co. | 2.8% | |
| Bank of Ireland | 2.8% | |
| Capital One Financial Corp. | 2.6% | |
| Banco Santander Central Hispano SA | 2.6% | |
| Royal Bank of Scotland Group PLC | 2.6% | |
| Other Holdings | 68.1% | |
| 100.0% | ||
| Top Industries | ||
| Financial Services | 42.6% | |
| Banking | 41.6% | |
| Insurance | 12.7% | |
| Real Estate Investment Trusts | 1.3% | |
| Other Industries | 1.8% | |
| 100.0% | ||
| * | For purpose of listing top holdings, repurchase agreements are considered cash equivalents and are included as part of Other Holdings. |
5
Table of Contents
GARTMORE VARIABLE INSURANCE TRUST
GARTMORE GVIT GLOBAL FINANCIAL SERVICES FUND
Statement of Investments — June 30, 2005 (Unaudited)
| Shares or Principal Amount | Value | ||||
| COMMON STOCKS (98.2%) | |||||
| AUSTRALIA (2.9%) | |||||
| Banking (2.9%) | |||||
| Australia & New Zealand Banking Group Ltd. (c) | 20,400 | $ | 336,790 | ||
| National Australia Bank Ltd. (c) | 9,180 | 214,461 | |||
| 551,251 | |||||
| AUSTRIA (0.8%) | |||||
| Banking (0.8%) | |||||
| Bank Austria Creditanstalt (c) | 1,532 | 159,453 | |||
| BELGIUM (2.2%) | |||||
| Financial Services (2.2%) | |||||
| Fortis NV (c) | 15,400 | 426,169 | |||
| CANADA (0.8%) | |||||
| Financial Services (0.8%) | |||||
| Manulife Financial Corp. | 3,100 | 148,090 | |||
| FRANCE (3.5%) | |||||
| Banking (2.5%) | |||||
| BNP Paribas SA (c) | 7,070 | 483,080 | |||
| Insurance (1.0%) | |||||
| Axa (c) | 7,790 | 194,030 | |||
| 677,110 | |||||
| GERMANY (1.8%) | |||||
| Financial Services (1.8%) | |||||
| Hypo Real Estate Holding AG (c) | 8,890 | 336,808 | |||
| HONG KONG (1.0%) | |||||
| Financial Services (1.0%) | |||||
| Hang Lung Group Ltd. (c) | 110,360 | 195,465 | |||
| IRELAND (2.8%) | |||||
| Banking (2.8%) | |||||
| Bank of Ireland (c) | 33,100 | 533,712 | |||
| ITALY (1.4%) | |||||
| Banking (1.4%) | |||||
| UniCredito Italiano SpA (c) | 52,050 | 274,534 | |||
| Shares or Principal Amount | Value | ||||
| COMMON STOCKS (continued) | |||||
| JAPAN (5.9%) | |||||
| Financial Services (5.5%) | |||||
| Mitsubishi Tokyo Financial Group, Inc. (c) | 46 | $ | 387,867 | ||
| Mizuho Financial Group, Inc. (c) | 61 | 274,276 | |||
| Orix Corp. (c) | 1,700 | 253,912 | |||
| Sumitomo Mitsui Financial Group, Inc. (c) | 20 | 134,529 | |||
| 1,050,584 | |||||
| Insurance (0.4%) | |||||
| Millea Holdings, Inc. (c) | 6 | 80,489 | |||
| 1,131,073 | |||||
| PORTUGAL (1.8%) | |||||
| Banking (1.8%) | |||||
| Banco Commercial Portuguese SA (c) | 136,960 | 350,848 | |||
| SPAIN (3.6%) | |||||
| Banking (3.6%) | |||||
| Banco Popular Espanol SA (b) (c) | 16,150 | 194,964 | |||
| Banco Santander Central Hispano SA (c) | 43,310 | 501,615 | |||
| 696,579 | |||||
| SWITZERLAND (3.6%) | |||||
| Financial Services (3.6%) | |||||
| UBS AG (c) | 8,820 | 687,564 | |||
| UNITED KINGDOM (10.9%) | |||||
| Banking (10.1%) | |||||
| Barclays PLC (c) | 40,370 | 400,323 | |||
| HBOS PLC (c) | 19,300 | 296,852 | |||
| HSBC Holdings PLC (c) | 34,540 | 549,500 | |||
| Lloyds TSB Group PLC (c) | 22,390 | 189,162 | |||
| Royal Bank of Scotland Group PLC (c) | 16,547 | 498,417 | |||
| 1,934,254 | |||||
| Insurance (0.8%) | |||||
| Royal & Sun Alliance Insurance Group PLC (c) | 106,148 | 158,885 | |||
| 2,093,139 | |||||
6
Table of Contents
GARTMORE VARIABLE INSURANCE TRUST
GARTMORE GVIT GLOBAL FINANCIAL SERVICES FUND
Statement of Investments — June 30, 2005 (Unaudited) (continued)
| Shares or Principal Amount | Value | ||||
| COMMON STOCKS (continued) | |||||
| UNITED STATES (55.2%) | |||||
| Banking (15.7%) | |||||
| Bank Of America Corp. | 20,230 | $ | 922,689 | ||
| Centerstate Banks of Florida, Inc. | 2,320 | 75,702 | |||
| Colonial BancGroup, Inc. (The) | 13,930 | 307,296 | |||
| Hudson City Bancorp, Inc. (b) | 21,500 | 245,315 | |||
| North Fork Bancorp, Inc. | 7,080 | 198,877 | |||
| Southwest Bancorp | 3,000 | 61,440 | |||
| Wachovia Corp. | 4,570 | 226,672 | |||
| Wells Fargo & Co. | 10,080 | 620,725 | |||
| Western Alliance Bancorp (b) | 3,080 | 78,232 | |||
| Zions Bancorp | 3,810 | 280,149 | |||
| 3,017,097 | |||||
| Financial Services (27.7%) | |||||
| American Capital Strategies Ltd. | 6,410 | 231,465 | |||
| American Express Co. | 10,030 | 533,897 | |||
| Capital One Financial Corp. | 6,290 | 503,263 | |||
| Chicago Mercantile Exchange (The) | 420 | 124,110 | |||
| Citigroup, Inc. | 16,720 | 772,965 | |||
| Countrywide Financial Corp. | 8,760 | 338,224 | |||
| Franklin Resources, Inc. | 5,190 | 399,526 | |||
| Freddie Mac | 3,060 | 199,604 | |||
| Goldman Sachs Group, Inc. | 4,600 | 469,292 | |||
| Greenhill & Co., Inc. | 3,260 | 132,063 | |||
| Host Marriott Corp. | 7,100 | 124,250 | |||
| J.P. Morgan Chase & Co. | 4,080 | 144,106 | |||
| Jefferies Group, Inc. | 3,150 | 119,354 | |||
| Legg Mason, Inc. | 1,250 | 130,138 | |||
| Lehman Brothers Holding, Inc. | 3,040 | 301,811 | |||
| MBIA, Inc. | 2,430 | 144,123 | |||
| MBNA Corp. | 5,500 | 143,880 | |||
| Merrill Lynch & Co., Inc. | 3,980 | 218,940 | |||
| Raymond James Financial, Inc. | 3,500 | 98,875 | |||
| SLM Corp. | 1,390 | 70,612 | |||
| T. Rowe Price Group, Inc. | 1,600 | 100,160 | |||
| 5,300,658 | |||||
| Shares or Principal Amount | Value | ||||||
| COMMON STOCKS (continued) | |||||||
| UNITED STATES (continued) | |||||||
| Insurance (10.5%) | |||||||
| Allstate Corp. | 4,180 | $ | 249,755 | ||||
| American International Group, Inc. | 7,970 | 463,057 | |||||
| Aspen Insurance Holdings Ltd. | 3,550 | 97,838 | |||||
| Hartford Financial Services Group | 3,430 | 256,495 | |||||
| PartnerRe Ltd. | 5,080 | 327,255 | |||||
| Principal Financial Group, Inc. | 4,800 | 201,120 | |||||
| St. Paul Travelers Cos. | 6,720 | 265,642 | |||||
| U.S.I. Holdings Corp. (b) | 11,740 | 151,211 | |||||
| 2,012,373 | |||||||
| Real Estate Investment Trusts (1.3%) | |||||||
| KKR Financial Corp. (b) | 5,990 | 149,750 | |||||
| ProLogis | 2,290 | 92,150 | |||||
| 241,900 | |||||||
| 10,572,028 | |||||||
| Total Common Stocks | 18,833,823 | ||||||
| CASH EQUIVALENTS (1.8%) | |||||||
| Investments in repurchase agreements (Collateralized by AA Corporate Bonds, in a joint trading account at 3.34%, dated 06/30/05, due 07/01/05, repurchase price $354,809) | $ | 354,776 | 354,776 | ||||
| Total Cash Equivalents | 354,776 | ||||||
| Total Investments (Cost $18,076,368) (a) — 100.0% | 19,188,599 | ||||||
| Liabilities in excess of other assets — 0.0% | (1,230 | ) | |||||
| NET ASSETS — 100.0% | $ | 19,187,369 | |||||
| (a) | See Notes to Statement of Investments for tax unrealized appreciation (depreciation) of securities. |
| (b) | Denotes a non-income producing security. |
| (c) | Fair Valued Security. |
See notes to financial statements.
7
Table of Contents
GARTMORE VARIABLE INSURANCE TRUST
GARTMORE GVIT GLOBAL FINANCIAL SERVICES FUND
Statement of Assets and Liabilities
June 30, 2005 (Unaudited)
Assets: | ||||
Investments, at value (cost $17,721,592) | $ | 18,833,823 | ||
Repurchase agreements, at cost and value | 354,776 | |||
Total Investments | 19,188,599 | |||
Foreign currencies, at value (cost $3,327) | 3,326 | |||
Interest and dividends receivable | 46,324 | |||
Receivable for investments sold | 193,304 | |||
Reclaims receivable | 18,006 | |||
Prepaid expenses and other assets | 3,602 | |||
Total Assets | 19,453,161 | |||
Liabilities: | ||||
Payable to custodian | 3,320 | |||
Payable for investments purchased | 243,616 | |||
Accrued expenses and other payables: | ||||
Investment advisory fees | 15,834 | |||
Fund administration and transfer agent fees | 410 | |||
Distribution fees | 339 | |||
Administrative servicing fees | 1,664 | |||
Other | 609 | |||
Total Liabilities | 265,792 | |||
Net Assets | $ | 19,187,369 | ||
Represented by: | ||||
Capital | $ | 17,047,534 | ||
Accumulated net investment income (loss) | (105,470 | ) | ||
Accumulated net realized gains (losses) from investment and foreign currency transactions | 1,133,313 | |||
Net unrealized appreciation (depreciation) on investments and translation of assets and liabilities denominated in foreign currencies | 1,111,992 | |||
Net Assets | $ | 19,187,369 | ||
Net Assets: | ||||
Class I Shares | $ | 3,178,505 | ||
Class II Shares | 1,656,367 | |||
Class III Shares | 14,352,497 | |||
Total | $ | 19,187,369 | ||
Shares outstanding (unlimited number of shares authorized): | ||||
Class I Shares | 264,838 | |||
Class II Shares | 138,314 | |||
Class III Shares | 1,195,726 | |||
Total | 1,598,878 | |||
Net asset value and offering price per share:* | ||||
Class I Shares | $ | 12.00 | ||
Class II Shares | $ | 11.98 | ||
Class III Shares | $ | 12.00 |
| * | Not subject to a front-end sales charge. |
For the Six Months Ended June 30, 2005 (Unaudited)
Investment Income: | ||||
Interest income | $ | 5,246 | ||
Dividend income (net of foreign withholding tax of $20,678) | 366,793 | |||
Total Income | 372,039 | |||
Expenses: | ||||
Investment advisory fees | 108,591 | |||
Fund administration and transfer agent fees | 12,116 | |||
Distribution fees Class II Shares | 2,166 | |||
Administrative servicing fees | 2,417 | |||
Administrative servicing fees | 1,283 | |||
Administrative servicing fees | 8,727 | |||
Other** | 5,563 | |||
Total Expenses | 140,863 | |||
Net Investment Income (Loss) | 231,176 | |||
REALIZED/UNREALIZED GAINS (LOSSES) ON INVESTMENTS: | ||||
Net realized gains (losses) on investment transactions | 1,176,351 | |||
Net realized gains (losses) on foreign currency transactions | 7,258 | |||
Net realized gains (losses) on investment and foreign currency transactions | 1,183,609 | |||
Net change in unrealized appreciation/depreciation on investments and translation of assets and liabilities denominated in foreign currencies | (2,190,896 | ) | ||
Net realized/unrealized gains (losses) on investments and foreign currencies | (1,007,287 | ) | ||
CHANGE IN NET ASSETS RESULTING FROM OPERATIONS | $ | (776,111 | ) | |
| ** | Other expenses may include the following fees: audit, custody, insurance, legal, printing, trustee, and out-of-pocket expenses. |
See notes to financial statements.
8
Table of Contents
GARTMORE VARIABLE INSURANCE TRUST
GARTMORE GVIT GLOBAL FINANCIAL SERVICES FUND
Statement of Changes in Net Assets
| Six Months Ended June 30, 2005 | Year Ended December 31, 2004 | |||||||
| (Unaudited) | ||||||||
From Investment Activities: | ||||||||
Operations: | ||||||||
Net investment income (loss) | $ | 231,176 | $ | 298,833 | ||||
Net realized gains (losses) on investment and foreign currency transactions | 1,183,609 | 1,691,506 | ||||||
Net change in unrealized appreciation/depreciation on investments and translation of assets and liabilities denominated in foreign currencies | (2,190,896 | ) | 1,816,307 | |||||
Change in net assets resulting from operations | (776,111 | ) | 3,806,646 | |||||
Distributions to Class I shareholders from: | ||||||||
Net investment income | (46,389 | ) | (52,216 | ) | ||||
Net realized gains on investments | (69,664 | ) | (231,224 | ) | ||||
Distributions to Class II shareholders from: | ||||||||
Net investment income | (22,722 | ) | (23,093 | ) | ||||
Net realized gains on investments | (36,176 | ) | (113,086 | ) | ||||
Distributions to Class III shareholders from: | ||||||||
Net investment income | (217,377 | ) | (273,711 | ) | ||||
Net realized gains on investments | (313,511 | ) | (1,153,388 | ) | ||||
Change in net assets from shareholder distributions | (705,839 | ) | (1,846,718 | ) | ||||
Change in net assets from capital transactions | (4,853,991 | ) | 7,894,969 | |||||
Change in net assets | (6,335,941 | ) | 9,854,897 | |||||
Net Assets: | ||||||||
Beginning of period | 25,523,310 | 15,668,413 | ||||||
End of period | $ | 19,187,369 | $ | 25,523,310 | ||||
CAPITAL TRANSACTIONS: | ||||||||
Class I Shares | ||||||||
Proceeds from shares issued | $ | 732,516 | $ | 2,552,458 | ||||
Dividends reinvested | 116,053 | 283,440 | ||||||
Cost of shares redeemed | (1,454,776 | ) | (2,337,109 | ) | ||||
| (606,207 | ) | 498,789 | ||||||
Class II Shares | ||||||||
Proceeds from shares issued | — | 2,035,636 | ||||||
Dividends reinvested | 58,923 | 136,178 | ||||||
Cost of shares redeemed | (164,708 | ) | (1,333,003 | ) | ||||
| (105,785 | ) | 838,811 | ||||||
Class III Shares | ||||||||
Proceeds from shares issued | 1,327,973 | 15,215,307 | ||||||
Dividends reinvested | 530,887 | 1,427,097 | ||||||
Cost of shares redeemed | (6,000,859 | ) | (10,085,035 | ) | ||||
| (4,141,999 | ) | 6,557,369 | ||||||
Change in net assets from capital transactions | $ | (4,853,991 | ) | $ | 7,894,969 | |||
9
Table of Contents
GARTMORE VARIABLE INSURANCE TRUST
GARTMORE GVIT GLOBAL FINANCIAL SERVICES FUND
Statement of Changes in Net Assets (continued)
| Six Months Ended June 30, 2005 | Year Ended December 31, 2004 | |||||
| (Unaudited) | ||||||
SHARE TRANSACTIONS: | ||||||
Class I Shares | ||||||
Issued | 59,235 | 211,272 | ||||
Reinvested | 9,692 | 22,515 | ||||
Redeemed | (116,829 | ) | (195,070 | ) | ||
| (47,902 | ) | 38,717 | ||||
Class II Shares | ||||||
Issued | — | 169,047 | ||||
Reinvested | 4,931 | 10,850 | ||||
Redeemed | (13,458 | ) | (113,378 | ) | ||
| (8,527 | ) | 66,519 | ||||
Class III Shares | ||||||
Issued | 106,964 | 1,253,232 | ||||
Reinvested | 44,328 | 113,503 | ||||
Redeemed | (486,325 | ) | (857,323 | ) | ||
| (335,033 | ) | 509,412 | ||||
See notes to financial statements.
10
Table of Contents
GARTMORE VARIABLE INSURANCE TRUST
Selected Data for Each Share of Capital Outstanding
Gartmore GVIT Global Financial Services Fund
| Investment Activities | Distributions | Ratios/Supplemental Data | |||||||||||||||||||||||||||||||||||||||||||
| Net Asset Value, Beginning of Period | Net Investment Income (Loss) | Redemption Fees | Net Realized and Unrealized Gains (Losses) on Investments | Total from Investment Activities | Net Investment Income | Net Realized Gains | Total Distributions | Net Asset Value, End of Period | Total Return | Net Assets at End of Period (000s) | Ratio of Expenses to Average Net Assets | Ratio of Net Investment Income (Loss) to Average Net Assets | Ratio of Expenses (Prior to Reimbursements) to Average Net Assets(a) | Ratio of Net Investment Income (Loss) (Prior to Reimbursements) to Average Net Assets(a) | Portfolio Turnover(b) | ||||||||||||||||||||||||||||||
Class I Shares | |||||||||||||||||||||||||||||||||||||||||||||
Period Ended December 31, 2002(c) | $ | 10.23 | — | 0.01 | (1.27 | ) | (1.26 | ) | (0.01 | ) | — | (0.01 | ) | $ | 8.96 | (12.26% | )(f) | $ | 218 | 1.37% | (g) | 0.30% | (g) | (h | ) | (h | ) | 211.21% | |||||||||||||||||
Year Ended December 31, 2003 | $ | 8.96 | 0.10 | 0.01 | 3.58 | 3.69 | (0.05 | ) | (1.21 | ) | (1.26 | ) | $ | 11.39 | 41.45% | $ | 3,121 | 1.27% | 1.47% | (h | ) | (h | ) | 261.68% | |||||||||||||||||||||
Year Ended December 31, 2004 | $ | 11.39 | 0.17 | 0.01 | 2.19 | 2.37 | (0.17 | ) | (0.77 | ) | (0.94 | ) | $ | 12.82 | 20.99% | $ | 4,011 | 1.27% | 1.19% | (h | ) | (h | ) | 127.69% | |||||||||||||||||||||
Six Months Ended June 30, 2005 (Unaudited) | $ | 12.82 | 0.14 | 0.01 | (0.52 | ) | (0.37 | ) | (0.18 | ) | (0.27 | ) | (0.45 | ) | $ | 12.00 | (2.87% | )(f) | $ | 3,179 | 1.31% | (g) | 2.14% | (g) | (h | ) | (h | ) | 71.26% | ||||||||||||||||
Class II Shares | |||||||||||||||||||||||||||||||||||||||||||||
Period Ended December 31, 2003(d) | $ | 8.46 | 0.04 | 0.01 | 4.11 | 4.16 | (0.04 | ) | (1.21 | ) | (1.25 | ) | $ | 11.37 | 49.51% | (f) | $ | 913 | 1.51% | (g) | 1.20% | (g) | (h | ) | (h | ) | 261.68% | ||||||||||||||||||
Year Ended December 31, 2004 | $ | 11.37 | 0.11 | 0.01 | 2.22 | 2.34 | (0.14 | ) | (0.77 | ) | (0.91 | ) | $ | 12.80 | 20.76% | $ | 1,879 | 1.52% | 1.00% | (h | ) | (h | ) | 127.69% | |||||||||||||||||||||
Six Months Ended June 30, 2005 (Unaudited) | $ | 12.80 | 0.12 | 0.01 | (0.52 | ) | (0.39 | ) | (0.16 | ) | (0.27 | ) | (0.43 | ) | $ | 11.98 | (2.99% | )(f) | $ | 1,656 | 1.56% | (g) | 1.91% | (g) | (h | ) | (h | ) | 71.26% | ||||||||||||||||
Class III Shares | |||||||||||||||||||||||||||||||||||||||||||||
Period Ended December 31, 2001(e) | $ | 10.00 | — | — | 0.13 | 0.13 | — | — | — | $ | 10.13 | 1.32% | (f) | $ | 3,041 | 1.35% | (g) | 0.33% | (g) | 8.56% | (g) | (6.88% | )(g) | 0.00% | |||||||||||||||||||||
Year Ended December 31, 2002 | $ | 10.13 | 0.04 | 0.01 | (1.21 | ) | (1.16 | ) | (0.01 | ) | — | (0.01 | ) | $ | 8.96 | (11.41% | ) | $ | 6,009 | 1.31% | 0.66% | (h | ) | (h | ) | 211.21% | |||||||||||||||||||
Year Ended December 31, 2003 | $ | 8.96 | 0.13 | 0.01 | 3.55 | 3.69 | (0.05 | ) | (1.21 | ) | (1.26 | ) | $ | 11.39 | 41.46% | $ | 11,634 | 1.22% | 1.57% | (h | ) | (h | ) | 261.68% | |||||||||||||||||||||
Year Ended December 31, 2004 | $ | 11.39 | 0.14 | 0.01 | 2.23 | 2.38 | (0.17 | ) | (0.77 | ) | (0.94 | ) | $ | 12.83 | 21.13% | $ | 19,634 | 1.24% | 1.28% | (h | ) | (h | ) | 127.69% | |||||||||||||||||||||
Six Months Ended June 30, 2005 (Unaudited) | $ | 12.83 | 0.15 | 0.01 | (0.54 | ) | (0.38 | ) | (0.18 | ) | (0.27 | ) | (0.45 | ) | $ | 12.00 | (2.93% | )(f) | $ | 14,352 | 1.27% | (g) | 2.15% | (g) | (h | ) | (h | ) | 71.26% | ||||||||||||||||
| (a) | During the period certain fees were waived and/or reimbursed. If such waivers/reimbursements had not occurred, the ratios would have been as indicated. |
| (b) | Portfolio turnover is calculated on the basis of the Fund as a whole without distinguishing among the classes of shares. |
| (c) | For the period from May 10, 2002 (commencement of operations) through December 31, 2002. |
| (d) | For the period from March 28, 2003 (commencement of operations) through December 31, 2003. |
| (e) | For the period from December 18, 2001 (commencement of operations) through December 31, 2001. Registration of shares effective with the Securities and Exchange Commission on December 28, 2001. On the effective date, the net asset value was $10.13 per share. |
| (f) | Not annualized. |
| (g) | Annualized. |
| (h) | There were no fee reductions during the period. |
See notes to financial statements.
11
Table of Contents
GARTMORE VARIABLE INSURANCE TRUST
NOTES TO FINANCIAL STATEMENTS (Unaudited)
June 30, 2005
1. Organization
Gartmore Variable Insurance Trust (“GVIT” or the “Trust”) is an open-end management investment company, organized under the laws of Delaware by an amended and restated Agreement and Declaration of Trust, dated October 28, 2004, as amended to date. The Trust, originally created under the laws of Massachusetts as a Massachusetts business trust pursuant to a Declaration of Trust dated, as of October 30, 1997, as subsequently amended, redomesticated as a Delaware Statutory Trust after the close of trading on April 29, 2005, and is registered under the Investment Company Act of 1940, as amended (the “1940 Act”). The redomestication is a change in statutory status and does not affect the operations of the Trust. As of June 30, 2005, the Trust had authorized an unlimited number of shares of beneficial interest (“shares”) without par value. The Trust currently offers shares to life insurance company separate accounts to fund the benefits under variable life insurance or annuity policies. To date, only the separate accounts of Nationwide Life Insurance Company and Nationwide Life and Annuity Insurance Company (collectively, “Nationwide”) have purchased shares of the Trust’s series. The Trust operates thirty-one (31) separate series, or mutual funds, each with its own investment objectives and strategies. This report contains the financial statements and financial highlights of the Gartmore GVIT Global Financial Services Fund (the “Fund”).
Under the Trust’s organizational documents, the Trust’s officers and trustees are indemnified against certain liabilities arising out of the performance of their duties to the Trust. In addition, the Trust has entered into Indemnification Agreements with the Trust’s trustees and certain officers covering similar liabilities. In addition, in the normal course of business, the Trust enters into contracts with its vendors and others that provide for general indemnifications. The Trust’s maximum exposure under these arrangements is unknown, as this would involve future claims that may be made against the Trust. Based on experience, however, the Trust expects that risk of loss to be remote.
2. Summary of Significant Accounting Policies
The following is a summary of significant accounting policies followed by the Fund in the preparation of its financial statements. The policies are in conformity with accounting principles generally accepted in the United States of America (“GAAP”). The preparation of financial statements requires management to make estimates and assumptions that affect the reported amounts of assets and liabilities, the disclosure of contingent assets and liabilities at the date of the financial statements and the reported amounts of income and expenses for the period. Actual results could differ from those estimates.
| (a) | Security Valuation |
Securities for which market quotations are readily available are valued at current market value as of “Valuation Time.” Valuation Time is as of the close of regular trading on the New York Stock Exchange (usually 4 p.m. Eastern time). Equity securities are valued at the last quoted sale price or, if there is no sale price, the last quoted bid price provided by an independent pricing service approved by the Trust’s Board of Trustees. Securities traded on NASDAQ are valued at the NASDAQ official closing price. Prices are taken from the primary market or exchange in which each security trades. Most securities listed on a foreign exchange are valued either at fair value (see description below) or at the last sale price at the close of the exchange on which the security is principally traded. Foreign securities, currencies, and other assets and liabilities denominated in foreign currencies are translated into U.S. dollars at the exchange rate of said currencies against the U.S. Dollar, as of Valuation Time, as provided by an independent pricing service approved by the Board of Trustees.
Securities for which market quotations are not readily available, or for which an independent pricing service does not provide a value or provides a value that does not represent fair value in the judgment of the Fund’s investment adviser or designee, are valued at fair value under procedures approved by the Trust’s Board of Trustees. The “Fair Value” of these securities is determined in good faith by taking into account relevant factors and surrounding circumstances. Methods utilized to obtain a “Fair Value” may include the following non-exclusive list of SEC-acceptable methods: (i) a multiple of earnings; (ii) the discount from market value of a similar, freely traded security; (iii) the yield-to-maturity for debt issues; or (iv) a consolidation of the methods. The Gartmore Fair Value Committee considers a non-exclusive list of factors to arrive at the appropriate method upon determining “Fair Value.” For example, fair value determinations are required for securities whose value is affected by a “significant” event that materially affects the value of a domestic or foreign security which occurs
12
Table of Contents
GARTMORE VARIABLE INSURANCE TRUST
NOTES TO FINANCIAL STATEMENTS (Unaudited) (Continued)
June 30, 2005
subsequent to the time of the close of the principal market on which such domestic or foreign security trades and before the Valuation Time (i.e., a “subsequent event”). Typically, this will involve events occurring after the close of a foreign market on which a security trades and before the next Valuation Time.
The Fund values foreign securities at fair value in the circumstances described below. Generally, trading in foreign securities markets is completed each day at various times prior to the Valuation Time. Due to the time differences between the closings of the relevant foreign securities exchanges and the Valuation Time for the Fund, the Fund will fair value its foreign investments when it is determined that the market quotations for the foreign investments either are not readily available or are unreliable and, therefore, do not represent fair value. When the fair value prices are utilized, these prices will attempt to reflect the impact of the U.S. financial markets’ perceptions and trading activities on the Fund’s foreign investments since the last closing prices of the foreign investments were calculated on their primary foreign securities markets or exchanges. For these purposes, the Board of Trustees of the Trust has determined that movements in relevant indices or other appropriate market indicators, after the close of the foreign securities exchanges, may demonstrate that market quotations are unreliable, and may trigger fair value pricing for certain securities. Consequently, fair valuation of portfolio securities may occur on a daily basis. In determining fair value prices, the Trust utilizes data furnished by an independent pricing service (and that data draws upon, among other information, the market values of foreign investments). The fair value prices of portfolio securities generally will be used when it is determined that the use of these prices will have a material impact on the net asset value of the Fund. When the Fund uses fair value pricing, the values assigned to the Fund’s foreign investments may not be the quoted or published prices of the investments on their primary markets or exchanges.
| (b) | Repurchase Agreements |
The Fund may enter into repurchase agreements with an entity which is a member of the Federal Reserve System or which is a “primary dealer” (as designated by the Federal Reserve Bank of New York) in U.S. Government obligations. The repurchase price generally equals the price paid by the Fund plus interest negotiated on the basis of current short-term rates, which may be more or less than the rate on the underlying portfolio securities. The seller under a repurchase agreement is required to maintain the value of the collateral held pursuant to the agreement at a market value equal to or greater than the repurchase price (including accrued interest). Collateral subject to repurchase agreements is held by the Fund’s custodian or another qualified sub-custodian or in the Federal Reserve/Treasury book-entry system. If the counterparty defaults and the fair value of the collateral declines, realization of the collateral by the Fund may be delayed or limited. The Fund may transfer uninvested cash balances into a pooled cash account. These balances are invested in one or more repurchase agreements, which are fully collateralized by AA-rated Corporate Bonds with the counterparties of CS First Boston and Nomura Securities.
| (c) | Foreign Currency Transactions |
The accounting records of the Fund are maintained in U.S. dollars. Foreign currency amounts are translated into U.S. dollars at the current rate of exchange to determine the value of investments, assets and liabilities. The Fund may enter into foreign currency contracts in connection with purchases or sales of securities denominated in a foreign currency. Purchases and sales of securities, and income and expenses, are translated at the prevailing rate of exchange on the respective date of these transactions. The Fund does not isolate that portion of the results of operations resulting from changes in foreign exchange rates on investments from fluctuations arising from changes in market prices of securities held. These fluctuations are included with the net realized and unrealized gain or loss from investments and foreign currencies.
| (d) | Risks Associated with Foreign Securities and Currencies |
Investments in securities of foreign issuers carry certain risks not ordinarily associated with investments in securities of U.S. issuers. These risks include future political and economic developments, and the possible imposition of exchange controls or other foreign governmental laws and restrictions. In addition, with respect to certain countries, there is the possibility of expropriation of assets, confiscatory taxation, political or social instability, or diplomatic developments, which could adversely affect investments in those countries.
13
Table of Contents
GARTMORE VARIABLE INSURANCE TRUST
NOTES TO FINANCIAL STATEMENTS (Unaudited) (Continued)
June 30, 2005
Certain countries also may impose substantial restrictions on investments in their capital markets by foreign entities, including restrictions on investments in issuers of industries deemed sensitive to relevant national interests. These factors may limit the investment opportunities available and result in a lack of liquidity and high price volatility with respect to securities of issuers from developing countries.
| (e) | Forward Foreign Currency Contracts |
The Fund may enter into forward foreign currency contracts in connection with planned purchases or sales of securities or to hedge the U.S. dollar value of portfolio securities denominated in a particular currency. The Fund could be exposed to risks if the counterparties to the contracts are unable to meet the terms of their contracts and from unanticipated movements in the value of a foreign currency relative to the U.S. dollar. Forward foreign currency contracts are valued at the current cost of covering these contracts, as provided by an independent pricing service approved by the Board of Trustees. The forward foreign currency contracts are adjusted by the daily exchange rate of the underlying currency and any gains or losses are recorded for financial statement purposes as unrealized gains or losses until the contract settlement date.
| (f) | Futures Contracts |
The Fund may invest in financial futures contracts (“futures contracts”) for the purpose of hedging its existing portfolio securities or securities that the Fund intends to purchase against fluctuations in value caused by changes in prevailing market interest rates or prices. Futures contracts may also be entered into for non-hedging purposes.
Upon entering into a futures contract, the Fund is required to pledge to the broker an amount of cash and/or other assets equal to a certain percentage of the contract amount (initial margin deposit). Subsequent payments, known as “variation margin,” are made each day, depending on the daily fluctuations in the fair value/market value of the underlying assets. A gain or loss equal to the daily variation margin is recognized on a daily basis. Futures contracts are valued daily at their last quoted sale price.
A “sale” of a futures contract means a contractual obligation to deliver the securities or foreign currency called for by the contract at a fixed price at a specified time in the future. A “purchase” of a futures contract means a contractual obligation to acquire the securities or foreign currency at a fixed price at a specified time in the future.
Should market conditions change unexpectedly, the Fund may not achieve the anticipated benefits of the futures contracts and may realize a loss. The use of futures transactions for hedging purposes involves the risk of imperfect correlation in movements in the price of futures contracts, interest rates, and the value of the underlying hedged assets.
| (g) | Written Options Contracts |
The Fund may write options contracts. A written option obligates the Fund to deliver (written call) or to receive (written put) a specified quantity of an underlying asset at the contract amount upon exercise by the holder of the option. The value of the option contract is recorded as a liability and unrealized gain or loss is measured by the difference between the current value and the premium received. Options traded on an exchange are valued at the last quoted sale price, or in the absence of a sale, the bid price provided by an independent pricing service approved by the Board of Trustees. Non-exchange traded options are valued using dealer supplied quotes.
| (h) | Short Sales |
The Fund is authorized to engage in short-selling of portfolio securities which obligates the Fund to replace any security that the Fund has borrowed by purchasing the security at current market value sometime in the future. The Fund will incur a loss if the price of the security increases between the date of the short sale and the date on which the Fund replaces the borrowed security. The Fund generally will realize a gain if the price of the security declines between these dates. Until the Fund replaces the borrowed security, the Fund will maintain a segregated account with cash, U.S. Government securities and/or securities held long to sufficiently cover the Fund’s short position on a daily basis. Dividends declared on securities sold short are recorded as
14
Table of Contents
GARTMORE VARIABLE INSURANCE TRUST
NOTES TO FINANCIAL STATEMENTS (Unaudited) (Continued)
June 30, 2005
an expense on the ex-dividend date and paid to the counterparty on the dividend pay date. The collateral for securities sold short are recorded as an expense on the ex-dividend date and paid to the counterparty on the dividend pay date. The collateral for securities sold short includes the deposits with brokers and securities held long as shown in the Statement of Investments for the Fund.
| (i) | Security Transactions and Investment Income |
Security transactions are accounted for on the date the security is purchased or sold (“trade date”). Securities gains and losses are calculated on the identified cost basis. Interest income is recognized on the accrual basis and includes, where applicable, the amortization or accretion of premium or discount. Dividend income is recorded on the ex-dividend date.
| (j) | Securities Lending |
To generate additional income, the Fund may lend up to 33 1/3% of the Fund’s total assets pursuant to agreements, requiring that the borrower deliver cash or securities as collateral with respect to each new loan of U.S. securities, equal to at least 102% of the value of the portfolio securities loaned, and with respect to each new loan of non-U.S. securities, collateral of at least 105% of the value of the portfolio securities loaned, and thereafter requiring the borrower to mark to market the collateral on a daily basis and requiring the borrower to make up any shortfall of collateral. The Fund receives payments from borrowers equivalent to the dividends and interest that would have been earned on securities lent while simultaneously seeking to earn income on the investment of cash collateral. Collateral is marked to market daily to provide a level of collateral at least equal to the market value of securities loaned. There may be risks of delay in recovery of the securities should the borrower of the securities fail financially. Loans will be made, however, only to borrowers deemed by the Fund’s investment adviser to be of good standing and creditworthy under guidelines established by the Board of Trustees and when, in the judgment of the adviser, the consideration which can be earned currently from these securities loans justifies the attendant risks. Loans are subject to termination by the Fund or the borrower at any time, and, therefore, are not considered to be illiquid investments. JPMorgan Chase Bank serves as custodian for the securities lending program of the Fund. JPMorgan Chase Bank receives a custody fee based on the value of collateral received from borrowers.
| (k) | Distributions to Shareholders |
The Fund’s dividends from net investment income, if any, are declared and paid quarterly. The Fund’s distributable net realized capital gains, if any, are declared and distributed at least annually.
Dividends and distributions to shareholders are determined in accordance with federal income tax regulations, which may differ from GAAP. These “book/tax” differences are considered either permanent or temporary in nature. In accordance with the American Institute of Certified Public Accountants (“AICPA”) Statement of Position 93-2, permanent differences (i.e., reclassification of market discounts, gain/loss, paydowns, and distributions) are reclassified within the capital accounts based on their nature for federal income tax purposes; temporary differences do not require reclassification. These reclassifications have no effect upon the net asset value of the Fund. To the extent distributions exceed current and accumulated earnings and profits for federal income tax purposes, these distributions are reported as distributions of paid-in-capital.
| (l) | Federal Income Taxes |
It is the policy of the Fund to qualify or continue to qualify as a “regulated investment company” by complying with the provisions available to certain investment companies, as defined in applicable sections of the U.S. Internal Revenue Code, and to make distributions of net investment income and net realized capital gains sufficient to relieve the Fund from all, or substantially all, federal income taxes.
As of June 30, 2005, the tax cost of securities and the breakdown of unrealized appreciation (depreciation) for the Fund is as follows:
| Tax Cost of Securities | Unrealized Appreciation | Unrealized Depreciation | Net Unrealized Appreciation (Depreciation) | |||
$279,637 | $1,051,390 | $(218,797) | $832,594 |
15
Table of Contents
GARTMORE VARIABLE INSURANCE TRUST
NOTES TO FINANCIAL STATEMENTS (Unaudited) (Continued)
June 30, 2005
| (m) | Allocation of Expenses, Income, and Gains and Losses |
Expenses directly attributable to the Fund are charged to the Fund. Expenses not directly attributable to the Fund are allocated proportionately among various or all funds within the Trust. The method used by the Fund for allocating income, fund level expenses, and realized and unrealized gains or losses is based on the fair value of shares outstanding relative to net assets. Under this method, each class of shares participates based on the total net asset value of that class’s shares in proportion to the total net assets of the Fund. Expenses specific to a class (such as rule 12b-1 and administrative services fees) are charged to that class.
3. Transactions with Affiliates
Under the terms of the Trust’s Investment Advisory Agreement, Gartmore Global Asset Management Trust (“GGAMT”) manages the investment of the assets and supervises the daily business affairs of the Fund. GGAMT is a wholly-owned subsidiary of Nationwide Corporation. All of the common stock of Nationwide Corporation is held by Nationwide Mutual Insurance Company (95.2%) and Nationwide Mutual Fire Insurance Company (4.8%), each of which is a mutual company owned by its policyholders. In addition, GGAMT provides investment management evaluation services in initially selecting and monitoring, on an ongoing basis, the performance of the subadviser, for the Fund that GGAMT advises. Gartmore Global Partners (the “subadviser”), an affiliate of GGAMT, manages all of the Fund’s investments and has the responsibility for making all investment decisions for the Fund.
Under the terms of the Investment Advisory Agreement, the Fund pays GGAMT an investment advisory fee based on that Fund’s average daily net assets. From such fees, pursuant to the subadvisory agreement, GGAMT pays fees to the subadviser. Additional information regarding investment advisory fees and subadvisory fees for GGAMT and the subadviser is as follows for the six months ended June 30, 2005:
| Fee Schedule | Total Fees | Fees Retained | Paid to Sub-adviser | |||
Up to $500 million | 1.00% | 0.50% | 0.50% | |||
$500 million up to $2 billion | 0.95% | 0.45% | 0.50% | |||
Over $2 billion | 0.90% | 0.40% | 0.50% |
Under the terms of a Fund Administration and Transfer Agency Agreement, Gartmore SA Capital Trust (“GSA”) provides the Fund with various administrative and accounting services, and Gartmore Investors Services, Inc. (“GISI”), an indirect subsidiary of GSA, serves as Transfer and Dividend Disbursing Agent for the Fund. The fees for the services provided under this Agreement are calculated based on the Trust’s average daily net assets according to the fee schedule below. The fees are then allocated proportionately among all funds within the Trust in relation to the average daily net assets of each fund and are paid to GSA. GSA pays GISI from these fees for its services.
| Combined Fee Schedule* | ||
Up to $1 billion | 0.13% | |
$1 billion and more up to $3 billion | 0.08% | |
$3 billion and more up to $8 billion | 0.05% | |
$8 billion and more up to $10 billion | 0.04% | |
$10 billion and more up to $12 billion | 0.02% | |
$12 billion or more | 0.01% | |
| * | The assets of the Gartmore GVIT Investor Destinations Aggressive Fund, the Gartmore GVIT Investor Destinations Moderately Aggressive Fund, the Gartmore GVIT Investor Destinations Moderate Fund, the Gartmore GVIT Investor Destinations Moderately Conservative Fund, and the Gartmore GVIT Investor Destinations Conservative Fund (collectively, the “Investor Destinations Funds”) are excluded from the Trust asset level amount in order to calculate this asset-based fee. The Investor Destinations Funds do not pay any part of this fee. |
16
Table of Contents
GARTMORE VARIABLE INSURANCE TRUST
NOTES TO FINANCIAL STATEMENTS (Unaudited) (Continued)
June 30, 2005
Effective January 1, 2005, the fee for the fund administration and transfer agency services increased as set forth below. The fees are calculated based on the Trust’s average daily net assets according to the fee schedule below. The fees are then allocated proportionately among all funds within the Trust in relation to the average daily net assets of each fund and are paid to GSA.
| Combined Fee Schedule* | ||
Up to $1 billion | 0.15% | |
$1 billion and more up to $3 billion | 0.10% | |
$3 billion and more up to $8 billion | 0.05% | |
$8 billion and more up to $10 billion | 0.04% | |
$10 billion and more up to $12 billion | 0.02% | |
$12 billion or more | 0.01% | |
| * | The assets of each of the Investor Destinations Funds are excluded from the Trust asset level amount in order to calculate this asset-based fee. The Investor Destinations Funds do not pay any part of this fee. |
GSA and GISI have entered into agreements with BISYS Fund Services Ohio, Inc. (“BISYS”), pursuant to which BISYS provides sub-administration and sub-transfer agency services, respectively, to the Fund.
Under the terms of a Distribution Plan under Rule 12b-1 of the 1940 Act, Gartmore Distribution Services, Inc. (“GDSI”), the Fund’s Distributor, is compensated by the Fund for expenses associated with the distribution of the Class II shares of the Fund. These fees are based on average daily net assets of Class II shares of the Fund at an annual rate not to exceed 0.25%.
Under the terms of an Administrative Services Plan, the Fund may pay fees to servicing organizations, such as broker-dealers, including Nationwide Financial Services, and financial institutions, which agree to provide administrative support services to the shareholders of certain classes. These services include, but are not limited, to the following: establishing and maintaining shareholder accounts; processing purchase and redemption transactions; arranging bank wires; performing shareholder sub-accounting; answering inquires regarding the Fund; and other such services. These fees are based on an annual rate of up to 0.25% of the average daily net assets of each class of shares of the Fund.
As of June 30, 2005, the advisers or affiliates of the advisers directly held 28% of the shares outstanding of the Fund.
4. Short-Term Trading Fees
The Fund reserves the right to assess a short-term trading fee on certain transactions out of Class III shares that a separate account makes on behalf of a variable insurance contract owner (the “contract owner”). A separate account that redeems Class III shares on behalf of a contract owner may be subject to a 1.00% short-term trading fee if the separate account held the Class III shares on behalf of the contract owner for 60 days or less, unless an exception applies disclosed in the prospectus. The short-term trading fee is paid directly to the Fund and is intended to offset the cost to the Fund of excess brokerage commissions and other costs associated with fluctuations in fund asset levels and cash flow caused by short-term trading. For purposes of determining whether the short-term trading fee applies, the Class III shares that were held on behalf of the contract owner the longest will be treated as being redeemed first.
For the six months ended June 30, 2005, the Fund had no contributions to capital due to collection of redemption fees.
5. Investment Transactions
For the six months ended June 30, 2005, (excluding short-term securities) the Fund had purchases of $15,287,391 and sales of $20,539,459.
6. Bank Loans
The Trust has a credit agreement of $100,000,000. Borrowings under this arrangement bear interest at the Federal Funds rate plus 0.50%. The interest costs are included in custodian fees in the Statement of Operations. No compensation balances were required under the terms of the line of credit. There were no borrowings outstanding as of June 30, 2005.
17
Table of Contents
GARTMORE VARIABLE INSURANCE TRUST
NOTES TO FINANCIAL STATEMENTS (Unaudited) (Continued)
June 30, 2005
7. Shareholder Meeting
A separate shareholders meeting was held on Tuesday, December 23, 2004, for the shareholders of the Trust’s predecessor pursuant to a Proxy Statement On Schedule 14A, dated October 29, 2004, and mailed to the shareholders of the Trust’s predecessor on or around November 5, 2004.
Two Proposals: The purpose of the December 23, 2004 meeting was to allow the shareholders of the Trust’s predecessor to vote on:
| i. | Proposal One: The election of the Trust’s Board of Trustees; and |
| ii. | Proposal Two: The approval of an “Agreement and Plan of Reorganization” that provided for the reorganization of the Trust from a Massachusetts business trust into a Delaware statutory trust. |
Proposal One: As set forth in the October 29, 2004 Proxy Statement, the nominees for election as Trustees of the Trust’s predecessor were: Charles E. Allen, Michael J. Baresich, Paula H.J. Cholmondeley, C. Brent DeVore, Phyllis Kay Dryden, Robert M. Duncan, Barbara L. Hennigar, Paul J. Hondros, Barbara I Jacobs, Thomas J. Kerr IV, Douglas F. Kridler, Michael D. McCarthy, Arden L. Shisler, and David C. Wetmore.
Proposal Two: As specifically set forth in the October 29, 2004 Proxy Statement, the Reorganization proposal requested the shareholders of the Trust’s predecessor to approve the proposed “Agreement and Plan of Reorganization” of the Trust’s predecessor (on behalf of each of the its funds) into a new Delaware-domiciled Trust, whereby the Funds of the new Delaware Trust would acquire all of the assets of the corresponding funds of the Trust’s predecessor subject to the liabilities, expenses, costs, charges, and reserves of the corresponding funds of the Trust’s predecessor (contingent or otherwise), in exchange for shares of the acquiring Funds to be distributed pro rata by the Trust to the holders of the shares of the funds of the Trust’s predecessor, in a complete liquidation of the Trust’s predecessor.
Voting Results:
The shareholders of the Trust’s predecessor voted to approve both Proposal One and Proposal Two, as follows:
Proposal 1: Election of a Board of Trustees of Gartmore Variable Insurance Trust
Charles E. Allen: | ||
FOR | 2,797,230,318.955 shares (96.078%) | |
WITHHOLD | 114,195,693.660 shares (3.922%) | |
TOTAL | 2,912,726,012.615 shares (100.000%) | |
Michael J. Baresich: | ||
FOR | 2,796,135,979.559 shares (96.040%) | |
WITHHOLD | 115,290,033.056 shares (3.960%) | |
TOTAL | 2,912,726,012.615 shares (100.000%) | |
Paula H.J. Cholmondeley: | ||
FOR | 2,795,095,945.396 shares (96.004%) | |
WITHHOLD | 116,330,067.219 shares (3.996%) | |
TOTAL | 2,912,726,012.615 shares (100.000%) | |
C. Brent DeVore: | ||
FOR | 2,797,207,046.916 shares (96.077%) | |
WITHHOLD | 114,218,965.699 shares (3.923%) | |
TOTAL | 2,912,726,012.615 shares (100.000%) | |
18
Table of Contents
GARTMORE VARIABLE INSURANCE TRUST
NOTES TO FINANCIAL STATEMENTS (Unaudited) (Continued)
June 30, 2005
Phyllis Kay Dryden: | ||
FOR | 2,795,587,023.994 shares (96.021%) | |
WITHHOLD | 115,838,988.621 shares (3.979%) | |
TOTAL | 2,912,726,012.615 shares (100.000%) | |
Robert M. Duncan: | ||
FOR | 2,790,191,720.503 shares (95.836%) | |
WITHHOLD | 121,234,292.112 shares (4.164%) | |
TOTAL | 2,912,726,012.615 shares (100.000%) | |
Barbara L. Hennigar: | ||
FOR | 2,792,939,848.858 shares (95.937%) | |
WITHHOLD | 118,486,163.757 shares (4.070%) | |
TOTAL | 2,912,726,012.615 shares (100.000%) | |
Paul J. Hondros: | ||
FOR | 2,797,557,404.448 shares (96.089%) | |
WITHHOLD | 113,868,608.167 shares (3.911%) | |
TOTAL | 2,912,726,012.615 shares (100.000%) | |
Barbara I. Jacobs: | ||
FOR | 2,796,306,126.654 shares (96.046%) | |
WITHHOLD | 115,119,885.961 shares (3.954%) | |
TOTAL | 2,912,726,012.615 shares (100.000%) | |
Thomas J. Kerr IV: | ||
FOR | 2,789,755,720.087 shares (95.821%) | |
WITHHOLD | 121,670,292.528 shares (4.179%) | |
TOTAL | 2,912,726,012.615 shares (100.000%) | |
Douglas F. Kridler: | ||
FOR | 2,798,065,774.375 shares (96.106%) | |
WITHHOLD | 113,360,238.240 shares (3.894%) | |
TOTAL | 2,912,726,012.615 shares (100.000%) | |
Michael D. McCarthy: | ||
FOR | 2,797,452,613.694 shares (96.085%) | |
WITHHOLD | 113,973,395.921 shares (3.915%) | |
TOTAL | 2,912,726,012.615 shares (100.000%) | |
Arden L. Shisler: | ||
FOR | 2,796,738,454.730 shares (96.061%) | |
WITHHOLD | 114,687,557.885 shares (3.939%) | |
TOTAL | 2,912,726,012.615 shares (100.000%) | |
19
Table of Contents
GARTMORE VARIABLE INSURANCE TRUST
NOTES TO FINANCIAL STATEMENTS (Unaudited) (Continued)
June 30, 2005
David C. Wetmore: | ||
FOR | 2,794,784,752.247 shares (95.994%) | |
WITHHOLD | 116,641,260.368 shares (4.006%) | |
TOTAL | 2,912,726,012.615 shares (100.000%) | |
Proposal 2: Approval of the Agreement and Plan of Reorganization of Gartmore Variable Insurance Trust
FOR | 2,561,003,822.546 shares (87.964%) | |
AGAINST | 103,593,261.010 shares (3.558%) | |
ABSTAIN | 246,828,929.059 shares (8.478%) | |
TOTAL | 2,912,726,012.615 shares (100.000%) | |
8. Subsequent Event
On July 29, 2005, the Trust filed a Post-Effective Amendment to its Registration Statement on Form N-1A to change the structure of the Fund’s investment advisory fee and sub-advisory fee from the current asset-based fee structure to a performance based fee structure on or about October 1, 2005. On that date, or, if later, upon SEC effectiveness, the Fund will immediately lower its base advisory fee by 0.10% at each breakpoint. Beginning one year after implementation of the new performance fee structure, the Fund’s base advisory fee may be adjusted proportionately upward or downward if the Fund outperforms or underperforms its stated benchmark by the following amounts:
Out or Underperformance | Change in Fees | |
+/- 1 percentage point | +/- 0.02% | |
+/- 2 percentage points | +/- 0.04% | |
+/- 3 percentage points | +/- 0.06% | |
+/- 4 percentage points | +/- 0.08% | |
+/- 5 percentage points | +/- 0.10% |
The prospectus describing the above Fund will be supplemented upon the effectiveness of the Post-Effective Amendment to the Trust’s Registration Statement. Please refer to the prospectus, as supplemented by a notice you will receive after the effectiveness of the Post-Effective Amendment, for further information about this new fee structure.
20
Table of Contents
GARTMORE VARIABLE INSURANCE TRUST
Management Information (Unaudited)
June 30, 2005
Trustees who are not Interested Persons (as defined in the 1940 Act) and Officers of the Funds June 30, 2005
| Name, Address and Date of Birth | Position(s) Held with the and Length of | Principal Occupation(s) During Past Five Years | Number of the Gartmore | Other Directorships Held by Trustee or Nominee2 | ||||
Charles E. Allen
c/o Gartmore Global Investments, Inc. 1200 River Road, Suite 1000 Conshohocken, PA 19428
1948 | Trustee since July 2000 | Mr. Allen is Chairman, Chief Executive Officer and President of the Graimark Realty Advisors, Inc. (real estate development, investment and asset management). | 84 | None | ||||
Paula H.J. Cholmondeley
c/o Gartmore Global Investments, Inc. 1200 River Road, Suite 1000 Conshohocken, PA 19428
1940 | Trustee since July 2000 | Ms. Cholmondeley has been the Chairman and Chief Executive Officer of the Sorrel Group, a management consulting company, since January 2004. From March 2000 through December 2003, Ms. Cholmondeley was Vice President and General Manager of Sappi Fine Paper North America. Prior thereto, Ms. Cholmondeley was Vice President and General Manager of Residential Insulation of Owens Corning. | 84 | Director of Dentsply International, Inc., Ultralife Batteries, Inc., Terex Corporation, Minerals Technology, Inc. and Albany International Corp. | ||||
C. Brent DeVore
c/o Gartmore Global Investments, Inc. 1200 River Road, Suite 1000 Conshohocken, PA 19428
1940 | Trustee since 1990 | Dr. DeVore is President of Otterbein College. | 84 | None | ||||
Phyllis K. Dryden
c/o Gartmore Global Investments, Inc. 1200 River Road, Suite 1000 Conshohocken, PA 19428
1947 | Trustee since December 2004 | Ms. Dryden was a former Managing Partner of marchFIRST, a global management consulting firm prior to 2002. | 84 | None |
21
Table of Contents
GARTMORE VARIABLE INSURANCE TRUST
Management Information (Unaudited)
June 30, 2005
| Name, Address and Date of Birth | Position(s) Held with the Trust and Length of Time Served1 | Principal Occupation(s) During Past 5 Years | Number of Portfolios in the Gartmore Fund Complex Overseen by Trustee | Other Directorships Held by Trustee or Nominee2 | ||||
Barbara L. Hennigar*
c/o Gartmore Global Investments, Inc. 1200 River Road, Suite 1000 Conshohocken, PA 19428
1935 | Trustee since July 2000 | Retired since June 2000. Prior thereto, Ms. Hennigar was the Chairman or President and Chief Executive Officer of OppenheimerFunds Services and a member of the Executive Committee of OppenheimerFunds. | 84 | None | ||||
Barbara I. Jacobs
c/o Gartmore Global Investments, Inc. 1200 River Road, Suite 1000 Conshohocken, PA 19428
1950 | Trustee since December 2004 | Ms. Jacobs has served as Chairman of the Board of Directors of KICAP Network Fund, a European (United Kingdom) hedge fund, since December 2000. Prior to 2004, Ms. Jacobs was also a Managing Director and European Portfolio Manager with CREF Investments (Teachers Insurance Annuity Association — College Retirement Equity Fund). | 84 | None | ||||
Douglas F. Kridler
c/o Gartmore Global Investments, Inc. 1200 River Road, Suite 1000 Conshohocken, PA 19428
1955 | Trustee since September 1997 | Mr. Kridler has served as the President and Chief Executive Officer of the Columbus Foundation (a Columbus, OH-based foundation which manages over 1,300 individual endowment funds) since February 2002. Mr. Kridler was the President of the Columbus Association for the Performing Arts prior thereto and Chairman of the Greater Columbus Convention and Visitors Bureau during 2000 and 2001. | 84 | None | ||||
Michael D. McCarthy
c/o Gartmore Global Investments, Inc. 1200 River Road, Suite 1000 Conshohocken, PA 19428
1947 | Trustee since December 2004 | Mr. McCarthy serves as: the Founder and Chairman of The Eureka Foundation (which sponsors and funds the “Great Museums” series on PBS); and a Partner of Pineville Properties LLC (a commercial real estate development firm). | 843 | None |
22
Table of Contents
GARTMORE VARIABLE INSURANCE TRUST
Management Information (Unaudited)
June 30, 2005
| Name, Address and Date of Birth | Position(s) Held with the Trust and Length of Time Served1 | Principal Occupation(s) During Past 5 Years | Number of Portfolios in the Gartmore Fund Complex Overseen by Trustee | Other Directorships Held by Trustee or Nominee2 | ||||
David C. Wetmore
c/o Gartmore Global Investments, Inc. 1200 River Road, Suite 1000 Conshohocken, PA 19428
1948 | Trustee since 1995 and Chairman since February 2005 | Retired. Mr. Wetmore was formerly a Managing Director of Updata Capital, an investment banking and venture capital firm. | 84 | None |
| * | Pursuant to the Trust’s mandatory retirement policy, Ms. Hennigar is expected to retire on or about January 12, 2006. |
| 1 | The term of office length is until a trustee resigns or reaches a mandatory retirement age of 70. On March 2, 2000, the Board adopted a five-year implementation period for any Trustee 65 or older as of the adoption of this policy. Pursuant to this policy, Messrs. Duncan and Kerr retired as trustees effective as of March 12, 2005. |
| 2 | Directorships held in (1) any other investment companies registered under the 1940 Act, (2) any company with a class of securities registered pursuant to Section 12 of the Securities Exchange Act of 1934, as amended (the “Exchange Act”), or (3) any company subject to the requirements of Section 15(d) of the Exchange Act. |
| 3 | Mr. McCarthy was also an Administrative Committee Member for the Alphagen Arneb Fund, LLC, The Healthcare Fund LDC, The Leaders Long-Short Fund, LLC, and The Leaders Long-Short Fund LDC, four private investment companies (hedge funds) managed by GSA. Mr. McCarthy resigned as an Administrative Committee Member effective June 30, 2005. |
Trustees and Officers who are not Interested Persons (as defined in the 1940 Act) of the Funds received aggregate compensation of $274,882 from the Trust for the Six Months Ended June 30, 2005. Additional information regarding the Trustees and Officers may be found in the Trust’s statement of additional information, which is available without charge upon request, by calling 1-800-848-0920.
23
Table of Contents
GARTMORE VARIABLE INSURANCE TRUST
Management Information (Unaudited)
June 30, 2005
Trustees who are Interested Persons (as defined in the 1940 Act) and/or Officers of the Funds June 30, 2005
| Name, Address and Age | Position(s) Held with the and Length of Time Served1 | Principal Occupation(s) During Past Five Years | Number of the Gartmore | Other Directorships Held by Trustee2 | ||||
Paul J. Hondros
Gartmore Global Investments, Inc. 1200 River Road, Suite 1000 Conshohocken, PA 19428
1948 | Trustee since July 2000 | Mr. Hondros has been President and Chief Executive Officer of various Gartmore entities, including Gartmore Distribution Services, Inc. (“GDSI”),3 Gartmore Investor Services, Inc. (“GISI”),3 Gartmore Morley Capital Management, Inc. (“GMCM”),3 Gartmore Morley Financial Services, Inc. (“GMFS”), 3 NorthPointe Capital, LLC (“NorthPointe”),3 Gartmore Global Asset Management Trust (“GGAMT”)3,, Gartmore Global Investments, Inc. (“GGI”)3, Gartmore Mutual Fund Capital Trust (“GMFCT”)3 and Gartmore SA Capital Trust (“GSA”)3; and a Director of Nationwide Securities, Inc.3, as well as several entities within Nationwide Financial Services, Inc. | 844 | None | ||||
Arden L. Shisler
c/o Gartmore Global Investments, Inc. 1200 River Road, Suite 1000 Conshohocken, PA 19428
1941 | Trustee since February 2000 | Mr. Shisler has been a consultant since January 2003. Prior thereto, he was President and Chief Executive Officer of K&B Transport, Inc., a trucking firm. Since 1992, Mr. Shisler has also been Chairman of the Board for Nationwide Mutual Insurance Company3. | 84 | Director of Nationwide Financial Services, Inc. | ||||
Gerald J. Holland
Gartmore Global Investments, Inc. 1200 River Road, Suite 1000 Conshohocken, PA 19428
1951 | Treasurer since March 2001 | Mr. Holland is Senior Vice President – Operations for GGI3, GMFCT3, and GSA3. Prior to July 2000, Mr, Holland was Vice President for First Data Investor Services, an investment company service provider. | 84 | None |
24
Table of Contents
GARTMORE VARIABLE INSURANCE TRUST
Management Information (Unaudited)
June 30, 2005
| Name, Address and Age | Position(s) Held with the Trust and Length of Time Served1 | Principal Occupation(s) During Past 5 Years | Number of Portfolios in the Gartmore Fund Complex Overseen by Trustee | Other Directorships Held by Trustee2 | ||||
Michael A. Krulikowski
Gartmore Global Investments, Inc. 1200 River Road, Suite 1000 Conshohocken, PA 19428
1959 | Chief Compliance Officer since June 2004 | Since November 1999, Mr. Krulikowski has served as a Vice President and Chief Compliance Officer of GGI. Prior thereto, Mr. Krulikowski served as Chief Compliance Officer of 1717 Capital Management Company/Provident Mutual Insurance Company. | 84 | None | ||||
Eric E. Miller
Gartmore Global Investments, Inc. 1200 River Road, Suite 1000 Conshohocken, PA 19428
1953 | Secretary since December 2002 | Mr. Miller is Senior Vice President, Chief Counsel for GGI3, GMFCT3 and GSA3 since August 2002. From August 2000 to August 2002, Mr. Miller was a Partner with Stradley Ronan Stevens & Young, LLP. Prior to August 2000, Mr. Miller served as Senior Vice President and Deputy General Counsel at Delaware Investments. | 84 | None |
| 1 | The term of office length is until a trustee resigns or reaches a mandatory retirement age of 70. On March 2, 2000, the Board adopted a five-year implementation period for any Trustee 65 or older as of the adoption of this policy. Pursuant to this policy, Messrs. Duncan and Kerr retired as trustees effective as of March 12, 2005. |
| 2 | Directorships held in (1) any other investment companies registered under the 1940 Act, (2) any company with a class of securities registered pursuant to Section 12 of the Securities Exchange Act of 1934, as amended (the “Exchange Act”), or (3) any company subject to the requirements of Section 15(d) of the Exchange Act. |
| 3 | This position is held with an affiliated person or principal underwriter of the Trust. |
| 4 | Mr. Hondros was also an Administrative Committee Member for the Alphagen Arneb Fund, LLC, The Healthcare Fund LDC, The Leaders Long-Short Fund, LLC, and The Leaders Long-Short Fund LDC, four private investment companies (hedge funds) managed by GSA. Mr. Hondros resigned as Administrative Committee Member effective June 30, 2005. |
Federal law requires the Trust, each of its investment advisers and sub-advisers to adopt procedures for voting proxies (“Proxy Voting Guidelines”) and to provide a summary of those Proxy Voting Guidelines used to vote the securities held by the Funds. The Funds’ proxy voting policies and procedures are available without charge (i) upon request, by calling 1-800-848-0920, (ii) on the Fund’s website at www.gartmorefunds.com, or (iii) on the Securities and Exchange Commission’s website at www.sec.gov.
25
Table of Contents
Gartmore GVIT Developing Markets Fund
SemiannualReport
| | June 30, 2005 |
| Contents | ||
| 6 | Statement of Investments | |
| 10 | Statement of Assets and Liabilities | |
| 10 | Statement of Operations | |
| 11 | Statements of Changes in New Assets | |
| 12 | Financial Highlights | |
| 13 | Notes to Financial Statements | |
Commentary provided by Gartmore Global Investments, investment adviser to Gartmore Variable Insurance Trust. All opinions and estimates included in this report constitute Gartmore Global Investments’ judgment as of the date of this report and are subject to change without notice.
Statement Regarding Availability of Quarterly Portfolio Schedule.
The Gartmore Variable Insurance Trust files complete schedules of portfolio holdings for each Fund with the Securities and Exchange Commission (the “Commission”) for the first and third quarters of each fiscal year on Form N-Q. The Funds’ Forms N-Q are available on the Commission’s website at http://www.sec.gov. The Funds’ Forms N-Q may be reviewed and copied at the Commission’s Public Reference Room in Washington, DC, and information on the operation of the Public Reference Room may be obtained by calling 800-SEC-0330; and the Funds make the information on Form N-Q available to shareholders upon request without charge.
Statement Regarding Availability of Proxy Voting Record.
Information regarding how the Fund voted proxies relating to portfolio securities held during the most recent 12-month period ended June 30, 2005 is available without charge, upon request, by calling 800-848-0920, and on the Commission’s website at http://www.sec.gov.
Table of Contents
Gartmore GVIT Developing Markets Fund
For the semiannual period ended June 30, 2005, the Gartmore GVIT Developing Markets Fund returned 6.29% (Class II at NAV) versus 6.26% for its benchmark, the Morgan Stanley Capital International Emerging Markets (MSCI EM) Index. For broader comparison, the average return for the Fund’s Lipper peer category of Emerging Markets Funds was 5.88%.
An emphasis on growth stocks was one factor that enabled the Fund to keep pace with the benchmark during the reporting period, as that segment of the market had a strong run during May and much of June. On a country basis, favorable stock selection in South Korea, Turkey and South Africa also was helpful to performance. Conversely, our selections in Taiwan, China and Russia hurt performance.
Regarding sectors, the Fund’s performance was particularly helped by stock selection in financials, information technology and consumer discretionary. The Fund’s financials holdings gained materially from positions in Turkish bank DenizBank, whose share price almost doubled during the reporting period. The company benefited from several factors, including: 1) a strong management team; 2) increased interest in Turkish stocks ahead of further discussions about the country’s possible inclusion in the European Union; and 3) speculation that the bank could be a takeover candidate.
In the technology sector, the Fund’s performance was aided by Solomon Systech Ltd., a leading Asian maker of integrated circuit products used in cellular phones, handheld devices and LCD (liquid-crystal display) televisions. South Korean holdings Seoul Semiconductor Co., Ltd. and LG Electronics, a leading maker of LCDs, cellular handsets and electrical appliances, also contributed to Fund performance. In the consumer discretionary sector, Fund holding CJ Home Shopping Co., Ltd. benefited from South Korea’s ongoing recovery in domestic spending.
Sectors that detracted from Fund performance included energy and telecommunications services. Despite turning in the highest return among all of the Fund’s sectors, the Fund’s energy holdings lagged relative to the benchmark because we were under-represented in some stocks that performed well, including PetroChina Co. Ltd. and Russia-based LUKOIL. High valuations made us reluctant to take meaningful positions in these stocks and a number of other exploration and production stocks. Instead, we chose to emphasize the services side of the energy group, where we thought the fundamentals were even stronger.
In telecommunication services, the Fund was hampered by overweighted positions in lackluster performers Telekom Malaysia Berhad, SK Telecom Co., Ltd. and Vimpel-Communications, the stocks of companies based in Malaysia, South Korea and Russia, respectively.
For the balance of 2005, we anticipate maintaining our emphasis on domestic consumption in a number of emerging markets where consumer spending trends have been constructive. However, we also think technology stocks could perform well and have recently increased the Fund’s positions in some globally competitive exporters of technology based in South Korea, Taiwan and elsewhere. These purchases were funded mainly from the sale of materials stocks, many of which we believe could underperform due to new capacity coming on line and volatility in commodity prices. Overall, we like the emerging markets sector, as we believe that valuations remain attractive compared with developed markets. Profitability has improved significantly, a development we think represents the early stages of an important long-term trend.
PORTFOLIO MANAGERS: Philip Ehrmann and Peter Dalgliesh
Investing in mutual funds involves risk, including possible loss of principal.
There is no assurance that the investment objective of any fund will be achieved.
International investing involves additional risks, including currency fluctuations, differences in accounting standards, political instability and foreign regulations, all of which are magnified in emerging markets.
Morgan Stanley Capital International (MSCI) Emerging Markets IndexSM: An unmanaged, free float-adjusted, market-capitalization index that is designed to measure the performance of the stocks in emerging-country markets.
Lipper Analytical Services, Inc. is an industry research firm whose rankings are based on total return performance and do not reflect the effects of sales charges.
The Gartmore Variable Insurance Trust Funds are available only as sub-account investment options in certain variable insurance products. Accordingly, investors are unable to invest in shares of these funds outside of an insurance product. Performance information found herein reflects only the performance of these funds, and does not indicate the performance your sub-account may experience under your variable insurance contract. Performance returns assume reinvestment of all distributions. The investment return and principal value of an investment will fluctuate so that an investor’s shares, when redeemed, may be worth more or less than their original cost. Index performance is provided for comparison purposes only; the indexes shown are unmanaged and do not reflect any fees or expenses. Investors cannot invest directly in market indexes. To obtain performance information about the sub-account option under your insurance contract that invests
1
Table of Contents
Gartmore GVIT Developing Markets Fund (continued)
in one of these funds, please contact your variable insurance carrier. PAST PERFORMANCE IS NO GUARANTEE OF FUTURE RESULTS.
Commentary provided by Gartmore Global Investments. All opinions and estimates included in this report constitute Gartmore Global Investments’ judgment as of the date of this report and are subject to change without notice.
Investors should carefully consider a fund’s investment objectives, risks, fees, charges and expenses before investing any money. To obtain this and other information on Gartmore Variable Insurance Trust, please contact your variable insurance contract provider or call 800-848-0920. Please read the Trust’s prospectus carefully before investing any money.
Gartmore Funds distributed by Gartmore Distribution Services, Inc., Member NASD. 1200 River Road, Suite 1000, Conshohocken, PA 19428.
2
Table of Contents
Fund Performance | Gartmore GVIT Developing Markets Fund |
Average Annual Total Return1
(For Periods Ended June 30, 2005)
| Six months* | One year | Five years | Inception2 | |||||||||
| Class II2 | 6.29 | % | 29.56 | % | 5.30 | % | 3.12 | % |
| * | Not Annualized. |
| 1 | Not subject to any sales charges. |
| 2 | The Fund’s predecessor, the Montgomery Variable Series: Emerging Markets Fund, commenced operations on February 2, 1996. As of June 23, 2003, the Gartmore GVIT Developing Markets Fund (which previously had not commenced operations) acquired all the assets, subject to stated liabilities, of the Montgomery Variable Series: Emerging Markets Fund. At that time the Gartmore GVIT Developing Markets Fund took on the performance of the Montgomery Variable Series: Emerging Markets Fund. |
Performance of a $10,000 Investment
Investment return and principal value will fluctuate, and when redeemed, shares may be worth more or less than original cost. Past performance is no guarantee of future results and does not reflect the deduction of taxes that a shareholder would pay on fund distributions or the redemption of fund shares. Investing in mutual funds involves market risk, including loss of principal. Performance returns assume the reinvestment of all distributions.
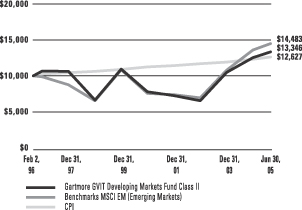
Comparative performance of $10,000 invested in Class II shares of the Gartmore GVIT Developing Markets Fund, Morgan Stanley Capital International Emerging Markets Free Index (MSCI Emerging Markets)(a), and the Consumer Price Index (CPI)(b) since inception. Unlike the Fund, the returns for these unmanaged indexes do not reflect any fees, expenses, or sales charges. Investors cannot invest directly in market indexes.
| (a) | The MSCI Emerging Markets is an unmanaged, free float-adjusted, market capitalization-weighted index that is designed to measure the performance of the stocks in emerging-country markets. |
| (b) | The CPI represents changes in prices of a basket of goods and services purchased for consumption by urban households. |
3
Table of Contents
Shareholder
Expense Example | Gartmore GVIT Developing Markets Fund |
As a shareholder of the Fund, you incur two types of costs: (1) transaction costs, including sales charges (loads) paid on purchase payments and redemption fees; and (2) ongoing costs, including investment advisory fees, administration fees, distribution fees and other Fund expenses. The examples below are intended to help you understand your ongoing costs (in dollars) of investing in the Fund and to compare these costs with the ongoing costs of investing in other mutual funds. Per SEC requirements, the examples assume that you had a $1,000 investment in the Class at the beginning of the reporting period, January 1, 2005, and continued to hold your shares at the end of the reporting period, June 30, 2005.
Actual Expenses
For each Class of the Fund in the table below, the first line provides information about actual account values and actual expenses. You may use the information in this line, together with the amount you invested, to estimate the expenses that you paid over the period. Simply divide your account value by $1,000 (for example, an $8,600 account value divided by $1,000 = 8.6), then multiply the result by the number in the first line of each Class under the heading entitled “Expenses Paid During Period” to estimate the expenses you paid on your account during the period.
Hypothetical Example for Comparison Purposes
The second line of each Class in the table below provides information about hypothetical account values and hypothetical expenses based on the Class’ actual expense ratio and an assumed rate of return of 5% per year before expenses, which is not the Class’ actual return. The hypothetical account values and expenses may not be used to estimate the actual ending account balance or expenses you paid for the period. You may use this information to compare the ongoing costs of investing in the Class of the Fund and other funds. To do so, compare this 5% hypothetical example with the 5% hypothetical examples that appear in the shareholder reports of the other funds.
Please note that the expenses shown in the table are meant to highlight your ongoing costs only and do not reflect any transaction costs, such as sales charges (loads) or redemption fees. Therefore, the second line for each Class in the table is useful in comparing ongoing costs only, and will not help you determine the relative total costs of owning different funds. In addition, if these transaction costs were included, your costs would have been higher. The examples also assume all dividends and distributions have been reinvested.
| Beginning Account Value, January 1, 2005 | Ending Account Value, June 30, 2005 | Expenses Paid During Period* | Annualized Expense Ratio* | ||||||||||
| Developing Markets Fund | |||||||||||||
Class II | Actual | $ | 1,000 | $ | 1,063 | $ | 8.90 | 1.74% | |||||
| Hypothetical1 | $ | 1,000 | $ | 1,016 | $ | 8.74 | 1.74% | ||||||
| * | Expenses are equal to the Fund’s annualized expense ratio multiplied by the average account value over the period multiplied by 181/365 (to reflect the one-half year period). The expense ratio presented represents a six month, annualized ratio in accordance with SEC guidelines. |
| 1 | Represents the hypothetical 5% return before expenses. |
4
Table of Contents
Portfolio Summary
June 30, 2005 | Gartmore GVIT Developing Markets Fund |
The SEC adopted a requirement that Funds present their portfolio holdings in a table, chart or graph format in their annual and semiannual reports to shareholders, whether or not a statement of investments is utilized. The following tables, which present portfolio holdings as a percentage of net assets, are provided in compliance with this requirement.
| Asset Allocation | ||
| Common Stocks | 90.0% | |
| Participation Notes | 5.7% | |
| Cash Equivalents | 4.6% | |
| Foreign Bonds | 0.0% | |
| Other Investments* | 1.3% | |
| Liabilities in excess of other assets** | -1.6 % | |
| 100.0% | ||
| Top Holdings*** | ||
| Samsung Electronics | 4.4% | |
| Au Optronics Corp. | 2.6% | |
| Denizbank AS | 2.2% | |
| Companhia Vale do Rio Doce, Class A | 2.0% | |
| Surgutneftgaz ADR | 2.0% | |
| China Telecom Corp. Ltd. | 1.8% | |
| Solomon Systech International Ltd. | 1.8% | |
| Petroleo Brasileiro SA | 1.8% | |
| Shin Kong Financial Holding Co., Ltd. | 1.7% | |
| Oil and Natural Gas Corp. Ltd., 10/31/05 | 1.6% | |
| Other Holdings | 78.1% | |
| 100.0% | ||
| Top Industries | ||
| Oil & Gas | 8.9% | |
| Electronics | 8.8% | |
| Banking | 8.4% | |
| Telecommunications | 8.2% | |
| Financial Services | 6.8% | |
| Semiconductors | 5.8% | |
| Retail | 5.0% | |
| Metals & Mining | 3.5% | |
| Diversified Operations | 2.7% | |
| Brewery | 2.3% | |
| Other Industries | 39.6% | |
| 100.0% | ||
| * | Includes value of collateral received from securities lending. |
| ** | Includes value of collateral owed from securities lending. |
| *** | For purpose of listing top holdings, repurchase agreements are considered cash equivalents and are included as part of Other Holdings. |
5
Table of Contents
GARTMORE VARIABLE INSURANCE TRUST
GARTMORE GVIT DEVELOPING MARKETS FUND
Statement of Investments — June 30, 2005 (Unaudited)
| Shares or Principal Amount | Value | ||||
| COMMON STOCKS (90.0%) | |||||
| ARGENTINA (0.9%) | |||||
| Steel (0.9%) | |||||
| Tenaris SA | 22,300 | $ | 1,745,421 | ||
| BERMUDA (1.4%) | |||||
| Television (1.4%) | |||||
| Central European Media Enterprises Ltd. (b) | 54,500 | 2,636,710 | |||
| BRAZIL (12.1%) | |||||
| Banking (1.5%) | |||||
| Banco Itau Holding Financeira SA ADR | 30,400 | 2,812,000 | |||
| Brewery (1.1%) | |||||
| Ambev Cia Bebid (b) | 863,260 | 222,299 | |||
| Ambev Cia Bebid Preferred | 5,675,300 | 1,761,973 | |||
| 1,984,272 | |||||
| Electric Utility (0.9%) | |||||
| Companhia Energetica de Minas Gerais | 55,256,600 | 1,759,674 | |||
| Insurance (0.8%) | |||||
| Porto Seguro SA (b) | 164,100 | 1,479,013 | |||
| Metals & Mining (2.0%) | |||||
| Companhia Vale do Rio Doce, Class A | 147,670 | 3,755,128 | |||
| Oil & Gas (3.3%) | |||||
| Petroleo Brasileiro SA | 64,100 | 3,345,304 | |||
| Petroleo Brasileiro SA ADR | 56,434 | 2,941,904 | |||
| 6,287,208 | |||||
| Paper Products (0.7%) | |||||
| Klabin SA | 755,143 | 1,306,106 | |||
| Retail (0.7%) | |||||
| Companhia Brasileira de Distribuicao Pao de Acucar ADR | 61,400 | 1,221,246 | |||
| Telecommunications (1.1%) | |||||
| Tele Norte Leste Participacoes SA ADR | 124,900 | 2,079,585 | |||
| 22,684,232 | |||||
| Shares or Principal Amount | Value | ||||
| COMMON STOCKS (continued) | |||||
| CHINA (6.1%) | |||||
| Coal Mining (0.7%) | |||||
| Yanzhou Coal Mining Co., Ltd. (c) | 1,590,400 | $ | 1,254,339 | ||
| Manufacturing (0.9%) | |||||
| Shanghai Electric Group Co., Ltd. (b) | 7,766,000 | 1,759,049 | |||
| Oilfield Services & Equipment (0.9%) | |||||
| China Oilfield Services Ltd. (c) | 4,474,000 | 1,647,455 | |||
| Semiconductors (1.8%) | |||||
| Solomon Systech International Ltd. (c) | 9,528,000 | 3,359,625 | |||
| Telecommunications (1.8%) | |||||
| China Telecom Corp. Ltd. | 9,662,000 | 3,450,882 | |||
| 11,471,350 | |||||
| HUNGARY (1.0%) | |||||
| Oil & Gas (1.0%) | |||||
| MOL Magyar Olaj-es Gazipari | 21,492 | 1,803,508 | |||
| INDIA (0.7%) | |||||
| Financial Services (0.7%) | |||||
| ICICI Bank Ltd. ADR | 58,447 | 1,277,067 | |||
| INDONESIA (0.9%) | |||||
| Coal Mining (0.9%) | |||||
| PT Bumi Resources (b) | 20,848,400 | 1,770,638 | |||
| ISRAEL (1.8%) | |||||
| Electronic Measuring Instruction (0.9%) | |||||
| Orbotech Ltd. (b) | 77,400 | 1,663,326 | |||
| Software & Computer Services (0.9%) | |||||
| Retalix Ltd. (b) | 82,400 | 1,771,600 | |||
| 3,434,926 | |||||
| KOREA (17.1%) | |||||
| Automotive (1.2%) | |||||
| Hyundai Motor Co. | 39,500 | 2,176,044 | |||
| Construction (1.5%) | |||||
| Hyundai Development Co. | 50,400 | 1,169,788 | |||
| Kumho Industrial Co., Ltd. | 88,800 | 1,567,988 | |||
| 2,737,776 | |||||
6
Table of Contents
GARTMORE VARIABLE INSURANCE TRUST
GARTMORE GVIT DEVELOPING MARKETS FUND
Statement of Investments — June 30, 2005 (Unaudited) (continued)
| Shares or Principal Amount | Value | ||||
| COMMON STOCKS (continued) | |||||
| KOREA (continued) | |||||
| Diversified Operations (1.3%) | |||||
| GS Holdings Corp. | 102,600 | $ | 2,410,794 | ||
| Electronic Components (1.7%) | |||||
| Hynix Semiconductor, Inc. (b) | 102,100 | 1,652,972 | |||
| Seoul Semiconductor Co., Ltd. | 49,645 | 1,482,182 | |||
| 3,135,154 | |||||
| Electronics (5.3%) | |||||
| KH Vatec Co., Ltd. | 55,900 | 1,068,738 | |||
| Samsung Electronics | 17,476 | 8,276,953 | |||
| Samsung Electronics GDR | 3,900 | 633,750 | |||
| 9,979,441 | |||||
| Financial Services (3.1%) | |||||
| Korea Investment Holdings Co., Ltd. | 99,900 | 1,774,561 | |||
| LG Card Co., Ltd. (b) | 50,600 | 1,684,433 | |||
| Woori Finance Holdings Co., Ltd. | 240,740 | 2,374,937 | |||
| 5,833,931 | |||||
| Retail (2.4%) | |||||
| CJ Home Shopping | 23,900 | 1,779,381 | |||
| Hyundai Department Store Co., Ltd. | 57,200 | 2,618,507 | |||
| 4,397,888 | |||||
| Telecommunication Services (0.6%) | |||||
| KT Freetel Co., Ltd. | 50,500 | 1,163,606 | |||
| 31,834,634 | |||||
| MALAYSIA (3.5%) | |||||
| Foreign Banking (0.1%) | |||||
| Commerce Asset Holdings Berhad | 145,100 | 192,592 | |||
| Real Estate (0.9%) | |||||
| SP Setia Berhad | 1,640,300 | 1,761,396 | |||
| Telecommunications (1.2%) | |||||
| Telekom Malaysia Berhad | 821,300 | 2,157,343 | |||
| Transportation (0.7%) | |||||
| Malaysai & Services Holdings Berhad (b) | 1,446,500 | 1,330,305 | |||
| Shares or Principal Amount | Value | ||||
| COMMON STOCKS (continued) | |||||
| MALAYSIA (continued) | |||||
| Transportation-Marine (0.6%) | |||||
| Malaysia International Shipping Corp. | 231,500 | $ | 1,089,503 | ||
| 6,531,139 | |||||
| MEXICO (7.1%) | |||||
| Building Materials (1.2%) | |||||
| Cemex SA ADR | 50,900 | 2,159,178 | |||
| Diversified Operations (0.8%) | |||||
| Grupo Carso SA de CV | 752,142 | 1,456,391 | |||
| Financial Services (1.3%) | |||||
| Grupo Financiero Banorte SA de CV | 390,400 | 2,580,377 | |||
| Real Estate (0.9%) | |||||
| Urbi, Desarrolloas Urbanos SA de CV (b) | 291,800 | 1,606,774 | |||
| Retail (1.0%) | |||||
| Wal-Mart de Mexico SA de CV | 464,700 | 1,892,197 | |||
| Steel Manufacturing Products (0.7%) | |||||
| Industrias CH SA (b) | 658,700 | 1,401,163 | |||
| Telecommunications (1.2%) | |||||
| America Movil SA de CV ADR | 37,000 | 2,205,570 | |||
| 13,301,650 | |||||
| NETHERLANDS (1.1%) | |||||
| Retail Food Products (1.1%) | |||||
| Pyaterochka Holding NV GDR (b) | 149,063 | 2,146,507 | |||
| POLAND (0.3%) | |||||
| Real Estate Development (0.3%) | |||||
| Globe Trade Centre SA (b) | 14,200 | 480,506 | |||
| RUSSIA (5.5%) | |||||
| Automobile Manufacturers (0.7%) | |||||
| JSC Severstal-Avto (b) | 92,200 | 1,336,900 | |||
| Brewery (1.2%) | |||||
| Efes Breweries International GDR (b) | 66,400 | 2,247,640 | |||
| Metals (0.6%) | |||||
| Norilsk Nickel ADR | 17,200 | 1,049,200 | |||
7
Table of Contents
GARTMORE VARIABLE INSURANCE TRUST
GARTMORE GVIT DEVELOPING MARKETS FUND
Statement of Investments — June 30, 2005 (Unaudited) (continued)
| Shares or Principal Amount | Value | ||||
| COMMON STOCKS (continued) | |||||
| RUSSIA (continued) | |||||
| Oil & Gas (2.0%) | |||||
| Surgutneftgaz ADR | 97,600 | $ | 3,647,312 | ||
| Telecommunications (1.0%) | |||||
| AO VimpelCom ADR (b) | 57,600 | 1,960,128 | |||
| 10,241,180 | |||||
| SOUTH AFRICA (6.7%) | |||||
| Banking (1.5%) | |||||
| ABSA Group Ltd. | 221,655 | 2,741,673 | |||
| Diversified Operations (0.6%) | |||||
| Barloworld Ltd. | 80,100 | 1,140,694 | |||
| Foreign Banking (0.7%) | |||||
| Standard Bank Group Ltd. | 137,000 | 1,326,200 | |||
| Metals & Mining (0.7%) | |||||
| Anglogold Ashanti Ltd. | 37,600 | 1,345,462 | |||
| Oil & Gas (0.9%) | |||||
| Sasol Ltd. | 63,400 | 1,713,155 | |||
| Retail (0.9%) | |||||
| Lewis Group Ltd. | 320,938 | 1,758,382 | |||
| Telecommunications (1.4%) | |||||
| MTN Group Ltd. | 381,763 | 2,528,744 | |||
| 12,554,310 | |||||
| TAIWAN (16.7%) | |||||
| Banking (1.7%) | |||||
| E.Sun Financial Holding Co., Ltd. (b) | 2,047,000 | 1,635,653 | |||
| TA Chong Bank Ltd. (b) | 5,024,972 | 1,561,194 | |||
| 3,196,847 | |||||
| Chemicals (1.4%) | |||||
| Taiwan Fertilizer Co., Ltd. (b) | 1,928,000 | 2,541,016 | |||
| Computer (2.0%) | |||||
| Compal Electronics, Inc. | 2,104,000 | 2,083,349 | |||
| Foxconn Technology Co., Ltd. (b) | 438,000 | 1,649,795 | |||
| 3,733,144 | |||||
| Electronics (3.5%) | |||||
| Au Optronics Corp. | 2,954,000 | 4,917,441 | |||
| Ichia Technologies, Inc. (b) | 1,012 | 1,026 | |||
| MediaTek, Inc. | 190,000 | 1,641,298 | |||
| 6,559,765 | |||||
| Shares or Principal Amount | Value | ||||
| COMMON STOCKS (continued) | |||||
| TAIWAN (continued) | |||||
| Financial Services (1.7%) | |||||
| Shin Kong Financial Holding Co., Ltd. (b) | 3,214,000 | $ | 3,230,892 | ||
| Photographic Products (0.9%) | |||||
| Largan Precision Co., Ltd. | 251,000 | 1,647,470 | |||
| Semiconductors (4.0%) | |||||
| Powerchip Semiconductor Corp. | 1,947,000 | 1,357,443 | |||
| Taiwan Semiconductor Manufacturing Co., Ltd. | 1,339,846 | 2,333,517 | |||
| Taiwan Semiconductor Manufacturing Co., Ltd. ADR | 254,670 | 2,322,590 | |||
| United Microelectronics Corp. ADR (b) | 331,300 | 1,361,643 | |||
| 7,375,193 | |||||
| Steel (0.7%) | |||||
| China Steel Corp. (b) | 1,340,000 | 1,351,661 | |||
| Textiles (0.8%) | |||||
| Far Eastern Textile Co., Ltd. | 2,159,092 | 1,536,408 | |||
| 31,172,396 | |||||
| THAILAND (3.4%) | |||||
| Banking (1.4%) | |||||
| Kasikornbank Public Co., Ltd. | 1,866,600 | 2,563,595 | |||
| Chemicals (0.9%) | |||||
| Aromatics Public Co., Ltd. NVDR | 1,393,600 | 1,727,627 | |||
| Electric Utility (0.6%) | |||||
| Ratchaburi Electricity Generating Holding Public Co., Ltd | 1,135,200 | 1,109,988 | |||
| Telecommunications (0.5%) | |||||
| Shin Corporation Public Co., Ltd. | 1,042,000 | 941,409 | |||
| 6,342,619 | |||||
| TURKEY (2.9%) | |||||
| Banking (2.2%) | |||||
| Denizbank AS (b) | 1,017,539 | 4,131,255 | |||
| Financial Investments (0.7%) | |||||
| Sabanci Holding AS | 329,450 | 1,261,627 | |||
| 5,392,882 | |||||
8
Table of Contents
GARTMORE VARIABLE INSURANCE TRUST
GARTMORE GVIT DEVELOPING MARKETS FUND
Statement of Investments — June 30, 2005 (Unaudited) (continued)
| Shares or Principal Amount | Value | |||||
| COMMON STOCKS (continued) | ||||||
| UNITED KINGDOM (0.8%) | ||||||
| Metals & Mining (0.8%) | ||||||
| Anglo American PLC | 61,200 | $ | 1,433,698 | |||
| Total Common Stocks | 168,255,373 | |||||
| FOREIGN BOND (0.0%) | ||||||
| BRAZIL (0.0%) | ||||||
| Metals & Mining (0.0%) | ||||||
| Comp Vale DO Rio Doce, 0.00%, 09/29/49 | 20,000 | 0 | ||||
| Total Foreign Bond | 0 | |||||
| PARTICIPATION NOTES (5.7%) | ||||||
| INDIA (5.7%) | ||||||
| Banking (0.1%) | ||||||
| ICICI Bank Ltd., 03/30/07 | $ | 2,742 | 26,872 | |||
| ICICI Bank Ltd., 12/21/07 | 14,035 | 137,543 | ||||
| 164,415 | ||||||
| Computer Service (1.0%) | ||||||
| Tata Consultancy Services Ltd. | 59,100 | 1,847,466 | ||||
| Engineering Services (1.2%) | ||||||
| Larsen & Toubro Ltd. | 87,300 | 2,275,038 | ||||
| Oil & Gas (1.7%) | ||||||
| Oil and Natural Gas Corp. Ltd., 10/31/05 | 129,400 | 3,060,310 | ||||
| Telecommunication Services (0.8%) | ||||||
| Bharti Televentures Ltd. (b) | 265,300 | 1,483,027 | ||||
| Tobacco (0.9%) | ||||||
| ITC Ltd., 04/07/30 | 45,900 | 1,755,675 | ||||
| Total Participation Notes | 10,585,931 | |||||
| Shares or Principal Amount | Value | ||||||
| CASH EQUIVALENTS (4.6%) | |||||||
| Investments in repurchase agreements (collateralized by AA Corporate Bonds in a joint trading account at 3.49%, dated 06/30/05, due 07/01/05, repurchase price $8,665,336) | $ | 8,664,496 | $ | 8,664,496 | |||
| Total Cash Equivalents | 8,664,496 | ||||||
| SHORT-TERM SECURITIES HELD AS COLLATERAL FOR SECURITIES LENDING (1.3%) | |||||||
| Pool of short-term securities for Gartmore Variable Trust Funds — note 2 (Securities Lending) | 2,356,202 | 2,356,202 | |||||
| Total Short-Term Securities Held as Collateral for Securities Lending | 2,356,202 | ||||||
| Total Investments (Cost $174,108,791) (a) — 101.6% | 189,862,002 | ||||||
| Liabilities in excess of other assets — (1.6%) | (2,994,856 | ) | |||||
| NET ASSETS — 100.0% | $ | 186,867,146 | |||||
| (a) | See Notes to Statement of Investments for tax unrealized appreciation (depreciation) of securities. |
| (b) | Denotes a non-income producing security |
| (c) | Fair valued securities |
Securities denominated in foreign currencies are shown at the U.S. dollar cost and value.
| ADR | American Depositary Receipt |
| GDR | Global Depositary Receipt |
| PREF | Preferred Stock |
| NVDR | Non Voting Depository Receipt |
At June 30, 2005, the Fund’s open forward foreign currency contracts were as follows:
| Currency | Delivery Date | Contract Value | Market Value | Unrealized Appreciation (Depreciation) | |||||||
| Long Contract: | |||||||||||
Hong Kong Dollar | 07/05/05 | $ | 301,968 | $ | 302,090 | $ | 122 | ||||
South African Rand | 07/06/05 | 95,148 | 95,288 | 140 | |||||||
| Total Long Contracts: | $ | 397,116 | $ | 397,378 | $ | 262 | |||||
See notes to financial statements.
9
Table of Contents
GARTMORE VARIABLE INSURANCE TRUST
GARTMORE GVIT DEVELOPING MARKETS FUND
Statement of Assets and Liabilities
June 30, 2005 (Unaudited)
Assets: | ||||
Investments, at value (cost $165,444,295) | $ | 181,197,506 | ||
Repurchase agreements, at cost and value | 8,664,496 | |||
Total Investments | 189,862,002 | |||
Foreign currencies, at value (cost $1,162,862) | 1,159,964 | |||
Interest and dividends receivable | 424,579 | |||
Receivable for investments sold | 48,708 | |||
Unrealized appreciation on forward foreign currency contracts | 262 | |||
Reclaims receivable | 4,916 | |||
Prepaid expenses and other assets | 3,425 | |||
Total Assets | 191,503,856 | |||
Liabilities: | ||||
Payable to custodian | 560,816 | |||
Payable for investments purchased | 1,389,509 | |||
Payable for return of collateral received for securities on loan | 2,356,202 | |||
Accrued expenses and other payables: | ||||
Investment advisory fees | 173,638 | |||
Fund administration and transfer agent fees | 1,667 | |||
Distribution fees | 37,747 | |||
Administrative servicing fees | 92,693 | |||
Other | 24,438 | |||
Total Liabilities | 4,636,710 | |||
Net Assets | $ | 186,867,146 | ||
Represented by: | ||||
Capital | $ | 171,605,518 | ||
Accumulated net investment income (loss) | 224,308 | |||
Accumulated net realized gains (losses) from investment and foreign currency transactions | (731,691 | ) | ||
Net unrealized appreciation (depreciation) on investments and translation of assets and liabilities denominated in foreign currencies | 15,769,011 | |||
Net Assets | $ | 186,867,146 | ||
Net Assets: | ||||
Class II Shares | $ | 186,867,146 | ||
Shares outstanding (unlimited number of shares authorized): | ||||
Class II Shares | 17,699,733 | |||
Net asset value and offering price per share:* | ||||
Class II Shares | $ | 10.56 |
| * | Not subject to a front-end sales charge. |
For the Six Months Ended June 30, 2005 (Unaudited)
Investment Income: | ||||
Interest income | $ | 64,173 | ||
Dividend income (net of foreign withholding tax of $182,051) | 2,726,346 | |||
Income from securities lending | 5,310 | |||
Total Income | 2,795,829 | |||
Expenses: | ||||
Investment advisory fees | 1,124,822 | |||
Fund administration and transfer agent fees | 69,990 | |||
Distribution fees Class II Shares | 244,526 | |||
Administrative servicing fees | 214,291 | |||
Other** | 52,514 | |||
Total Expenses | 1,706,143 | |||
Net Investment Income (Loss) | 1,089,686 | |||
REALIZED/UNREALIZED GAINS (LOSSES) ON INVESTMENTS: | ||||
Net realized gains (losses) on investment transactions | 16,995,473 | |||
Net realized gains (losses) on foreign currency transactions | (252,687 | ) | ||
Net realized gains (losses) on investment and foreign currency transactions | 16,742,786 | |||
Net change in unrealized appreciation/depreciation on investments and translation of assets and liabilities denominated in foreign currencies | (9,218,794 | ) | ||
Net realized/unrealized gains (losses) on investments and foreign currencies | 7,523,992 | |||
CHANGE IN NET ASSETS RESULTING FROM OPERATIONS | $ | 8,613,678 | ||
| ** | Other expenses may include the following fees: audit, custody, insurance, legal, printing, trustee, and out-of-pocket expenses. |
See notes to financial statements.
10
Table of Contents
GARTMORE VARIABLE INSURANCE TRUST
GARTMORE GVIT DEVELOPING MARKETS FUND
Statement of Changes in Net Assets
| Six Months Ended June 30, 2005 | Year Ended December 31, 2004 | |||||||
| (Unaudited) | ||||||||
From Investment Activities: | ||||||||
Operations: | ||||||||
Net investment income (loss) | $ | 1,089,686 | $ | 1,092,831 | ||||
Net realized gains (losses) on investment and foreign currency transactions | 16,742,786 | 32,137,377 | ||||||
Net change in unrealized appreciation/depreciation on investments and translation of assets and liabilities denominated in foreign currencies | (9,218,794 | ) | (9,596,336 | ) | ||||
Change in net assets resulting from operations | 8,613,678 | 23,633,872 | ||||||
Distributions to Class II shareholders from: | ||||||||
Net investment income | (887,593 | ) | (869,653 | ) | ||||
Net realized gains on investments | (29,349,917 | ) | (6,076,649 | ) | ||||
Change in net assets from shareholder distributions | (30,237,510 | ) | (6,946,302 | ) | ||||
Change in net assets from capital transactions | 13,592,642 | 12,610,182 | ||||||
Change in net assets | (8,031,190 | ) | 29,297,752 | |||||
Net Assets: | ||||||||
Beginning of period | 194,898,336 | 165,600,584 | ||||||
End of period | $ | 186,867,146 | $ | 194,898,336 | ||||
CAPITAL TRANSACTIONS: | ||||||||
Class II Shares | ||||||||
Proceeds from shares issued | $ | 70,759,515 | $ | 139,079,878 | ||||
Dividends reinvested | 30,237,493 | 6,946,293 | ||||||
Cost of shares redeemed | (87,404,366 | ) | (133,415,989 | ) | ||||
Change in net assets from capital transactions | $ | 13,592,642 | $ | 12,610,182 | ||||
SHARE TRANSACTIONS: | ||||||||
Class II Shares | ||||||||
Issued | 5,755,834 | 12,668,914 | ||||||
Reinvested | 2,851,999 | 677,427 | ||||||
Redeemed | (7,377,682 | ) | (12,813,855 | ) | ||||
| 1,230,151 | 532,486 | |||||||
See notes to financial statements.
11
Table of Contents
GARTMORE VARIABLE INSURANCE TRUST
FINANCIAL HIGHLIGHTS
Selected Data for Each Share of Capital Outstanding
Gartmore GVIT Developing Markets Fund
| Investment Activities | Distributions | Ratios/Supplemental Data | ||||||||||||||||||||||||||||||||||||||||||
| Net Asset Value, Beginning of Period | Net Investment Income (Loss) | Net Realized and Unrealized Gains (Losses) on Investments | Total from Investment Activities | Net Investment Income | Net Realized Gains | Total Distributions | Net Asset Value, End of Period | Total Return | Net Assets at End of Period (000s) | Ratio of Expenses to Average Net Assets | Ratio of Net Investment Income (Loss) to Average Net Assets | Ratio of Expenses (Prior to Reimbursements) to Average Net Assets(a) | Ratio of Net Investment Income (Loss) (Prior to Reimbursements) to Average Net Assets(a) | Portfolio Turnover | ||||||||||||||||||||||||||||||
Class II Shares | ||||||||||||||||||||||||||||||||||||||||||||
Year Ended December 31, 2000 | $ | 10.86 | (0.03 | ) | (3.07 | ) | (3.10 | ) | — | — | — | $ | 7.76 | (28.55% | ) | $ | 100,730 | 1.56% | (0.34% | ) | 1.81% | (0.59% | ) | 103.00% | ||||||||||||||||||||
Year Ended December 31, 2001 | $ | 7.76 | 0.08 | (0.62 | ) | (0.54 | ) | — | — | — | $ | 7.22 | (6.96% | ) | $ | 100,899 | 1.59% | 1.19% | 1.67% | 1.11% | 118.00% | |||||||||||||||||||||||
Year Ended December 31, 2002 | $ | 7.22 | 0.03 | (0.73 | ) | (0.70 | ) | (0.01 | ) | — | (0.01 | ) | $ | 6.51 | (9.68% | ) | $ | 75,321 | 1.60% | 0.44% | 1.68% | 0.36% | 97.00% | |||||||||||||||||||||
Year Ended December 31, 2003(b) | $ | 6.51 | 0.06 | 3.83 | 3.89 | (0.01 | ) | — | (0.01 | ) | $ | 10.39 | 59.70% | $ | 165,601 | 1.64% | 0.75% | 1.80% | 0.60% | 167.45% | ||||||||||||||||||||||||
Year Ended December 31, 2004 | $ | 10.39 | 0.07 | 1.90 | 1.97 | (0.06 | ) | (0.47 | ) | (0.53 | ) | $ | 11.83 | 19.78% | $ | 194,898 | 1.78% | 0.69% | (c | ) | (c | ) | 167.98% | |||||||||||||||||||||
Six Months Ended June 30, 2005 (Unaudited) | $ | 11.83 | 0.07 | 0.68 | 0.75 | (0.06 | ) | (1.96 | ) | (2.02 | ) | $ | 10.56 | 6.29% | (d) | $ | 186,867 | 1.74% | (e) | 1.11% | (e) | (c | ) | (c | ) | 81.04% | ||||||||||||||||||
| (a) | During the period certain fees were waived and/or reimbursed. If such waivers/reimbursements had not occurred, the ratios would have been as indicated. |
| (b) | Upon reorganization on June 23, 2003, the existing shares of the Fund were designated Class II shares. |
| (c) | There were no fee reductions during the period. |
| (d) | Not annualized. |
| (e) | Annualized. |
See notes to financial statements.
12
Table of Contents
GARTMORE VARIABLE INSURANCE TRUST
NOTES TO FINANCIAL STATEMENTS (Unaudited)
June 30, 2005
1. Organization
Gartmore Variable Insurance Trust (“GVIT” or the “Trust”) is an open-end management investment company, organized under the laws of Delaware by an amended and restated Agreement and Declaration of Trust, dated October 28, 2004, as amended to date. The Trust, originally created under the laws of Massachusetts as a Massachusetts business trust pursuant to a Declaration of Trust dated, as of June 30, 1981, as subsequently amended, redomesticated as a Delaware Statutory Trust after the close of trading on April 29, 2005, and is registered under the Investment Company Act of 1940, as amended (the “1940 Act”). The redomestication is a change in statutory status and does not affect the operations of the Trust. As of June 30, 2005, the Trust had authorized an unlimited number of shares of beneficial interest (“shares”) without par value. The Trust currently offers shares to life insurance company separate accounts to fund the benefits under variable life insurance or annuity policies. The Trust currently offers shares to life insurance company separate accounts to fund the benefits under variable life insurance or annuity policies. To date, the separate accounts of Nationwide Life Insurance Company and Nationwide Life and Annuity Insurance Company (collectively, “Nationwide”), American Skandia Life Insurance Cooperation, Peoples Benefit Life Insurance Company, a subsidiary of Aegon, and Great West Life & Annuity Insurance Company have purchased shares of the Gartmore GVIT Developing Markets Fund (the “Fund”). The Trust operates thirty-one (31) separate series, or mutual funds, each with its own investment objectives and strategies. This report contains the financial statements and financial highlights of the Fund.
Under the Trust’s organizational documents, the Trust’s officers and trustees are indemnified against certain liabilities arising out of the performance of their duties to the Trust. In addition, the Trust has entered into Indemnification Agreements with the Trust’s trustees and certain officers covering similar liabilities. In addition, in the normal course of business, the Trust enters into contracts with its vendors and others that provide for general indemnifications. The Trust’s maximum exposure under these arrangements is unknown, as this would involve future claims that may be made against the Trust. Based on experience, however, the Trust expects that risk of loss to be remote.
2. Summary of Significant Accounting Policies
The following is a summary of significant accounting policies followed by the Fund in the preparation of its financial statements. The policies are in conformity with accounting principles generally accepted in the United States of America (“GAAP”). The preparation of financial statements requires management to make estimates and assumptions that affect the reported amounts of assets and liabilities, the disclosure of contingent assets and liabilities at the date of the financial statements and the reported amounts of income and expenses for the period. Actual results could differ from those estimates.
| (a) | Security Valuation |
Securities for which market quotations are readily available are valued at current market value as of “Valuation Time.” Valuation Time is as of the close of regular trading on the New York Stock Exchange (usually 4 p.m. Eastern time). Equity securities are valued at the last quoted sale price or, if there is no sale price, the last quoted bid price provided by an independent pricing service approved by the Trust’s Board of Trustees. Securities traded on NASDAQ are valued at the NASDAQ official closing price. Prices are taken from the primary market or exchange in which each security trades. Most securities listed on a foreign exchange are valued either at fair value (see description below) or at the last sale price at the close of the exchange on which the security is principally traded. Foreign securities, currencies, and other assets and liabilities denominated in foreign currencies are translated into U.S. dollars at the exchange rate of said currencies against the U.S. Dollar, as of Valuation Time, as provided by an independent pricing service approved by the Board of Trustees.
Securities for which market quotations are not readily available, or for which an independent pricing service does not provide a value or provides a value that does not represent fair value in the judgment of the Fund’s investment adviser or designee, are valued at fair value under procedures approved by the Trust’s Board of Trustees. The “Fair Value” of these securities is determined in good faith by taking into account relevant factors and surrounding circumstances. Methods utilized to obtain a “Fair Value” may include the following non-exclusive list of SEC-acceptable methods: (i) a multiple of earnings; (ii) the discount from market value of a similar, freely traded security; (iii) the yield-to-maturity for debt issues; or (iv) a consolidation of the methods. The Gartmore Fair Value Committee considers a non-exclusive list of factors to arrive at the
13
Table of Contents
GARTMORE VARIABLE INSURANCE TRUST
NOTES TO FINANCIAL STATEMENTS (Unaudited) (Continued)
June 30, 2005
appropriate method upon determining “Fair Value.” For example, fair value determinations are required for securities whose value is affected by a “significant” event that materially affects the value of a domestic or foreign security which occurs subsequent to the time of the close of the principal market on which such domestic or foreign security trades and before the Valuation Time (i.e., a “subsequent event”). Typically, this will involve events occurring after the close of a foreign market on which a security trades and before the next Valuation Time.
The Fund values foreign securities at fair value in the circumstances described below. Generally, trading in foreign securities markets is completed each day at various times prior to the Valuation Time. Due to the time differences between the closings of the relevant foreign securities exchanges and the Valuation Time for the Fund, the Fund will fair value its foreign investments when it is determined that the market quotations for the foreign investments either are not readily available or are unreliable and, therefore, do not represent fair value. When the fair value prices are utilized, these prices will attempt to reflect the impact of the U.S. financial markets’ perceptions and trading activities on the Fund’s foreign investments since the last closing prices of the foreign investments were calculated on their primary foreign securities markets or exchanges. For these purposes, the Board of Trustees of the Trust has determined that movements in relevant indices or other appropriate market indicators, after the close of the foreign securities exchanges, may demonstrate that market quotations are unreliable, and may trigger fair value pricing for certain securities. Consequently, fair valuation of portfolio securities may occur on a daily basis. In determining fair value prices, the Trust utilizes data furnished by an independent pricing service (and that data draws upon, among other information, the market values of foreign investments). The fair value prices of portfolio securities generally will be used when it is determined that the use of these prices will have a material impact on the net asset value of the Fund. When the Fund uses fair value pricing, the values assigned to the Fund’s foreign investments may not be the quoted or published prices of the investments on their primary markets or exchanges.
| (b) | Repurchase Agreements |
The Fund may enter into repurchase agreements with an entity which is a member of the Federal Reserve System or which is a “primary dealer” (as designated by the Federal Reserve Bank of New York) in U.S. Government obligations. The repurchase price generally equals the price paid by the Fund plus interest negotiated on the basis of current short-term rates, which may be more or less than the rate on the underlying portfolio securities. The seller under a repurchase agreement is required to maintain the value of the collateral held pursuant to the agreement at a market value equal to or greater than the repurchase price (including accrued interest). Collateral subject to repurchase agreements is held by the Fund’s custodian or another qualified sub-custodian or in the Federal Reserve/Treasury book-entry system. If the counterparty defaults and the fair value of the collateral declines, realization of the collateral by the Fund may be delayed or limited. The Fund may transfer uninvested cash balances into a pooled cash account. These balances are invested in one or more repurchase agreements, which are fully collateralized by AA-rated Corporate Bonds with the counterparties of CS First Boston and Nomura Securities.
| (c) | Foreign Currency Transactions |
The accounting records of the Fund are maintained in U.S. dollars. Foreign currency amounts are translated into U.S. dollars at the current rate of exchange to determine the value of investments, assets and liabilities. The Fund may enter into foreign currency contracts in connection with purchases or sales of securities denominated in a foreign currency. Purchases and sales of securities, and income and expenses, are translated at the prevailing rate of exchange on the respective date of these transactions. The Fund does not isolate that portion of the results of operations resulting from changes in foreign exchange rates on investments from fluctuations arising from changes in market prices of securities held. These fluctuations are included with the net realized and unrealized gain or loss from investments and foreign currencies.
| (d) | Risks Associated with Foreign Securities and Currencies |
Investments in securities of foreign issuers carry certain risks not ordinarily associated with investments in securities of U.S. issuers. These risks include future political and economic developments, and the possible imposition of exchange controls or other foreign governmental laws and restrictions. In addition, with respect to certain countries, there is the possibility of expropriation of assets, confiscatory taxation, political or social instability, or diplomatic developments, which could adversely affect investments in those countries.
14
Table of Contents
GARTMORE VARIABLE INSURANCE TRUST
NOTES TO FINANCIAL STATEMENTS (Unaudited) (Continued)
June 30, 2005
Certain countries also may impose substantial restrictions on investments in their capital markets by foreign entities, including restrictions on investments in issuers of industries deemed sensitive to relevant national interests. These factors may limit the investment opportunities available and result in a lack of liquidity and high price volatility with respect to securities of issuers from developing countries.
| (e) | Forward Foreign Currency Contracts |
The Fund may enter into forward foreign currency contracts in connection with planned purchases or sales of securities or to hedge the U.S. dollar value of portfolio securities denominated in a particular currency. The Fund could be exposed to risks if the counterparties to the contracts are unable to meet the terms of their contracts and from unanticipated movements in the value of a foreign currency relative to the U.S. dollar. Forward foreign currency contracts are valued at the current cost of covering these contracts, as provided by an independent pricing service approved by the Board of Trustees. The forward foreign currency contracts are adjusted by the daily exchange rate of the underlying currency and any gains or losses are recorded for financial statement purposes as unrealized gains or losses until the contract settlement date.
| (f) | Futures Contracts |
The Fund may invest in financial futures contracts (“futures contracts”) for the purpose of hedging its existing portfolio securities or securities that the Fund intends to purchase against fluctuations in value caused by changes in prevailing market interest rates or prices. Futures contracts may also be entered into for non-hedging purposes.
Upon entering into a futures contract, the Fund is required to pledge to the broker an amount of cash and/or other assets equal to a certain percentage of the contract amount (initial margin deposit). Subsequent payments, known as “variation margin,” are made each day, depending on the daily fluctuations in the fair value/market value of the underlying assets. A gain or loss equal to the daily variation margin is recognized on a daily basis. Futures contracts are valued daily at their last quoted sale price.
A “sale” of a futures contract means a contractual obligation to deliver the securities or foreign currency called for by the contract at a fixed price at a specified time in the future. A “purchase” of a futures contract means a contractual obligation to acquire the securities or foreign currency at a fixed price at a specified time in the future.
Should market conditions change unexpectedly, the Fund may not achieve the anticipated benefits of the futures contracts and may realize a loss. The use of futures transactions for hedging purposes involves the risk of imperfect correlation in movements in the price of futures contracts, interest rates, and the value of the underlying hedged assets.
| (g) | Written Options Contracts |
The Fund may write options contracts. A written option obligates the Fund to deliver (written call) or to receive (written put) a specified quantity of an underlying asset at the contract amount upon exercise by the holder of the option. The value of the option contract is recorded as a liability and unrealized gain or loss is measured by the difference between the current value and the premium received. Options traded on an exchange are valued at the last quoted sale price, or in the absence of a sale, the bid price provided by an independent pricing service approved by the Board of Trustees. Non-exchange traded options are valued using dealer supplied quotes.
| (h) | Security Transactions and Investment Income |
Security transactions are accounted for on the date the security is purchased or sold (“trade date”). Securities gains and losses are calculated on the identified cost basis. Interest income is recognized on the accrual basis and includes, where applicable, the amortization or accretion of premium or discount. Dividend income is recorded on the ex-dividend date.
| (i) | Securities Lending |
To generate additional income, the Fund may lend up to 33 1/3% of the Fund’s total assets pursuant to agreements, requiring that the borrower deliver cash or securities as collateral with respect to each new loan of U.S. securities, equal to at least
15
Table of Contents
GARTMORE VARIABLE INSURANCE TRUST
NOTES TO FINANCIAL STATEMENTS (Unaudited) (Continued)
June 30, 2005
102% of the value of the portfolio securities loaned, and with respect to each new loan of non-U.S. securities, collateral of at least 105% of the value of the portfolio securities loaned, and thereafter requiring the borrower to mark to market the collateral on a daily basis and requiring the borrower to make up any shortfall of collateral. The Fund receives payments from borrowers equivalent to the dividends and interest that would have been earned on securities lent while simultaneously seeking to earn income on the investment of cash collateral. Collateral is marked to market daily to provide a level of collateral at least equal to the market value of securities loaned. There may be risks of delay in recovery of the securities should the borrower of the securities fail financially. Loans will be made, however, only to borrowers deemed by the Fund’s investment adviser to be of good standing and creditworthy under guidelines established by the Board of Trustees and when, in the judgment of the adviser, the consideration which can be earned currently from these securities loans justifies the attendant risks. Loans are subject to termination by the Fund or the borrower at any time, and, therefore, are not considered to be illiquid investments. JPMorgan Chase Bank serves as custodian for the securities lending program of the Fund. JPMorgan Chase Bank receives a custody fee based on the value of collateral received from borrowers.
The cash collateral received by the Fund was pooled and, at June 30, 2005, was invested in the following:
Security Type | Security Name | Market Value | Maturity Rate | Maturity Date | |||||
| Repurchase Agreement | Nomura Securities | $ | 2,356,202 | 3.48% | 07/01/05 | ||||
As of June 30, 2005, the Fund had securities with the following market values on loan:
Market Value of | Market Value of Collateral | ||
$2,239,943 | $ | 2,356,202 | |
| (j) | Distributions to Shareholders |
The Fund’s dividends from net investment income, if any, are declared and paid quarterly. The Fund’s distributable net realized capital gains, if any, are declared and distributed at least annually.
Dividends and distributions to shareholders are determined in accordance with federal income tax regulations, which may differ from GAAP. These “book/tax” differences are considered either permanent or temporary in nature. In accordance with the American Institute of Certified Public Accountants (“AICPA”) Statement of Position 93-2, permanent differences (i.e., reclassification of market discounts, gain/loss, paydowns, and distributions) are reclassified within the capital accounts based on their nature for federal income tax purposes; temporary differences do not require reclassification. These reclassifications have no effect upon the net asset value of the Fund. To the extent distributions exceed current and accumulated earnings and profits for federal income tax purposes, these distributions are reported as distributions of paid-in-capital.
| (k) | Federal Income Taxes |
It is the policy of the Fund to qualify or continue to qualify as a “regulated investment company” by complying with the provisions available to certain investment companies, as defined in applicable sections of the U.S. Internal Revenue Code, and to make distributions of net investment income and net realized capital gains sufficient to relieve the Fund from all, or substantially all, federal income taxes.
As of June 30, 2005, the tax cost of securities and the breakdown of unrealized appreciation (depreciation) for the Fund is as follows:
Tax Cost of | Unrealized Appreciation | Unrealized Depreciation | Net Unrealized Appreciation (Depreciation) | |||||||
$1,035,761 | $ | 17,968,170 | $ | (3,250,721 | ) | $ | 14,717,450 | |||
16
Table of Contents
GARTMORE VARIABLE INSURANCE TRUST
NOTES TO FINANCIAL STATEMENTS (Unaudited) (Continued)
June 30, 2005
| (l) | Allocation of Expenses, Income, and Gains and Losses |
Expenses directly attributable to the Fund are charged to the Fund. Expenses not directly attributable to the Fund are allocated proportionately among various or all funds within the Trust. The method used by the Fund for allocating income, fund level expenses, and realized and unrealized gains or losses is based on the fair value of shares outstanding relative to net assets. Under this method, each class of shares participates based on the total net asset value of that class’s shares in proportion to the total net assets of the Fund. Expenses specific to a class (such as rule 12b-1 and administrative services fees) are charged to that class.
3. Transactions with Affiliates
Under the terms of the Trust’s Investment Advisory Agreement, Gartmore Global Asset Management Trust (“GGAMT”) manages the investment of the assets and supervises the daily business affairs of the Fund. GGAMT is a wholly-owned subsidiary of Nationwide Corporation. All of the common stock of Nationwide Corporation is held by Nationwide Mutual Insurance Company (95.2%) and Nationwide Mutual Fire Insurance Company (4.8%), each of which is a mutual company owned by its policyholders. In addition, GGAMT provides investment management evaluation services in initially selecting and monitoring, on an ongoing basis, the performance of the subadviser, for the Fund that GGAMT advises. Gartmore Global Partners (the “subadviser”), an affiliate of GGAMT, manages all of the Fund’s investments and has the responsibility for making all investment decisions for the Fund.
Under the terms of the Investment Advisory Agreement, the Fund pays the Fund’s adviser an investment advisory fee based on the Fund’s average daily net assets. From such fees, pursuant to the subadvisory agreements, the adviser pays fees to the subadviser. Additional information regarding investment advisory fees and subadvisory fees for GGAMT and the subadviser is as follows for the six months ended June 30, 2005:
| Fee Schedule | Total Fees | Fees Retained | Paid to Sub-adviser | |||
Up to $500 million | 1.15% | 0.575% | 0.575% | |||
$500 million up to $2 billion | 1.10% | 0.525% | 0.575% | |||
Next $2 billion or more | 1.05% | 0.475% | 0.575% |
GGAMT and the Fund have entered into a written contract (“Expense Limitation Agreement”) that limits operating expenses (excluding any taxes, interest, brokerage fees, extraordinary expenses, short sale dividend expenses, Rule 12b-1 fees, and administrative service fees) from exceeding 1.40% for all classes until at least May 1, 2006.
GGAMT may request and receive reimbursement from the Fund of the advisory fees waived and other expenses reimbursed by GGAMT, respectively, pursuant to the Expense Limitation Agreement at a later date not to exceed three years from the fiscal year in which the corresponding reimbursement to the Fund was made, depending on the Fund (as described below), if the Fund has reached a sufficient asset size to permit reimbursement to be made without causing the total annual operating expense ratio of the Fund to exceed the limits set forth above. No reimbursement will be made unless: (i) the Fund’s assets exceed $100 million; (ii) the total annual expense ratio of the Class making such reimbursement is less than the limit set forth above; and (iii) the payment of such reimbursement is approved by the Board of Trustees on a quarterly basis. Except as provided for in the Expense Limitation Agreements, reimbursement of amounts previously waived or assumed by GGAMT is not permitted.
As of the six months ended June 30, 2005, the cumulative potential reimbursements for all classes of the Fund, based on reimbursements which expires within three years from the fiscal year in which the corresponding reimbursement to the Fund was made for expenses reimbursed by GGAMT, would be:
Amount | Amount Fiscal Year 2004 | Amount Six Months Ended June 30, 2005 | ||||
$5,714 | $ | — | $ | — | ||
17
Table of Contents
GARTMORE VARIABLE INSURANCE TRUST
NOTES TO FINANCIAL STATEMENTS (Unaudited) (Continued)
June 30, 2005
Under the terms of a Fund Administration and Transfer Agency Agreement, Gartmore SA Capital Trust (“GSA”) provides the Fund with various administrative and accounting services, and Gartmore Investors Services, Inc. (“GISI”), an indirect subsidiary of GSA, serves as Transfer and Dividend Disbursing Agent for the Fund. The fees for the services provided under this Agreement are calculated based on the Trust’s average daily net assets according to the fee schedule below. The fees are then allocated proportionately among all funds within the Trust in relation to the average daily net assets of each fund and are paid to GSA. GSA pays GISI from these fees for its services.
| Combined Fee Schedule* | ||
Up to $1 billion | 0.13% | |
$1 billion and more up to $3 billion | 0.08% | |
$3 billion and more up to $8 billion | 0.05% | |
$8 billion and more up to $10 billion | 0.04% | |
$10 billion and more up to $12 billion | 0.02% | |
$12 billion or more | 0.01% | |
| * | The assets of the Gartmore GVIT Investor Destinations Aggressive Fund, the Gartmore GVIT Investor Destinations Moderately Aggressive Fund, the Gartmore GVIT Investor Destinations Moderate Fund, the Gartmore GVIT Investor Destinations Moderately Conservative Fund, and the Gartmore GVIT Investor Destinations Conservative Fund (collectively, the “Investor Destinations Funds”) are excluded from the Trust asset level amount in order to calculate this asset-based fee. The Investor Destinations Funds do not pay any part of this fee. |
Effective January 1, 2005, the fee for the fund administration and transfer agency services increased as set forth below. The fees are calculated based on the Trust’s average daily net assets according to the fee schedule below. The fees are then allocated proportionately among all funds within the Trust in relation to the average daily net assets of each fund and are paid to GSA.
| Combined Fee Schedule* | ||
Up to $1 billion | 0.15% | |
$1 billion and more up to $3 billion | 0.10% | |
$3 billion and more up to $8 billion | 0.05% | |
$8 billion and more up to $10 billion | 0.04% | |
$10 billion and more up to $12 billion | 0.02% | |
$12 billion or more | 0.01% | |
| * | The assets of each of the Investor Destinations Funds are excluded from the Trust asset level amount in order to calculate this asset-based fee. The Investor Destinations Funds do not pay any part of this fee. |
GSA and GISI have entered into agreements with BISYS Fund Services Ohio, Inc. (“BISYS”), pursuant to which BISYS provides sub-administration and sub-transfer agency services, respectively, to the Fund.
Under the terms of a Distribution Plan under Rule 12b-1 of the 1940 Act, Gartmore Distribution Services, Inc. (“GDSI”), the Fund’s Distributor, is compensated by the Fund for expenses associated with the distribution of the Class II shares of the Fund. These fees are based on average daily net assets of Class II shares of the Fund at an annual rate not to exceed 0.25%.
Under the terms of an Administrative Services Plan, the Fund may pay fees to servicing organizations, such as broker-dealers, including Nationwide Financial Services, and financial institutions, which agree to provide administrative support services to the shareholders of certain classes. These services include, but are not limited, to the following: establishing and maintaining shareholder accounts; processing purchase and redemption transactions; arranging bank wires; performing shareholder sub-accounting; answering inquires regarding the Fund; and other such services. These fees are based on an annual rate of up to 0.25% of the average daily net assets of each class of shares of the Fund.
18
Table of Contents
GARTMORE VARIABLE INSURANCE TRUST
NOTES TO FINANCIAL STATEMENTS (Unaudited) (Continued)
June 30, 2005
4. Investment Transactions
For the six months ended June 30, 2005, (excluding short-term securities) the Fund had purchases of $155,609,350 and sales of $179,419,257.
5. Portfolio Investment Risks
Credit and Market Risk. The Fund invests in emerging market instruments that are subject to certain additional credit and market risks. The yields of emerging market debt obligations reflect, among other things, perceived credit risk. The Fund’s investment in securities rated below investment grade typically involve risks not associated with higher rated securities including, among others, greater risk of not receiving timely and/or ultimate payment of interest and principal, greater market price volatility, and less liquid secondary market trading. The consequences of political, social, economic, or diplomatic changes may have disruptive effects on the market prices of emerging markets investments held by the Fund.
6. Bank Loans
The Trust has a credit agreement of $100,000,000. Borrowings under this arrangement bear interest at the Federal Funds rate plus 0.50%. The interest costs are included in custodian fees in the Statement of Operations. No compensation balances were required under the terms of the line of credit. There were no borrowings outstanding as of June 30, 2005.
7. Shareholder Meeting
A separate shareholders meeting was held on Tuesday, December 23, 2004, for the shareholders of the Trust’s predecessor pursuant to a Proxy Statement On Schedule 14A, dated October 29, 2004, and mailed to the shareholders of the Trust’s predecessor on or around November 5, 2004.
Two Proposals: The purpose of the December 23, 2004 meeting was to allow the shareholders of the Trust’s predecessor to vote on:
| i. | Proposal One: The election of the Trust’s Board of Trustees; and |
| ii. | Proposal Two: The approval of an “Agreement and Plan of Reorganization” that provided for the reorganization of the Trust from a Massachusetts business trust into a Delaware statutory trust. |
Proposal One: As set forth in the October 29, 2004 Proxy Statement, the nominees for election as Trustees of the Trust’s predecessor were: Charles E. Allen, Michael J. Baresich, Paula H.J. Cholmondeley, C. Brent DeVore, Phyllis Kay Dryden, Robert M. Duncan, Barbara L. Hennigar, Paul J. Hondros, Barbara I Jacobs, Thomas J. Kerr IV, Douglas F. Kridler, Michael D. McCarthy, Arden L. Shisler, and David C. Wetmore.
Proposal Two: As specifically set forth in the October 29, 2004 Proxy Statement, the Reorganization proposal requested the shareholders of the Trust’s predecessor to approve the proposed “Agreement and Plan of Reorganization” of the Trust’s predecessor (on behalf of each of the its funds) into a new Delaware-domiciled Trust, whereby the Funds of the new Delaware Trust would acquire all of the assets of the corresponding funds of the Trust’s predecessor subject to the liabilities, expenses, costs, charges, and reserves of the corresponding funds of the Trust’s predecessor (contingent or otherwise), in exchange for shares of the acquiring Funds to be distributed pro rata by the Trust to the holders of the shares of the funds of the Trust’s predecessor, in a complete liquidation of the Trust’s predecessor.
19
Table of Contents
GARTMORE VARIABLE INSURANCE TRUST
NOTES TO FINANCIAL STATEMENTS (Unaudited) (Continued)
June 30, 2005
Voting Results:
The shareholders of the Trust’s predecessor voted to approve both Proposal One and Proposal Two, as follows:
Proposal 1: Election of a Board of Trustees of Gartmore Variable Insurance Trust
Charles E. Allen: | ||
FOR | 2,797,230,318.955 shares (96.078%) | |
WITHHOLD | 114,195,693.660 shares (3.922%) | |
TOTAL | 2,912,726,012.615 shares (100.000%) | |
Michael J. Baresich: | ||
FOR | 2,796,135,979.559 shares (96.040%) | |
WITHHOLD | 115,290,033.056 shares (3.960%) | |
TOTAL | 2,912,726,012.615 shares (100.000%) | |
Paula H.J. Cholmondeley: | ||
FOR | 2,795,095,945.396 shares (96.004%) | |
WITHHOLD | 116,330,067.219 shares (3.996%) | |
TOTAL | 2,912,726,012.615 shares (100.000%) | |
C. Brent DeVore: | ||
FOR | 2,797,207,046.916 shares (96.077%) | |
WITHHOLD | 114,218,965.699 shares (3.923%) | |
TOTAL | 2,912,726,012.615 shares (100.000%) | |
Phyllis Kay Dryden: | ||
FOR | 2,795,587,023.994 shares (96.021%) | |
WITHHOLD | 115,838,988.621 shares (3.979%) | |
TOTAL | 2,912,726,012.615 shares (100.000%) | |
Robert M. Duncan: | ||
FOR | 2,790,191,720.503 shares (95.836%) | |
WITHHOLD | 121,234,292.112 shares (4.164%) | |
TOTAL | 2,912,726,012.615 shares (100.000%) | |
Barbara L. Hennigar: | ||
FOR | 2,792,939,848.858 shares (95.937%) | |
WITHHOLD | 118,486,163.757 shares (4.070%) | |
TOTAL | 2,912,726,012.615 shares (100.000%) | |
Paul J. Hondros: | ||
FOR | 2,797,557,404.448 shares (96.089%) | |
WITHHOLD | 113,868,608.167 shares (3.911%) | |
TOTAL | 2,912,726,012.615 shares (100.000%) | |
20
Table of Contents
GARTMORE VARIABLE INSURANCE TRUST
NOTES TO FINANCIAL STATEMENTS (Unaudited) (Continued)
June 30, 2005
Barbara I. Jacobs: | ||
FOR | 2,796,306,126.654 shares (96.046%) | |
WITHHOLD | 115,119,885.961 shares (3.954%) | |
TOTAL | 2,912,726,012.615 shares (100.000%) | |
Thomas J. Kerr IV: | ||
FOR | 2,789,755,720.087 shares (95.821%) | |
WITHHOLD | 121,670,292.528 shares (4.179%) | |
TOTAL | 2,912,726,012.615 shares (100.000%) | |
Douglas F. Kridler: | ||
FOR | 2,798,065,774.375 shares (96.106%) | |
WITHHOLD | 113,360,238.240 shares (3.894%) | |
TOTAL | 2,912,726,012.615 shares (100.000%) | |
Michael D. McCarthy: | ||
FOR | 2,797,452,613.694 shares (96.085%) | |
WITHHOLD | 113,973,395.921 shares (3.915%) | |
TOTAL | 2,912,726,012.615 shares (100.000%) | |
Arden L. Shisler: | ||
FOR | 2,796,738,454.730 shares (96.061%) | |
WITHHOLD | 114,687,557.885 shares (3.939%) | |
TOTAL | 2,912,726,012.615 shares (100.000%) | |
David C. Wetmore: | ||
FOR | 2,794,784,752.247 shares (95.994%) | |
WITHHOLD | 116,641,260.368 shares (4.006%) | |
TOTAL | 2,912,726,012.615 shares (100.000%) | |
Proposal 2: Approval of the Agreement and Plan of Reorganization of Gartmore Variable Insurance Trust
FOR | 2,561,003,822.546 shares (87.964%) | |
AGAINST | 103,593,261.010 shares (3.558%) | |
ABSTAIN | 246,828,929.059 shares (8.478%) | |
TOTAL | 2,912,726,012.615 shares (100.000%) | |
21
Table of Contents
GARTMORE VARIABLE INSURANCE TRUST
NOTES TO FINANCIAL STATEMENTS (Unaudited) (Continued)
June 30, 2005
8. Subsequent Event
On July 29, 2005, the Trust filed a Post-Effective Amendment to its Registration Statement on Form N-1A to change the structure of the Fund’s investment advisory fee and sub-advisory fee from the current asset-based fee structure to a performance based fee structure on or about October 1, 2005. On that date, or, if later, upon SEC effectiveness, the Fund will immediately lower its base advisory fee by 0.10% at each breakpoint. Beginning one year after implementation of the new performance fee structure, the Fund’s base advisory fee may be adjusted proportionately upward or downward if the Fund outperforms or underperforms its stated benchmark by the following amounts:
| Out or Underperformance | Change in Fees | |
+/- 1 percentage point | +/- 0.02% | |
+/- 2 percentage points | +/- 0.04% | |
+/- 3 percentage points | +/- 0.06% | |
+/- 4 percentage points | +/- 0.08% | |
+/- 5 percentage points | +/- 0.10% |
The prospectus describing the above Fund will be supplemented upon the effectiveness of the Post-Effective Amendment to the Trust’s Registration Statement. Please refer to the prospectus, as supplemented by a notice you will receive after the effectiveness of the Post-Effective Amendment, for further information about this new fee structure.
22
Table of Contents
GARTMORE VARIABLE INSURANCE TRUST
Management Information (Unaudited)
June 30, 2005
Trustees who are not Interested Persons (as defined in the 1940 Act) and Officers of the Funds June 30, 2005
| Name, Address and Date of Birth | Position(s) Held with the and Length of | Principal Occupation(s) During Past Five Years | Number of the Gartmore | Other Directorships Held by Trustee or Nominee2 | ||||
Charles E. Allen
c/o Gartmore Global Investments, Inc. 1200 River Road, Suite 1000 Conshohocken, PA 19428
1948 | Trustee since July 2000 | Mr. Allen is Chairman, Chief Executive Officer and President of the Graimark Realty Advisors, Inc. (real estate development, investment and asset management). | 84 | None | ||||
Paula H.J. Cholmondeley
c/o Gartmore Global Investments, Inc. 1200 River Road, Suite 1000 Conshohocken, PA 19428
1940 | Trustee since July 2000 | Ms. Cholmondeley has been the Chairman and Chief Executive Officer of the Sorrel Group, a management consulting company, since January 2004. From March 2000 through December 2003, Ms. Cholmondeley was Vice President and General Manager of Sappi Fine Paper North America. Prior thereto, Ms. Cholmondeley was Vice President and General Manager of Residential Insulation of Owens Corning. | 84 | Director of Dentsply International, Inc., Ultralife Batteries, Inc., Terex Corporation, Minerals Technology, Inc. and Albany International Corp. | ||||
C. Brent DeVore c/o Gartmore Global Investments, Inc. 1200 River Road, Suite 1000 Conshohocken, PA 19428
1940 | Trustee since 1990 | Dr. DeVore is President of Otterbein College. | 84 | None | ||||
Phyllis K. Dryden c/o Gartmore Global Investments, Inc. 1200 River Road, Suite 1000 Conshohocken, PA 19428
1947 | Trustee since December 2004 | Ms. Dryden was a former Managing Partner of marchFIRST, a global management consulting firm prior to 2002. | 84 | None |
23
Table of Contents
GARTMORE VARIABLE INSURANCE TRUST
Management Information (Unaudited)
June 30, 2005
| Name, Address and Date of Birth | Position(s) Held with the Trust and Length of Time Served1 | Principal Occupation(s) During Past 5 Years | Number of Portfolios in the Gartmore Fund Complex Overseen by Trustee | Other Directorships Held by Trustee or Nominee2 | ||||
Barbara L. Hennigar*
c/o Gartmore Global Investments, Inc. 1200 River Road, Suite 1000 Conshohocken, PA 19428
1935 | Trustee since July 2000 | Retired since June 2000. Prior thereto, Ms. Hennigar was the Chairman or President and Chief Executive Officer of OppenheimerFunds Services and a member of the Executive Committee of OppenheimerFunds. | 84 | None | ||||
Barbara I. Jacobs
c/o Gartmore Global Investments, Inc. 1200 River Road, Suite 1000 Conshohocken, PA 19428
1950 | Trustee since December 2004 | Ms. Jacobs has served as Chairman of the Board of Directors of KICAP Network Fund, a European (United Kingdom) hedge fund, since December 2000. Prior to 2004, Ms. Jacobs was also a Managing Director and European Portfolio Manager with CREF Investments (Teachers Insurance Annuity Association — College Retirement Equity Fund). | 84 | None | ||||
Douglas F. Kridler
c/o Gartmore Global Investments, Inc. 1200 River Road, Suite 1000 Conshohocken, PA 19428
1955 | Trustee since September 1997 | Mr. Kridler has served as the President and Chief Executive Officer of the Columbus Foundation (a Columbus, OH-based foundation which manages over 1,300 individual endowment funds) since February 2002. Mr. Kridler was the President of the Columbus Association for the Performing Arts prior thereto and Chairman of the Greater Columbus Convention and Visitors Bureau during 2000 and 2001. | 84 | None | ||||
Michael D. McCarthy
c/o Gartmore Global Investments, Inc. 1200 River Road, Suite 1000 Conshohocken, PA 19428
1947 | Trustee since December 2004 | Mr. McCarthy serves as: the Founder and Chairman of The Eureka Foundation (which sponsors and funds the “Great Museums” series on PBS); and a Partner of Pineville Properties LLC (a commercial real estate development firm). | 843 | None |
24
Table of Contents
GARTMORE VARIABLE INSURANCE TRUST
Management Information (Unaudited)
June 30, 2005
| Name, Address and Date of Birth | Position(s) Held with the Trust and Length of Time Served1 | Principal Occupation(s) During Past 5 Years | Number of Portfolios in the Gartmore Fund Complex Overseen by Trustee | Other Directorships Held by Trustee or Nominee2 | ||||
David C. Wetmore
c/o Gartmore Global Investments, Inc. 1200 River Road, Suite 1000 Conshohocken, PA 19428
1948 | Trustee since 1995 and Chairman since February 2005 | Retired. Mr. Wetmore was formerly a Managing Director of Updata Capital, an investment banking and venture capital firm. | 84 | None |
| * | Pursuant to the Trust’s mandatory retirement policy, Ms. Hennigar is expected to retire on or about January 12, 2006. |
| 1 | The term of office length is until a trustee resigns or reaches a mandatory retirement age of 70. On March 2, 2000, the Board adopted a five-year implementation period for any Trustee 65 or older as of the adoption of this policy. Pursuant to this policy, Messrs. Duncan and Kerr retired as trustees effective as of March 12, 2005. |
| 2 | Directorships held in (1) any other investment companies registered under the 1940 Act, (2) any company with a class of securities registered pursuant to Section 12 of the Securities Exchange Act of 1934, as amended (the “Exchange Act”), or (3) any company subject to the requirements of Section 15(d) of the Exchange Act. |
| 3 | Mr. McCarthy was also an Administrative Committee Member for the Alphagen Arneb Fund, LLC, The Healthcare Fund LDC, The Leaders Long-Short Fund, LLC, and The Leaders Long-Short Fund LDC, four private investment companies (hedge funds) managed by GSA. Mr. McCarthy resigned as an Administrative Committee Member effective June 30, 2005. |
Trustees and Officers who are not Interested Persons (as defined in the 1940 Act) of the Funds received aggregate compensation of $274,882 from the Trust for the Six Months Ended June 30, 2005. Additional information regarding the Trustees and Officers may be found in the Trust’s statement of additional information, which is available without charge upon request, by calling 1-800-848-0920.
25
Table of Contents
GARTMORE VARIABLE INSURANCE TRUST
Management Information (Unaudited)
June 30, 2005
Trustees who are Interested Persons (as defined in the 1940 Act) and/or Officers of the Funds June 30, 2005
| Name, Address and Age | Position(s) Held with the and Length of | Principal Occupation(s) During Past Five Years | Number of Portfolios in the Gartmore Fund Complex Overseen by Trustee | Other Directorships Held by Trustee2 | ||||
Paul J. Hondros
Gartmore Global Investments, Inc. 1200 River Road, Suite 1000 Conshohocken, PA 19428
1948 | Trustee since July 2000 | Mr. Hondros has been President and Chief Executive Officer of various Gartmore entities, including Gartmore Distribution Services, Inc. (“GDSI”),3 Gartmore Investor Services, Inc. (“GISI”),3 Gartmore Morley Capital Management, Inc. (“GMCM”),3 Gartmore Morley Financial Services, Inc. (“GMFS”), 3 NorthPointe Capital, LLC (“NorthPointe”),3 Gartmore Global Asset Management Trust (“GGAMT”)3, Gartmore Global Investments, Inc. (“GGI”)3, Gartmore Mutual Fund Capital Trust (“GMFCT”)3 and Gartmore SA Capital Trust (“GSA”)3; and a Director of Nationwide Securities, Inc.3, as well as several entities within Nationwide Financial Services, Inc. | 844 | None | ||||
Arden L. Shisler
c/o Gartmore Global Investments, Inc. 1200 River Road, Suite 1000 Conshohocken, PA 19428
1941 | Trustee since February 2000 | Mr. Shisler has been a consultant since January 2003. Prior thereto, he was President and Chief Executive Officer of K&B Transport, Inc., a trucking firm. Since 1992, Mr. Shisler has also been Chairman of the Board for Nationwide Mutual Insurance Company3. | 84 | Director of Nationwide Financial Services, Inc. | ||||
Gerald J. Holland
Gartmore Global Investments, Inc. 1200 River Road, Suite 1000 Conshohocken, PA 19428
1951 | Treasurer since March 2001 | Mr. Holland is Senior Vice President - Operations for GGI3, GMFCT3, and GSA3. Prior to July 2000, Mr. Holland was Vice President for First Data Investor Services, an investment company service provider. | 84 | None |
26
Table of Contents
GARTMORE VARIABLE INSURANCE TRUST
Management Information (Unaudited)
June 30, 2005
| Name, Address and Age | Position(s) Held with the Trust and Length of Time Served1 | Principal Occupation(s) During Past 5 Years | Number of Portfolios in the Gartmore Fund Complex Overseen by Trustee | Other Directorships Held by Trustee2 | ||||
Michael A. Krulikowski
Gartmore Global Investments, Inc. 1200 River Road, Suite 1000 Conshohocken, PA 19428
1959 | Chief Compliance Officer since June 2004 | Since November 1999, Mr. Krulikowski has served as a Vice President and Chief Compliance Officer of GGI. Prior thereto, Mr. Krulikowski served as Chief Compliance Officer of 1717 Capital Management Company/Provident Mutual Insurance Company. | 84 | None | ||||
Eric E. Miller
Gartmore Global Investments, Inc. 1200 River Road, Suite 1000 Conshohocken, PA 19428
1953 | Secretary since December 2002 | Mr. Miller is Senior Vice President, Chief Counsel for GGI3, GMFCT3 and GSA3 since August 2002. From August 2000 to August 2002, Mr. Miller was a Partner with Stradley Ronan Stevens & Young, LLP. Prior to August 2000, Mr. Miller served as Senior Vice President and Deputy General Counsel at Delaware Investments. | 84 | None |
| 1 | The term of office length is until a trustee resigns or reaches a mandatory retirement age of 70. On March 2, 2000, the Board adopted a five-year implementation period for any Trustee 65 or older as of the adoption of this policy. Pursuant to this policy, Messrs. Duncan and Kerr retired as trustees effective as of March 12, 2005. |
| 2 | Directorships held in (1) any other investment companies registered under the 1940 Act, (2) any company with a class of securities registered pursuant to Section 12 of the Securities Exchange Act of 1934, as amended (the “Exchange Act”), or (3) any company subject to the requirements of Section 15(d) of the Exchange Act. |
| 3 | This position is held with an affiliated person or principal underwriter of the Trust. |
| 4 | Mr. Hondros was also an Administrative Committee Member for the Alphagen Arneb Fund, LLC, The Healthcare Fund LDC, The Leaders Long-Short Fund, LLC, and The Leaders Long-Short Fund LDC, four private investment companies (hedge funds) managed by GSA. Mr. Hondros resigned as Administrative Committee Member effective June 30, 2005. |
Federal law requires the Trust, each of its investment advisers and sub-advisers to adopt procedures for voting proxies (“Proxy Voting Guidelines”) and to provide a summary of those Proxy Voting Guidelines used to vote the securities held by the Funds. The Funds’ proxy voting policies and procedures are available without charge (i) upon request, by calling 1-800-848-0920, (ii) on the Fund’s website at www.gartmorefunds.com, or (iii) on the Securities and Exchange Commission’s website at www.sec.gov.
27
Table of Contents
| Item 2. | Code of Ethics. |
Not applicable – The information required by this item is required only in an annual report on the Form N-CSR.
| Item 3. | Audit Committee Financial Expert. |
Not applicable – The information required by this item is required only in an annual report on the Form N-CSR.
| Item 4. | Principal Accountant Fees and Services. |
Not applicable – The information required by this item is required only in an annual report on the Form N-CSR.
| Item 5. | Audit Committee of Listed Registrants. |
Not applicable. The registrant is not a listed issuer as defined in Rule 10A-3 under the Exchange Act.
| Item 6. | Schedule of Investments. |
File Schedule I – Investments in securities of unaffiliated issuers as of the close of the reporting period as set forth in § 210.12-12 of Regulation S-X, unless the schedule is included as part of the report to shareholders filed under Item 1 of this Form.
This schedule is included as part of the report to shareholders filed under Item 1 of this Form N-CSR.
| Item 7. | Disclosure of Proxy Voting Policies and Procedures for Closed-End Management Investment Companies. |
A closed-end management investment company that is filing an annual report on this Form N-CSR must, unless it invests exclusively in non-voting securities, describe the policies and procedures that it uses to determine how to vote proxies relating to portfolio securities, including the procedures that the company uses when a vote presents a conflict between the interests of its shareholders, on the one hand, and those of the company’s investment adviser; principal underwriter; or any affiliated person (as defined in Section 2(a)(3) of the Investment Company Act of 1940 (15 U.S.C. 80a-2(a)(3)) and the rules thereunder) of the company, its investment adviser, or its principal underwriter, on the other. Include any policies and procedures of the company’s investment adviser, or any other third party, that the company uses, or that are used on the company’s behalf, to determine how to vote proxies relating to portfolio securities.
Not applicable. The registrant is an open-end management investment company, not a closed-end management investment company.
| Item 8. | Portfolio Managers of Closed-End Management Investment Company. |
Not applicable. The registrant is an open-end management investment company, not a closed-end management investment company.
| Item 9. | Purchases of Equity Securities by Closed-End Management Investment Company and Affiliated Purchasers. |
If the registrant is a closed-end management investment company, provide the information specified in paragraph (b) of this Item with respect to any purchase made by or on behalf of the registrant or any “affiliated purchaser,” as defined in Rule 10b-18(a)(3) under the Exchange Act (17 CFR 240.10b-18(a)(3)), of shares or other units of any class of the registrant’s equity securities that is registered by the registrant pursuant to Section 12 of the Exchange Act (15 U.S.C. 781).
Not applicable. The registrant is an open-end management investment company, not a closed-end management investment company.
| Item 10. | Submission of Matters to a Vote of Security Holders. |
Describe any material changes to the procedures by which shareholders may recommend nominees to the registrant’s board of directors, where those changes were implemented after the registrant last provided disclosure in response to the requirements of Item 7(d)(2)(ii)(G) of Schedule 14A (17 CFR 240.14a-101), or this Item.
The Independent Trustees and the Board of Trustees of the registrant adopted a formal, written “Policy Regarding Shareholder Submission of Trustee Candidates,” as well as a formal, written “Statement of Policy On Criteria For Selecting Trustees,” on June 9, 2004, and June 10, 2004, respectively. Neither this policy nor this statement of policy has been materially changed since the Board of Trustees adoption of the policy and the statement of policy, respectively.
| Item 11. | Controls and Procedures. |
(a) Disclose the conclusions of the registrant’s principal executive and principal financial officers, or persons performing similar functions, regarding the effectiveness of the registrant’s disclosure controls and procedures (as defined in Rule 30a-3(c) under the
Table of Contents
Act (17 CFR 270.30a-3(c))) as of a date within 90 days of the filing date of the report that includes the disclosure required by this paragraph, based on the evaluation of these controls and procedures required by Rule 30a-3(b) under the Act (17 CFR 270.30a-3(b)) and Rules 13a-15(b) or 15d-15(b) under the Exchange Act (17 CFR 240.13a-15(b) or 240.15d-15(b)).
The registrant’s principal executive officer and principal financial officer have concluded, based on their evaluation of the registrant’s disclosure controls and procedures as conducted within 90 days of the filing date of this report, that these disclosure controls and procedures are adequately designed and are operating effectively to ensure that information required to be disclosed by the registrant on Form N-CSR is: (i) accumulated and communicated to the investment company’s management, including the investment company’s certifying officers, to allow timely decisions regarding required disclosure; and (ii) recorded, processed, summarized, and reported within the time periods specified in the Securities and Exchange Commission’s rules and forms.
(b) Disclose any change in the registrant’s internal control over financial reporting (as defined in Rule 30a-3(d) under the Act (17 CFR 270.30a-3(d)) that occurred during the second fiscal quarter of the period covered by this report that has materially affected, or is reasonably likely to materially affect, the registrant’s internal control over financial reporting.
There were no changes in the registrant’s internal control over financial reporting that occurred during the registrant’s most recent fiscal half-year (the registrant’s second fiscal half-year in the case of an annual report) that have materially affected or are reasonably likely to materially affect, the registrant’s internal control over financial reporting.
| Item 12. | Exhibits. |
(a) File the exhibits listed below as part of this Form. Letter or number the exhibits in the sequence indicated.
(a)(1) Any code of ethics, or amendment thereto, that is the subject of the disclosure required by Item 2, to the extent that the registrant intends to satisfy the Item 2 requirements through filing of an exhibit.
Not applicable – The information required by this item is required only in an annual report on the Form N-CSR.
(a)(2) A separate certification for each principal executive officer and principal financial officer of the registrant as required by Rule 30a-2(a) under the Act (17 CFR 270.30a-2).
Certifications pursuant to Section 302 of the Sarbanes-Oxley Act of 2002 are attached hereto.
(a)(3) Any written solicitation to purchase securities under Rule 23c-1 under the Act (17 CFR 270.23c-1) sent or given during the period covered by the report by or on behalf of the registrant to 10 or more persons.
Not applicable.
(b) If the report is filed under Section 13(a) or 15(d) of the Exchange Act, provide the certifications required by rule 30a-2(b) under the Act as an exhibit. A certification furnished pursuant to this paragraph will not be deemed “filed” for purposes of Section 18 of the Exchange Act, or otherwise subject to the liability of that section. Such certification will not be deemed to be incorporated by reference into any filing under the Securities Act of 1933 or the Exchange Act, except to the extent that the registrant incorporates it by reference.
Certifications pursuant to Section 906 of the Sarbanes-Oxley Act of 2002 are attached hereto.
Table of Contents
SIGNATURES
Pursuant to the requirements of the Securities Exchange Act of 1934 and the Investment Company Act of 1940, the registrant has duly caused this report to be signed on its behalf by the undersigned, thereunto duly authorized.
(Registrant) | GARTMORE VARIABLE INSURANCE TRUST | |||
By (Signature and Title) | /S/ GERALD J. HOLLAND | |||
Name: | Gerald J. Holland | |||
Title: | Treasurer | |||
Date: | September 7, 2005 | |||
Pursuant to the requirements of the Securities Exchange Act of 1934 and the Investment Company Act of 1940, this report has been signed below by the following persons on behalf of the registrant and in the capacities and on the dates indicated.
By (Signature and Title) | /S/ PAUL J. HONDROS | |||
Name: | Paul J. Hondros | |||
Title: | President & Principal Executive Officer | |||
Date: | September 7, 2005 | |||
By (Signature and Title) | /S/ GERALD J. HOLLAND | |||
Name: | Gerald J. Holland | |||
Title: | Treasurer | |||
Date: | September 7, 2005 | |||