UNITED STATES | |||
SECURITIES AND EXCHANGE COMMISSION | |||
Washington, D.C. 20549 | |||
| |||
SCHEDULE 14A | |||
(Rule 14a-101) | |||
| |||
INFORMATION REQUIRED IN PROXY STATEMENT | |||
| |||
SCHEDULE 14A INFORMATION | |||
Proxy Statement Pursuant to Section 14(a) of | |||
| |||
Filed by the Registrant ý | |||
| |||
Filed by a Party other than the Registrant o | |||
| |||
Check the appropriate box: | |||
o | Preliminary Proxy Statement | ||
o | Confidential, for Use of the Commission Only (as permitted by Rule 14a-6(e)(2)) | ||
o | Definitive Proxy Statement | ||
o | Definitive Additional Materials | ||
ý | Soliciting Material Pursuant to §240.14a-12 | ||
| |||
EVERGREEN RESOURCES, INC. | |||
(Name of Registrant as Specified In Its Charter) | |||
| |||
| |||
(Name of Person(s) Filing Proxy Statement, if other than the Registrant) | |||
| |||
Payment of Filing Fee (Check the appropriate box): | |||
ý | No fee required. | ||
o | Fee computed on table below per Exchange Act Rules 14a-6(i)(4) and 0-11. | ||
| (1) | Title of each class of securities to which transaction applies: | |
|
|
| |
| (2) | Aggregate number of securities to which transaction applies: | |
|
|
| |
| (3) | Per unit price or other underlying value of transaction computed pursuant to Exchange Act Rule 0-11 (set forth the amount on which the filing fee is calculated and state how it was determined): | |
|
|
| |
| (4) | Proposed maximum aggregate value of transaction: | |
|
|
| |
| (5) | Total fee paid: | |
|
|
| |
o | Fee paid previously with preliminary materials. | ||
o | Check box if any part of the fee is offset as provided by Exchange Act Rule 0-11(a)(2) and identify the filing for which the offsetting fee was paid previously. Identify the previous filing by registration statement number, or the Form or Schedule and the date of its filing. | ||
| (1) | Amount Previously Paid: | |
|
|
| |
| (2) | Form, Schedule or Registration Statement No.: | |
|
|
| |
| (3) | Filing Party: | |
|
|
| |
| (4) | Date Filed: | |
|
|
| |
|
| Persons who are to respond to the collection of information contained in this form are not required to respond unless the form displays a currently valid OMB control number. | |
On June 1, 2004, Evergreen Resources, Inc. (the “Company”) participated in a conference with analysts held in San Francisco during which some of the terms of the proposed merger of the Company with a wholly owned subsidiary of Pioneer Natural Resources Company were discussed. Set forth below are the slides presented at the conference.
# # # # #

Link to searchable text of slide shown above
Link to searchable text of slide shown above

Link to searchable text of slide shown above
Link to searchable text of slide shown above
Link to searchable text of slide shown above

Link to searchable text of slide shown above

Link to searchable text of slide shown above

Link to searchable text of slide shown above
Link to searchable text of slide shown above

Link to searchable text of slide shown above
Link to searchable text of slide shown above
Link to searchable text of slide shown above

Link to searchable text of slide shown above

Link to searchable text of slide shown above

Link to searchable text of slide shown above

Link to searchable text of slide shown above

Link to searchable text of slide shown above
Link to searchable text of slide shown above

Link to searchable text of slide shown above

Link to searchable text of slide shown above

Link to searchable text of slide shown above

Link to searchable text of slide shown above
Link to searchable text of slide shown above

Link to searchable text of slide shown above

Link to searchable text of slide shown above

Link to searchable text of slide shown above

Link to searchable text of slide shown above

Link to searchable text of slide shown above

Link to searchable text of slide shown above

Link to searchable text of slide shown above

Link to searchable text of slide shown above

Link to searchable text of slide shown above

Link to searchable text of slide shown above

Link to searchable text of slide shown above

Link to searchable text of slide shown above
Link to searchable text of slide shown above

Link to searchable text of slide shown above

Link to searchable text of slide shown above

Link to searchable text of slide shown above

Link to searchable text of slide shown above

Link to searchable text of slide shown above

Link to searchable text of slide shown above

Link to searchable text of slide shown above

Link to searchable text of slide shown above

Link to searchable text of slide shown above

Link to searchable text of slide shown above

Link to searchable text of slide shown above

Link to searchable text of slide shown above

Link to searchable text of slide shown above
Link to searchable text of slide shown above

Link to searchable text of slide shown above
Link to searchable text of slide shown above
Link to searchable text of slide shown above

Link to searchable text of slide shown above

Link to searchable text of slide shown above
Searchable text section of graphics shown above
[GRAPHIC]
EVERGREEN RESOURCES, INC.
San Francisco
June 1, 2004
Pioneer Natural Resources |
| Evergreen Resources |
Forward Looking Statements
This presentation contains forward-looking statements within the meaning of federal securities laws, including statements regarding, among other things, the company’s growth strategies; anticipated trends in the company’s business and its future results of operations; market conditions in the oil and gas industry; the ability of the company to make and integrate acquisitions; and the impact of government regulations. These forward-looking statements are based largely on the company’s expectations and are subject to a number of risks and uncertainties, many of which are beyond the company’s control. Actual results could differ materially from those implied by these forward-looking statements as a result of, among other things, a decline in natural gas production, a decline in natural gas prices, incorrect estimations of required capital expenditures, increases in the cost of drilling, completion and gas collection, an increase in the cost of production and operations, an inability to meet projections, and/or changes in general economic conditions. In light of these and other risks and uncertainties of which the company may be unaware or which the company currently deems immaterial, there can be no assurance that actual results will be as projected in the forward-looking statements. These and other risks and uncertainties are described in more detail in the company’s most recent Annual Report on Form 10-K filed with the Securities and Exchange Commission.
1
Transaction Terms
Transaction Consideration: |
| Evergreen’s common shareholders will receive: |
|
| • 0.58175 shares of Pioneer stock, plus |
|
| • $19.50 per share in cash, plus |
|
| • Cash equal to the greater of: |
|
| • $0.35 per share (~$15 million) as a consideration from Pioneer for the Kansas properties |
|
| • Net proceeds from the sale of the Kansas properties to a third party |
|
|
|
Purchase Price per Share: |
| $39.35 (assumes Pioneer retains Kansas properties) |
|
| $40.00+ (assumes KS properties sold for >$48 million) |
|
|
|
Transaction Structure: |
| Tax-free (Section 368a) Reorganization |
|
|
|
Estimated Closing: |
| September / October |
|
|
|
Conditions: |
| • Pioneer shareholder approval |
|
| • Evergreen shareholder approval |
|
| • Hart Scott Rodino approval |
|
|
|
Termination Fee: |
| $35 million |
2
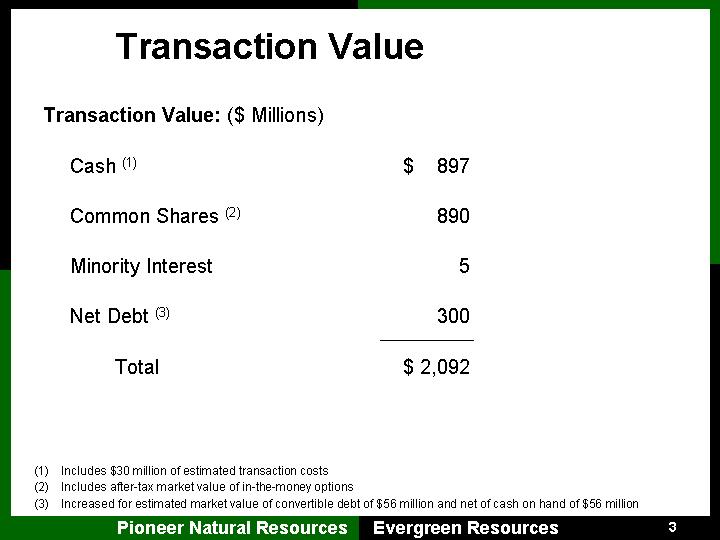
Transaction Value
Transaction Value: ($ Millions)
Cash (1) |
| $ | 897 |
|
|
|
|
| |
Common Shares (2) |
| 890 |
| |
|
|
|
| |
Minority Interest |
| 5 |
| |
|
|
|
| |
Net Debt (3) |
| 300 |
| |
|
|
|
| |
Total |
| $ | 2,092 |
|
(1) Includes $30 million of estimated transaction costs
(2) Includes after-tax market value of in-the-money options
(3) Increased for estimated market value of convertible debt of $56 million and net of cash on hand of $56 million
3
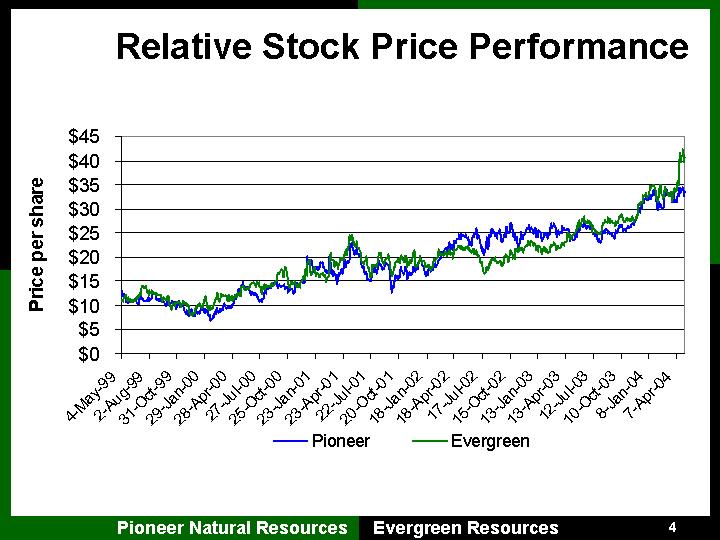
Relative Stock Price Performance
[CHART]
4
Strategic Implications
Pioneer Strategy |
| Evergreen Model |
|
|
|
• Moderate low-risk growth from onshore, long-lived foundation assets | [GRAPHIC] | • Best long-lived onshore gas platform in North America with excellent growth potential |
|
|
|
• Lower maintenance capital needed to preserve stable production and reserve base | [GRAPHIC] | • Maintenance capital requirements among lowest in upstream sector |
|
|
|
• Deploy portion of free cash flow to high impact, high return exploration and acquisitions | [GRAPHIC] | • Exceptional full cycle economics provide strong free cash flow available for reinvestment |
|
|
|
• Harvest portion of cash flow from exploration successes to rebalance portfolio with additional long-lived assets | [GRAPHIC] | • Reserve profile strongly complements diversified portfolio foundation |
|
|
|
• Grow through consolidation of core areas | [GRAPHIC] | • Substantial Rockies acreage position in key growth basins with significant consolidation potential |
|
|
|
• Strengthen expertise and improve ability Strengthen expertise and improve ability to leverage other plays | [GRAPHIC] | • Preeminent CBM platform providing ability to leverage expertise with • Statistic plays • Fracture stimulation technology • Low pressure gas gathering systems |
5
Evergreen Asset Base
[GRAPHIC]
Proved reserves |
| 1.5 TCFE |
|
% operated |
| ~100 | % |
% natural gas |
| ~100 | % |
% North America |
| 100 | % |
2003 net average production |
| 127 MMCFE/D |
|
Current net daily production |
| 150 MMCFE/D |
|
R/P ratio |
| 32 years |
|
PDP R/P ratio |
| 20 years |
|
Net acreage position |
| 1.8 million |
|
Probable reserves (96% Raton) |
| ~900 BCFE |
|
Identified drilling locations |
| 1,500+ |
|
6
Evergreen Reserve and Production Growth
Proved Reserves
[CHART]
Production
[CHART]
7
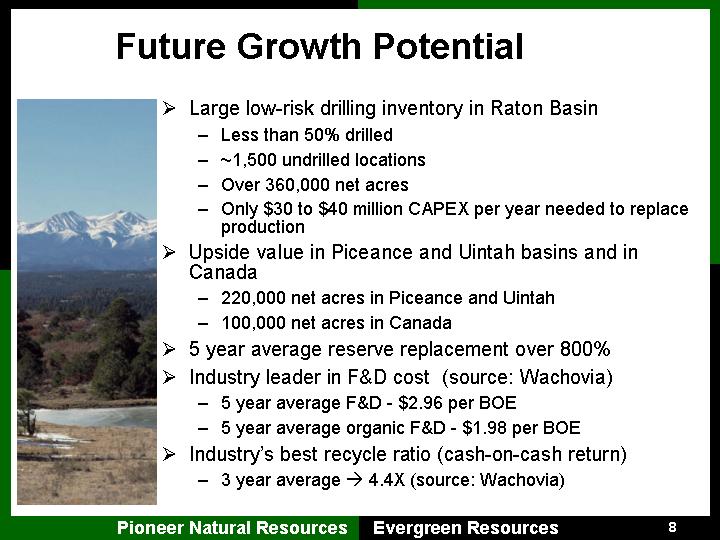
Future Growth Potential
[GRAPHIC]
• Large low-risk drilling inventory in Raton Basin
• Less than 50% drilled
• ~1,500 undrilled locations
• Over 360,000 net acres
• Only $30 to $40 million CAPEX per year needed to replace production
• Upside value in Piceance and Uintah basins and in Canada
• 220,000 net acres in Piceance and Uintah
• 100,000 net acres in Canada
• 5 year average reserve replacement over 800%
• Industry leader in F&D cost (source: Wachovia)
• 5 year average F&D - $2.96 per BOE
• 5 year average organic F&D - $1.98 per BOE
• Industry’s best recycle ratio (cash-on-cash return)
• 3 year average ® 4.4X (source: Wachovia)
8
Impact to Pioneer
• Adds 2.4 TCFE of proved and probable North America gas reserves at acquisition cost plus future development costs of $1.22 per MCFE
• Adds 1.5 TCFE of proved reserves at an acquisition finding cost of $1.40 per MCFE
• Adds ~900 BCFE of low-risk probable reserves
• Adds 2,000+ low-risk drilling locations
• Adds eight years of low-risk production growth from identified drilling locations
• Provides additional possible reserves and drilling locations, infill and extension
• Accretive to free cash flow per share in 2005
• Increases North America reserves from 81% to 86%
• Increases natural gas reserves from 46% to 59%
• Creates new core area onshore U.S.
• Creates operating efficiencies and economies of scale
• Provides Denver office to access Rockies opportunities
• Enhances Canadian asset portfolio
9
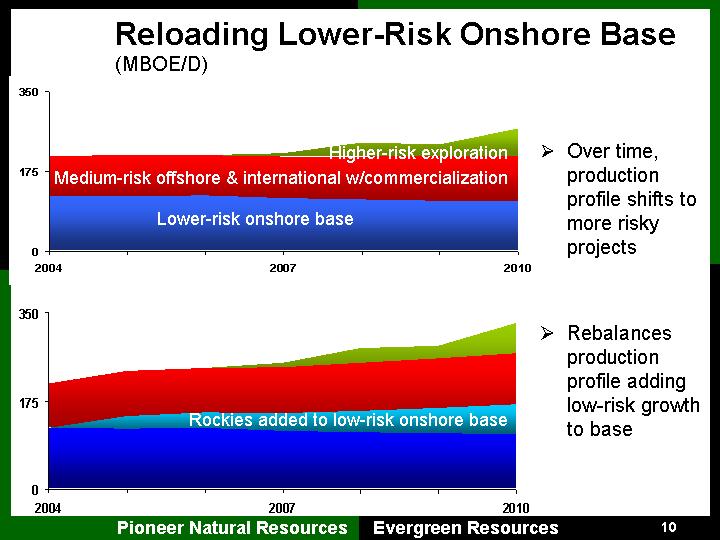
Reloading Lower-Risk Onshore Base
(MBOE/D)
[CHART]
• Over time, production profile shifts to more risky projects
[CHART]
• Rebalances production profile adding low-risk growth to base
10
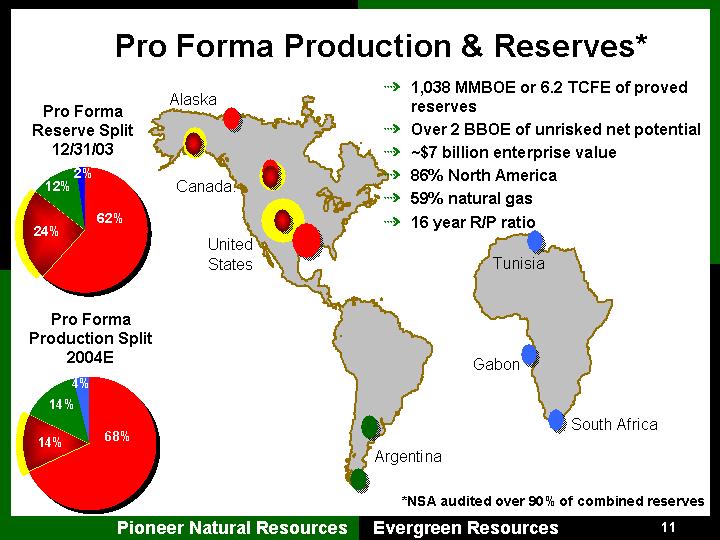
Pro Forma Production & Reserves*
Pro Forma Reserve Split 12/31/03
[CHART]
Pro Forma Production Split 2004E
[CHART]
[GRAPHIC]
• 1,038 MMBOE or 6.2 TCFE of proved reserves
• Over 2 BBOE of unrisked net potential
• ~$7 billion enterprise value
• 86% North America
• 59% natural gas
• 16 year R/P ratio
[GRAPHIC]
*NSA audited over 90% of combined reserves
11
Pro Forma Production Growth
[GRAPHIC]
*Assumes 09/30/04 Closing
12
Proved Reserves*
(MMBOE)
[CHART]
* As of 12/31/03, pro forma for acquisitions and divestitures. Peer group data compiled by J.P. Morgan Securities Inc.
13
Total Reserves/Production Ratio*
(Years)
[CHART]
* As of 12/31/03, pro forma for acquisitions and divestitures. Peer group data compiled by J.P. Morgan Securities Inc.
14
PDP Reserves/Production Ratio*
(Years)
[CHART]
* As of 12/31/03, pro forma for acquisitions and divestitures. Peer group data compiled by J.P. Morgan Securities Inc.
15
Conventional Gas vs. CBM Production
|
|
|
| Conventional Gas |
|
|
| CBM |
Gas Quality |
| • |
| Gas typically associated with NGLs: ~ 80% methane |
| • |
| Gas typically dry: ~ 99%+ methane, H2S not present |
Drilling |
| • |
| 500 to 15,000 feet |
| • |
| 500 to 5,000 feet |
Water Production |
| • |
| Usually brine; rates may increase during production life, water is typically re-injected |
| • |
| Rates typically decrease during production life, numerous options for disposal; water may be usable at surface |
Reservoir |
| • |
| Gas reserves and production are closely tied to initial pressure |
| • |
| Gas adsorbed onto the coal and produced when pressure decreased |
Production Mechanism |
| • |
| Reservoir pressure maintenance |
| • |
| Reservoir desorption and dewatering |
Compression |
| • |
| Fewer stages required |
| • |
| More stages required |
Well Drilling Pattern |
| • |
| Initially, 1 to 2 wells per section, but density may be increased |
| • |
| 4 to 8 wells per section |
Gas Production |
| • |
| Gas can be shut-in and reactivated with little problems |
| • |
| CBM well may need dewatering reinstated if not continually produced |
Production Profile |
|
|
| [CHART] |
|
|
| [CHART] |
16
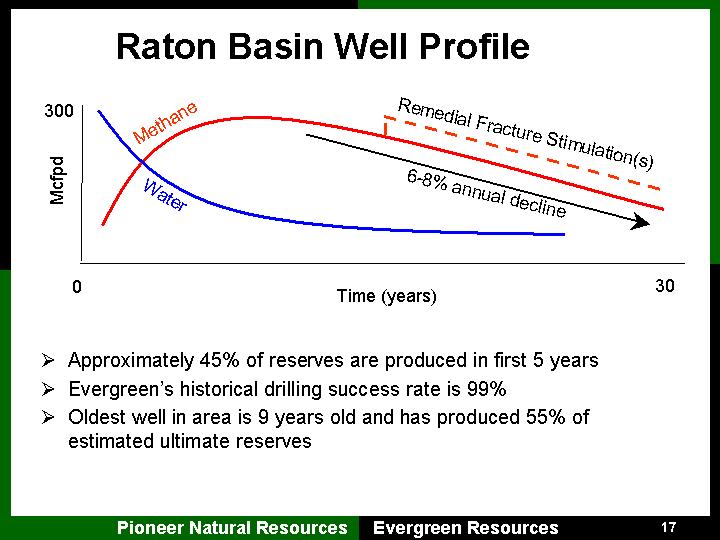
Raton Basin Well Profile
[CHART]
• Approximately 45% of reserves are produced in first 5 years
• Evergreen’s historical drilling success rate is 99%
• Oldest well in area is 9 years old and has produced 55% of estimated ultimate reserves
17
U.S. Conventional vs. Unconventional Gas Resource Potential (Tcf)
[GRAPHIC]
Source: Energy Information Administration, Office of Integrated Analysis and Forecasting (as of 1999)
[CHART]
Source: Cambridge Energy Research Associates
(Updated February 2004)
18
US Coal Bed Methane Resources
[GRAPHIC]
19
[GRAPHIC]
20
Expected U.S. CBM Production
|
| Average Well |
| Capacity Outlook (Bcf per day) |
| ||||||||||||
|
|
| 2000 |
| 2002 |
| 2003 |
| 2004 |
| 2005 |
| 2007 |
| 2010 |
| |
|
|
|
|
|
|
|
|
|
|
|
|
|
|
|
|
|
|
San Juan |
| 2,600 |
| 2.70 |
| 2.50 |
| 2.40 |
| 2.30 |
| 2.20 |
| 2.00 |
| 1.75 |
|
|
|
|
|
|
|
|
|
|
|
|
|
|
|
|
|
|
|
Powder River |
| 700/1,500 |
| 0.35 |
| 0.89 |
| 0.95 |
| 1.00 |
| 1.05 |
| 1.30 |
| 1.50 |
|
|
|
|
|
|
|
|
|
|
|
|
|
|
|
|
|
|
|
Raton |
| 1,500 |
| 0.10 |
| 0.20 |
| 0.23 |
| 0.27 |
| 0.30 |
| 0.35 |
| 0.40 |
|
|
|
|
|
|
|
|
|
|
|
|
|
|
|
|
|
|
|
Uintah |
| 3,500 |
| 0.20 |
| 0.23 |
| 0.27 |
| 0.31 |
| 0.35 |
| 0.40 |
| 0.55 |
|
|
|
|
|
|
|
|
|
|
|
|
|
|
|
|
|
|
|
Black Warrior |
| 1,800 |
| 0.31 |
| 0.31 |
| 0.31 |
| 0.31 |
| 0.31 |
| 0.29 |
| 0.25 |
|
|
|
|
|
|
|
|
|
|
|
|
|
|
|
|
|
|
|
Others (a) |
| — |
| 0.10 |
| 0.20 |
| 0.25 |
| 0.30 |
| 0.35 |
| 0.50 |
| 0.75 |
|
|
|
|
|
|
|
|
|
|
|
|
|
|
|
|
|
|
|
Subtotal |
|
|
| 3.76 |
| 4.33 |
| 4.41 |
| 4.49 |
| 4.56 |
| 4.84 |
| 5.20 |
|
|
|
|
|
|
|
|
|
|
|
|
|
|
|
|
|
|
|
Alaska |
| — |
| — |
| — |
| — |
| — |
| — |
| 0.01 |
| 0.05 |
|
|
|
|
|
|
|
|
|
|
|
|
|
|
|
|
|
|
|
Total US |
|
|
| 3.76 |
| 4.33 |
| 4.41 |
| 4.49 |
| 4.56 |
| 4.85 |
| 5.25 |
|
|
|
|
|
|
|
|
|
|
|
|
|
|
|
|
|
|
|
% of Total US Gas Production |
|
|
| 6.8 | % | 7.8 | % | 8.0 | % | 8.2 | % | 8.3 | % | 8.9 | % | 9.9 | % |
Source: Cambridge Energy Research Associates (Updated February 2004)
(a) Includes Arkoma, Appalachian, Cherokee, Forest City, Hanna and Illinois Basins.
21
Evergreen Asset Review
22
EVG Acreage Position
(thousands of acres)
|
| Developed |
| Undeveloped |
| Total |
| ||||||
|
| Gross |
| Net |
| Gross |
| Net |
| Gross |
| Net |
|
|
|
|
|
|
|
|
|
|
|
|
|
|
|
Raton |
| 224 |
| 205 |
| 189 |
| 161 |
| 413 |
| 367 |
|
Piceance/Uintah 53 |
| 48 |
| 192 |
| 176 |
| 245 |
| 223 |
|
|
|
Canada |
| 87 |
| 45 |
| 71 |
| 60 |
| 159 |
| 105 |
|
23
Vertically Integrated Operations
[GRAPHIC]
24
[GRAPHIC]
25
[GRAPHIC] |
| [GRAPHIC] |
|
|
|
[GRAPHIC] |
| [GRAPHIC] |
26
Raton Basin Comparative Well Economics
|
| Vermejo |
| Raton Coal |
| ||
|
|
|
|
|
| ||
Well Cost |
| $ | 400,000 |
| $ | 200,000 |
|
Reserves |
| ~ 1.15 Bcf |
| ~ 1.0 Bcf |
| ||
Finding Cost |
| $ | 0.35 / Mcf |
| $ | 0.20 / Mcf |
|
|
|
|
|
|
| ||
$4.00 per Mcf Nymex |
|
|
|
|
| ||
Payout |
| ~ 4.0 years |
| ~ 4.0 years |
| ||
ROI |
| > 6.5:1 |
| > 8:1 |
| ||
Rate of Return |
| > 40% |
| > 50% |
| ||
|
|
|
|
|
| ||
$5.00 per Mcf Nymex |
|
|
|
|
| ||
Payout |
| ~ 4.0 years |
| ~ 4.0 years |
| ||
ROI |
| > 8:1 |
| > 10:1 |
| ||
Rate of Return |
| > 50% |
| > 60% |
| ||
27
Raton Basin
[GRAPHIC]
• |
| Working Interest |
| 75% - 100% |
• |
| Operator |
| EVG |
• |
| Proved Reserves 12/31/03 (Bcfe) |
| 1,393 |
• |
| % PUD |
| 38% |
• |
| % Gas |
| 100% |
• |
| Current Production (MMcfe/d) |
| 133 |
• |
| R/P (Years) |
| 31 |
• |
| Net Developed Acreage |
| 205 K |
• |
| Net Undeveloped Acreage |
| 161 K |
• |
| Total Net Acreage |
| 367 K |
28
Raton Basin Geology
[GRAPHIC]
• Multiple intervals developed in new wells and existing wells through state-of-the-art recompletions
• The coals and tight sands of the Raton and Vermejo formations are primary objectives
• Extensive in-fill drilling opportunities in current gas price environment ($4.00/Mcf or greater)
• Vermejo coals: development, extensions & infill drilling. (~1,000 locations)
• Raton coals:
twin wells. (~400 locations)
• Opportunities in deep fractured shales and Raton sands
29
Piceance & Uintah Basins
[GRAPHIC]
• |
| Average Working Interest |
| 84% |
• |
| Operator |
| EVG, et al |
• |
| Proved Reserves 12/31/03 (Bcfe) |
| 65 |
• |
| % PUD |
| 49% |
• |
| % Gas |
| 94% |
• |
| Daily Production Since Acquisition (MMcfe/d) |
| 6 |
• |
| R/P (Years) |
| 37 |
• |
| Net Developed Acreage |
| 48 K |
• |
| Net Undeveloped Acreage |
| 176 K |
• |
| Total Net Acreage |
| 223 K |
30
Piceance & Uintah Opportunities
• Development drilling
• Stepout drilling
• Infill drilling
• Exploration drilling
• Recompletions of existing zones
• New zone additions
[GRAPHIC]
31
Potential Upside in Piceance/Uintah
• CBM Potential
• Douglas Creek Arch
• Mesa Verde Cameo Coals
• 15 ft to 30 ft net coal thicknesses
• < 1,500 ft drilling depths
• Active economic production pilot
• 250 possible locations (2 projects)
• 200 Bcf natural gas reserve potential
• Castlegate Field – Uintah Basin
• Remedial and recompletion potential (coiled tubing unit fracs)
• ~ 80 ft coal thicknesses with 400+ Scft/Ton gas content
• ~ 200 potential drilling locations (EVG-owned gathering system)
• Deepest pure CBM field in Rockies
• 0.5 Tcf natural gas reserve potential
32
• Rulison Field Recompletion Potential – Piceance Basin
• Multi-zone potential in Wasatch formation
• Bypassed pay behind pipe in existing wellbores
• Coiled tubing unit conveyed fracture stimulation technology
• EVG-owned gas gathering system in place
• 100+ remedial candidates
• Mancos “B” Recompletion Potential
• Wellbores with 1970 vintage frac jobs exhibiting low EUR’s
• ~ 100 remedial candidates
• Gas gathering system in place
• Coiled tubing unit conveyed fracture stimulation technology
• Production uplift and reserve add potential
33
Southeast Alberta
|
| Existing Conventional Resource |
|
|
|
|
|
|
|
• |
| Average Working Interest |
| 63% |
• |
| Operator |
| EVG, et al |
• |
| Proved Reserves 12/31/03 (Bcfe) |
| 37 |
• |
| % PUD |
| 28% |
• |
| % Gas |
| 88% |
• |
| Daily Production Since Acquisition (MMcfe/d) |
| 11 |
• |
| R/P (Years) |
| 11 |
• |
| Net Developed Acreage |
| 45 K |
• |
| Net Undeveloped Acreage |
| 60 K |
• |
| Total Acreage |
| 105 K |
[GRAPHIC]
34
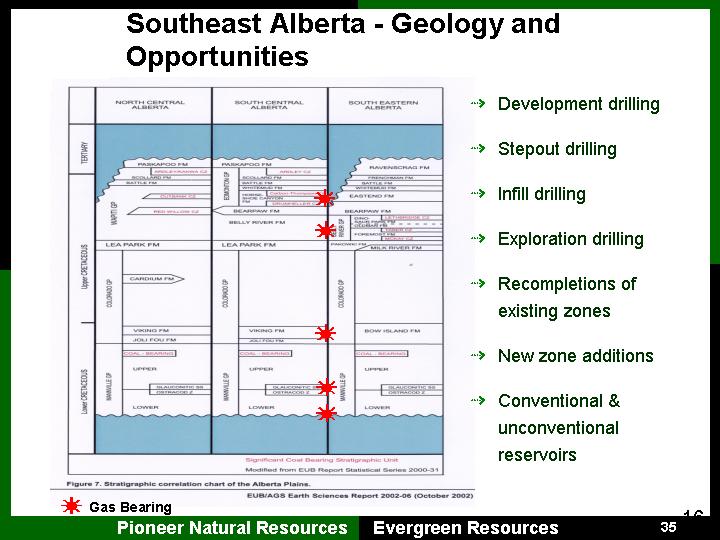
Southeast Alberta - Geology and Opportunities
[GRAPHIC]
• Development drilling
• Stepout drilling
• Infill drilling
• Exploration drilling
• Recompletions of existing zones
• New zone additions
• Conventional & unconventional reservoirs
35
Southeast Alberta - CBM Potential
• Plans for 2004
• Mannville Coals
• 50/50 JV on 50,000+ acres
• Two 4-well pilot projects planned for 2004
• Recompletion opportunities in existing well bores
• Horseshoe Canyon Coals
• 100% WI in 12,800 acres
• 6 wells planned for 2004
• Recompletion opportunities in existing well bores
• EVG acreage adjacent to economic Encana & MJV Palliser Horseshoe Canyon CBM projects
• All producing 100+ Mcf/d
• Drilling depths of between 1,000 ft and 1,500 ft
• High rate nitrogen frac jobs
• Water-free production
• Several Mannville CBM pilot projects in dewatering phase
36
Pioneer Asset Review
37
North America Onshore
[GRAPHIC]
• Canadian assets focused in NE BC/Alberta area
• ~$61MM operating cash flow in 2003
• Strong winter drilling program
• Platform for growth
[GRAPHIC]
• ~$530MM operating cash flow in 2003
• Provide stable production & cash flow
• Control midstream
• R/P Ratio of 20 years
• Less capital required to maintain production
• Multi-year inventory of locations
• 100% ownership
38
Argentina – On Track for Growth
[GRAPHIC]
18% CAGR Prior to 2001
[CHART]
• Gas sales have grown significantly over last 6 months
• LPG realizations drive full cycle gas returns of 3:1
• Argentine government announced increase in gas prices
• 12-17% production growth expected in 2004, doubled capital program
• Continuing active oil development
• Expanding exploration effort targeting deeper gas potential
• Demand for Neuquen gas projected to increase by ~1 Bcfepd by 2008
39
Offshore Producing Assets
• Deepwater Gulf of Mexico
• Canyon Express gas production exceeding expectations for first quarter
• ~$190 million operating cash flow in 2003
• Falcon corridor gas sales stronger than expected, Harrier production on ahead of schedule during first quarter
• ~$200 million operating cash flow in 2003
• Offshore South Africa
• Sable field oil production stabilized, meeting expectations for first quarter
40
Gulf of Mexico Development
[GRAPHIC]
41
Commercialization
• Alaska
• Evaluating commercialization of Jurassic discovery in Oooguruk field
• ~63,000 acre position in Oooguruk field area
• North Africa Gas
• Gas discovered on Anaguid and BEK blocks
• Evaluating market for gas and potential for developing infrastructure
• Gabon
• Expect to submit plan of development by June
• South Africa Gas
• Negotiating gas contract price and evaluating development cost
42
Exploration – 4 Areas of Focus
[GRAPHIC]
• Alaska
• Prolific petroleum system
• U.S. fiscal terms
• High-impact opportunities
• Balanced opportunity set
• Strong relationships with existing companies
• Gulf of Mexico
• Prolific petroleum system
• U.S. fiscal terms
• Company-impact prospect size
• Strong returns
• Ability to partner, spread risk
• North Africa
• Targeted prolific Ghadames Basin
• Low-cost entry opportunity in southern Tunisia with good fiscal terms
• Lower-risk exploration with existing infrastructure
• Ghadames Basin extends into Algeria and Libya
• West Africa
• Prolific petroleum system
• Billion+ BOE potential
• Strong partner in Kosmos
• Decreases lead time
• Early in exploration life cycle
43
Deepwater GOM Exploration
[GRAPHIC]
• Deepwater, targeting drilling depths of >20,000 ft
• Prospect mean reserve potential 150-250 Mmboe
• Farm-in opportunities
• ~2,800 leases expiring 2006-2008
• Continue to acquire new leases
• Apparent high bidder on 14 leases in March 2004 lease sale
44
Alaska
[GRAPHIC]
• Added 23,000 acres adjacent to Oooguruk discovery
• Evaluating development of the Jurassic pay in Oooguruk field
• High bidder on 53 tracts in recent lease sale
• >180,000 total acres
45
North Africa
• Prolific Ghadames Basin
• 5 Million Net Acres on 5 Blocks
• Five successful wells drilled to date
• Adam 1, Adam 2 and Hawa producing
• Evaluating development plans for two second quarter discoveries on Anaguid block
• Planning to test potential expansion of Ordovician and Silurian discoveries
• 5-8 wells in 2004
• Potential for significant field expansion beyond four-way closures
[GRAPHIC]
46
West Africa
• Olowi Discovery Offshore Gabon
• Improved terms
• 314,000 acres
• Pioneer-operated, 100% WI
• 3 wells tested 2,000+ BOPD from Lower Gamba
• Recent Joint Venture
• Explore from Morocco to Angola, excluding Gabon
• Joined Kosmos, led by former Triton and Gulf Canada executives
• Proven West African exploration track record
• Decreases lead time
West Africa 1998-2003
• High potential – over 14 BBOE found
• Sizable fields – up to 1 BBO; average field size over 100 MBO
• Affordable risk – 1:3 success ratio
[GRAPHIC]
47
Financial
48
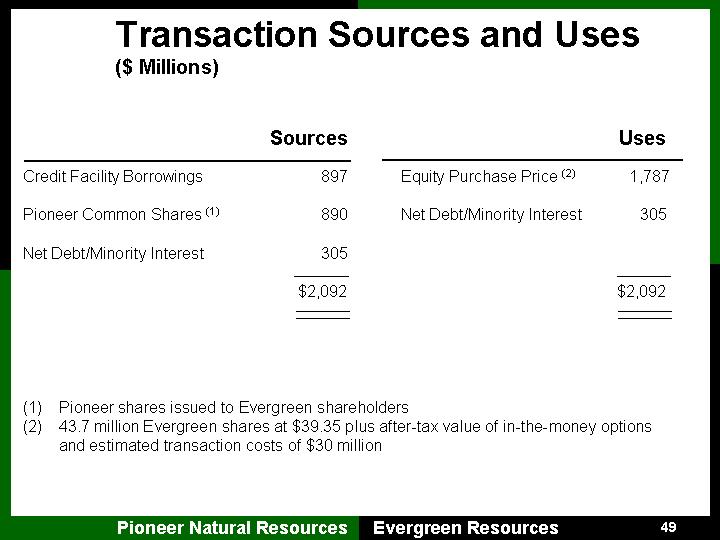
Transaction Sources and Uses
($ Millions)
|
| Sources |
| |
|
|
|
| |
Credit Facility Borrowings |
| 897 |
| |
|
|
|
| |
Pioneer Common Shares (1) |
| 890 |
| |
|
|
|
| |
Net Debt/Minority Interest |
| 305 |
| |
|
|
|
| |
|
| $ | 2,092 |
|
|
| Uses |
| |
|
|
|
| |
Equity Purchase Price (2) |
| 1,787 |
| |
|
|
|
| |
Net Debt/Minority Interest |
| 305 |
| |
|
|
|
| |
|
| $ | 2,092 |
|
(1) Pioneer shares issued to Evergreen shareholders
(2) 43.7 million Evergreen shares at $39.35 plus after-tax value of in-the-money options and estimated transaction costs of $30 million
49
Preliminary Purchase Price Allocation
($ Millions)
Purchase Price |
|
|
| |
Equity purchase price ($19.85 + 0.58175 share of Pioneer) |
| $ | 1,787 |
|
Minority interest |
| 5 |
| |
Net debt |
| 300 |
| |
Enterprise value |
| 2,092 |
| |
Plus other net liabilities |
| 102 |
| |
Plus other deferred income taxes |
| 709 |
| |
Total transaction value |
| $ | 2,903 |
|
|
|
|
| |
Value Allocation |
|
|
| |
Proved oil & gas properties |
| $ | 2,246 |
|
Unproved oil & gas properties |
| 419 |
| |
Other assets |
| 38 |
| |
Goodwill |
| 200 |
| |
Total value of assets acquired |
| $ | 2,903 |
|
50
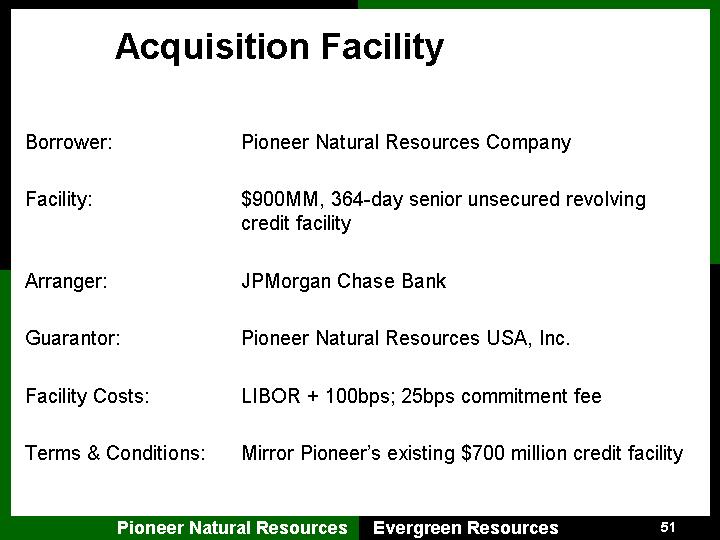
Acquisition Facility
Borrower: |
| Pioneer Natural Resources Company |
|
|
|
Facility: |
| $900MM, 364-day senior unsecured revolving credit facility |
|
|
|
Arranger: |
| JPMorgan Chase Bank |
|
|
|
Guarantor: |
| Pioneer Natural Resources USA, Inc. |
|
|
|
Facility Costs: |
| LIBOR + 100bps; 25bps commitment fee |
|
|
|
Terms & Conditions: |
| Mirror Pioneer’s existing $700 million credit facility |
51
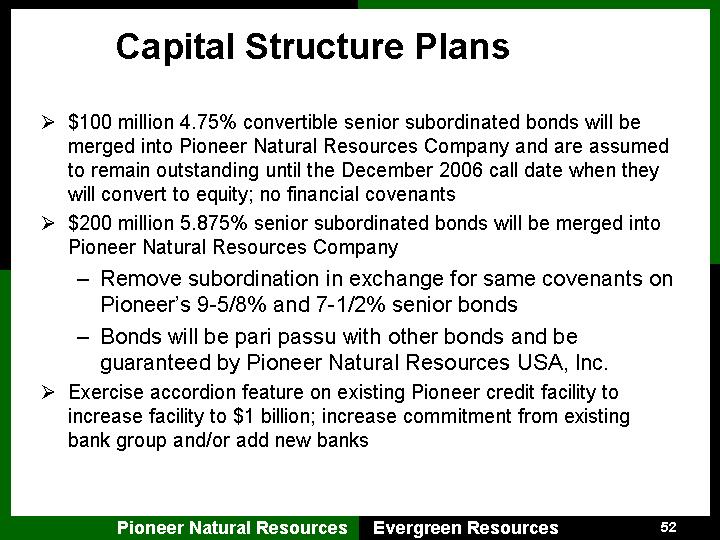
Capital Structure Plans
• $100 million 4.75% convertible senior subordinated bonds will be merged into Pioneer Natural Resources Company and are assumed to remain outstanding until the December 2006 call date when they will convert to equity; no financial covenants
• $200 million 5.875% senior subordinated bonds will be merged into Pioneer Natural Resources Company
• Remove subordination in exchange for same covenants on Pioneer’s 9-5/8% and 7-1/2% senior bonds
• Bonds will be pari passu with other bonds and be guaranteed by Pioneer Natural Resources USA, Inc.
• Exercise accordion feature on existing Pioneer credit facility to increase facility to $1 billion; increase commitment from existing bank group and/or add new banks
52
Forward Looking Statements
This presentation contains forward-looking statements within the meaning of federal securities laws, including statements regarding, among other things, the company’s growth strategies; anticipated trends in the company’s business and its future results of operations; market conditions in the oil and gas industry; the ability of the company to make and integrate acquisitions; and the impact of government regulations. These forward-looking statements are based largely on the company’s expectations and are subject to a number of risks and uncertainties, many of which are beyond the company’s control. Actual results could differ materially from those implied by these forward-looking statements as a result of, among other things, a decline in natural gas production, a decline in natural gas prices, incorrect estimations of required capital expenditures, increases in the cost of drilling, completion and gas collection, an increase in the cost of production and operations, an inability to meet projections, and/or changes in general economic conditions. In light of these and other risks and uncertainties of which the company may be unaware or which the company currently deems immaterial, there can be no assurance that actual results will be as projected in the forward-looking statements. These and other risks and uncertainties are described in more detail in the company’s most recent Annual Report on Form 10-K filed with the Securities and Exchange Commission.
53
[GRAPHIC]
EVERGREEN RESOURCES, INC.
San Francisco
June 1, 2004
54
# # # # #
Legal Information
This filing contains forward-looking statements within the meaning of federal securities laws, including statements regarding, among other things, Evergreen’s growth strategies; anticipated trends in Evergreen’s business and its future results of operations; market conditions in the oil and gas industry; the ability of the company to make and integrate acquisitions; and the impact of government regulations. These forward-looking statements are based largely on Evergreen’s expectations and are subject to a number of risks and uncertainties, many of which are beyond Evergreen’s control. Actual results could differ materially from those implied by these forward-looking statements as a result of, among other things, a decline in natural gas production, a decline in natural gas prices, incorrect estimations of required capital expenditures, increases in the cost of drilling, completion and gas collection, an increase in the cost of production and operations, an inability to meet projections, and/or changes in general economic conditions. In light of these and other risks and uncertainties of which Evergreen may be unaware or which Evergreen currently deems immaterial, there can be no assurance that actual results will be as projected in the forward-looking statements. These and other risks and uncertainties are described in more detail in Evergreen’s most recent Annual Report on Form 10-K filed with the Securities and Exchange Commission.
This filing also contains forward looking statements regarding Evergreen’s proposed merger with a wholly owned subsidiary of Pioneer Natural Resources. Forward-looking statements relating to expectations about future results or events regarding the proposed merger are based upon information available to Evergreen as of today’s date, and Evergreen does not assume any obligation to update any of these statements. The forward-looking statements are not guarantees of the future performance of Pioneer, Evergreen or the combined company, and actual results may vary materially from the results and expectations discussed. For instance, although Pioneer and Evergreen have signed an agreement for a subsidiary of Pioneer to merge with Evergreen, there is no assurance that they will complete the proposed merger. The merger agreement will terminate if the companies do not receive necessary approval of each of Pioneer’s and Evergreen’s stockholders or government approvals or fail to satisfy conditions to closing. Additional risks and uncertainties related to the proposed merger include, but are not limited to, conditions in the financial markets relevant to the proposed merger, the successful integration of Evergreen into Pioneer’s business, and each company’s ability to compete in the highly competitive oil and gas exploration and production industry. The revenues, earnings and business prospects of Pioneer, Evergreen and the combined company and their ability to achieve planned business objectives will be subject to a number of risks and uncertainties. These risks and uncertainties include, among other things, volatility of oil and gas prices, product supply and demand, competition, government regulation or action, foreign currency valuation changes, foreign government tax and regulation changes, litigation, the costs and results of drilling and operations, Pioneer’s and Evergreen’s ability to replace reserves, implement its business plans, or complete its development projects as scheduled, access to and cost of capital, uncertainties about estimates of reserves, quality of technical data, environmental and weather risks, acts of war or terrorism. These and other risks are identified from time to time in Pioneer’s and Evergreen’s SEC reports and public announcements.
The proposed merger of Evergreen with a wholly owned subsidiary of Pioneer will be submitted to each of Pioneer’s and Evergreen’s stockholders for their consideration, and Pioneer will file with the SEC a registration statement containing the joint proxy statement–prospectus to be used by Pioneer to solicit approval of its stockholders to issue additional stock in the merger and to be used by Evergreen to solicit the approval of its
stockholders for the proposed merger. Pioneer and Evergreen will also file other documents concerning the proposed merger. You are urged to read the registration statement and the joint proxy statement–prospectus regarding the proposed merger when they become available and any other relevant documents filed with the SEC, as well as any amendments or supplements to those documents, because they will contain important information. You will be able to obtain a free copy of the joint proxy statement–prospectus including the registration statement, as well as other filings containing information about Evergreen at the SEC’s Internet Site (http://www.sec.gov). Copies of the joint proxy statement–prospectus can also be obtained, without charge, by directing a request to Evergreen Resources, Inc., John B. Kelso, 1401 17th Street, Suite 1200, Denver, Colorado 80202, or via telephone at 303-298-8100.
Evergreen and its directors and executive officers may be deemed to be participants in the solicitation of proxies from the stockholders of Evergreen in connection with the proposed merger. Pioneer and its directors and executive officers may be deemed to be participants in the solicitation of proxies from the stockholders of Pioneer in connection with the proposed merger. Additional information regarding the interests of those participants may be obtained by reading the joint proxy statement–prospectus regarding the proposed merger when it becomes available.