Fidelity® Trend Fund
Annual Report
December 31, 2019

See the inside front cover for important information about access to your fund’s shareholder reports.

Beginning on January 1, 2021, as permitted by regulations adopted by the Securities and Exchange Commission, paper copies of a fund’s shareholder reports will no longer be sent by mail, unless you specifically request paper copies of the reports from the fund or from your financial intermediary, such as a financial advisor, broker-dealer or bank. Instead, the reports will be made available on a website, and you will be notified by mail each time a report is posted and provided with a website link to access the report.
If you already elected to receive shareholder reports electronically, you will not be affected by this change and you need not take any action. You may elect to receive shareholder reports and other communications from a fund electronically, by contacting your financial intermediary. For Fidelity customers, visit Fidelity's web site or call Fidelity using the contact information listed below.
You may elect to receive all future reports in paper free of charge. If you wish to continue receiving paper copies of your shareholder reports, you may contact your financial intermediary or, if you are a Fidelity customer, visit Fidelity’s website, or call Fidelity at the applicable toll-free number listed below. Your election to receive reports in paper will apply to all funds held with the fund complex/your financial intermediary.
| Account Type | Website | Phone Number |
| Brokerage, Mutual Fund, or Annuity Contracts: | fidelity.com/mailpreferences | 1-800-343-3548 |
| Employer Provided Retirement Accounts: | netbenefits.fidelity.com/preferences (choose 'no' under Required Disclosures to continue to print) | 1-800-343-0860 |
| Advisor Sold Accounts Serviced Through Your Financial Intermediary: | Contact Your Financial Intermediary | Your Financial Intermediary's phone number |
| Advisor Sold Accounts Serviced by Fidelity: | institutional.fidelity.com | 1-877-208-0098 |
Contents
To view a fund's proxy voting guidelines and proxy voting record for the 12-month period ended June 30, visit http://www.fidelity.com/proxyvotingresults or visit the Securities and Exchange Commission's (SEC) web site at http://www.sec.gov.
You may also call 1-800-544-8544 to request a free copy of the proxy voting guidelines.
Standard & Poor's, S&P and S&P 500 are registered service marks of The McGraw-Hill Companies, Inc. and have been licensed for use by Fidelity Distributors Corporation.
Other third-party marks appearing herein are the property of their respective owners.
All other marks appearing herein are registered or unregistered trademarks or service marks of FMR LLC or an affiliated company. © 2020 FMR LLC. All rights reserved.
This report and the financial statements contained herein are submitted for the general information of the shareholders of the Fund. This report is not authorized for distribution to prospective investors in the Fund unless preceded or accompanied by an effective prospectus.
A fund files its complete schedule of portfolio holdings with the SEC for the first and third quarters of each fiscal year on Form N-PORT. Forms N-PORT are available on the SEC’s web site at http://www.sec.gov. A fund's Forms N-PORT may be reviewed and copied at the SEC’s Public Reference Room in Washington, DC. Information regarding the operation of the SEC's Public Reference Room may be obtained by calling 1-800-SEC-0330.
For a complete list of a fund's portfolio holdings, view the most recent holdings listing, semiannual report, or annual report on Fidelity's web site at http://www.fidelity.com, http://www.institutional.fidelity.com, or http://www.401k.com, as applicable.
NOT FDIC INSURED •MAY LOSE VALUE •NO BANK GUARANTEE
Neither the Fund nor Fidelity Distributors Corporation is a bank.
Performance: The Bottom Line
Average annual total return reflects the change in the value of an investment, assuming reinvestment of distributions from dividend income and capital gains (the profits earned upon the sale of securities that have grown in value, if any) and assuming a constant rate of performance each year. The hypothetical investment and the average annual total returns do not reflect the deduction of taxes that a shareholder would pay on fund distributions or the redemption of fund shares. During periods of reimbursement by Fidelity, a fund’s total return will be greater than it would be had the reimbursement not occurred. How a fund did yesterday is no guarantee of how it will do tomorrow.
Average Annual Total Returns
| For the periods ended December 31, 2019 | Past 1 year | Past 5 years | Past 10 years |
| Fidelity® Trend Fund | 35.88% | 13.45% | 14.94% |
$10,000 Over 10 Years
Let's say hypothetically that $10,000 was invested in Fidelity® Trend Fund on December 31, 2009.
The chart shows how the value of your investment would have changed, and also shows how the Russell 1000® Growth Index performed over the same period.
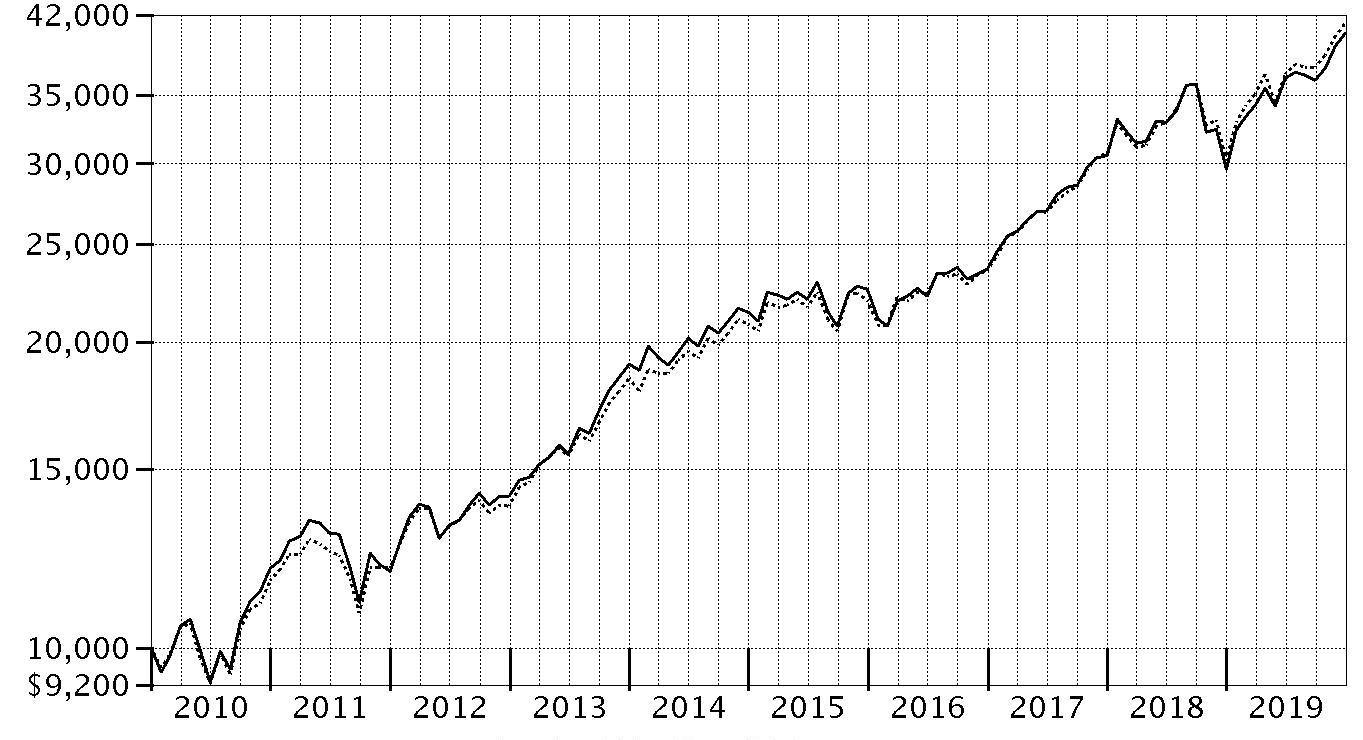
| Period Ending Values |
| $40,259 | Fidelity® Trend Fund |
| $41,234 | Russell 1000® Growth Index |
Management's Discussion of Fund Performance
Market Recap: U.S. stocks continued to roll in 2019, with the S&P 500
® index soaring 31.49% and marking history as the longest and strongest bull market ever, despite persistent, nagging concerns about global economic growth and trade. After a rough end to 2018, equities sharply reversed course to begin the new year amid upbeat company earnings and signs the Federal Reserve may pause on rates. The uptrend continued until May, when the index sunk as trade negotiations between the U.S. and China broke down. The bull market roared back to record a series of highs in July, when the Fed cut interest rates for the first time since 2008. Volatility intensified in August, as the Treasury yield curve inverted, which some investors viewed as a sign the U.S. economy could be heading for recession. But the market proved resilient, hitting a new high on October 30, when the Fed lowered rates for the third time in 2019, and moving even higher through year-end. Gains were robust and broad-based, with information technology (+50%) leading the way with its best calendar-year result in a decade, amid strong growth trends. Communication services (+33%) and financials (+32%) also stood out. In contrast, energy (+12%) was by far the weakest group – struggling amid sluggish oil prices – while several strong gainers nonetheless fell short of the broader market: industrials and real estate (+29% each), consumer discretionary and consumer staples (+28% each), utilities (+26%), materials (+25%), and health care (+21%).
Comments from Portfolio Manager Shilpa Mehra: For the year, the fund gained 35.88%, slightly trailing the 36.39% advance of the benchmark Russell 1000 Growth Index. Stock picks in the communication services sector hindered relative performance the most, whereas security selection in health care and an underweighting in consumer staples helped. Versus the benchmark, the portfolio's biggest individual detractor was an underweighting in consumer technology leader Apple (+89%), which saw its valuation appreciate amid better-than-expected revenue growth in its services and wearables segments in 2019. The untimely sale of managed health care company Humana (-13%) last spring also hurt the fund’s relative result, as fading hopes for near-term passage of a single-payer system subsequently triggered a strong rebound in the stock. Conversely, the portfolio benefited from initiating an underweight stake in pharmaceuticals company AbbVie (+39%) at a low point this period, following news late last June that it would acquire Ireland-based Botox
® maker Allergan. As investors gained more confidence in the merits and terms of the deal, AbbVie’s share price took off. Lastly, not owning networking equipment company and index component Cisco Systems also contributed to relative performance, as an uncertain global macroeconomic environment slowed technology hardware spending, leading to earnings and outlook reductions that resulted in the stock’s -11% return within the benchmark.
The views expressed above reflect those of the portfolio manager(s) only through the end of the period as stated on the cover of this report and do not necessarily represent the views of Fidelity or any other person in the Fidelity organization. Any such views are subject to change at any time based upon market or other conditions and Fidelity disclaims any responsibility to update such views. These views may not be relied on as investment advice and, because investment decisions for a Fidelity fund are based on numerous factors, may not be relied on as an indication of trading intent on behalf of any Fidelity fund.
Note to shareholders: On April 1, 2019, Dan Kelley transitioned off of the fund, leaving Shilpa Mehra sole Portfolio Manager of the fund.
Investment Summary (Unaudited)
Top Ten Stocks as of December 31, 2019
| | % of fund's net assets |
| Microsoft Corp. | 8.3 |
| Amazon.com, Inc. | 4.9 |
| Apple, Inc. | 4.6 |
| Alphabet, Inc. Class A | 4.4 |
| MasterCard, Inc. Class A | 4.2 |
| Facebook, Inc. Class A | 3.6 |
| UnitedHealth Group, Inc. | 1.9 |
| Adobe, Inc. | 1.6 |
| NVIDIA Corp. | 1.4 |
| NIKE, Inc. Class B | 1.3 |
| | 36.2 |
Top Five Market Sectors as of December 31, 2019
| | % of fund's net assets |
| Information Technology | 44.1 |
| Health Care | 15.8 |
| Consumer Discretionary | 12.2 |
| Communication Services | 10.6 |
| Industrials | 10.1 |
Asset Allocation (% of fund's net assets)
| As of December 31, 2019* |
| | Stocks | 99.5% |
| | Convertible Securities | 0.3% |
| | Short-Term Investments and Net Other Assets (Liabilities) | 0.2% |

* Foreign investments - 7.2%
Schedule of Investments December 31, 2019
Showing Percentage of Net Assets
| Common Stocks - 99.5% | | | |
| | | Shares | Value (000s) |
| COMMUNICATION SERVICES - 10.6% | | | |
| Entertainment - 1.1% | | | |
| Netflix, Inc. (a) | | 71,180 | $23,032 |
| Interactive Media & Services - 9.1% | | | |
| Alphabet, Inc. Class A (a) | | 68,885 | 92,264 |
| CarGurus, Inc. Class A (a) | | 233,600 | 8,218 |
| Facebook, Inc. Class A (a) | | 361,965 | 74,293 |
| IAC/InterActiveCorp (a) | | 31,700 | 7,897 |
| Match Group, Inc. (b) | | 88,100 | 7,234 |
| | | | 189,906 |
| Wireless Telecommunication Services - 0.4% | | | |
| T-Mobile U.S., Inc. (a) | | 102,600 | 8,046 |
|
| TOTAL COMMUNICATION SERVICES | | | 220,984 |
|
| CONSUMER DISCRETIONARY - 11.9% | | | |
| Automobiles - 0.3% | | | |
| Tesla, Inc. (a) | | 16,000 | 6,693 |
| Diversified Consumer Services - 0.7% | | | |
| Arco Platform Ltd. Class A (a) | | 177,300 | 7,837 |
| Bright Horizons Family Solutions, Inc. (a) | | 43,700 | 6,568 |
| | | | 14,405 |
| Hotels, Restaurants & Leisure - 2.0% | | | |
| Chipotle Mexican Grill, Inc. (a) | | 12,400 | 10,380 |
| Domino's Pizza, Inc. | | 22,800 | 6,698 |
| Marriott International, Inc. Class A | | 74,000 | 11,206 |
| McDonald's Corp. | | 44,400 | 8,774 |
| Vail Resorts, Inc. | | 16,900 | 4,053 |
| | | | 41,111 |
| Internet & Direct Marketing Retail - 4.9% | | | |
| Amazon.com, Inc. (a) | | 54,383 | 100,491 |
| The RealReal, Inc. | | 4,100 | 77 |
| Wayfair LLC Class A (a) | | 8,000 | 723 |
| | | | 101,291 |
| Multiline Retail - 0.7% | | | |
| Dollar General Corp. | | 74,200 | 11,574 |
| Dollar Tree, Inc. (a) | | 42,800 | 4,025 |
| | | | 15,599 |
| Specialty Retail - 0.9% | | | |
| TJX Companies, Inc. | | 290,100 | 17,714 |
| Textiles, Apparel & Luxury Goods - 2.4% | | | |
| Hermes International SCA | | 6,900 | 5,156 |
| LVMH Moet Hennessy Louis Vuitton SE | | 25,900 | 12,068 |
| Moncler SpA | | 127,200 | 5,717 |
| NIKE, Inc. Class B | | 267,600 | 27,111 |
| | | | 50,052 |
|
| TOTAL CONSUMER DISCRETIONARY | | | 246,865 |
|
| CONSUMER STAPLES - 2.6% | | | |
| Beverages - 0.9% | | | |
| Keurig Dr. Pepper, Inc. (b) | | 240,600 | 6,965 |
| Monster Beverage Corp. (a) | | 58,800 | 3,737 |
| The Coca-Cola Co. | | 149,000 | 8,247 |
| | | | 18,949 |
| Food & Staples Retailing - 1.1% | | | |
| Costco Wholesale Corp. | | 74,200 | 21,809 |
| Personal Products - 0.6% | | | |
| Estee Lauder Companies, Inc. Class A | | 63,800 | 13,177 |
|
| TOTAL CONSUMER STAPLES | | | 53,935 |
|
| FINANCIALS - 2.4% | | | |
| Banks - 0.5% | | | |
| HDFC Bank Ltd. sponsored ADR | | 165,000 | 10,456 |
| Capital Markets - 1.9% | | | |
| Intercontinental Exchange, Inc. | | 98,100 | 9,079 |
| Moody's Corp. | | 74,600 | 17,711 |
| MSCI, Inc. | | 49,100 | 12,677 |
| | | | 39,467 |
|
| TOTAL FINANCIALS | | | 49,923 |
|
| HEALTH CARE - 15.8% | | | |
| Biotechnology - 3.4% | | | |
| AbbVie, Inc. | | 242,500 | 21,471 |
| Amgen, Inc. | | 22,800 | 5,496 |
| Exact Sciences Corp. (a) | | 88,800 | 8,212 |
| Intercept Pharmaceuticals, Inc. (a) | | 22,200 | 2,751 |
| Neurocrine Biosciences, Inc. (a) | | 53,800 | 5,783 |
| Sarepta Therapeutics, Inc. (a) | | 52,000 | 6,710 |
| Vertex Pharmaceuticals, Inc. (a) | | 92,900 | 20,340 |
| | | | 70,763 |
| Health Care Equipment & Supplies - 5.3% | | | |
| Becton, Dickinson & Co. | | 39,000 | 10,607 |
| Boston Scientific Corp. (a) | | 359,442 | 16,254 |
| Danaher Corp. | | 63,700 | 9,777 |
| IDEXX Laboratories, Inc. (a) | | 62,500 | 16,321 |
| Insulet Corp. (a) | | 38,813 | 6,645 |
| Intuitive Surgical, Inc. (a) | | 29,550 | 17,468 |
| Masimo Corp. (a) | | 40,100 | 6,338 |
| Penumbra, Inc. (a) | | 37,400 | 6,144 |
| Stryker Corp. | | 96,300 | 20,217 |
| | | | 109,771 |
| Health Care Providers & Services - 2.7% | | | |
| Centene Corp. (a) | | 125,800 | 7,909 |
| UnitedHealth Group, Inc. | | 134,000 | 39,393 |
| Wellcare Health Plans, Inc. (a) | | 25,000 | 8,255 |
| | | | 55,557 |
| Health Care Technology - 0.0% | | | |
| Veeva Systems, Inc. Class A (a) | | 307 | 43 |
| Life Sciences Tools & Services - 1.5% | | | |
| 10X Genomics, Inc. (a) | | 3,200 | 244 |
| Mettler-Toledo International, Inc. (a) | | 5,800 | 4,601 |
| Thermo Fisher Scientific, Inc. | | 80,700 | 26,217 |
| | | | 31,062 |
| Pharmaceuticals - 2.9% | | | |
| Bristol-Myers Squibb Co. | | 173,700 | 11,150 |
| Dechra Pharmaceuticals PLC | | 269,200 | 10,341 |
| Eli Lilly & Co. | | 172,500 | 22,672 |
| Zoetis, Inc. Class A | | 123,000 | 16,279 |
| | | | 60,442 |
|
| TOTAL HEALTH CARE | | | 327,638 |
|
| INDUSTRIALS - 10.1% | | | |
| Aerospace & Defense - 3.0% | | | |
| Airbus Group NV | | 35,700 | 5,240 |
| HEICO Corp. Class A | | 173,200 | 15,507 |
| Lockheed Martin Corp. | | 14,100 | 5,490 |
| Northrop Grumman Corp. | | 50,900 | 17,508 |
| TransDigm Group, Inc. | | 33,700 | 18,872 |
| | | | 62,617 |
| Commercial Services & Supplies - 2.5% | | | |
| Cintas Corp. | | 55,300 | 14,880 |
| Copart, Inc. (a) | | 181,000 | 16,460 |
| Rollins, Inc. | | 322,300 | 10,687 |
| Waste Connection, Inc. (United States) | | 107,600 | 9,769 |
| | | | 51,796 |
| Electrical Equipment - 0.3% | | | |
| AMETEK, Inc. | | 51,500 | 5,137 |
| Machinery - 1.8% | | | |
| Fortive Corp. | | 80,650 | 6,161 |
| Gardner Denver Holdings, Inc. (a) | | 254,000 | 9,317 |
| Graco, Inc. | | 119,300 | 6,204 |
| IDEX Corp. | | 48,900 | 8,411 |
| Nordson Corp. | | 47,500 | 7,735 |
| | | | 37,828 |
| Professional Services - 1.5% | | | |
| CoStar Group, Inc. (a) | | 27,400 | 16,393 |
| IHS Markit Ltd. (a) | | 84,500 | 6,367 |
| Verisk Analytics, Inc. | | 61,700 | 9,214 |
| | | | 31,974 |
| Road & Rail - 1.0% | | | |
| Union Pacific Corp. | | 109,900 | 19,869 |
|
| TOTAL INDUSTRIALS | | | 209,221 |
|
| INFORMATION TECHNOLOGY - 44.1% | | | |
| Communications Equipment - 0.4% | | | |
| Arista Networks, Inc. (a) | | 38,600 | 7,851 |
| Ubiquiti, Inc. (b) | | 8,200 | 1,550 |
| | | | 9,401 |
| Electronic Equipment & Components - 1.9% | | | |
| Amphenol Corp. Class A | | 97,000 | 10,498 |
| CDW Corp. | | 80,600 | 11,513 |
| Littelfuse, Inc. | | 26,300 | 5,031 |
| Zebra Technologies Corp. Class A (a) | | 49,300 | 12,593 |
| | | | 39,635 |
| IT Services - 12.7% | | | |
| Accenture PLC Class A | | 105,600 | 22,236 |
| Adyen BV (a)(c) | | 11,065 | 9,073 |
| Automatic Data Processing, Inc. | | 99,700 | 16,999 |
| Black Knight, Inc. (a) | | 252,200 | 16,262 |
| Booz Allen Hamilton Holding Corp. Class A | | 154,800 | 11,011 |
| EPAM Systems, Inc. (a) | | 46,600 | 9,887 |
| Euronet Worldwide, Inc. (a) | | 137,800 | 21,712 |
| Fidelity National Information Services, Inc. | | 31,900 | 4,437 |
| Gartner, Inc. (a) | | 50,000 | 7,705 |
| Global Payments, Inc. | | 73,000 | 13,327 |
| Jack Henry & Associates, Inc. | | 68,200 | 9,935 |
| MasterCard, Inc. Class A | | 295,500 | 88,233 |
| MongoDB, Inc. Class A (a)(b) | | 73,100 | 9,621 |
| Okta, Inc. (a) | | 63,800 | 7,361 |
| PagSeguro Digital Ltd. (a) | | 157,600 | 5,384 |
| Square, Inc. (a) | | 34,300 | 2,146 |
| VeriSign, Inc. (a) | | 38,600 | 7,437 |
| | | | 262,766 |
| Semiconductors & Semiconductor Equipment - 5.4% | | | |
| Advanced Micro Devices, Inc. (a) | | 321,700 | 14,753 |
| ASML Holding NV | | 42,700 | 12,637 |
| Broadcom, Inc. | | 31,800 | 10,049 |
| Lam Research Corp. | | 67,600 | 19,766 |
| Marvell Technology Group Ltd. | | 111,500 | 2,961 |
| Microchip Technology, Inc. (b) | | 82,700 | 8,660 |
| Monolithic Power Systems, Inc. | | 44,500 | 7,922 |
| NVIDIA Corp. | | 124,900 | 29,389 |
| Qualcomm, Inc. | | 77,000 | 6,794 |
| | | | 112,931 |
| Software - 19.1% | | | |
| Adobe, Inc. (a) | | 99,300 | 32,750 |
| Anaplan, Inc. (a) | | 52,500 | 2,751 |
| ANSYS, Inc. (a) | | 61,300 | 15,779 |
| Aspen Technology, Inc. (a) | | 54,000 | 6,530 |
| Atlassian Corp. PLC (a) | | 94,200 | 11,336 |
| Autodesk, Inc. (a) | | 54,400 | 9,980 |
| Cadence Design Systems, Inc. (a) | | 230,200 | 15,967 |
| Cloudflare, Inc. | | 90,446 | 1,466 |
| Coupa Software, Inc. (a) | | 28,500 | 4,168 |
| Fair Isaac Corp. (a) | | 56,800 | 21,282 |
| Globant SA (a) | | 49,400 | 5,239 |
| Intuit, Inc. | | 71,900 | 18,833 |
| Microsoft Corp. | | 1,093,200 | 172,396 |
| Paycom Software, Inc. (a) | | 21,800 | 5,772 |
| Proofpoint, Inc. (a) | | 14,900 | 1,710 |
| RingCentral, Inc. (a) | | 53,500 | 9,024 |
| Salesforce.com, Inc. (a) | | 113,470 | 18,455 |
| ServiceNow, Inc. (a) | | 26,700 | 7,538 |
| Temenos Group AG | | 105,060 | 16,631 |
| The Trade Desk, Inc. (a)(b) | | 18,300 | 4,754 |
| Workday, Inc. Class A (a) | | 58,016 | 9,541 |
| Zoom Video Communications, Inc. Class A | | 61,300 | 4,171 |
| | | | 396,073 |
| Technology Hardware, Storage & Peripherals - 4.6% | | | |
| Apple, Inc. | | 322,125 | 94,592 |
|
| TOTAL INFORMATION TECHNOLOGY | | | 915,398 |
|
| MATERIALS - 0.9% | | | |
| Chemicals - 0.6% | | | |
| Ecolab, Inc. | | 30,200 | 5,828 |
| Sherwin-Williams Co. | | 9,400 | 5,485 |
| | | | 11,313 |
| Containers & Packaging - 0.3% | | | |
| Avery Dennison Corp. | | 51,600 | 6,750 |
|
| TOTAL MATERIALS | | | 18,063 |
|
| REAL ESTATE - 1.1% | | | |
| Equity Real Estate Investment Trusts (REITs) - 1.1% | | | |
| American Tower Corp. | | 95,000 | 21,833 |
| TOTAL COMMON STOCKS | | | |
| (Cost $1,359,032) | | | 2,063,860 |
|
| Convertible Preferred Stocks - 0.3% | | | |
| CONSUMER DISCRETIONARY - 0.3% | | | |
| Hotels, Restaurants & Leisure - 0.0% | | | |
| Topgolf International, Inc. Series F (a)(d)(e) | | 62,891 | 901 |
| Internet & Direct Marketing Retail - 0.3% | | | |
| The Honest Co., Inc.: | | | |
| Series D (a)(d)(e) | | 87,422 | 4,000 |
| Series E (a)(d)(e) | | 102,016 | 2,000 |
| | | | 6,000 |
| TOTAL CONVERTIBLE PREFERRED STOCKS | | | |
| (Cost $6,870) | | | 6,901 |
|
| Money Market Funds - 2.1% | | | |
| Fidelity Cash Central Fund 1.58% (f) | | 5,180,553 | 5,182 |
| Fidelity Securities Lending Cash Central Fund 1.58% (f)(g) | | 38,813,248 | 38,817 |
| TOTAL MONEY MARKET FUNDS | | | |
| (Cost $43,999) | | | 43,999 |
| TOTAL INVESTMENT IN SECURITIES - 101.9% | | | |
| (Cost $1,409,901) | | | 2,114,760 |
| NET OTHER ASSETS (LIABILITIES) - (1.9)% | | | (39,543) |
| NET ASSETS - 100% | | | $2,075,217 |
Legend
(a) Non-income producing
(b) Security or a portion of the security is on loan at period end.
(c) Security exempt from registration under Rule 144A of the Securities Act of 1933. These securities may be resold in transactions exempt from registration, normally to qualified institutional buyers. At the end of the period, the value of these securities amounted to $9,073,000 or 0.4% of net assets.
(d) Restricted securities - Investment in securities not registered under the Securities Act of 1933 (excluding 144A issues). At the end of the period, the value of restricted securities (excluding 144A issues) amounted to $6,901,000 or 0.3% of net assets.
(e) Level 3 security
(f) Affiliated fund that is generally available only to investment companies and other accounts managed by Fidelity Investments. The rate quoted is the annualized seven-day yield of the fund at period end. A complete unaudited listing of the fund's holdings as of its most recent quarter end is available upon request. In addition, each Fidelity Central Fund's financial statements, which are not covered by the Fund's Report of Independent Registered Public Accounting Firm, are available on the SEC's website or upon request.
(g) Investment made with cash collateral received from securities on loan.
Additional information on each restricted holding is as follows:
| Security | Acquisition Date | Acquisition Cost (000s) |
| The Honest Co., Inc. Series D | 8/3/15 | $4,000 |
| The Honest Co., Inc. Series E | 9/28/17 | $2,000 |
| Topgolf International, Inc. Series F | 11/10/17 | $870 |
Affiliated Central Funds
Information regarding fiscal year to date income earned by the Fund from investments in Fidelity Central Funds is as follows:
| Fund | Income earned |
| | (Amounts in thousands) |
| Fidelity Cash Central Fund | $183 |
| Fidelity Securities Lending Cash Central Fund | 121 |
| Total | $304 |
Amounts in the income column in the above table include any capital gain distributions from underlying funds, which are presented in the corresponding line-item in the Statement of Operations, if applicable. Amount for Fidelity Securities Lending Cash Central Fund represents the income earned on investing cash collateral, less rebates paid to borrowers and any lending agent fees associated with the loan, plus any premium payments received for lending certain types of securities.
Investment Valuation
The following is a summary of the inputs used, as of December 31, 2019, involving the Fund's assets and liabilities carried at fair value. The inputs or methodology used for valuing securities may not be an indication of the risk associated with investing in those securities. For more information on valuation inputs, and their aggregation into the levels used below, please refer to the Investment Valuation section in the accompanying Notes to Financial Statements.
| | Valuation Inputs at Reporting Date: |
| Description | Total | Level 1 | Level 2 | Level 3 |
| (Amounts in thousands) | | | | |
| Investments in Securities: | | | | |
| Equities: | | | | |
| Communication Services | $220,984 | $220,984 | $-- | $-- |
| Consumer Discretionary | 253,766 | 234,797 | 12,068 | 6,901 |
| Consumer Staples | 53,935 | 53,935 | -- | -- |
| Financials | 49,923 | 49,923 | -- | -- |
| Health Care | 327,638 | 327,638 | -- | -- |
| Industrials | 209,221 | 203,981 | 5,240 | -- |
| Information Technology | 915,398 | 913,932 | 1,466 | -- |
| Materials | 18,063 | 18,063 | -- | -- |
| Real Estate | 21,833 | 21,833 | -- | -- |
| Money Market Funds | 43,999 | 43,999 | -- | -- |
| Total Investments in Securities: | $2,114,760 | $2,089,085 | $18,774 | $6,901 |
The following is a reconciliation of Investments in Securities for which Level 3 inputs were used in determining value:
| (Amounts in thousands) | |
| Investments in Securities: | |
| Equities - Information Technology | |
| Beginning Balance | $24,175 |
| Net Realized Gain (Loss) on Investment Securities | -- |
| Net Unrealized Gain (Loss) on Investment Securities | -- |
| Cost of Purchases | -- |
| Proceeds of Sales | -- |
| Amortization/Accretion | -- |
| Transfers into Level 3 | -- |
| Transfers out of Level 3 | (24,175) |
| Ending Balance | $-- |
| The change in unrealized gain (loss) for the period attributable to Level 3 securities held at December 31, 2019 | $-- |
| Other Investments in Securities | |
| Beginning Balance | $6,298 |
| Net Realized Gain (Loss) on Investment Securities | -- |
| Net Unrealized Gain (Loss) on Investment Securities | 603 |
| Cost of Purchases | -- |
| Proceeds of Sales | -- |
| Amortization/Accretion | -- |
| Transfers into Level 3 | -- |
| Transfers out of Level 3 | -- |
| Ending Balance | $6,901 |
| The change in unrealized gain (loss) for the period attributable to Level 3 securities held at December 31, 2019 | $603 |
The information used in the above reconciliations represents fiscal year to date activity for any Investments in Securities identified as using Level 3 inputs at either the beginning or the end of the current fiscal period. Transfers in or out of Level 3 represent the beginning value of any Security or Instrument where a change in the pricing level occurred from the beginning to the end of the period. The cost of purchases and the proceeds of sales may include securities received or delivered through corporate actions or exchanges. Realized and unrealized gains (losses) disclosed in the reconciliations are included in Net Gain (Loss) on the Fund's Statement of Operations.
See accompanying notes which are an integral part of the financial statements.
Financial Statements
Statement of Assets and Liabilities
| Amounts in thousands (except per-share amount) | | December 31, 2019 |
| Assets | | |
Investment in securities, at value (including securities loaned of $38,241) — See accompanying schedule:
Unaffiliated issuers (cost $1,365,902) | $2,070,761 | |
| Fidelity Central Funds (cost $43,999) | 43,999 | |
| Total Investment in Securities (cost $1,409,901) | | $2,114,760 |
| Foreign currency held at value (cost $2) | | 2 |
| Receivable for investments sold | | 7,518 |
| Receivable for fund shares sold | | 1,347 |
| Dividends receivable | | 1,661 |
| Distributions receivable from Fidelity Central Funds | | 30 |
| Prepaid expenses | | 3 |
| Other receivables | | 12 |
| Total assets | | 2,125,333 |
| Liabilities | | |
| Payable for investments purchased | $6,901 | |
| Payable for fund shares redeemed | 3,274 | |
| Accrued management fee | 782 | |
| Other affiliated payables | 269 | |
| Other payables and accrued expenses | 75 | |
| Collateral on securities loaned | 38,815 | |
| Total liabilities | | 50,116 |
| Net Assets | | $2,075,217 |
| Net Assets consist of: | | |
| Paid in capital | | $1,348,948 |
| Total accumulated earnings (loss) | | 726,269 |
| Net Assets | | $2,075,217 |
| Net Asset Value, offering price and redemption price per share ($2,075,217 ÷ 19,197 shares) | | $108.10 |
See accompanying notes which are an integral part of the financial statements.
Statement of Operations
| Amounts in thousands | | Year ended December 31, 2019 |
| Investment Income | | |
| Dividends | | $17,183 |
| Income from Fidelity Central Funds (including $121 from security lending) | | 304 |
| Total income | | 17,487 |
| Expenses | | |
| Management fee | | |
| Basic fee | $10,167 | |
| Performance adjustment | (1,426) | |
| Transfer agent fees | 2,568 | |
| Accounting and security lending fees | 580 | |
| Custodian fees and expenses | 25 | |
| Independent trustees' fees and expenses | 10 | |
| Registration fees | 55 | |
| Audit | 78 | |
| Legal | 10 | |
| Interest | 4 | |
| Miscellaneous | 13 | |
| Total expenses before reductions | 12,084 | |
| Expense reductions | (47) | |
| Total expenses after reductions | | 12,037 |
| Net investment income (loss) | | 5,450 |
| Realized and Unrealized Gain (Loss) | | |
| Net realized gain (loss) on: | | |
| Investment securities: | | |
| Unaffiliated issuers (net of foreign taxes of $41) | 210,204 | |
| Fidelity Central Funds | 1 | |
| Foreign currency transactions | (11) | |
| Total net realized gain (loss) | | 210,194 |
| Change in net unrealized appreciation (depreciation) on: | | |
| Investment securities: | | |
| Unaffiliated issuers | 352,199 | |
| Assets and liabilities in foreign currencies | 3 | |
| Total change in net unrealized appreciation (depreciation) | | 352,202 |
| Net gain (loss) | | 562,396 |
| Net increase (decrease) in net assets resulting from operations | | $567,846 |
See accompanying notes which are an integral part of the financial statements.
Statement of Changes in Net Assets
| Amounts in thousands | Year ended December 31, 2019 | Year ended December 31, 2018 |
| Increase (Decrease) in Net Assets | | |
| Operations | | |
| Net investment income (loss) | $5,450 | $4,127 |
| Net realized gain (loss) | 210,194 | 146,071 |
| Change in net unrealized appreciation (depreciation) | 352,202 | (196,488) |
| Net increase (decrease) in net assets resulting from operations | 567,846 | (46,290) |
| Distributions to shareholders | (186,848) | (167,944) |
| Share transactions | | |
| Proceeds from sales of shares | 151,149 | 165,457 |
| Reinvestment of distributions | 170,786 | 153,815 |
| Cost of shares redeemed | (248,320) | (261,829) |
| Net increase (decrease) in net assets resulting from share transactions | 73,615 | 57,443 |
| Total increase (decrease) in net assets | 454,613 | (156,791) |
| Net Assets | | |
| Beginning of period | 1,620,604 | 1,777,395 |
| End of period | $2,075,217 | $1,620,604 |
| Other Information | | |
| Shares | | |
| Sold | 1,437 | 1,575 |
| Issued in reinvestment of distributions | 1,604 | 1,669 |
| Redeemed | (2,384) | (2,550) |
| Net increase (decrease) | 657 | 694 |
See accompanying notes which are an integral part of the financial statements.
Financial Highlights
Fidelity Trend Fund
| | | | | | |
| Years ended December 31, | 2019 | 2018 | 2017 | 2016 | 2015 |
| Selected Per–Share Data | | | | | |
| Net asset value, beginning of period | $87.41 | $99.60 | $84.03 | $84.63 | $85.65 |
| Income from Investment Operations | | | | | |
| Net investment income (loss)A | .30 | .23 | .32 | .40 | 1.00B |
| Net realized and unrealized gain (loss) | 30.82 | (2.85) | 24.16 | 3.41 | 3.43 |
| Total from investment operations | 31.12 | (2.62) | 24.48 | 3.81 | 4.43 |
| Distributions from net investment income | (.25) | (.22)C | (.35) | (.39) | (.93) |
| Distributions from net realized gain | (10.18) | (9.34)C | (8.56) | (4.03) | (4.52) |
| Total distributions | (10.43) | (9.57)D | (8.91) | (4.41)E | (5.45) |
| Net asset value, end of period | $108.10 | $87.41 | $99.60 | $84.03 | $84.63 |
| Total ReturnF | 35.88% | (2.96)% | 29.42% | 4.57% | 5.32% |
| Ratios to Average Net AssetsG,H | | | | | |
| Expenses before reductions | .64% | .67% | .67% | .74% | .77% |
| Expenses net of fee waivers, if any | .64% | .67% | .67% | .74% | .77% |
| Expenses net of all reductions | .63% | .66% | .66% | .73% | .76% |
| Net investment income (loss) | .29% | .22% | .33% | .47% | 1.15%B |
| Supplemental Data | | | | | |
| Net assets, end of period (in millions) | $2,075 | $1,621 | $1,777 | $1,495 | $1,475 |
| Portfolio turnover rateI | 73% | 88% | 128% | 129% | 140% |
A Calculated based on average shares outstanding during the period.
B Net investment income per share reflects a large, non-recurring dividend which amounted to $.69 per share. Excluding this non-recurring dividend, the ratio of net investment income (loss) to average net assets would have been .38%.
C The amounts shown reflect certain reclassifications related to book to tax differences that were made in the year shown.
D Total distributions of $9.57 per share is comprised of distributions from net investment income of $.224 and distributions from net realized gain of $9.341 per share.
E Total distributions of $4.41 per share is comprised of distributions from net investment income of $.386 and distributions from net realized gain of $4.026 per share.
F Total returns would have been lower if certain expenses had not been reduced during the applicable periods shown.
G Fees and expenses of any underlying Fidelity Central Funds are not included in the Fund's expense ratio. The Fund indirectly bears its proportionate share of the expenses of any underlying Fidelity Central Funds.
H Expense ratios reflect operating expenses of the Fund. Expenses before reductions do not reflect amounts reimbursed by the investment adviser or reductions from brokerage service arrangements or reductions from other expense offset arrangements and do not represent the amount paid by the Fund during periods when reimbursements or reductions occur. Expenses net of fee waivers reflect expenses after reimbursement by the investment adviser but prior to reductions from brokerage service arrangements or other expense offset arrangements. Expenses net of all reductions represent the net expenses paid by the Fund.
I Amount does not include the portfolio activity of any underlying Fidelity Central Funds.
See accompanying notes which are an integral part of the financial statements.
Notes to Financial Statements
For the period ended December 31, 2019
(Amounts in thousands except percentages)
1. Organization.
Fidelity Trend Fund (the Fund) is registered under the Investment Company Act of 1940, as amended (the 1940 Act), as an open-end management investment company organized as a Massachusetts business trust and is authorized to issue an unlimited number of shares. Share transactions on the Statement of Changes in Net Assets may contain exchanges between affiliated funds.
2. Investments in Fidelity Central Funds.
The Fund invests in Fidelity Central Funds, which are open-end investment companies generally available only to other investment companies and accounts managed by the investment adviser and its affiliates. The Fund's Schedule of Investments lists each of the Fidelity Central Funds held as of period end, if any, as an investment of the Fund, but does not include the underlying holdings of each Fidelity Central Fund. As an Investing Fund, the Fund indirectly bears its proportionate share of the expenses of the underlying Fidelity Central Funds.
The Money Market Central Funds seek preservation of capital and current income and are managed by Fidelity Investments Money Management, Inc. (FIMM), an affiliate of the investment adviser. Annualized expenses of the Money Market Central Funds as of their most recent shareholder report date ranged from less than .005% to .01%.
A complete unaudited list of holdings for each Fidelity Central Fund is available upon request or at the Securities and Exchange Commission (the SEC) website at www.sec.gov. In addition, the financial statements of the Fidelity Central Funds, which are not covered by the Fund's Report of Independent Registered Public Accounting Firm, are available on the SEC website or upon request.
3. Significant Accounting Policies.
The Fund is an investment company and applies the accounting and reporting guidance of the Financial Accounting Standards Board (FASB) Accounting Standards Codification Topic 946 Financial Services – Investments Companies. The financial statements have been prepared in conformity with accounting principles generally accepted in the United States of America (GAAP), which require management to make certain estimates and assumptions at the date of the financial statements. Actual results could differ from those estimates. Subsequent events, if any, through the date that the financial statements were issued have been evaluated in the preparation of the financial statements. The following summarizes the significant accounting policies of the Fund:
Investment Valuation. Investments are valued as of 4:00 p.m. Eastern time on the last calendar day of the period. The Board of Trustees (the Board) has delegated the day to day responsibility for the valuation of the Fund's investments to the Fair Value Committee (the Committee) established by the Fund's investment adviser. In accordance with valuation policies and procedures approved by the Board, the Fund attempts to obtain prices from one or more third party pricing vendors or brokers to value its investments. When current market prices, quotations or currency exchange rates are not readily available or reliable, investments will be fair valued in good faith by the Committee, in accordance with procedures adopted by the Board. Factors used in determining fair value vary by investment type and may include market or investment specific events. The frequency with which these procedures are used cannot be predicted and they may be utilized to a significant extent. The Committee oversees the Fund's valuation policies and procedures and reports to the Board on the Committee's activities and fair value determinations. The Board monitors the appropriateness of the procedures used in valuing the Fund's investments and ratifies the fair value determinations of the Committee.
The Fund categorizes the inputs to valuation techniques used to value its investments into a disclosure hierarchy consisting of three levels as shown below:
- Level 1 – quoted prices in active markets for identical investments
- Level 2 – other significant observable inputs (including quoted prices for similar investments, interest rates, prepayment speeds, etc.)
- Level 3 – unobservable inputs (including the Fund's own assumptions based on the best information available)
Valuation techniques used to value the Fund's investments by major category are as follows:
Equity securities, including restricted securities, for which market quotations are readily available, are valued at the last reported sale price or official closing price as reported by a third party pricing vendor on the primary market or exchange on which they are traded and are categorized as Level 1 in the hierarchy. In the event there were no sales during the day or closing prices are not available, securities are valued at the last quoted bid price or may be valued using the last available price and are generally categorized as Level 2 in the hierarchy. For foreign equity securities, when market or security specific events arise, comparisons to the valuation of American Depositary Receipts (ADRs), futures contracts, Exchange-Traded Funds (ETFs) and certain indexes as well as quoted prices for similar securities may be used and would be categorized as Level 2 in the hierarchy. For equity securities, including restricted securities, where observable inputs are limited, assumptions about market activity and risk are used and these securities may be categorized as Level 3 in the hierarchy. Equity securities, including restricted securities, for which observable inputs are not available are valued using alternate valuation approaches, including the market approach and the income approach and are categorized as Level 3 in the hierarchy. The market approach generally consists of using comparable market transactions while the income approach generally consists of using the net present value of estimated future cash flows, adjusted as appropriate for liquidity, credit, market and/or other risk factors.
Investments in open-end mutual funds, including the Fidelity Central Funds, are valued at their closing net asset value (NAV) each business day and are categorized as Level 1 in the hierarchy.
Changes in valuation techniques may result in transfers in or out of an assigned level within the disclosure hierarchy. The aggregate value of investments by input level as of December 31, 2019, as well as a roll forward of Level 3 investments, is included at the end of the Fund's Schedule of Investments.
Foreign Currency. The Fund may use foreign currency contracts to facilitate transactions in foreign-denominated securities. Gains and losses from these transactions may arise from changes in the value of the foreign currency or if the counterparties do not perform under the contracts' terms.
Foreign-denominated assets, including investment securities, and liabilities are translated into U.S. dollars at the exchange rates at period end. Purchases and sales of investment securities, income and dividends received and expenses denominated in foreign currencies are translated into U.S. dollars at the exchange rate in effect on the transaction date.
The effects of exchange rate fluctuations on investments are included with the net realized and unrealized gain (loss) on investment securities. Other foreign currency transactions resulting in realized and unrealized gain (loss) are disclosed separately.
Investment Transactions and Income. For financial reporting purposes, the Fund's investment holdings and NAV include trades executed through the end of the last business day of the period. The NAV per share for processing shareholder transactions is calculated as of the close of business of the New York Stock Exchange (NYSE), normally 4:00 p.m. Eastern time and includes trades executed through the end of the prior business day. Gains and losses on securities sold are determined on the basis of identified cost and include proceeds received from litigation. Dividend income is recorded on the ex-dividend date, except for certain dividends from foreign securities where the ex-dividend date may have passed, which are recorded as soon as the Fund is informed of the ex-dividend date. Non-cash dividends included in dividend income, if any, are recorded at the fair market value of the securities received. Income and capital gain distributions from Fidelity Central Funds, if any, are recorded on the ex-dividend date. Certain distributions received by the Fund represent a return of capital or capital gain. The Fund determines the components of these distributions subsequent to the ex-dividend date, based upon receipt of tax filings or other correspondence relating to the underlying investment. These distributions are recorded as a reduction of cost of investments and/or as a realized gain. Investment income is recorded net of foreign taxes withheld where recovery of such taxes is uncertain.
Expenses. Expenses directly attributable to a fund are charged to that fund. Expenses attributable to more than one fund are allocated among the respective funds on the basis of relative net assets or other appropriate methods. Expense estimates are accrued in the period to which they relate and adjustments are made when actual amounts are known.
Deferred Trustee Compensation. Under a Deferred Compensation Plan (the Plan) for the Fund, certain independent Trustees have elected to defer receipt of a portion of their annual compensation. Deferred amounts are invested in a cross-section of Fidelity funds, are marked-to-market and remain in the Fund until distributed in accordance with the Plan. The investment of deferred amounts and the offsetting payable to the Trustees of $10 are included in the accompanying Statement of Assets and Liabilities in other receivables and other payables and accrued expenses, respectively.
Income Tax Information and Distributions to Shareholders. Each year, the Fund intends to qualify as a regulated investment company under Subchapter M of the Internal Revenue Code, including distributing substantially all of its taxable income and realized gains. As a result, no provision for U.S. Federal income taxes is required. As of December 31, 2019, the Fund did not have any unrecognized tax benefits in the financial statements; nor is the Fund aware of any tax positions for which it is reasonably possible that the total amounts of unrecognized tax benefits will significantly change in the next twelve months. The Fund files a U.S. federal tax return, in addition to state and local tax returns as required. The Fund's federal income tax returns are subject to examination by the Internal Revenue Service (IRS) for a period of three fiscal years after they are filed. State and local tax returns may be subject to examination for an additional fiscal year depending on the jurisdiction. Foreign taxes are provided for based on the Fund's understanding of the tax rules and rates that exist in the foreign markets in which it invests. The Fund is subject to a tax imposed on capital gains by certain countries in which it invests.
Distributions are declared and recorded on the ex-dividend date. Income and capital gain distributions are determined in accordance with income tax regulations, which may differ from GAAP. These differences resulted in distribution reclassifications for the period ended December 31, 2018. In addition, the Fund claimed a portion of the payment made to redeeming shareholders as a distribution for income tax purposes.
Capital accounts within the financial statements are adjusted for permanent book-tax differences. These adjustments have no impact on net assets or the results of operations. Capital accounts are not adjusted for temporary book-tax differences which will reverse in a subsequent period.
Book-tax differences are primarily due to foreign currency transactions, certain foreign taxes, deferred trustees compensation and losses deferred due to wash sales and excise tax regulations.
As of period end, the cost and unrealized appreciation (depreciation) in securities, and derivatives if applicable, for federal income tax purposes were as follows:
| Gross unrealized appreciation | $718,649 |
| Gross unrealized depreciation | (14,813) |
| Net unrealized appreciation (depreciation) | $703,836 |
| Tax Cost | $1,410,924 |
The tax-based components of distributable earnings as of period end were as follows:
| Undistributed ordinary income | $1,054 |
| Undistributed long-term capital gain | $21,388 |
| Net unrealized appreciation (depreciation) on securities and other investments | $703,836 |
The tax character of distributions paid was as follows:
| | December 31, 2019 | December 31, 2018 |
| Ordinary Income | $4,506 | $ 20,282 |
| Long-term Capital Gains | 182,342 | 147,662 |
| Total | $186,848 | $ 167,944 |
Restricted Securities. The Fund may invest in securities that are subject to legal or contractual restrictions on resale. These securities generally may be resold in transactions exempt from registration or to the public if the securities are registered. Disposal of these securities may involve time-consuming negotiations and expense, and prompt sale at an acceptable price may be difficult. Information regarding restricted securities is included at the end of the Fund's Schedule of Investments.
4. Purchases and Sales of Investments.
Purchases and sales of securities, other than short-term securities, aggregated $1,379,313 and $1,478,028, respectively.
5. Fees and Other Transactions with Affiliates.
Management Fee. Fidelity Management & Research Company (the investment adviser) and its affiliates provide the Fund with investment management related services for which the Fund pays a monthly management fee. The management fee is the sum of an individual fund fee rate that is based on an annual rate of .30% of the Fund's average net assets and an annualized group fee rate that averaged .24% during the period. The group fee rate is based upon the average net assets of all the mutual funds advised by the investment adviser, including any mutual funds previously advised by the investment adviser that are currently advised by Fidelity SelectCo, LLC, an affiliate of the investment adviser. The group fee rate decreases as assets under management increase and increases as assets under management decrease. In addition, the management fee is subject to a performance adjustment (up to a maximum of +/- .20% of the Fund's average net assets over a 36 month performance period). The upward or downward adjustment to the management fee is based on the Fund's relative investment performance as compared to its benchmark index, the Russell 1000 Growth Index, over the same 36 month performance period. For the reporting period, the total annual management fee rate, including the performance adjustment, was .46% of the Fund's average net assets. The performance adjustment included in the management fee rate may be higher or lower than the maximum performance adjustment rate due to the difference between the average net assets for the reporting and performance periods.
Transfer Agent Fees. Fidelity Investments Institutional Operations Company, Inc. (FIIOC), an affiliate of the investment adviser, is the Fund's transfer, dividend disbursing and shareholder servicing agent. FIIOC receives account fees and asset-based fees that vary according to account size and type of account. FIIOC pays for typesetting, printing and mailing of shareholder reports, except proxy statements. For the period, the transfer agent fees were equivalent to an annual rate of .14% of average net assets.
Accounting and Security Lending Fees. Fidelity Service Company, Inc. (FSC), an affiliate of the investment adviser, maintains the Fund's accounting records. The accounting fee is based on the level of average net assets for each month. Prior to April 1, 2019, FSC had a separate agreement with the Fund for administration of the security lending program, based on the number and duration of lending transactions. For the period, the total fees paid for accounting and administration of securities lending were equivalent to the following annual rates:
| | % of Average Net Assets |
| Fidelity Trend Fund | .03 |
Brokerage Commissions. A portion of portfolio transactions were placed with brokerage firms which are affiliates of the investment adviser. Brokerage commissions are included in net realized gain (loss) and change in net unrealized appreciation (depreciation) in the Statement of Operations. The commissions paid to these affiliated firms were as follows:
| | Amount |
| Fidelity Trend Fund | $35 |
Interfund Lending Program. Pursuant to an Exemptive Order issued by the SEC, the fund, along with other registered investment companies having management contracts with Fidelity Management & Research Company (FMR) or other affiliated entities of FMR, may participate in an interfund lending program. This program provides an alternative credit facility allowing the fund to borrow from, or lend money to, other participating affiliated funds. At period end, there were no interfund loans outstanding. Activity in this program during the period for which loans were outstanding was as follows:
| | Borrower or Lender | Average Loan Balance | Weighted Average Interest Rate | Interest Expense |
| Fidelity Trend Fund | Borrower | $7,506 | 1.88% | $4 |
Interfund Trades. The Fund may purchase from or sell securities to other Fidelity Funds under procedures adopted by the Board. The procedures have been designed to ensure these interfund trades are executed in accordance with Rule 17a-7 of the 1940 Act. Interfund trades are included within the respective purchases and sales amounts shown in the Purchases and Sales of Investments note.
Other. During the period, the investment adviser reimbursed the Fund for certain losses in the amount of $72.
6. Committed Line of Credit.
The Fund participates with other funds managed by the investment adviser or an affiliate in a $4.25 billion credit facility (the "line of credit") to be utilized for temporary or emergency purposes to fund shareholder redemptions or for other short-term liquidity purposes. The Fund has agreed to pay commitment fees on its pro-rata portion of the line of credit, which amounted to $5 and is reflected in Miscellaneous expenses on the Statement of Operations. During the period, the Fund did not borrow on this line of credit.
7. Security Lending.
The Fund lends portfolio securities from time to time in order to earn additional income. For equity securities, lending agents are used, including National Financial Services (NFS), an affiliate of the Fund. Pursuant to a securities lending agreement, NFS will receive a fee, which is capped at 9.9% of daily lending revenue, for its services as lending agent. The Fund may lend securities to certain qualified borrowers, including NFS. On the settlement date of the loan, the Fund receives collateral (in the form of U.S. Treasury obligations, letters of credit and/or cash) against the loaned securities and maintains collateral in an amount not less than 100% of the market value of the loaned securities during the period of the loan. The market value of the loaned securities is determined at the close of business of the Fund and any additional required collateral is delivered to the Fund on the next business day. The Fund or borrower may terminate the loan at any time, and if the borrower defaults on its obligation to return the securities loaned because of insolvency or other reasons, the Fund may apply collateral received from the borrower against the obligation. The Fund may experience delays and costs in recovering the securities loaned. Any cash collateral received is invested in the Fidelity Securities Lending Cash Central Fund. The value of loaned securities and cash collateral at period end are disclosed on the Fund's Statement of Assets and Liabilities. At period end, there were no security loans outstanding with NFS, as affiliated borrower. Total fees paid by the Fund to NFS, as lending agent, amounted to $8. Security lending income represents the income earned on investing cash collateral, less rebates paid to borrowers and any lending agent fees associated with the loan, plus any premium payments received for lending certain types of securities. Security lending income is presented in the Statement of Operations as a component of income from Fidelity Central Funds, and includes $1 from securities loaned to NFS, as affiliated borrower.
8. Expense Reductions.
Commissions paid to certain brokers with whom the investment adviser, or its affiliates, places trades on behalf of the Fund include an amount in addition to trade execution, which may be rebated back to the Fund to offset certain expenses. This amount totaled $25 for the period. In addition, through arrangements with the Fund's custodian and transfer agent, credits realized as a result of certain uninvested cash balances were used to reduce the Fund's expenses by $1 and $8, respectively.
In addition, during the period the investment adviser reimbursed and/or waived a portion of operating expenses in the amount of $13.
9. Other.
The Fund's organizational documents provide former and current trustees and officers with a limited indemnification against liabilities arising in connection with the performance of their duties to the Fund. In the normal course of business, the Fund may also enter into contracts that provide general indemnifications. The Fund's maximum exposure under these arrangements is unknown as this would be dependent on future claims that may be made against the Fund. The risk of material loss from such claims is considered remote.
Effective January 1, 2020, following any required regulatory notices and approvals:
Investment advisers Fidelity Investments Money Management, Inc., FMR Co., Inc., and Fidelity SelectCo, LLC, merged with and into Fidelity Management & Research Company. In connection with the merger transactions, the resulting, merged investment adviser was then redomiciled from Massachusetts to Delaware, changed its corporate structure from a corporation to a limited liability company, and changed its name to "Fidelity Management & Research Company LLC".
Fidelity Investments Institutional Operations Company, Inc. (FIIOC) converted from a Massachusetts corporation to a Massachusetts LLC, and changed its name to "Fidelity Investments Institutional Operations Company LLC".
Report of Independent Registered Public Accounting Firm
To the Board of Trustees of Fidelity Trend Fund and Shareholders of Fidelity Trend Fund:
Opinion on the Financial Statements
We have audited the accompanying statement of assets and liabilities, including the schedule of investments, of Fidelity Trend Fund (one of the funds constituting Fidelity Trend Fund, referred to hereafter as the “Fund”) as of December 31, 2019, the related statement of operations for the year ended December 31, 2019, the statement of changes in net assets for each of the two years in the period ended December 31, 2019, including the related notes, and the financial highlights for each of the five years in the period ended December 31, 2019 (collectively referred to as the “financial statements”). In our opinion, the financial statements present fairly, in all material respects, the financial position of the Fund as of December 31, 2019, the results of its operations for the year then ended, the changes in its net assets for each of the two years in the period ended December 31, 2019 and the financial highlights for each of the five years in the period ended December 31, 2019 in conformity with accounting principles generally accepted in the United States of America.
Basis for Opinion
These financial statements are the responsibility of the Fund’s management. Our responsibility is to express an opinion on the Fund’s financial statements based on our audits. We are a public accounting firm registered with the Public Company Accounting Oversight Board (United States) (PCAOB) and are required to be independent with respect to the Fund in accordance with the U.S. federal securities laws and the applicable rules and regulations of the Securities and Exchange Commission and the PCAOB.
We conducted our audits of these financial statements in accordance with the standards of the PCAOB. Those standards require that we plan and perform the audit to obtain reasonable assurance about whether the financial statements are free of material misstatement, whether due to error or fraud.
Our audits included performing procedures to assess the risks of material misstatement of the financial statements, whether due to error or fraud, and performing procedures that respond to those risks. Such procedures included examining, on a test basis, evidence regarding the amounts and disclosures in the financial statements. Our audits also included evaluating the accounting principles used and significant estimates made by management, as well as evaluating the overall presentation of the financial statements. Our procedures included confirmation of securities owned as of December 31, 2019 by correspondence with the custodian, issuers of privately offered securities and brokers; when replies were not received from brokers, we performed other auditing procedures. We believe that our audits provide a reasonable basis for our opinion.
PricewaterhouseCoopers LLP
Boston, Massachusetts
February 12, 2020
We have served as the auditor of one or more investment companies in the Fidelity group of funds since 1932.
Trustees and Officers
The Trustees, Members of the Advisory Board (if any), and officers of the trust and fund, as applicable, are listed below. The Board of Trustees governs the fund and is responsible for protecting the interests of shareholders. The Trustees are experienced executives who meet periodically throughout the year to oversee the fund's activities, review contractual arrangements with companies that provide services to the fund, oversee management of the risks associated with such activities and contractual arrangements, and review the fund's performance. Except for Michael E. Wiley, each of the Trustees oversees 302 funds. Mr. Wiley oversees 199 funds.
The Trustees hold office without limit in time except that (a) any Trustee may resign; (b) any Trustee may be removed by written instrument, signed by at least two-thirds of the number of Trustees prior to such removal; (c) any Trustee who requests to be retired or who has become incapacitated by illness or injury may be retired by written instrument signed by a majority of the other Trustees; and (d) any Trustee may be removed at any special meeting of shareholders by a two-thirds vote of the outstanding voting securities of the trust. Each Trustee who is not an interested person (as defined in the Investment Company Act of 1940 (1940 Act)) of the trust and the fund is referred to herein as an Independent Trustee. Each Independent Trustee shall retire not later than the last day of the calendar year in which his or her 75th birthday occurs. The Independent Trustees may waive this mandatory retirement age policy with respect to individual Trustees. Officers and Advisory Board Members hold office without limit in time, except that any officer or Advisory Board Member may resign or may be removed by a vote of a majority of the Trustees at any regular meeting or any special meeting of the Trustees. Except as indicated, each individual has held the office shown or other offices in the same company for the past five years.
The fund’s Statement of Additional Information (SAI) includes more information about the Trustees. To request a free copy, call Fidelity at 1-800-544-8544.
Experience, Skills, Attributes, and Qualifications of the Trustees. The Governance and Nominating Committee has adopted a statement of policy that describes the experience, qualifications, attributes, and skills that are necessary and desirable for potential Independent Trustee candidates (Statement of Policy). The Board believes that each Trustee satisfied at the time he or she was initially elected or appointed a Trustee, and continues to satisfy, the standards contemplated by the Statement of Policy. The Governance and Nominating Committee also engages professional search firms to help identify potential Independent Trustee candidates who have the experience, qualifications, attributes, and skills consistent with the Statement of Policy. From time to time, additional criteria based on the composition and skills of the current Independent Trustees, as well as experience or skills that may be appropriate in light of future changes to board composition, business conditions, and regulatory or other developments, have also been considered by the professional search firms and the Governance and Nominating Committee. In addition, the Board takes into account the Trustees' commitment and participation in Board and committee meetings, as well as their leadership of standing and ad hoc committees throughout their tenure.
In determining that a particular Trustee was and continues to be qualified to serve as a Trustee, the Board has considered a variety of criteria, none of which, in isolation, was controlling. The Board believes that, collectively, the Trustees have balanced and diverse experience, qualifications, attributes, and skills, which allow the Board to operate effectively in governing the fund and protecting the interests of shareholders. Information about the specific experience, skills, attributes, and qualifications of each Trustee, which in each case led to the Board's conclusion that the Trustee should serve (or continue to serve) as a trustee of the fund, is provided below.
Board Structure and Oversight Function. James C. Curvey is an interested person and currently serves as Chairman. The Trustees have determined that an interested Chairman is appropriate and benefits shareholders because an interested Chairman has a personal and professional stake in the quality and continuity of services provided to the fund. Independent Trustees exercise their informed business judgment to appoint an individual of their choosing to serve as Chairman, regardless of whether the Trustee happens to be independent or a member of management. The Independent Trustees have determined that they can act independently and effectively without having an Independent Trustee serve as Chairman and that a key structural component for assuring that they are in a position to do so is for the Independent Trustees to constitute a substantial majority for the Board. The Independent Trustees also regularly meet in executive session. Ned C. Lautenbach serves as Chairman of the Independent Trustees and as such (i) acts as a liaison between the Independent Trustees and management with respect to matters important to the Independent Trustees and (ii) with management prepares agendas for Board meetings.
Fidelity® funds are overseen by different Boards of Trustees. The fund's Board oversees Fidelity's high income and certain equity funds, and other Boards oversee Fidelity's investment-grade bond, money market, asset allocation, and other equity funds. The asset allocation funds may invest in Fidelity® funds overseen by the fund's Board. The use of separate Boards, each with its own committee structure, allows the Trustees of each group of Fidelity® funds to focus on the unique issues of the funds they oversee, including common research, investment, and operational issues. On occasion, the separate Boards establish joint committees to address issues of overlapping consequences for the Fidelity® funds overseen by each Board.
The Trustees operate using a system of committees to facilitate the timely and efficient consideration of all matters of importance to the Trustees, the fund, and fund shareholders and to facilitate compliance with legal and regulatory requirements and oversight of the fund's activities and associated risks. The Board, acting through its committees, has charged FMR and its affiliates with (i) identifying events or circumstances the occurrence of which could have demonstrably adverse effects on the fund's business and/or reputation; (ii) implementing processes and controls to lessen the possibility that such events or circumstances occur or to mitigate the effects of such events or circumstances if they do occur; and (iii) creating and maintaining a system designed to evaluate continuously business and market conditions in order to facilitate the identification and implementation processes described in (i) and (ii) above. Because the day-to-day operations and activities of the fund are carried out by or through FMR, its affiliates, and other service providers, the fund's exposure to risks is mitigated but not eliminated by the processes overseen by the Trustees. While each of the Board's committees has responsibility for overseeing different aspects of the fund's activities, oversight is exercised primarily through the Operations, Audit, and Compliance Committees. Appropriate personnel, including but not limited to the fund's Chief Compliance Officer (CCO), FMR's internal auditor, the independent accountants, the fund's Treasurer and portfolio management personnel, make periodic reports to the Board's committees, as appropriate, including an annual review of Fidelity's risk management program for the Fidelity® funds. The responsibilities of each standing committee, including their oversight responsibilities, are described further under "Standing Committees of the Trustees."
Interested Trustees*:
Correspondence intended for a Trustee who is an interested person may be sent to Fidelity Investments, 245 Summer Street, Boston, Massachusetts 02210.
Name, Year of Birth; Principal Occupations and Other Relevant Experience+
James C. Curvey (1935)
Year of Election or Appointment: 2007
Trustee
Chairman of the Board of Trustees
Mr. Curvey also serves as Trustee of other Fidelity® funds. Mr. Curvey is Vice Chairman (2007-present) and Director of FMR LLC (diversified financial services company). In addition, Mr. Curvey is an Overseer Emeritus for the Boston Symphony Orchestra, a Director of Artis-Naples, and a Trustee of Brewster Academy in Wolfeboro, New Hampshire. Previously, Mr. Curvey served as a Director of Fidelity Research & Analysis Co. (investment adviser firm, 2009-2018), Director of Fidelity Investments Money Management, Inc. (investment adviser firm, 2009-2014) and a Director of FMR and FMR Co., Inc. (investment adviser firms, 2007-2014).
* Determined to be an “Interested Trustee” by virtue of, among other things, his or her affiliation with the trust or various entities under common control with FMR.
+ The information includes the Trustee's principal occupation during the last five years and other information relating to the experience, attributes, and skills relevant to the Trustee's qualifications to serve as a Trustee, which led to the conclusion that the Trustee should serve as a Trustee for the fund.
Independent Trustees:
Correspondence intended for an Independent Trustee may be sent to Fidelity Investments, P.O. Box 55235, Boston, Massachusetts 02205-5235.
Name, Year of Birth; Principal Occupations and Other Relevant Experience+
Dennis J. Dirks (1948)
Year of Election or Appointment: 2005
Trustee
Mr. Dirks also serves as Trustee of other Fidelity® funds. Prior to his retirement in May 2003, Mr. Dirks was Chief Operating Officer and a member of the Board of The Depository Trust & Clearing Corporation (DTCC). He also served as President, Chief Operating Officer, and Board member of The Depository Trust Company (DTC) and President and Board member of the National Securities Clearing Corporation (NSCC). In addition, Mr. Dirks served as Chief Executive Officer and Board member of the Government Securities Clearing Corporation, Chief Executive Officer and Board member of the Mortgage-Backed Securities Clearing Corporation, as a Trustee and a member of the Finance Committee of Manhattan College (2005-2008), as a Trustee and a member of the Finance Committee of AHRC of Nassau County (2006-2008), as a member of the Independent Directors Council (IDC) Governing Council (2010-2015), and as a member of the Board of Directors for The Brookville Center for Children’s Services, Inc. (2009-2017). Mr. Dirks is a member of the Finance Committee (2016-present) and Board of Directors (2017-present) and is Treasurer (2018-present) of the Asolo Repertory Theatre.
Donald F. Donahue (1950)
Year of Election or Appointment: 2018
Trustee
Mr. Donahue also serves as a Trustee of other Fidelity® funds. Mr. Donahue is President and Chief Executive Officer of Miranda Partners, LLC (risk consulting for the financial services industry, 2012-present). Previously, Mr. Donahue served as a Member of the Advisory Board of certain Fidelity® funds (2015-2018) and Chief Executive Officer (2006-2012), Chief Operating Officer (2003-2006), and Managing Director, Customer Marketing and Development (1999-2003) of The Depository Trust & Clearing Corporation (financial markets infrastructure). Mr. Donahue serves as a Member (2007-present) and Co-Chairman (2016-present) of the Board of Directors of United Way of New York, Member of the Board of Directors of NYC Leadership Academy (2012-present) and Member of the Board of Advisors of Ripple Labs, Inc. (financial services, 2015-present). He also served as Chairman (2010-2012) and Member of the Board of Directors (2012-2013) of Omgeo, LLC (financial services), Treasurer of United Way of New York (2012-2016), and Member of the Board of Directors of XBRL US (financial services non-profit, 2009-2012) and the International Securities Services Association (2009-2012).
Alan J. Lacy (1953)
Year of Election or Appointment: 2008
Trustee
Mr. Lacy also serves as Trustee of other Fidelity® funds. Mr. Lacy serves as a Director of Bristol-Myers Squibb Company (global pharmaceuticals, 2008-present). He is a Trustee of the California Chapter of The Nature Conservancy (2015-present) and a Director of the Center for Advanced Study in the Behavioral Sciences at Stanford University (2015-present). In addition, Mr. Lacy served as Senior Adviser (2007-2014) of Oak Hill Capital Partners, L.P. (private equity) and also served as Chief Executive Officer (2005) and Vice Chairman (2005-2006) of Sears Holdings Corporation (retail) and Chief Executive Officer and Chairman of the Board of Sears, Roebuck and Co. (retail, 2000-2005). Previously, Mr. Lacy served as Chairman (2014-2017) and a member (2010-2017) of the Board of Directors of Dave & Buster’s Entertainment, Inc. (restaurant and entertainment complexes), as Chairman (2008-2011) and a member (2006-2015) of the Board of Trustees of the National Parks Conservation Association, and as a member of the Board of Directors for The Hillman Companies, Inc. (hardware wholesalers, 2010-2014), Earth Fare, Inc. (retail grocery, 2010-2014), and The Western Union Company (global money transfer, 2006-2011).
Ned C. Lautenbach (1944)
Year of Election or Appointment: 2000
Trustee
Chairman of the Independent Trustees
Mr. Lautenbach also serves as Trustee of other Fidelity® funds. Mr. Lautenbach currently serves as Chair (2018-present) and Member (2013-present) of the Board of Governors, State University System of Florida and is a member of the Council on Foreign Relations (1994-present). He is also a member and has most recently served as Chairman of the Board of Directors of Artis-Naples (2012-present). Previously, Mr. Lautenbach served as a member and then Lead Director of the Board of Directors of Eaton Corporation (diversified industrial, 1997-2016). He was also a Partner and Advisory Partner at Clayton, Dubilier & Rice, LLC (private equity investment, 1998-2010), as well as a Director of Sony Corporation (2006-2007). In addition, Mr. Lautenbach also had a 30-year career with IBM (technology company) during which time he served as Senior Vice President and a member of the Corporate Executive Committee (1968-1998).
Joseph Mauriello (1944)
Year of Election or Appointment: 2008
Trustee
Mr. Mauriello also serves as Trustee of other Fidelity® funds. Prior to his retirement in January 2006, Mr. Mauriello served in numerous senior management positions including Deputy Chairman and Chief Operating Officer (2004-2005), and Vice Chairman of Financial Services (2002-2004) of KPMG LLP US (professional services, 1965-2005). Mr. Mauriello currently serves as a member of the Independent Directors Council (IDC) Governing Council (2015-present). Previously, Mr. Mauriello served as a member of the Board of Directors of XL Group plc. (global insurance and re-insurance, 2006-2018).
Cornelia M. Small (1944)
Year of Election or Appointment: 2005
Trustee
Ms. Small also serves as Trustee of other Fidelity® funds. Ms. Small is a member of the Board of Directors (2009-present) and Chair of the Investment Committee (2010-present) of the Teagle Foundation. Ms. Small also serves on the Investment Committee of the Berkshire Taconic Community Foundation (2008-present). Previously, Ms. Small served as Chairperson (2002-2008) and a member of the Investment Committee and Chairperson (2008-2012) and a member of the Board of Trustees of Smith College. In addition, Ms. Small served as Chief Investment Officer, Director of Global Equity Investments, and a member of the Board of Directors of Scudder, Stevens & Clark and Scudder Kemper Investments.
Garnett A. Smith (1947)
Year of Election or Appointment: 2018
Trustee
Mr. Smith also serves as Trustee of other Fidelity® funds. Prior to Mr. Smith's retirement, he served as Chairman and Chief Executive Officer of Inbrand Corp. (manufacturer of personal absorbent products, 1990-1997). He also served as President (1986-1990) of Inbrand Corp. Prior to his employment with Inbrand Corp., he was employed by a retail fabric chain and North Carolina National Bank. In addition, Mr. Smith served as a Member of the Advisory Board of certain Fidelity® funds (2012-2013) and as a board member of the Jackson Hole Land Trust (2009-2012).
David M. Thomas (1949)
Year of Election or Appointment: 2008
Trustee
Mr. Thomas also serves as Trustee of other Fidelity® funds. Mr. Thomas serves as Non-Executive Chairman of the Board of Directors of Fortune Brands Home and Security (home and security products, 2011-present) and as a member of the Board of Directors (2004-present) and Presiding Director (2013-present) of Interpublic Group of Companies, Inc. (marketing communication). Previously, Mr. Thomas served as Executive Chairman (2005-2006) and Chairman and Chief Executive Officer (2000-2005) of IMS Health, Inc. (pharmaceutical and healthcare information solutions), a Director of Fortune Brands, Inc. (consumer products, 2000-2011), and a member of the Board of Trustees of the University of Florida (2013-2018).
Michael E. Wiley (1950)
Year of Election or Appointment: 2018
Trustee
Mr. Wiley also serves as Trustee or Member of the Advisory Board of other Fidelity® funds. Mr. Wiley serves as a Director of High Point Resources (exploration and production, 2005-present). Previously, Mr. Wiley served as a Director of Andeavor Corporation (independent oil refiner and marketer, 2005-2018), a Director of Andeavor Logistics LP (natural resources logistics, 2015-2018), a Director of Post Oak Bank (privately-held bank, 2004-2018), a Director of Asia Pacific Exploration Consolidated (international oil and gas exploration and production, 2008-2013), a member of the Board of Trustees of the University of Tulsa (2000-2006; 2007-2010), a Senior Energy Advisor of Katzenbach Partners, LLC (consulting, 2006-2007), an Advisory Director of Riverstone Holdings (private investment), a Director of Spinnaker Exploration Company (exploration and production, 2001-2005) and Chairman, President, and CEO of Baker Hughes, Inc. (oilfield services, 2000-2004).
+ The information includes the Trustee's principal occupation during the last five years and other information relating to the experience, attributes, and skills relevant to the Trustee's qualifications to serve as a Trustee, which led to the conclusion that the Trustee should serve as a Trustee for the fund.
Advisory Board Members and Officers:
Correspondence intended for a Member of the Advisory Board (if any) may be sent to Fidelity Investments, P.O. Box 55235, Boston, Massachusetts 02205-5235. Correspondence intended for an officer or Peter S. Lynch may be sent to Fidelity Investments, 245 Summer Street, Boston, Massachusetts 02210. Officers appear below in alphabetical order.
Name, Year of Birth; Principal Occupation
Vicki L. Fuller (1957)
Year of Election or Appointment: 2018
Member of the Advisory Board
Ms. Fuller also serves as Member of the Advisory Board of other Fidelity® funds. Ms. Fuller serves as a member of the Board of Directors, Audit Committee, and Nominating and Governance Committee of The Williams Companies, Inc. (natural gas infrastructure, 2018-present). Previously, Ms. Fuller served as the Chief Investment Officer of the New York State Common Retirement Fund (2012-2018) and held a variety of positions at AllianceBernstein L.P. (global asset management, 1985-2012), including Managing Director (2006-2012) and Senior Vice President and Senior Portfolio Manager (2001-2006).
Patricia L. Kampling (1959)
Year of Election or Appointment: 2020
Member of the Advisory Board
Ms. Kampling also serves as Member of the Advisory Board of other Fidelity® funds. Prior to her retirement, Ms. Kampling served as Chairman of the Board and Chief Executive Officer (2012-2019), President and Chief Operating Officer (2011-2012) and Executive Vice President and Chief Financial Officer (2010-2011) of Alliant Energy Corporation. Ms. Kampling currently serves as a member of the Board, Compensation Committee and Executive Committee and as Chair of the Audit Committee of Briggs & Stratton Corporation (manufacturing, 2011-present) and as a member of the Board, Audit, Finance and Risk Committee and Safety, Environmental, Technology and Operations Committee of American Water Works Company, Inc. (utilities company, 2019-present). In addition, Ms. Kampling currently serves as a member of the Board of the Nature Conservancy, Wisconsin Chapter (2019-present). Previously, Ms. Kampling served as a member of the Board of Interstate Power and Light Company (2012-2019) and Wisconsin Power and Light Company (2012-2019) (each a subsidiary of Alliant Energy Corporation) and as a member of the Board and Workforce Development Committee of the Business Roundtable (2018-2019).
Peter S. Lynch (1944)
Year of Election or Appointment: 2003
Member of the Advisory Board
Mr. Lynch also serves as Member of the Advisory Board of other Fidelity® funds. Mr. Lynch is Vice Chairman and a Director of Fidelity Management & Research Company LLC (investment adviser firm). In addition, Mr. Lynch serves as a Trustee of Boston College and as the Chairman of the Inner-City Scholarship Fund. Previously, Mr. Lynch served as Vice Chairman and a Director of FMR Co., Inc. (investment adviser firm) and on the Special Olympics International Board of Directors (1997-2006).
Susan Tomasky (1953)
Year of Election or Appointment: 2020
Member of the Advisory Board
Ms. Tomasky also serves as Member of the Advisory Board of other Fidelity® funds. Prior to her retirement, Ms. Tomasky served in various executive officer positions at American Electric Power Company, Inc. (1998-2011), including most recently as President of AEP Transmission (2007-2011). Ms. Tomasky currently serves as a member of the Board and Sustainability Committee and as Chair of the Audit Committee of Marathon Petroleum Corporation (2018-present) and as a member of the Board, Corporate Governance Committee and Organization and Compensation Committee and as Chair of the Audit Committee of Public Service Enterprise Group, Inc. (utilities company, 2012-present). In addition, Ms. Tomasky currently serves as a member of the Board of the Columbus Regional Airport Authority (2007-present), as a member of the Board of the Royal Shakespeare Company – America (2009-present), as a member of the Board of the Columbus Association for the Performing Arts (2011-present) and as a member of the Board of Kenyon College (2016-present). Previously, Ms. Tomasky served as a member of the Board (2011-2019) and as Lead Independent Director (2015-2018) of Andeavor Corporation (previously Tesoro Corporation) (independent oil refiner and marketer) and as a member of the Board of Summit Midstream Partners LP (energy, 2012-2018).
Elizabeth Paige Baumann (1968)
Year of Election or Appointment: 2017
Anti-Money Laundering (AML) Officer
Ms. Baumann also serves as AML Officer of other funds. She is Chief AML Officer (2012-present) and Senior Vice President (2014-present) of FMR LLC (diversified financial services company) and is an employee of Fidelity Investments. Previously, Ms. Baumann served as AML Officer of the funds (2012-2016), and Vice President (2007-2014) and Deputy Anti-Money Laundering Officer (2007-2012) of FMR LLC.
Craig S. Brown (1977)
Year of Election or Appointment: 2019
Assistant Treasurer
Mr. Brown also serves as Assistant Treasurer of other funds. Mr. Brown is an employee of Fidelity Investments (2013-present).
John J. Burke III (1964)
Year of Election or Appointment: 2018
Chief Financial Officer
Mr. Burke also serves as Chief Financial Officer of other funds. Mr. Burke serves as Head of Investment Operations for Fidelity Fund and Investment Operations (2018-present) and is an employee of Fidelity Investments (1998-present). Previously Mr. Burke served as head of Asset Management Investment Operations (2012-2018).
William C. Coffey (1969)
Year of Election or Appointment: 2019
Assistant Secretary
Mr. Coffey also serves as Assistant Secretary of other funds. He is Senior Vice President and Deputy General Counsel of FMR LLC (diversified financial services company, 2010-present), and is an employee of Fidelity Investments. Previously, Mr. Coffey served as Secretary and CLO of certain funds (2018-2019); CLO, Secretary, and Senior Vice President of Fidelity Management & Research Company and FMR Co., Inc. (investment adviser firms, 2018-2019); Secretary of Fidelity SelectCo, LLC and Fidelity Investments Money Management, Inc. (investment adviser firms, 2018-2019); CLO of Fidelity Management & Research (Hong Kong) Limited, FMR Investment Management (UK) Limited, and Fidelity Management & Research (Japan) Limited (investment adviser firms, 2018-2019); and Assistant Secretary of certain funds (2009-2018).
Timothy M. Cohen (1969)
Year of Election or Appointment: 2018
Vice President
Mr. Cohen also serves as Vice President of other funds. Mr. Cohen serves as Co-Head of Equity (2018-present), a Director of Fidelity Management & Research (Japan) Limited (investment adviser firm, 2016-present), and is an employee of Fidelity Investments. Previously, Mr. Cohen served as Executive Vice President of Fidelity SelectCo, LLC (2019), Head of Global Equity Research (2016-2018), Chief Investment Officer - Equity and a Director of Fidelity Management & Research (U.K.) Inc. (investment adviser firm, 2013-2015) and as a Director of Fidelity Management & Research (Hong Kong) Limited (investment adviser firm, 2017).
Jonathan Davis (1968)
Year of Election or Appointment: 2010
Assistant Treasurer
Mr. Davis also serves as Assistant Treasurer of other funds. Mr. Davis serves as Assistant Treasurer of FMR Capital, Inc. (2017-present) and is an employee of Fidelity Investments. Previously, Mr. Davis served as Vice President and Associate General Counsel of FMR LLC (diversified financial services company, 2003-2010).
Laura M. Del Prato (1964)
Year of Election or Appointment: 2018
Assistant Treasurer
Ms. Del Prato also serves as an officer of other funds. Ms. Del Prato is an employee of Fidelity Investments (2017-present). Prior to joining Fidelity Investments, Ms. Del Prato served as a Managing Director and Treasurer of the JPMorgan Mutual Funds (2014-2017). Prior to JPMorgan, Ms. Del Prato served as a partner at Cohen Fund Audit Services (accounting firm, 2012-2013) and KPMG LLP (accounting firm, 2004-2012).
Colm A. Hogan (1973)
Year of Election or Appointment: 2020
Assistant Treasurer
Mr. Hogan also serves as an officer of other funds. Mr. Hogan serves as Assistant Treasurer of FMR Capital, Inc. (2017-present) and is an employee of Fidelity Investments (2005-present). Previously, Mr. Hogan served as Deputy Treasurer of certain Fidelity® funds (2016-2020) and Assistant Treasurer of certain Fidelity® funds (2016-2018).
Pamela R. Holding (1964)
Year of Election or Appointment: 2018
Vice President
Ms. Holding also serves as Vice President of other funds. Ms. Holding serves as Co-Head of Equity (2018-present) and is an employee of Fidelity Investments (2013-present). Previously, Ms. Holding served as Executive Vice President of Fidelity SelectCo, LLC (2019) and as Chief Investment Officer of Fidelity Institutional Asset Management (2013-2018).
Cynthia Lo Bessette (1969)
Year of Election or Appointment: 2019
Secretary and Chief Legal Officer (CLO)
Ms. Lo Bessette also serves as an officer of other funds. Ms. Lo Bessette serves as CLO, Secretary, and Senior Vice President of Fidelity Management & Research Company LLC (investment adviser firm, 2019-present); and CLO of Fidelity Management & Research (Hong Kong) Limited, FMR Investment Management (UK) Limited, and Fidelity Management & Research (Japan) Limited (investment adviser firms, 2019-present). She is a Senior Vice President and Deputy General Counsel of FMR LLC (diversified financial services company, 2019-present), and is an employee of Fidelity Investments. Previously, Ms. Lo Bessette served as CLO, Secretary, and Senior Vice President of FMR Co., Inc. (investment adviser firm, 2019); Secretary of Fidelity SelectCo, LLC and Fidelity Investments Money Management, Inc. (investment adviser firms, 2019). Prior to joining Fidelity Investments, Ms. Lo Bessette was Executive Vice President, General Counsel (2016-2019) and Senior Vice President, Deputy General Counsel (2015-2016) of OppenheimerFunds (investment management company) and Deputy Chief Legal Officer (2013-2015) of Jennison Associates LLC (investment adviser firm).
Chris Maher (1972)
Year of Election or Appointment: 2020
Deputy Treasurer
Mr. Maher also serves as an officer of other funds. Mr. Maher serves as Assistant Treasurer of FMR Capital, Inc. (2017-present), and is an employee of Fidelity Investments (2008-present). Previously, Mr. Maher served as Assistant Treasurer of certain funds (2013-2020); Vice President of Asset Management Compliance (2013), Vice President of the Program Management Group of FMR (investment adviser firm, 2010-2013), and Vice President of Valuation Oversight (2008-2010).
Kenneth B. Robins (1969)
Year of Election or Appointment: 2016
Chief Compliance Officer
Mr. Robins also serves as an officer of other funds. Mr. Robins serves as Compliance Officer of Fidelity Management & Research Company LLC (investment adviser firm, 2016-present) and is an employee of Fidelity Investments (2004-present). Previously, Mr. Robins served as Compliance Officer of FMR Co., Inc. (investment adviser firm, 2016-2019), as Executive Vice President of Fidelity Investments Money Management, Inc. (investment adviser firm, 2013-2016) and served in other fund officer roles.
Stacie M. Smith (1974)
Year of Election or Appointment: 2016
President and Treasurer
Ms. Smith also serves as an officer of other funds. Ms. Smith serves as Assistant Treasurer of FMR Capital, Inc. (2017-present), is an employee of Fidelity Investments (2009-present), and has served in other fund officer roles. Prior to joining Fidelity Investments, Ms. Smith served as Senior Audit Manager of Ernst & Young LLP (accounting firm, 1996-2009). Previously, Ms. Smith served as Assistant Treasurer (2013-2019) and Deputy Treasurer (2013-2016) of certain Fidelity® funds.
Marc L. Spector (1972)
Year of Election or Appointment: 2016
Assistant Treasurer
Mr. Spector also serves as an officer of other funds. Mr. Spector serves as Assistant Treasurer of FMR Capital, Inc. (2017-present) and is an employee of Fidelity Investments (2016-present). Prior to joining Fidelity Investments, Mr. Spector served as Director at the Siegfried Group (accounting firm, 2013-2016), and prior to Siegfried Group as audit senior manager at Deloitte & Touche (accounting firm, 2005-2013).
Jim Wegmann (1979)
Year of Election or Appointment: 2019
Assistant Treasurer
Mr. Wegmann also serves as Assistant Treasurer of other funds. Mr. Wegmann is an employee of Fidelity Investments (2011-present).
Shareholder Expense Example
As a shareholder of the Fund, you incur two types of costs: (1) transaction costs and (2) ongoing costs, including management fees and other Fund expenses. This Example is intended to help you understand your ongoing costs (in dollars) of investing in the Fund and to compare these costs with the ongoing costs of investing in other mutual funds.
The Example is based on an investment of $1,000 invested at the beginning of the period and held for the entire period (July 1, 2019 to December 31, 2019).
Actual Expenses
The first line of the accompanying table provides information about actual account values and actual expenses. You may use the information in this line, together with the amount you invested, to estimate the expenses that you paid over the period. Simply divide your account value by $1,000.00 (for example, an $8,600 account value divided by $1,000.00 = 8.6), then multiply the result by the number in the first line under the heading entitled "Expenses Paid During Period" to estimate the expenses you paid on your account during this period. In addition, the Fund, as a shareholder in the underlying Fidelity Central Funds, will indirectly bear its pro-rata share of the fees and expenses incurred by the underlying Fidelity Central Funds. These fees and expenses are not included in the Fund's annualized expense ratio used to calculate the expense estimate in the table below.
Hypothetical Example for Comparison Purposes
The second line of the accompanying table provides information about hypothetical account values and hypothetical expenses based on the Fund's actual expense ratio and an assumed rate of return of 5% per year before expenses, which is not the Fund's actual return. The hypothetical account values and expenses may not be used to estimate the actual ending account balance or expenses you paid for the period. You may use this information to compare the ongoing costs of investing in the Fund and other funds. To do so, compare this 5% hypothetical example with the 5% hypothetical examples that appear in the shareholder reports of the other funds. In addition, the Fund, as a shareholder in the underlying Fidelity Central Funds, will indirectly bear its pro-rata share of the fees and expenses incurred by the underlying Fidelity Central Funds. These fees and expenses are not included in the Fund's annualized expense ratio used to calculate the expense estimate in the table below.
Please note that the expenses shown in the table are meant to highlight your ongoing costs only and do not reflect any transaction costs. Therefore, the second line of the table is useful in comparing ongoing costs only, and will not help you determine the relative total costs of owning different funds.
| | Annualized Expense Ratio-A | Beginning
Account Value
July 1, 2019 | Ending
Account Value
December 31, 2019 | Expenses Paid
During Period-B
July 1, 2019
to December 31, 2019 |
| Actual | .62% | $1,000.00 | $1,106.70 | $3.29 |
| Hypothetical-C | | $1,000.00 | $1,022.08 | $3.16 |
A Annualized expense ratio reflects expenses net of applicable fee waivers.
B Expenses are equal to the Fund's annualized expense ratio, multiplied by the average account value over the period, multiplied by 184/365 (to reflect the one-half year period).
C 5% return per year before expenses
Distributions (Unaudited)
The Board of Trustees of Fidelity Trend Fund voted to pay on February 10, 2020, to shareholders of record at the opening of business on February 7, 2020, a distribution of $1.116 per share derived from capital gains realized from sales of portfolio securities and a dividend of $0.055 per share from net investment income.
The fund hereby designates as a capital gain dividend with respect to the taxable year ended December 31, 2019, $191,678,937, or, if subsequently determined to be different, the net capital gain of such year.
The fund designates 100% of the dividends distributed during the fiscal year as qualifying for the dividends–received deduction for corporate shareholders.
The fund designates 100% of the dividends distributed in February and December during the fiscal year as amounts which may be taken into account as a dividend for the purposes of the maximum rate under section 1(h)(11) of the Internal Revenue Code.
The fund will notify shareholders in January 2020 of amounts for use in preparing 2019 income tax returns.
Board Approval of Investment Advisory Contracts
Fidelity Trend Fund
At its November 2019 meeting, the Board of Trustees, including the Independent Trustees (together, the Board), voted to approve an amended and restated management contract and amended and restated sub-advisory agreements (together, the Amended and Restated Contracts) for the fund, effective January 1, 2020, for a one month period through January 31, 2020, in connection with an upcoming consolidation of certain of Fidelity's advisory businesses.
The Board considered that, on or about January 1, 2020, each of FMR Co., Inc. (FMRC), Fidelity Investments Money Management, Inc. (FIMM), and SelectCo, LLC (SelectCo) will merge with and into Fidelity Management & Research Company (FMR) and that, after the merger, FMR will redomicile as a Delaware limited liability company. The Board also approved the termination of the sub-advisory agreement with FMRC upon the completion of the merger. The Board noted that the Amended and Restated Contracts would be updated to reflect the renamed adviser, Fidelity Management & Research Company LLC and its new form of organization and domicile. The Board also noted that the Amended and Restated Contracts will not change the investment processes, the level or nature of services provided, the resources and personnel allocated, trading and compliance operations, or any fees or expenses paid by the fund.
The Board concluded that the fund's Amended and Restated Contracts are fair and reasonable, and that the fund's Advisory Contracts should be approved through January 31, 2020.
In connection with its consideration of future renewals of the fund's Amended and Restated Contracts, the Board will consider: (i) the nature, extent and quality of services provided to the fund, including shareholder and administrative services and investment performance; (ii) the competitiveness of the management fee and total expenses for the fund; (iii) the costs of the services and profitability, including the revenues earned and the expenses incurred in conducting the business of developing, marketing, distributing, managing, administering, and servicing the fund and its shareholders, to the extent applicable; and (iv) whether there have been economies of scale in respect of the Fidelity funds, whether the Fidelity funds (including the fund) have appropriately benefited from any such economies of scale, and whether there is the potential for realization of any further economies.
Based on its evaluation of all of the conclusions noted above, and after considering all factors it believed relevant, the Board ultimately concluded that the fund's management fee structure is fair and reasonable, and that the continuation of the fund's Amended and Restated Contracts should be approved.

TRE-ANN-0220
1.540017.122