UNITED STATES
SECURITIES AND EXCHANGE COMMISSION
Washington, D.C. 20549
FORM N-CSR
CERTIFIED SHAREHOLDER REPORT OF REGISTERED
MANAGEMENT INVESTMENT COMPANIES
Investment Company Act file number 811-03221
Fidelity Charles Street Trust
(Exact name of registrant as specified in charter)
245 Summer St., Boston, MA 02210
(Address of principal executive offices) (Zip code)
Margaret Carey, Secretary
245 Summer St.
Boston, Massachusetts 02210
(Name and address of agent for service)
Registrant's telephone number, including area code:
617-563-7000
Date of fiscal year end: | September 30 |
Date of reporting period: | March 31, 2023 |
Item 1.
Reports to Stockholders


Contents
Top Holdings (% of Fund's net assets) | ||
| Apple, Inc. | 1.1 | |
| Microsoft Corp. | 1.1 | |
| iShares MSCI USA Minimum Volatility ETF | 0.8 | |
| VanEck Vectors Gold Miners ETF | 0.5 | |
| Alphabet, Inc. Class A | 0.5 | |
| iShares 20+ Year Treasury Bond ETF | 0.5 | |
| Amazon.com, Inc. | 0.4 | |
| Exxon Mobil Corp. | 0.3 | |
| Taiwan Semiconductor Manufacturing Co. Ltd. | 0.3 | |
| Meta Platforms, Inc. Class A | 0.2 | |
| 5.7 | ||
| Top Bond Issuers (% of Fund's net assets) | ||
(with maturities greater than one year) | ||
| U.S. Treasury Obligations | 21.4 | |
| Fannie Mae | 2.9 | |
| Freddie Mac | 2.9 | |
| Ginnie Mae | 1.8 | |
| Uniform Mortgage Backed Securities | 1.1 | |
| JPMorgan Chase & Co. | 0.7 | |
| Morgan Stanley | 0.6 | |
| Bank of America Corp. | 0.5 | |
| Citigroup, Inc. | 0.5 | |
| Petroleos Mexicanos | 0.5 | |
| 32.9 | ||
| Market Sectors (% of Fund's net assets) | ||
| Financials | 30.6 | |
| Information Technology | 5.8 | |
| Health Care | 4.1 | |
| Consumer Discretionary | 3.9 | |
| Industrials | 3.9 | |
| Communication Services | 3.2 | |
| Energy | 3.0 | |
| Consumer Staples | 2.7 | |
| Real Estate | 2.1 | |
| Utilities | 1.4 | |
| Materials | 1.1 | |
| Financial Services | 0.1 | |
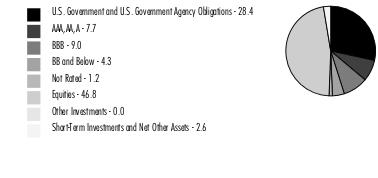
Quality Diversification (% of Fund's net assets) |
 |
Percentages shown as 0.0% may reflect amounts less than 0.05%. |
| We have used ratings from Moody's Investors Service, Inc. Where Moody's® ratings are not available, we have used S&P® ratings. All ratings are as of the date indicated and do not reflect subsequent changes. |
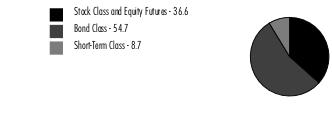
Asset Allocation (% of Fund's net assets) |
 |
Geographic Diversification (% of Fund's net assets) |
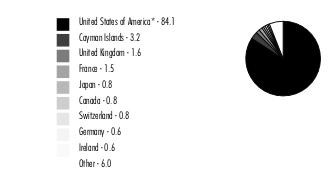 |
* Includes Short-Term investments and Net Other Assets (Liabilities). Percentages are based on country or territory of incorporation and are adjusted for the effect of derivatives, if applicable. |
| Equity Central Funds - 24.9% | |||
| Shares | Value ($) | ||
| Fidelity Commodity Strategy Central Fund (a) | 458,026 | 44,300,241 | |
| Fidelity Emerging Markets Equity Central Fund (a) | 842,617 | 162,304,806 | |
| Fidelity Hedged Equity Central Fund (a) | 166,378 | 16,824,192 | |
| Fidelity International Equity Central Fund (a) | 3,613,885 | 330,815,058 | |
| Fidelity Real Estate Equity Central Fund (a) | 212,068 | 25,556,359 | |
| Fidelity U.S. Equity Central Fund (a) | 7,416,572 | 829,988,539 | |
| TOTAL EQUITY CENTRAL FUNDS (Cost $907,126,610) | 1,409,789,195 | ||
| Fixed-Income Central Funds - 53.9% | |||
| Shares | Value ($) | ||
| High Yield Fixed-Income Funds - 4.1% | |||
| Fidelity Emerging Markets Debt Central Fund (a) | 1,327,459 | 10,048,865 | |
| Fidelity Emerging Markets Debt Local Currency Central Fund (a) | 492,927 | 43,914,844 | |
| Fidelity Floating Rate Central Fund (a) | 1,386,652 | 133,506,894 | |
| Fidelity High Income Central Fund (a) | 439,580 | 44,995,360 | |
TOTAL HIGH YIELD FIXED-INCOME FUNDS | 232,465,963 | ||
| Investment Grade Fixed-Income Funds - 49.8% | |||
| Fidelity Inflation-Protected Bond Index Central Fund (a) | 775,562 | 70,126,275 | |
| Fidelity International Credit Central Fund (a) | 529,062 | 41,134,561 | |
| Fidelity Investment Grade Bond Central Fund (a) | 27,291,920 | 2,701,900,034 | |
TOTAL INVESTMENT GRADE FIXED-INCOME FUNDS | 2,813,160,870 | ||
| TOTAL FIXED-INCOME CENTRAL FUNDS (Cost $3,179,563,735) | 3,045,626,833 | ||
| Money Market Central Funds - 19.1% | |||
| Shares | Value ($) | ||
| Fidelity Cash Central Fund 4.86% (b) | 40,103,772 | 40,111,793 | |
| Fidelity Money Market Central Fund 4.99% (b) | 1,037,899,228 | 1,037,795,438 | |
| TOTAL MONEY MARKET CENTRAL FUNDS (Cost $1,077,993,876) | 1,077,907,231 | ||
| U.S. Treasury Obligations - 0.4% | |||
Principal Amount (c) | Value ($) | ||
U.S. Treasury Bills, yield at date of purchase 4.41% to 4.93% 4/6/23 to 6/8/23 (d) (Cost $25,069,178) | 25,270,000 | 25,085,670 | |
| Investment Companies - 1.8% | |||
| Shares | Value ($) | ||
| iShares 20+ Year Treasury Bond ETF | 271,757 | 28,906,792 | |
| iShares MSCI USA Minimum Volatility ETF | 585,090 | 42,559,449 | |
| VanEck Vectors Gold Miners ETF | 912,872 | 29,531,409 | |
| TOTAL INVESTMENT COMPANIES (Cost $101,948,735) | 100,997,650 | ||
| TOTAL INVESTMENT IN SECURITIES - 100.1% (Cost $5,291,702,134) | 5,659,406,579 |
NET OTHER ASSETS (LIABILITIES) - (0.1)% | (4,725,813) |
| NET ASSETS - 100.0% | 5,654,680,766 |
| Futures Contracts | |||||
Number of contracts | Expiration Date | Notional Amount ($) | Value ($) | Unrealized Appreciation/ (Depreciation) ($) | |
| Purchased | |||||
| Equity Index Contracts | |||||
| ICE E-mini MSCI EAFE Index Contracts (United States) | 271 | Jun 2023 | 28,407,575 | 1,196,691 | 1,196,691 |
| ICE E-mini MSCI Emerging Markets Index Contracts (United States) | 133 | Jun 2023 | 6,620,075 | 237,519 | 237,519 |
| TOTAL EQUITY INDEX CONTRACTS | 1,434,210 | ||||
| Treasury Contracts | |||||
| CBOT 5-Year U.S. Treasury Note Contracts (United States) | 396 | Jun 2023 | 43,365,094 | 918,048 | 918,048 |
| TOTAL PURCHASED | 2,352,258 | ||||
| Sold | |||||
| Equity Index Contracts | |||||
| CME E-mini S&P 500 Index Contracts (United States) | 1,964 | Jun 2023 | 406,327,050 | (23,831,136) | (23,831,136) |
| TOTAL FUTURES CONTRACTS | (21,478,878) | ||||
| The notional amount of futures purchased as a percentage of Net Assets is 1.4% | |||||
| The notional amount of futures sold as a percentage of Net Assets is 7.2% | |||||
| ETF | - | EXCHANGE-TRADED FUND |
| (a) | Affiliated fund that is generally available only to investment companies and other accounts managed by Fidelity Investments. A complete unaudited schedule of portfolio holdings for each Fidelity Central Fund is filed with the SEC for the first and third quarters of each fiscal year on Form N-PORT and is available upon request or at the SEC's website at www.sec.gov. An unaudited holdings listing for the Fund, which presents direct holdings as well as the pro-rata share of securities and other investments held indirectly through its investment in underlying non-money market Fidelity Central Funds, other than the Commodity Strategy Central Fund, is available at fidelity.com and/or institutional.fidelity.com, as applicable. In addition, each Fidelity Central Fund's financial statements are available on the SEC's website or upon request. |
| (b) | Affiliated fund that is generally available only to investment companies and other accounts managed by Fidelity Investments. The rate quoted is the annualized seven-day yield of the fund at period end. A complete unaudited listing of the fund's holdings as of its most recent quarter end is available upon request. In addition, each Fidelity Central Fund's financial statements are available on the SEC's website or upon request. |
| (c) | Amount is stated in United States dollars unless otherwise noted. |
| (d) | Security or a portion of the security was pledged to cover margin requirements for futures contracts. At period end, the value of securities pledged amounted to $25,085,670. |
| Affiliate | Value, beginning of period ($) | Purchases ($) | Sales Proceeds ($) | Dividend Income ($) | Realized Gain (loss) ($) | Change in Unrealized appreciation (depreciation) ($) | Value, end of period ($) | % ownership, end of period |
| Fidelity Cash Central Fund 4.86% | 59,228,042 | 431,818,444 | 450,934,693 | 1,044,769 | - | - | 40,111,793 | 0.1% |
| Fidelity Commodity Strategy Central Fund | 106,709,912 | 5,117,043 | 64,817,838 | 1,128,701 | (18,270,914) | 15,562,038 | 44,300,241 | 9.5% |
| Fidelity Emerging Markets Debt Central Fund | 10,372,630 | 1,743,111 | 2,677,515 | 330,632 | (503,765) | 1,114,404 | 10,048,865 | 0.5% |
| Fidelity Emerging Markets Debt Local Currency Central Fund | 11,242,314 | 30,501,877 | - | 34,580 | - | 2,170,653 | 43,914,844 | 15.9% |
| Fidelity Emerging Markets Equity Central Fund | 117,545,795 | 88,882,049 | 54,983,444 | 1,288,774 | (29,571,807) | 40,432,213 | 162,304,806 | 7.1% |
| Fidelity Floating Rate Central Fund | 159,044,039 | 13,739,553 | 42,962,701 | 6,585,647 | (1,278,683) | 4,964,686 | 133,506,894 | 7.1% |
| Fidelity Hedged Equity Central Fund | - | 16,637,624 | - | 9,146 | - | 186,568 | 16,824,192 | 15.8% |
| Fidelity High Income Central Fund | 42,203,666 | 3,977,794 | 3,119,820 | 1,743,673 | 374,230 | 1,559,490 | 44,995,360 | 2.7% |
| Fidelity Inflation-Protected Bond Index Central Fund | 68,571,060 | 10,706,870 | 4,875,410 | 7,431,676 | (183,472) | (4,092,773) | 70,126,275 | 11.2% |
| Fidelity International Credit Central Fund | 51,773,273 | 4,054,459 | 13,203,923 | 2,375,780 | (3,953,779) | 2,464,531 | 41,134,561 | 11.6% |
| Fidelity International Equity Central Fund | 172,519,871 | 152,850,141 | 43,657,484 | 1,300,207 | (6,261,420) | 55,363,950 | 330,815,058 | 6.8% |
| Fidelity Investment Grade Bond Central Fund | 2,397,843,318 | 392,112,716 | 172,191,459 | 46,160,141 | (4,527,317) | 88,662,776 | 2,701,900,034 | 7.4% |
| Fidelity Money Market Central Fund 0.45% | 1,111,446,680 | 74,131,344 | 147,785,167 | 23,541,899 | (6,952) | 9,533 | 1,037,795,438 | 81.2% |
| Fidelity Real Estate Equity Central Fund | 36,620,079 | 2,316,319 | 16,627,346 | 498,096 | (916,328) | 4,163,635 | 25,556,359 | 2.7% |
| Fidelity Securities Lending Cash Central Fund 4.87% | - | 178,375,444 | 178,375,444 | 1,591 | - | - | - | 0.0% |
| Fidelity U.S. Equity Central Fund | 858,863,446 | 53,757,114 | 196,859,553 | 18,308,522 | (8,118,236) | 122,345,768 | 829,988,539 | 5.3% |
| Total | 5,203,984,125 | 1,460,721,902 | 1,393,071,797 | 111,783,834 | (73,218,443) | 334,907,472 | 5,533,323,259 | |
| Valuation Inputs at Reporting Date: | ||||
| Description | Total ($) | Level 1 ($) | Level 2 ($) | Level 3 ($) |
Investments in Securities: | ||||
| Equity Central Funds | 1,409,789,195 | 1,409,789,195 | - | - |
| Fixed-Income Central Funds | 3,045,626,833 | 3,045,626,833 | - | - |
| Money Market Central Funds | 1,077,907,231 | 1,077,907,231 | - | - |
| Other Short-Term Investments and Net Other Assets | 25,085,670 | - | 25,085,670 | - |
| Investment Companies | 100,997,650 | 100,997,650 | - | - |
| Total Investments in Securities: | 5,659,406,579 | 5,634,320,909 | 25,085,670 | - |
Derivative Instruments: | ||||
| Assets | ||||
Futures Contracts | 2,352,258 | 2,352,258 | - | - |
| Total Assets | 2,352,258 | 2,352,258 | - | - |
| Liabilities | ||||
Futures Contracts | (23,831,136) | (23,831,136) | - | - |
| Total Liabilities | (23,831,136) | (23,831,136) | - | - |
| Total Derivative Instruments: | (21,478,878) | (21,478,878) | - | - |
Primary Risk Exposure / Derivative Type | Value | |
| Asset ($) | Liability ($) | |
| Equity Risk | ||
Futures Contracts (a) | 1,434,210 | (23,831,136) |
| Total Equity Risk | 1,434,210 | (23,831,136) |
| Interest Rate Risk | ||
Futures Contracts (a) | 918,048 | 0 |
| Total Interest Rate Risk | 918,048 | 0 |
| Total Value of Derivatives | 2,352,258 | (23,831,136) |
| Statement of Assets and Liabilities | ||||
March 31, 2023 (Unaudited) | ||||
| Assets | ||||
| Investment in securities, at value - See accompanying schedule: | ||||
Unaffiliated issuers (cost $127,017,913) | $ | 126,083,320 | ||
Fidelity Central Funds (cost $5,164,684,221) | 5,533,323,259 | |||
| Total Investment in Securities (cost $5,291,702,134) | $ | 5,659,406,579 | ||
| Receivable for investments sold | 5,997,111 | |||
| Receivable for fund shares sold | 616,848 | |||
| Distributions receivable from Fidelity Central Funds | 150,179 | |||
| Prepaid expenses | 2,932 | |||
Total assets | 5,666,173,649 | |||
| Liabilities | ||||
| Payable for investments purchased | $ | 9,638 | ||
| Payable for fund shares redeemed | 3,600,647 | |||
| Accrued management fee | 1,865,538 | |||
| Distribution and service plan fees payable | 39,160 | |||
| Payable for daily variation margin on futures contracts | 5,478,051 | |||
| Other affiliated payables | 453,830 | |||
| Other payables and accrued expenses | 46,019 | |||
| Total Liabilities | 11,492,883 | |||
| Net Assets | $ | 5,654,680,766 | ||
| Net Assets consist of: | ||||
| Paid in capital | $ | 5,650,634,982 | ||
| Total accumulated earnings (loss) | 4,045,784 | |||
| Net Assets | $ | 5,654,680,766 | ||
| Net Asset Value and Maximum Offering Price | ||||
| Class A : | ||||
Net Asset Value and redemption price per share ($57,587,431 ÷ 4,410,613 shares) (a) | $ | 13.06 | ||
| Maximum offering price per share (100/94.25 of $13.06) | $ | 13.86 | ||
| Class M : | ||||
Net Asset Value and redemption price per share ($28,906,503 ÷ 2,220,006 shares) (a) | $ | 13.02 | ||
| Maximum offering price per share (100/96.50 of $13.02) | $ | 13.49 | ||
| Class C : | ||||
Net Asset Value and offering price per share ($19,105,755 ÷ 1,479,438 shares) (a) | $ | 12.91 | ||
| Asset Manager 20% : | ||||
Net Asset Value , offering price and redemption price per share ($3,659,501,310 ÷ 279,754,253 shares) | $ | 13.08 | ||
| Class I : | ||||
Net Asset Value , offering price and redemption price per share ($29,118,076 ÷ 2,225,615 shares) | $ | 13.08 | ||
| Class Z : | ||||
Net Asset Value , offering price and redemption price per share ($1,860,461,691 ÷ 142,294,169 shares) | $ | 13.07 | ||
(a)Redemption price per share is equal to net asset value less any applicable contingent deferred sales charge. | ||||
| Statement of Operations | ||||
Six months ended March 31, 2023 (Unaudited) | ||||
| Investment Income | ||||
| Dividends | $ | 1,318,090 | ||
| Interest | 420,526 | |||
| Income from Fidelity Central Funds (including $1,591 from security lending) | 96,899,114 | |||
| Total Income | 98,637,730 | |||
| Expenses | ||||
| Management fee | $ | 11,127,725 | ||
| Transfer agent fees | 2,095,782 | |||
| Distribution and service plan fees | 236,864 | |||
| Accounting fees | 598,092 | |||
| Custodian fees and expenses | 19,240 | |||
| Independent trustees' fees and expenses | 11,280 | |||
| Registration fees | 68,744 | |||
| Audit | 24,740 | |||
| Legal | 10,166 | |||
| Miscellaneous | 13,858 | |||
| Total expenses before reductions | 14,206,491 | |||
| Expense reductions | (57,653) | |||
| Total expenses after reductions | 14,148,838 | |||
| Net Investment income (loss) | 84,488,892 | |||
| Realized and Unrealized Gain (Loss) | ||||
| Net realized gain (loss) on: | ||||
| Investment Securities: | ||||
| Unaffiliated issuers | (25,064,170) | |||
| Fidelity Central Funds | (73,218,443) | |||
| Futures contracts | 19,015,594 | |||
| Capital gain distributions from Fidelity Central Funds | 14,590,285 | |||
| Total net realized gain (loss) | (64,676,734) | |||
| Change in net unrealized appreciation (depreciation) on: | ||||
| Investment Securities: | ||||
| Unaffiliated issuers | 29,347,321 | |||
| Fidelity Central Funds | 334,907,472 | |||
| Futures contracts | (58,695,115) | |||
| Total change in net unrealized appreciation (depreciation) | 305,559,678 | |||
| Net gain (loss) | 240,882,944 | |||
| Net increase (decrease) in net assets resulting from operations | $ | 325,371,836 | ||
| Statement of Changes in Net Assets | ||||
Six months ended March 31, 2023 (Unaudited) | Year ended September 30, 2022 | |||
| Increase (Decrease) in Net Assets | ||||
| Operations | ||||
| Net investment income (loss) | $ | 84,488,892 | $ | 120,665,591 |
| Net realized gain (loss) | (64,676,734) | 141,315,034 | ||
| Change in net unrealized appreciation (depreciation) | 305,559,678 | (1,018,435,410) | ||
| Net increase (decrease) in net assets resulting from operations | 325,371,836 | (756,454,785) | ||
| Distributions to shareholders | (214,481,973) | (122,000,836) | ||
| Share transactions - net increase (decrease) | 110,539,404 | (49,428,139) | ||
| Total increase (decrease) in net assets | 221,429,267 | (927,883,760) | ||
| Net Assets | ||||
| Beginning of period | 5,433,251,499 | 6,361,135,259 | ||
| End of period | $ | 5,654,680,766 | $ | 5,433,251,499 |
| Fidelity Advisor Asset Manager® 20% Class A |
Six months ended (Unaudited) March 31, 2023 | Years ended September 30, 2022 | 2021 | 2020 | 2019 | 2018 | |||||||
Selected Per-Share Data | ||||||||||||
| Net asset value, beginning of period | $ | 12.81 | $ | 14.74 | $ | 14.00 | $ | 13.51 | $ | 13.40 | $ | 13.55 |
| Income from Investment Operations | ||||||||||||
Net investment income (loss) A,B | .18 | .23 | .14 | .18 | .26 | .20 | ||||||
| Net realized and unrealized gain (loss) | .55 | (1.93) | .82 | .62 | .36 | .11 | ||||||
| Total from investment operations | .73 | (1.70) | .96 | .80 | .62 | .31 | ||||||
| Distributions from net investment income | (.22) | (.19) | (.11) | (.19) | (.26) | (.19) | ||||||
| Distributions from net realized gain | (.26) | (.03) | (.12) | (.13) | (.24) | (.27) | ||||||
| Total distributions | (.48) | (.23) C | (.22) C | (.31) C | (.51) C | (.46) | ||||||
| Net asset value, end of period | $ | 13.06 | $ | 12.81 | $ | 14.74 | $ | 14.00 | $ | 13.51 | $ | 13.40 |
Total Return D,E,F | 5.83% | (11.71)% | 6.91% | 6.04% | 4.85% | 2.36% | ||||||
Ratios to Average Net Assets B,G,H | ||||||||||||
| Expenses before reductions | .82% I | .81% | .81% | .82% | .83% | .84% | ||||||
| Expenses net of fee waivers, if any | .81% I | .81% | .81% | .82% | .83% | .84% | ||||||
| Expenses net of all reductions | .81% I | .81% | .81% | .82% | .83% | .84% | ||||||
| Net investment income (loss) | 2.72% I | 1.61% | .97% | 1.34% | 1.97% | 1.49% | ||||||
| Supplemental Data | ||||||||||||
| Net assets, end of period (000 omitted) | $ | 57,587 | $ | 56,979 | $ | 62,957 | $ | 50,633 | $ | 45,153 | $ | 39,089 |
Portfolio turnover rate J | 36% I | 22% | 25% | 25% | 41% | 24% |
| Fidelity Advisor Asset Manager® 20% Class M |
Six months ended (Unaudited) March 31, 2023 | Years ended September 30, 2022 | 2021 | 2020 | 2019 | 2018 | |||||||
Selected Per-Share Data | ||||||||||||
| Net asset value, beginning of period | $ | 12.77 | $ | 14.70 | $ | 13.97 | $ | 13.48 | $ | 13.37 | $ | 13.52 |
| Income from Investment Operations | ||||||||||||
Net investment income (loss) A,B | .16 | .19 | .10 | .15 | .23 | .16 | ||||||
| Net realized and unrealized gain (loss) | .55 | (1.92) | .82 | .62 | .35 | .12 | ||||||
| Total from investment operations | .71 | (1.73) | .92 | .77 | .58 | .28 | ||||||
| Distributions from net investment income | (.21) | (.16) | (.07) | (.15) | (.23) | (.16) | ||||||
| Distributions from net realized gain | (.26) | (.03) | (.12) | �� | (.13) | (.24) | (.27) | |||||
| Total distributions | (.46) C | (.20) C | (.19) | (.28) | (.47) | (.43) | ||||||
| Net asset value, end of period | $ | 13.02 | $ | 12.77 | $ | 14.70 | $ | 13.97 | $ | 13.48 | $ | 13.37 |
Total Return D,E,F | 5.71% | (11.94)% | 6.60% | 5.79% | 4.58% | 2.10% | ||||||
Ratios to Average Net Assets B,G,H | ||||||||||||
| Expenses before reductions | 1.07% I | 1.06% | 1.07% | 1.08% | 1.08% | 1.10% | ||||||
| Expenses net of fee waivers, if any | 1.06% I | 1.06% | 1.07% | 1.07% | 1.08% | 1.10% | ||||||
| Expenses net of all reductions | 1.06% I | 1.06% | 1.07% | 1.07% | 1.08% | 1.10% | ||||||
| Net investment income (loss) | 2.47% I | 1.36% | .72% | 1.09% | 1.72% | 1.23% | ||||||
| Supplemental Data | ||||||||||||
| Net assets, end of period (000 omitted) | $ | 28,907 | $ | 27,193 | $ | 31,762 | $ | 27,366 | $ | 25,696 | $ | 22,133 |
Portfolio turnover rate J | 36% I | 22% | 25% | 25% | 41% | 24% |
| Fidelity Advisor Asset Manager® 20% Class C |
Six months ended (Unaudited) March 31, 2023 | Years ended September 30, 2022 | 2021 | 2020 | 2019 | 2018 | |||||||
Selected Per-Share Data | ||||||||||||
| Net asset value, beginning of period | $ | 12.67 | $ | 14.61 | $ | 13.91 | $ | 13.43 | $ | 13.32 | $ | 13.47 |
| Income from Investment Operations | ||||||||||||
Net investment income (loss) A,B | .13 | .12 | .03 | .08 | .16 | .10 | ||||||
| Net realized and unrealized gain (loss) | .54 | (1.92) | .82 | .61 | .36 | .11 | ||||||
| Total from investment operations | .67 | (1.80) | .85 | .69 | .52 | .21 | ||||||
| Distributions from net investment income | (.17) | (.11) | (.03) | (.09) | (.16) | (.09) | ||||||
| Distributions from net realized gain | (.26) | (.03) | (.12) | (.13) | (.24) | (.27) | ||||||
| Total distributions | (.43) | (.14) | (.15) | (.21) C | (.41) C | (.36) | ||||||
| Net asset value, end of period | $ | 12.91 | $ | 12.67 | $ | 14.61 | $ | 13.91 | $ | 13.43 | $ | 13.32 |
Total Return D,E,F | 5.41% | (12.41)% | 6.10% | 5.22% | 4.06% | 1.59% | ||||||
Ratios to Average Net Assets B,G,H | ||||||||||||
| Expenses before reductions | 1.57% I | 1.57% | 1.57% | 1.58% | 1.59% | 1.59% | ||||||
| Expenses net of fee waivers, if any | 1.57% I | 1.57% | 1.57% | 1.58% | 1.59% | 1.59% | ||||||
| Expenses net of all reductions | 1.57% I | 1.57% | 1.57% | 1.58% | 1.59% | 1.59% | ||||||
| Net investment income (loss) | 1.96% I | .85% | .22% | .59% | 1.21% | .74% | ||||||
| Supplemental Data | ||||||||||||
| Net assets, end of period (000 omitted) | $ | 19,106 | $ | 19,557 | $ | 25,804 | $ | 24,940 | $ | 21,588 | $ | 26,000 |
Portfolio turnover rate J | 36% I | 22% | 25% | 25% | 41% | 24% |
| Fidelity Asset Manager® 20% |
Six months ended (Unaudited) March 31, 2023 | Years ended September 30, 2022 | 2021 | 2020 | 2019 | 2018 | |||||||
Selected Per-Share Data | ||||||||||||
| Net asset value, beginning of period | $ | 12.83 | $ | 14.76 | $ | 14.02 | $ | 13.54 | $ | 13.42 | $ | 13.57 |
| Income from Investment Operations | ||||||||||||
Net investment income (loss) A,B | .20 | .27 | .19 | .23 | .30 | .24 | ||||||
| Net realized and unrealized gain (loss) | .55 | (1.93) | .82 | .61 | .37 | .12 | ||||||
| Total from investment operations | .75 | (1.66) | 1.01 | .84 | .67 | .36 | ||||||
| Distributions from net investment income | (.24) | (.24) | (.15) | (.23) | (.31) | (.24) | ||||||
| Distributions from net realized gain | (.26) | (.03) | (.12) | (.13) | (.24) | (.27) | ||||||
| Total distributions | (.50) | (.27) | (.27) | (.36) | (.55) | (.51) | ||||||
| Net asset value, end of period | $ | 13.08 | $ | 12.83 | $ | 14.76 | $ | 14.02 | $ | 13.54 | $ | 13.42 |
Total Return C,D | 5.98% | (11.41)% | 7.24% | 6.29% | 5.24% | 2.68% | ||||||
Ratios to Average Net Assets B,E,F | ||||||||||||
| Expenses before reductions | .51% G | .50% | .50% | .51% | .51% | .52% | ||||||
| Expenses net of fee waivers, if any | .51% G | .50% | .50% | .50% | .51% | .52% | ||||||
| Expenses net of all reductions | .51% G | .50% | .50% | .50% | .51% | .51% | ||||||
| Net investment income (loss) | 3.02% G | 1.92% | 1.29% | 1.66% | 2.29% | 1.81% | ||||||
| Supplemental Data | ||||||||||||
| Net assets, end of period (000 omitted) | $ | 3,659,501 | $ | 3,734,894 | $ | 4,723,410 | $ | 5,377,374 | $ | 4,990,188 | $ | 4,819,671 |
Portfolio turnover rate H | 36% G | 22% | 25% | 25% | 41% | 24% |
| Fidelity Advisor Asset Manager® 20% Class I |
Six months ended (Unaudited) March 31, 2023 | Years ended September 30, 2022 | 2021 | 2020 | 2019 | 2018 | |||||||
Selected Per-Share Data | ||||||||||||
| Net asset value, beginning of period | $ | 12.83 | $ | 14.76 | $ | 14.02 | $ | 13.53 | $ | 13.41 | $ | 13.57 |
| Income from Investment Operations | ||||||||||||
Net investment income (loss) A,B | .19 | .26 | .18 | .22 | .30 | .24 | ||||||
| Net realized and unrealized gain (loss) | .56 | (1.93) | .82 | .61 | .36 | .10 | ||||||
| Total from investment operations | .75 | (1.67) | 1.00 | .83 | .66 | .34 | ||||||
| Distributions from net investment income | (.24) | (.23) | (.14) | (.22) | (.30) | (.23) | ||||||
| Distributions from net realized gain | (.26) | (.03) | (.12) | (.13) | (.24) | (.27) | ||||||
| Total distributions | (.50) | (.26) | (.26) | (.34) C | (.54) | (.50) | ||||||
| Net asset value, end of period | $ | 13.08 | $ | 12.83 | $ | 14.76 | $ | 14.02 | $ | 13.53 | $ | 13.41 |
Total Return D,E | 5.94% | (11.46)% | 7.17% | 6.27% | 5.18% | 2.57% | ||||||
Ratios to Average Net Assets B,F,G | ||||||||||||
| Expenses before reductions | .56% H | .55% | .55% | .58% | .56% | .55% | ||||||
| Expenses net of fee waivers, if any | .55% H | .55% | .55% | .57% | .56% | .55% | ||||||
| Expenses net of all reductions | .55% H | .55% | .55% | .57% | .56% | .55% | ||||||
| Net investment income (loss) | 2.98% H | 1.87% | 1.24% | 1.59% | 2.24% | 1.78% | ||||||
| Supplemental Data | ||||||||||||
| Net assets, end of period (000 omitted) | $ | 29,118 | $ | 28,182 | $ | 31,374 | $ | 32,445 | $ | 25,577 | $ | 48,713 |
Portfolio turnover rate I | 36% H | 22% | 25% | 25% | 41% | 24% |
| Fidelity Advisor Asset Manager® 20% Class Z |
Six months ended (Unaudited) March 31, 2023 | Years ended September 30, 2022 | 2021 | 2020 | 2019 A | ||||||
Selected Per-Share Data | ||||||||||
| Net asset value, beginning of period | $ | 12.82 | $ | 14.76 | $ | 14.02 | $ | 13.53 | $ | 13.41 |
| Income from Investment Operations | ||||||||||
Net investment income (loss) B,C | .20 | .27 | .19 | .23 | .30 | |||||
| Net realized and unrealized gain (loss) | .55 | (1.93) | .82 | .62 | .37 | |||||
| Total from investment operations | .75 | (1.66) | 1.01 | .85 | .67 | |||||
| Distributions from net investment income | (.24) | (.24) | (.16) | (.24) | (.31) | |||||
| Distributions from net realized gain | (.26) | (.03) | (.12) | (.13) | (.24) | |||||
| Total distributions | (.50) | (.28) D | (.27) D | (.36) D | (.55) | |||||
| Net asset value, end of period | $ | 13.07 | $ | 12.82 | $ | 14.76 | $ | 14.02 | $ | 13.53 |
Total Return E,F | 6.00% | (11.45)% | 7.27% | 6.41% | 5.27% | |||||
Ratios to Average Net Assets C,G,H | ||||||||||
| Expenses before reductions | .47% I | .47% | .47% | .48% | .48% I | |||||
| Expenses net of fee waivers, if any | .47% I | .47% | .47% | .48% | .48% I | |||||
| Expenses net of all reductions | .47% I | .47% | .47% | .48% | .48% I | |||||
| Net investment income (loss) | 3.06% I | 1.95% | 1.31% | 1.69% | 2.32% I | |||||
| Supplemental Data | ||||||||||
| Net assets, end of period (000 omitted) | $ | 1,860,462 | $ | 1,566,447 | $ | 1,485,829 | $ | 18,177 | $ | 14,613 |
Portfolio turnover rate J | 36% I | 22% | 25% | 25% | 41% |
Top Holdings (% of Fund's net assets) | ||
| Apple, Inc. | 1.6 | |
| Microsoft Corp. | 1.5 | |
| iShares MSCI USA Minimum Volatility ETF | 0.8 | |
| Alphabet, Inc. Class A | 0.8 | |
| Amazon.com, Inc. | 0.6 | |
| VanEck Vectors Gold Miners ETF | 0.5 | |
| iShares 20+ Year Treasury Bond ETF | 0.5 | |
| Exxon Mobil Corp. | 0.4 | |
| Taiwan Semiconductor Manufacturing Co. Ltd. | 0.4 | |
| Meta Platforms, Inc. Class A | 0.3 | |
| 7.4 | ||
| Top Bond Issuers (% of Fund's net assets) | ||
(with maturities greater than one year) | ||
| U.S. Treasury Obligations | 21.4 | |
| Fannie Mae | 2.9 | |
| Freddie Mac | 2.9 | |
| Ginnie Mae | 1.6 | |
| Uniform Mortgage Backed Securities | 1.0 | |
| JPMorgan Chase & Co. | 0.7 | |
| Morgan Stanley | 0.6 | |
| Bank of America Corp. | 0.5 | |
| Citigroup, Inc. | 0.5 | |
| Petroleos Mexicanos | 0.5 | |
| 32.6 | ||
| Market Sectors (% of Fund's net assets) | ||
| Financials | 21.8 | |
| Information Technology | 8.2 | |
| Health Care | 5.4 | |
| Consumer Discretionary | 4.9 | |
| Industrials | 4.7 | |
| Communication Services | 3.8 | |
| Consumer Staples | 3.3 | |
| Energy | 3.1 | |
| Real Estate | 2.3 | |
| Materials | 1.4 | |
| Utilities | 1.2 | |
| Financial Services | 0.1 | |
Quality Diversification (% of Fund's net assets) |
 |
Percentages shown as 0.0% may reflect amounts less than 0.05%. |
| We have used ratings from Moody's Investors Service, Inc. Where Moody's® ratings are not available, we have used S&P® ratings. All ratings are as of the date indicated and do not reflect subsequent changes. |
Asset Allocation (% of Fund's net assets) |
 |
Geographic Diversification (% of Fund's net assets) |
 |
* Includes Short-Term investments and Net Other Assets (Liabilities). Percentages are based on country or territory of incorporation and are adjusted for the effect of derivatives, if applicable. |
| Equity Central Funds - 35.4% | |||
| Shares | Value ($) | ||
| Fidelity Commodity Strategy Central Fund (a) | 175,708 | 16,994,473 | |
| Fidelity Emerging Markets Equity Central Fund (a) | 460,835 | 88,765,960 | |
| Fidelity Hedged Equity Central Fund (a) | 64,451 | 6,517,311 | |
| Fidelity International Equity Central Fund (a) | 2,178,083 | 199,381,685 | |
| Fidelity Real Estate Equity Central Fund (a) | 77,211 | 9,304,731 | |
| Fidelity U.S. Equity Central Fund (a) | 4,034,928 | 451,548,739 | |
| TOTAL EQUITY CENTRAL FUNDS (Cost $562,501,236) | 772,512,899 | ||
| Fixed-Income Central Funds - 53.3% | |||
| Shares | Value ($) | ||
| High Yield Fixed-Income Funds - 4.1% | |||
| Fidelity Emerging Markets Debt Central Fund (a) | 454,752 | 3,442,474 | |
| Fidelity Emerging Markets Debt Local Currency Central Fund (a) | 191,317 | 17,044,412 | |
| Fidelity Floating Rate Central Fund (a) | 536,721 | 51,675,499 | |
| Fidelity High Income Central Fund (a) | 173,733 | 17,783,262 | |
TOTAL HIGH YIELD FIXED-INCOME FUNDS | 89,945,647 | ||
| Investment Grade Fixed-Income Funds - 49.2% | |||
| Fidelity Inflation-Protected Bond Index Central Fund (a) | 363,397 | 32,858,361 | |
| Fidelity International Credit Central Fund (a) | 201,897 | 15,697,470 | |
| Fidelity Investment Grade Bond Central Fund (a) | 10,350,176 | 1,024,667,403 | |
TOTAL INVESTMENT GRADE FIXED-INCOME FUNDS | 1,073,223,234 | ||
| TOTAL FIXED-INCOME CENTRAL FUNDS (Cost $1,265,175,329) | 1,163,168,881 | ||
| Money Market Central Funds - 9.1% | |||
| Shares | Value ($) | ||
| Fidelity Cash Central Fund 4.86% (b) | 25,317,995 | 25,323,058 | |
| Fidelity Money Market Central Fund 4.99% (b) | 172,928,911 | 172,911,618 | |
| TOTAL MONEY MARKET CENTRAL FUNDS (Cost $198,247,337) | 198,234,676 | ||
| U.S. Treasury Obligations - 0.5% | |||
Principal Amount (c) | Value ($) | ||
U.S. Treasury Bills, yield at date of purchase 4.41% to 4.93% 4/6/23 to 6/8/23 (d) (Cost $10,606,611) | 10,690,000 | 10,613,609 | |
| Investment Companies - 1.8% | |||
| Shares | Value ($) | ||
| iShares 20+ Year Treasury Bond ETF | 105,633 | 11,236,182 | |
| iShares MSCI USA Minimum Volatility ETF | 225,830 | 16,426,874 | |
| VanEck Vectors Gold Miners ETF | 352,227 | 11,394,543 | |
| TOTAL INVESTMENT COMPANIES (Cost $39,611,831) | 39,057,599 | ||
| TOTAL INVESTMENT IN SECURITIES - 100.1% (Cost $2,076,142,344) | 2,183,587,664 |
NET OTHER ASSETS (LIABILITIES) - (0.1)% | (1,918,310) |
| NET ASSETS - 100.0% | 2,181,669,354 |
| Futures Contracts | |||||
Number of contracts | Expiration Date | Notional Amount ($) | Value ($) | Unrealized Appreciation/ (Depreciation) ($) | |
| Purchased | |||||
| Equity Index Contracts | |||||
| ICE E-mini MSCI EAFE Index Contracts (United States) | 75 | Jun 2023 | 7,861,875 | 330,743 | 330,743 |
| ICE E-mini MSCI Emerging Markets Index Contracts (United States) | 113 | Jun 2023 | 5,624,575 | 201,762 | 201,762 |
| TOTAL EQUITY INDEX CONTRACTS | 532,505 | ||||
| Treasury Contracts | |||||
| CBOT 5-Year U.S. Treasury Note Contracts (United States) | 152 | Jun 2023 | 16,645,188 | 352,382 | 352,382 |
| TOTAL PURCHASED | 884,887 | ||||
| Sold | |||||
| Equity Index Contracts | |||||
| CME E-mini S&P 500 Index Contracts (United States) | 757 | Jun 2023 | 156,613,838 | (9,185,423) | (9,185,423) |
| TOTAL FUTURES CONTRACTS | (8,300,536) | ||||
| The notional amount of futures purchased as a percentage of Net Assets is 1.5% | |||||
| The notional amount of futures sold as a percentage of Net Assets is 7.2% | |||||
| ETF | - | EXCHANGE-TRADED FUND |
| (a) | Affiliated fund that is generally available only to investment companies and other accounts managed by Fidelity Investments. A complete unaudited schedule of portfolio holdings for each Fidelity Central Fund is filed with the SEC for the first and third quarters of each fiscal year on Form N-PORT and is available upon request or at the SEC's website at www.sec.gov. An unaudited holdings listing for the Fund, which presents direct holdings as well as the pro-rata share of securities and other investments held indirectly through its investment in underlying non-money market Fidelity Central Funds, other than the Commodity Strategy Central Fund, is available at fidelity.com and/or institutional.fidelity.com, as applicable. In addition, each Fidelity Central Fund's financial statements are available on the SEC's website or upon request. |
| (b) | Affiliated fund that is generally available only to investment companies and other accounts managed by Fidelity Investments. The rate quoted is the annualized seven-day yield of the fund at period end. A complete unaudited listing of the fund's holdings as of its most recent quarter end is available upon request. In addition, each Fidelity Central Fund's financial statements are available on the SEC's website or upon request. |
| (c) | Amount is stated in United States dollars unless otherwise noted. |
| (d) | Security or a portion of the security was pledged to cover margin requirements for futures contracts. At period end, the value of securities pledged amounted to $10,613,609. |
| Affiliate | Value, beginning of period ($) | Purchases ($) | Sales Proceeds ($) | Dividend Income ($) | Realized Gain (loss) ($) | Change in Unrealized appreciation (depreciation) ($) | Value, end of period ($) | % ownership, end of period |
| Fidelity Cash Central Fund 4.86% | 26,304,484 | 176,168,884 | 177,150,310 | 473,926 | - | - | 25,323,058 | 0.1% |
| Fidelity Commodity Strategy Central Fund | 43,032,802 | 926,633 | 25,921,980 | 454,748 | (7,064,065) | 6,021,083 | 16,994,473 | 3.7% |
| Fidelity Emerging Markets Debt Central Fund | 4,177,203 | 256,655 | 1,233,982 | 123,796 | (231,220) | 473,818 | 3,442,474 | 0.2% |
| Fidelity Emerging Markets Debt Local Currency Central Fund | 5,164,720 | 10,949,900 | - | 14,535 | - | 929,792 | 17,044,412 | 6.2% |
| Fidelity Emerging Markets Equity Central Fund | 71,327,680 | 27,554,359 | 18,695,503 | 973,284 | (7,030,128) | 15,609,552 | 88,765,960 | 3.9% |
| Fidelity Floating Rate Central Fund | 64,573,399 | 3,337,308 | 17,694,512 | 2,603,607 | (598,504) | 2,057,808 | 51,675,499 | 2.8% |
| Fidelity Hedged Equity Central Fund | - | 6,445,039 | - | 3,543 | - | 72,272 | 6,517,311 | 6.1% |
| Fidelity High Income Central Fund | 17,488,385 | 1,011,544 | 1,507,241 | 706,984 | 138,641 | 651,933 | 17,783,262 | 1.1% |
| Fidelity Inflation-Protected Bond Index Central Fund | 33,761,713 | 4,019,005 | 2,786,326 | 3,638,062 | (131,366) | (2,004,665) | 32,858,361 | 5.2% |
| Fidelity International Credit Central Fund | 20,783,361 | 1,024,460 | 5,522,054 | 827,393 | (1,552,998) | 964,701 | 15,697,470 | 4.4% |
| Fidelity International Equity Central Fund | 121,113,145 | 66,952,631 | 23,366,445 | 924,935 | (4,074,326) | 38,756,680 | 199,381,685 | 4.1% |
| Fidelity Investment Grade Bond Central Fund | 958,225,809 | 118,430,583 | 84,549,533 | 18,086,705 | (5,610,649) | 38,171,193 | 1,024,667,403 | 2.8% |
| Fidelity Money Market Central Fund 0.45% | 198,931,024 | 6,240,238 | 32,260,994 | 4,037,534 | (1,652) | 3,002 | 172,911,618 | 13.5% |
| Fidelity Real Estate Equity Central Fund | 14,434,007 | 382,569 | 6,746,905 | 195,466 | 33,025 | 1,202,035 | 9,304,731 | 1.0% |
| Fidelity Securities Lending Cash Central Fund 4.87% | - | 103,743,603 | 103,743,603 | 1,679 | - | - | - | 0.0% |
| Fidelity U.S. Equity Central Fund | 493,161,621 | 14,657,742 | 118,620,513 | 9,948,796 | (4,197,703) | 66,547,592 | 451,548,739 | 2.9% |
| Total | 2,072,479,353 | 542,101,153 | 619,799,901 | 43,014,993 | (30,320,945) | 169,456,796 | 2,133,916,456 | |
| Valuation Inputs at Reporting Date: | ||||
| Description | Total ($) | Level 1 ($) | Level 2 ($) | Level 3 ($) |
Investments in Securities: | ||||
| Equity Central Funds | 772,512,899 | 772,512,899 | - | - |
| Fixed-Income Central Funds | 1,163,168,881 | 1,163,168,881 | - | - |
| Money Market Central Funds | 198,234,676 | 198,234,676 | - | - |
| Other Short-Term Investments and Net Other Assets | 10,613,609 | - | 10,613,609 | - |
| Investment Companies | 39,057,599 | 39,057,599 | - | - |
| Total Investments in Securities: | 2,183,587,664 | 2,172,974,055 | 10,613,609 | - |
Derivative Instruments: | ||||
| Assets | ||||
Futures Contracts | 884,887 | 884,887 | - | - |
| Total Assets | 884,887 | 884,887 | - | - |
| Liabilities | ||||
Futures Contracts | (9,185,423) | (9,185,423) | - | - |
| Total Liabilities | (9,185,423) | (9,185,423) | - | - |
| Total Derivative Instruments: | (8,300,536) | (8,300,536) | - | - |
Primary Risk Exposure / Derivative Type | Value | |
| Asset ($) | Liability ($) | |
| Equity Risk | ||
Futures Contracts (a) | 532,505 | (9,185,423) |
| Total Equity Risk | 532,505 | (9,185,423) |
| Interest Rate Risk | ||
Futures Contracts (a) | 352,382 | 0 |
| Total Interest Rate Risk | 352,382 | 0 |
| Total Value of Derivatives | 884,887 | (9,185,423) |
| Statement of Assets and Liabilities | ||||
March 31, 2023 (Unaudited) | ||||
| Assets | ||||
| Investment in securities, at value - See accompanying schedule: | ||||
Unaffiliated issuers (cost $50,218,442) | $ | 49,671,208 | ||
Fidelity Central Funds (cost $2,025,923,902) | 2,133,916,456 | |||
| Total Investment in Securities (cost $2,076,142,344) | $ | 2,183,587,664 | ||
| Receivable for investments sold | 2,456,266 | |||
| Receivable for fund shares sold | 301,804 | |||
| Distributions receivable from Fidelity Central Funds | 89,302 | |||
| Prepaid expenses | 1,203 | |||
Total assets | 2,186,436,239 | |||
| Liabilities | ||||
| Payable for investments purchased | $ | 10,340 | ||
| Payable for fund shares redeemed | 1,621,740 | |||
| Accrued management fee | 715,760 | |||
| Distribution and service plan fees payable | 43,914 | |||
| Payable for daily variation margin on futures contracts | 2,131,960 | |||
| Other affiliated payables | 204,382 | |||
| Other payables and accrued expenses | 38,789 | |||
| Total Liabilities | 4,766,885 | |||
| Net Assets | $ | 2,181,669,354 | ||
| Net Assets consist of: | ||||
| Paid in capital | $ | 2,178,807,282 | ||
| Total accumulated earnings (loss) | 2,862,072 | |||
| Net Assets | $ | 2,181,669,354 | ||
| Net Asset Value and Maximum Offering Price | ||||
| Class A : | ||||
Net Asset Value and redemption price per share ($72,725,963 ÷ 6,522,824 shares) (a) | $ | 11.15 | ||
| Maximum offering price per share (100/94.25 of $11.15) | $ | 11.83 | ||
| Class M : | ||||
Net Asset Value and redemption price per share ($22,743,003 ÷ 2,044,762 shares) (a) | $ | 11.12 | ||
| Maximum offering price per share (100/96.50 of $11.12) | $ | 11.52 | ||
| Class C : | ||||
Net Asset Value and offering price per share ($23,611,246 ÷ 2,144,651 shares) (a) | $ | 11.01 | ||
| Asset Manager 30% : | ||||
Net Asset Value , offering price and redemption price per share ($1,586,546,852 ÷ 142,375,428 shares) | $ | 11.14 | ||
| Class I : | ||||
Net Asset Value , offering price and redemption price per share ($27,024,753 ÷ 2,424,609 shares) | $ | 11.15 | ||
| Class Z : | ||||
Net Asset Value , offering price and redemption price per share ($449,017,537 ÷ 40,300,467 shares) | $ | 11.14 | ||
(a)Redemption price per share is equal to net asset value less any applicable contingent deferred sales charge. | ||||
| Statement of Operations | ||||
Six months ended March 31, 2023 (Unaudited) | ||||
| Investment Income | ||||
| Dividends | $ | 570,866 | ||
| Interest | 186,727 | |||
| Income from Fidelity Central Funds (including $1,679 from security lending) | 35,188,624 | |||
| Total Income | 35,946,217 | |||
| Expenses | ||||
| Management fee | $ | 4,373,906 | ||
| Transfer agent fees | 873,221 | |||
| Distribution and service plan fees | 267,870 | |||
| Accounting fees | 359,162 | |||
| Custodian fees and expenses | 17,608 | |||
| Independent trustees' fees and expenses | 4,515 | |||
| Registration fees | 46,013 | |||
| Audit | 20,336 | |||
| Legal | 4,098 | |||
| Miscellaneous | 5,594 | |||
| Total expenses before reductions | 5,972,323 | |||
| Expense reductions | (23,268) | |||
| Total expenses after reductions | 5,949,055 | |||
| Net Investment income (loss) | 29,997,162 | |||
| Realized and Unrealized Gain (Loss) | ||||
| Net realized gain (loss) on: | ||||
| Investment Securities: | ||||
| Unaffiliated issuers | (12,712,234) | |||
| Fidelity Central Funds | (30,320,945) | |||
| Futures contracts | 8,774,780 | |||
| Capital gain distributions from Fidelity Central Funds | 7,826,369 | |||
| Total net realized gain (loss) | (26,432,030) | |||
| Change in net unrealized appreciation (depreciation) on: | ||||
| Investment Securities: | ||||
| Unaffiliated issuers | 15,034,633 | |||
| Fidelity Central Funds | 169,456,796 | |||
| Futures contracts | (25,416,874) | |||
| Total change in net unrealized appreciation (depreciation) | 159,074,555 | |||
| Net gain (loss) | 132,642,525 | |||
| Net increase (decrease) in net assets resulting from operations | $ | 162,639,687 | ||
| Statement of Changes in Net Assets | ||||
Six months ended March 31, 2023 (Unaudited) | Year ended September 30, 2022 | |||
| Increase (Decrease) in Net Assets | ||||
| Operations | ||||
| Net investment income (loss) | $ | 29,997,162 | $ | 52,128,543 |
| Net realized gain (loss) | (26,432,030) | 71,770,963 | ||
| Change in net unrealized appreciation (depreciation) | 159,074,555 | (500,477,751) | ||
| Net increase (decrease) in net assets resulting from operations | 162,639,687 | (376,578,245) | ||
| Distributions to shareholders | (90,968,670) | (58,123,685) | ||
| Share transactions - net increase (decrease) | (63,356,663) | (274,428,795) | ||
| Total increase (decrease) in net assets | 8,314,354 | (709,130,725) | ||
| Net Assets | ||||
| Beginning of period | 2,173,355,000 | 2,882,485,725 | ||
| End of period | $ | 2,181,669,354 | $ | 2,173,355,000 |
| Fidelity Advisor Asset Manager® 30% Class A |
Six months ended (Unaudited) March 31, 2023 | Years ended September 30, 2022 | 2021 | 2020 | 2019 | 2018 | |||||||
Selected Per-Share Data | ||||||||||||
| Net asset value, beginning of period | $ | 10.80 | $ | 12.77 | $ | 11.80 | $ | 11.24 | $ | 11.15 | $ | 11.11 |
| Income from Investment Operations | ||||||||||||
Net investment income (loss) A,B | .14 | .20 | .14 | .16 | .21 | .16 | ||||||
| Net realized and unrealized gain (loss) | .65 | (1.95) | 1.03 | .71 | .27 | .21 | ||||||
| Total from investment operations | .79 | (1.75) | 1.17 | .87 | .48 | .37 | ||||||
| Distributions from net investment income | (.19) | (.18) | (.09) | (.17) | (.21) | (.15) | ||||||
| Distributions from net realized gain | (.26) | (.04) | (.11) | (.14) | (.18) | (.18) | ||||||
| Total distributions | (.44) C | (.22) | (.20) | (.31) | (.39) | (.33) | ||||||
| Net asset value, end of period | $ | 11.15 | $ | 10.80 | $ | 12.77 | $ | 11.80 | $ | 11.24 | $ | 11.15 |
Total Return D,E,F | 7.52% | (13.89)% | 9.98% | 7.83% | 4.54% | 3.40% | ||||||
Ratios to Average Net Assets B,G,H | ||||||||||||
| Expenses before reductions | .82% I | .82% | .82% | .82% | .82% | .84% | ||||||
| Expenses net of fee waivers, if any | .82% I | .82% | .82% | .82% | .82% | .84% | ||||||
| Expenses net of all reductions | .82% I | .82% | .82% | .82% | .82% | .84% | ||||||
| Net investment income (loss) | 2.46% I | 1.66% | 1.10% | 1.43% | 1.91% | 1.47% | ||||||
| Supplemental Data | ||||||||||||
| Net assets, end of period (000 omitted) | $ | 72,726 | $ | 71,633 | $ | 77,502 | $ | 50,625 | $ | 36,978 | $ | 28,713 |
Portfolio turnover rate J | 29% I | 23% | 18% | 23% | 34% | 18% |
| Fidelity Advisor Asset Manager® 30% Class M |
Six months ended (Unaudited) March 31, 2023 | Years ended September 30, 2022 | 2021 | 2020 | 2019 | 2018 | |||||||
Selected Per-Share Data | ||||||||||||
| Net asset value, beginning of period | $ | 10.77 | $ | 12.75 | $ | 11.77 | $ | 11.22 | $ | 11.13 | $ | 11.10 |
| Income from Investment Operations | ||||||||||||
Net investment income (loss) A,B | .12 | .17 | .11 | .13 | .18 | .13 | ||||||
| Net realized and unrealized gain (loss) | .66 | (1.95) | 1.04 | .70 | .27 | .21 | ||||||
| Total from investment operations | .78 | (1.78) | 1.15 | .83 | .45 | .34 | ||||||
| Distributions from net investment income | (.17) | (.15) | (.07) | (.14) | (.18) | (.13) | ||||||
| Distributions from net realized gain | (.26) | (.04) | (.11) | (.14) | (.18) | (.18) | ||||||
| Total distributions | (.43) | (.20) C | (.17) C | (.28) | (.36) | (.31) | ||||||
| Net asset value, end of period | $ | 11.12 | $ | 10.77 | $ | 12.75 | $ | 11.77 | $ | 11.22 | $ | 11.13 |
Total Return D,E,F | 7.40% | (14.20)% | 9.84% | 7.49% | 4.28% | 3.08% | ||||||
Ratios to Average Net Assets B,G,H | ||||||||||||
| Expenses before reductions | 1.07% I | 1.08% | 1.08% | 1.08% | 1.09% | 1.10% | ||||||
| Expenses net of fee waivers, if any | 1.07% I | 1.08% | 1.08% | 1.08% | 1.09% | 1.09% | ||||||
| Expenses net of all reductions | 1.07% I | 1.08% | 1.08% | 1.08% | 1.09% | 1.09% | ||||||
| Net investment income (loss) | 2.20% I | 1.41% | .84% | 1.17% | 1.64% | 1.21% | ||||||
| Supplemental Data | ||||||||||||
| Net assets, end of period (000 omitted) | $ | 22,743 | $ | 22,364 | $ | 26,218 | $ | 20,329 | $ | 16,252 | $ | 14,473 |
Portfolio turnover rate J | 29% I | 23% | 18% | 23% | 34% | 18% |
| Fidelity Advisor Asset Manager® 30% Class C |
Six months ended (Unaudited) March 31, 2023 | Years ended September 30, 2022 | 2021 | 2020 | 2019 | 2018 | |||||||
Selected Per-Share Data | ||||||||||||
| Net asset value, beginning of period | $ | 10.66 | $ | 12.64 | $ | 11.71 | $ | 11.16 | $ | 11.07 | $ | 11.04 |
| Income from Investment Operations | ||||||||||||
Net investment income (loss) A,B | .09 | .11 | .04 | .07 | .12 | .08 | ||||||
| Net realized and unrealized gain (loss) | .66 | (1.94) | 1.03 | .70 | .28 | .20 | ||||||
| Total from investment operations | .75 | (1.83) | 1.07 | .77 | .40 | .28 | ||||||
| Distributions from net investment income | (.14) | (.11) | (.03) | (.08) | (.12) | (.07) | ||||||
| Distributions from net realized gain | (.26) | (.04) | (.11) | (.14) | (.18) | (.18) | ||||||
| Total distributions | (.40) | (.15) | (.14) | (.22) | (.31) C | (.25) | ||||||
| Net asset value, end of period | $ | 11.01 | $ | 10.66 | $ | 12.64 | $ | 11.71 | $ | 11.16 | $ | 11.07 |
Total Return D,E,F | 7.20% | (14.62)% | 9.17% | 7.00% | 3.77% | 2.59% | ||||||
Ratios to Average Net Assets B,G,H | ||||||||||||
| Expenses before reductions | 1.58% I | 1.58% | 1.59% | 1.59% | 1.60% | 1.61% | ||||||
| Expenses net of fee waivers, if any | 1.58% I | 1.58% | 1.59% | 1.59% | 1.60% | 1.61% | ||||||
| Expenses net of all reductions | 1.58% I | 1.58% | 1.59% | 1.59% | 1.60% | 1.61% | ||||||
| Net investment income (loss) | 1.69% I | .90% | .33% | .66% | 1.13% | .70% | ||||||
| Supplemental Data | ||||||||||||
| Net assets, end of period (000 omitted) | $ | 23,611 | $ | 24,169 | $ | 31,949 | $ | 27,496 | $ | 24,224 | $ | 24,911 |
Portfolio turnover rate J | 29% I | 23% | 18% | 23% | 34% | 18% |
| Fidelity Asset Manager® 30% |
Six months ended (Unaudited) March 31, 2023 | Years ended September 30, 2022 | 2021 | 2020 | 2019 | 2018 | |||||||
Selected Per-Share Data | ||||||||||||
| Net asset value, beginning of period | $ | 10.79 | $ | 12.77 | $ | 11.79 | $ | 11.24 | $ | 11.15 | $ | 11.11 |
| Income from Investment Operations | ||||||||||||
Net investment income (loss) A,B | .15 | .24 | .18 | .20 | .24 | .20 | ||||||
| Net realized and unrealized gain (loss) | .66 | (1.96) | 1.04 | .69 | .27 | .21 | ||||||
| Total from investment operations | .81 | (1.72) | 1.22 | .89 | .51 | .41 | ||||||
| Distributions from net investment income | (.20) | (.22) | (.14) | (.20) | (.24) | (.19) | ||||||
| Distributions from net realized gain | (.26) | (.04) | (.11) | (.14) | (.18) | (.18) | ||||||
| Total distributions | (.46) | (.26) | (.24) C | (.34) | (.42) | (.37) | ||||||
| Net asset value, end of period | $ | 11.14 | $ | 10.79 | $ | 12.77 | $ | 11.79 | $ | 11.24 | $ | 11.15 |
Total Return D,E | 7.69% | (13.71)% | 10.43% | 8.05% | 4.87% | 3.75% | ||||||
Ratios to Average Net Assets B,F,G | ||||||||||||
| Expenses before reductions | .52% H | .52% | .52% | .52% | .53% | .53% | ||||||
| Expenses net of fee waivers, if any | .52% H | .51% | .52% | .52% | .52% | .53% | ||||||
| Expenses net of all reductions | .52% H | .51% | .52% | .52% | .52% | .53% | ||||||
| Net investment income (loss) | 2.75% H | 1.97% | 1.40% | 1.74% | 2.21% | 1.78% | ||||||
| Supplemental Data | ||||||||||||
| Net assets, end of period (000 omitted) | $ | 1,586,547 | $ | 1,625,346 | $ | 2,196,582 | $ | 1,935,863 | $ | 1,661,192 | $ | 1,480,983 |
Portfolio turnover rate I | 29% H | 23% | 18% | 23% | 34% | 18% |
| Fidelity Advisor Asset Manager® 30% Class I |
Six months ended (Unaudited) March 31, 2023 | Years ended September 30, 2022 | 2021 | 2020 | 2019 | 2018 | |||||||
Selected Per-Share Data | ||||||||||||
| Net asset value, beginning of period | $ | 10.79 | $ | 12.77 | $ | 11.79 | $ | 11.24 | $ | 11.15 | $ | 11.11 |
| Income from Investment Operations | ||||||||||||
Net investment income (loss) A,B | .15 | .24 | .17 | .19 | .23 | .19 | ||||||
| Net realized and unrealized gain (loss) | .67 | (1.96) | 1.05 | .69 | .28 | .21 | ||||||
| Total from investment operations | .82 | (1.72) | 1.22 | .88 | .51 | .40 | ||||||
| Distributions from net investment income | (.20) | (.21) | (.13) | (.19) | (.23) | (.18) | ||||||
| Distributions from net realized gain | (.26) | (.04) | (.11) | (.14) | (.18) | (.18) | ||||||
| Total distributions | (.46) | (.26) C | (.24) | (.33) | (.42) C | (.36) | ||||||
| Net asset value, end of period | $ | 11.15 | $ | 10.79 | $ | 12.77 | $ | 11.79 | $ | 11.24 | $ | 11.15 |
Total Return D,E | 7.74% | (13.75)% | 10.41% | 8.00% | 4.80% | 3.66% | ||||||
Ratios to Average Net Assets B,F,G | ||||||||||||
| Expenses before reductions | .58% H | .54% | .55% | .59% | .59% | .61% | ||||||
| Expenses net of fee waivers, if any | .58% H | .54% | .54% | .59% | .59% | .61% | ||||||
| Expenses net of all reductions | .58% H | .54% | .54% | .59% | .59% | .61% | ||||||
| Net investment income (loss) | 2.69% H | 1.94% | 1.37% | 1.67% | 2.14% | 1.70% | ||||||
| Supplemental Data | ||||||||||||
| Net assets, end of period (000 omitted) | $ | 27,025 | $ | 30,027 | $ | 76,079 | $ | 19,225 | $ | 19,014 | $ | 23,818 |
Portfolio turnover rate I | 29% H | 23% | 18% | 23% | 34% | 18% |
| Fidelity Advisor Asset Manager® 30% Class Z |
Six months ended (Unaudited) March 31, 2023 | Years ended September 30, 2022 | 2021 | 2020 | 2019 A | ||||||
Selected Per-Share Data | ||||||||||
| Net asset value, beginning of period | $ | 10.79 | $ | 12.77 | $ | 11.79 | $ | 11.24 | $ | 11.14 |
| Income from Investment Operations | ||||||||||
Net investment income (loss) B,C | .15 | .24 | .18 | .20 | .24 | |||||
| Net realized and unrealized gain (loss) | .66 | (1.96) | 1.04 | .69 | .29 | |||||
| Total from investment operations | .81 | (1.72) | 1.22 | .89 | .53 | |||||
| Distributions from net investment income | (.21) | (.22) | (.14) | (.20) | (.25) | |||||
| Distributions from net realized gain | (.26) | (.04) | (.11) | (.14) | (.18) | |||||
| Total distributions | (.46) D | (.26) | (.24) D | (.34) | (.43) | |||||
| Net asset value, end of period | $ | 11.14 | $ | 10.79 | $ | 12.77 | $ | 11.79 | $ | 11.24 |
Total Return E,F | 7.71% | (13.69)% | 10.44% | 8.10% | 5.01% | |||||
Ratios to Average Net Assets C,G,H | ||||||||||
| Expenses before reductions | .49% I | .49% | .49% | .50% | .50% I | |||||
| Expenses net of fee waivers, if any | .49% I | .49% | .49% | .49% | .50% I | |||||
| Expenses net of all reductions | .49% I | .49% | .49% | .49% | .50% I | |||||
| Net investment income (loss) | 2.78% I | 2.00% | 1.43% | 1.76% | 2.23% I | |||||
| Supplemental Data | ||||||||||
| Net assets, end of period (000 omitted) | $ | 449,018 | $ | 399,817 | $ | 474,155 | $ | 9,698 | $ | 7,353 |
Portfolio turnover rate J | 29% I | 23% | 18% | 23% | 34% |
Top Holdings (% of Fund's net assets) | ||
| Apple, Inc. | 2.0 | |
| Microsoft Corp. | 1.9 | |
| Alphabet, Inc. Class A | 1.0 | |
| iShares MSCI USA Minimum Volatility ETF | 0.8 | |
| Amazon.com, Inc. | 0.7 | |
| VanEck Vectors Gold Miners ETF | 0.5 | |
| Exxon Mobil Corp. | 0.5 | |
| iShares 20+ Year Treasury Bond ETF | 0.5 | |
| Taiwan Semiconductor Manufacturing Co. Ltd. | 0.5 | |
| Meta Platforms, Inc. Class A | 0.4 | |
| 8.8 | ||
| Top Bond Issuers (% of Fund's net assets) | ||
(with maturities greater than one year) | ||
| U.S. Treasury Obligations | 19.2 | |
| Fannie Mae | 2.5 | |
| Freddie Mac | 2.5 | |
| Ginnie Mae | 1.6 | |
| Uniform Mortgage Backed Securities | 1.0 | |
| JPMorgan Chase & Co. | 0.7 | |
| Morgan Stanley | 0.6 | |
| Bank of America Corp. | 0.5 | |
| Citigroup, Inc. | 0.5 | |
| Petroleos Mexicanos | 0.5 | |
| 29.6 | ||
| Market Sectors (% of Fund's net assets) | ||
| Financials | 18.2 | |
| Information Technology | 10.1 | |
| Health Care | 6.1 | |
| Consumer Discretionary | 6.1 | |
| Industrials | 5.8 | |
| Communication Services | 4.2 | |
| Consumer Staples | 3.8 | |
| Energy | 3.6 | |
| Real Estate | 2.3 | |
| Materials | 2.1 | |
| Utilities | 1.4 | |
| Financial Services | 0.1 | |
Quality Diversification (% of Fund's net assets) |
 |
Percentages shown as 0.0% may reflect amounts less than 0.05%. |
| We have used ratings from Moody's Investors Service, Inc. Where Moody's® ratings are not available, we have used S&P® ratings. All ratings are as of the date indicated and do not reflect subsequent changes. |
Asset Allocation (% of Fund's net assets) |
 |
Geographic Diversification (% of Fund's net assets) |
 |
* Includes Short-Term investments and Net Other Assets (Liabilities). Percentages are based on country or territory of incorporation and are adjusted for the effect of derivatives, if applicable. |
| Equity Central Funds - 45.6% | |||
| Shares | Value ($) | ||
| Fidelity Commodity Strategy Central Fund (a) | 234,348 | 22,666,128 | |
| Fidelity Emerging Markets Equity Central Fund (a) | 610,050 | 117,507,841 | |
| Fidelity Hedged Equity Central Fund (a) | 65,493 | 6,622,628 | |
| Fidelity International Equity Central Fund (a) | 2,888,990 | 264,458,153 | |
| Fidelity Real Estate Equity Central Fund (a) | 78,939 | 9,512,909 | |
| Fidelity U.S. Equity Central Fund (a) | 5,303,000 | 593,458,685 | |
| TOTAL EQUITY CENTRAL FUNDS (Cost $715,812,609) | 1,014,226,344 | ||
| Fixed-Income Central Funds - 48.1% | |||
| Shares | Value ($) | ||
| High Yield Fixed-Income Funds - 4.2% | |||
| Fidelity Emerging Markets Debt Central Fund (a) | 615,850 | 4,661,983 | |
| Fidelity Emerging Markets Debt Local Currency Central Fund (a) | 195,103 | 17,381,688 | |
| Fidelity Floating Rate Central Fund (a) | 547,892 | 52,751,000 | |
| Fidelity High Income Central Fund (a) | 177,382 | 18,156,800 | |
TOTAL HIGH YIELD FIXED-INCOME FUNDS | 92,951,471 | ||
| Investment Grade Fixed-Income Funds - 43.9% | |||
| Fidelity Inflation-Protected Bond Index Central Fund (a) | 371,089 | 33,553,867 | |
| Fidelity International Credit Central Fund (a) | 204,374 | 15,890,044 | |
| Fidelity Investment Grade Bond Central Fund (a) | 9,379,619 | 928,582,318 | |
TOTAL INVESTMENT GRADE FIXED-INCOME FUNDS | 978,026,229 | ||
| TOTAL FIXED-INCOME CENTRAL FUNDS (Cost $1,156,763,534) | 1,070,977,700 | ||
| Money Market Central Funds - 4.1% | |||
| Shares | Value ($) | ||
| Fidelity Cash Central Fund 4.86% (b) | 24,435,303 | 24,440,190 | |
| Fidelity Money Market Central Fund 4.99% (b) | 67,193,174 | 67,186,454 | |
| TOTAL MONEY MARKET CENTRAL FUNDS (Cost $91,629,481) | 91,626,644 | ||
| U.S. Treasury Obligations - 0.5% | |||
Principal Amount (c) | Value ($) | ||
U.S. Treasury Bills, yield at date of purchase 4.41% to 4.93% 4/6/23 to 6/8/23 (d) (Cost $10,823,532) | 10,910,000 | 10,830,882 | |
| Investment Companies - 1.8% | |||
| Shares | Value ($) | ||
| iShares 20+ Year Treasury Bond ETF | 107,623 | 11,447,859 | |
| iShares MSCI USA Minimum Volatility ETF | 230,321 | 16,753,548 | |
| VanEck Vectors Gold Miners ETF | 359,874 | 11,641,924 | |
| TOTAL INVESTMENT COMPANIES (Cost $40,418,050) | 39,843,331 | ||
| TOTAL INVESTMENT IN SECURITIES - 100.1% (Cost $2,015,447,206) | 2,227,504,901 |
NET OTHER ASSETS (LIABILITIES) - (0.1)% | (1,883,169) |
| NET ASSETS - 100.0% | 2,225,621,732 |
| Futures Contracts | |||||
Number of contracts | Expiration Date | Notional Amount ($) | Value ($) | Unrealized Appreciation/ (Depreciation) ($) | |
| Purchased | |||||
| Equity Index Contracts | |||||
| ICE E-mini MSCI EAFE Index Contracts (United States) | 107 | Jun 2023 | 11,216,275 | 472,498 | 472,498 |
| ICE E-mini MSCI Emerging Markets Index Contracts (United States) | 76 | Jun 2023 | 3,782,900 | 135,698 | 135,698 |
| TOTAL EQUITY INDEX CONTRACTS | 608,196 | ||||
| Treasury Contracts | |||||
| CBOT 5-Year U.S. Treasury Note Contracts (United States) | 155 | Jun 2023 | 16,973,711 | 359,337 | 359,337 |
| TOTAL PURCHASED | 967,533 | ||||
| Sold | |||||
| Equity Index Contracts | |||||
| CME E-mini S&P 500 Index Contracts (United States) | 767 | Jun 2023 | 158,682,713 | (9,306,762) | (9,306,762) |
| TOTAL FUTURES CONTRACTS | (8,339,229) | ||||
| The notional amount of futures purchased as a percentage of Net Assets is 1.5% | |||||
| The notional amount of futures sold as a percentage of Net Assets is 7.1% | |||||
| ETF | - | EXCHANGE-TRADED FUND |
| (a) | Affiliated fund that is generally available only to investment companies and other accounts managed by Fidelity Investments. A complete unaudited schedule of portfolio holdings for each Fidelity Central Fund is filed with the SEC for the first and third quarters of each fiscal year on Form N-PORT and is available upon request or at the SEC's website at www.sec.gov. An unaudited holdings listing for the Fund, which presents direct holdings as well as the pro-rata share of securities and other investments held indirectly through its investment in underlying non-money market Fidelity Central Funds, other than the Commodity Strategy Central Fund, is available at fidelity.com and/or institutional.fidelity.com, as applicable. In addition, each Fidelity Central Fund's financial statements are available on the SEC's website or upon request. |
| (b) | Affiliated fund that is generally available only to investment companies and other accounts managed by Fidelity Investments. The rate quoted is the annualized seven-day yield of the fund at period end. A complete unaudited listing of the fund's holdings as of its most recent quarter end is available upon request. In addition, each Fidelity Central Fund's financial statements are available on the SEC's website or upon request. |
| (c) | Amount is stated in United States dollars unless otherwise noted. |
| (d) | Security or a portion of the security was pledged to cover margin requirements for futures contracts. At period end, the value of securities pledged amounted to $10,830,882. |
| Affiliate | Value, beginning of period ($) | Purchases ($) | Sales Proceeds ($) | Dividend Income ($) | Realized Gain (loss) ($) | Change in Unrealized appreciation (depreciation) ($) | Value, end of period ($) | % ownership, end of period |
| Fidelity Cash Central Fund 4.86% | 25,779,181 | 166,739,477 | 168,078,468 | 463,330 | - | - | 24,440,190 | 0.1% |
| Fidelity Commodity Strategy Central Fund | 48,250,509 | 906,270 | 25,205,485 | 508,000 | (7,413,615) | 6,128,449 | 22,666,128 | 4.9% |
| Fidelity Emerging Markets Debt Central Fund | 5,115,458 | 307,387 | 1,062,544 | 156,813 | (196,024) | 497,706 | 4,661,983 | 0.2% |
| Fidelity Emerging Markets Debt Local Currency Central Fund | 4,816,726 | 11,664,528 | - | 14,119 | - | 900,434 | 17,381,688 | 6.3% |
| Fidelity Emerging Markets Equity Central Fund | 95,037,432 | 28,894,874 | 18,600,338 | 1,367,406 | (6,019,276) | 18,195,149 | 117,507,841 | 5.2% |
| Fidelity Floating Rate Central Fund | 64,536,473 | 3,351,096 | 16,605,579 | 2,621,792 | (544,892) | 2,013,902 | 52,751,000 | 2.8% |
| Fidelity Hedged Equity Central Fund | - | 6,549,188 | - | 3,600 | - | 73,440 | 6,622,628 | 6.2% |
| Fidelity High Income Central Fund | 17,596,056 | 983,486 | 1,222,326 | 714,746 | 54,741 | 744,843 | 18,156,800 | 1.1% |
| Fidelity Inflation-Protected Bond Index Central Fund | 33,934,556 | 4,045,346 | 2,306,706 | 3,645,814 | (93,195) | (2,026,134) | 33,553,867 | 5.3% |
| Fidelity International Credit Central Fund | 20,394,314 | 1,031,287 | 4,954,974 | 824,103 | (1,434,925) | 854,342 | 15,890,044 | 4.5% |
| Fidelity International Equity Central Fund | 175,490,724 | 60,174,414 | 21,198,630 | 1,285,925 | (2,779,206) | 52,770,851 | 264,458,153 | 5.4% |
| Fidelity Investment Grade Bond Central Fund | 844,746,742 | 117,803,148 | 63,278,486 | 16,176,595 | (2,808,513) | 32,119,427 | 928,582,318 | 2.5% |
| Fidelity Money Market Central Fund 0.45% | 87,063,754 | 2,581,383 | 22,459,324 | 1,661,678 | (1,482) | 2,123 | 67,186,454 | 5.3% |
| Fidelity Real Estate Equity Central Fund | 14,451,672 | 384,049 | 6,577,038 | 194,365 | 45,196 | 1,209,030 | 9,512,909 | 1.0% |
| Fidelity Securities Lending Cash Central Fund 4.87% | - | 146,665,570 | 146,665,570 | 1,671 | - | - | - | 0.0% |
| Fidelity U.S. Equity Central Fund | 617,394,236 | 18,426,008 | 121,938,784 | 12,623,375 | (5,632,366) | 85,209,591 | 593,458,685 | 3.8% |
| Total | 2,054,607,833 | 570,507,511 | 620,154,252 | 42,263,332 | (26,823,557) | 198,693,153 | 2,176,830,688 | |
| Valuation Inputs at Reporting Date: | ||||
| Description | Total ($) | Level 1 ($) | Level 2 ($) | Level 3 ($) |
Investments in Securities: | ||||
| Equity Central Funds | 1,014,226,344 | 1,014,226,344 | - | - |
| Fixed-Income Central Funds | 1,070,977,700 | 1,070,977,700 | - | - |
| Money Market Central Funds | 91,626,644 | 91,626,644 | - | - |
| Other Short-Term Investments and Net Other Assets | 10,830,882 | - | 10,830,882 | - |
| Investment Companies | 39,843,331 | 39,843,331 | - | - |
| Total Investments in Securities: | 2,227,504,901 | 2,216,674,019 | 10,830,882 | - |
Derivative Instruments: | ||||
| Assets | ||||
Futures Contracts | 967,533 | 967,533 | - | - |
| Total Assets | 967,533 | 967,533 | - | - |
| Liabilities | ||||
Futures Contracts | (9,306,762) | (9,306,762) | - | - |
| Total Liabilities | (9,306,762) | (9,306,762) | - | - |
| Total Derivative Instruments: | (8,339,229) | (8,339,229) | - | - |
Primary Risk Exposure / Derivative Type | Value | |
| Asset ($) | Liability ($) | |
| Equity Risk | ||
Futures Contracts (a) | 608,196 | (9,306,762) |
| Total Equity Risk | 608,196 | (9,306,762) |
| Interest Rate Risk | ||
Futures Contracts (a) | 359,337 | 0 |
| Total Interest Rate Risk | 359,337 | 0 |
| Total Value of Derivatives | 967,533 | (9,306,762) |
| Statement of Assets and Liabilities | ||||
March 31, 2023 (Unaudited) | ||||
| Assets | ||||
| Investment in securities, at value - See accompanying schedule: | ||||
Unaffiliated issuers (cost $51,241,582) | $ | 50,674,213 | ||
Fidelity Central Funds (cost $1,964,205,624) | 2,176,830,688 | |||
| Total Investment in Securities (cost $2,015,447,206) | $ | 2,227,504,901 | ||
| Receivable for investments sold | 3,361,968 | |||
| Receivable for fund shares sold | 420,089 | |||
| Distributions receivable from Fidelity Central Funds | 85,593 | |||
| Prepaid expenses | 1,165 | |||
Total assets | 2,231,373,716 | |||
| Liabilities | ||||
| Payable for investments purchased | $ | 253 | ||
| Payable for fund shares redeemed | 2,590,559 | |||
| Accrued management fee | 728,581 | |||
| Distribution and service plan fees payable | 36,446 | |||
| Payable for daily variation margin on futures contracts | 2,141,635 | |||
| Other affiliated payables | 209,674 | |||
| Other payables and accrued expenses | 44,836 | |||
| Total Liabilities | 5,751,984 | |||
| Net Assets | $ | 2,225,621,732 | ||
| Net Assets consist of: | ||||
| Paid in capital | $ | 2,110,451,730 | ||
| Total accumulated earnings (loss) | 115,170,002 | |||
| Net Assets | $ | 2,225,621,732 | ||
| Net Asset Value and Maximum Offering Price | ||||
| Class A : | ||||
Net Asset Value and redemption price per share ($72,587,170 ÷ 6,092,469 shares) (a) | $ | 11.91 | ||
| Maximum offering price per share (100/94.25 of $11.91) | $ | 12.64 | ||
| Class M : | ||||
Net Asset Value and redemption price per share ($13,779,142 ÷ 1,158,497 shares) (a) | $ | 11.89 | ||
| Maximum offering price per share (100/96.50 of $11.89) | $ | 12.32 | ||
| Class C : | ||||
Net Asset Value and offering price per share ($18,979,416 ÷ 1,603,433 shares) (a) | $ | 11.84 | ||
| Asset Manager 40% : | ||||
Net Asset Value , offering price and redemption price per share ($1,518,300,506 ÷ 127,450,199 shares) | $ | 11.91 | ||
| Class I : | ||||
Net Asset Value , offering price and redemption price per share ($37,310,076 ÷ 3,130,709 shares) | $ | 11.92 | ||
| Class Z : | ||||
Net Asset Value , offering price and redemption price per share ($564,665,422 ÷ 47,399,424 shares) | $ | 11.91 | ||
(a)Redemption price per share is equal to net asset value less any applicable contingent deferred sales charge. | ||||
| Statement of Operations | ||||
Six months ended March 31, 2023 (Unaudited) | ||||
| Investment Income | ||||
| Dividends | $ | 555,169 | ||
| Interest | 186,374 | |||
| Income from Fidelity Central Funds (including $1,671 from security lending) | 32,591,988 | |||
| Total Income | 33,333,531 | |||
| Expenses | ||||
| Management fee | $ | 4,405,863 | ||
| Transfer agent fees | 889,663 | |||
| Distribution and service plan fees | 220,890 | |||
| Accounting fees | 361,585 | |||
| Custodian fees and expenses | 23,012 | |||
| Independent trustees' fees and expenses | 4,491 | |||
| Registration fees | 51,301 | |||
| Audit | 20,336 | |||
| Legal | 4,087 | |||
| Miscellaneous | 5,506 | |||
| Total expenses before reductions | 5,986,734 | |||
| Expense reductions | (22,928) | |||
| Total expenses after reductions | 5,963,806 | |||
| Net Investment income (loss) | 27,369,725 | |||
| Realized and Unrealized Gain (Loss) | ||||
| Net realized gain (loss) on: | ||||
| Investment Securities: | ||||
| Unaffiliated issuers | (11,325,018) | |||
| Fidelity Central Funds | (26,823,557) | |||
| Futures contracts | 8,788,037 | |||
| Capital gain distributions from Fidelity Central Funds | 9,671,344 | |||
| Total net realized gain (loss) | (19,689,194) | |||
| Change in net unrealized appreciation (depreciation) on: | ||||
| Investment Securities: | ||||
| Unaffiliated issuers | 13,548,201 | |||
| Fidelity Central Funds | 198,693,153 | |||
| Futures contracts | (24,814,861) | |||
| Total change in net unrealized appreciation (depreciation) | 187,426,493 | |||
| Net gain (loss) | 167,737,299 | |||
| Net increase (decrease) in net assets resulting from operations | $ | 195,107,024 | ||
| Statement of Changes in Net Assets | ||||
Six months ended March 31, 2023 (Unaudited) | Year ended September 30, 2022 | |||
| Increase (Decrease) in Net Assets | ||||
| Operations | ||||
| Net investment income (loss) | $ | 27,369,725 | $ | 50,128,286 |
| Net realized gain (loss) | (19,689,194) | 83,390,599 | ||
| Change in net unrealized appreciation (depreciation) | 187,426,493 | (535,548,491) | ||
| Net increase (decrease) in net assets resulting from operations | 195,107,024 | (402,029,606) | ||
| Distributions to shareholders | (108,059,955) | (63,105,930) | ||
| Share transactions - net increase (decrease) | (13,097,839) | 72,581,869 | ||
| Total increase (decrease) in net assets | 73,949,230 | (392,553,667) | ||
| Net Assets | ||||
| Beginning of period | 2,151,672,502 | 2,544,226,169 | ||
| End of period | $ | 2,225,621,732 | $ | 2,151,672,502 |
| Fidelity Advisor Asset Manager® 40% Class A |
Six months ended (Unaudited) March 31, 2023 | Years ended September 30, 2022 | 2021 | 2020 | 2019 | 2018 | |||||||
Selected Per-Share Data | ||||||||||||
| Net asset value, beginning of period | $ | 11.46 | $ | 13.85 | $ | 12.49 | $ | 11.82 | $ | 11.87 | $ | 11.67 |
| Income from Investment Operations | ||||||||||||
Net investment income (loss) A,B | .13 | .22 | .15 | .17 | .21 | .17 | ||||||
| Net realized and unrealized gain (loss) | .88 | (2.32) | 1.47 | .88 | .21 | .36 | ||||||
| Total from investment operations | 1.01 | (2.10) | 1.62 | 1.05 | .42 | .53 | ||||||
| Distributions from net investment income | (.19) | (.18) | (.12) | (.17) | (.21) | (.15) | ||||||
| Distributions from net realized gain | (.37) | (.11) | (.13) | (.21) | (.27) | (.18) | ||||||
| Total distributions | (.56) | (.29) | (.26) C | (.38) | (.47) C | (.33) | ||||||
| Net asset value, end of period | $ | 11.91 | $ | 11.46 | $ | 13.85 | $ | 12.49 | $ | 11.82 | $ | 11.87 |
Total Return D,E,F | 9.08% | (15.47)% | 13.06% | 9.06% | 3.90% | 4.62% | ||||||
Ratios to Average Net Assets B,G,H | ||||||||||||
| Expenses before reductions | .83% I | .82% | .82% | .83% | .83% | .84% | ||||||
| Expenses net of fee waivers, if any | .82% I | .82% | .82% | .83% | .83% | .84% | ||||||
| Expenses net of all reductions | .82% I | .82% | .82% | .83% | .83% | .84% | ||||||
| Net investment income (loss) | 2.19% I | 1.72% | 1.08% | 1.43% | 1.79% | 1.41% | ||||||
| Supplemental Data | ||||||||||||
| Net assets, end of period (000 omitted) | $ | 72,587 | $ | 69,848 | $ | 74,272 | $ | 48,985 | $ | 42,490 | $ | 38,073 |
Portfolio turnover rate J | 28% I | 16% | 22% | 24% | 36% | 17% |
| Fidelity Advisor Asset Manager® 40% Class M |
Six months ended (Unaudited) March 31, 2023 | Years ended September 30, 2022 | 2021 | 2020 | 2019 | 2018 | |||||||
Selected Per-Share Data | ||||||||||||
| Net asset value, beginning of period | $ | 11.45 | $ | 13.83 | $ | 12.47 | $ | 11.80 | $ | 11.85 | $ | 11.65 |
| Income from Investment Operations | ||||||||||||
Net investment income (loss) A,B | .11 | .19 | .11 | .14 | .18 | .13 | ||||||
| Net realized and unrealized gain (loss) | .88 | (2.31) | 1.47 | .88 | .21 | .37 | ||||||
| Total from investment operations | .99 | (2.12) | 1.58 | 1.02 | .39 | .50 | ||||||
| Distributions from net investment income | (.18) | (.15) | (.09) | (.14) | (.17) | (.12) | ||||||
| Distributions from net realized gain | (.37) | (.11) | (.13) | (.21) | (.27) | (.18) | ||||||
| Total distributions | (.55) | (.26) | (.22) | (.35) | (.44) | (.30) | ||||||
| Net asset value, end of period | $ | 11.89 | $ | 11.45 | $ | 13.83 | $ | 12.47 | $ | 11.80 | $ | 11.85 |
Total Return C,D,E | 8.88% | (15.63)% | 12.80% | 8.80% | 3.61% | 4.35% | ||||||
Ratios to Average Net Assets B,F,G | ||||||||||||
| Expenses before reductions | 1.06% H | 1.06% | 1.06% | 1.08% | 1.09% | 1.10% | ||||||
| Expenses net of fee waivers, if any | 1.06% H | 1.06% | 1.06% | 1.08% | 1.09% | 1.10% | ||||||
| Expenses net of all reductions | 1.06% H | 1.06% | 1.06% | 1.08% | 1.09% | 1.10% | ||||||
| Net investment income (loss) | 1.95% H | 1.48% | .84% | 1.17% | 1.53% | 1.14% | ||||||
| Supplemental Data | ||||||||||||
| Net assets, end of period (000 omitted) | $ | 13,779 | $ | 12,231 | $ | 14,809 | $ | 11,898 | $ | 10,913 | $ | 12,318 |
Portfolio turnover rate I | 28% H | 16% | 22% | 24% | 36% | 17% |
| Fidelity Advisor Asset Manager® 40% Class C |
Six months ended (Unaudited) March 31, 2023 | Years ended September 30, 2022 | 2021 | 2020 | 2019 | 2018 | |||||||
Selected Per-Share Data | ||||||||||||
| Net asset value, beginning of period | $ | 11.39 | $ | 13.77 | $ | 12.42 | $ | 11.75 | $ | 11.80 | $ | 11.61 |
| Income from Investment Operations | ||||||||||||
Net investment income (loss) A,B | .08 | .12 | .04 | .08 | .12 | .08 | ||||||
| Net realized and unrealized gain (loss) | .89 | (2.30) | 1.47 | .88 | .21 | .35 | ||||||
| Total from investment operations | .97 | (2.18) | 1.51 | .96 | .33 | .43 | ||||||
| Distributions from net investment income | (.14) | (.09) | (.03) | (.08) | (.12) | (.06) | ||||||
| Distributions from net realized gain | (.37) | (.11) | (.13) | (.21) | (.27) | (.18) | ||||||
| Total distributions | (.52) C | (.20) | (.16) | (.29) | (.38) C | (.24) | ||||||
| Net asset value, end of period | $ | 11.84 | $ | 11.39 | $ | 13.77 | $ | 12.42 | $ | 11.75 | $ | 11.80 |
Total Return D,E,F | 8.67% | (16.07)% | 12.24% | 8.25% | 3.11% | 3.77% | ||||||
Ratios to Average Net Assets A,G,H | ||||||||||||
| Expenses before reductions | 1.59% I | 1.59% | 1.59% | 1.59% | 1.60% | 1.60% | ||||||
| Expenses net of fee waivers, if any | 1.59% I | 1.59% | 1.59% | 1.59% | 1.60% | 1.60% | ||||||
| Expenses net of all reductions | 1.59% I | 1.59% | 1.59% | 1.59% | 1.60% | 1.60% | ||||||
| Net investment income (loss) | 1.42% I | .95% | .31% | .66% | 1.03% | .64% | ||||||
| Supplemental Data | ||||||||||||
| Net assets, end of period (000 omitted) | $ | 18,979 | $ | 19,517 | $ | 26,841 | $ | 23,974 | $ | 24,834 | $ | 25,656 |
Portfolio turnover rate J | 28% I | 16% | 22% | 24% | 36% | 17% |
| Fidelity Asset Manager® 40% |
Six months ended (Unaudited) March 31, 2023 | Years ended September 30, 2022 | 2021 | 2020 | 2019 | 2018 | |||||||
Selected Per-Share Data | ||||||||||||
| Net asset value, beginning of period | $ | 11.46 | $ | 13.85 | $ | 12.49 | $ | 11.82 | $ | 11.87 | $ | 11.67 |
| Income from Investment Operations | ||||||||||||
Net investment income (loss) A,B | .15 | .26 | .19 | .21 | .24 | .20 | ||||||
| Net realized and unrealized gain (loss) | .88 | (2.32) | 1.46 | .88 | .22 | .37 | ||||||
| Total from investment operations | 1.03 | (2.06) | 1.65 | 1.09 | .46 | .57 | ||||||
| Distributions from net investment income | (.21) | (.22) | (.16) | (.21) | (.24) | (.19) | ||||||
| Distributions from net realized gain | (.37) | (.11) | (.13) | (.21) | (.27) | (.18) | ||||||
| Total distributions | (.58) | (.33) | (.29) | (.42) | (.51) | (.37) | ||||||
| Net asset value, end of period | $ | 11.91 | $ | 11.46 | $ | 13.85 | $ | 12.49 | $ | 11.82 | $ | 11.87 |
Total Return C,D | 9.27% | (15.21)% | 13.38% | 9.41% | 4.23% | 4.95% | ||||||
Ratios to Average Net Assets B,E,F | ||||||||||||
| Expenses before reductions | .53% G | .52% | .52% | .52% | .52% | .53% | ||||||
| Expenses net of fee waivers, if any | .52% G | .52% | .51% | .52% | .52% | .53% | ||||||
| Expenses net of all reductions | .52% G | .52% | .51% | .52% | .52% | .53% | ||||||
| Net investment income (loss) | 2.49% G | 2.02% | 1.39% | 1.73% | 2.10% | 1.71% | ||||||
| Supplemental Data | ||||||||||||
| Net assets, end of period (000 omitted) | $ | 1,518,300 | $ | 1,515,043 | $ | 1,829,755 | $ | 1,911,787 | $ | 1,704,998 | $ | 1,577,393 |
Portfolio turnover rate H | 28% G | 16% | 22% | 24% | 36% | 17% |
| Fidelity Advisor Asset Manager® 40% Class I |
Six months ended (Unaudited) March 31, 2023 | Years ended September 30, 2022 | 2021 | 2020 | 2019 | 2018 | |||||||
Selected Per-Share Data | ||||||||||||
| Net asset value, beginning of period | $ | 11.47 | $ | 13.86 | $ | 12.49 | $ | 11.82 | $ | 11.87 | $ | 11.67 |
| Income from Investment Operations | ||||||||||||
Net investment income (loss) A,B | .14 | .26 | .18 | .20 | .24 | .20 | ||||||
| Net realized and unrealized gain (loss) | .89 | (2.32) | 1.48 | .88 | .21 | .36 | ||||||
| Total from investment operations | 1.03 | (2.06) | 1.66 | 1.08 | .45 | .56 | ||||||
| Distributions from net investment income | (.21) | (.21) | (.16) | (.20) | (.24) | (.18) | ||||||
| Distributions from net realized gain | (.37) | (.11) | (.13) | (.21) | (.27) | (.18) | ||||||
| Total distributions | (.58) | (.33) C | (.29) | (.41) | (.50) C | (.36) | ||||||
| Net asset value, end of period | $ | 11.92 | $ | 11.47 | $ | 13.86 | $ | 12.49 | $ | 11.82 | $ | 11.87 |
Total Return D,E | 9.23% | (15.24)% | 13.42% | 9.35% | 4.18% | 4.91% | ||||||
Ratios to Average Net Assets B,F,G | ||||||||||||
| Expenses before reductions | .58% H | .57% | .57% | .56% | .56% | .56% | ||||||
| Expenses net of fee waivers, if any | .57% H | .57% | .56% | .56% | .56% | .56% | ||||||
| Expenses net of all reductions | .57% H | .57% | .56% | .56% | .56% | .56% | ||||||
| Net investment income (loss) | 2.44% H | 1.97% | 1.34% | 1.69% | 2.06% | 1.68% | ||||||
| Supplemental Data | ||||||||||||
| Net assets, end of period (000 omitted) | $ | 37,310 | $ | 34,286 | $ | 42,310 | $ | 28,708 | $ | 25,014 | $ | 29,180 |
Portfolio turnover rate I | 28% H | 16% | 22% | 24% | 36% | 17% |
| Fidelity Advisor Asset Manager® 40% Class Z |
Six months ended (Unaudited) March 31, 2023 | Years ended September 30, 2022 | 2021 | 2020 | 2019 A | ||||||
Selected Per-Share Data | ||||||||||
| Net asset value, beginning of period | $ | 11.47 | $ | 13.86 | $ | 12.49 | $ | 11.82 | $ | 11.86 |
| Income from Investment Operations | ||||||||||
Net investment income (loss) B,C | .15 | .27 | .19 | .21 | .24 | |||||
| Net realized and unrealized gain (loss) | .88 | (2.32) | 1.48 | .88 | .23 | |||||
| Total from investment operations | 1.03 | (2.05) | 1.67 | 1.09 | .47 | |||||
| Distributions from net investment income | (.21) | (.23) | (.17) | (.22) | (.24) | |||||
| Distributions from net realized gain | (.37) | (.11) | (.13) | (.21) | (.27) | |||||
| Total distributions | (.59) D | (.34) | (.30) | (.42) D | (.51) | |||||
| Net asset value, end of period | $ | 11.91 | $ | 11.47 | $ | 13.86 | $ | 12.49 | $ | 11.82 |
Total Return E,F | 9.20% | (15.16)% | 13.49% | 9.45% | 4.34% | |||||
Ratios to Average Net Assets C,G,H | ||||||||||
| Expenses before reductions | .49% I | .49% | .49% | .50% | .50% I | |||||
| Expenses net of fee waivers, if any | .49% I | .49% | .49% | .49% | .50% I | |||||
| Expenses net of all reductions | .49% I | .49% | .49% | .49% | .50% I | |||||
| Net investment income (loss) | 2.52% I | 2.05% | 1.41% | 1.76% | 2.12% I | |||||
| Supplemental Data | ||||||||||
| Net assets, end of period (000 omitted) | $ | 564,665 | $ | 500,747 | $ | 556,238 | $ | 12,416 | $ | 6,431 |
Portfolio turnover rate J | 28% I | 16% | 22% | 24% | 36% |
Top Holdings (% of Fund's net assets) | ||
| Apple, Inc. | 2.3 | |
| Microsoft Corp. | 2.2 | |
| Alphabet, Inc. Class A | 1.2 | |
| Amazon.com, Inc. | 0.9 | |
| iShares 20+ Year Treasury Bond ETF | 0.8 | |
| iShares MSCI USA Minimum Volatility ETF | 0.8 | |
| Exxon Mobil Corp. | 0.6 | |
| Taiwan Semiconductor Manufacturing Co. Ltd. | 0.6 | |
| VanEck Vectors Gold Miners ETF | 0.5 | |
| Meta Platforms, Inc. Class A | 0.5 | |
| 10.4 | ||
| Top Bond Issuers (% of Fund's net assets) | ||
(with maturities greater than one year) | ||
| U.S. Treasury Obligations | 16.8 | |
| Fannie Mae | 2.2 | |
| Freddie Mac | 2.0 | |
| Ginnie Mae | 1.4 | |
| Uniform Mortgage Backed Securities | 0.8 | |
| JPMorgan Chase & Co. | 0.6 | |
| Morgan Stanley | 0.4 | |
| Bank of America Corp. | 0.4 | |
| Petroleos Mexicanos | 0.4 | |
| Citigroup, Inc. | 0.4 | |
| 25.4 | ||
| Market Sectors (% of Fund's net assets) | ||
| Financials | 15.9 | |
| Information Technology | 11.5 | |
| Health Care | 7.6 | |
| Consumer Discretionary | 7.3 | |
| Industrials | 7.3 | |
| Communication Services | 4.5 | |
| Consumer Staples | 4.0 | |
| Energy | 4.0 | |
| Real Estate | 2.6 | |
| Materials | 2.5 | |
| Utilities | 1.6 | |
| Financial Services | 0.1 | |
Quality Diversification (% of Fund's net assets) |
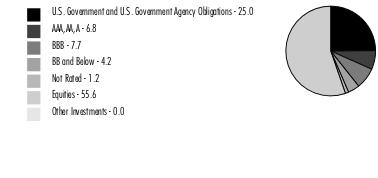 |
Short-Term Investments and Net Other Assets (Liabilities) - (0.5)%* |
Percentages shown as 0.0% may reflect amounts less than 0.05%. |
*Short-term investments and Net Other Assets (Liabilities) are not available in the pie chart. |
| We have used ratings from Moody's Investors Service, Inc. Where Moody's® ratings are not available, we have used S&P® ratings. All ratings are as of the date indicated and do not reflect subsequent changes. |
Asset Allocation (% of Fund's net assets) |
 |
Short-Term Class* - (0.2)% |
Geographic Diversification (% of Fund's net assets) |
 |
* Includes Short-Term investments and Net Other Assets (Liabilities). Percentages are based on country or territory of incorporation and are adjusted for the effect of derivatives, if applicable. |
| Equity Central Funds - 54.2% | |||
| Shares | Value ($) | ||
| Fidelity Commodity Strategy Central Fund (a) | 1,005,171 | 97,220,153 | |
| Fidelity Emerging Markets Equity Central Fund (a) | 3,206,864 | 617,706,123 | |
| Fidelity Hedged Equity Central Fund (a) | 278,816 | 28,193,888 | |
| Fidelity International Equity Central Fund (a) | 15,263,669 | 1,397,236,304 | |
| Fidelity Real Estate Equity Central Fund (a) | 339,076 | 40,861,998 | |
| Fidelity U.S. Equity Central Fund (a) | 26,776,866 | 2,996,599,091 | |
| TOTAL EQUITY CENTRAL FUNDS (Cost $2,907,419,329) | 5,177,817,557 | ||
| Fixed-Income Central Funds - 42.5% | |||
| Shares | Value ($) | ||
| High Yield Fixed-Income Funds - 4.2% | |||
| Fidelity Emerging Markets Debt Central Fund (a) | 2,557,184 | 19,357,883 | |
| Fidelity Emerging Markets Debt Local Currency Central Fund (a) | 834,576 | 74,352,366 | |
| Fidelity Floating Rate Central Fund (a) | 2,353,066 | 226,553,189 | |
| Fidelity High Income Central Fund (a) | 768,251 | 78,638,138 | |
TOTAL HIGH YIELD FIXED-INCOME FUNDS | 398,901,576 | ||
| Investment Grade Fixed-Income Funds - 38.3% | |||
| Fidelity Inflation-Protected Bond Index Central Fund (a) | 2,054,237 | 185,744,105 | |
| Fidelity International Credit Central Fund (a) | 1,161,449 | 90,302,672 | |
| Fidelity Investment Grade Bond Central Fund (a) | 34,129,791 | 3,378,849,315 | |
TOTAL INVESTMENT GRADE FIXED-INCOME FUNDS | 3,654,896,092 | ||
| TOTAL FIXED-INCOME CENTRAL FUNDS (Cost $4,211,883,591) | 4,053,797,668 | ||
| Money Market Central Funds - 0.9% | |||
| Shares | Value ($) | ||
Fidelity Cash Central Fund 4.86% (b) (Cost $85,922,263) | 85,905,082 | 85,922,263 | |
| U.S. Treasury Obligations - 0.4% | |||
Principal Amount (c) | Value ($) | ||
U.S. Treasury Bills, yield at date of purchase 4.41% to 4.93% 4/6/23 to 6/8/23 (d) (Cost $40,695,126) | 40,920,000 | 40,712,478 | |
| Investment Companies - 2.1% | |||
| Shares | Value ($) | ||
| iShares 20+ Year Treasury Bond ETF | 706,093 | 75,107,113 | |
| iShares MSCI USA Minimum Volatility ETF | 987,281 | 71,814,820 | |
| VanEck Vectors Gold Miners ETF | 1,543,441 | 49,930,316 | |
| TOTAL INVESTMENT COMPANIES (Cost $198,542,747) | 196,852,249 | ||
| TOTAL INVESTMENT IN SECURITIES - 100.1% (Cost $7,444,463,056) | 9,555,102,215 |
NET OTHER ASSETS (LIABILITIES) - (0.1)% | (6,937,157) |
| NET ASSETS - 100.0% | 9,548,165,058 |
| Futures Contracts | |||||
Number of contracts | Expiration Date | Notional Amount ($) | Value ($) | Unrealized Appreciation/ (Depreciation) ($) | |
| Purchased | |||||
| Equity Index Contracts | |||||
| ICE E-mini MSCI EAFE Index Contracts (United States) | 1,041 | Jun 2023 | 109,122,825 | 4,596,419 | 4,596,419 |
| ICE E-mini MSCI Emerging Markets Index Contracts (United States) | 597 | Jun 2023 | 29,715,675 | 1,066,041 | 1,066,041 |
| TOTAL EQUITY INDEX CONTRACTS | 5,662,460 | ||||
| Treasury Contracts | |||||
| CBOT 5-Year U.S. Treasury Note Contracts (United States) | 668 | Jun 2023 | 73,151,219 | 1,548,626 | 1,548,626 |
| TOTAL PURCHASED | 7,211,086 | ||||
| Sold | |||||
| Equity Index Contracts | |||||
| CME E-mini S&P 500 Index Contracts (United States) | 2,920 | Jun 2023 | 604,111,500 | (35,431,221) | (35,431,221) |
| TOTAL FUTURES CONTRACTS | (28,220,135) | ||||
| The notional amount of futures purchased as a percentage of Net Assets is 2.2% | |||||
| The notional amount of futures sold as a percentage of Net Assets is 6.3% | |||||
| ETF | - | EXCHANGE-TRADED FUND |
| (a) | Affiliated fund that is generally available only to investment companies and other accounts managed by Fidelity Investments. A complete unaudited schedule of portfolio holdings for each Fidelity Central Fund is filed with the SEC for the first and third quarters of each fiscal year on Form N-PORT and is available upon request or at the SEC's website at www.sec.gov. An unaudited holdings listing for the Fund, which presents direct holdings as well as the pro-rata share of securities and other investments held indirectly through its investment in underlying non-money market Fidelity Central Funds, other than the Commodity Strategy Central Fund, is available at fidelity.com and/or institutional.fidelity.com, as applicable. In addition, each Fidelity Central Fund's financial statements are available on the SEC's website or upon request. |
| (b) | Affiliated fund that is generally available only to investment companies and other accounts managed by Fidelity Investments. The rate quoted is the annualized seven-day yield of the fund at period end. A complete unaudited listing of the fund's holdings as of its most recent quarter end is available upon request. In addition, each Fidelity Central Fund's financial statements are available on the SEC's website or upon request. |
| (c) | Amount is stated in United States dollars unless otherwise noted. |
| (d) | Security or a portion of the security was pledged to cover margin requirements for futures contracts. At period end, the value of securities pledged amounted to $40,489,358. |
| Affiliate | Value, beginning of period ($) | Purchases ($) | Sales Proceeds ($) | Dividend Income ($) | Realized Gain (loss) ($) | Change in Unrealized appreciation (depreciation) ($) | Value, end of period ($) | % ownership, end of period |
| Fidelity Cash Central Fund 4.86% | 91,967,268 | 627,682,484 | 633,727,489 | 1,654,852 | - | - | 85,922,263 | 0.2% |
| Fidelity Commodity Strategy Central Fund | 203,314,745 | 3,182,020 | 103,813,223 | 2,149,638 | (30,671,544) | 25,208,155 | 97,220,153 | 21.0% |
| Fidelity Emerging Markets Debt Central Fund | 20,685,617 | 968,016 | 3,508,174 | 639,495 | (831,364) | 2,043,788 | 19,357,883 | 0.9% |
| Fidelity Emerging Markets Debt Local Currency Central Fund | 23,176,447 | 47,040,113 | - | 63,738 | - | 4,135,806 | 74,352,366 | 26.9% |
| Fidelity Emerging Markets Equity Central Fund | 486,823,346 | 106,330,245 | 43,836,433 | 7,846,807 | (12,851,448) | 81,240,413 | 617,706,123 | 27.1% |
| Fidelity Floating Rate Central Fund | 273,001,460 | 12,909,663 | 65,562,618 | 11,150,314 | (2,067,976) | 8,272,660 | 226,553,189 | 12.1% |
| Fidelity Hedged Equity Central Fund | - | 27,881,239 | - | 15,326 | - | 312,649 | 28,193,888 | 26.5% |
| Fidelity High Income Central Fund | 75,459,699 | 3,544,060 | 3,788,864 | 3,078,627 | 388,462 | 3,034,781 | 78,638,138 | 4.7% |
| Fidelity Inflation-Protected Bond Index Central Fund | 186,198,174 | 21,337,623 | 10,107,035 | 20,093,071 | (405,727) | (11,278,930) | 185,744,105 | 29.6% |
| Fidelity International Credit Central Fund | 108,800,355 | 5,224,671 | 20,544,009 | 4,603,277 | (6,074,580) | 2,896,235 | 90,302,672 | 25.6% |
| Fidelity International Equity Central Fund | 941,361,876 | 248,048,039 | 61,153,842 | 6,717,360 | (2,764,790) | 271,745,021 | 1,397,236,304 | 28.8% |
| Fidelity Investment Grade Bond Central Fund | 2,986,555,177 | 484,455,278 | 197,252,971 | 58,291,002 | (5,965,130) | 111,056,961 | 3,378,849,315 | 9.2% |
| Fidelity Real Estate Equity Central Fund | 61,134,245 | 1,282,820 | 26,862,599 | 826,094 | 203,923 | 5,103,609 | 40,861,998 | 4.2% |
| Fidelity Securities Lending Cash Central Fund 4.87% | - | 348,271,991 | 348,271,991 | 8,079 | - | - | - | 0.0% |
| Fidelity U.S. Equity Central Fund | 3,121,072,050 | 81,215,997 | 608,688,081 | 63,374,238 | 106,511,262 | 296,487,863 | 2,996,599,091 | 19.0% |
| Total | 8,579,550,459 | 2,019,374,259 | 2,127,117,329 | 180,511,918 | 45,471,088 | 800,259,011 | 9,317,537,488 | |
| Valuation Inputs at Reporting Date: | ||||
| Description | Total ($) | Level 1 ($) | Level 2 ($) | Level 3 ($) |
Investments in Securities: | ||||
| Equity Central Funds | 5,177,817,557 | 5,177,817,557 | - | - |
| Fixed-Income Central Funds | 4,053,797,668 | 4,053,797,668 | - | - |
| Money Market Central Funds | 85,922,263 | 85,922,263 | - | - |
| Other Short-Term Investments and Net Other Assets | 40,712,478 | - | 40,712,478 | - |
| Investment Companies | 196,852,249 | 196,852,249 | - | - |
| Total Investments in Securities: | 9,555,102,215 | 9,514,389,737 | 40,712,478 | - |
Derivative Instruments: | ||||
| Assets | ||||
Futures Contracts | 7,211,086 | 7,211,086 | - | - |
| Total Assets | 7,211,086 | 7,211,086 | - | - |
| Liabilities | ||||
Futures Contracts | (35,431,221) | (35,431,221) | - | - |
| Total Liabilities | (35,431,221) | (35,431,221) | - | - |
| Total Derivative Instruments: | (28,220,135) | (28,220,135) | - | - |
Primary Risk Exposure / Derivative Type | Value | |
| Asset ($) | Liability ($) | |
| Equity Risk | ||
Futures Contracts (a) | 5,662,460 | (35,431,221) |
| Total Equity Risk | 5,662,460 | (35,431,221) |
| Interest Rate Risk | ||
Futures Contracts (a) | 1,548,626 | 0 |
| Total Interest Rate Risk | 1,548,626 | 0 |
| Total Value of Derivatives | 7,211,086 | (35,431,221) |
| Statement of Assets and Liabilities | ||||
March 31, 2023 (Unaudited) | ||||
| Assets | ||||
| Investment in securities, at value - See accompanying schedule: | ||||
Unaffiliated issuers (cost $239,237,873) | $ | 237,564,727 | ||
Fidelity Central Funds (cost $7,205,225,183) | 9,317,537,488 | |||
| Total Investment in Securities (cost $7,444,463,056) | $ | 9,555,102,215 | ||
| Cash | 2 | |||
| Receivable for investments sold | 11,479,260 | |||
| Receivable for fund shares sold | 1,308,113 | |||
| Distributions receivable from Fidelity Central Funds | 286,819 | |||
| Prepaid expenses | 4,897 | |||
| Other receivables | 148,116 | |||
Total assets | 9,568,329,422 | |||
| Liabilities | ||||
| Payable for investments purchased | $ | 6,859 | ||
| Payable for fund shares redeemed | 7,323,029 | |||
| Accrued management fee | 3,724,824 | |||
| Distribution and service plan fees payable | 71,745 | |||
| Payable for daily variation margin on futures contracts | 7,893,759 | |||
| Other affiliated payables | 965,345 | |||
| Other payables and accrued expenses | 178,803 | |||
| Total Liabilities | 20,164,364 | |||
| Net Assets | $ | 9,548,165,058 | ||
| Net Assets consist of: | ||||
| Paid in capital | $ | 8,233,429,505 | ||
| Total accumulated earnings (loss) | 1,314,735,553 | |||
| Net Assets | $ | 9,548,165,058 | ||
| Net Asset Value and Maximum Offering Price | ||||
| Class A : | ||||
Net Asset Value and redemption price per share ($121,411,810 ÷ 6,562,208 shares) (a) | $ | 18.50 | ||
| Maximum offering price per share (100/94.25 of $18.50) | $ | 19.63 | ||
| Class M : | ||||
Net Asset Value and redemption price per share ($51,705,921 ÷ 2,798,489 shares) (a) | $ | 18.48 | ||
| Maximum offering price per share (100/96.50 of $18.48) | $ | 19.15 | ||
| Class C : | ||||
Net Asset Value and offering price per share ($31,265,121 ÷ 1,709,680 shares) (a) | $ | 18.29 | ||
| Asset Manager 50% : | ||||
Net Asset Value , offering price and redemption price per share ($7,393,043,353 ÷ 397,521,105 shares) | $ | 18.60 | ||
| Class I : | ||||
Net Asset Value , offering price and redemption price per share ($55,770,573 ÷ 3,005,182 shares) | $ | 18.56 | ||
| Class Z : | ||||
Net Asset Value , offering price and redemption price per share ($1,894,968,280 ÷ 102,198,734 shares) | $ | 18.54 | ||
(a)Redemption price per share is equal to net asset value less any applicable contingent deferred sales charge. | ||||
| Statement of Operations | ||||
Six months ended March 31, 2023 (Unaudited) | ||||
| Investment Income | ||||
| Dividends | $ | 2,548,938 | ||
| Interest | 714,040 | |||
| Income from Fidelity Central Funds (including $8,079 from security lending) | 131,511,112 | |||
| Total Income | 134,774,090 | |||
| Expenses | ||||
| Management fee | $ | 22,418,958 | ||
| Transfer agent fees | 4,978,302 | |||
| Distribution and service plan fees | 433,926 | |||
| Accounting fees | 738,476 | |||
| Custodian fees and expenses | 17,571 | |||
| Independent trustees' fees and expenses | 18,996 | |||
| Registration fees | 60,092 | |||
| Audit | 24,784 | |||
| Legal | 17,280 | |||
| Miscellaneous | 23,257 | |||
| Total expenses before reductions | 28,731,642 | |||
| Expense reductions | (179,215) | |||
| Total expenses after reductions | 28,552,427 | |||
| Net Investment income (loss) | 106,221,663 | |||
| Realized and Unrealized Gain (Loss) | ||||
| Net realized gain (loss) on: | ||||
| Investment Securities: | ||||
| Unaffiliated issuers | (59,472,839) | |||
| Fidelity Central Funds | 45,471,088 | |||
| Futures contracts | 32,785,437 | |||
| Capital gain distributions from Fidelity Central Funds | 49,000,806 | |||
| Total net realized gain (loss) | 67,784,492 | |||
| Change in net unrealized appreciation (depreciation) on: | ||||
| Investment Securities: | ||||
| Unaffiliated issuers | 71,460,251 | |||
| Fidelity Central Funds | 800,259,011 | |||
| Futures contracts | (93,758,917) | |||
| Total change in net unrealized appreciation (depreciation) | 777,960,345 | |||
| Net gain (loss) | 845,744,837 | |||
| Net increase (decrease) in net assets resulting from operations | $ | 951,966,500 | ||
| Statement of Changes in Net Assets | ||||
Six months ended March 31, 2023 (Unaudited) | Year ended September 30, 2022 | |||
| Increase (Decrease) in Net Assets | ||||
| Operations | ||||
| Net investment income (loss) | $ | 106,221,663 | $ | 208,898,662 |
| Net realized gain (loss) | 67,784,492 | 465,207,708 | ||
| Change in net unrealized appreciation (depreciation) | 777,960,345 | (2,558,606,467) | ||
| Net increase (decrease) in net assets resulting from operations | 951,966,500 | (1,884,500,097) | ||
| Distributions to shareholders | (550,151,286) | (345,832,994) | ||
| Share transactions - net increase (decrease) | 135,695,895 | (312,881,619) | ||
| Total increase (decrease) in net assets | 537,511,109 | (2,543,214,710) | ||
| Net Assets | ||||
| Beginning of period | 9,010,653,949 | 11,553,868,659 | ||
| End of period | $ | 9,548,165,058 | $ | 9,010,653,949 |
| Fidelity Advisor Asset Manager® 50% Class A |
Six months ended (Unaudited) March 31, 2023 | Years ended September 30, 2022 | 2021 | 2020 | 2019 | 2018 | |||||||
Selected Per-Share Data | ||||||||||||
| Net asset value, beginning of period | $ | 17.75 | $ | 21.98 | $ | 19.33 | $ | 18.22 | $ | 18.58 | $ | 18.29 |
| Income from Investment Operations | ||||||||||||
Net investment income (loss) A,B | .18 | .33 | .20 | .24 | .28 | .23 | ||||||
| Net realized and unrealized gain (loss) | 1.64 | (3.97) | 2.86 | 1.57 | .20 | .80 | ||||||
| Total from investment operations | 1.82 | (3.64) | 3.06 | 1.81 | .48 | 1.03 | ||||||
| Distributions from net investment income | (.29) | (.28) | (.17) | (.25) | (.29) | (.21) | ||||||
| Distributions from net realized gain | (.78) | (.31) | (.24) | (.45) | (.55) | (.53) | ||||||
| Total distributions | (1.07) | (.59) | (.41) | (.70) | (.84) | (.74) | ||||||
| Net asset value, end of period | $ | 18.50 | $ | 17.75 | $ | 21.98 | $ | 19.33 | $ | 18.22 | $ | 18.58 |
Total Return C,D,E | 10.58% | (17.02)% | 15.99% | 10.15% | 3.07% | 5.74% | ||||||
Ratios to Average Net Assets B,F,G | ||||||||||||
| Expenses before reductions | .91% H | .91% | .91% | .93% | .94% | .94% | ||||||
| Expenses net of fee waivers, if any | .91% H | .90% | .91% | .92% | .94% | .94% | ||||||
| Expenses net of all reductions | .91% H | .90% | .91% | .92% | .94% | .94% | ||||||
| Net investment income (loss) | 1.96% H | 1.63% | .94% | 1.32% | 1.57% | 1.24% | ||||||
| Supplemental Data | ||||||||||||
| Net assets, end of period (000 omitted) | $ | 121,412 | $ | 110,693 | $ | 134,052 | $ | 106,339 | $ | 95,542 | $ | 86,252 |
Portfolio turnover rate I | 26% H | 20% | 17% | 24% | 37% | 15% |
| Fidelity Advisor Asset Manager® 50% Class M |
Six months ended (Unaudited) March 31, 2023 | Years ended September 30, 2022 | 2021 | 2020 | 2019 | 2018 | |||||||
Selected Per-Share Data | ||||||||||||
| Net asset value, beginning of period | $ | 17.73 | $ | 21.95 | $ | 19.31 | $ | 18.20 | $ | 18.56 | $ | 18.27 |
| Income from Investment Operations | ||||||||||||
Net investment income (loss) A,B | .16 | .28 | .15 | .20 | .23 | .18 | ||||||
| Net realized and unrealized gain (loss) | 1.64 | (3.95) | 2.85 | 1.57 | .21 | .80 | ||||||
| Total from investment operations | 1.80 | (3.67) | 3.00 | 1.77 | .44 | .98 | ||||||
| Distributions from net investment income | (.27) | (.24) | (.12) | (.20) | (.25) | (.16) | ||||||
| Distributions from net realized gain | (.78) | (.31) | (.24) | (.45) | (.55) | (.53) | ||||||
| Total distributions | (1.05) | (.55) | (.36) | (.66) C | (.80) | (.69) | ||||||
| Net asset value, end of period | $ | 18.48 | $ | 17.73 | $ | 21.95 | $ | 19.31 | $ | 18.20 | $ | 18.56 |
Total Return D,E,F | 10.45% | (17.18)% | 15.69% | 9.89% | 2.81% | 5.48% | ||||||
Ratios to Average Net Assets B,G,H | ||||||||||||
| Expenses before reductions | 1.15% I | 1.15% | 1.15% | 1.17% | 1.18% | 1.19% | ||||||
| Expenses net of fee waivers, if any | 1.15% I | 1.15% | 1.15% | 1.16% | 1.18% | 1.19% | ||||||
| Expenses net of all reductions | 1.15% I | 1.15% | 1.15% | 1.16% | 1.18% | 1.19% | ||||||
| Net investment income (loss) | 1.72% I | 1.39% | .70% | 1.08% | 1.33% | .99% | ||||||
| Supplemental Data | ||||||||||||
| Net assets, end of period (000 omitted) | $ | 51,706 | $ | 47,759 | $ | 57,507 | $ | 45,076 | $ | 42,658 | $ | 41,222 |
Portfolio turnover rate J | 26% I | 20% | 17% | 24% | 37% | 15% |
| Fidelity Advisor Asset Manager® 50% Class C |
Six months ended (Unaudited) March 31, 2023 | Years ended September 30, 2022 | 2021 | 2020 | 2019 | 2018 | |||||||
Selected Per-Share Data | ||||||||||||
| Net asset value, beginning of period | $ | 17.55 | $ | 21.76 | $ | 19.16 | $ | 18.05 | $ | 18.42 | $ | 18.15 |
| Income from Investment Operations | ||||||||||||
Net investment income (loss) A,B | .11 | .18 | .04 | .10 | .14 | .09 | ||||||
| Net realized and unrealized gain (loss) | 1.63 | (3.93) | 2.84 | 1.57 | .20 | .79 | ||||||
| Total from investment operations | 1.74 | (3.75) | 2.88 | 1.67 | .34 | .88 | ||||||
| Distributions from net investment income | (.21) | (.15) | (.04) | (.11) | (.16) | (.08) | ||||||
| Distributions from net realized gain | (.78) | (.31) | (.24) | (.45) | (.55) | (.53) | ||||||
| Total distributions | (1.00) C | (.46) | (.28) | (.56) | (.71) | (.61) | ||||||
| Net asset value, end of period | $ | 18.29 | $ | 17.55 | $ | 21.76 | $ | 19.16 | $ | 18.05 | $ | 18.42 |
Total Return D,E,F | 10.17% | (17.64)% | 15.12% | 9.38% | 2.25% | 4.93% | ||||||
Ratios to Average Net Assets B,G,H | ||||||||||||
| Expenses before reductions | 1.67% I | 1.66% | 1.67% | 1.68% | 1.69% | 1.70% | ||||||
| Expenses net of fee waivers, if any | 1.66% I | 1.66% | 1.67% | 1.68% | 1.69% | 1.70% | ||||||
| Expenses net of all reductions | 1.66% I | 1.66% | 1.67% | 1.68% | 1.69% | 1.70% | ||||||
| Net investment income (loss) | 1.21% I | .87% | .18% | .56% | .82% | .49% | ||||||
| Supplemental Data | ||||||||||||
| Net assets, end of period (000 omitted) | $ | 31,265 | $ | 31,796 | $ | 51,226 | $ | 44,990 | $ | 46,487 | $ | 51,337 |
Portfolio turnover rate J | 26% I | 20% | 17% | 24% | 37% | 15% |
| Fidelity Asset Manager® 50% |
Six months ended (Unaudited) March 31, 2023 | Years ended September 30, 2022 | 2021 | 2020 | 2019 | 2018 | |||||||
Selected Per-Share Data | ||||||||||||
| Net asset value, beginning of period | $ | 17.84 | $ | 22.09 | $ | 19.42 | $ | 18.30 | $ | 18.66 | $ | 18.37 |
| Income from Investment Operations | ||||||||||||
Net investment income (loss) A,B | .21 | .40 | .27 | .30 | .33 | .29 | ||||||
| Net realized and unrealized gain (loss) | 1.65 | (3.99) | 2.87 | 1.58 | .21 | .80 | ||||||
| Total from investment operations | 1.86 | (3.59) | 3.14 | 1.88 | .54 | 1.09 | ||||||
| Distributions from net investment income | (.32) | (.35) | (.23) | (.30) | (.35) | (.26) | ||||||
| Distributions from net realized gain | (.78) | (.31) | (.24) | (.45) | (.55) | (.53) | ||||||
| Total distributions | (1.10) | (.66) | (.47) | (.76) C | (.90) | (.80) C | ||||||
| Net asset value, end of period | $ | 18.60 | $ | 17.84 | $ | 22.09 | $ | 19.42 | $ | 18.30 | $ | 18.66 |
Total Return D,E | 10.76% | (16.79)% | 16.36% | 10.51% | 3.37% | 6.05% | ||||||
Ratios to Average Net Assets B,F,G | ||||||||||||
| Expenses before reductions | .62% H | .61% | .61% | .62% | .63% | .63% | ||||||
| Expenses net of fee waivers, if any | .61% H | .60% | .60% | .62% | .63% | .63% | ||||||
| Expenses net of all reductions | .61% H | .60% | .60% | .62% | .63% | .63% | ||||||
| Net investment income (loss) | 2.26% H | 1.93% | 1.25% | 1.63% | 1.88% | 1.55% | ||||||
| Supplemental Data | ||||||||||||
| Net assets, end of period (000 omitted) | $ | 7,393,043 | $ | 7,094,870 | $ | 9,274,634 | $ | 9,387,915 | $ | 9,026,444 | $ | 9,140,811 |
Portfolio turnover rate I | 26% H | 20% | 17% | 24% | 37% | 15% |
| Fidelity Advisor Asset Manager® 50% Class I |
Six months ended (Unaudited) March 31, 2023 | Years ended September 30, 2022 | 2021 | 2020 | 2019 | 2018 | |||||||
Selected Per-Share Data | ||||||||||||
| Net asset value, beginning of period | $ | 17.80 | $ | 22.04 | $ | 19.38 | $ | 18.26 | $ | 18.62 | $ | 18.33 |
| Income from Investment Operations | ||||||||||||
Net investment income (loss) A,B | .20 | .39 | .26 | .29 | .33 | .28 | ||||||
| Net realized and unrealized gain (loss) | 1.66 | (3.98) | 2.87 | 1.58 | .20 | .80 | ||||||
| Total from investment operations | 1.86 | (3.59) | 3.13 | 1.87 | .53 | 1.08 | ||||||
| Distributions from net investment income | (.31) | (.34) | (.23) | (.30) | (.34) | (.26) | ||||||
| Distributions from net realized gain | (.78) | (.31) | (.24) | (.45) | (.55) | (.53) | ||||||
| Total distributions | (1.10) C | (.65) | (.47) | (.75) | (.89) | (.79) | ||||||
| Net asset value, end of period | $ | 18.56 | $ | 17.80 | $ | 22.04 | $ | 19.38 | $ | 18.26 | $ | 18.62 |
Total Return D,E | 10.76% | (16.80)% | 16.30% | 10.49% | 3.33% | 6.02% | ||||||
Ratios to Average Net Assets B,F,G | ||||||||||||
| Expenses before reductions | .64% H | .64% | .64% | .65% | .66% | .67% | ||||||
| Expenses net of fee waivers, if any | .64% H | .64% | .64% | .65% | .66% | .67% | ||||||
| Expenses net of all reductions | .64% H | .64% | .64% | .65% | .66% | .67% | ||||||
| Net investment income (loss) | 2.23% H | 1.90% | 1.21% | 1.59% | 1.85% | 1.52% | ||||||
| Supplemental Data | ||||||||||||
| Net assets, end of period (000 omitted) | $ | 55,771 | $ | 60,352 | $ | 81,320 | $ | 55,021 | $ | 62,141 | $ | 75,904 |
Portfolio turnover rate I | 26% H | 20% | 17% | 24% | 37% | 15% |
| Fidelity Advisor Asset Manager® 50% Class Z |
Six months ended (Unaudited) March 31, 2023 | Years ended September 30, 2022 | 2021 | 2020 | 2019 A | ||||||
Selected Per-Share Data | ||||||||||
| Net asset value, beginning of period | $ | 17.79 | $ | 22.03 | $ | 19.37 | $ | 18.26 | $ | 18.59 |
| Income from Investment Operations | ||||||||||
Net investment income (loss) B,C | .21 | .41 | .28 | .31 | .35 | |||||
| Net realized and unrealized gain (loss) | 1.65 | (3.98) | 2.87 | 1.57 | .23 | |||||
| Total from investment operations | 1.86 | (3.57) | 3.15 | 1.88 | .58 | |||||
| Distributions from net investment income | (.33) | (.36) | (.25) | (.32) | (.36) | |||||
| Distributions from net realized gain | (.78) | (.31) | (.24) | (.45) | (.55) | |||||
| Total distributions | (1.11) | (.67) | (.49) | (.77) | (.91) | |||||
| Net asset value, end of period | $ | 18.54 | $ | 17.79 | $ | 22.03 | $ | 19.37 | $ | 18.26 |
Total Return D,E | 10.79% | (16.71)% | 16.43% | 10.56% | 3.61% | |||||
Ratios to Average Net Assets C,F,G | ||||||||||
| Expenses before reductions | .54% H | .53% | .54% | .55% | .55% H | |||||
| Expenses net of fee waivers, if any | .53% H | .53% | .54% | .54% | .55% H | |||||
| Expenses net of all reductions | .53% H | .53% | .54% | .54% | .55% H | |||||
| Net investment income (loss) | 2.33% H | 2.00% | 1.32% | 1.70% | 1.96% H | |||||
| Supplemental Data | ||||||||||
| Net assets, end of period (000 omitted) | $ | 1,894,968 | $ | 1,665,184 | $ | 1,955,130 | $ | 26,638 | $ | 20,968 |
Portfolio turnover rate I | 26% H | 20% | 17% | 24% | 37% |
Top Holdings (% of Fund's net assets) | ||
| Apple, Inc. | 2.6 | |
| Microsoft Corp. | 2.5 | |
| Alphabet, Inc. Class A | 1.3 | |
| iShares 20+ Year Treasury Bond ETF | 1.0 | |
| Amazon.com, Inc. | 1.0 | |
| iShares MSCI USA Minimum Volatility ETF | 0.8 | |
| Exxon Mobil Corp. | 0.7 | |
| Taiwan Semiconductor Manufacturing Co. Ltd. | 0.6 | |
| Meta Platforms, Inc. Class A | 0.5 | |
| VanEck Vectors Gold Miners ETF | 0.5 | |
| 11.5 | ||
| Market Sectors (% of Fund's net assets) | ||
| Financials | 16.2 | |
| Information Technology | 12.9 | |
| Health Care | 7.6 | |
| Consumer Discretionary | 7.6 | |
| Industrials | 7.2 | |
| Communication Services | 4.8 | |
| Consumer Staples | 4.4 | |
| Energy | 4.0 | |
| Materials | 2.7 | |
| Real Estate | 2.5 | |
| Utilities | 1.7 | |
| Financial Services | 0.1 | |
Quality Diversification (% of Fund's net assets) |
 |
Percentages shown as 0.0% may reflect amounts less than 0.05%. |
| We have used ratings from Moody's Investors Service, Inc. Where Moody's® ratings are not available, we have used S&P® ratings. All ratings are as of the date indicated and do not reflect subsequent changes. |
Asset Allocation (% of Fund's net assets) |
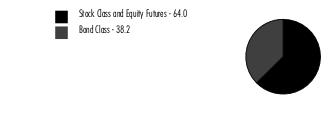 |
Short-Term Class * - (2.2)% |
Geographic Diversification (% of Fund's net assets) |
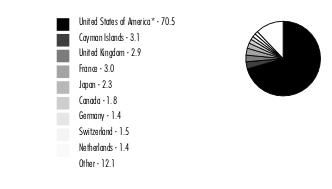 |
* Includes Short-Term investments and Net Other Assets (Liabilities). Percentages are based on country or territory of incorporation and are adjusted for the effect of derivatives, if applicable. |
| Equity Central Funds - 60.0% | |||
| Shares | Value ($) | ||
| Fidelity Commodity Strategy Central Fund (a) | 406,563 | 39,322,780 | |
| Fidelity Emerging Markets Equity Central Fund (a) | 1,516,943 | 292,193,631 | |
| Fidelity Hedged Equity Central Fund (a) | 110,657 | 11,189,595 | |
| Fidelity International Equity Central Fund (a) | 6,448,993 | 590,340,826 | |
| Fidelity Real Estate Equity Central Fund (a) | 136,111 | 16,402,740 | |
| Fidelity U.S. Equity Central Fund (a) | 12,100,280 | 1,354,142,381 | |
| TOTAL EQUITY CENTRAL FUNDS (Cost $1,589,107,690) | 2,303,591,953 | ||
| Fixed-Income Central Funds - 36.4% | |||
| Shares | Value ($) | ||
| High Yield Fixed-Income Funds - 4.0% | |||
| Fidelity Emerging Markets Debt Central Fund (a) | 1,273,024 | 9,636,790 | |
| Fidelity Emerging Markets Debt Local Currency Central Fund (a) | 333,075 | 29,673,624 | |
| Fidelity Floating Rate Central Fund (a) | 838,760 | 80,755,852 | |
| Fidelity High Income Central Fund (a) | 309,626 | 31,693,339 | |
TOTAL HIGH YIELD FIXED-INCOME FUNDS | 151,759,605 | ||
| Investment Grade Fixed-Income Funds - 32.4% | |||
| Fidelity Inflation-Protected Bond Index Central Fund (a) | 856,606 | 77,454,354 | |
| Fidelity International Credit Central Fund (a) | 463,223 | 36,015,616 | |
| Fidelity Investment Grade Bond Central Fund (a) | 11,414,069 | 1,129,992,848 | |
TOTAL INVESTMENT GRADE FIXED-INCOME FUNDS | 1,243,462,818 | ||
| TOTAL FIXED-INCOME CENTRAL FUNDS (Cost $1,493,285,962) | 1,395,222,423 | ||
| Money Market Central Funds - 1.6% | |||
| Shares | Value ($) | ||
| Fidelity Cash Central Fund 4.86% (b) | 36,681,989 | 36,689,325 | |
| Fidelity Securities Lending Cash Central Fund 4.87% (b)(c) | 26,148,185 | 26,150,800 | |
| TOTAL MONEY MARKET CENTRAL FUNDS (Cost $62,840,125) | 62,840,125 | ||
| U.S. Treasury Obligations - 0.4% | |||
Principal Amount (d) | Value ($) | ||
U.S. Treasury Bills, yield at date of purchase 4.41% to 4.93% 4/6/23 to 6/8/23 (e) (Cost $14,670,254) | 14,760,000 | 14,676,240 | |
| Investment Companies - 2.3% | |||
| Shares | Value ($) | ||
| iShares 20+ Year Treasury Bond ETF (f) | 371,408 | 39,506,672 | |
| iShares MSCI USA Minimum Volatility ETF | 393,568 | 28,628,136 | |
| VanEck Vectors Gold Miners ETF | 615,460 | 19,910,131 | |
| TOTAL INVESTMENT COMPANIES (Cost $92,553,846) | 88,044,939 | ||
| TOTAL INVESTMENT IN SECURITIES - 100.7% (Cost $3,252,457,877) | 3,864,375,680 |
NET OTHER ASSETS (LIABILITIES) - (0.7)% | (27,699,096) |
| NET ASSETS - 100.0% | 3,836,676,584 |
| Futures Contracts | |||||
Number of contracts | Expiration Date | Notional Amount ($) | Value ($) | Unrealized Appreciation/ (Depreciation) ($) | |
| Purchased | |||||
| Equity Index Contracts | |||||
| ICE E-mini MSCI EAFE Index Contracts (United States) | 1,190 | Jun 2023 | 124,741,750 | 5,254,517 | 5,254,517 |
| ICE E-mini MSCI Emerging Markets Index Contracts (United States) | 176 | Jun 2023 | 8,760,400 | 314,248 | 314,248 |
| TOTAL EQUITY INDEX CONTRACTS | 5,568,765 | ||||
| Treasury Contracts | |||||
| CBOT 5-Year U.S. Treasury Note Contracts (United States) | 267 | Jun 2023 | 29,238,586 | 618,987 | 618,987 |
| TOTAL PURCHASED | 6,187,752 | ||||
| Sold | |||||
| Equity Index Contracts | |||||
| CME E-mini S&P 500 Index Contracts (United States) | 778 | Jun 2023 | 160,958,475 | (9,440,236) | (9,440,236) |
| TOTAL FUTURES CONTRACTS | (3,252,484) | ||||
| The notional amount of futures purchased as a percentage of Net Assets is 4.3% | |||||
| The notional amount of futures sold as a percentage of Net Assets is 4.2% | |||||
| ETF | - | EXCHANGE-TRADED FUND |
| (a) | Affiliated fund that is generally available only to investment companies and other accounts managed by Fidelity Investments. A complete unaudited schedule of portfolio holdings for each Fidelity Central Fund is filed with the SEC for the first and third quarters of each fiscal year on Form N-PORT and is available upon request or at the SEC's website at www.sec.gov. An unaudited holdings listing for the Fund, which presents direct holdings as well as the pro-rata share of securities and other investments held indirectly through its investment in underlying non-money market Fidelity Central Funds, other than the Commodity Strategy Central Fund, is available at fidelity.com and/or institutional.fidelity.com, as applicable. In addition, each Fidelity Central Fund's financial statements are available on the SEC's website or upon request. |
| (b) | Affiliated fund that is generally available only to investment companies and other accounts managed by Fidelity Investments. The rate quoted is the annualized seven-day yield of the fund at period end. A complete unaudited listing of the fund's holdings as of its most recent quarter end is available upon request. In addition, each Fidelity Central Fund's financial statements are available on the SEC's website or upon request. |
| (c) | Investment made with cash collateral received from securities on loan. |
| (d) | Amount is stated in United States dollars unless otherwise noted. |
| (e) | Security or a portion of the security was pledged to cover margin requirements for futures contracts. At period end, the value of securities pledged amounted to $14,518,569. |
| (f) | Security or a portion of the security is on loan at period end. |
| Affiliate | Value, beginning of period ($) | Purchases ($) | Sales Proceeds ($) | Dividend Income ($) | Realized Gain (loss) ($) | Change in Unrealized appreciation (depreciation) ($) | Value, end of period ($) | % ownership, end of period |
| Fidelity Cash Central Fund 4.86% | 19,144,438 | 201,347,465 | 183,802,578 | 475,455 | - | - | 36,689,325 | 0.1% |
| Fidelity Commodity Strategy Central Fund | 87,982,827 | 2,215,393 | 48,514,823 | 935,666 | (8,350,122) | 5,989,505 | 39,322,780 | 8.5% |
| Fidelity Emerging Markets Debt Central Fund | 9,389,231 | 755,105 | 1,069,034 | 299,059 | (176,261) | 737,749 | 9,636,790 | 0.5% |
| Fidelity Emerging Markets Debt Local Currency Central Fund | 8,782,496 | 19,289,867 | - | 24,693 | - | 1,601,261 | 29,673,624 | 10.7% |
| Fidelity Emerging Markets Equity Central Fund | 224,652,096 | 45,691,562 | 10,597,527 | 3,754,103 | (2,236,590) | 34,684,090 | 292,193,631 | 12.8% |
| Fidelity Floating Rate Central Fund | 106,769,688 | 5,396,882 | 33,723,160 | 4,059,564 | (1,291,861) | 3,604,303 | 80,755,852 | 4.3% |
| Fidelity Hedged Equity Central Fund | - | 11,065,511 | - | 6,083 | - | 124,084 | 11,189,595 | 10.5% |
| Fidelity High Income Central Fund | 29,754,467 | 1,751,642 | 1,170,417 | 1,224,924 | 85,177 | 1,272,470 | 31,693,339 | 1.9% |
| Fidelity Inflation-Protected Bond Index Central Fund | 75,762,196 | 9,652,884 | 3,184,658 | 8,242,779 | (112,291) | (4,663,777) | 77,454,354 | 12.3% |
| Fidelity International Credit Central Fund | 44,027,858 | 2,528,307 | 9,253,729 | 1,820,431 | (2,609,235) | 1,322,415 | 36,015,616 | 10.2% |
| Fidelity International Equity Central Fund | 393,745,617 | 110,873,444 | 26,767,623 | 2,875,154 | (3,145,511) | 115,634,899 | 590,340,826 | 12.2% |
| Fidelity Investment Grade Bond Central Fund | 969,331,203 | 171,538,670 | 46,052,728 | 19,222,915 | (386,626) | 35,562,329 | 1,129,992,848 | 3.1% |
| Fidelity Real Estate Equity Central Fund | 23,887,449 | 794,063 | 10,373,340 | 325,651 | 94,485 | 2,000,083 | 16,402,740 | 1.7% |
| Fidelity Securities Lending Cash Central Fund 4.87% | 21,668,650 | 413,160,926 | 408,678,776 | 5,308 | - | - | 26,150,800 | 0.1% |
| Fidelity U.S. Equity Central Fund | 1,329,560,304 | 52,238,479 | 203,245,061 | 28,024,422 | 6,861,145 | 168,727,514 | 1,354,142,381 | 8.6% |
| Total | 3,344,458,520 | 1,048,300,200 | 986,433,454 | 71,296,207 | (11,267,690) | 366,596,925 | 3,761,654,501 | |
| Valuation Inputs at Reporting Date: | ||||
| Description | Total ($) | Level 1 ($) | Level 2 ($) | Level 3 ($) |
Investments in Securities: | ||||
| Equity Central Funds | 2,303,591,953 | 2,303,591,953 | - | - |
| Fixed-Income Central Funds | 1,395,222,423 | 1,395,222,423 | - | - |
| Money Market Central Funds | 62,840,125 | 62,840,125 | - | - |
| Other Short-Term Investments and Net Other Assets | 14,676,240 | - | 14,676,240 | - |
| Investment Companies | 88,044,939 | 88,044,939 | - | - |
| Total Investments in Securities: | 3,864,375,680 | 3,849,699,440 | 14,676,240 | - |
Derivative Instruments: | ||||
| Assets | ||||
Futures Contracts | 6,187,752 | 6,187,752 | - | - |
| Total Assets | 6,187,752 | 6,187,752 | - | - |
| Liabilities | ||||
Futures Contracts | (9,440,236) | (9,440,236) | - | - |
| Total Liabilities | (9,440,236) | (9,440,236) | - | - |
| Total Derivative Instruments: | (3,252,484) | (3,252,484) | - | - |
Primary Risk Exposure / Derivative Type | Value | |
| Asset ($) | Liability ($) | |
| Equity Risk | ||
Futures Contracts (a) | 5,568,765 | (9,440,236) |
| Total Equity Risk | 5,568,765 | (9,440,236) |
| Interest Rate Risk | ||
Futures Contracts (a) | 618,987 | 0 |
| Total Interest Rate Risk | 618,987 | 0 |
| Total Value of Derivatives | 6,187,752 | (9,440,236) |
| Statement of Assets and Liabilities | ||||
March 31, 2023 (Unaudited) | ||||
| Assets | ||||
| Investment in securities, at value (including securities loaned of $25,996,828) - See accompanying schedule: | ||||
Unaffiliated issuers (cost $107,224,100) | $ | 102,721,179 | ||
Fidelity Central Funds (cost $3,145,233,777) | 3,761,654,501 | |||
| Total Investment in Securities (cost $3,252,457,877) | $ | 3,864,375,680 | ||
| Receivable for investments sold | 3,067,597 | |||
| Receivable for fund shares sold | 1,076,732 | |||
| Dividends receivable | 20,528 | |||
| Distributions receivable from Fidelity Central Funds | 109,359 | |||
| Prepaid expenses | 1,903 | |||
| Other receivables | 2,381 | |||
Total assets | 3,868,654,180 | |||
| Liabilities | ||||
| Payable for investments purchased | $ | 16,823 | ||
| Payable for fund shares redeemed | 1,951,582 | |||
| Accrued management fee | 1,642,592 | |||
| Distribution and service plan fees payable | 78,244 | |||
| Payable for daily variation margin on futures contracts | 1,683,504 | |||
| Other affiliated payables | 409,625 | |||
| Other payables and accrued expenses | 44,426 | |||
| Collateral on securities loaned | 26,150,800 | |||
| Total Liabilities | 31,977,596 | |||
| Net Assets | $ | 3,836,676,584 | ||
| Net Assets consist of: | ||||
| Paid in capital | $ | 3,373,402,032 | ||
| Total accumulated earnings (loss) | 463,274,552 | |||
| Net Assets | $ | 3,836,676,584 | ||
| Net Asset Value and Maximum Offering Price | ||||
| Class A : | ||||
Net Asset Value and redemption price per share ($154,032,335 ÷ 11,300,275 shares) (a) | $ | 13.63 | ||
| Maximum offering price per share (100/94.25 of $13.63) | $ | 14.46 | ||
| Class M : | ||||
Net Asset Value and redemption price per share ($47,421,601 ÷ 3,497,728 shares) (a) | $ | 13.56 | ||
| Maximum offering price per share (100/96.50 of $13.56) | $ | 14.05 | ||
| Class C : | ||||
Net Asset Value and offering price per share ($33,320,760 ÷ 2,483,426 shares) (a) | $ | 13.42 | ||
| Asset Manager 60% : | ||||
Net Asset Value , offering price and redemption price per share ($2,114,765,906 ÷ 154,314,643 shares) | $ | 13.70 | ||
| Class I : | ||||
Net Asset Value , offering price and redemption price per share ($104,334,410 ÷ 7,609,867 shares) | $ | 13.71 | ||
| Class Z : | ||||
Net Asset Value , offering price and redemption price per share ($1,382,801,572 ÷ 100,983,087 shares) | $ | 13.69 | ||
(a)Redemption price per share is equal to net asset value less any applicable contingent deferred sales charge. | ||||
| Statement of Operations | ||||
Six months ended March 31, 2023 (Unaudited) | ||||
| Investment Income | ||||
| Dividends | $ | 1,075,222 | ||
| Interest | 270,659 | |||
| Income from Fidelity Central Funds (including $5,308 from security lending) | 49,809,255 | |||
| Total Income | 51,155,136 | |||
| Expenses | ||||
| Management fee | $ | 9,781,317 | ||
| Transfer agent fees | 1,797,243 | |||
| Distribution and service plan fees | 470,625 | |||
| Accounting fees | 621,859 | |||
| Custodian fees and expenses | 16,395 | |||
| Independent trustees' fees and expenses | 7,455 | |||
| Registration fees | 66,115 | |||
| Audit | 20,354 | |||
| Legal | 11,094 | |||
| Miscellaneous | 9,100 | |||
| Total expenses before reductions | 12,801,557 | |||
| Expense reductions | (70,299) | |||
| Total expenses after reductions | 12,731,258 | |||
| Net Investment income (loss) | 38,423,878 | |||
| Realized and Unrealized Gain (Loss) | ||||
| Net realized gain (loss) on: | ||||
| Investment Securities: | ||||
| Unaffiliated issuers | (19,968,715) | |||
| Fidelity Central Funds | (11,267,690) | |||
| Futures contracts | 13,003,786 | |||
| Capital gain distributions from Fidelity Central Funds | 21,486,952 | |||
| Total net realized gain (loss) | 3,254,333 | |||
| Change in net unrealized appreciation (depreciation) on: | ||||
| Investment Securities: | ||||
| Unaffiliated issuers | 24,372,234 | |||
| Fidelity Central Funds | 366,596,925 | |||
| Assets and liabilities in foreign currencies | 1,946 | |||
| Futures contracts | (8,689,964) | |||
| Total change in net unrealized appreciation (depreciation) | 382,281,141 | |||
| Net gain (loss) | 385,535,474 | |||
| Net increase (decrease) in net assets resulting from operations | $ | 423,959,352 | ||
| Statement of Changes in Net Assets | ||||
Six months ended March 31, 2023 (Unaudited) | Year ended September 30, 2022 | |||
| Increase (Decrease) in Net Assets | ||||
| Operations | ||||
| Net investment income (loss) | $ | 38,423,878 | $ | 77,394,423 |
| Net realized gain (loss) | 3,254,333 | 135,782,767 | ||
| Change in net unrealized appreciation (depreciation) | 382,281,141 | (1,021,962,706) | ||
| Net increase (decrease) in net assets resulting from operations | 423,959,352 | (808,785,516) | ||
| Distributions to shareholders | (156,194,680) | (114,158,802) | ||
| Share transactions - net increase (decrease) | 83,021,036 | 176,306,744 | ||
| Total increase (decrease) in net assets | 350,785,708 | (746,637,574) | ||
| Net Assets | ||||
| Beginning of period | 3,485,890,876 | 4,232,528,450 | ||
| End of period | $ | 3,836,676,584 | $ | 3,485,890,876 |
| Fidelity Advisor Asset Manager® 60% Class A |
Six months ended (Unaudited) March 31, 2023 | Years ended September 30, 2022 | 2021 | 2020 | 2019 | 2018 | |||||||
Selected Per-Share Data | ||||||||||||
| Net asset value, beginning of period | $ | 12.66 | $ | 15.88 | $ | 13.57 | $ | 12.68 | $ | 12.92 | $ | 12.42 |
| Income from Investment Operations | ||||||||||||
Net investment income (loss) A,B | .12 | .23 | .13 | .15 | .17 | .14 | ||||||
| Net realized and unrealized gain (loss) | 1.38 | (3.08) | 2.42 | 1.24 | .06 | .69 | ||||||
| Total from investment operations | 1.50 | (2.85) | 2.55 | 1.39 | .23 | .83 | ||||||
| Distributions from net investment income | (.25) | (.18) | (.12) | (.17) | (.15) | (.11) | ||||||
| Distributions from net realized gain | (.28) | (.19) | (.12) | (.33) | (.32) | (.22) | ||||||
| Total distributions | (.53) | (.37) | (.24) | (.50) | (.47) | (.33) | ||||||
| Net asset value, end of period | $ | 13.63 | $ | 12.66 | $ | 15.88 | $ | 13.57 | $ | 12.68 | $ | 12.92 |
Total Return C,D,E | 12.08% | (18.47)% | 18.90% | 11.13% | 2.24% | 6.80% | ||||||
Ratios to Average Net Assets B,F,G | ||||||||||||
| Expenses before reductions | 1.00% H | .99% | .99% | 1.00% | 1.02% | 1.02% | ||||||
| Expenses net of fee waivers, if any | .99% H | .99% | .99% | 1.00% | 1.01% | 1.01% | ||||||
| Expenses net of all reductions | .99% H | .99% | .99% | 1.00% | 1.01% | 1.01% | ||||||
| Net investment income (loss) | 1.76% H | 1.55% | .84% | 1.19% | 1.40% | 1.12% | ||||||
| Supplemental Data | ||||||||||||
| Net assets, end of period (000 omitted) | $ | 154,032 | $ | 138,958 | $ | 167,442 | $ | 129,967 | $ | 128,269 | $ | 130,729 |
Portfolio turnover rate I | 27% H | 23% | 19% | 29% | 39% | 18% J |
| Fidelity Advisor Asset Manager® 60% Class M |
Six months ended (Unaudited) March 31, 2023 | Years ended September 30, 2022 | 2021 | 2020 | 2019 | 2018 | |||||||
Selected Per-Share Data | ||||||||||||
| Net asset value, beginning of period | $ | 12.58 | $ | 15.78 | $ | 13.48 | $ | 12.60 | $ | 12.84 | $ | 12.34 |
| Income from Investment Operations | ||||||||||||
Net investment income (loss) A,B | .10 | .19 | .09 | .12 | .14 | .11 | ||||||
| Net realized and unrealized gain (loss) | 1.38 | (3.07) | 2.41 | 1.22 | .06 | .70 | ||||||
| Total from investment operations | 1.48 | (2.88) | 2.50 | 1.34 | .20 | .81 | ||||||
| Distributions from net investment income | (.22) | (.13) | (.08) | (.13) | (.12) | (.08) | ||||||
| Distributions from net realized gain | (.28) | (.19) | (.12) | (.33) | (.32) | (.22) | ||||||
| Total distributions | (.50) | (.32) | (.20) | (.46) | (.44) | (.31) C | ||||||
| Net asset value, end of period | $ | 13.56 | $ | 12.58 | $ | 15.78 | $ | 13.48 | $ | 12.60 | $ | 12.84 |
Total Return D,E,F | 11.95% | (18.67)% | 18.67% | 10.83% | 2.01% | 6.60% | ||||||
Ratios to Average Net Assets B,G,H | ||||||||||||
| Expenses before reductions | 1.24% I | 1.23% | 1.24% | 1.26% | 1.28% | 1.28% | ||||||
| Expenses net of fee waivers, if any | 1.23% I | 1.23% | 1.24% | 1.25% | 1.25% | 1.26% | ||||||
| Expenses net of all reductions | 1.23% I | 1.23% | 1.24% | 1.25% | 1.25% | 1.26% | ||||||
| Net investment income (loss) | 1.52% I | 1.31% | .59% | .94% | 1.15% | .87% | ||||||
| Supplemental Data | ||||||||||||
| Net assets, end of period (000 omitted) | $ | 47,422 | $ | 43,630 | $ | 54,174 | $ | 49,060 | $ | 49,997 | $ | 55,343 |
Portfolio turnover rate J | 27% I | 23% | 19% | 29% | 39% | 18% K |
| Fidelity Advisor Asset Manager® 60% Class C |
Six months ended (Unaudited) March 31, 2023 | Years ended September 30, 2022 | 2021 | 2020 | 2019 | 2018 | |||||||
Selected Per-Share Data | ||||||||||||
| Net asset value, beginning of period | $ | 12.39 | $ | 15.55 | $ | 13.29 | $ | 12.42 | $ | 12.67 | $ | 12.18 |
| Income from Investment Operations | ||||||||||||
Net investment income (loss) A,B | .07 | .12 | .01 | .05 | .08 | .05 | ||||||
| Net realized and unrealized gain (loss) | 1.36 | (3.05) | 2.38 | 1.21 | .06 | .69 | ||||||
| Total from investment operations | 1.43 | (2.93) | 2.39 | 1.26 | .14 | .74 | ||||||
| Distributions from net investment income | (.12) | (.04) | - C | (.06) | (.07) | (.02) | ||||||
| Distributions from net realized gain | (.28) | (.19) | (.12) | (.33) | (.32) | (.22) | ||||||
| Total distributions | (.40) | (.23) | (.13) D | (.39) | (.39) | (.25) D | ||||||
| Net asset value, end of period | $ | 13.42 | $ | 12.39 | $ | 15.55 | $ | 13.29 | $ | 12.42 | $ | 12.67 |
Total Return E,F,G | 11.72% | (19.15)% | 18.02% | 10.29% | 1.47% | 6.09% | ||||||
Ratios to Average Net Assets B,H,I | ||||||||||||
| Expenses before reductions | 1.77% J | 1.75% | 1.77% | 1.79% | 1.81% | 1.79% | ||||||
| Expenses net of fee waivers, if any | 1.76% J | 1.75% | 1.77% | 1.76% | 1.76% | 1.76% | ||||||
| Expenses net of all reductions | 1.76% J | 1.75% | 1.77% | 1.76% | 1.76% | 1.76% | ||||||
| Net investment income (loss) | .99% J | .79% | .06% | .42% | .64% | .37% | ||||||
| Supplemental Data | ||||||||||||
| Net assets, end of period (000 omitted) | $ | 33,321 | $ | 32,289 | $ | 55,262 | $ | 61,950 | $ | 67,955 | $ | 86,887 |
Portfolio turnover rate K | 27% J | 23% | 19% | 29% | 39% | 18% L |
| Fidelity Asset Manager® 60% |
Six months ended (Unaudited) March 31, 2023 | Years ended September 30, 2022 | 2021 | 2020 | 2019 | 2018 | |||||||
Selected Per-Share Data | ||||||||||||
| Net asset value, beginning of period | $ | 12.75 | $ | 15.98 | $ | 13.65 | $ | 12.75 | $ | 12.98 | $ | 12.47 |
| Income from Investment Operations | ||||||||||||
Net investment income (loss) A,B | .14 | .28 | .18 | .19 | .21 | .18 | ||||||
| Net realized and unrealized gain (loss) | 1.39 | (3.10) | 2.43 | 1.25 | .06 | .70 | ||||||
| Total from investment operations | 1.53 | (2.82) | 2.61 | 1.44 | .27 | .88 | ||||||
| Distributions from net investment income | (.29) | (.22) | (.16) | (.21) | (.18) | (.15) | ||||||
| Distributions from net realized gain | (.28) | (.19) | (.12) | (.33) | (.32) | (.22) | ||||||
| Total distributions | (.58) C | (.41) | (.28) | (.54) | (.50) | (.37) | ||||||
| Net asset value, end of period | $ | 13.70 | $ | 12.75 | $ | 15.98 | $ | 13.65 | $ | 12.75 | $ | 12.98 |
Total Return D,E | 12.20% | (18.20)% | 19.28% | 11.50% | 2.60% | 7.17% | ||||||
Ratios to Average Net Assets B,F,G | ||||||||||||
| Expenses before reductions | .69% H | .67% | .67% | .69% | .70% | .70% | ||||||
| Expenses net of fee waivers, if any | .68% H | .67% | .67% | .68% | .69% | .70% | ||||||
| Expenses net of all reductions | .68% H | .67% | .67% | .68% | .69% | .70% | ||||||
| Net investment income (loss) | 2.07% H | 1.87% | 1.15% | 1.51% | 1.71% | 1.44% | ||||||
| Supplemental Data | ||||||||||||
| Net assets, end of period (000 omitted) | $ | 2,114,766 | $ | 1,935,217 | $ | 2,427,382 | $ | 2,950,010 | $ | 2,727,092 | $ | 2,679,353 |
Portfolio turnover rate I | 27% H | 23% | 19% | 29% | 39% | 18% J |
| Fidelity Advisor Asset Manager® 60% Class I |
Six months ended (Unaudited) March 31, 2023 | Years ended September 30, 2022 | 2021 | 2020 | 2019 | 2018 | |||||||
Selected Per-Share Data | ||||||||||||
| Net asset value, beginning of period | $ | 12.75 | $ | 15.99 | $ | 13.66 | $ | 12.76 | $ | 12.99 | $ | 12.48 |
| Income from Investment Operations | ||||||||||||
Net investment income (loss) A,B | .14 | .27 | .17 | .19 | .21 | .18 | ||||||
| Net realized and unrealized gain (loss) | 1.39 | (3.10) | 2.43 | 1.24 | .05 | .70 | ||||||
| Total from investment operations | 1.53 | (2.83) | 2.60 | 1.43 | .26 | .88 | ||||||
| Distributions from net investment income | (.29) | (.22) | (.15) | (.20) | (.17) | (.14) | ||||||
| Distributions from net realized gain | (.28) | (.19) | (.12) | (.33) | (.32) | (.22) | ||||||
| Total distributions | (.57) | (.41) | (.27) | (.53) | (.49) | (.37) C | ||||||
| Net asset value, end of period | $ | 13.71 | $ | 12.75 | $ | 15.99 | $ | 13.66 | $ | 12.76 | $ | 12.99 |
Total Return D,E | 12.21% | (18.27)% | 19.20% | 11.44% | 2.56% | 7.12% | ||||||
Ratios to Average Net Assets B,F,G | ||||||||||||
| Expenses before reductions | .75% H | .74% | .74% | .74% | .75% | .75% | ||||||
| Expenses net of fee waivers, if any | .74% H | .73% | .74% | .73% | .73% | .74% | ||||||
| Expenses net of all reductions | .74% H | .73% | .74% | .73% | .73% | .74% | ||||||
| Net investment income (loss) | 2.01% H | 1.81% | 1.09% | 1.46% | 1.67% | 1.39% | ||||||
| Supplemental Data | ||||||||||||
| Net assets, end of period (000 omitted) | $ | 104,334 | $ | 95,499 | $ | 115,782 | $ | 51,429 | $ | 55,379 | $ | 63,604 |
Portfolio turnover rate I | 27% H | 23% | 19% | 29% | 39% | 18% J |
| Fidelity Advisor Asset Manager® 60% Class Z |
Six months ended (Unaudited) March 31, 2023 | Years ended September 30, 2022 | 2021 | 2020 | 2019 A | ||||||
Selected Per-Share Data | ||||||||||
| Net asset value, beginning of period | $ | 12.74 | $ | 15.98 | $ | 13.65 | $ | 12.76 | $ | 12.97 |
| Income from Investment Operations | ||||||||||
Net investment income (loss) B,C | .14 | .29 | .19 | .20 | .22 | |||||
| Net realized and unrealized gain (loss) | 1.40 | (3.10) | 2.43 | 1.24 | .08 | |||||
| Total from investment operations | 1.54 | (2.81) | 2.62 | 1.44 | .30 | |||||
| Distributions from net investment income | (.31) | (.24) | (.17) | (.22) | (.19) | |||||
| Distributions from net realized gain | (.28) | (.19) | (.12) | (.33) | (.32) | |||||
| Total distributions | (.59) | (.43) | (.29) | (.55) | (.51) | |||||
| Net asset value, end of period | $ | 13.69 | $ | 12.74 | $ | 15.98 | $ | 13.65 | $ | 12.76 |
Total Return D,E | 12.30% | (18.17)% | 19.35% | 11.50% | 2.86% | |||||
Ratios to Average Net Assets C,F,G | ||||||||||
| Expenses before reductions | .61% H | .60% | .61% | .62% | .63% H | |||||
| Expenses net of fee waivers, if any | .61% H | .60% | .61% | .62% | .63% H | |||||
| Expenses net of all reductions | .61% H | .60% | .61% | .62% | .63% H | |||||
| Net investment income (loss) | 2.15% H | 1.94% | 1.22% | 1.57% | 1.77% H | |||||
| Supplemental Data | ||||||||||
| Net assets, end of period (000 omitted) | $ | 1,382,802 | $ | 1,240,298 | $ | 1,412,486 | $ | 22,117 | $ | 19,124 |
Portfolio turnover rate I | 27% H | 23% | 19% | 29% | 39% |
Top Holdings (% of Fund's net assets) | ||
| Apple, Inc. | 3.0 | |
| Microsoft Corp. | 2.9 | |
| Alphabet, Inc. Class A | 1.5 | |
| Amazon.com, Inc. | 1.1 | |
| iShares 20+ Year Treasury Bond ETF | 1.0 | |
| Exxon Mobil Corp. | 0.8 | |
| Taiwan Semiconductor Manufacturing Co. Ltd. | 0.8 | |
| iShares MSCI USA Minimum Volatility ETF | 0.8 | |
| Meta Platforms, Inc. Class A | 0.6 | |
| LVMH Moet Hennessy Louis Vuitton SE | 0.5 | |
| 13.0 | ||
| Market Sectors (% of Fund's net assets) | ||
| Financials | 16.6 | |
| Information Technology | 14.2 | |
| Health Care | 8.6 | |
| Consumer Discretionary | 8.6 | |
| Industrials | 8.5 | |
| Communication Services | 5.4 | |
| Consumer Staples | 5.3 | |
| Energy | 3.9 | |
| Materials | 3.4 | |
| Real Estate | 2.4 | |
| Utilities | 1.7 | |
| Financial Services | 0.1 | |
Quality Diversification (% of Fund's net assets) |
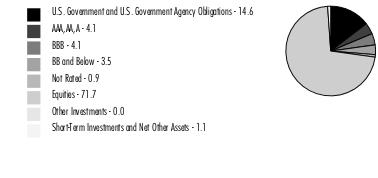 |
Percentages shown as 0.0% may reflect amounts less than 0.05%. |
| We have used ratings from Moody's Investors Service, Inc. Where Moody's® ratings are not available, we have used S&P® ratings. All ratings are as of the date indicated and do not reflect subsequent changes. |
Asset Allocation (% of Fund's net assets) |
 |
Short-Term Class* - (1.8)% |
Geographic Diversification (% of Fund's net assets) |
 |
* Includes Short-Term investments and Net Other Assets (Liabilities). Percentages are based on country or territory of incorporation and are adjusted for the effect of derivatives, if applicable. |
| Equity Central Funds - 70.3% | |||
| Shares | Value ($) | ||
| Fidelity Commodity Strategy Central Fund (a) | 802,323 | 77,600,706 | |
| Fidelity Emerging Markets Equity Central Fund (a) | 2,827,973 | 544,724,118 | |
| Fidelity Hedged Equity Central Fund (a) | 177,946 | 17,993,936 | |
| Fidelity International Equity Central Fund (a) | 12,279,902 | 1,124,102,214 | |
| Fidelity Real Estate Equity Central Fund (a) | 217,866 | 26,255,055 | |
| Fidelity U.S. Equity Central Fund (a) | 22,813,471 | 2,553,055,517 | |
| TOTAL EQUITY CENTRAL FUNDS (Cost $2,510,835,993) | 4,343,731,546 | ||
| Fixed-Income Central Funds - 25.8% | |||
| Shares | Value ($) | ||
| High Yield Fixed-Income Funds - 3.9% | |||
| Fidelity Emerging Markets Debt Central Fund (a) | 3,912,607 | 29,618,432 | |
| Fidelity Emerging Markets Debt Local Currency Central Fund (a) | 537,533 | 47,888,825 | |
| Fidelity Floating Rate Central Fund (a) | 1,201,187 | 115,650,316 | |
| Fidelity High Income Central Fund (a) | 498,584 | 51,035,010 | |
TOTAL HIGH YIELD FIXED-INCOME FUNDS | 244,192,583 | ||
| Investment Grade Fixed-Income Funds - 21.9% | |||
| Fidelity Inflation-Protected Bond Index Central Fund (a) | 1,374,010 | 124,237,994 | |
| Fidelity International Credit Central Fund (a) | 741,695 | 57,666,781 | |
| Fidelity Investment Grade Bond Central Fund (a) | 11,808,336 | 1,169,025,283 | |
TOTAL INVESTMENT GRADE FIXED-INCOME FUNDS | 1,350,930,058 | ||
| TOTAL FIXED-INCOME CENTRAL FUNDS (Cost $1,675,123,299) | 1,595,122,641 | ||
| Money Market Central Funds - 2.3% | |||
| Shares | Value ($) | ||
| Fidelity Cash Central Fund 4.86% (b) | 79,381,657 | 79,397,534 | |
| Fidelity Securities Lending Cash Central Fund 4.87% (b)(c) | 63,177,182 | 63,183,500 | |
| TOTAL MONEY MARKET CENTRAL FUNDS (Cost $142,581,034) | 142,581,034 | ||
| U.S. Treasury Obligations - 0.4% | |||
Principal Amount (d) | Value ($) | ||
U.S. Treasury Bills, yield at date of purchase 4.41% to 4.93% 4/6/23 to 6/8/23 (e) (Cost $23,696,285) | 23,880,000 | 23,709,602 | |
| Investment Companies - 2.3% | |||
| Shares | Value ($) | ||
| iShares 20+ Year Treasury Bond ETF (f) | 590,566 | 62,818,506 | |
| iShares MSCI USA Minimum Volatility ETF | 638,852 | 46,470,094 | |
| VanEck Vectors Gold Miners ETF | 999,102 | 32,320,950 | |
| TOTAL INVESTMENT COMPANIES (Cost $150,630,917) | 141,609,550 | ||
| TOTAL INVESTMENT IN SECURITIES - 101.1% (Cost $4,502,867,528) | 6,246,754,373 |
NET OTHER ASSETS (LIABILITIES) - (1.1)% | (70,000,809) |
| NET ASSETS - 100.0% | 6,176,753,564 |
| Futures Contracts | |||||
Number of contracts | Expiration Date | Notional Amount ($) | Value ($) | Unrealized Appreciation/ (Depreciation) ($) | |
| Purchased | |||||
| Equity Index Contracts | |||||
| ICE E-mini MSCI EAFE Index Contracts (United States) | 1,972 | Jun 2023 | 206,714,900 | 8,707,463 | 8,707,463 |
| ICE E-mini MSCI Emerging Markets Index Contracts (United States) | 184 | Jun 2023 | 9,158,600 | 328,549 | 328,549 |
| TOTAL EQUITY INDEX CONTRACTS | 9,036,012 | ||||
| Treasury Contracts | |||||
| CBOT 5-Year U.S. Treasury Note Contracts (United States) | 432 | Jun 2023 | 47,307,375 | 1,001,507 | 1,001,507 |
| TOTAL PURCHASED | 10,037,519 | ||||
| Sold | |||||
| Equity Index Contracts | |||||
| CME E-mini S&P 500 Index Contracts (United States) | 1,266 | Jun 2023 | 261,919,575 | (15,361,618) | (15,361,618) |
| TOTAL FUTURES CONTRACTS | (5,324,099) | ||||
| The notional amount of futures purchased as a percentage of Net Assets is 4.2% | |||||
| The notional amount of futures sold as a percentage of Net Assets is 4.2% | |||||
| ETF | - | EXCHANGE-TRADED FUND |
| (a) | Affiliated fund that is generally available only to investment companies and other accounts managed by Fidelity Investments. A complete unaudited schedule of portfolio holdings for each Fidelity Central Fund is filed with the SEC for the first and third quarters of each fiscal year on Form N-PORT and is available upon request or at the SEC's website at www.sec.gov. An unaudited holdings listing for the Fund, which presents direct holdings as well as the pro-rata share of securities and other investments held indirectly through its investment in underlying non-money market Fidelity Central Funds, other than the Commodity Strategy Central Fund, is available at fidelity.com and/or institutional.fidelity.com, as applicable. In addition, each Fidelity Central Fund's financial statements are available on the SEC's website or upon request. |
| (b) | Affiliated fund that is generally available only to investment companies and other accounts managed by Fidelity Investments. The rate quoted is the annualized seven-day yield of the fund at period end. A complete unaudited listing of the fund's holdings as of its most recent quarter end is available upon request. In addition, each Fidelity Central Fund's financial statements are available on the SEC's website or upon request. |
| (c) | Investment made with cash collateral received from securities on loan. |
| (d) | Amount is stated in United States dollars unless otherwise noted. |
| (e) | Security or a portion of the security was pledged to cover margin requirements for futures contracts. At period end, the value of securities pledged amounted to $23,460,469. |
| (f) | Security or a portion of the security is on loan at period end. |
| Affiliate | Value, beginning of period ($) | Purchases ($) | Sales Proceeds ($) | Dividend Income ($) | Realized Gain (loss) ($) | Change in Unrealized appreciation (depreciation) ($) | Value, end of period ($) | % ownership, end of period |
| Fidelity Cash Central Fund 4.86% | 31,878,883 | 326,194,493 | 278,675,842 | 809,722 | - | - | 79,397,534 | 0.2% |
| Fidelity Commodity Strategy Central Fund | 140,326,756 | 3,115,048 | 61,657,312 | 1,498,478 | (11,470,921) | 7,287,135 | 77,600,706 | 16.7% |
| Fidelity Emerging Markets Debt Central Fund | 28,301,729 | 1,582,454 | 1,955,119 | 912,411 | (162,555) | 1,851,923 | 29,618,432 | 1.4% |
| Fidelity Emerging Markets Debt Local Currency Central Fund | 14,887,808 | 30,337,378 | - | 40,744 | - | 2,663,639 | 47,888,825 | 17.3% |
| Fidelity Emerging Markets Equity Central Fund | 418,358,762 | 81,166,941 | 15,767,062 | 7,101,752 | (2,949,378) | 63,914,855 | 544,724,118 | 23.9% |
| Fidelity Floating Rate Central Fund | 155,147,748 | 8,036,758 | 51,068,508 | 6,169,364 | (1,748,827) | 5,283,145 | 115,650,316 | 6.2% |
| Fidelity Hedged Equity Central Fund | - | 17,794,397 | - | 9,782 | - | 199,539 | 17,993,936 | 16.9% |
| Fidelity High Income Central Fund | 47,825,594 | 2,558,962 | 1,528,592 | 1,974,451 | (4,107) | 2,183,153 | 51,035,010 | 3.1% |
| Fidelity Inflation-Protected Bond Index Central Fund | 121,276,414 | 14,813,135 | 4,159,306 | 13,249,431 | (225,148) | (7,467,101) | 124,237,994 | 19.8% |
| Fidelity International Credit Central Fund | 72,088,262 | 3,713,617 | 16,024,973 | 2,931,044 | (4,669,749) | 2,559,624 | 57,666,781 | 16.3% |
| Fidelity International Equity Central Fund | 787,786,717 | 146,295,179 | 35,014,934 | 5,617,211 | (1,004,454) | 226,039,706 | 1,124,102,214 | 23.1% |
| Fidelity Investment Grade Bond Central Fund | 920,418,876 | 256,015,409 | 41,903,417 | 19,383,402 | (471,938) | 34,966,353 | 1,169,025,283 | 3.2% |
| Fidelity Real Estate Equity Central Fund | 38,168,175 | 1,058,773 | 16,315,795 | 523,283 | 147,822 | 3,196,080 | 26,255,055 | 2.7% |
| Fidelity Securities Lending Cash Central Fund 4.87% | 63,992,200 | 913,039,769 | 913,848,469 | 13,392 | - | - | 63,183,500 | 0.2% |
| Fidelity U.S. Equity Central Fund | 2,468,179,513 | 84,250,577 | 325,240,815 | 52,312,016 | 6,566,437 | 319,299,805 | 2,553,055,517 | 16.2% |
| Total | 5,308,637,437 | 1,889,972,890 | 1,763,160,144 | 112,546,483 | (15,992,818) | 661,977,856 | 6,081,435,221 | |
| Valuation Inputs at Reporting Date: | ||||
| Description | Total ($) | Level 1 ($) | Level 2 ($) | Level 3 ($) |
Investments in Securities: | ||||
| Equity Central Funds | 4,343,731,546 | 4,343,731,546 | - | - |
| Fixed-Income Central Funds | 1,595,122,641 | 1,595,122,641 | - | - |
| Money Market Central Funds | 142,581,034 | 142,581,034 | - | - |
| Other Short-Term Investments and Net Other Assets | 23,709,602 | - | 23,709,602 | - |
| Investment Companies | 141,609,550 | 141,609,550 | - | - |
| Total Investments in Securities: | 6,246,754,373 | 6,223,044,771 | 23,709,602 | - |
Derivative Instruments: | ||||
| Assets | ||||
Futures Contracts | 10,037,519 | 10,037,519 | - | - |
| Total Assets | 10,037,519 | 10,037,519 | - | - |
| Liabilities | ||||
Futures Contracts | (15,361,618) | (15,361,618) | - | - |
| Total Liabilities | (15,361,618) | (15,361,618) | - | - |
| Total Derivative Instruments: | (5,324,099) | (5,324,099) | - | - |
Primary Risk Exposure / Derivative Type | Value | |
| Asset ($) | Liability ($) | |
| Equity Risk | ||
Futures Contracts (a) | 9,036,012 | (15,361,618) |
| Total Equity Risk | 9,036,012 | (15,361,618) |
| Interest Rate Risk | ||
Futures Contracts (a) | 1,001,507 | 0 |
| Total Interest Rate Risk | 1,001,507 | 0 |
| Total Value of Derivatives | 10,037,519 | (15,361,618) |
| Statement of Assets and Liabilities | ||||
March 31, 2023 (Unaudited) | ||||
| Assets | ||||
| Investment in securities, at value (including securities loaned of $62,811,485) - See accompanying schedule: | ||||
Unaffiliated issuers (cost $174,327,202) | $ | 165,319,152 | ||
Fidelity Central Funds (cost $4,328,540,326) | 6,081,435,221 | |||
| Total Investment in Securities (cost $4,502,867,528) | $ | 6,246,754,373 | ||
| Receivable for investments sold | 3,968,165 | |||
| Receivable for fund shares sold | 1,897,385 | |||
| Distributions receivable from Fidelity Central Funds | 241,151 | |||
| Prepaid expenses | 3,017 | |||
| Other receivables | 4,191 | |||
Total assets | 6,252,868,282 | |||
| Liabilities | ||||
| Payable to custodian bank | $ | 4,826,731 | ||
| Payable for investments purchased | 50,521 | |||
| Payable for fund shares redeemed | 1,939,938 | |||
| Accrued management fee | 2,643,234 | |||
| Distribution and service plan fees payable | 96,265 | |||
| Payable for daily variation margin on futures contracts | 2,712,100 | |||
| Other affiliated payables | 619,296 | |||
| Other payables and accrued expenses | 43,133 | |||
| Collateral on securities loaned | 63,183,500 | |||
| Total Liabilities | 76,114,718 | |||
| Net Assets | $ | 6,176,753,564 | ||
| Net Assets consist of: | ||||
| Paid in capital | $ | 4,891,400,434 | ||
| Total accumulated earnings (loss) | 1,285,353,130 | |||
| Net Assets | $ | 6,176,753,564 | ||
| Net Asset Value and Maximum Offering Price | ||||
| Class A : | ||||
Net Asset Value and redemption price per share ($204,361,390 ÷ 8,576,342 shares) (a) | $ | 23.83 | ||
| Maximum offering price per share (100/94.25 of $23.83) | $ | 25.28 | ||
| Class M : | ||||
Net Asset Value and redemption price per share ($69,398,107 ÷ 2,911,401 shares) (a) | $ | 23.84 | ||
| Maximum offering price per share (100/96.50 of $23.84) | $ | 24.70 | ||
| Class C : | ||||
Net Asset Value and offering price per share ($32,226,030 ÷ 1,355,991 shares) (a) | $ | 23.77 | ||
| Asset Manager 70% : | ||||
Net Asset Value , offering price and redemption price per share ($3,854,707,235 ÷ 161,370,473 shares) | $ | 23.89 | ||
| Class I : | ||||
Net Asset Value , offering price and redemption price per share ($48,985,927 ÷ 2,049,266 shares) | $ | 23.90 | ||
| Class Z : | ||||
Net Asset Value , offering price and redemption price per share ($1,967,074,875 ÷ 82,485,032 shares) | $ | 23.85 | ||
(a)Redemption price per share is equal to net asset value less any applicable contingent deferred sales charge. | ||||
| Statement of Operations | ||||
Six months ended March 31, 2023 (Unaudited) | ||||
| Investment Income | ||||
| Dividends | $ | 1,979,272 | ||
| Interest | 428,639 | |||
| Income from Fidelity Central Funds (including $13,392 from security lending) | 73,029,997 | |||
| Total Income | 75,437,908 | |||
| Expenses | ||||
| Management fee | $ | 15,708,811 | ||
| Transfer agent fees | 2,968,567 | |||
| Distribution and service plan fees | 569,671 | |||
| Accounting fees | 667,982 | |||
| Custodian fees and expenses | 17,752 | |||
| Independent trustees' fees and expenses | 11,928 | |||
| Registration fees | 57,958 | |||
| Audit | 24,745 | |||
| Legal | 10,841 | |||
| Miscellaneous | 14,514 | |||
| Total expenses before reductions | 20,052,769 | |||
| Expense reductions | (112,196) | |||
| Total expenses after reductions | 19,940,573 | |||
| Net Investment income (loss) | 55,497,335 | |||
| Realized and Unrealized Gain (Loss) | ||||
| Net realized gain (loss) on: | ||||
| Investment Securities: | ||||
| Unaffiliated issuers | (37,132,912) | |||
| Fidelity Central Funds | (15,992,818) | |||
| Futures contracts | 18,609,561 | |||
| Capital gain distributions from Fidelity Central Funds | 39,516,486 | |||
| Total net realized gain (loss) | 5,000,317 | |||
| Change in net unrealized appreciation (depreciation) on: | ||||
| Investment Securities: | ||||
| Unaffiliated issuers | 45,013,138 | |||
| Fidelity Central Funds | 661,977,856 | |||
| Futures contracts | (16,865,632) | |||
| Total change in net unrealized appreciation (depreciation) | 690,125,362 | |||
| Net gain (loss) | 695,125,679 | |||
| Net increase (decrease) in net assets resulting from operations | $ | 750,623,014 | ||
| Statement of Changes in Net Assets | ||||
Six months ended March 31, 2023 (Unaudited) | Year ended September 30, 2022 | |||
| Increase (Decrease) in Net Assets | ||||
| Operations | ||||
| Net investment income (loss) | $ | 55,497,335 | $ | 118,820,892 |
| Net realized gain (loss) | 5,000,317 | 351,046,181 | ||
| Change in net unrealized appreciation (depreciation) | 690,125,362 | (1,801,796,030) | ||
| Net increase (decrease) in net assets resulting from operations | 750,623,014 | (1,331,928,957) | ||
| Distributions to shareholders | (369,551,537) | (197,081,541) | ||
| Share transactions - net increase (decrease) | 263,622,022 | 166,143,423 | ||
| Total increase (decrease) in net assets | 644,693,499 | (1,362,867,075) | ||
| Net Assets | ||||
| Beginning of period | 5,532,060,065 | 6,894,927,140 | ||
| End of period | $ | 6,176,753,564 | $ | 5,532,060,065 |
| Fidelity Advisor Asset Manager® 70% Class A |
Six months ended (Unaudited) March 31, 2023 | Years ended September 30, 2022 | 2021 | 2020 | 2019 | 2018 | |||||||
Selected Per-Share Data | ||||||||||||
| Net asset value, beginning of period | $ | 22.33 | $ | 28.33 | $ | 23.67 | $ | 22.21 | $ | 23.27 | $ | 22.26 |
| Income from Investment Operations | ||||||||||||
Net investment income (loss) A,B | .18 | .40 | .21 | .25 | .27 | .23 | ||||||
| Net realized and unrealized gain (loss) | 2.76 | (5.69) | 4.95 | 2.32 | (.17) | 1.59 | ||||||
| Total from investment operations | 2.94 | (5.29) | 5.16 | 2.57 | .10 | 1.82 | ||||||
| Distributions from net investment income | (.42) | (.31) | (.18) | (.28) | (.25) | (.19) | ||||||
| Distributions from net realized gain | (1.02) | (.40) | (.32) | (.83) | (.91) | (.62) | ||||||
| Total distributions | (1.44) | (.71) | (.50) | (1.11) | (1.16) | (.81) | ||||||
| Net asset value, end of period | $ | 23.83 | $ | 22.33 | $ | 28.33 | $ | 23.67 | $ | 22.21 | $ | 23.27 |
Total Return C,D,E | 13.51% | (19.23)% | 21.99% | 11.81% | 1.16% | 8.31% | ||||||
Ratios to Average Net Assets B,F,G | ||||||||||||
| Expenses before reductions | .97% H | .96% | .96% | .99% | 1.00% | 1.00% | ||||||
| Expenses net of fee waivers, if any | .96% H | .96% | .96% | .98% | 1.00% | 1.00% | ||||||
| Expenses net of all reductions | .96% H | .96% | .96% | .98% | 1.00% | 1.00% | ||||||
| Net investment income (loss) | 1.57% H | 1.50% | .76% | 1.11% | 1.25% | .99% | ||||||
| Supplemental Data | ||||||||||||
| Net assets, end of period (000 omitted) | $ | 204,361 | $ | 179,830 | $ | 219,595 | $ | 179,404 | $ | 166,280 | $ | 155,622 |
Portfolio turnover rate I | 25% H | 23% | 20% | 27% | 41% | 21% |
| Fidelity Advisor Asset Manager® 70% Class M |
Six months ended (Unaudited) March 31, 2023 | Years ended September 30, 2022 | 2021 | 2020 | 2019 | 2018 | |||||||
Selected Per-Share Data | ||||||||||||
| Net asset value, beginning of period | $ | 22.30 | $ | 28.30 | $ | 23.65 | $ | 22.19 | $ | 23.24 | $ | 22.25 |
| Income from Investment Operations | ||||||||||||
Net investment income (loss) A,B | .16 | .33 | .14 | .19 | .22 | .17 | ||||||
| Net realized and unrealized gain (loss) | 2.75 | (5.69) | 4.96 | 2.33 | (.17) | 1.58 | ||||||
| Total from investment operations | 2.91 | (5.36) | 5.10 | 2.52 | .05 | 1.75 | ||||||
| Distributions from net investment income | (.35) | (.24) | (.13) | (.23) | (.19) | (.14) | ||||||
| Distributions from net realized gain | (1.02) | (.40) | (.32) | (.83) | (.91) | (.62) | ||||||
| Total distributions | (1.37) | (.64) | (.45) | (1.06) | (1.10) | (.76) | ||||||
| Net asset value, end of period | $ | 23.84 | $ | 22.30 | $ | 28.30 | $ | 23.65 | $ | 22.19 | $ | 23.24 |
Total Return C,D,E | 13.38% | (19.45)% | 21.71% | 11.56% | .90% | 7.99% | ||||||
Ratios to Average Net Assets B,F,G | ||||||||||||
| Expenses before reductions | 1.21% H | 1.21% | 1.21% | 1.23% | 1.24% | 1.25% | ||||||
| Expenses net of fee waivers, if any | 1.21% H | 1.20% | 1.21% | 1.23% | 1.24% | 1.25% | ||||||
| Expenses net of all reductions | 1.21% H | 1.20% | 1.21% | 1.23% | 1.24% | 1.25% | ||||||
| Net investment income (loss) | 1.32% H | 1.25% | .51% | .87% | 1.01% | .74% | ||||||
| Supplemental Data | ||||||||||||
| Net assets, end of period (000 omitted) | $ | 69,398 | $ | 62,915 | $ | 80,784 | $ | 69,250 | $ | 63,064 | $ | 61,587 |
Portfolio turnover rate I | 25% H | 23% | 20% | 27% | 41% | 21% |
| Fidelity Advisor Asset Manager® 70% Class C |
Six months ended (Unaudited) March 31, 2023 | Years ended September 30, 2022 | 2021 | 2020 | 2019 | 2018 | |||||||
Selected Per-Share Data | ||||||||||||
| Net asset value, beginning of period | $ | 22.18 | $ | 28.12 | $ | 23.50 | $ | 22.03 | $ | 23.06 | $ | 22.08 |
| Income from Investment Operations | ||||||||||||
Net investment income (loss) A,B | .09 | .19 | - C | .08 | .11 | .05 | ||||||
| Net realized and unrealized gain (loss) | 2.74 | (5.66) | 4.94 | 2.30 | (.15) | 1.57 | ||||||
| Total from investment operations | 2.83 | (5.47) | 4.94 | 2.38 | (.04) | 1.62 | ||||||
| Distributions from net investment income | (.22) | (.07) | - | (.08) | (.07) | (.03) | ||||||
| Distributions from net realized gain | (1.02) | (.40) | (.32) | (.83) | (.91) | (.62) | ||||||
| Total distributions | (1.24) | (.47) | (.32) | (.91) | (.99) D | (.64) D | ||||||
| Net asset value, end of period | $ | 23.77 | $ | 22.18 | $ | 28.12 | $ | 23.50 | $ | 22.03 | $ | 23.06 |
Total Return E,F,G | 13.06% | (19.84)% | 21.12% | 10.98% | .42% | 7.46% | ||||||
Ratios to Average Net Assets B,H,I | ||||||||||||
| Expenses before reductions | 1.73% J | 1.72% | 1.72% | 1.74% | 1.75% | 1.75% | ||||||
| Expenses net of fee waivers, if any | 1.72% J | 1.72% | 1.72% | 1.74% | 1.75% | 1.75% | ||||||
| Expenses net of all reductions | 1.72% J | 1.72% | 1.72% | 1.74% | 1.75% | 1.75% | ||||||
| Net investment income (loss) | .81% J | .74% | -% K | .36% | .50% | .24% | ||||||
| Supplemental Data | ||||||||||||
| Net assets, end of period (000 omitted) | $ | 32,226 | $ | 29,116 | $ | 44,170 | $ | 40,240 | $ | 42,547 | $ | 63,398 |
Portfolio turnover rate L | 25% J | 23% | 20% | 27% | 41% | 21% |
| Fidelity Asset Manager® 70% |
Six months ended (Unaudited) March 31, 2023 | Years ended September 30, 2022 | 2021 | 2020 | 2019 | 2018 | |||||||
Selected Per-Share Data | ||||||||||||
| Net asset value, beginning of period | $ | 22.42 | $ | 28.43 | $ | 23.74 | $ | 22.27 | $ | 23.33 | $ | 22.33 |
| Income from Investment Operations | ||||||||||||
Net investment income (loss) A,B | .22 | .48 | .29 | .32 | .34 | .30 | ||||||
| Net realized and unrealized gain (loss) | 2.76 | (5.70) | 4.97 | 2.33 | (.17) | 1.58 | ||||||
| Total from investment operations | 2.98 | (5.22) | 5.26 | 2.65 | .17 | 1.88 | ||||||
| Distributions from net investment income | (.48) | (.39) | (.26) | (.35) | (.31) | (.26) | ||||||
| Distributions from net realized gain | (1.02) | (.40) | (.32) | (.83) | (.91) | (.62) | ||||||
| Total distributions | (1.51) C | (.79) | (.57) C | (1.18) | (1.23) C | (.88) | ||||||
| Net asset value, end of period | $ | 23.89 | $ | 22.42 | $ | 28.43 | $ | 23.74 | $ | 22.27 | $ | 23.33 |
Total Return D,E | 13.65% | (18.98)% | 22.39% | 12.14% | 1.51% | 8.57% | ||||||
Ratios to Average Net Assets B,F,G | ||||||||||||
| Expenses before reductions | .68% H | .67% | .66% | .68% | .69% | .69% | ||||||
| Expenses net of fee waivers, if any | .67% H | .66% | .66% | .68% | .69% | .69% | ||||||
| Expenses net of all reductions | .67% H | .66% | .66% | .68% | .69% | .69% | ||||||
| Net investment income (loss) | 1.86% H | 1.79% | 1.06% | 1.42% | 1.56% | 1.30% | ||||||
| Supplemental Data | ||||||||||||
| Net assets, end of period (000 omitted) | $ | 3,854,707 | $ | 3,518,486 | $ | 4,523,497 | $ | 5,203,794 | $ | 4,893,270 | $ | 5,088,118 |
Portfolio turnover rate I | 25% H | 23% | 20% | 27% | 41% | 21% |
| Fidelity Advisor Asset Manager® 70% Class I |
Six months ended (Unaudited) March 31, 2023 | Years ended September 30, 2022 | 2021 | 2020 | 2019 | 2018 | |||||||
Selected Per-Share Data | ||||||||||||
| Net asset value, beginning of period | $ | 22.43 | $ | 28.46 | $ | 23.75 | $ | 22.27 | $ | 23.33 | $ | 22.33 |
| Income from Investment Operations | ||||||||||||
Net investment income (loss) A,B | .22 | .47 | .28 | .31 | .33 | .29 | ||||||
| Net realized and unrealized gain (loss) | 2.75 | (5.71) | 4.98 | 2.34 | (.17) | 1.58 | ||||||
| Total from investment operations | 2.97 | (5.24) | 5.26 | 2.65 | .16 | 1.87 | ||||||
| Distributions from net investment income | (.48) | (.39) | (.24) | (.34) | (.30) | (.25) | ||||||
| Distributions from net realized gain | (1.02) | (.40) | (.32) | (.83) | (.91) | (.62) | ||||||
| Total distributions | (1.50) | (.79) | (.55) C | (1.17) | (1.22) C | (.87) | ||||||
| Net asset value, end of period | $ | 23.90 | $ | 22.43 | $ | 28.46 | $ | 23.75 | $ | 22.27 | $ | 23.33 |
Total Return D,E | 13.62% | (19.03)% | 22.37% | 12.14% | 1.46% | 8.53% | ||||||
Ratios to Average Net Assets B,F,G | ||||||||||||
| Expenses before reductions | .70% H | .69% | .69% | .71% | .72% | .72% | ||||||
| Expenses net of fee waivers, if any | .70% H | .69% | .69% | .71% | .72% | .72% | ||||||
| Expenses net of all reductions | .70% H | .69% | .69% | .71% | .72% | .72% | ||||||
| Net investment income (loss) | 1.83% H | 1.76% | 1.03% | 1.39% | 1.53% | 1.27% | ||||||
| Supplemental Data | ||||||||||||
| Net assets, end of period (000 omitted) | $ | 48,986 | $ | 43,240 | $ | 54,440 | $ | 38,396 | $ | 68,475 | $ | 74,682 |
Portfolio turnover rate I | 25% H | 23% | 20% | 27% | 41% | 21% |
| Fidelity Advisor Asset Manager® 70% Class Z |
Six months ended (Unaudited) March 31, 2023 | Years ended September 30, 2022 | 2021 | 2020 | 2019 A | ||||||
Selected Per-Share Data | ||||||||||
| Net asset value, beginning of period | $ | 22.39 | $ | 28.41 | $ | 23.72 | $ | 22.26 | $ | 23.29 |
| Income from Investment Operations | ||||||||||
Net investment income (loss) B,C | .23 | .49 | .32 | .33 | .35 | |||||
| Net realized and unrealized gain (loss) | 2.76 | (5.68) | 4.96 | 2.33 | (.13) | |||||
| Total from investment operations | 2.99 | (5.19) | 5.28 | 2.66 | .22 | |||||
| Distributions from net investment income | (.50) | (.42) | (.27) | (.37) | (.34) | |||||
| Distributions from net realized gain | (1.02) | (.40) | (.32) | (.83) | (.91) | |||||
| Total distributions | (1.53) D | (.83) D | (.59) | (1.20) | (1.25) | |||||
| Net asset value, end of period | $ | 23.85 | $ | 22.39 | $ | 28.41 | $ | 23.72 | $ | 22.26 |
Total Return E,F | 13.72% | (18.94)% | 22.48% | 12.21% | 1.78% | |||||
Ratios to Average Net Assets C,G,H | ||||||||||
| Expenses before reductions | .60% I | .59% | .59% | .61% | .62% I | |||||
| Expenses net of fee waivers, if any | .59% I | .59% | .59% | .60% | .61% I | |||||
| Expenses net of all reductions | .59% I | .59% | .59% | .60% | .61% I | |||||
| Net investment income (loss) | 1.94% I | 1.86% | 1.13% | 1.49% | 1.64% I | |||||
| Supplemental Data | ||||||||||
| Net assets, end of period (000 omitted) | $ | 1,967,075 | $ | 1,698,474 | $ | 1,972,441 | $ | 28,723 | $ | 24,876 |
Portfolio turnover rate J | 25% I | 23% | 20% | 27% | 41% |
Top Holdings (% of Fund's net assets) | ||
| Apple, Inc. | 3.6 | |
| Microsoft Corp. | 3.4 | |
| iShares 20+ Year Treasury Bond ETF | 1.8 | |
| Alphabet, Inc. Class A | 1.8 | |
| Amazon.com, Inc. | 1.3 | |
| Exxon Mobil Corp. | 1.0 | |
| Taiwan Semiconductor Manufacturing Co. Ltd. | 1.0 | |
| iShares MSCI USA Minimum Volatility ETF | 0.8 | |
| Meta Platforms, Inc. Class A | 0.7 | |
| LVMH Moet Hennessy Louis Vuitton SE | 0.6 | |
| 16.0 | ||
| Market Sectors (% of Fund's net assets) | ||
| Information Technology | 17.0 | |
| Financials | 16.6 | |
| Health Care | 10.3 | |
| Consumer Discretionary | 9.7 | |
| Industrials | 9.3 | |
| Consumer Staples | 6.2 | |
| Communication Services | 6.0 | |
| Materials | 3.9 | |
| Energy | 3.8 | |
| Real Estate | 2.6 | |
| Utilities | 1.7 | |
| Financial Services | 0.1 | |
Quality Diversification (% of Fund's net assets) |
 |
Percentages shown as 0.0% may reflect amounts less than 0.05%. |
| We have used ratings from Moody's Investors Service, Inc. Where Moody's® ratings are not available, we have used S&P® ratings. All ratings are as of the date indicated and do not reflect subsequent changes. |
Asset Allocation (% of Fund's net assets) |
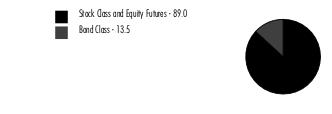 |
Short-Term Class * - (2.5)% |
Geographic Diversification (% of Fund's net assets) |
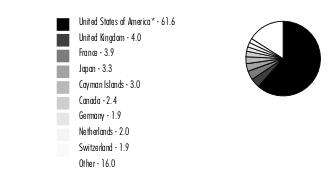 |
* Includes Short-Term investments and Net Other Assets (Liabilities). Percentages are based on country or territory of incorporation and are adjusted for the effect of derivatives, if applicable. |
| Equity Central Funds - 85.1% | |||
| Shares | Value ($) | ||
| Fidelity Commodity Strategy Central Fund (a) | 443,728 | 42,917,339 | |
| Fidelity Emerging Markets Equity Central Fund (a) | 1,924,067 | 370,613,817 | |
| Fidelity Hedged Equity Central Fund (a) | 100,496 | 10,162,142 | |
| Fidelity International Equity Central Fund (a) | 8,374,229 | 766,576,904 | |
| Fidelity Real Estate Equity Central Fund (a) | 183,723 | 22,140,482 | |
| Fidelity U.S. Equity Central Fund (a) | 15,449,720 | 1,728,978,201 | |
| TOTAL EQUITY CENTRAL FUNDS (Cost $1,964,930,759) | 2,941,388,885 | ||
| Fixed-Income Central Funds - 10.8% | |||
| Shares | Value ($) | ||
| High Yield Fixed-Income Funds - 1.7% | |||
| Fidelity Emerging Markets Debt Central Fund (a) | 1,679,150 | 12,711,165 | |
| Fidelity Emerging Markets Debt Local Currency Central Fund (a) | 408,797 | 36,419,761 | |
| Fidelity Floating Rate Central Fund (a) | 115,145 | 11,086,148 | |
TOTAL HIGH YIELD FIXED-INCOME FUNDS | 60,217,074 | ||
| Investment Grade Fixed-Income Funds - 9.1% | |||
| Fidelity Inflation-Protected Bond Index Central Fund (a) | 791,118 | 71,532,927 | |
| Fidelity International Credit Central Fund (a) | 411,316 | 31,979,827 | |
| Fidelity Investment Grade Bond Central Fund (a) | 2,122,024 | 210,080,365 | |
TOTAL INVESTMENT GRADE FIXED-INCOME FUNDS | 313,593,119 | ||
| TOTAL FIXED-INCOME CENTRAL FUNDS (Cost $396,250,100) | 373,810,193 | ||
| Money Market Central Funds - 2.5% | |||
| Shares | Value ($) | ||
| Fidelity Cash Central Fund 4.86% (b) | 23,181,128 | 23,185,764 | |
| Fidelity Securities Lending Cash Central Fund 4.87% (b)(c) | 65,204,730 | 65,211,250 | |
| TOTAL MONEY MARKET CENTRAL FUNDS (Cost $88,397,014) | 88,397,014 | ||
| U.S. Treasury Obligations - 0.4% | |||
Principal Amount (d) | Value ($) | ||
U.S. Treasury Bills, yield at date of purchase 4.41% to 4.93% 5/4/23 to 6/8/23 (e) (Cost $13,214,992) | 13,310,000 | 13,221,363 | |
| Investment Companies - 3.1% | |||
| Shares | Value ($) | ||
| iShares 20+ Year Treasury Bond ETF (f) | 591,422 | 62,909,559 | |
| iShares MSCI USA Minimum Volatility ETF (f) | 362,118 | 26,340,463 | |
| VanEck Vectors Gold Miners ETF (f) | 566,788 | 18,335,592 | |
| TOTAL INVESTMENT COMPANIES (Cost $118,702,771) | 107,585,614 | ||
| TOTAL INVESTMENT IN SECURITIES - 101.9% (Cost $2,581,495,636) | 3,524,403,069 |
NET OTHER ASSETS (LIABILITIES) - (1.9)% | (66,450,603) |
| NET ASSETS - 100.0% | 3,457,952,466 |
| Futures Contracts | |||||
Number of contracts | Expiration Date | Notional Amount ($) | Value ($) | Unrealized Appreciation/ (Depreciation) ($) | |
| Purchased | |||||
| Equity Index Contracts | |||||
| ICE E-mini MSCI EAFE Index Contracts (United States) | 1,222 | Jun 2023 | 128,096,150 | 5,395,498 | 5,395,498 |
| ICE E-mini MSCI Emerging Markets Index Contracts (United States) | 112 | Jun 2023 | 5,574,800 | 199,976 | 199,976 |
| TOTAL EQUITY INDEX CONTRACTS | 5,595,474 | ||||
| Treasury Contracts | |||||
| CBOT 5-Year U.S. Treasury Note Contracts (United States) | 246 | Jun 2023 | 26,938,922 | 570,302 | 570,302 |
| TOTAL PURCHASED | 6,165,776 | ||||
| Sold | |||||
| Equity Index Contracts | |||||
| CME E-mini S&P 500 Index Contracts (United States) | 660 | Jun 2023 | 136,545,750 | (8,008,427) | (8,008,427) |
| TOTAL FUTURES CONTRACTS | (1,842,651) | ||||
| The notional amount of futures purchased as a percentage of Net Assets is 4.7% | |||||
| The notional amount of futures sold as a percentage of Net Assets is 3.9% | |||||
| ETF | - | EXCHANGE-TRADED FUND |
| (a) | Affiliated fund that is generally available only to investment companies and other accounts managed by Fidelity Investments. A complete unaudited schedule of portfolio holdings for each Fidelity Central Fund is filed with the SEC for the first and third quarters of each fiscal year on Form N-PORT and is available upon request or at the SEC's website at www.sec.gov. An unaudited holdings listing for the Fund, which presents direct holdings as well as the pro-rata share of securities and other investments held indirectly through its investment in underlying non-money market Fidelity Central Funds, other than the Commodity Strategy Central Fund, is available at fidelity.com and/or institutional.fidelity.com, as applicable. In addition, each Fidelity Central Fund's financial statements are available on the SEC's website or upon request. |
| (b) | Affiliated fund that is generally available only to investment companies and other accounts managed by Fidelity Investments. The rate quoted is the annualized seven-day yield of the fund at period end. A complete unaudited listing of the fund's holdings as of its most recent quarter end is available upon request. In addition, each Fidelity Central Fund's financial statements are available on the SEC's website or upon request. |
| (c) | Investment made with cash collateral received from securities on loan. |
| (d) | Amount is stated in United States dollars unless otherwise noted. |
| (e) | Security or a portion of the security was pledged to cover margin requirements for futures contracts. At period end, the value of securities pledged amounted to $13,070,634. |
| (f) | Security or a portion of the security is on loan at period end. |
| Affiliate | Value, beginning of period ($) | Purchases ($) | Sales Proceeds ($) | Dividend Income ($) | Realized Gain (loss) ($) | Change in Unrealized appreciation (depreciation) ($) | Value, end of period ($) | % ownership, end of period |
| Fidelity Cash Central Fund 4.86% | 13,400,862 | 167,391,705 | 157,606,803 | 350,582 | - | - | 23,185,764 | 0.1% |
| Fidelity Commodity Strategy Central Fund | 78,940,714 | 2,310,894 | 36,003,460 | 840,050 | (5,459,422) | 3,128,613 | 42,917,339 | 9.3% |
| Fidelity Emerging Markets Debt Central Fund | 12,999,589 | 1,050,523 | 2,105,966 | 411,971 | (306,014) | 1,073,033 | 12,711,165 | 0.6% |
| Fidelity Emerging Markets Debt Local Currency Central Fund | 8,467,097 | 26,172,671 | - | 23,053 | - | 1,779,993 | 36,419,761 | 13.2% |
| Fidelity Emerging Markets Equity Central Fund | 292,726,440 | 67,693,419 | 30,577,671 | 4,823,506 | (9,171,810) | 49,943,439 | 370,613,817 | 16.3% |
| Fidelity Floating Rate Central Fund | 26,789,150 | 1,561,282 | 17,936,425 | 1,011,948 | (701,683) | 1,373,824 | 11,086,148 | 0.6% |
| Fidelity Hedged Equity Central Fund | - | 10,049,451 | - | 5,524 | - | 112,691 | 10,162,142 | 9.6% |
| Fidelity High Income Central Fund | - | 28 | 4,821 | 45 | 4,793 | - | - | 0.0% |
| Fidelity Inflation-Protected Bond Index Central Fund | 63,761,519 | 15,153,445 | 3,586,697 | 6,888,421 | (125,700) | (3,669,640) | 71,532,927 | 11.4% |
| Fidelity International Credit Central Fund | 42,225,958 | 2,431,705 | 11,475,273 | 1,650,776 | (3,263,792) | 2,061,229 | 31,979,827 | 9.1% |
| Fidelity International Equity Central Fund | 580,772,173 | 65,200,233 | 38,381,175 | 3,939,557 | (4,559,906) | 163,545,579 | 766,576,904 | 15.8% |
| Fidelity Investment Grade Bond Central Fund | 146,696,239 | 113,460,967 | 56,367,033 | 3,636,930 | (4,516,853) | 10,807,045 | 210,080,365 | 0.6% |
| Fidelity Real Estate Equity Central Fund | 28,721,218 | 1,126,915 | 10,203,909 | 392,387 | (11,795) | 2,508,053 | 22,140,482 | 2.3% |
| Fidelity Securities Lending Cash Central Fund 4.87% | 16,469,750 | 768,829,551 | 720,088,051 | 15,844 | - | - | 65,211,250 | 0.2% |
| Fidelity U.S. Equity Central Fund | 1,623,482,375 | 101,626,119 | 214,775,249 | 35,560,027 | 5,083,989 | 213,560,967 | 1,728,978,201 | 11.0% |
| Total | 2,935,453,084 | 1,344,058,908 | 1,299,112,533 | 59,550,621 | (23,028,193) | 446,224,826 | 3,403,596,092 | |
| Valuation Inputs at Reporting Date: | ||||
| Description | Total ($) | Level 1 ($) | Level 2 ($) | Level 3 ($) |
Investments in Securities: | ||||
| Equity Central Funds | 2,941,388,885 | 2,941,388,885 | - | - |
| Fixed-Income Central Funds | 373,810,193 | 373,810,193 | - | - |
| Money Market Central Funds | 88,397,014 | 88,397,014 | - | - |
| Other Short-Term Investments and Net Other Assets | 13,221,363 | - | 13,221,363 | - |
| Investment Companies | 107,585,614 | 107,585,614 | - | - |
| Total Investments in Securities: | 3,524,403,069 | 3,511,181,706 | 13,221,363 | - |
Derivative Instruments: | ||||
| Assets | ||||
Futures Contracts | 6,165,776 | 6,165,776 | - | - |
| Total Assets | 6,165,776 | 6,165,776 | - | - |
| Liabilities | ||||
Futures Contracts | (8,008,427) | (8,008,427) | - | - |
| Total Liabilities | (8,008,427) | (8,008,427) | - | - |
| Total Derivative Instruments: | (1,842,651) | (1,842,651) | - | - |
Primary Risk Exposure / Derivative Type | Value | |
| Asset ($) | Liability ($) | |
| Equity Risk | ||
Futures Contracts (a) | 5,595,474 | (8,008,427) |
| Total Equity Risk | 5,595,474 | (8,008,427) |
| Interest Rate Risk | ||
Futures Contracts (a) | 570,302 | 0 |
| Total Interest Rate Risk | 570,302 | 0 |
| Total Value of Derivatives | 6,165,776 | (8,008,427) |
| Statement of Assets and Liabilities | ||||
March 31, 2023 (Unaudited) | ||||
| Assets | ||||
| Investment in securities, at value (including securities loaned of $64,636,353) - See accompanying schedule: | ||||
Unaffiliated issuers (cost $131,917,763) | $ | 120,806,977 | ||
Fidelity Central Funds (cost $2,449,577,873) | 3,403,596,092 | |||
| Total Investment in Securities (cost $2,581,495,636) | $ | 3,524,403,069 | ||
| Receivable for investments sold | 1,959,024 | |||
| Receivable for fund shares sold | 1,395,288 | |||
| Distributions receivable from Fidelity Central Funds | 71,782 | |||
| Prepaid expenses | 1,698 | |||
Total assets | 3,527,830,861 | |||
| Liabilities | ||||
| Payable for fund shares redeemed | $ | 1,356,357 | ||
| Accrued management fee | 1,477,559 | |||
| Distribution and service plan fees payable | 90,858 | |||
| Payable for daily variation margin on futures contracts | 1,325,777 | |||
| Other affiliated payables | 378,253 | |||
| Other payables and accrued expenses | 38,341 | |||
| Collateral on securities loaned | 65,211,250 | |||
| Total Liabilities | 69,878,395 | |||
| Net Assets | $ | 3,457,952,466 | ||
| Net Assets consist of: | ||||
| Paid in capital | $ | 2,742,279,894 | ||
| Total accumulated earnings (loss) | 715,672,572 | |||
| Net Assets | $ | 3,457,952,466 | ||
| Net Asset Value and Maximum Offering Price | ||||
| Class A : | ||||
Net Asset Value and redemption price per share ($197,887,655 ÷ 9,064,890 shares) (a) | $ | 21.83 | ||
| Maximum offering price per share (100/94.25 of $21.83) | $ | 23.16 | ||
| Class M : | ||||
Net Asset Value and redemption price per share ($45,856,745 ÷ 2,115,938 shares) (a) | $ | 21.67 | ||
| Maximum offering price per share (100/96.50 of $21.67) | $ | 22.46 | ||
| Class C : | ||||
Net Asset Value and offering price per share ($39,934,412 ÷ 1,863,448 shares) (a) | $ | 21.43 | ||
| Asset Manager 85% : | ||||
Net Asset Value , offering price and redemption price per share ($1,907,130,529 ÷ 86,312,777 shares) | $ | 22.10 | ||
| Class I : | ||||
Net Asset Value , offering price and redemption price per share ($58,288,588 ÷ 2,646,496 shares) | $ | 22.02 | ||
| Class Z : | ||||
Net Asset Value , offering price and redemption price per share ($1,208,854,537 ÷ 55,032,869 shares) | $ | 21.97 | ||
(a)Redemption price per share is equal to net asset value less any applicable contingent deferred sales charge. | ||||
| Statement of Operations | ||||
Six months ended March 31, 2023 (Unaudited) | ||||
| Investment Income | ||||
| Dividends | $ | 1,249,544 | ||
| Interest | 239,960 | |||
| Income from Fidelity Central Funds (including $15,844 from security lending) | 33,263,134 | |||
| Total Income | 34,752,638 | |||
| Expenses | ||||
| Management fee | $ | 8,834,934 | ||
| Transfer agent fees | 1,790,009 | |||
| Distribution and service plan fees | 538,362 | |||
| Accounting fees | 430,704 | |||
| Custodian fees and expenses | 13,518 | |||
| Independent trustees' fees and expenses | 6,711 | |||
| Registration fees | 53,434 | |||
| Audit | 24,715 | |||
| Legal | 6,109 | |||
| Interest | 1,696 | |||
| Miscellaneous | 8,175 | |||
| Total expenses before reductions | 11,708,367 | |||
| Expense reductions | (63,071) | |||
| Total expenses after reductions | 11,645,296 | |||
| Net Investment income (loss) | 23,107,342 | |||
| Realized and Unrealized Gain (Loss) | ||||
| Net realized gain (loss) on: | ||||
| Investment Securities: | ||||
| Unaffiliated issuers | (20,561,010) | |||
| Fidelity Central Funds | (23,028,193) | |||
| Futures contracts | 7,806,524 | |||
| Capital gain distributions from Fidelity Central Funds | 26,287,487 | |||
| Total net realized gain (loss) | (9,495,192) | |||
| Change in net unrealized appreciation (depreciation) on: | ||||
| Investment Securities: | ||||
| Unaffiliated issuers | 24,957,104 | |||
| Fidelity Central Funds | 446,224,826 | |||
| Futures contracts | (2,767,834) | |||
| Total change in net unrealized appreciation (depreciation) | 468,414,096 | |||
| Net gain (loss) | 458,918,904 | |||
| Net increase (decrease) in net assets resulting from operations | $ | 482,026,246 | ||
| Statement of Changes in Net Assets | ||||
Six months ended March 31, 2023 (Unaudited) | Year ended September 30, 2022 | |||
| Increase (Decrease) in Net Assets | ||||
| Operations | ||||
| Net investment income (loss) | $ | 23,107,342 | $ | 57,022,306 |
| Net realized gain (loss) | (9,495,192) | 172,237,074 | ||
| Change in net unrealized appreciation (depreciation) | 468,414,096 | (1,059,883,711) | ||
| Net increase (decrease) in net assets resulting from operations | 482,026,246 | (830,624,331) | ||
| Distributions to shareholders | (159,424,150) | (128,057,101) | ||
| Share transactions - net increase (decrease) | 49,260,546 | 242,638,642 | ||
| Total increase (decrease) in net assets | 371,862,642 | (716,042,790) | ||
| Net Assets | ||||
| Beginning of period | 3,086,089,824 | 3,802,132,614 | ||
| End of period | $ | 3,457,952,466 | $ | 3,086,089,824 |
| Fidelity Advisor Asset Manager® 85% Class A |
Six months ended (Unaudited) March 31, 2023 | Years ended September 30, 2022 | 2021 | 2020 | 2019 | 2018 | |||||||
Selected Per-Share Data | ||||||||||||
| Net asset value, beginning of period | $ | 19.79 | $ | 25.79 | $ | 20.73 | $ | 19.30 | $ | 20.36 | $ | 19.02 |
| Income from Investment Operations | ||||||||||||
Net investment income (loss) A,B | .12 | .30 | .16 | .19 | .20 | .16 | ||||||
| Net realized and unrealized gain (loss) | 2.91 | (5.52) | 5.31 | 2.29 | (.37) | 1.77 | ||||||
| Total from investment operations | 3.03 | (5.22) | 5.47 | 2.48 | (.17) | 1.93 | ||||||
| Distributions from net investment income | (.32) | (.24) | (.13) | (.22) | (.17) | (.14) | ||||||
| Distributions from net realized gain | (.67) | (.54) | (.28) | (.84) | (.72) | (.45) | ||||||
| Total distributions | (.99) | (.78) | (.41) | (1.05) C | (.89) | (.59) | ||||||
| Net asset value, end of period | $ | 21.83 | $ | 19.79 | $ | 25.79 | $ | 20.73 | $ | 19.30 | $ | 20.36 |
Total Return D,E,F | 15.63% | (21.00)% | 26.59% | 13.11% | (.11)% | 10.29% | ||||||
Ratios to Average Net Assets B,G,H | ||||||||||||
| Expenses before reductions | .98% I | .97% | .98% | 1.00% | 1.01% | 1.02% | ||||||
| Expenses net of fee waivers, if any | .98% I | .97% | .98% | .99% | 1.01% | 1.02% | ||||||
| Expenses net of all reductions | .98% I | .97% | .98% | .99% | 1.01% | 1.02% | ||||||
| Net investment income (loss) | 1.10% I | 1.24% | .64% | .97% | 1.06% | .80% | ||||||
| Supplemental Data | ||||||||||||
| Net assets, end of period (000 omitted) | $ | 197,888 | $ | 165,075 | $ | 191,715 | $ | 143,117 | $ | 125,168 | $ | 115,447 |
Portfolio turnover rate J | 29% I | 27% | 18% | 41% | 47% | 24% |
| Fidelity Advisor Asset Manager® 85% Class M |
Six months ended (Unaudited) March 31, 2023 | Years ended September 30, 2022 | 2021 | 2020 | 2019 | 2018 | |||||||
Selected Per-Share Data | ||||||||||||
| Net asset value, beginning of period | $ | 19.62 | $ | 25.58 | $ | 20.57 | $ | 19.17 | $ | 20.22 | $ | 18.91 |
| Income from Investment Operations | ||||||||||||
Net investment income (loss) A,B | .09 | .24 | .09 | .14 | .15 | .10 | ||||||
| Net realized and unrealized gain (loss) | 2.89 | (5.48) | 5.28 | 2.27 | (.36) | 1.75 | ||||||
| Total from investment operations | 2.98 | (5.24) | 5.37 | 2.41 | (.21) | 1.85 | ||||||
| Distributions from net investment income | (.26) | (.18) | (.08) | (.18) | (.13) | (.09) | ||||||
| Distributions from net realized gain | (.67) | (.54) | (.28) | (.84) | (.72) | (.45) | ||||||
| Total distributions | (.93) | (.72) | (.36) | (1.01) C | (.84) C | (.54) | ||||||
| Net asset value, end of period | $ | 21.67 | $ | 19.62 | $ | 25.58 | $ | 20.57 | $ | 19.17 | $ | 20.22 |
Total Return D,E,F | 15.46% | (21.21)% | 26.30% | 12.81% | (.35)% | 9.94% | ||||||
Ratios to Average Net Assets B,G,H | ||||||||||||
| Expenses before reductions | 1.23% I | 1.22% | 1.23% | 1.25% | 1.27% | 1.29% | ||||||
| Expenses net of fee waivers, if any | 1.22% I | 1.22% | 1.23% | 1.25% | 1.27% | 1.29% | ||||||
| Expenses net of all reductions | 1.22% I | 1.22% | 1.23% | 1.25% | 1.27% | 1.29% | ||||||
| Net investment income (loss) | .85% I | 1.00% | .39% | .72% | .80% | .53% | ||||||
| Supplemental Data | ||||||||||||
| Net assets, end of period (000 omitted) | $ | 45,857 | $ | 42,034 | $ | 54,864 | $ | 40,604 | $ | 33,611 | $ | 31,371 |
Portfolio turnover rate J | 29% I | 27% | 18% | 41% | 47% | 24% |
| Fidelity Advisor Asset Manager® 85% Class C |
Six months ended (Unaudited) March 31, 2023 | Years ended September 30, 2022 | 2021 | 2020 | 2019 | 2018 | |||||||
Selected Per-Share Data | ||||||||||||
| Net asset value, beginning of period | $ | 19.36 | $ | 25.24 | $ | 20.31 | $ | 18.92 | $ | 19.95 | $ | 18.65 |
| Income from Investment Operations | ||||||||||||
Net investment income (loss) A,B | .03 | .11 | (.03) | .04 | .06 | .01 | ||||||
| Net realized and unrealized gain (loss) | 2.86 | (5.42) | 5.21 | 2.24 | (.35) | 1.74 | ||||||
| Total from investment operations | 2.89 | (5.31) | 5.18 | 2.28 | (.29) | 1.75 | ||||||
| Distributions from net investment income | (.15) | (.03) | - | (.06) | (.02) | - C | ||||||
| Distributions from net realized gain | (.67) | (.54) | (.25) | (.84) | (.72) | (.45) | ||||||
| Total distributions | (.82) | (.57) | (.25) | (.89) D | (.74) | (.45) | ||||||
| Net asset value, end of period | $ | 21.43 | $ | 19.36 | $ | 25.24 | $ | 20.31 | $ | 18.92 | $ | 19.95 |
Total Return E,F,G | 15.16% | (21.61)% | 25.65% | 12.25% | (.88)% | 9.51% | ||||||
Ratios to Average Net Assets B,H,I | ||||||||||||
| Expenses before reductions | 1.74% J | 1.74% | 1.74% | 1.76% | 1.77% | 1.77% | ||||||
| Expenses net of fee waivers, if any | 1.74% J | 1.73% | 1.74% | 1.76% | 1.77% | 1.77% | ||||||
| Expenses net of all reductions | 1.74% J | 1.73% | 1.74% | 1.76% | 1.77% | 1.77% | ||||||
| Net investment income (loss) | .33% J | .48% | (.13)% | .21% | .30% | .05% | ||||||
| Supplemental Data | ||||||||||||
| Net assets, end of period (000 omitted) | $ | 39,934 | $ | 36,141 | $ | 49,896 | $ | 44,510 | $ | 40,909 | $ | 50,588 |
Portfolio turnover rate K | 29% J | 27% | 18% | 41% | 47% | 24% |
| Fidelity Asset Manager® 85% |
Six months ended (Unaudited) March 31, 2023 | Years ended September 30, 2022 | 2021 | 2020 | 2019 | 2018 | |||||||
Selected Per-Share Data | ||||||||||||
| Net asset value, beginning of period | $ | 20.05 | $ | 26.10 | $ | 20.96 | $ | 19.50 | $ | 20.56 | $ | 19.20 |
| Income from Investment Operations | ||||||||||||
Net investment income (loss) A,B | .15 | .37 | .23 | .25 | .26 | .22 | ||||||
| Net realized and unrealized gain (loss) | 2.95 | (5.58) | 5.38 | 2.32 | (.38) | 1.78 | ||||||
| Total from investment operations | 3.10 | (5.21) | 5.61 | 2.57 | (.12) | 2.00 | ||||||
| Distributions from net investment income | (.38) | (.30) | (.19) | (.27) | (.23) | (.19) | ||||||
| Distributions from net realized gain | (.67) | (.54) | (.28) | (.84) | (.72) | (.45) | ||||||
| Total distributions | (1.05) | (.84) | (.47) | (1.11) | (.94) C | (.64) | ||||||
| Net asset value, end of period | $ | 22.10 | $ | 20.05 | $ | 26.10 | $ | 20.96 | $ | 19.50 | $ | 20.56 |
Total Return D,E | 15.79% | (20.76)% | 27.00% | 13.44% | .21% | 10.62% | ||||||
Ratios to Average Net Assets B,F,G | ||||||||||||
| Expenses before reductions | .70% H | .69% | .68% | .69% | .71% | .71% | ||||||
| Expenses net of fee waivers, if any | .69% H | .68% | .68% | .69% | .71% | .71% | ||||||
| Expenses net of all reductions | .69% H | .68% | .68% | .69% | .71% | .71% | ||||||
| Net investment income (loss) | 1.38% H | 1.53% | .94% | 1.28% | 1.36% | 1.11% | ||||||
| Supplemental Data | ||||||||||||
| Net assets, end of period (000 omitted) | $ | 1,907,131 | $ | 1,697,192 | $ | 2,185,948 | $ | 2,520,790 | $ | 2,278,919 | $ | 2,377,705 |
Portfolio turnover rate I | 29% H | 27% | 18% | 41% | 47% | 24% |
| Fidelity Advisor Asset Manager® 85% Class I |
Six months ended (Unaudited) March 31, 2023 | Years ended September 30, 2022 | 2021 | 2020 | 2019 | 2018 | |||||||
Selected Per-Share Data | ||||||||||||
| Net asset value, beginning of period | $ | 19.99 | $ | 26.03 | $ | 20.91 | $ | 19.45 | $ | 20.50 | $ | 19.15 |
| Income from Investment Operations | ||||||||||||
Net investment income (loss) A,B | .15 | .36 | .22 | .24 | .25 | .21 | ||||||
| Net realized and unrealized gain (loss) | 2.93 | (5.56) | 5.36 | 2.32 | (.37) | 1.78 | ||||||
| Total from investment operations | 3.08 | (5.20) | 5.58 | 2.56 | (.12) | 1.99 | ||||||
| Distributions from net investment income | (.38) | (.30) | (.18) | (.26) | (.21) | (.19) | ||||||
| Distributions from net realized gain | (.67) | (.54) | (.28) | (.84) | (.72) | (.45) | ||||||
| Total distributions | (1.05) | (.84) | (.46) | (1.10) | (.93) | (.64) | ||||||
| Net asset value, end of period | $ | 22.02 | $ | 19.99 | $ | 26.03 | $ | 20.91 | $ | 19.45 | $ | 20.50 |
Total Return C,D | 15.72% | (20.78)% | 26.93% | 13.40% | .15% | 10.58% | ||||||
Ratios to Average Net Assets B,E,F | ||||||||||||
| Expenses before reductions | .72% G | .71% | .71% | .73% | .74% | .75% | ||||||
| Expenses net of fee waivers, if any | .72% G | .71% | .71% | .72% | .74% | .75% | ||||||
| Expenses net of all reductions | .72% G | .71% | .71% | .72% | .74% | .75% | ||||||
| Net investment income (loss) | 1.36% G | 1.50% | .90% | 1.25% | 1.33% | 1.07% | ||||||
| Supplemental Data | ||||||||||||
| Net assets, end of period (000 omitted) | $ | 58,289 | $ | 51,528 | $ | 60,989 | $ | 31,606 | $ | 39,115 | $ | 54,135 |
Portfolio turnover rate H | 29% G | 27% | 18% | 41% | 47% | 24% |
| Fidelity Advisor Asset Manager® 85% Class Z |
Six months ended (Unaudited) March 31, 2023 | Years ended September 30, 2022 | 2021 | 2020 | 2019 A | ||||||
Selected Per-Share Data | ||||||||||
| Net asset value, beginning of period | $ | 19.95 | $ | 25.99 | $ | 20.87 | $ | 19.43 | $ | 20.45 |
| Income from Investment Operations | ||||||||||
Net investment income (loss) B,C | .16 | .39 | .26 | .26 | .27 | |||||
| Net realized and unrealized gain (loss) | 2.93 | (5.55) | 5.34 | 2.31 | (.32) | |||||
| Total from investment operations | 3.09 | (5.16) | 5.60 | 2.57 | (.05) | |||||
| Distributions from net investment income | (.40) | (.34) | (.21) | (.30) | (.25) | |||||
| Distributions from net realized gain | (.67) | (.54) | (.28) | (.84) | (.72) | |||||
| Total distributions | (1.07) | (.88) | (.48) D | (1.13) D | (.97) | |||||
| Net asset value, end of period | $ | 21.97 | $ | 19.95 | $ | 25.99 | $ | 20.87 | $ | 19.43 |
Total Return E,F | 15.84% | (20.71)% | 27.11% | 13.50% | .54% | |||||
Ratios to Average Net Assets C,G,H | ||||||||||
| Expenses before reductions | .60% I | .60% | .60% | .61% | .62% I | |||||
| Expenses net of fee waivers, if any | .60% I | .59% | .60% | .61% | .62% I | |||||
| Expenses net of all reductions | .60% I | .59% | .60% | .61% | .62% I | |||||
| Net investment income (loss) | 1.48% I | 1.62% | 1.01% | 1.36% | 1.45% I | |||||
| Supplemental Data | ||||||||||
| Net assets, end of period (000 omitted) | $ | 1,208,855 | $ | 1,094,119 | $ | 1,258,721 | $ | 24,683 | $ | 23,286 |
Portfolio turnover rate J | 29% I | 27% | 18% | 41% | 47% |
| Fidelity Central Fund | Investment Manager | Investment Objective | Investment Practices | Expense Ratio A |
| Fidelity Commodity Strategy Central Fund | Geode Capital Management, LLC (Geode) | Seeks to provide investment returns that correspond to the performance of the commodities market. | Investment in commodity-related investments through a wholly-owned subsidiary organized under the laws of the Cayman Islands Futures | Less than .005% |
| Fidelity Emerging Markets Debt Central Fund | Fidelity Management & Research Company LLC (FMR) | Seeks high total return by normally investing in debt securities of issuers in emerging markets and other debt investments that are tied economically to emerging markets. | Foreign Securities Restricted Securities | 0.02% |
| Fidelity Emerging Markets Equity Central Fund | Fidelity Management & Research Company LLC (FMR) | Seeks capital appreciation by investing primarily in equity securities of issuers in emerging markets. | Foreign Securities Futures Loans & Direct Debt Instruments | .02% |
| Fidelity International Equity Central Fund | Fidelity Management & Research Company LLC (FMR) | Seeks capital appreciation by investing primarily in non-U.S. based common stocks, including securities of issuers located in emerging markets. | Delayed Delivery & When Issued Securities Foreign Securities Futures Loans & Direct Debt Instruments | 0.01% |
| Fidelity Floating Rate Central Fund | Fidelity Management & Research Company LLC (FMR) | Seeks a high level of income by normally investing in floating rate loans and other floating rate securities. | Foreign Securities Loans & Direct Debt Instruments Restricted Securities | Less than .005% |
| Fidelity High Income Central Fund | Fidelity Management & Research Company LLC (FMR) | Seeks a high level of income and may also seek capital appreciation by investing primarily in debt securities, preferred stocks, and convertible securities, with an emphasis on lower-quality debt securities. | Loans & Direct Debt Instruments Restricted Securities | 0.03% |
| Fidelity Inflation-Protected Bond Index Central Fund | Fidelity Management & Research Company LLC (FMR) | Seeks to provide investment results that correspond to the performance of the inflation-protected United States Treasury market, and may invest in derivatives. | Less than .005% | |
| Fidelity Investment Grade Bond Central Fund | Fidelity Management & Research Company LLC (FMR) | Seeks a high level of income by normally investing in investment-grade debt securities. | Delayed Delivery & When Issued Securities Futures Restricted Securities Swaps | Less than .005% |
| Fidelity Real Estate Equity Central Fund | Fidelity Management & Research Company LLC (FMR) | Seeks above-average income and long-term capital growth by investing primarily in equity securities of issuers in the real estate industry. | Loans & Direct Debt Instruments | Less than .005% |
| Fidelity International Credit Central Fund | Fidelity Management & Research Company LLC (FMR) | Seeks a high level of current income by normally investing in debt securities of foreign issuers, including debt securities of issuers located in emerging markets. Foreign currency exposure is hedged utilizing foreign currency contracts. | Foreign Securities Futures Options Restricted Securities Swaps Forward Foreign Currency Contracts | Less than .005% |
| Fidelity U.S. Equity Central Fund | Fidelity Management & Research Company LLC (FMR) | Seeks capital appreciation by investing primarily in common stocks, allocated across different market sectors. | Foreign Securities Futures Loans & Direct Debt Instruments Restricted Securities | Less than .005% |
| Fidelity Emerging Markets Debt Local Currency Central Fund | Fidelity Management & Research Company LLC (FMR) | Seeks high total return by normally investing in debt securities of issuers in emerging markets and other debt investments that are tied economically to emerging markets and denominated in the local currency of the issuer. | Foreign Securities Restricted Securities | Less than .005% |
| Fidelity Money Market Central Funds | Fidelity Management & Research Company LLC (FMR) | Each fund seeks to obtain a high level of current income consistent with the preservation of capital and liquidity. | Short-term Investments | Less than .005% |
| Fidelity Asset Manager 50% | 148,116 |
| Fidelity Asset Manager 70% | 4,191 |
| Tax cost | Gross unrealized appreciation | Gross unrealized depreciation | Net unrealized appreciation (depreciation) | |
| Fidelity Asset Manager 20% | $5,561,799,651 | $405,202,096 | $ (329,074,046) | $76,128,050 |
| Fidelity Asset Manager 30% | 2,136,092,532 | 185,779,126 | (146,584,530) | 39,194,596 |
| Fidelity Asset Manager 40% | 2,079,203,940 | 269,073,554 | (129,111,822) | 139,961,732 |
| Fidelity Asset Manager 50% | 8,272,059,998 | 1,722,782,984 | (467,960,902) | 1,254,822,082 |
| Fidelity Asset Manager 60% | 3,094,634,721 | 878,064,125 | (111,575,650) | 766,488,475 |
| Fidelity Asset Manager 70% | 5,015,207,113 | 1,435,659,035 | (209,435,874) | 1,226,223,161 |
| Fidelity Asset Manager 85% | 2,798,514,093 | 827,811,307 | (103,764,982) | 724,046,325 |
| Equity Risk | Equity risk relates to the fluctuations in the value of financial instruments as a result of changes in market prices (other than those arising from interest rate risk or foreign exchange risk), whether caused by factors specific to an individual investment, its issuer, or all factors affecting all instruments traded in a market or market segment. |
| Interest Rate Risk | Interest rate risk relates to the fluctuations in the value of interest-bearing securities due to changes in the prevailing levels of market interest rates. |
| Primary Risk Exposure / Derivative Type | Net Realized Gain (Loss) | Change in Net Unrealized Appreciation (Depreciation) |
| Fidelity Asset Manager 20% | ||
| Equity Risk | ||
| Futures Contracts | $20,173,782 | $(59,708,042) |
| Total Equity Risk | 20,173,782 | (59,708,042) |
| Interest Rate Risk | ||
| Futures Contracts | (1,158,188) | 1,012,927 |
| Total Interest Rate Risk | (1,158,188) | 1,012,927 |
| Totals | $19,015,594 | $(58,695,115) |
| Fidelity Asset Manager 30% | ||
| Equity Risk | ||
| Futures Contracts | $9,244,111 | $(25,807,173) |
| Total Equity Risk | 9,244,111 | (25,807,173) |
| Interest Rate Risk | ||
| Futures Contracts | (469,331) | 390,299 |
| Total Interest Rate Risk | (469,331) | 390,299 |
| Totals | $8,774,780 | $(25,416,874) |
| Fidelity Asset Manager 40% | ||
| Equity Risk | ||
| Futures Contracts | $9,250,508 | $(25,211,738) |
| Total Equity Risk | 9,250,508 | (25,211,738) |
| Interest Rate Risk | ||
| Futures Contracts | (462,471) | 396,877 |
| Total Interest Rate Risk | (462,471) | 396,877 |
| Totals | $8,788,037 | $(24,814,861) |
| Fidelity Asset Manager 50% | ||
| Equity Risk | ||
| Futures Contracts | $34,709,448 | $(95,464,944) |
| Total Equity Risk | 34,709,448 | (95,464,944) |
| Interest Rate Risk | ||
| Futures Contracts | (1,924,011) | 1,706,027 |
| Total Interest Rate Risk | (1,924,011) | 1,706,027 |
| Totals | $32,785,437 | $(93,758,917) |
| Fidelity Asset Manager 60% | ||
| Equity Risk | ||
| Futures Contracts | $13,745,216 | $(9,370,005) |
| Total Equity Risk | 13,745,216 | (9,370,005) |
| Interest Rate Risk | ||
| Futures Contracts | (741,430) | 680,041 |
| Total Interest Rate Risk | (741,430) | 680,041 |
| Totals | $13,003,786 | $(8,689,964) |
| Fidelity Asset Manager 70% | ||
| Equity Risk | ||
| Futures Contracts | $19,782,850 | $(17,963,863) |
| Total Equity Risk | 19,782,850 | (17,963,863) |
| Interest Rate Risk | ||
| Futures Contracts | (1,173,289) | 1,098,231 |
| Total Interest Rate Risk | (1,173,289) | 1,098,231 |
| Totals | $18,609,561 | $(16,865,632) |
| Fidelity Asset Manager 85% | ||
| Equity Risk | ||
| Futures Contracts | $8,459,522 | $(3,392,191) |
| Total Equity Risk | 8,459,522 | (3,392,191) |
| Interest Rate Risk | ||
| Futures Contracts | (652,998) | 624,357 |
| Total Interest Rate Risk | (652,998) | 624,357 |
| Totals | $7,806,524 | $(2,767,834) |
| Purchases ($) | Sales ($) | |
| Fidelity Asset Manager 20% | 863,666,495 | 788,020,113 |
| Fidelity Asset Manager 30% | 289,451,463 | 382,881,751 |
| Fidelity Asset Manager 40% | 288,664,747 | 355,341,402 |
| Fidelity Asset Manager 50% | 1,213,913,958 | 1,469,538,401 |
| Fidelity Asset Manager 60% | 501,782,106 | 512,315,218 |
| Fidelity Asset Manager 70% | 744,735,025 | 771,339,931 |
| Fidelity Asset Manager 85% | 479,195,339 | 531,463,754 |
| Individual Rate | Group Rate | Total | |
| Fidelity Asset Manager 20% | .30% | .10% | .40% |
| Fidelity Asset Manager 30% | .30% | .10% | .40% |
| Fidelity Asset Manager 40% | .30% | .10% | .40% |
| Fidelity Asset Manager 50% | .25% | .23% | .48% |
| Fidelity Asset Manager 60% | .30% | .23% | .53% |
| Fidelity Asset Manager 70% | .30% | .23% | .53% |
| Fidelity Asset Manager 85% | .30% | .23% | .53% |
| Distribution Fee | Service Fee | Total Fees | Retained by FDC | |
| Fidelity Asset Manager 20% | ||||
Class A | - % | .25% | $71,199 | $4,138 |
Class M | .25% | .25% | 68,922 | 472 |
Class C | .75% | .25% | 96,743 | 11,110 |
| $236,864 | $15,720 | |||
| Fidelity Asset Manager 30% | ||||
Class A | - % | .25% | $90,765 | $3,097 |
Class M | .25% | .25% | 56,606 | 370 |
Class C | .75% | .25% | 120,499 | 14,923 |
| $267,870 | $18,390 | |||
| Fidelity Asset Manager 40% | ||||
Class A | - % | .25% | $90,561 | $1,274 |
Class M | .25% | .25% | 32,640 | 269 |
Class C | .75% | .25% | 97,689 | 13,136 |
| $220,890 | $14,679 | |||
| Fidelity Asset Manager 50% | ||||
Class A | - % | .25% | $147,621 | $5,409 |
Class M | .25% | .25% | 126,264 | 1,005 |
Class C | .75% | .25% | 160,041 | 15,385 |
| $433,926 | $21,799 | |||
| Fidelity Asset Manager 60% | ||||
Class A | - % | .25% | $186,716 | $3,479 |
Class M | .25% | .25% | 116,402 | 915 |
Class C | .75% | .25% | 167,507 | 17,645 |
| $470,625 | $22,039 | |||
| Fidelity Asset Manager 70% | ||||
Class A | - % | .25% | $245,030 | $4,255 |
Class M | .25% | .25% | 168,428 | 1,277 |
Class C | .75% | .25% | 156,213 | 22,595 |
| $569,671 | $28,127 | |||
| Fidelity Asset Manager 85% | ||||
Class A | - % | .25% | $231,435 | $1,932 |
Class M | .25% | .25% | 112,622 | 961 |
Class C | .75% | .25% | 194,305 | 32,400 |
| $538,362 | $35,293 |
| Retained by FDC | |
| Fidelity Asset Manager 20% | |
Class A | $17,387 |
Class M | 3,468 |
Class C A | 1,576 |
| $22,431 | |
| Fidelity Asset Manager 30% | |
Class A | $5,821 |
Class M | 2,119 |
Class C A | 1,186 |
| $9,126 | |
| Fidelity Asset Manager 40% | |
Class A | $8,781 |
Class M | 6,286 |
Class C A | 816 |
| $15,883 | |
| Fidelity Asset Manager 50% | |
Class A | $29,393 |
Class M | 2,882 |
Class C A | 1,653 |
| $33,928 | |
| Fidelity Asset Manager 60% | |
Class A | $24,203 |
Class M | 3,114 |
Class C A | 2,399 |
| $29,716 | |
| Fidelity Asset Manager 70% | |
Class A | $80,548 |
Class M | 6,294 |
Class C A | 3,640 |
| $90,482 | |
| Fidelity Asset Manager 85% | |
Class A | $191,908 |
Class M | 3,703 |
Class C A | 5,094 |
| $200,705 |
| Amount | % of Class-Level Average Net Assets A | |
| Fidelity Asset Manager 20% | ||
Class A | $40,198 | .14 |
Class M | 19,499 | .14 |
Class C | 13,942 | .14 |
Asset Manager 20% | 1,565,375 | .08 |
Class I | 18,647 | .13 |
Class Z | 438,121 | .05 |
| $2,095,782 | ||
| Fidelity Asset Manager 30% | ||
Class A | $46,770 | .13 |
Class M | 14,798 | .13 |
Class C | 17,439 | .14 |
Asset Manager 30% | 665,894 | .08 |
Class I | 20,613 | .14 |
Class Z | 107,707 | .05 |
| $873,221 | ||
| Fidelity Asset Manager 40% | ||
Class A | $49,127 | .14 |
Class M | 8,028 | .12 |
Class C | 14,651 | .15 |
Asset Manager 40% | 658,554 | .09 |
Class I | 24,159 | .14 |
Class Z | 135,144 | .05 |
| $889,663 | ||
| Fidelity Asset Manager 50% | ||
Class A | $97,797 | .17 |
Class M | 39,463 | .16 |
Class C | 27,151 | .17 |
Asset Manager 50% | 4,392,206 | .12 |
Class I | 41,226 | .14 |
Class Z | 380,459 | .04 |
| $4,978,302 | ||
| Fidelity Asset Manager 60% | ||
Class A | $134,541 | .18 |
Class M | 39,838 | .17 |
Class C | 33,188 | .20 |
Asset Manager 60% | 1,220,548 | .12 |
Class I | 90,855 | .18 |
Class Z | 278,273 | .04 |
| $1,797,243 | ||
| Fidelity Asset Manager 70% | ||
Class A | $161,461 | .16 |
Class M | 53,200 | .16 |
Class C | 27,060 | .17 |
Asset Manager 70% | 2,299,990 | .12 |
Class I | 35,027 | .15 |
Class Z | 391,829 | .04 |
| $2,968,567 | ||
| Fidelity Asset Manager 85% | ||
Class A | $ 157,872 | .17 |
Class M | 37,819 | .17 |
Class C | 35,404 | .18 |
Asset Manager 85% | 1,264,299 | .14 |
Class I | 44,833 | .16 |
Class Z | 249,782 | .04 |
| $1,790,009 |
| % of Average Net Assets | |
| Fidelity Asset Manager 20% | .02 |
| Fidelity Asset Manager 30% | .03 |
| Fidelity Asset Manager 40% | .03 |
| Fidelity Asset Manager 50% | .02 |
| Fidelity Asset Manager 60% | .03 |
| Fidelity Asset Manager 70% | .02 |
| Fidelity Asset Manager 85% | .03 |
| Amount | |
| Fidelity Asset Manager 20% | $4 |
| Fidelity Asset Manager 30% | 2 |
| Fidelity Asset Manager 40% | 2 |
| Fidelity Asset Manager 50% | 7 |
| Fidelity Asset Manager 60% | 3 |
| Fidelity Asset Manager 70% | 4 |
| Fidelity Asset Manager 85% | 2 |
| Borrower or Lender | Average Loan Balance | Weighted Average Interest Rate | Interest Expense | |
| Fidelity Asset Manager 85% | Borrower | $5,008,000 | 4.07% | $1,696 |
| Amount | |
| Fidelity Asset Manager 20% | $7,983 |
| Fidelity Asset Manager 30% | 3,183 |
| Fidelity Asset Manager 40% | 3,173 |
| Fidelity Asset Manager 50% | 13,444 |
| Fidelity Asset Manager 60% | 5,287 |
| Fidelity Asset Manager 70% | 8,469 |
| Fidelity Asset Manager 85% | 4,772 |
| Total Security Lending Fees Paid to NFS | Security Lending Income From Securities Loaned to NFS | Value of Securities Loaned to NFS at Period End | |
| Fidelity Asset Manager 20% | $172 | $- | $- |
| Fidelity Asset Manager 30% | $181 | $- | $- |
| Fidelity Asset Manager 40% | $181 | $- | $- |
| Fidelity Asset Manager 50% | $871 | $- | $- |
| Fidelity Asset Manager 60% | $556 | $- | $- |
| Fidelity Asset Manager 70% | $1,427 | $- | $- |
| Fidelity Asset Manager 85% | $1,708 | $- | $- |
| Custodian credits | Transfer Agent credits | |
| Fidelity Asset Manager 20% | $- | $- |
| Class A | - | $55 |
| Class M | - | 359 |
| Class C | - | 25 |
| Fidelity Asset Manager 30% | - | - |
| Class M | - | 140 |
| Class C | - | 19 |
| Fidelity Asset Manager 40% | - | - |
| Class A | - | 8 |
| Class M | - | 54 |
| Fidelity Asset Manager 50% | - | - |
| Class M | - | 277 |
| Fidelity Asset Manager 60% | - | - |
| Class M | - | 187 |
| Fidelity Asset Manager 70% | - | - |
| Class M | - | 66 |
| Fidelity Asset Manager 85% | 15 | - |
| Class M | - | 147 |
| Fund-Level Amount | |
| Fidelity Asset Manager 20% | $57,214 |
| Fidelity Asset Manager 30% | 23,109 |
| Fidelity Asset Manager 40% | 22,866 |
| Fidelity Asset Manager 50% | 178,938 |
| Fidelity Asset Manager 60% | 70,112 |
| Fidelity Asset Manager 70% | 112,130 |
| Fidelity Asset Manager 85% | 62,909 |
Six months ended March 31, 2023 | Year ended September 30, 2022 | |
| Fidelity Asset Manager 20% | ||
| Distributions to shareholders | ||
| Class A | $2,109,254 | $991,390 |
| Class M | 977,829 | 421,840 |
| Class C | 649,959 | 250,693 |
| Asset Manager 20% | 141,979,792 | 85,201,958 |
| Class I | 1,074,025 | 564,762 |
| Class Z | 67,691,114 | 34,570,193 |
Total | $214,481,973 | $122,000,836 |
| Fidelity Asset Manager 30% | ||
| Distributions to shareholders | ||
| Class A | $2,879,486 | $1,450,459 |
| Class M | 882,548 | 413,081 |
| Class C | 880,253 | 398,808 |
| Asset Manager 30% | 67,275,456 | 44,055,920 |
| Class I | 1,128,188 | 1,487,743 |
| Class Z | 17,922,739 | 10,317,674 |
Total | $90,968,670 | $58,123,685 |
| Fidelity Asset Manager 40% | ||
| Distributions to shareholders | ||
| Class A | 3,392,274 | $1,639,380 |
| Class M | 605,521 | 277,419 |
| Class C | 850,399 | 395,975 |
| Asset Manager 40% | 75,322,994 | 45,248,272 |
| Class I | 1,709,476 | 1,013,722 |
| Class Z | 26,179,291 | 14,531,162 |
Total | $108,059,955 | $63,105,930 |
| Fidelity Asset Manager 50% | ||
| Distributions to shareholders | ||
| Class A | $6,769,754 | $3,721,847 |
| Class M | 2,824,180 | 1,484,787 |
| Class C | 1,719,660 | 1,078,039 |
| Asset Manager 50% | 429,155,365 | 273,464,153 |
| Class I | 3,362,774 | 2,421,243 |
| Class Z | 106,319,553 | 63,662,925 |
Total | $550,151,286 | $345,832,994 |
| Fidelity Asset Manager 60% | ||
| Distributions to shareholders | ||
| Class A | $5,829,870 | $3,902,281 |
| Class M | 1,719,076 | 1,101,083 |
| Class C | 1,017,325 | 858,414 |
| Asset Manager 60% | 86,418,079 | 63,251,257 |
| Class I | 4,209,470 | 2,945,047 |
| Class Z | 57,000,860 | 42,100,720 |
Total | $156,194,680 | $114,158,802 |
| Fidelity Asset Manager 70% | ||
| Distributions to shareholders | ||
| Class A | $11,630,364 | $5,556,535 |
| Class M | 3,792,389 | 1,832,295 |
| Class C | 1,619,138 | 693,159 |
| Asset Manager 70% | 232,428,831 | 125,547,326 |
| Class I | 2,972,044 | 1,586,971 |
| Class Z | 117,108,771 | 61,865,255 |
Total | $369,551,537 | $197,081,541 |
| Fidelity Asset Manager 85% | ||
| Distributions to shareholders | ||
| Class A | $8,386,513 | $5,950,158 |
| Class M | 1,930,817 | 1,556,477 |
| Class C | 1,489,984 | 1,116,460 |
| Asset Manager 85% | 87,417,456 | 70,669,724 |
| Class I | 2,665,270 | 1,988,931 |
| Class Z | 57,534,110 | 46,775,351 |
Total | $159,424,150 | $128,057,101 |
| Shares | Shares | Dollars | Dollars | |
Six months ended March 31, 2023 | Year ended September 30, 2022 | Six months ended March 31, 2023 | Year ended September 30, 2022 | |
| Fidelity Asset Manager 20% | ||||
| Class A | ||||
| Shares sold | 339,200 | 1,213,628 | $4,385,401 | $17,161,109 |
| Reinvestment of distributions | 160,622 | 67,107 | 2,048,249 | 958,183 |
| Shares redeemed | (538,803) | (1,102,850) | (6,983,697) | (15,442,378) |
| Net increase (decrease) | (38,981) | 177,885 | $(550,047) | $2,676,914 |
| Class M | ||||
| Shares sold | 140,331 | 260,742 | $1,804,511 | $3,700,387 |
| Reinvestment of distributions | 76,466 | 29,459 | 972,076 | 421,152 |
| Shares redeemed | (126,137) | (321,181) | (1,624,753) | (4,514,288) |
| Net increase (decrease) | 90,660 | (30,980) | $1,151,834 | $(392,749) |
| Class C | ||||
| Shares sold | 106,857 | 781,490 | $1,371,622 | $11,016,567 |
| Reinvestment of distributions | 51,075 | 17,269 | 644,337 | 247,715 |
| Shares redeemed | (221,913) | (1,021,837) | (2,847,361) | (13,973,536) |
| Net increase (decrease) | (63,981) | (223,078) | $(831,402) | $(2,709,254) |
| Asset Manager 20% | ||||
| Shares sold | 7,958,636 | 34,537,085 | $103,130,423 | $493,333,788 |
| Reinvestment of distributions | 10,502,509 | 5,685,424 | 134,169,451 | 81,364,653 |
| Shares redeemed | (29,832,407) | (69,009,967) | (386,860,073) | (964,227,064) |
| Net increase (decrease) | (11,371,262) | (28,787,458) | $(149,560,199) | $(389,528,623) |
| Class I | ||||
| Shares sold | 463,611 | 1,039,602 | $6,013,458 | $14,594,278 |
| Reinvestment of distributions | 80,375 | 36,840 | 1,026,746 | 525,188 |
| Shares redeemed | (514,964) | (1,004,799) | (6,675,127) | (14,055,036) |
| Net increase (decrease) | 29,022 | 71,643 | $365,077 | $1,064,430 |
| Class Z | ||||
| Shares sold | 28,716,561 | 58,153,285 | $372,705,656 | $852,912,615 |
| Reinvestment of distributions | 5,295,330 | 2,420,374 | 67,595,679 | 34,545,167 |
| Shares redeemed | (13,892,489) | (39,079,978) | (180,337,194) | (547,996,639) |
| Net increase (decrease) | 20,119,402 | 21,493,681 | $259,964,141 | $339,461,143 |
| Fidelity Asset Manager 30% | ||||
| Class A | ||||
| Shares sold | 411,108 | 1,638,808 | $4,500,837 | $20,111,023 |
| Reinvestment of distributions | 262,107 | 114,874 | 2,831,330 | 1,424,987 |
| Shares redeemed | (785,849) | (1,185,055) | (8,684,844) | (14,197,922) |
| Net increase (decrease) | (112,634) | 568,627 | $(1,352,677) | $7,338,088 |
| Class M | ||||
| Shares sold | 119,779 | 492,689 | $1,328,099 | $6,024,847 |
| Reinvestment of distributions | 81,827 | 33,190 | 882,138 | 412,720 |
| Shares redeemed | (233,302) | (506,164) | (2,559,955) | (6,083,193) |
| Net increase (decrease) | (31,696) | 19,715 | $(349,718) | $354,374 |
| Class C | ||||
| Shares sold | 103,482 | 621,466 | $1,121,213 | $7,670,984 |
| Reinvestment of distributions | 82,461 | 31,982 | 880,164 | 398,765 |
| Shares redeemed | (307,680) | (913,951) | (3,344,689) | (10,932,489) |
| Net increase (decrease) | (121,737) | (260,503) | $(1,343,312) | $(2,862,740) |
| Asset Manager 30% | ||||
| Shares sold | 4,562,611 | 25,304,829 | $50,245,426 | $313,879,604 |
| Reinvestment of distributions | 5,828,702 | 3,362,693 | 62,921,195 | 41,729,028 |
| Shares redeemed | (18,644,778) | (50,063,881) | (205,159,780) | (603,305,981) |
| Net increase (decrease) | (8,253,465) | (21,396,359) | $(91,993,159) | $(247,697,349) |
| Class I | ||||
| Shares sold | 2,099,019 | 927,221 | $23,558,077 | $11,540,764 |
| Reinvestment of distributions | 100,073 | 115,131 | 1,080,234 | 1,427,504 |
| Shares redeemed | (2,556,974) | (4,219,686) | (28,333,571) | (48,105,245) |
| Net increase (decrease) | (357,882) | (3,177,334) | $(3,695,260) | $(35,136,977) |
| Class Z | ||||
| Shares sold | 4,658,314 | 9,286,612 | $51,380,402 | $116,583,512 |
| Reinvestment of distributions | 1,653,947 | 829,481 | 17,855,013 | 10,268,903 |
| Shares redeemed | (3,067,227) | (10,199,285) | (33,857,952) | (123,276,606) |
| Net increase (decrease) | 3,245,034 | (83,192) | $35,377,463 | $3,575,809 |
| Fidelity Asset Manager 40% | ||||
| Class A | ||||
| Shares sold | 433,266 | 1,624,250 | $5,090,704 | $21,547,853 |
| Reinvestment of distributions | 295,998 | 120,588 | 3,389,727 | 1,637,134 |
| Shares redeemed | (729,912) | (1,013,908) | (8,568,381) | (13,044,713) |
| Net increase (decrease) | (648) | 730,930 | $(87,950) | $10,140,274 |
| Class M | ||||
| Shares sold | 117,425 | 141,483 | $1,394,276 | $1,854,906 |
| Reinvestment of distributions | 51,892 | 19,968 | 593,730 | 272,231 |
| Shares redeemed | (79,511) | (163,695) | (935,199) | (2,112,478) |
| Net increase (decrease) | 89,806 | (2,244) | $1,052,807 | $14,659 |
| Class C | ||||
| Shares sold | 98,611 | 445,803 | $1,156,133 | $5,889,712 |
| Reinvestment of distributions | 74,383 | 28,802 | 847,964 | 395,493 |
| Shares redeemed | (283,618) | (709,727) | (3,314,388) | (9,131,451) |
| Net increase (decrease) | (110,624) | (235,122) | $(1,310,291) | $(2,846,246) |
| Asset Manager 40% | ||||
| Shares sold | 5,088,750 | 30,122,919 | $59,822,435 | $400,913,648 |
| Reinvestment of distributions | 6,078,750 | 3,151,983 | 69,552,916 | 42,769,069 |
| Shares redeemed | (15,866,682) | (33,206,313) | (186,434,858) | (429,561,437) |
| Net increase (decrease) | (4,699,182) | 68,589 | $(57,059,507) | $14,121,280 |
| Class I | ||||
| Shares sold | 486,724 | 833,599 | $5,724,187 | $10,882,785 |
| Reinvestment of distributions | 127,034 | 60,145 | 1,454,542 | 815,909 |
| Shares redeemed | (472,820) | (957,436) | (5,535,230) | (12,321,248) |
| Net increase (decrease) | 140,938 | (63,692) | $1,643,499 | $(622,554) |
| Class Z | ||||
| Shares sold | 4,768,193 | 8,734,021 | $55,705,367 | $118,135,811 |
| Reinvestment of distributions | 2,284,750 | 1,070,159 | 26,141,858 | 14,495,871 |
| Shares redeemed | (3,329,439) | (6,274,751) | (39,183,622) | (80,857,226) |
| Net increase (decrease) | 3,723,504 | 3,529,429 | $42,663,603 | $51,774,456 |
| Fidelity Asset Manager 50% | ||||
| Class A | ||||
| Shares sold | 527,234 | 1,097,694 | $9,578,264 | $22,893,055 |
| Reinvestment of distributions | 371,346 | 166,313 | 6,574,277 | 3,608,779 |
| Shares redeemed | (572,333) | (1,126,804) | (10,458,709) | (22,919,785) |
| Net increase (decrease) | 326,247 | 137,203 | $5,693,832 | $3,582,049 |
| Class M | ||||
| Shares sold | 154,979 | 406,424 | $2,820,508 | $8,571,943 |
| Reinvestment of distributions | 159,444 | 68,192 | 2,820,862 | 1,483,171 |
| Shares redeemed | (210,240) | (399,715) | (3,861,125) | (8,135,490) |
| Net increase (decrease) | 104,183 | 74,901 | $1,780,245 | $1,919,624 |
| Class C | ||||
| Shares sold | 91,014 | 356,481 | $1,648,650 | $7,555,005 |
| Reinvestment of distributions | 96,908 | 48,862 | 1,698,976 | 1,064,828 |
| Shares redeemed | (290,313) | (947,734) | (5,262,968) | (19,409,950) |
| Net increase (decrease) | (102,391) | (542,391) | $(1,915,342) | $(10,790,117) |
| Asset Manager 50% | ||||
| Shares sold | 7,676,966 | 27,309,440 | $141,299,969 | $577,432,799 |
| Reinvestment of distributions | 22,772,252 | 11,987,047 | 404,978,547 | 260,572,763 |
| Shares redeemed | (30,616,347) | (61,543,211) | (562,886,637) | (1,266,134,074) |
| Net increase (decrease) | (167,129) | (22,246,724) | $(16,608,121) | $(428,128,512) |
| Class I | ||||
| Shares sold | 269,376 | 643,396 | $4,923,948 | $13,349,939 |
| Reinvestment of distributions | 175,750 | 102,735 | 3,118,781 | 2,227,359 |
| Shares redeemed | (830,026) | (1,045,348) | (15,266,773) | (20,852,276) |
| Net increase (decrease) | (384,900) | (299,217) | $(7,224,044) | $(5,274,978) |
| Class Z | ||||
| Shares sold | 8,779,789 | 14,429,540 | $160,603,647 | $317,156,617 |
| Reinvestment of distributions | 5,995,269 | 2,940,624 | 106,266,274 | 63,625,470 |
| Shares redeemed | (6,168,756) | (12,520,527) | (112,900,596) | (254,971,772) |
| Net increase (decrease) | 8,606,302 | 4,849,637 | $153,969,325 | $125,810,315 |
| Fidelity Asset Manager 60% | ||||
| Class A | ||||
| Shares sold | 669,360 | 1,933,013 | $8,942,943 | $28,794,422 |
| Reinvestment of distributions | 442,750 | 238,708 | 5,742,465 | 3,845,582 |
| Shares redeemed | (787,163) | (1,739,346) | (10,512,566) | (25,611,081) |
| Net increase (decrease) | 324,947 | 432,375 | $4,172,842 | $7,028,923 |
| Class M | ||||
| Shares sold | 120,260 | 404,590 | $1,588,489 | $5,941,698 |
| Reinvestment of distributions | 132,108 | 68,230 | 1,705,515 | 1,094,411 |
| Shares redeemed | (223,244) | (437,923) | (2,986,941) | (6,435,330) |
| Net increase (decrease) | 29,124 | 34,897 | $307,063 | $600,779 |
| Class C | ||||
| Shares sold | 241,264 | 761,108 | $3,159,440 | $11,638,028 |
| Reinvestment of distributions | 79,236 | 53,957 | 1,013,431 | 856,301 |
| Shares redeemed | (442,077) | (1,764,942) | (5,742,284) | (25,816,724) |
| Net increase (decrease) | (121,577) | (949,877) | $(1,569,413) | $(13,322,395) |
| Asset Manager 60% | ||||
| Shares sold | 10,118,988 | 24,399,337 | $135,538,075 | $372,698,318 |
| Reinvestment of distributions | 6,154,563 | 3,711,829 | 80,193,953 | 60,094,504 |
| Shares redeemed | (13,762,778) | (28,208,147) | (184,869,236) | (417,194,958) |
| Net increase (decrease) | 2,510,773 | (96,981) | $30,862,792 | $15,597,864 |
| Class I | ||||
| Shares sold | 504,939 | 1,457,978 | $6,827,725 | $21,857,509 |
| Reinvestment of distributions | 316,435 | 178,293 | 4,126,312 | 2,888,342 |
| Shares redeemed | (701,530) | (1,387,591) | (9,478,038) | (20,572,676) |
| Net increase (decrease) | 119,844 | 248,680 | $1,475,999 | $4,173,175 |
| Class Z | ||||
| Shares sold | 5,877,968 | 20,950,179 | $79,056,293 | $332,907,746 |
| Reinvestment of distributions | 4,361,118 | 2,601,636 | 56,781,753 | 42,068,451 |
| Shares redeemed | (6,577,061) | (14,604,794) | (88,066,293) | (212,747,799) |
| Net increase (decrease) | 3,662,025 | 8,947,021 | $47,771,753 | $162,228,398 |
| Fidelity Asset Manager 70% | ||||
| Class A | ||||
| Shares sold | 552,335 | 1,232,167 | $12,947,247 | $32,684,583 |
| Reinvestment of distributions | 497,456 | 185,884 | 11,227,571 | 5,366,481 |
| Shares redeemed | (526,093) | (1,115,506) | (12,319,198) | (29,516,026) |
| Net increase (decrease) | 523,698 | 302,545 | $11,855,620 | $8,535,038 |
| Class M | ||||
| Shares sold | 140,392 | 365,881 | $3,304,791 | $9,976,911 |
| Reinvestment of distributions | 166,294 | 62,819 | 3,756,587 | 1,814,208 |
| Shares redeemed | (216,238) | (462,420) | (5,012,878) | (12,080,636) |
| Net increase (decrease) | 90,448 | (33,720) | $2,048,500 | $(289,517) |
| Class C | ||||
| Shares sold | 136,735 | 244,063 | $3,208,529 | $6,432,819 |
| Reinvestment of distributions | 71,764 | 24,031 | 1,618,279 | 692,811 |
| Shares redeemed | (165,459) | (526,175) | (3,857,503) | (14,054,121) |
| Net increase (decrease) | 43,040 | (258,081) | $969,305 | $(6,928,491) |
| Asset Manager 70% | ||||
| Shares sold | 5,248,018 | 13,461,929 | $123,868,996 | $363,284,018 |
| Reinvestment of distributions | 9,702,638 | 4,176,392 | 219,376,640 | 120,739,485 |
| Shares redeemed | (10,542,782) | (19,789,580) | (248,483,246) | (523,368,127) |
| Net increase (decrease) | 4,407,874 | (2,151,259) | $94,762,390 | $(39,344,624) |
| Class I | ||||
| Shares sold | 272,613 | 611,462 | $6,405,383 | $16,733,716 |
| Reinvestment of distributions | 123,913 | 52,797 | 2,804,156 | 1,527,414 |
| Shares redeemed | (275,100) | (649,608) | (6,405,228) | (17,306,780) |
| Net increase (decrease) | 121,426 | 14,651 | $2,804,311 | $954,350 |
| Class Z | ||||
| Shares sold | 5,053,830 | 11,306,690 | $118,922,338 | $323,885,349 |
| Reinvestment of distributions | 5,183,731 | 2,141,090 | 116,996,811 | 61,791,848 |
| Shares redeemed | (3,607,735) | (7,017,762) | (84,737,253) | (182,460,530) |
| Net increase (decrease) | 6,629,826 | 6,430,018 | $151,181,896 | $203,216,667 |
| Fidelity Asset Manager 85% | ||||
| Class A | ||||
| Shares sold | 880,607 | 1,954,912 | $18,669,647 | $46,844,607 |
| Reinvestment of distributions | 406,693 | 223,610 | 8,349,398 | 5,909,999 |
| Shares redeemed | (562,540) | (1,270,677) | (11,980,477) | (30,396,928) |
| Net increase (decrease) | 724,760 | 907,845 | $15,038,568 | $22,357,678 |
| Class M | ||||
| Shares sold | 107,439 | 294,786 | $2,280,650 | $7,228,937 |
| Reinvestment of distributions | 94,377 | 59,085 | 1,924,349 | 1,550,980 |
| Shares redeemed | (228,207) | (356,369) | (4,866,649) | (8,566,938) |
| Net increase (decrease) | (26,391) | (2,498) | $(661,650) | $212,979 |
| Class C | ||||
| Shares sold | 174,249 | 372,668 | $3,638,035 | $8,760,605 |
| Reinvestment of distributions | 73,597 | 42,825 | 1,485,932 | 1,113,453 |
| Shares redeemed | (251,343) | (525,731) | (5,237,669) | (12,376,554) |
| Net increase (decrease) | (3,497) | (110,238) | $(113,702) | $(2,502,496) |
| Asset Manager 85% | ||||
| Shares sold | 3,377,264 | 10,443,635 | $72,792,791 | $258,814,937 |
| Reinvestment of distributions | 4,009,724 | 2,550,056 | 83,241,869 | 68,112,000 |
| Shares redeemed | (5,725,987) | (12,083,008) | (122,932,572) | (291,630,863) |
| Net increase (decrease) | 1,661,001 | 910,683 | $33,102,088 | $35,296,074 |
| Class I | ||||
| Shares sold | 274,842 | 636,693 | $5,868,891 | $15,242,748 |
| Reinvestment of distributions | 122,678 | 73,939 | 2,539,426 | 1,969,001 |
| Shares redeemed | (329,181) | (475,195) | (7,027,130) | (11,332,371) |
| Net increase (decrease) | 68,339 | 235,437 | $1,381,187 | $5,879,378 |
| Class Z | ||||
| Shares sold | 4,741,638 | 13,530,246 | $100,578,116 | $344,125,128 |
| Reinvestment of distributions | 2,786,073 | 1,760,616 | 57,504,545 | 46,761,952 |
| Shares redeemed | (7,343,162) | (8,877,361) | (157,568,606) | (209,492,051) |
| Net increase (decrease) | 184,549 | 6,413,501 | $514,055 | $181,395,029 |
| Fund | Affiliated % |
| Fidelity Asset Manager 20% | 33% |
| Fidelity Asset Manager 60% | 35% |
| Fidelity Asset Manager 70% | 31% |
| Fidelity Asset Manager 85% | 33% |
| The Example is based on an investment of $1,000 invested at the beginning of the period and held for the entire period (October 1, 2022 to March 31, 2023). |
Annualized Expense Ratio- A | Beginning Account Value October 1, 2022 | Ending Account Value March 31, 2023 | Expenses Paid During Period- C October 1, 2022 to March 31, 2023 | |||||||
| Fidelity Asset Manager® 20% | ||||||||||
| Class A | .81% | |||||||||
| Actual | $ 1,000 | $ 1,058.30 | $ 4.16 | |||||||
Hypothetical- B | $ 1,000 | $ 1,020.89 | $ 4.08 | |||||||
| Class M | 1.06% | |||||||||
| Actual | $ 1,000 | $ 1,057.10 | $ 5.44 | |||||||
Hypothetical- B | $ 1,000 | $ 1,019.65 | $ 5.34 | |||||||
| Class C | 1.57% | |||||||||
| Actual | $ 1,000 | $ 1,054.10 | $ 8.04 | |||||||
Hypothetical- B | $ 1,000 | $ 1,017.10 | $ 7.90 | |||||||
| Fidelity Asset Manager® 20% | .51% | |||||||||
| Actual | $ 1,000 | $ 1,059.80 | $ 2.62 | |||||||
Hypothetical- B | $ 1,000 | $ 1,022.39 | $ 2.57 | |||||||
| Class I | .55% | |||||||||
| Actual | $ 1,000 | $ 1,059.40 | $ 2.82 | |||||||
Hypothetical- B | $ 1,000 | $ 1,022.19 | $ 2.77 | |||||||
| Class Z | .47% | |||||||||
| Actual | $ 1,000 | $ 1,060.00 | $ 2.41 | |||||||
Hypothetical- B | $ 1,000 | $ 1,022.59 | $ 2.37 | |||||||
| Fidelity Asset Manager® 30% | ||||||||||
| Class A | .82% | |||||||||
| Actual | $ 1,000 | $ 1,075.20 | $ 4.24 | |||||||
Hypothetical- B | $ 1,000 | $ 1,020.84 | $ 4.13 | |||||||
| Class M | 1.07% | |||||||||
| Actual | $ 1,000 | $ 1,074.00 | $ 5.53 | |||||||
Hypothetical- B | $ 1,000 | $ 1,019.60 | $ 5.39 | |||||||
| Class C | 1.58% | |||||||||
| Actual | $ 1,000 | $ 1,072.00 | $ 8.16 | |||||||
Hypothetical- B | $ 1,000 | $ 1,017.05 | $ 7.95 | |||||||
| Fidelity Asset Manager® 30% | .52% | |||||||||
| Actual | $ 1,000 | $ 1,076.90 | $ 2.69 | |||||||
Hypothetical- B | $ 1,000 | $ 1,022.34 | $ 2.62 | |||||||
| Class I | .58% | |||||||||
| Actual | $ 1,000 | $ 1,077.40 | $ 3.00 | |||||||
Hypothetical- B | $ 1,000 | $ 1,022.04 | $ 2.92 | |||||||
| Class Z | .49% | |||||||||
| Actual | $ 1,000 | $ 1,077.10 | $ 2.54 | |||||||
Hypothetical- B | $ 1,000 | $ 1,022.49 | $ 2.47 | |||||||
| Fidelity Asset Manager® 40% | ||||||||||
| Class A | .82% | |||||||||
| Actual | $ 1,000 | $ 1,090.80 | $ 4.27 | |||||||
Hypothetical- B | $ 1,000 | $ 1,020.84 | $ 4.13 | |||||||
| Class M | 1.06% | |||||||||
| Actual | $ 1,000 | $ 1,088.80 | $ 5.52 | |||||||
Hypothetical- B | $ 1,000 | $ 1,019.65 | $ 5.34 | |||||||
| Class C | 1.59% | |||||||||
| Actual | $ 1,000 | $ 1,086.70 | $ 8.27 | |||||||
Hypothetical- B | $ 1,000 | $ 1,017.00 | $ 8.00 | |||||||
| Fidelity Asset Manager® 40% | .52% | |||||||||
| Actual | $ 1,000 | $ 1,092.70 | $ 2.71 | |||||||
Hypothetical- B | $ 1,000 | $ 1,022.34 | $ 2.62 | |||||||
| Class I | .57% | |||||||||
| Actual | $ 1,000 | $ 1,092.30 | $ 2.97 | |||||||
Hypothetical- B | $ 1,000 | $ 1,022.09 | $ 2.87 | |||||||
| Class Z | .49% | |||||||||
| Actual | $ 1,000 | $ 1,092.00 | $ 2.56 | |||||||
Hypothetical- B | $ 1,000 | $ 1,022.49 | $ 2.47 | |||||||
| Fidelity Asset Manager® 50% | ||||||||||
| Class A | .91% | |||||||||
| Actual | $ 1,000 | $ 1,105.80 | $ 4.78 | |||||||
Hypothetical- B | $ 1,000 | $ 1,020.39 | $ 4.58 | |||||||
| Class M | 1.15% | |||||||||
| Actual | $ 1,000 | $ 1,104.50 | $ 6.03 | |||||||
Hypothetical- B | $ 1,000 | $ 1,019.20 | $ 5.79 | |||||||
| Class C | 1.66% | |||||||||
| Actual | $ 1,000 | $ 1,101.70 | $ 8.70 | |||||||
Hypothetical- B | $ 1,000 | $ 1,016.65 | $ 8.35 | |||||||
| Fidelity Asset Manager® 50% | .61% | |||||||||
| Actual | $ 1,000 | $ 1,107.60 | $ 3.21 | |||||||
Hypothetical- B | $ 1,000 | $ 1,021.89 | $ 3.07 | |||||||
| Class I | .64% | |||||||||
| Actual | $ 1,000 | $ 1,107.60 | $ 3.36 | |||||||
Hypothetical- B | $ 1,000 | $ 1,021.74 | $ 3.23 | |||||||
| Class Z | .53% | |||||||||
| Actual | $ 1,000 | $ 1,107.90 | $ 2.79 | |||||||
Hypothetical- B | $ 1,000 | $ 1,022.29 | $ 2.67 | |||||||
| Fidelity Asset Manager® 60% | ||||||||||
| Class A | .99% | |||||||||
| Actual | $ 1,000 | $ 1,120.80 | $ 5.23 | |||||||
Hypothetical- B | $ 1,000 | $ 1,020.00 | $ 4.99 | |||||||
| Class M | 1.23% | |||||||||
| Actual | $ 1,000 | $ 1,119.50 | $ 6.50 | |||||||
Hypothetical- B | $ 1,000 | $ 1,018.80 | $ 6.19 | |||||||
| Class C | 1.76% | |||||||||
| Actual | $ 1,000 | $ 1,117.20 | $ 9.29 | |||||||
Hypothetical- B | $ 1,000 | $ 1,016.16 | $ 8.85 | |||||||
| Fidelity Asset Manager® 60% | .68% | |||||||||
| Actual | $ 1,000 | $ 1,122.00 | $ 3.60 | |||||||
Hypothetical- B | $ 1,000 | $ 1,021.54 | $ 3.43 | |||||||
| Class I | .74% | |||||||||
| Actual | $ 1,000 | $ 1,122.10 | $ 3.92 | |||||||
Hypothetical- B | $ 1,000 | $ 1,021.24 | $ 3.73 | |||||||
| Class Z | .61% | |||||||||
| Actual | $ 1,000 | $ 1,123.00 | $ 3.23 | |||||||
Hypothetical- B | $ 1,000 | $ 1,021.89 | $ 3.07 | |||||||
| Fidelity Asset Manager® 70% | ||||||||||
| Class A | .96% | |||||||||
| Actual | $ 1,000 | $ 1,135.10 | $ 5.11 | |||||||
Hypothetical- B | $ 1,000 | $ 1,020.14 | $ 4.84 | |||||||
| Class M | 1.21% | |||||||||
| Actual | $ 1,000 | $ 1,133.80 | $ 6.44 | |||||||
Hypothetical- B | $ 1,000 | $ 1,018.90 | $ 6.09 | |||||||
| Class C | 1.72% | |||||||||
| Actual | $ 1,000 | $ 1,130.60 | $ 9.14 | |||||||
Hypothetical- B | $ 1,000 | $ 1,016.36 | $ 8.65 | |||||||
| Fidelity Asset Manager® 70% | .67% | |||||||||
| Actual | $ 1,000 | $ 1,136.50 | $ 3.57 | |||||||
Hypothetical- B | $ 1,000 | $ 1,021.59 | $ 3.38 | |||||||
| Class I | .70% | |||||||||
| Actual | $ 1,000 | $ 1,136.20 | $ 3.73 | |||||||
Hypothetical- B | $ 1,000 | $ 1,021.44 | $ 3.53 | |||||||
| Class Z | .59% | |||||||||
| Actual | $ 1,000 | $ 1,137.20 | $ 3.14 | |||||||
Hypothetical- B | $ 1,000 | $ 1,021.99 | $ 2.97 | |||||||
| Fidelity Asset Manager® 85% | ||||||||||
| Class A | .98% | |||||||||
| Actual | $ 1,000 | $ 1,156.30 | $ 5.27 | |||||||
Hypothetical- B | $ 1,000 | $ 1,020.04 | $ 4.94 | |||||||
| Class M | 1.22% | |||||||||
| Actual | $ 1,000 | $ 1,154.60 | $ 6.55 | |||||||
Hypothetical- B | $ 1,000 | $ 1,018.85 | $ 6.14 | |||||||
| Class C | 1.74% | |||||||||
| Actual | $ 1,000 | $ 1,151.60 | $ 9.33 | |||||||
Hypothetical- B | $ 1,000 | $ 1,016.26 | $ 8.75 | |||||||
| Fidelity Asset Manager® 85% | .69% | |||||||||
| Actual | $ 1,000 | $ 1,157.90 | $ 3.71 | |||||||
Hypothetical- B | $ 1,000 | $ 1,021.49 | $ 3.48 | |||||||
| Class I | .72% | |||||||||
| Actual | $ 1,000 | $ 1,157.20 | $ 3.87 | |||||||
Hypothetical- B | $ 1,000 | $ 1,021.34 | $ 3.63 | |||||||
| Class Z | .60% | |||||||||
| Actual | $ 1,000 | $ 1,158.40 | $ 3.23 | |||||||
Hypothetical- B | $ 1,000 | $ 1,021.94 | $ 3.02 | |||||||
- Highly liquid investments - cash or convertible to cash within three business days or less
- Moderately liquid investments - convertible to cash in three to seven calendar days
- Less liquid investments - can be sold or disposed of, but not settled, within seven calendar days
- Illiquid investments - cannot be sold or disposed of within seven calendar days
 |


Contents
Top Holdings (% of Fund's net assets) | ||
| Fidelity U.S. Sustainability Index Fund | 26.3 | |
| Fidelity Sustainable International Equity Fund | 18.5 | |
| Fidelity Sustainable Core Plus Bond Fund | 13.3 | |
| Fidelity Sustainable U.S. Equity ETF | 11.1 | |
| Fidelity Inflation-Protected Bond Index Fund | 7.0 | |
| Fidelity International Sustainability Index Fund | 6.9 | |
| Fidelity Sustainable Emerging Markets Equity Fund | 5.8 | |
| Fidelity Sustainability Bond Index Fund | 4.4 | |
| Fidelity Long-Term Treasury Bond Index Fund | 4.1 | |
| Fidelity Sustainable Low Duration Bond Fund | 2.6 | |
| 100.0 | ||
Asset Allocation (% of Fund's net assets) |
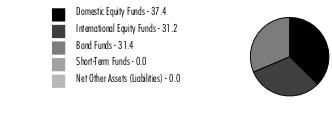 |
Percentages shown as 0.0% may reflect amounts less than 0.05%. |
| Domestic Equity Funds - 37.4% | |||
| Shares | Value ($) | ||
| Fidelity Sustainable U.S. Equity ETF (a) | 56,542 | 1,106,550 | |
| Fidelity U.S. Sustainability Index Fund (a) | 144,718 | 2,606,367 | |
| TOTAL DOMESTIC EQUITY FUNDS (Cost $3,542,054) | 3,712,917 | ||
| International Equity Funds - 31.2% | |||
| Shares | Value ($) | ||
| Fidelity International Sustainability Index Fund (a) | 61,042 | 688,548 | |
| Fidelity Sustainable Emerging Markets Equity Fund (a) | 72,257 | 576,611 | |
| Fidelity Sustainable International Equity Fund (a) | 214,938 | 1,831,270 | |
| TOTAL INTERNATIONAL EQUITY FUNDS (Cost $2,931,122) | 3,096,429 | ||
| Bond Funds - 31.4% | |||
| Shares | Value ($) | ||
| Fidelity Inflation-Protected Bond Index Fund (a) | 74,127 | 691,604 | |
| Fidelity Long-Term Treasury Bond Index Fund (a) | 37,635 | 404,575 | |
| Fidelity Sustainability Bond Index Fund (a) | 47,302 | 441,331 | |
| Fidelity Sustainable Core Plus Bond Fund (a) | 141,525 | 1,321,845 | |
| Fidelity Sustainable Low Duration Bond Fund (a) | 25,664 | 257,671 | |
| TOTAL BOND FUNDS (Cost $3,153,378) | 3,117,026 | ||
| Short-Term Funds - 0.0% | |||
| Shares | Value ($) | ||
Fidelity Cash Central Fund 4.86% (b) (Cost $1,420) | 1,420 | 1,420 | |
| TOTAL INVESTMENT IN SECURITIES - 100.0% (Cost $9,627,974) | 9,927,792 |
NET OTHER ASSETS (LIABILITIES) - 0.0% | 2,007 |
| NET ASSETS - 100.0% | 9,929,799 |
| ETF | - | EXCHANGE-TRADED FUND |
| (a) | Affiliated Fund |
| (b) | Affiliated fund that is generally available only to investment companies and other accounts managed by Fidelity Investments. The rate quoted is the annualized seven-day yield of the fund at period end. A complete unaudited listing of the fund's holdings as of its most recent quarter end is available upon request. In addition, each Fidelity Central Fund's financial statements are available on the SEC's website or upon request. |
| Affiliate | Value, beginning of period ($) | Purchases ($) | Sales Proceeds ($) | Dividend Income ($) | Realized Gain (loss) ($) | Change in Unrealized appreciation (depreciation) ($) | Value, end of period ($) | % ownership, end of period |
| Fidelity Cash Central Fund 4.86% | 464 | 161,247 | 160,291 | 54 | - | - | 1,420 | 0.0% |
| Total | 464 | 161,247 | 160,291 | 54 | - | - | 1,420 | |
| Affiliate | Value, beginning of period ($) | Purchases ($) | Sales Proceeds ($) | Dividend Income ($) | Realized Gain (loss) ($) | Change in Unrealized appreciation (depreciation) ($) | Value, end of period ($) |
| Fidelity Inflation-Protected Bond Index Fund | 442,310 | 499,622 | 227,177 | 54,227 | (22,858) | (293) | 691,604 |
| Fidelity International Sustainability Index Fund | 330,703 | 369,486 | 105,371 | 11,780 | (7,871) | 101,601 | 688,548 |
| Fidelity Long-Term Treasury Bond Index Fund | 247,345 | 300,909 | 166,843 | 5,122 | (16,029) | 39,193 | 404,575 |
| Fidelity Sustainability Bond Index Fund | 165,311 | 306,050 | 38,262 | 3,887 | (1,203) | 9,435 | 441,331 |
| Fidelity Sustainable Core Plus Bond Fund | 497,093 | 922,708 | 117,418 | 18,785 | (3,715) | 23,177 | 1,321,845 |
| Fidelity Sustainable Emerging Markets Equity Fund | 319,811 | 427,326 | 241,807 | 3,459 | (879) | 72,160 | 576,611 |
| Fidelity Sustainable International Equity Fund | 876,458 | 967,208 | 269,947 | 7,257 | (22,871) | 280,422 | 1,831,270 |
| Fidelity Sustainable Low Duration Bond Fund | 70,084 | 222,296 | 35,744 | 1,136 | (51) | 1,086 | 257,671 |
| Fidelity Sustainable U.S. Equity ETF | 569,900 | 424,098 | 13,656 | 5,806 | (625) | 126,833 | 1,106,550 |
| Fidelity U.S. Sustainability Index Fund | 1,349,419 | 1,802,184 | 813,827 | 27,536 | (50,945) | 319,536 | 2,606,367 |
| 4,868,434 | 6,241,887 | 2,030,052 | 138,995 | (127,047) | 973,150 | 9,926,372 |
| Valuation Inputs at Reporting Date: | ||||
| Description | Total ($) | Level 1 ($) | Level 2 ($) | Level 3 ($) |
Investments in Securities: | ||||
| Domestic Equity Funds | 3,712,917 | 3,712,917 | - | - |
| International Equity Funds | 3,096,429 | 3,096,429 | - | - |
| Bond Funds | 3,117,026 | 3,117,026 | - | - |
| Short-Term Funds | 1,420 | 1,420 | - | - |
| Total Investments in Securities: | 9,927,792 | 9,927,792 | - | - |
| Statement of Assets and Liabilities | ||||
March 31, 2023 (Unaudited) | ||||
| Assets | ||||
| Investment in securities, at value - See accompanying schedule: | ||||
Fidelity Central Funds (cost $1,420) | $ | 1,420 | ||
Other affiliated issuers (cost $9,626,554) | 9,926,372 | |||
| Total Investment in Securities (cost $9,627,974) | $ | 9,927,792 | ||
| Cash | 1,823 | |||
| Receivable for fund shares sold | 31,132 | |||
| Distributions receivable from Fidelity Central Funds | 6 | |||
| Receivable from investment adviser for expense reductions | 376 | |||
Total assets | 9,961,129 | |||
| Liabilities | ||||
| Payable for investments purchased | $ | 29,406 | ||
| Payable for fund shares redeemed | 814 | |||
| Accrued management fee | 774 | |||
| Distribution and service plan fees payable | 336 | |||
| Total Liabilities | 31,330 | |||
| Net Assets | $ | 9,929,799 | ||
| Net Assets consist of: | ||||
| Paid in capital | $ | 9,862,419 | ||
| Total accumulated earnings (loss) | 67,380 | |||
| Net Assets | $ | 9,929,799 | ||
| Net Asset Value and Maximum Offering Price | ||||
| Class A : | ||||
Net Asset Value and redemption price per share ($211,311 ÷ 23,995 shares) (a) | $ | 8.81 | ||
| Maximum offering price per share (100/94.25 of $8.81) | $ | 9.35 | ||
| Class M : | ||||
Net Asset Value and redemption price per share ($194,100 ÷ 22,054 shares) (a) | $ | 8.80 | ||
| Maximum offering price per share (100/96.50 of $8.80) | $ | 9.12 | ||
| Class C : | ||||
Net Asset Value and offering price per share ($266,057 ÷ 30,288 shares) (a) | $ | 8.78 | ||
| Fidelity Sustainable Multi-Asset Fund : | ||||
Net Asset Value , offering price and redemption price per share ($8,616,267 ÷ 977,757 shares) | $ | 8.81 | ||
| Class I : | ||||
Net Asset Value , offering price and redemption price per share ($642,064 ÷ 72,860 shares) | $ | 8.81 | ||
(a)Redemption price per share is equal to net asset value less any applicable contingent deferred sales charge. | ||||
| Statement of Operations | ||||
Six months ended March 31, 2023 (Unaudited) | ||||
| Investment Income | ||||
| Dividends: | ||||
| Affiliated issuers | $ | 138,995 | ||
| Income from Fidelity Central Funds | 54 | |||
| Total Income | 139,049 | |||
| Expenses | ||||
| Management fee | $ | 3,845 | ||
| Distribution and service plan fees | 1,963 | |||
| Independent trustees' fees and expenses | 13 | |||
| Total expenses before reductions | 5,821 | |||
| Expense reductions | (2,077) | |||
| Total expenses after reductions | 3,744 | |||
| Net Investment income (loss) | 135,305 | |||
| Realized and Unrealized Gain (Loss) | ||||
| Net realized gain (loss) on: | ||||
| Investment Securities: | ||||
| Affiliated issuers | (127,047) | |||
| Total net realized gain (loss) | (127,047) | |||
| Change in net unrealized appreciation (depreciation) on: | ||||
| Investment Securities: | ||||
| Affiliated issuers | 973,150 | |||
| Total change in net unrealized appreciation (depreciation) | 973,150 | |||
| Net gain (loss) | 846,103 | |||
| Net increase (decrease) in net assets resulting from operations | $ | 981,408 | ||
| Statement of Changes in Net Assets | ||||
Six months ended March 31, 2023 (Unaudited) | For the period February 10, 2022 (commencement of operations) through September 30, 2022 | |||
| Increase (Decrease) in Net Assets | ||||
| Operations | ||||
| Net investment income (loss) | $ | 135,305 | $ | 7,371 |
| Net realized gain (loss) | (127,047) | (120,181) | ||
| Change in net unrealized appreciation (depreciation) | 973,150 | (673,332) | ||
| Net increase (decrease) in net assets resulting from operations | 981,408 | (786,142) | ||
| Distributions to shareholders | (127,886) | - | ||
| Share transactions - net increase (decrease) | 4,206,095 | 5,656,324 | ||
| Total increase (decrease) in net assets | 5,059,617 | 4,870,182 | ||
| Net Assets | ||||
| Beginning of period | 4,870,182 | - | ||
| End of period | $ | 9,929,799 | $ | 4,870,182 |
| Fidelity Advisor® Sustainable Multi-Asset Fund Class A |
Six months ended (Unaudited) March 31, 2023 | Years ended September 30, 2022 A | |||
Selected Per-Share Data | ||||
| Net asset value, beginning of period | $ | 7.79 | $ | 10.00 |
| Income from Investment Operations | ||||
Net investment income (loss) B,C | .14 | .02 | ||
| Net realized and unrealized gain (loss) | 1.01 | (2.23) | ||
| Total from investment operations | 1.15 | (2.21) | ||
| Distributions from net investment income | (.13) | - | ||
| Total distributions | (.13) | - | ||
| Net asset value, end of period | $ | 8.81 | $ | 7.79 |
Total Return D,E,F | 14.86% | (22.10)% | ||
Ratios to Average Net Assets C,G,H | ||||
| Expenses before reductions | .35% I | .35% I | ||
| Expenses net of fee waivers, if any | .30% I | .30% I | ||
| Expenses net of all reductions | .29% I | .30% I | ||
| Net investment income (loss) | 3.32% I | .30% I | ||
| Supplemental Data | ||||
| Net assets, end of period (000 omitted) | $ | 211 | $ | 163 |
Portfolio turnover rate J | 53% I | 111% I |
| Fidelity Advisor® Sustainable Multi-Asset Fund Class M |
Six months ended (Unaudited) March 31, 2023 | Years ended September 30, 2022 A | |||
Selected Per-Share Data | ||||
| Net asset value, beginning of period | $ | 7.77 | $ | 10.00 |
| Income from Investment Operations | ||||
Net investment income (loss) B,C | .13 | - D | ||
| Net realized and unrealized gain (loss) | 1.01 | (2.23) | ||
| Total from investment operations | 1.14 | (2.23) | ||
| Distributions from net investment income | (.11) | - | ||
| Total distributions | (.11) | - | ||
| Net asset value, end of period | $ | 8.80 | $ | 7.77 |
Total Return E,F,G | 14.77% | (22.30)% | ||
Ratios to Average Net Assets C,H,I | ||||
| Expenses before reductions | .60% J | .60% J | ||
| Expenses net of fee waivers, if any | .55% J | .55% J | ||
| Expenses net of all reductions | .54% J | .55% J | ||
| Net investment income (loss) | 3.07% J | .05% J | ||
| Supplemental Data | ||||
| Net assets, end of period (000 omitted) | $ | 194 | $ | 169 |
Portfolio turnover rate K | 53% J | 111% J |
| Fidelity Advisor® Sustainable Multi-Asset Fund Class C |
Six months ended (Unaudited) March 31, 2023 | Years ended September 30, 2022 A | |||
Selected Per-Share Data | ||||
| Net asset value, beginning of period | $ | 7.75 | $ | 10.00 |
| Income from Investment Operations | ||||
Net investment income (loss) B,C | .11 | (.03) | ||
| Net realized and unrealized gain (loss) | 1.00 | (2.22) | ||
| Total from investment operations | 1.11 | (2.25) | ||
| Distributions from net investment income | (.08) | - | ||
| Total distributions | (.08) | - | ||
| Net asset value, end of period | $ | 8.78 | $ | 7.75 |
Total Return D,E,F | 14.37% | (22.50)% | ||
Ratios to Average Net Assets C,G,H | ||||
| Expenses before reductions | 1.10% I | 1.10% I | ||
| Expenses net of fee waivers, if any | 1.05% I | 1.05% I | ||
| Expenses net of all reductions | 1.04% I | 1.05% I | ||
| Net investment income (loss) | 2.57% I | (.45)% I | ||
| Supplemental Data | ||||
| Net assets, end of period (000 omitted) | $ | 266 | $ | 229 |
Portfolio turnover rate J | 53% I | 111% I |
| Fidelity® Sustainable Multi-Asset Fund |
Six months ended (Unaudited) March 31, 2023 | Years ended September 30, 2022 A | |||
Selected Per-Share Data | ||||
| Net asset value, beginning of period | $ | 7.80 | $ | 10.00 |
| Income from Investment Operations | ||||
Net investment income (loss) B,C | .15 | .03 | ||
| Net realized and unrealized gain (loss) | 1.01 | (2.23) | ||
| Total from investment operations | 1.16 | (2.20) | ||
| Distributions from net investment income | (.15) | - | ||
| Total distributions | (.15) | - | ||
| Net asset value, end of period | $ | 8.81 | $ | 7.80 |
Total Return D,E | 14.96% | (22.00)% | ||
Ratios to Average Net Assets C,F,G | ||||
| Expenses before reductions | .10% H | .10% H | ||
| Expenses net of fee waivers, if any | .05% H | .05% H | ||
| Expenses net of all reductions | .05% H | .05% H | ||
| Net investment income (loss) | 3.57% H | .55% H | ||
| Supplemental Data | ||||
| Net assets, end of period (000 omitted) | $ | 8,616 | $ | 4,010 |
Portfolio turnover rate I | 53% H | 111% H |
| Fidelity Advisor® Sustainable Multi-Asset Fund Class I |
Six months ended (Unaudited) March 31, 2023 | Years ended September 30, 2022 A | |||
Selected Per-Share Data | ||||
| Net asset value, beginning of period | $ | 7.80 | $ | 10.00 |
| Income from Investment Operations | ||||
Net investment income (loss) B,C | .15 | .03 | ||
| Net realized and unrealized gain (loss) | 1.01 | (2.23) | ||
| Total from investment operations | 1.16 | (2.20) | ||
| Distributions from net investment income | (.15) | - | ||
| Total distributions | (.15) | - | ||
| Net asset value, end of period | $ | 8.81 | $ | 7.80 |
Total Return D,E | 14.96% | (22.00)% | ||
Ratios to Average Net Assets C,F,G | ||||
| Expenses before reductions | .10% H | .10% H | ||
| Expenses net of fee waivers, if any | .05% H | .05% H | ||
| Expenses net of all reductions | .05% H | .05% H | ||
| Net investment income (loss) | 3.57% H | .55% H | ||
| Supplemental Data | ||||
| Net assets, end of period (000 omitted) | $ | 642 | $ | 300 |
Portfolio turnover rate I | 53% H | 111% H |
| Fidelity Central Fund | Investment Manager | Investment Objective | Investment Practices | Expense Ratio A |
| Fidelity Money Market Central Funds | Fidelity Management & Research Company LLC (FMR) | Each fund seeks to obtain a high level of current income consistent with the preservation of capital and liquidity. | Short-term Investments | Less than .005% |
| Gross unrealized appreciation | $345,882 |
| Gross unrealized depreciation | (223,867) |
| Net unrealized appreciation (depreciation) | $122,015 |
| Tax cost | $9,805,777 |
Short-term | $(39,082) |
| Purchases ($) | Sales ($) | |
| Fidelity Sustainable Multi-Asset Fund | 6,241,887 | 2,030,052 |
| Annual % of Class-Level Average Net Assets | |
| Class A | .10% |
| Class M | .10% |
| Class C | .10% |
| Fidelity Sustainable Multi-Asset Fund | .10% |
| Class I | .10% |
| Distribution Fee | Service Fee | Total Fees | Retained by FDC | |
| Class A | - % | .25% | $238 | $213 |
| Class M | .25% | .25% | 462 | 426 |
| Class C | .75% | .25% | 1,263 | 1,249 |
| $1,963 | $1,888 |
| Amount | |
| Fidelity Sustainable Multi-Asset Fund | $4 |
| Expense Limitations | Reimbursement | |
| Class A | .30% | $48 |
| Class M | .55% | 46 |
| Class C | 1.05% | 63 |
| Fidelity Sustainable Multi-Asset Fund | .05% | 1,633 |
| Class I | .05% | 138 |
| $1,928 |
| Expense reduction | |
| Class A | $3 |
| Class M | 3 |
| Class C | 4 |
| Fidelity Sustainable Multi-Asset Fund | 38 |
| $48 |
Six months ended March 31, 2023 | Year ended September 30, 2022 | |
| Fidelity Sustainable Multi-Asset Fund | ||
| Distributions to shareholders | ||
| Class A | $2,921 | $- |
| Class M | 2,413 | - |
| Class C | 2,356 | - |
| Fidelity Sustainable Multi-Asset Fund | 111,228 | - |
| Class I | 8,968 | - |
Total | $127,886 | $- |
| Shares | Shares | Dollars | Dollars | |
Six months ended March 31, 2023 | Year ended September 30, 2022 A | Six months ended March 31, 2023 | Year ended September 30, 2022 A | |
| Fidelity Sustainable Multi-Asset Fund | ||||
| Class A | ||||
| Shares sold | 2,847 | 21,029 | $23,837 | $209,320 |
| Reinvestment of distributions | 351 | - | 2,921 | - |
| Shares redeemed | (177) | (55) | (1,513) | (462) |
| Net increase (decrease) | 3,021 | 20,974 | $25,245 | $208,858 |
| Class M | ||||
| Shares sold | 74 | 21,690 | $635 | $214,500 |
| Reinvestment of distributions | 290 | - | 2,413 | - |
| Net increase (decrease) | 364 | 21,690 | $3,048 | $214,500 |
| Class C | ||||
| Shares sold | 452 | 29,553 | $3,711 | $287,500 |
| Reinvestment of distributions | 283 | - | 2,356 | - |
| Net increase (decrease) | 735 | 29,553 | $6,067 | $287,500 |
| Fidelity Sustainable Multi-Asset Fund | ||||
| Shares sold | 564,733 | 577,511 | $4,773,514 | $5,157,892 |
| Reinvestment of distributions | 9,927 | - | 82,677 | - |
| Shares redeemed | (111,025) | (63,389) | (960,531) | (568,256) |
| Net increase (decrease) | 463,635 | 514,122 | $3,895,660 | $4,589,636 |
| Class I | ||||
| Shares sold | 33,510 | 39,415 | $268,206 | $364,524 |
| Reinvestment of distributions | 983 | - | 8,185 | - |
| Shares redeemed | (37) | (1,011) | (316) | (8,694) |
| Net increase (decrease) | 34,456 | 38,404 | $276,075 | $355,830 |
| Fund | Fidelity Sustainable Multi-Asset Fund |
| Fidelity Sustainable Emerging Markets Equity Fund | 13% |
| Fidelity Sustainable International Equity Fund | 26% |
| The Example is based on an investment of $1,000 invested at the beginning of the period and held for the entire period (October 1, 2022 to March 31, 2023). |
Annualized Expense Ratio- A | Beginning Account Value October 1, 2022 | Ending Account Value March 31, 2023 | Expenses Paid During Period- C October 1, 2022 to March 31, 2023 | |||||||
| Fidelity® Sustainable Multi-Asset Fund | ||||||||||
| Class A | .30% | |||||||||
| Actual | $ 1,000 | $ 1,148.60 | $ 1.61 | |||||||
Hypothetical- B | $ 1,000 | $ 1,023.44 | $ 1.51 | |||||||
| Class M | .55% | |||||||||
| Actual | $ 1,000 | $ 1,147.70 | $ 2.94 | |||||||
Hypothetical- B | $ 1,000 | $ 1,022.19 | $ 2.77 | |||||||
| Class C | 1.05% | |||||||||
| Actual | $ 1,000 | $ 1,143.70 | $ 5.61 | |||||||
Hypothetical- B | $ 1,000 | $ 1,019.70 | $ 5.29 | |||||||
| Fidelity® Sustainable Multi-Asset Fund | .05% | |||||||||
| Actual | $ 1,000 | $ 1,149.60 | $ .27 | |||||||
Hypothetical- B | $ 1,000 | $ 1,024.68 | $ .25 | |||||||
| Class I | .05% | |||||||||
| Actual | $ 1,000 | $ 1,149.60 | $ .27 | |||||||
Hypothetical- B | $ 1,000 | $ 1,024.68 | $ .25 | |||||||
- Highly liquid investments - cash or convertible to cash within three business days or less
- Moderately liquid investments - convertible to cash in three to seven calendar days
- Less liquid investments - can be sold or disposed of, but not settled, within seven calendar days
- Illiquid investments - cannot be sold or disposed of within seven calendar days
 |


Contents
Top Holdings (% of Fund's net assets) | ||
| Fidelity International Bond Index Fund | 18.6 | |
| Fidelity U.S. Bond Index Fund | 15.4 | |
| Fidelity Total Market Index Fund | 13.1 | |
| Fidelity Long-Term Treasury Bond Index Fund | 11.0 | |
| iShares JPMorgan USD Emerging Markets Bond ETF | 9.2 | |
| Fidelity International Index Fund | 8.5 | |
| Fidelity Emerging Markets Index Fund | 4.0 | |
| Invesco Senior Loan ETF | 2.4 | |
| iShares iBoxx $ High Yield Corporate Bond ETF | 1.0 | |
| VanEck JP Morgan EM Local Currency Bond ETF | 0.7 | |
| 83.9 | ||
Quality Diversification (% of Fund's net assets) |
 |
Percentages shown as 0.0% may reflect amounts less than 0.05%. |
| We have used ratings from Moody's Investors Service, Inc. Where Moody's® ratings are not available, we have used S&P® ratings. All ratings are as of the date indicated and do not reflect subsequent changes. |
Asset Allocation (% of Fund's net assets) |
 |
Futures - 0.9% |
Percentages shown as 0.0% may reflect amounts less than 0.05%. |
| Equity Central Funds - 0.3% | |||
| Shares | Value ($) | ||
Fidelity Hedged Equity Central Fund (a) (Cost $63,035) | 630 | 63,742 | |
| Equity Funds - 26.9% | |||
| Shares | Value ($) | ||
| Fidelity Commodity Strategy Fund (b) | 2,442 | 237,645 | |
| Fidelity Emerging Markets Index Fund (b) | 95,421 | 937,987 | |
| Fidelity International Index Fund (b) | 44,094 | 1,972,306 | |
| Fidelity Real Estate Index Fund (b) | 6,677 | 98,818 | |
| Fidelity Total Market Index Fund (b) | 26,823 | 3,049,014 | |
| TOTAL EQUITY FUNDS (Cost $6,118,232) | 6,295,770 | ||
| Fixed-Income Central Funds - 13.0% | |||
| Shares | Value ($) | ||
| Investment Grade Fixed-Income Funds - 13.0% | |||
Fidelity Inflation-Protected Bond Index Central Fund (a) (Cost $3,502,268) | 33,562 | 3,034,635 | |
| Money Market Central Funds - 0.2% | |||
| Shares | Value ($) | ||
Fidelity Cash Central Fund 4.86% (c) (Cost $35,373) | 35,366 | 35,373 | |
| U.S. Treasury Obligations - 0.0% | |||
Principal Amount (d) | Value ($) | ||
U.S. Treasury Bills, yield at date of purchase 4.44% 6/1/23 (e) (Cost $9,925) | 10,000 | 9,926 | |
| Investment Companies - 14.6% | |||
| Shares | Value ($) | ||
| Invesco Senior Loan ETF | 26,452 | 550,202 | |
| iShares iBoxx $ High Yield Corporate Bond ETF | 3,203 | 241,987 | |
| iShares JPMorgan USD Emerging Markets Bond ETF | 24,787 | 2,138,622 | |
| iShares MSCI USA Minimum Volatility ETF | 2,372 | 172,539 | |
| VanEck JP Morgan EM Local Currency Bond ETF | 6,941 | 175,260 | |
| VanEck Vectors Gold Miners ETF | 3,726 | 120,536 | |
| TOTAL INVESTMENT COMPANIES (Cost $3,882,618) | 3,399,146 | ||
| Fixed-Income Funds - 45.0% | |||
| Shares | Value ($) | ||
| Fidelity International Bond Index Fund (b) | 482,049 | 4,357,720 | |
| Fidelity Long-Term Treasury Bond Index Fund (b) | 238,509 | 2,563,973 | |
| Fidelity U.S. Bond Index Fund (b) | 345,709 | 3,602,285 | |
| TOTAL FIXED-INCOME FUNDS (Cost $11,645,296) | 10,523,978 | ||
| TOTAL INVESTMENT IN SECURITIES - 100.0% (Cost $25,256,747) | 23,362,570 |
NET OTHER ASSETS (LIABILITIES) - 0.0% | 5,756 |
| NET ASSETS - 100.0% | 23,368,326 |
| Futures Contracts | |||||
Number of contracts | Expiration Date | Notional Amount ($) | Value ($) | Unrealized Appreciation/ (Depreciation) ($) | |
| Purchased | |||||
| Treasury Contracts | |||||
| CBOT 5-Year U.S. Treasury Note Contracts (United States) | 2 | Jun 2023 | 219,016 | 4,637 | 4,637 |
| The notional amount of futures purchased as a percentage of Net Assets is 0.9% | |||||
| ETF | - | EXCHANGE-TRADED FUND |
| (a) | Affiliated fund that is generally available only to investment companies and other accounts managed by Fidelity Investments. A complete unaudited schedule of portfolio holdings for each Fidelity Central Fund is filed with the SEC for the first and third quarters of each fiscal year on Form N-PORT and is available upon request or at the SEC's website at www.sec.gov. An unaudited holdings listing for the Fund, which presents direct holdings as well as the pro-rata share of securities and other investments held indirectly through its investment in underlying non-money market Fidelity Central Funds, is available at fidelity.com and/or institutional.fidelity.com, as applicable. In addition, each Fidelity Central Fund's financial statements are available on the SEC's website or upon request. |
| (b) | Affiliated Fund |
| (c) | Affiliated fund that is generally available only to investment companies and other accounts managed by Fidelity Investments. The rate quoted is the annualized seven-day yield of the fund at period end. A complete unaudited listing of the fund's holdings as of its most recent quarter end is available upon request. In addition, each Fidelity Central Fund's financial statements are available on the SEC's website or upon request. |
| (d) | Amount is stated in United States dollars unless otherwise noted. |
| (e) | Security or a portion of the security was pledged to cover margin requirements for futures contracts. At period end, the value of securities pledged amounted to $9,926. |
| Affiliate | Value, beginning of period ($) | Purchases ($) | Sales Proceeds ($) | Dividend Income ($) | Realized Gain (loss) ($) | Change in Unrealized appreciation (depreciation) ($) | Value, end of period ($) | % ownership, end of period |
| Fidelity Cash Central Fund 4.86% | 1,849 | 339,972 | 306,448 | 593 | - | - | 35,373 | 0.0% |
| Fidelity Hedged Equity Central Fund | - | 63,035 | - | 35 | - | 707 | 63,742 | 0.1% |
| Fidelity Inflation-Protected Bond Index Central Fund | 2,537,896 | 725,046 | 60,272 | 294,010 | (5,351) | (162,684) | 3,034,635 | 0.5% |
| Total | 2,539,745 | 1,128,053 | 366,720 | 294,638 | (5,351) | (161,977) | 3,133,750 | |
| Affiliate | Value, beginning of period ($) | Purchases ($) | Sales Proceeds ($) | Dividend Income ($) | Realized Gain (loss) ($) | Change in Unrealized appreciation (depreciation) ($) | Value, end of period ($) |
| Fidelity Commodity Strategy Fund | 436,441 | 50,737 | 236,667 | 3,932 | (115,807) | 102,941 | 237,645 |
| Fidelity Emerging Markets Index Fund | 529,810 | 467,809 | 115,241 | 13,108 | (32,773) | 88,382 | 937,987 |
| Fidelity International Bond Index Fund | 3,841,487 | 1,081,412 | 663,676 | 22,337 | (35,079) | 133,576 | 4,357,720 |
| Fidelity International Index Fund | 741,301 | 1,064,163 | 56,924 | 30,215 | 909 | 222,857 | 1,972,306 |
| Fidelity Long-Term Treasury Bond Index Fund | 2,091,132 | 872,898 | 490,605 | 34,007 | (67,618) | 158,166 | 2,563,973 |
| Fidelity Real Estate Index Fund | 131,617 | 15,559 | 56,271 | 1,956 | (2,950) | 10,863 | 98,818 |
| Fidelity Total Market Index Fund | 3,301,986 | 494,773 | 1,166,599 | 44,748 | (91,276) | 510,130 | 3,049,014 |
| Fidelity U.S. Bond Index Fund | 2,677,964 | 1,475,292 | 667,689 | 42,962 | (36,260) | 152,978 | 3,602,285 |
| 13,751,738 | 5,522,643 | 3,453,672 | 193,265 | (380,854) | 1,379,893 | 16,819,748 |
| Valuation Inputs at Reporting Date: | ||||
| Description | Total ($) | Level 1 ($) | Level 2 ($) | Level 3 ($) |
Investments in Securities: | ||||
| Equity Central Funds | 63,742 | 63,742 | - | - |
| Equity Funds | 6,295,770 | 6,295,770 | - | - |
| Fixed-Income Central Funds | 3,034,635 | 3,034,635 | - | - |
| Money Market Central Funds | 35,373 | 35,373 | - | - |
| Other Short-Term Investments | 9,926 | - | 9,926 | - |
| Investment Companies | 3,399,146 | 3,399,146 | - | - |
| Fixed-Income Funds | 10,523,978 | 10,523,978 | - | - |
| Total Investments in Securities: | 23,362,570 | 23,352,644 | 9,926 | - |
Derivative Instruments: | ||||
| Assets | ||||
Futures Contracts | 4,637 | 4,637 | - | - |
| Total Assets | 4,637 | 4,637 | - | - |
| Total Derivative Instruments: | 4,637 | 4,637 | - | - |
Primary Risk Exposure / Derivative Type | Value | |
| Asset ($) | Liability ($) | |
| Interest Rate Risk | ||
Futures Contracts (a) | 4,637 | 0 |
| Total Interest Rate Risk | 4,637 | 0 |
| Total Value of Derivatives | 4,637 | 0 |
| Statement of Assets and Liabilities | ||||
March 31, 2023 (Unaudited) | ||||
| Assets | ||||
| Investment in securities, at value - See accompanying schedule: | ||||
Unaffiliated issuers (cost $3,892,543) | $ | 3,409,072 | ||
Fidelity Central Funds (cost $3,600,676) | 3,133,750 | |||
Other affiliated issuers (cost $17,763,528) | 16,819,748 | |||
| Total Investment in Securities (cost $25,256,747) | $ | 23,362,570 | ||
| Cash | 7,093 | |||
| Receivable for investments sold | 32,302 | |||
| Receivable for fund shares sold | 15,343 | |||
| Distributions receivable from Fidelity Central Funds | 154 | |||
| Receivable for daily variation margin on futures contracts | 453 | |||
Total assets | 23,417,915 | |||
| Liabilities | ||||
| Payable for investments purchased | $ | 35,932 | ||
| Payable for fund shares redeemed | 11,758 | |||
| Accrued management fee | 1,899 | |||
| Total Liabilities | 49,589 | |||
| Net Assets | $ | 23,368,326 | ||
| Net Assets consist of: | ||||
| Paid in capital | $ | 26,018,706 | ||
| Total accumulated earnings (loss) | (2,650,380) | |||
| Net Assets | $ | 23,368,326 | ||
Net Asset Value , offering price and redemption price per share ($23,368,326 ÷ 2,474,933 shares) | $ | 9.44 | ||
| Statement of Operations | ||||
Six months ended March 31, 2023 (Unaudited) | ||||
| Investment Income | ||||
| Dividends: | ||||
| Unaffiliated issuers | $ | 81,206 | ||
| Affiliated issuers | 193,265 | |||
| Interest | 193 | |||
| Income from Fidelity Central Funds | 219,317 | |||
| Total Income | 493,981 | |||
| Expenses | ||||
| Management fee | $ | 15,933 | ||
| Independent trustees' fees and expenses | 42 | |||
| Total expenses before reductions | 15,975 | |||
| Expense reductions | (5,447) | |||
| Total expenses after reductions | 10,528 | |||
| Net Investment income (loss) | 483,453 | |||
| Realized and Unrealized Gain (Loss) | ||||
| Net realized gain (loss) on: | ||||
| Investment Securities: | ||||
| Unaffiliated issuers | (56,800) | |||
| Fidelity Central Funds | (5,351) | |||
| Other affiliated issuers | (380,854) | |||
| Futures contracts | (5,254) | |||
| Capital gain distributions from underlying funds: | ||||
| Affiliated issuers | 75,321 | |||
| Total net realized gain (loss) | (372,938) | |||
| Change in net unrealized appreciation (depreciation) on: | ||||
| Investment Securities: | ||||
| Unaffiliated issuers | 270,368 | |||
| Fidelity Central Funds | (161,977) | |||
| Other affiliated issuers | 1,379,893 | |||
| Futures contracts | 5,462 | |||
| Total change in net unrealized appreciation (depreciation) | 1,493,746 | |||
| Net gain (loss) | 1,120,808 | |||
| Net increase (decrease) in net assets resulting from operations | $ | 1,604,261 | ||
| Statement of Changes in Net Assets | ||||
Six months ended March 31, 2023 (Unaudited) | Year ended September 30, 2022 | |||
| Increase (Decrease) in Net Assets | ||||
| Operations | ||||
| Net investment income (loss) | $ | 483,453 | $ | 605,114 |
| Net realized gain (loss) | (372,938) | (383,544) | ||
| Change in net unrealized appreciation (depreciation) | 1,493,746 | (3,838,318) | ||
| Net increase (decrease) in net assets resulting from operations | 1,604,261 | (3,616,748) | ||
| Distributions to shareholders | (605,620) | (537,680) | ||
| Share transactions | ||||
| Proceeds from sales of shares | 3,611,581 | 9,482,212 | ||
| Reinvestment of distributions | 594,303 | 534,480 | ||
| Cost of shares redeemed | (1,245,148) | (3,317,424) | ||
Net increase (decrease) in net assets resulting from share transactions | 2,960,736 | 6,699,268 | ||
| Total increase (decrease) in net assets | 3,959,377 | 2,544,840 | ||
| Net Assets | ||||
| Beginning of period | 19,408,949 | 16,864,109 | ||
| End of period | $ | 23,368,326 | $ | 19,408,949 |
| Other Information | ||||
| Shares | ||||
| Sold | 389,057 | 895,231 | ||
| Issued in reinvestment of distributions | 65,451 | 49,657 | ||
| Redeemed | (134,548) | (314,380) | ||
| Net increase (decrease) | 319,960 | 630,508 | ||
| Fidelity® Health Savings Index Fund |
Six months ended (Unaudited) March 31, 2023 | Years ended September 30, 2022 | 2021 | 2020 A | |||||
Selected Per-Share Data | ||||||||
| Net asset value, beginning of period | $ | 9.01 | $ | 11.06 | $ | 10.41 | $ | 10.00 |
| Income from Investment Operations | ||||||||
Net investment income (loss) B,C | .21 | .32 | .17 | .06 | ||||
| Net realized and unrealized gain (loss) | .49 | (2.06) | .66 | .40 | ||||
| Total from investment operations | .70 | (1.74) | .83 | .46 | ||||
| Distributions from net investment income | (.27) | (.28) | (.14) | (.05) | ||||
| Distributions from net realized gain | - | (.03) | (.04) | - | ||||
| Total distributions | (.27) | (.31) | (.18) | (.05) | ||||
| Net asset value, end of period | $ | 9.44 | $ | 9.01 | $ | 11.06 | $ | 10.41 |
Total Return D,E | 7.95% | (16.22)% | 7.99% | 4.58% | ||||
Ratios to Average Net Assets C,F,G | ||||||||
| Expenses before reductions | .15% H | .15% | .15% | .15% H | ||||
| Expenses net of fee waivers, if any | .10% H | .10% | .10% | .10% H | ||||
| Expenses net of all reductions | .10% H | .10% | .10% | .10% H | ||||
| Net investment income (loss) | 4.55% H | 3.08% | 1.51% | .97% H | ||||
| Supplemental Data | ||||||||
| Net assets, end of period (000 omitted) | $ | 23,368 | $ | 19,409 | $ | 16,864 | $ | 3,609 |
Portfolio turnover rate I | 39% H | 32% | 42% | 71% H |
| Fidelity Central Fund | Investment Manager | Investment Objective | Investment Practices | Expense Ratio A |
| Fidelity Inflation-Protected Bond Index Central Fund | Fidelity Management & Research Company LLC (FMR) | Seeks to provide investment results that correspond to the performance of the inflation-protected United States Treasury market, and may invest in derivatives. | Less than .005% | |
| Fidelity Hedged Equity Central Fund | Fidelity Diversifying Solutions LLC (FDS) | Seeks capital appreciation by investing primarily in common stocks of companies with market capitalizations generally similar to companies in the S&P 500® Index. | Options | 0.01% |
| Fidelity Money Market Central Funds | Fidelity Management & Research Company LLC (FMR) | Each fund seeks to obtain a high level of current income consistent with the preservation of capital and liquidity. | Short-term Investments | Less than .005% |
| Gross unrealized appreciation | $382,207 |
| Gross unrealized depreciation | (2,696,437) |
| Net unrealized appreciation (depreciation) | $(2,314,230) |
| Tax cost | $25,681,437 |
Short-term | $(139,134) |
| Total capital loss carryforward | $(139,134) |
| Interest Rate Risk | Interest rate risk relates to the fluctuations in the value of interest-bearing securities due to changes in the prevailing levels of market interest rates. |
| Purchases ($) | Sales ($) | |
| Fidelity Health Savings Index Fund | 7,023,936 | 4,142,448 |
| Amount | |
| Fidelity Health Savings Index Fund | $5 |
| The Example is based on an investment of $1,000 invested at the beginning of the period and held for the entire period (October 1, 2022 to March 31, 2023). |
Annualized Expense Ratio- A | Beginning Account Value October 1, 2022 | Ending Account Value March 31, 2023 | Expenses Paid During Period- C October 1, 2022 to March 31, 2023 | |||||||
| Fidelity® Health Savings Index Fund | .10% | |||||||||
| Actual | $ 1,000 | $ 1,079.50 | $ .52 | |||||||
Hypothetical- B | $ 1,000 | $ 1,024.43 | $ .50 | |||||||
- Highly liquid investments - cash or convertible to cash within three business days or less
- Moderately liquid investments - convertible to cash in three to seven calendar days
- Less liquid investments - can be sold or disposed of, but not settled, within seven calendar days
- Illiquid investments - cannot be sold or disposed of within seven calendar days
 |


Contents
Top Holdings (% of Fund's net assets) | ||
| Fidelity International Bond Index Fund | 18.7 | |
| Fidelity Long-Term Treasury Bond Index Fund | 10.9 | |
| Apple, Inc. | 1.0 | |
| Microsoft Corp. | 1.0 | |
| iShares MSCI USA Minimum Volatility ETF | 0.8 | |
| VanEck Vectors Gold Miners ETF | 0.6 | |
| Alphabet, Inc. Class A | 0.6 | |
| Amazon.com, Inc. | 0.4 | |
| Taiwan Semiconductor Manufacturing Co. Ltd. | 0.3 | |
| Exxon Mobil Corp. | 0.3 | |
| 34.6 | ||
| Market Sectors (% of Fund's net assets) | ||
| Financials | 8.3 | |
| Information Technology | 5.7 | |
| Consumer Discretionary | 3.9 | |
| Industrials | 4.6 | |
| Health Care | 4.0 | |
| Energy | 3.7 | |
| Communication Services | 2.9 | |
| Consumer Staples | 2.3 | |
| Materials | 2.0 | |
| Real Estate | 1.1 | |
| Utilities | 0.8 | |
Quality Diversification (% of Fund's net assets) |
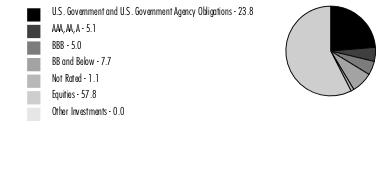 |
Short-Term Investments and Net Other Assets (Liabilities) - (0.5)%* |
Equities percentage includes investment in Fidelity Commodity Strategy Central Fund - 1.0% |
Percentages shown as 0.0% may reflect amounts less than 0.05%. |
*Short-term investments and Net Other Assets (Liabilities) are not available in the pie chart. |
| We have used ratings from Moody's Investors Service, Inc. Where Moody's® ratings are not available, we have used S&P® ratings. All ratings are as of the date indicated and do not reflect subsequent changes. |
Asset Allocation (% of Fund's net assets) |
 |
Short-Term Investments and Net Other Assets (Liabilities) - (0.5)% |
Short-Term Investments and Net Other Assets (Liabilities) are not available in the pie chart. |
Geographic Diversification (% of Fund's net assets) |
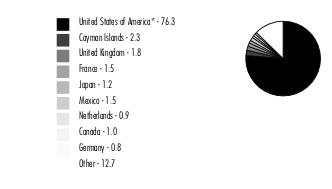 |
* Includes Short-Term investments and Net Other Assets (Liabilities). Percentages are based on country or territory of incorporation and are adjusted for the effect of derivatives, if applicable. |
| Equity Central Funds - 27.3% | |||
| Shares | Value ($) | ||
| Fidelity Commodity Strategy Central Fund (a) | 5,501 | 532,089 | |
| Fidelity Emerging Markets Equity Central Fund (a) | 10,787 | 2,077,698 | |
| Fidelity Hedged Equity Central Fund (a) | 1,309 | 132,408 | |
| Fidelity International Equity Central Fund (a) | 48,086 | 4,401,766 | |
| Fidelity Real Estate Equity Central Fund (a) | 1,865 | 224,710 | |
| Fidelity U.S. Equity Central Fund (a) | 60,721 | 6,795,331 | |
| TOTAL EQUITY CENTRAL FUNDS (Cost $14,343,653) | 14,164,002 | ||
| Fixed-Income Central Funds - 41.7% | |||
| Shares | Value ($) | ||
| High Yield Fixed-Income Funds - 13.3% | |||
| Fidelity Emerging Markets Debt Central Fund (a) | 626,726 | 4,744,315 | |
| Fidelity Emerging Markets Debt Local Currency Central Fund (a) | 4,299 | 383,001 | |
| Fidelity Floating Rate Central Fund (a) | 12,848 | 1,237,003 | |
| Fidelity High Income Central Fund (a) | 5,375 | 550,217 | |
TOTAL HIGH YIELD FIXED-INCOME FUNDS | 6,914,536 | ||
| Investment Grade Fixed-Income Funds - 28.4% | |||
| Fidelity Inflation-Protected Bond Index Central Fund (a) | 74,428 | 6,729,750 | |
| Fidelity Investment Grade Bond Central Fund (a) | 80,655 | 7,984,876 | |
TOTAL INVESTMENT GRADE FIXED-INCOME FUNDS | 14,714,626 | ||
| TOTAL FIXED-INCOME CENTRAL FUNDS (Cost $23,805,810) | 21,629,162 | ||
| Money Market Central Funds - 0.1% | |||
| Shares | Value ($) | ||
Fidelity Cash Central Fund 4.86% (b) (Cost $47,902) | 47,892 | 47,902 | |
| U.S. Treasury Obligations - 0.0% | |||
Principal Amount (c) | Value ($) | ||
U.S. Treasury Bills, yield at date of purchase 4.58% 5/4/23 (d) (Cost $9,959) | 10,000 | 9,960 | |
| Investment Companies - 1.3% | |||
| Shares | Value ($) | ||
| iShares MSCI USA Minimum Volatility ETF | 5,185 | 377,157 | |
| VanEck Vectors Gold Miners ETF | 8,149 | 263,620 | |
| TOTAL INVESTMENT COMPANIES (Cost $619,290) | 640,777 | ||
| Fixed-Income Funds - 29.6% | |||
| Shares | Value ($) | ||
| Fidelity International Bond Index Fund (e) | 1,071,412 | 9,685,567 | |
| Fidelity Long-Term Treasury Bond Index Fund (e) | 528,726 | 5,683,808 | |
| TOTAL FIXED-INCOME FUNDS (Cost $17,178,352) | 15,369,375 | ||
| TOTAL INVESTMENT IN SECURITIES - 100.0% (Cost $56,004,966) | 51,861,178 |
NET OTHER ASSETS (LIABILITIES) - 0.0% | 14,643 |
| NET ASSETS - 100.0% | 51,875,821 |
| Futures Contracts | |||||
Number of contracts | Expiration Date | Notional Amount ($) | Value ($) | Unrealized Appreciation/ (Depreciation) ($) | |
| Purchased | |||||
| Treasury Contracts | |||||
| CBOT 5-Year U.S. Treasury Note Contracts (United States) | 4 | Jun 2023 | 438,031 | 9,273 | 9,273 |
| The notional amount of futures purchased as a percentage of Net Assets is 0.8% | |||||
| ETF | - | EXCHANGE-TRADED FUND |
| (a) | Affiliated fund that is generally available only to investment companies and other accounts managed by Fidelity Investments. A complete unaudited schedule of portfolio holdings for each Fidelity Central Fund is filed with the SEC for the first and third quarters of each fiscal year on Form N-PORT and is available upon request or at the SEC's website at www.sec.gov. An unaudited holdings listing for the Fund, which presents direct holdings as well as the pro-rata share of securities and other investments held indirectly through its investment in underlying non-money market Fidelity Central Funds, other than the Commodity Strategy Central Fund, is available at fidelity.com and/or institutional.fidelity.com, as applicable. In addition, each Fidelity Central Fund's financial statements are available on the SEC's website or upon request. |
| (b) | Affiliated fund that is generally available only to investment companies and other accounts managed by Fidelity Investments. The rate quoted is the annualized seven-day yield of the fund at period end. A complete unaudited listing of the fund's holdings as of its most recent quarter end is available upon request. In addition, each Fidelity Central Fund's financial statements are available on the SEC's website or upon request. |
| (c) | Amount is stated in United States dollars unless otherwise noted. |
| (d) | Security or a portion of the security was pledged to cover margin requirements for futures contracts. At period end, the value of securities pledged amounted to $9,960. |
| (e) | Affiliated Fund |
| Affiliate | Value, beginning of period ($) | Purchases ($) | Sales Proceeds ($) | Dividend Income ($) | Realized Gain (loss) ($) | Change in Unrealized appreciation (depreciation) ($) | Value, end of period ($) | % ownership, end of period |
| Fidelity Cash Central Fund 4.86% | 11,079 | 206,892 | 170,069 | 292 | - | - | 47,902 | 0.0% |
| Fidelity Commodity Strategy Central Fund | 908,745 | 155,225 | 503,442 | 10,069 | (154,538) | 126,099 | 532,089 | 0.1% |
| Fidelity Emerging Markets Debt Central Fund | 3,768,817 | 910,326 | 165,358 | 128,673 | (28,245) | 258,775 | 4,744,315 | 0.2% |
| Fidelity Emerging Markets Debt Local Currency Central Fund | 93,400 | 271,309 | - | 309 | - | 18,292 | 383,001 | 0.1% |
| Fidelity Emerging Markets Equity Central Fund | 1,110,376 | 1,028,734 | 206,479 | 19,109 | (55,386) | 200,453 | 2,077,698 | 0.1% |
| Fidelity Floating Rate Central Fund | 1,232,257 | 243,118 | 266,627 | 54,310 | (3,690) | 31,945 | 1,237,003 | 0.1% |
| Fidelity Hedged Equity Central Fund | - | 130,940 | - | 72 | - | 1,468 | 132,408 | 0.1% |
| Fidelity High Income Central Fund | 463,947 | 109,484 | 44,119 | 19,802 | (3,426) | 24,331 | 550,217 | 0.0% |
| Fidelity Inflation-Protected Bond Index Central Fund | 5,315,270 | 1,844,014 | 78,230 | 623,311 | (8,387) | (342,917) | 6,729,750 | 1.1% |
| Fidelity International Equity Central Fund | 1,556,314 | 2,406,896 | 92,538 | 15,454 | 2,141 | 528,953 | 4,401,766 | 0.1% |
| Fidelity Investment Grade Bond Central Fund | 5,612,806 | 3,089,791 | 960,965 | 119,998 | (82,807) | 326,051 | 7,984,876 | 0.0% |
| Fidelity Real Estate Equity Central Fund | 273,025 | 44,008 | 116,395 | 3,912 | (5,559) | 29,631 | 224,710 | 0.0% |
| Fidelity Securities Lending Cash Central Fund 4.87% | - | 1,309,627 | 1,309,627 | 23 | - | - | - | 0.0% |
| Fidelity U.S. Equity Central Fund | 6,922,099 | 1,403,484 | 2,432,268 | 139,559 | (210,819) | 1,112,835 | 6,795,331 | 0.0% |
| Total | 27,268,135 | 13,153,848 | 6,346,117 | 1,134,893 | (550,716) | 2,315,916 | 35,841,066 | |
| Affiliate | Value, beginning of period ($) | Purchases ($) | Sales Proceeds ($) | Dividend Income ($) | Realized Gain (loss) ($) | Change in Unrealized appreciation (depreciation) ($) | Value, end of period ($) |
| Fidelity International Bond Index Fund | 8,047,697 | 2,712,077 | 1,287,783 | 47,007 | (85,630) | 299,206 | 9,685,567 |
| Fidelity Long-Term Treasury Bond Index Fund | 4,381,151 | 2,102,161 | 998,289 | 72,557 | (171,182) | 369,967 | 5,683,808 |
| 12,428,848 | 4,814,238 | 2,286,072 | 119,564 | (256,812) | 669,173 | 15,369,375 |
| Valuation Inputs at Reporting Date: | ||||
| Description | Total ($) | Level 1 ($) | Level 2 ($) | Level 3 ($) |
Investments in Securities: | ||||
| Equity Central Funds | 14,164,002 | 14,164,002 | - | - |
| Fixed-Income Central Funds | 21,629,162 | 21,629,162 | - | - |
| Money Market Central Funds | 47,902 | 47,902 | - | - |
| Other Short-Term Investments | 9,960 | - | 9,960 | - |
| Investment Companies | 640,777 | 640,777 | - | - |
| Fixed-Income Funds | 15,369,375 | 15,369,375 | - | - |
| Total Investments in Securities: | 51,861,178 | 51,851,218 | 9,960 | - |
Derivative Instruments: | ||||
| Assets | ||||
Futures Contracts | 9,273 | 9,273 | - | - |
| Total Assets | 9,273 | 9,273 | - | - |
| Total Derivative Instruments: | 9,273 | 9,273 | - | - |
Primary Risk Exposure / Derivative Type | Value | |
| Asset ($) | Liability ($) | |
| Interest Rate Risk | ||
Futures Contracts (a) | 9,273 | 0 |
| Total Interest Rate Risk | 9,273 | 0 |
| Total Value of Derivatives | 9,273 | 0 |
| Statement of Assets and Liabilities | ||||
March 31, 2023 (Unaudited) | ||||
| Assets | ||||
| Investment in securities, at value - See accompanying schedule: | ||||
Unaffiliated issuers (cost $629,249) | $ | 650,737 | ||
Fidelity Central Funds (cost $38,197,365) | 35,841,066 | |||
Other affiliated issuers (cost $17,178,352) | 15,369,375 | |||
| Total Investment in Securities (cost $56,004,966) | $ | 51,861,178 | ||
| Cash | 14,250 | |||
| Receivable for investments sold | 8,111 | |||
| Receivable for fund shares sold | 203,830 | |||
| Distributions receivable from Fidelity Central Funds | 115 | |||
| Receivable for daily variation margin on futures contracts | 906 | |||
Total assets | 52,088,390 | |||
| Liabilities | ||||
| Payable for investments purchased | $ | 169,725 | ||
| Payable for fund shares redeemed | 26,511 | |||
| Accrued management fee | 16,333 | |||
| Total Liabilities | 212,569 | |||
| Net Assets | $ | 51,875,821 | ||
| Net Assets consist of: | ||||
| Paid in capital | $ | 57,253,798 | ||
| Total accumulated earnings (loss) | (5,377,977) | |||
| Net Assets | $ | 51,875,821 | ||
| Net Asset Value and Maximum Offering Price | ||||
| Fidelity Health Savings Fund : | ||||
Net Asset Value , offering price and redemption price per share ($21,358,492 ÷ 2,231,602 shares) | $ | 9.57 | ||
| Class K : | ||||
Net Asset Value , offering price and redemption price per share ($30,517,329 ÷ 3,189,183 shares) | $ | 9.57 | ||
| Statement of Operations | ||||
Six months ended March 31, 2023 (Unaudited) | ||||
| Investment Income | ||||
| Dividends: | ||||
| Unaffiliated issuers | $ | 6,907 | ||
| Affiliated issuers | 119,564 | |||
| Interest | 363 | |||
| Income from Fidelity Central Funds (including $23 from security lending) | 878,849 | |||
| Total Income | 1,005,683 | |||
| Expenses | ||||
| Management fee | $ | 89,191 | ||
| Independent trustees' fees and expenses | 87 | |||
| Total expenses before reductions | 89,278 | |||
| Expense reductions | (75) | |||
| Total expenses after reductions | 89,203 | |||
| Net Investment income (loss) | 916,480 | |||
| Realized and Unrealized Gain (Loss) | ||||
| Net realized gain (loss) on: | ||||
| Investment Securities: | ||||
| Unaffiliated issuers | (74,264) | |||
| Fidelity Central Funds | (550,716) | |||
| Other affiliated issuers | (256,812) | |||
| Futures contracts | (10,454) | |||
| Capital gain distributions from underlying funds: | ||||
| Affiliated issuers | 256,044 | |||
| Total net realized gain (loss) | (636,202) | |||
| Change in net unrealized appreciation (depreciation) on: | ||||
| Investment Securities: | ||||
| Unaffiliated issuers | 106,489 | |||
| Fidelity Central Funds | 2,315,916 | |||
| Other affiliated issuers | 669,173 | |||
| Futures contracts | 10,923 | |||
| Total change in net unrealized appreciation (depreciation) | 3,102,501 | |||
| Net gain (loss) | 2,466,299 | |||
| Net increase (decrease) in net assets resulting from operations | $ | 3,382,779 | ||
| Statement of Changes in Net Assets | ||||
Six months ended March 31, 2023 (Unaudited) | Year ended September 30, 2022 | |||
| Increase (Decrease) in Net Assets | ||||
| Operations | ||||
| Net investment income (loss) | $ | 916,480 | $ | 1,099,098 |
| Net realized gain (loss) | (636,202) | (210,536) | ||
| Change in net unrealized appreciation (depreciation) | 3,102,501 | (8,250,369) | ||
| Net increase (decrease) in net assets resulting from operations | 3,382,779 | (7,361,807) | ||
| Distributions to shareholders | (1,337,122) | (1,166,276) | ||
| Share transactions - net increase (decrease) | 9,146,493 | 15,716,403 | ||
| Total increase (decrease) in net assets | 11,192,150 | 7,188,320 | ||
| Net Assets | ||||
| Beginning of period | 40,683,671 | 33,495,351 | ||
| End of period | $ | 51,875,821 | $ | 40,683,671 |
| Fidelity® Health Savings Fund |
Six months ended (Unaudited) March 31, 2023 | Years ended September 30, 2022 | 2021 | 2020 A | |||||
Selected Per-Share Data | ||||||||
| Net asset value, beginning of period | $ | 9.15 | $ | 11.21 | $ | 10.48 | $ | 10.00 |
| Income from Investment Operations | ||||||||
Net investment income (loss) B,C | .19 | .28 | .16 | .08 | ||||
| Net realized and unrealized gain (loss) | .52 | (2.02) | .76 | .46 | ||||
| Total from investment operations | .71 | (1.74) | .92 | .54 | ||||
| Distributions from net investment income | (.24) | (.25) | (.11) | (.06) | ||||
| Distributions from net realized gain | (.05) | (.07) | (.08) | - | ||||
| Total distributions | (.29) | (.32) | (.19) | (.06) | ||||
| Net asset value, end of period | $ | 9.57 | $ | 9.15 | $ | 11.21 | $ | 10.48 |
Total Return D,E | 7.85% | (15.98)% | 8.81% | 5.41% | ||||
Ratios to Average Net Assets C,F,G | ||||||||
| Expenses before reductions | .45% H | .45% | .45% | .45% H | ||||
| Expenses net of fee waivers, if any | .45% H | .45% | .45% | .45% H | ||||
| Expenses net of all reductions | .45% H | .45% | .45% | .45% H | ||||
| Net investment income (loss) | 3.98% H | 2.66% | 1.48% | 1.36% H | ||||
| Supplemental Data | ||||||||
| Net assets, end of period (000 omitted) | $ | 21,358 | $ | 18,399 | $ | 16,668 | $ | 4,324 |
Portfolio turnover rate I | 36% H | 29% | 31% | 43% H |
| Fidelity® Health Savings Fund Class K |
Six months ended (Unaudited) March 31, 2023 | Years ended September 30, 2022 | 2021 | 2020 A | |||||
Selected Per-Share Data | ||||||||
| Net asset value, beginning of period | $ | 9.15 | $ | 11.21 | $ | 10.48 | $ | 10.00 |
| Income from Investment Operations | ||||||||
Net investment income (loss) B,C | .19 | .29 | .18 | .09 | ||||
| Net realized and unrealized gain (loss) | .52 | (2.02) | .75 | .45 | ||||
| Total from investment operations | .71 | (1.73) | .93 | .54 | ||||
| Distributions from net investment income | (.24) | (.27) | (.12) | (.06) | ||||
| Distributions from net realized gain | (.05) | (.07) | (.08) | - | ||||
| Total distributions | (.29) | (.33) D | (.20) | (.06) | ||||
| Net asset value, end of period | $ | 9.57 | $ | 9.15 | $ | 11.21 | $ | 10.48 |
Total Return E,F | 7.92% | (15.88)% | 8.92% | 5.45% | ||||
Ratios to Average Net Assets C,G,H | ||||||||
| Expenses before reductions | .35% I | .35% | .35% | .35% I | ||||
| Expenses net of fee waivers, if any | .35% I | .35% | .35% | .35% I | ||||
| Expenses net of all reductions | .35% I | .35% | .35% | .35% I | ||||
| Net investment income (loss) | 4.08% I | 2.76% | 1.58% | 1.46% I | ||||
| Supplemental Data | ||||||||
| Net assets, end of period (000 omitted) | $ | 30,517 | $ | 22,284 | $ | 16,827 | $ | 3,308 |
Portfolio turnover rate J | 36% I | 29% | 31% | 43% I |
| Fidelity Central Fund | Investment Manager | Investment Objective | Investment Practices | Expense Ratio A |
| Fidelity Commodity Strategy Central Fund | Geode Capital Management, LLC (Geode) | Seeks to provide investment returns that correspond to the performance of the commodities market. | Investment in commodity-related investments through a wholly-owned subsidiary organized under the laws of the Cayman Islands Futures | Less than .005% |
| Fidelity Emerging Markets Debt Central Fund | Fidelity Management & Research Company LLC (FMR) | Seeks high total return by normally investing in debt securities of issuers in emerging markets and other debt investments that are tied economically to emerging markets. | Foreign Securities Restricted Securities | 0.02% |
| Fidelity Emerging Markets Equity Central Fund | Fidelity Management & Research Company LLC (FMR) | Seeks capital appreciation by investing primarily in equity securities of issuers in emerging markets. | Foreign Securities Futures Loans & Direct Debt Instruments | 0.02% |
| Fidelity International Equity Central Fund | Fidelity Management & Research Company LLC (FMR) | Seeks capital appreciation by investing primarily in non-U.S. based common stocks, including securities of issuers located in emerging markets. | Delayed Delivery & When Issued Securities Foreign Securities Futures Loans & Direct Debt Instruments | 0.01% |
| Fidelity Floating Rate Central Fund | Fidelity Management & Research Company LLC (FMR) | Seeks a high level of income by normally investing in floating rate loans and other floating rate securities. | Foreign Securities Loans & Direct Debt Instruments Restricted Securities | Less than .005% |
| Fidelity High Income Central Fund | Fidelity Management & Research Company LLC (FMR) | Seeks a high level of income and may also seek capital appreciation by investing primarily in debt securities, preferred stocks, and convertible securities, with an emphasis on lower-quality debt securities. | Loans & Direct Debt Instruments Restricted Securities | 0.03% |
| Fidelity Inflation-Protected Bond Index Central Fund | Fidelity Management & Research Company LLC (FMR) | Seeks to provide investment results that correspond to the performance of the inflation-protected United States Treasury market, and may invest in derivatives. | Less than .005% | |
| Fidelity Investment Grade Bond Central Fund | Fidelity Management & Research Company LLC (FMR) | Seeks a high level of income by normally investing in investment-grade debt securities. | Delayed Delivery & When Issued Securities Futures Restricted Securities Swaps | Less than .005% |
| Fidelity Real Estate Equity Central Fund | Fidelity Management & Research Company LLC (FMR) | Seeks above-average income and long-term capital growth by investing primarily in equity securities of issuers in the real estate industry. | Loans & Direct Debt Instruments | Less than .005% |
| Fidelity U.S. Equity Central Fund | Fidelity Management & Research Company LLC (FMR) | Seeks capital appreciation by investing primarily in common stocks, allocated across different market sectors. | Foreign Securities Futures Loans & Direct Debt Instruments Restricted Securities | Less than .005% |
| Fidelity Emerging Markets Debt Local Currency Central Fund | Fidelity Management & Research Company LLC (FMR) | Seeks high total return by normally investing in debt securities of issuers in emerging markets and other debt investments that are tied economically to emerging markets and denominated in the local currency of the issuer. | Foreign Securities Restricted Securities | Less than .005% |
| Fidelity Hedged Equity Central Fund | Fidelity Diversifying Solutions LLC (FDS) | Seeks capital appreciation by investing primarily in common stocks of companies with market capitalizations generally similar to companies in the S&P 500® Index. | Options | 0.01% |
| Fidelity Money Market Central Funds | Fidelity Management & Research Company LLC (FMR) | Each fund seeks to obtain a high level of current income consistent with the preservation of capital and liquidity. | Short-term Investments | Less than .005% |
| Gross unrealized appreciation | $648,383 |
| Gross unrealized depreciation | (5,824,241) |
| Net unrealized appreciation (depreciation) | $(5,175,858) |
| Tax cost | $57,046,309 |
| Interest Rate Risk | Interest rate risk relates to the fluctuations in the value of interest-bearing securities due to changes in the prevailing levels of market interest rates. |
| Purchases ($) | Sales ($) | |
| Fidelity Health Savings Fund | 17,114,514 | 8,180,998 |
| Annual % of Class-Level Average Net Assets | |
| Fidelity Health Savings Fund | .45% |
| Class K | .35% |
| Amount | |
| Fidelity Health Savings Fund | $1 |
| Total Security Lending Fees Paid to NFS | Security Lending Income From Securities Loaned to NFS | Value of Securities Loaned to NFS at Period End | |
| Fidelity Health Savings Fund | $2 | $- | $- |
| Six months ended March 31, 2023 | Year ended September 30, 2022 | |
| Fidelity Health Savings Fund | ||
| Distributions to shareholders | ||
| Fidelity Health Savings Fund | $585,083 | $553,514 |
| Class K | 752,039 | 612,762 |
Total | $1,337,122 | $1,166,276 |
| Shares | Shares | Dollars | Dollars | |
| Six months ended March 31, 2023 | Year ended September 30, 2022 | Six months ended March 31, 2023 | Year ended September 30, 2022 | |
| Fidelity Health Savings Fund | ||||
| Fidelity Health Savings Fund | ||||
| Shares sold | 299,592 | 741,885 | $2,826,258 | $7,995,080 |
| Reinvestment of distributions | 61,555 | 50,079 | 567,391 | 545,571 |
| Shares redeemed | (140,247) | (268,130) | (1,317,906) | (2,817,885) |
| Net increase (decrease) | 220,900 | 523,834 | $2,075,743 | $5,722,766 |
| Class K | ||||
| Shares sold | 830,924 | 1,121,709 | $7,810,517 | $11,928,637 |
| Reinvestment of distributions | 80,692 | 56,311 | 744,009 | 610,743 |
| Shares redeemed | (157,806) | (243,420) | (1,483,776) | (2,545,743) |
| Net increase (decrease) | 753,810 | 934,600 | $7,070,750 | $9,993,637 |
| The Example is based on an investment of $1,000 invested at the beginning of the period and held for the entire period (October 1, 2022 to March 31, 2023). |
Annualized Expense Ratio- A | Beginning Account Value October 1, 2022 | Ending Account Value March 31, 2023 | Expenses Paid During Period- C October 1, 2022 to March 31, 2023 | |||||||
| Fidelity® Health Savings Fund | ||||||||||
| Fidelity® Health Savings Fund | .45% | |||||||||
| Actual | $ 1,000 | $ 1,078.50 | $ 2.33 | |||||||
Hypothetical- B | $ 1,000 | $ 1,022.69 | $ 2.27 | |||||||
| Class K | .35% | |||||||||
| Actual | $ 1,000 | $ 1,079.20 | $ 1.81 | |||||||
Hypothetical- B | $ 1,000 | $ 1,023.19 | $ 1.77 | |||||||
- Highly liquid investments - cash or convertible to cash within three business days or less
- Moderately liquid investments - convertible to cash in three to seven calendar days
- Less liquid investments - can be sold or disposed of, but not settled, within seven calendar days
- Illiquid investments - cannot be sold or disposed of within seven calendar days
 |


Contents
Top Holdings (% of Fund's net assets) | ||
| Fidelity U.S. Bond Index Fund | 50.1 | |
| Fidelity Total Market Index Fund | 21.0 | |
| Fidelity Short-Term Bond Index Fund | 20.0 | |
| Fidelity Total International Index Fund | 8.9 | |
| 100.0 | ||
Asset Allocation (% of Fund's net assets) |
 |
| Domestic Equity Funds - 21.0% | |||
| Shares | Value ($) | ||
Fidelity Total Market Index Fund (a) (Cost $46,627) | 400 | 45,487 | |
| International Equity Funds - 8.9% | |||
| Shares | Value ($) | ||
Fidelity Total International Index Fund (a) (Cost $19,974) | 1,548 | 19,348 | |
| Bond Funds - 70.1% | |||
| Shares | Value ($) | ||
| Fidelity Short-Term Bond Index Fund (a) | 4,490 | 43,151 | |
| Fidelity U.S. Bond Index Fund (a) | 10,413 | 108,503 | |
| TOTAL BOND FUNDS (Cost $158,840) | 151,654 | ||
| TOTAL INVESTMENT IN SECURITIES - 100.0% (Cost $225,441) | 216,489 |
NET OTHER ASSETS (LIABILITIES) - 0.0% | (1) |
| NET ASSETS - 100.0% | 216,488 |
| (a) | Affiliated Fund |
| Affiliate | Value, beginning of period ($) | Purchases ($) | Sales Proceeds ($) | Dividend Income ($) | Realized Gain (loss) ($) | Change in Unrealized appreciation (depreciation) ($) | Value, end of period ($) |
| Fidelity Short-Term Bond Index Fund | 31,835 | 11,143 | 636 | 266 | (21) | 830 | 43,151 |
| Fidelity Total International Index Fund | 14,076 | 4,529 | 2,124 | 380 | (324) | 3,191 | 19,348 |
| Fidelity Total Market Index Fund | 32,681 | 12,198 | 4,227 | 495 | (612) | 5,447 | 45,487 |
| Fidelity U.S. Bond Index Fund | 79,280 | 26,847 | 613 | 1,254 | (39) | 3,028 | 108,503 |
| 157,872 | 54,717 | 7,600 | 2,395 | (996) | 12,496 | 216,489 |
| Valuation Inputs at Reporting Date: | ||||
| Description | Total ($) | Level 1 ($) | Level 2 ($) | Level 3 ($) |
Investments in Securities: | ||||
| Domestic Equity Funds | 45,487 | 45,487 | - | - |
| International Equity Funds | 19,348 | 19,348 | - | - |
| Bond Funds | 151,654 | 151,654 | - | - |
| Total Investments in Securities: | 216,489 | 216,489 | - | - |
| Statement of Assets and Liabilities | ||||
March 31, 2023 (Unaudited) | ||||
| Assets | ||||
| Investment in securities, at value - See accompanying schedule: | ||||
Affiliated issuers (cost $225,441) | $ | 216,489 | ||
| Total Investment in Securities (cost $225,441) | $ | 216,489 | ||
Total assets | 216,489 | |||
| Net Assets | �� | $ | 216,488 | |
| Net Assets consist of: | ||||
| Paid in capital | $ | 226,508 | ||
| Total accumulated earnings (loss) | (10,020) | |||
| Net Assets | $ | 216,488 | ||
Net Asset Value , offering price and redemption price per share ($216,488 ÷ 23,706 shares) | $ | 9.13 | ||
| Statement of Operations | ||||
Six months ended March 31, 2023 (Unaudited) | ||||
| Investment Income | ||||
| Dividends: | ||||
| Affiliated issuers | $ | 2,395 | ||
| Expenses | ||||
| Management fee | $ | 92 | ||
| Total expenses before reductions | 92 | |||
| Expense reductions | (92) | |||
| Net Investment income (loss) | 2,395 | |||
| Realized and Unrealized Gain (Loss) | ||||
| Net realized gain (loss) on: | ||||
| Investment Securities: | ||||
| Affiliated issuers | (996) | |||
| Total net realized gain (loss) | (996) | |||
| Change in net unrealized appreciation (depreciation) on: | ||||
| Investment Securities: | ||||
| Affiliated issuers | 12,496 | |||
| Total change in net unrealized appreciation (depreciation) | 12,496 | |||
| Net gain (loss) | 11,500 | |||
| Net increase (decrease) in net assets resulting from operations | $ | 13,895 | ||
| Statement of Changes in Net Assets | ||||
Six months ended March 31, 2023 (Unaudited) | For the period February 9, 2022 (commencement of operations) through September 30, 2022 | |||
| Increase (Decrease) in Net Assets | ||||
| Operations | ||||
| Net investment income (loss) | $ | 2,395 | $ | 1,215 |
| Net realized gain (loss) | (996) | (508) | ||
| Change in net unrealized appreciation (depreciation) | 12,496 | (21,448) | ||
| Net increase (decrease) in net assets resulting from operations | 13,895 | (20,741) | ||
| Distributions to shareholders | (2,247) | (927) | ||
| Share transactions | ||||
| Proceeds from sales of shares | 67,457 | 178,618 | ||
| Reinvestment of distributions | 2,247 | 927 | ||
| Cost of shares redeemed | (22,736) | (5) | ||
Net increase (decrease) in net assets resulting from share transactions | 46,968 | 179,540 | ||
| Total increase (decrease) in net assets | 58,616 | 157,872 | ||
| Net Assets | ||||
| Beginning of period | 157,872 | - | ||
| End of period | $ | 216,488 | $ | 157,872 |
| Other Information | ||||
| Shares | ||||
| Sold | 7,500 | 18,354 | ||
| Issued in reinvestment of distributions | 255 | 101 | ||
| Redeemed | (2,503) | (1) | ||
| Net increase (decrease) | 5,252 | 18,454 | ||
| Moderate with Income Allocation Fund |
Six months ended (Unaudited) March 31, 2023 | Years ended September 30, 2022 A | |||
Selected Per-Share Data | ||||
| Net asset value, beginning of period | $ | 8.55 | $ | 10.00 |
| Income from Investment Operations | ||||
Net investment income (loss) B,C | .12 | .08 | ||
| Net realized and unrealized gain (loss) | .57 | (1.47) | ||
| Total from investment operations | .69 | (1.39) | ||
| Distributions from net investment income | (.11) | (.06) | ||
| Total distributions | (.11) | (.06) | ||
| Net asset value, end of period | $ | 9.13 | $ | 8.55 |
Total Return D,E | 8.17% | (13.93)% | ||
Ratios to Average Net Assets C,F,G | ||||
| Expenses before reductions | .10% H | .10% H | ||
| Expenses net of fee waivers, if any | -% H | -% H | ||
| Expenses net of all reductions | -% H | -% H | ||
| Net investment income (loss) | 2.60% H | 1.36% H | ||
| Supplemental Data | ||||
| Net assets, end of period (000 omitted) | $ | 216 | $ | 158 |
Portfolio turnover rate I | 8% H | 11% H |
Top Holdings (% of Fund's net assets) | ||
| Fidelity U.S. Bond Index Fund | 40.1 | |
| Fidelity Total Market Index Fund | 35.0 | |
| Fidelity Total International Index Fund | 14.9 | |
| Fidelity Short-Term Bond Index Fund | 10.0 | |
| 100.0 | ||
Asset Allocation (% of Fund's net assets) |
 |
| Domestic Equity Funds - 35.0% | |||
| Shares | Value ($) | ||
Fidelity Total Market Index Fund (a) (Cost $128,439) | 1,100 | 125,015 | |
| International Equity Funds - 14.9% | |||
| Shares | Value ($) | ||
Fidelity Total International Index Fund (a) (Cost $54,234) | 4,255 | 53,189 | |
| Bond Funds - 50.1% | |||
| Shares | Value ($) | ||
| Fidelity Short-Term Bond Index Fund (a) | 3,710 | 35,652 | |
| Fidelity U.S. Bond Index Fund (a) | 13,727 | 143,035 | |
| TOTAL BOND FUNDS (Cost $186,334) | 178,687 | ||
| TOTAL INVESTMENT IN SECURITIES - 100.0% (Cost $369,007) | 356,891 |
NET OTHER ASSETS (LIABILITIES) - 0.0% | 2 |
| NET ASSETS - 100.0% | 356,893 |
| (a) | Affiliated Fund |
| Affiliate | Value, beginning of period ($) | Purchases ($) | Sales Proceeds ($) | Dividend Income ($) | Realized Gain (loss) ($) | Change in Unrealized appreciation (depreciation) ($) | Value, end of period ($) |
| Fidelity Short-Term Bond Index Fund | 25,588 | 12,544 | 3,175 | 222 | (36) | 731 | 35,652 |
| Fidelity Total International Index Fund | 37,701 | 16,272 | 8,568 | 1,053 | (873) | 8,657 | 53,189 |
| Fidelity Total Market Index Fund | 87,411 | 40,294 | 15,816 | 1,371 | (1,684) | 14,810 | 125,015 |
| Fidelity U.S. Bond Index Fund | 101,723 | 48,597 | 11,334 | 1,674 | (572) | 4,621 | 143,035 |
| 252,423 | 117,707 | 38,893 | 4,320 | (3,165) | 28,819 | 356,891 |
| Valuation Inputs at Reporting Date: | ||||
| Description | Total ($) | Level 1 ($) | Level 2 ($) | Level 3 ($) |
Investments in Securities: | ||||
| Domestic Equity Funds | 125,015 | 125,015 | - | - |
| International Equity Funds | 53,189 | 53,189 | - | - |
| Bond Funds | 178,687 | 178,687 | - | - |
| Total Investments in Securities: | 356,891 | 356,891 | - | - |
| Statement of Assets and Liabilities | ||||
March 31, 2023 (Unaudited) | ||||
| Assets | ||||
| Investment in securities, at value - See accompanying schedule: | ||||
Affiliated issuers (cost $369,007) | $ | 356,891 | ||
| Total Investment in Securities (cost $369,007) | $ | 356,891 | ||
| Receivable for fund shares sold | 633 | |||
Total assets | 357,524 | |||
| Liabilities | ||||
| Payable for investments purchased | $ | 631 | ||
| Total Liabilities | 631 | |||
| Net Assets | $ | 356,893 | ||
| Net Assets consist of: | ||||
| Paid in capital | $ | 371,860 | ||
| Total accumulated earnings (loss) | (14,967) | |||
| Net Assets | $ | 356,893 | ||
Net Asset Value , offering price and redemption price per share ($356,893 ÷ 39,420 shares) | $ | 9.05 | ||
| Statement of Operations | ||||
Six months ended March 31, 2023 (Unaudited) | ||||
| Investment Income | ||||
| Dividends: | ||||
| Affiliated issuers | $ | 4,320 | ||
| Expenses | ||||
| Management fee | $ | 154 | ||
| Independent trustees' fees and expenses | 1 | |||
| Total expenses before reductions | 155 | |||
| Expense reductions | (154) | |||
| Total expenses after reductions | 1 | |||
| Net Investment income (loss) | 4,319 | |||
| Realized and Unrealized Gain (Loss) | ||||
| Net realized gain (loss) on: | ||||
| Investment Securities: | ||||
| Affiliated issuers | (3,165) | |||
| Total net realized gain (loss) | (3,165) | |||
| Change in net unrealized appreciation (depreciation) on: | ||||
| Investment Securities: | ||||
| Affiliated issuers | 28,819 | |||
| Total change in net unrealized appreciation (depreciation) | 28,819 | |||
| Net gain (loss) | 25,654 | |||
| Net increase (decrease) in net assets resulting from operations | $ | 29,973 | ||
| Statement of Changes in Net Assets | ||||
Six months ended March 31, 2023 (Unaudited) | For the period February 9, 2022 (commencement of operations) through September 30, 2022 | |||
| Increase (Decrease) in Net Assets | ||||
| Operations | ||||
| Net investment income (loss) | $ | 4,319 | $ | 1,452 |
| Net realized gain (loss) | (3,165) | (684) | ||
| Change in net unrealized appreciation (depreciation) | 28,819 | (40,935) | ||
| Net increase (decrease) in net assets resulting from operations | 29,973 | (40,167) | ||
| Distributions to shareholders | (4,067) | (706) | ||
| Share transactions | ||||
| Proceeds from sales of shares | 152,272 | 296,747 | ||
| Reinvestment of distributions | 4,067 | 706 | ||
| Cost of shares redeemed | (77,775) | (4,157) | ||
Net increase (decrease) in net assets resulting from share transactions | 78,564 | 293,296 | ||
| Total increase (decrease) in net assets | 104,470 | 252,423 | ||
| Net Assets | ||||
| Beginning of period | 252,423 | - | ||
| End of period | $ | 356,893 | $ | 252,423 |
| Other Information | ||||
| Shares | ||||
| Sold | 17,144 | 30,805 | ||
| Issued in reinvestment of distributions | 473 | 79 | ||
| Redeemed | (8,641) | (440) | ||
| Net increase (decrease) | 8,976 | 30,444 | ||
| Balanced Allocation Fund |
Six months ended (Unaudited) March 31, 2023 | Years ended September 30, 2022 A | |||
Selected Per-Share Data | ||||
| Net asset value, beginning of period | $ | 8.29 | $ | 10.00 |
| Income from Investment Operations | ||||
Net investment income (loss) B,C | .12 | .06 | ||
| Net realized and unrealized gain (loss) | .77 | (1.74) | ||
| Total from investment operations | .89 | (1.68) | ||
| Distributions from net investment income | (.13) | (.03) | ||
| Total distributions | (.13) | (.03) | ||
| Net asset value, end of period | $ | 9.05 | $ | 8.29 |
Total Return D,E | 10.78% | (16.81)% | ||
Ratios to Average Net Assets C,F,G | ||||
| Expenses before reductions | .10% H | .10% H | ||
| Expenses net of fee waivers, if any | -% H | -% H | ||
| Expenses net of all reductions | -% H | -% H | ||
| Net investment income (loss) | 2.81% H | 1.07% H | ||
| Supplemental Data | ||||
| Net assets, end of period (000 omitted) | $ | 357 | $ | 252 |
Portfolio turnover rate I | 25% H | 12% H |
Top Holdings (% of Fund's net assets) | ||
| Fidelity Total Market Index Fund | 49.1 | |
| Fidelity U.S. Bond Index Fund | 25.1 | |
| Fidelity Total International Index Fund | 20.8 | |
| Fidelity Short-Term Bond Index Fund | 5.0 | |
| 100.0 | ||
Asset Allocation (% of Fund's net assets) |
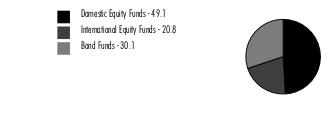 |
| Domestic Equity Funds - 49.1% | |||
| Shares | Value ($) | ||
Fidelity Total Market Index Fund (a) (Cost $242,356) | 2,100 | 238,652 | |
| International Equity Funds - 20.8% | |||
| Shares | Value ($) | ||
Fidelity Total International Index Fund (a) (Cost $101,181) | 8,109 | 101,365 | |
| Bond Funds - 30.1% | |||
| Shares | Value ($) | ||
| Fidelity Short-Term Bond Index Fund (a) | 2,533 | 24,342 | |
| Fidelity U.S. Bond Index Fund (a) | 11,685 | 121,758 | |
| TOTAL BOND FUNDS (Cost $152,104) | 146,100 | ||
| TOTAL INVESTMENT IN SECURITIES - 100.0% (Cost $495,641) | 486,117 |
NET OTHER ASSETS (LIABILITIES) - 0.0% | 0 |
| NET ASSETS - 100.0% | 486,117 |
| (a) | Affiliated Fund |
| Affiliate | Value, beginning of period ($) | Purchases ($) | Sales Proceeds ($) | Dividend Income ($) | Realized Gain (loss) ($) | Change in Unrealized appreciation (depreciation) ($) | Value, end of period ($) |
| Fidelity Short-Term Bond Index Fund | 17,365 | 8,813 | 2,331 | 155 | (19) | 514 | 24,342 |
| Fidelity Total International Index Fund | 71,347 | 30,290 | 15,773 | 2,169 | (1,193) | 16,694 | 101,365 |
| Fidelity Total Market Index Fund | 165,312 | 73,959 | 25,577 | 2,823 | (1,315) | 26,273 | 238,652 |
| Fidelity U.S. Bond Index Fund | 85,923 | 43,014 | 10,860 | 1,463 | (361) | 4,042 | 121,758 |
| 339,947 | 156,076 | 54,541 | 6,610 | (2,888) | 47,523 | 486,117 |
| Valuation Inputs at Reporting Date: | ||||
| Description | Total ($) | Level 1 ($) | Level 2 ($) | Level 3 ($) |
Investments in Securities: | ||||
| Domestic Equity Funds | 238,652 | 238,652 | - | - |
| International Equity Funds | 101,365 | 101,365 | - | - |
| Bond Funds | 146,100 | 146,100 | - | - |
| Total Investments in Securities: | 486,117 | 486,117 | - | - |
| Statement of Assets and Liabilities | ||||
March 31, 2023 (Unaudited) | ||||
| Assets | ||||
| Investment in securities, at value - See accompanying schedule: | ||||
Affiliated issuers (cost $495,641) | $ | 486,117 | ||
| Total Investment in Securities (cost $495,641) | $ | 486,117 | ||
| Receivable for investments sold | 51 | |||
| Receivable for fund shares sold | 570 | |||
Total assets | 486,738 | |||
| Liabilities | ||||
| Payable for investments purchased | $ | 621 | ||
| Total Liabilities | 621 | |||
| Net Assets | $ | 486,117 | ||
| Net Assets consist of: | ||||
| Paid in capital | $ | 504,199 | ||
| Total accumulated earnings (loss) | (18,082) | |||
| Net Assets | $ | 486,117 | ||
Net Asset Value , offering price and redemption price per share ($486,117 ÷ 54,025 shares) | $ | 9.00 | ||
| Statement of Operations | ||||
Six months ended March 31, 2023 (Unaudited) | ||||
| Investment Income | ||||
| Dividends: | ||||
| Affiliated issuers | $ | 6,610 | ||
| Expenses | ||||
| Management fee | $ | 215 | ||
| Independent trustees' fees and expenses | 1 | |||
| Total expenses before reductions | 216 | |||
| Expense reductions | (215) | |||
| Total expenses after reductions | 1 | |||
| Net Investment income (loss) | 6,609 | |||
| Realized and Unrealized Gain (Loss) | ||||
| Net realized gain (loss) on: | ||||
| Investment Securities: | ||||
| Affiliated issuers | (2,888) | |||
| Total net realized gain (loss) | (2,888) | |||
| Change in net unrealized appreciation (depreciation) on: | ||||
| Investment Securities: | ||||
| Affiliated issuers | 47,523 | |||
| Total change in net unrealized appreciation (depreciation) | 47,523 | |||
| Net gain (loss) | 44,635 | |||
| Net increase (decrease) in net assets resulting from operations | $ | 51,244 | ||
| Statement of Changes in Net Assets | ||||
Six months ended March 31, 2023 (Unaudited) | For the period February 9, 2022 (commencement of operations) through September 30, 2022 | |||
| Increase (Decrease) in Net Assets | ||||
| Operations | ||||
| Net investment income (loss) | $ | 6,609 | $ | 1,350 |
| Net realized gain (loss) | (2,888) | (6,503) | ||
| Change in net unrealized appreciation (depreciation) | 47,523 | (57,047) | ||
| Net increase (decrease) in net assets resulting from operations | 51,244 | (62,200) | ||
| Distributions to shareholders | (7,126) | - | ||
| Share transactions | ||||
| Proceeds from sales of shares | 148,351 | 445,709 | ||
| Reinvestment of distributions | 7,126 | - | ||
| Cost of shares redeemed | (53,425) | (43,562) | ||
Net increase (decrease) in net assets resulting from share transactions | 102,052 | 402,147 | ||
| Total increase (decrease) in net assets | 146,170 | 339,947 | ||
| Net Assets | ||||
| Beginning of period | 339,947 | - | ||
| End of period | $ | 486,117 | $ | 339,947 |
| Other Information | ||||
| Shares | ||||
| Sold | 17,066 | 47,105 | ||
| Issued in reinvestment of distributions | 835 | - | ||
| Redeemed | (6,006) | (4,975) | ||
| Net increase (decrease) | 11,895 | 42,130 | ||
| Growth Allocation Fund |
Six months ended (Unaudited) March 31, 2023 | Years ended September 30, 2022 A | |||
Selected Per-Share Data | ||||
| Net asset value, beginning of period | $ | 8.07 | $ | 10.00 |
| Income from Investment Operations | ||||
Net investment income (loss) B,C | .13 | .04 | ||
| Net realized and unrealized gain (loss) | .95 | (1.97) | ||
| Total from investment operations | 1.08 | (1.93) | ||
| Distributions from net investment income | (.15) | - | ||
| Total distributions | (.15) | - | ||
| Net asset value, end of period | $ | 9.00 | $ | 8.07 |
Total Return D,E | 13.42% | (19.30)% | ||
Ratios to Average Net Assets C,F,G | ||||
| Expenses before reductions | .10% H | .10% H | ||
| Expenses net of fee waivers, if any | -% H | -% H | ||
| Expenses net of all reductions | -% H | -% H | ||
| Net investment income (loss) | 3.07% H | .73% H | ||
| Supplemental Data | ||||
| Net assets, end of period (000 omitted) | $ | 486 | $ | 340 |
Portfolio turnover rate I | 26% H | 34% H |
Top Holdings (% of Fund's net assets) | ||
| Fidelity Total Market Index Fund | 60.1 | |
| Fidelity Total International Index Fund | 24.8 | |
| Fidelity U.S. Bond Index Fund | 15.1 | |
| 100.0 | ||
Asset Allocation (% of Fund's net assets) |
 |
| Domestic Equity Funds - 60.1% | |||
| Shares | Value ($) | ||
Fidelity Total Market Index Fund (a) (Cost $326,783) | 2,831 | 321,777 | |
| International Equity Funds - 24.8% | |||
| Shares | Value ($) | ||
Fidelity Total International Index Fund (a) (Cost $131,577) | 10,630 | 132,880 | |
| Bond Funds - 15.1% | |||
| Shares | Value ($) | ||
Fidelity U.S. Bond Index Fund (a) (Cost $83,592) | 7,726 | 80,506 | |
| TOTAL INVESTMENT IN SECURITIES - 100.0% (Cost $541,952) | 535,163 |
NET OTHER ASSETS (LIABILITIES) - 0.0% | (1) |
| NET ASSETS - 100.0% | 535,162 |
| (a) | Affiliated Fund |
| Affiliate | Value, beginning of period ($) | Purchases ($) | Sales Proceeds ($) | Dividend Income ($) | Realized Gain (loss) ($) | Change in Unrealized appreciation (depreciation) ($) | Value, end of period ($) |
| Fidelity Total International Index Fund | 88,592 | 46,115 | 21,476 | 2,808 | (2,257) | 21,906 | 132,880 |
| Fidelity Total Market Index Fund | 210,960 | 111,442 | 33,114 | 3,759 | (1,138) | 33,627 | 321,777 |
| Fidelity U.S. Bond Index Fund | 53,774 | 32,169 | 7,785 | 953 | (369) | 2,717 | 80,506 |
| 353,326 | 189,726 | 62,375 | 7,520 | (3,764) | 58,250 | 535,163 |
| Valuation Inputs at Reporting Date: | ||||
| Description | Total ($) | Level 1 ($) | Level 2 ($) | Level 3 ($) |
Investments in Securities: | ||||
| Domestic Equity Funds | 321,777 | 321,777 | - | - |
| International Equity Funds | 132,880 | 132,880 | - | - |
| Bond Funds | 80,506 | 80,506 | - | - |
| Total Investments in Securities: | 535,163 | 535,163 | - | - |
| Statement of Assets and Liabilities | ||||
March 31, 2023 (Unaudited) | ||||
| Assets | ||||
| Investment in securities, at value - See accompanying schedule: | ||||
Affiliated issuers (cost $541,952) | $ | 535,163 | ||
| Total Investment in Securities (cost $541,952) | $ | 535,163 | ||
| Receivable for fund shares sold | 1,638 | |||
Total assets | 536,801 | |||
| Liabilities | ||||
| Payable for investments purchased | $ | 1,639 | ||
| Total Liabilities | 1,639 | |||
| Net Assets | $ | 535,162 | ||
| Net Assets consist of: | ||||
| Paid in capital | $ | 547,983 | ||
| Total accumulated earnings (loss) | (12,821) | |||
| Net Assets | $ | 535,162 | ||
Net Asset Value , offering price and redemption price per share ($535,162 ÷ 60,045 shares) | $ | 8.91 | ||
| Statement of Operations | ||||
Six months ended March 31, 2023 (Unaudited) | ||||
| Investment Income | ||||
| Dividends: | ||||
| Affiliated issuers | $ | 7,520 | ||
| Expenses | ||||
| Management fee | $ | 233 | ||
| Independent trustees' fees and expenses | 1 | |||
| Total expenses before reductions | 234 | |||
| Expense reductions | (233) | |||
| Total expenses after reductions | 1 | |||
| Net Investment income (loss) | 7,519 | |||
| Realized and Unrealized Gain (Loss) | ||||
| Net realized gain (loss) on: | ||||
| Investment Securities: | ||||
| Affiliated issuers | (3,764) | |||
| Total net realized gain (loss) | (3,764) | |||
| Change in net unrealized appreciation (depreciation) on: | ||||
| Investment Securities: | ||||
| Affiliated issuers | 58,250 | |||
| Total change in net unrealized appreciation (depreciation) | 58,250 | |||
| Net gain (loss) | 54,486 | |||
| Net increase (decrease) in net assets resulting from operations | $ | 62,005 | ||
| Statement of Changes in Net Assets | ||||
Six months ended March 31, 2023 (Unaudited) | For the period February 9, 2022 (commencement of operations) through September 30, 2022 | |||
| Increase (Decrease) in Net Assets | ||||
| Operations | ||||
| Net investment income (loss) | $ | 7,519 | $ | 880 |
| Net realized gain (loss) | (3,764) | (2,613) | ||
| Change in net unrealized appreciation (depreciation) | 58,250 | (65,039) | ||
| Net increase (decrease) in net assets resulting from operations | 62,005 | (66,772) | ||
| Distributions to shareholders | (8,054) | - | ||
| Share transactions | ||||
| Proceeds from sales of shares | 192,830 | 437,529 | ||
| Reinvestment of distributions | 8,054 | - | ||
| Cost of shares redeemed | (72,998) | (17,432) | ||
Net increase (decrease) in net assets resulting from share transactions | 127,886 | 420,097 | ||
| Total increase (decrease) in net assets | 181,837 | 353,325 | ||
| Net Assets | ||||
| Beginning of period | 353,325 | - | ||
| End of period | $ | 535,162 | $ | 353,325 |
| Other Information | ||||
| Shares | ||||
| Sold | 22,523 | 46,920 | ||
| Issued in reinvestment of distributions | 959 | - | ||
| Redeemed | (8,345) | (2,012) | ||
| Net increase (decrease) | 15,137 | 44,908 | ||
| Aggressive Growth Allocation Fund |
Six months ended (Unaudited) March 31, 2023 | Years ended September 30, 2022 A | |||
Selected Per-Share Data | ||||
| Net asset value, beginning of period | $ | 7.87 | $ | 10.00 |
| Income from Investment Operations | ||||
Net investment income (loss) B,C | .14 | .03 | ||
| Net realized and unrealized gain (loss) | 1.05 | (2.16) | ||
| Total from investment operations | 1.19 | (2.13) | ||
| Distributions from net investment income | (.15) | - | ||
| Distributions from net realized gain | - D | - | ||
| Total distributions | (.15) | - | ||
| Net asset value, end of period | $ | 8.91 | $ | 7.87 |
Total Return E,F | 15.29% | (21.30)% | ||
Ratios to Average Net Assets C,G,H | ||||
| Expenses before reductions | .10% I | .10% I | ||
| Expenses net of fee waivers, if any | -% I | -% I | ||
| Expenses net of all reductions | -% I | -% I | ||
| Net investment income (loss) | 3.22% I | .46% I | ||
| Supplemental Data | ||||
| Net assets, end of period (000 omitted) | $ | 535 | $ | 353 |
Portfolio turnover rate J | 27% I | 14% I |
| Tax cost | Gross unrealized appreciation | Gross unrealized depreciation | Net unrealized appreciation (depreciation) | |
| Moderate with Income Allocation Fund | $226,748 | $1,524 | $ (11,783) | $ (10,259) |
| Balanced Allocation Fund | 372,878 | 4,204 | (20,191) | (15,987) |
| Growth Allocation Fund | 503,368 | 9,156 | (26,407) | (17,251) |
| Aggressive Growth Allocation Fund | 548,446 | 11,805 | (25,088) | (13,283) |
| Short-term | Long-term | Total capital loss carryforward | |
| Moderate with Income Allocation Fund | $(8) | $- | $(8) |
| Growth Allocation Fund | (1,655) | - | (1,655) |
| Purchases ($) | Sales ($) | |
| Moderate with Income Allocation Fund | 54,717 | 7,600 |
| Balanced Allocation Fund | 117,707 | 38,893 |
| Growth Allocation Fund | 156,076 | 54,541 |
| Aggressive Growth Allocation Fund | 189,726 | 62,375 |
| Management Fee Waiver | |
| Moderate with Income Allocation Fund | $92 |
| Balanced Allocation Fund | $154 |
| Growth Allocation Fund | $215 |
| Aggressive Growth Allocation Fund | $233 |
| Fund | Affiliated % |
| Moderate with Income Allocation Fund | 33% |
| Balanced Allocation Fund | 10% |
| Growth Allocation Fund | 15% |
| Aggressive Growth Allocation Fund | 15% |
| The Example is based on an investment of $1,000 invested at the beginning of the period and held for the entire period (October 1, 2022 to March 31, 2023). |
Annualized Expense Ratio- A | Beginning Account Value October 1, 2022 | Ending Account Value March 31, 2023 | Expenses Paid During Period- C October 1, 2022 to March 31, 2023 | |||||||
| Moderate with Income Allocation Fund | -%- D | |||||||||
| Actual | $ 1,000 | $ 1,081.70 | $- E | |||||||
Hypothetical- B | $ 1,000 | $ 1,024.93 | $- E | |||||||
| Balanced Allocation Fund | -%- D | |||||||||
| Actual | $ 1,000 | $ 1,107.80 | $- E | |||||||
Hypothetical- B | $ 1,000 | $ 1,024.93 | $- E | |||||||
| Growth Allocation Fund | -%- D | |||||||||
| Actual | $ 1,000 | $ 1,134.20 | $- E | |||||||
Hypothetical- B | $ 1,000 | $ 1,024.93 | $- E | |||||||
| Aggressive Growth Allocation Fund | -%- D | |||||||||
| Actual | $ 1,000 | $ 1,152.90 | $- E | |||||||
Hypothetical- B | $ 1,000 | $ 1,024.93 | $- E | |||||||
- Highly liquid investments - cash or convertible to cash within three business days or less
- Moderately liquid investments - convertible to cash in three to seven calendar days
- Less liquid investments - can be sold or disposed of, but not settled, within seven calendar days
- Illiquid investments - cannot be sold or disposed of within seven calendar days
 |
Item 2.
Code of Ethics
Not applicable.
Item 3.
Audit Committee Financial Expert
Not applicable.
Item 4.
Principal Accountant Fees and Services
Not applicable.
Item 5.
Audit Committee of Listed Registrants
Not applicable.
Item 6.
Investments
(a)
Not applicable.
(b)
Not applicable
Item 7.
Disclosure of Proxy Voting Policies and Procedures for Closed-End Management Investment Companies
Not applicable.
Item 8.
Portfolio Managers of Closed-End Management Investment Companies
Not applicable.
Item 9.
Purchase of Equity Securities by Closed-End Management Investment Company and Affiliated Purchasers
Not applicable.
Item 10.
Submission of Matters to a Vote of Security Holders
There were no material changes to the procedures by which shareholders may recommend nominees to the Fidelity Charles Street Trust’s Board of Trustees.
Item 11.
Controls and Procedures
(a)(i) The President and Treasurer and the Chief Financial Officer have concluded that the Fidelity Charles Street Trust’s (the “Trust”) disclosure controls and procedures (as defined in Rule 30a-3(c) under the Investment Company Act) provide reasonable assurances that material information relating to the Trust is made known to them by the appropriate persons, based on their evaluation of these controls and procedures as of a date within 90 days of the filing date of this report.
(a)(ii) There was no change in the Trust’s internal control over financial reporting (as defined in Rule 30a-3(d) under the Investment Company Act) that occurred during the period covered by this report that has materially affected, or is reasonably likely to materially affect, the Trust’s internal control over financial reporting.
Item 12.
Disclosure of Securities Lending Activities for Closed-End Management
Investment Companies
Not applicable.
Item 13.
Exhibits
(a) | (1) | Not applicable. |
(a) | (2) | |
(a) | (3) | Not applicable. |
(b) |
SIGNATURES
Pursuant to the requirements of the Securities Exchange Act of 1934 and the Investment Company Act of 1940, the registrant has duly caused this report to be signed on its behalf by the undersigned, thereunto duly authorized.
Fidelity Charles Street Trust
By: | /s/Laura M. Del Prato |
Laura M. Del Prato | |
President and Treasurer | |
Date: | May 19, 2023 |
Pursuant to the requirements of the Securities Exchange Act of 1934 and the Investment Company Act of 1940, this report has been signed below by the following persons on behalf of the registrant and in the capacities and on the dates indicated.
By: | /s/Laura M. Del Prato |
Laura M. Del Prato | |
President and Treasurer | |
Date: | May 19, 2023 |
By: | /s/John J. Burke III |
John J. Burke III | |
Chief Financial Officer | |
Date: | May 19, 2023 |