UNITED STATES
SECURITIES AND EXCHANGE COMMISSION
Washington, D.C. 20549
FORM N-CSR
CERTIFIED SHAREHOLDER REPORT OF REGISTERED
MANAGEMENT INVESTMENT COMPANIES
Investment Company Act file number 811-3221
Fidelity Charles Street Trust
(Exact name of registrant as specified in charter)
245 Summer St., Boston, Massachusetts 02210
(Address of principal executive offices) (Zip code)
Marc Bryant, Secretary
245 Summer St.
Boston, Massachusetts 02210
(Name and address of agent for service)
Registrant's telephone number, including area code:
617-563-7000
| |
Date of fiscal year end: | October 31 |
| |
Date of reporting period: | October 31, 2016 |
Item 1.
Reports to Stockholders
Fidelity® Global Balanced Fund
Annual Report October 31, 2016 |
 |
Contents
To view a fund's proxy voting guidelines and proxy voting record for the 12-month period ended June 30, visit http://www.fidelity.com/proxyvotingresults or visit the Securities and Exchange Commission's (SEC) web site at http://www.sec.gov.
You may also call 1-800-544-8544 to request a free copy of the proxy voting guidelines.
Standard & Poor's, S&P and S&P 500 are registered service marks of The McGraw-Hill Companies, Inc. and have been licensed for use by Fidelity Distributors Corporation.
Other third-party marks appearing herein are the property of their respective owners.
All other marks appearing herein are registered or unregistered trademarks or service marks of FMR LLC or an affiliated company. © 2016 FMR LLC. All rights reserved.
This report and the financial statements contained herein are submitted for the general information of the shareholders of the Fund. This report is not authorized for distribution to prospective investors in the Fund unless preceded or accompanied by an effective prospectus.
A fund files its complete schedule of portfolio holdings with the SEC for the first and third quarters of each fiscal year on Form N-Q. Forms N-Q are available on the SEC’s web site at http://www.sec.gov. A fund's Forms N-Q may be reviewed and copied at the SEC’s Public Reference Room in Washington, DC. Information regarding the operation of the SEC's Public Reference Room may be obtained by calling 1-800-SEC-0330.
For a complete list of a fund's portfolio holdings, view the most recent holdings listing, semiannual report, or annual report on Fidelity's web site at http://www.fidelity.com, http://www.institutional.fidelity.com, or http://www.401k.com, as applicable.
NOT FDIC INSURED •MAY LOSE VALUE •NO BANK GUARANTEE
Neither the Fund nor Fidelity Distributors Corporation is a bank.
Performance: The Bottom Line
Average annual total return reflects the change in the value of an investment, assuming reinvestment of distributions from dividend income and capital gains (the profits earned upon the sale of securities that have grown in value, if any) and assuming a constant rate of performance each year. The hypothetical investment and the average annual total returns do not reflect the deduction of taxes that a shareholder would pay on fund distributions or the redemption of fund shares. During periods of reimbursement by Fidelity, a fund’s total return will be greater than it would be had the reimbursement not occurred. How a fund did yesterday is no guarantee of how it will do tomorrow.
Average Annual Total Returns
| For the periods ended October 31, 2016 | Past 1 year | Past 5 years | Past 10 years |
| Fidelity® Global Balanced Fund | 2.64% | 5.27% | 4.84% |
$10,000 Over 10 Years
Let's say hypothetically that $10,000 was invested in Fidelity® Global Balanced Fund, a class of the fund, on October 31, 2006.
The chart shows how the value of your investment would have changed, and also shows how the MSCI World Index performed over the same period.
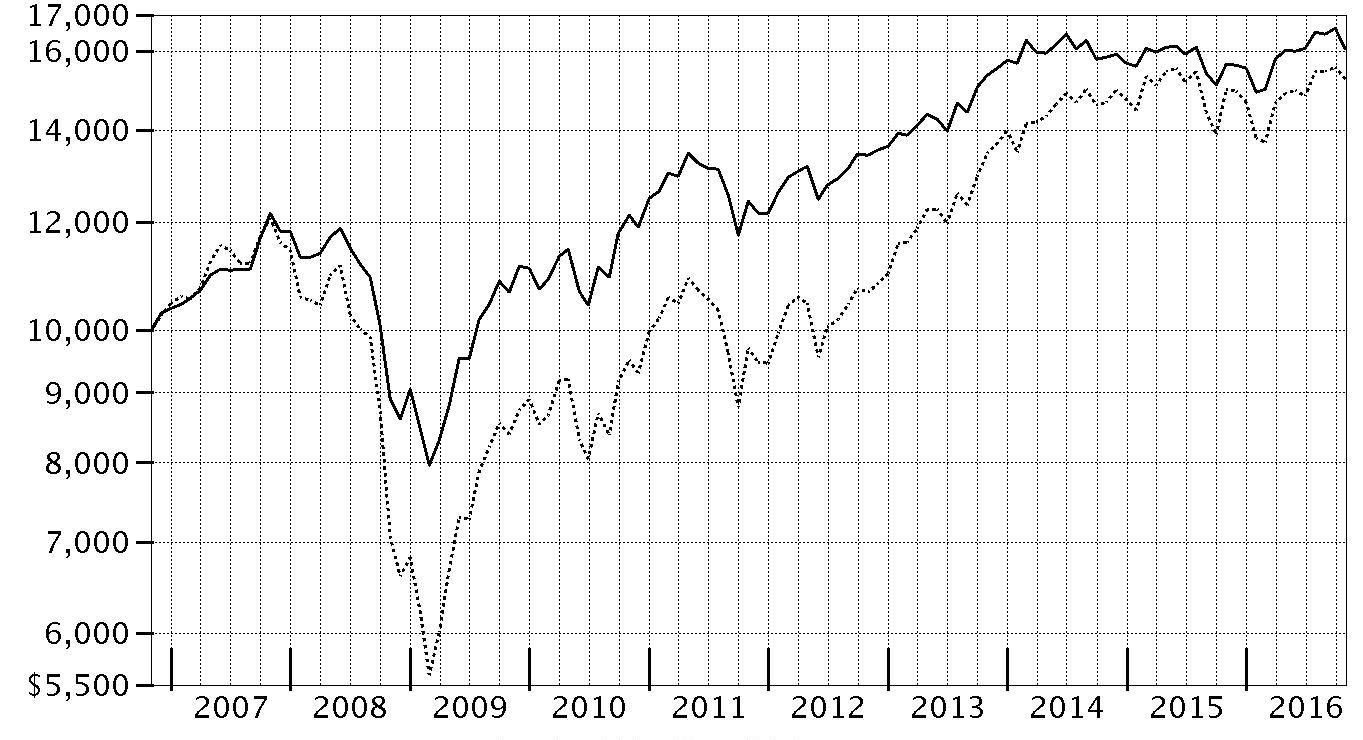
| Period Ending Values |
| $16,049 | Fidelity® Global Balanced Fund |
| $15,261 | MSCI World Index |
Management's Discussion of Fund Performance
Market Recap: Global equities, as measured by the MSCI ACWI (All Country World Index) Index, eked a 2.48% gain for the year ending October 31, 2016. After early-2016 volatility largely driven by concern about energy prices and global growth, central banks in Europe, Japan and China took action to reignite their economies; the U.S. Federal Reserve added fuel by softening its rate-hike stance. Stock prices recovered nicely until the U.K.’s June vote to exit the European Union (Brexit) touched off near-tumult in global markets. After a sharp initial rebound, the MSCI index traced a generally upward arc into autumn. Regionally, Canada (+10%) and emerging markets (+9%) benefited from rising commodity prices. Japan (+4%) topped the index but lagged the rest of the Asia Pacific group (+9%). The U.S. (+4%) also outperformed, but Europe (-5%) and the U.K. (-11%) were beset by Brexit stress. Global taxable investment-grade bonds rose 4.72% overall, according to the Bloomberg Barclays Global Aggregate GDP Weighted Index, propelled largely by a strong first half of the period and continued demand for fixed income in a low-yield environment. By segment, corporate bonds outperformed the market, as did local-authority and sovereign debt, while securitized sectors lagged. Regionally, Japan led the market higher, while the U.K. fell markedly. Outside the index, high-yield emerging-markets debt was particularly strong.
Comments from Lead Portfolio Manager Geoff Stein: For the year, the fund’s share classes (excluding sales charges, if applicable) posted low-single-digit gains, trailing the 3.54% return of the Fidelity Global Balanced Composite Index. Security selection as a whole had a net neutral impact versus the Composite index. Beneficial stock picks in Europe and Japan, along with selections in investment-grade bonds, offset disappointing U.S. stock selection. Asset allocation modestly contributed, led by an overweighting in Canadian equities during the first half of the period. The manager of the U.S. equity subportfolio was hurt by underexposure to income-oriented sectors in the Composite index, such as utilities and consumer staples, which generated some of the strongest returns. The European equity subportfolio was bolstered by broadly positive contributions across various countries, most notably Germany, Denmark and Sweden. Within investment-grade bonds, a variety of U.S. and foreign-government securities contributed most, led by Japanese government bonds, U.S. Treasuries and Treasury Inflation-Protected Securities, or TIPS.
The views expressed above reflect those of the portfolio manager(s) only through the end of the period as stated on the cover of this report and do not necessarily represent the views of Fidelity or any other person in the Fidelity organization. Any such views are subject to change at any time based upon market or other conditions and Fidelity disclaims any responsibility to update such views. These views may not be relied on as investment advice and, because investment decisions for a Fidelity fund are based on numerous factors, may not be relied on as an indication of trading intent on behalf of any Fidelity fund.
Note to shareholders: John Dance and David Simner became Co-Portfolio Managers of the fund during the period. John Lo, Maria Nikishkova and Andy Weir are no longer serving as Co-Managers.
Investment Summary (Unaudited)
The information in the following tables is based on the combined investments of the Fund and its pro-rata share of the investments of Fidelity's Central Funds, other than the Commodity Strategy and Money Market Central Funds.
Geographic Diversification (% of fund's net assets)
| As of October 31, 2016 |
| | United States of America* | 46.2% |
| | Japan | 12.4% |
| | United Kingdom | 6.0% |
| | Germany | 4.9% |
| | Netherlands | 4.0% |
| | Canada | 3.4% |
| | France | 3.2% |
| | Ireland | 3.1% |
| | Italy | 1.8% |
| | Other | 15.0% |

* Includes Short-Term investments and Net Other Assets (Liabilities).
Percentages are based on country or territory of incorporation and are adjusted for the effect of futures contracts, if applicable.
| As of April 30, 2016 |
| | United States of America* | 50.8% |
| | Japan | 12.1% |
| | United Kingdom | 5.6% |
| | Canada | 4.4% |
| | Germany | 3.7% |
| | Netherlands | 3.2% |
| | Spain | 3.2% |
| | Italy | 2.6% |
| | Sweden | 2.1% |
| | Other | 12.3% |

* Includes Short-Term investments and Net Other Assets (Liabilities).
Percentages are based on country or territory of incorporation and are adjusted for the effect of futures contracts, if applicable.
Asset Allocation as of October 31, 2016
| | % of fund's net assets | % of fund's net assets 6 months ago |
| Stocks | 58.4(a) | 58.8(b) |
| Bonds | 35.2 | 31.9 |
| Other Investments | 3.8 | 4.0 |
| Short-Term Investments and Net Other Assets (Liabilities) | 2.6 | 5.3 |
(a) Includes investment in Fidelity® Commodity Strategy Central Fund of 0.8%
(b) Includes investment in Fidelity® Commodity Strategy Central Fund of 1.1%
Top Five Stocks as of October 31, 2016
| | % of fund's net assets | % of fund's net assets 6 months ago |
| Alphabet, Inc. Class A (United States of America) | 2.1 | 1.8 |
| Adobe Systems, Inc. (United States of America) | 2.0 | 1.8 |
| S&P Global, Inc. (United States of America) | 1.9 | 1.1 |
| Apple, Inc. (United States of America) | 1.4 | 0.0 |
| Amazon.com, Inc. (United States of America) | 1.4 | 0.8 |
| | 8.8 | |
Top Five Bond Issuers as of October 31, 2016
| (with maturities greater than one year) | % of fund's net assets | % of fund's net assets 6 months ago |
| Japan Government | 9.0 | 7.6 |
| U.S. Treasury Obligations | 8.9 | 4.3 |
| Dutch Government | 1.6 | 2.1 |
| United Kingdom, Great Britain and Northern Ireland | 1.0 | 0.9 |
| Spanish Kingdom | 1.0 | 2.8 |
| | 21.5 | |
Top Market Sectors as of October 31, 2016
| | % of fund's net assets | % of fund's net assets 6 months ago |
| Financials | 19.4 | 16.0 |
| Information Technology | 15.5 | 11.5 |
| Industrials | 7.2 | 9.2 |
| Consumer Discretionary | 7.2 | 8.3 |
| Health Care | 6.4 | 8.0 |
| Energy | 4.1 | 3.4 |
| Consumer Staples | 4.0 | 5.5 |
| Real Estate | 1.7 | 0.0 |
| Materials | 1.4 | 2.5 |
| Utilities | 1.2 | 0.5 |
Prior period industry classifications reflect the categories in place as of the date indicated and have not been adjusted to reflect current industry classifications.
An unaudited holdings listing for the Fund, which presents direct holdings as well as the pro-rata share of any securities and other investments held indirectly through its investment in underlying Fidelity Central Funds, other than the Commodity Strategy and Money Market Central Funds, is available at fidelity.com and/or institutional.fidelity.com, as applicable.
Percentages shown as 0.0% may reflect amounts less than 0.05%.
Investments October 31, 2016
Showing Percentage of Net Assets
| Common Stocks - 56.2% | | | |
| | | Shares | Value |
| Australia - 1.6% | | | |
| Abacus Property Group unit | | 82,842 | $176,450 |
| Aconex Ltd. (a) | | 37,422 | 158,276 |
| ALS Ltd. | | 34,115 | 161,676 |
| Amcor Ltd. | | 29,438 | 329,184 |
| Arena (REIT) unit | | 154,609 | 227,577 |
| Asaleo Care Ltd. | | 186,334 | 206,947 |
| Aub Group Ltd. | | 28,929 | 217,862 |
| Australia & New Zealand Banking Group Ltd. | | 37,254 | 789,244 |
| Bapcor Ltd. | | 67,442 | 263,185 |
| Beacon Lighting Group Ltd. | | 223,190 | 287,778 |
| BHP Billiton Ltd. | | 21,292 | 371,989 |
| Blue Sky Alternative Investments Ltd. | | 37,721 | 208,895 |
| Coca-Cola Amatil Ltd. | | 31,911 | 231,581 |
| Commonwealth Bank of Australia | | 20,345 | 1,135,816 |
| Corporate Travel Managemnt Ltd. | | 14,544 | 210,209 |
| CSL Ltd. | | 8,513 | 650,887 |
| Hansen Technologies Ltd. | | 82,376 | 257,547 |
| HUB24 Ltd. (a) | | 42,001 | 169,336 |
| Magellan Financial Group Ltd. | | 17,940 | 290,544 |
| McMillan Shakespeare Ltd. | | 10,918 | 89,947 |
| NIB Holdings Ltd. | | 80,499 | 295,156 |
| realestate.com.au Ltd. | | 6,424 | 249,908 |
| Reliance Worldwide Corp. Ltd. | | 85,463 | 192,435 |
| Sydney Airport unit | | 65,232 | 310,634 |
| Vita Group Ltd. | | 52,328 | 162,806 |
| Woodside Petroleum Ltd. | | 16,191 | 349,419 |
|
| TOTAL AUSTRALIA | | | 7,995,288 |
|
| Bailiwick of Jersey - 0.6% | | | |
| Randgold Resources Ltd. | | 1,202 | 106,746 |
| Shire PLC | | 34,900 | 1,970,548 |
| Wizz Air Holdings PLC (a) | | 7,000 | 129,462 |
| Wolseley PLC | | 14,542 | 756,653 |
|
| TOTAL BAILIWICK OF JERSEY | | | 2,963,409 |
|
| Bermuda - 1.4% | | | |
| Credicorp Ltd. (United States) | | 1,200 | 178,416 |
| Dairy Farm International Holdings Ltd. | | 46,400 | 328,048 |
| Hongkong Land Holdings Ltd. | | 51,500 | 345,050 |
| IHS Markit Ltd. (a) | | 103,800 | 3,818,802 |
| PAX Global Technology Ltd. | | 194,000 | 121,320 |
| Vostok Emerging Finance Ltd. (depository receipt) (a) | | 3,274,986 | 536,636 |
| Vostok New Ventures Ltd. SDR (a) | | 239,261 | 1,794,693 |
|
| TOTAL BERMUDA | | | 7,122,965 |
|
| Canada - 2.8% | | | |
| Agnico Eagle Mines Ltd. (Canada) | | 3,650 | 185,371 |
| Agrium, Inc. | | 2,410 | 221,236 |
| AGT Food & Ingredients, Inc. | | 900 | 25,592 |
| Alimentation Couche-Tard, Inc. Class B (sub. vtg.) | | 5,150 | 258,709 |
| Allied Properties (REIT) | | 3,370 | 90,600 |
| ARC Resources Ltd. | | 6,850 | 116,286 |
| AutoCanada, Inc. | | 2,150 | 35,344 |
| Bank of Nova Scotia | | 6,280 | 337,480 |
| Barrick Gold Corp. | | 3,100 | 54,544 |
| Brookfield Asset Management, Inc. Class A | | 1,700 | 59,531 |
| Canadian Energy Services & Technology Corp. | | 14,740 | 58,134 |
| Canadian National Railway Co. | | 9,710 | 610,413 |
| Canadian Natural Resources Ltd. | | 7,020 | 222,800 |
| CCL Industries, Inc. Class B | | 580 | 103,149 |
| Cenovus Energy, Inc. | | 13,590 | 196,053 |
| CGI Group, Inc. Class A (sub. vtg.) (a) | | 3,980 | 189,045 |
| Cogeco Communications, Inc. | | 1,600 | 74,626 |
| Constellation Software, Inc. | | 330 | 154,593 |
| Corus Entertainment, Inc. Class B (non-vtg.) | | 4,900 | 40,441 |
| Detour Gold Corp. (a) | | 4,660 | 88,836 |
| Element Financial Corp. | | 6,400 | 62,363 |
| Empire Co. Ltd. Class A (non-vtg.) | | 1,900 | 27,367 |
| Enbridge, Inc. | | 10,620 | 458,593 |
| Fairfax Financial Holdings Ltd. (sub. vtg.) | | 250 | 128,038 |
| Franco-Nevada Corp. | | 2,520 | 164,938 |
| George Weston Ltd. | | 2,520 | 205,350 |
| Hydro One Ltd. | | 4,240 | 77,352 |
| Imperial Oil Ltd. | | 4,660 | 151,130 |
| Intact Financial Corp. | | 2,610 | 177,425 |
| Jean Coutu Group, Inc. Class A (sub. vtg.) | | 3,280 | 49,397 |
| Keyera Corp. | | 1,746 | 52,407 |
| Labrador Iron Ore Royalty Corp. | | 4,760 | 52,132 |
| Lundin Mining Corp. (a) | | 19,260 | 75,386 |
| Magna International, Inc. Class A (sub. vtg.) | | 520 | 21,350 |
| Metro, Inc. Class A (sub. vtg.) | | 1,100 | 34,001 |
| North West Co., Inc. | | 2,880 | 54,968 |
| NuVista Energy Ltd. (a) | | 7,000 | 35,592 |
| Open Text Corp. | | 2,310 | 143,426 |
| Painted Pony Petroleum Ltd. (a) | | 6,280 | 38,486 |
| Parkland Fuel Corp. | | 3,090 | 72,176 |
| Pason Systems, Inc. | | 3,100 | 35,246 |
| Peyto Exploration & Development Corp. | | 3,600 | 92,489 |
| Power Corp. of Canada (sub. vtg.) | | 9,970 | 213,850 |
| PrairieSky Royalty Ltd. (b) | | 177,858 | 3,867,977 |
| Quebecor, Inc. Class B (sub. vtg.) | | 3,180 | 89,238 |
| Raging River Exploration, Inc. (a) | | 7,170 | 57,465 |
| Rogers Communications, Inc. Class B (non-vtg.) | | 10,170 | 409,135 |
| Royal Bank of Canada | | 17,080 | 1,067,102 |
| Shopify, Inc. Class A (a) | | 2,700 | 111,915 |
| Silver Wheaton Corp. | | 6,190 | 149,154 |
| Sleep Country Canada Holdings, Inc. | | 1,500 | 31,883 |
| Spartan Energy Corp. (a) | | 18,480 | 42,986 |
| Stantec, Inc. | | 2,970 | 66,074 |
| Sun Life Financial, Inc. | | 12,080 | 404,288 |
| Suncor Energy, Inc. | | 20,132 | 604,125 |
| Tahoe Resources, Inc. | | 6,960 | 83,439 |
| Teck Resources Ltd. Class B (sub. vtg.) | | 2,620 | 56,568 |
| TELUS Corp. | | 10,460 | 338,685 |
| The Toronto-Dominion Bank | | 21,920 | 994,596 |
| TMX Group Ltd. | | 1,300 | 59,984 |
| Torex Gold Resources, Inc. (a) | | 2,682 | 49,889 |
| Toromont Industries Ltd. | | 1,700 | 49,937 |
| TransForce, Inc. | | 2,650 | 60,120 |
| Western Forest Products, Inc. | | 41,500 | 63,118 |
| WestJet Airlines Ltd. | | 3,280 | 53,676 |
| Whitecap Resources, Inc. | | 8,130 | 64,977 |
| ZCL Composites, Inc. | | 3,760 | 32,770 |
|
| TOTAL CANADA | | | 14,355,346 |
|
| Cayman Islands - 0.7% | | | |
| Alibaba Group Holding Ltd. sponsored ADR (a) | | 21,300 | 2,165,997 |
| CK Hutchison Holdings Ltd. | | 45,500 | 562,916 |
| International Housewares Retail Co. Ltd. | | 981,000 | 196,060 |
| Tencent Holdings Ltd. | | 27,600 | 731,465 |
|
| TOTAL CAYMAN ISLANDS | | | 3,656,438 |
|
| China - 0.0% | | | |
| Shenzhen Expressway Co. (H Shares) | | 168,000 | 168,746 |
| Denmark - 0.4% | | | |
| DONG Energy A/S | | 3,075 | 121,942 |
| Nets A/S (c) | | 54,000 | 1,031,258 |
| Scandinavian Tobacco Group A/S | | 43,630 | 755,306 |
|
| TOTAL DENMARK | | | 1,908,506 |
|
| Finland - 0.2% | | | |
| Valmet Corp. | | 58,800 | 873,330 |
| France - 1.1% | | | |
| Amundi SA | | 1,100 | 53,910 |
| Bollore Group | | 189,040 | 622,556 |
| Capgemini SA | | 12,500 | 1,035,727 |
| Havas SA | | 156,700 | 1,274,821 |
| Publicis Groupe SA | | 8,139 | 558,412 |
| Rubis | | 11,100 | 1,012,332 |
| Wendel SA | | 9,300 | 1,069,911 |
|
| TOTAL FRANCE | | | 5,627,669 |
|
| Germany - 2.7% | | | |
| adidas AG | | 28,500 | 4,682,378 |
| Bertrandt AG | | 2,500 | 266,342 |
| Brenntag AG | | 22,500 | 1,202,736 |
| CompuGroup Medical AG | | 20,100 | 889,872 |
| CTS Eventim AG | | 20,299 | 729,330 |
| EDAG Engineering Group AG | | 13,000 | 214,061 |
| Fresenius Medical Care AG & Co. KGaA | | 8,000 | 651,633 |
| Fresenius SE & Co. KGaA | | 11,300 | 834,084 |
| GEA Group AG | | 22,152 | 856,579 |
| LEG Immobilien AG | | 7,080 | 597,206 |
| SAP AG | | 31,567 | 2,781,035 |
|
| TOTAL GERMANY | | | 13,705,256 |
|
| Hong Kong - 0.4% | | | |
| AIA Group Ltd. | | 166,800 | 1,052,776 |
| Hang Seng Bank Ltd. | | 23,500 | 424,515 |
| Power Assets Holdings Ltd. | | 58,500 | 550,261 |
|
| TOTAL HONG KONG | | | 2,027,552 |
|
| India - 0.3% | | | |
| HDFC Bank Ltd. | | 35,000 | 782,111 |
| HDFC Bank Ltd. sponsored ADR | | 7,000 | 495,460 |
| Housing Development Finance Corp. Ltd. | | 6,000 | 125,180 |
|
| TOTAL INDIA | | | 1,402,751 |
|
| Ireland - 2.1% | | | |
| Accenture PLC Class A | | 33,500 | 3,894,040 |
| Alkermes PLC (a) | | 48,900 | 2,465,049 |
| CRH PLC | | 1,500 | 48,696 |
| DCC PLC (United Kingdom) | | 13,000 | 1,060,535 |
| Medtronic PLC | | 25,000 | 2,050,500 |
| Ryanair Holdings PLC sponsored ADR | | 8,582 | 644,422 |
| United Drug PLC (United Kingdom) | | 82,217 | 657,641 |
|
| TOTAL IRELAND | | | 10,820,883 |
|
| Isle of Man - 0.4% | | | |
| Paysafe Group PLC (a) | | 296,633 | 1,572,131 |
| Playtech Ltd. | | 58,566 | 665,235 |
|
| TOTAL ISLE OF MAN | | | 2,237,366 |
|
| Israel - 0.1% | | | |
| Sarine Technologies Ltd. | | 199,200 | 233,384 |
| Teva Pharmaceutical Industries Ltd. sponsored ADR | | 970 | 41,458 |
|
| TOTAL ISRAEL | | | 274,842 |
|
| Italy - 0.1% | | | |
| Prada SpA | | 196,900 | 690,561 |
| Japan - 3.4% | | | |
| Asahi Group Holdings | | 13,300 | 475,716 |
| Astellas Pharma, Inc. | | 43,300 | 642,653 |
| Daikin Industries Ltd. | | 4,400 | 422,924 |
| Daito Trust Construction Co. Ltd. | | 2,900 | 486,006 |
| Dentsu, Inc. | | 5,000 | 249,833 |
| East Japan Railway Co. | | 5,200 | 459,010 |
| Eiken Chemical Co. Ltd. | | 5,800 | 158,730 |
| Fuji Heavy Industries Ltd. | | 14,700 | 573,871 |
| Hoya Corp. | | 10,300 | 430,681 |
| Japan Meat Co. Ltd. | | 18,100 | 254,922 |
| Japan Tobacco, Inc. | | 16,700 | 636,024 |
| Kakaku.com, Inc. | | 26,500 | 446,005 |
| Kaken Pharmaceutical Co. Ltd. | | 3,100 | 195,690 |
| Kao Corp. | | 7,400 | 381,396 |
| Keyence Corp. | | 700 | 514,370 |
| Kubota Corp. | | 24,800 | 400,721 |
| Kyudenko Corp. | | 6,400 | 206,580 |
| Kyushu Railway Co. | | 7,500 | 220,988 |
| Misumi Group, Inc. | | 22,800 | 416,779 |
| Mitsubishi Pencil Co. Ltd. | | 5,800 | 290,913 |
| Mitsui Fudosan Co. Ltd. | | 15,000 | 341,923 |
| Nakanishi, Inc. | | 8,460 | 302,921 |
| Nidec Corp. | | 5,400 | 523,677 |
| Nihon Parkerizing Co. Ltd. | | 25,000 | 345,666 |
| Nintendo Co. Ltd. | | 2,000 | 482,120 |
| Nitori Holdings Co. Ltd. | | 3,700 | 443,492 |
| NTT DOCOMO, Inc. | | 25,300 | 635,384 |
| Olympus Corp. | | 6,500 | 232,431 |
| Open House Co. Ltd. | | 11,700 | 248,013 |
| ORIX Corp. | | 22,800 | 362,100 |
| Panasonic Corp. | | 30,000 | 309,476 |
| PeptiDream, Inc. (a) | | 1,500 | 77,525 |
| Rakuten, Inc. | | 31,900 | 368,826 |
| Seven Bank Ltd. | | 108,200 | 333,256 |
| SHIMANO, Inc. | | 1,500 | 256,889 |
| Shionogi & Co. Ltd. | | 6,600 | 325,878 |
| SK Kaken Co. Ltd. | | 3,300 | 343,940 |
| SMS Co., Ltd. | | 4,300 | 112,390 |
| SoftBank Corp. | | 10,200 | 642,407 |
| Start Today Co. Ltd. | | 22,800 | 400,908 |
| Sundrug Co. Ltd. | | 3,900 | 307,552 |
| Sysmex Corp. | | 4,600 | 319,767 |
| The Suruga Bank Ltd. | | 17,800 | 435,368 |
| Tokyo Century Corp. | | 6,500 | 229,641 |
| Tokyu Fudosan Holdings Corp. | | 40,500 | 229,012 |
| Toshiba Plant Systems & Services Corp. | | 22,400 | 362,048 |
| Tsuruha Holdings, Inc. | | 3,600 | 416,058 |
| Welcia Holdings Co. Ltd. | | 6,000 | 410,222 |
|
| TOTAL JAPAN | | | 17,662,702 |
|
| Korea (South) - 0.0% | | | |
| Samsung Biologics Co. Ltd. (a)(d) | | 819 | 97,384 |
| Luxembourg - 0.0% | | | |
| Samsonite International SA | | 69,600 | 218,971 |
| Malta - 0.2% | | | |
| Kambi Group PLC (a) | | 52,200 | 775,878 |
| Netherlands - 1.1% | | | |
| CSM NV (exchangeable) | | 36,400 | 839,919 |
| Intertrust NV | | 31,900 | 673,050 |
| Koninklijke Philips Electronics NV | | 78,600 | 2,368,388 |
| Koninklijke Wessanen NV | | 48,500 | 579,527 |
| NXP Semiconductors NV (a) | | 3,000 | 300,000 |
| Wolters Kluwer NV | | 19,700 | 762,413 |
|
| TOTAL NETHERLANDS | | | 5,523,297 |
|
| New Zealand - 0.1% | | | |
| Chorus Ltd. | | 43,329 | 113,249 |
| Ryman Healthcare Group Ltd. | | 35,724 | 226,851 |
|
| TOTAL NEW ZEALAND | | | 340,100 |
|
| Norway - 0.3% | | | |
| Schibsted ASA (A Shares) | | 22,800 | 546,658 |
| TGS Nopec Geophysical Co. ASA | | 46,600 | 944,707 |
|
| TOTAL NORWAY | | | 1,491,365 |
|
| Singapore - 0.4% | | | |
| Broadcom Ltd. | | 10,000 | 1,702,800 |
| Sheng Siong Group Ltd. | | 345,900 | 259,813 |
| UOL Group Ltd. | | 52,600 | 214,370 |
|
| TOTAL SINGAPORE | | | 2,176,983 |
|
| South Africa - 0.1% | | | |
| Naspers Ltd. Class N | | 4,000 | 670,407 |
| Spain - 0.2% | | | |
| Amadeus IT Holding SA Class A | | 19,500 | 920,463 |
| Sweden - 1.9% | | | |
| AF AB (B Shares) | | 7,600 | 139,258 |
| Dometic Group AB | | 108,600 | 768,315 |
| Getinge AB (B Shares) | | 110,600 | 1,812,282 |
| Hemfosa Fastigheter AB | | 74,200 | 698,283 |
| Indutrade AB | | 49,500 | 920,163 |
| Investor AB (B Shares) | | 40,254 | 1,431,061 |
| Lundbergfoeretagen AB | | 5,000 | 323,843 |
| Nobia AB | | 35,900 | 312,808 |
| Nordea Bank AB | | 55,400 | 582,390 |
| Pandox AB | | 40,600 | 643,692 |
| Svenska Cellulosa AB (SCA) (B Shares) | | 50,300 | 1,425,106 |
| Svenska Handelsbanken AB (A Shares) | | 37,400 | 509,879 |
|
| TOTAL SWEDEN | | | 9,567,080 |
|
| Switzerland - 1.0% | | | |
| ABB Ltd. (Reg.) | | 53,120 | 1,095,888 |
| Nestle SA (Reg. S) | | 40,876 | 2,964,079 |
| Panalpina Welttransport Holding AG | | 8,530 | 1,107,680 |
|
| TOTAL SWITZERLAND | | | 5,167,647 |
|
| United Kingdom - 2.5% | | | |
| Bunzl PLC | | 25,485 | 685,948 |
| CMC Markets PLC | | 178,354 | 414,343 |
| Dechra Pharmaceuticals PLC | | 53,900 | 887,345 |
| Dialog Semiconductor PLC (a) | | 800 | 31,396 |
| Diploma PLC | | 71,200 | 817,020 |
| Essentra PLC | | 113,000 | 705,391 |
| Imperial Tobacco Group PLC | | 1,269 | 61,439 |
| International Personal Finance PLC | | 273,900 | 987,322 |
| Micro Focus International PLC | | 41,400 | 1,084,922 |
| NCC Group Ltd. | | 327,300 | 759,166 |
| Prudential PLC | | 80,385 | 1,311,792 |
| Saga PLC | | 172,800 | 419,630 |
| Shawbrook Group PLC (a) | | 152,813 | 420,473 |
| Softcat PLC | | 175,500 | 695,991 |
| St. James's Place Capital PLC | | 31,620 | 365,742 |
| Standard Chartered PLC (United Kingdom) | | 172,868 | 1,506,312 |
| William Hill PLC | | 458,149 | 1,658,771 |
|
| TOTAL UNITED KINGDOM | | | 12,813,003 |
|
| United States of America - 30.1% | | | |
| Activision Blizzard, Inc. | | 68,900 | 2,974,413 |
| Acuity Brands, Inc. | | 2,300 | 514,211 |
| Adobe Systems, Inc. (a) | | 96,700 | 10,396,217 |
| Allison Transmission Holdings, Inc. | | 34,300 | 1,004,647 |
| Alphabet, Inc. Class A | | 13,400 | 10,852,660 |
| Amazon.com, Inc. (a) | | 9,100 | 7,187,362 |
| American Tower Corp. | | 52,000 | 6,093,880 |
| Amgen, Inc. | | 10,400 | 1,468,064 |
| Amphenol Corp. Class A | | 20,000 | 1,318,600 |
| Apple, Inc. | | 64,000 | 7,266,560 |
| Arch Coal, Inc. (a) | | 14,000 | 1,027,320 |
| AutoZone, Inc. (a) | | 4,600 | 3,413,936 |
| Ball Corp. | | 30,300 | 2,335,221 |
| Boston Scientific Corp. (a) | | 196,000 | 4,312,000 |
| Caterpillar, Inc. | | 19,000 | 1,585,740 |
| CBOE Holdings, Inc. | | 9,000 | 568,890 |
| Charter Communications, Inc. Class A (a) | | 5,300 | 1,324,417 |
| CME Group, Inc. | | 32,000 | 3,203,200 |
| Constellation Brands, Inc. Class A (sub. vtg.) | | 22,000 | 3,676,640 |
| Dollar Tree, Inc. (a) | | 5,000 | 377,750 |
| Ecolab, Inc. | | 5,000 | 570,850 |
| Electronic Arts, Inc. (a) | | 31,500 | 2,473,380 |
| EOG Resources, Inc. | | 52,000 | 4,701,840 |
| Equifax, Inc. | | 6,300 | 781,011 |
| Estee Lauder Companies, Inc. Class A | | 10,600 | 923,578 |
| Facebook, Inc. Class A (a) | | 34,800 | 4,558,452 |
| Fidelity National Information Services, Inc. | | 6,000 | 443,520 |
| FleetCor Technologies, Inc. (a) | | 1,000 | 175,300 |
| Global Payments, Inc. | | 21,000 | 1,522,920 |
| Illumina, Inc. (a) | | 2,000 | 272,280 |
| Intercept Pharmaceuticals, Inc. (a) | | 12,100 | 1,497,254 |
| Kansas City Southern | | 27,000 | 2,369,520 |
| Legg Mason, Inc. | | 32,000 | 919,040 |
| Liberty Interactive Corp. QVC Group Series A (a) | | 7,000 | 129,430 |
| lululemon athletica, Inc. (a) | | 5,600 | 320,600 |
| MasterCard, Inc. Class A | | 7,800 | 834,756 |
| Microsoft Corp. | | 83,000 | 4,973,360 |
| Molson Coors Brewing Co. Class B | | 36,870 | 3,827,475 |
| Monsanto Co. | | 410 | 41,316 |
| Moody's Corp. | | 5,500 | 552,860 |
| MSCI, Inc. | | 70,500 | 5,653,395 |
| Newell Brands, Inc. | | 49,000 | 2,352,980 |
| Norfolk Southern Corp. | | 13,000 | 1,209,000 |
| Northrop Grumman Corp. | | 14,600 | 3,343,400 |
| NVIDIA Corp. | | 28,200 | 2,006,712 |
| O'Reilly Automotive, Inc. (a) | | 3,200 | 846,208 |
| Parsley Energy, Inc. Class A (a) | | 13,600 | 447,440 |
| PayPal Holdings, Inc. (a) | | 37,000 | 1,541,420 |
| Pioneer Natural Resources Co. | | 9,000 | 1,611,180 |
| Post Holdings, Inc. (a) | | 2,200 | 167,706 |
| Prestige Brands Holdings, Inc. (a) | | 55,500 | 2,513,040 |
| Range Resources Corp. | | 55,000 | 1,858,450 |
| Raytheon Co. | | 4,500 | 614,745 |
| ResMed, Inc. CDI | | 50,046 | 298,469 |
| S&P Global, Inc. | | 79,600 | 9,699,260 |
| Salesforce.com, Inc. (a) | | 6,800 | 511,088 |
| SLM Corp. (a) | | 43,000 | 303,150 |
| SM Energy Co. | | 14,000 | 470,820 |
| Spectrum Brands Holdings, Inc. | | 2,500 | 338,100 |
| SunTrust Banks, Inc. | | 22,000 | 995,060 |
| SVB Financial Group (a) | | 4,000 | 489,080 |
| T-Mobile U.S., Inc. (a) | | 8,000 | 397,840 |
| The NASDAQ OMX Group, Inc. | | 21,000 | 1,343,370 |
| Titan International, Inc. | | 39,000 | 397,410 |
| U.S. Silica Holdings, Inc. | | 4,000 | 184,760 |
| Union Pacific Corp. | | 9,000 | 793,620 |
| UnitedHealth Group, Inc. | | 9,900 | 1,399,167 |
| Visa, Inc. Class A | | 46,000 | 3,795,460 |
| Wells Fargo & Co. | | 64,000 | 2,944,640 |
| Wynn Resorts Ltd. | | 5,300 | 501,115 |
| Xylem, Inc. | | 45,000 | 2,174,850 |
| Zimmer Biomet Holdings, Inc. | | 3,000 | 316,200 |
|
| TOTAL UNITED STATES OF AMERICA | | | 154,309,605 |
|
| TOTAL COMMON STOCKS | | | |
| (Cost $255,542,196) | | | 287,565,793 |
|
| Nonconvertible Preferred Stocks - 0.3% | | | |
| Brazil - 0.3% | | | |
| Petroleo Brasileiro SA - Petrobras sponsored ADR (a) | | | |
| (Cost $1,096,722) | | 116,000 | 1,353,720 |
|
| Investment Companies - 3.6% | | | |
| United States of America - 3.6% | | | |
| iShares Barclays TIPS Bond ETF | | | |
| (Cost $17,930,597) | | 161,200 | 18,676,632 |
| | | Principal Amount(e) | Value |
|
| Nonconvertible Bonds - 10.4% | | | |
| Bailiwick of Guernsey - 0.2% | | | |
| Credit Suisse Group Funding Guernsey Ltd. 2.75% 8/8/25 (Reg. S) | GBP | 1,000,000 | 1,170,953 |
| Bailiwick of Jersey - 0.9% | | | |
| AA Bond Co. Ltd.: | | | |
| 3.781% 7/31/43 (Reg S.) | GBP | 500,000 | 637,952 |
| 4.7201% 7/31/18 (Reg. S) | GBP | 600,000 | 769,785 |
| UBS Group Funding Ltd.: | | | |
| 1.25% 9/1/26 (Reg. S) | EUR | 200,000 | 215,308 |
| 2.65% 2/1/22 (c) | | 3,000,000 | 2,989,227 |
|
| TOTAL BAILIWICK OF JERSEY | | | 4,612,272 |
|
| Belgium - 0.5% | | | |
| KBC Groep NV 2.375% 11/25/24 (Reg. S) (f) | EUR | 2,300,000 | 2,618,294 |
| France - 1.2% | | | |
| BPCE SA 2.75% 11/30/27 (Reg. S) (f) | EUR | 1,300,000 | 1,483,987 |
| CNP Assurances 1.875% 10/20/22 (Reg. S) | EUR | 800,000 | 887,658 |
| EDF SA 1.875% 10/13/36 (Reg. S) | EUR | 1,100,000 | 1,149,955 |
| SCOR SE 3% 6/8/46 (Reg. S) (f) | EUR | 1,200,000 | 1,346,017 |
| Wendel SA 1% 4/20/23 (Reg. S) | EUR | 1,200,000 | 1,311,040 |
|
| TOTAL FRANCE | | | 6,178,657 |
|
| Germany - 0.3% | | | |
| EnBW Energie Baden-Wuerttemberg AG 3.375% 4/5/77 (f) | EUR | 1,125,000 | 1,241,279 |
| Ireland - 0.5% | | | |
| Shire Acquisitions Investments Ireland DAC 2.4% 9/23/21 | | 2,500,000 | 2,481,588 |
| Italy - 0.8% | | | |
| Assicurazioni Generali SpA 7.75% 12/12/42 (f) | EUR | 1,400,000 | 1,813,483 |
| Intesa Sanpaolo SpA 1.125% 3/4/22 | EUR | 2,250,000 | 2,483,162 |
|
| TOTAL ITALY | | | 4,296,645 |
|
| Netherlands - 1.3% | | | |
| ABN AMRO Bank NV 2.875% 6/30/25 (Reg. S) (f) | EUR | 1,550,000 | 1,794,075 |
| EDP Finance BV 1.125% 2/12/24 (Reg. S) | EUR | 800,000 | 856,631 |
| Rabobank Nederland 6.875% 3/19/20 (Reg. S) | EUR | 1,850,000 | 2,393,831 |
| Teva Pharmaceutical Finance Netherlands III BV: | | | |
| 3.15% 10/1/26 | | 750,000 | 729,871 |
| 4.1% 10/1/46 | | 1,000,000 | 929,234 |
|
| TOTAL NETHERLANDS | | | 6,703,642 |
|
| Switzerland - 0.6% | | | |
| Credit Suisse Group AG 5.75% 9/18/25 (Reg. S) (f) | EUR | 1,525,000 | 1,820,901 |
| Zurich Insurance Co. Ltd. 3.5% 10/1/46 (f) | EUR | 1,000,000 | 1,134,850 |
|
| TOTAL SWITZERLAND | | | 2,955,751 |
|
| United Kingdom - 2.5% | | | |
| Barclays PLC 3.2% 8/10/21 | | 2,500,000 | 2,517,200 |
| Direct Line Insurance Group PLC 9.25% 4/27/42 (f) | GBP | 725,000 | 1,076,521 |
| HSBC Holdings PLC 0.875% 9/6/24 (Reg. S) | EUR | 2,150,000 | 2,334,111 |
| National Grid Gas Finance PLC 1.125% 9/22/21 (Reg. S) | GBP | 1,000,000 | 1,207,322 |
| Nationwide Building Society 4.125% 3/20/23 (Reg. S) (f) | EUR | 3,000,000 | 3,423,870 |
| Royal Bank of Scotland Group PLC 2.5% 3/22/23 (Reg. S) | EUR | 2,000,000 | 2,202,984 |
| SKY PLC 2.5% 9/15/26 (Reg. S) | EUR | 100,000 | 119,258 |
|
| TOTAL UNITED KINGDOM | | | 12,881,266 |
|
| United States of America - 1.6% | | | |
| AT&T, Inc. 5.875% 10/1/19 | | 1,500,000 | 1,661,328 |
| Citigroup, Inc. 1.5% 10/26/28 | EUR | 2,000,000 | 2,166,677 |
| Ford Motor Credit Co. LLC 1.897% 8/12/19 | | 1,800,000 | 1,794,182 |
| Goldman Sachs Group, Inc. 3% 2/12/31 (Reg. S) | EUR | 1,390,000 | 1,686,580 |
| Molson Coors Brewing Co. 1.25% 7/15/24 | EUR | 600,000 | 668,267 |
|
| TOTAL UNITED STATES OF AMERICA | | | 7,977,034 |
|
| TOTAL NONCONVERTIBLE BONDS | | | |
| (Cost $54,799,403) | | | 53,117,381 |
|
| Government Obligations - 24.8% | | | |
| Belgium - 0.1% | | | |
| Belgian Kingdom 2.15% 6/22/66 (c) | EUR | 600,000 | 772,952 |
| Canada - 0.6% | | | |
| Canadian Government: | | | |
| 0.75% 3/1/21 | CAD | 600,000 | 449,121 |
| 3.5% 12/1/45 | CAD | 2,600,000 | 2,652,899 |
|
| TOTAL CANADA | | | 3,102,020 |
|
| France - 0.7% | | | |
| French Government: | | | |
| 0.5% 5/25/26 | EUR | 2,000,000 | 2,213,613 |
| 1.75% 5/25/66 (c) | EUR | 1,000,000 | 1,162,386 |
|
| TOTAL FRANCE | | | 3,375,999 |
|
| Germany - 0.5% | | | |
| German Federal Republic: | | | |
| 0% 8/15/26(Reg. S) | EUR | 1,450,000 | 1,566,327 |
| 2.5% 8/15/46 | EUR | 650,000 | 1,035,478 |
|
| TOTAL GERMANY | | | 2,601,805 |
|
| Ireland - 0.5% | | | |
| Irish Republic: | | | |
| 1% 5/15/26(Reg. S) | EUR | 1,200,000 | 1,359,849 |
| 2% 2/18/45 (Reg.S) | EUR | 800,000 | 976,348 |
|
| TOTAL IRELAND | | | 2,336,197 |
|
| Italy - 0.9% | | | |
| Buoni del Tesoro Poliennali: | | | |
| 1.25% 12/1/26 | EUR | 1,050,000 | 1,107,617 |
| 2.7% 3/1/47 (c) | EUR | 800,000 | 874,339 |
| 4.5% 3/1/24 | EUR | 2,150,000 | 2,902,037 |
|
| TOTAL ITALY | | | 4,883,993 |
|
| Japan - 9.0% | | | |
| Japan Government: | | | |
| 0.1% 6/20/26 | JPY | 780,000,000 | 7,556,859 |
| 0.4% 3/20/56 | JPY | 375,000,000 | 3,350,827 |
| 0.9% 6/20/22 | JPY | 619,800,000 | 6,274,359 |
| 1.3% 6/20/20 | JPY | 722,450,000 | 7,269,554 |
| 1.3% 3/20/21 | JPY | 802,750,000 | 8,160,080 |
| 1.7% 9/20/32 | JPY | 1,155,000,000 | 13,641,930 |
|
| TOTAL JAPAN | | | 46,253,609 |
|
| Netherlands - 1.6% | | | |
| Dutch Government 0.5% 7/15/26(Reg. S) (c) | EUR | 7,200,000 | 8,072,720 |
| Spain - 1.0% | | | |
| Spanish Kingdom: | | | |
| 2.75% 10/31/24 (Reg. S) | EUR | 2,350,000 | 2,947,580 |
| 2.9% 10/31/46(Reg. S) (c) | EUR | 1,850,000 | 2,254,518 |
|
| TOTAL SPAIN | | | 5,202,098 |
|
| United Kingdom - 1.0% | | | |
| United Kingdom, Great Britain and Northern Ireland 4.25% 6/7/32 | GBP | 300,000 | 500,661 |
| United Kingdom, Great Britain and Northern Ireland Treasury Indexed-Linked GILT 2.5% 7/22/65 (Reg. S) | GBP | 3,050,000 | 4,709,245 |
|
| TOTAL UNITED KINGDOM | | | 5,209,906 |
|
| United States of America - 8.9% | | | |
| U.S. Treasury Bonds 2.5% 2/15/46 | | 8,450,000 | 8,302,784 |
| U.S. Treasury Notes: | | | |
| 1.25% 3/31/21 | | 21,900,000 | 21,874,334 |
| 1.625% 5/15/26 | | 15,500,000 | 15,231,773 |
|
| TOTAL UNITED STATES OF AMERICA | | | 45,408,891 |
|
| TOTAL GOVERNMENT OBLIGATIONS | | | |
| (Cost $132,152,771) | | | 127,220,190 |
|
| Commercial Paper - 1.4% | | | |
| Germany - 1.4% | | | |
| DZ BANK AG 0.93% 12/15/16 | | | |
| (Cost $6,992,062) | | 7,000,000 | 6,995,450 |
|
| Preferred Securities - 0.2% | | | |
| France - 0.2% | | | |
Total SA 2.708% (Reg. S) (f)(g)
(Cost $1,121,840) | | $1,000,000 | $1,091,848 |
| | | Shares | Value |
|
| Equity Central Funds - 1.9% | | | |
| Fidelity Commodity Strategy Central Fund (h) | | 623,890 | 3,967,940 |
| Fidelity Emerging Markets Equity Central Fund (h) | | 27,616 | 5,590,031 |
| TOTAL EQUITY CENTRAL FUNDS | | | |
| (Cost $8,885,414) | | | 9,557,971 |
|
| Money Market Funds - 1.1% | | | |
| Fidelity Cash Central Fund, 0.41% (i) | | 4,748,264 | 4,749,689 |
| Fidelity Securities Lending Cash Central Fund 0.48% (i)(j) | | 1,029,969 | 1,030,175 |
| TOTAL MONEY MARKET FUNDS | | | |
| (Cost $5,779,445) | | | 5,779,864 |
| TOTAL INVESTMENT PORTFOLIO - 99.9% | | | |
| (Cost $484,300,450) | | | 511,358,849 |
| NET OTHER ASSETS (LIABILITIES) - 0.1% | | | 476,366 |
| NET ASSETS - 100% | | | $511,835,215 |
Currency Abbreviations
CAD – Canadian dollar
EUR – European Monetary Unit
GBP – British pound
JPY – Japanese yen
Security Type Abbreviations
ETF – Exchange-Traded Fund
Categorizations in the Schedule of Investments are based on country or territory of incorporation.
Legend
(a) Non-income producing
(b) Security or a portion of the security is on loan at period end.
(c) Security exempt from registration under Rule 144A of the Securities Act of 1933. These securities may be resold in transactions exempt from registration, normally to qualified institutional buyers. At the end of the period, the value of these securities amounted to $17,157,400 or 3.4% of net assets.
(d) Security or a portion of the security purchased on a delayed delivery or when-issued basis.
(e) Amount is stated in United States dollars unless otherwise noted.
(f) Coupon rates for floating and adjustable rate securities reflect the rates in effect at period end.
(g) Security is perpetual in nature with no stated maturity date.
(h) Affiliated fund that is generally available only to investment companies and other accounts managed by Fidelity Investments. A complete unaudited schedule of portfolio holdings for each Fidelity Central Fund is filed with the SEC for the first and third quarters of each fiscal year on Form N-Q and is available upon request or at the SEC's website at www.sec.gov. An unaudited holdings listing for the Fund, which presents direct holdings as well as the pro-rata share of securities and other investments held indirectly through its investment in underlying non-money market Fidelity Central Funds, other than the Commodity Strategy Central Fund, is available at fidelity.com and/or institutional.fidelity.com, as applicable. In addition, each Fidelity Central Fund's financial statements, which are not covered by the Fund's Report of Independent Registered Public Accounting Firm, are available on the SEC's website or upon request.
(i) Affiliated fund that is generally available only to investment companies and other accounts managed by Fidelity Investments. The rate quoted is the annualized seven-day yield of the fund at period end. A complete unaudited listing of the fund's holdings as of its most recent quarter end is available upon request. In addition, each Fidelity Central Fund's financial statements, which are not covered by the Fund's Report of Independent Registered Public Accounting Firm, are available on the SEC's website or upon request.
(j) Investment made with cash collateral received from securities on loan.
Affiliated Central Funds
Information regarding fiscal year to date income earned by the Fund from investments in Fidelity Central Funds is as follows:
| Fund | Income earned |
| Fidelity Cash Central Fund | $40,454 |
| Fidelity Commodity Strategy Central Fund | 7,487 |
| Fidelity Emerging Markets Equity Central Fund | 41,619 |
| Fidelity Securities Lending Cash Central Fund | 36,161 |
| Total | $125,721 |
Additional information regarding the Fund's fiscal year to date purchases and sales, including the ownership percentage, of the non Money Market Central Funds is as follows:
| Fund | Value, beginning of period | Purchases | Sales Proceeds | Value, end of period | % ownership, end of period |
| Fidelity Commodity Strategy Central Fund | $-- | $5,004,200 | $1,612,819 | $3,967,940 | 0.8% |
| Fidelity Emerging Markets Equity Central Fund | -- | 10,751,442 | 5,500,656 | 5,590,031 | 1.4% |
| Total | $-- | $15,755,642 | $7,113,475 | $9,557,971 | |
Investment Valuation
The following is a summary of the inputs used, as of October 31, 2016, involving the Fund's assets and liabilities carried at fair value. The inputs or methodology used for valuing securities may not be an indication of the risk associated with investing in those securities. For more information on valuation inputs, and their aggregation into the levels used below, please refer to the Investment Valuation section in the accompanying Notes to Financial Statements.
| | Valuation Inputs at Reporting Date: |
| Description | Total | Level 1 | Level 2 | Level 3 |
| Investments in Securities: | | | | |
| Equities: | | | | |
| Consumer Discretionary | $34,464,984 | $29,473,130 | $4,991,854 | $-- |
| Consumer Staples | 18,527,313 | 15,563,234 | 2,964,079 | -- |
| Energy | 19,149,348 | 19,149,348 | -- | -- |
| Financials | 51,079,559 | 48,475,777 | 2,603,782 | -- |
| Health Care | 27,998,284 | 24,636,066 | 3,362,218 | -- |
| Industrials | 38,558,939 | 35,094,663 | 3,464,276 | -- |
| Information Technology | 77,707,451 | 73,712,831 | 3,994,620 | -- |
| Materials | 7,386,678 | 6,859,247 | 527,431 | -- |
| Real Estate | 9,748,370 | 9,748,370 | -- | -- |
| Telecommunication Services | 2,536,700 | 1,258,909 | 1,277,791 | -- |
| Utilities | 1,761,887 | 1,761,887 | -- | -- |
| Investment Companies | 18,676,632 | 18,676,632 | -- | -- |
| Corporate Bonds | 53,117,381 | -- | 53,117,381 | -- |
| Government Obligations | 127,220,190 | -- | 127,220,190 | -- |
| Commercial Paper | 6,995,450 | -- | 6,995,450 | -- |
| Preferred Securities | 1,091,848 | -- | 1,091,848 | -- |
| Equity Central Funds | 9,557,971 | 9,557,971 | -- | -- |
| Money Market Funds | 5,779,864 | 5,779,864 | -- | -- |
| Total Investments in Securities: | $511,358,849 | $299,747,929 | $211,610,920 | $-- |
The following is a summary of transfers between Level 1 and Level 2 for the period ended October 31, 2016. Transfers are assumed to have occurred at the beginning of the period, and are primarily attributable to the valuation techniques used for foreign equity securities, as discussed in the accompanying Notes to Financial Statements:
| Transfers | Total |
| Level 1 to Level 2 | $0 |
| Level 2 to Level 1 | $17,431,563 |
Other Information
The composition of credit quality ratings as a percentage of Total Net Assets (Unaudited) is as follows. The information is based on the combined investments of the Fund and its pro-rata share of the investments of Fidelity's Central Funds, other than the Commodity Strategy and Money Market Central Funds.
| U.S. Government and U.S. Government Agency Obligations | 8.9% |
| AAA,AA,A | 14.2% |
| BBB | 9.8% |
| BB | 0.4% |
| Not Rated | 2.1% |
| Equities | 62.0% |
| Short-Term Investments and Net Other Assets | 2.6% |
| | 100.0% |
We have used ratings from Moody's Investors Service, Inc. Where Moody's® ratings are not available, we have used S&P® ratings. All ratings are as of the date indicated and do not reflect subsequent changes.
See accompanying notes which are an integral part of the financial statements.
Financial Statements
Statement of Assets and Liabilities
| | | October 31, 2016 |
| Assets | | |
Investment in securities, at value (including securities loaned of $968,525) — See accompanying schedule:
Unaffiliated issuers (cost $469,635,592) | $496,021,014 | |
| Fidelity Central Funds (cost $14,664,858) | 15,337,835 | |
| Total Investments (cost $484,300,450) | | $511,358,849 |
| Cash | | 7,061 |
| Foreign currency held at value (cost $8,472) | | 8,472 |
| Receivable for investments sold | | 5,089,410 |
| Receivable for fund shares sold | | 147,009 |
| Dividends receivable | | 419,146 |
| Interest receivable | | 1,001,984 |
| Distributions receivable from Fidelity Central Funds | | 2,597 |
| Prepaid expenses | | 1,305 |
| Other receivables | | 12,040 |
| Total assets | | 518,047,873 |
| Liabilities | | |
| Payable for investments purchased | | |
| Regular delivery | $4,055,225 | |
| Delayed delivery | 98,358 | |
| Payable for fund shares redeemed | 483,291 | |
| Accrued management fee | 304,044 | |
| Distribution and service plan fees payable | 38,684 | |
| Other affiliated payables | 105,750 | |
| Other payables and accrued expenses | 97,131 | |
| Collateral on securities loaned, at value | 1,030,175 | |
| Total liabilities | | 6,212,658 |
| Net Assets | | $511,835,215 |
| Net Assets consist of: | | |
| Paid in capital | | $485,498,449 |
| Undistributed net investment income | | 9,899 |
| Accumulated undistributed net realized gain (loss) on investments and foreign currency transactions | | (699,141) |
| Net unrealized appreciation (depreciation) on investments and assets and liabilities in foreign currencies | | 27,026,008 |
| Net Assets | | $511,835,215 |
| Calculation of Maximum Offering Price | | |
| Class A: | | |
| Net Asset Value and redemption price per share ($41,067,132 ÷ 1,831,139 shares) | | $22.43 |
| Maximum offering price per share (100/94.25 of $22.43) | | $23.80 |
| Class T: | | |
| Net Asset Value and redemption price per share ($15,367,872 ÷ 691,345 shares) | | $22.23 |
| Maximum offering price per share (100/96.50 of $22.23) | | $23.04 |
| Class C: | | |
| Net Asset Value and offering price per share ($27,401,027 ÷ 1,259,031 shares)(a) | | $21.76 |
| Global Balanced: | | |
| Net Asset Value, offering price and redemption price per share ($422,405,536 ÷ 18,596,657 shares) | | $22.71 |
| Class I: | | |
| Net Asset Value, offering price and redemption price per share ($5,593,648÷ 246,997 shares) | | $22.65 |
(a) Redemption price per share is equal to net asset value less any applicable contingent deferred sales charge.
See accompanying notes which are an integral part of the financial statements.
Statement of Operations
| | | Year ended October 31, 2016 |
| Investment Income | | |
| Dividends | | $5,255,018 |
| Interest | | 3,134,696 |
| Income from Fidelity Central Funds | | 125,721 |
| Income before foreign taxes withheld | | 8,515,435 |
| Less foreign taxes withheld | | (256,006) |
| Total income | | 8,259,429 |
| Expenses | | |
| Management fee | $3,684,179 | |
| Transfer agent fees | 1,007,508 | |
| Distribution and service plan fees | 472,648 | |
| Accounting and security lending fees | 270,674 | |
| Custodian fees and expenses | 171,207 | |
| Independent trustees' fees and expenses | 2,368 | |
| Registration fees | 86,077 | |
| Audit | 146,912 | |
| Legal | 6,932 | |
| Interest | 523 | |
| Miscellaneous | 4,457 | |
| Total expenses before reductions | 5,853,485 | |
| Expense reductions | (32,021) | 5,821,464 |
| Net investment income (loss) | | 2,437,965 |
| Realized and Unrealized Gain (Loss) | | |
| Net realized gain (loss) on: | | |
| Investment securities: | | |
| Unaffiliated issuers | 287,571 | |
| Fidelity Central Funds | 243,444 | |
| Foreign currency transactions | 24,587 | |
| Total net realized gain (loss) | | 555,602 |
Change in net unrealized appreciation (depreciation) on:
Investment securities | 9,887,345 | |
| Assets and liabilities in foreign currencies | (39,989) | |
| Total change in net unrealized appreciation (depreciation) | | 9,847,356 |
| Net gain (loss) | | 10,402,958 |
| Net increase (decrease) in net assets resulting from operations | | $12,840,923 |
See accompanying notes which are an integral part of the financial statements.
Statement of Changes in Net Assets
| | Year ended October 31, 2016 | Year ended October 31, 2015 |
| Increase (Decrease) in Net Assets | | |
| Operations | | |
| Net investment income (loss) | $2,437,965 | $3,617,582 |
| Net realized gain (loss) | 555,602 | 6,654,630 |
| Change in net unrealized appreciation (depreciation) | 9,847,356 | (17,997,479) |
| Net increase (decrease) in net assets resulting from operations | 12,840,923 | (7,725,267) |
| Distributions to shareholders from net investment income | – | (1,672,129) |
| Distributions to shareholders from net realized gain | (15,584,739) | (43,816,065) |
| Total distributions | (15,584,739) | (45,488,194) |
| Share transactions - net increase (decrease) | (38,129,692) | (52,070,060) |
| Redemption fees | 6,276 | 9,666 |
| Total increase (decrease) in net assets | (40,867,232) | (105,273,855) |
| Net Assets | | |
| Beginning of period | 552,702,447 | 657,976,302 |
| End of period | $511,835,215 | $552,702,447 |
| Other Information | | |
| Undistributed net investment income end of period | $9,899 | $– |
| Distributions in excess of net investment income end of period | $– | $(5,875,367) |
See accompanying notes which are an integral part of the financial statements.
Financial Highlights — Fidelity Global Balanced Fund Class A
| Years ended October 31, | 2016 | 2015 | 2014 | 2013 | 2012 |
| Selected Per–Share Data | | | | | |
| Net asset value, beginning of period | $22.58 | $24.65 | $26.18 | $23.45 | $22.05 |
| Income from Investment Operations | | | | | |
| Net investment income (loss)A | .06 | .09 | .15 | .13 | .27 |
| Net realized and unrealized gain (loss) | .44 | (.45) | .49 | 3.13 | 1.41 |
| Total from investment operations | .50 | (.36) | .64 | 3.26 | 1.68 |
| Distributions from net investment income | – | (.01) | (.10) | (.24) | (.19) |
| Distributions from net realized gain | (.65) | (1.70) | (2.07) | (.29) | (.09) |
| Total distributions | (.65) | (1.71) | (2.17) | (.53) | (.28) |
| Redemption fees added to paid in capitalA,B | – | – | – | – | – |
| Net asset value, end of period | $22.43 | $22.58 | $24.65 | $26.18 | $23.45 |
| Total ReturnC,D | 2.35% | (1.48)% | 2.69% | 14.19% | 7.74% |
| Ratios to Average Net AssetsE,F | | | | | |
| Expenses before reductions | 1.30% | 1.29% | 1.28% | 1.31% | 1.33% |
| Expenses net of fee waivers, if any | 1.30% | 1.29% | 1.28% | 1.31% | 1.33% |
| Expenses net of all reductions | 1.29% | 1.27% | 1.27% | 1.29% | 1.32% |
| Net investment income (loss) | .27% | .41% | .58% | .55% | 1.18% |
| Supplemental Data | | | | | |
| Net assets, end of period (000 omitted) | $41,067 | $42,165 | $47,048 | $38,972 | $26,714 |
| Portfolio turnover rateG | 155% | 140% | 157% | 181% | 157% |
A Calculated based on average shares outstanding during the period.
B Amount represents less than $.005 per share.
C Total returns would have been lower if certain expenses had not been reduced during the applicable periods shown.
D Total returns do not include the effect of the sales charges.
E Fees and expenses of any underlying Fidelity Central Funds are not included in the Fund's expense ratio. The Fund indirectly bears its proportionate share of the expenses of any underlying Fidelity Central Funds. Based on their most recent shareholder report date, the expenses of any underlying non-money market Fidelity Central Funds ranged from .06% to .09%.
F Expense ratios reflect operating expenses of the class. Expenses before reductions do not reflect amounts reimbursed by the investment adviser or reductions from brokerage service arrangements or reductions from other expense offset arrangements and do not represent the amount paid by the class during periods when reimbursements or reductions occur. Expenses net of fee waivers reflect expenses after reimbursement by the investment adviser but prior to reductions from brokerage service arrangements or other expense offset arrangements. Expenses net of all reductions represent the net expenses paid by the class.
G Amount does not include the portfolio activity of any underlying Fidelity Central Funds.
See accompanying notes which are an integral part of the financial statements.
Financial Highlights — Fidelity Global Balanced Fund Class T
| Years ended October 31, | 2016 | 2015 | 2014 | 2013 | 2012 |
| Selected Per–Share Data | | | | | |
| Net asset value, beginning of period | $22.44 | $24.52 | $26.04 | $23.32 | $21.96 |
| Income from Investment Operations | | | | | |
| Net investment income (loss)A | –B | .03 | .08 | .07 | .21 |
| Net realized and unrealized gain (loss) | .44 | (.46) | .49 | 3.12 | 1.41 |
| Total from investment operations | .44 | (.43) | .57 | 3.19 | 1.62 |
| Distributions from net investment income | – | – | (.02) | (.18) | (.17) |
| Distributions from net realized gain | (.65) | (1.65) | (2.07) | (.29) | (.09) |
| Total distributions | (.65) | (1.65) | (2.09) | (.47) | (.26) |
| Redemption fees added to paid in capitalA,B | – | – | – | – | – |
| Net asset value, end of period | $22.23 | $22.44 | $24.52 | $26.04 | $23.32 |
| Total ReturnC,D | 2.08% | (1.80)% | 2.40% | 13.94% | 7.46% |
| Ratios to Average Net AssetsE,F | | | | | |
| Expenses before reductions | 1.58% | 1.56% | 1.55% | 1.57% | 1.58% |
| Expenses net of fee waivers, if any | 1.58% | 1.56% | 1.55% | 1.57% | 1.58% |
| Expenses net of all reductions | 1.57% | 1.55% | 1.55% | 1.55% | 1.57% |
| Net investment income (loss) | (.01)% | .14% | .31% | .28% | .94% |
| Supplemental Data | | | | | |
| Net assets, end of period (000 omitted) | $15,368 | $16,867 | $17,662 | $14,650 | $13,654 |
| Portfolio turnover rateG | 155% | 140% | 157% | 181% | 157% |
A Calculated based on average shares outstanding during the period.
B Amount represents less than $.005 per share.
C Total returns would have been lower if certain expenses had not been reduced during the applicable periods shown.
D Total returns do not include the effect of the sales charges.
E Fees and expenses of any underlying Fidelity Central Funds are not included in the Fund's expense ratio. The Fund indirectly bears its proportionate share of the expenses of any underlying Fidelity Central Funds. Based on their most recent shareholder report date, the expenses of any underlying non-money market Fidelity Central Funds ranged from .06% to .09%.
F Expense ratios reflect operating expenses of the class. Expenses before reductions do not reflect amounts reimbursed by the investment adviser or reductions from brokerage service arrangements or reductions from other expense offset arrangements and do not represent the amount paid by the class during periods when reimbursements or reductions occur. Expenses net of fee waivers reflect expenses after reimbursement by the investment adviser but prior to reductions from brokerage service arrangements or other expense offset arrangements. Expenses net of all reductions represent the net expenses paid by the class.
G Amount does not include the portfolio activity of any underlying Fidelity Central Funds.
See accompanying notes which are an integral part of the financial statements.
See accompanying notes which are an integral part of the financial statements.
Financial Highlights — Fidelity Global Balanced Fund Class C
| Years ended October 31, | 2016 | 2015 | 2014 | 2013 | 2012 |
| Selected Per–Share Data | | | | | |
| Net asset value, beginning of period | $22.10 | $24.17 | $25.76 | $23.09 | $21.73 |
| Income from Investment Operations | | | | | |
| Net investment income (loss)A | (.12) | (.09) | (.05) | (.06) | .09 |
| Net realized and unrealized gain (loss) | .43 | (.46) | .49 | 3.08 | 1.41 |
| Total from investment operations | .31 | (.55) | .44 | 3.02 | 1.50 |
| Distributions from net investment income | – | – | – | (.06) | (.05) |
| Distributions from net realized gain | (.65) | (1.52) | (2.03) | (.29) | (.09) |
| Total distributions | (.65) | (1.52) | (2.03) | (.35) | (.14) |
| Redemption fees added to paid in capitalA,B | – | – | – | – | – |
| Net asset value, end of period | $21.76 | $22.10 | $24.17 | $25.76 | $23.09 |
| Total ReturnC,D | 1.51% | (2.33)% | 1.89% | 13.27% | 6.94% |
| Ratios to Average Net AssetsE,F | | | | | |
| Expenses before reductions | 2.11% | 2.10% | 2.08% | 2.12% | 2.13% |
| Expenses net of fee waivers, if any | 2.11% | 2.09% | 2.08% | 2.12% | 2.13% |
| Expenses net of all reductions | 2.10% | 2.08% | 2.07% | 2.10% | 2.12% |
| Net investment income (loss) | (.54)% | (.40)% | (.22)% | (.26)% | .39% |
| Supplemental Data | | | | | |
| Net assets, end of period (000 omitted) | $27,401 | $28,505 | $29,809 | $20,997 | $13,797 |
| Portfolio turnover rateG | 155% | 140% | 157% | 181% | 157% |
A Calculated based on average shares outstanding during the period.
B Amount represents less than $.005 per share.
C Total returns would have been lower if certain expenses had not been reduced during the applicable periods shown.
D Total returns do not include the effect of the contingent deferred sales charge.
E Fees and expenses of any underlying Fidelity Central Funds are not included in the Fund's expense ratio. The Fund indirectly bears its proportionate share of the expenses of any underlying Fidelity Central Funds. Based on their most recent shareholder report date, the expenses of any underlying non-money market Fidelity Central Funds ranged from .06% to .09%.
F Expense ratios reflect operating expenses of the class. Expenses before reductions do not reflect amounts reimbursed by the investment adviser or reductions from brokerage service arrangements or reductions from other expense offset arrangements and do not represent the amount paid by the class during periods when reimbursements or reductions occur. Expenses net of fee waivers reflect expenses after reimbursement by the investment adviser but prior to reductions from brokerage service arrangements or other expense offset arrangements. Expenses net of all reductions represent the net expenses paid by the class.
G Amount does not include the portfolio activity of any underlying Fidelity Central Funds.
See accompanying notes which are an integral part of the financial statements.
Financial Highlights — Fidelity Global Balanced Fund
| Years ended October 31, | 2016 | 2015 | 2014 | 2013 | 2012 |
| Selected Per–Share Data | | | | | |
| Net asset value, beginning of period | $22.79 | $24.87 | $26.38 | $23.62 | $22.18 |
| Income from Investment Operations | | | | | |
| Net investment income (loss)A | .13 | .16 | .22 | .21 | .33 |
| Net realized and unrealized gain (loss) | .44 | (.47) | .50 | 3.14 | 1.44 |
| Total from investment operations | .57 | (.31) | .72 | 3.35 | 1.77 |
| Distributions from net investment income | – | (.08) | (.16) | (.30) | (.24) |
| Distributions from net realized gain | (.65) | (1.70) | (2.07) | (.29) | (.09) |
| Total distributions | (.65) | (1.77)B | (2.23) | (.59) | (.33) |
| Redemption fees added to paid in capitalA,C | – | – | – | – | – |
| Net asset value, end of period | $22.71 | $22.79 | $24.87 | $26.38 | $23.62 |
| Total ReturnD | 2.64% | (1.24)% | 3.00% | 14.52% | 8.11% |
| Ratios to Average Net AssetsE,F | | | | | |
| Expenses before reductions | 1.01% | 1.00% | .99% | 1.02% | 1.03% |
| Expenses net of fee waivers, if any | 1.01% | 1.00% | .99% | 1.02% | 1.03% |
| Expenses net of all reductions | 1.00% | .99% | .99% | 1.00% | 1.02% |
| Net investment income (loss) | .56% | .70% | .87% | .84% | 1.48% |
| Supplemental Data | | | | | |
| Net assets, end of period (000 omitted) | $422,406 | $457,766 | $554,896 | $540,412 | $468,758 |
| Portfolio turnover rateG | 155% | 140% | 157% | 181% | 157% |
A Calculated based on average shares outstanding during the period.
B Total distributions of $1.77 per share is comprised of distributions from net investment income of $.075 and distributions from net realized gain of $1.697 per share.
C Amount represents less than $.005 per share.
D Total returns would have been lower if certain expenses had not been reduced during the applicable periods shown.
E Fees and expenses of any underlying Fidelity Central Funds are not included in the Fund's expense ratio. The Fund indirectly bears its proportionate share of the expenses of any underlying Fidelity Central Funds. Based on their most recent shareholder report date, the expenses of any underlying non-money market Fidelity Central Funds ranged from .06% to .09%.
F Expense ratios reflect operating expenses of the class. Expenses before reductions do not reflect amounts reimbursed by the investment adviser or reductions from brokerage service arrangements or reductions from other expense offset arrangements and do not represent the amount paid by the class during periods when reimbursements or reductions occur. Expenses net of fee waivers reflect expenses after reimbursement by the investment adviser but prior to reductions from brokerage service arrangements or other expense offset arrangements. Expenses net of all reductions represent the net expenses paid by the class.
G Amount does not include the portfolio activity of any underlying Fidelity Central Funds.
See accompanying notes which are an integral part of the financial statements.
Financial Highlights — Fidelity Global Balanced Fund Class I
| Years ended October 31, | 2016 | 2015 | 2014 | 2013 | 2012 |
| Selected Per–Share Data | | | | | |
| Net asset value, beginning of period | $22.72 | $24.80 | $26.33 | $23.58 | $22.16 |
| Income from Investment Operations | | | | | |
| Net investment income (loss)A | .13 | .16 | .21 | .20 | .33 |
| Net realized and unrealized gain (loss) | .45 | (.47) | .49 | 3.14 | 1.43 |
| Total from investment operations | .58 | (.31) | .70 | 3.34 | 1.76 |
| Distributions from net investment income | – | (.07) | (.17) | (.30) | (.25) |
| Distributions from net realized gain | (.65) | (1.70) | (2.07) | (.29) | (.09) |
| Total distributions | (.65) | (1.77) | (2.23)B | (.59) | (.34) |
| Redemption fees added to paid in capitalA,C | – | – | – | – | – |
| Net asset value, end of period | $22.65 | $22.72 | $24.80 | $26.33 | $23.58 |
| Total ReturnD | 2.69% | (1.25)% | 2.95% | 14.50% | 8.10% |
| Ratios to Average Net AssetsE,F | | | | | |
| Expenses before reductions | 1.00% | 1.01% | 1.02% | 1.03% | 1.04% |
| Expenses net of fee waivers, if any | 1.00% | 1.01% | 1.02% | 1.03% | 1.04% |
| Expenses net of all reductions | .99% | 1.00% | 1.02% | 1.01% | 1.03% |
| Net investment income (loss) | .57% | .68% | .84% | .83% | 1.48% |
| Supplemental Data | | | | | |
| Net assets, end of period (000 omitted) | $5,594 | $6,048 | $6,537 | $3,183 | $1,966 |
| Portfolio turnover rateG | 155% | 140% | 157% | 181% | 157% |
A Calculated based on average shares outstanding during the period.
B Total distributions of $2.23 per share is comprised of distributions from net investment income of $.167 and distributions from net realized gain of $2.065 per share.
C Amount represents less than $.005 per share.
D Total returns would have been lower if certain expenses had not been reduced during the applicable periods shown.
E Fees and expenses of any underlying Fidelity Central Funds are not included in the Fund's expense ratio. The Fund indirectly bears its proportionate share of the expenses of any underlying Fidelity Central Funds. Based on their most recent shareholder report date, the expenses of any underlying non-money market Fidelity Central Funds ranged from .06% to .09%.
F Expense ratios reflect operating expenses of the class. Expenses before reductions do not reflect amounts reimbursed by the investment adviser or reductions from brokerage service arrangements or reductions from other expense offset arrangements and do not represent the amount paid by the class during periods when reimbursements or reductions occur. Expenses net of fee waivers reflect expenses after reimbursement by the investment adviser but prior to reductions from brokerage service arrangements or other expense offset arrangements. Expenses net of all reductions represent the net expenses paid by the class.
G Amount does not include the portfolio activity of any underlying Fidelity Central Funds.
See accompanying notes which are an integral part of the financial statements.
Notes to Financial Statements
For the period ended October 31, 2016
1. Organization.
Fidelity Global Balanced Fund (the Fund) is a fund of Fidelity Charles Street Trust (the Trust) and is authorized to issue an unlimited number of shares. The Trust is registered under the Investment Company Act of 1940, as amended (the 1940 Act), as an open-end management investment company organized as a Massachusetts business trust. The Fund offers Class A, Class T, Class C, Global Balanced and Class I shares, each of which has equal rights as to assets and voting privileges. Each class has exclusive voting rights with respect to matters that affect that class.
After the close of business on June 24, 2016, all outstanding Class B shares were converted to Class A shares. All current fiscal period dollar and share amounts for Class B presented in the Notes to Financial Statements are for the period November 1, 2015 through June 24, 2016.
2. Investments in Fidelity Central Funds.
The Fund invests in Fidelity Central Funds, which are open-end investment companies generally available only to other investment companies and accounts managed by the investment adviser and its affiliates. The Fund's Schedule of Investments lists each of the Fidelity Central Funds held as of period end, if any, as an investment of the Fund, but does not include the underlying holdings of each Fidelity Central Fund. As an Investing Fund, the Fund indirectly bears its proportionate share of the expenses of the underlying Fidelity Central Funds.
Based on its investment objective, each Fidelity Central Fund may invest or participate in various investment vehicles or strategies that are similar to those of the Fund. These strategies are consistent with the investment objectives of the Fund and may involve certain economic risks which may cause a decline in value of each of the Fidelity Central Funds and thus a decline in the value of the Fund. The Money Market Central Funds seek preservation of capital and current income and are managed by Fidelity Investments Money Management, Inc. (FIMM), an affiliate of the investment adviser. Annualized expenses of the Money Market Central Funds as of their most recent shareholder report date are less than .005%. The following summarizes the Fund's investment in each non-money market Fidelity Central Fund.
| Fidelity Central Fund | Investment Manager | Investment Objective | Investment Practices | Expense Ratio(a) |
| Fidelity Commodity Strategy Central Fund | Geode Capital Management, LLC (Geode) | Seeks to provide investment returns that correspond to the performance of the commodities market. | Investment in commodity-related investments through a wholly-owned subsidiary organized under the laws of the Cayman Islands
Futures
| .06% |
| Fidelity Emerging Markets Equity Central Fund | FMR Co., Inc. (FMRC) | Seeks capital appreciation by investing primarily in equity securities of issuers in emerging markets. | Foreign Securities
Futures | .09% |
(a) Expenses expressed as a percentage of average net assets and are as of each underlying Central Fund's most recent annual or semi-annual shareholder report.
An unaudited holdings listing for the Fund, which presents direct holdings as well as the pro-rata share of any securities and other investments held indirectly through its investment in underlying non-money market Fidelity Central Funds, is available at fidelity.com and/or institutional.fidelity.com, as applicable. A complete unaudited list of holdings for each Fidelity Central Fund is available upon request or at the Securities and Exchange Commission (the SEC) website at www.sec.gov. In addition, the financial statements of the Fidelity Central Funds which contain the significant accounting policies (including investment valuation policies) of those funds, which are not covered by the Fund's Report of Independent Registered Public Accounting Firm, are available on the SEC website or upon request.
3. Significant Accounting Policies.
The financial statements have been prepared in conformity with accounting principles generally accepted in the United States of America (GAAP), which require management to make certain estimates and assumptions at the date of the financial statements. Actual results could differ from those estimates. Subsequent events, if any, through the date that the financial statements were issued have been evaluated in the preparation of the financial statements. The following summarizes the significant accounting policies of the Fund:
Investment Valuation. Investments are valued as of 4:00 p.m. Eastern time on the last calendar day of the period. The Board of Trustees (the Board) has delegated the day to day responsibility for the valuation of the Fund's investments to the Fair Value Committee (the Committee) established by the Fund's investment adviser. In accordance with valuation policies and procedures approved by the Board, the Fund attempts to obtain prices from one or more third party pricing vendors or brokers to value its investments. When current market prices, quotations or currency exchange rates are not readily available or reliable, investments will be fair valued in good faith by the Committee, in accordance with procedures adopted by the Board. Factors used in determining fair value vary by investment type and may include market or investment specific events, changes in interest rates and credit quality. The frequency with which these procedures are used cannot be predicted and they may be utilized to a significant extent. The Committee oversees the Fund's valuation policies and procedures and reports to the Board on the Committee's activities and fair value determinations. The Board monitors the appropriateness of the procedures used in valuing the Fund's investments and ratifies the fair value determinations of the Committee.
The Fund categorizes the inputs to valuation techniques used to value its investments into a disclosure hierarchy consisting of three levels as shown below:
- Level 1 – quoted prices in active markets for identical investments
- Level 2 – other significant observable inputs (including quoted prices for similar investments, interest rates, prepayment speeds, etc.)
- Level 3 – unobservable inputs (including the Fund's own assumptions based on the best information available)
Valuation techniques used to value the Fund's investments by major category are as follows:
Equity securities, including restricted securities, for which market quotations are readily available, are valued at the last reported sale price or official closing price as reported by a third party pricing vendor on the primary market or exchange on which they are traded and are categorized as Level 1 in the hierarchy. In the event there were no sales during the day or closing prices are not available, securities are valued at the last quoted bid price or may be valued using the last available price and are generally categorized as Level 2 in the hierarchy. For foreign equity securities, when market or security specific events arise, comparisons to the valuation of American Depositary Receipts (ADRs), futures contracts, Exchange-Traded Funds (ETFs) and certain indexes as well as quoted prices for similar securities may be used and would be categorized as Level 2 in the hierarchy. Utilizing these techniques may result in transfers between Level 1 and Level 2. For equity securities, including restricted securities, where observable inputs are limited, assumptions about market activity and risk are used and these securities may be categorized as Level 3 in the hierarchy.
Debt securities, including restricted securities, are valued based on evaluated prices received from third party pricing vendors or from brokers who make markets in such securities. Corporate bonds, foreign government and government agency obligations, preferred securities, U.S. government and government agency obligations and commercial paper are valued by pricing vendors who utilize matrix pricing which considers yield or price of bonds of comparable quality, coupon, maturity and type or by broker-supplied prices. When independent prices are unavailable or unreliable, debt securities may be valued utilizing pricing methodologies which consider similar factors that would be used by third party pricing vendors. Debt securities are generally categorized as Level 2 in the hierarchy but may be Level 3 depending on the circumstances. ETFs are valued at their last sale price or official closing price as reported by a third party pricing vendor on the primary market or exchange on which they are traded and are categorized as Level 1 in the hierarchy. In the event there were no sales during the day but the exchange reports a closing bid level, ETFs are valued at the closing bid and would be categorized as Level 1 in the hierarchy. In the event there was no closing bid, ETFs may be valued by another method that the Board believes reflects fair value in accordance with the Board's fair value pricing policies and may be categorized as Level 2 in the hierarchy.
Investments in open-end mutual funds, including the Fidelity Central Funds, are valued at their closing net asset value (NAV) each business day and are categorized as Level 1 in the hierarchy.
Changes in valuation techniques may result in transfers in or out of an assigned level within the disclosure hierarchy. The aggregate value of investments by input level as of October 31, 2016, including information on transfers between Levels 1 and 2, is included at the end of the Fund's Schedule of Investments.
Foreign Currency. The Fund may use foreign currency contracts to facilitate transactions in foreign-denominated securities. Gains and losses from these transactions may arise from changes in the value of the foreign currency or if the counterparties do not perform under the contracts' terms.
Foreign-denominated assets, including investment securities, and liabilities are translated into U.S. dollars at the exchange rates at period end. Purchases and sales of investment securities, income and dividends received and expenses denominated in foreign currencies are translated into U.S. dollars at the exchange rate in effect on the transaction date.
The effects of exchange rate fluctuations on investments are included with the net realized and unrealized gain (loss) on investment securities. Other foreign currency transactions resulting in realized and unrealized gain (loss) are disclosed separately.
Investment Transactions and Income. For financial reporting purposes, the Fund's investment holdings and NAV include trades executed through the end of the last business day of the period. The NAV per share for processing shareholder transactions is calculated as of the close of business of the New York Stock Exchange (NYSE), normally 4:00 p.m. Eastern time and includes trades executed through the end of the prior business day. Gains and losses on securities sold are determined on the basis of identified cost and may include proceeds received from litigation. Dividend income is recorded on the ex-dividend date, except for certain dividends from foreign securities where the ex-dividend date may have passed, which are recorded as soon as the Fund is informed of the ex-dividend date. Non-cash dividends included in dividend income, if any, are recorded at the fair market value of the securities received. Income and capital gain distributions from Fidelity Central Funds, if any, are recorded on the ex-dividend date. Distributions received on securities that represent a return of capital or capital gain are recorded as a reduction of cost of investments and/or as a realized gain. Subsequent to ex-dividend date the Fund determines the components of these distributions, based upon receipt of tax filings or other correspondence relating to the underlying investment. Interest income is accrued as earned and includes coupon interest and amortization of premium and accretion of discount on debt securities as applicable. The principal amount on inflation-indexed securities is periodically adjusted to the rate of inflation and interest is accrued based on the principal amount. The adjustments to principal due to inflation are reflected as increases or decreases to Interest in the accompanying Statement of Operations. Investment income is recorded net of foreign taxes withheld where recovery of such taxes is uncertain. Debt obligations may be placed on non-accrual status and related interest income may be reduced by ceasing current accruals and writing off interest receivables when the collection of all or a portion of interest has become doubtful based on consistently applied procedures. A debt obligation is removed from non-accrual status when the issuer resumes interest payments or when collectability of interest is reasonably assured.
Class Allocations and Expenses. Investment income, realized and unrealized capital gains and losses, common expenses of the Fund, and certain fund-level expense reductions, if any, are allocated daily on a pro-rata basis to each class based on the relative net assets of each class to the total net assets of the Fund. Each class differs with respect to transfer agent and distribution and service plan fees incurred. Certain expense reductions may also differ by class. For the reporting period, the allocated portion of income and expenses to each class as a percent of its average net assets may vary due to the timing of recording these transactions in relation to fluctuating net assets of the classes. Expenses directly attributable to a fund are charged to that fund. Expenses attributable to more than one fund are allocated among the respective funds on the basis of relative net assets or other appropriate methods. Expense estimates are accrued in the period to which they relate and adjustments are made when actual amounts are known.
Income Tax Information and Distributions to Shareholders. Each year, the Fund intends to qualify as a regulated investment company under Subchapter M of the Internal Revenue Code, including distributing substantially all of its taxable income and realized gains. As a result, no provision for U.S. Federal income taxes is required. As of October 31, 2016, the Fund did not have any unrecognized tax benefits in the financial statements; nor is the Fund aware of any tax positions for which it is reasonably possible that the total amounts of unrecognized tax benefits will significantly change in the next twelve months. The Fund files a U.S. federal tax return, in addition to state and local tax returns as required. The Fund's federal income tax returns are subject to examination by the Internal Revenue Service (IRS) for a period of three fiscal years after they are filed. State and local tax returns may be subject to examination for an additional fiscal year depending on the jurisdiction. Foreign taxes are provided for based on the Fund's understanding of the tax rules and rates that exist in the foreign markets in which it invests.
Distributions are declared and recorded on the ex-dividend date. Income dividends and capital gain distributions are declared separately for each class. Income and capital gain distributions are determined in accordance with income tax regulations, which may differ from GAAP.
Capital accounts within the financial statements are adjusted for permanent book-tax differences. These adjustments have no impact on net assets or the results of operations. Capital accounts are not adjusted for temporary book-tax differences which will reverse in a subsequent period.
Book-tax differences are primarily due to foreign currency transactions, passive foreign investment companies (PFIC), market discount, partnerships (including allocations from fidelity Central Funds), deferred trustees compensation, net operating losses, losses deferred due to wash sales and excise tax regulations.
The federal tax cost of investment securities and unrealized appreciation (depreciation) as of period end were as follows:
| Gross unrealized appreciation | $43,081,022 |
| Gross unrealized depreciation | (18,487,383) |
| Net unrealized appreciation (depreciation) on securities | $24,593,639 |
| Tax Cost | $486,765,210 |
The tax-based components of distributable earnings as of period end were as follows:
| Undistributed long-term capital gain | $1,775,693 |
| Net unrealized appreciation (depreciation) on securities and other investments | $24,561,263 |
The tax character of distributions paid was as follows:
| | October 31, 2016 | October 31, 2015 |
| Ordinary Income | $– | $ 13,870,965 |
| Long-term Capital Gains | 15,584,739 | 31,617,229 |
| Total | $15,584,739 | $ 45,488,194 |
Short-Term Trading (Redemption) Fees. Shares held by investors in the Fund less than 30 days may have been subject to a redemption fee equal to 1.00% of the NAV of shares redeemed. All redemption fees, which reduce the proceeds of the shareholder redemption, are retained by the Fund and accounted for as an addition to paid in capital. In November 2016, the Board of Trustees approved the elimination of these redemption fees effective December 12, 2016.
Delayed Delivery Transactions and When-Issued Securities. During the period, the Fund transacted in securities on a delayed delivery or when-issued basis. Payment and delivery may take place after the customary settlement period for that security. The price of the underlying securities and the date when the securities will be delivered and paid for are fixed at the time the transaction is negotiated. The securities purchased on a delayed delivery or when-issued basis are identified as such in the Fund's Schedule of Investments. The Fund may receive compensation for interest forgone in the purchase of a delayed delivery or when-issued security. With respect to purchase commitments, the Fund identifies securities as segregated in its records with a value at least equal to the amount of the commitment. Losses may arise due to changes in the value of the underlying securities or if the counterparty does not perform under the contract's terms, or if the issuer does not issue the securities due to political, economic, or other factors.
Restricted Securities. The Fund may invest in securities that are subject to legal or contractual restrictions on resale. These securities generally may be resold in transactions exempt from registration or to the public if the securities are registered. Disposal of these securities may involve time-consuming negotiations and expense, and prompt sale at an acceptable price may be difficult. Information regarding restricted securities is included at the end of the Fund's Schedule of Investments.
4. Purchases and Sales of Investments.
Purchases and sales of securities (including the Equity Central Funds), other than short-term securities and U.S. government securities, aggregated $689,726,507 and $732,680,289, respectively.
5. Fees and Other Transactions with Affiliates.
Management Fee. Fidelity Management & Research Company (the investment adviser) and its affiliates provide the Fund with investment management related services for which the Fund pays a monthly management fee. The management fee is the sum of an individual fund fee rate that is based on an annual rate of .45% of the Fund's average net assets and an annualized group fee rate that averaged .25% during the period. The group fee rate is based upon the average net assets of all the mutual funds advised by the investment adviser, including any mutual funds previously advised by the investment adviser that are currently advised by Fidelity SelectCo, LLC, an affiliate of the investment adviser. The group fee rate decreases as assets under management increase and increases as assets under management decrease. For the reporting period, the total annual management fee rate was .70% of the Fund's average net assets.
Distribution and Service Plan Fees. In accordance with Rule 12b-1 of the 1940 Act, the Fund has adopted separate Distribution and Service Plans for each class of shares. Certain classes pay Fidelity Distributors Corporation (FDC), an affiliate of the investment adviser, separate Distribution and Service Fees, each of which is based on an annual percentage of each class' average net assets. In addition, FDC may pay financial intermediaries for selling shares of the Fund and providing shareholder support services. For the period, the Distribution and Service Fee rates, total fees and amounts retained by FDC were as follows:
| | Distribution
Fee | Service
Fee | Total Fees | Retained
by FDC |
| Class A | -% | .25% | $105,050 | $2,963 |
| Class T | .25% | .25% | 79,460 | 619 |
| Class B | .75% | .25% | 7,561 | 5,686 |
| Class C | .75% | .25% | 280,577 | 41,543 |
| | | | $472,648 | $50,811 |
Sales Load. FDC may receive a front-end sales charge of up to 5.75% for selling Class A shares and 3.50% for selling Class T shares, some of which is paid to financial intermediaries for selling shares of the Fund. Depending on the holding period, FDC may receive contingent deferred sales charges levied on Class A, Class T, Class B, and Class C redemptions. The deferred sales charges range from 5.00% to 1.00% for Class B shares, 1.00% for Class C shares, 1.00% for certain purchases of Class A shares and .25% for certain purchases of Class T shares.
For the period, sales charge amounts retained by FDC were as follows:
| | Retained
by FDC |
| Class A | $14,042 |
| Class T | 3,846 |
| Class B(a) | 58 |
| Class C(a) | 6,126 |
| | $24,072 |
(a) When Class B and Class C shares are initially sold, FDC pays commissions from its own resources to financial intermediaries through which the sales are made.
Transfer Agent Fees. Fidelity Investments Institutional Operations Company, Inc., (FIIOC), an affiliate of the investment adviser, is the transfer, dividend disbursing and shareholder servicing agent for each class of the Fund. FIIOC receives account fees and asset-based fees that vary according to the account size and type of account of the shareholders of the respective classes of the Fund. FIIOC pays for typesetting, printing and mailing of shareholder reports, except proxy statements.
For the period, transfer agent fees for each class were as follows:
| | Amount | % of
Class-Level Average
Net Assets |
| Class A | $91,625 | .22 |
| Class T | 39,448 | .25 |
| Class B | 1,922 | .26 |
| Class C | 78,134 | .28 |
| Global Balanced | 786,275 | .18 |
| Class I | 10,104 | .17 |
| | $1,007,508 | |
Accounting and Security Lending Fees. Fidelity Service Company, Inc. (FSC), an affiliate of the investment adviser, maintains the Fund's accounting records. The accounting fee is based on the level of average net assets for each month. Under a separate contract, FSC administers the security lending program. The security lending fee is based on the number and duration of lending transactions.
Brokerage Commissions. The Fund placed a portion of its portfolio transactions with brokerage firms which are affiliates of the investment adviser. Brokerage commissions are included in net realized gain (loss) and change in net unrealized appreciation (depreciation) in the Statement of Operations. The commissions paid to these affiliated firms were $6,154 for the period.
Interfund Lending Program. Pursuant to an Exemptive Order issued by the SEC, the Fund, along with other registered investment companies having management contracts with FMR or other affiliated entities of FMR, may participate in an interfund lending program. This program provides an alternative credit facility allowing the funds to borrow from, or lend money to, other participating affiliated funds. At period end, there were no interfund loans outstanding. The Fund's activity in this program during the period for which loans were outstanding was as follows:
| Borrower or Lender | Average Loan Balance | Weighted Average Interest Rate | Interest Expense |
| Borrower | $8,091,000 | .58% | $523 |
Interfund Trades. The Fund may purchase from or sell securities to other Fidelity Funds under procedures adopted by the Board. The procedures have been designed to ensure these interfund trades are executed in accordance with Rule 17a-7 of the 1940 Act. Interfund trades are included within the respective purchases and sales amounts shown in the Purchases and Sales of Investments note.
6. Committed Line of Credit.
The Fund participates with other funds managed by the investment adviser or an affiliate in a $4.25 billion credit facility (the "line of credit") to be utilized for temporary or emergency purposes to fund shareholder redemptions or for other short-term liquidity purposes. The Fund has agreed to pay commitment fees on its pro-rata portion of the line of credit, which amounted to $1,351 and is reflected in Miscellaneous expenses on the Statement of Operations. During the period, the Fund did not borrow on this line of credit.
7. Security Lending.
The Fund lends portfolio securities through a lending agent from time to time in order to earn additional income. For equity securities, a lending agent is used and may loan securities to certain qualified borrowers, including Fidelity Capital Markets (FCM), a broker-dealer affiliated with the Fund. On the settlement date of the loan, the Fund receives collateral (in the form of U.S. Treasury obligations, letters of credit and/or cash) against the loaned securities and maintains collateral in an amount not less than 100% of the market value of the loaned securities during the period of the loan. The market value of the loaned securities is determined at the close of business of the Fund and any additional required collateral is delivered to the Fund on the next business day. The Fund or borrower may terminate the loan at any time, and if the borrower defaults on its obligation to return the securities loaned because of insolvency or other reasons, the Fund may apply collateral received from the borrower against the obligation. The Fund may experience delays and costs in recovering the securities loaned. Any cash collateral received is invested in the Fidelity Securities Lending Cash Central Fund. The value of loaned securities and cash collateral at period end are disclosed on the Fund's Statement of Assets and Liabilities. Security lending income represents the income earned on investing cash collateral, less rebates paid to borrowers and any lending agent fees associated with the loan, plus any premium payments received for lending certain types of securities. Security lending income is presented in the Statement of Operations as a component of income from Fidelity Central Funds. Total security lending income during the period amounted to $36,161. During the period, there were no securities loaned to FCM.
8. Expense Reductions.
Commissions paid to certain brokers with whom the investment adviser, or its affiliates, places trades on behalf of the Fund include an amount in addition to trade execution, which may be rebated back to the Fund to offset certain expenses. This amount totaled $28,175 for the period.
In addition, during the period the investment adviser reimbursed and/or waived a portion of fund-level operating expenses in the amount of $3,846.
9. Distributions to Shareholders.
Distributions to shareholders of each class were as follows:
| | Year ended
October 31, 2016 | Year ended October 31, 2015 |
| From net investment income | | |
| Class A | $– | $21,068 |
| Global Balanced | – | 1,632,478 |
| Class I | – | 18,583 |
| Total | $– | $1,672,129 |
| From net realized gain | | |
| Class A | $1,198,713 | $3,250,151 |
| Class T | 472,741 | 1,204,951 |
| Class B | 38,199 | 119,044 |
| Class C | 844,073 | 1,878,431 |
| Global Balanced | 12,857,308 | 36,937,336 |
| Class I | 173,705 | 426,152 |
| Total | $15,584,739 | $43,816,065 |
10. Share Transactions.
Share transactions for each class were as follows and may contain automatic conversions between classes or exchanges between affiliated funds:
| | Shares | Shares | Dollars | Dollars |
| | Year ended
October 31, 2016 | Year ended October 31, 2015 | Year ended
October 31, 2016 | Year ended October 31, 2015 |
| Class A | | | | |
| Shares sold | 315,518 | 342,368 | $6,953,190 | $7,938,746 |
| Reinvestment of distributions | 52,986 | 138,033 | 1,141,851 | 3,123,694 |
| Shares redeemed | (405,081) | (521,026) | (9,020,050) | (12,017,082) |
| Net increase (decrease) | (36,577) | (40,625) | $(925,009) | $(954,642) |
| Class T | | | | |
| Shares sold | 72,280 | 115,195 | $1,589,041 | $2,671,230 |
| Reinvestment of distributions | 21,845 | 52,572 | 467,928 | 1,186,019 |
| Shares redeemed | (154,320) | (136,517) | (3,396,160) | (3,134,575) |
| Net increase (decrease) | (60,195) | 31,250 | $(1,339,191) | $722,674 |
| Class B | | | | |
| Shares sold | 48 | 1,702 | $1,021 | $39,359 |
| Reinvestment of distributions | 1,741 | 5,016 | 37,184 | 113,421 |
| Shares redeemed | (62,152) | (29,264) | (1,356,722) | (670,876) |
| Net increase (decrease) | (60,363) | (22,546) | $(1,318,517) | $(518,096) |
| Class C | | | | |
| Shares sold | 227,726 | 290,996 | $4,917,879 | $6,638,000 |
| Reinvestment of distributions | 37,381 | 76,970 | 787,624 | 1,717,971 |
| Shares redeemed | (295,837) | (311,709) | (6,357,105) | (7,093,083) |
| Net increase (decrease) | (30,730) | 56,257 | $(651,602) | $1,262,888 |
| Global Balanced | | | | |
| Shares sold | 2,114,763 | 2,245,199 | $47,490,820 | $52,274,696 |
| Reinvestment of distributions | 560,214 | 1,612,167 | 12,195,855 | 36,741,286 |
| Shares redeemed | (4,162,916) | (6,083,367) | (93,142,954) | (141,655,708) |
| Net increase (decrease) | (1,487,939) | (2,226,001) | $(33,456,279) | $(52,639,726) |
| Class I | | | | |
| Shares sold | 69,161 | 195,822 | $1,567,504 | $4,546,299 |
| Reinvestment of distributions | 6,856 | 15,294 | 148,834 | 347,634 |
| Shares redeemed | (95,184) | (208,476) | (2,155,432) | (4,837,091) |
| Net increase (decrease) | (19,167) | 2,640 | $(439,094) | $56,842 |
11. Other.
The Fund's organizational documents provide former and current trustees and officers with a limited indemnification against liabilities arising in connection with the performance of their duties to the Fund. In the normal course of business, the Fund may also enter into contracts that provide general indemnifications. The Fund's maximum exposure under these arrangements is unknown as this would be dependent on future claims that may be made against the Fund. The risk of material loss from such claims is considered remote.
Report of Independent Registered Public Accounting Firm
To the Trustees of Fidelity Charles Street Trust and Shareholders of Fidelity Global Balanced Fund:
In our opinion, the accompanying statement of assets and liabilities, including the schedule of investments, and the related statements of operations and of changes in net assets and the financial highlights present fairly, in all material respects, the financial position of Fidelity Global Balanced Fund (a fund of Fidelity Charles Street Trust) at October 31, 2016, the results of its operations for the year then ended, the changes in its net assets for each of the two years in the period then ended and the financial highlights for each of the five years in the period then ended, in conformity with accounting principles generally accepted in the United States of America. These financial statements and financial highlights (hereafter referred to as “financial statements”) are the responsibility of the Fidelity Global Balanced Fund’s management. Our responsibility is to express an opinion on these financial statements based on our audits. We conducted our audits of these financial statements in accordance with the standards of the Public Company Accounting Oversight Board (United States). Those standards require that we plan and perform the audit to obtain reasonable assurance about whether the financial statements are free of material misstatement. An audit includes examining, on a test basis, evidence supporting the amounts and disclosures in the financial statements, assessing the accounting principles used and significant estimates made by management, and evaluating the overall financial statement presentation. We believe that our audits, which included confirmation of securities at October 31, 2016 by correspondence with the custodian and brokers, provide a reasonable basis for our opinion.
PricewaterhouseCoopers LLP
Boston, Massachusetts
December 15, 2016
Trustees and Officers
The Trustees, Members of the Advisory Board (if any), and officers of the trust and fund, as applicable, are listed below. The Board of Trustees governs the fund and is responsible for protecting the interests of shareholders. The Trustees are experienced executives who meet periodically throughout the year to oversee the fund's activities, review contractual arrangements with companies that provide services to the fund, oversee management of the risks associated with such activities and contractual arrangements, and review the fund's performance. Except for Jennifer Toolin McAuliffe and Mark A. Murray, each of the Trustees oversees 244 funds. Ms. McAuliffe and Mr. Murray each oversees 191 funds.
The Trustees hold office without limit in time except that (a) any Trustee may resign; (b) any Trustee may be removed by written instrument, signed by at least two-thirds of the number of Trustees prior to such removal; (c) any Trustee who requests to be retired or who has become incapacitated by illness or injury may be retired by written instrument signed by a majority of the other Trustees; and (d) any Trustee may be removed at any special meeting of shareholders by a two-thirds vote of the outstanding voting securities of the trust. Each Trustee who is not an interested person (as defined in the 1940 Act) of the trust and the fund is referred to herein as an Independent Trustee. Each Independent Trustee shall retire not later than the last day of the calendar year in which his or her 75th birthday occurs. The Independent Trustees may waive this mandatory retirement age policy with respect to individual Trustees. Officers and Advisory Board Members hold office without limit in time, except that any officer or Advisory Board Member may resign or may be removed by a vote of a majority of the Trustees at any regular meeting or any special meeting of the Trustees. Except as indicated, each individual has held the office shown or other offices in the same company for the past five years.
The fund’s Statement of Additional Information (SAI) includes more information about the Trustees. To request a free copy, call Fidelity at 1-800-544-8544.
Experience, Skills, Attributes, and Qualifications of the Trustees. The Governance and Nominating Committee has adopted a statement of policy that describes the experience, qualifications, attributes, and skills that are necessary and desirable for potential Independent Trustee candidates (Statement of Policy). The Board believes that each Trustee satisfied at the time he or she was initially elected or appointed a Trustee, and continues to satisfy, the standards contemplated by the Statement of Policy. The Governance and Nominating Committee also engages professional search firms to help identify potential Independent Trustee candidates who have the experience, qualifications, attributes, and skills consistent with the Statement of Policy. From time to time, additional criteria based on the composition and skills of the current Independent Trustees, as well as experience or skills that may be appropriate in light of future changes to board composition, business conditions, and regulatory or other developments, have also been considered by the professional search firms and the Governance and Nominating Committee. In addition, the Board takes into account the Trustees' commitment and participation in Board and committee meetings, as well as their leadership of standing and ad hoc committees throughout their tenure.
In determining that a particular Trustee was and continues to be qualified to serve as a Trustee, the Board has considered a variety of criteria, none of which, in isolation, was controlling. The Board believes that, collectively, the Trustees have balanced and diverse experience, qualifications, attributes, and skills, which allow the Board to operate effectively in governing the fund and protecting the interests of shareholders. Information about the specific experience, skills, attributes, and qualifications of each Trustee, which in each case led to the Board's conclusion that the Trustee should serve (or continue to serve) as a trustee of the fund, is provided below.
Board Structure and Oversight Function. Abigail P. Johnson is an interested person and currently serves as Chairman. The Trustees have determined that an interested Chairman is appropriate and benefits shareholders because an interested Chairman has a personal and professional stake in the quality and continuity of services provided to the fund. Independent Trustees exercise their informed business judgment to appoint an individual of their choosing to serve as Chairman, regardless of whether the Trustee happens to be independent or a member of management. The Independent Trustees have determined that they can act independently and effectively without having an Independent Trustee serve as Chairman and that a key structural component for assuring that they are in a position to do so is for the Independent Trustees to constitute a substantial majority for the Board. The Independent Trustees also regularly meet in executive session. Marie L. Knowles serves as Chairman of the Independent Trustees and as such (i) acts as a liaison between the Independent Trustees and management with respect to matters important to the Independent Trustees and (ii) with management prepares agendas for Board meetings.
Fidelity® funds are overseen by different Boards of Trustees. The fund's Board oversees Fidelity's investment-grade bond, money market, asset allocation and certain equity funds, and other Boards oversee Fidelity's high income, sector and other equity funds. The asset allocation funds may invest in Fidelity® funds that are overseen by such other Boards. The use of separate Boards, each with its own committee structure, allows the Trustees of each group of Fidelity® funds to focus on the unique issues of the funds they oversee, including common research, investment, and operational issues. On occasion, the separate Boards establish joint committees to address issues of overlapping consequences for the Fidelity® funds overseen by each Board.
The Trustees operate using a system of committees to facilitate the timely and efficient consideration of all matters of importance to the Trustees, the fund, and fund shareholders and to facilitate compliance with legal and regulatory requirements and oversight of the fund's activities and associated risks. The Board, acting through its committees, has charged FMR and its affiliates with (i) identifying events or circumstances the occurrence of which could have demonstrably adverse effects on the fund's business and/or reputation; (ii) implementing processes and controls to lessen the possibility that such events or circumstances occur or to mitigate the effects of such events or circumstances if they do occur; and (iii) creating and maintaining a system designed to evaluate continuously business and market conditions in order to facilitate the identification and implementation processes described in (i) and (ii) above. Because the day-to-day operations and activities of the fund are carried out by or through FMR, its affiliates, and other service providers, the fund's exposure to risks is mitigated but not eliminated by the processes overseen by the Trustees. While each of the Board's committees has responsibility for overseeing different aspects of the fund's activities, oversight is exercised primarily through the Operations and Audit Committees. In addition, an ad hoc Board committee of Independent Trustees has worked with FMR to enhance the Board's oversight of investment and financial risks, legal and regulatory risks, technology risks, and operational risks, including the development of additional risk reporting to the Board. Appropriate personnel, including but not limited to the fund's Chief Compliance Officer (CCO), FMR's internal auditor, the independent accountants, the fund's Treasurer and portfolio management personnel, make periodic reports to the Board's committees, as appropriate, including an annual review of Fidelity's risk management program for the Fidelity® funds. The responsibilities of each standing committee, including their oversight responsibilities, are described further under "Standing Committees of the Trustees."
Interested Trustees*:
Correspondence intended for a Trustee who is an interested person may be sent to Fidelity Investments, 245 Summer Street, Boston, Massachusetts 02210.
Name, Year of Birth; Principal Occupations and Other Relevant Experience+
Abigail P. Johnson (1961)
Year of Election or Appointment: 2009
Trustee
Chairman of the Board of Trustees
Ms. Johnson also serves as Trustee of other Fidelity® funds. Ms. Johnson serves as President (2013-present) and Chief Executive Officer (2014-present) of FMR LLC (diversified financial services company), President of Fidelity Financial Services (2012-present) and President of Personal, Workplace and Institutional Services (2005-present). Ms. Johnson is Chairman and Director of FMR Co., Inc. (investment adviser firm, 2011-present), Chairman and Director of FMR (investment adviser firm, 2011-present), and the Vice Chairman and Director (2007-present) of FMR LLC. Previously, Ms. Johnson served as President and a Director of FMR (2001-2005), a Trustee of other investment companies advised by FMR, Fidelity Investments Money Management, Inc. (investment adviser firm), and FMR Co., Inc. (2001-2005), Senior Vice President of the Fidelity® funds (2001-2005), and managed a number of Fidelity® funds. Ms. Abigail P. Johnson and Mr. Arthur E. Johnson are not related.
Jennifer Toolin McAuliffe (1959)
Year of Election or Appointment: 2016
Trustee
Ms. McAuliffe also serves as Trustee or Member of the Advisory Board of other Fidelity® funds. Ms. McAuliffe previously served as Co-Head of Fixed Income of Fidelity Investments Limited (now known as FIL Limited (FIL)) (diversified financial services company). Earlier roles at FIL included Director of Research for FIL’s credit and quantitative teams in London, Hong Kong and Tokyo. Ms. McAuliffe also was the Director of Research for taxable and municipal bonds at Fidelity Investments Money Management, Inc. Ms. McAuliffe is also a director or trustee of several not-for-profit entities.
* Determined to be an “Interested Trustee” by virtue of, among other things, his or her affiliation with the trust or various entities under common control with FMR.
+ The information includes the Trustee's principal occupation during the last five years and other information relating to the experience, attributes, and skills relevant to the Trustee's qualifications to serve as a Trustee, which led to the conclusion that the Trustee should serve as a Trustee for the fund.
Independent Trustees:
Correspondence intended for an Independent Trustee may be sent to Fidelity Investments, P.O. Box 55235, Boston, Massachusetts 02205-5235.
Name, Year of Birth; Principal Occupations and Other Relevant Experience+
Elizabeth S. Acton (1951)
Year of Election or Appointment: 2013
Trustee
Ms. Acton also serves as Trustee of other Fidelity® funds. Prior to her retirement in April 2012, Ms. Acton was Executive Vice President, Finance (2011-2012), Executive Vice President, Chief Financial Officer (2002-2011), and Treasurer (2004-2005) of Comerica Incorporated (financial services). Prior to joining Comerica, Ms. Acton held a variety of positions at Ford Motor Company (1983-2002), including Vice President and Treasurer (2000-2002) and Executive Vice President and Chief Financial Officer of Ford Motor Credit Company (1998-2000). Ms. Acton currently serves as a member of the Board of Directors and Audit and Finance Committees of Beazer Homes USA, Inc. (homebuilding, 2012-present). Previously, Ms. Acton served as a Member of the Advisory Board of certain Fidelity® funds (2013-2016).
John Engler (1948)
Year of Election or Appointment: 2014
Trustee
Mr. Engler also serves as Trustee of other Fidelity® funds. He serves as president of the Business Roundtable (2011-present), and on the board of directors for Universal Forest Products (manufacturer and distributor of wood and wood-alternative products, 2003-present) and K12 Inc. (technology-based education company, 2012-present). Previously, Mr. Engler served as a Member of the Advisory Board of certain Fidelity® funds (2014-2016), a trustee of The Munder Funds (2003-2014), president and CEO of the National Association of Manufacturers (2004-2011), member of the Board of Trustees of the Annie E. Casey Foundation (2004-2015), and as governor of Michigan (1991-2003). He is a past chairman of the National Governors Association.
Albert R. Gamper, Jr. (1942)
Year of Election or Appointment: 2006
Trustee
Mr. Gamper also serves as Trustee of other Fidelity® funds. Prior to his retirement in December 2004, Mr. Gamper served as Chairman of the Board of CIT Group Inc. (commercial finance). During his tenure with CIT Group Inc. Mr. Gamper served in numerous senior management positions, including Chairman (1987-1989; 1999-2001; 2002-2004), Chief Executive Officer (1987-2004), and President (2002-2003). Mr. Gamper currently serves as a member of the Board of Directors of Public Service Enterprise Group (utilities, 2000-present), and Member of the Board of Trustees of Barnabas Health Care System (1997-present). Previously, Mr. Gamper served as Chairman (2012-2015) and Vice Chairman (2011-2012) of the Independent Trustees of certain Fidelity® funds and as Chairman of the Board of Governors, Rutgers University (2004-2007).
Robert F. Gartland (1951)
Year of Election or Appointment: 2010
Trustee
Mr. Gartland also serves as Trustee of other Fidelity® funds. Mr. Gartland is Chairman and an investor in Gartland & Mellina Group Corp. (consulting, 2009-present). Previously, Mr. Gartland served as a partner and investor of Vietnam Partners LLC (investments and consulting, 2008-2011). Prior to his retirement, Mr. Gartland held a variety of positions at Morgan Stanley (financial services, 1979-2007) including Managing Director (1987-2007).
Arthur E. Johnson (1947)
Year of Election or Appointment: 2008
Trustee
Vice Chairman of the Independent Trustees
Mr. Johnson also serves as Trustee of other Fidelity® funds. Mr. Johnson serves as a member of the Board of Directors of Eaton Corporation plc (diversified power management, 2009-present), AGL Resources, Inc. (holding company, 2002-present) and Booz Allen Hamilton (management consulting, 2011-present). Prior to his retirement, Mr. Johnson served as Senior Vice President of Corporate Strategic Development of Lockheed Martin Corporation (defense contractor, 1999-2009). He previously served on the Board of Directors of IKON Office Solutions, Inc. (1999-2008) and Delta Airlines (2005-2007). Mr. Arthur E. Johnson is not related to Ms. Abigail P. Johnson.
Michael E. Kenneally (1954)
Year of Election or Appointment: 2009
Trustee
Mr. Kenneally also serves as Trustee of other Fidelity® funds. Prior to his retirement, Mr. Kenneally served as Chairman and Global Chief Executive Officer of Credit Suisse Asset Management. Before joining Credit Suisse, he was an Executive Vice President and Chief Investment Officer for Bank of America Corporation. Earlier roles at Bank of America included Director of Research, Senior Portfolio Manager and Research Analyst, and Mr. Kenneally was awarded the Chartered Financial Analyst (CFA) designation in 1991.
James H. Keyes (1940)
Year of Election or Appointment: 2007
Trustee
Mr. Keyes also serves as Trustee of other Fidelity® funds. Mr. Keyes serves as a member of the Board and Non-Executive Chairman of Navistar International Corporation (manufacture and sale of trucks, buses, and diesel engines, since 2002). Previously, Mr. Keyes served as a member of the Board of Pitney Bowes, Inc. (integrated mail, messaging, and document management solutions, 1998-2013). Prior to his retirement, Mr. Keyes served as Chairman (1993-2002) and Chief Executive Officer (1988-2002) of Johnson Controls (automotive, building, and energy) and as a member of the Board of LSI Logic Corporation (semiconductor technologies, 1984-2008).
Marie L. Knowles (1946)
Year of Election or Appointment: 2001
Trustee
Chairman of the Independent Trustees
Ms. Knowles also serves as Trustee of other Fidelity® funds. Prior to Ms. Knowles' retirement in June 2000, she served as Executive Vice President and Chief Financial Officer of Atlantic Richfield Company (ARCO) (diversified energy, 1996-2000). From 1993 to 1996, she was a Senior Vice President of ARCO and President of ARCO Transportation Company (pipeline and tanker operations). Ms. Knowles currently serves as a Director and Chairman of the Audit Committee of McKesson Corporation (healthcare service, since 2002). Ms. Knowles is a member of the Board of the Santa Catalina Island Company (real estate, 2009-present). Ms. Knowles is a Member of the Investment Company Institute Board of Governors and a Member of the Governing Council of the Independent Directors Council (2014-present). She also serves as a member of the Advisory Board for the School of Engineering of the University of Southern California. Previously, Ms. Knowles served as a Director of Phelps Dodge Corporation (copper mining and manufacturing, 1994-2007), URS Corporation (engineering and construction, 2000-2003) and America West (airline, 1999-2002). Ms. Knowles previously served as Vice Chairman of the Independent Trustees of certain Fidelity�� funds (2012-2015).
Mark A. Murray (1954)
Year of Election or Appointment: 2016
Trustee
Mr. Murray also serves as Trustee or Member of the Advisory Board of other Fidelity® funds. Mr. Murray is Vice Chairman (2013-present) of Meijer, Inc. (regional retail chain). Previously, Mr. Murray served as Co-Chief Executive Officer (2013-2016) and President (2006-2013) of Meijer, Inc. Mr. Murray serves as a member of the Board of Directors and Nuclear Review and Public Policy and Responsibility Committees of DTE Energy Company (diversified energy company, 2009-present). Mr. Murray also serves as a member of the Board of Directors of Spectrum Health (not-for-profit health system, 2015-present). Mr. Murray previously served as President of Grand Valley State University (2001-2006), Treasurer for the State of Michigan (1999-2001), Vice President of Finance and Administration for Michigan State University (1998-1999), and a member of the Board of Directors and Audit Committee and Chairman of the Nominating and Corporate Governance Committee of Universal Forest Products, Inc. (manufacturer and distributor of wood and wood-alternative products, 2004-2016). Mr. Murray is also a director or trustee of many community and professional organizations.
+ The information includes the Trustee's principal occupation during the last five years and other information relating to the experience, attributes, and skills relevant to the Trustee's qualifications to serve as a Trustee, which led to the conclusion that the Trustee should serve as a Trustee for the fund.
Advisory Board Members and Officers:
Correspondence intended for an officer may be sent to Fidelity Investments, 245 Summer Street, Boston, Massachusetts 02210. Officers appear below in alphabetical order.
Name, Year of Birth; Principal Occupation
Marc R. Bryant (1966)
Year of Election or Appointment: 2015
Secretary and Chief Legal Officer (CLO)
Mr. Bryant also serves as Secretary and CLO of other funds. Mr. Bryant serves as CLO, Secretary, and Senior Vice President of Fidelity Management & Research Company (investment adviser firm, 2015-present) and FMR Co., Inc. (investment adviser firm, 2015-present); Secretary of Fidelity SelectCo, LLC (investment adviser firm, 2015-present) and Fidelity Investments Money Management, Inc. (investment adviser firm, 2015-present); and CLO of Fidelity Management & Research (Hong Kong) Limited and FMR Investment Management (UK) Limited (investment adviser firms, 2015-present) and Fidelity Management & Research (Japan) Limited (investment adviser firm, 2016-present). He is Senior Vice President and Deputy General Counsel of FMR LLC (diversified financial services company). Previously, Mr. Bryant served as Secretary and CLO of Fidelity Rutland Square Trust II (2010-2014) and Assistant Secretary of Fidelity's Fixed Income and Asset Allocation Funds (2013-2015). Prior to joining Fidelity Investments, Mr. Bryant served as a Senior Vice President and the Head of Global Retail Legal for AllianceBernstein L.P. (2006-2010), and as the General Counsel for ProFund Advisors LLC (2001-2006).
Jeffrey S. Christian (1961)
Year of Election or Appointment: 2016
Assistant Treasurer
Mr. Christian also serves as Assistant Treasurer of other funds. Mr. Christian is an employee of Fidelity Investments (2003-present).
Jonathan Davis (1968)
Year of Election or Appointment: 2010
Assistant Treasurer
Mr. Davis also serves as Assistant Treasurer of other funds, and is an employee of Fidelity Investments. Previously, Mr. Davis served as Vice President and Associate General Counsel of FMR LLC (diversified financial services company, 2003-2010).
Adrien E. Deberghes (1967)
Year of Election or Appointment: 2010
Assistant Treasurer
Mr. Deberghes also serves as an officer of other funds. He serves as Executive Vice President of Fidelity Investments Money Management, Inc. (FIMM) (investment adviser firm, 2016-present) and is an employee of Fidelity Investments (2008-present). Prior to joining Fidelity Investments, Mr. Deberghes was Senior Vice President of Mutual Fund Administration at State Street Corporation (2007-2008), Senior Director of Mutual Fund Administration at Investors Bank & Trust (2005-2007), and Director of Finance for Dunkin' Brands (2000-2005). Previously, Mr. Deberghes served in other fund officer roles.
Stephanie J. Dorsey (1969)
Year of Election or Appointment: 2013
President and Treasurer
Ms. Dorsey also serves as an officer of other funds. She is an employee of Fidelity Investments (2008-present) and has served in other fund officer roles. Prior to joining Fidelity Investments, Ms. Dorsey served as Treasurer (2004-2008) of the JPMorgan Mutual Funds and Vice President (2004-2008) of JPMorgan Chase Bank.
Howard J. Galligan III (1966)
Year of Election or Appointment: 2014
Chief Financial Officer
Mr. Galligan also serves as Chief Financial Officer of other funds. Mr. Galligan serves as President of Fidelity Pricing and Cash Management Services (FPCMS) (2014-present) and as a Director of Strategic Advisers, Inc. (investment adviser firm, 2008-present). Previously, Mr. Galligan served as Chief Administrative Officer of Asset Management (2011-2014) and Chief Operating Officer and Senior Vice President of Investment Support for Strategic Advisers, Inc. (2003-2011).
Scott C. Goebel (1968)
Year of Election or Appointment: 2015
Vice President
Mr. Goebel serves as Vice President of other funds and is an employee of Fidelity Investments (2001-present). Previously, Mr. Goebel served as Senior Vice President of Fidelity Management & Research Company (FMR) (investment adviser firm, 2016), Secretary of Fidelity SelectCo, LLC (investment adviser firm, 2013-2015), Fidelity Investments Money Management, Inc. (FIMM) (investment adviser firm, 2010-2015), and Fidelity Research and Analysis Company (FRAC) (investment adviser firm, 2010-2015); General Counsel, Secretary, and Senior Vice President of FMR (investment adviser firm, 2008-2015) and FMR Co., Inc. (investment adviser firm, 2008-2015); Assistant Secretary of Fidelity Management & Research (Japan) Limited (investment adviser firm, 2008-2015) and Fidelity Management & Research (U.K.) Inc. (investment adviser firm, 2008-2015); Chief Legal Officer (CLO) of Fidelity Management & Research (Hong Kong) Limited (investment adviser firm, 2008-2015); Secretary and CLO of certain Fidelity® funds (2008-2015); Assistant Secretary of FIMM (2008-2010), FRAC (2008-2010), and certain funds (2007-2008); and as Vice President and Secretary of Fidelity Distributors Corporation (FDC) (2005-2007).
Colm A. Hogan (1973)
Year of Election or Appointment: 2016
Assistant Treasurer
Mr. Hogan also serves as an officer of other funds. Mr. Hogan is an employee of Fidelity Investments (2005-present).
Chris Maher (1972)
Year of Election or Appointment: 2013
Assistant Treasurer
Mr. Maher serves as Assistant Treasurer of other funds. Mr. Maher is Vice President of Valuation Oversight and is an employee of Fidelity Investments. Previously, Mr. Maher served as Vice President of Asset Management Compliance (2013), Vice President of the Program Management Group of FMR (investment adviser firm, 2010-2013), and Vice President of Valuation Oversight (2008-2010).
John B. McGinty, Jr. (1962)
Year of Election or Appointment: 2016
Chief Compliance Officer
Mr. McGinty also serves as Chief Compliance Officer of other funds. Mr. McGinty is Senior Vice President of Asset Management Compliance for Fidelity Investments and is an employee of Fidelity Investments (2016-present). Mr. McGinty previously served as Vice President, Senior Attorney at Eaton Vance Management (investment management firm, 2015-2016), and prior to Eaton Vance as global CCO for all firm operations and registered investment companies at GMO LLC (investment management firm, 2009-2015). Before joining GMO LLC, Mr. McGinty served as Senior Vice President, Deputy General Counsel for Fidelity Investments (2007-2009).
John F. Papandrea (1972)
Year of Election or Appointment: 2016
Anti-Money Laundering (AML) Officer
Mr. Papandrea also serves as AML Officer of other funds. Mr. Papandrea is Vice President of FMR LLC (diversified financial services company, 2008-present) and is an employee of Fidelity Investments (2005-present).
Jason P. Pogorelec (1975)
Year of Election or Appointment: 2015
Assistant Secretary
Mr. Pogorelec also serves as Assistant Secretary of other funds. Mr. Pogorelec serves as Vice President, Associate General Counsel (2010-present) and is an employee of Fidelity Investments (2006-present).
Nancy D. Prior (1967)
Year of Election or Appointment: 2014
Vice President
Ms. Prior also serves as Vice President of other funds. Ms. Prior serves as a Director of FMR Investment Management (UK) Limited (investment adviser firm, 2015-present), President (2016-present) and Director (2014-present) of Fidelity Investments Money Management, Inc. (FIMM) (investment adviser firm), President, Fixed Income (2014-present), Vice Chairman of FIAM LLC (investment adviser firm, 2014-present), and is an employee of Fidelity Investments (2002-present). Previously, Ms. Prior served as Vice President of Fidelity's Money Market Funds (2012-2014), President, Money Market and Short Duration Bond Group of Fidelity Management & Research (FMR) (investment adviser firm, 2013-2014), President, Money Market Group of FMR (2011-2013), Managing Director of Research (2009-2011), Senior Vice President and Deputy General Counsel (2007-2009), and Assistant Secretary of certain Fidelity® funds (2008-2009).
Stacie M. Smith (1974)
Year of Election or Appointment: 2013
Assistant Treasurer
Ms. Smith also serves as an officer of other funds. She is an employee of Fidelity Investments (2009-present) and has served in other fund officer roles. Prior to joining Fidelity Investments, Ms. Smith served as Senior Audit Manager of Ernst & Young LLP (accounting firm, 1996-2009). Previously, Ms. Smith served as Deputy Treasurer of certain Fidelity® funds (2013-2016).
Marc L. Spector (1972)
Year of Election or Appointment: 2016
Deputy Treasurer
Mr. Spector also serves as an officer of other funds. Mr. Spector is an employee of Fidelity Investments (2016-present). Prior to joining Fidelity Investments, Mr. Spector served as Director at the Siegfried Group (accounting firm, 2013-2016), and prior to Siegfried Group as audit senior manager at Deloitte & Touche (accounting firm, 2005-2013).
Renee Stagnone (1975)
Year of Election or Appointment: 2016
Assistant Treasurer
Ms. Stagnone also serves as an officer of other funds. Ms. Stagnone is an employee of Fidelity Investments (1997-present). Previously, Ms. Stagnone served as Deputy Treasurer of certain Fidelity® funds (2013-2016).
Derek L. Young (1964)
Year of Election or Appointment: 2009
Vice President of Fidelity's Asset Allocation Funds
Mr. Young also serves as an officer of other funds. He is a Director of Strategic Advisers, Inc. (investment adviser firm, 2011-present) and FMR Investment Management (UK) Limited (investment adviser firm, 2016-present), President of Fidelity Global Asset Allocation (GAA) (2011-present), and Vice Chairman of FIAM LLC (investment adviser firm, 2011-present). Previously, Mr. Young served as Trustee of certain funds (2012-2015), President of Strategic Advisers, Inc. (2011-2015), Chief Investment Officer of GAA (2009-2011), and as a portfolio manager.
Shareholder Expense Example
As a shareholder of the Fund, you incur two types of costs: (1) transaction costs, including sales charges (loads) on purchase payments or redemption proceeds, redemption fees and (2) ongoing costs, including management fees, distribution and/or service (12b-1) fees and other Fund expenses. This Example is intended to help you understand your ongoing costs (in dollars) of investing in the Fund and to compare these costs with the ongoing costs of investing in other mutual funds.
The Example is based on an investment of $1,000 invested at the beginning of the period and held for the entire period (May 1, 2016 to October 31, 2016).
Actual Expenses
The first line of the accompanying table for each class of the Fund provides information about actual account values and actual expenses. You may use the information in this line, together with the amount you invested, to estimate the expenses that you paid over the period. Simply divide your account value by $1,000.00 (for example, an $8,600 account value divided by $1,000.00 = 8.6), then multiply the result by the number in the first line for a class of the Fund under the heading entitled "Expenses Paid During Period" to estimate the expenses you paid on your account during this period. A small balance maintenance fee of $12.00 that is charged once a year may apply for certain accounts with a value of less than $2,000. This fee is not included in the table below. If it was, the estimate of expenses you paid during the period would be higher, and your ending account value lower, by this amount. In addition, the Fund, as a shareholder in the underlying Fidelity Central Funds, will indirectly bear its pro-rata share of the fees and expenses incurred by the underlying Fidelity Central Funds. These fees and expenses are not included in the Fund's annualized expense ratio used to calculate the expense estimate in the table below.
Hypothetical Example for Comparison Purposes
The second line of the accompanying table for each class of the Fund provides information about hypothetical account values and hypothetical expenses based on a Class' actual expense ratio and an assumed rate of return of 5% per year before expenses, which is not the Class' actual return. The hypothetical account values and expenses may not be used to estimate the actual ending account balance or expenses you paid for the period. You may use this information to compare the ongoing costs of investing in the Fund and other funds. To do so, compare this 5% hypothetical example with the 5% hypothetical examples that appear in the shareholder reports of the other funds. A small balance maintenance fee of $12.00 that is charged once a year may apply for certain accounts with a value of less than $2,000. This fee is not included in the table below. If it was, the estimate of expenses you paid during the period would be higher, and your ending account value lower, by this amount. In addition, the Fund, as a shareholder in the underlying Fidelity Central Funds, will indirectly bear its pro-rata share of the fees and expenses incurred by the underlying Fidelity Central Funds. These fees and expenses are not included in the Fund's annualized expense ratio used to calculate the expense estimate in the table below.
Please note that the expenses shown in the table are meant to highlight your ongoing costs only and do not reflect any transaction costs. Therefore, the second line of the table is useful in comparing ongoing costs only, and will not help you determine the relative total costs of owning different funds. In addition, if these transactional costs were included, your costs would have been higher.
| | Annualized Expense Ratio-A | Beginning
Account Value
May 1, 2016 | Ending
Account Value
October 31, 2016 | Expenses Paid
During Period-B
May 1, 2016
to October 31, 2016 |
| Class A | 1.28% | | | |
| Actual | | $1,000.00 | $1,000.90 | $6.44 |
| Hypothetical-C | | $1,000.00 | $1,018.70 | $6.50 |
| Class T | 1.56% | | | |
| Actual | | $1,000.00 | $999.60 | $7.84 |
| Hypothetical-C | | $1,000.00 | $1,017.29 | $7.91 |
| Class C | 2.09% | | | |
| Actual | | $1,000.00 | $996.80 | $10.49 |
| Hypothetical-C | | $1,000.00 | $1,014.63 | $10.58 |
| Global Balanced | .99% | | | |
| Actual | | $1,000.00 | $1,002.20 | $4.98 |
| Hypothetical-C | | $1,000.00 | $1,020.16 | $5.03 |
| Class I | .99% | | | |
| Actual | | $1,000.00 | $1,002.70 | $4.98 |
| Hypothetical-C | | $1,000.00 | $1,020.16 | $5.03 |
A Annualized expense ratio reflects expenses net of applicable fee waivers.
B Expenses are equal to each Class' annualized expense ratio, multiplied by the average account value over the period, multiplied by 184/366 (to reflect the one-half year period). In addition to the expenses noted above, the Fund also indirectly bears its proportional share of the expenses of the underlying Fidelity Central Funds. Annualized expenses of the underlying non-money market Fidelity Central Funds as of their most recent fiscal half year ranged from .06% to .09%.
C 5% return per year before expenses
Distributions (Unaudited)
The Board of Trustees of Fidelity Global Balanced Fund voted to pay to shareholders of record at the opening of business on record date, the following distributions per share derived from capital gains realized from sales of portfolio securities, and dividends derived from net investment income:
| | Pay Date | Record Date | Dividends | Capital Gains |
| Fidelity Global Balanced Fund | | | | |
| Class A | 12/12/16 | 12/09/16 | $0.005 | $0.080 |
| Class C | 12/12/16 | 12/09/16 | $0.000 | $0.080 |
| Class I | 12/12/16 | 12/09/16 | $0.015 | $0.080 |
| Fidelity Global Balanced Fund | 12/12/16 | 12/09/16 | $0.015 | $0.080 |
| Class T | 12/12/16 | 12/09/16 | $ 0.000 | $ 0.080 |
|
The fund hereby designates as a capital gain dividend with respect to the taxable year ended October 31, 2016, $1,791,203, or, if subsequently determined to be different, the net capital gain of such year.
A total of 6.46% of the dividends distributed during the fiscal year was derived from interest on U.S. Government securities which is generally exempt from state income tax.
The fund will notify shareholders in January 2017 of amounts for use in preparing 2016 income tax returns.
Board Approval of Investment Advisory Contracts and Management Fees
Fidelity Global Balanced Fund
Each year, the Board of Trustees, including the Independent Trustees (together, the Board), votes on the renewal of the management contract with Fidelity Management & Research Company (FMR) and the sub-advisory agreements (together, the Advisory Contracts) for the fund. The Board, assisted by the advice of fund counsel and Independent Trustees' counsel, requests and considers a broad range of information relevant to the renewal of the Advisory Contracts throughout the year.
The Board meets regularly and, at each of its meetings, covers an extensive agenda of topics and materials and considers factors that are relevant to its annual consideration of the renewal of the fund's Advisory Contracts, including the services and support provided to the fund and its shareholders. The Board has established four standing committees (Committees) — Operations, Audit, Fair Valuation, and Governance and Nominating — each composed of and chaired by Independent Trustees with varying backgrounds, to which the Board has assigned specific subject matter responsibilities in order to enhance effective decision-making by the Board. The Operations Committee, of which all of the Independent Trustees are members, meets regularly throughout the year and considers, among other matters, information specifically related to the annual consideration of the renewal of the fund's Advisory Contracts. The Board, acting directly and through its Committees, requests and receives information concerning the annual consideration of the renewal of the fund's Advisory Contracts. The Board also meets as needed to consider matters specifically related to the Board's annual consideration of the renewal of the Advisory Contracts. Members of the Board may also meet with trustees of other Fidelity funds through ad hoc joint committees to discuss certain matters relevant to all of the Fidelity funds.
At its September 2016 meeting, the Board unanimously determined to renew the fund's Advisory Contracts. In reaching its determination, the Board considered all factors it believed relevant, including (i) the nature, extent, and quality of the services to be provided to the fund and its shareholders (including the investment performance of the fund); (ii) the competitiveness of the fund's management fee and total expense ratio relative to peer funds; (iii) the total costs of the services to be provided by and the profits to be realized by Fidelity from its relationships with the fund; and (iv) the extent to which, if any, economies of scale exist and would be realized as the fund grows, and whether any economies of scale are appropriately shared with fund shareholders.
In considering whether to renew the Advisory Contracts for the fund, the Board reached a determination, with the assistance of fund counsel and Independent Trustees' counsel and through the exercise of its business judgment, that the renewal of the Advisory Contracts was in the best interests of the fund and its shareholders and that the compensation payable under the Advisory Contracts was fair and reasonable. The Board's decision to renew the Advisory Contracts was not based on any single factor, but rather was based on a comprehensive consideration of all the information provided to the Board at its meetings throughout the year. The Board, in reaching its determination to renew the Advisory Contracts, was aware that shareholders of the fund have a broad range of investment choices available to them, including a wide choice among funds offered by Fidelity's competitors, and that the fund's shareholders, who have the opportunity to review and weigh the disclosure provided by the fund in its prospectus and other public disclosures, have chosen to invest in this fund, which is part of the Fidelity family of funds.
Nature, Extent, and Quality of Services Provided. The Board considered Fidelity's staffing as it relates to the fund, including the backgrounds of investment personnel of Fidelity, and also considered the fund's investment objective, strategies, and related investment philosophy. The Independent Trustees also had discussions with senior management of Fidelity's investment operations and investment groups. The Board considered the structure of the investment personnel compensation program and whether this structure provides appropriate incentives to act in the best interests of the fund. Additionally, the Board considered the portfolio managers' investments, if any, in the funds that they manage.
Resources Dedicated to Investment Management and Support Services. The Board reviewed the general qualifications and capabilities of Fidelity's investment staff, including its size, education, experience, and resources, as well as Fidelity's approach to recruiting, managing, and compensating investment personnel. The Board noted that Fidelity has continued to increase the resources devoted to non-U.S. offices, including expansion of Fidelity's global investment organization. The Board also noted that Fidelity's analysts have extensive resources, tools and capabilities that allow them to conduct sophisticated quantitative and fundamental analysis, as well as credit analysis of issuers, counterparties and guarantors. Further, the Board considered that Fidelity's investment professionals have sufficient access to global information and data so as to provide competitive investment results over time, and that those professionals also have access to sophisticated tools that permit them to assess portfolio construction and risk and performance attribution characteristics continuously, as well as to transmit new information and research conclusions rapidly around the world. Additionally, in its deliberations, the Board considered Fidelity's trading, risk management, compliance, and technology and operations capabilities and resources, which are integral parts of the investment management process.
Shareholder and Administrative Services. The Board considered (i) the nature, extent, quality, and cost of advisory, administrative, and shareholder services performed by FMR, the sub-advisers (together with FMR, the Investment Advisers), and their affiliates under the Advisory Contracts and under separate agreements covering transfer agency, pricing and bookkeeping, and securities lending services for the fund; (ii) the nature and extent of the supervision of third party service providers, principally custodians, subcustodians, and pricing vendors; and (iii) the resources devoted to, and the record of compliance with, the fund's compliance policies and procedures. The Board also reviewed the allocation of fund brokerage, including allocations to brokers affiliated with the Investment Advisers, the use of brokerage commissions to pay fund expenses, and the use of "soft" commission dollars to pay for research services.
The Board noted that the growth of fund assets over time across the complex allows Fidelity to reinvest in the development of services designed to enhance the value or convenience of the Fidelity funds as investment vehicles. These services include 24-hour access to account information and market information through telephone representatives and over the Internet, investor education materials and asset allocation tools, and the expanded availability of Fidelity Investor Centers.
Investment in a Large Fund Family. The Board considered the benefits to shareholders of investing in a Fidelity fund, including the benefits of investing in a fund that is part of a large family of funds offering a variety of investment disciplines and providing a large variety of mutual fund investor services. The Board noted that Fidelity had taken, or had made recommendations that resulted in the Fidelity funds taking, a number of actions over the previous year that benefited particular funds, including: (i) continuing to dedicate additional resources to investment research and to the support of the senior management team that oversees asset management; (ii) continuing efforts to enhance Fidelity's global research capabilities; (iii) launching new funds and making other enhancements to meet client needs; (iv) broadening eligibility requirements for certain lower-priced share classes of, and streamlining the fee structure for, certain existing equity index funds; (v) lowering expense caps for certain existing funds and classes to reduce expenses paid by shareholders; (vi) eliminating redemption fees for certain variable insurance product funds and classes; (vii) continuing to launch dedicated lower cost underlying funds to meet portfolio construction needs related to expanding underlying fund options for Fidelity funds of funds, specifically for the Freedom Fund product lines; (viii) launching a lower cost share class for use by the Freedom Index Fund product line; (ix) rationalizing product lines and gaining increased efficiencies through fund mergers and share class consolidations; (x) continuing to develop, acquire and implement systems and technology to improve services to the funds and shareholders, strengthen information security, and increase efficiency; (xi) implementing investment enhancements to further strengthen Fidelity's target date product line to increase investors' probability of success in achieving their goals; (xii) accelerating the conversion of all remaining Class B shares to Class A shares, which have a lower expense structure; and (xiii) implementing changes to Fidelity's money market fund product line in response to recent regulatory reforms.
Investment Performance. The Board considered whether the fund has operated in accordance with its investment objective, as well as its record of compliance with its investment restrictions and its performance history. The Board noted that there were portfolio management changes for the fund in December 2015 and April 2016.
The Board took into account discussions with representatives of the Investment Advisers about fund investment performance that occur at Board meetings throughout the year. In this regard the Board noted that as part of regularly scheduled fund reviews and other reports to the Board on fund performance, the Board considers annualized return information for the fund for different time periods, measured against one or more securities market indices, including a customized blended index representative of the fund's asset classes (each a "benchmark index") and a peer group of funds with similar objectives ("peer group"), if any. In its evaluation of fund investment performance at meetings throughout the year, the Board gave particular attention to information indicating underperformance of certain Fidelity funds for specific time periods and discussed with the Investment Advisers the reasons for such underperformance.
In addition to reviewing absolute and relative fund performance, the Independent Trustees periodically consider the appropriateness of fund performance metrics in evaluating the results achieved. In general, the Independent Trustees believe that fund performance should be evaluated based on gross performance (before fees and expenses but after transaction costs) compared to appropriate benchmark indices, over appropriate time periods that may include full market cycles, and on net performance (after fees and expenses) compared to peer groups, as applicable, over the same periods, taking into account relevant factors including the following: general market conditions; expectations for interest rate levels and credit conditions; issuer-specific information including credit quality; and fund cash flows and other factors. Depending on the circumstances, the Independent Trustees may be satisfied with a fund's performance notwithstanding that it lags its benchmark index or peer group for certain periods.
The Independent Trustees recognize that shareholders evaluate performance on a net basis over their own holding periods, for which one-, three-, and five-year periods are often used as a proxy. For this reason, the performance information reviewed by the Board also included net cumulative calendar year total return information for the fund and an appropriate benchmark index and peer group for the most recent one-, three-, and five-year periods.
Based on its review, the Board concluded that the nature, extent, and quality of services provided to the fund under the Advisory Contracts should continue to benefit the shareholders of the fund.
Competitiveness of Management Fee and Total Expense Ratio. The Board considered the fund's management fee and total expense ratio compared to "mapped groups" of competitive funds and classes created for the purpose of facilitating the Trustees' competitive analysis of management fees and total expenses. Fidelity creates "mapped groups" by combining similar Lipper investment objective categories that have comparable investment mandates. Combining Lipper investment objective categories aids the Board's management fee and total expense ratio comparisons by broadening the competitive group used for comparison.
Management Fee. The Board considered two proprietary management fee comparisons for the 12-month periods shown in basis points (BP) in the chart below. The group of Lipper funds used by the Board for management fee comparisons is referred to below as the "Total Mapped Group." The Total Mapped Group comparison focuses on a fund's standing in terms of gross management fees before expense reimbursements or caps relative to the total universe of funds with comparable investment mandates, regardless of whether their management fee structures also are comparable. Funds with comparable investment mandates offer exposure to similar types of securities. Funds with comparable management fee structures have similar management fee contractual arrangements (
e.g., flat rate charged for advisory services, all-inclusive fee rate,
etc.). "TMG %" represents the percentage of funds in the Total Mapped Group that had management fees that were lower than the fund's. For example, a hypothetical TMG % of 20% would mean that 80% of the funds in the Total Mapped Group had higher,and 20% had lower, management fees than the fund. The fund's actual TMG %s and the number of funds in the Total Mapped Group are in the chart below. The "Asset-Size Peer Group" (ASPG) comparison focuses on a fund's standing relative to a subset of non-Fidelity funds within the Total Mapped Group that are similar in size and management fee structure. For example, if a fund is in the first quartile of the ASPG, the fund's management fee ranks in the least expensive or lowest 25% of funds in the ASPG. The ASPG represents at least 15% of the funds in the Total Mapped Group with comparable asset size and management fee structures, subject to a minimum of 50 funds (or all funds in the Total Mapped Group if fewer than 50). Additional information, such as the ASPG quartile in which the fund's management fee rate ranked, is also included in the chart and considered by the Board.
Fidelity Global Balanced Fund
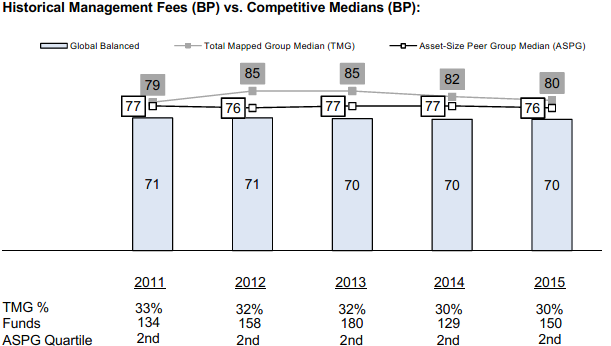
The Board noted that the fund's management fee rate ranked below the median of its Total Mapped Group and below the median of its ASPG for 2015.
The Board noted that, in 2014, the ad hoc Committee on Group Fee was formed by it and the boards of other Fidelity funds to conduct an in-depth review of the "group fee" component of the management fee of funds with such management fee structures. The Committee's focus included the mechanics of the group fee, the competitive landscape of group fee structures, Fidelity funds with no group fee component and investment products not included in group fee assets. The Board also considered that, for funds subject to the group fee, FMR agreed to voluntarily waive fees over a specified period of time in amounts designed to account for assets converted from certain funds to certain collective investment trusts.
Based on its review, the Board concluded that the fund's management fee is fair and reasonable in light of the services that the fund receives and the other factors considered.
Total Expense Ratio. In its review of each class's total expense ratio, the Board considered the fund's management fee rate as well as other fund or class expenses, as applicable, such as transfer agent fees, pricing and bookkeeping fees, fund-paid 12b-1 fees, and custodial, legal, and audit fees. The Board also noted that Fidelity may agree to waive fees and expenses from time to time, and the extent to which, if any, it has done so for the fund. As part of its review, the Board also considered the current and historical total expense ratios of each class of the fund compared to competitive fund median expenses. Each class of the fund is compared to those funds and classes in the Total Mapped Group (used by the Board for management fee comparisons) that have a similar sales load structure.
The Board noted that the total expense ratio of the retail class ranked below the competitive median for 2015 and the total expense ratio of each of Class A, Class T, Class C, and Class I ranked above the competitive median for 2015. The Board considered that, in general, various factors can affect total expense ratios. The Board also considered that each of Class A, Class T, Class C, and Class I was above the competitive median primarily because of higher transfer agent fees due to smaller average account sizes. Additionally, the Board considered that this fund has higher expenses because of the fund's small size and its global focus, which results in higher pricing and bookkeeping and custodian fees. The Board also noted that the total expense ratio of Class T was above the competitive median because of higher 12b-1 fees on Class T as compared to most competitor funds. Class T has a higher 12b-1 fee, but a lower front-end sales charge, than traditionally priced front-end sales charge classes. The Board considered that Class T is primarily sold load-waived in the retirement plan market where its 0.50% 12b-1 fee is comparable to competing no-load, higher 12b-1 fee classes designed specifically for retirement plans. The Board noted that the total expense ratio of Class C was above the competitive median because of its 12b-1 fees. The Board noted that the fund offers multiple classes, each of which has a different sales load and 12b-1 fee structure, and that the multiple structures are intended to offer a range of pricing options for the intermediary market. The Board also noted that the total expense ratios of the classes vary primarily by the level of their 12b-1 fees, although differences in transfer agent fees may also cause expenses to vary from class to class.
Fees Charged to Other Fidelity Clients. The Board also considered Fidelity fee structures and other information with respect to clients of Fidelity, such as other funds advised or subadvised by Fidelity, pension plan clients, and other institutional clients with similar mandates. The Board noted that an ad hoc joint committee created by it and the boards of other Fidelity funds periodically (most recently in 2013) reviews and compares Fidelity's institutional investment advisory business with its business of providing services to the Fidelity funds, including the differences in services provided, fees charged, and costs incurred, as well as competition in their respective marketplaces.
Based on its review of total expense ratios and fees charged to other Fidelity clients, the Board concluded that, although some classes were above the median of the universe presented for comparison, the total expense ratio of each class of the fund was reasonable in light of the services that the fund and its shareholders receive and the other factors considered.
Costs of the Services and Profitability. The Board considered the revenues earned and the expenses incurred by Fidelity in conducting the business of developing, marketing, distributing, managing, administering and servicing the fund and servicing the fund's shareholders. The Board also considered the level of Fidelity's profits in respect of all the Fidelity funds.
On an annual basis, Fidelity presents to the Board information about the profitability of its relationships with the fund. Fidelity calculates profitability information for each fund, as well as aggregate profitability information for groups of Fidelity funds and all Fidelity funds, using a series of detailed revenue and cost allocation methodologies which originate with the books and records of Fidelity on which Fidelity's audited financial statements are based. The Audit Committee of the Board reviews any significant changes from the prior year's methodologies.
PricewaterhouseCoopers LLP (PwC), independent registered public accounting firm and auditor to Fidelity and certain Fidelity funds, has been engaged annually by the Board as part of the Board's assessment of Fidelity's profitability analysis. PwC's engagement includes the review and assessment of the methodologies used by Fidelity in determining the revenues and expenses attributable to Fidelity's mutual fund business, and completion of agreed-upon procedures in respect of the mathematical accuracy of the fund profitability information and its conformity to established allocation methodologies. After considering PwC's reports issued under the engagement and information provided by Fidelity, the Board concluded that while other allocation methods may also be reasonable, Fidelity's profitability methodologies are reasonable in all material respects.
The Board also reviewed Fidelity's non-fund businesses and fall-out benefits related to the mutual fund business as well as cases where Fidelity's affiliates may benefit from or be related to the fund's business.
The Board considered the costs of the services provided by and the profits realized by Fidelity in connection with the operation of the fund and was satisfied that the profitability was not excessive.
Economies of Scale. The Board considered whether there have been economies of scale in respect of the management of the Fidelity funds, whether the Fidelity funds (including the fund) have appropriately benefited from any such economies of scale, and whether there is potential for realization of any further economies of scale. The Board considered the extent to which the fund will benefit from economies of scale as assets grow through increased services to the fund, through waivers or reimbursements, or through fee or expense ratio reductions. The Board also noted that a committee (the Economies of Scale Committee) created by it and the boards of other Fidelity funds periodically (most recently in 2013) analyzes whether Fidelity attains economies of scale in respect of the management and servicing of the Fidelity funds, whether the Fidelity funds have appropriately benefited from such economies of scale, and whether there is potential for realization of any further economies of scale.
The Board recognized that the fund's management contract incorporates a "group fee" structure, which provides for lower group fee rates as total group assets increase, and for higher group fee rates as total group assets decrease (with "group assets" defined to include fund assets under FMR's management plus the assets of sector funds previously under FMR's management). FMR calculates the group fee rates based on a tiered asset "breakpoint" schedule that varies based on asset class. The Board considered that the group fee is designed to deliver the benefits of economies of scale to fund shareholders when total Fidelity fund assets increase, even if assets of any particular fund are unchanged or have declined, because some portion of Fidelity's costs are attributable to services provided to all Fidelity funds, and all funds benefit if those costs can be allocated among more assets. The Board concluded that, given the group fee structure, fund shareholders will benefit from lower management fees as group assets increase at the fund complex level, regardless of whether Fidelity achieves any such economies of scale.
The Board concluded, taking into account the analysis of the Economies of Scale Committee, that economies of scale, if any, are being appropriately shared between fund shareholders and Fidelity.
Additional Information Requested by the Board. In order to develop fully the factual basis for consideration of the Fidelity funds' advisory contracts, the Board requested and received additional information on certain topics, including: (i) Fidelity's fund profitability methodology, profitability trends for certain funds, and the impact of certain factors on fund profitability results; (ii) portfolio manager changes that have occurred during the past year and the amount of the investment that each portfolio manager has made in the Fidelity fund(s) that he or she manages; (iii) Fidelity's compensation structure for portfolio managers, research analysts, and other key personnel, including its effects on fund profitability, the rationale for the compensation structure, and the extent to which current market conditions have affected retention and recruitment; (iv) the arrangements with and compensation paid to certain fund sub-advisers on behalf of the Fidelity funds; (v) Fidelity's voluntary waiver of its fees to maintain minimum yields for certain money market funds and classes as well as contractual waivers in place for certain funds; (vi) the methodology with respect to competitive fund data and peer group classifications; (vii) Fidelity's transfer agent fee, expense, and service structures for different funds and classes relative to competitive trends, and the impact of the increased use of omnibus accounts; (viii) Fidelity's long-term expectations for its offerings in the workplace investing channel; (ix) new developments in the retail and institutional marketplaces; (x) the approach to considering "fall-out" benefits; and (xi) the impact of money market reform on Fidelity's money market funds, including with respect to costs and profitability. In addition, the Board considered its discussions with Fidelity throughout the year regarding enhanced information security initiatives and the funds' fair valuation policies.
Based on its evaluation of all of the conclusions noted above, and after considering all factors it believed relevant, the Board concluded that the advisory fee structures are fair and reasonable, and that the fund's Advisory Contracts should be renewed.
Proxy Voting Results
A special meeting of shareholders was held on November 18, 2015. The results of votes taken among shareholders on the proposal before them are reported below. Each vote reported represents one dollar of net asset value held on the record date for the meeting.
PROPOSAL 1
| To elect a Board of Trustees. |
| | # of
Votes | % of
Votes |
| Elizabeth S. Acton | | |
| Affirmative | 14,943,915,330.95 | 96.336 |
| Withheld | 568,375,299.84 | 3.664 |
| TOTAL | 15,512,290,630.79 | 100.000 |
| John Engler | | |
| Affirmative | 14,882,992,640.02 | 95.944 |
| Withheld | 629,297,990.77 | 4.056 |
| TOTAL | 15,512,290,630.79 | 100.000 |
| Albert R. Gamper, Jr. | | |
| Affirmative | 14,876,209,021.25 | 95.900 |
| Withheld | 636,081,609.54 | 4.100 |
| TOTAL | 15,512,290,630.79 | 100.000 |
| Robert F. Gartland | | |
| Affirmative | 14,911,998,079.07 | 96.131 |
| Withheld | 600,292,551.72 | 3.869 |
| TOTAL | 15,512,290,630.79 | 100.000 |
| Abigail P. Johnson | | |
| Affirmative | 14,938,566,748.36 | 96.302 |
| Withheld | 573,723,882.43 | 3.698 |
| TOTAL | 15,512,290,630.79 | 100.000 |
| Arthur E. Johnson | | |
| Affirmative | 14,924,734,316.31 | 96.213 |
| Withheld | 587,556,314.48 | 3.787 |
| TOTAL | 15,512,290,630.79 | 100.000 |
| Michael E. Kenneally | | |
| Affirmative | 14,957,076,322.58 | 96.421 |
| Withheld | 555,214,308.21 | 3.579 |
| TOTAL | 15,512,290,630.79 | 100.000 |
| James H. Keyes | | |
| Affirmative | 14,883,069,701.12 | 95.944 |
| Withheld | 629,220,929.67 | 4.056 |
| TOTAL | 15,512,290,630.79 | 100.000 |
| Marie L. Knowles | | |
| Affirmative | 14,926,474,549.99 | 96.224 |
| Withheld | 585,816,080.80 | 3.776 |
| TOTAL | 15,512,290,630.79 | 100.000 |
| Geoffrey A. von Kuhn | | |
| Affirmative | 14,911,889,870.77 | 96.130 |
| Withheld | 600,400,760.02 | 3.870 |
| TOTAL | 15,512,290,630.79 | 100.000 |
| Proposal 1 reflects trust wide proposal and voting results. |

Corporate Headquarters
245 Summer St.
Boston, MA 02210
www.fidelity.com
GBL-ANN-1216
1.536134.112
Fidelity Advisor® Global Balanced Fund - Class A, Class T, Class C and Class I
Annual Report October 31, 2016 Class A, Class T, Class C and Class I are classes of Fidelity® Global Balanced Fund |
|
Contents
To view a fund's proxy voting guidelines and proxy voting record for the 12-month period ended June 30, visit http://www.fidelity.com/proxyvotingresults or visit the Securities and Exchange Commission's (SEC) web site at http://www.sec.gov.
You may also call 1-877-208-0098 to request a free copy of the proxy voting guidelines.
Standard & Poor's, S&P and S&P 500 are registered service marks of The McGraw-Hill Companies, Inc. and have been licensed for use by Fidelity Distributors Corporation.
Other third-party marks appearing herein are the property of their respective owners.
All other marks appearing herein are registered or unregistered trademarks or service marks of FMR LLC or an affiliated company. © 2016 FMR LLC. All rights reserved.
This report and the financial statements contained herein are submitted for the general information of the shareholders of the Fund. This report is not authorized for distribution to prospective investors in the Fund unless preceded or accompanied by an effective prospectus.
A fund files its complete schedule of portfolio holdings with the SEC for the first and third quarters of each fiscal year on Form N-Q. Forms N-Q are available on the SEC’s web site at http://www.sec.gov. A fund's Forms N-Q may be reviewed and copied at the SEC’s Public Reference Room in Washington, DC. Information regarding the operation of the SEC's Public Reference Room may be obtained by calling 1-800-SEC-0330.
For a complete list of a fund's portfolio holdings, view the most recent holdings listing, semiannual report, or annual report on Fidelity's web site at http://www.fidelity.com, http://www.institutional.fidelity.com, or http://www.401k.com, as applicable.
NOT FDIC INSURED •MAY LOSE VALUE •NO BANK GUARANTEE
Neither the Fund nor Fidelity Distributors Corporation is a bank.
Performance: The Bottom Line
Average annual total return reflects the change in the value of an investment, assuming reinvestment of distributions from dividend income and capital gains (the profits earned upon the sale of securities that have grown in value, if any) and assuming a constant rate of performance each year. The hypothetical investment and the average annual total returns do not reflect the deduction of taxes that a shareholder would pay on fund distributions or the redemption of fund shares. During periods of reimbursement by Fidelity, a fund’s total return will be greater than it would be had the reimbursement not occurred. How a fund did yesterday is no guarantee of how it will do tomorrow.
Average Annual Total Returns
| For the periods ended October 31, 2016 | Past 1 year | Past 5 years | Past 10 years |
| Class A (incl. 5.75% sales charge) | (3.54)% | 3.72% | 3.99% |
| Class T (incl. 3.50% sales charge) | (1.49)% | 3.94% | 4.04% |
| Class C (incl. contingent deferred sales charge) | 0.53% | 4.12% | 3.98% |
| Class I | 2.69% | 5.26% | 4.84% |
Class A shares bear a 0.25% 12b-1 fee. The initial offering of Class A shares took place on February 19, 2009. Returns prior to February 19, 2009, are those of Fidelity® Global Balanced Fund, the original class of the fund, which has no 12b-1 fee. Had Class A's 12b-1 fee been reflected, returns prior to February 19, 2009, would have been lower.
Class T shares bear a 0.50% 12b-1 fee. The initial offering of Class T shares took place on February 19, 2009. Returns prior to February 19, 2009, are those of Fidelity® Global Balanced Fund, the original class of the fund, which has no 12b-1 fee. Had Class T's 12b-1 fee been reflected, returns prior to February 19, 2009, would have been lower.
Class C shares bear a 1.00% 12b-1 fee. The initial offering of Class C shares took place on February 19, 2009. Returns prior to February 19, 2009, are those of Fidelity® Global Balanced Fund, the original class of the fund, which has no 12b-1 fee. Had Class C's 12b-1 fee been reflected, returns prior to February 19, 2009, would have been lower.
Class C shares' contingent deferred sales charges included in the past one year, past five years and past ten years total return figures are 1%, 0% and 0%, respectively.
The initial offering of Class I shares took place on February 19, 2009. Returns prior to February 19, 2009 are those of Fidelity® Global Balanced Fund, the original class of the fund.
$10,000 Over 10 Years
Let's say hypothetically that $10,000 was invested in Fidelity Advisor® Global Balanced Fund - Class A on October 31, 2006, and the current 5.75% sales charge was paid.
The chart shows how the value of your investment would have changed, and also shows how the MSCI World Index performed over the same period.
See previous page for additional information regarding the performance of Class A.
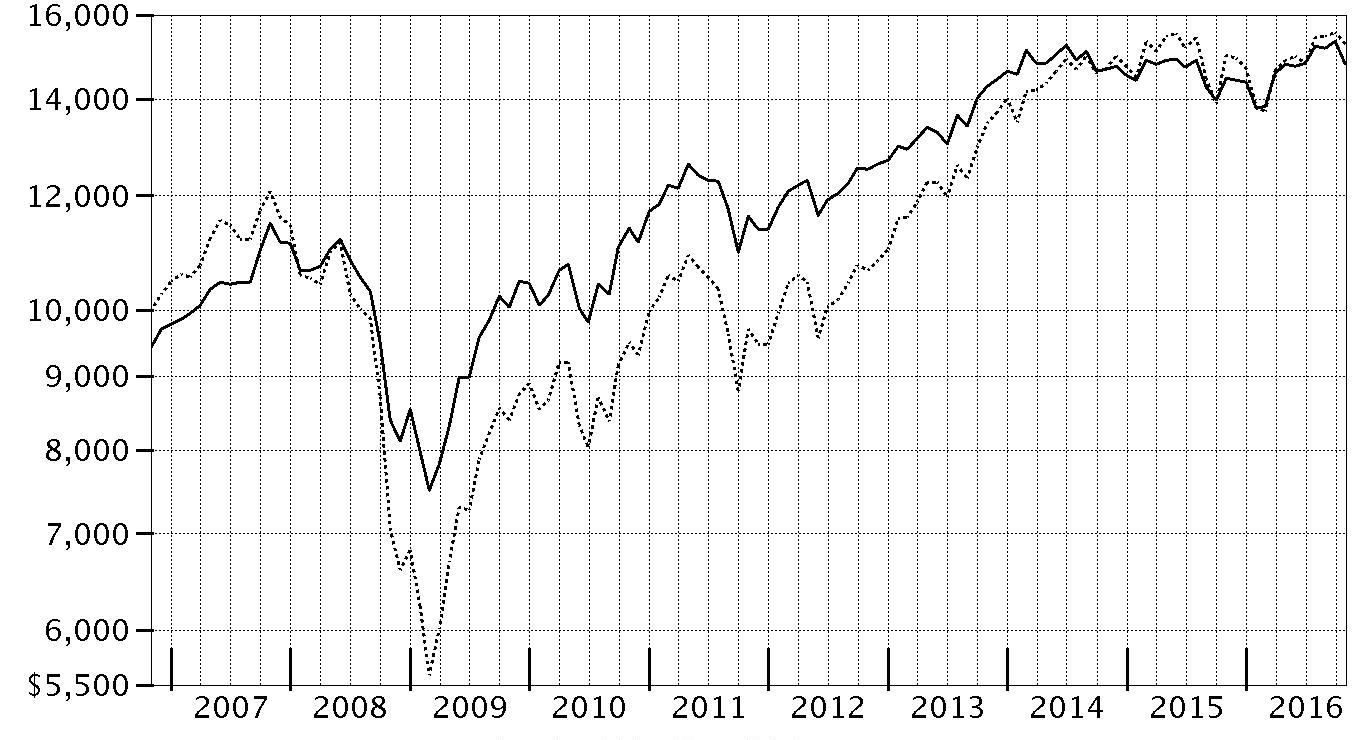
| Period Ending Values |
| $14,794 | Fidelity Advisor® Global Balanced Fund - Class A |
| $15,261 | MSCI World Index |
Management's Discussion of Fund Performance
Market Recap: Global equities, as measured by the MSCI ACWI (All Country World Index) Index, eked a 2.48% gain for the year ending October 31, 2016. After early-2016 volatility largely driven by concern about energy prices and global growth, central banks in Europe, Japan and China took action to reignite their economies; the U.S. Federal Reserve added fuel by softening its rate-hike stance. Stock prices recovered nicely until the U.K.’s June vote to exit the European Union (Brexit) touched off near-tumult in global markets. After a sharp initial rebound, the MSCI index traced a generally upward arc into autumn. Regionally, Canada (+10%) and emerging markets (+9%) benefited from rising commodity prices. Japan (+4%) topped the index but lagged the rest of the Asia Pacific group (+9%). The U.S. (+4%) also outperformed, but Europe (-5%) and the U.K. (-11%) were beset by Brexit stress. Global taxable investment-grade bonds rose 4.72% overall, according to the Bloomberg Barclays Global Aggregate GDP Weighted Index, propelled largely by a strong first half of the period and continued demand for fixed income in a low-yield environment. By segment, corporate bonds outperformed the market, as did local-authority and sovereign debt, while securitized sectors lagged. Regionally, Japan led the market higher, while the U.K. fell markedly. Outside the index, high-yield emerging-markets debt was particularly strong.
Comments from Lead Portfolio Manager Geoff Stein: For the year, the fund’s share classes (excluding sales charges, if applicable) posted low-single-digit gains, trailing the 3.54% return of the Fidelity Global Balanced Composite Index. Security selection as a whole had a net neutral impact versus the Composite index. Beneficial stock picks in Europe and Japan, along with selections in investment-grade bonds, offset disappointing U.S. stock selection. Asset allocation modestly contributed, led by an overweighting in Canadian equities during the first half of the period. The manager of the U.S. equity subportfolio was hurt by underexposure to income-oriented sectors in the Composite index, such as utilities and consumer staples, which generated some of the strongest returns. The European equity subportfolio was bolstered by broadly positive contributions across various countries, most notably Germany, Denmark and Sweden. Within investment-grade bonds, a variety of U.S. and foreign-government securities contributed most, led by Japanese government bonds, U.S. Treasuries and Treasury Inflation-Protected Securities, or TIPS.
The views expressed above reflect those of the portfolio manager(s) only through the end of the period as stated on the cover of this report and do not necessarily represent the views of Fidelity or any other person in the Fidelity organization. Any such views are subject to change at any time based upon market or other conditions and Fidelity disclaims any responsibility to update such views. These views may not be relied on as investment advice and, because investment decisions for a Fidelity fund are based on numerous factors, may not be relied on as an indication of trading intent on behalf of any Fidelity fund.
Note to shareholders: John Dance and David Simner became Co-Portfolio Managers of the fund during the period. John Lo, Maria Nikishkova and Andy Weir are no longer serving as Co-Managers.
Investment Summary (Unaudited)
The information in the following tables is based on the combined investments of the Fund and its pro-rata share of the investments of Fidelity's Central Funds, other than the Commodity Strategy and Money Market Central Funds.
Geographic Diversification (% of fund's net assets)
| As of October 31, 2016 |
| | United States of America* | 46.2% |
| | Japan | 12.4% |
| | United Kingdom | 6.0% |
| | Germany | 4.9% |
| | Netherlands | 4.0% |
| | Canada | 3.4% |
| | France | 3.2% |
| | Ireland | 3.1% |
| | Italy | 1.8% |
| | Other | 15.0% |

* Includes Short-Term investments and Net Other Assets (Liabilities).
Percentages are based on country or territory of incorporation and are adjusted for the effect of futures contracts, if applicable.
| As of April 30, 2016 |
| | United States of America* | 50.8% |
| | Japan | 12.1% |
| | United Kingdom | 5.6% |
| | Canada | 4.4% |
| | Germany | 3.7% |
| | Netherlands | 3.2% |
| | Spain | 3.2% |
| | Italy | 2.6% |
| | Sweden | 2.1% |
| | Other | 12.3% |

* Includes Short-Term investments and Net Other Assets (Liabilities).
Percentages are based on country or territory of incorporation and are adjusted for the effect of futures contracts, if applicable.
Asset Allocation as of October 31, 2016
| | % of fund's net assets | % of fund's net assets 6 months ago |
| Stocks | 58.4(a) | 58.8(b) |
| Bonds | 35.2 | 31.9 |
| Other Investments | 3.8 | 4.0 |
| Short-Term Investments and Net Other Assets (Liabilities) | 2.6 | 5.3 |
(a) Includes investment in Fidelity® Commodity Strategy Central Fund of 0.8%
(b) Includes investment in Fidelity® Commodity Strategy Central Fund of 1.1%
Top Five Stocks as of October 31, 2016
| | % of fund's net assets | % of fund's net assets 6 months ago |
| Alphabet, Inc. Class A (United States of America) | 2.1 | 1.8 |
| Adobe Systems, Inc. (United States of America) | 2.0 | 1.8 |
| S&P Global, Inc. (United States of America) | 1.9 | 1.1 |
| Apple, Inc. (United States of America) | 1.4 | 0.0 |
| Amazon.com, Inc. (United States of America) | 1.4 | 0.8 |
| | 8.8 | |
Top Five Bond Issuers as of October 31, 2016
| (with maturities greater than one year) | % of fund's net assets | % of fund's net assets 6 months ago |
| Japan Government | 9.0 | 7.6 |
| U.S. Treasury Obligations | 8.9 | 4.3 |
| Dutch Government | 1.6 | 2.1 |
| United Kingdom, Great Britain and Northern Ireland | 1.0 | 0.9 |
| Spanish Kingdom | 1.0 | 2.8 |
| | 21.5 | |
Top Market Sectors as of October 31, 2016
| | % of fund's net assets | % of fund's net assets 6 months ago |
| Financials | 19.4 | 16.0 |
| Information Technology | 15.5 | 11.5 |
| Industrials | 7.2 | 9.2 |
| Consumer Discretionary | 7.2 | 8.3 |
| Health Care | 6.4 | 8.0 |
| Energy | 4.1 | 3.4 |
| Consumer Staples | 4.0 | 5.5 |
| Real Estate | 1.7 | 0.0 |
| Materials | 1.4 | 2.5 |
| Utilities | 1.2 | 0.5 |
Prior period industry classifications reflect the categories in place as of the date indicated and have not been adjusted to reflect current industry classifications.
An unaudited holdings listing for the Fund, which presents direct holdings as well as the pro-rata share of any securities and other investments held indirectly through its investment in underlying Fidelity Central Funds, other than the Commodity Strategy and Money Market Central Funds, is available at fidelity.com and/or institutional.fidelity.com, as applicable.
Percentages shown as 0.0% may reflect amounts less than 0.05%.
Investments October 31, 2016
Showing Percentage of Net Assets
| Common Stocks - 56.2% | | | |
| | | Shares | Value |
| Australia - 1.6% | | | |
| Abacus Property Group unit | | 82,842 | $176,450 |
| Aconex Ltd. (a) | | 37,422 | 158,276 |
| ALS Ltd. | | 34,115 | 161,676 |
| Amcor Ltd. | | 29,438 | 329,184 |
| Arena (REIT) unit | | 154,609 | 227,577 |
| Asaleo Care Ltd. | | 186,334 | 206,947 |
| Aub Group Ltd. | | 28,929 | 217,862 |
| Australia & New Zealand Banking Group Ltd. | | 37,254 | 789,244 |
| Bapcor Ltd. | | 67,442 | 263,185 |
| Beacon Lighting Group Ltd. | | 223,190 | 287,778 |
| BHP Billiton Ltd. | | 21,292 | 371,989 |
| Blue Sky Alternative Investments Ltd. | | 37,721 | 208,895 |
| Coca-Cola Amatil Ltd. | | 31,911 | 231,581 |
| Commonwealth Bank of Australia | | 20,345 | 1,135,816 |
| Corporate Travel Managemnt Ltd. | | 14,544 | 210,209 |
| CSL Ltd. | | 8,513 | 650,887 |
| Hansen Technologies Ltd. | | 82,376 | 257,547 |
| HUB24 Ltd. (a) | | 42,001 | 169,336 |
| Magellan Financial Group Ltd. | | 17,940 | 290,544 |
| McMillan Shakespeare Ltd. | | 10,918 | 89,947 |
| NIB Holdings Ltd. | | 80,499 | 295,156 |
| realestate.com.au Ltd. | | 6,424 | 249,908 |
| Reliance Worldwide Corp. Ltd. | | 85,463 | 192,435 |
| Sydney Airport unit | | 65,232 | 310,634 |
| Vita Group Ltd. | | 52,328 | 162,806 |
| Woodside Petroleum Ltd. | | 16,191 | 349,419 |
|
| TOTAL AUSTRALIA | | | 7,995,288 |
|
| Bailiwick of Jersey - 0.6% | | | |
| Randgold Resources Ltd. | | 1,202 | 106,746 |
| Shire PLC | | 34,900 | 1,970,548 |
| Wizz Air Holdings PLC (a) | | 7,000 | 129,462 |
| Wolseley PLC | | 14,542 | 756,653 |
|
| TOTAL BAILIWICK OF JERSEY | | | 2,963,409 |
|
| Bermuda - 1.4% | | | |
| Credicorp Ltd. (United States) | | 1,200 | 178,416 |
| Dairy Farm International Holdings Ltd. | | 46,400 | 328,048 |
| Hongkong Land Holdings Ltd. | | 51,500 | 345,050 |
| IHS Markit Ltd. (a) | | 103,800 | 3,818,802 |
| PAX Global Technology Ltd. | | 194,000 | 121,320 |
| Vostok Emerging Finance Ltd. (depository receipt) (a) | | 3,274,986 | 536,636 |
| Vostok New Ventures Ltd. SDR (a) | | 239,261 | 1,794,693 |
|
| TOTAL BERMUDA | | | 7,122,965 |
|
| Canada - 2.8% | | | |
| Agnico Eagle Mines Ltd. (Canada) | | 3,650 | 185,371 |
| Agrium, Inc. | | 2,410 | 221,236 |
| AGT Food & Ingredients, Inc. | | 900 | 25,592 |
| Alimentation Couche-Tard, Inc. Class B (sub. vtg.) | | 5,150 | 258,709 |
| Allied Properties (REIT) | | 3,370 | 90,600 |
| ARC Resources Ltd. | | 6,850 | 116,286 |
| AutoCanada, Inc. | | 2,150 | 35,344 |
| Bank of Nova Scotia | | 6,280 | 337,480 |
| Barrick Gold Corp. | | 3,100 | 54,544 |
| Brookfield Asset Management, Inc. Class A | | 1,700 | 59,531 |
| Canadian Energy Services & Technology Corp. | | 14,740 | 58,134 |
| Canadian National Railway Co. | | 9,710 | 610,413 |
| Canadian Natural Resources Ltd. | | 7,020 | 222,800 |
| CCL Industries, Inc. Class B | | 580 | 103,149 |
| Cenovus Energy, Inc. | | 13,590 | 196,053 |
| CGI Group, Inc. Class A (sub. vtg.) (a) | | 3,980 | 189,045 |
| Cogeco Communications, Inc. | | 1,600 | 74,626 |
| Constellation Software, Inc. | | 330 | 154,593 |
| Corus Entertainment, Inc. Class B (non-vtg.) | | 4,900 | 40,441 |
| Detour Gold Corp. (a) | | 4,660 | 88,836 |
| Element Financial Corp. | | 6,400 | 62,363 |
| Empire Co. Ltd. Class A (non-vtg.) | | 1,900 | 27,367 |
| Enbridge, Inc. | | 10,620 | 458,593 |
| Fairfax Financial Holdings Ltd. (sub. vtg.) | | 250 | 128,038 |
| Franco-Nevada Corp. | | 2,520 | 164,938 |
| George Weston Ltd. | | 2,520 | 205,350 |
| Hydro One Ltd. | | 4,240 | 77,352 |
| Imperial Oil Ltd. | | 4,660 | 151,130 |
| Intact Financial Corp. | | 2,610 | 177,425 |
| Jean Coutu Group, Inc. Class A (sub. vtg.) | | 3,280 | 49,397 |
| Keyera Corp. | | 1,746 | 52,407 |
| Labrador Iron Ore Royalty Corp. | | 4,760 | 52,132 |
| Lundin Mining Corp. (a) | | 19,260 | 75,386 |
| Magna International, Inc. Class A (sub. vtg.) | | 520 | 21,350 |
| Metro, Inc. Class A (sub. vtg.) | | 1,100 | 34,001 |
| North West Co., Inc. | | 2,880 | 54,968 |
| NuVista Energy Ltd. (a) | | 7,000 | 35,592 |
| Open Text Corp. | | 2,310 | 143,426 |
| Painted Pony Petroleum Ltd. (a) | | 6,280 | 38,486 |
| Parkland Fuel Corp. | | 3,090 | 72,176 |
| Pason Systems, Inc. | | 3,100 | 35,246 |
| Peyto Exploration & Development Corp. | | 3,600 | 92,489 |
| Power Corp. of Canada (sub. vtg.) | | 9,970 | 213,850 |
| PrairieSky Royalty Ltd. (b) | | 177,858 | 3,867,977 |
| Quebecor, Inc. Class B (sub. vtg.) | | 3,180 | 89,238 |
| Raging River Exploration, Inc. (a) | | 7,170 | 57,465 |
| Rogers Communications, Inc. Class B (non-vtg.) | | 10,170 | 409,135 |
| Royal Bank of Canada | | 17,080 | 1,067,102 |
| Shopify, Inc. Class A (a) | | 2,700 | 111,915 |
| Silver Wheaton Corp. | | 6,190 | 149,154 |
| Sleep Country Canada Holdings, Inc. | | 1,500 | 31,883 |
| Spartan Energy Corp. (a) | | 18,480 | 42,986 |
| Stantec, Inc. | | 2,970 | 66,074 |
| Sun Life Financial, Inc. | | 12,080 | 404,288 |
| Suncor Energy, Inc. | | 20,132 | 604,125 |
| Tahoe Resources, Inc. | | 6,960 | 83,439 |
| Teck Resources Ltd. Class B (sub. vtg.) | | 2,620 | 56,568 |
| TELUS Corp. | | 10,460 | 338,685 |
| The Toronto-Dominion Bank | | 21,920 | 994,596 |
| TMX Group Ltd. | | 1,300 | 59,984 |
| Torex Gold Resources, Inc. (a) | | 2,682 | 49,889 |
| Toromont Industries Ltd. | | 1,700 | 49,937 |
| TransForce, Inc. | | 2,650 | 60,120 |
| Western Forest Products, Inc. | | 41,500 | 63,118 |
| WestJet Airlines Ltd. | | 3,280 | 53,676 |
| Whitecap Resources, Inc. | | 8,130 | 64,977 |
| ZCL Composites, Inc. | | 3,760 | 32,770 |
|
| TOTAL CANADA | | | 14,355,346 |
|
| Cayman Islands - 0.7% | | | |
| Alibaba Group Holding Ltd. sponsored ADR (a) | | 21,300 | 2,165,997 |
| CK Hutchison Holdings Ltd. | | 45,500 | 562,916 |
| International Housewares Retail Co. Ltd. | | 981,000 | 196,060 |
| Tencent Holdings Ltd. | | 27,600 | 731,465 |
|
| TOTAL CAYMAN ISLANDS | | | 3,656,438 |
|
| China - 0.0% | | | |
| Shenzhen Expressway Co. (H Shares) | | 168,000 | 168,746 |
| Denmark - 0.4% | | | |
| DONG Energy A/S | | 3,075 | 121,942 |
| Nets A/S (c) | | 54,000 | 1,031,258 |
| Scandinavian Tobacco Group A/S | | 43,630 | 755,306 |
|
| TOTAL DENMARK | | | 1,908,506 |
|
| Finland - 0.2% | | | |
| Valmet Corp. | | 58,800 | 873,330 |
| France - 1.1% | | | |
| Amundi SA | | 1,100 | 53,910 |
| Bollore Group | | 189,040 | 622,556 |
| Capgemini SA | | 12,500 | 1,035,727 |
| Havas SA | | 156,700 | 1,274,821 |
| Publicis Groupe SA | | 8,139 | 558,412 |
| Rubis | | 11,100 | 1,012,332 |
| Wendel SA | | 9,300 | 1,069,911 |
|
| TOTAL FRANCE | | | 5,627,669 |
|
| Germany - 2.7% | | | |
| adidas AG | | 28,500 | 4,682,378 |
| Bertrandt AG | | 2,500 | 266,342 |
| Brenntag AG | | 22,500 | 1,202,736 |
| CompuGroup Medical AG | | 20,100 | 889,872 |
| CTS Eventim AG | | 20,299 | 729,330 |
| EDAG Engineering Group AG | | 13,000 | 214,061 |
| Fresenius Medical Care AG & Co. KGaA | | 8,000 | 651,633 |
| Fresenius SE & Co. KGaA | | 11,300 | 834,084 |
| GEA Group AG | | 22,152 | 856,579 |
| LEG Immobilien AG | | 7,080 | 597,206 |
| SAP AG | | 31,567 | 2,781,035 |
|
| TOTAL GERMANY | | | 13,705,256 |
|
| Hong Kong - 0.4% | | | |
| AIA Group Ltd. | | 166,800 | 1,052,776 |
| Hang Seng Bank Ltd. | | 23,500 | 424,515 |
| Power Assets Holdings Ltd. | | 58,500 | 550,261 |
|
| TOTAL HONG KONG | | | 2,027,552 |
|
| India - 0.3% | | | |
| HDFC Bank Ltd. | | 35,000 | 782,111 |
| HDFC Bank Ltd. sponsored ADR | | 7,000 | 495,460 |
| Housing Development Finance Corp. Ltd. | | 6,000 | 125,180 |
|
| TOTAL INDIA | | | 1,402,751 |
|
| Ireland - 2.1% | | | |
| Accenture PLC Class A | | 33,500 | 3,894,040 |
| Alkermes PLC (a) | | 48,900 | 2,465,049 |
| CRH PLC | | 1,500 | 48,696 |
| DCC PLC (United Kingdom) | | 13,000 | 1,060,535 |
| Medtronic PLC | | 25,000 | 2,050,500 |
| Ryanair Holdings PLC sponsored ADR | | 8,582 | 644,422 |
| United Drug PLC (United Kingdom) | | 82,217 | 657,641 |
|
| TOTAL IRELAND | | | 10,820,883 |
|
| Isle of Man - 0.4% | | | |
| Paysafe Group PLC (a) | | 296,633 | 1,572,131 |
| Playtech Ltd. | | 58,566 | 665,235 |
|
| TOTAL ISLE OF MAN | | | 2,237,366 |
|
| Israel - 0.1% | | | |
| Sarine Technologies Ltd. | | 199,200 | 233,384 |
| Teva Pharmaceutical Industries Ltd. sponsored ADR | | 970 | 41,458 |
|
| TOTAL ISRAEL | | | 274,842 |
|
| Italy - 0.1% | | | |
| Prada SpA | | 196,900 | 690,561 |
| Japan - 3.4% | | | |
| Asahi Group Holdings | | 13,300 | 475,716 |
| Astellas Pharma, Inc. | | 43,300 | 642,653 |
| Daikin Industries Ltd. | | 4,400 | 422,924 |
| Daito Trust Construction Co. Ltd. | | 2,900 | 486,006 |
| Dentsu, Inc. | | 5,000 | 249,833 |
| East Japan Railway Co. | | 5,200 | 459,010 |
| Eiken Chemical Co. Ltd. | | 5,800 | 158,730 |
| Fuji Heavy Industries Ltd. | | 14,700 | 573,871 |
| Hoya Corp. | | 10,300 | 430,681 |
| Japan Meat Co. Ltd. | | 18,100 | 254,922 |
| Japan Tobacco, Inc. | | 16,700 | 636,024 |
| Kakaku.com, Inc. | | 26,500 | 446,005 |
| Kaken Pharmaceutical Co. Ltd. | | 3,100 | 195,690 |
| Kao Corp. | | 7,400 | 381,396 |
| Keyence Corp. | | 700 | 514,370 |
| Kubota Corp. | | 24,800 | 400,721 |
| Kyudenko Corp. | | 6,400 | 206,580 |
| Kyushu Railway Co. | | 7,500 | 220,988 |
| Misumi Group, Inc. | | 22,800 | 416,779 |
| Mitsubishi Pencil Co. Ltd. | | 5,800 | 290,913 |
| Mitsui Fudosan Co. Ltd. | | 15,000 | 341,923 |
| Nakanishi, Inc. | | 8,460 | 302,921 |
| Nidec Corp. | | 5,400 | 523,677 |
| Nihon Parkerizing Co. Ltd. | | 25,000 | 345,666 |
| Nintendo Co. Ltd. | | 2,000 | 482,120 |
| Nitori Holdings Co. Ltd. | | 3,700 | 443,492 |
| NTT DOCOMO, Inc. | | 25,300 | 635,384 |
| Olympus Corp. | | 6,500 | 232,431 |
| Open House Co. Ltd. | | 11,700 | 248,013 |
| ORIX Corp. | | 22,800 | 362,100 |
| Panasonic Corp. | | 30,000 | 309,476 |
| PeptiDream, Inc. (a) | | 1,500 | 77,525 |
| Rakuten, Inc. | | 31,900 | 368,826 |
| Seven Bank Ltd. | | 108,200 | 333,256 |
| SHIMANO, Inc. | | 1,500 | 256,889 |
| Shionogi & Co. Ltd. | | 6,600 | 325,878 |
| SK Kaken Co. Ltd. | | 3,300 | 343,940 |
| SMS Co., Ltd. | | 4,300 | 112,390 |
| SoftBank Corp. | | 10,200 | 642,407 |
| Start Today Co. Ltd. | | 22,800 | 400,908 |
| Sundrug Co. Ltd. | | 3,900 | 307,552 |
| Sysmex Corp. | | 4,600 | 319,767 |
| The Suruga Bank Ltd. | | 17,800 | 435,368 |
| Tokyo Century Corp. | | 6,500 | 229,641 |
| Tokyu Fudosan Holdings Corp. | | 40,500 | 229,012 |
| Toshiba Plant Systems & Services Corp. | | 22,400 | 362,048 |
| Tsuruha Holdings, Inc. | | 3,600 | 416,058 |
| Welcia Holdings Co. Ltd. | | 6,000 | 410,222 |
|
| TOTAL JAPAN | | | 17,662,702 |
|
| Korea (South) - 0.0% | | | |
| Samsung Biologics Co. Ltd. (a)(d) | | 819 | 97,384 |
| Luxembourg - 0.0% | | | |
| Samsonite International SA | | 69,600 | 218,971 |
| Malta - 0.2% | | | |
| Kambi Group PLC (a) | | 52,200 | 775,878 |
| Netherlands - 1.1% | | | |
| CSM NV (exchangeable) | | 36,400 | 839,919 |
| Intertrust NV | | 31,900 | 673,050 |
| Koninklijke Philips Electronics NV | | 78,600 | 2,368,388 |
| Koninklijke Wessanen NV | | 48,500 | 579,527 |
| NXP Semiconductors NV (a) | | 3,000 | 300,000 |
| Wolters Kluwer NV | | 19,700 | 762,413 |
|
| TOTAL NETHERLANDS | | | 5,523,297 |
|
| New Zealand - 0.1% | | | |
| Chorus Ltd. | | 43,329 | 113,249 |
| Ryman Healthcare Group Ltd. | | 35,724 | 226,851 |
|
| TOTAL NEW ZEALAND | | | 340,100 |
|
| Norway - 0.3% | | | |
| Schibsted ASA (A Shares) | | 22,800 | 546,658 |
| TGS Nopec Geophysical Co. ASA | | 46,600 | 944,707 |
|
| TOTAL NORWAY | | | 1,491,365 |
|
| Singapore - 0.4% | | | |
| Broadcom Ltd. | | 10,000 | 1,702,800 |
| Sheng Siong Group Ltd. | | 345,900 | 259,813 |
| UOL Group Ltd. | | 52,600 | 214,370 |
|
| TOTAL SINGAPORE | | | 2,176,983 |
|
| South Africa - 0.1% | | | |
| Naspers Ltd. Class N | | 4,000 | 670,407 |
| Spain - 0.2% | | | |
| Amadeus IT Holding SA Class A | | 19,500 | 920,463 |
| Sweden - 1.9% | | | |
| AF AB (B Shares) | | 7,600 | 139,258 |
| Dometic Group AB | | 108,600 | 768,315 |
| Getinge AB (B Shares) | | 110,600 | 1,812,282 |
| Hemfosa Fastigheter AB | | 74,200 | 698,283 |
| Indutrade AB | | 49,500 | 920,163 |
| Investor AB (B Shares) | | 40,254 | 1,431,061 |
| Lundbergfoeretagen AB | | 5,000 | 323,843 |
| Nobia AB | | 35,900 | 312,808 |
| Nordea Bank AB | | 55,400 | 582,390 |
| Pandox AB | | 40,600 | 643,692 |
| Svenska Cellulosa AB (SCA) (B Shares) | | 50,300 | 1,425,106 |
| Svenska Handelsbanken AB (A Shares) | | 37,400 | 509,879 |
|
| TOTAL SWEDEN | | | 9,567,080 |
|
| Switzerland - 1.0% | | | |
| ABB Ltd. (Reg.) | | 53,120 | 1,095,888 |
| Nestle SA (Reg. S) | | 40,876 | 2,964,079 |
| Panalpina Welttransport Holding AG | | 8,530 | 1,107,680 |
|
| TOTAL SWITZERLAND | | | 5,167,647 |
|
| United Kingdom - 2.5% | | | |
| Bunzl PLC | | 25,485 | 685,948 |
| CMC Markets PLC | | 178,354 | 414,343 |
| Dechra Pharmaceuticals PLC | | 53,900 | 887,345 |
| Dialog Semiconductor PLC (a) | | 800 | 31,396 |
| Diploma PLC | | 71,200 | 817,020 |
| Essentra PLC | | 113,000 | 705,391 |
| Imperial Tobacco Group PLC | | 1,269 | 61,439 |
| International Personal Finance PLC | | 273,900 | 987,322 |
| Micro Focus International PLC | | 41,400 | 1,084,922 |
| NCC Group Ltd. | | 327,300 | 759,166 |
| Prudential PLC | | 80,385 | 1,311,792 |
| Saga PLC | | 172,800 | 419,630 |
| Shawbrook Group PLC (a) | | 152,813 | 420,473 |
| Softcat PLC | | 175,500 | 695,991 |
| St. James's Place Capital PLC | | 31,620 | 365,742 |
| Standard Chartered PLC (United Kingdom) | | 172,868 | 1,506,312 |
| William Hill PLC | | 458,149 | 1,658,771 |
|
| TOTAL UNITED KINGDOM | | | 12,813,003 |
|
| United States of America - 30.1% | | | |
| Activision Blizzard, Inc. | | 68,900 | 2,974,413 |
| Acuity Brands, Inc. | | 2,300 | 514,211 |
| Adobe Systems, Inc. (a) | | 96,700 | 10,396,217 |
| Allison Transmission Holdings, Inc. | | 34,300 | 1,004,647 |
| Alphabet, Inc. Class A | | 13,400 | 10,852,660 |
| Amazon.com, Inc. (a) | | 9,100 | 7,187,362 |
| American Tower Corp. | | 52,000 | 6,093,880 |
| Amgen, Inc. | | 10,400 | 1,468,064 |
| Amphenol Corp. Class A | | 20,000 | 1,318,600 |
| Apple, Inc. | | 64,000 | 7,266,560 |
| Arch Coal, Inc. (a) | | 14,000 | 1,027,320 |
| AutoZone, Inc. (a) | | 4,600 | 3,413,936 |
| Ball Corp. | | 30,300 | 2,335,221 |
| Boston Scientific Corp. (a) | | 196,000 | 4,312,000 |
| Caterpillar, Inc. | | 19,000 | 1,585,740 |
| CBOE Holdings, Inc. | | 9,000 | 568,890 |
| Charter Communications, Inc. Class A (a) | | 5,300 | 1,324,417 |
| CME Group, Inc. | | 32,000 | 3,203,200 |
| Constellation Brands, Inc. Class A (sub. vtg.) | | 22,000 | 3,676,640 |
| Dollar Tree, Inc. (a) | | 5,000 | 377,750 |
| Ecolab, Inc. | | 5,000 | 570,850 |
| Electronic Arts, Inc. (a) | | 31,500 | 2,473,380 |
| EOG Resources, Inc. | | 52,000 | 4,701,840 |
| Equifax, Inc. | | 6,300 | 781,011 |
| Estee Lauder Companies, Inc. Class A | | 10,600 | 923,578 |
| Facebook, Inc. Class A (a) | | 34,800 | 4,558,452 |
| Fidelity National Information Services, Inc. | | 6,000 | 443,520 |
| FleetCor Technologies, Inc. (a) | | 1,000 | 175,300 |
| Global Payments, Inc. | | 21,000 | 1,522,920 |
| Illumina, Inc. (a) | | 2,000 | 272,280 |
| Intercept Pharmaceuticals, Inc. (a) | | 12,100 | 1,497,254 |
| Kansas City Southern | | 27,000 | 2,369,520 |
| Legg Mason, Inc. | | 32,000 | 919,040 |
| Liberty Interactive Corp. QVC Group Series A (a) | | 7,000 | 129,430 |
| lululemon athletica, Inc. (a) | | 5,600 | 320,600 |
| MasterCard, Inc. Class A | | 7,800 | 834,756 |
| Microsoft Corp. | | 83,000 | 4,973,360 |
| Molson Coors Brewing Co. Class B | | 36,870 | 3,827,475 |
| Monsanto Co. | | 410 | 41,316 |
| Moody's Corp. | | 5,500 | 552,860 |
| MSCI, Inc. | | 70,500 | 5,653,395 |
| Newell Brands, Inc. | | 49,000 | 2,352,980 |
| Norfolk Southern Corp. | | 13,000 | 1,209,000 |
| Northrop Grumman Corp. | | 14,600 | 3,343,400 |
| NVIDIA Corp. | | 28,200 | 2,006,712 |
| O'Reilly Automotive, Inc. (a) | | 3,200 | 846,208 |
| Parsley Energy, Inc. Class A (a) | | 13,600 | 447,440 |
| PayPal Holdings, Inc. (a) | | 37,000 | 1,541,420 |
| Pioneer Natural Resources Co. | | 9,000 | 1,611,180 |
| Post Holdings, Inc. (a) | | 2,200 | 167,706 |
| Prestige Brands Holdings, Inc. (a) | | 55,500 | 2,513,040 |
| Range Resources Corp. | | 55,000 | 1,858,450 |
| Raytheon Co. | | 4,500 | 614,745 |
| ResMed, Inc. CDI | | 50,046 | 298,469 |
| S&P Global, Inc. | | 79,600 | 9,699,260 |
| Salesforce.com, Inc. (a) | | 6,800 | 511,088 |
| SLM Corp. (a) | | 43,000 | 303,150 |
| SM Energy Co. | | 14,000 | 470,820 |
| Spectrum Brands Holdings, Inc. | | 2,500 | 338,100 |
| SunTrust Banks, Inc. | | 22,000 | 995,060 |
| SVB Financial Group (a) | | 4,000 | 489,080 |
| T-Mobile U.S., Inc. (a) | | 8,000 | 397,840 |
| The NASDAQ OMX Group, Inc. | | 21,000 | 1,343,370 |
| Titan International, Inc. | | 39,000 | 397,410 |
| U.S. Silica Holdings, Inc. | | 4,000 | 184,760 |
| Union Pacific Corp. | | 9,000 | 793,620 |
| UnitedHealth Group, Inc. | | 9,900 | 1,399,167 |
| Visa, Inc. Class A | | 46,000 | 3,795,460 |
| Wells Fargo & Co. | | 64,000 | 2,944,640 |
| Wynn Resorts Ltd. | | 5,300 | 501,115 |
| Xylem, Inc. | | 45,000 | 2,174,850 |
| Zimmer Biomet Holdings, Inc. | | 3,000 | 316,200 |
|
| TOTAL UNITED STATES OF AMERICA | | | 154,309,605 |
|
| TOTAL COMMON STOCKS | | | |
| (Cost $255,542,196) | | | 287,565,793 |
|
| Nonconvertible Preferred Stocks - 0.3% | | | |
| Brazil - 0.3% | | | |
| Petroleo Brasileiro SA - Petrobras sponsored ADR (a) | | | |
| (Cost $1,096,722) | | 116,000 | 1,353,720 |
|
| Investment Companies - 3.6% | | | |
| United States of America - 3.6% | | | |
| iShares Barclays TIPS Bond ETF | | | |
| (Cost $17,930,597) | | 161,200 | 18,676,632 |
| | | Principal Amount(e) | Value |
|
| Nonconvertible Bonds - 10.4% | | | |
| Bailiwick of Guernsey - 0.2% | | | |
| Credit Suisse Group Funding Guernsey Ltd. 2.75% 8/8/25 (Reg. S) | GBP | 1,000,000 | 1,170,953 |
| Bailiwick of Jersey - 0.9% | | | |
| AA Bond Co. Ltd.: | | | |
| 3.781% 7/31/43 (Reg S.) | GBP | 500,000 | 637,952 |
| 4.7201% 7/31/18 (Reg. S) | GBP | 600,000 | 769,785 |
| UBS Group Funding Ltd.: | | | |
| 1.25% 9/1/26 (Reg. S) | EUR | 200,000 | 215,308 |
| 2.65% 2/1/22 (c) | | 3,000,000 | 2,989,227 |
|
| TOTAL BAILIWICK OF JERSEY | | | 4,612,272 |
|
| Belgium - 0.5% | | | |
| KBC Groep NV 2.375% 11/25/24 (Reg. S) (f) | EUR | 2,300,000 | 2,618,294 |
| France - 1.2% | | | |
| BPCE SA 2.75% 11/30/27 (Reg. S) (f) | EUR | 1,300,000 | 1,483,987 |
| CNP Assurances 1.875% 10/20/22 (Reg. S) | EUR | 800,000 | 887,658 |
| EDF SA 1.875% 10/13/36 (Reg. S) | EUR | 1,100,000 | 1,149,955 |
| SCOR SE 3% 6/8/46 (Reg. S) (f) | EUR | 1,200,000 | 1,346,017 |
| Wendel SA 1% 4/20/23 (Reg. S) | EUR | 1,200,000 | 1,311,040 |
|
| TOTAL FRANCE | | | 6,178,657 |
|
| Germany - 0.3% | | | |
| EnBW Energie Baden-Wuerttemberg AG 3.375% 4/5/77 (f) | EUR | 1,125,000 | 1,241,279 |
| Ireland - 0.5% | | | |
| Shire Acquisitions Investments Ireland DAC 2.4% 9/23/21 | | 2,500,000 | 2,481,588 |
| Italy - 0.8% | | | |
| Assicurazioni Generali SpA 7.75% 12/12/42 (f) | EUR | 1,400,000 | 1,813,483 |
| Intesa Sanpaolo SpA 1.125% 3/4/22 | EUR | 2,250,000 | 2,483,162 |
|
| TOTAL ITALY | | | 4,296,645 |
|
| Netherlands - 1.3% | | | |
| ABN AMRO Bank NV 2.875% 6/30/25 (Reg. S) (f) | EUR | 1,550,000 | 1,794,075 |
| EDP Finance BV 1.125% 2/12/24 (Reg. S) | EUR | 800,000 | 856,631 |
| Rabobank Nederland 6.875% 3/19/20 (Reg. S) | EUR | 1,850,000 | 2,393,831 |
| Teva Pharmaceutical Finance Netherlands III BV: | | | |
| 3.15% 10/1/26 | | 750,000 | 729,871 |
| 4.1% 10/1/46 | | 1,000,000 | 929,234 |
|
| TOTAL NETHERLANDS | | | 6,703,642 |
|
| Switzerland - 0.6% | | | |
| Credit Suisse Group AG 5.75% 9/18/25 (Reg. S) (f) | EUR | 1,525,000 | 1,820,901 |
| Zurich Insurance Co. Ltd. 3.5% 10/1/46 (f) | EUR | 1,000,000 | 1,134,850 |
|
| TOTAL SWITZERLAND | | | 2,955,751 |
|
| United Kingdom - 2.5% | | | |
| Barclays PLC 3.2% 8/10/21 | | 2,500,000 | 2,517,200 |
| Direct Line Insurance Group PLC 9.25% 4/27/42 (f) | GBP | 725,000 | 1,076,521 |
| HSBC Holdings PLC 0.875% 9/6/24 (Reg. S) | EUR | 2,150,000 | 2,334,111 |
| National Grid Gas Finance PLC 1.125% 9/22/21 (Reg. S) | GBP | 1,000,000 | 1,207,322 |
| Nationwide Building Society 4.125% 3/20/23 (Reg. S) (f) | EUR | 3,000,000 | 3,423,870 |
| Royal Bank of Scotland Group PLC 2.5% 3/22/23 (Reg. S) | EUR | 2,000,000 | 2,202,984 |
| SKY PLC 2.5% 9/15/26 (Reg. S) | EUR | 100,000 | 119,258 |
|
| TOTAL UNITED KINGDOM | | | 12,881,266 |
|
| United States of America - 1.6% | | | |
| AT&T, Inc. 5.875% 10/1/19 | | 1,500,000 | 1,661,328 |
| Citigroup, Inc. 1.5% 10/26/28 | EUR | 2,000,000 | 2,166,677 |
| Ford Motor Credit Co. LLC 1.897% 8/12/19 | | 1,800,000 | 1,794,182 |
| Goldman Sachs Group, Inc. 3% 2/12/31 (Reg. S) | EUR | 1,390,000 | 1,686,580 |
| Molson Coors Brewing Co. 1.25% 7/15/24 | EUR | 600,000 | 668,267 |
|
| TOTAL UNITED STATES OF AMERICA | | | 7,977,034 |
|
| TOTAL NONCONVERTIBLE BONDS | | | |
| (Cost $54,799,403) | | | 53,117,381 |
|
| Government Obligations - 24.8% | | | |
| Belgium - 0.1% | | | |
| Belgian Kingdom 2.15% 6/22/66 (c) | EUR | 600,000 | 772,952 |
| Canada - 0.6% | | | |
| Canadian Government: | | | |
| 0.75% 3/1/21 | CAD | 600,000 | 449,121 |
| 3.5% 12/1/45 | CAD | 2,600,000 | 2,652,899 |
|
| TOTAL CANADA | | | 3,102,020 |
|
| France - 0.7% | | | |
| French Government: | | | |
| 0.5% 5/25/26 | EUR | 2,000,000 | 2,213,613 |
| 1.75% 5/25/66 (c) | EUR | 1,000,000 | 1,162,386 |
|
| TOTAL FRANCE | | | 3,375,999 |
|
| Germany - 0.5% | | | |
| German Federal Republic: | | | |
| 0% 8/15/26(Reg. S) | EUR | 1,450,000 | 1,566,327 |
| 2.5% 8/15/46 | EUR | 650,000 | 1,035,478 |
|
| TOTAL GERMANY | | | 2,601,805 |
|
| Ireland - 0.5% | | | |
| Irish Republic: | | | |
| 1% 5/15/26(Reg. S) | EUR | 1,200,000 | 1,359,849 |
| 2% 2/18/45 (Reg.S) | EUR | 800,000 | 976,348 |
|
| TOTAL IRELAND | | | 2,336,197 |
|
| Italy - 0.9% | | | |
| Buoni del Tesoro Poliennali: | | | |
| 1.25% 12/1/26 | EUR | 1,050,000 | 1,107,617 |
| 2.7% 3/1/47 (c) | EUR | 800,000 | 874,339 |
| 4.5% 3/1/24 | EUR | 2,150,000 | 2,902,037 |
|
| TOTAL ITALY | | | 4,883,993 |
|
| Japan - 9.0% | | | |
| Japan Government: | | | |
| 0.1% 6/20/26 | JPY | 780,000,000 | 7,556,859 |
| 0.4% 3/20/56 | JPY | 375,000,000 | 3,350,827 |
| 0.9% 6/20/22 | JPY | 619,800,000 | 6,274,359 |
| 1.3% 6/20/20 | JPY | 722,450,000 | 7,269,554 |
| 1.3% 3/20/21 | JPY | 802,750,000 | 8,160,080 |
| 1.7% 9/20/32 | JPY | 1,155,000,000 | 13,641,930 |
|
| TOTAL JAPAN | | | 46,253,609 |
|
| Netherlands - 1.6% | | | |
| Dutch Government 0.5% 7/15/26(Reg. S) (c) | EUR | 7,200,000 | 8,072,720 |
| Spain - 1.0% | | | |
| Spanish Kingdom: | | | |
| 2.75% 10/31/24 (Reg. S) | EUR | 2,350,000 | 2,947,580 |
| 2.9% 10/31/46(Reg. S) (c) | EUR | 1,850,000 | 2,254,518 |
|
| TOTAL SPAIN | | | 5,202,098 |
|
| United Kingdom - 1.0% | | | |
| United Kingdom, Great Britain and Northern Ireland 4.25% 6/7/32 | GBP | 300,000 | 500,661 |
| United Kingdom, Great Britain and Northern Ireland Treasury Indexed-Linked GILT 2.5% 7/22/65 (Reg. S) | GBP | 3,050,000 | 4,709,245 |
|
| TOTAL UNITED KINGDOM | | | 5,209,906 |
|
| United States of America - 8.9% | | | |
| U.S. Treasury Bonds 2.5% 2/15/46 | | 8,450,000 | 8,302,784 |
| U.S. Treasury Notes: | | | |
| 1.25% 3/31/21 | | 21,900,000 | 21,874,334 |
| 1.625% 5/15/26 | | 15,500,000 | 15,231,773 |
|
| TOTAL UNITED STATES OF AMERICA | | | 45,408,891 |
|
| TOTAL GOVERNMENT OBLIGATIONS | | | |
| (Cost $132,152,771) | | | 127,220,190 |
|
| Commercial Paper - 1.4% | | | |
| Germany - 1.4% | | | |
| DZ BANK AG 0.93% 12/15/16 | | | |
| (Cost $6,992,062) | | 7,000,000 | 6,995,450 |
|
| Preferred Securities - 0.2% | | | |
| France - 0.2% | | | |
Total SA 2.708% (Reg. S) (f)(g)
(Cost $1,121,840) | | $1,000,000 | $1,091,848 |
| | | Shares | Value |
|
| Equity Central Funds - 1.9% | | | |
| Fidelity Commodity Strategy Central Fund (h) | | 623,890 | 3,967,940 |
| Fidelity Emerging Markets Equity Central Fund (h) | | 27,616 | 5,590,031 |
| TOTAL EQUITY CENTRAL FUNDS | | | |
| (Cost $8,885,414) | | | 9,557,971 |
|
| Money Market Funds - 1.1% | | | |
| Fidelity Cash Central Fund, 0.41% (i) | | 4,748,264 | 4,749,689 |
| Fidelity Securities Lending Cash Central Fund 0.48% (i)(j) | | 1,029,969 | 1,030,175 |
| TOTAL MONEY MARKET FUNDS | | | |
| (Cost $5,779,445) | | | 5,779,864 |
| TOTAL INVESTMENT PORTFOLIO - 99.9% | | | |
| (Cost $484,300,450) | | | 511,358,849 |
| NET OTHER ASSETS (LIABILITIES) - 0.1% | | | 476,366 |
| NET ASSETS - 100% | | | $511,835,215 |
Currency Abbreviations
CAD – Canadian dollar
EUR – European Monetary Unit
GBP – British pound
JPY – Japanese yen
Security Type Abbreviations
ETF – Exchange-Traded Fund
Categorizations in the Schedule of Investments are based on country or territory of incorporation.
Legend
(a) Non-income producing
(b) Security or a portion of the security is on loan at period end.
(c) Security exempt from registration under Rule 144A of the Securities Act of 1933. These securities may be resold in transactions exempt from registration, normally to qualified institutional buyers. At the end of the period, the value of these securities amounted to $17,157,400 or 3.4% of net assets.
(d) Security or a portion of the security purchased on a delayed delivery or when-issued basis.
(e) Amount is stated in United States dollars unless otherwise noted.
(f) Coupon rates for floating and adjustable rate securities reflect the rates in effect at period end.
(g) Security is perpetual in nature with no stated maturity date.
(h) Affiliated fund that is generally available only to investment companies and other accounts managed by Fidelity Investments. A complete unaudited schedule of portfolio holdings for each Fidelity Central Fund is filed with the SEC for the first and third quarters of each fiscal year on Form N-Q and is available upon request or at the SEC's website at www.sec.gov. An unaudited holdings listing for the Fund, which presents direct holdings as well as the pro-rata share of securities and other investments held indirectly through its investment in underlying non-money market Fidelity Central Funds, other than the Commodity Strategy Central Fund, is available at fidelity.com and/or institutional.fidelity.com, as applicable. In addition, each Fidelity Central Fund's financial statements, which are not covered by the Fund's Report of Independent Registered Public Accounting Firm, are available on the SEC's website or upon request.
(i) Affiliated fund that is generally available only to investment companies and other accounts managed by Fidelity Investments. The rate quoted is the annualized seven-day yield of the fund at period end. A complete unaudited listing of the fund's holdings as of its most recent quarter end is available upon request. In addition, each Fidelity Central Fund's financial statements, which are not covered by the Fund's Report of Independent Registered Public Accounting Firm, are available on the SEC's website or upon request.
(j) Investment made with cash collateral received from securities on loan.
Affiliated Central Funds
Information regarding fiscal year to date income earned by the Fund from investments in Fidelity Central Funds is as follows:
| Fund | Income earned |
| Fidelity Cash Central Fund | $40,454 |
| Fidelity Commodity Strategy Central Fund | 7,487 |
| Fidelity Emerging Markets Equity Central Fund | 41,619 |
| Fidelity Securities Lending Cash Central Fund | 36,161 |
| Total | $125,721 |
Additional information regarding the Fund's fiscal year to date purchases and sales, including the ownership percentage, of the non Money Market Central Funds is as follows:
| Fund | Value, beginning of period | Purchases | Sales Proceeds | Value, end of period | % ownership, end of period |
| Fidelity Commodity Strategy Central Fund | $-- | $5,004,200 | $1,612,819 | $3,967,940 | 0.8% |
| Fidelity Emerging Markets Equity Central Fund | -- | 10,751,442 | 5,500,656 | 5,590,031 | 1.4% |
| Total | $-- | $15,755,642 | $7,113,475 | $9,557,971 | |
Investment Valuation
The following is a summary of the inputs used, as of October 31, 2016, involving the Fund's assets and liabilities carried at fair value. The inputs or methodology used for valuing securities may not be an indication of the risk associated with investing in those securities. For more information on valuation inputs, and their aggregation into the levels used below, please refer to the Investment Valuation section in the accompanying Notes to Financial Statements.
| | Valuation Inputs at Reporting Date: |
| Description | Total | Level 1 | Level 2 | Level 3 |
| Investments in Securities: | | | | |
| Equities: | | | | |
| Consumer Discretionary | $34,464,984 | $29,473,130 | $4,991,854 | $-- |
| Consumer Staples | 18,527,313 | 15,563,234 | 2,964,079 | -- |
| Energy | 19,149,348 | 19,149,348 | -- | -- |
| Financials | 51,079,559 | 48,475,777 | 2,603,782 | -- |
| Health Care | 27,998,284 | 24,636,066 | 3,362,218 | -- |
| Industrials | 38,558,939 | 35,094,663 | 3,464,276 | -- |
| Information Technology | 77,707,451 | 73,712,831 | 3,994,620 | -- |
| Materials | 7,386,678 | 6,859,247 | 527,431 | -- |
| Real Estate | 9,748,370 | 9,748,370 | -- | -- |
| Telecommunication Services | 2,536,700 | 1,258,909 | 1,277,791 | -- |
| Utilities | 1,761,887 | 1,761,887 | -- | -- |
| Investment Companies | 18,676,632 | 18,676,632 | -- | -- |
| Corporate Bonds | 53,117,381 | -- | 53,117,381 | -- |
| Government Obligations | 127,220,190 | -- | 127,220,190 | -- |
| Commercial Paper | 6,995,450 | -- | 6,995,450 | -- |
| Preferred Securities | 1,091,848 | -- | 1,091,848 | -- |
| Equity Central Funds | 9,557,971 | 9,557,971 | -- | -- |
| Money Market Funds | 5,779,864 | 5,779,864 | -- | -- |
| Total Investments in Securities: | $511,358,849 | $299,747,929 | $211,610,920 | $-- |
The following is a summary of transfers between Level 1 and Level 2 for the period ended October 31, 2016. Transfers are assumed to have occurred at the beginning of the period, and are primarily attributable to the valuation techniques used for foreign equity securities, as discussed in the accompanying Notes to Financial Statements:
| Transfers | Total |
| Level 1 to Level 2 | $0 |
| Level 2 to Level 1 | $17,431,563 |
Other Information
The composition of credit quality ratings as a percentage of Total Net Assets (Unaudited) is as follows. The information is based on the combined investments of the Fund and its pro-rata share of the investments of Fidelity's Central Funds, other than the Commodity Strategy and Money Market Central Funds.
| U.S. Government and U.S. Government Agency Obligations | 8.9% |
| AAA,AA,A | 14.2% |
| BBB | 9.8% |
| BB | 0.4% |
| Not Rated | 2.1% |
| Equities | 62.0% |
| Short-Term Investments and Net Other Assets | 2.6% |
| | 100.0% |
We have used ratings from Moody's Investors Service, Inc. Where Moody's® ratings are not available, we have used S&P® ratings. All ratings are as of the date indicated and do not reflect subsequent changes.
See accompanying notes which are an integral part of the financial statements.
Financial Statements
Statement of Assets and Liabilities
| | | October 31, 2016 |
| Assets | | |
Investment in securities, at value (including securities loaned of $968,525) — See accompanying schedule:
Unaffiliated issuers (cost $469,635,592) | $496,021,014 | |
| Fidelity Central Funds (cost $14,664,858) | 15,337,835 | |
| Total Investments (cost $484,300,450) | | $511,358,849 |
| Cash | | 7,061 |
| Foreign currency held at value (cost $8,472) | | 8,472 |
| Receivable for investments sold | | 5,089,410 |
| Receivable for fund shares sold | | 147,009 |
| Dividends receivable | | 419,146 |
| Interest receivable | | 1,001,984 |
| Distributions receivable from Fidelity Central Funds | | 2,597 |
| Prepaid expenses | | 1,305 |
| Other receivables | | 12,040 |
| Total assets | | 518,047,873 |
| Liabilities | | |
| Payable for investments purchased | | |
| Regular delivery | $4,055,225 | |
| Delayed delivery | 98,358 | |
| Payable for fund shares redeemed | 483,291 | |
| Accrued management fee | 304,044 | |
| Distribution and service plan fees payable | 38,684 | |
| Other affiliated payables | 105,750 | |
| Other payables and accrued expenses | 97,131 | |
| Collateral on securities loaned, at value | 1,030,175 | |
| Total liabilities | | 6,212,658 |
| Net Assets | | $511,835,215 |
| Net Assets consist of: | | |
| Paid in capital | | $485,498,449 |
| Undistributed net investment income | | 9,899 |
| Accumulated undistributed net realized gain (loss) on investments and foreign currency transactions | | (699,141) |
| Net unrealized appreciation (depreciation) on investments and assets and liabilities in foreign currencies | | 27,026,008 |
| Net Assets | | $511,835,215 |
| Calculation of Maximum Offering Price | | |
| Class A: | | |
| Net Asset Value and redemption price per share ($41,067,132 ÷ 1,831,139 shares) | | $22.43 |
| Maximum offering price per share (100/94.25 of $22.43) | | $23.80 |
| Class T: | | |
| Net Asset Value and redemption price per share ($15,367,872 ÷ 691,345 shares) | | $22.23 |
| Maximum offering price per share (100/96.50 of $22.23) | | $23.04 |
| Class C: | | |
| Net Asset Value and offering price per share ($27,401,027 ÷ 1,259,031 shares)(a) | | $21.76 |
| Global Balanced: | | |
| Net Asset Value, offering price and redemption price per share ($422,405,536 ÷ 18,596,657 shares) | | $22.71 |
| Class I: | | |
| Net Asset Value, offering price and redemption price per share ($5,593,648÷ 246,997 shares) | | $22.65 |
(a) Redemption price per share is equal to net asset value less any applicable contingent deferred sales charge.
See accompanying notes which are an integral part of the financial statements.
Statement of Operations
| | | Year ended October 31, 2016 |
| Investment Income | | |
| Dividends | | $5,255,018 |
| Interest | | 3,134,696 |
| Income from Fidelity Central Funds | | 125,721 |
| Income before foreign taxes withheld | | 8,515,435 |
| Less foreign taxes withheld | | (256,006) |
| Total income | | 8,259,429 |
| Expenses | | |
| Management fee | $3,684,179 | |
| Transfer agent fees | 1,007,508 | |
| Distribution and service plan fees | 472,648 | |
| Accounting and security lending fees | 270,674 | |
| Custodian fees and expenses | 171,207 | |
| Independent trustees' fees and expenses | 2,368 | |
| Registration fees | 86,077 | |
| Audit | 146,912 | |
| Legal | 6,932 | |
| Interest | 523 | |
| Miscellaneous | 4,457 | |
| Total expenses before reductions | 5,853,485 | |
| Expense reductions | (32,021) | 5,821,464 |
| Net investment income (loss) | | 2,437,965 |
| Realized and Unrealized Gain (Loss) | | |
| Net realized gain (loss) on: | | |
| Investment securities: | | |
| Unaffiliated issuers | 287,571 | |
| Fidelity Central Funds | 243,444 | |
| Foreign currency transactions | 24,587 | |
| Total net realized gain (loss) | | 555,602 |
Change in net unrealized appreciation (depreciation) on:
Investment securities | 9,887,345 | |
| Assets and liabilities in foreign currencies | (39,989) | |
| Total change in net unrealized appreciation (depreciation) | | 9,847,356 |
| Net gain (loss) | | 10,402,958 |
| Net increase (decrease) in net assets resulting from operations | | $12,840,923 |
See accompanying notes which are an integral part of the financial statements.
Statement of Changes in Net Assets
| | Year ended October 31, 2016 | Year ended October 31, 2015 |
| Increase (Decrease) in Net Assets | | |
| Operations | | |
| Net investment income (loss) | $2,437,965 | $3,617,582 |
| Net realized gain (loss) | 555,602 | 6,654,630 |
| Change in net unrealized appreciation (depreciation) | 9,847,356 | (17,997,479) |
| Net increase (decrease) in net assets resulting from operations | 12,840,923 | (7,725,267) |
| Distributions to shareholders from net investment income | – | (1,672,129) |
| Distributions to shareholders from net realized gain | (15,584,739) | (43,816,065) |
| Total distributions | (15,584,739) | (45,488,194) |
| Share transactions - net increase (decrease) | (38,129,692) | (52,070,060) |
| Redemption fees | 6,276 | 9,666 |
| Total increase (decrease) in net assets | (40,867,232) | (105,273,855) |
| Net Assets | | |
| Beginning of period | 552,702,447 | 657,976,302 |
| End of period | $511,835,215 | $552,702,447 |
| Other Information | | |
| Undistributed net investment income end of period | $9,899 | $– |
| Distributions in excess of net investment income end of period | $– | $(5,875,367) |
See accompanying notes which are an integral part of the financial statements.
Financial Highlights — Fidelity Global Balanced Fund Class A
| Years ended October 31, | 2016 | 2015 | 2014 | 2013 | 2012 |
| Selected Per–Share Data | | | | | |
| Net asset value, beginning of period | $22.58 | $24.65 | $26.18 | $23.45 | $22.05 |
| Income from Investment Operations | | | | | |
| Net investment income (loss)A | .06 | .09 | .15 | .13 | .27 |
| Net realized and unrealized gain (loss) | .44 | (.45) | .49 | 3.13 | 1.41 |
| Total from investment operations | .50 | (.36) | .64 | 3.26 | 1.68 |
| Distributions from net investment income | – | (.01) | (.10) | (.24) | (.19) |
| Distributions from net realized gain | (.65) | (1.70) | (2.07) | (.29) | (.09) |
| Total distributions | (.65) | (1.71) | (2.17) | (.53) | (.28) |
| Redemption fees added to paid in capitalA,B | – | – | – | – | – |
| Net asset value, end of period | $22.43 | $22.58 | $24.65 | $26.18 | $23.45 |
| Total ReturnC,D | 2.35% | (1.48)% | 2.69% | 14.19% | 7.74% |
| Ratios to Average Net AssetsE,F | | | | | |
| Expenses before reductions | 1.30% | 1.29% | 1.28% | 1.31% | 1.33% |
| Expenses net of fee waivers, if any | 1.30% | 1.29% | 1.28% | 1.31% | 1.33% |
| Expenses net of all reductions | 1.29% | 1.27% | 1.27% | 1.29% | 1.32% |
| Net investment income (loss) | .27% | .41% | .58% | .55% | 1.18% |
| Supplemental Data | | | | | |
| Net assets, end of period (000 omitted) | $41,067 | $42,165 | $47,048 | $38,972 | $26,714 |
| Portfolio turnover rateG | 155% | 140% | 157% | 181% | 157% |
A Calculated based on average shares outstanding during the period.
B Amount represents less than $.005 per share.
C Total returns would have been lower if certain expenses had not been reduced during the applicable periods shown.
D Total returns do not include the effect of the sales charges.
E Fees and expenses of any underlying Fidelity Central Funds are not included in the Fund's expense ratio. The Fund indirectly bears its proportionate share of the expenses of any underlying Fidelity Central Funds. Based on their most recent shareholder report date, the expenses of any underlying non-money market Fidelity Central Funds ranged from .06% to .09%.
F Expense ratios reflect operating expenses of the class. Expenses before reductions do not reflect amounts reimbursed by the investment adviser or reductions from brokerage service arrangements or reductions from other expense offset arrangements and do not represent the amount paid by the class during periods when reimbursements or reductions occur. Expenses net of fee waivers reflect expenses after reimbursement by the investment adviser but prior to reductions from brokerage service arrangements or other expense offset arrangements. Expenses net of all reductions represent the net expenses paid by the class.
G Amount does not include the portfolio activity of any underlying Fidelity Central Funds.
See accompanying notes which are an integral part of the financial statements.
Financial Highlights — Fidelity Global Balanced Fund Class T
| Years ended October 31, | 2016 | 2015 | 2014 | 2013 | 2012 |
| Selected Per–Share Data | | | | | |
| Net asset value, beginning of period | $22.44 | $24.52 | $26.04 | $23.32 | $21.96 |
| Income from Investment Operations | | | | | |
| Net investment income (loss)A | –B | .03 | .08 | .07 | .21 |
| Net realized and unrealized gain (loss) | .44 | (.46) | .49 | 3.12 | 1.41 |
| Total from investment operations | .44 | (.43) | .57 | 3.19 | 1.62 |
| Distributions from net investment income | – | – | (.02) | (.18) | (.17) |
| Distributions from net realized gain | (.65) | (1.65) | (2.07) | (.29) | (.09) |
| Total distributions | (.65) | (1.65) | (2.09) | (.47) | (.26) |
| Redemption fees added to paid in capitalA,B | – | – | – | – | – |
| Net asset value, end of period | $22.23 | $22.44 | $24.52 | $26.04 | $23.32 |
| Total ReturnC,D | 2.08% | (1.80)% | 2.40% | 13.94% | 7.46% |
| Ratios to Average Net AssetsE,F | | | | | |
| Expenses before reductions | 1.58% | 1.56% | 1.55% | 1.57% | 1.58% |
| Expenses net of fee waivers, if any | 1.58% | 1.56% | 1.55% | 1.57% | 1.58% |
| Expenses net of all reductions | 1.57% | 1.55% | 1.55% | 1.55% | 1.57% |
| Net investment income (loss) | (.01)% | .14% | .31% | .28% | .94% |
| Supplemental Data | | | | | |
| Net assets, end of period (000 omitted) | $15,368 | $16,867 | $17,662 | $14,650 | $13,654 |
| Portfolio turnover rateG | 155% | 140% | 157% | 181% | 157% |
A Calculated based on average shares outstanding during the period.
B Amount represents less than $.005 per share.
C Total returns would have been lower if certain expenses had not been reduced during the applicable periods shown.
D Total returns do not include the effect of the sales charges.
E Fees and expenses of any underlying Fidelity Central Funds are not included in the Fund's expense ratio. The Fund indirectly bears its proportionate share of the expenses of any underlying Fidelity Central Funds. Based on their most recent shareholder report date, the expenses of any underlying non-money market Fidelity Central Funds ranged from .06% to .09%.
F Expense ratios reflect operating expenses of the class. Expenses before reductions do not reflect amounts reimbursed by the investment adviser or reductions from brokerage service arrangements or reductions from other expense offset arrangements and do not represent the amount paid by the class during periods when reimbursements or reductions occur. Expenses net of fee waivers reflect expenses after reimbursement by the investment adviser but prior to reductions from brokerage service arrangements or other expense offset arrangements. Expenses net of all reductions represent the net expenses paid by the class.
G Amount does not include the portfolio activity of any underlying Fidelity Central Funds.
See accompanying notes which are an integral part of the financial statements.
See accompanying notes which are an integral part of the financial statements.
Financial Highlights — Fidelity Global Balanced Fund Class C
| Years ended October 31, | 2016 | 2015 | 2014 | 2013 | 2012 |
| Selected Per–Share Data | | | | | |
| Net asset value, beginning of period | $22.10 | $24.17 | $25.76 | $23.09 | $21.73 |
| Income from Investment Operations | | | | | |
| Net investment income (loss)A | (.12) | (.09) | (.05) | (.06) | .09 |
| Net realized and unrealized gain (loss) | .43 | (.46) | .49 | 3.08 | 1.41 |
| Total from investment operations | .31 | (.55) | .44 | 3.02 | 1.50 |
| Distributions from net investment income | – | – | – | (.06) | (.05) |
| Distributions from net realized gain | (.65) | (1.52) | (2.03) | (.29) | (.09) |
| Total distributions | (.65) | (1.52) | (2.03) | (.35) | (.14) |
| Redemption fees added to paid in capitalA,B | – | – | – | – | – |
| Net asset value, end of period | $21.76 | $22.10 | $24.17 | $25.76 | $23.09 |
| Total ReturnC,D | 1.51% | (2.33)% | 1.89% | 13.27% | 6.94% |
| Ratios to Average Net AssetsE,F | | | | | |
| Expenses before reductions | 2.11% | 2.10% | 2.08% | 2.12% | 2.13% |
| Expenses net of fee waivers, if any | 2.11% | 2.09% | 2.08% | 2.12% | 2.13% |
| Expenses net of all reductions | 2.10% | 2.08% | 2.07% | 2.10% | 2.12% |
| Net investment income (loss) | (.54)% | (.40)% | (.22)% | (.26)% | .39% |
| Supplemental Data | | | | | |
| Net assets, end of period (000 omitted) | $27,401 | $28,505 | $29,809 | $20,997 | $13,797 |
| Portfolio turnover rateG | 155% | 140% | 157% | 181% | 157% |
A Calculated based on average shares outstanding during the period.
B Amount represents less than $.005 per share.
C Total returns would have been lower if certain expenses had not been reduced during the applicable periods shown.
D Total returns do not include the effect of the contingent deferred sales charge.
E Fees and expenses of any underlying Fidelity Central Funds are not included in the Fund's expense ratio. The Fund indirectly bears its proportionate share of the expenses of any underlying Fidelity Central Funds. Based on their most recent shareholder report date, the expenses of any underlying non-money market Fidelity Central Funds ranged from .06% to .09%.
F Expense ratios reflect operating expenses of the class. Expenses before reductions do not reflect amounts reimbursed by the investment adviser or reductions from brokerage service arrangements or reductions from other expense offset arrangements and do not represent the amount paid by the class during periods when reimbursements or reductions occur. Expenses net of fee waivers reflect expenses after reimbursement by the investment adviser but prior to reductions from brokerage service arrangements or other expense offset arrangements. Expenses net of all reductions represent the net expenses paid by the class.
G Amount does not include the portfolio activity of any underlying Fidelity Central Funds.
See accompanying notes which are an integral part of the financial statements.
Financial Highlights — Fidelity Global Balanced Fund
| Years ended October 31, | 2016 | 2015 | 2014 | 2013 | 2012 |
| Selected Per–Share Data | | | | | |
| Net asset value, beginning of period | $22.79 | $24.87 | $26.38 | $23.62 | $22.18 |
| Income from Investment Operations | | | | | |
| Net investment income (loss)A | .13 | .16 | .22 | .21 | .33 |
| Net realized and unrealized gain (loss) | .44 | (.47) | .50 | 3.14 | 1.44 |
| Total from investment operations | .57 | (.31) | .72 | 3.35 | 1.77 |
| Distributions from net investment income | – | (.08) | (.16) | (.30) | (.24) |
| Distributions from net realized gain | (.65) | (1.70) | (2.07) | (.29) | (.09) |
| Total distributions | (.65) | (1.77)B | (2.23) | (.59) | (.33) |
| Redemption fees added to paid in capitalA,C | – | – | – | – | – |
| Net asset value, end of period | $22.71 | $22.79 | $24.87 | $26.38 | $23.62 |
| Total ReturnD | 2.64% | (1.24)% | 3.00% | 14.52% | 8.11% |
| Ratios to Average Net AssetsE,F | | | | | |
| Expenses before reductions | 1.01% | 1.00% | .99% | 1.02% | 1.03% |
| Expenses net of fee waivers, if any | 1.01% | 1.00% | .99% | 1.02% | 1.03% |
| Expenses net of all reductions | 1.00% | .99% | .99% | 1.00% | 1.02% |
| Net investment income (loss) | .56% | .70% | .87% | .84% | 1.48% |
| Supplemental Data | | | | | |
| Net assets, end of period (000 omitted) | $422,406 | $457,766 | $554,896 | $540,412 | $468,758 |
| Portfolio turnover rateG | 155% | 140% | 157% | 181% | 157% |
A Calculated based on average shares outstanding during the period.
B Total distributions of $1.77 per share is comprised of distributions from net investment income of $.075 and distributions from net realized gain of $1.697 per share.
C Amount represents less than $.005 per share.
D Total returns would have been lower if certain expenses had not been reduced during the applicable periods shown.
E Fees and expenses of any underlying Fidelity Central Funds are not included in the Fund's expense ratio. The Fund indirectly bears its proportionate share of the expenses of any underlying Fidelity Central Funds. Based on their most recent shareholder report date, the expenses of any underlying non-money market Fidelity Central Funds ranged from .06% to .09%.
F Expense ratios reflect operating expenses of the class. Expenses before reductions do not reflect amounts reimbursed by the investment adviser or reductions from brokerage service arrangements or reductions from other expense offset arrangements and do not represent the amount paid by the class during periods when reimbursements or reductions occur. Expenses net of fee waivers reflect expenses after reimbursement by the investment adviser but prior to reductions from brokerage service arrangements or other expense offset arrangements. Expenses net of all reductions represent the net expenses paid by the class.
G Amount does not include the portfolio activity of any underlying Fidelity Central Funds.
See accompanying notes which are an integral part of the financial statements.
Financial Highlights — Fidelity Global Balanced Fund Class I
| Years ended October 31, | 2016 | 2015 | 2014 | 2013 | 2012 |
| Selected Per–Share Data | | | | | |
| Net asset value, beginning of period | $22.72 | $24.80 | $26.33 | $23.58 | $22.16 |
| Income from Investment Operations | | | | | |
| Net investment income (loss)A | .13 | .16 | .21 | .20 | .33 |
| Net realized and unrealized gain (loss) | .45 | (.47) | .49 | 3.14 | 1.43 |
| Total from investment operations | .58 | (.31) | .70 | 3.34 | 1.76 |
| Distributions from net investment income | – | (.07) | (.17) | (.30) | (.25) |
| Distributions from net realized gain | (.65) | (1.70) | (2.07) | (.29) | (.09) |
| Total distributions | (.65) | (1.77) | (2.23)B | (.59) | (.34) |
| Redemption fees added to paid in capitalA,C | – | – | – | – | – |
| Net asset value, end of period | $22.65 | $22.72 | $24.80 | $26.33 | $23.58 |
| Total ReturnD | 2.69% | (1.25)% | 2.95% | 14.50% | 8.10% |
| Ratios to Average Net AssetsE,F | | | | | |
| Expenses before reductions | 1.00% | 1.01% | 1.02% | 1.03% | 1.04% |
| Expenses net of fee waivers, if any | 1.00% | 1.01% | 1.02% | 1.03% | 1.04% |
| Expenses net of all reductions | .99% | 1.00% | 1.02% | 1.01% | 1.03% |
| Net investment income (loss) | .57% | .68% | .84% | .83% | 1.48% |
| Supplemental Data | | | | | |
| Net assets, end of period (000 omitted) | $5,594 | $6,048 | $6,537 | $3,183 | $1,966 |
| Portfolio turnover rateG | 155% | 140% | 157% | 181% | 157% |
A Calculated based on average shares outstanding during the period.
B Total distributions of $2.23 per share is comprised of distributions from net investment income of $.167 and distributions from net realized gain of $2.065 per share.
C Amount represents less than $.005 per share.
D Total returns would have been lower if certain expenses had not been reduced during the applicable periods shown.
E Fees and expenses of any underlying Fidelity Central Funds are not included in the Fund's expense ratio. The Fund indirectly bears its proportionate share of the expenses of any underlying Fidelity Central Funds. Based on their most recent shareholder report date, the expenses of any underlying non-money market Fidelity Central Funds ranged from .06% to .09%.
F Expense ratios reflect operating expenses of the class. Expenses before reductions do not reflect amounts reimbursed by the investment adviser or reductions from brokerage service arrangements or reductions from other expense offset arrangements and do not represent the amount paid by the class during periods when reimbursements or reductions occur. Expenses net of fee waivers reflect expenses after reimbursement by the investment adviser but prior to reductions from brokerage service arrangements or other expense offset arrangements. Expenses net of all reductions represent the net expenses paid by the class.
G Amount does not include the portfolio activity of any underlying Fidelity Central Funds.
See accompanying notes which are an integral part of the financial statements.
Notes to Financial Statements
For the period ended October 31, 2016
1. Organization.
Fidelity Global Balanced Fund (the Fund) is a fund of Fidelity Charles Street Trust (the Trust) and is authorized to issue an unlimited number of shares. The Trust is registered under the Investment Company Act of 1940, as amended (the 1940 Act), as an open-end management investment company organized as a Massachusetts business trust. The Fund offers Class A, Class T, Class C, Global Balanced and Class I shares, each of which has equal rights as to assets and voting privileges. Each class has exclusive voting rights with respect to matters that affect that class.
After the close of business on June 24, 2016, all outstanding Class B shares were converted to Class A shares. All current fiscal period dollar and share amounts for Class B presented in the Notes to Financial Statements are for the period November 1, 2015 through June 24, 2016.
2. Investments in Fidelity Central Funds.
The Fund invests in Fidelity Central Funds, which are open-end investment companies generally available only to other investment companies and accounts managed by the investment adviser and its affiliates. The Fund's Schedule of Investments lists each of the Fidelity Central Funds held as of period end, if any, as an investment of the Fund, but does not include the underlying holdings of each Fidelity Central Fund. As an Investing Fund, the Fund indirectly bears its proportionate share of the expenses of the underlying Fidelity Central Funds.
Based on its investment objective, each Fidelity Central Fund may invest or participate in various investment vehicles or strategies that are similar to those of the Fund. These strategies are consistent with the investment objectives of the Fund and may involve certain economic risks which may cause a decline in value of each of the Fidelity Central Funds and thus a decline in the value of the Fund. The Money Market Central Funds seek preservation of capital and current income and are managed by Fidelity Investments Money Management, Inc. (FIMM), an affiliate of the investment adviser. Annualized expenses of the Money Market Central Funds as of their most recent shareholder report date are less than .005%. The following summarizes the Fund's investment in each non-money market Fidelity Central Fund.
| Fidelity Central Fund | Investment Manager | Investment Objective | Investment Practices | Expense Ratio(a) |
| Fidelity Commodity Strategy Central Fund | Geode Capital Management, LLC (Geode) | Seeks to provide investment returns that correspond to the performance of the commodities market. | Investment in commodity-related investments through a wholly-owned subsidiary organized under the laws of the Cayman Islands
Futures
| .06% |
| Fidelity Emerging Markets Equity Central Fund | FMR Co., Inc. (FMRC) | Seeks capital appreciation by investing primarily in equity securities of issuers in emerging markets. | Foreign Securities
Futures | .09% |
(a) Expenses expressed as a percentage of average net assets and are as of each underlying Central Fund's most recent annual or semi-annual shareholder report.
An unaudited holdings listing for the Fund, which presents direct holdings as well as the pro-rata share of any securities and other investments held indirectly through its investment in underlying non-money market Fidelity Central Funds, is available at fidelity.com and/or institutional.fidelity.com, as applicable. A complete unaudited list of holdings for each Fidelity Central Fund is available upon request or at the Securities and Exchange Commission (the SEC) website at www.sec.gov. In addition, the financial statements of the Fidelity Central Funds which contain the significant accounting policies (including investment valuation policies) of those funds, which are not covered by the Fund's Report of Independent Registered Public Accounting Firm, are available on the SEC website or upon request.
3. Significant Accounting Policies.
The financial statements have been prepared in conformity with accounting principles generally accepted in the United States of America (GAAP), which require management to make certain estimates and assumptions at the date of the financial statements. Actual results could differ from those estimates. Subsequent events, if any, through the date that the financial statements were issued have been evaluated in the preparation of the financial statements. The following summarizes the significant accounting policies of the Fund:
Investment Valuation. Investments are valued as of 4:00 p.m. Eastern time on the last calendar day of the period. The Board of Trustees (the Board) has delegated the day to day responsibility for the valuation of the Fund's investments to the Fair Value Committee (the Committee) established by the Fund's investment adviser. In accordance with valuation policies and procedures approved by the Board, the Fund attempts to obtain prices from one or more third party pricing vendors or brokers to value its investments. When current market prices, quotations or currency exchange rates are not readily available or reliable, investments will be fair valued in good faith by the Committee, in accordance with procedures adopted by the Board. Factors used in determining fair value vary by investment type and may include market or investment specific events, changes in interest rates and credit quality. The frequency with which these procedures are used cannot be predicted and they may be utilized to a significant extent. The Committee oversees the Fund's valuation policies and procedures and reports to the Board on the Committee's activities and fair value determinations. The Board monitors the appropriateness of the procedures used in valuing the Fund's investments and ratifies the fair value determinations of the Committee.
The Fund categorizes the inputs to valuation techniques used to value its investments into a disclosure hierarchy consisting of three levels as shown below:
- Level 1 – quoted prices in active markets for identical investments
- Level 2 – other significant observable inputs (including quoted prices for similar investments, interest rates, prepayment speeds, etc.)
- Level 3 – unobservable inputs (including the Fund's own assumptions based on the best information available)
Valuation techniques used to value the Fund's investments by major category are as follows:
Equity securities, including restricted securities, for which market quotations are readily available, are valued at the last reported sale price or official closing price as reported by a third party pricing vendor on the primary market or exchange on which they are traded and are categorized as Level 1 in the hierarchy. In the event there were no sales during the day or closing prices are not available, securities are valued at the last quoted bid price or may be valued using the last available price and are generally categorized as Level 2 in the hierarchy. For foreign equity securities, when market or security specific events arise, comparisons to the valuation of American Depositary Receipts (ADRs), futures contracts, Exchange-Traded Funds (ETFs) and certain indexes as well as quoted prices for similar securities may be used and would be categorized as Level 2 in the hierarchy. Utilizing these techniques may result in transfers between Level 1 and Level 2. For equity securities, including restricted securities, where observable inputs are limited, assumptions about market activity and risk are used and these securities may be categorized as Level 3 in the hierarchy.
Debt securities, including restricted securities, are valued based on evaluated prices received from third party pricing vendors or from brokers who make markets in such securities. Corporate bonds, foreign government and government agency obligations, preferred securities, U.S. government and government agency obligations and commercial paper are valued by pricing vendors who utilize matrix pricing which considers yield or price of bonds of comparable quality, coupon, maturity and type or by broker-supplied prices. When independent prices are unavailable or unreliable, debt securities may be valued utilizing pricing methodologies which consider similar factors that would be used by third party pricing vendors. Debt securities are generally categorized as Level 2 in the hierarchy but may be Level 3 depending on the circumstances. ETFs are valued at their last sale price or official closing price as reported by a third party pricing vendor on the primary market or exchange on which they are traded and are categorized as Level 1 in the hierarchy. In the event there were no sales during the day but the exchange reports a closing bid level, ETFs are valued at the closing bid and would be categorized as Level 1 in the hierarchy. In the event there was no closing bid, ETFs may be valued by another method that the Board believes reflects fair value in accordance with the Board's fair value pricing policies and may be categorized as Level 2 in the hierarchy.
Investments in open-end mutual funds, including the Fidelity Central Funds, are valued at their closing net asset value (NAV) each business day and are categorized as Level 1 in the hierarchy.
Changes in valuation techniques may result in transfers in or out of an assigned level within the disclosure hierarchy. The aggregate value of investments by input level as of October 31, 2016, including information on transfers between Levels 1 and 2, is included at the end of the Fund's Schedule of Investments.
Foreign Currency. The Fund may use foreign currency contracts to facilitate transactions in foreign-denominated securities. Gains and losses from these transactions may arise from changes in the value of the foreign currency or if the counterparties do not perform under the contracts' terms.
Foreign-denominated assets, including investment securities, and liabilities are translated into U.S. dollars at the exchange rates at period end. Purchases and sales of investment securities, income and dividends received and expenses denominated in foreign currencies are translated into U.S. dollars at the exchange rate in effect on the transaction date.
The effects of exchange rate fluctuations on investments are included with the net realized and unrealized gain (loss) on investment securities. Other foreign currency transactions resulting in realized and unrealized gain (loss) are disclosed separately.
Investment Transactions and Income. For financial reporting purposes, the Fund's investment holdings and NAV include trades executed through the end of the last business day of the period. The NAV per share for processing shareholder transactions is calculated as of the close of business of the New York Stock Exchange (NYSE), normally 4:00 p.m. Eastern time and includes trades executed through the end of the prior business day. Gains and losses on securities sold are determined on the basis of identified cost and may include proceeds received from litigation. Dividend income is recorded on the ex-dividend date, except for certain dividends from foreign securities where the ex-dividend date may have passed, which are recorded as soon as the Fund is informed of the ex-dividend date. Non-cash dividends included in dividend income, if any, are recorded at the fair market value of the securities received. Income and capital gain distributions from Fidelity Central Funds, if any, are recorded on the ex-dividend date. Distributions received on securities that represent a return of capital or capital gain are recorded as a reduction of cost of investments and/or as a realized gain. Subsequent to ex-dividend date the Fund determines the components of these distributions, based upon receipt of tax filings or other correspondence relating to the underlying investment. Interest income is accrued as earned and includes coupon interest and amortization of premium and accretion of discount on debt securities as applicable. The principal amount on inflation-indexed securities is periodically adjusted to the rate of inflation and interest is accrued based on the principal amount. The adjustments to principal due to inflation are reflected as increases or decreases to Interest in the accompanying Statement of Operations. Investment income is recorded net of foreign taxes withheld where recovery of such taxes is uncertain. Debt obligations may be placed on non-accrual status and related interest income may be reduced by ceasing current accruals and writing off interest receivables when the collection of all or a portion of interest has become doubtful based on consistently applied procedures. A debt obligation is removed from non-accrual status when the issuer resumes interest payments or when collectability of interest is reasonably assured.
Class Allocations and Expenses. Investment income, realized and unrealized capital gains and losses, common expenses of the Fund, and certain fund-level expense reductions, if any, are allocated daily on a pro-rata basis to each class based on the relative net assets of each class to the total net assets of the Fund. Each class differs with respect to transfer agent and distribution and service plan fees incurred. Certain expense reductions may also differ by class. For the reporting period, the allocated portion of income and expenses to each class as a percent of its average net assets may vary due to the timing of recording these transactions in relation to fluctuating net assets of the classes. Expenses directly attributable to a fund are charged to that fund. Expenses attributable to more than one fund are allocated among the respective funds on the basis of relative net assets or other appropriate methods. Expense estimates are accrued in the period to which they relate and adjustments are made when actual amounts are known.
Income Tax Information and Distributions to Shareholders. Each year, the Fund intends to qualify as a regulated investment company under Subchapter M of the Internal Revenue Code, including distributing substantially all of its taxable income and realized gains. As a result, no provision for U.S. Federal income taxes is required. As of October 31, 2016, the Fund did not have any unrecognized tax benefits in the financial statements; nor is the Fund aware of any tax positions for which it is reasonably possible that the total amounts of unrecognized tax benefits will significantly change in the next twelve months. The Fund files a U.S. federal tax return, in addition to state and local tax returns as required. The Fund's federal income tax returns are subject to examination by the Internal Revenue Service (IRS) for a period of three fiscal years after they are filed. State and local tax returns may be subject to examination for an additional fiscal year depending on the jurisdiction. Foreign taxes are provided for based on the Fund's understanding of the tax rules and rates that exist in the foreign markets in which it invests.
Distributions are declared and recorded on the ex-dividend date. Income dividends and capital gain distributions are declared separately for each class. Income and capital gain distributions are determined in accordance with income tax regulations, which may differ from GAAP.
Capital accounts within the financial statements are adjusted for permanent book-tax differences. These adjustments have no impact on net assets or the results of operations. Capital accounts are not adjusted for temporary book-tax differences which will reverse in a subsequent period.
Book-tax differences are primarily due to foreign currency transactions, passive foreign investment companies (PFIC), market discount, partnerships (including allocations from fidelity Central Funds), deferred trustees compensation, net operating losses, losses deferred due to wash sales and excise tax regulations.
The federal tax cost of investment securities and unrealized appreciation (depreciation) as of period end were as follows:
| Gross unrealized appreciation | $43,081,022 |
| Gross unrealized depreciation | (18,487,383) |
| Net unrealized appreciation (depreciation) on securities | $24,593,639 |
| Tax Cost | $486,765,210 |
The tax-based components of distributable earnings as of period end were as follows:
| Undistributed long-term capital gain | $1,775,693 |
| Net unrealized appreciation (depreciation) on securities and other investments | $24,561,263 |
The tax character of distributions paid was as follows:
| | October 31, 2016 | October 31, 2015 |
| Ordinary Income | $– | $ 13,870,965 |
| Long-term Capital Gains | 15,584,739 | 31,617,229 |
| Total | $15,584,739 | $ 45,488,194 |
Short-Term Trading (Redemption) Fees. Shares held by investors in the Fund less than 30 days may have been subject to a redemption fee equal to 1.00% of the NAV of shares redeemed. All redemption fees, which reduce the proceeds of the shareholder redemption, are retained by the Fund and accounted for as an addition to paid in capital. In November 2016, the Board of Trustees approved the elimination of these redemption fees effective December 12, 2016.
Delayed Delivery Transactions and When-Issued Securities. During the period, the Fund transacted in securities on a delayed delivery or when-issued basis. Payment and delivery may take place after the customary settlement period for that security. The price of the underlying securities and the date when the securities will be delivered and paid for are fixed at the time the transaction is negotiated. The securities purchased on a delayed delivery or when-issued basis are identified as such in the Fund's Schedule of Investments. The Fund may receive compensation for interest forgone in the purchase of a delayed delivery or when-issued security. With respect to purchase commitments, the Fund identifies securities as segregated in its records with a value at least equal to the amount of the commitment. Losses may arise due to changes in the value of the underlying securities or if the counterparty does not perform under the contract's terms, or if the issuer does not issue the securities due to political, economic, or other factors.
Restricted Securities. The Fund may invest in securities that are subject to legal or contractual restrictions on resale. These securities generally may be resold in transactions exempt from registration or to the public if the securities are registered. Disposal of these securities may involve time-consuming negotiations and expense, and prompt sale at an acceptable price may be difficult. Information regarding restricted securities is included at the end of the Fund's Schedule of Investments.
4. Purchases and Sales of Investments.
Purchases and sales of securities (including the Equity Central Funds), other than short-term securities and U.S. government securities, aggregated $689,726,507 and $732,680,289, respectively.
5. Fees and Other Transactions with Affiliates.
Management Fee. Fidelity Management & Research Company (the investment adviser) and its affiliates provide the Fund with investment management related services for which the Fund pays a monthly management fee. The management fee is the sum of an individual fund fee rate that is based on an annual rate of .45% of the Fund's average net assets and an annualized group fee rate that averaged .25% during the period. The group fee rate is based upon the average net assets of all the mutual funds advised by the investment adviser, including any mutual funds previously advised by the investment adviser that are currently advised by Fidelity SelectCo, LLC, an affiliate of the investment adviser. The group fee rate decreases as assets under management increase and increases as assets under management decrease. For the reporting period, the total annual management fee rate was .70% of the Fund's average net assets.
Distribution and Service Plan Fees. In accordance with Rule 12b-1 of the 1940 Act, the Fund has adopted separate Distribution and Service Plans for each class of shares. Certain classes pay Fidelity Distributors Corporation (FDC), an affiliate of the investment adviser, separate Distribution and Service Fees, each of which is based on an annual percentage of each class' average net assets. In addition, FDC may pay financial intermediaries for selling shares of the Fund and providing shareholder support services. For the period, the Distribution and Service Fee rates, total fees and amounts retained by FDC were as follows:
| | Distribution
Fee | Service
Fee | Total Fees | Retained
by FDC |
| Class A | -% | .25% | $105,050 | $2,963 |
| Class T | .25% | .25% | 79,460 | 619 |
| Class B | .75% | .25% | 7,561 | 5,686 |
| Class C | .75% | .25% | 280,577 | 41,543 |
| | | | $472,648 | $50,811 |
Sales Load. FDC may receive a front-end sales charge of up to 5.75% for selling Class A shares and 3.50% for selling Class T shares, some of which is paid to financial intermediaries for selling shares of the Fund. Depending on the holding period, FDC may receive contingent deferred sales charges levied on Class A, Class T, Class B, and Class C redemptions. The deferred sales charges range from 5.00% to 1.00% for Class B shares, 1.00% for Class C shares, 1.00% for certain purchases of Class A shares and .25% for certain purchases of Class T shares.
For the period, sales charge amounts retained by FDC were as follows:
| | Retained
by FDC |
| Class A | $14,042 |
| Class T | 3,846 |
| Class B(a) | 58 |
| Class C(a) | 6,126 |
| | $24,072 |
(a) When Class B and Class C shares are initially sold, FDC pays commissions from its own resources to financial intermediaries through which the sales are made.
Transfer Agent Fees. Fidelity Investments Institutional Operations Company, Inc., (FIIOC), an affiliate of the investment adviser, is the transfer, dividend disbursing and shareholder servicing agent for each class of the Fund. FIIOC receives account fees and asset-based fees that vary according to the account size and type of account of the shareholders of the respective classes of the Fund. FIIOC pays for typesetting, printing and mailing of shareholder reports, except proxy statements.
For the period, transfer agent fees for each class were as follows:
| | Amount | % of
Class-Level Average
Net Assets |
| Class A | $91,625 | .22 |
| Class T | 39,448 | .25 |
| Class B | 1,922 | .26 |
| Class C | 78,134 | .28 |
| Global Balanced | 786,275 | .18 |
| Class I | 10,104 | .17 |
| | $1,007,508 | |
Accounting and Security Lending Fees. Fidelity Service Company, Inc. (FSC), an affiliate of the investment adviser, maintains the Fund's accounting records. The accounting fee is based on the level of average net assets for each month. Under a separate contract, FSC administers the security lending program. The security lending fee is based on the number and duration of lending transactions.
Brokerage Commissions. The Fund placed a portion of its portfolio transactions with brokerage firms which are affiliates of the investment adviser. Brokerage commissions are included in net realized gain (loss) and change in net unrealized appreciation (depreciation) in the Statement of Operations. The commissions paid to these affiliated firms were $6,154 for the period.
Interfund Lending Program. Pursuant to an Exemptive Order issued by the SEC, the Fund, along with other registered investment companies having management contracts with FMR or other affiliated entities of FMR, may participate in an interfund lending program. This program provides an alternative credit facility allowing the funds to borrow from, or lend money to, other participating affiliated funds. At period end, there were no interfund loans outstanding. The Fund's activity in this program during the period for which loans were outstanding was as follows:
| Borrower or Lender | Average Loan Balance | Weighted Average Interest Rate | Interest Expense |
| Borrower | $8,091,000 | .58% | $523 |
Interfund Trades. The Fund may purchase from or sell securities to other Fidelity Funds under procedures adopted by the Board. The procedures have been designed to ensure these interfund trades are executed in accordance with Rule 17a-7 of the 1940 Act. Interfund trades are included within the respective purchases and sales amounts shown in the Purchases and Sales of Investments note.
6. Committed Line of Credit.
The Fund participates with other funds managed by the investment adviser or an affiliate in a $4.25 billion credit facility (the "line of credit") to be utilized for temporary or emergency purposes to fund shareholder redemptions or for other short-term liquidity purposes. The Fund has agreed to pay commitment fees on its pro-rata portion of the line of credit, which amounted to $1,351 and is reflected in Miscellaneous expenses on the Statement of Operations. During the period, the Fund did not borrow on this line of credit.
7. Security Lending.
The Fund lends portfolio securities through a lending agent from time to time in order to earn additional income. For equity securities, a lending agent is used and may loan securities to certain qualified borrowers, including Fidelity Capital Markets (FCM), a broker-dealer affiliated with the Fund. On the settlement date of the loan, the Fund receives collateral (in the form of U.S. Treasury obligations, letters of credit and/or cash) against the loaned securities and maintains collateral in an amount not less than 100% of the market value of the loaned securities during the period of the loan. The market value of the loaned securities is determined at the close of business of the Fund and any additional required collateral is delivered to the Fund on the next business day. The Fund or borrower may terminate the loan at any time, and if the borrower defaults on its obligation to return the securities loaned because of insolvency or other reasons, the Fund may apply collateral received from the borrower against the obligation. The Fund may experience delays and costs in recovering the securities loaned. Any cash collateral received is invested in the Fidelity Securities Lending Cash Central Fund. The value of loaned securities and cash collateral at period end are disclosed on the Fund's Statement of Assets and Liabilities. Security lending income represents the income earned on investing cash collateral, less rebates paid to borrowers and any lending agent fees associated with the loan, plus any premium payments received for lending certain types of securities. Security lending income is presented in the Statement of Operations as a component of income from Fidelity Central Funds. Total security lending income during the period amounted to $36,161. During the period, there were no securities loaned to FCM.
8. Expense Reductions.
Commissions paid to certain brokers with whom the investment adviser, or its affiliates, places trades on behalf of the Fund include an amount in addition to trade execution, which may be rebated back to the Fund to offset certain expenses. This amount totaled $28,175 for the period.
In addition, during the period the investment adviser reimbursed and/or waived a portion of fund-level operating expenses in the amount of $3,846.
9. Distributions to Shareholders.
Distributions to shareholders of each class were as follows:
| | Year ended
October 31, 2016 | Year ended October 31, 2015 |
| From net investment income | | |
| Class A | $– | $21,068 |
| Global Balanced | – | 1,632,478 |
| Class I | – | 18,583 |
| Total | $– | $1,672,129 |
| From net realized gain | | |
| Class A | $1,198,713 | $3,250,151 |
| Class T | 472,741 | 1,204,951 |
| Class B | 38,199 | 119,044 |
| Class C | 844,073 | 1,878,431 |
| Global Balanced | 12,857,308 | 36,937,336 |
| Class I | 173,705 | 426,152 |
| Total | $15,584,739 | $43,816,065 |
10. Share Transactions.
Share transactions for each class were as follows and may contain automatic conversions between classes or exchanges between affiliated funds:
| | Shares | Shares | Dollars | Dollars |
| | Year ended
October 31, 2016 | Year ended October 31, 2015 | Year ended
October 31, 2016 | Year ended October 31, 2015 |
| Class A | | | | |
| Shares sold | 315,518 | 342,368 | $6,953,190 | $7,938,746 |
| Reinvestment of distributions | 52,986 | 138,033 | 1,141,851 | 3,123,694 |
| Shares redeemed | (405,081) | (521,026) | (9,020,050) | (12,017,082) |
| Net increase (decrease) | (36,577) | (40,625) | $(925,009) | $(954,642) |
| Class T | | | | |
| Shares sold | 72,280 | 115,195 | $1,589,041 | $2,671,230 |
| Reinvestment of distributions | 21,845 | 52,572 | 467,928 | 1,186,019 |
| Shares redeemed | (154,320) | (136,517) | (3,396,160) | (3,134,575) |
| Net increase (decrease) | (60,195) | 31,250 | $(1,339,191) | $722,674 |
| Class B | | | | |
| Shares sold | 48 | 1,702 | $1,021 | $39,359 |
| Reinvestment of distributions | 1,741 | 5,016 | 37,184 | 113,421 |
| Shares redeemed | (62,152) | (29,264) | (1,356,722) | (670,876) |
| Net increase (decrease) | (60,363) | (22,546) | $(1,318,517) | $(518,096) |
| Class C | | | | |
| Shares sold | 227,726 | 290,996 | $4,917,879 | $6,638,000 |
| Reinvestment of distributions | 37,381 | 76,970 | 787,624 | 1,717,971 |
| Shares redeemed | (295,837) | (311,709) | (6,357,105) | (7,093,083) |
| Net increase (decrease) | (30,730) | 56,257 | $(651,602) | $1,262,888 |
| Global Balanced | | | | |
| Shares sold | 2,114,763 | 2,245,199 | $47,490,820 | $52,274,696 |
| Reinvestment of distributions | 560,214 | 1,612,167 | 12,195,855 | 36,741,286 |
| Shares redeemed | (4,162,916) | (6,083,367) | (93,142,954) | (141,655,708) |
| Net increase (decrease) | (1,487,939) | (2,226,001) | $(33,456,279) | $(52,639,726) |
| Class I | | | | |
| Shares sold | 69,161 | 195,822 | $1,567,504 | $4,546,299 |
| Reinvestment of distributions | 6,856 | 15,294 | 148,834 | 347,634 |
| Shares redeemed | (95,184) | (208,476) | (2,155,432) | (4,837,091) |
| Net increase (decrease) | (19,167) | 2,640 | $(439,094) | $56,842 |
11. Other.
The Fund's organizational documents provide former and current trustees and officers with a limited indemnification against liabilities arising in connection with the performance of their duties to the Fund. In the normal course of business, the Fund may also enter into contracts that provide general indemnifications. The Fund's maximum exposure under these arrangements is unknown as this would be dependent on future claims that may be made against the Fund. The risk of material loss from such claims is considered remote.
Report of Independent Registered Public Accounting Firm
To the Trustees of Fidelity Charles Street Trust and Shareholders of Fidelity Global Balanced Fund:
In our opinion, the accompanying statement of assets and liabilities, including the schedule of investments, and the related statements of operations and of changes in net assets and the financial highlights present fairly, in all material respects, the financial position of Fidelity Global Balanced Fund (a fund of Fidelity Charles Street Trust) at October 31, 2016, the results of its operations for the year then ended, the changes in its net assets for each of the two years in the period then ended and the financial highlights for each of the five years in the period then ended, in conformity with accounting principles generally accepted in the United States of America. These financial statements and financial highlights (hereafter referred to as “financial statements”) are the responsibility of the Fidelity Global Balanced Fund’s management. Our responsibility is to express an opinion on these financial statements based on our audits. We conducted our audits of these financial statements in accordance with the standards of the Public Company Accounting Oversight Board (United States). Those standards require that we plan and perform the audit to obtain reasonable assurance about whether the financial statements are free of material misstatement. An audit includes examining, on a test basis, evidence supporting the amounts and disclosures in the financial statements, assessing the accounting principles used and significant estimates made by management, and evaluating the overall financial statement presentation. We believe that our audits, which included confirmation of securities at October 31, 2016 by correspondence with the custodian and brokers, provide a reasonable basis for our opinion.
PricewaterhouseCoopers LLP
Boston, Massachusetts
December 15, 2016
Trustees and Officers
The Trustees, Members of the Advisory Board (if any), and officers of the trust and fund, as applicable, are listed below. The Board of Trustees governs the fund and is responsible for protecting the interests of shareholders. The Trustees are experienced executives who meet periodically throughout the year to oversee the fund's activities, review contractual arrangements with companies that provide services to the fund, oversee management of the risks associated with such activities and contractual arrangements, and review the fund's performance. Except for Jennifer Toolin McAuliffe and Mark A. Murray, each of the Trustees oversees 244 funds. Ms. McAuliffe and Mr. Murray each oversees 191 funds.
The Trustees hold office without limit in time except that (a) any Trustee may resign; (b) any Trustee may be removed by written instrument, signed by at least two-thirds of the number of Trustees prior to such removal; (c) any Trustee who requests to be retired or who has become incapacitated by illness or injury may be retired by written instrument signed by a majority of the other Trustees; and (d) any Trustee may be removed at any special meeting of shareholders by a two-thirds vote of the outstanding voting securities of the trust. Each Trustee who is not an interested person (as defined in the 1940 Act) of the trust and the fund is referred to herein as an Independent Trustee. Each Independent Trustee shall retire not later than the last day of the calendar year in which his or her 75th birthday occurs. The Independent Trustees may waive this mandatory retirement age policy with respect to individual Trustees. Officers and Advisory Board Members hold office without limit in time, except that any officer or Advisory Board Member may resign or may be removed by a vote of a majority of the Trustees at any regular meeting or any special meeting of the Trustees. Except as indicated, each individual has held the office shown or other offices in the same company for the past five years.
The fund’s Statement of Additional Information (SAI) includes more information about the Trustees. To request a free copy, call Fidelity at 1-877-208-0098.
Experience, Skills, Attributes, and Qualifications of the Trustees. The Governance and Nominating Committee has adopted a statement of policy that describes the experience, qualifications, attributes, and skills that are necessary and desirable for potential Independent Trustee candidates (Statement of Policy). The Board believes that each Trustee satisfied at the time he or she was initially elected or appointed a Trustee, and continues to satisfy, the standards contemplated by the Statement of Policy. The Governance and Nominating Committee also engages professional search firms to help identify potential Independent Trustee candidates who have the experience, qualifications, attributes, and skills consistent with the Statement of Policy. From time to time, additional criteria based on the composition and skills of the current Independent Trustees, as well as experience or skills that may be appropriate in light of future changes to board composition, business conditions, and regulatory or other developments, have also been considered by the professional search firms and the Governance and Nominating Committee. In addition, the Board takes into account the Trustees' commitment and participation in Board and committee meetings, as well as their leadership of standing and ad hoc committees throughout their tenure.
In determining that a particular Trustee was and continues to be qualified to serve as a Trustee, the Board has considered a variety of criteria, none of which, in isolation, was controlling. The Board believes that, collectively, the Trustees have balanced and diverse experience, qualifications, attributes, and skills, which allow the Board to operate effectively in governing the fund and protecting the interests of shareholders. Information about the specific experience, skills, attributes, and qualifications of each Trustee, which in each case led to the Board's conclusion that the Trustee should serve (or continue to serve) as a trustee of the fund, is provided below.
Board Structure and Oversight Function. Abigail P. Johnson is an interested person and currently serves as Chairman. The Trustees have determined that an interested Chairman is appropriate and benefits shareholders because an interested Chairman has a personal and professional stake in the quality and continuity of services provided to the fund. Independent Trustees exercise their informed business judgment to appoint an individual of their choosing to serve as Chairman, regardless of whether the Trustee happens to be independent or a member of management. The Independent Trustees have determined that they can act independently and effectively without having an Independent Trustee serve as Chairman and that a key structural component for assuring that they are in a position to do so is for the Independent Trustees to constitute a substantial majority for the Board. The Independent Trustees also regularly meet in executive session. Marie L. Knowles serves as Chairman of the Independent Trustees and as such (i) acts as a liaison between the Independent Trustees and management with respect to matters important to the Independent Trustees and (ii) with management prepares agendas for Board meetings.
Fidelity® funds are overseen by different Boards of Trustees. The fund's Board oversees Fidelity's investment-grade bond, money market, asset allocation and certain equity funds, and other Boards oversee Fidelity's high income, sector and other equity funds. The asset allocation funds may invest in Fidelity® funds that are overseen by such other Boards. The use of separate Boards, each with its own committee structure, allows the Trustees of each group of Fidelity® funds to focus on the unique issues of the funds they oversee, including common research, investment, and operational issues. On occasion, the separate Boards establish joint committees to address issues of overlapping consequences for the Fidelity® funds overseen by each Board.
The Trustees operate using a system of committees to facilitate the timely and efficient consideration of all matters of importance to the Trustees, the fund, and fund shareholders and to facilitate compliance with legal and regulatory requirements and oversight of the fund's activities and associated risks. The Board, acting through its committees, has charged FMR and its affiliates with (i) identifying events or circumstances the occurrence of which could have demonstrably adverse effects on the fund's business and/or reputation; (ii) implementing processes and controls to lessen the possibility that such events or circumstances occur or to mitigate the effects of such events or circumstances if they do occur; and (iii) creating and maintaining a system designed to evaluate continuously business and market conditions in order to facilitate the identification and implementation processes described in (i) and (ii) above. Because the day-to-day operations and activities of the fund are carried out by or through FMR, its affiliates, and other service providers, the fund's exposure to risks is mitigated but not eliminated by the processes overseen by the Trustees. While each of the Board's committees has responsibility for overseeing different aspects of the fund's activities, oversight is exercised primarily through the Operations and Audit Committees. In addition, an ad hoc Board committee of Independent Trustees has worked with FMR to enhance the Board's oversight of investment and financial risks, legal and regulatory risks, technology risks, and operational risks, including the development of additional risk reporting to the Board. Appropriate personnel, including but not limited to the fund's Chief Compliance Officer (CCO), FMR's internal auditor, the independent accountants, the fund's Treasurer and portfolio management personnel, make periodic reports to the Board's committees, as appropriate, including an annual review of Fidelity's risk management program for the Fidelity® funds. The responsibilities of each standing committee, including their oversight responsibilities, are described further under "Standing Committees of the Trustees."
Interested Trustees*:
Correspondence intended for a Trustee who is an interested person may be sent to Fidelity Investments, 245 Summer Street, Boston, Massachusetts 02210.
Name, Year of Birth; Principal Occupations and Other Relevant Experience+
Abigail P. Johnson (1961)
Year of Election or Appointment: 2009
Trustee
Chairman of the Board of Trustees
Ms. Johnson also serves as Trustee of other Fidelity® funds. Ms. Johnson serves as President (2013-present) and Chief Executive Officer (2014-present) of FMR LLC (diversified financial services company), President of Fidelity Financial Services (2012-present) and President of Personal, Workplace and Institutional Services (2005-present). Ms. Johnson is Chairman and Director of FMR Co., Inc. (investment adviser firm, 2011-present), Chairman and Director of FMR (investment adviser firm, 2011-present), and the Vice Chairman and Director (2007-present) of FMR LLC. Previously, Ms. Johnson served as President and a Director of FMR (2001-2005), a Trustee of other investment companies advised by FMR, Fidelity Investments Money Management, Inc. (investment adviser firm), and FMR Co., Inc. (2001-2005), Senior Vice President of the Fidelity® funds (2001-2005), and managed a number of Fidelity® funds. Ms. Abigail P. Johnson and Mr. Arthur E. Johnson are not related.
Jennifer Toolin McAuliffe (1959)
Year of Election or Appointment: 2016
Trustee
Ms. McAuliffe also serves as Trustee or Member of the Advisory Board of other Fidelity® funds. Ms. McAuliffe previously served as Co-Head of Fixed Income of Fidelity Investments Limited (now known as FIL Limited (FIL)) (diversified financial services company). Earlier roles at FIL included Director of Research for FIL’s credit and quantitative teams in London, Hong Kong and Tokyo. Ms. McAuliffe also was the Director of Research for taxable and municipal bonds at Fidelity Investments Money Management, Inc. Ms. McAuliffe is also a director or trustee of several not-for-profit entities.
* Determined to be an “Interested Trustee” by virtue of, among other things, his or her affiliation with the trust or various entities under common control with FMR.
+ The information includes the Trustee's principal occupation during the last five years and other information relating to the experience, attributes, and skills relevant to the Trustee's qualifications to serve as a Trustee, which led to the conclusion that the Trustee should serve as a Trustee for the fund.
Independent Trustees:
Correspondence intended for an Independent Trustee may be sent to Fidelity Investments, P.O. Box 55235, Boston, Massachusetts 02205-5235.
Name, Year of Birth; Principal Occupations and Other Relevant Experience+
Elizabeth S. Acton (1951)
Year of Election or Appointment: 2013
Trustee
Ms. Acton also serves as Trustee of other Fidelity® funds. Prior to her retirement in April 2012, Ms. Acton was Executive Vice President, Finance (2011-2012), Executive Vice President, Chief Financial Officer (2002-2011), and Treasurer (2004-2005) of Comerica Incorporated (financial services). Prior to joining Comerica, Ms. Acton held a variety of positions at Ford Motor Company (1983-2002), including Vice President and Treasurer (2000-2002) and Executive Vice President and Chief Financial Officer of Ford Motor Credit Company (1998-2000). Ms. Acton currently serves as a member of the Board of Directors and Audit and Finance Committees of Beazer Homes USA, Inc. (homebuilding, 2012-present). Previously, Ms. Acton served as a Member of the Advisory Board of certain Fidelity® funds (2013-2016).
John Engler (1948)
Year of Election or Appointment: 2014
Trustee
Mr. Engler also serves as Trustee of other Fidelity® funds. He serves as president of the Business Roundtable (2011-present), and on the board of directors for Universal Forest Products (manufacturer and distributor of wood and wood-alternative products, 2003-present) and K12 Inc. (technology-based education company, 2012-present). Previously, Mr. Engler served as a Member of the Advisory Board of certain Fidelity® funds (2014-2016), a trustee of The Munder Funds (2003-2014), president and CEO of the National Association of Manufacturers (2004-2011), member of the Board of Trustees of the Annie E. Casey Foundation (2004-2015), and as governor of Michigan (1991-2003). He is a past chairman of the National Governors Association.
Albert R. Gamper, Jr. (1942)
Year of Election or Appointment: 2006
Trustee
Mr. Gamper also serves as Trustee of other Fidelity® funds. Prior to his retirement in December 2004, Mr. Gamper served as Chairman of the Board of CIT Group Inc. (commercial finance). During his tenure with CIT Group Inc. Mr. Gamper served in numerous senior management positions, including Chairman (1987-1989; 1999-2001; 2002-2004), Chief Executive Officer (1987-2004), and President (2002-2003). Mr. Gamper currently serves as a member of the Board of Directors of Public Service Enterprise Group (utilities, 2000-present), and Member of the Board of Trustees of Barnabas Health Care System (1997-present). Previously, Mr. Gamper served as Chairman (2012-2015) and Vice Chairman (2011-2012) of the Independent Trustees of certain Fidelity® funds and as Chairman of the Board of Governors, Rutgers University (2004-2007).
Robert F. Gartland (1951)
Year of Election or Appointment: 2010
Trustee
Mr. Gartland also serves as Trustee of other Fidelity® funds. Mr. Gartland is Chairman and an investor in Gartland & Mellina Group Corp. (consulting, 2009-present). Previously, Mr. Gartland served as a partner and investor of Vietnam Partners LLC (investments and consulting, 2008-2011). Prior to his retirement, Mr. Gartland held a variety of positions at Morgan Stanley (financial services, 1979-2007) including Managing Director (1987-2007).
Arthur E. Johnson (1947)
Year of Election or Appointment: 2008
Trustee
Vice Chairman of the Independent Trustees
Mr. Johnson also serves as Trustee of other Fidelity® funds. Mr. Johnson serves as a member of the Board of Directors of Eaton Corporation plc (diversified power management, 2009-present), AGL Resources, Inc. (holding company, 2002-present) and Booz Allen Hamilton (management consulting, 2011-present). Prior to his retirement, Mr. Johnson served as Senior Vice President of Corporate Strategic Development of Lockheed Martin Corporation (defense contractor, 1999-2009). He previously served on the Board of Directors of IKON Office Solutions, Inc. (1999-2008) and Delta Airlines (2005-2007). Mr. Arthur E. Johnson is not related to Ms. Abigail P. Johnson.
Michael E. Kenneally (1954)
Year of Election or Appointment: 2009
Trustee
Mr. Kenneally also serves as Trustee of other Fidelity® funds. Prior to his retirement, Mr. Kenneally served as Chairman and Global Chief Executive Officer of Credit Suisse Asset Management. Before joining Credit Suisse, he was an Executive Vice President and Chief Investment Officer for Bank of America Corporation. Earlier roles at Bank of America included Director of Research, Senior Portfolio Manager and Research Analyst, and Mr. Kenneally was awarded the Chartered Financial Analyst (CFA) designation in 1991.
James H. Keyes (1940)
Year of Election or Appointment: 2007
Trustee
Mr. Keyes also serves as Trustee of other Fidelity® funds. Mr. Keyes serves as a member of the Board and Non-Executive Chairman of Navistar International Corporation (manufacture and sale of trucks, buses, and diesel engines, since 2002). Previously, Mr. Keyes served as a member of the Board of Pitney Bowes, Inc. (integrated mail, messaging, and document management solutions, 1998-2013). Prior to his retirement, Mr. Keyes served as Chairman (1993-2002) and Chief Executive Officer (1988-2002) of Johnson Controls (automotive, building, and energy) and as a member of the Board of LSI Logic Corporation (semiconductor technologies, 1984-2008).
Marie L. Knowles (1946)
Year of Election or Appointment: 2001
Trustee
Chairman of the Independent Trustees
Ms. Knowles also serves as Trustee of other Fidelity® funds. Prior to Ms. Knowles' retirement in June 2000, she served as Executive Vice President and Chief Financial Officer of Atlantic Richfield Company (ARCO) (diversified energy, 1996-2000). From 1993 to 1996, she was a Senior Vice President of ARCO and President of ARCO Transportation Company (pipeline and tanker operations). Ms. Knowles currently serves as a Director and Chairman of the Audit Committee of McKesson Corporation (healthcare service, since 2002). Ms. Knowles is a member of the Board of the Santa Catalina Island Company (real estate, 2009-present). Ms. Knowles is a Member of the Investment Company Institute Board of Governors and a Member of the Governing Council of the Independent Directors Council (2014-present). She also serves as a member of the Advisory Board for the School of Engineering of the University of Southern California. Previously, Ms. Knowles served as a Director of Phelps Dodge Corporation (copper mining and manufacturing, 1994-2007), URS Corporation (engineering and construction, 2000-2003) and America West (airline, 1999-2002). Ms. Knowles previously served as Vice Chairman of the Independent Trustees of certain Fidelity® funds (2012-2015).
Mark A. Murray (1954)
Year of Election or Appointment: 2016
Trustee
Mr. Murray also serves as Trustee or Member of the Advisory Board of other Fidelity® funds. Mr. Murray is Vice Chairman (2013-present) of Meijer, Inc. (regional retail chain). Previously, Mr. Murray served as Co-Chief Executive Officer (2013-2016) and President (2006-2013) of Meijer, Inc. Mr. Murray serves as a member of the Board of Directors and Nuclear Review and Public Policy and Responsibility Committees of DTE Energy Company (diversified energy company, 2009-present). Mr. Murray also serves as a member of the Board of Directors of Spectrum Health (not-for-profit health system, 2015-present). Mr. Murray previously served as President of Grand Valley State University (2001-2006), Treasurer for the State of Michigan (1999-2001), Vice President of Finance and Administration for Michigan State University (1998-1999), and a member of the Board of Directors and Audit Committee and Chairman of the Nominating and Corporate Governance Committee of Universal Forest Products, Inc. (manufacturer and distributor of wood and wood-alternative products, 2004-2016). Mr. Murray is also a director or trustee of many community and professional organizations.
+ The information includes the Trustee's principal occupation during the last five years and other information relating to the experience, attributes, and skills relevant to the Trustee's qualifications to serve as a Trustee, which led to the conclusion that the Trustee should serve as a Trustee for the fund.
Advisory Board Members and Officers:
Correspondence intended for an officer may be sent to Fidelity Investments, 245 Summer Street, Boston, Massachusetts 02210. Officers appear below in alphabetical order.
Name, Year of Birth; Principal Occupation
Marc R. Bryant (1966)
Year of Election or Appointment: 2015
Secretary and Chief Legal Officer (CLO)
Mr. Bryant also serves as Secretary and CLO of other funds. Mr. Bryant serves as CLO, Secretary, and Senior Vice President of Fidelity Management & Research Company (investment adviser firm, 2015-present) and FMR Co., Inc. (investment adviser firm, 2015-present); Secretary of Fidelity SelectCo, LLC (investment adviser firm, 2015-present) and Fidelity Investments Money Management, Inc. (investment adviser firm, 2015-present); and CLO of Fidelity Management & Research (Hong Kong) Limited and FMR Investment Management (UK) Limited (investment adviser firms, 2015-present) and Fidelity Management & Research (Japan) Limited (investment adviser firm, 2016-present). He is Senior Vice President and Deputy General Counsel of FMR LLC (diversified financial services company). Previously, Mr. Bryant served as Secretary and CLO of Fidelity Rutland Square Trust II (2010-2014) and Assistant Secretary of Fidelity's Fixed Income and Asset Allocation Funds (2013-2015). Prior to joining Fidelity Investments, Mr. Bryant served as a Senior Vice President and the Head of Global Retail Legal for AllianceBernstein L.P. (2006-2010), and as the General Counsel for ProFund Advisors LLC (2001-2006).
Jeffrey S. Christian (1961)
Year of Election or Appointment: 2016
Assistant Treasurer
Mr. Christian also serves as Assistant Treasurer of other funds. Mr. Christian is an employee of Fidelity Investments (2003-present).
Jonathan Davis (1968)
Year of Election or Appointment: 2010
Assistant Treasurer
Mr. Davis also serves as Assistant Treasurer of other funds, and is an employee of Fidelity Investments. Previously, Mr. Davis served as Vice President and Associate General Counsel of FMR LLC (diversified financial services company, 2003-2010).
Adrien E. Deberghes (1967)
Year of Election or Appointment: 2010
Assistant Treasurer
Mr. Deberghes also serves as an officer of other funds. He serves as Executive Vice President of Fidelity Investments Money Management, Inc. (FIMM) (investment adviser firm, 2016-present) and is an employee of Fidelity Investments (2008-present). Prior to joining Fidelity Investments, Mr. Deberghes was Senior Vice President of Mutual Fund Administration at State Street Corporation (2007-2008), Senior Director of Mutual Fund Administration at Investors Bank & Trust (2005-2007), and Director of Finance for Dunkin' Brands (2000-2005). Previously, Mr. Deberghes served in other fund officer roles.
Stephanie J. Dorsey (1969)
Year of Election or Appointment: 2013
President and Treasurer
Ms. Dorsey also serves as an officer of other funds. She is an employee of Fidelity Investments (2008-present) and has served in other fund officer roles. Prior to joining Fidelity Investments, Ms. Dorsey served as Treasurer (2004-2008) of the JPMorgan Mutual Funds and Vice President (2004-2008) of JPMorgan Chase Bank.
Howard J. Galligan III (1966)
Year of Election or Appointment: 2014
Chief Financial Officer
Mr. Galligan also serves as Chief Financial Officer of other funds. Mr. Galligan serves as President of Fidelity Pricing and Cash Management Services (FPCMS) (2014-present) and as a Director of Strategic Advisers, Inc. (investment adviser firm, 2008-present). Previously, Mr. Galligan served as Chief Administrative Officer of Asset Management (2011-2014) and Chief Operating Officer and Senior Vice President of Investment Support for Strategic Advisers, Inc. (2003-2011).
Scott C. Goebel (1968)
Year of Election or Appointment: 2015
Vice President
Mr. Goebel serves as Vice President of other funds and is an employee of Fidelity Investments (2001-present). Previously, Mr. Goebel served as Senior Vice President of Fidelity Management & Research Company (FMR) (investment adviser firm, 2016), Secretary of Fidelity SelectCo, LLC (investment adviser firm, 2013-2015), Fidelity Investments Money Management, Inc. (FIMM) (investment adviser firm, 2010-2015), and Fidelity Research and Analysis Company (FRAC) (investment adviser firm, 2010-2015); General Counsel, Secretary, and Senior Vice President of FMR (investment adviser firm, 2008-2015) and FMR Co., Inc. (investment adviser firm, 2008-2015); Assistant Secretary of Fidelity Management & Research (Japan) Limited (investment adviser firm, 2008-2015) and Fidelity Management & Research (U.K.) Inc. (investment adviser firm, 2008-2015); Chief Legal Officer (CLO) of Fidelity Management & Research (Hong Kong) Limited (investment adviser firm, 2008-2015); Secretary and CLO of certain Fidelity® funds (2008-2015); Assistant Secretary of FIMM (2008-2010), FRAC (2008-2010), and certain funds (2007-2008); and as Vice President and Secretary of Fidelity Distributors Corporation (FDC) (2005-2007).
Colm A. Hogan (1973)
Year of Election or Appointment: 2016
Assistant Treasurer
Mr. Hogan also serves as an officer of other funds. Mr. Hogan is an employee of Fidelity Investments (2005-present).
Chris Maher (1972)
Year of Election or Appointment: 2013
Assistant Treasurer
Mr. Maher serves as Assistant Treasurer of other funds. Mr. Maher is Vice President of Valuation Oversight and is an employee of Fidelity Investments. Previously, Mr. Maher served as Vice President of Asset Management Compliance (2013), Vice President of the Program Management Group of FMR (investment adviser firm, 2010-2013), and Vice President of Valuation Oversight (2008-2010).
John B. McGinty, Jr. (1962)
Year of Election or Appointment: 2016
Chief Compliance Officer
Mr. McGinty also serves as Chief Compliance Officer of other funds. Mr. McGinty is Senior Vice President of Asset Management Compliance for Fidelity Investments and is an employee of Fidelity Investments (2016-present). Mr. McGinty previously served as Vice President, Senior Attorney at Eaton Vance Management (investment management firm, 2015-2016), and prior to Eaton Vance as global CCO for all firm operations and registered investment companies at GMO LLC (investment management firm, 2009-2015). Before joining GMO LLC, Mr. McGinty served as Senior Vice President, Deputy General Counsel for Fidelity Investments (2007-2009).
John F. Papandrea (1972)
Year of Election or Appointment: 2016
Anti-Money Laundering (AML) Officer
Mr. Papandrea also serves as AML Officer of other funds. Mr. Papandrea is Vice President of FMR LLC (diversified financial services company, 2008-present) and is an employee of Fidelity Investments (2005-present).
Jason P. Pogorelec (1975)
Year of Election or Appointment: 2015
Assistant Secretary
Mr. Pogorelec also serves as Assistant Secretary of other funds. Mr. Pogorelec serves as Vice President, Associate General Counsel (2010-present) and is an employee of Fidelity Investments (2006-present).
Nancy D. Prior (1967)
Year of Election or Appointment: 2014
Vice President
Ms. Prior also serves as Vice President of other funds. Ms. Prior serves as a Director of FMR Investment Management (UK) Limited (investment adviser firm, 2015-present), President (2016-present) and Director (2014-present) of Fidelity Investments Money Management, Inc. (FIMM) (investment adviser firm), President, Fixed Income (2014-present), Vice Chairman of FIAM LLC (investment adviser firm, 2014-present), and is an employee of Fidelity Investments (2002-present). Previously, Ms. Prior served as Vice President of Fidelity's Money Market Funds (2012-2014), President, Money Market and Short Duration Bond Group of Fidelity Management & Research (FMR) (investment adviser firm, 2013-2014), President, Money Market Group of FMR (2011-2013), Managing Director of Research (2009-2011), Senior Vice President and Deputy General Counsel (2007-2009), and Assistant Secretary of certain Fidelity® funds (2008-2009).
Stacie M. Smith (1974)
Year of Election or Appointment: 2013
Assistant Treasurer
Ms. Smith also serves as an officer of other funds. She is an employee of Fidelity Investments (2009-present) and has served in other fund officer roles. Prior to joining Fidelity Investments, Ms. Smith served as Senior Audit Manager of Ernst & Young LLP (accounting firm, 1996-2009). Previously, Ms. Smith served as Deputy Treasurer of certain Fidelity® funds (2013-2016).
Marc L. Spector (1972)
Year of Election or Appointment: 2016
Deputy Treasurer
Mr. Spector also serves as an officer of other funds. Mr. Spector is an employee of Fidelity Investments (2016-present). Prior to joining Fidelity Investments, Mr. Spector served as Director at the Siegfried Group (accounting firm, 2013-2016), and prior to Siegfried Group as audit senior manager at Deloitte & Touche (accounting firm, 2005-2013).
Renee Stagnone (1975)
Year of Election or Appointment: 2016
Assistant Treasurer
Ms. Stagnone also serves as an officer of other funds. Ms. Stagnone is an employee of Fidelity Investments (1997-present). Previously, Ms. Stagnone served as Deputy Treasurer of certain Fidelity® funds (2013-2016).
Derek L. Young (1964)
Year of Election or Appointment: 2009
Vice President of Fidelity's Asset Allocation Funds
Mr. Young also serves as an officer of other funds. He is a Director of Strategic Advisers, Inc. (investment adviser firm, 2011-present) and FMR Investment Management (UK) Limited (investment adviser firm, 2016-present), President of Fidelity Global Asset Allocation (GAA) (2011-present), and Vice Chairman of FIAM LLC (investment adviser firm, 2011-present). Previously, Mr. Young served as Trustee of certain funds (2012-2015), President of Strategic Advisers, Inc. (2011-2015), Chief Investment Officer of GAA (2009-2011), and as a portfolio manager.
Shareholder Expense Example
As a shareholder of the Fund, you incur two types of costs: (1) transaction costs, including sales charges (loads) on purchase payments or redemption proceeds, redemption fees and (2) ongoing costs, including management fees, distribution and/or service (12b-1) fees and other Fund expenses. This Example is intended to help you understand your ongoing costs (in dollars) of investing in the Fund and to compare these costs with the ongoing costs of investing in other mutual funds.
The Example is based on an investment of $1,000 invested at the beginning of the period and held for the entire period (May 1, 2016 to October 31, 2016).
Actual Expenses
The first line of the accompanying table for each class of the Fund provides information about actual account values and actual expenses. You may use the information in this line, together with the amount you invested, to estimate the expenses that you paid over the period. Simply divide your account value by $1,000.00 (for example, an $8,600 account value divided by $1,000.00 = 8.6), then multiply the result by the number in the first line for a class of the Fund under the heading entitled "Expenses Paid During Period" to estimate the expenses you paid on your account during this period. A small balance maintenance fee of $12.00 that is charged once a year may apply for certain accounts with a value of less than $2,000. This fee is not included in the table below. If it was, the estimate of expenses you paid during the period would be higher, and your ending account value lower, by this amount. In addition, the Fund, as a shareholder in the underlying Fidelity Central Funds, will indirectly bear its pro-rata share of the fees and expenses incurred by the underlying Fidelity Central Funds. These fees and expenses are not included in the Fund's annualized expense ratio used to calculate the expense estimate in the table below.
Hypothetical Example for Comparison Purposes
The second line of the accompanying table for each class of the Fund provides information about hypothetical account values and hypothetical expenses based on a Class' actual expense ratio and an assumed rate of return of 5% per year before expenses, which is not the Class' actual return. The hypothetical account values and expenses may not be used to estimate the actual ending account balance or expenses you paid for the period. You may use this information to compare the ongoing costs of investing in the Fund and other funds. To do so, compare this 5% hypothetical example with the 5% hypothetical examples that appear in the shareholder reports of the other funds. A small balance maintenance fee of $12.00 that is charged once a year may apply for certain accounts with a value of less than $2,000. This fee is not included in the table below. If it was, the estimate of expenses you paid during the period would be higher, and your ending account value lower, by this amount. In addition, the Fund, as a shareholder in the underlying Fidelity Central Funds, will indirectly bear its pro-rata share of the fees and expenses incurred by the underlying Fidelity Central Funds. These fees and expenses are not included in the Fund's annualized expense ratio used to calculate the expense estimate in the table below.
Please note that the expenses shown in the table are meant to highlight your ongoing costs only and do not reflect any transaction costs. Therefore, the second line of the table is useful in comparing ongoing costs only, and will not help you determine the relative total costs of owning different funds. In addition, if these transactional costs were included, your costs would have been higher.
| | Annualized Expense Ratio-A | Beginning
Account Value
May 1, 2016 | Ending
Account Value
October 31, 2016 | Expenses Paid
During Period-B
May 1, 2016
to October 31, 2016 |
| Class A | 1.28% | | | |
| Actual | | $1,000.00 | $1,000.90 | $6.44 |
| Hypothetical-C | | $1,000.00 | $1,018.70 | $6.50 |
| Class T | 1.56% | | | |
| Actual | | $1,000.00 | $999.60 | $7.84 |
| Hypothetical-C | | $1,000.00 | $1,017.29 | $7.91 |
| Class C | 2.09% | | | |
| Actual | | $1,000.00 | $996.80 | $10.49 |
| Hypothetical-C | | $1,000.00 | $1,014.63 | $10.58 |
| Global Balanced | .99% | | | |
| Actual | | $1,000.00 | $1,002.20 | $4.98 |
| Hypothetical-C | | $1,000.00 | $1,020.16 | $5.03 |
| Class I | .99% | | | |
| Actual | | $1,000.00 | $1,002.70 | $4.98 |
| Hypothetical-C | | $1,000.00 | $1,020.16 | $5.03 |
A Annualized expense ratio reflects expenses net of applicable fee waivers.
B Expenses are equal to each Class' annualized expense ratio, multiplied by the average account value over the period, multiplied by 184/366 (to reflect the one-half year period). In addition to the expenses noted above, the Fund also indirectly bears its proportional share of the expenses of the underlying Fidelity Central Funds. Annualized expenses of the underlying non-money market Fidelity Central Funds as of their most recent fiscal half year ranged from .06% to .09%.
C 5% return per year before expenses
Distributions (Unaudited)
The Board of Trustees of Fidelity Global Balanced Fund voted to pay to shareholders of record at the opening of business on record date, the following distributions per share derived from capital gains realized from sales of portfolio securities, and dividends derived from net investment income:
| | Pay Date | Record Date | Dividends | Capital Gains |
| Fidelity Global Balanced Fund | | | | |
| Class A | 12/12/16 | 12/09/16 | $0.005 | $0.080 |
| Class C | 12/12/16 | 12/09/16 | $0.000 | $0.080 |
| Class I | 12/12/16 | 12/09/16 | $0.015 | $0.080 |
| Fidelity Global Balanced Fund | 12/12/16 | 12/09/16 | $0.015 | $0.080 |
| Class T | 12/12/16 | 12/09/16 | $ 0.000 | $ 0.080 |
|
The fund hereby designates as a capital gain dividend with respect to the taxable year ended October 31, 2016, $1,791,203, or, if subsequently determined to be different, the net capital gain of such year.
A total of 6.46% of the dividends distributed during the fiscal year was derived from interest on U.S. Government securities which is generally exempt from state income tax.
The fund will notify shareholders in January 2017 of amounts for use in preparing 2016 income tax returns.
Board Approval of Investment Advisory Contracts and Management Fees
Fidelity Global Balanced Fund
Each year, the Board of Trustees, including the Independent Trustees (together, the Board), votes on the renewal of the management contract with Fidelity Management & Research Company (FMR) and the sub-advisory agreements (together, the Advisory Contracts) for the fund. The Board, assisted by the advice of fund counsel and Independent Trustees' counsel, requests and considers a broad range of information relevant to the renewal of the Advisory Contracts throughout the year.
The Board meets regularly and, at each of its meetings, covers an extensive agenda of topics and materials and considers factors that are relevant to its annual consideration of the renewal of the fund's Advisory Contracts, including the services and support provided to the fund and its shareholders. The Board has established four standing committees (Committees) — Operations, Audit, Fair Valuation, and Governance and Nominating — each composed of and chaired by Independent Trustees with varying backgrounds, to which the Board has assigned specific subject matter responsibilities in order to enhance effective decision-making by the Board. The Operations Committee, of which all of the Independent Trustees are members, meets regularly throughout the year and considers, among other matters, information specifically related to the annual consideration of the renewal of the fund's Advisory Contracts. The Board, acting directly and through its Committees, requests and receives information concerning the annual consideration of the renewal of the fund's Advisory Contracts. The Board also meets as needed to consider matters specifically related to the Board's annual consideration of the renewal of the Advisory Contracts. Members of the Board may also meet with trustees of other Fidelity funds through ad hoc joint committees to discuss certain matters relevant to all of the Fidelity funds.
At its September 2016 meeting, the Board unanimously determined to renew the fund's Advisory Contracts. In reaching its determination, the Board considered all factors it believed relevant, including (i) the nature, extent, and quality of the services to be provided to the fund and its shareholders (including the investment performance of the fund); (ii) the competitiveness of the fund's management fee and total expense ratio relative to peer funds; (iii) the total costs of the services to be provided by and the profits to be realized by Fidelity from its relationships with the fund; and (iv) the extent to which, if any, economies of scale exist and would be realized as the fund grows, and whether any economies of scale are appropriately shared with fund shareholders.
In considering whether to renew the Advisory Contracts for the fund, the Board reached a determination, with the assistance of fund counsel and Independent Trustees' counsel and through the exercise of its business judgment, that the renewal of the Advisory Contracts was in the best interests of the fund and its shareholders and that the compensation payable under the Advisory Contracts was fair and reasonable. The Board's decision to renew the Advisory Contracts was not based on any single factor, but rather was based on a comprehensive consideration of all the information provided to the Board at its meetings throughout the year. The Board, in reaching its determination to renew the Advisory Contracts, was aware that shareholders of the fund have a broad range of investment choices available to them, including a wide choice among funds offered by Fidelity's competitors, and that the fund's shareholders, who have the opportunity to review and weigh the disclosure provided by the fund in its prospectus and other public disclosures, have chosen to invest in this fund, which is part of the Fidelity family of funds.
Nature, Extent, and Quality of Services Provided. The Board considered Fidelity's staffing as it relates to the fund, including the backgrounds of investment personnel of Fidelity, and also considered the fund's investment objective, strategies, and related investment philosophy. The Independent Trustees also had discussions with senior management of Fidelity's investment operations and investment groups. The Board considered the structure of the investment personnel compensation program and whether this structure provides appropriate incentives to act in the best interests of the fund. Additionally, the Board considered the portfolio managers' investments, if any, in the funds that they manage.
Resources Dedicated to Investment Management and Support Services. The Board reviewed the general qualifications and capabilities of Fidelity's investment staff, including its size, education, experience, and resources, as well as Fidelity's approach to recruiting, managing, and compensating investment personnel. The Board noted that Fidelity has continued to increase the resources devoted to non-U.S. offices, including expansion of Fidelity's global investment organization. The Board also noted that Fidelity's analysts have extensive resources, tools and capabilities that allow them to conduct sophisticated quantitative and fundamental analysis, as well as credit analysis of issuers, counterparties and guarantors. Further, the Board considered that Fidelity's investment professionals have sufficient access to global information and data so as to provide competitive investment results over time, and that those professionals also have access to sophisticated tools that permit them to assess portfolio construction and risk and performance attribution characteristics continuously, as well as to transmit new information and research conclusions rapidly around the world. Additionally, in its deliberations, the Board considered Fidelity's trading, risk management, compliance, and technology and operations capabilities and resources, which are integral parts of the investment management process.
Shareholder and Administrative Services. The Board considered (i) the nature, extent, quality, and cost of advisory, administrative, and shareholder services performed by FMR, the sub-advisers (together with FMR, the Investment Advisers), and their affiliates under the Advisory Contracts and under separate agreements covering transfer agency, pricing and bookkeeping, and securities lending services for the fund; (ii) the nature and extent of the supervision of third party service providers, principally custodians, subcustodians, and pricing vendors; and (iii) the resources devoted to, and the record of compliance with, the fund's compliance policies and procedures. The Board also reviewed the allocation of fund brokerage, including allocations to brokers affiliated with the Investment Advisers, the use of brokerage commissions to pay fund expenses, and the use of "soft" commission dollars to pay for research services.
The Board noted that the growth of fund assets over time across the complex allows Fidelity to reinvest in the development of services designed to enhance the value or convenience of the Fidelity funds as investment vehicles. These services include 24-hour access to account information and market information through telephone representatives and over the Internet, investor education materials and asset allocation tools, and the expanded availability of Fidelity Investor Centers.
Investment in a Large Fund Family. The Board considered the benefits to shareholders of investing in a Fidelity fund, including the benefits of investing in a fund that is part of a large family of funds offering a variety of investment disciplines and providing a large variety of mutual fund investor services. The Board noted that Fidelity had taken, or had made recommendations that resulted in the Fidelity funds taking, a number of actions over the previous year that benefited particular funds, including: (i) continuing to dedicate additional resources to investment research and to the support of the senior management team that oversees asset management; (ii) continuing efforts to enhance Fidelity's global research capabilities; (iii) launching new funds and making other enhancements to meet client needs; (iv) broadening eligibility requirements for certain lower-priced share classes of, and streamlining the fee structure for, certain existing equity index funds; (v) lowering expense caps for certain existing funds and classes to reduce expenses paid by shareholders; (vi) eliminating redemption fees for certain variable insurance product funds and classes; (vii) continuing to launch dedicated lower cost underlying funds to meet portfolio construction needs related to expanding underlying fund options for Fidelity funds of funds, specifically for the Freedom Fund product lines; (viii) launching a lower cost share class for use by the Freedom Index Fund product line; (ix) rationalizing product lines and gaining increased efficiencies through fund mergers and share class consolidations; (x) continuing to develop, acquire and implement systems and technology to improve services to the funds and shareholders, strengthen information security, and increase efficiency; (xi) implementing investment enhancements to further strengthen Fidelity's target date product line to increase investors' probability of success in achieving their goals; (xii) accelerating the conversion of all remaining Class B shares to Class A shares, which have a lower expense structure; and (xiii) implementing changes to Fidelity's money market fund product line in response to recent regulatory reforms.
Investment Performance. The Board considered whether the fund has operated in accordance with its investment objective, as well as its record of compliance with its investment restrictions and its performance history. The Board noted that there were portfolio management changes for the fund in December 2015 and April 2016.
The Board took into account discussions with representatives of the Investment Advisers about fund investment performance that occur at Board meetings throughout the year. In this regard the Board noted that as part of regularly scheduled fund reviews and other reports to the Board on fund performance, the Board considers annualized return information for the fund for different time periods, measured against one or more securities market indices, including a customized blended index representative of the fund's asset classes (each a "benchmark index") and a peer group of funds with similar objectives ("peer group"), if any. In its evaluation of fund investment performance at meetings throughout the year, the Board gave particular attention to information indicating underperformance of certain Fidelity funds for specific time periods and discussed with the Investment Advisers the reasons for such underperformance.
In addition to reviewing absolute and relative fund performance, the Independent Trustees periodically consider the appropriateness of fund performance metrics in evaluating the results achieved. In general, the Independent Trustees believe that fund performance should be evaluated based on gross performance (before fees and expenses but after transaction costs) compared to appropriate benchmark indices, over appropriate time periods that may include full market cycles, and on net performance (after fees and expenses) compared to peer groups, as applicable, over the same periods, taking into account relevant factors including the following: general market conditions; expectations for interest rate levels and credit conditions; issuer-specific information including credit quality; and fund cash flows and other factors. Depending on the circumstances, the Independent Trustees may be satisfied with a fund's performance notwithstanding that it lags its benchmark index or peer group for certain periods.
The Independent Trustees recognize that shareholders evaluate performance on a net basis over their own holding periods, for which one-, three-, and five-year periods are often used as a proxy. For this reason, the performance information reviewed by the Board also included net cumulative calendar year total return information for the fund and an appropriate benchmark index and peer group for the most recent one-, three-, and five-year periods.
Based on its review, the Board concluded that the nature, extent, and quality of services provided to the fund under the Advisory Contracts should continue to benefit the shareholders of the fund.
Competitiveness of Management Fee and Total Expense Ratio. The Board considered the fund's management fee and total expense ratio compared to "mapped groups" of competitive funds and classes created for the purpose of facilitating the Trustees' competitive analysis of management fees and total expenses. Fidelity creates "mapped groups" by combining similar Lipper investment objective categories that have comparable investment mandates. Combining Lipper investment objective categories aids the Board's management fee and total expense ratio comparisons by broadening the competitive group used for comparison.
Management Fee. The Board considered two proprietary management fee comparisons for the 12-month periods shown in basis points (BP) in the chart below. The group of Lipper funds used by the Board for management fee comparisons is referred to below as the "Total Mapped Group." The Total Mapped Group comparison focuses on a fund's standing in terms of gross management fees before expense reimbursements or caps relative to the total universe of funds with comparable investment mandates, regardless of whether their management fee structures also are comparable. Funds with comparable investment mandates offer exposure to similar types of securities. Funds with comparable management fee structures have similar management fee contractual arrangements (
e.g., flat rate charged for advisory services, all-inclusive fee rate,
etc.). "TMG %" represents the percentage of funds in the Total Mapped Group that had management fees that were lower than the fund's. For example, a hypothetical TMG % of 20% would mean that 80% of the funds in the Total Mapped Group had higher,and 20% had lower, management fees than the fund. The fund's actual TMG %s and the number of funds in the Total Mapped Group are in the chart below. The "Asset-Size Peer Group" (ASPG) comparison focuses on a fund's standing relative to a subset of non-Fidelity funds within the Total Mapped Group that are similar in size and management fee structure. For example, if a fund is in the first quartile of the ASPG, the fund's management fee ranks in the least expensive or lowest 25% of funds in the ASPG. The ASPG represents at least 15% of the funds in the Total Mapped Group with comparable asset size and management fee structures, subject to a minimum of 50 funds (or all funds in the Total Mapped Group if fewer than 50). Additional information, such as the ASPG quartile in which the fund's management fee rate ranked, is also included in the chart and considered by the Board.
Fidelity Global Balanced Fund
The Board noted that the fund's management fee rate ranked below the median of its Total Mapped Group and below the median of its ASPG for 2015.
The Board noted that, in 2014, the ad hoc Committee on Group Fee was formed by it and the boards of other Fidelity funds to conduct an in-depth review of the "group fee" component of the management fee of funds with such management fee structures. The Committee's focus included the mechanics of the group fee, the competitive landscape of group fee structures, Fidelity funds with no group fee component and investment products not included in group fee assets. The Board also considered that, for funds subject to the group fee, FMR agreed to voluntarily waive fees over a specified period of time in amounts designed to account for assets converted from certain funds to certain collective investment trusts.
Based on its review, the Board concluded that the fund's management fee is fair and reasonable in light of the services that the fund receives and the other factors considered.
Total Expense Ratio. In its review of each class's total expense ratio, the Board considered the fund's management fee rate as well as other fund or class expenses, as applicable, such as transfer agent fees, pricing and bookkeeping fees, fund-paid 12b-1 fees, and custodial, legal, and audit fees. The Board also noted that Fidelity may agree to waive fees and expenses from time to time, and the extent to which, if any, it has done so for the fund. As part of its review, the Board also considered the current and historical total expense ratios of each class of the fund compared to competitive fund median expenses. Each class of the fund is compared to those funds and classes in the Total Mapped Group (used by the Board for management fee comparisons) that have a similar sales load structure.
The Board noted that the total expense ratio of the retail class ranked below the competitive median for 2015 and the total expense ratio of each of Class A, Class T, Class C, and Class I ranked above the competitive median for 2015. The Board considered that, in general, various factors can affect total expense ratios. The Board also considered that each of Class A, Class T, Class C, and Class I was above the competitive median primarily because of higher transfer agent fees due to smaller average account sizes. Additionally, the Board considered that this fund has higher expenses because of the fund's small size and its global focus, which results in higher pricing and bookkeeping and custodian fees. The Board also noted that the total expense ratio of Class T was above the competitive median because of higher 12b-1 fees on Class T as compared to most competitor funds. Class T has a higher 12b-1 fee, but a lower front-end sales charge, than traditionally priced front-end sales charge classes. The Board considered that Class T is primarily sold load-waived in the retirement plan market where its 0.50% 12b-1 fee is comparable to competing no-load, higher 12b-1 fee classes designed specifically for retirement plans. The Board noted that the total expense ratio of Class C was above the competitive median because of its 12b-1 fees. The Board noted that the fund offers multiple classes, each of which has a different sales load and 12b-1 fee structure, and that the multiple structures are intended to offer a range of pricing options for the intermediary market. The Board also noted that the total expense ratios of the classes vary primarily by the level of their 12b-1 fees, although differences in transfer agent fees may also cause expenses to vary from class to class.
Fees Charged to Other Fidelity Clients. The Board also considered Fidelity fee structures and other information with respect to clients of Fidelity, such as other funds advised or subadvised by Fidelity, pension plan clients, and other institutional clients with similar mandates. The Board noted that an ad hoc joint committee created by it and the boards of other Fidelity funds periodically (most recently in 2013) reviews and compares Fidelity's institutional investment advisory business with its business of providing services to the Fidelity funds, including the differences in services provided, fees charged, and costs incurred, as well as competition in their respective marketplaces.
Based on its review of total expense ratios and fees charged to other Fidelity clients, the Board concluded that, although some classes were above the median of the universe presented for comparison, the total expense ratio of each class of the fund was reasonable in light of the services that the fund and its shareholders receive and the other factors considered.
Costs of the Services and Profitability. The Board considered the revenues earned and the expenses incurred by Fidelity in conducting the business of developing, marketing, distributing, managing, administering and servicing the fund and servicing the fund's shareholders. The Board also considered the level of Fidelity's profits in respect of all the Fidelity funds.
On an annual basis, Fidelity presents to the Board information about the profitability of its relationships with the fund. Fidelity calculates profitability information for each fund, as well as aggregate profitability information for groups of Fidelity funds and all Fidelity funds, using a series of detailed revenue and cost allocation methodologies which originate with the books and records of Fidelity on which Fidelity's audited financial statements are based. The Audit Committee of the Board reviews any significant changes from the prior year's methodologies.
PricewaterhouseCoopers LLP (PwC), independent registered public accounting firm and auditor to Fidelity and certain Fidelity funds, has been engaged annually by the Board as part of the Board's assessment of Fidelity's profitability analysis. PwC's engagement includes the review and assessment of the methodologies used by Fidelity in determining the revenues and expenses attributable to Fidelity's mutual fund business, and completion of agreed-upon procedures in respect of the mathematical accuracy of the fund profitability information and its conformity to established allocation methodologies. After considering PwC's reports issued under the engagement and information provided by Fidelity, the Board concluded that while other allocation methods may also be reasonable, Fidelity's profitability methodologies are reasonable in all material respects.
The Board also reviewed Fidelity's non-fund businesses and fall-out benefits related to the mutual fund business as well as cases where Fidelity's affiliates may benefit from or be related to the fund's business.
The Board considered the costs of the services provided by and the profits realized by Fidelity in connection with the operation of the fund and was satisfied that the profitability was not excessive.
Economies of Scale. The Board considered whether there have been economies of scale in respect of the management of the Fidelity funds, whether the Fidelity funds (including the fund) have appropriately benefited from any such economies of scale, and whether there is potential for realization of any further economies of scale. The Board considered the extent to which the fund will benefit from economies of scale as assets grow through increased services to the fund, through waivers or reimbursements, or through fee or expense ratio reductions. The Board also noted that a committee (the Economies of Scale Committee) created by it and the boards of other Fidelity funds periodically (most recently in 2013) analyzes whether Fidelity attains economies of scale in respect of the management and servicing of the Fidelity funds, whether the Fidelity funds have appropriately benefited from such economies of scale, and whether there is potential for realization of any further economies of scale.
The Board recognized that the fund's management contract incorporates a "group fee" structure, which provides for lower group fee rates as total group assets increase, and for higher group fee rates as total group assets decrease (with "group assets" defined to include fund assets under FMR's management plus the assets of sector funds previously under FMR's management). FMR calculates the group fee rates based on a tiered asset "breakpoint" schedule that varies based on asset class. The Board considered that the group fee is designed to deliver the benefits of economies of scale to fund shareholders when total Fidelity fund assets increase, even if assets of any particular fund are unchanged or have declined, because some portion of Fidelity's costs are attributable to services provided to all Fidelity funds, and all funds benefit if those costs can be allocated among more assets. The Board concluded that, given the group fee structure, fund shareholders will benefit from lower management fees as group assets increase at the fund complex level, regardless of whether Fidelity achieves any such economies of scale.
The Board concluded, taking into account the analysis of the Economies of Scale Committee, that economies of scale, if any, are being appropriately shared between fund shareholders and Fidelity.
Additional Information Requested by the Board. In order to develop fully the factual basis for consideration of the Fidelity funds' advisory contracts, the Board requested and received additional information on certain topics, including: (i) Fidelity's fund profitability methodology, profitability trends for certain funds, and the impact of certain factors on fund profitability results; (ii) portfolio manager changes that have occurred during the past year and the amount of the investment that each portfolio manager has made in the Fidelity fund(s) that he or she manages; (iii) Fidelity's compensation structure for portfolio managers, research analysts, and other key personnel, including its effects on fund profitability, the rationale for the compensation structure, and the extent to which current market conditions have affected retention and recruitment; (iv) the arrangements with and compensation paid to certain fund sub-advisers on behalf of the Fidelity funds; (v) Fidelity's voluntary waiver of its fees to maintain minimum yields for certain money market funds and classes as well as contractual waivers in place for certain funds; (vi) the methodology with respect to competitive fund data and peer group classifications; (vii) Fidelity's transfer agent fee, expense, and service structures for different funds and classes relative to competitive trends, and the impact of the increased use of omnibus accounts; (viii) Fidelity's long-term expectations for its offerings in the workplace investing channel; (ix) new developments in the retail and institutional marketplaces; (x) the approach to considering "fall-out" benefits; and (xi) the impact of money market reform on Fidelity's money market funds, including with respect to costs and profitability. In addition, the Board considered its discussions with Fidelity throughout the year regarding enhanced information security initiatives and the funds' fair valuation policies.
Based on its evaluation of all of the conclusions noted above, and after considering all factors it believed relevant, the Board concluded that the advisory fee structures are fair and reasonable, and that the fund's Advisory Contracts should be renewed.
Proxy Voting Results
A special meeting of shareholders was held on November 18, 2015. The results of votes taken among shareholders on the proposal before them are reported below. Each vote reported represents one dollar of net asset value held on the record date for the meeting.
PROPOSAL 1
| To elect a Board of Trustees. |
| | # of
Votes | % of
Votes |
| Elizabeth S. Acton | | |
| Affirmative | 14,943,915,330.95 | 96.336 |
| Withheld | 568,375,299.84 | 3.664 |
| TOTAL | 15,512,290,630.79 | 100.000 |
| John Engler | | |
| Affirmative | 14,882,992,640.02 | 95.944 |
| Withheld | 629,297,990.77 | 4.056 |
| TOTAL | 15,512,290,630.79 | 100.000 |
| Albert R. Gamper, Jr. | | |
| Affirmative | 14,876,209,021.25 | 95.900 |
| Withheld | 636,081,609.54 | 4.100 |
| TOTAL | 15,512,290,630.79 | 100.000 |
| Robert F. Gartland | | |
| Affirmative | 14,911,998,079.07 | 96.131 |
| Withheld | 600,292,551.72 | 3.869 |
| TOTAL | 15,512,290,630.79 | 100.000 |
| Abigail P. Johnson | | |
| Affirmative | 14,938,566,748.36 | 96.302 |
| Withheld | 573,723,882.43 | 3.698 |
| TOTAL | 15,512,290,630.79 | 100.000 |
| Arthur E. Johnson | | |
| Affirmative | 14,924,734,316.31 | 96.213 |
| Withheld | 587,556,314.48 | 3.787 |
| TOTAL | 15,512,290,630.79 | 100.000 |
| Michael E. Kenneally | | |
| Affirmative | 14,957,076,322.58 | 96.421 |
| Withheld | 555,214,308.21 | 3.579 |
| TOTAL | 15,512,290,630.79 | 100.000 |
| James H. Keyes | | |
| Affirmative | 14,883,069,701.12 | 95.944 |
| Withheld | 629,220,929.67 | 4.056 |
| TOTAL | 15,512,290,630.79 | 100.000 |
| Marie L. Knowles | | |
| Affirmative | 14,926,474,549.99 | 96.224 |
| Withheld | 585,816,080.80 | 3.776 |
| TOTAL | 15,512,290,630.79 | 100.000 |
| Geoffrey A. von Kuhn | | |
| Affirmative | 14,911,889,870.77 | 96.130 |
| Withheld | 600,400,760.02 | 3.870 |
| TOTAL | 15,512,290,630.79 | 100.000 |
| Proposal 1 reflects trust wide proposal and voting results. |
AGBL-ANN-1216
1.883464.107
Item 2.
Code of Ethics
As of the end of the period, October 31, 2016, Fidelity Charles Street Trust (the trust) has adopted a code of ethics, as defined in Item 2 of Form N-CSR, that applies to its President and Treasurer and its Chief Financial Officer. A copy of the code of ethics is filed as an exhibit to this Form N-CSR.
Item 3.
Audit Committee Financial Expert
The Board of Trustees of the trust has determined that Elizabeth S. Acton is an audit committee financial expert, as defined in Item 3 of Form N-CSR. Ms. Acton is independent for purposes of Item 3 of Form N-CSR.
Item 4.
Principal Accountant Fees and Services
Fees and Services
The following table presents fees billed by PricewaterhouseCoopers LLP (“PwC”) in each of the last two fiscal years for services rendered to Fidelity Global Balanced Fund (the “Fund”):
Services Billed by PwC
October 31, 2016 FeesA
| | | | |
| Audit Fees | Audit-Related Fees | Tax Fees | All Other Fees |
Fidelity Global Balanced Fund | $132,000 | $- | $7,000 | $5,300 |
| | | | |
| Audit Fees | Audit-Related Fees | Tax Fees | All Other Fees |
Fidelity Global Balanced Fund | $72,000 | $- | $8,600 | $1,800 |
A Amounts may reflect rounding.
The following table presents fees billed by PwC that were required to be approved by the Audit Committee for services that relate directly to the operations and financial reporting of the Fund and that are rendered on behalf of Fidelity Management & Research Company (“FMR”) and entities controlling, controlled by, or under common control with FMR (not including any sub-adviser whose role is primarily portfolio management and is subcontracted with or overseen by another investment adviser) that provide ongoing services to the Fund (“Fund Service Providers”):
Services Billed by PwC
| | |
| October 31, 2016A | October 31, 2015A |
Audit-Related Fees | $5,775,000 | $3,465,000 |
Tax Fees | $10,000 | $- |
All Other Fees | $- | $- |
A Amounts may reflect rounding.
“Audit-Related Fees” represent fees billed for assurance and related services that are reasonably related to the performance of the fund audit or the review of the fund's financial statements and that are not reported under Audit Fees.
“Tax Fees” represent fees billed for tax compliance, tax advice or tax planning that relate directly to the operations and financial reporting of the fund.
“All Other Fees” represent fees billed for services provided to the fund or Fund Service Provider, a significant portion of which are assurance related, that relate directly to the operations and financial reporting of the fund, excluding those services that are reported under Audit Fees, Audit-Related Fees or Tax Fees.
Assurance services must be performed by an independent public accountant.
* * *
The aggregate non-audit fees billed by PwC for services rendered to the Fund, FMR (not including any sub-adviser whose role is primarily portfolio management and is subcontracted with or overseen by another investment adviser), and any Fund Service Provider for each of the last two fiscal years of the Fund are as follows:
| | | |
Billed By | October 31, 2016 A | October 31, 2015 A |
PwC | $6,565,000 | $4,775,000 |
A Amounts may reflect rounding.
The trust's Audit Committee has considered non-audit services that were not pre-approved that were provided by PwC to Fund Service Providers to be compatible with maintaining the independence of PwC in its audit of the Fund, taking into account representations from PwC, in accordance with Public Company Accounting Oversight Board rules, regarding its independence from the Fund and its related entities and FMR’s review of the appropriateness and permissibility under applicable law of such non-audit services prior to their provision to the Fund Service Providers.
Audit Committee Pre-Approval Policies and Procedures
The trust’s Audit Committee must pre-approve all audit and non-audit services provided by a fund’s independent registered public accounting firm relating to the operations or financial reporting of the fund. Prior to the commencement of any audit or non-audit services to a fund, the Audit Committee reviews the services to determine whether they are appropriate and permissible under applicable law.
The Audit Committee has adopted policies and procedures to, among other purposes, provide a framework for the Committee’s consideration of non-audit services by the audit firms that audit the Fidelity funds. The policies and procedures require that any non-audit service provided by a fund audit firm to a Fidelity fund and any non-audit service provided by a fund auditor to a Fund Service Provider that relates directly to the operations and financial reporting of a Fidelity fund (“Covered Service”) are subject to approval by the Audit Committee before such service is provided.
All Covered Services must be approved in advance of provision of the service either: (i) by formal resolution of the Audit Committee, or (ii) by oral or written approval of the service by the Chair of the Audit Committee (or if the Chair is unavailable, such other member of the Audit Committee as may be designated by the Chair to act in the Chair’s absence). The approval contemplated by (ii) above is permitted where the Treasurer determines that action on such an engagement is necessary before the next meeting of the Audit Committee.
Non-audit services provided by a fund audit firm to a Fund Service Provider that do not relate directly to the operations and financial reporting of a Fidelity fund are reported to the Audit Committee on a periodic basis.
Non-Audit Services Approved Pursuant to Rule 2-01(c)(7)(i)(C) and (ii) of Regulation S-X (“De Minimis Exception”)
There were no non-audit services approved or required to be approved by the Audit Committee pursuant to the De Minimis Exception during the Fund’s last two fiscal years relating to services provided to (i) the Fund or (ii) any Fund Service Provider that relate directly to the operations and financial reporting of the Fund.
Item 5.
Audit Committee of Listed Registrants
Not applicable.
Item 6.
Investments
(a)
Not applicable.
(b)
Not applicable
Item 7.
Disclosure of Proxy Voting Policies and Procedures for Closed-End Management Investment Companies
Not applicable.
Item 8.
Portfolio Managers of Closed-End Management Investment Companies
Not applicable.
Item 9.
Purchase of Equity Securities by Closed-End Management Investment Company and Affiliated Purchasers
Not applicable.
Item 10.
Submission of Matters to a Vote of Security Holders
There were no material changes to the procedures by which shareholders may recommend nominees to the trust’s Board of Trustees.
Item 11.
Controls and Procedures
(a)(i) The President and Treasurer and the Chief Financial Officer have concluded that the trust’s disclosure controls and procedures (as defined in Rule 30a-3(c) under the Investment Company Act) provide reasonable assurances that material information relating to the trust is made known to them by the appropriate persons, based on their evaluation of these controls and procedures as of a date within 90 days of the filing date of this report.
(a)(ii) There was no change in the trust’s internal control over financial reporting (as defined in Rule 30a-3(d) under the Investment Company Act) that occurred during the second fiscal quarter of the period covered by this report that has materially affected, or is reasonably likely to materially affect, the trust’s internal control over financial reporting.
Item 12.
Exhibits
| | |
(a) | (1) | Code of Ethics pursuant to Item 2 of Form N-CSR is filed and attached hereto as EX-99.CODE ETH. |
(a) | (2) | Certification pursuant to Rule 30a-2(a) under the Investment Company Act of 1940 (17 CFR 270.30a-2(a)) is filed and attached hereto as Exhibit 99.CERT. |
(a) | (3) | Not applicable. |
(b) | | Certification pursuant to Rule 30a-2(b) under the Investment Company Act of 1940 (17 CFR 270.30a-2(b)) is furnished and attached hereto as Exhibit 99.906CERT. |
SIGNATURES
Pursuant to the requirements of the Securities Exchange Act of 1934 and the Investment Company Act of 1940, the registrant has duly caused this report to be signed on its behalf by the undersigned, thereunto duly authorized.
Fidelity Charles Street Trust
| |
By: | /s/ Stephanie J. Dorsey |
| Stephanie J. Dorsey |
| President and Treasurer |
| |
Date: | December 28, 2016 |
Pursuant to the requirements of the Securities Exchange Act of 1934 and the Investment Company Act of 1940, this report has been signed below by the following persons on behalf of the registrant and in the capacities and on the dates indicated.
| |
By: | /s/Stephanie J. Dorsey |
| Stephanie J. Dorsey |
| President and Treasurer |
| |
Date: | December 28, 2016 |
| |
By: | /s/Howard J. Galligan III |
| Howard J. Galligan III |
| Chief Financial Officer |
| |
Date: | December 28, 2016 |