Arthur J. Gallagher & Co.
INVESTMENT P R O F I L E
Brokerage Segment
Risk Management Segment
Financial Services Segment
NYSE: AJG
GROWING VALUE
Arthur J. Gallagher & Co. is the world’s fourth-largest insurance brokerage and risk management services firm and the third-largest broker of U.S. business. Gallagher provides a full range of property/casualty products and services to clients of all sizes. It is also one of the world’s premier alternative risk transfer and third-party claims managers and a full-service employee benefits consultant.
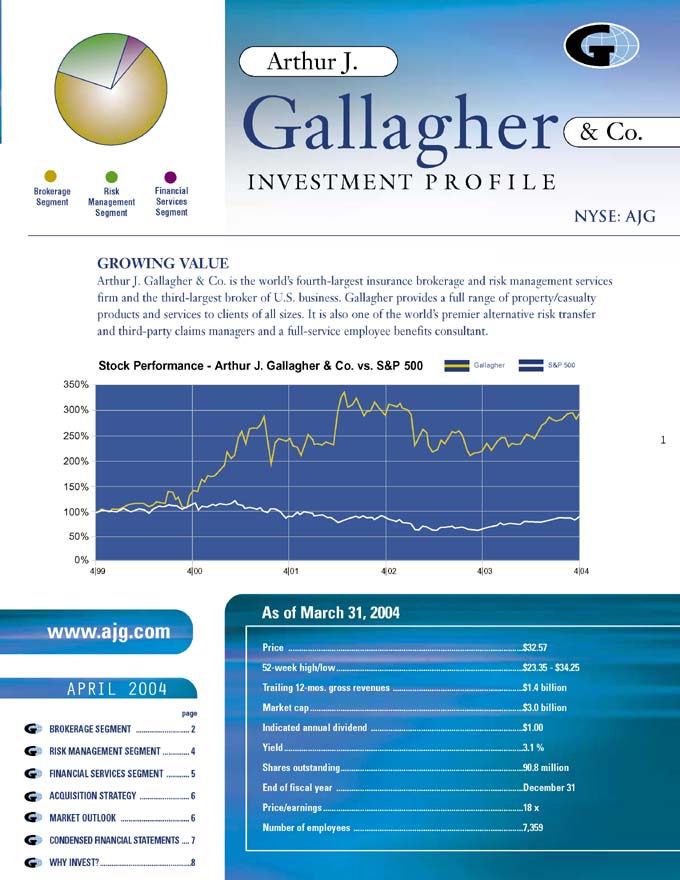
Stock Performance—Arthur J. Gallagher & Co. vs. S&P 500
www.ajg.com
APRIL 2004
page
BROKERAGE SEGMENT 2
RISK MANAGEMENT SEGMENT 4
FINANCIAL SERVICES SEGMENT 5
ACQUISITION STRATEGY 6
MARKET OUTLOOK 6
CONDENSED FINANCIAL STATEMENTS 7
WHY INVEST? 8
As of March 31, 2004
Price $ 32.57
52-week high/low $23.35—$ 34.25
Trailing 12-mos. gross revenues $1.4 billion
Market cap $3.0 billion
Indicated annual dividend $ 1.00
Yield 3.1 %
Shares outstanding 90.8 million
End of fiscal year December 31
Price/earnings 18 x
Number of employees 7,359
1
Team Oriented
Client Focused
Innovative
Brokerage Segment
BROKERAGE SERVICES RETAIL DIVISION
N I C H E S
• Agribusiness
• Aviation
• Construction
• Energy
• Global Risk Management
• Healthcare
• Higher Education
• Management Liability
• Marine
• Mergers & Acquisitions
• Personal Insurance
• Public Entity
• Real Estate (4)
- General Commercial
- Habitational
- Hospitality
- Shopping Centers
• Religious/Nonprofit
• Restaurant
• Scholastic K-12
• Transportation
• Worldwide Risk Services
• Wrap Ups
Gallagher’s Brokerage Services Retail Division (BSD) specializes in structuring property/casualty insurance and risk management programs for commercial, industrial, institutional and governmental organizations. With more than 60 offices throughout the U.S., this operation pursues cross-selling opportunities with other Gallagher operations and with the company’s Strategic Alliance Network of independent broker partners in more than 100 countries throughout the world.
BSD is a leading provider of insurance programs for middle-market commercial clients. While it brokers all types of property/casualty insurance, approximately 67% of its business falls within 22 specialized niches. These cross-divisional niche practice groups target areas of business in which Gallagher has developed a depth of expertise and a large client base. This niche focus provides advantages both in new business production and account retention. Niche practice groups allow for highly-focused marketing efforts and facilitate the development of value-added products and services specific to those industries or business segments. The detailed understanding and broad client contacts developed within the niches provide a competitive advantage.
BSD anticipates its greatest revenue growth in 2004 to come from its niche practice groups; middle-market accounts; developing and managing alternative market mechanisms like captives, rent-a-captives, deductible plans and self-insurance; and mergers and acquisitions.
SPECIALTY MARKETING AND INTERNATIONAL
C A P A B I L I T I E S
• Reinsurance Brokerage
• International Property/Casualty Brokerage
• Programs/Program Administration
• CoverageFirst.com
• Excess/Surplus Lines Brokerage
• Captive/Rent-a-Captive Management
Specialty Marketing and International is comprised of wholesale, excess/surplus and reinsurance brokerage operations in the U.S. and abroad, captive
2
SPECIALTY MARKETING AND INTERNATIONAL (CONTINUED) management operations outside the Continental U.S., and property/casualty joint-ventures and partnerships.
From 2001 through 2003, rate increases and coverage restrictions in the property/casualty market increased client demand for alternative risk transfer mechanisms. Gallagher structures a broad range of alternative market mechanisms, tailored to clients’ specific needs and financial situations. Those market conditions also contributed to exceptional growth in wholesale and excess/surplus lines business, much of which is generated by producers outside the Gallagher network. A growing amount of business is coming to Gallagher via its e-commerce portal, CoverageFirst.com, which has over 11,500 registered independent agent, wholesale broker and managing general agent users.
Through 2004, the operation expects its greatest revenue growth opportunities to come from reinsurance, international and wholesale brokerage business, programs and program administration. In addition to its offices or joint-ventures in the U.S., U.K., Bermuda, Australia, Singapore, Malaysia and Bahrain, the operation pursues business opportunities in conjunction with Gallagher’s Strategic Alliance Network of correspondent brokers and consultants in over 100 countries around the world.
S T R A T E G I C A L L I A N C E N E T W O R K
In addition to its own international brokerage offices, Gallagher has developed a non-owned network of leading independent brokers in more than 100 countries around the world. These relationships provide Gallagher’s clients with one of the most comprehensive worldwide sales and service networks available.
GALLAGHER BENEFIT SERVICES
C A P A B I L I T I E S
• Employee Benefits Brokerage/Consulting
• Healthcare Data Analysis/Benchmarking
• Compliance Consulting
• Merger & Acquisition Analysis
• Actuarial Services
• Executive Benefits/Financial Planning
• Human Resource Services
• Retirement Plan Services
• Employer Administrative Services
• Business Continuation
• Compensation Program Design/Analysis
Gallagher Benefit Services provides employee benefit brokerage and human resource consulting to assist clients in all areas of their employee retirement and health and welfare plans. Rising healthcare costs and growing regulatory complexities have resulted in double-digit increases in employee benefit costs. Gallagher has significantly expanded its technical resources and technological capabilities over the last couple of years to better assist clients in addressing this trend.
Gallagher offers expertise and guidance in all areas of benefits planning, delivery and administration. This encompasses a broad range of benefit services, including executive benefits and financial planning, worksite marketing and voluntary products, defined contribution products, actuarial services, compensation program design/analysis, data analysis and benchmarking, retirement services, benefits communication and out-sourcing, and training programs and tools that help employers address federal and state regulatory compliance.
The operation has also established eight niche practice groups in the following areas: healthcare, higher education, hospitality, public entity, religious, restaurant, education (K-12) and transportation. Its strongest near-term growth opportunities are expected to come from its niche practice groups, through mergers and acquisitions, from cross-selling opportunities with other Gallagher operations, and by assisting clients and prospects in addressing their most pressing benefit priorities.
3
Quality Driven
Comprehensive
Cost Effective
Risk Management Segment
GALLAGHER BASSETT
EXPERTISE
• Real-Time Claims Reporting
• Recoveries (subrogation, salvage, etc.)
• Appraisal Services
• Litigation Management
• Information Management
• Managed Care Services
• Loss Control Services
• Safety Programs
• Settlement Management
• Education and Training
Gallagher Bassett has built a reputation as the high-quality, cost-effective provider in the multi-billion dollar market for third-party P/C claims management services. Claims management involves managing clients’ risk exposures as well as managing and paying their claims. Based on revenues from self-insured clients, Gallagher Bassett currently ranks as the world’s largest multiline, third-party administrator, according to Business Insurance magazine. It has offices in the U.S., U.K., Australia and Canada.
Gallagher Bassett’s primary business is contracted claims management. It provides claims management services for workers compensation, liability, auto, property and integrated disability management programs. It also offers information services, risk control consulting (loss control) services and appraisal services, either individually or in combination.
The corporate world’s growing interest in self-insurance and alternative risk transfer is stimulating client demand for claims management as an unbundled function, since many self-insuring corporations and public entities require more comprehensive loss reporting and claims tracking services than are typically provided by an insurance company. With Gallagher Bassett’s sophisticated claims management data systems and extensive network, it has reached a point where scale gives it a distinct competitive advantage. The division has also maintained an unwavering commitment to quality for over a decade that has significantly reduced its rework and processing costs, leading to an exceptional annual client retention rate.
Gallagher Bassett’s Web-based, proprietary claims and loss control information management system, risxfacs.com, brings diverse elements of intelligent risk management together in a comprehensive system that streamlines client loss and claim processes. By the end of March 2004, the system had more than 8,000 users and was handling over 13 million site hits and over 55,000 visitor sessions per month.
The division expects its most significant growth prospects through 2004 to come from Fortune 1000 companies, captives, program business and the out-sourcing of insurance company claims departments.
4
GALLGHER BENEFIT ADMINISTRATORS
C A P A B I L I T I E S
• Medical Case Management
• Non-Network Fee Negotiations
• Customized Reporting Capabilities
• EAP/Wellness Programs
• Managed Healthcare Delivery
• Utilization Review
• Internet Enrollment/Administration
Gallagher Benefit Administrators offers a wide range of benefit administrative services as well as the ability to integrate those services. It brings clients innovative reporting capabilities, customized managed healthcare options and integrated utilization management services.
While many third-party claims administrators have fallen behind in upgrading core competencies, Gallagher Benefit Administrators has continued to address systems and processes related to electronic data interchange and security issues, claims regulatory changes, access to information via the Internet, and methods through which employers can communicate and administer their plans more efficiently.
The operation has a platform that allows for paperless claims processing and pays many claims automatically. Clients have Web access to claims data and can complete their enrollments electronically. Gallagher Benefit Administrators expects these enhancements to elevate its competitive position in an industry facing consolidation.
Financial Services Segment
CORE
COMPETENCIES
• Tax-Advantaged Investing
• Real Estate
• Asset Management
The Financial Services segment is responsible for managing Gallagher’s investments and tax obligations. Financial Services specializes in tax-advantaged, real estate and asset management investments.
Tax-advantaged investments are comprised primarily of low income housing developments, waste-to-energy projects and synthetic fuel plants. These investments have helped reduce Gallagher’s tax rate to 30% in 2002, 24% in 2003 and 20% in 2004.
Real estate investments include Gallagher’s 60% ownership of a 25-story office building in Itasca, Illinois that houses its home office operations and several of its profit centers. Nearly 50% of the building is leased to third parties. Gallagher also owns an 11,000-acre community near Orlando. Known as Harmony, Florida, the site has a Johnny Miller Signature golf course and a new high school scheduled to open in August 2004. Sixty homes have been completed and there are now more than 100 residents in Harmony. National builder D.R. Horton and several local custom builders have 80 additional homes in various stages of development.
Asset management is primarily comprised of Gallagher’s 25% minority interest in Asset Alliance Corporation, which generally owns up to 50% of 13 alternative investment fund manager companies with approximately $4.4 billion under management.
5
ACQUISITION STRATEGY
Gallagher made 132 acquisitions from 1986 through March 2004, almost exclusively within the Brokerage Segment. The majority of these were regional or local property/casualty brokers possessing a strong middle-market focus or significant expertise in a desirable market niche. In the last few years, the company has also increased its acquisition activity in the benefits consulting area. Acquisitions typically fall within the $5 million to $15 million range.
Gallagher is highly selective. An acquisition must offer significant benefits, such as expanding its talent pool, enhancing its geographic presence and service capabilities, and/or broadening and further diversifying its business mix. In selecting acquisition candidates, Gallagher focuses on:
• a corporate culture that matches its own aggressive, marketing-oriented culture
• a profitable, growing business whose ability to compete would be enhanced by gaining access to Gallagher’s greater resources
• clearly defined financial criteria.
Management anticipates that Gallagher’s aggressive acquisition pace will continue. Contributing to the company’s success as an acquirer is its attractiveness as a merger partner. Growth-oriented independent brokers and consultants are attracted by its aggressive, sales-oriented culture and incentive-based compensation structure.
MARKET OUTLOOK
The property/casualty (P/C) market is cyclical, fluctuating between periods of broad coverage availability and widespread rate reductions (referred to as a “soft” market), and periods of significant rate increases and limited coverage availability (referred to as a “hard” market). Hard markets are typically triggered when rates have been driven so low that underwriting losses exceed total premiums collected, threatening insurer solvency on a large-scale basis.
Throughout the 1990s, an overabundance of underwriting capacity created an extremely competitive environment for most P/C insurers, putting them under significant pressure to reduce premium rates despite growing underwriting losses. As a result, between 1992 and 2000 the overall cost of managing risk for U.S. corporations dropped 42%. In 2000, insurers began seeking modest increases averaging about 5%. The market hardened more significantly in 2001, especially following the September 11th terrorist attacks, and double-digit rate increases and coverage restrictions continued throughout 2002. In 2003, the magnitude of rate increases began to moderate. A market survey conducted by the Council of Insurance Agents & Brokers indicated that by the fourth quarter of 2003, premiums were stable to slightly lower for one-third of all U.S. commercial P/C accounts, with the remaining two-thirds seeing increases averaging less than 10%. The study revealed that property coverages were averaging the most significant reductions, while professional liability lines, construction risks and workers compensation exposures were averaging the greatest increases. Rate competition is expected to increase during 2004.
Insurance brokers, as intermediaries between insurers and their customers, normally assume no underwriting risk. Their role is to add value to the transaction by explaining to clients the complex array of insurance and risk management products available; negotiating with insurers for optimum rates and coverage terms and conditions; and helping to place complex risks for clients and other brokers. Large brokers such as Gallagher also help insurance companies transfer some of their own risk to reinsurance providers. As compensation, brokers receive commissions from insurers or fees directly from clients.
In addition to structuring traditional P/C programs, Gallagher assists many clients in managing risk through the alternative market, a segment that includes self-insurance, captives, rent-a-captives and risk retention groups. According to industry estimates, these mechanisms now account for nearly 50% of the total commercial P/C market in the U.S. When traditional coverage becomes more expensive and harder to obtain, interest in alternative market mechanisms escalates. While competition is beginning to increase, Gallagher continues to see a strong interest in alternative market mechanisms in 2004.
SAFE HARBOR STATEMENT
Except for the historical information and discussions contained herein, statements contained herein may constitute “forward-looking statements” within the meaning of the Private Securities Litigation Reform Act of 1995. These statements involve a number of risks, uncertainties and other factors that could cause actual results to differ materially, as discussed in the company’s filings with the U.S. Securities and Exchange Commission (the “SEC”). This document includes certain non-GAAP financial measures as defined under rules promulgated by the SEC. As required by SEC rules, we have provided reconciliations of those measures to the most directly comparable GAAP measures, which are available on our Web site at www.ajg.com.
6
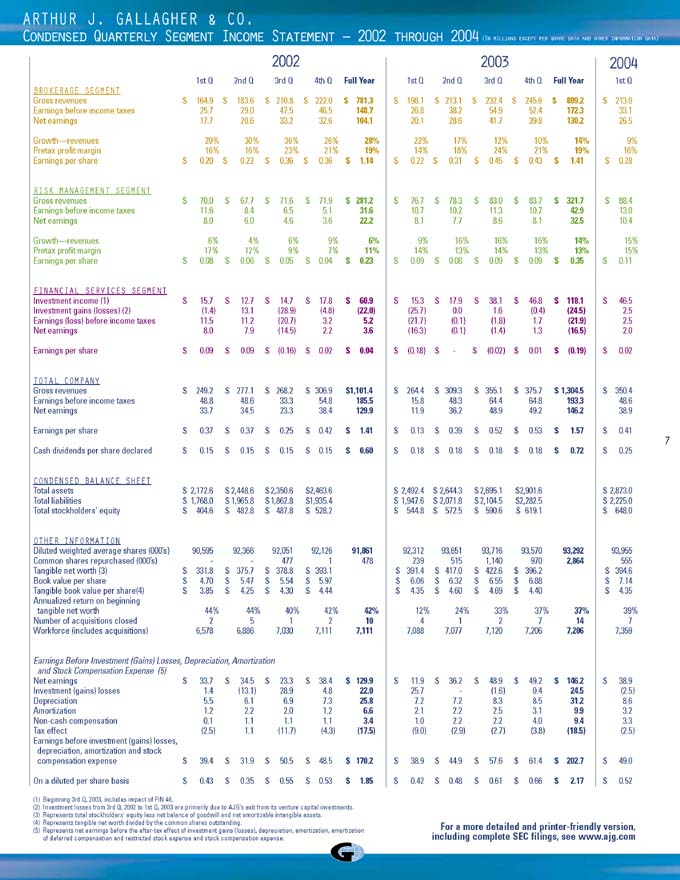
ARTHUR J. GALLAGHER & CO.
CONDENSED QUARTERLY SEGMENT INCOME STATEMENT – 2002 THROUGH 2004(IN MILLIONS EXCEPT PER SHARE DATA AND OTHER INFORMATION DATA)
2002 2003 2004
1st Q 2nd Q 3rd Q 4th Q Full Year 1st Q 2nd Q 3rd Q 4th Q Full Year 1st Q
BROKERAGE SEGMENT
Gross revenues $ 164.9 $ 183.6 $ 210.8 $ 222.0 $ 781.3 $ 198.1 $ 213.1 $ 232.4 $ 245.6 $ 889.2 $ 213.0
Earnings before income taxes 25.7 29.0 47.5 46.5 148.7 26.8 38.2 54.9 52.4 172.3 33.1
Net earnings 17.7 20.6 33.2 32.6 104.1 20.1 28.6 41.7 39.8 130.2 26.5
Growth—revenues 20% 30% 36% 26% 28% 22% 17% 12% 10% 14% 9%
Pretax profit margin 16% 16% 23% 21% 19% 14% 18% 24% 21% 19% 16%
Earnings per share $ 0.20 $ 0.22 $ 0.36 $ 0.36 $ 1.14 $ 0.22 $ 0.31 $ 0.45 $ 0.43 $ 1.41 $ 0.28
RISK MANAGEMENT SEGMENT
Gross revenues $ 70.0 $ 67.7 $ 71.6 $ 71.9 $ 281.2 $ 76.7 $ 78.3 $ 83.0 $ 83.7 $ 321.7 $ 88.4
Earnings before income taxes 11.6 8.4 6.5 5.1 31.6 10.7 10.2 11.3 10.7 42.9 13.0
Net earnings 8.0 6.0 4.6 3.6 22.2 8.1 7.7 8.6 8.1 32.5 10.4
Growth—revenues 6% 4% 6% 9% 6% 9% 16% 16% 16% 14% 15%
Pretax profit margin 17% 12% 9% 7% 11% 14% 13% 14% 13% 13% 15%
Earnings per share $ 0.08 $ 0.06 $ 0.05 $ 0.04 $ 0.23 $ 0.09 $ 0.08 $ 0.09 $ 0.09 $ 0.35 $ 0.11
FINANCIAL SERVICES SEGMENT
Investment income (1) $ 15.7 $ 12.7 $ 14.7 $ 17.8 $ 60.9 $ 15.3 $ 17.9 $ 38.1 $ 46.8 $ 118.1 $ 46.5
Investment gains (losses) (2) (1.4) 13.1 (28.9) (4.8) (22.0) (25.7) 0.0 1.6 (0.4) (24.5) 2.5
Earnings (loss) before income taxes 11.5 11.2 (20.7) 3.2 5.2 (21.7) (0.1) (1.8) 1.7 (21.9) 2.5
Net earnings 8.0 7.9 (14.5) 2.2 3.6 (16.3) (0.1) (1.4) 1.3 (16.5) 2.0
Earnings per share $ 0.09 $ 0.09 $ (0.16) $ 0.02 $ 0.04 $ (0.18) $ - $ (0.02) $ 0.01 $ (0.19) $ 0.02
TOTAL COMPANY
Gross revenues $ 249.2 $ 277.1 $ 268.2 $ 306.9 $ 1,101.4 $ 264.4 $ 309.3 $ 355.1 $ 375.7 $ 1,304.5 $ 350.4
Earnings before income taxes 48.8 48.6 33.3 54.8 185.5 15.8 48.3 64.4 64.8 193.3 48.6
Net earnings 33.7 34.5 23.3 38.4 129.9 11.9 36.2 48.9 49.2 146.2 38.9
Earnings per share $ 0.37 $ 0.37 $ 0.25 $ 0.42 $ 1.41 $ 0.13 $ 0.39 $ 0.52 $ 0.53 $ 1.57 $ 0.41
Cash dividends per share declared $ 0.15 $ 0.15 $ 0.15 $ 0.15 $ 0.60 $ 0.18 $ 0.18 $ 0.18 $ 0.18 $ 0.72 $ 0.25
CONDENSED BALANCE SHEET
Total assets $ 2,172.6 $ 2,448.6 $ 2,350.6 $ 2,463.6 $ 2,492.4 $ 2,644.3 $ 2,695.1 $ 2,901.6 $ 2,873.0
Total liabilities $ 1,768.0 $ 1,965.8 $ 1,862.8 $ 1,935.4 $ 1,947.6 $ 2,071.8 $ 2,104.5 $ 2,282.5 $ 2,225.0
Total stockholders' equity $ 404.6 $ 482.8 $ 487.8 $ 528.2 $ 544.8 $ 572.5 $ 590.6 $ 619.1 $ 648.0
OTHER INFORMATION
Diluted weighted average shares (000’s) 90,595 92,366 92,051 92,126 91,861 92,312 93,651 93,716 93,570 93,292 93,955
Common shares repurchased (000’s) - - 477 1 478 239 515 1,140 970 2,864 555
Tangible net worth (3) $ 331.8 $ 375.7 $ 378.8 $ 393.1 $ 391.4 $ 417.0 $ 422.6 $ 396.2 $ 394.6
Book value per share $ 4.70 $ 5.47 $ 5.54 $ 5.97 $ 6.06 $ 6.32 $ 6.55 $ 6.88 $ 7.14
Tangible book value per share(4) $ 3.85 $ 4.25 $ 4.30 $ 4.44 $ 4.35 $ 4.60 $ 4.69 $ 4.40 $ 4.35
Annualized return on beginning
tangible net worth 44% 44% 40% 42% 42% 12% 24% 33% 37% 37% 39%
Number of acquisitions closed 2 5 1 2 10 4 1 2 7 14 7
Workforce (includes acquisitions) 6,578 6,886 7,030 7,111 7,111 7,088 7,077 7,120 7,206 7,206 7,359
Earnings Before Investment (Gains) Losses, Depreciation, Amortization
and Stock Compensation Expense (5)
Net earnings $ 33.7 $ 34.5 $ 23.3 $ 38.4 $ 129.9 $ 11.9 $ 36.2 $ 48.9 $ 49.2 $ 146.2 $ 38.9
Investment (gains) losses 1.4 (13.1) 28.9 4.8 22.0 25.7 - (1.6) 0.4 24.5 (2.5)
Depreciation 5.5 6.1 6.9 7.3 25.8 7.2 7.2 8.3 8.5 31.2 8.6
Amortization 1.2 2.2 2.0 1.2 6.6 2.1 2.2 2.5 3.1 9.9 3.2
Non-cash compensation 0.1 1.1 1.1 1.1 3.4 1.0 2.2 2.2 4.0 9.4 3.3
Tax effect (2.5) 1.1 (11.7) (4.3) (17.5) (9.0) (2.9) (2.7) (3.8) (18.5) (2.5)
Earnings before investment (gains) losses,
depreciation, amortization and stock
compensation expense $ 39.4 $ 31.9 $ 50.5 $ 48.5 $ 170.2 $ 38.9 $ 44.9 $ 57.6 $ 61.4 $ 202.7 $ 49.0
On a diluted per share basis $ 0.43 $ 0.35 $ 0.55 $ 0.53 $ 1.85 $ 0.42 $ 0.48 $ 0.61 $ 0.66 $ 2.17 $ 0.52
(1) Beginning 3rd Q, 2003, includes impact of FIN 46.
(2) Investment losses from 3rd Q, 2002 to 1st Q, 2003 are primarily due to AJG’s exit from its venture capital investments.
(3) Represents total stockholders’ equity less net balance of goodwill and net amortizable intangible assets.
(4) Represents tangible net worth divided by the common shares outstanding.
(5) Represents net earnings before the after-tax effect of investment gains (losses), depreciation, amortization, amortization of deferred compensation and restricted stock expense and stock compensation expense.
For a more detailed and printer-friendly version, including complete SEC filings, see www.ajg.com
7
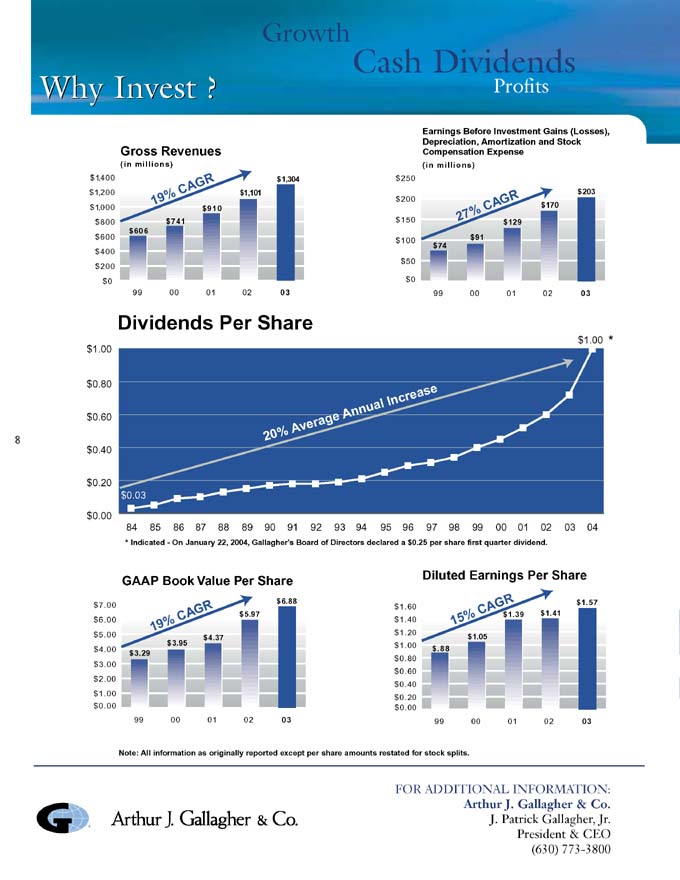
Growth
Cash Dividends
Why Invest ? Profits
Gross Revenues
(in millions)
$606
99
$741
00
$910
01
$1,101
02
$1,304
03
Earnings Before Investment Gains (Losses), Depreciation, Amortization and Stock Compensation Expense
(in millions)
$74
99
$91
00
$129
01
$170
02
$203
03
Dividends Per Share
* Indicated—On January 22, 2004, Gallagher’s Board of Directors declared a $0.25 per share first quarter dividend.
GAAP Book Value Per Share
$3.29
99
$3.95
00
$4.37
01
$5.97
02
$6.88
03
Diluted Earnings Per Share
$.88
99
$1.05
00
$1.39
01
$1.41
02
$1.57
03
Note: All information as originally reported except per share amounts restated for stock splits.
FOR ADDITIONAL INFORMATION:
Arthur J. Gallagher & Co.
J. Patrick Gallagher, Jr.
President & CEO
(630) 773-3800
8