Exhibit 99.1
May 2005
Safe Harbor Statement Under the
Private Securities Litigation Reform Act of 1995
The presentation relating to this material may contain forward-looking statements. Forward-looking statements made by or on behalf of Gallagher are subject to risks and uncertainties, including but not limited to the following: Gallagher’s commission revenues are highly dependent on premiums charged by insurers, which are subject to fluctuation; lower interest rates reduce Gallagher’s income earned on invested funds; the alternative insurance market continues to grow which could unfavorably impact commission and favorably impact fee revenue, though not necessarily to the same extent; Gallagher’s revenues vary significantly from period to period as a result of the timing of policy inception dates and the net effect of new and lost business production; the insurance brokerage industry is subject to a great deal of uncertainty due to investigations into its business practices by various governmental authorities and related private litigation; the general level of economic activity can have a substantial impact on Gallagher’s renewal business; Gallagher’s operating results, returns on investments and financial position may be adversely impacted by exposure to various market risks such as interest rate, equity pricing, foreign exchange rates and the competitive environment or the outcome of litigation concerning Gallagher’s Syn/Coal production; Gallagher’s revenues and net earnings may be subject to reduction due to the elimination of contingent commission arrangements in 2005 and related developments in the insurance industry; and Gallagher’s effective income tax rate may be subject to increase as a result of changes in income tax laws or unfavorable interpretations of such laws or developments resulting in the loss or unavailability of Syn/Coal credits. Gallagher’s ability to grow has been enhanced through acquisitions, which may or may not be available on acceptable terms in the future and which, if consummated, may or may not be advantageous to Gallagher. Accordingly, actual results may differ materially from those set forth in the forward-looking statements.
2
Non-GAAP Financial Measures
Regulation G Disclosure
This presentation includes certain non-GAAP financial measures as defined under rules promulgated by the U.S. Securities and Exchange Commission (the “SEC”). As required by SEC rules, we have provided reconciliations of those measures to the most directly comparable GAAP measures, which are available on our investor relations web-site at www.ajg.com.
3
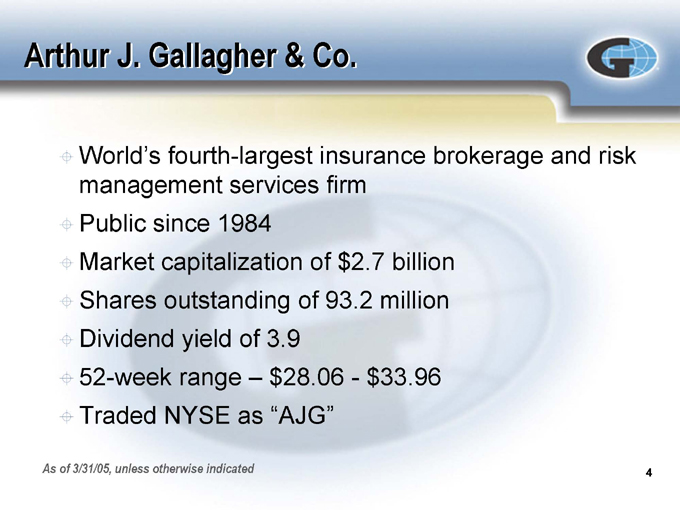
Arthur J. Gallagher & Co.
World’s fourth-largest insurance brokerage and risk management services firm Public since 1984 Market capitalization of $2.7 billion Shares outstanding of 93.2 million Dividend yield of 3.9 52-week range – $28.06—$33.96 Traded NYSE as “AJG”
As of 3/31/05, unless otherwise indicated
4
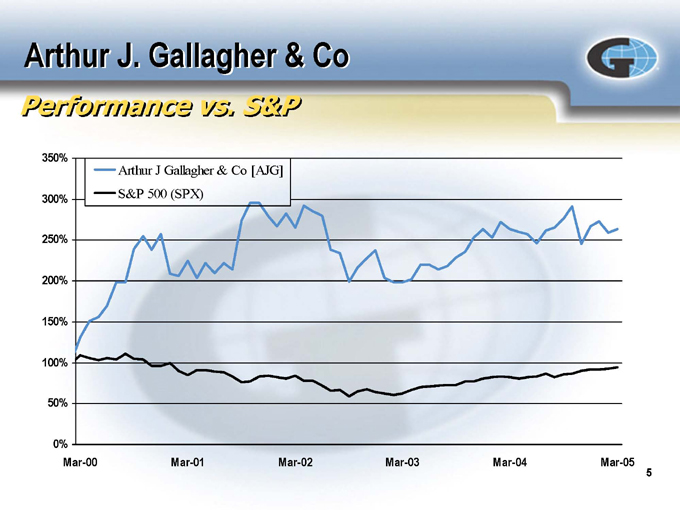
Arthur J. Gallagher & Co
Performance vs. S&P
350% 300% 250% 200% 150% 100% 50% 0%
Arthur J Gallagher & Co [AJG]
S&P 500 (SPX)
Mar-00 Mar-01 Mar-02 Mar-03 Mar-04 Mar-05
5
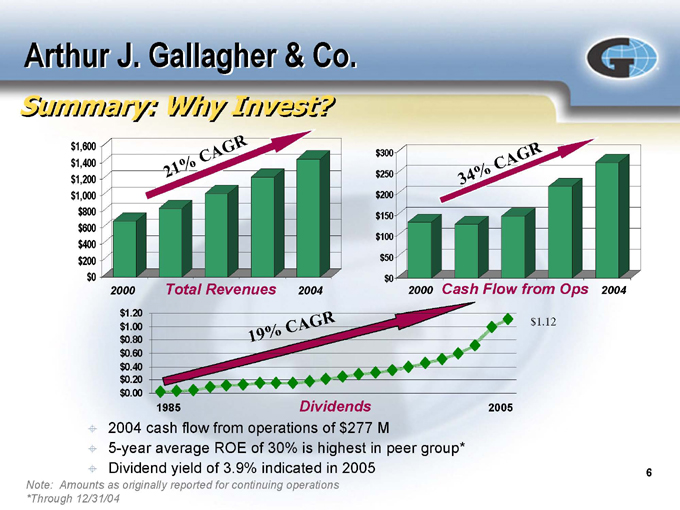
Arthur J. Gallagher & Co.
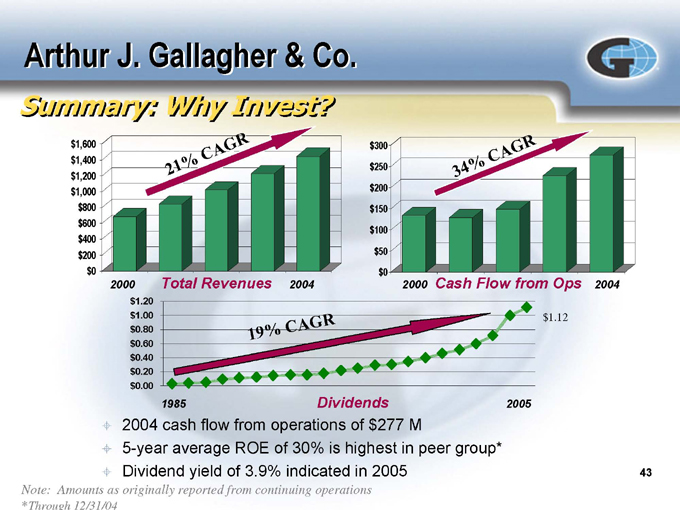
Summary: Why Invest?
$1,600 $1,400 $1,200 $1,000 $800 $600 $400 $200 $0
21%
CAGR
2000
Total Revenues
2004 $300 $250 $200 $150 $100 $50 $0
34%
CAGR
2000
Cash Flow from Ops
2004 $1.20 $1.00 $0.80 $0.60 $0.40 $0.20 $0.00
19%
CAGR
1985
Dividends
2005 $1.12
2004 cash flow from operations of $277 M
5-year average ROE of 30% is highest in peer group* Dividend yield of 3.9% indicated in 2005
Note: Amounts as originally reported for continuing operations *Through 12/31/04
6
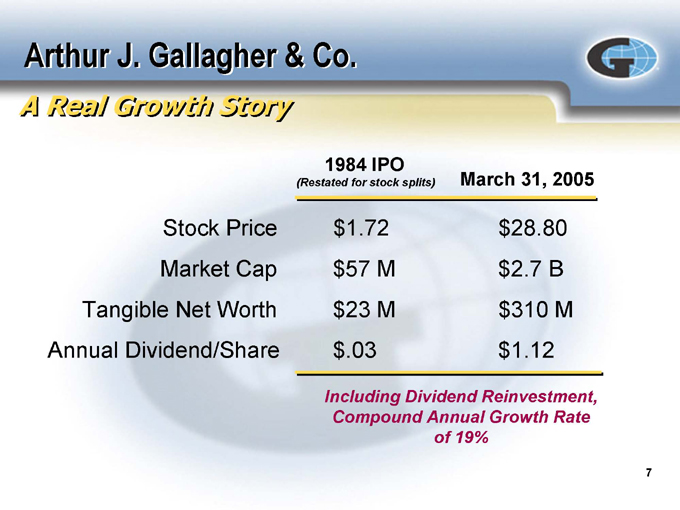
Arthur J. Gallagher & Co.
A Real Growth Story
1984 IPO
(Restated for stock splits) March 31, 2005
Stock Price $1.72 $28.80
Market Cap $57 M $2.7 B
Tangible Net Worth $23 M $310 M
Annual Dividend/Share $.03 $1.12
Including Dividend Reinvestment, Compound Annual Growth Rate of 19%
7
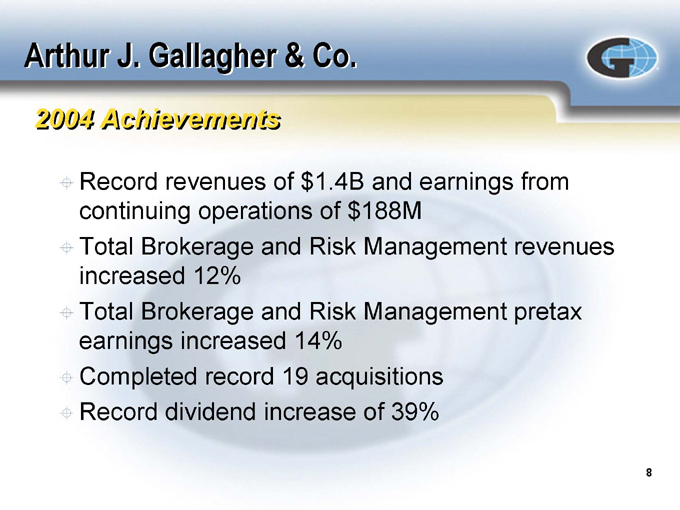
Arthur J. Gallagher & Co.
2004 Achievements
Record revenues of $1.4B and earnings from continuing operations of $188M
Total Brokerage and Risk Management revenues increased 12% Total Brokerage and Risk Management pretax earnings increased 14% Completed record 19 acquisitions Record dividend increase of 39%
8
Arthur J. Gallagher & Co.
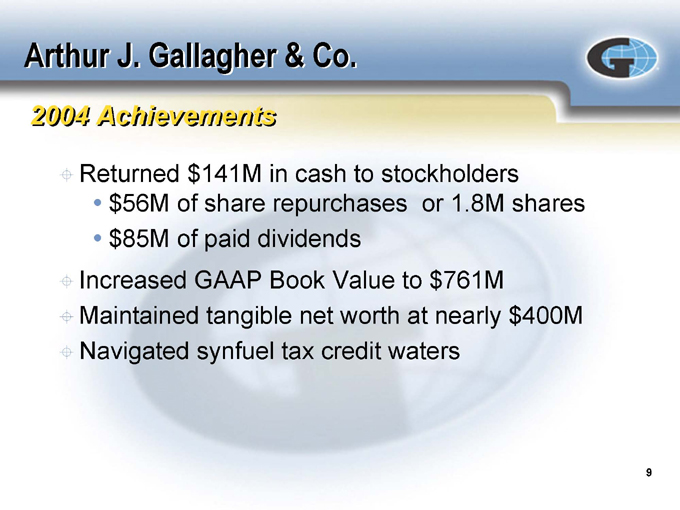
2004 Achievements
Returned $141M in cash to stockholders $56M of share repurchases or 1.8M shares $85M of paid dividends
Increased GAAP Book Value to $761M Maintained tangible net worth at nearly $400M Navigated synfuel tax credit waters
9
Arthur J. Gallagher & Co.
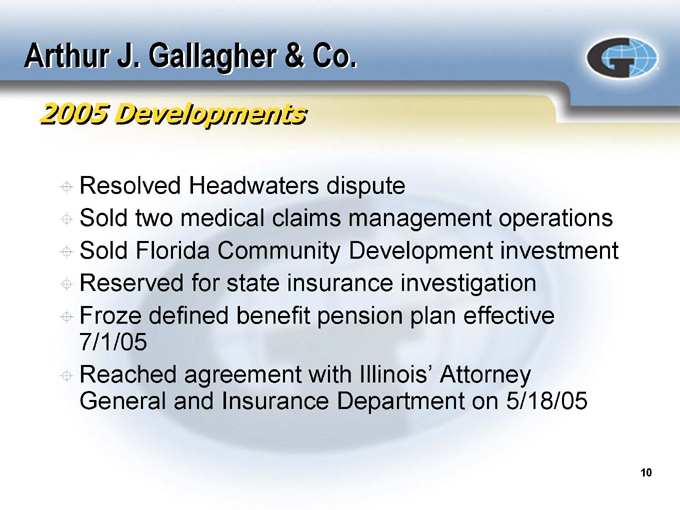
2005 Developments
Resolved Headwaters dispute
Sold two medical claims management operations Sold Florida Community Development investment Reserved for state insurance investigation Froze defined benefit pension plan effective 7/1/05 Reached agreement with Illinois’ Attorney General and Insurance Department on 5/18/05
10
Arthur J. Gallagher & Co.
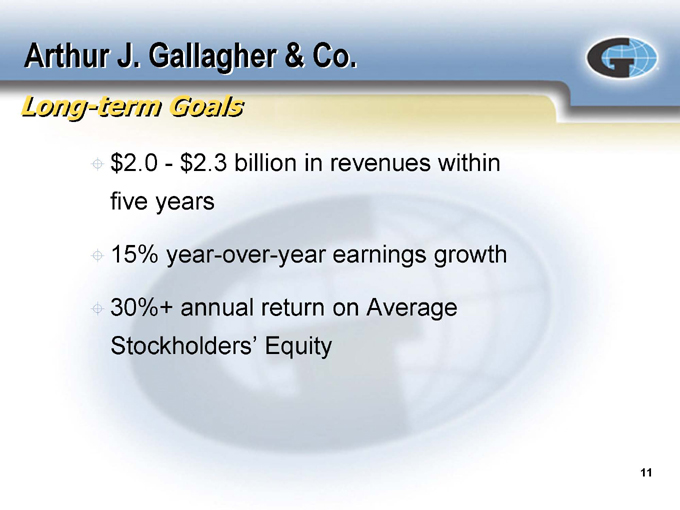
Long-term Goals $2.0—$2.3 billion in revenues within five years
15% year-over-year earnings growth
30%+ annual return on Average Stockholders’ Equity
11
Arthur J. Gallagher & Co.
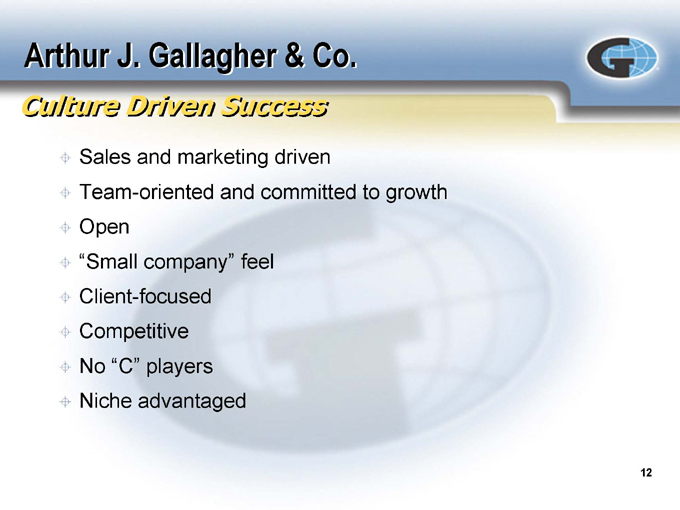
Culture Driven Success
Sales and marketing driven
Team-oriented and committed to growth Open “Small company” feel Client-focused Competitive No “C” players Niche advantaged
12
Arthur J. Gallagher & Co.
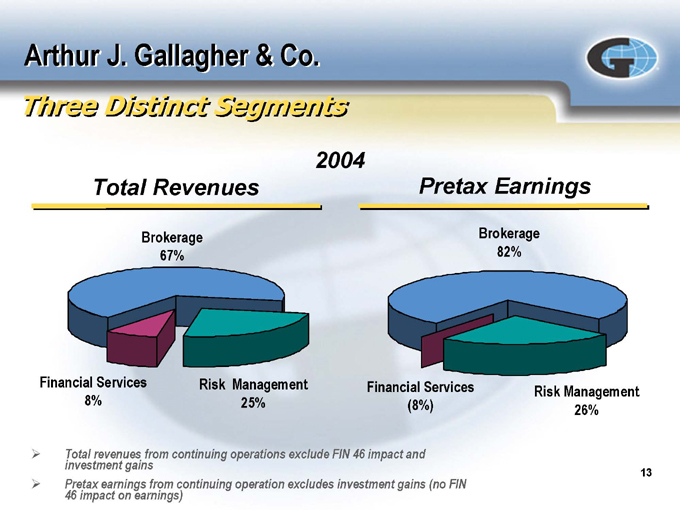
Three Distinct Segments
2004
Total Revenues
Brokerage 67%
Financial Services 8%
Risk Management 25%
Pretax Earnings
Brokerage 82%
Financial Services (8%)
Risk Management 26%
Total revenues from continuing operations exclude FIN 46 impact and investment gains
Pretax earnings from continuing operation excludes investment gains (no FIN 46 impact on earnings)
13
Brokerage Segment
Gallagher’s largest business segment Acts as intermediary – no underwriting risk Niche driven Alternative market leaders
14
Brokerage Segment
Contingent Commission Chronology
October 2004—effective 1/1/05, not entering into new volume/profit-based contingent agreements as retail broker Received subpoenas and other requests for information from state attorneys general and state regulatory authorities Q4 2004—conducted internal review with outside counsel which found no evidence of price fixing, bid rigging or improper tying arrangements Q1 2005, received $20.7M in contingent commissions on 2004 contracts Q1 2005—recorded $35M charge ($21M after tax, or $.23 per diluted share) as best estimate of amount to resolve the state insurance investigations based on costs of similar industry settlements thus far, plus an accrual for legal costs May 18, 2005 – reach agreement with Illinois’ Attorney General and Insurance Department – no lawsuit; no unlawful conduct will create $27M fund for certain retail clients which does not represent a fine or penalty will adopt certain business reforms including an agreement not to receive retail contingent commissions
Continue full cooperation with other state regulatory authorities
15
Brokerage Segment
A Strategic Consolidator
Geographic diversity; enhance or expand capabilities Approximately 140 acquisitions in this segment from 1986 through 3/31/05 The rules: financial health, similar culture Gallagher is merger partner of choice
16
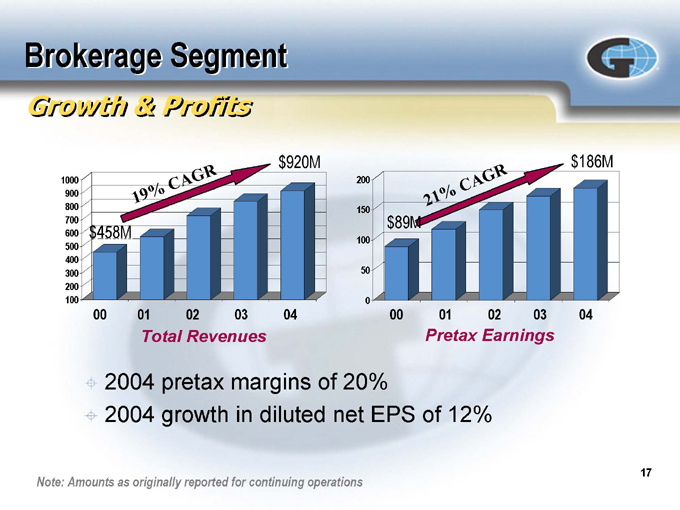
Brokerage Segment
Growth & Profits
1000 900 800 700 600 500 400 300 200 100 $458M
19%
CAGR
$920M
00 01 02 03 04
Total Revenues
200 150 100 50 0 $89M
21%
CAGR
$186M
00 01 02 03 04
Pretax Earnings
2004 pretax margins of 20%
2004 growth in diluted net EPS of 12%
Note: Amounts as originally reported for continuing operations
17
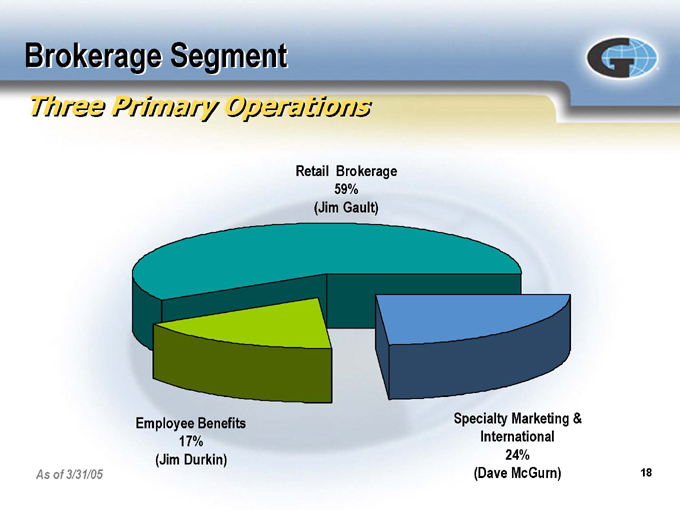
Brokerage Segment
Three Primary Operations
Retail Brokerage 59% (Jim Gault)
Employee Benefits 17% (Jim Durkin)
Specialty Marketing & International 24% (Dave McGurn)
As of 3/31/05
18
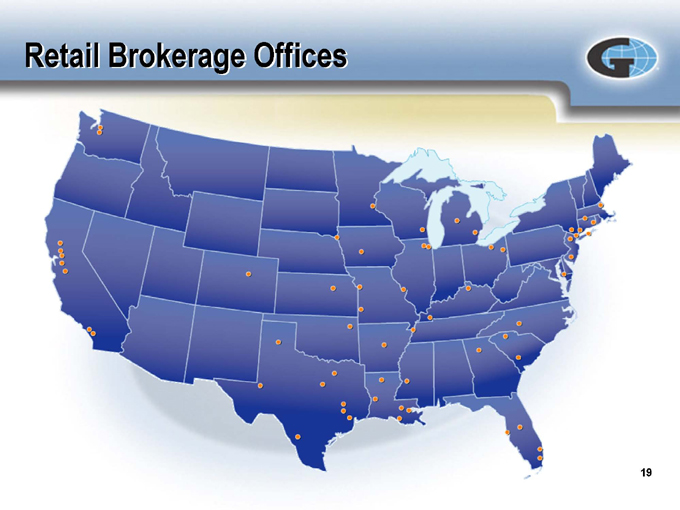
Retail Brokerage Offices
19
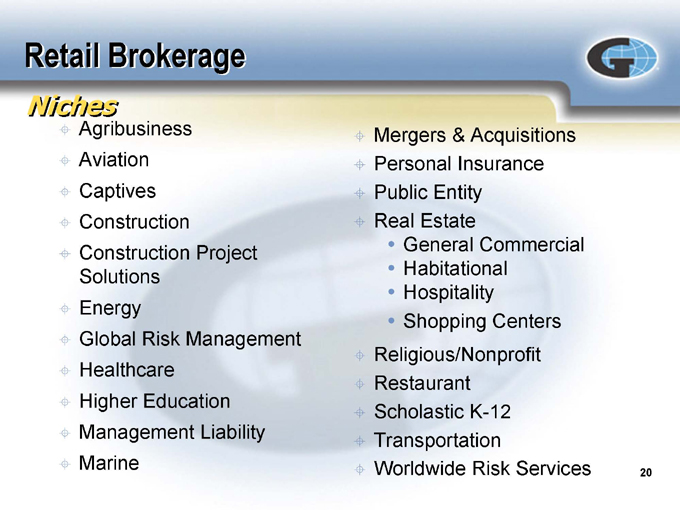
Retail Brokerage
Niches
Agribusiness Aviation Captives Construction Construction Project Solutions Energy Global Risk Management Healthcare Higher Education Management Liability Marine
Mergers & Acquisitions Personal Insurance Public Entity Real Estate
General Commercial Habitational Hospitality Shopping Centers
Religious/Nonprofit Restaurant Scholastic K-12 Transportation Worldwide Risk Services
20
Retail Brokerage
High Growth & Profit Potential
Niches – number and size Acquisitions and hiring Alternative market
Captives Rent-a-captives Deductible plans Self-insurance
21
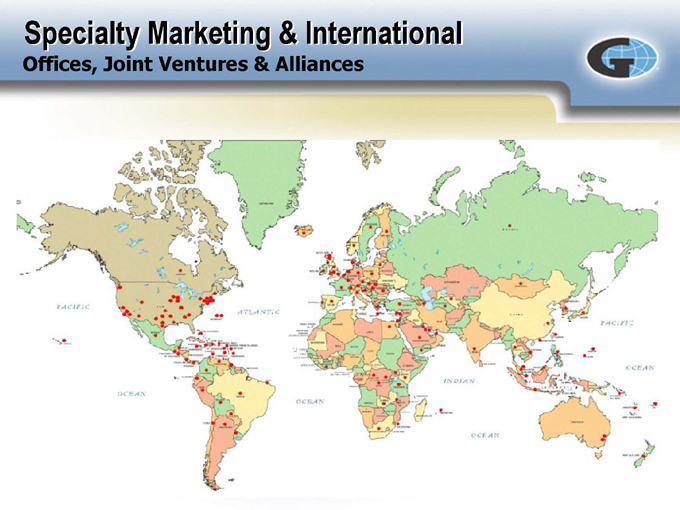
Specialty Marketing & International
Offices, Joint Ventures & Alliances
Specialty Marketing & International
Capabilities
Wholesale Brokerage International P&C Brokerage Programs/Program Administration Reinsurance Brokerage Captives/Rent-a-Captives CoverageFirst.com
23
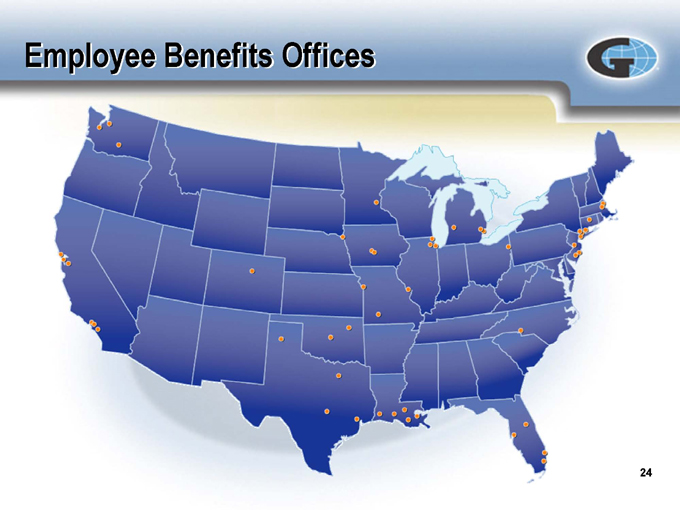
Employee Benefits Offices
24
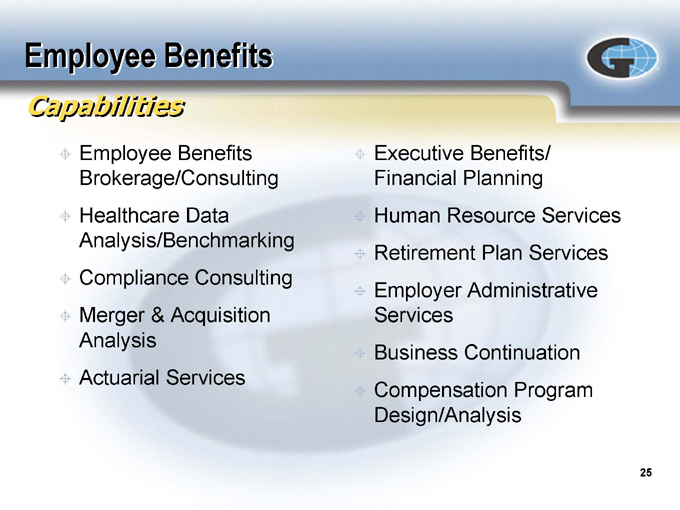
Employee Benefits
Capabilities
Employee Benefits Brokerage/Consulting Healthcare Data Analysis/Benchmarking Compliance Consulting Merger & Acquisition Analysis Actuarial Services
Executive Benefits/ Financial Planning Human Resource Services Retirement Plan Services Employer Administrative Services Business Continuation Compensation Program Design/Analysis
25
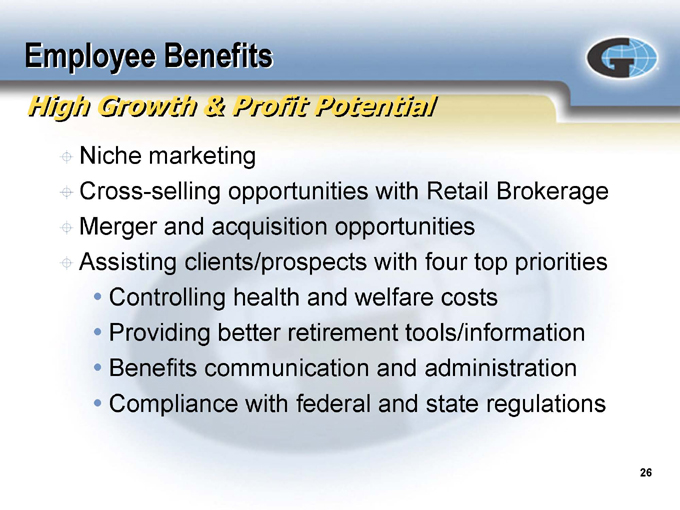
Employee Benefits
High Growth & Profit Potential
Niche marketing
Cross-selling opportunities with Retail Brokerage Merger and acquisition opportunities Assisting clients/prospects with four top priorities
Controlling health and welfare costs Providing better retirement tools/information Benefits communication and administration Compliance with federal and state regulations
26
Risk Management Segment
Gallagher’s Property/Casualty Claims Management Operation “Gallagher Bassett” – Rich McKenna World’s largest multiline, third-party administrator (Business Insurance magazine) Revenue growth is all organic Fee revenues are primarily generated based on number of claims Significant barriers to entry into this business – high retention levels
27

Risk Management Segment
Growth & Profits
350 300 250 200 150 100 50 0
16%
CAGR
$203M $346M
2000 2004
Total Revenues
60 50 40 30 20 10 0
24%
CAGR
$28M $58M
2000 2004
Pretax Earnings
2004 pretax margin of 17%
2004 growth in diluted net EPS of 47%
Note: Amounts as originally reported for continuing operations
28
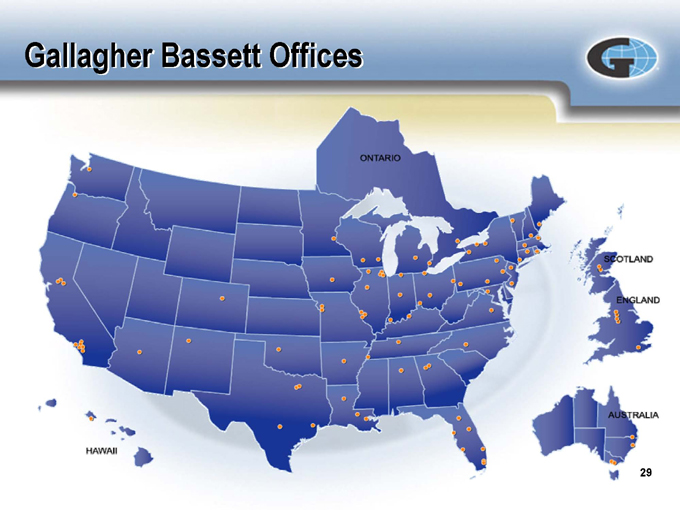
Gallagher Bassett Offices
29
Risk Management Segment
Expertise
Real-time Claims Reporting Recoveries (subrogation, salvage, etc.) Appraisal Services Litigation Management Information Management
Managed Care Services Loss Control Services Safety Programs Settlement Management Education and Training
30

Risk Management Segment
High Growth & Profit Potential
Fortune 1000 companies
Outsourcing of insurance co. claims departments Captives Program business Expanding global capabilities Enhancements in systems/processes related to:
Electronic data storage Security Claims regulatory changes
Access to information via the Internet Employer communication/plan administration
31
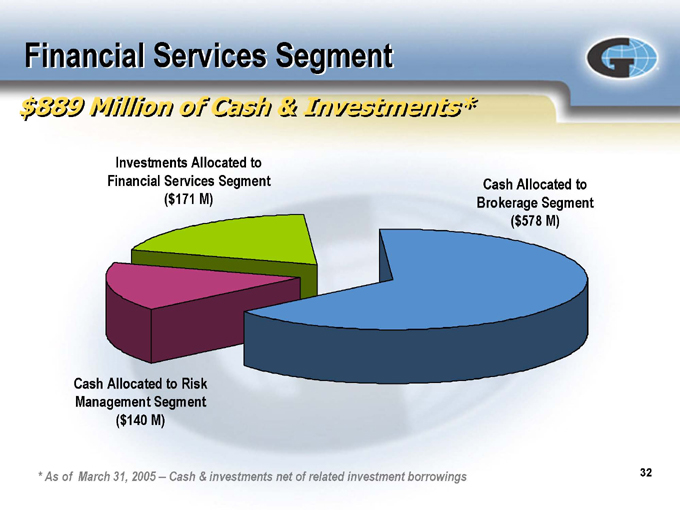
Financial Services Segment $889 Million of Cash & Investments*
Investments Allocated to Financial Services Segment
($171 M)
Cash Allocated to Risk Management Segment
($140 M)
Cash Allocated to Brokerage Segment
($578 M)
* As of March 31, 2005 – Cash & investments net of related investment borrowings
32
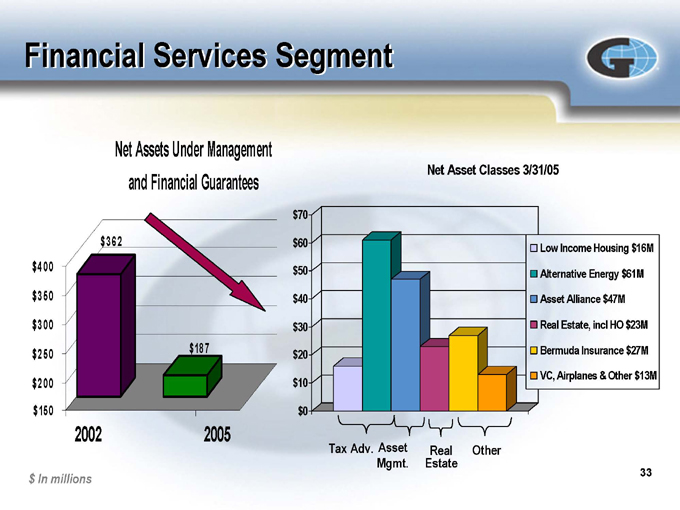
Financial Services Segment
Net Assets Under Management and Financial Guarantees $400 $350 $300 $250
$200 $150 $362 $187
2002 2005
Net Asset Classes 3/31/05 $70 $60 $50 $40 $30 $20 $10 $0
Tax Adv. Asset Mgmt. Real Estate Other
Low Income Housing $16M Alternative Energy $61M Asset Alliance $47M Real Estate, incl HO $23M Bermuda Insurance $27M VC, Airplanes & Other $13M $ In millions
33
Financial Services Segment
Refocused Investing
Tax advantaged – maximize through 2007 Asset management – monetize Real estate – optimize cash flows
Sold Florida Community Development investment in Q2 2005
Venture capital – substantially exited in 2003
34
Financial Services Segment
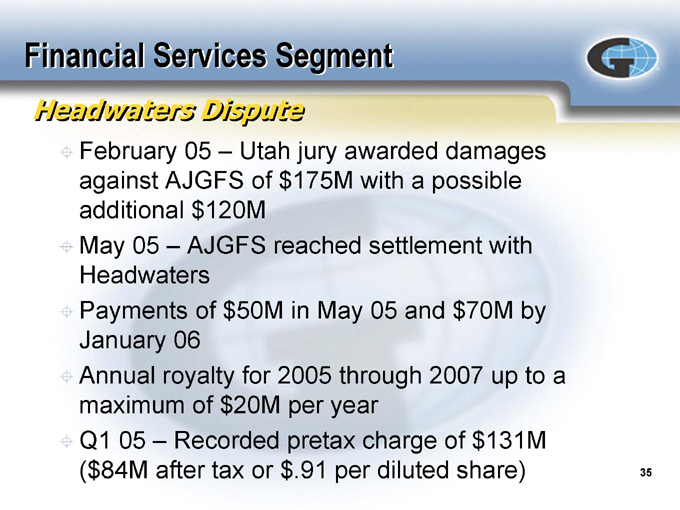
Headwaters Dispute
February 05 – Utah jury awarded damages against AJGFS of $175M with a possible additional $120M
May 05 – AJGFS reached settlement with Headwaters Payments of $50M in May 05 and $70M by January 06 Annual royalty for 2005 through 2007 up to a maximum of $20M per year Q1 05 – Recorded pretax charge of $131M
($84M after tax or $.91 per diluted share)
35
Arthur J. Gallagher & Co.
Why Invest?
36
Arthur J. Gallagher & Co.
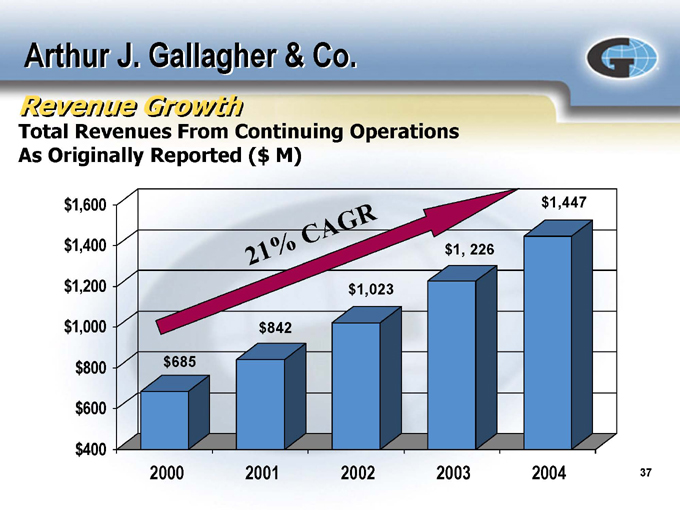
Revenue Growth
Total Revenues From Continuing Operations As Originally Reported ($ M) $1,600 $1,400 $1,200 $1,000 $800 $600 $400
21%
CAGR
$685 $842 $1,023 $1, 226 $1,447
2000 2001 2002 2003 2004
37
Arthur J. Gallagher & Co.
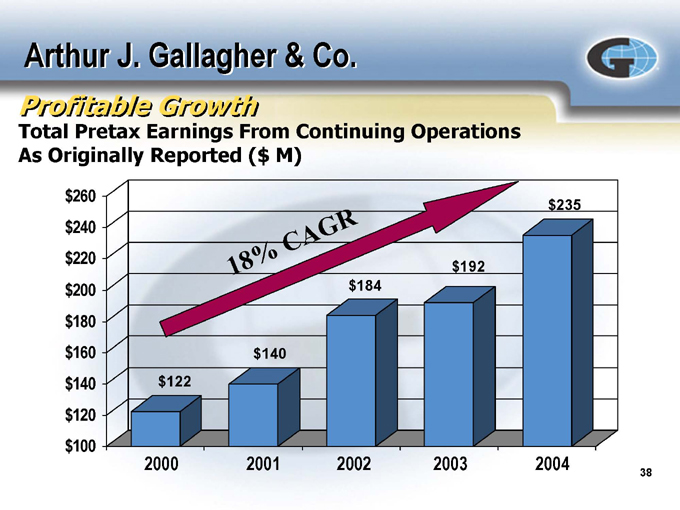
Profitable Growth
Total Pretax Earnings From Continuing Operations As Originally Reported ($ M) $260 $240 $220 $200 $180 $160 $140 $120 $100
18%
CAGR
$122 $140 $184 $192 $235
2000 2001 2002 2003 2004
38
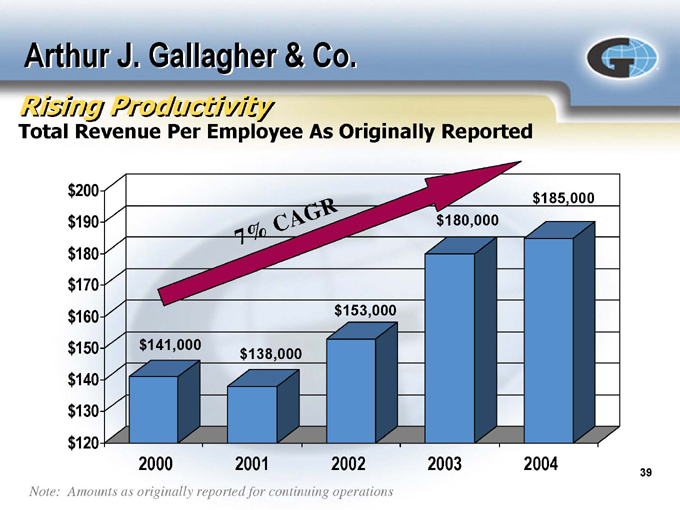
Arthur J. Gallagher & Co.
Rising Productivity
Total Revenue Per Employee As Originally Reported $200 $190 $180 $170 $160 $150 $140 $130 $120
7%
CAGR
$141,000 $138,000 $153,000 $180,000 $185,000
2000 2001 2002 2003 2004
Note: Amounts as originally reported for continuing operations
39
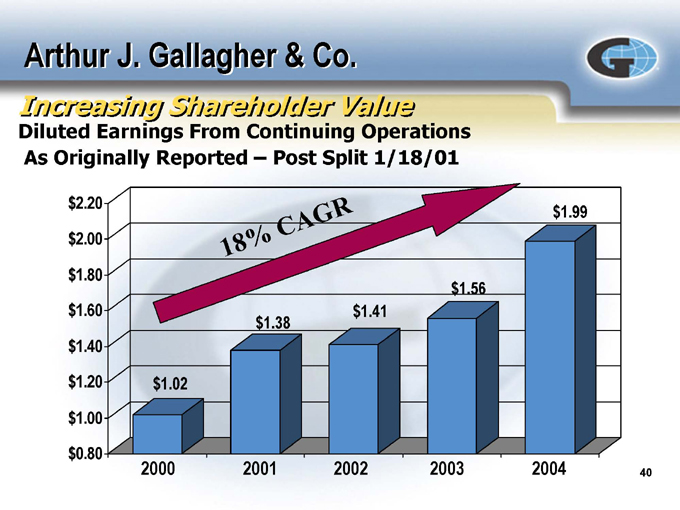
Arthur J. Gallagher & Co.
Increasing Shareholder Value
Diluted Earnings From Continuing Operations As Originally Reported – Post Split 1/18/01 $2.20 $2.00
$1.80 $1.60
$1.40 $1.20
$1.00 $0.80
18%
CAGR
$1.02 $1.38 $1.41 $1.56 $1.99
2000 2001 2002 2003 2004
40
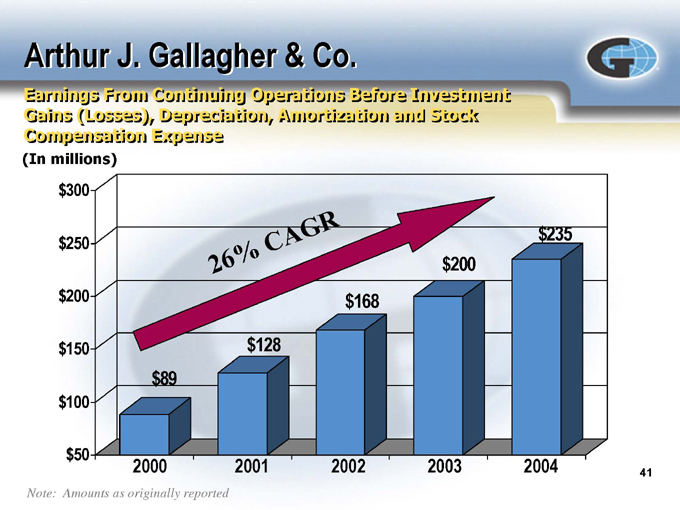
Arthur J. Gallagher & Co.
Earnings From Continuing Operations Before Investment Gains (Losses), Depreciation, Amortization and Stock Compensation Expense
(In millions) $300 $250 $200 $150 $100 $50
26%
CAGR
$89 $128 $168 $200 $235
2000 2001 2002 2003 2004
Note: Amounts as originally reported
41
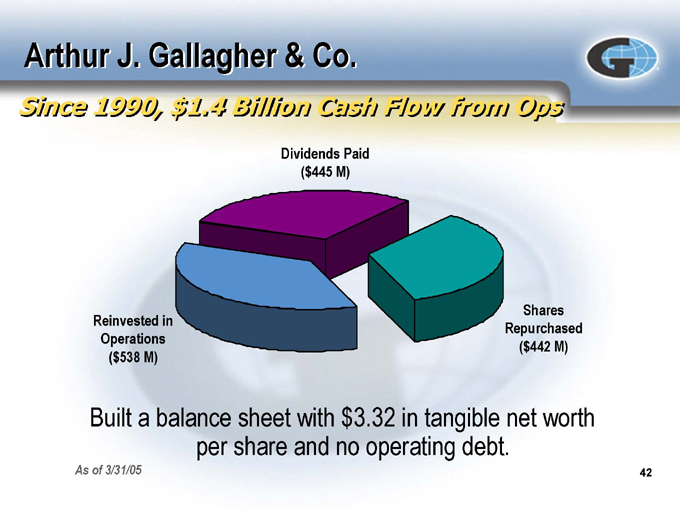
Arthur J. Gallagher & Co.
Since 1990, $1.4 Billion Cash Flow from Ops
Dividends Paid
($445 M)
Reinvested in Operations
($538 M)
Shares Repurchased
($442 M)
Built a balance sheet with $3.32 in tangible net worth per share and no operating debt.
As of 3/31/05
42
Arthur J. Gallagher & Co.
Summary: Why Invest?
$1,600 $1,400 $1,200 $1,000 $800 $600 $400 $200 $0
21%
CAGR
2000
Total Revenues
2004 $300 $250 $200 $150 $100 $50 $0
34%
CAGR
2000
Cash Flow from Ops
2004 $1.20 $1.00 $0.80 $0.60 $0.40 $0.20 $0.00
19%
CAGR
$1.12
1985
Dividends
2005
2004 cash flow from operations of $277 M
5-year average ROE of 30% is highest in peer group* Dividend yield of 3.9% indicated in 2005
Note: Amounts as originally reported from continuing operations
* Through 12/31/04
43
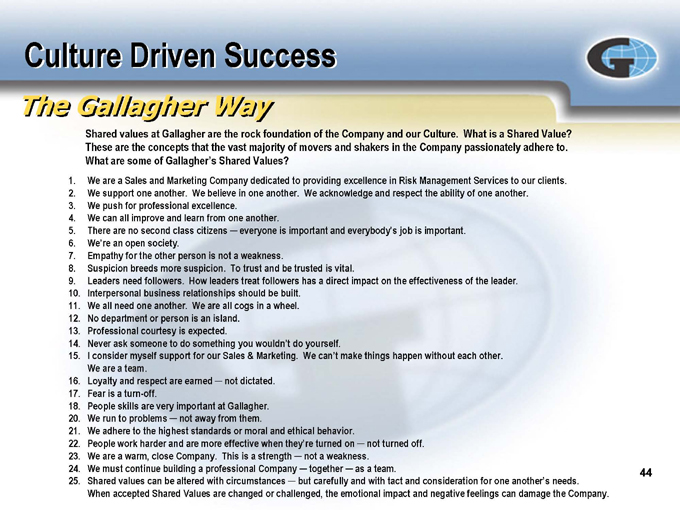
Culture Driven Success
The Gallagher Way
Shared values at Gallagher are the rock foundation of the Company and our Culture. What is a Shared Value? These are the concepts that the vast majority of movers and shakers in the Company passionately adhere to. What are some of Gallagher’s Shared Values?
1. We are a Sales and Marketing Company dedicated to providing excellence in Risk Management Services to our clients.
2. We support one another. We believe in one another. We acknowledge and respect the ability of one another.
3. We push for professional excellence.
4. We can all improve and learn from one another.
5. There are no second class citizens -everyone is important and everybody’s job is important.
6. We’re an open society.
7. Empathy for the other person is not a weakness.
8. Suspicion breeds more suspicion. To trust and be trusted is vital.
9. Leaders need followers. How leaders treat followers has a direct impact on the effectiveness of the leader.
10. Interpersonal business relationships should be built. 11. We all need one another. We are all cogs in a wheel. 12. No department or person is an island.
13. Professional courtesy is expected.
14. Never ask someone to do something you wouldn’t do yourself.
15. I consider myself support for our Sales & Marketing. We can’t make things happen without each other.
We are a team.
16. Loyalty and respect are earned -not dictated. 17. Fear is a turn-off.
18. People skills are very important at Gallagher. 20. We run to problems -not away from them.
21. We adhere to the highest standards or moral and ethical behavior.
22. People work harder and are more effective when they’re turned on -not turned off. 23. We are a warm, close Company. This is a strength -not a weakness.
24. We must continue building a professional Company -together -as a team.
25. Shared values can be altered with circumstances -but carefully and with tact and consideration for one another’s needs.
When accepted Shared Values are changed or challenged, the emotional impact and negative feelings can damage the Company.
44