Exhibit 99.1
JULY 2006
Safe Harbor Statement Under the Private Securities Litigation Reform Act of 1995
Except for the historical information and discussions contained herein, statements contained herein may constitute “forward-looking statements” within the meaning of the Private Securities Litigation Reform Act of 1995. These statements involve a number of risks, uncertainties and other factors that could cause actual results to differ materially, as discussed in the company’s filings with the U.S. Securities and Exchange Commission, including but not limited to the following: Gallagher’s commission revenues are highly dependent on premiums charged by insurers, which are subject to fluctuation; lower interest rates reduce Gallagher’s income earned on invested funds; the alternative insurance market continues to grow which could unfavorably impact commission and favorably impact fee revenue, though not necessarily to the same extent; Gallagher’s revenues vary significantly from period to period as a result of the timing of policy inception dates and the net effect of new and lost business production; the insurance brokerage industry is subject to a great deal of uncertainty due to investigations into its business practices by various governmental authorities and related private litigation; the general level of economic activity can have a substantial impact on Gallagher’s renewal business; Gallagher’s operating results, returns on investments and financial position may be adversely impacted by exposure to various market risks such as interest rate, equity pricing, foreign exchange rates and the competitive environment; Gallagher’s revenues and net earnings may continue to be subject to reduction due to the elimination of certain contingent commission arrangements on January 1, 2005 and related developments in the insurance industry; and Gallagher’s effective income tax rate may be subject to increase as a result of changes in income tax laws, unfavorable interpretations of such laws or changes in crude oil prices or developments resulting in the loss or unavailability of IRC Section 29-related Syn/Coal Credits. Gallagher’s ability to grow has been enhanced through acquisitions, which may or may not be available on acceptable terms in the future and which, if consummated, may or may not be advantageous to Gallagher. Accordingly, actual results may differ materially from those set forth in the forward-looking statements. For a further discussion of certain of the matters described above see Item 1A, “Risk Factors” in Gallagher’s Annual Report on Form 10K for the year ended December 31, 2005.
Certain Non-GAAP Financial Measures
This presentation includes certain information that may be considered “non-GAAP financial measures” within the meaning of SEC regulations because it is derived from Gallagher’s consolidated financial information but is not required to be presented in financial statements that are prepared in conformity with U.S. generally accepted accounting principles (GAAP). Consistent with SEC regulations, a description of such information is provided below and a reconciliation of certain of such items to GAAP is provided on our web-site at www.ajg.com.
Pretax earnings from continuing operations for 2005 was adjusted in this presentation to add back charges related to litigation and contingent commission matters and claims handling obligations. Charges in 2005 related to retail contingent commission matters and claims handling obligations totaled $73.6 million (or $44.2 million after tax) and $15.0 million (or $9.8 million after tax), respectively. There were no such items in 2000 to 2004. These amounts, which Gallagher believes are non-recurring, were added back to GAAP earnings from continuing operations in 2005 in order to calculate earnings from continuing operations before litigation and contingent commission related matters and claims handling obligations. In addition, total revenues and pretax earnings from continuing operations exclude retail contingent commissions and are on an as originally reported basis for all periods presented in this presentation.
Gallagher believes the “non-GAAP financial measures” included in this presentation provide meaningful additional information, which may be helpful to investors in assessing certain aspects of Gallagher’s operating performance and financial condition that may not be otherwise apparent from GAAP. Industry peers provide similar supplemental information, although they may not use the same or comparable terminology and may not make identical adjustments. This non-GAAP information should be used in addition to, but not as a substitute for, the GAAP information.
Arthur J. Gallagher & Co.
World’s 4th Largest Insurance Brokerage and Risk Management Services Firm
Brokerage – We sell a full range of property/casualty and employee benefit products and services, provide access to wholesale, reinsurance, captive and excess/surplus lines markets and provide generalized risk shifting consulting to our domestic and international clients Risk Management – We provide our domestic and international self-insured clients, as well as insurance companies that outsource their claims department, with outsourced P/C claims payment and claims management services that assist them in managing risk exposures and reducing claims payment costs
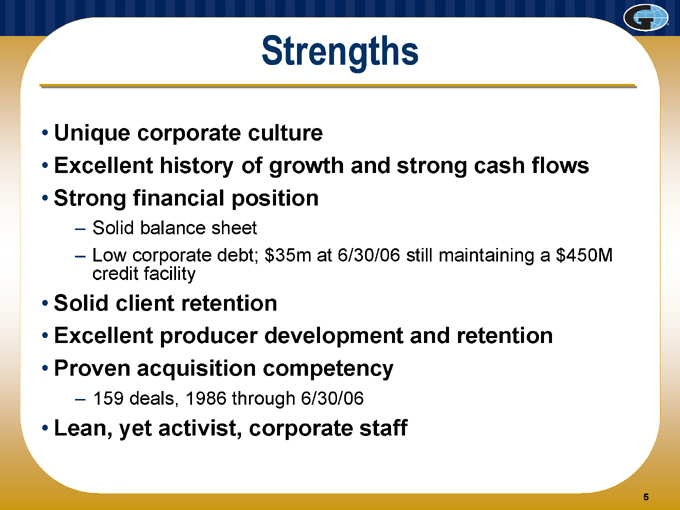
Strengths
Unique corporate culture
Excellent history of growth and strong cash flows
Strong financial position
– Solid balance sheet
– Low corporate debt; $35m at 6/30/06 still maintaining a $450M credit facility
Solid client retention
Excellent producer development and retention
Proven acquisition competency
– 159 deals, 1986 through 6/30/06
Lean, yet activist, corporate staff

Differentiators
• Culture Driven Success
– Client-first focus
– Local company feel with global capabilities
– Team-based approach
– Committed to growth
– Emphasis on professional development
• Niche strategy – industry-focused practice groups
• International network of brokers and agents
• Innovative – created alternative market
• “Network” philosophy of service that benefits clients
• Strong claims management capabilities
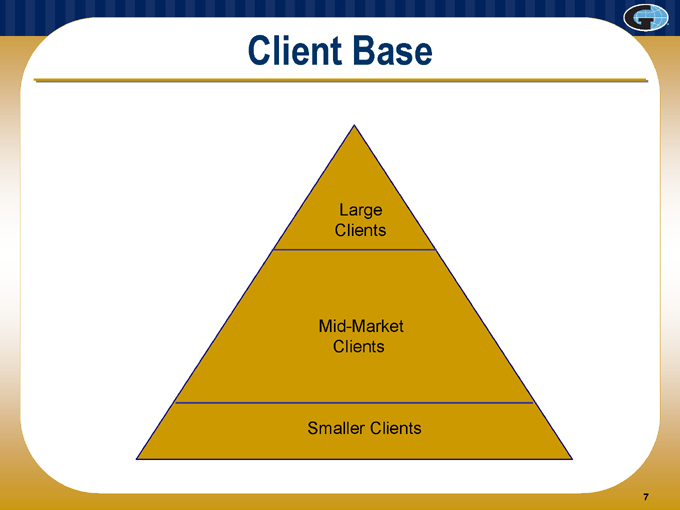
Client Base
Large Clients
Mid-Market Clients
Smaller Clients
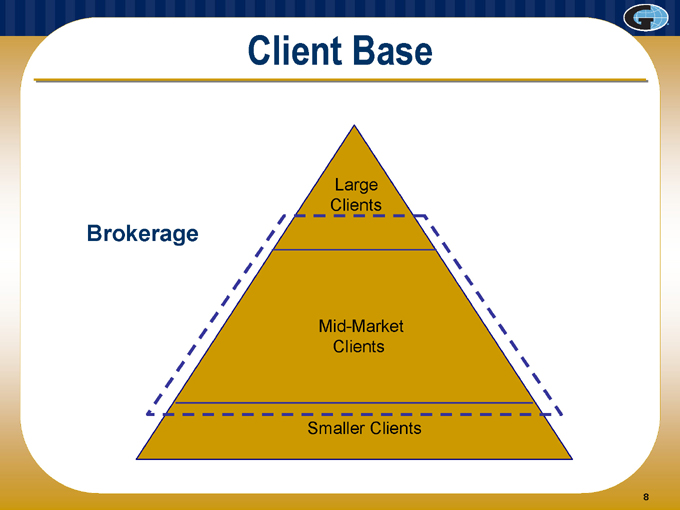
Client Base
Brokerage
Large Clients
Mid-Market Clients
Smaller Clients
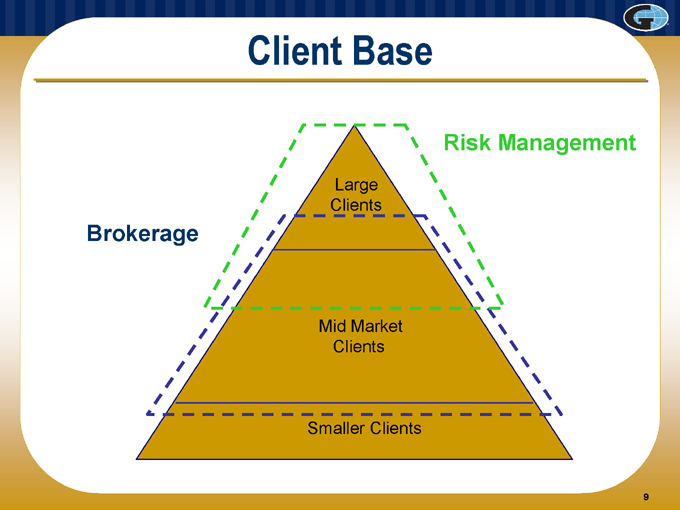
Client Base
Brokerage
Risk Management
Large Clients
Mid Market Clients
Smaller Clients
9
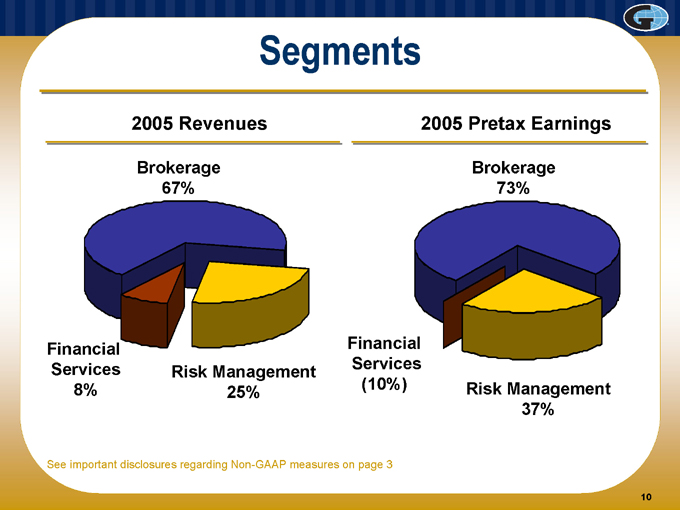
Segments
2005 Revenues
2005 Pretax Earnings
Brokerage 67%
Brokerage 73%
Financial Services 8%
Risk Management 25%
Financial Services (10%)
Risk Management 37%
See important disclosures regarding Non-GAAP measures on page 3
10
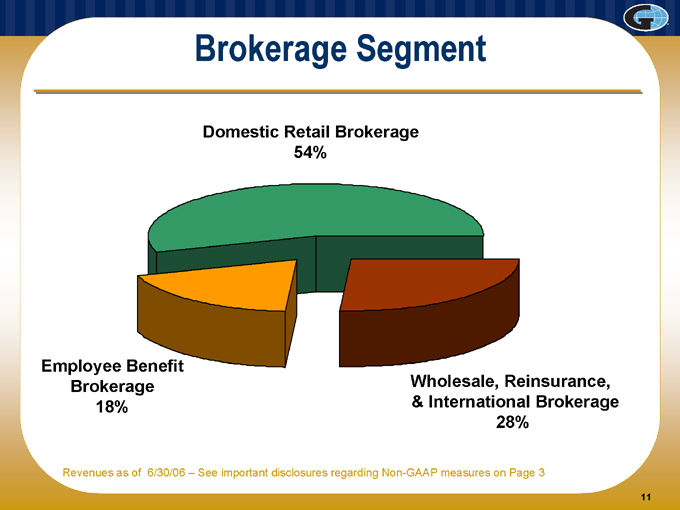
Brokerage Segment
Domestic Retail Brokerage 54%
Employee Benefit Brokerage 18%
Wholesale, Reinsurance, & International Brokerage 28%
Revenues as of 6/30/06 – See important disclosures regarding Non-GAAP measures on Page 3
11
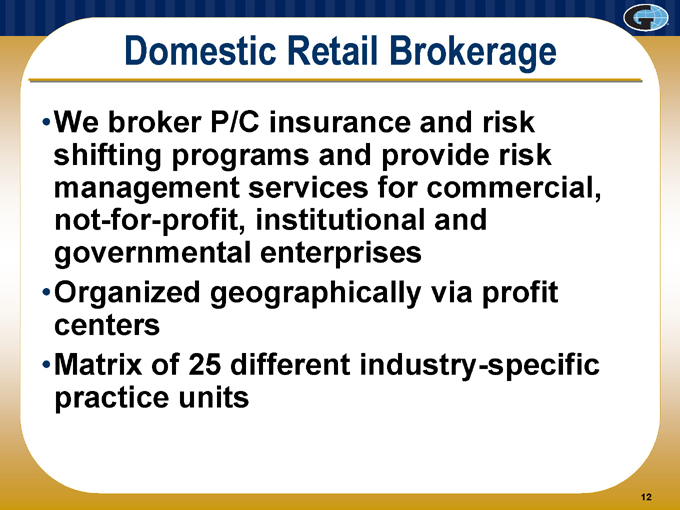
Domestic Retail Brokerage
We broker P/C insurance and risk shifting programs and provide risk management services for commercial, not-for-profit, institutional and governmental enterprises Organized geographically via profit centers Matrix of 25 different industry-specific practice units
12
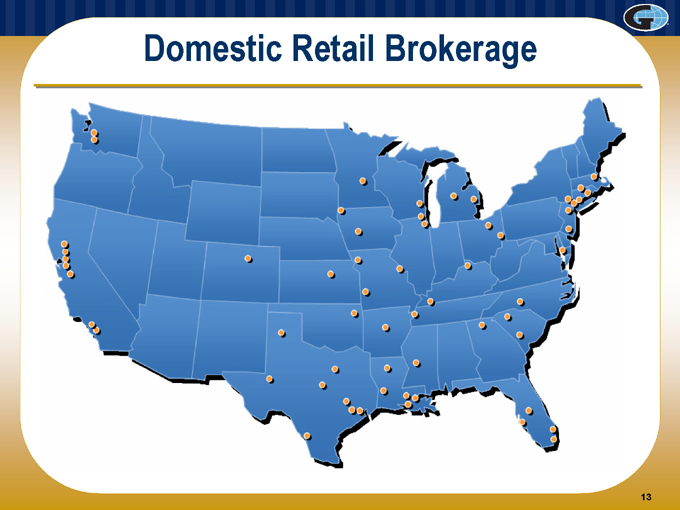
Domestic Retail Brokerage
13
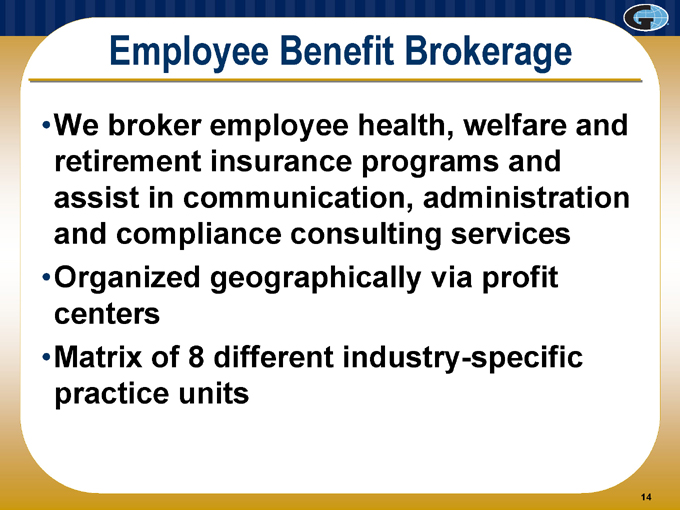
Employee Benefit Brokerage
We broker employee health, welfare and retirement insurance programs and assist in communication, administration and compliance consulting services Organized geographically via profit centers Matrix of 8 different industry-specific practice units
14

Employee Benefit Brokerage
15
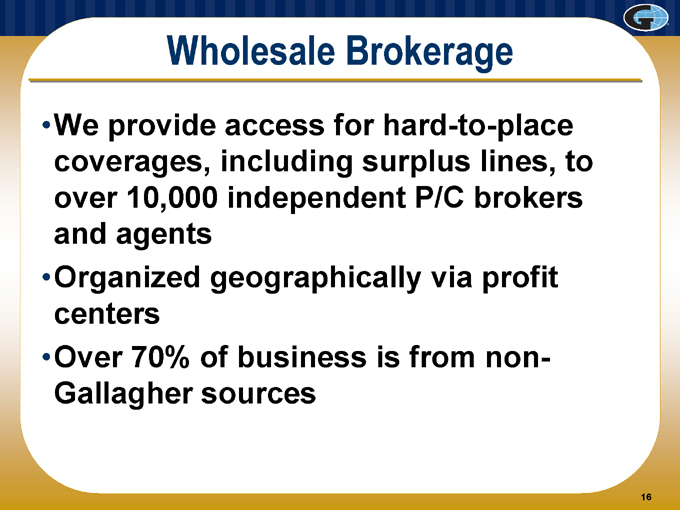
Wholesale Brokerage
We provide access for hard-to-place coverages, including surplus lines, to over 10,000 independent P/C brokers and agents Organized geographically via profit centers Over 70% of business is from non-Gallagher sources
16
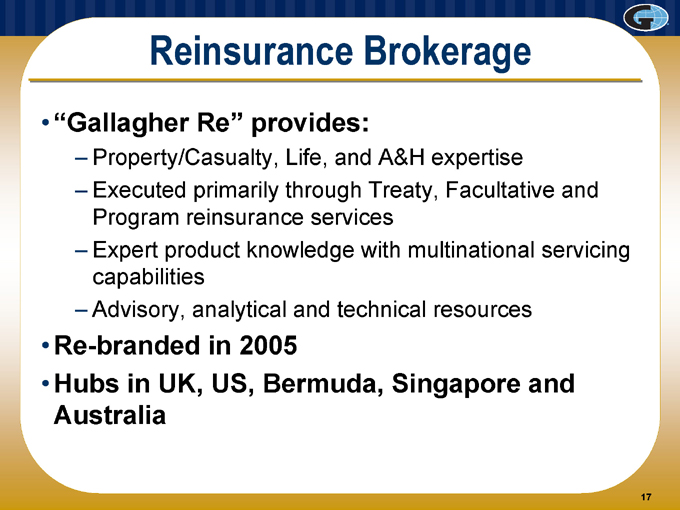
Reinsurance Brokerage
”Gallagher Re” provides:
– Property/Casualty, Life, and A&H expertise
– Executed primarily through Treaty, Facultative and Program reinsurance services
– Expert product knowledge with multinational servicing capabilities
– Advisory, analytical and technical resources
Re-branded in 2005
Hubs in UK, US, Bermuda, Singapore and Australia
17
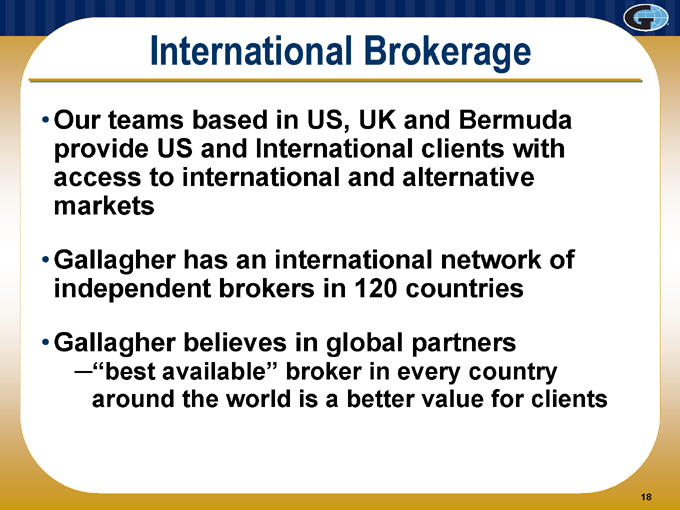
International Brokerage
Our teams based in US, UK and Bermuda provide US and International clients with access to international and alternative markets
Gallagher has an international network of independent brokers in 120 countries
Gallagher believes in global partners
“best available” broker in every country around the world is a better value for clients
18
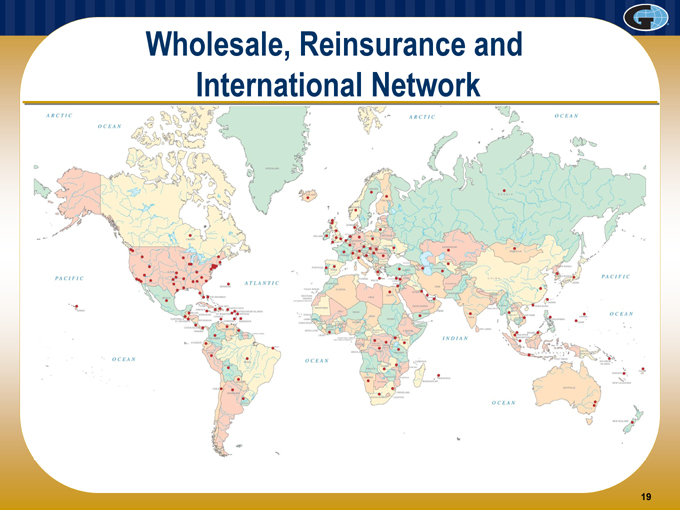
Wholesale, Reinsurance and International Network
19
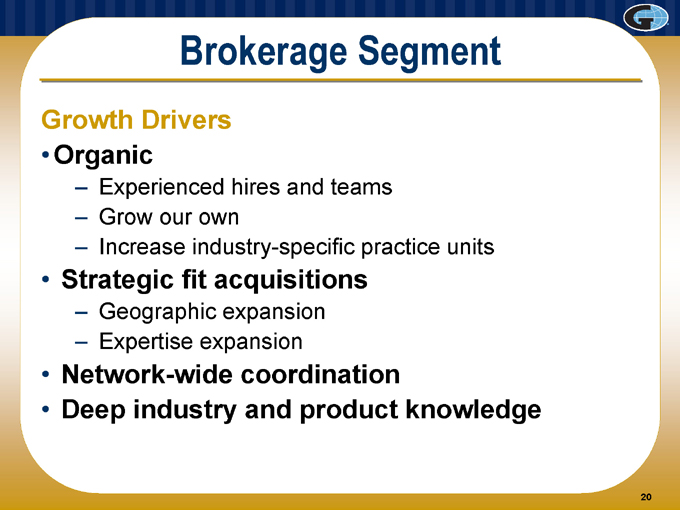
Brokerage Segment
Growth Drivers Organic
– Experienced hires and teams
– Grow our own
– Increase industry-specific practice units
Strategic fit acquisitions
– Geographic expansion
– Expertise expansion
Network-wide coordination
Deep industry and product knowledge
20
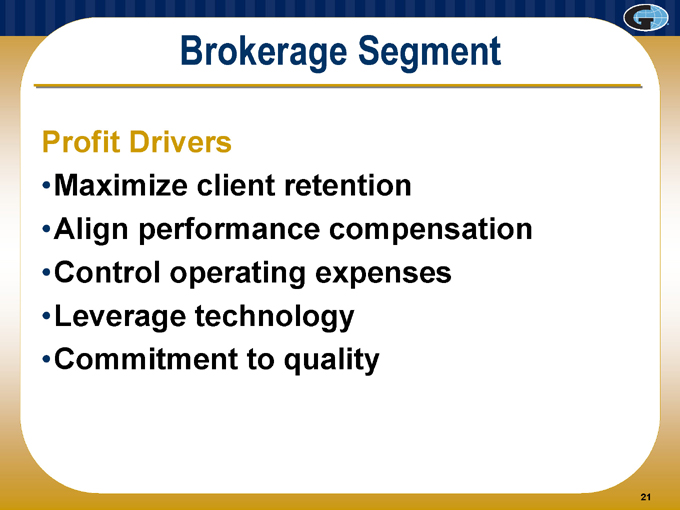
Brokerage Segment
Profit Drivers
Maximize client retention
Align performance compensation Control operating expenses Leverage technology Commitment to quality
21
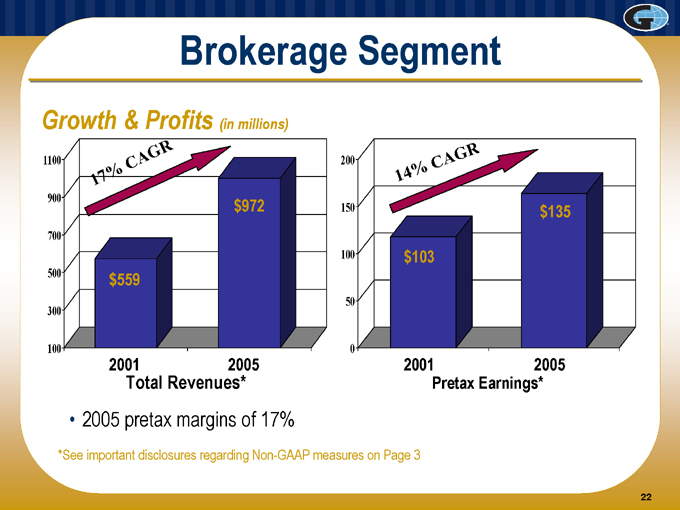
Brokerage Segment
Growth & Profits (in millions)
1100 900 700 500 300 100
17% CAGR
$559 $972
2001 2005
Total Revenues*
200 150 100 50 0
14% CAGR
$103 $135
2001 2005
Pretax Earnings*
2005 pretax margins of 17%
* See important disclosures regarding Non-GAAP measures on Page 3
22
Risk Management Segment
“Gallagher Bassett” provides outsourced P/C claims payment and management services for self-insured clients as well as insurance companies that outsource their claims department We DO NOT chase catastrophe overflow claims One of the world’s largest claims administrators– Business Insurance 80% of business is from non-Gallagher sources Network (vs. dedicated unit) philosophy
23
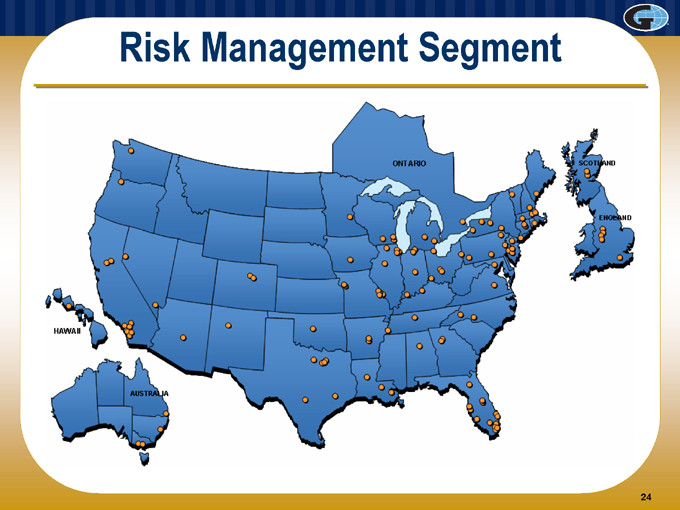
Risk Management Segment
24
Risk Management Segment
Growth Drivers Purely organic Unbundled trend International footprint Deep client intimacy Leverage technology
25
Risk Management Segment
Profit Drivers
Maximize client retention Control operating expenses Leverage technology Commitment to quality
26
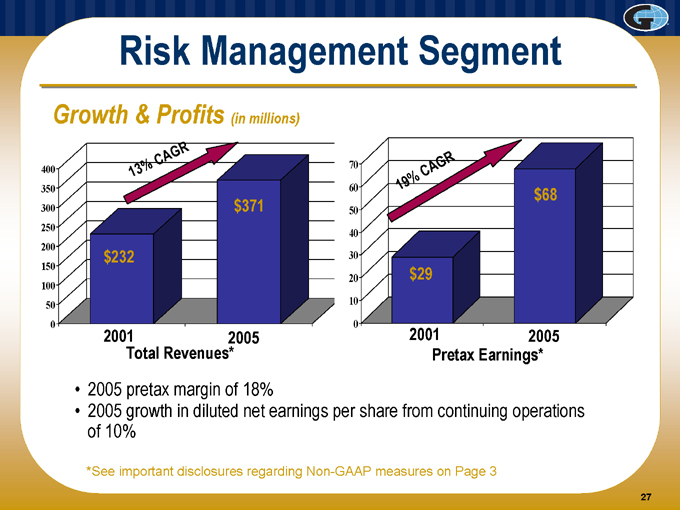
Risk Management Segment
Growth & Profits (in millions)
400 350 300 250 200 150 100 50 0
13% CAGR
$232 $371
70 60 50 40 30 20 10 0
19% CAGR
$29 $68
2001 2005
2001 2005
Total Revenues*
Pretax Earnings*
2005 pretax margin of 18%
2005 growth in diluted net earnings per share from continuing operations of 10%
*See important disclosures regarding Non-GAAP measures on Page 3
27
Financial Services Segment
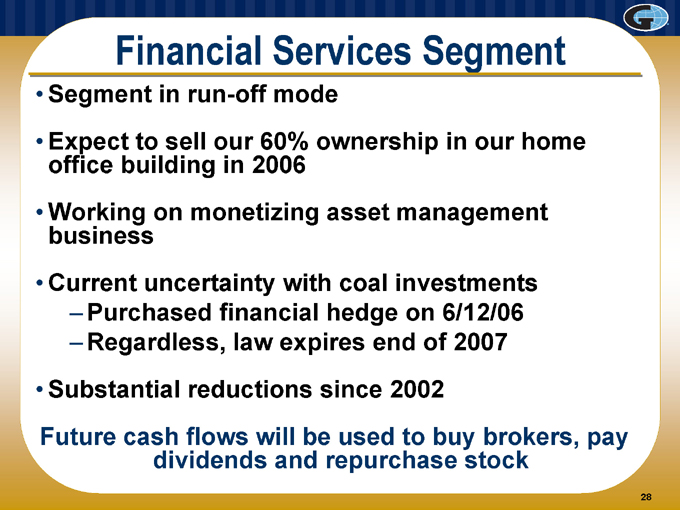
Segment in run-off mode
Expect to sell our 60% ownership in our home office building in 2006 Working on monetizing asset management business Current uncertainty with coal investments
– Purchased financial hedge on 6/12/06
– Regardless, law expires end of 2007 Substantial reductions since 2002
Future cash flows will be used to buy brokers, pay dividends and repurchase stock
28
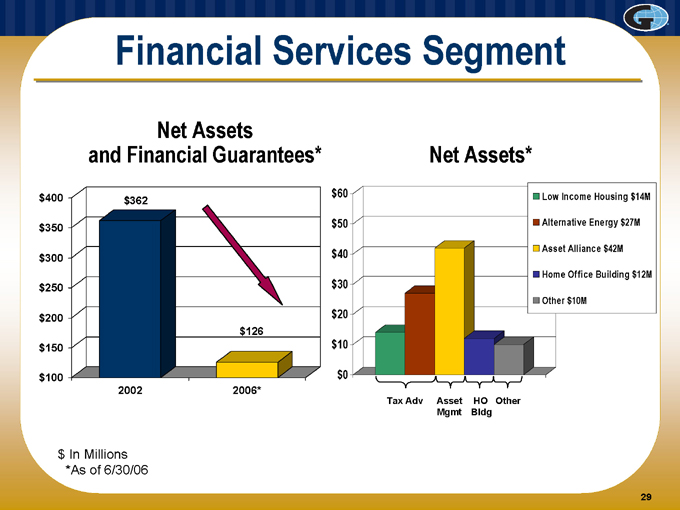
Financial Services Segment
Net Assets and Financial Guarantees* $400
$350
$300
$250
$200 $150 $100 $362
2002 $126
2006* $60 $50 $40 $30 $20 $10 $0
Net Assets*
Tax Adv Asset HO Other Mgmt Bldg
Low Income Housing $14M Alternative Energy $27M Asset Alliance $42M Home Office Building $12M Other $10M $ In Millions *As of 6/30/06
29
2005 Recap
Resolved numerous legacy issues Brokerage revenues up 10%, 2% organic Risk Management revenues up 9%, all organic, and pretax margin at 18%, best in industry Maintained $450 million unsecured credit facility Jan 05 increased dividend 12% 10 acquisitions
See important disclosures regarding Non-GAAP measures on Page 3
30
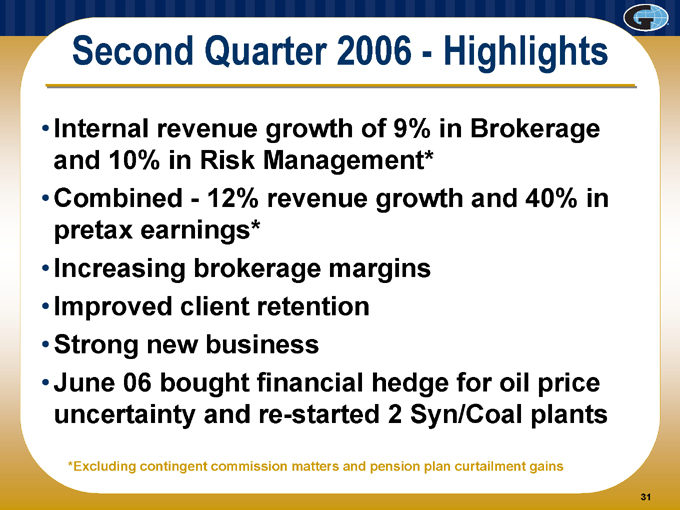
Second Quarter 2006 - - Highlights
Internal revenue growth of 9% in Brokerage and 10% in Risk Management* Combined - 12% revenue growth and 40% in pretax earnings* Increasing brokerage margins Improved client retention Strong new business June 06 bought financial hedge for oil price uncertainty and re-started 2 Syn/Coal plants
*Excluding contingent commission matters and pension plan curtailment gains
31

Where We’re Going
Revenue and pretax growth of 15% per year Target enterprise-wide margin of 20+% Continue selective acquisition strategy Maintain solid, low-risk balance sheet Maximize shareholder returns through dividends and stock repurchases
32
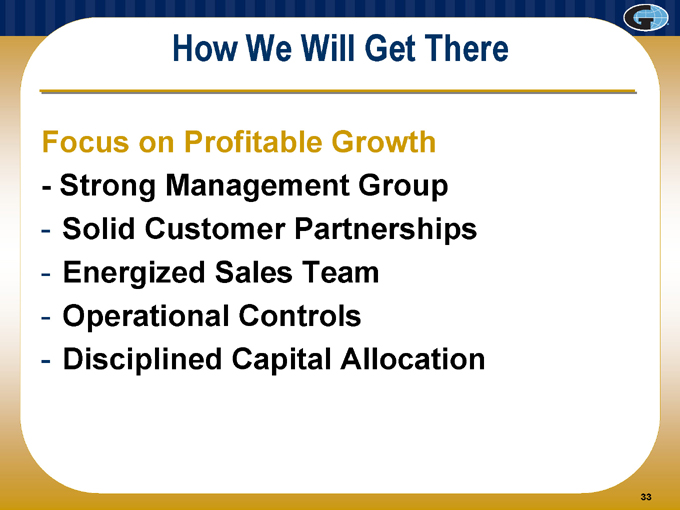
How We Will Get There
Focus on Profitable Growth
- Strong Management Group
- Solid Customer Partnerships
- Energized Sales Team
- Operational Controls
- Disciplined Capital Allocation
33
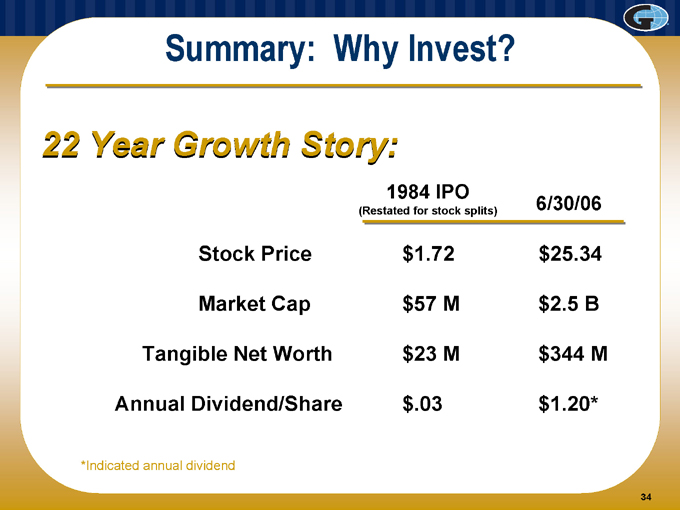
Summary: Why Invest?
22 Year Growth Story:
1984 IPO
(Restated for stock splits) 6/30/06
Stock Price $1.72 $25.34
Market Cap $57 M $2.5 B
Tangible Net Worth $23 M $344 M
Annual Dividend/Share $.03 $1.20*
* Indicated annual dividend
34
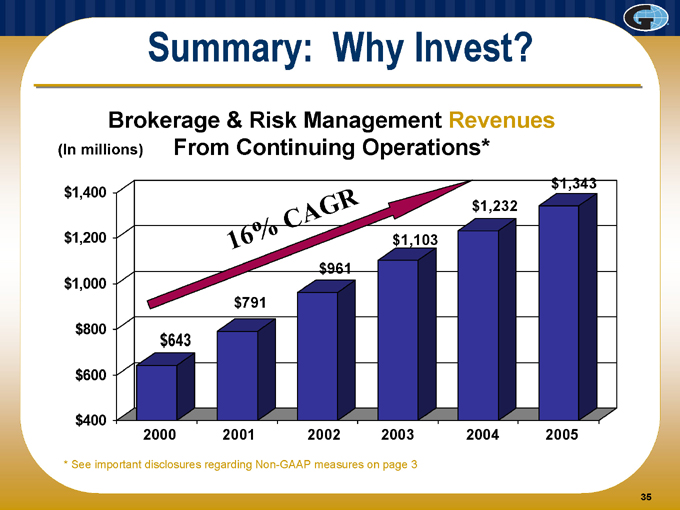
Summary: Why Invest?
Brokerage & Risk Management Revenues From Continuing Operations*
(In millions)
$1,400 $1,200 $1,000 $800 $600 $400
16% CAGR
$643 $791 $961 $1,103 $1,232 $1,343
2000
2001
2002
2003
2004
2005
* See important disclosures regarding Non-GAAP measures on page 3
35
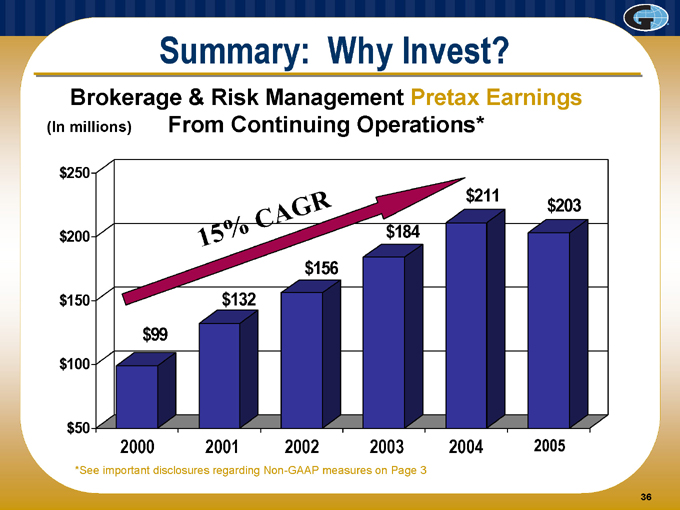
Summary: Why Invest?
Brokerage & Risk Management Pretax Earnings (In millions) From Continuing Operations* $250 $200 $150 $100 $50
15% CAGR
$99 $132 $156 $184 $211 $203
2000 2001 2002 2003 2004 2005
* See important disclosures regarding Non-GAAP measures on Page 3
36
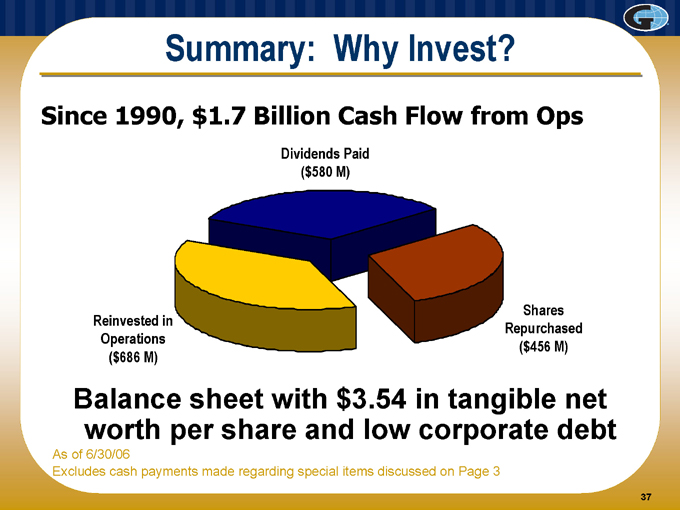
Summary: Why Invest?
Since 1990, $1.7 Billion Cash Flow from Ops
Dividends Paid
($580 M)
Reinvested in Operations
($686 M)
Shares Repurchased
($456 M)
Balance sheet with $3.54 in tangible net worth per share and low corporate debt
As of 6/30/06
Excludes cash payments made regarding special items discussed on Page 3
37
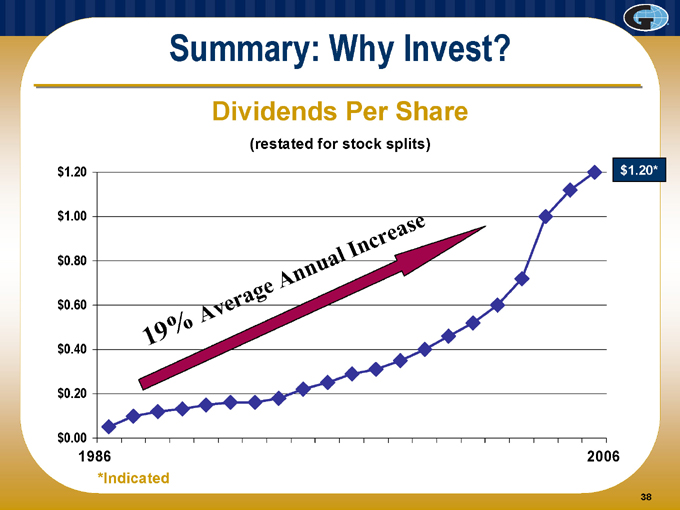
Summary: Why Invest?
Dividends Per Share
(restated for stock splits) $1.20 $1.00 $0.80 $0.60 $0.40 $0.20 $0.00
1986
* Indicated
19%
Average
Annual
Increase $1.20*
2006
38
Arthur J. Gallagher & Co.
Culture Driven Success
The Gallagher Way, Robert E. Gallagher – 1984
Shared values at Gallagher are the rock foundation of the Company and our Culture. What is a Shared Value? These are the concepts that the vast majority of movers and shakers in the Company passionately adhere to. What are some of Gallagher’s Shared Values?
1. We are a Sales and Marketing Company dedicated to providing excellence in Risk Management Services to our clients.
2. We support one another. We believe in one another. We acknowledge and respect the ability of one another.
3. We push for professional excellence.
4. We can all improve and learn from one another.
5. There are no second class citizens — everyone is important and everybody’s job is important.
6. We’re an open society.
7. Empathy for the other person is not a weakness.
8. Suspicion breeds more suspicion. To trust and be trusted is vital.
9. Leaders need followers. How leaders treat followers has a direct impact on the effectiveness of the leader.
10. Interpersonal business relationships should be built. 11. We all need one another. We are all cogs in a wheel. 12. No department or person is an island.
13. | | Professional courtesy is expected. |
14. | | Never ask someone to do something you wouldn’t do yourself. |
15. I consider myself support for our Sales & Marketing. We can’t make things happen without each other. We are a team. 16. Loyalty and respect are earned — not dictated.
18. | | People skills are very important at Gallagher. 20. We run to problems — not away from them. |
21. | | We adhere to the highest standards or moral and ethical behavior. |
22. People work harder and are more effective when they’re turned on — not turned off. 23. We are a warm, close Company. This is a strength — not a weakness.
24. | | We must continue building a professional Company — together — as a team. |
25. Shared values can be altered with circumstances — but carefully and with tact and consideration for one another’s needs.
When accepted Shared Values are changed or challenged, the emotional impact and negative feelings can damage the Company
39