Exhibit 99.2
Brokerage Segment Risk Management Segment Financial Services Segment
NYSE: AJG Arthur J. Gallagher & Co.
INVESTMENT P R O F I L E
GROWING VALUE
Arthur J. Gallagher & Co. is the world’s fourth-largest insurance brokerage and risk management services firm. Gallagher provides a full range of property/casualty (P/C) products and services to clients of all sizes. It is also one of the world’s premier alternative risk transfer and third-party claims managers and a fullservice employee benefits consultant.
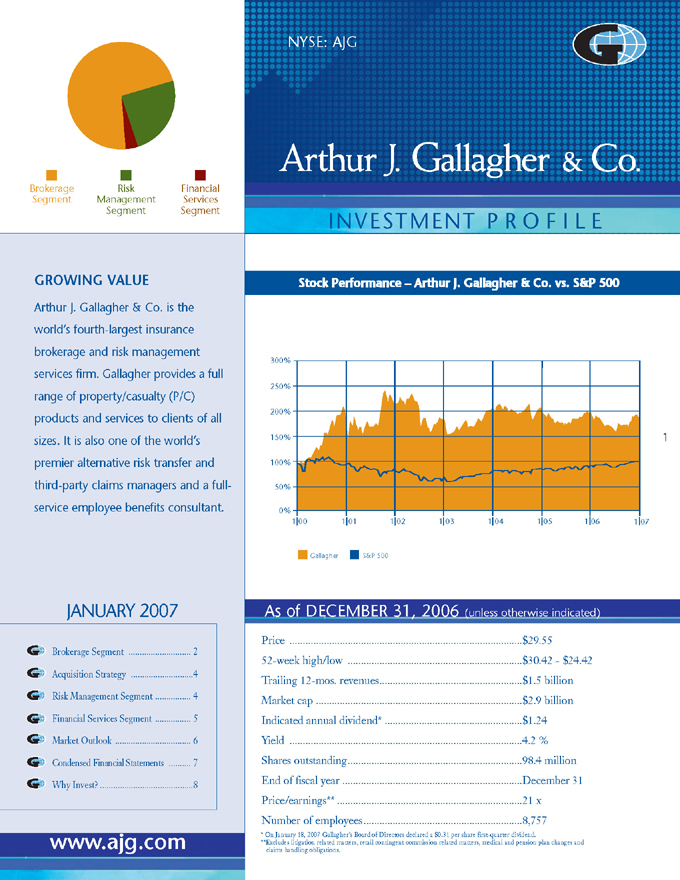
Stock Performance – Arthur J. Gallagher & Co. vs. S&P 500
300%
50%
100%
0%
150%
200%
250%
1 | | 01 1 02 1 03 1 04 1 05 1 00 1 06 1 07 |
Gallagher S&P 500
JANUARY 2007
Brokerage Segment 2
Acquisition Strategy 4
Risk Management Segment 4
Financial Services Segment 5
Market Outlook 6
Condensed Financial Statements 7
Why Invest? 8
As of DECEMBER 31, 2006 (unless otherwise indicated)
Price $29.55
52-week high/low $30.42—$24.42
Trailing 12-mos. revenues $1.5 billion
Market cap $2.9 billion
Indicated annual dividend* $1.24
Yield 4.2 %
Shares outstanding 98.4 million
End of fiscal year December 31
Price/earnings** 21 x
Number of employees 8,757
* | | On January 18, 2007 Gallagher’s Board of Directors declared a $0.31 per share first-quarter dividend. |
**Excludes litigation related matters, retail contingent commission related matters, medical and pension plan changes and
claims handling obligations.
www.ajg.com
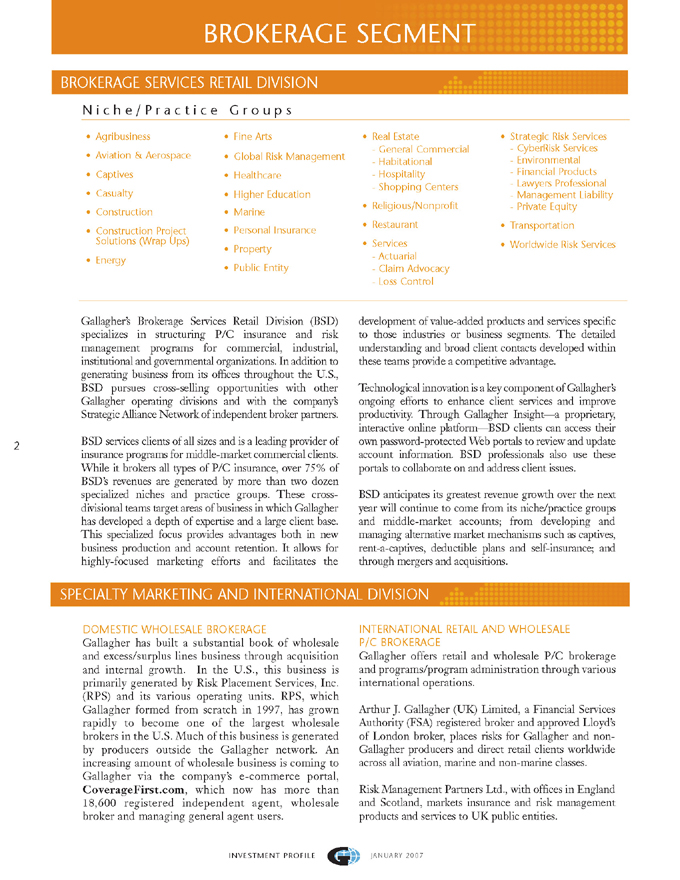
BROKERAGE SEGMENT
BROKERAGE SERVICES RETAIL DIVISION
Niche/Practice Groups
Agribusiness Fine Arts Real Estate Strategic Risk Services
Aviation & Aerospace Global Risk Management General Commercial Habitational CyberRisk Services Environmental
Captives Casualty Construction Healthcare Higher Education Marine Hospitality Shopping Centers Religious/Nonprofit Financial Products Lawyers Professional Management Liability Private Equity
Construction Project Solutions (Wrap Ups) Energy Personal Insurance Property Public Entity Restaurant Services—Actuarial Claim Advocacy Transportation Worldwide Risk Services
Loss Control
Gallagher’s Brokerage Services Retail Division (BSD) specializes in structuring P/C insurance and risk management programs for commercial, industrial, institutional and governmental organizations. In addition to generating business from its offices throughout the U.S., BSD pursues cross-selling opportunities with other Gallagher operating divisions and with the company’s Strategic Alliance Network of independent broker partners.
BSD services clients of all sizes and is a leading provider of insurance programs for middle-market commercial clients. While it brokers all types of P/C insurance, over 75% of BSD’s revenues are generated by more than two dozen specialized niches and practice groups. These crossdivisional teams target areas of business in which Gallagher has developed a depth of expertise and a large client base. This specialized focus provides advantages both in new business production and account retention. It allows for highly-focused marketing efforts and facilitates the development of value-added products and services specific to those industries or business segments. The detailed understanding and broad client contacts developed within these teams provide a competitive advantage.
Technological innovation is a key component of Gallagher’s ongoing efforts to enhance client services and improve productivity. Through Gallagher Insight—a proprietary, interactive online platform—BSD clients can access their own password-protected Web portals to review and update account information. BSD professionals also use these portals to collaborate on and address client issues.
BSD anticipates its greatest revenue growth over the next year will continue to come from its niche/practice groups and middle-market accounts; from developing and managing alternative market mechanisms such as captives, rent-a-captives, deductible plans and self-insurance; and through mergers and acquisitions.
SPECIALTY MARKETING AND INTERNATIONAL DIVISION
DOMESTIC WHOLESALE BROKERAGE
Gallagher has built a substantial book of wholesale and excess/surplus lines business through acquisition and internal growth. In the U.S., this business is primarily generated by Risk Placement Services, Inc. (RPS) and its various operating units. RPS, which Gallagher formed from scratch in 1997, has grown rapidly to become one of the largest wholesale brokers in the U.S. Much of this business is generated by producers outside the Gallagher network. An increasing amount of wholesale business is coming to Gallagher via the company’s e-commerce portal, CoverageFirst.com, which now has more than 18,600 registered independent agent, wholesale broker and managing general agent users.
INTERNATIONAL RETAIL AND WHOLESALE
P/C BROKERAGE
Gallagher offers retail and wholesale P/C brokerage and programs/program administration through various international operations.
Arthur J. Gallagher (UK) Limited, a Financial Services Authority (FSA) registered broker and approved Lloyd’s of London broker, places risks for Gallagher and non- Gallagher producers and direct retail clients worldwide across all aviation, marine and non-marine classes.
Risk Management Partners Ltd., with offices in England and Scotland, markets insurance and risk management products and services to UK public entities.
INVESTMENT PROFILE
JANUARY 2007
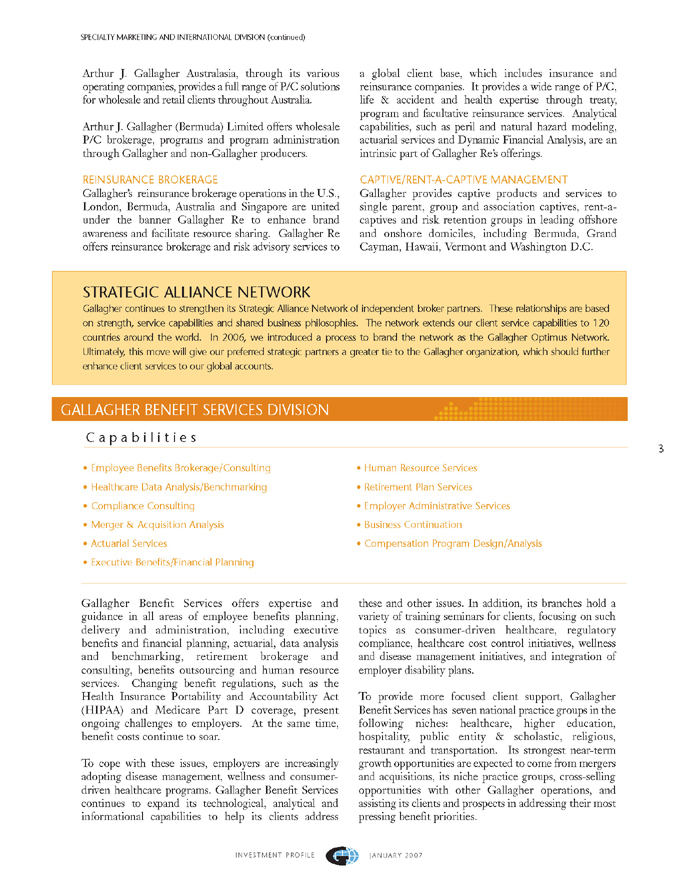
SPECIALTY MARKETING AND INTERNATIONAL DIVISION (continued)
Arthur J. Gallagher Australasia, through its various operating companies, provides a full range of P/C solutions for wholesale and retail clients throughout Australia.
Arthur J. Gallagher (Bermuda) Limited offers wholesale P/C brokerage, programs and program administration through Gallagher and non-Gallagher producers.
REINSURANCE BROKERAGE
Gallagher’s reinsurance brokerage operations in the U.S., London, Bermuda, Australia and Singapore are united under the banner Gallagher Re to enhance brand awareness and facilitate resource sharing. Gallagher Re offers reinsurance brokerage and risk advisory services to a global client base, which includes insurance and reinsurance companies. It provides a wide range of P/C, life & accident and health expertise through treaty, program and facultative reinsurance services. Analytical capabilities, such as peril and natural hazard modeling, actuarial services and Dynamic Financial Analysis, are an intrinsic part of Gallagher Re’s offerings.
CAPTIVE/RENT-A-CAPTIVE MANAGEMENT
Gallagher provides captive products and services to single parent, group and association captives, rent-acaptives and risk retention groups in leading offshore and onshore domiciles, including Bermuda, Grand Cayman, Hawaii, Vermont and Washington D.C.
STRATEGIC ALLIANCE NETWORK
Gallagher continues to strengthen its Strategic Alliance Network of independent broker partners. These relationships are based on strength, service capabilities and shared business philosophies. The network extends our client service capabilities to 120 countries around the world. In 2006, we introduced a process to brand the network as the Gallagher Optimus Network. Ultimately, this move will give our preferred strategic partners a greater tie to the Gallagher organization, which should further enhance client services to our global accounts.
GALLAGHER BENEFIT SERVICES DIVISION
Capabilities
Employee Benefits Brokerage/Consulting Human Resource Services
Healthcare Data Analysis/Benchmarking Retirement Plan Services
Compliance Consulting Employer Administrative Services
Merger & Acquisition Analysis Business Continuation
Actuarial Services Compensation Program Design/Analysis
Executive Benefits/Financial Planning
Gallagher Benefit Services offers expertise and guidance in all areas of employee benefits planning, delivery and administration, including executive benefits and financial planning, actuarial, data analysis and benchmarking, retirement brokerage and consulting, benefits outsourcing and human resource services. Changing benefit regulations, such as the Health Insurance Portability and Accountability Act (HIPAA) and Medicare Part D coverage, present ongoing challenges to employers. At the same time, benefit costs continue to soar.
To cope with these issues, employers are increasingly adopting disease management, wellness and consumerdriven healthcare programs. Gallagher Benefit Services continues to expand its technological, analytical and informational capabilities to help its clients address these and other issues. In addition, its branches hold a variety of training seminars for clients, focusing on such topics as consumer-driven healthcare, regulatory compliance, healthcare cost control initiatives, wellness and disease management initiatives, and integration of employer disability plans.
To provide more focused client support, Gallagher Benefit Services has seven national practice groups in the following niches: healthcare, higher education, hospitality, public entity & scholastic, religious, restaurant and transportation. Its strongest near-term growth opportunities are expected to come from mergers and acquisitions, its niche practice groups, cross-selling opportunities with other Gallagher operations, and assisting its clients and prospects in addressing their most pressing benefit priorities.
INVESTMENT PROFILE
JANUARY 2007
ACQUISITION STRATEGY
Gallagher made 165 acquisitions from 1986 through December 2006, almost exclusively within the Brokerage Segment. The majority of these have been regional or local P/C brokers possessing a strong middle-market focus or significant expertise in a desirable market niche. Over the last decade, Gallagher has also increased its acquisition activity in the benefits consulting area. Acquisitions typically fall within the $5 million to $15 million range.
Gallagher is highly selective. An acquisition must offer significant benefits, such as expanding the company’s talent pool, enhancing its geographic presence and service capabilities, and/or broadening and further diversifying its business mix. In selecting acquisition candidates, Gallagher focuses on:
a corporate culture that matches its own aggressive, sales-oriented culture
a profitable, growing business thats ability to compete would be enhanced by gaining access to Gallagher’s greater resources
clearly defined financial criteria.
Management anticipates that Gallagher’s historical acquisition pace will continue. Contributing to the company’s success as an acquirer is its attractiveness as a merger partner. Growth-oriented independent brokers and consultants are attracted by its aggressive, sales-oriented culture and incentive-based compensation structure.
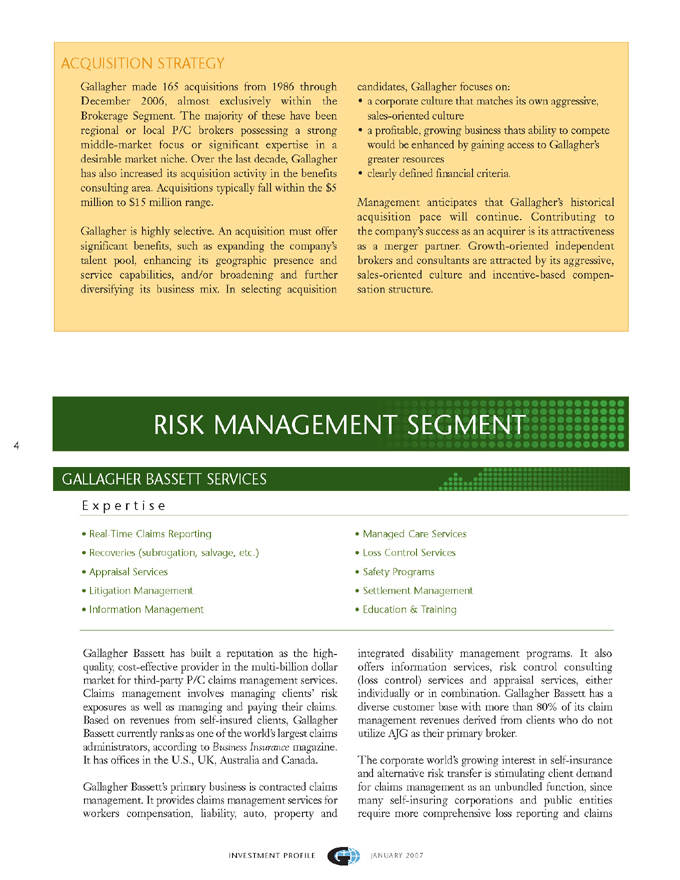
RISK MANAGEMENT SEGMENT
GALLAGHER BASSETT SERVICES
Expertise
Real-Time Claims Reporting Managed Care Services
Recoveries (subrogation, salvage, etc.) Loss Control Services
Appraisal Services Safety Programs
Litigation Management Settlement Management
Information Management Education & Training
Gallagher Bassett has built a reputation as the highquality, cost-effective provider in the multi-billion dollar market for third-party P/C claims management services. Claims management involves managing clients’ risk exposures as well as managing and paying their claims. Based on revenues from self-insured clients, Gallagher Bassett currently ranks as one of the world’s largest claims administrators, according to Business Insurance magazine. It has offices in the U.S., UK, Australia and Canada.
Gallagher Bassett’s primary business is contracted claims management. It provides claims management services for workers compensation, liability, auto, property and integrated disability management programs. It also offers information services, risk control consulting (loss control) services and appraisal services, either individually or in combination. Gallagher Bassett has a diverse customer base with more than 80% of its claim management revenues derived from clients who do not utilize AJG as their primary broker.
The corporate world’s growing interest in self-insurance and alternative risk transfer is stimulating client demand for claims management as an unbundled function, since many self-insuring corporations and public entities require more comprehensive loss reporting and claims
INVESTMENT PROFILE
JANUARY 2007
tracking services than are typically provided by an insurance company. With Gallagher Bassett’s sophisticated claims management data systems and extensive network, it has reached a point where scale gives it a distinct competitive advantage. The division has also maintained an unwavering commitment to quality for more than a decade-and-a-half that has significantly reduced its rework and processing costs, leading to an exceptional annual client retention rate.
Gallagher Bassett’s Web-based, proprietary claims and loss control information management system, risxfacs.com, brings diverse elements of intelligent risk management together in a comprehensive system that streamlines client loss and claim processes. During the fourth quarter of 2006, the system had 14,500 users and was averaging nearly 21 million site hits and 75,000 visitor sessions per month.
The division expects its most significant growth prospects through the next year will come from Fortune 1000 companies, captives, program business and the outsourcing of insurance company claims departments.
FINANCIAL SERVICES SEGMENT
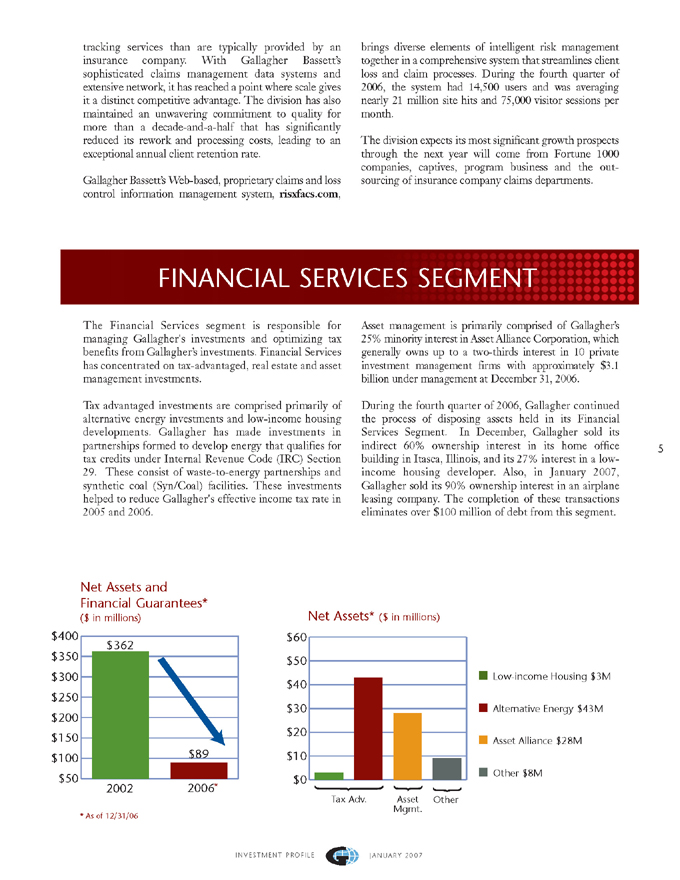
The Financial Services segment is responsible for managing Gallagher’s investments and optimizing tax benefits from Gallagher’s investments. Financial Services has concentrated on tax-advantaged, real estate and asset management investments.
Tax advantaged investments are comprised primarily of alternative energy investments and low-income housing developments. Gallagher has made investments in partnerships formed to develop energy that qualifies for tax credits under Internal Revenue Code (IRC) Section 29. These consist of waste-to-energy partnerships and synthetic coal (Syn/Coal) facilities. These investments helped to reduce Gallagher’s effective income tax rate in 2005 and 2006.
Asset management is primarily comprised of Gallagher’s 25% minority interest in Asset Alliance Corporation, which generally owns up to a two-thirds interest in 10 private investment management firms with approximately $3.1 billion under management at December 31, 2006.
During the fourth quarter of 2006, Gallagher continued the process of disposing assets held in its Financial Services Segment. In December, Gallagher sold its indirect 60% ownership interest in its home office building in Itasca, Illinois, and its 27% interest in a lowincome housing developer. Also, in January 2007, Gallagher sold its 90% ownership interest in an airplane leasing company. The completion of these transactions eliminates over $100 million of debt from this segment.
Net Assets and
Financial Guarantees* ($ in millions)
2002 2006
$362
$89
$50
$100
$150
$200
$250
$300
$350
$400
Net Assets* ($ in millions)
$0
$10
$20
$30
$40
$50
$60
Low-income Housing $3M
Alternative Energy $43M
Asset Alliance $28M
Other $8M
Tax Adv. Asset Mgmt. Other
INVESTMENT PROFILE JANUARY 2007
MARKET OUTLOOK
The P/C market is cyclical, fluctuating between periods of broad coverage availability and widespread rate reductions (referred to as a “soft” market), and periods of significant rate increases and limited coverage availability (referred to as a “hard” market). Hard markets are typically triggered when rates have been driven so low that underwriting losses exceed total premiums collected, threatening insurer solvency on a large-scale basis.
Throughout the 1990s, an over-abundance of underwriting capacity created an extremely competitive environment for most P/C insurers, putting them under significant pressure to reduce premium rates despite growing underwriting losses. As a result, between 1992 and 2000 the overall cost of managing risk for U.S. corporations dropped 42%. A market correction began in 2000 and intensified in 2001 following the September 11th terrorist attacks. Doubledigit rate increases and coverage restrictions continued throughout 2002.
In 2003, commercial P/C premiums stabilized and the market again began to soften, with premium rates falling, on average, throughout 2004, 2005 and 2006. One notable exception was coastal properties, which experienced significant rate hikes and coverage restrictions following 2005’s unprecedented hurricane season and the resulting devastation. According to quarterly market surveys conducted by the Council of Insurance Agents and Brokers (CIAB), commercial P/C rate reductions in the first half of 2006 averaged about 3% across the U.S. The magnitude of rate decreases accelerated in the second half, averaging 5% in the third quarter and almost 10% in the fourth quarter. Coastal properties, however, continued to face capacity restrictions and increases in deductibles and exclusions, with premium levels at historic highs, according to survey respondents.
Insurance brokers, as intermediaries between insurers and their customers, normally assume no underwriting risk. Their role is to add value to the transaction by explaining to clients the complex array of insurance and risk management products available; negotiating with insurers for optimum rates and coverage terms and conditions; and helping to place complex risks for clients and other brokers. Large brokers such as Gallagher also help insurance companies transfer some of their own risk to reinsurance providers. As compensation, brokers receive commissions from insurers or fees directly from clients.
In addition to structuring traditional P/C programs, Gallagher assists many clients in managing risk through the alternative market, a segment that includes selfinsurance, captives, rent-a-captives and risk retention groups. According to industry estimates, these mechanisms now account for nearly 50% of the total commercial P/C market in the U.S. When traditional coverage becomes more expensive and harder to obtain, interest in alternative market mechanisms escalates. While competition has increased, Gallagher continues to see a strong interest in alternative market mechanisms.
The insurance industry remains under scrutiny by various regulatory bodies, including State Attorneys General and departments of insurance for various states, and legal actions by private litigants with respect to contingent compensation arrangements and various historical business practices. As previously reported, Gallagher entered into an Assurance of Voluntary Compliance (the AVC) on May 18, 2005, with both the Attorney General and Director of Insurance in the State of Illinois to resolve all issues related to certain investigations conducted by these Illinois State Agencies involving contingent commission arrangements. There was no lawsuit nor any finding of unlawful or deceitful conduct. As stipulated in the AVC, on January 12, 2006, Gallagher paid $26.9 million into a fund to be distributed to certain eligible policyholder clients. As of December 31, 2006, $18.4 million had been paid from the fund to eligible policyholders. In addition, under the AVC, Gallagher agreed to implement, to the extent not previously undertaken, certain business changes, including agreeing not to accept U.S.-domiciled retail contingent compensation as defined in the AVC. However, as allowed under the AVC, Gallagher has continued to accept contingent compensation from non-retail business, including business generated by wholesalers, managing general agents and managing general underwriters. In addition, the AVC allows Gallagher to collect retail contingent compensation related to contracts in place at entities it acquires for up to three years from the acquisition date. Accordingly, in 2005 Gallagher began to experience reduced contingent commission revenue, and in 2006, Gallagher received $2.5 million in retail contingent commission revenue verses $28.8 million in 2005.
On December 29, 2006, Gallagher reached an agreement to resolve all claims in a Federal Multi-District class action litigation (MDL) pending in the New Jersey Federal District Court. The MDL, which names dozens of insurers, reinsurers and brokers, focuses on industry-wide contingent commission matters. While admitting no wrongdoing, Gallagher chose to conclude its involvement rather than prolong what could be a costly and burdensome lawsuit. Subject to court approval, Gallagher’s settlement of $28.0 million plus plaintiff’s attorney fees resolves substantially all pending civil actions against the company related to those matters. In 2005, Gallagher established a provision for this matter that covered substantially all of the costs associated with this settlement. However, in the fourth quarter of 2006, Gallagher recorded a pretax charge of $9.0 million for administrative expenses related to the MDL and to resolve other regulatory and civil litigation matters. Gallagher continues to be the subject of various regulatory and legal actions by State Attorneys General and private litigants investigating various historical business practices.
SAFE HARBOR STATEMENT Except for the historical information and discussions, statements contained herein may contain certain “forward-looking statements” relating to future results. The Private Securities Litigation Reform Act of 1995 provides a safe harbor for forward-looking statements. These forward-looking statements are subject to certain risks and uncertainties that could cause actual results to differ materially from those expected, depending on a variety of factors such as changes in worldwide and national economic conditions, changes in premium rates and in insurance markets generally, and changes in securities and fixed income markets, as well as developments in the areas of tax legislation and crude oil prices. Please refer to our filings with the Securities and Exchange Commission, including Item 1, “Business – Information Concerning Forward-Looking Statements” and Item 1A, “Risk Factors,” of our Annual Report on Form 10-K, for a more detailed discussion of these factors. This document includes certain non-GAAP financial measures as defined under rules promulgated by the SEC. As required by SEC rules, we have provided reconciliations of those measures to the most directly comparable GAAP measures, which are available on our Web site at www.ajg.com.
INVESTMENT PROFILE JANUARY 2007
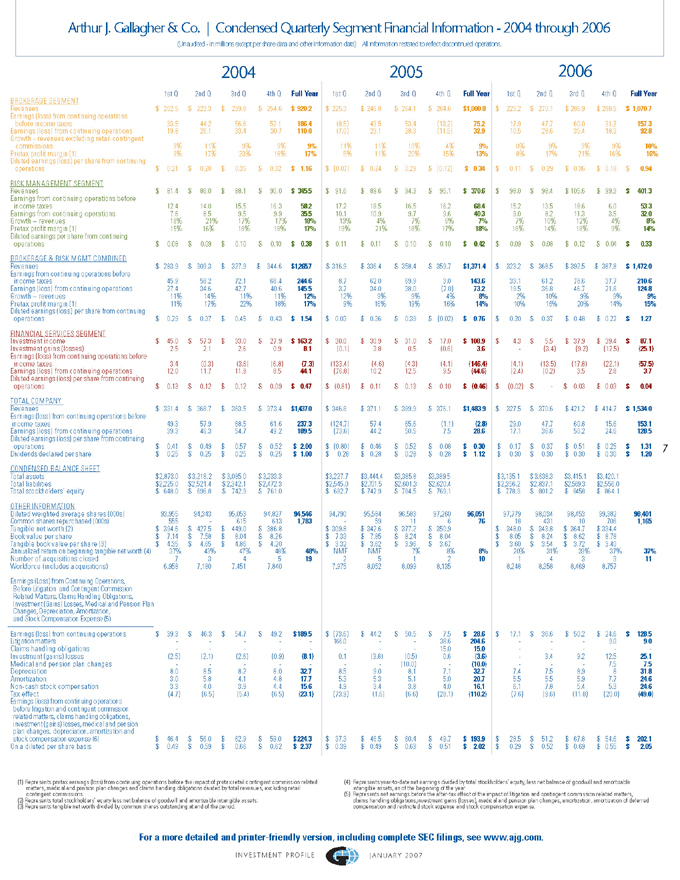
Arthur J. Gallagher & Co. | Condensed Quarterly Segment Financial Information—2004 through 2006
(Unaudited—in millions except per share data and other information data) All information restated to reflect discontinued operations.
2004 2005 2006
1st Q 2nd Q 3rd Q 4th Q Full Year 1st Q 2nd Q 3rd Q 4th Q Full Year 1st Q 2nd Q 3rd Q 4th Q Full Year
BROKERAGE SEGMENT
Revenues $202.5 $223.3 $239.8 $254.6 $920.2 $225.3 $246.8 $264.1 $264.6 $1,000.8 $225.2 $270.1 $286.9 $288.5 $1,070.7
Earnings (loss) from continuing operations before income taxes 33.5 44.2 56.6 52.1 186.4 (8.5) 43.5 53.4 (13.2) 75.2 17.9 47.7 60.0 31.7 157.3
Earnings (loss) from continuing operations 19.8 26.1 33.4 30.7 110.0 (7.0) 23.1 28.3 (11.5) 32.9 10.5 28.6 35.4 18.3 92.8
Growth—revenues excluding retail contingent commissions 9% 11% 9% 9% 9% 11% 11% 10% 4% 9% 0% 9% 9% 9% 10%
Pretax profit margin (1) 9% 17% 23% 18% 17% 5% 11% 20% 15% 13% 8% 17% 21% 16% 16%
Diluted earnings (loss) per share from continuing operations $0.21 $0.28 $0.35 $0.32 $1.16 $(0.07) $0.24 $0.29 $(0.12) $0.34 $0.11 $0.29 $0.36 $0.18 $0.94
RISK MANAGEMENT SEGMENT
Revenues $81.4 $86.0 $88.1 $90.0 $345.5 $91.6 $89.6 $94.3 $95.1 $370.6 $98.0 $98.4 $105.6 $99.3 $401.3
Earnings from continuing operations before income taxes 12.4 14.0 15.5 16.3 58.2 17.2 18.5 16.5 16.2 68.4 15.2 13.5 18.6 6.0 53.3
Earnings from continuing operations 7.6 8.5 9.5 9.9 35.5 10.1 10.9 9.7 9.6 40.3 9.0 8.2 11.3 3.5 32.0
Growth—revenues 18% 21% 17% 17% 18% 13% 4% 7% 6% 7% 7% 10% 12% 4% 8%
Pretax profit margin (1) 15% 16% 18% 18% 17% 19% 21% 18% 17% 18% 16% 14% 18% 9% 14%
Diluted earnings per share from continuing operations $0.08 $0.09 $0.10 $0.10 $0.38 $0.11 $0.11 $0.10 $0.10 $0.42 $0.09 $0.08 $0.12 $0.04 $0.33
BROKERAGE & RISK MGMT COMBINED
Revenues $283.9 $309.3 $327.9 $344.6 $1,265.7 $316.9 $336.4 $358.4 $359.7 $1,371.4 $323.2 $368.5 $392.5 $387.8 $1,472.0
Earnings from continuing operations before income taxes 45.9 58.2 72.1 68.4 244.6 8.7 62.0 69.9 3.0 143.6 33.1 61.2 78.6 37.7 210.6
Earnings (loss) from continuing operations 27.4 34.6 42.7 40.6 145.5 3.2 34.0 38.0 (2.0) 73.2 19.5 36.8 46.7 21.8 124.8
Growth-revenues 11% 14% 11% 11% 12% 12% 9% 9% 4% 8% 2% 10% 9% 9% 9%
Pretax profit margin (1) 11% 17% 22% 18% 17% 9% 16% 19% 16% 14% 10% 16% 20% 14% 15%
Diluted earnings (loss) per share from continuing operations $0.29 $0.37 $0.45 $0.43 $1.54 $0.03 $0.36 $0.39 $(0.02) $0.76 $0.20 $0.37 $0.48 $0.22 $1.27
FINANCIAL SERVICES SEGMENT
Investment income $45.0 $57.3 $33.0 $27.9 $163.2 $30.0 $30.9 $31.0 $17.0 $108.9 $4.3 $5.5 $37.9 $39.4 $87.1
Investment gains (losses) 2.5 2.1 2.6 0.9 8.1 (0.1) 3.8 0.5 (0.6) 3.6 (3.4) (9.2) (12.5) (25.1)
Earnings (loss) from continuing operations before income taxes 3.4 (0.3) (3.6) (6.8) (7.3) (133.4) (4.6) (4.3) (4.1) (146.4) (4.1) (13.5) (17.8) (22.1) (57.5)
Earnings (loss) from continuing operations 12.0 11.7 11.9 8.5 44.1 (76.8) 10.2 12.5 9.5 (44.6) (2.4) (0.2) 3.5 2.8 3.7
Diluted earnings (loss) per share from continuing operations $0.13 $0.12 $0.12 $0.09 $0.47 $(0.81) $0.11 $0.13 $0.10 $(0.46) $(0.02) $$0.03 $0.03 $0.04
TOTAL COMPANY
Revenues $331.4 $368.7 $363.5 $373.4 $1,437.0 $346.8 $371.1 $389.9 $376.1 $1,483.9 $327.5 $370.6 $421.2 $414.7 s 1,534.0
Earnings (loss) from continuing operations before income taxes 49.3 57.9 68.5 61.6 237.3 (124.7) 57.4 65.6 (1.1) (2.8) 29.0 47.7 60.8 15.6 153.1
Earnings (loss) from continuing operations 39.3 46.3 54.7 49.2 189.5 (73.6) 44.2 50.5 7.5 28.6 17.1 36.6 50.2 24.6 128.5
Diluted earnings (loss) per share from continuing operations $0.41 $0.49 $0.57 $0.52 $2.00 $(0.80) $0.46 $0.52 $0.08 $0.30 $0.17 $0.37 $0.51 $0.25 $1.31
Dividends declared per share $0.25 $0.25 $0.25 $0.25 $1.00 $0.28 $0.28 $0.28 $0.28 $1.12 $0.30 $0.30 $0.30 $0.30 $1.20
CONDENSED BALANCE SHEET
Total assets $2,873.0 $3,218.2 $3,085.0 $3,233.3 $3,227.7 $3,444.4 $3,444.4 $3,385.8 $3,389.5 $3,135.1 $3,638.3 $3,415.1 $3,420.1
Total liabilities $2,225.0 $2,521.4 $2,342.1 $2,472.3 $2,545.0 $2,701.5 $2,601.3 $2,620.4 $2,356.2 $2,837.1 $2,569.3 $2,601.3 $2,556.0
Total stockholders’ equity $648.0 $696.8 $742.9 $761.0 $742.9 $7 $682.7 $784.5 $769.1 $778.9 $801.2 $845.8 $864.1
OTHER INFORMATION
Diluted weighted average shares (000s) 93,955 94,343 95,053 94,827 94,546 94,790 95,584 96,583 97,260 96,051 97,779 98,034 98,453 99,382 98,401
Common shares repurchased (000s) 555 615 613 1,783 59 11 6 76 18 431 10 706 1,165
Tangible net worth (2) $394.6 $427.5 $449.0 $386.8 $309.8 $342.6 $377.2 $350.9 $348.0 $348.0 $343.8 $364.7 $334.4
Bookvalue per share $7.14 $7.58 $8.04 $8.26 $7.33 $7.85 $8.24 $8.04 $8.05 $8.24 $8.62 $8.78
Tangible bookvalue per share (3) $4.35 $4.65 $4.86 $4.20 $3.32 $3.62 $3.96 $3.67 $3.60 $3.54 $3.72 $3.40
Annualized return on beginning tangible net worth (4) 37% 43% 47% 48% 48% NMF NMF 7% 8% 8% 20% 31% 39% 37% 37%
Number of acquisitions closed 7 3 4 5 19 2 5 1 2 10 1 4 3 3 11
Workforce (includes acquisitions) 6,958 7,180 7,451 7,840 7,975 8,052 8,099 8,135 8,248 8,358 8,469 8,757
Earnings (Loss) from Continuing Operations, Before Litigation and Contingent Commission Related Matters, Claims Handling Obligations, Investment (Gains) Losses, Medical and Pension Plan Changes, Depreciation, Amortization, and Stock Compensation Expense (5) Earnings (loss) from continuing operations $39.3 $46.3 $54.7 $49.2 $189.5 $(73.6) $44.2 $50.5 $7.5 $28.6 $17.1 $36.6 $50.2 $24.6 s 128.5
Litigation matters 166.0 38.6 204.6 9.0 9.0
Claims handling obligations 15.0 15.0
Investment (gains) losses (2.5) (2.1) (2.6) (0.9) (8.1) 0.1 (3.8) (0.5) 0.6 (3.6) 3.4 9.2 12.5 25.1
Medical and pension plan changes———- (10.0) (10.0)—- 7.5 7.5
Depreciation 8.0 8.5 8.2 8.0 32.7 8.5 9.0 8.1 7.1 32.7 7.4 7.5 8.9 8 31.8
Amortization 3.0 5.8 4.1 4.8 17.7 5.3 5.3 5.1 5.0 20.7 5.5 5.5 5.9 7.7 24.6
Non-cash stock compensation 3.3 4.0 3.9 4.4 15.6 4.9 3.4 3.8 4.0 16.1 6.1 7.8 5.4 5.3 24.6
Tax effect (4.7) (6.5) (5.4) (6.5) (23.1) (73.9) (1.6) (6.6) (28.1) (110.2) (7.6) (9.6) (11.8) (20.0) (49.0)
Earnings (loss) from continuing operations before litigation and contingent commission related matters, claims handling obligations, investment (gains) losses, medical and pension plan changes, depreciation, amortization and stock compensation expense (6) $46.4 $56.0 $62.9 $59.0 $224.3 $37.3 $46.5 $60.4 $49.7 $193.9 $28.5 $51.2 $67.8 $54.6 s 202.1
On a diluted per share basis $0.49 $0.59 $0.66 $0.62 $2.37 $0.39 $0.49 $0.63 $0.51 $2.02 $0.29 $0.52 $0.69 $0.55 s 2.05
(1) Represents pretax earnings (loss) from continuing operations before the impact of pretax retail contingent commission related matters, medical and pension plan changes and claims handling obligations divided by total revenues, excluding retail contingent commissions.
(2) | | Represents total stockholders’ equity less net balance of goodwill and amortizable intangible assets. |
(3) | | Represents tangible net worth divided by common shares outstanding at end of the period. |
(4) Represents year-to-date net earnings divided by total stockholders’ equity, less net balance of goodwill and amortizable intangible assets, as of the beginning of the year.
(5) Represents net earnings before the after-tax effect of the impact of litigation and contingent commission related matters, claims handling obligations,investment gains (losses), medical and pension plan changes, amortization, amortization of deferred compensation and restricted stock expense and stock compensation expense.
For a more detailed and printer-friendly version, including complete SEC filings, see www.ajg.com.
INVESTMENT PROFILE JANUARY 2007
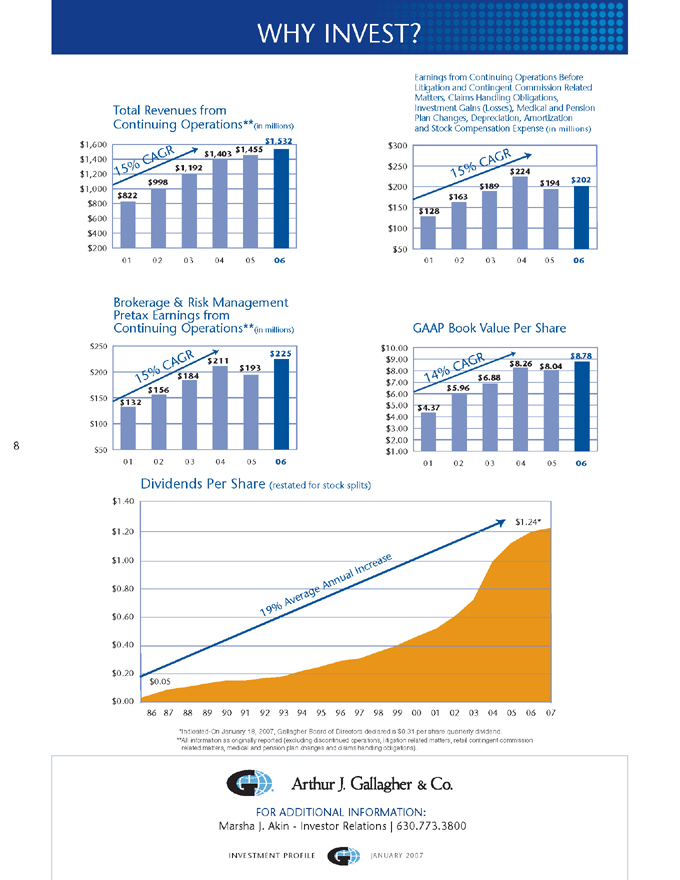
WHY INVEST?
Total Revenues from
Continuing Operations**(in millions)
15% CAGR
$822
$998
$1,192
$1,403 $1,455
$1,532
$200
$400
$600
$800
$1,000
$1,200
$1,400
$1,600
01 02 03 04 05 06
Brokerage & Risk Management
Pretax Earnings from
Continuing Operations**(in millions)
15% CAGR
$132
$156
$184
$211
$193
$225
$50
$100
$150
$200
$250
01 02 03 04 05 06
Earnings from Continuing Operations Before
Litigation and Contingent Commission Related
Matters, Claims Handling Obligations,
Investment Gains (Losses), Medical and Pension
Plan Changes, Depreciation, Amortization
and Stock Compensation Expense (in millions)
$128
$163
$189
$224
$194
$202
15% CAGR
$50
$100
$150
$200
$250
$300
01 02 03 04 05 06
GAAP Book Value Per Share
$4.37
$5.96
$6.88
$8.26
$8.04
$8.78
14% CAGR
$1.00
$2.00
$3.00
$4.00
$5.00
$6.00
$7.00
$8.00
$9.00
$10.00
Dividends Per Share (restated for stock splits)
$1.40
$1.20
$1.00
$0.80
$0.60
$0.40
$0.20
$0.00
$0.05
$1.24*
19% Average Annual Increase
86 87 88 89 90 91 92 93 94 95 96 97 98 99 00 01 02 03 04 05 06 07
*Indicated-On January 18, 2007, Gallagher Board of Directors declared a $0.31 per share quarterly dividend.
FOR ADDITIONAL INFORMATION:
Marsha J. Akin—Investor Relations | 630.773.3800
**All information as originally reported (excluding discontinued operations, litigation related matters, retail contingent commission
related matters, medical and pension plan changes and claims handling obligations).
INVESTMENT PROFILE JANUARY 2007