Exhibit 99.1
Exhibit 99.1
Investment Presentation February 2009
Safe Harbor Statement Under the Private Securities Litigation Reform Act of 1995
Except for the historical information and discussions contained herein, statements contained herein may constitute “forward-looking statements” within the meaning of the Private Securities Litigation Reform Act of 1995. These statements involve a number of risks, uncertainties and other factors that could cause actual results to differ materially, as discussed in the company’s filings with the U.S. Securities and Exchange Commission, including but not limited to the following: Gallagher’s commission revenues are highly dependent on premiums charged by insurers, which are subject to fluctuation; lower interest rates reduce Gallagher’s income earned on invested funds; the alternative insurance market continues to grow which could unfavorably impact commission and favorably impact fee revenue, though not necessarily to the same extent; Gallagher’s revenues vary significantly from period to period as a result of the timing of policy inception dates and the net effect of new and lost business production; the insurance brokerage industry is subject to uncertainty due to investigations into its business practices by various governmental authorities and related private litigation; the general level of economic activity can have a substantial impact on Gallagher’s renewal business; Gallagher’s operating results, returns on investments and financial position may be adversely impacted by exposure to various market risks such as interest rate, equity pricing, foreign exchange rates and the competitive environment; disruptions in the credit and financial markets could limit access to capital and credit and make it more difficult for Gallagher to obtain financing for its operations or investments or increase its cost of obtaining financing; liquidity or capital problems at one or more of the lenders under Gallagher’s revolving credit facility could reduce or eliminate the amount available for Gallagher to draw under such facility; changes in the pension regulatory environment and investment losses in its pension plan could require Gallagher to make significant contributions to its defined benefit pension plan and increase its pension expense in future periods; Gallagher’s revenues and net earnings may continue to be subject to reduction due to the elimination of certain contingent commission arrangements on January 1, 2005 and related developments in the insurance industry; and Gallagher’s effective income tax rate may be subject to increase as a result of changes in income tax laws, unfavorable interpretations of past, current or future laws or developments resulting in the loss or unavailability of historically claimed IRC Section 29-related Syn/Coal Credits. Gallagher’s ability to grow has been enhanced through acquisitions, which may or may not be available on acceptable terms in the future and which, if consummated, may or may not be advantageous to Gallagher. Accordingly, actual results may differ materially from those set forth in the forward-looking statements. For a further discussion of certain of the matters described above see Item 1A, “Risk Factors” in Gallagher’s Annual Report on Form 10K for the year ended December 31, 2008.
2

Certain Non-GAAP Financial Measures
This presentation includes certain information that may be considered “non-GAAP financial measures” within the meaning of SEC regulations because it is derived from Gallagher’s consolidated financial information but is not required to be presented in financial statements that are prepared in conformity with U.S. generally accepted accounting principles (GAAP). Consistent with SEC regulations, a description of such information is provided below and a reconciliation of certain of such items to GAAP is provided on our web-site at www.ajg.com.
Pretax earnings from continuing operations for 2006 and 2005 were adjusted in this presentation to add back charges related to litigation and contingent commission matters and claims handling obligations and to eliminate the impact of medical and pension plan changes. Charges in 2006 related to retail contingent commission related matters and medical plan changes totaled $9.0 million (or $5.4 million after tax) and $7.5 million (or $4.5 million after tax), respectively. Charges in 2005 related to retail contingent commission matters and claims handling obligations totaled $73.6 million (or $44.2 million after tax) and $5.2 million (or $3.6 million after tax), respectively. In addition, Gallagher recognized a pension curtailment gain of $10.0 million (or $6.0 million after tax) in 2005. There were no such charges or gains in 2001 to 2004. These adjustments, which Gallagher believes are for non-recurring items, were made to GAAP earnings from continuing operations in 2006 and 2005 in order to calculate earnings from continuing operations before litigation and contingent commission related matters, claims handling obligations and medical and pension plan changes. In addition, total revenues and pretax earnings from continuing operations exclude retail contingent commissions and are on an as originally reported basis for all periods presented in this presentation.
Gallagher believes the “non-GAAP financial measures” included in this presentation provide meaningful additional information, which may be helpful to investors in assessing certain aspects of Gallagher’s operating performance and financial condition that may not be otherwise apparent from GAAP. Industry peers provide similar supplemental information, although they may not use the same or comparable terminology and may not make identical adjustments. This non-GAAP information should be used in addition to, but not as a substitute for, the GAAP information.
3
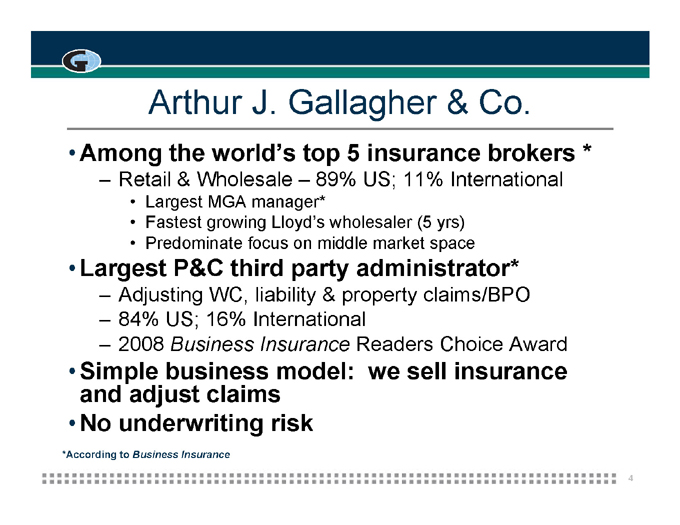
Arthur J. Gallagher & Co.
Among the world’s top 5 insurance brokers *
Retail & Wholesale – 89% US; 11% International
Largest MGA manager*
Fastest growing Lloyd’s wholesaler (5 yrs)
Predominate focus on middle market space
Largest P&C third party administrator*
Adjusting WC, liability & property claims/BPO
84% US; 16% International
2008 Business Insurance Readers Choice Award
Simple business model: we sell insurance and adjust claims •No underwriting risk
*According to Business Insurance
4
Arthur J. Gallagher & Co.
•GAAP •EBITDA •Cash
5
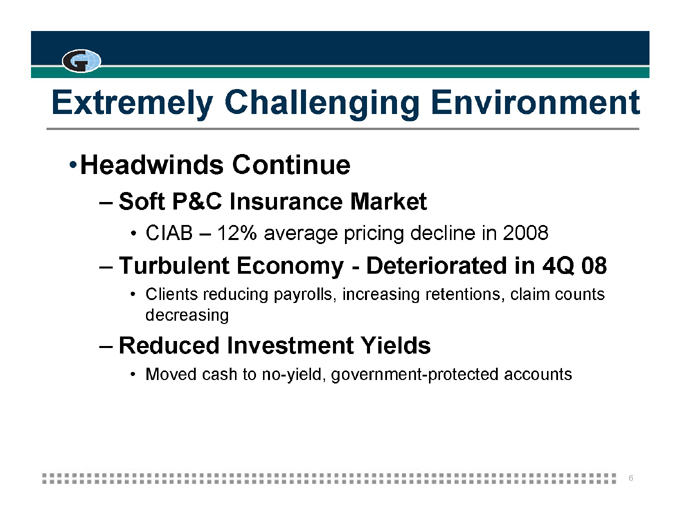
Extremely Challenging Environment
Headwinds Continue
Soft P&C Insurance Market
CIAB — 12% average pricing decline in 2008
Turbulent Economy - Deteriorated in 4Q 08
Clients reducing payrolls, increasing retentions, claim counts decreasing
Reduced Investment Yields
Moved cash to no-yield, government-protected accounts
6
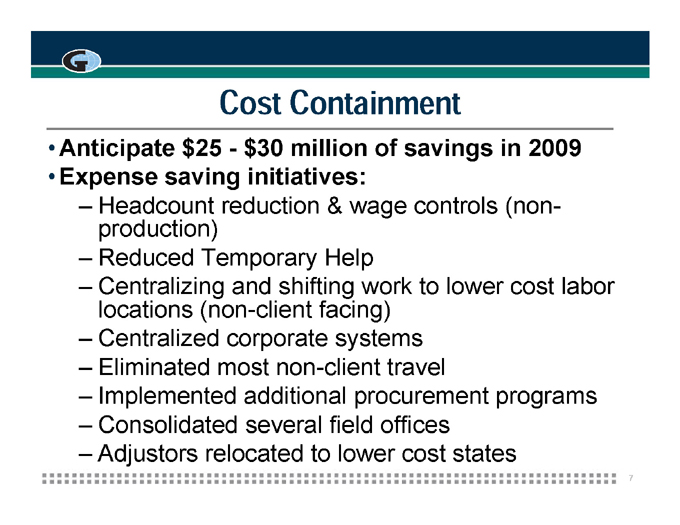
Cost Containment
Anticipate $25 - $30 million of savings in 2009
Expense saving initiatives:
Headcount reduction & wage controls (non-production)
Reduced Temporary Help
Centralizing and shifting work to lower cost labor locations (non-client facing)
Centralized corporate systems
Eliminated most non-client travel
Implemented additional procurement programs
Consolidated several field offices
Adjustors relocated to lower cost states
7
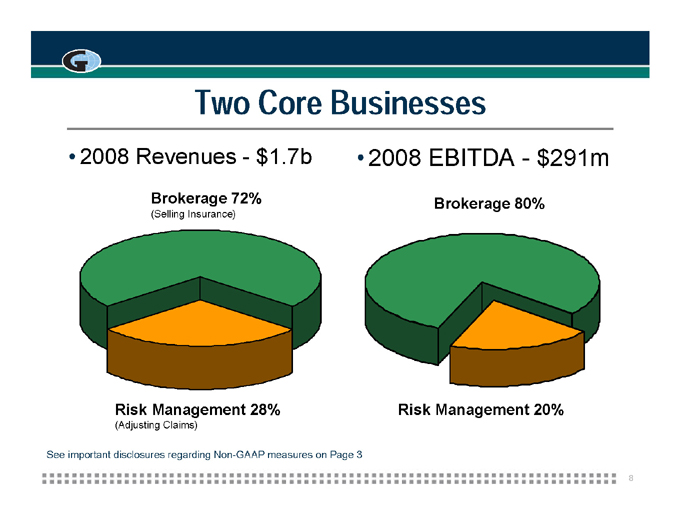
Two Core Businesses
2008 Revenues - $1.7b 2008 EBITDA - $291m
Brokerage 72% Brokerage 80%
(Selling Insurance)
Risk Management 28% Risk Management 20%
(Adjusting Claims)
See important disclosures regarding Non-GAAP measures on Page 3
8
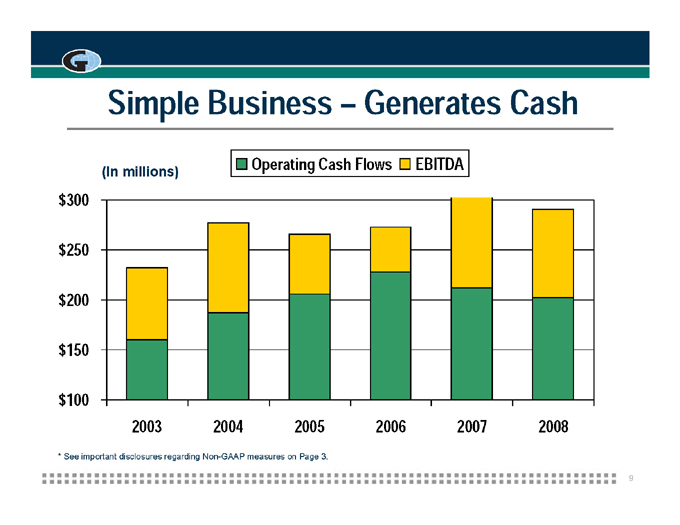
Simple Business – Generates Cash
Operating Cash Flows EBITDA
(In millions)
$300 $250 $200 $150
$100
2003 2004 2005 2006 2007 2008
* See important disclosures regarding Non-GAAP measures on Page 3.
9
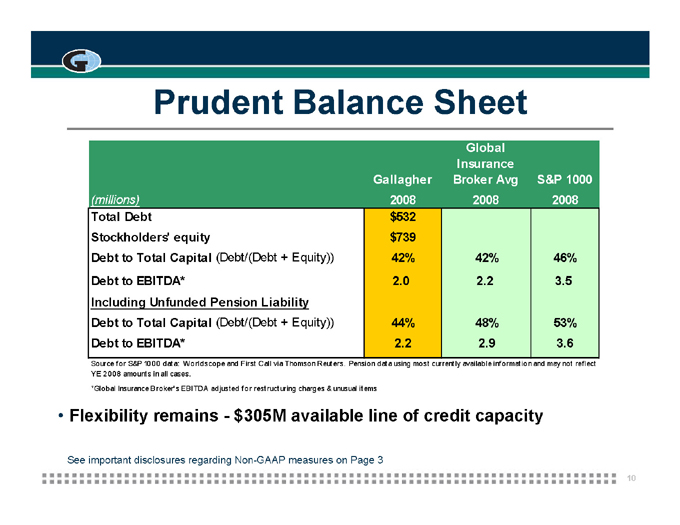
Prudent Balance Sheet
Global
Insurance
Gallagher Broker Avg S&P 1000
(millions) 2008 2008 2008
Total Debt $532
Stockholders’ equity $739
Debt to Total Capital (Debt/(Debt + Equity)) 42% 42% 46%
Debt to EBITDA* 2.0 2.2 3.5
Including Unfunded Pension Liability
Debt to Total Capital (Debt/(Debt + Equity)) 44% 48% 53%
Debt to EBITDA* 2.2 2.9 3.6
Source for S&P 1000 data: Worldscope and First Call via Thomson Reuters. Pension data using most currently available information and may not reflect YE 2008 amounts in all cases.
*Global Insurance Broker’s EBITDA adjusted for restructuring charges & unusual items
Flexibility remains - $305M available line of credit capacity
See important disclosures regarding Non-GAAP measures on Page 3
10

Uses of Cash
Return cash to shareholders
Pay dividends
Repurchase shares but currently favor dividends Buy brokers
Mix of cash and/or stock
Neither segment needs substantial capital or cap-ex
11
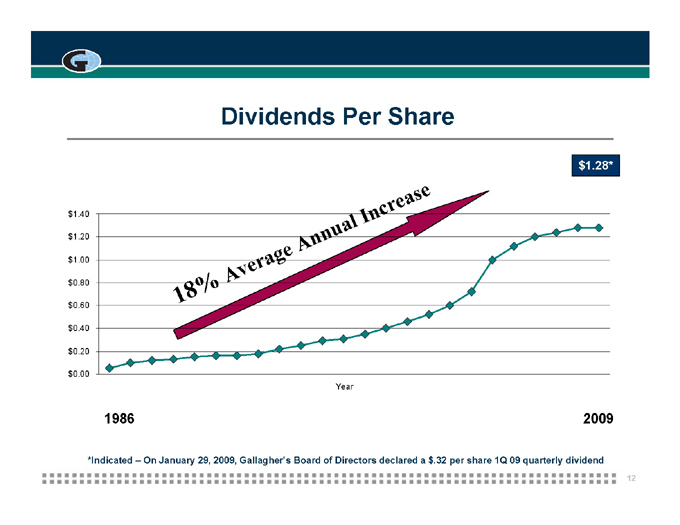
Dividends Per Share
$1.28*
$1.40
$1.20
$1.00
$0.80
$0.60 18%
Average Annual Increase
$0.40
$0.20
$0.00
Year
1986 2009
*Indicated – On January 29, 2009, Gallagher’s Board of Directors declared a $.32 per share 1Q 09 quarterly dividend
12

Dividends Per Share
$1.28*
$1.40
$1.20
$1.00
$0.80
$0.60 18%
As of 2/20/09 Yield is 7.7%
$0.40
$0.20
$0.00
Year
1986 2009
*Indicated – On January 29, 2009, Gallagher’s Board of Directors declared a $.32 per share 1Q 09 quarterly dividend
13
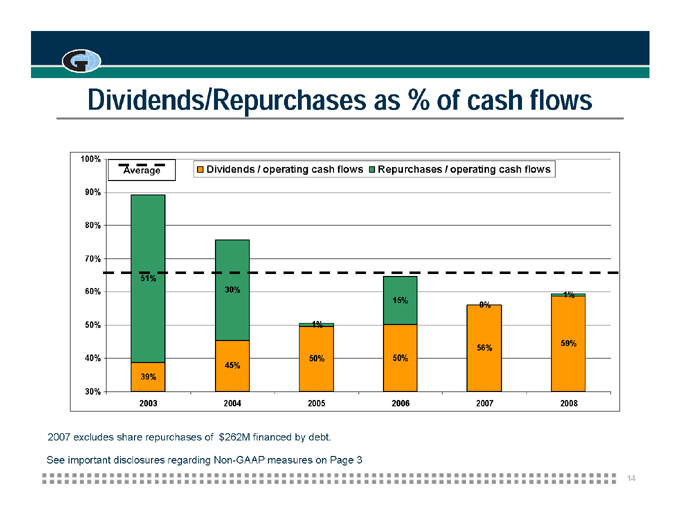
Dividends/Repurchases as % of cash flows
100%
Average Dividends / operating cash flows Repurchases / operating cash flows
90%
80%
70%
51%
60% 30% 1%
15% 0%
50% 1%
56% 59%
40% 50% 50%
45%
39%
30%
2003 2004 2005 2006 2007 2008
2007 excludes share repurchases of $262M financed by debt.
See important disclosures regarding Non-GAAP measures on Page 3
14
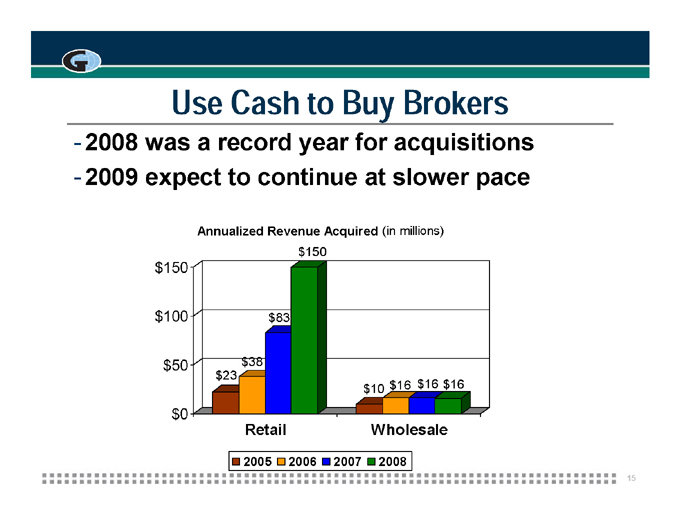
Use Cash to Buy Brokers
2008 was a record year for acquisitions
2009 expect to continue at slower pace
Annualized Revenue Acquired (in millions)
$150
$150
$100 $83
$50 $38
$23
$10 $16 $16 $16
$0
Retail Wholesale
2005 2006 2007 2008
15
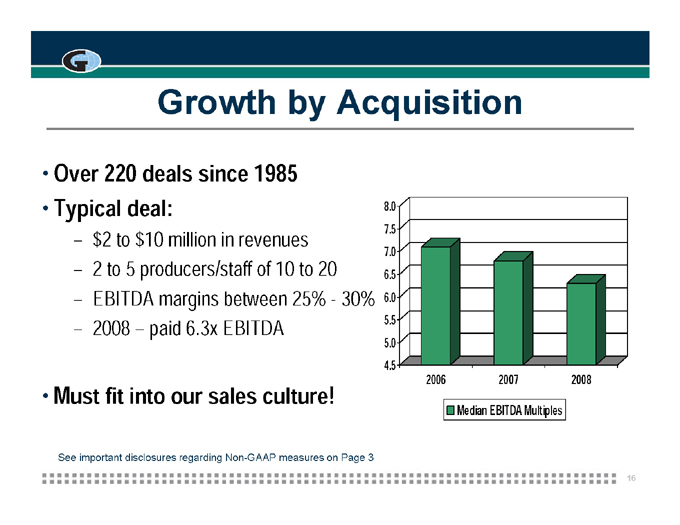
Growth by Acquisition
Over 220 deals since 1985
Typical deal: 8.0
$2 to $10 million in revenues 7.5
7.0
2 to 5 producers/staff of 10 to 20 6.5
EBITDA margins between 25% - 30% 6.0
2008 – paid 6.3x EBITDA 5.5
5.0
4.5
2006 2007 2008
Must fit into our sales culture!
Median EBITDA Multiples
See important disclosures regarding Non-GAAP measures on Page 3
16
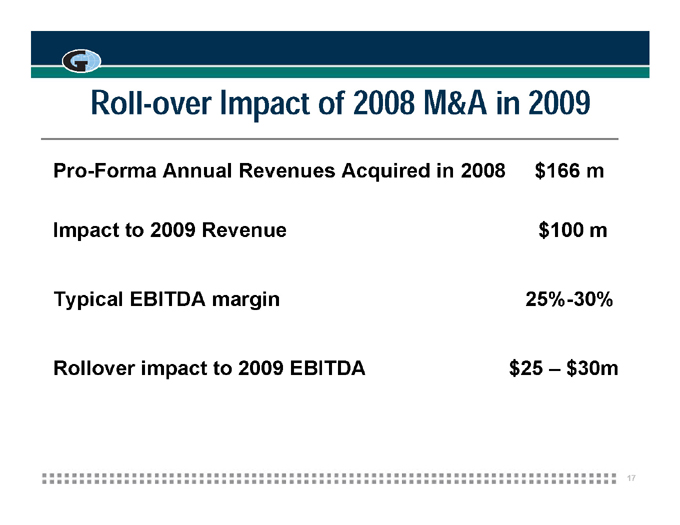
Roll-over Impact of 2008 M&A in 2009
Pro-Forma Annual Revenues Acquired in 2008 $166 m Impact to 2009 Revenue $100 m Typical EBITDA margin 25%-30% Rollover impact to 2009 EBITDA $25 — $30m
17
2009 Expansion Opportunity
Liberty Mutual/Wausau — closes approx 3/1/09
Possible revenues of $70m to $90m
Approx 125 new producers and 140 support/mgmt staff
26 states predominately in Midwest & East/Southeast
Approx 18 new locations with “tuck ins” into 42 existing offices
Break even in 2009 but accretive in 2010 > +$30m EBITDA
Don’t pay for business that we don’t retain
Maximum purchase price of $164m in cash and/or stock
New Gallagher producers- no longer captive Liberty agents
Access to full suite of new products, markets & niche expertise
Access to new clients
18
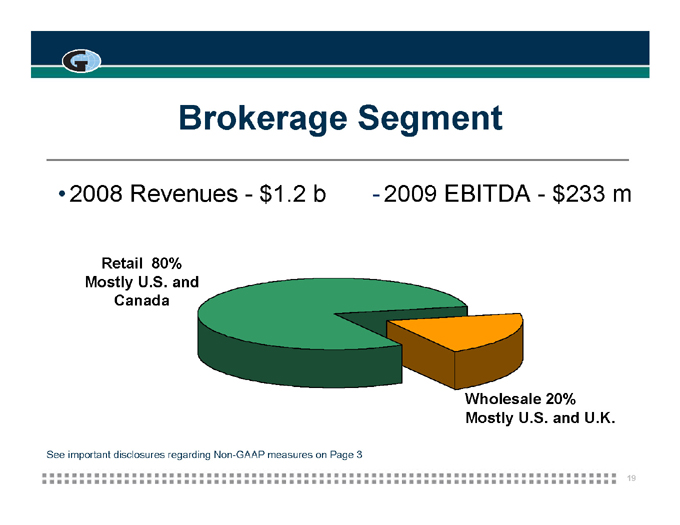
Brokerage Segment
2008 Revenues - $1.2 b - 2009 EBITDA - $233 m
Retail 80%
Mostly U.S. and
Canada
Wholesale 20%
Mostly U.S. and U.K.
See important disclosures regarding Non-GAAP measures on Page 3
19
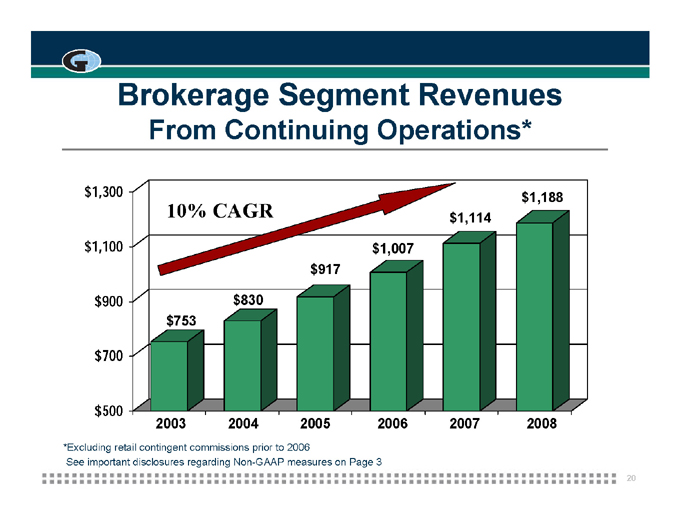
Brokerage Segment Revenues
From Continuing Operations*
$1,300 $1,188
10% CAGR $1,114
$1,100 $1,007
$917
$900 $830
$753
$700
$500
2003 2004 2005 2006 2007 2008
*Excluding retail contingent commissions prior to 2006
See important disclosures regarding Non-GAAP measures on Page 3
20
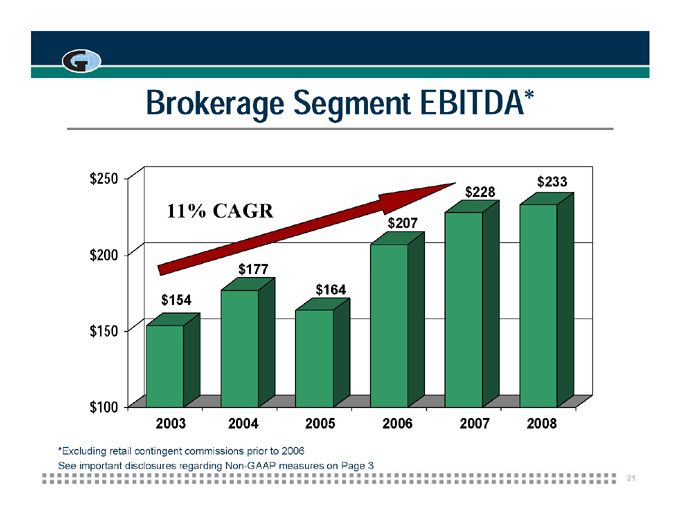
Brokerage Segment EBITDA*
$250 $233
$228
11% CAGR
$207
$200
$177
$164
$154
$150
$100
2003 2004 2005 2006 2007 2008
*Excluding retail contingent commissions prior to 2006
See important disclosures regarding Non-GAAP measures on Page 3
21
Brokerage Segment Focus
Growth
Domestic
International Cost containment Stay in sweet spot
Middle to upper commercial market
22
Growth - Domestic
Organic
Hiring new producers wanting:
Access to our network, expertise and niches
Infrastructure support
Growing our own producers thru:
Two-year internship program
Career Launch program
Acquisitions
18,000 retail and wholesale brokerages and agencies* in the U.S. (P&C and Benefits)
Many owned by baby boomers that need an exit strategy yet still want to be in the business
Smaller number of consolidators
*According to Hales & Co, Inc.
23

Current Gallagher U.S. Locations
WA
MT ME ND
OR MN VT NH
ID MA SD WI NY
WY MI RI IA CT
PA
NE NJ NV OH
UT DE IL IN
CO WV MD KS VA
CA MO KY
NC TN
AZ OK
NM AR
SC MS AL GA
TX LA
FL
AK
HI
24
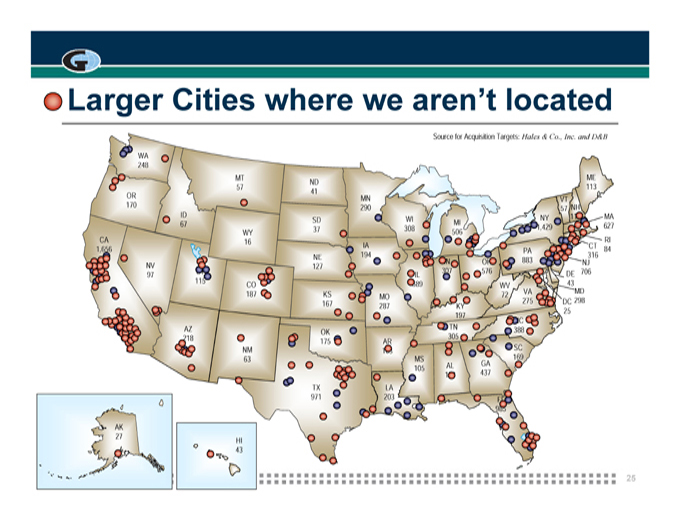
Larger Cities where we aren’t located
Source for Acquisition Targets: Hales & Co., Inc. and D&B
WA 248
MT ME ND
57 113 41 OR MN VT
170 290 57 NH
ID NY 112 MA SD WI MI
67 1,429 627
37 308 506
CA WY RI 16 IA CT 84 1,656 PA
NE 194 316 IN OH 883 NJ
NV 127
UT 307 576 DE 706
97 IL
115 689 43 CO WV
187 KS 72 VA MD MO 298 167 275 DC
287 KY
25 197 NC
AZ TN 388 OK
218 305 175 AR
NM 103 SC
63 MS 169 AL GA
105
188 437 TX LA
971 203 FL 985
AK 27
HI 43
25
Growth - International
Organic
Substantial London operations
Hire experienced sales teams
Opportunistic acquisitions/minority interests
Gallagher Optimus Network
Correspondent brokers and agents in over 100 countries
Stages of partnership to investment
26
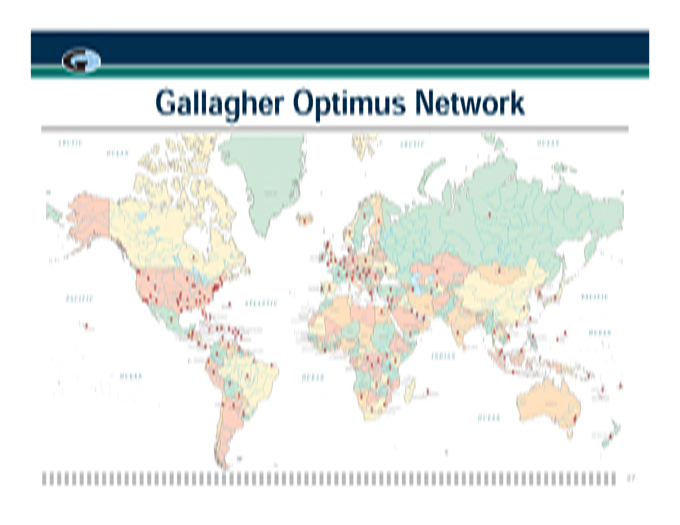
Gallagher Optimus Network
27
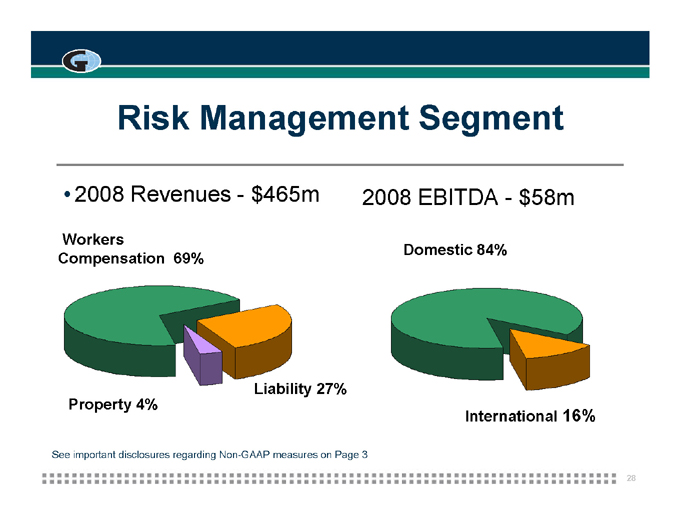
Risk Management Segment
• 2008 Revenues - $465m 2008 EBITDA - $58m
Workers
Domestic 84% Compensation 69%
Liability 27% Property 4%
International 16%
See important disclosures regarding Non-GAAP measures on Page 3
28
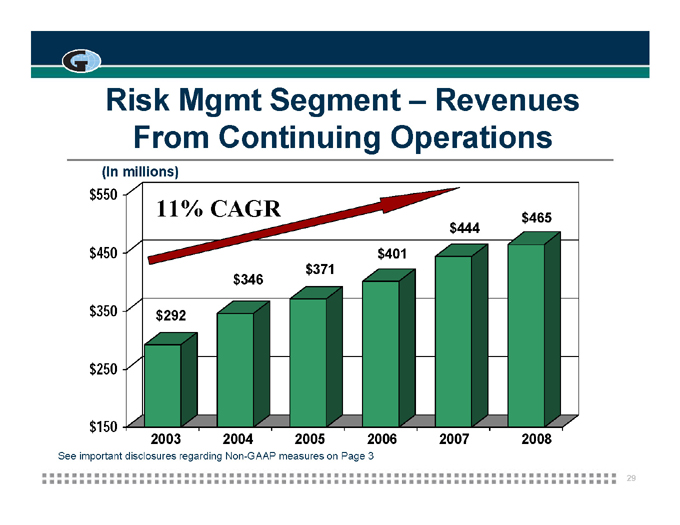
Risk Mgmt Segment — Revenues
From Continuing Operations
(In millions)
$550
11% CAGR $465
$444
$450 $401
$371
$346
$350 $292
$250
$150
2003 2004 2005 2006 2007 2008
See important disclosures regarding Non-GAAP measures on Page 3
29
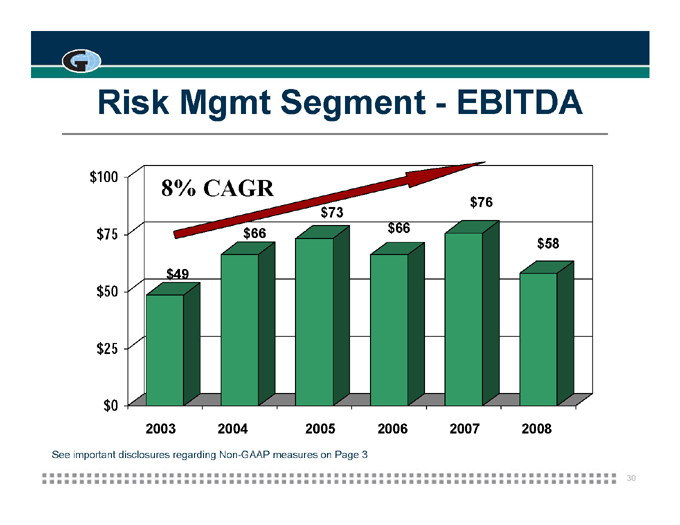
Risk Mgmt Segment - - EBITDA
$100 8% CAGR
$76
$73
$75 $66 $66
$58
$49
$50
$25
$0
2003 2004 2005 2006 2007 2008
See important disclosures regarding Non-GAAP measures on Page 3
30
Risk Management Segment - Focus
Growth
Domestic
International
Client service
High quality standards
Technology •Cost containment
31
RM Growth - Domestic
All organic
Over 86% non-Gallagher clients •Targeting
Mainly Fortune 1000
Standard platform enables profitable service to smaller accounts
Differentiation
Network focused or dedicated - flexibility
Client intimacy
Quality standards
Proprietary technology
32
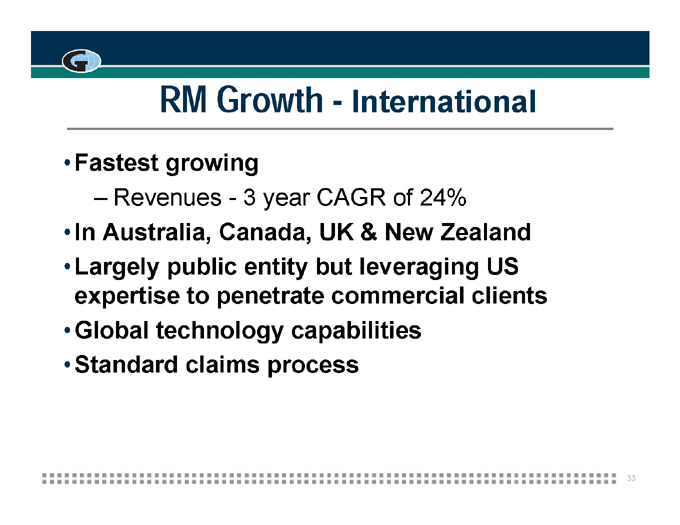
RM Growth - International
Fastest growing
Revenues - 3 year CAGR of 24%
In Australia, Canada, UK & New Zealand
Largely public entity but leveraging US expertise to penetrate commercial clients
Global technology capabilities Standard claims process
33
Summary
Top priority – servicing our clients
Helping them navigate troubled economy
Continuing to increase quality service levels
Expanding capabilities and options
34
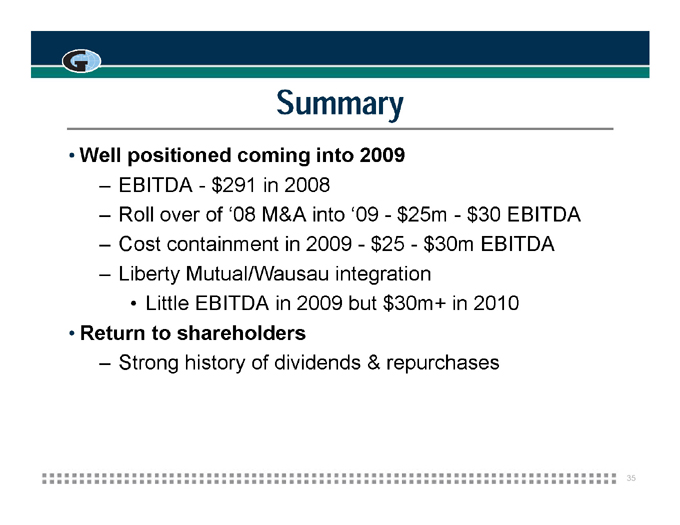
Summary
Well positioned coming into 2009
EBITDA - $291 in 2008
Roll over of ‘08 M&A into ‘09 - $25m - $30 EBITDA
Cost containment in 2009 - $25 - $30m EBITDA
Liberty Mutual/Wausau integration
Little EBITDA in 2009 but $30m+ in 2010 Return to shareholders
Strong history of dividends & repurchases
35

Questions & Answers
36
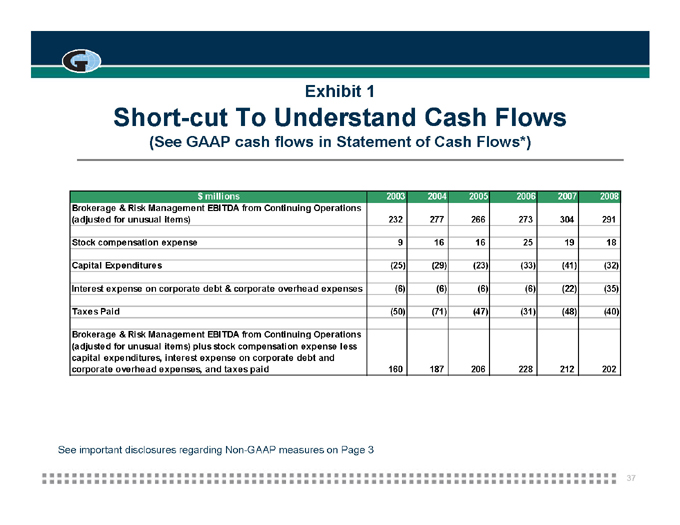
Exhibit 1
Short-cut To Understand Cash Flows
(See GAAP cash flows in Statement of Cash Flows*)
$ millions 2003 2004 2005 2006 2007 2008
Brokerage & Risk Management EBITDA from Continuing Operations
(adjusted for unusual items) 232 277 266 273 304 291
Stock compensation expense 9 16 16 25 19 18
Capital Expenditures(25)(29)(23)(33)(41)(32)
Interest expense on corporate debt & corporate overhead expenses(6)(6)(6)(6)(22)(35)
Taxes Paid(50)(71)(47)(31)(48)(40)
Brokerage & Risk Management EBITDA from Continuing Operations
(adjusted for unusual items) plus stock compensation expense less
capital expenditures, interest expense on corporate debt and
corporate overhead expenses, and taxes paid 160 187 206 228 212 202
See important disclosures regarding Non-GAAP measures on Page 3
37

For Additional Information
•Website: www.ajg.com
• Email: investor_relations@ajg.com •Marsha Akin Marsha_Akin@ajg.com Phone: 630-773-3800
38