Exhibit 99.1
Exhibit 99.1
Welcome to the Arthur J. Gallagher & Co.
2009
Annual Stockholders’ Meeting
Tuesday, May 12, 2009

Please turn off all cell phones and PDAs at this time.
Thank you for your cooperation.
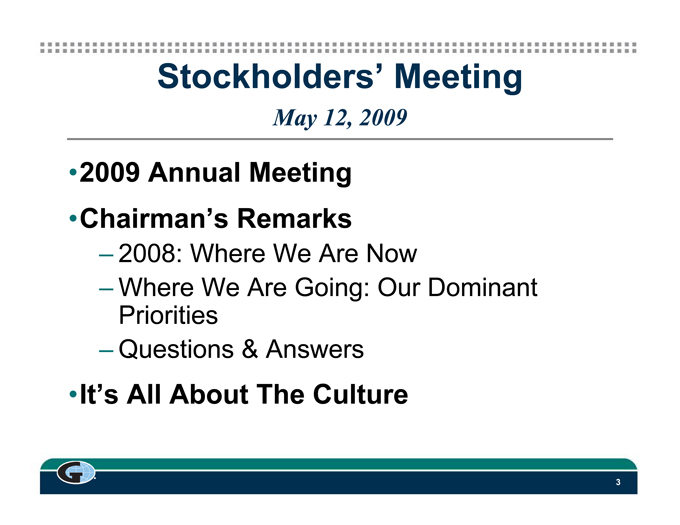
Stockholders’ Meeting
May 12, 2009
•2009 Annual Meeting •Chairman’s Remarks
– 2008: Where We Are Now
– Where We Are Going: Our Dominant Priorities
– Questions & Answers •It’s All About The Culture
Safe Harbor Statement Under the Private Securities Litigation Reform Act of 1995
Forward-looking statements made by or on behalf of Gallagher are subject to risks and uncertainties, including but not limited to the following: Gallagher’s commission revenues are highly dependent on premiums charged by insurers, which are subject to fluctuation; lower interest rates reduce Gallagher’s income earned on invested funds; alternative insurance market continues to grow, which could unfavorably impact commission revenue and favorably impact fee revenue, though not necessarily to the same extent; Gallagher’s revenues vary significantly from period-to-period as a result of the timing of policy inception dates and the net effect of new and lost business production; the insurance brokerage industry is subject to uncertainty due to investigations into its business practices by various governmental authorities and related private litigation; the general level of economic activity can have a substantial impact on Gallagher’s renewal business; Gallagher’s operating results, returns on investments and financial position may be adversely impacted by exposure to various market risks such as interest rates, equity pricing, foreign exchange rates and the competitive environment; disruptions in the credit and financial markets could limit access to capital and credit and make it more difficult for Gallagher to obtain financing for its operations or investments or increase its cost of obtaining financing; liquidity or capital problems at one or more of the lenders under Gallagher’s revolving credit facility could reduce or eliminate the amount available for Gallagher to draw under such facility; changes in the pension regulatory environment and investment losses in its pension plan could require Gallagher to make significant contributions to its defined benefit pension plan and increase its pension expense in future periods; Gallagher’s revenues and net earnings will continue to be subject to reduction due to the elimination of certain contingent commission arrangements on January 1, 2005 and related developments in the insurance industry; and Gallagher’s effective income tax rate and obligations under tax indemnity agreements may be subject to increase as a result of changes in income tax laws, unfavorable interpretations of past, current or future tax laws or developments resulting in the loss or unavailability of historically claimed IRC Section 29-related Syn/Coal tax credits. Gallagher’s ability to grow has been enhanced through acquisitions, which may or may not be available on acceptable terms in the future and which, if consummated, may or may not be advantageous to Gallagher. Accordingly, actual results may differ materially from those set forth in the forward-looking statements. For a further discussion of certain of the matters described above see Item 1A, “Risk Factors” in Gallagher’s Annual Report on Form 10-K for the year ended December 31, 2008.
Certain Non-GAAP Financial Measures
This presentation includes certain information that may be considered “non-GAAP financial measures” within the meaning of SEC regulations because it is derived from Gallagher’s consolidated financial information but is not required to be presented in financial statements that are prepared in conformity with U.S. generally accepted accounting principles (GAAP). Consistent with SEC regulations, a description of such information is provided below and a reconciliation of certain of such items to GAAP is provided on our web-site at www.ajg.com.
Pretax earnings from continuing operations for 2006 and 2005 were adjusted in this presentation to add back charges related to litigation and contingent commission matters and claims handling obligations and to eliminate the impact of medical and pension plan changes. Charges in 2006 related to retail contingent commission related matters and medical plan changes totaled $9.0 million (or $5.4 million after tax) and $7.5 million (or $4.5 million after tax), respectively. Charges in 2005 related to retail contingent commission matters and claims handling obligations totaled $73.6 million (or $44.2 million after tax) and $5.2 million (or $3.6 million after tax), respectively. In addition, Gallagher recognized a pension curtailment gain of $10.0 million (or $6.0 million after tax) in 2005. There were no such charges or gains in 2001 to 2004. These adjustments, which Gallagher believes are for non-recurring items, were made to GAAP earnings from continuing operations in 2006 and 2005 in order to calculate earnings from continuing operations before litigation and contingent commission related matters, claims handling obligations and medical and pension plan changes. In addition, total revenues and pretax earnings from continuing operations exclude retail contingent commissions and are on an as originally reported basis for all periods presented in this presentation.
Gallagher believes the “non-GAAP financial measures” included in this presentation provide meaningful additional information, which may be helpful to investors in assessing certain aspects of Gallagher’s operating performance and financial condition that may not be otherwise apparent from GAAP. Industry peers provide similar supplemental information, although they may not use the same or comparable terminology and may not make identical adjustments. This non-GAAP information should be used in addition to, but not as a substitute for, the GAAP information.
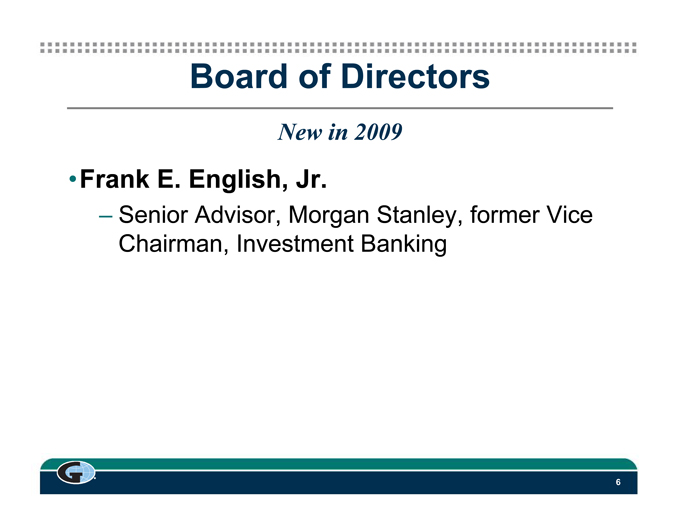
Board of Directors
New in 2009
•Frank E. English, Jr.
– Senior Advisor, Morgan Stanley, former Vice Chairman, Investment Banking
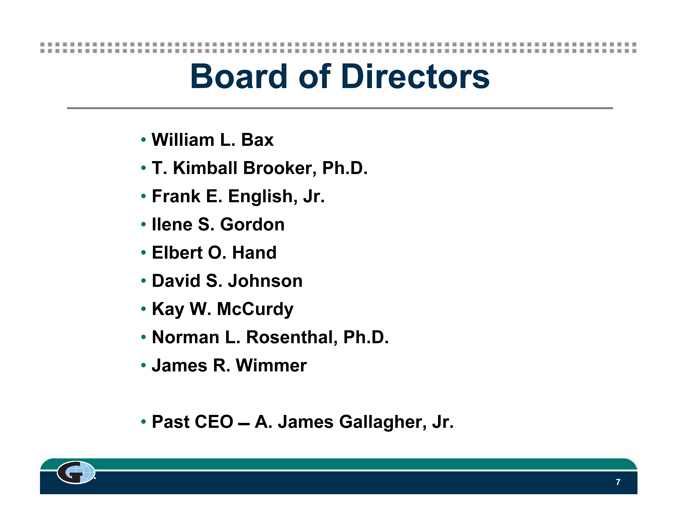
Board of Directors
• William L. Bax
• T. Kimball Brooker, Ph.D.
• Frank E. English, Jr.
• Ilene S. Gordon
• Elbert O. Hand
• David S. Johnson
• Kay W. McCurdy
• Norman L. Rosenthal, Ph.D.
• James R. Wimmer
• Past CEO A. James Gallagher, Jr.
Stockholders’ Meeting
May 12, 2009
•2009 Annual Meeting
Stockholders’ Meeting
May 12, 2009
•2009 Annual Meeting •Chairman’s Remarks
– 2008: Where We Are Now
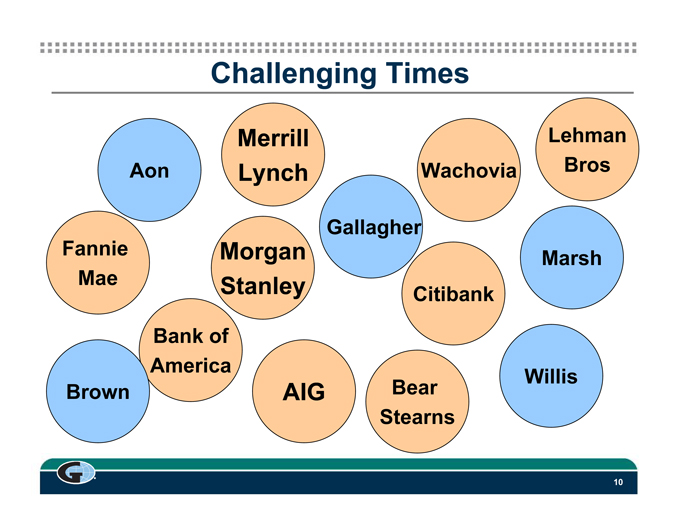
Challenging Times
Merrill Lynch Lehman Bros
Aon Wachovia
Gallagher
Fannie Mae Morgan Stanley Marsh
Citibank
Bank of
America
Brown AIG Bear Stearns Willis
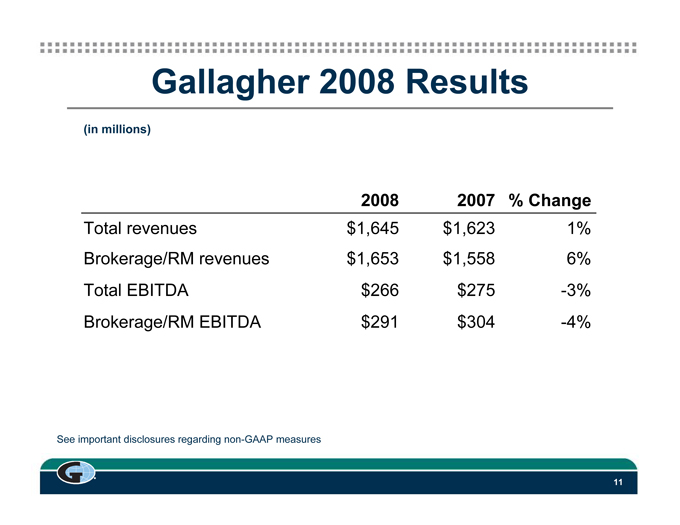
Gallagher 2008 Results
(in millions)
2008 2007 % Change
Total revenues $1,645 $1,623 1% Brokerage/RM revenues $1,653 $1,558 6% Total EBITDA $266 $275 -3% Brokerage/RM EBITDA $291 $304 -4%
See important disclosures regarding non-GAAP measures
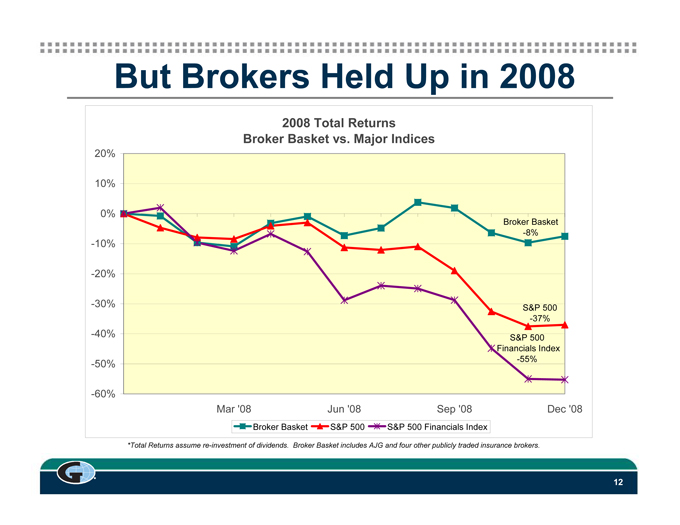
But Brokers Held Up in 2008
2008 Total Returns Broker Basket vs. Major Indices
20%
10%
0% Broker Basket -8%
-10%
-20%
-30% S&P 500 -37% -40% S&P 500 Financials Index -50% -55%
-60%
Mar ‘08 Jun ‘08 Sep ‘08 Dec ‘08
Broker Basket S&P 500 S&P 500 Financials Index
*Total Returns assume re-investment of dividends. Broker Basket includes AJG and four other publicly traded insurance brokers.
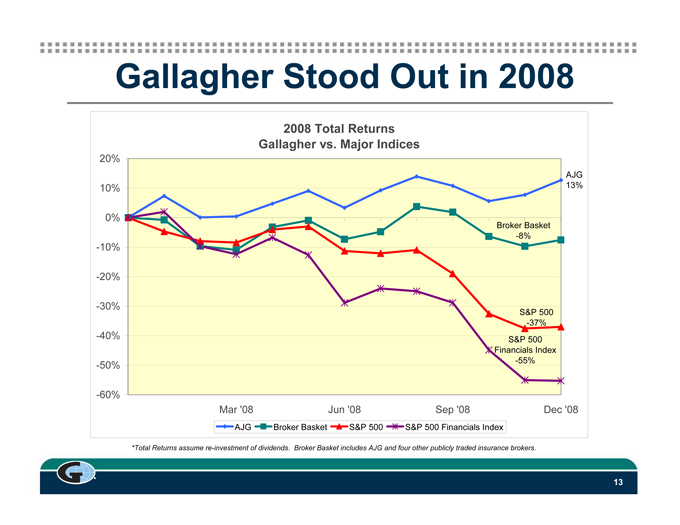
Gallagher Stood Out in 2008
2008 Total Returns
Gallagher vs. Major Indices
20%
AJG
10% 13%
0%
Broker Basket
-8%
-10%
-20%
-30% S&P 500
-37%
-40% S&P 500
Financials Index
-50% -55%
-60%
Mar ‘08 Jun ‘08 Sep ‘08 Dec ‘08
AJG Broker Basket S&P 500 S&P 500 Financials Index
*Total Returns assume re-investment of dividends. Broker Basket includes AJG and four other publicly traded insurance brokers.
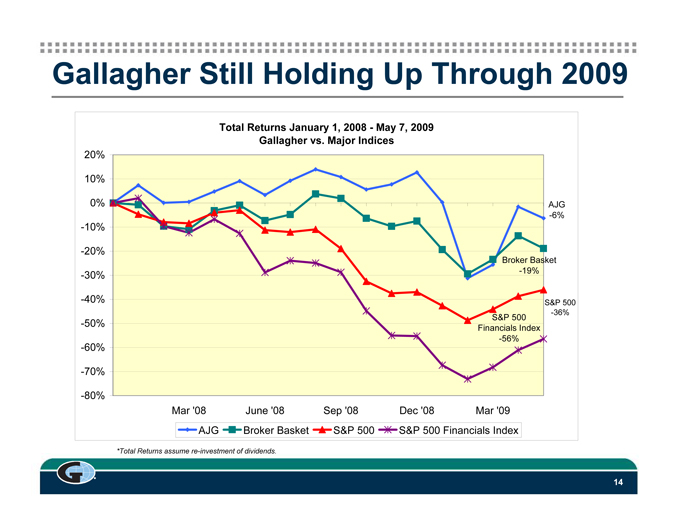
Gallagher Still Holding Up Through 2009
Total Returns January 1, 2008 - May 7, 2009 Gallagher vs. Major Indices
20%
10%
0% AJG
-6%
-10%
-20%
Broker Basket
-30% -19%
-40% S&P 500
-36%
-50% S&P 500
Financials Index
-56%
-60%
-70%
-80%
Mar ‘08 June ‘08 Sep ‘08 Dec ‘08 Mar ‘09
AJG Broker Basket S&P 500 S&P 500 Financials Index
*Total Returns assume re-investment of dividends.
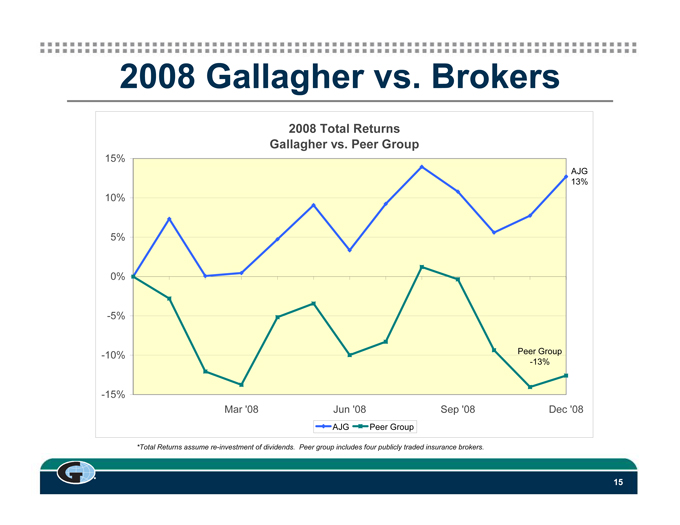
2008 Gallagher vs. Brokers
2008 Total Returns
Gallagher vs. Peer Group
15%
AJG
13%
10%
5%
0%
-5%
-10% Peer Group
-13%
-15%
Mar ‘08 Jun ‘08 Sep ‘08 Dec ‘08
AJG Peer Group
*Total Returns assume re-investment of dividends. Peer group includes four publicly traded insurance brokers.
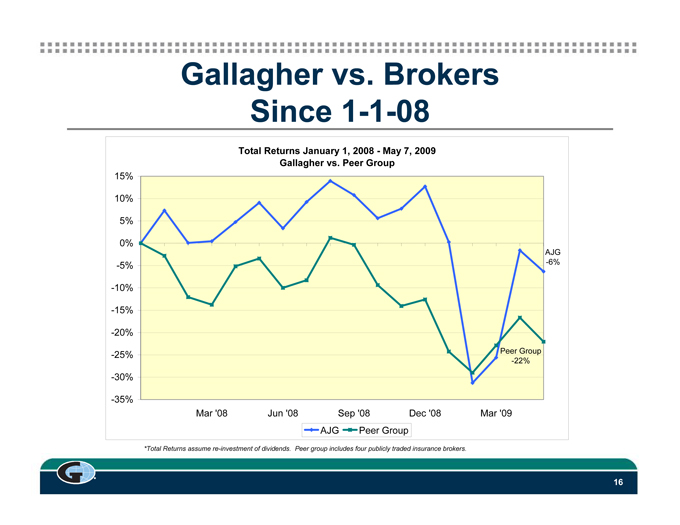
Gallagher vs. Brokers Since 1-1-08
Total Returns January 1, 2008 - May 7, 2009
Gallagher vs. Peer Group
15%
10%
5%
0%
AJG
-5% -6%
-10%
-15%
-20%
-25% Peer Group
-22%
-30%
-35%
Mar ‘08 Jun ‘08 Sep ‘08 Dec ‘08 Mar ‘09
AJG Peer Group
*Total Returns assume re-investment of dividends. Peer group includes four publicly traded insurance brokers.
Why?
•Business that generates cash •Prudent balance sheet •Long history of growth
•Consistent return of cash to shareholders
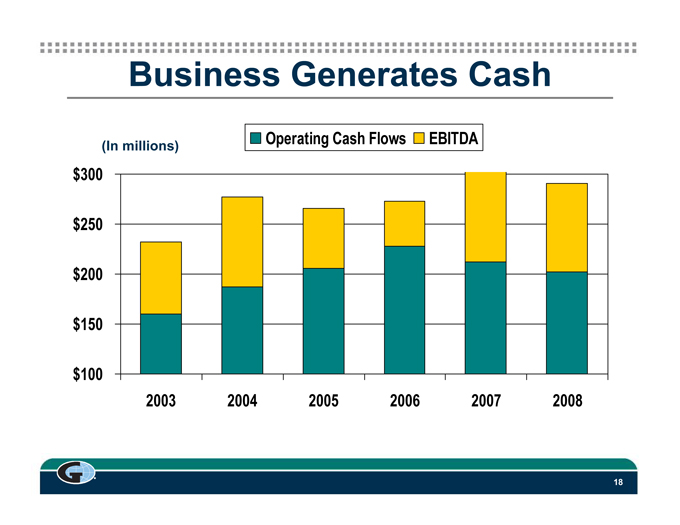
Business Generates Cash
(In millions) Operating Cash Flows EBITDA
$300
$250
$200
$150
$100
2003 2004 2005 2006 2007 2008
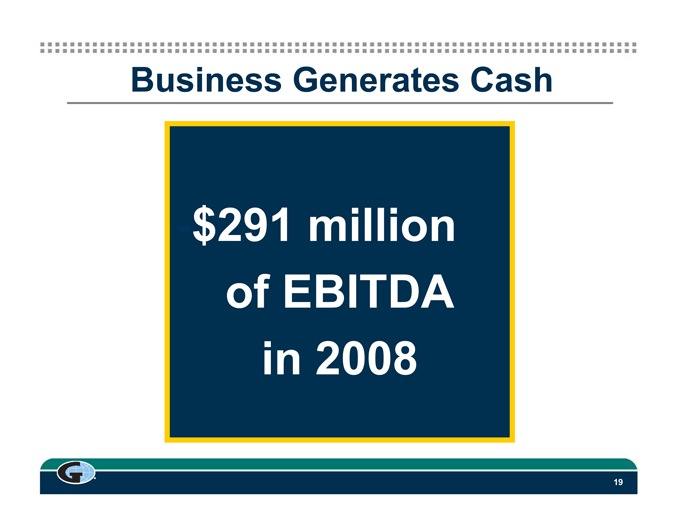
Business Generates Cash
$291 million of EBITDA in 2008
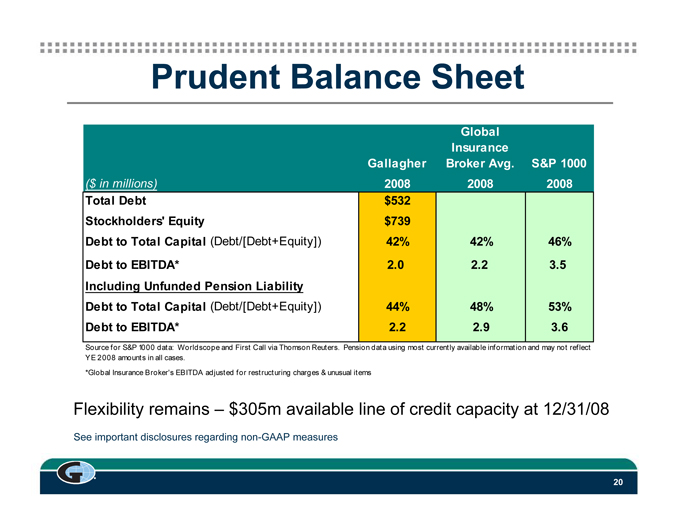
Prudent Balance Sheet
Global
Insurance
Gallagher Broker Avg. S&P 1000
($ in millions) 2008 2008 2008
Total Debt $532
Stockholders’ Equity $739
Debt to Total Capital (Debt/[Debt+Equity]) 42% 42% 46%
Debt to EBITDA* 2.0 2.2 3.5
Including Unfunded Pension Liability
Debt to Total Capital (Debt/[Debt+Equity]) 44% 48% 53%
Debt to EBITDA* 2.2 2.9 3.6
Source for S&P 1000 data: Worldscope and First Call via Thomson Reuters. Pension data using most currently available information and may not reflect YE 2008 amounts in all cases.
*Global Insurance Broker’s EBITDA adjusted for restructuring charges & unusual items
Flexibility remains – $305m available line of credit capacity at 12/31/08
See important disclosures regarding non-GAAP measures
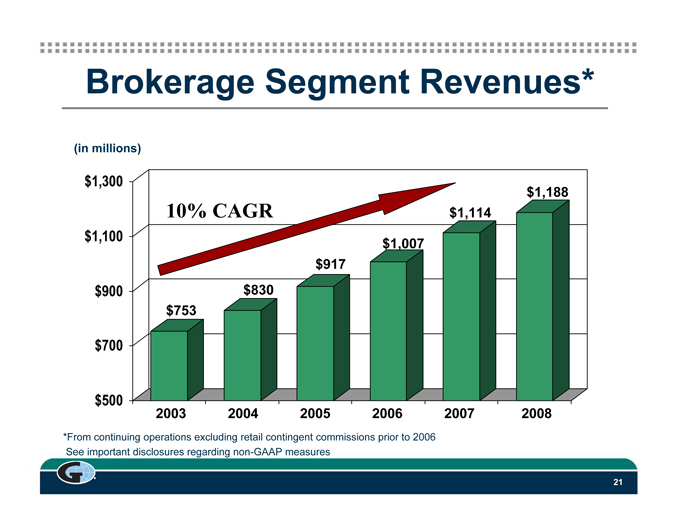
Brokerage Segment Revenues*
(in millions)
$1,300
$1,188
10% CAGR $1,114
$1,100 $1,007
$917
$900 $830
$753
$700
$500
2003 2004 2005 2006 2007 2008
*From continuing operations excluding retail contingent commissions prior to 2006 See important disclosures regarding non-GAAP measures
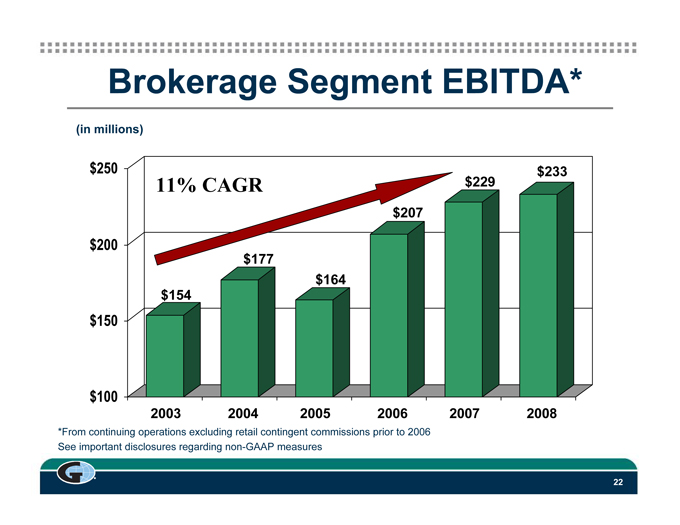
Brokerage Segment EBITDA*
(in millions)
$250 $233
11% CAGR $229
$207
$200
$177
$164
$154
$150
$100
2003 2004 2005 2006 2007 2008
*From continuing operations excluding retail contingent commissions prior to 2006 See important disclosures regarding non-GAAP measures
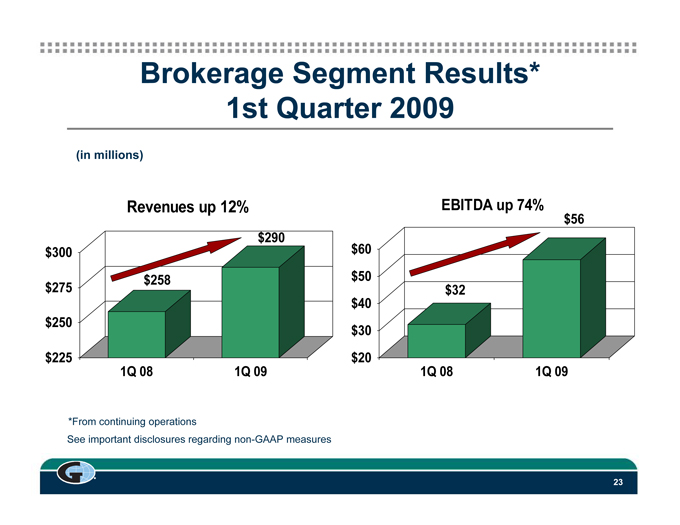
Brokerage Segment Results* 1st Quarter 2009
(in millions)
Revenues up 12% EBITDA up 74%
$56
$290
$300 $60
$258 $50
$275 $32
$40
$250 $30
$225 $20
1Q 08 1Q 09 1Q 08 1Q 09
*From continuing operations
See important disclosures regarding non-GAAP measures
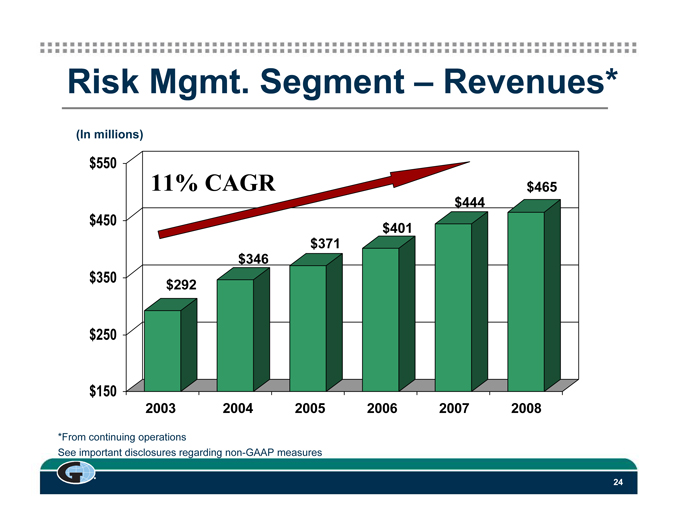
Risk Mgmt. Segment – Revenues*
(In millions)
$550
11% CAGR $465
$444
$450 $401
$371
$346
$350 $292
$250
$150
2003 2004 2005 2006 2007 2008
*From continuing operations
See important disclosures regarding non-GAAP measures
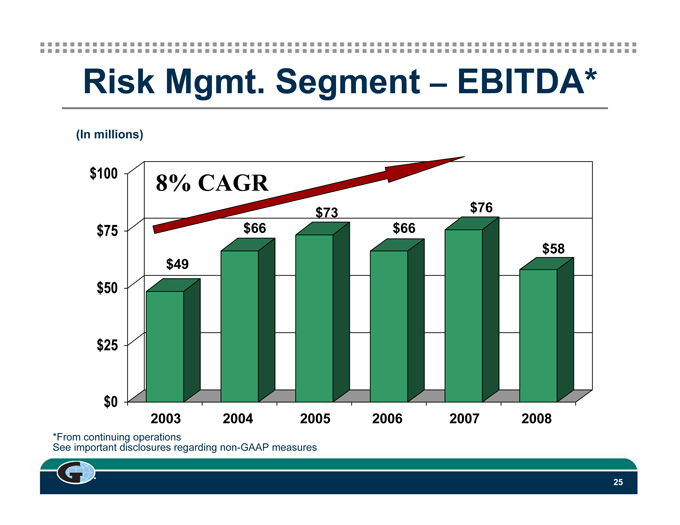
Risk Mgmt. Segment EBITDA* (In millions) $100 8% CAGR $73 $76 $75 $66 $66 $58 $49 $50 $25 $0 2003 2004 2005 2006 2007 2008 *From continuing operations See important disclosures regarding non-GAAP measures G 25
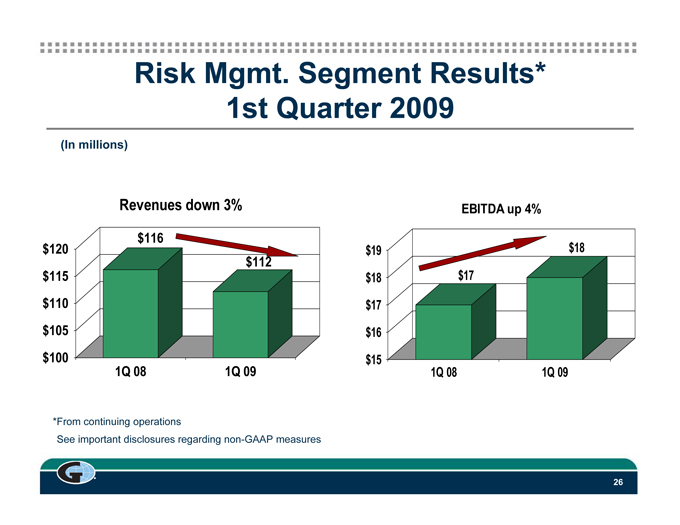
Risk Mgmt. Segment Results* 1st Quarter 2009 (In millions) Revenues down 3% $116 $120 $112 $115 $110 $105 $100 1Q 08 1Q 09 EBITDA up 4% $19 $18 $18 $17 $17 $16 $15 1Q 08 1Q 09 *From continuing operations See important disclosures regarding non-GAAP measures G 26
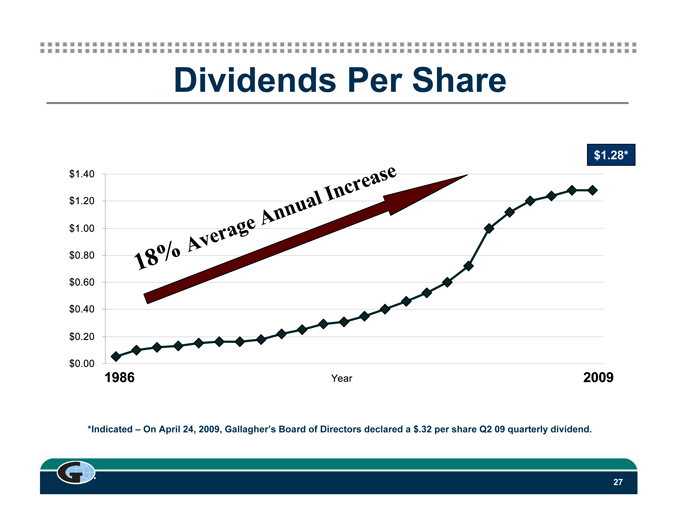
Dividends Per Share $1.40 $1.20 $1.00 $0.80 $0.60 $0.40 $0.20 $0.00 $1.28* 2009 1 8 % Average Annual Increase 1986 Year 2009 *Indicated On April 24, 2009, Gallaghers Board of Directors declared a $.32 per share Q2 09 quarterly dividend. G 27
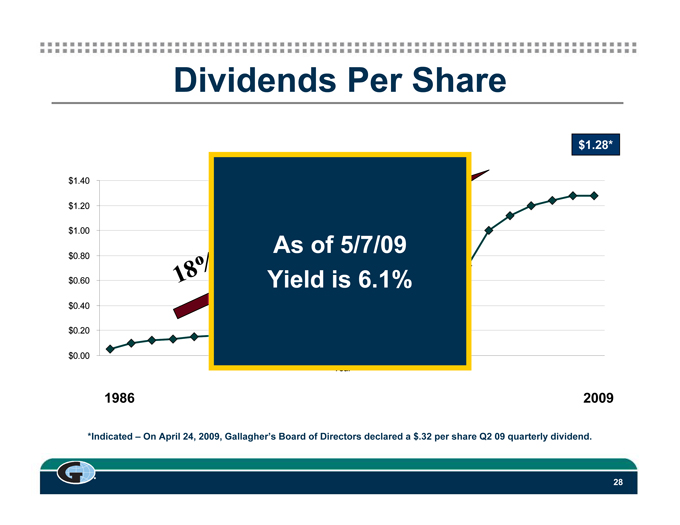
Dividends Per Share $1.40 $1.20 $1.00 $0.80 $0.60 $0.40 $0.20 $0.00 18% As of 5/7/09 Yield is 6.1% $1.28* 2009 1986 *Indicated – On April 24, 2009, Gallagher’s Board of Directors declared a $.32 per share Q2 09 quarterly dividend. G 28
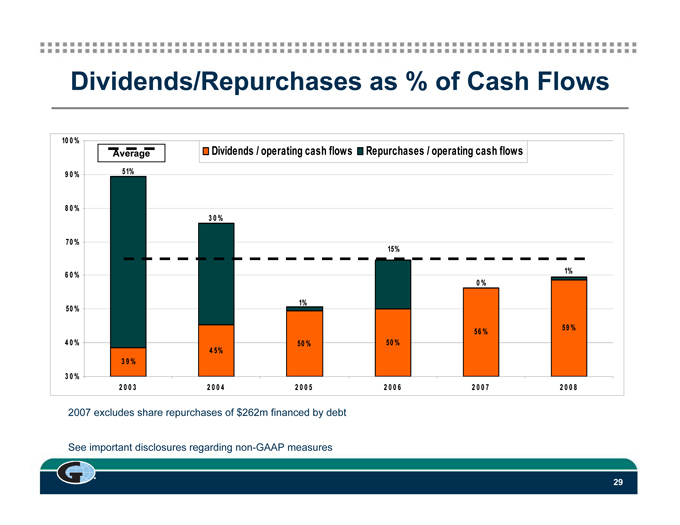
Dividends/Repurchases as % of Cash Flows 100% 90% 80% 70% 60% 50% 40% 30% Dividends / operating cash flows Repurchases / operating cash flows 51% 30% 15% 1% 0% 1% 59% 56% 50% 50% 45% 39% 2003 2004 2005 2006 2007 2008 2007 excludes share repurchases of $262m financed by debt See important disclosures regarding non-GAAP measures G 29
Stockholders’ Meeting May 12, 2009 •Formal Annual Meeting •Chairman’s Remarks – 2008: Where We Are Now – Where We Are Going: Our Dominant Priorities G 30
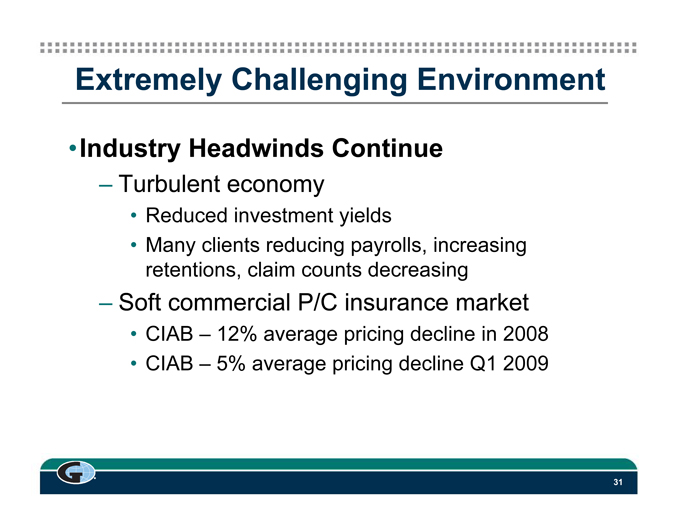
Extremely Challenging Environment •Industry Headwinds Continue – Turbulent economy • Reduced investment yields • Many clients reducing payrolls, increasing retentions, claim counts decreasing – Soft commercial P/C insurance market • CIAB – 12% average pricing decline in 2008 • CIAB – 5% average pricing decline Q1 2009 G 31
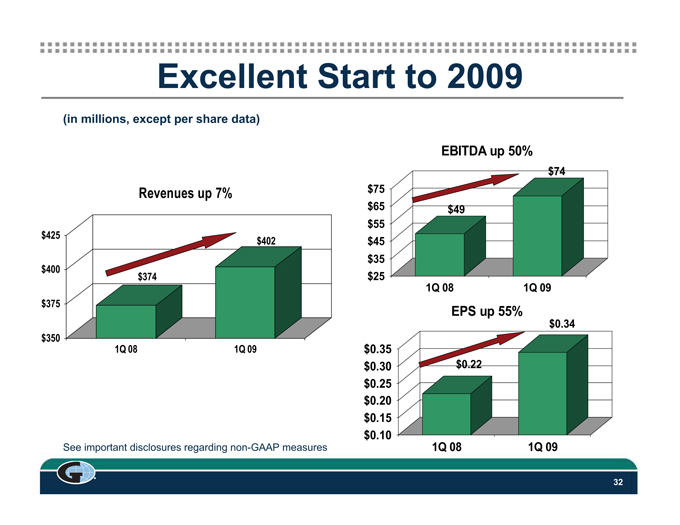
Excellent Start to 2009 (in millions, except per share data) Revenues up 7% $425 $402 $400 $374 $375 $350 1Q 08 1Q 09 EBITDA up 50% $74 $75 $65 $49 $55 $45 $35 $25 1Q 08 1Q 09 EPS up 55% $0.34 $0.35 $0.30 $0.22 $0.25 $0.20 $0.15 $0.10 1Q 08 1Q 09 See important disclosures regarding non-GAAP measures G 32
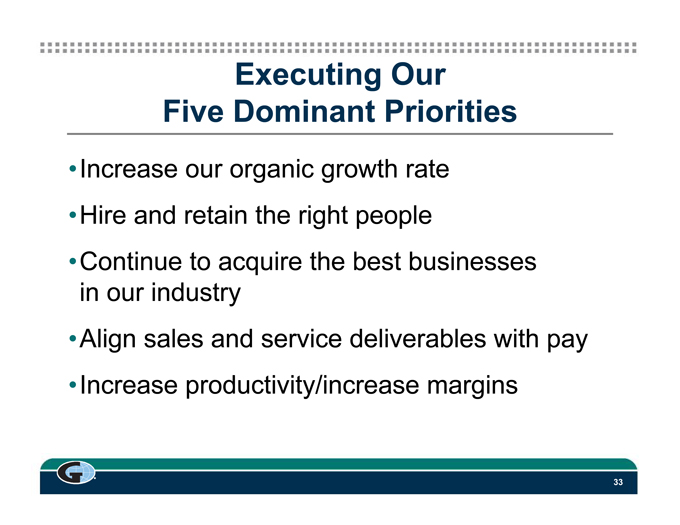
Executing Our Five Dominant Priorities •Increase our organic growth rate •Hire and retain the right people •Continue to acquire the best businesses in our industry •Align sales and service deliverables with pay •Increase productivity/increase margins G 33
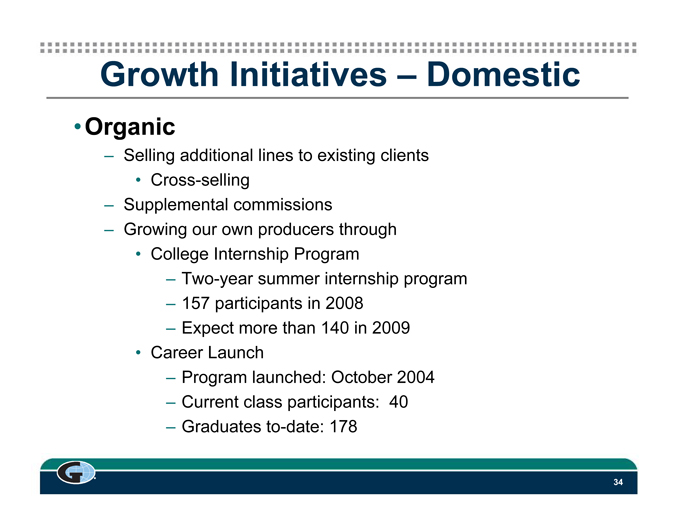
Growth Initiatives – Domestic •Organic – Selling additional lines to existing clients • Cross-selling – Supplemental commissions – Growing our own producers through • College Internship Program – Two-year summer internship program – 157 participants in 2008 – Expect more than 140 in 2009 • Career Launch – Program launched: October 2004 – Current class participants: 40 – Graduates to-date: 178 G 34
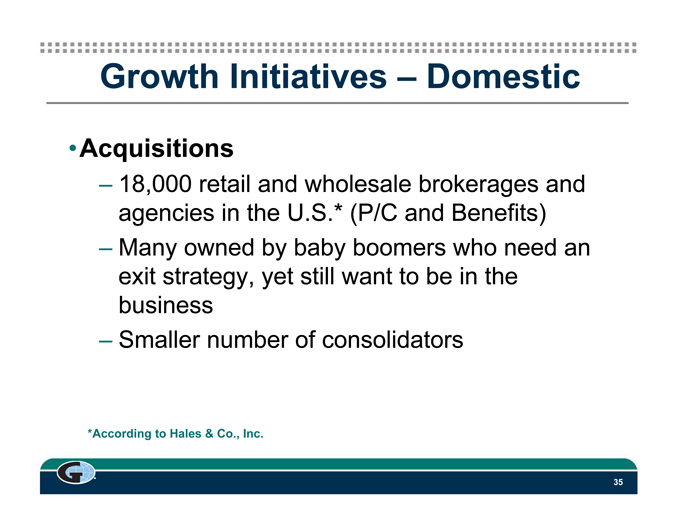
Growth Initiatives – Domestic •Acquisitions – 18,000 retail and wholesale brokerages and agencies in the U.S.* (P/C and Benefits) – Many owned by baby boomers who need an exit strategy, yet still want to be in the business – Smaller number of consolidators *According to Hales & Co., Inc. G 35
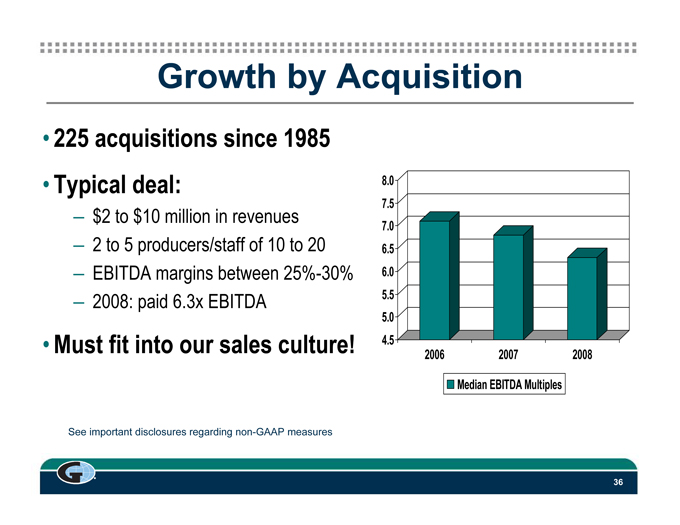
Growth by Acquisition • 225 acquisitions since 1985 • Typical deal: – $2 to $10 million in revenues – 2 to 5 producers/staff of 10 to 20 – EBITDA margins between 25%-30% – 2008: paid 6.3x EBITDA • Must fit into our sales culture! 8.0 7.5 7.0 6.5 6.0 5.5 5.0 4.5 2006 2007 2008 Median EBITDA Multiples See important disclosures regarding non-GAAP measures G 36
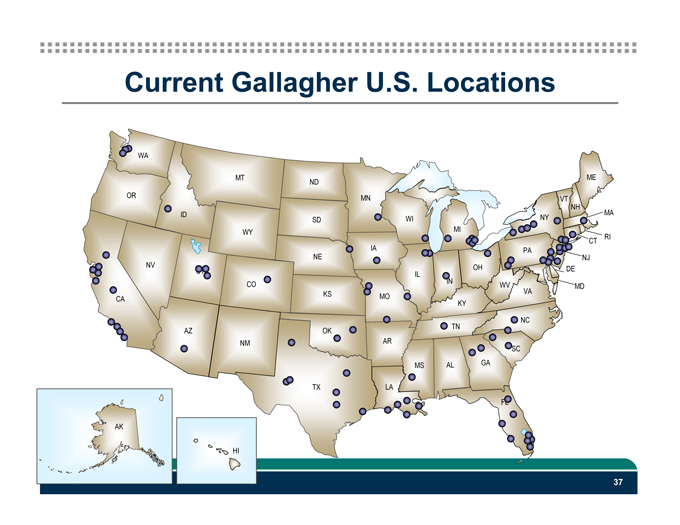
Current Gallagher U.S. Locations WA MT ME ND OR MN VT NH ID MA SD WI NY WY MI RI IA CT PA NE NJ NV OH UT DE IL IN CO WV VA MD KS MO CA KY NC TN AZ OK NM AR SC MS AL GA TX LA FL AK HI 37
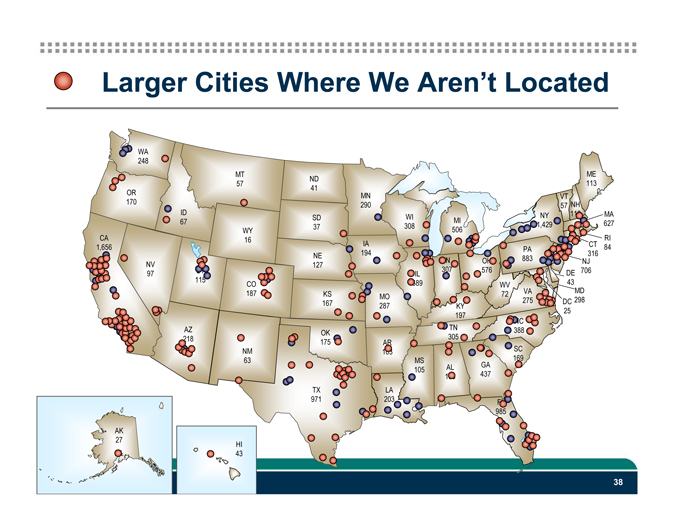
Larger Cities Where We Aren’t Located WA 248 MT ME ND 57 113 41 OR MN VT 170 290 NH ID 57 WI NY 112 MA SD MI 67 1,429 627 37 308 506 CA WY RI 16 1,656 IA CT 84 PA NE 194 316 IN OH 883 NJ NV 127 UT 307 576 DE 706 97 IL 115 689 43 CO WV 187 KS 72 VA MD MO 298 167 275 DC 287 KY 25 197 NC AZ TN 388 OK 218 305 175 AR NM 103 SC 63 MS 169 AL GA 105 188 437 TX LA 971 203 FL 985 AK 27 HI 43 38
Growth – International •Gallagher Optimus Network – Correspondent brokers in more than 100 countries – Stages of partnership to investment •Opportunistic acquisitions/minority interests – SBA in Perth, Australia •Other International locations – Australia, Bermuda, Canada, Caribbean, U.K. G 39
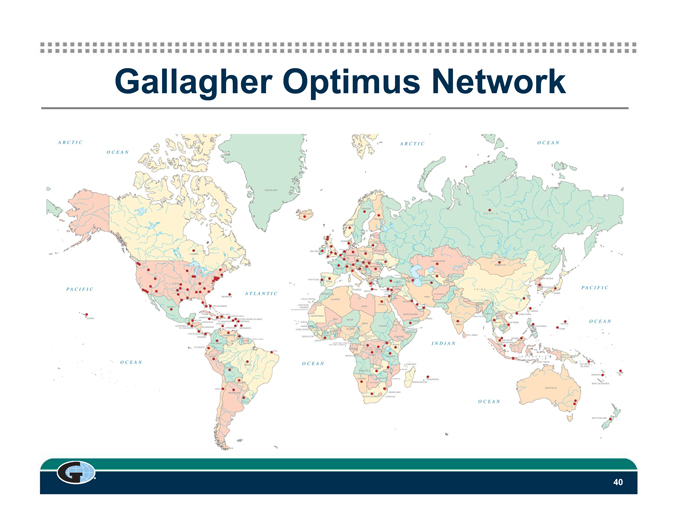
Gallagher Optimus Network ARCTIC OCEAN PACIFIC OCEAN ATLANTIC OCEAN INDIAN OCEAN ARCTIC OCEAN PACIFIC OCEAN G 40
Growth – International • 13% of 2008 revenues were from international operations. • Gallagher is a global company. G 41
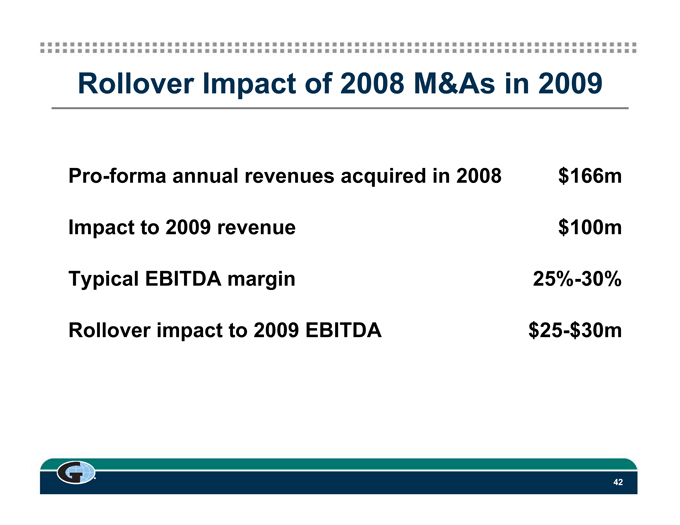
Rollover Impact of 2008 M&As in 2009 Pro-forma annual revenues acquired in 2008 $166m Impact to 2009 revenue $100m Typical EBITDA margin 25%-30% Rollover impact to 2009 EBITDA $25-$30m G 42
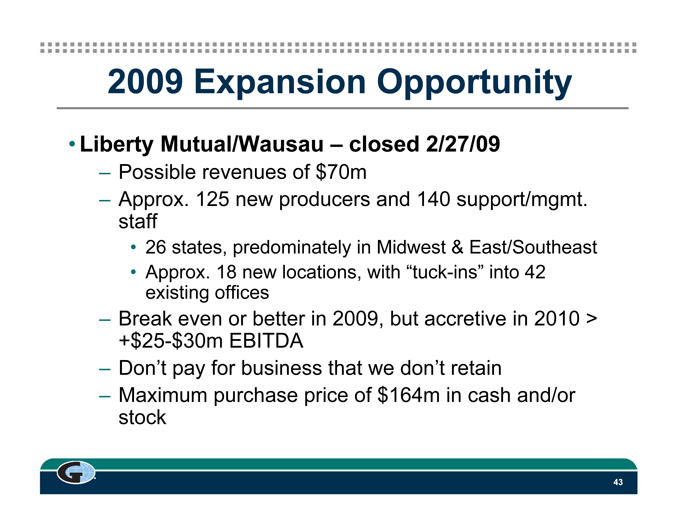
2009 Expansion Opportunity • Liberty Mutual/Wausau – closed 2/27/09 – Possible revenues of $70m – Approx. 125 new producers and 140 support/mgmt. staff • 26 states, predominately in Midwest & East/Southeast • Approx. 18 new locations, with “tuck-ins” into 42 existing offices – Break even or better in 2009, but accretive in 2010 > +$25-$30m EBITDA – Don’t pay for business that we don’t retain – Maximum purchase price of $164m in cash and/or stock G 43
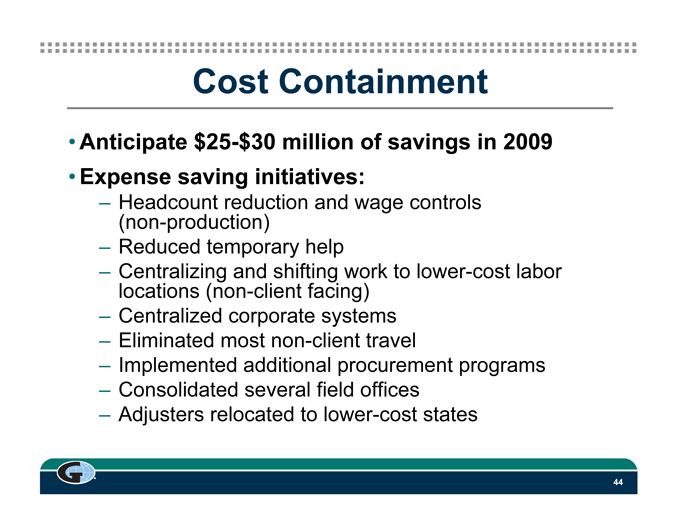
Cost Containment • Anticipate $25-$30 million of savings in 2009 • Expense saving initiatives: – Headcount reduction and wage controls (non-production) – Reduced temporary help – Centralizing and shifting work to lower-cost labor locations (non-client facing) – Centralized corporate systems – Eliminated most non-client travel – Implemented additional procurement programs – Consolidated several field offices – Adjusters relocated to lower-cost states G 44
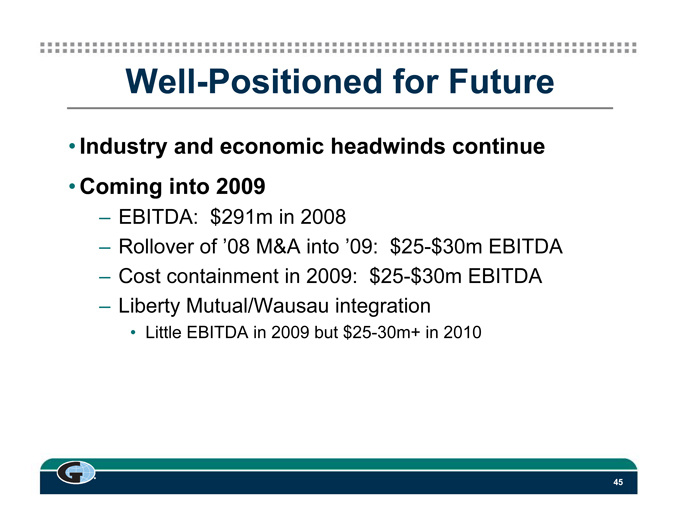
Well-Positioned for Future • Industry and economic headwinds continue • Coming into 2009 – EBITDA: $291m in 2008 – Rollover of ‘08 M&A into ‘09: $25-$30m EBITDA – Cost containment in 2009: $25-$30m EBITDA – Liberty Mutual/Wausau integration • Little EBITDA in 2009 but $25-30m+ in 2010 G 45

Questions & Answers G 46
Stockholders’ Meeting May 12, 2009 •2009 Annual Meeting •Chairman’s Remarks – 2008: Where We Are Now – Where We Are Going: Our Dominant Priorities – Questions & Answers •It’s All About The Culture G 47
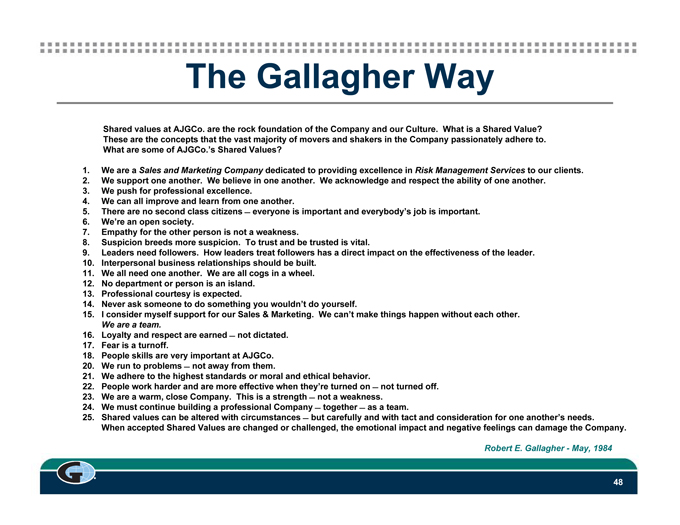
The Gallagher Way Shared values at AJGCo. are the rock foundation of the Company and our Culture. What is a Shared Value? These are the concepts that the vast majority of movers and shakers in the Company passionately adhere to. What are some of AJGCo.’s Shared Values? 1. We are a Sales and Marketing Company dedicated to providing excellence in Risk Management Services to our clients. 2. We support one another. We believe in one another. We acknowledge and respect the ability of one another. 3. We push for professional excellence. 4. We can all improve and learn from one another. 5. There are no second class citizens everyone is important and everybody’s job is important. 6. We’re an open society. 7. Empathy for the other person is not a weakness. 8. Suspicion breeds more suspicion. To trust and be trusted is vital. 9. Leaders need followers. How leaders treat followers has a direct impact on the effectiveness of the leader. 10. Interpersonal business relationships should be built. 11. We all need one another. We are all cogs in a wheel. 12. No department or person is an island. 13. Professional courtesy is expected. 14. Never ask someone to do something you wouldn’t do yourself. 15. I consider myself support for our Sales & Marketing. We can’t make things happen without each other. We are a team. 16. Loyalty and respect are earned not dictated. 17. Fear is a turnoff. 18. People skills are very important at AJGCo. 20. We run to problems not away from them. 21. We adhere to the highest standards or moral and ethical behavior. 22. People work harder and are more effective when they’re turned on not turned off. 23. We are a warm, close Company. This is a strength not a weakness. 24. We must continue building a professional Company together as a team. 25. Shared values can be altered with circumstances but carefully and with tact and consideration for one another’s needs. When accepted Shared Values are changed or challenged, the emotional impact and negative feelings can damage the Company. Robert E. Gallagher—May, 1984 G 48
2009 Annual Stockholders’ Meeting Tuesday, May 12, 2009