Exhibit 99.1
Investment Presentation
August 2011
Information Regarding Forward-Looking
Statements
This presentation contains “forward-looking statements” within the meaning of the Private Securities Litigation Reform Act of 1995. When used in this presentation, the words “anticipates,” “expects,” “believes,” “should,” “could,” “estimates,” “expects,” “intends,” “plans” and similar expressions are intended to identify forward-looking statements. Examples of forward-looking statements in this presentation include, but are not limited to, statements relating to: (i) Gallagher’s capabilities for growth and expansion; (ii) Gallagher’s acquisition strategy and planned levels of acquisition activity; (iii) the integration of recent acquisitions (including GAB Robins and Heath Lambert); (iv) the revenue and earnings impact of such acquisitions; (v) drivers of organic growth in the Brokerage and Risk Management Segments; (vi) anticipated future results or performance (including margins) of any segment or Gallagher as a whole; (vii) Gallagher’s stock performance (including dividend payments); (viii) future debt levels; (ix) expected uses of cash; (x) international opportunities; (xi) productivity and expense reduction initiatives; and (xii) potential future developments in, and income and tax credits that could be generated by, Gallagher’s clean-energy investments.
Important factors that could cause actual results to differ materially from those in the forward-looking statements include the following:
•changes in worldwide and national economic conditions, changes in premium rates and insurance markets generally, changes in the insurance brokerage industry’s competitive landscape, and the difficulties inherent in combining the cultures and systems of different companies could impact (i) through (xi) above; and
•uncertainties related to Gallagher’s clean-energy investments, including uncertainties related to receipt and maintenance by Gallagher’s utility partners of long-term permits, Gallagher’s ability to find operating sites and co-investors for its non-operating and future operations, potential IRS challenges to Gallagher’s ability to claim tax credits under IRC Section 45, utilities’ future use of coal to generate electricity, operational risks at Gallagher’s clean-energy operations, business risks relating to Gallagher’s co-investors and partners, intellectual property risks and environmental risks, could impact (xii) above.
Please refer to Gallagher’s filings with the SEC, including Item 1A, “Risk Factors,” of its Annual Report on Form 10-K for the fiscal year ended December 31, 2010, for a more detailed discussion of these and other factors that could impact its forward-looking statements.
Information Regarding Non-GAAP Measures
This presentation includes references to EBITDAC, Adjusted EBITDAC, Adjusted EBITDAC margin, Adjusted Revenues and Organic Growth, which are performance measures not in accordance with, or an alternative to, the GAAP information provided herein.
Earnings Measures—Gallagher believes that each of EBITDAC, Adjusted EBITDAC and Adjusted EBITDAC margin, as defined below, provides a meaningful representation of its operating performance. Gallagher considers EBITDAC as a way to measure financial performance on an ongoing basis. Adjusted EBITDAC and Adjusted EBITDAC margin are presented to improve the comparability of Gallagher’s results between periods by eliminating the impact of certain items that have a high degree of variability.
EBITDAC is defined as earnings from continuing operations before interest, income taxes, depreciation, amortization and the change in estimated acquisition earnout
payables.
Adjusted EBITDAC is defined as EBITDAC adjusted to exclude gains realized from sales of books of business, supplemental commission timing amounts, workforce
related charges, lease termination related charges, acquisition related integration costs and litigation settlements.
Adjusted EBITDAC margin is defined as Adjusted EBITDAC divided by total revenues, as adjusted to exclude gains realized from sales of books of business and
supplemental commission timing amounts.
The most directly comparable GAAP measure for these non-GAAP earnings measures is earnings from continuing operations. For the Brokerage Segment, the Risk Management Segment, and the two segments on a combined basis, earnings from continuing operations was $136 million, $31 million, and $167 million, respectively, in 2010, $61 million, $17 million, and $78 million, respectively, for the 6 months ended June 30, 2010 and $62 million, $13 million, and $75 million, respectively, for the 6 months ended June 30, 2011.
Revenue Measures—Gallagher believes that Adjusted Revenues, as defined below, provides stockholders and other interested persons with useful information that will assist such persons in analyzing Gallagher’s operating results as they develop a future outlook for Gallagher. Gallagher believes that Organic Growth provides a comparable measurement of revenue growth that is associated with the revenue sources that will be continuing in 2011 and beyond. Gallagher has historically viewed Organic Growth as an important indicator when assessing and evaluating the performance of its Brokerage and Risk Management Segments. Gallagher also believes that using this measure allows financial statement users to measure, analyze and compare the growth from its Brokerage and Risk Management Segments in a meaningful and consistent manner. Adjusted Revenues is defined as revenues adjusted to exclude gains realized from sales of books of business and supplemental commission timing amounts. Organic Growth is organic change in commission, fee and supplemental commission revenues, which excludes the first twelve months of net commission, fee and supplemental commission revenues generated from acquisitions accounted for as purchases and the net commission and fee revenues related to operations disposed of in each year presented. These commissions and fees are excluded from organic revenues in order to determine the revenue growth that is associated with the operations that were a part of Gallagher in both the current and prior year. In addition, organic growth excludes the impact of contingent commission revenues and the period-over-period impact of foreign currency translation. The amounts excluded with respect to foreign currency translation are calculated by applying 2011 foreign exchange rates to the same periods in 2010.
The most directly comparable GAAP measure for Adjusted Revenues and Organic Growth is revenues. For the Brokerage Segment, the Risk Management Segment, and the two segments on a combined basis, revenues were $1,341 million, $462 million, and $1,803 million, respectively, in 2010, $651 million, $222 million, and $873 million, respectively, for the 6 months ended June 30, 2010 and $721 million, $264 million, and $985 million, respectively, for the 6 months ended June 30, 2011. For the Brokerage Segment, revenues were $780 million, $849 million, $926 million, $1,001 million, $1,071 million, $1,114 million, $1,188 million, $1,276 million, $1,341 million, $317 million and $404 million, in 2002, 2003, 2004, 2005, 2006, 2007, 2008, 2009, 2010, first quarter 2011 and second quarter 2011, respectively.
Reconciliations—Please see “Reconciliation of Non-GAAP Measures” on Gallagher’s Web site at www.ajg.com under “Investor Relations” for a reconciliation of non-GAAP measures to the most directly comparable GAAP measures.
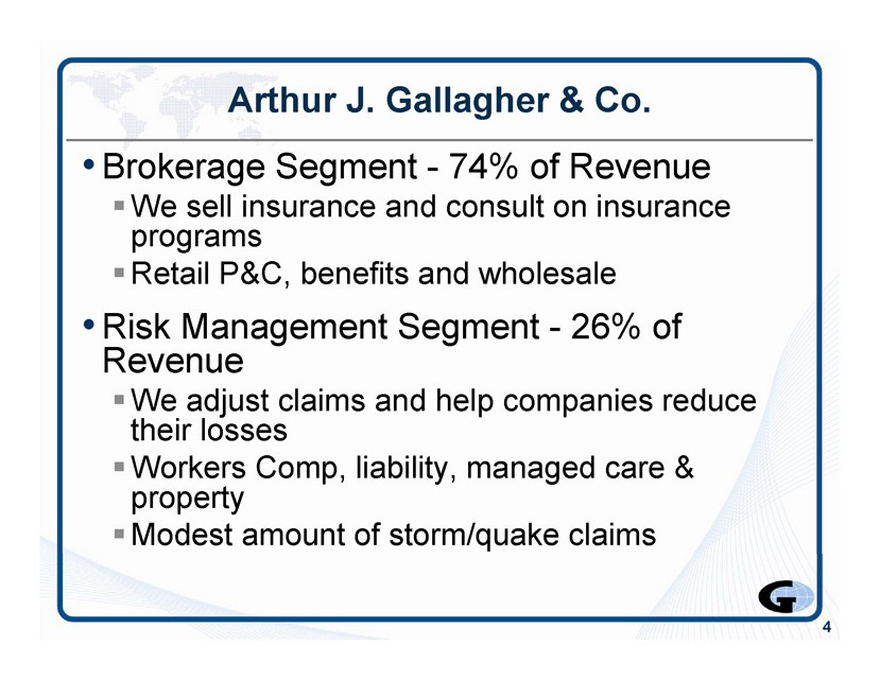
Arthur J. Gallagher & Co.
• Brokerage Segment—74% of Revenue
We sell insurance and consult on insurance programs
Retail P&C, benefits and wholesale
• Risk Management Segment—26% of Revenue
We adjust claims and help companies reduce their losses
Workers Comp, liability, managed care & property
Modest amount of storm/quake claims
QJ
4 |
|
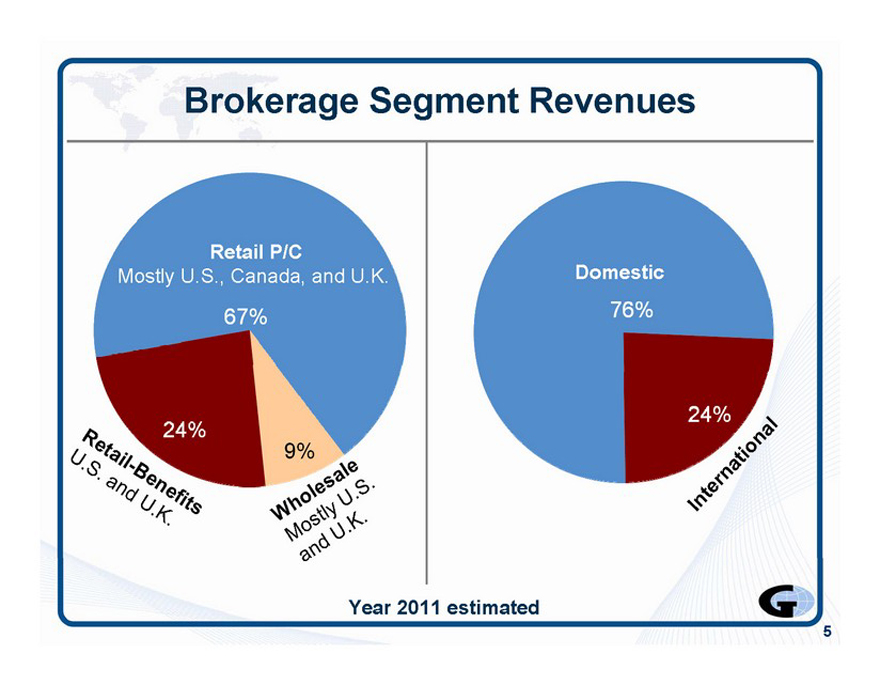
Brokerage Segment Revenues
Retail P/C
Mostly U.S., Canada, and U.K.
Domestic
76%
%%
9% J
Year 2011 estimated
5 |
|
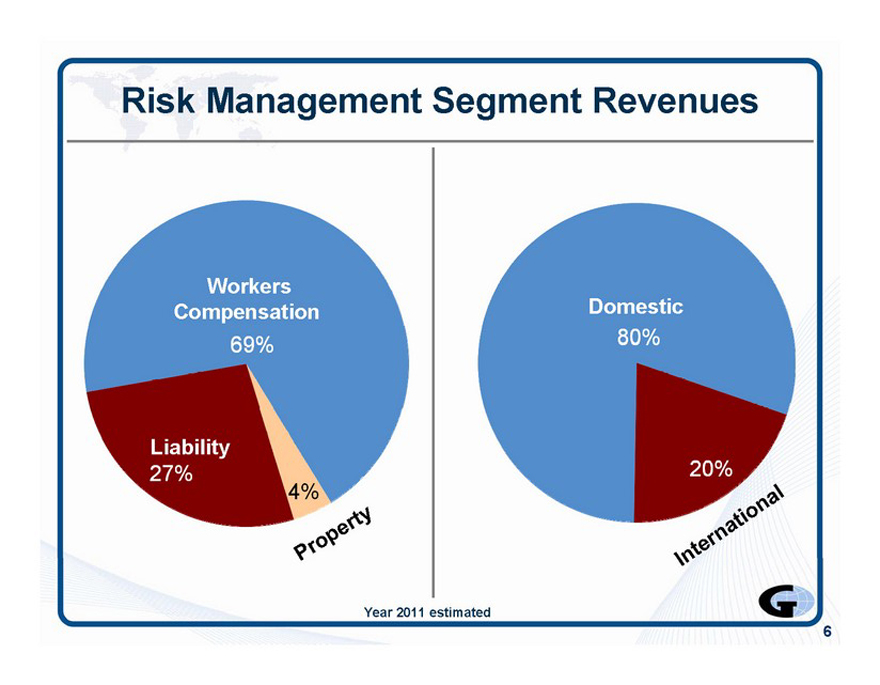
Risk Management Segment Revenues
6 |
|
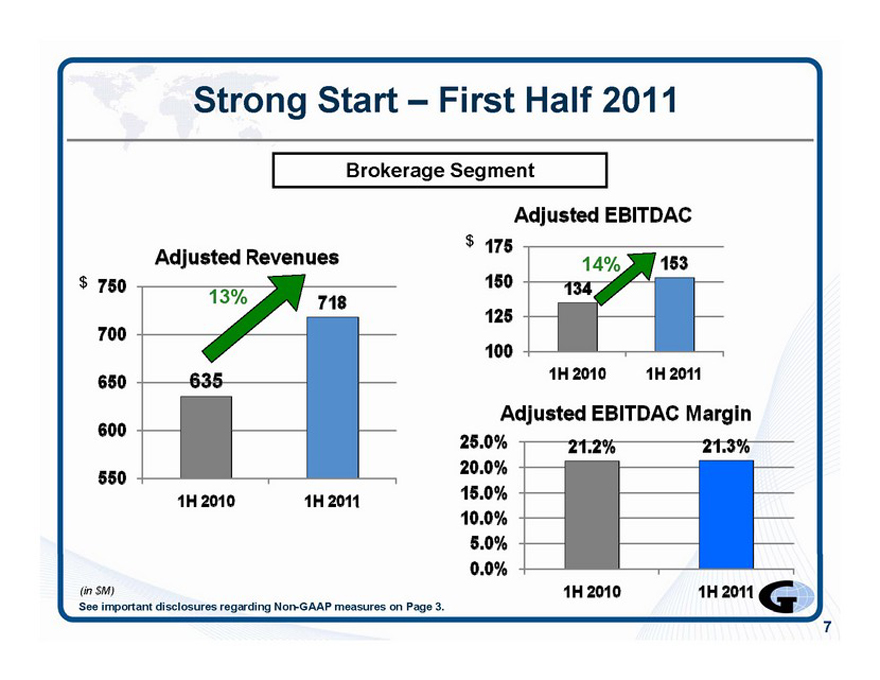
Strong Start—First Half 2011
Brokerage Segment
Adjusted Revenues
$ 750
700
650
600
550
1H2011
1H2010
(in $M)
See important disclosures regarding Non-GAAP measures on Page 3.
Adjusted EBITDAC
7 |
|
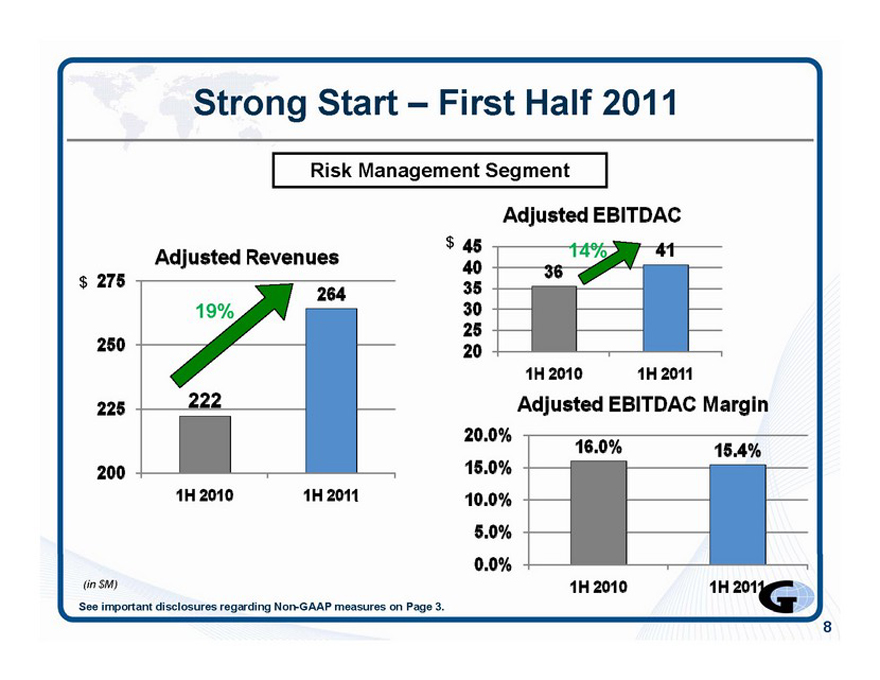
Strong Start—First Half 2011
Risk Management Segment
$ 275
Adjusted Revenues
250
264
225
222
200
1H2011
1H2010
(in $M)
See important disclosures regarding Non-GAAP measures on Page 3.
Adjusted EBITDAC
8 |
|
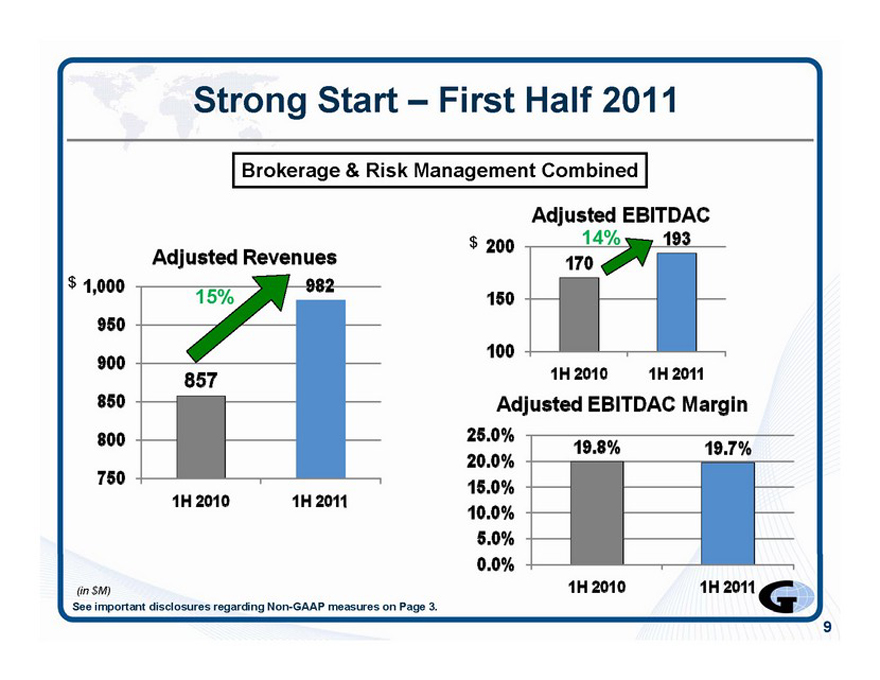
Strong Start—First Half 2011
Brokerage & Risk Management Combined
19.7%
1H2011
Adjusted Revenues
(in $M)
See important disclosures regarding Non-GAAP measures on Page 3.
Adjusted EBITDAC
9
Corporate Segment—Clean Energy Update
Gallagher owns 42% of Chem-Mod, LLC. Chem-Mod is a multi-pollutant reduction venture that owns technologies to reduce harmful emissions from coal fired power plants. When The Chem-Mod™ Solution is used in refined coal plants placed in service by December 31, 2011, the operation can qualify for tax credits under IRC Section 45.
Gallagher owns approximately 25% of six Section 45 operations. Collectively, these six operations could generate approximately $4.5 million of net after-tax earnings per quarter through 2019.
Gallagher has signed agreements with a utility to build and run two new refined coal operations. Gallagher expects to retain 40% to 49% ownership. These two operations could generate approximately $2.5 to $3.0 million of net after-tax earnings per quarter through 2021.
Demand for Section 45 plants using The Chem-Mod™ Solution is increasing. Accordingly, Gallagher has obtained an extension of its license from Chem-Mod and is in the process of constructing up to 10 additional facilities.
10
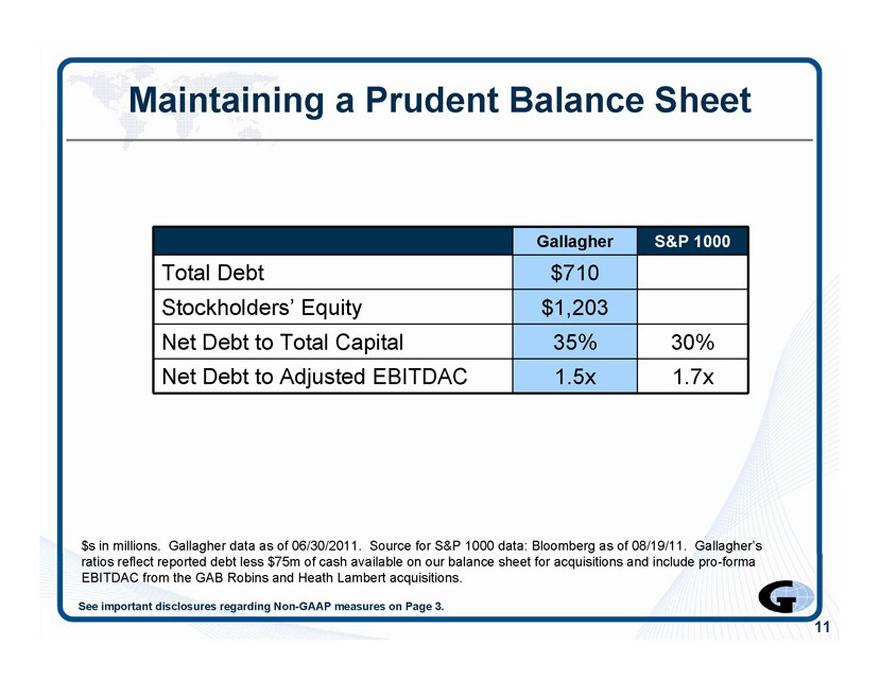
Maintaining a Prudent Balance Sheet
Gallagher S&P 1000
Total Debt $710
Stockholders’ Equity $1,203
Net Debt to Total Capital 35% 30%
Net Debt to Adjusted EBITDAC 1.5x 1.7x
G
$s in millions. Gallagher data as of 06/30/2011. Source for S&P 1000 data: Bloomberg as of 08/19/11. Gallagher’s ratios reflect reported debt less $75m of cash available on our balance sheet for acquisitions and include pro-forma EBITDAC from the GAB Robins and Heath Lambert acquisitions.
See important disclosures regarding Non-GAAP measures on Page 3.
11
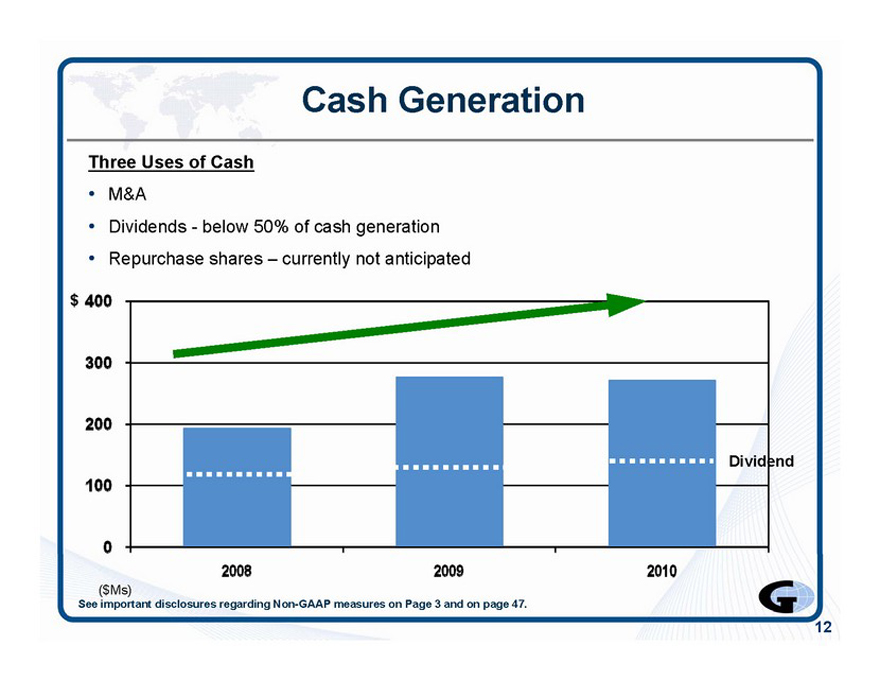
Cash Generation
Three Uses of Cash
• M&A
Dividends—below 50% of cash generation
• Repurchase shares—currently not anticipated
$ 400
300
200
100
Dividend
2008
2009
($Ms)
See important disclosures regarding Non-GAAP measures on Page 3 and on page 47.
2010
G
12
Looking Forward
View of operating environment Plan for growth
13
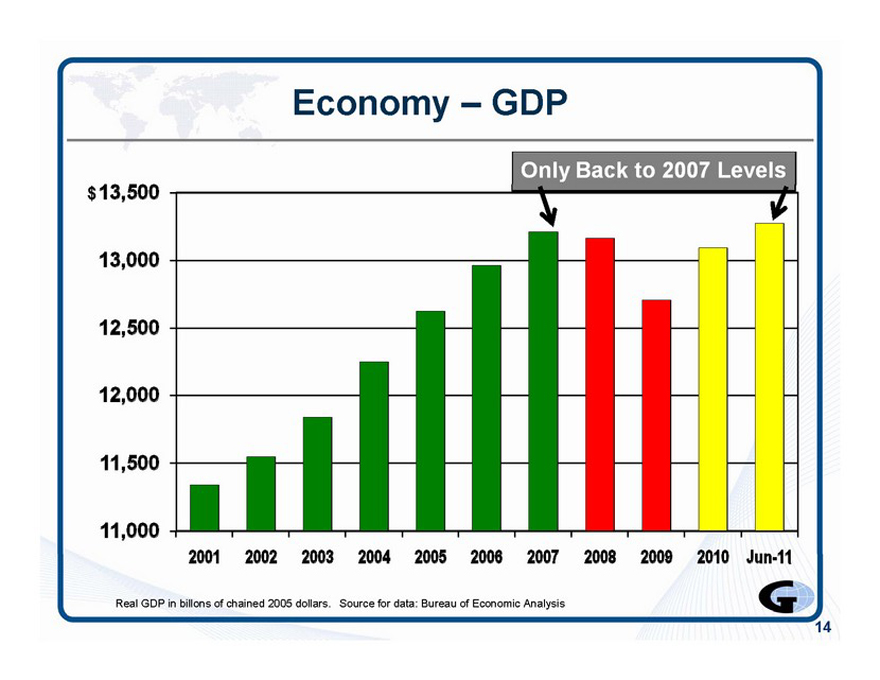
Economy – GDP
Real GDP in billons of chained 2005 dollars. Source for data: Bureau of Economic Analysis
14
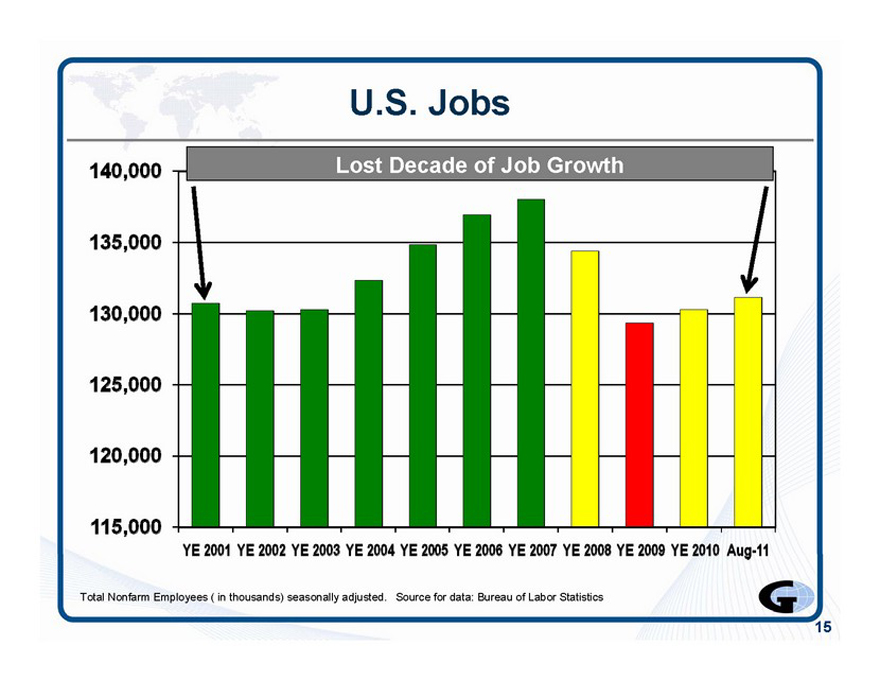
U.S. Jobs
140,000 T
Lost Decade of Job Growth
135,000
130,000
JL
125,000
120,000
115,000
YE 2001 YE 2002 YE 2003 YE 2004 YE 2005 YE 2006 YE 2007 YE 2008 YE 2009 YE 2010 Aug-11
Total Nonfarm Employees ( in thousands) seasonally adjusted. Source for data: Bureau of Labor Statistics
G
15
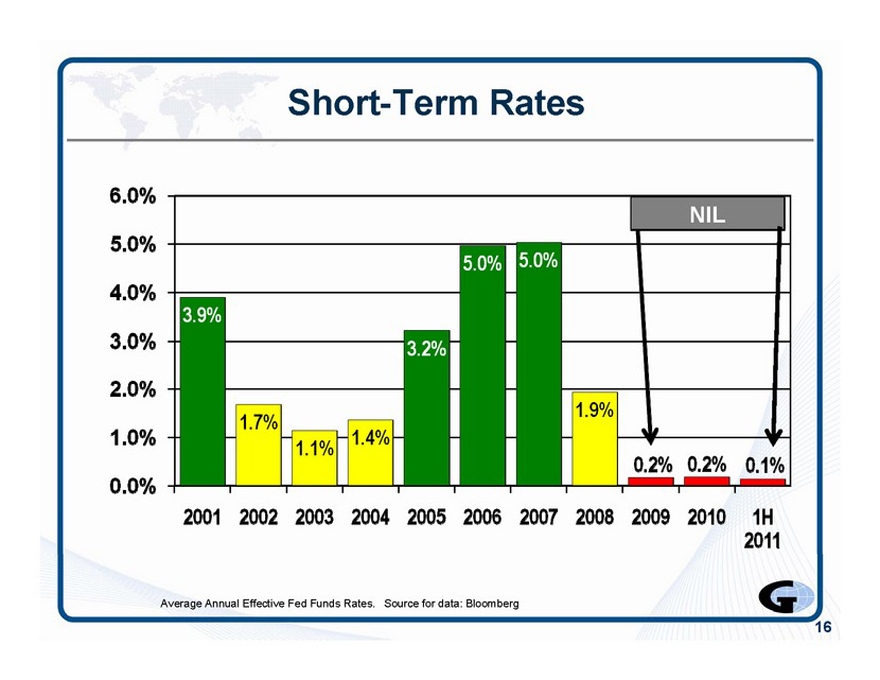
Short-Term Rates
•EBHttE
6.0%
5.0%
4.0%
3.0%
2.0% 4
1.0% \
0.0%
3.9%
1.7%
1.1%
hl.4%
1.9%
0.2% 0.2% 0.1%
r r
Hi i
2001 2002 2003 2004 2005 2006 2007 2008 2009 2010 1H
2011
Average Annual Effective Fed Funds Rates. Source for data: Bloomberg
G
16
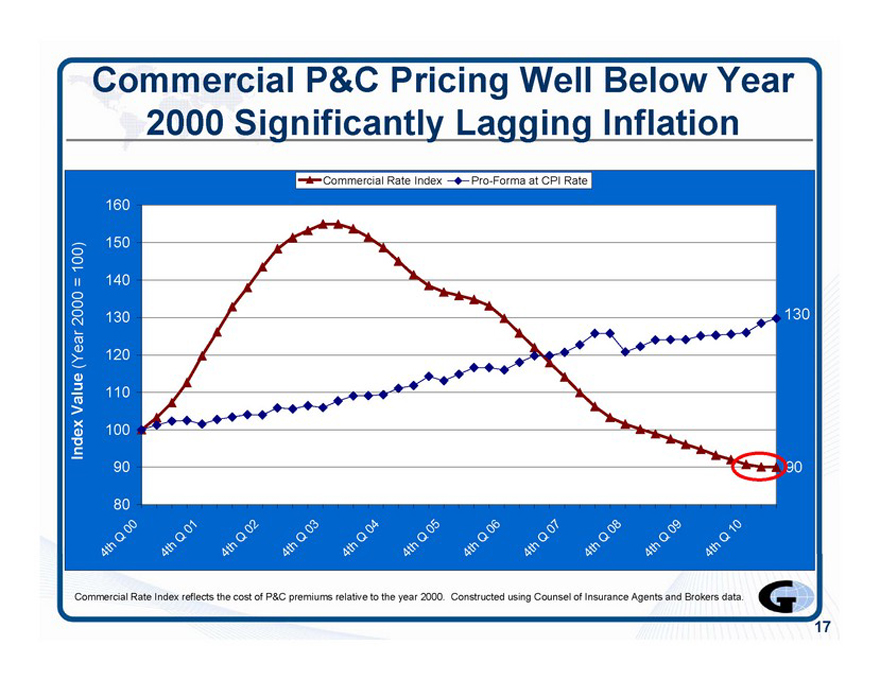
Commercial P&C Pricing Well Below Year 2000 Significantly Lagging Inflation
17
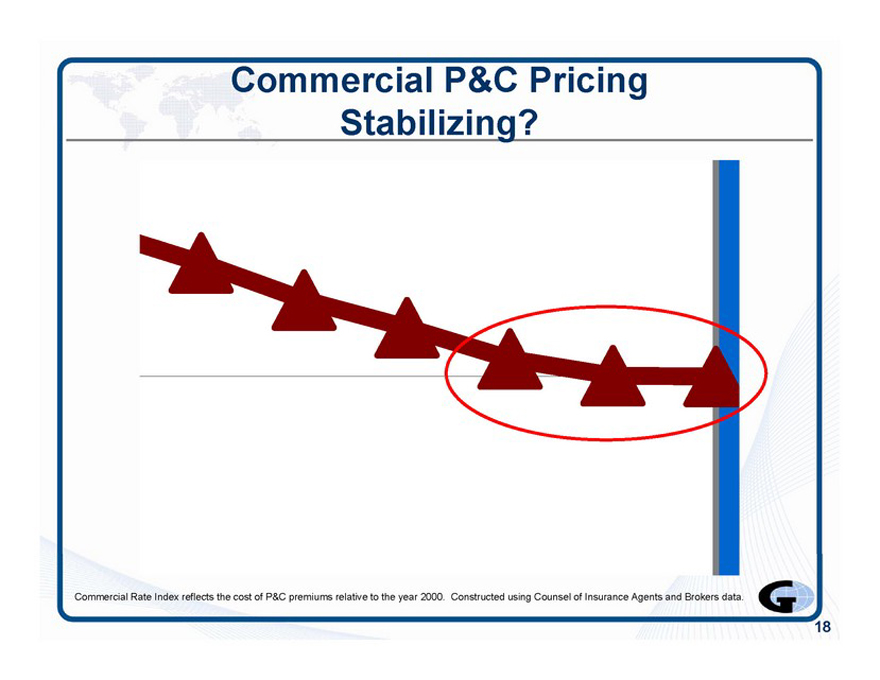
Commercial P&C Pricing Stabilizing?
18
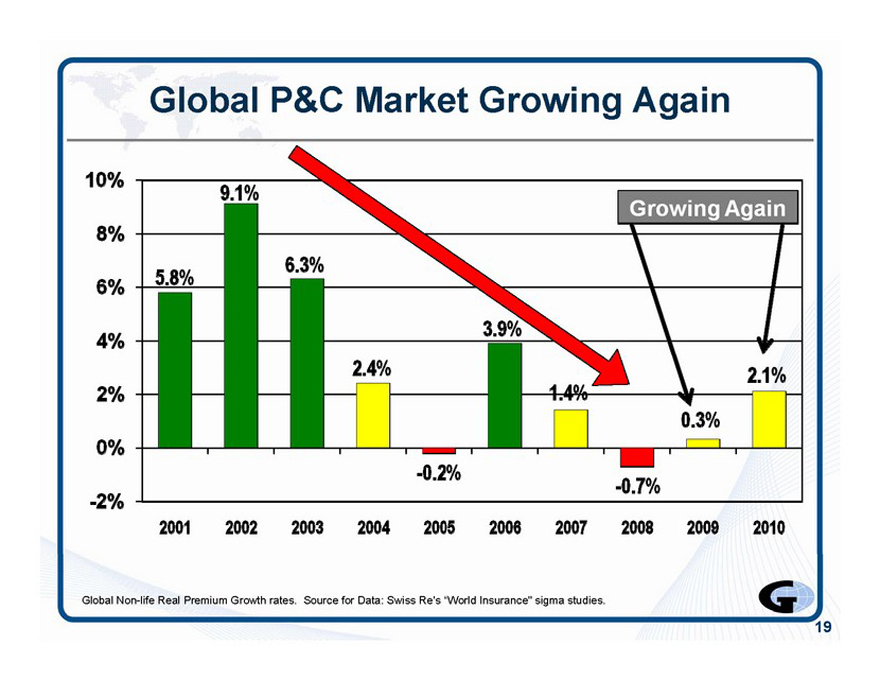
Global P&C Market Growing Again
19
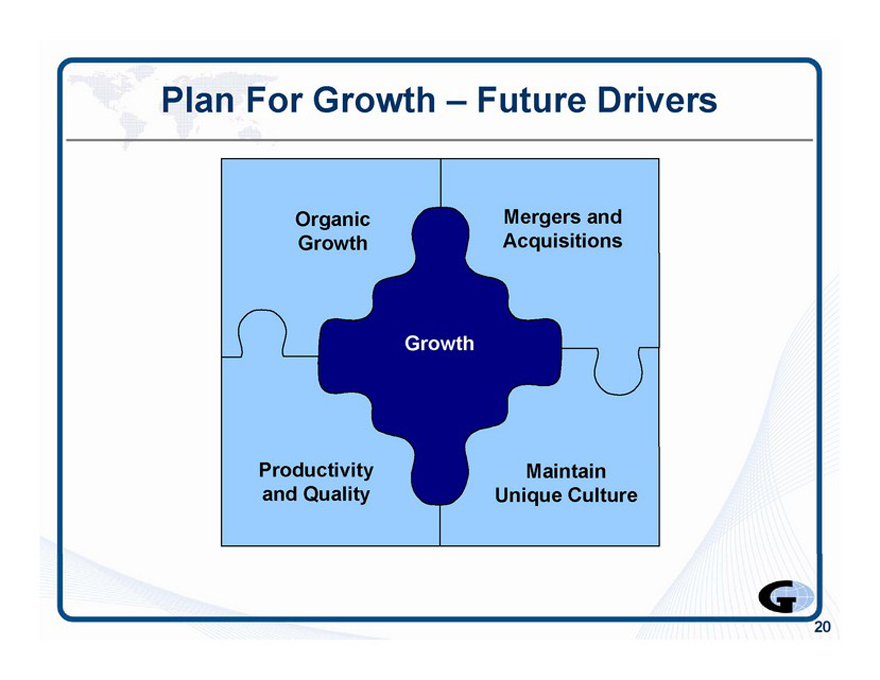
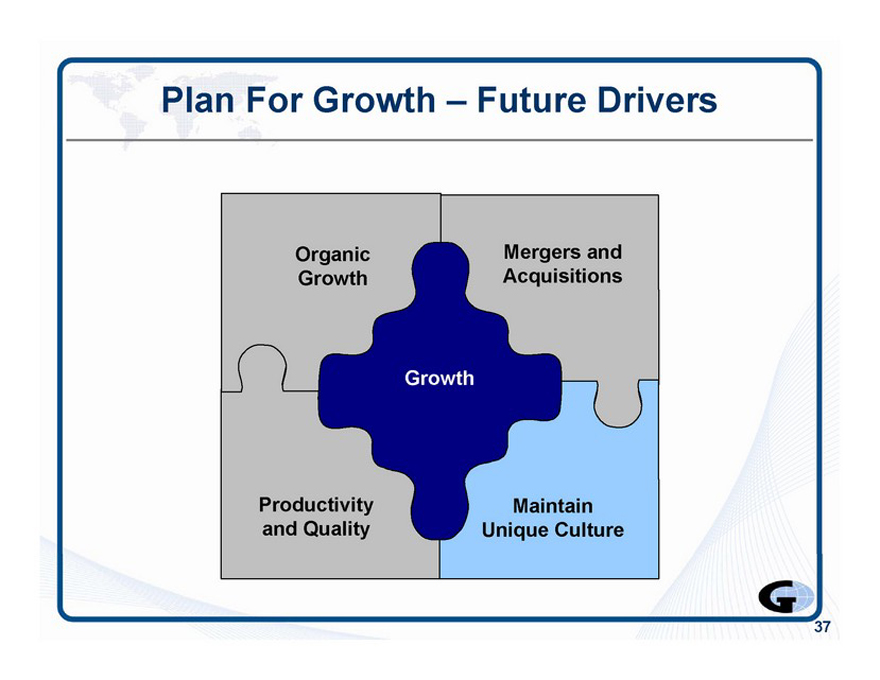
Plan For Growth—Future Drivers
Organic A Growth Mergers and Acquisitions
Growth
Productivity and Quality Maintain W Unique Culture
G
20
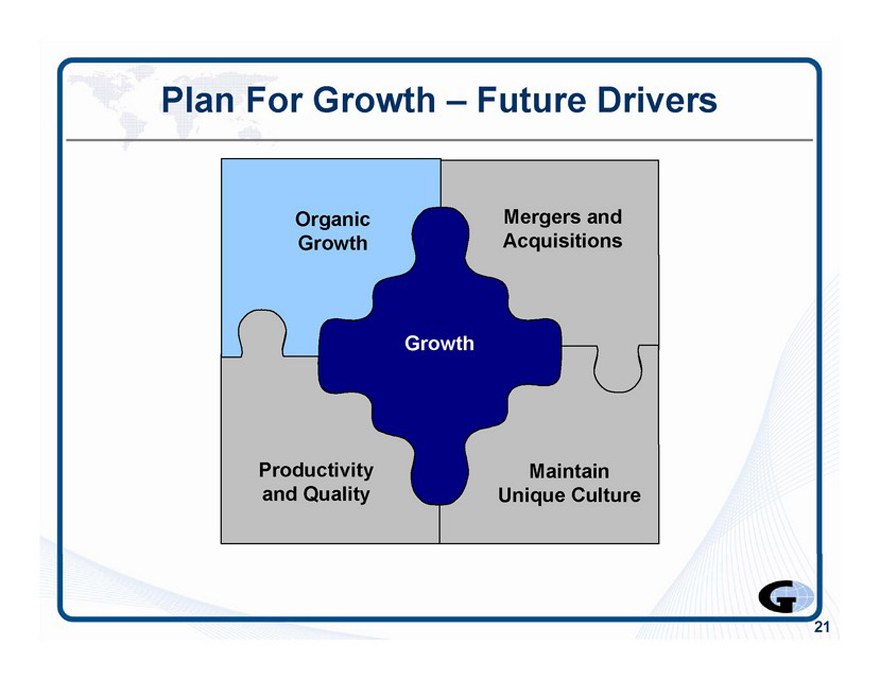
Plan For Growth—Future Drivers
Organic A Growth Mergers and Acquisitions
Growth
Productivity and Quality Maintain W Unique Culture
21
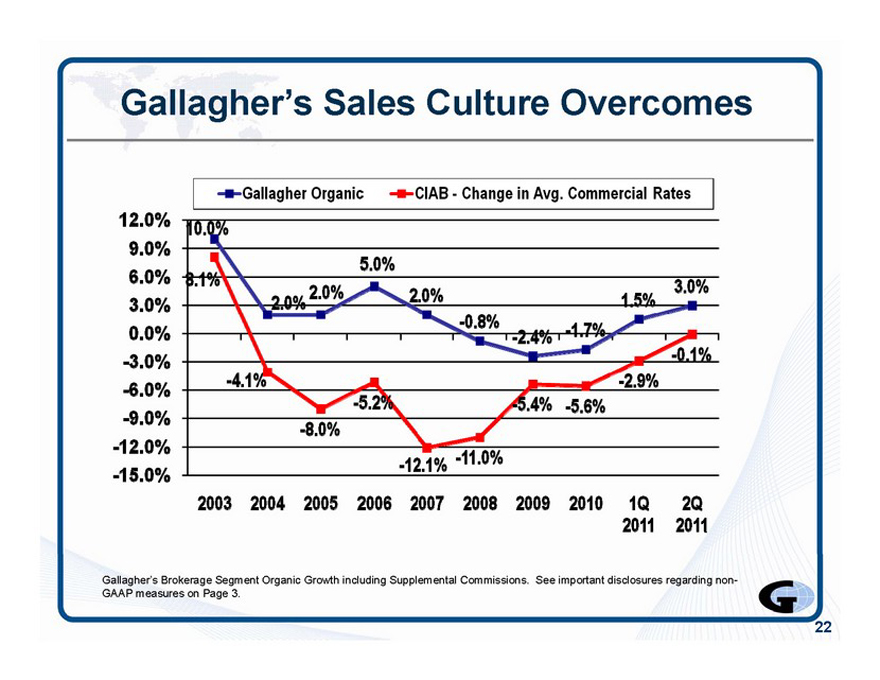
Gallagher’s Sales Culture Overcomes
•Gallagher Organic -a-ClAB—Change in Avg. Commercial Rates
12.0%
9.0%
6.0%
3.0%
0.0%
-3.0%
-6.0%
-9.0%
-12.0%
?15.0%
2003 2004 2005 2006 2007 2008 2009 2010 1Q 2Q
2011 2011
Gallagher’s Brokerage Segment Organic Growth including Supplemental Commissions. See important disclosures regarding non-GAAP measures on Page 3.
G
22
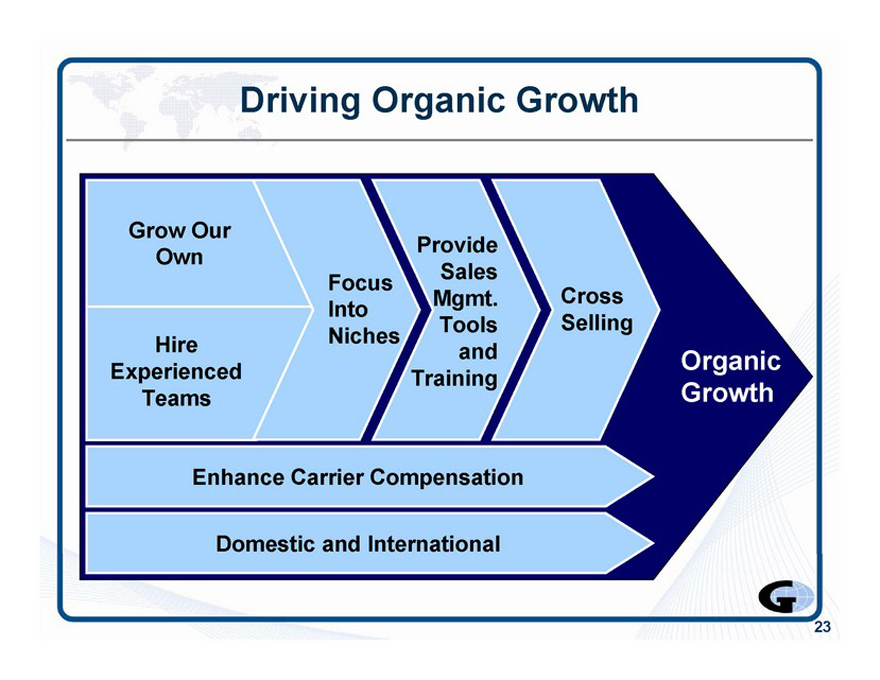
Grow Our Own
Driving Organic Growth
Hire Experienced Teams
Focus Into Niches
Provide Sales Mgmt.
Tools and Training
Cross Selling
Organic Growth
Enhance Carrier Compensation
Domestic and International
23
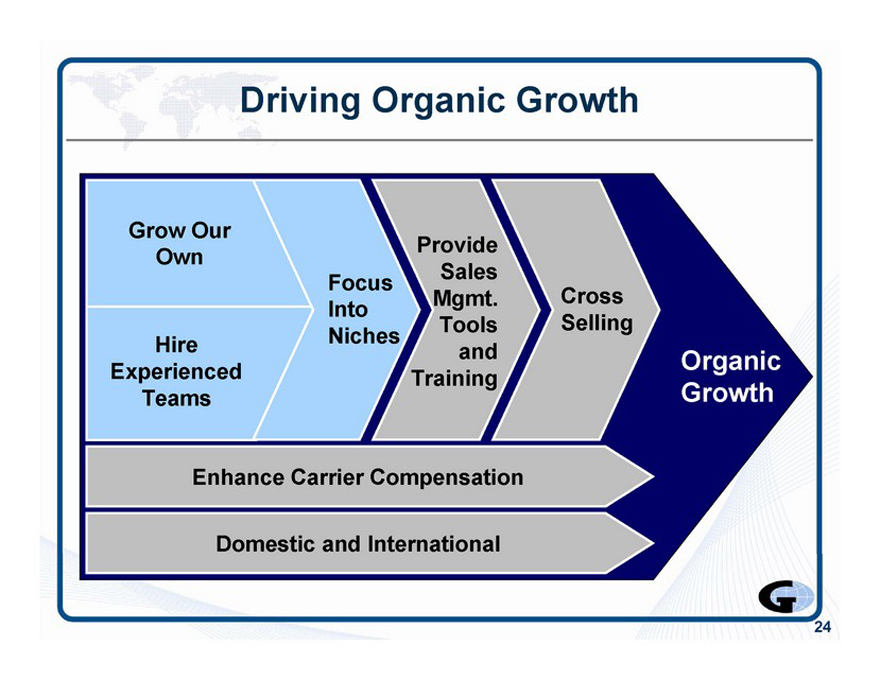
Driving Organic Growth
Grow Our Own
Hire Experienced Teams
Focus Into Niches
Provide Sales Mgmt.
Tools and Training
Cross Selling
Organic Growth
Enhance Carrier Compensation
Domestic and International
24
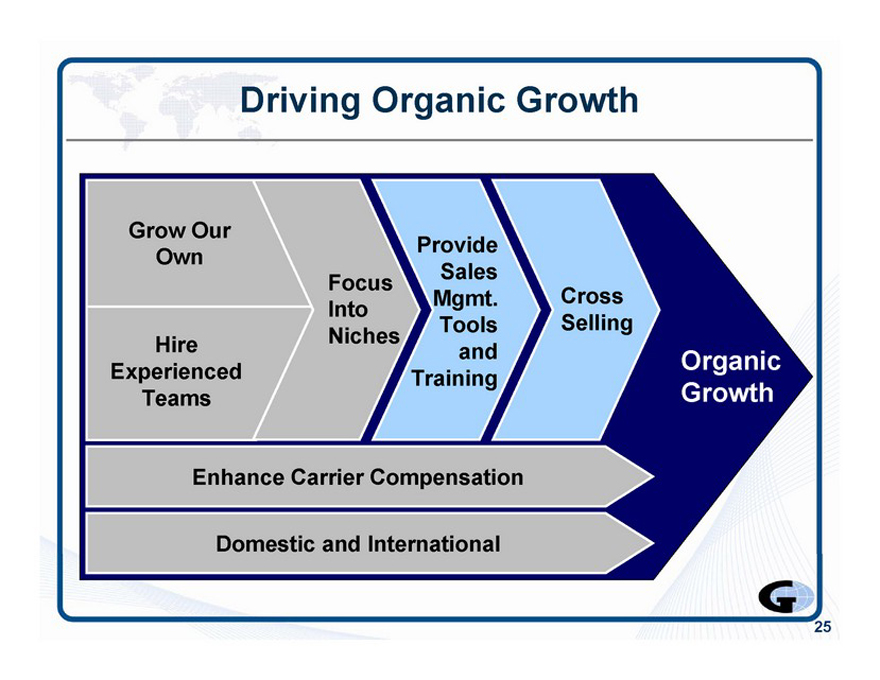
Driving Organic Growth
Grow Our
Provide Own Sales Focus
Mgmt. Cross Into Tools Selling Hire Niches
Experienced and Organic Training
Teams Growth
Enhance Carrier Compensation
Domestic and International
25
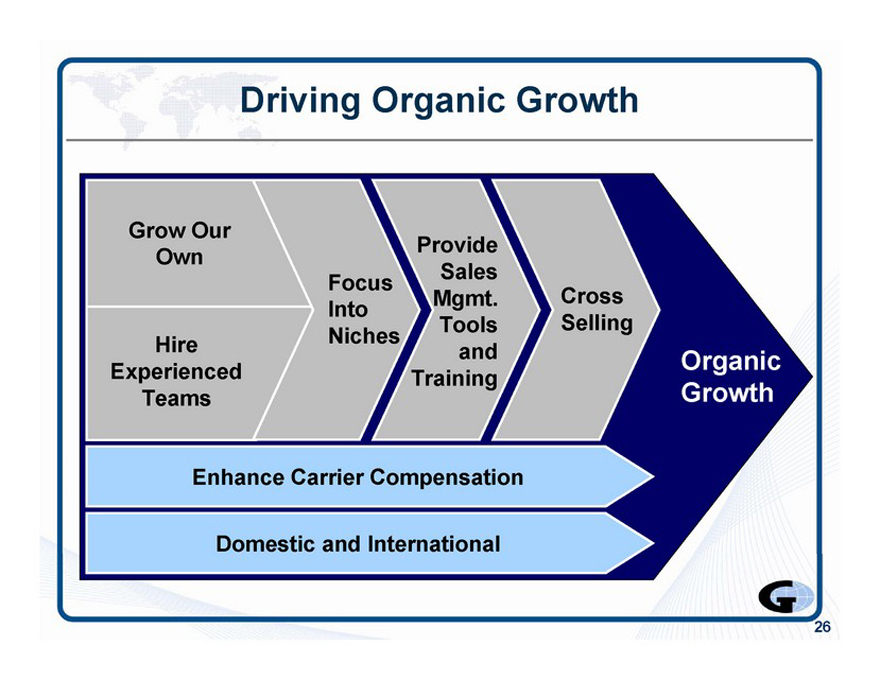
Driving Organic Growth
Grow Our
Provide Own Sales Focus
Mgmt. Cross Into Tools Selling Hire Niches
Experienced and Organic Training
Teams Growth
Enhance Carrier Compensation
Domestic and International
26
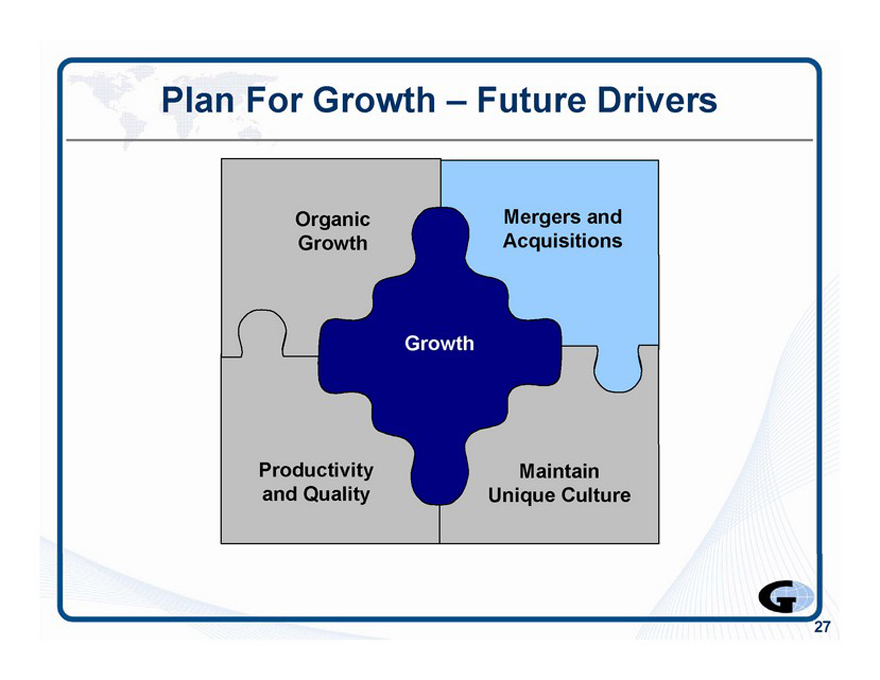
Plan For Growth—Future Drivers
Organic A Growth Mergers and Acquisitions
Growth
Productivity and Quality Maintain W Unique Culture
27
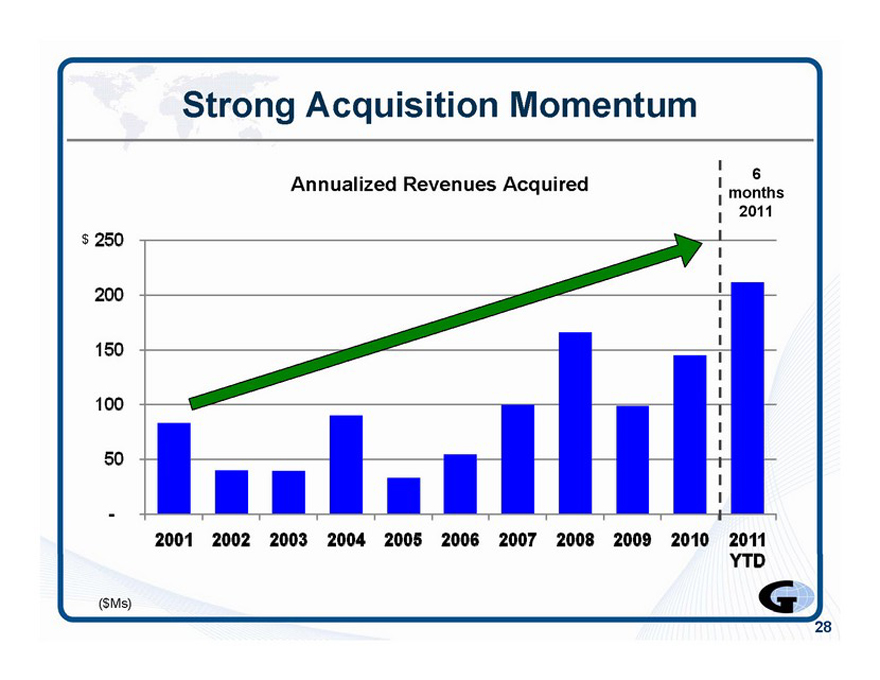
Strong Acquisition Momentum
28
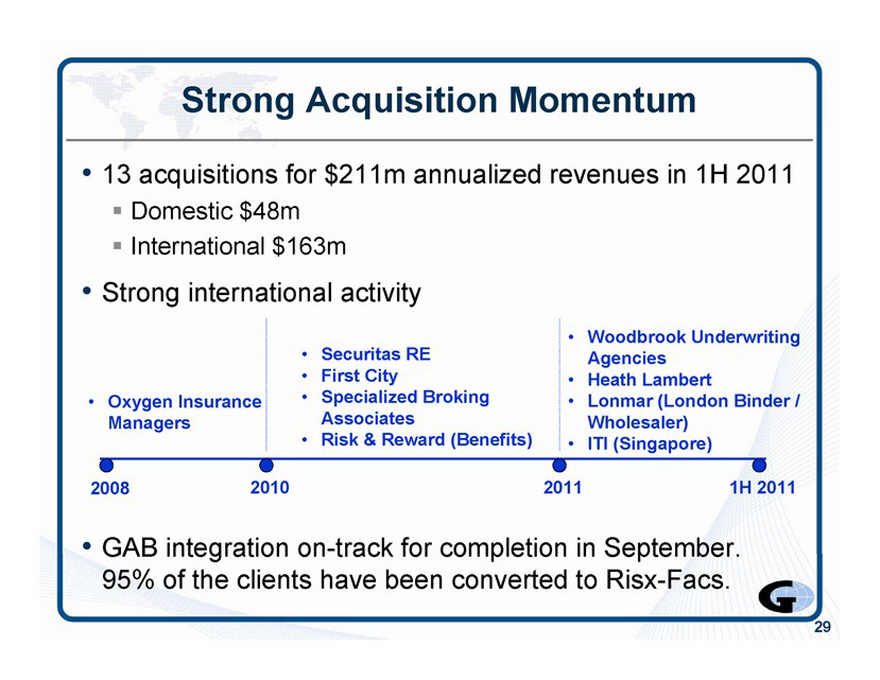
Strong Acquisition Momentum
13 acquisitions for $211m annualized revenues in 1H 2011 ? Domestic $48m International $163m
Strong international activity
• Oxygen Insurance Managers
Securitas RE
First City
Specialized Broking
Associates
Risk & Reward (Benefits)
Woodbrook Underwriting Agencies
Heath Lambert
Lonmar(London Binder / Wholesaler)
ITI (Singapore)
2008
2010
2011
1H 2011
•
GAB integration on-track for completion in September. 95% of the clients have been converted to Risx-Facs.
G
29
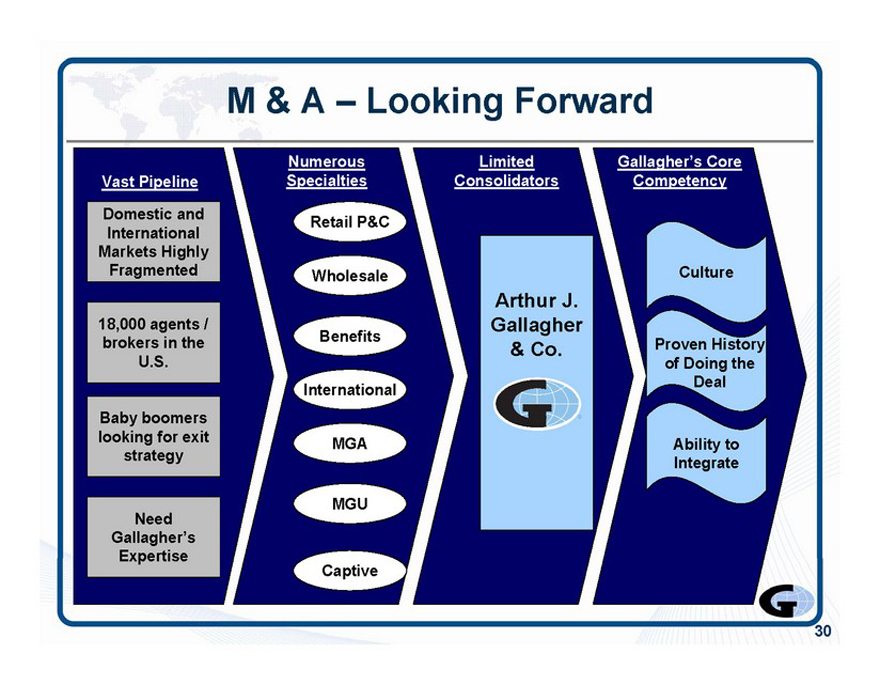
M & A—Looking Forward
Vast Pipeline
Domestic and International Markets Highly Fragmented
18,000 agents / brokers in the U.S.
Baby boomers looking for exit strategy
Need Gallagher’s Expertise
Numerous Specialties
Retail P&C Wholesale Benefits International MGA
MGU
Captive
Limited Consolidators
Arthur J. Gallagher
& Co.
Gallagher’s Core Competency
Culture
Proven History of Doing the Deal
Ability to Integrate
30
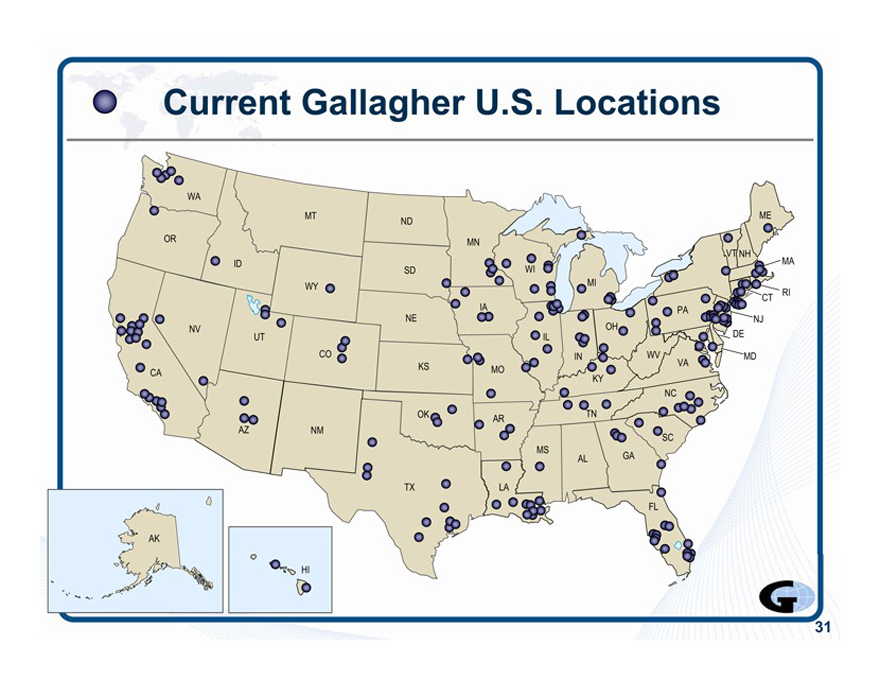
Current Gallagher U.S. Locations
31
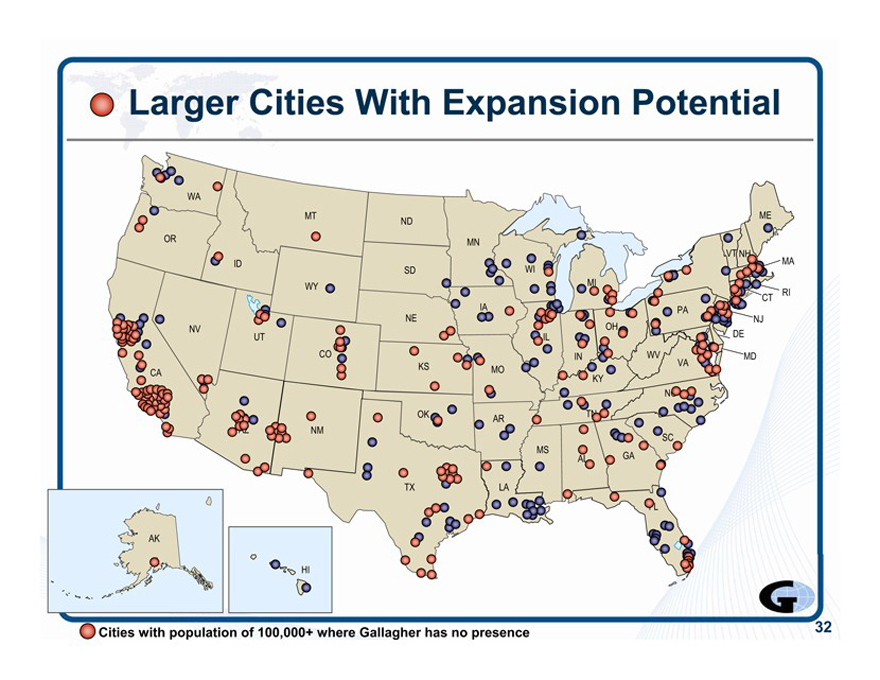
Larger Cities With Expansion Potential
Cities with population of 100,000+ where Gallagher has no presence
32
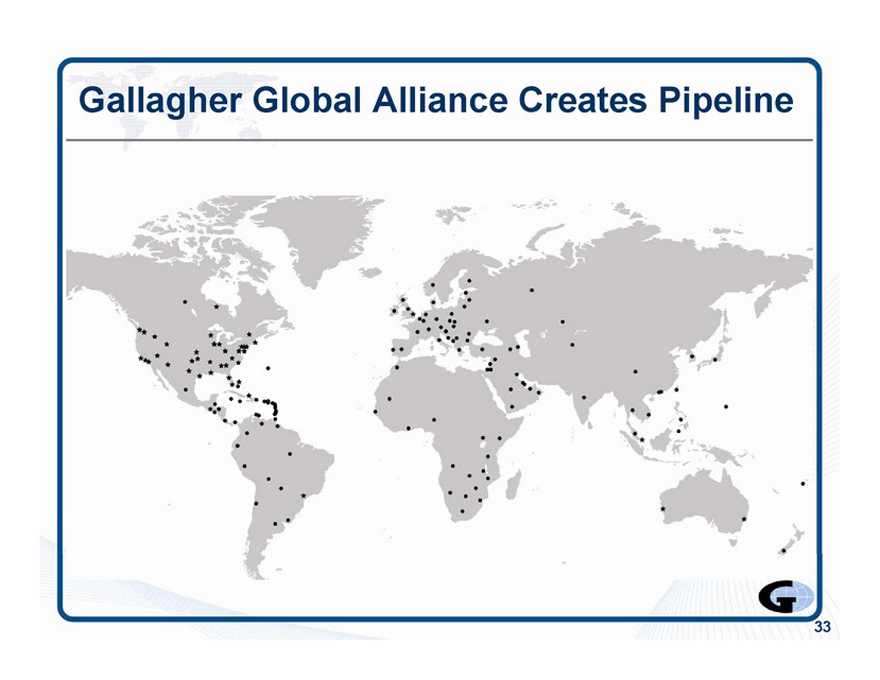
Gallagher Global Alliance Creates Pipeline
33
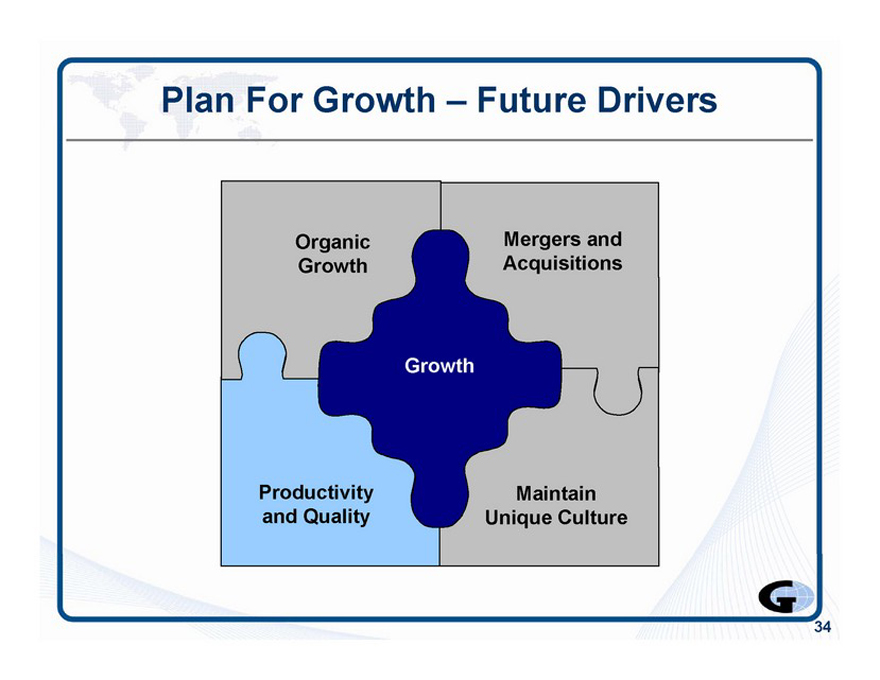
Plan For Growth—Future Drivers
Organic Growth Mergers and Acquisitions
Growth productivity & quality Maintain Unique Culture
34
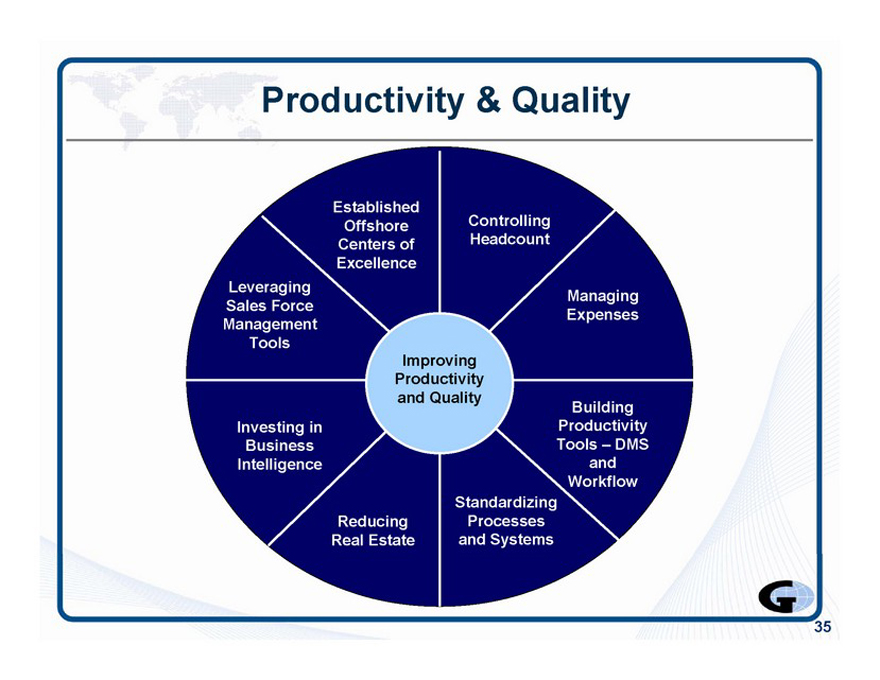
Productivity & Quality
Established
Offshore
Centers of
Excellence
Controlling Headcount
Reducing Real Estate
Leveraging
Sales Force
Management
Tools
Investing in
Business
Intelligence
Improving Productivity
and Quality
Standardizing
Processes and Systems
Managing Expenses
Building
Productivity
Tools—DMS
and
Workflow
35
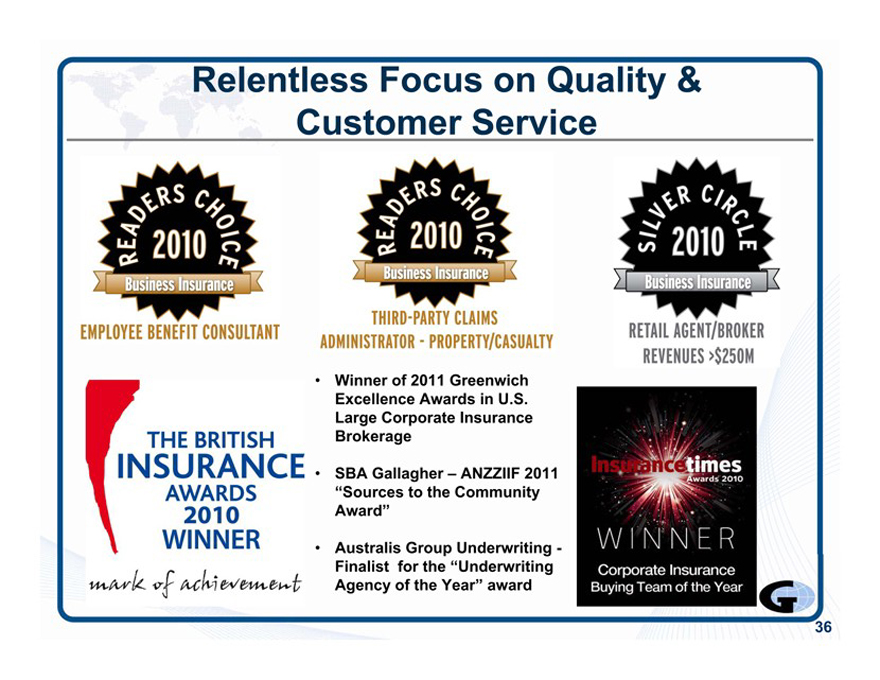
Relentless Focus on Quality & Customer Service
EMPLOYEE BENEFIT CONSULTANT W THE BRITISH
I INSURANCE
1 |
| AWARDS |
1 |
| 2010 |
\ WINNER
&S G
20 0 5
THIRD-PARTY CLAIMS ADMINISTRATOR—PROPERTY/CASUALTY
Winner of 2011 Greenwich Excellence Awards in U.S. Large Corporate Insurance Brokerage
SBA Gallagher -ANZZIIF 2011 “Sources to the Community Award”
Australis Group Underwriting -Finalist for the “Underwriting Agency of the Year” award
*fr* C/^
s 2010 «
RETAIL AGENT/BROKER REVENUES >$250M
36
Plan For Growth—Future Drivers
Organic Growth Mergers and Acquisitions
Growth
Productivity and quality Maintain W Unique Culture
37
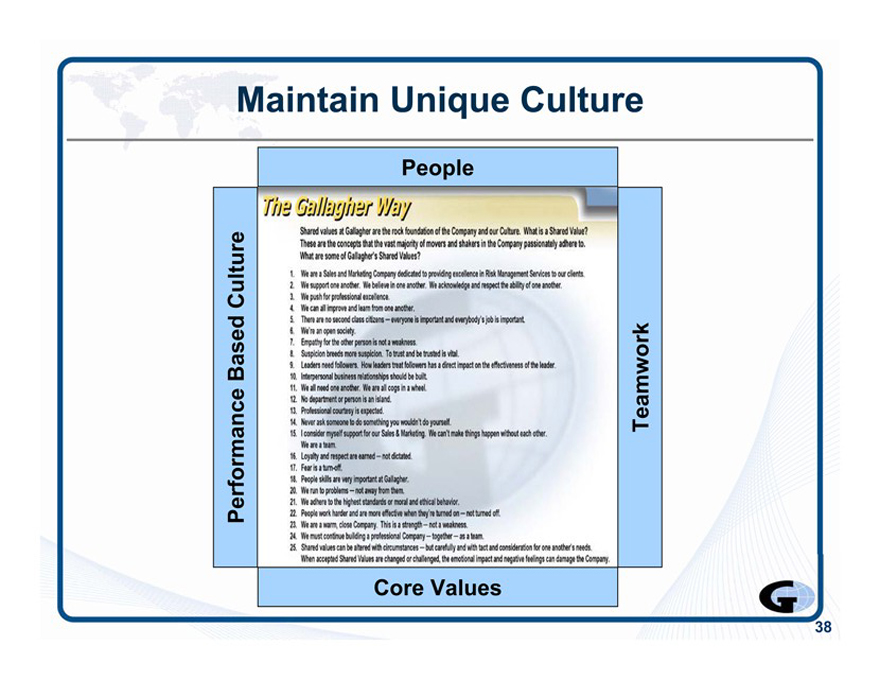
Maintain Unique Culture
People
Core Values
G
38
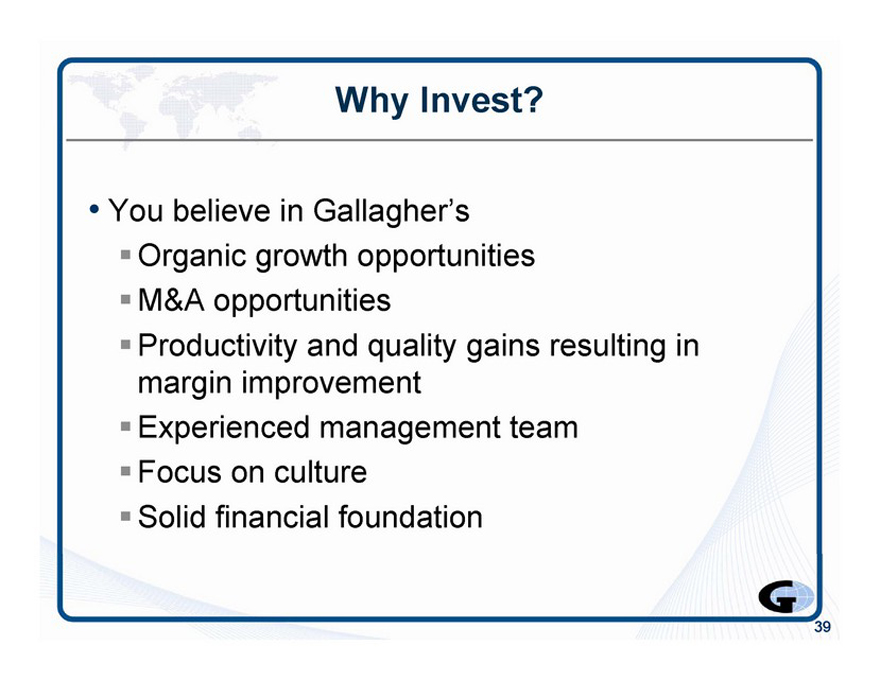
Why Invest?
You believe in Gallagher’s
Organic growth opportunities M&A opportunities
Productivity and quality gains resulting in margin improvement
Experienced management team
Focus on culture
Solid financial foundation
39
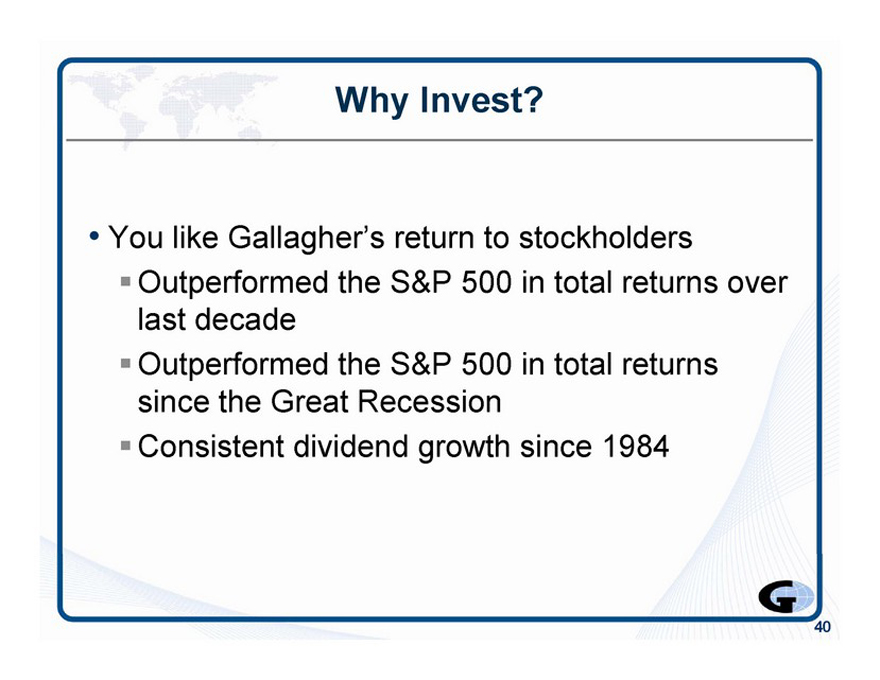
Why Invest?
You like Gallagher’s return to stockholders
Outperformed the S&P 500 in total returns over last decade
Outperformed the S&P 500 in total returns since the Great Recession
?Consistent dividend growth since 1984
40
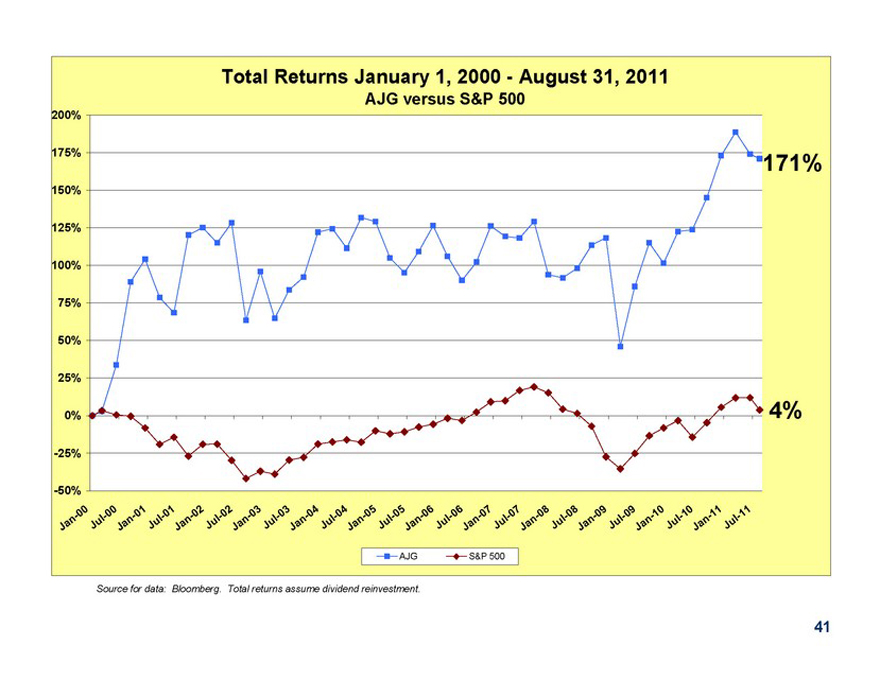
Total Returns January 1, 2000—August 31, 2011
AJG versus S&P 500
200% 175% 150% 125% 100%
75%
50%
25%
0%
-25%
-50%
-AJG ? S&P 500
Source for data: Bloomberg. Total returns assume dividend reinvestment.
41
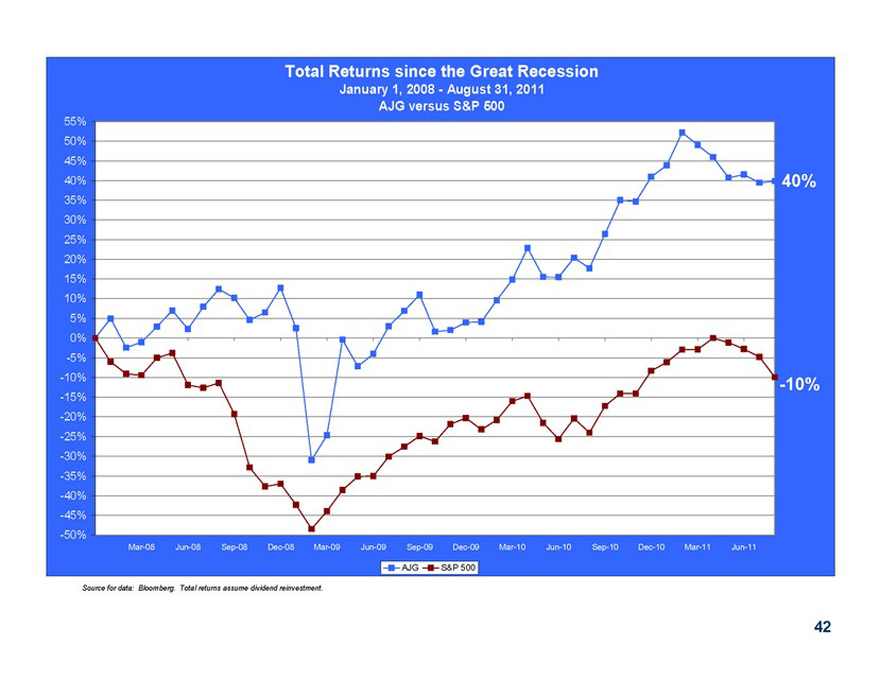
Total Returns since the Great Recession
January 1, 2008—August 31, 2011 AJG versus S&P 500
55%
50%
45%
40%
35%
30%
25%
20%
15%
10%
5%
0%
-5%
-10%
-15%
-20%
-25%
-30%
-35%
-40%
-45%
-50%
-10%
Mar-08 Jun-08 Sep-08 Dec-08 Mar-09 Jun-09 Sep-09 Dec-09 Mar-10 Jun-10 Sep-10 Dec-10 Mar-11 Jun-11
-AJG
?S&P 500
Source for data: Bloomberg. Total returns assume dividend reinvestment.
42
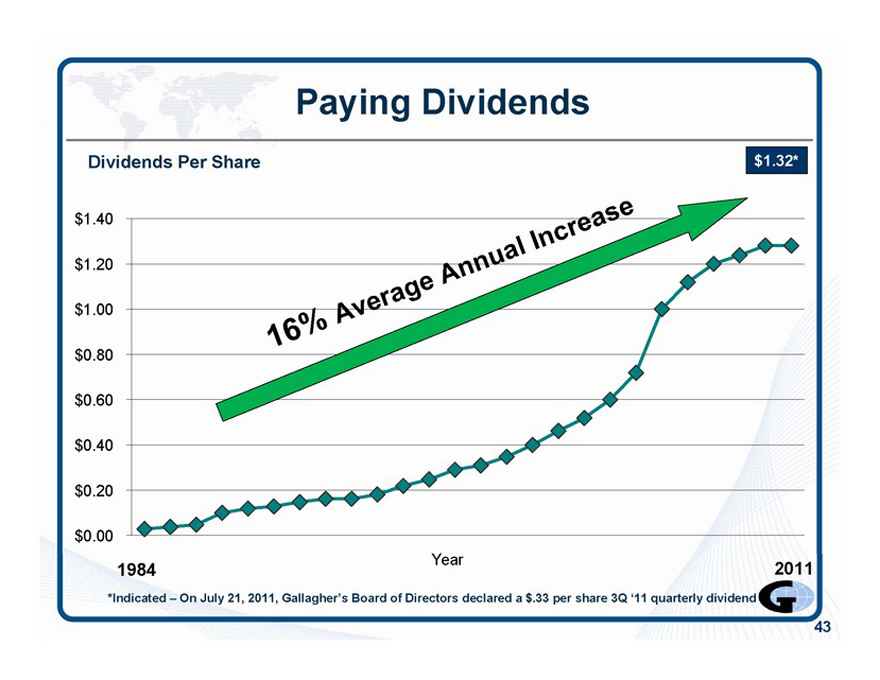
Paying Dividends
Dividends Per Share
$1.32
$1.40
$1.20
$1.00
$0.80
$0.60
$0.40
$0.20
$0.00
Year
1984 ,v~” 2011
Indicated—On July 21, 2011, Gallagher’s Board of Directors declared a $.33 per share 3Q ‘11 quarterly dividend ff^™
43

44
Questions
& Answers

For Additional Information
Marsha Akin
Director—Investor Relations
Marsha_Akin@ajg.com
Phone: 630-285-3501
45
Appendix
46
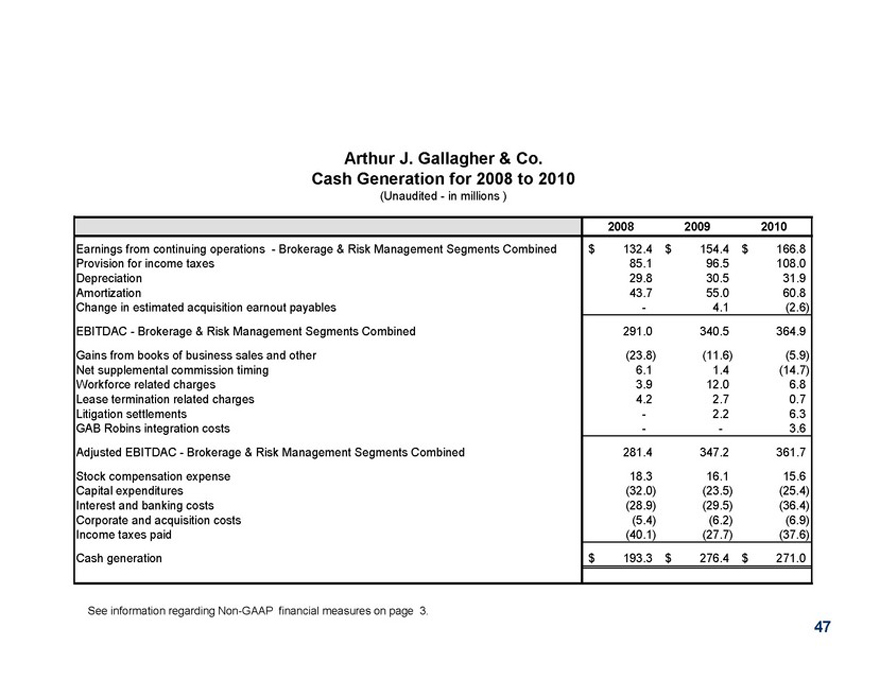
Arthur J. Gallagher & Co. Cash Generation for 2008 to 2010
(Unaudited—in millions )
2008 2009 2010
Earnings from continuing operations—Brokerage & Risk Management Segments Combined
Provision for income taxes
Depreciation
Amortization
Change in estimated acquisition earnout payables
EBITDAC—Brokerage & Risk Management Segments Combined
Gains from books of business sales and other
Net supplemental commission timing
Workforce related charges
Lease termination related charges
Litigation settlements
GAB Robins integration costs
Adjusted EBITDAC—Brokerage & Risk Management Segments Combined
Stock compensation expense Capital expenditures Interest and banking costs Corporate and acquisition costs Income taxes paid
Cash generation $ 132.4 $ 154.4 $ 166.8
85.1 96.5 108.0
29.8 30.5 31.9
43.7 55.0 60.8
4.1 (2.6)
291.0 340.5 364.9
(23.8) (11.6) (5.9)
6.1 1.4 (14.7) 3.9 12.0 6.8
4.2 2.7 0.7 2.2 6.3
3.6
281.4 347.2 361.7
18.3 16.1 15.6
(32.0) (23.5) (25.4) (28.9) (29.5) (36.4)
(5.4) (6.2) (6.9)
(40.1) (27.7) (37.6)
$ 193.3 $ 276.4 $ 271.0
See information regarding Non-GAAP financial measures on page 3.
47