Exhibit 99.2
ARTHUR J. GALLAGHER & CO.
Presented by:
Douglas K. Howell
CFO
Clean Energy Investments
Conference Call
April 11, 2012
Information Regarding Forward-Looking Statements
This presentation contains “forward-looking statements” within the meaning of the Private Securities Litigation Reform Act of 1995. When used in this presentation, the words “anticipates,” “expects,” “believes,” “should,” “could,” “estimates,” “intends,” “plans,” “contemplates” and similar expressions are intended to identify forward-looking statements. Examples of forward-looking statements in this presentation include, but are not limited to, statements in connection with Gallagher’s clean coal investments relating to:
The amount of tax credits expected to be generated by these investments;
Gallagher’s estimates regarding the phase-out feature of IRC Section 45 based upon the price of coal;
Future cash flows that could be generated by these investments, and the expected impact on Gallagher’s earnings, cash flows and stock price;
Assumed annual revenue and earnings growth rates for Gallagher, as well as earnings multiples to be paid on acquisitions;
Gallagher’s future corporate tax rate;
Gallagher’s expected uses of cash generated by these investments (including potential changes to Gallagher’s dividend policy);
The long-term availability and cost-effectiveness of coal as an energy source in the United States and internationally;
The future annual volume of coal expected to be consumed by clean coal plants that license The Chem-ModTM Solution;
The ongoing role of the U.S. government in clean energy development;
The impact of MATS (Mercury and Air Toxics Standards) on utilities’ operations;
Expected future subsidy rates under IRC Section 45;
The probability that utilities using The Chem-ModTM Solution in a clean coal plant will be in compliance with the EPA’s 2014 mercury standard;
The long-term potential of The Chem-ModTM Solution outside the tax-subsidized Section 45 market;
International opportunities for The Chem-ModTM Solution;
Gallagher’s expected date for recouping its investment in Chem-Mod LLC;
Gallagher’s expected ownership levels in the Section 45 tax entities;
Gallagher’s expected role vis-à-vis its operational and investment partners;
Future costs related to these investments (including the cost of moving a plant from one utility to another); and
Gallagher’s evaluation of strategic alternatives related to these investments.
Additionally, this presentation contains a discussion of actions management could take and other factors expected to mitigate the risks related to these investments. There can be no assurance that Gallagher will take any such contemplated actions to mitigate risk, and Gallagher’s risk mitigation efforts may prove ineffective. Important factors that could cause actual results to differ materially from those in the forward-looking statements include the risks set forth on slides 30-44, as well as those set forth in greater detail in Gallagher’s Annual Report on Form 10-K for the fiscal year ended December 31, 2011, under Item 1A, entitled “Risk Factors” (subheading “Risks Relating to our Investments, Debt and Common Stock”).
Presentation Agenda
During the call, management will review and frequently reference the presentation materials and then open the call for questions and answers. Management anticipates total time for the call to be approximately 1.5 hours in duration. Some of the topics management expects to cover include the following:
A pictorial of a clean energy, how it works and plant development – Pages 4 to 9
A simplified description of the clean energy chemistry – Pages 10 to 12
Clean energy investment economics and accounting – Pages 13 to 26
Uses of cash generated by the clean energy investments – Pages 27 to 29
Risks and uncertainties associated with the clean energy investments – Pages 30 to 44
Other frequently asked questions – Pages 45 to 54
Appendix A for phase out models – Pages 56 to 58
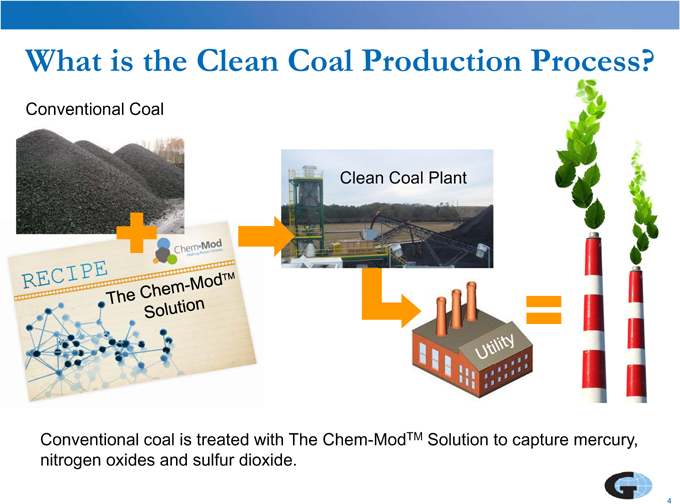
What is the Clean Coal Production Process?
Conventional Coal
Clean Coal Plant
Conventional coal is treated with The Chem-ModTM Solution to capture mercury, nitrogen oxides and sulfur dioxide.
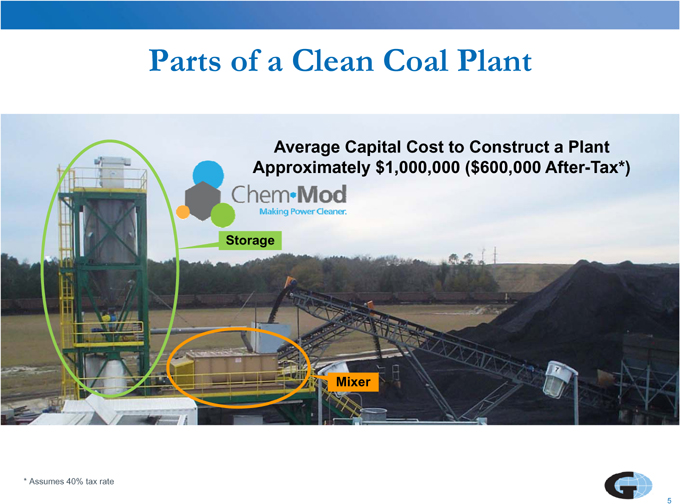
Parts of a Clean Coal Plant
Average Capital Cost to Construct a Plant Approximately $1,000,000 ($600,000 After-Tax*)
Storage
Mixer
* Assumes 40% tax rate
5
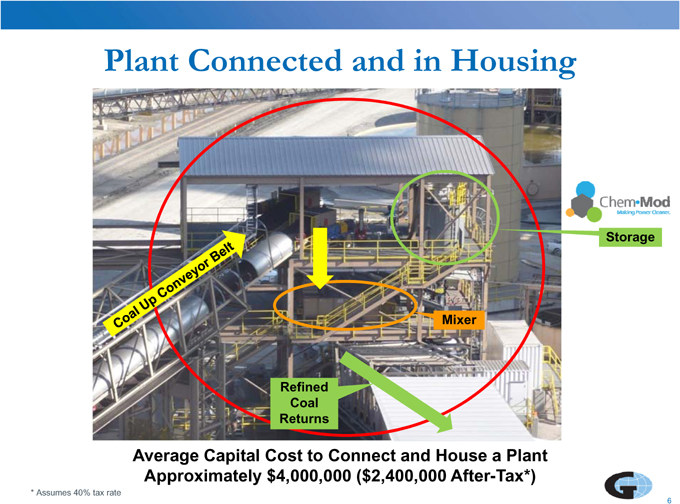
Plant Connected and in Housing
Storage
Mixer
Refined Coal Returns
Average Capital Cost to Connect and House a Plant Approximately $4,000,000 ($2,400,000 After-Tax*)
* Assumes 40% tax rate
6
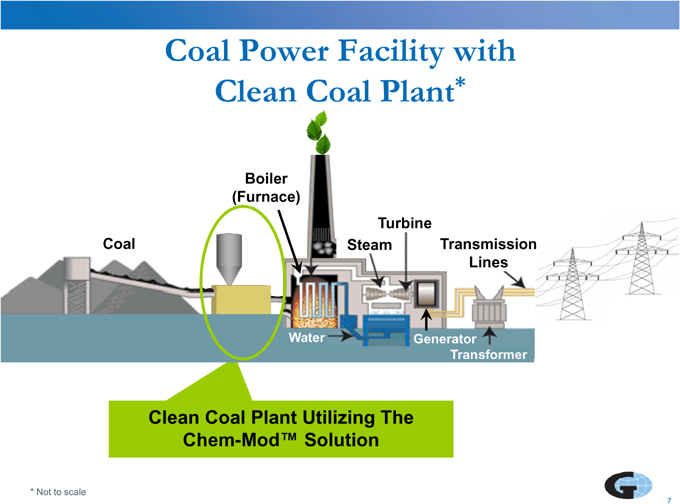
Coal Power Facility with Clean Coal Plant*
Boiler (Furnace)
Turbine
Coal Steam Transmission Lines
Water Generator Transformer
Clean Coal Plant Utilizing The Chem-Mod™ Solution
* Not to scale
7
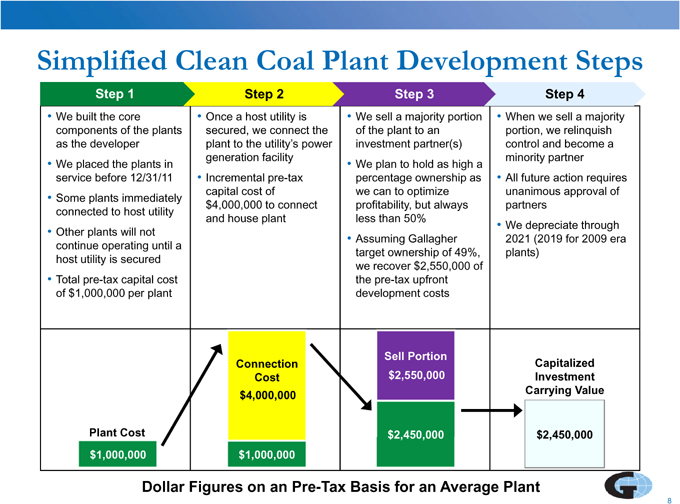
Simplified Clean Coal Plant Development Steps
Step 1 Step 2 Step 3 Step 4
We built the core Once a host utility is We sell a majority portion When we sell a majority components of the plants secured, we connect the of the plant to an portion, we relinquish as the developer plant to the utility’s power investment partner(s) control and become a generation facility minority partner
We placed the plants in We plan to hold as high a service before 12/31/11 Incremental pre-tax percentage ownership as All future action requires capital cost of we can to optimize unanimous approval of
Some plants immediately $4,000,000 to connect profitability, but always partners connected to host utility and house plant less than 50%
We depreciate through
Other plants will not
Assuming Gallagher 2021 (2019 for 2009 era continue operating until a target ownership of 49%, plants) host utility is secured we recover $2,550,000 of
Total pre-tax capital cost the pre-tax upfront of $1,000,000 per plant development costs
Sell Portion
Connection Capitalized Cost $2,550,000 Investment $4,000,000 Carrying Value
Plant Cost $2,450,000 $2,450,000 $1,000,000 $1,000,000
Dollar Figures on an Pre-Tax Basis for an Average Plant
8
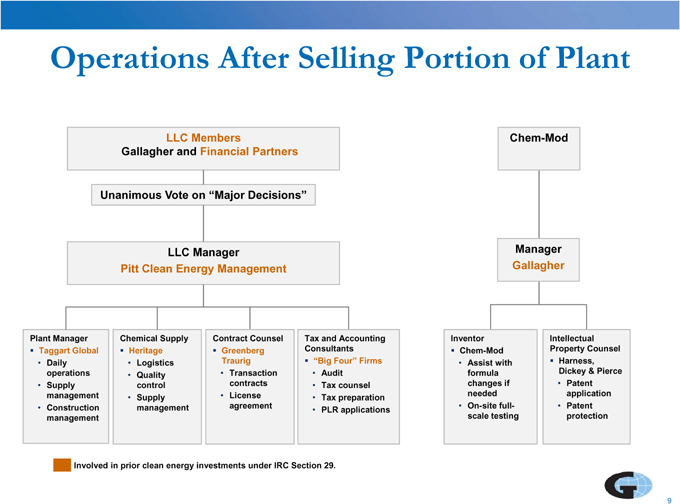
Operations After Selling Portion of Plant
LLC Members Chem-Mod Gallagher and Financial Partners
Unanimous Vote on “Major Decisions”
LLC Manager Manager Pitt Clean Energy Management Gallagher
Plant Manager Chemical Supply Contract Counsel Tax and Accounting Inventor Intellectual Taggart Global Heritage Greenberg Consultants Chem-Mod Property Counsel
Daily Logistics Traurig “Big Four” Firms Assist with Harness, operations Transaction Audit formula Dickey & Pierce
Quality contracts changes if Patent
Supply control Tax counsel needed application management Supply License Tax preparation
Construction management agreement On-site full- Patent
PLR applications management scale testing protection
Involved in prior clean energy investments under IRC Section 29.
9
Simplified Description of The Chem-ModTM Solution Chemistry
The Chem-Mod recipe is a patented combination of dry and wet chemicals
It gets mixed with coal
When the mixture heats up in the boiler, mercury, nitrogen oxides and sulfur dioxide react with the Chem-Mod chemicals
As it cools, a chemical bonding occurs and captures the mercury, etc. and becomes part of the ash rather than released into the air
Laboratory tests must prove that the mixture of coal and chemicals reduces mercury by more than 40% (or, 40% of sulfur dioxide) plus reduces nitrogen oxides by more than 20% to qualify Chem-Mod achieves these levels, and depending on the chemical addition rate, would achieve higher reductions for further environmental remediation
Does not release from ash unless reheated to over 3000 degrees Fahrenheit
This process actually improves the ash – i.e., it is a stronger ash that can be used in making concrete
See the environmental risk factors on page 43 for information regarding risks and uncertainties related to this process.
10
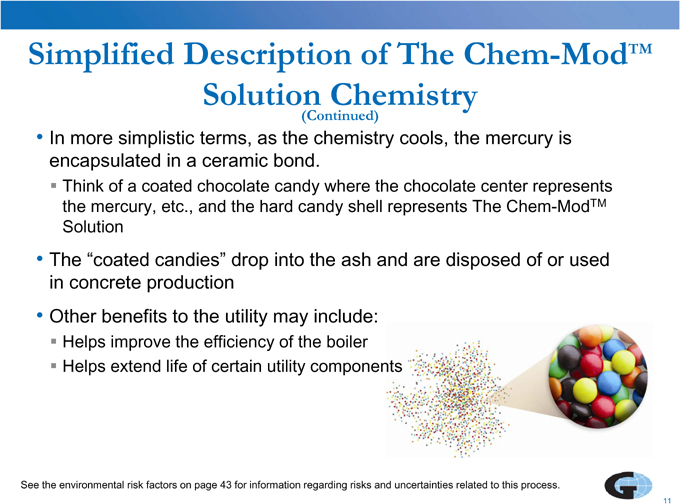
Simplified Description of The Chem-ModTM Solution Chemistry
(Continued)
In more simplistic terms, as the chemistry cools, the mercury is encapsulated in a ceramic bond.
Think of a coated chocolate candy where the chocolate center represents the mercury, etc., and the hard candy shell represents The Chem-ModTM
Solution
The “coated candies” drop into the ash and are disposed of or used in concrete production
Other benefits to the utility may include: Helps improve the efficiency of the boiler
Helps extend life of certain utility components
See the environmental risk factors on page 43 for information regarding risks and uncertainties related to this process.
11
Does a Clean Coal Plant Comply with
New Mercury Standards Using the Chem-ModTM Solution?
Section 45 Mercury capture standards for Clean Coal Plants are governed by tax regulations outlined in the Internal Revenue Code
These standards are different than the mercury capture standards in the EPA’s 2014 MATS regulations
We believe some utilities that are using The Chem-ModTM Solution now comply with the EPA’s 2014 mercury standards
We also believe other utilities that are using The Chem-ModTM Solution may comply with the EPA’s 2014 mercury standards with a slight modification
Although the technology is currently focused on the tax-subsidized Section 45 market, there is significant longer-term potential for The Chem-ModTM Solution in the mercury control market driven by the new environmental regulations
However, without the tax credit subsidy, utilities will need to absorb costs to produce clean coal, or pass increased costs through to customers. Both of these scenarios will likely impact plant profitability and Chem-Mod’s ability to receive royalties for use of the technology
See page 2 for information regarding how risks and uncertainties could impact the forward-looking statements, including implied statements, on this slide.
12
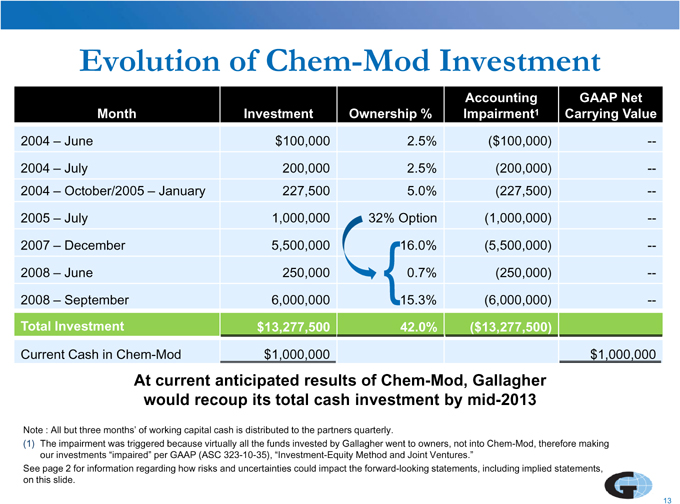
Evolution of Chem-Mod Investment
Accounting GAAP Net Month Investment Ownership % Impairment1 Carrying Value
2004 – June $100,000 2.5% ($100,000) --
2004 – July 200,000 2.5% (200,000) --2004 – October/2005 – January 227,500 5.0% (227,500) --
2005 – July 1,000,000 32% Option (1,000,000) --
2007 – December 5,500,000 16.0% (5,500,000) --2008 – June 250,000 { 0.7% (250,000) --2008 – September 6,000,000 15.3% (6,000,000) --
Total Investment $13,277,500 42.0% ($13,277,500)
Current Cash in Chem-Mod $1,000,000 $1,000,000
At current anticipated results of Chem-Mod, Gallagher would recoup its total cash investment by mid-2013
Note : All but three months’ of working capital cash is distributed to the partners quarterly.
(1) The impairment was triggered because virtually all the funds invested by Gallagher went to owners, not into Chem-Mod, therefore making our investments “impaired” per GAAP (ASC 323-10-35), “Investment-Equity Method and Joint Ventures.” See page 2 for information regarding how risks and uncertainties could impact the forward-looking statements, including implied statements, on this slide.
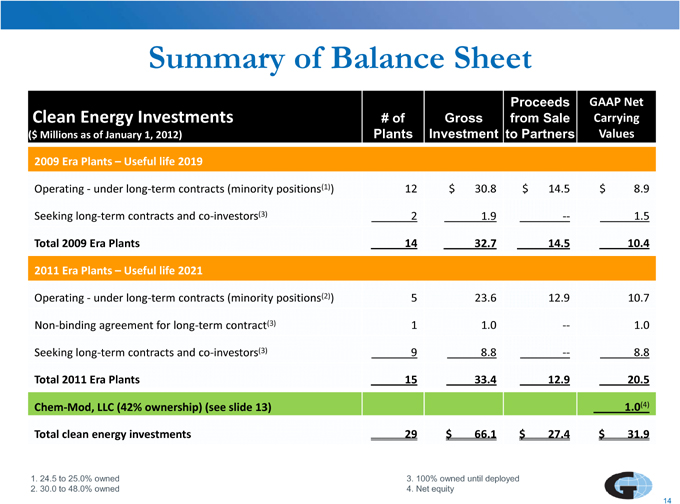
Summary of Balance Sheet
Proceeds GAAP Net
Clean Energy Investments # of Gross from Sale Carrying
($ Millions as of January 1, 2012) Plants Investment to Partners Values 2009 Era Plants – Useful life 2019
Operating under - long- term contracts (minority positions(1)) 12 $ 30.8 $ 14.5 $ 8.9
Seeking long- term contracts and co- investors(3) 2 1.9 _ -- 1.5
Total 2009 Era Plants 14 32.7 14.5 10.4
2011 Era Plants – Useful life 2021
Operating under - long- term contracts (minority positions(2)) 5 23.6 12.9 10.7 Non- binding agreement for long- term contract(3) 1 1.0 -- 1.0 Seeking long- term contracts and co- investors(3) 9 8.8 -- 8.8
Total 2011 Era Plants 15 33.4 12.9 20.5 Chem- Mod, LLC (42% ownership) (see slide 13) 1.0(4) Total clean energy investments 29 $ 66.1 $ 27.4 $ 31.9
1. 24.5 to 25.0% owned 3. 100% owned until deployed
2. 30.0 to 48.0% owned 4. Net equity
14
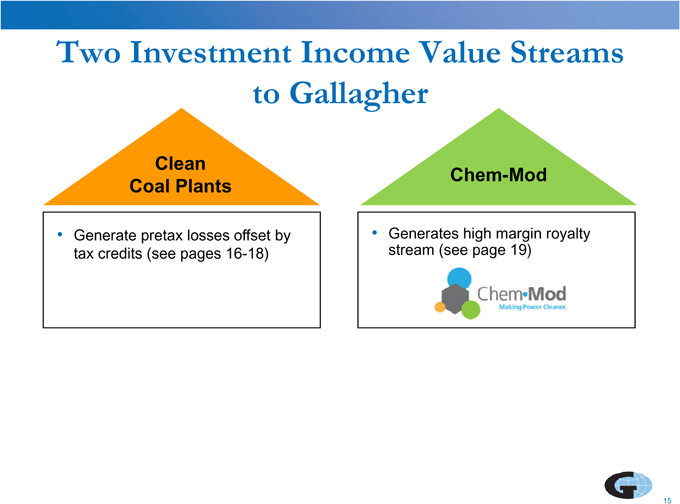
Two Investment Income Value Streams to Gallagher
Clean
Chem-Mod Coal Plants
Generate pretax losses offset by Generates high margin royalty tax credits (see pages 16-18) stream (see page 19)
15
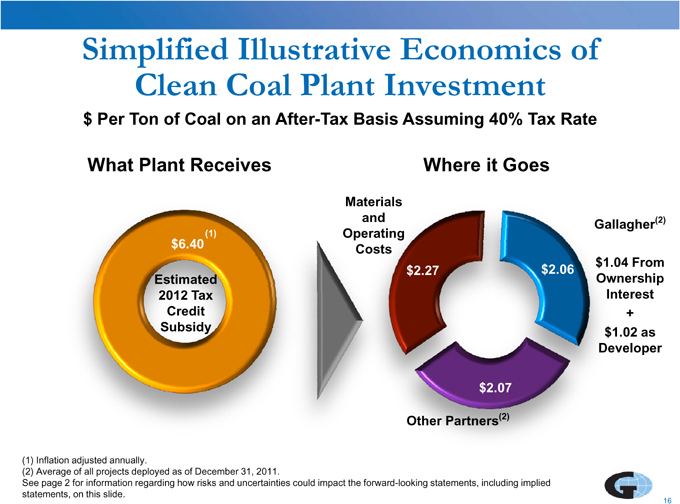
Simplified Illustrative Economics of Clean Coal Plant Investment$ Per Ton of Coal on an After-Tax Basis Assuming 40% Tax RateWhat Plant Receives Where it GoesMaterials and (2) Gallagher $6.40 (1) Operating Costs $1.04 From $2.27 $2.06 Estimated Ownership 2012 Tax Interest Credit + Subsidy $1.02 as Developer$2.07 Other Partners(2)(1) Inflation adjusted annually. (2) Average of all projects deployed as of December 31, 2011. See page 2 for information regarding how risks and uncertainties could impact the forward-looking statements, including implied statements, on this slide. 16
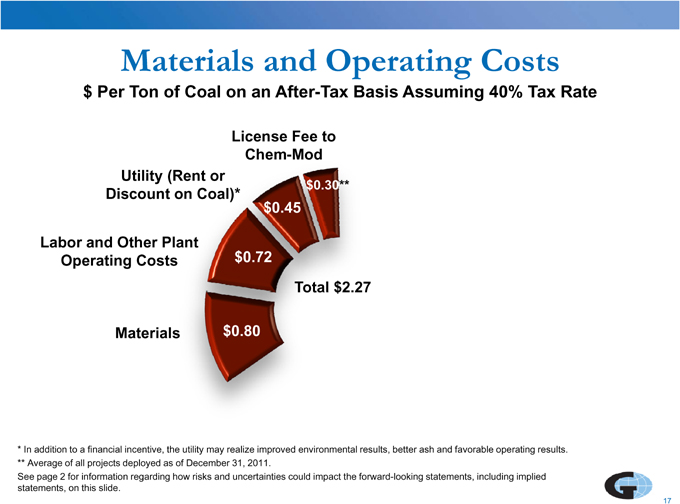
Materials and Operating Costs$ Per Ton of Coal on an After-Tax Basis Assuming 40% Tax RateLicense Fee to Chem-Mod Utility (Rent or $0.30** Discount on Coal)* $0.45 Labor and Other Plant Operating Costs $0.72 Total $2.27Materials $0.80 * In addition to a financial incentive, the utility may realize improved environmental results, better ash and favorable operating results.** Average of all projects deployed as of December 31, 2011.See page 2 for information regarding how risks and uncertainties could impact the forward-looking statements, including implied statements, on this slide.17
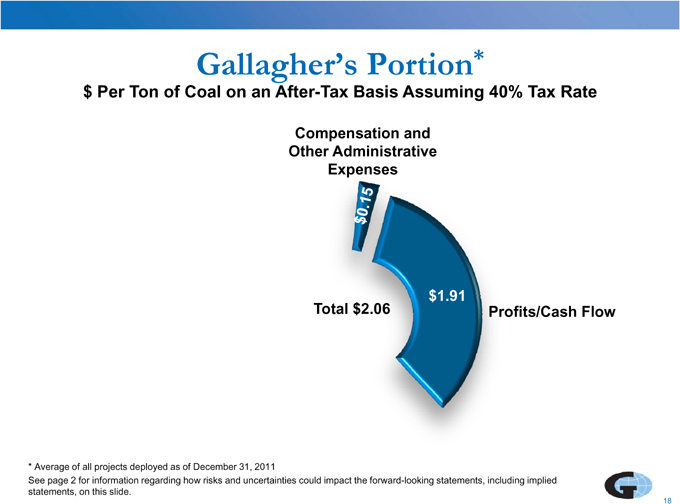
Gallagher’ s Portion*$ Per Ton of Coal on an After-Tax Basis Assuming 40% Tax RateCompensation and Other Administrative Expenses$1.91 Total $2.06 Profits/Cash Flow* Average of all projects deployed as of December 31, 2011See page 2 for information regarding how risks and uncertainties could impact the forward-looking statements, including implied statements, on this slide.18

Simplified Illustrative Economics of Chem-Mod Investment$ Per Ton of Coal on an After-Tax Basis Assuming 40% Tax RateRoyalty Income Where it GoesCompensation, Gallagher 42% of Administrative, Profits/Cash Flow Business Development & Insurance $0.05 $0.11 $0.30 ($0.50 Pretax) $0.14 Other Partners 58% of Profits/Cash FlowSee page 2 for information regarding how risks and uncertainties could impact the forward-looking statements, including implied statements, on this slide.19
Chem-Mod Opportunity• In addition to Gallagher’s clean coal plants, Chem-Mod licenses its clean coal technology to other plants not developed by Gallagher entities 33 other qualified plants owned by other investors Representing coal consumption of approximately 100 to 140 million tons per year• The ultimate annual volume of coal consumption from all clean coal plants under licensing agreements with Chem-Mod could reach approximately 150 to 200 million tons per year• To put these figures into perspective, that volume range represents approximately 15% to 20% of the annual coal consumption for power generation in the U.S.• No revenues have yet been generated based only on mercury controlSee page 2 for information regarding how risks and uncertainties could impact the forward-looking statements, including implied statements, on this slide.20
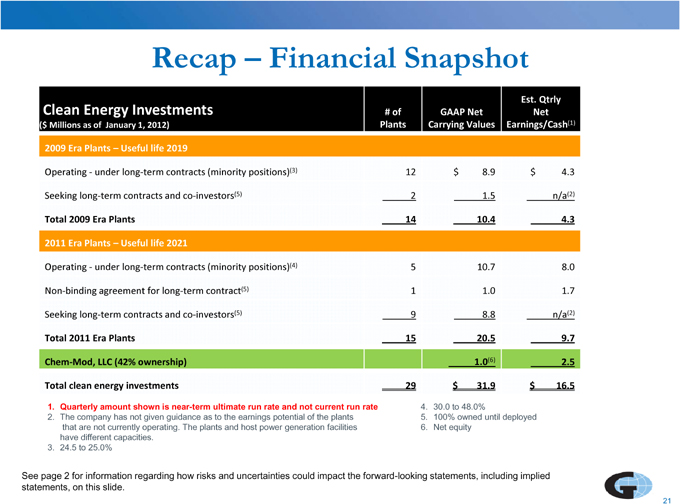
Recap – Financial SnapshotClean Energy Investments Est. Qtrly# of GAAP Net Net ($ Millions as of January 1, 2012) Plants Carrying Values Earnings/Cash(1) 2009 Era Plants – Useful life 2019Operating under - long- term contracts (minority positions)(3) 12 $ 8.9 $ 4.3Seeking long- term contracts and co- investors(5) 2 1.5 n/a(2)Total 2009 Era Plants 14 10.4 4.32011 Era Plants – Useful life 2021Operating under - long- term contracts (minority positions)(4) 5 10.7 8.0 Non- binding agreement for long- term contract(5) 1 1.0 1.7 Seeking long- term contracts and co- investors(5) 9 8.8 n/a(2)Total 2011 Era Plants 15 20.5 9.7 Chem- Mod, LLC (42% ownership) 1.0(6) 2.5 Total clean energy investments 29 $ 31.9 $ 16.51. Quarterly amount shown is near-term ultimate run rate and not current run rate 4. 30.0 to 48.0%2. The company has not given guidance as to the earnings potential of the plants 5. 100% owned until deployed that are not currently operating. The plants and host power generation facilities 6. Net equity have different capacities. 3. 24.5 to 25.0%See page 2 for information regarding how risks and uncertainties could impact the forward-looking statements, including implied statements, on this slide.21
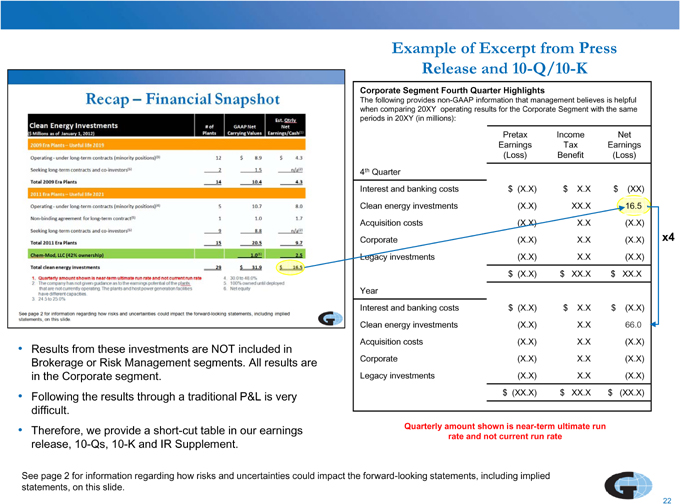
Example of Excerpt from Press Release and 10-Q/10-KCorporate Segment Fourth Quarter HighlightsThe following provides non-GAAP information that management believes is helpful when comparing 20XY operating results for the Corporate Segment with the same periods in 20XY (in millions):Pretax Income Net Earnings Tax Earnings (Loss) Benefit (Loss) 4th Quarter Interest and banking costs $ (X.X) $ X.X $ (XX) Clean energy investments (X.X) XX.X 16.5) Acquisition costs (X.X) X.X (X.X) Corporate (X.X) X.X (X.X) x4 Legacy investments (X.X) X.X (X.X) $ (X.X) $ XX.X $ XX.X) Year Interest and banking costs $ (X.X) $ X.X $ (X.X) Clean energy investments (X.X) X.X 66.0) Acquisition costs (X.X) X.X (X.X)• Results from these investments are NOT included in Brokerage or Risk Management segments. All results are Corporate (X.X) X.X (X.X)in the Corporate segment. Legacy investments (X.X) X.X (X.X)• Following the results through a traditional P&L is very $ (XX.X) $ XX.X $ (XX.X) difficult.• Therefore, we provide a short-cut table in our earnings Quarterly amount shown is near-term ultimate run rate and not current run raterelease, 10-Qs, 10-K and IR Supplement.See page 2 for information regarding how risks and uncertainties could impact the forward-looking statements, including implied statements, on this slide.22
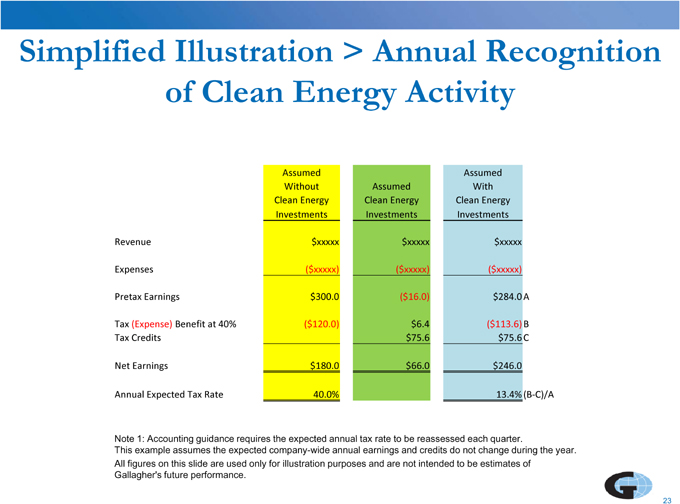
Simplified Illustration > Annual Recognition of Clean Energy ActivityAssumed Assumed Without Assumed With Clean Energy Clean Energy Clean Energy Investments Investments InvestmentsRevenue $xxxxx $xxxxx $xxxxx Expenses ($xxxxx) ($xxxxx) ($xxxxx) Pretax Earnings $300.0 ($16.0) $284.0 ATax (Expense) Benefit at 40% ($120.0) $6.4 ($113.6) B Tax Credits $75.6 $75.6 CNet Earnings $180.0 $66.0 $246.0 Annual Expected Tax Rate 40.0% 13.4% (B- C)/ANote 1: Accounting guidance requires the expected annual tax rate to be reassessed each quarter.This example assumes the expected company-wide annual earnings and credits do not change during the year. All figures on this slide are used only for illustration purposes and are not intended to be estimates of Gallagher’s future performance.23
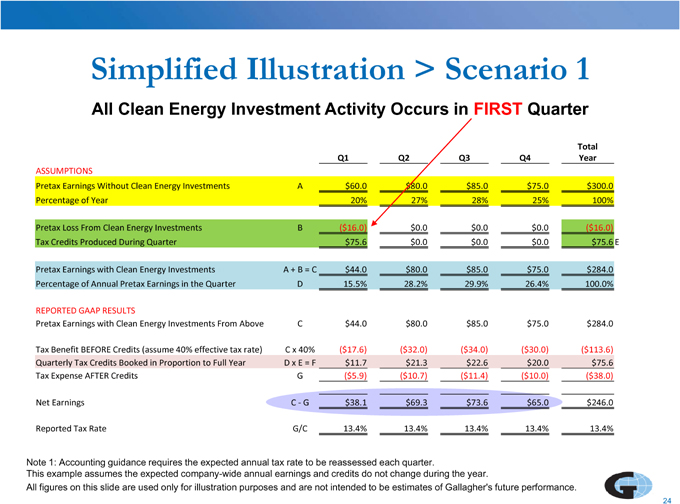
Simplified Illustration > Scenario 1All Clean Energy Investment Activity Occurs in FIRST QuarterTotal Q1 Q2 Q3 Q4 YearASSUMPTIONSPretax Earnings Without Clean Energy Investments A $60.0 $80.0 $85.0 $75.0 $300.0 Percentage of Year 20% 27% 28% 25% 100%Pretax Loss From Clean Energy Investments B ($16.0) $0.0 $0.0 $0.0 ($16.0) Tax Credits Produced During Quarter $75.6 $0.0 $0.0 $0.0 $75.6 EPretax Earnings with Clean Energy Investments A + B = C $44.0 $80.0 $85.0 $75.0 $284.0 Percentage of Annual Pretax Earnings in the Quarter D 15.5% 28.2% 29.9% 26.4% 100.0%REPORTED GAAP RESULTSPretax Earnings with Clean Energy Investments From Above C $44.0 $80.0 $85.0 $75.0 $284.0 Tax Benefit BEFORE Credits (assume 40% effective tax rate) C x 40% ($17.6) ($32.0) ($34.0) ($30.0) ($113.6) Quarterly Tax Credits Booked in Proportion to Full Year D x E = F $11.7 $21.3 $22.6 $20.0 $75.6 Tax Expense AFTER Credits G ($5.9) ($10.7) ($11.4) ($10.0) ($38.0)Net Earnings C G - $38.1 $69.3 $73.6 $65.0 $246.0 Reported Tax Rate G/C 13.4% 13.4% 13.4% 13.4% 13.4%Note 1: Accounting guidance requires the expected annual tax rate to be reassessed each quarter.This example assumes the expected company-wide annual earnings and credits do not change during the year.All figures on this slide are used only for illustration purposes and are not intended to be estimates of Gallagher’s future performance.24
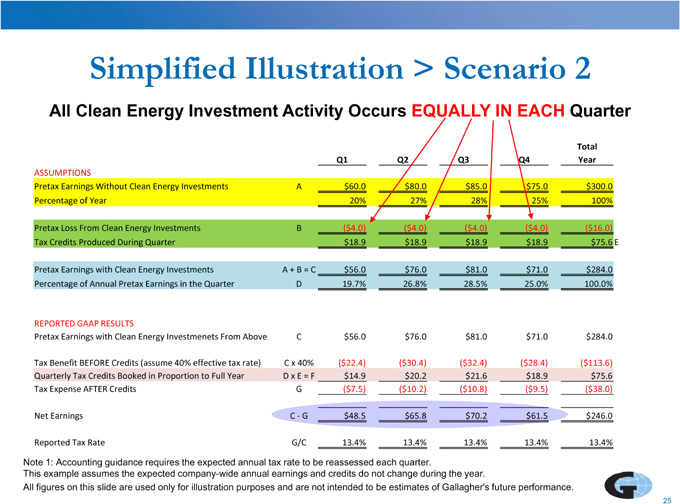
Simplified Illustration > Scenario 2All Clean Energy Investment Activity Occurs EQUALLY IN EACH QuarterTotal Q1 Q2 Q3 Q4 YearASSUMPTIONSPretax Earnings Without Clean Energy Investments A $60.0 $80.0 $85.0 $75.0 $300.0 Percentage of Year 20% 27% 28% 25% 100%Pretax Loss From Clean Energy Investments B ($4.0) ($4.0) ($4.0) ($4.0) ($16.0) Tax Credits Produced During Quarter $18.9 $18.9 $18.9 $18.9 $75.6 EPretax Earnings with Clean Energy Investments A + B = C $56.0 $76.0 $81.0 $71.0 $284.0 Percentage of Annual Pretax Earnings in the Quarter D 19.7% 26.8% 28.5% 25.0% 100.0%REPORTED GAAP RESULTSPretax Earnings with Clean Energy Investmenets From Above C $56.0 $76.0 $81.0 $71.0 $284.0 Tax Benefit BEFORE Credits (assume 40% effective tax rate) C x 40% ($22.4) ($30.4) ($32.4) ($28.4) ($113.6) Quarterly Tax Credits Booked in Proportion to Full Year D x E = F $14.9 $20.2 $21.6 $18.9 $75.6 Tax Expense AFTER Credits G ($7.5) ($10.2) ($10.8) ($9.5) ($38.0)Net Earnings C G - $48.5 $65.8 $70.2 $61.5 $246.0 Reported Tax Rate G/C 13.4% 13.4% 13.4% 13.4% 13.4%Note 1: Accounting guidance requires the expected annual tax rate to be reassessed each quarter.This example assumes the expected company-wide annual earnings and credits do not change during the year.All figures on this slide are used only for illustration purposes and are not intended to be estimates of Gallagher’s future performance.25
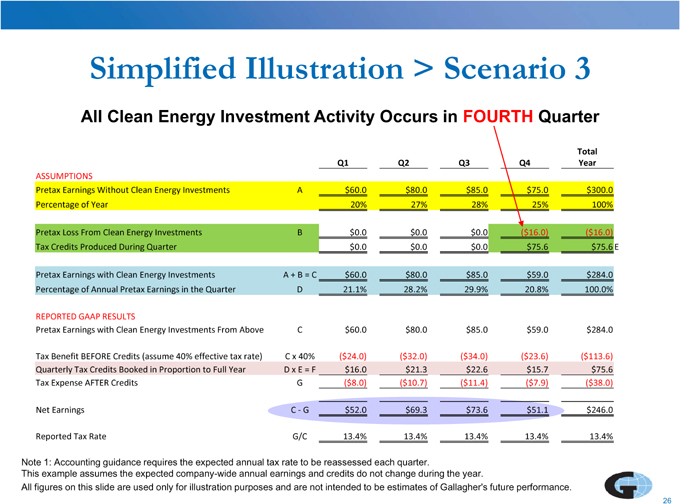
Simplified Illustration > Scenario 3All Clean Energy Investment Activity Occurs in FOURTH QuarterTotal Q1 Q2 Q3 Q4 YearASSUMPTIONSPretax Earnings Without Clean Energy Investments A $60.0 $80.0 $85.0 $75.0 $300.0 Percentage of Year 20% 27% 28% 25% 100%Pretax Loss From Clean Energy Investments B $0.0 $0.0 $0.0 ($16.0) ($16.0) Tax Credits Produced During Quarter $0.0 $0.0 $0.0 $75.6 $75.6 EPretax Earnings with Clean Energy Investments A + B = C $60.0 $80.0 $85.0 $59.0 $284.0 Percentage of Annual Pretax Earnings in the Quarter D 21.1% 28.2% 29.9% 20.8% 100.0%REPORTED GAAP RESULTSPretax Earnings with Clean Energy Investments From Above C $60.0 $80.0 $85.0 $59.0 $284.0 Tax Benefit BEFORE Credits (assume 40% effective tax rate) C x 40% ($24.0) ($32.0) ($34.0) ($23.6) ($113.6) Quarterly Tax Credits Booked in Proportion to Full Year D x E = F $16.0 $21.3 $22.6 $15.7 $75.6 Tax Expense AFTER Credits G ($8.0) ($10.7) ($11.4) ($7.9) ($38.0)Net Earnings C G - $52.0 $69.3 $73.6 $51.1 $246.0 Reported Tax Rate G/C 13.4% 13.4% 13.4% 13.4% 13.4%Note 1: Accounting guidance requires the expected annual tax rate to be reassessed each quarter.This example assumes the expected company-wide annual earnings and credits do not change during the year.All figures on this slide are used only for illustration purposes and are not intended to be estimates of Gallagher’s future performance.26
Intended Uses of Cash Flows Generated by Clean Energy Investments• Gallagher’s clean energy investments will generate cash flows for a limited time (through 2019 for 2009 Era Plants and 2021 for 2011 Era Plants)• Cash intended to be used for: Acquiring insurance brokers and risk managers thereby creating recurring earnings for the company We may also repurchase our shares• These cash flows are not intended to directly impact Gallagher’s dividend. However, as the cash flows are used to purchase recurring brokerage and risk management earnings, those earnings may ultimately influence dividends.See page 2 for information regarding how risks and uncertainties could impact the forward-looking statements, including implied statements, on this slide.27
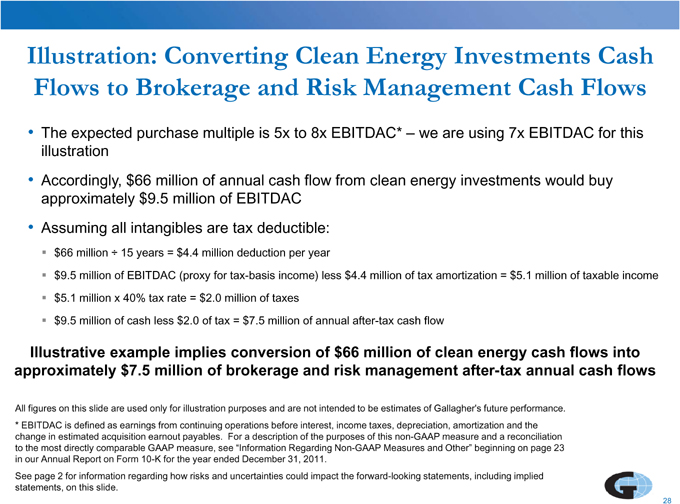
Illustration: Converting Clean Energy Investments Cash Flows to Brokerage and Risk Management Cash Flows• The expected purchase multiple is 5x to 8x EBITDAC* – we are using 7x EBITDAC for this illustration• Accordingly, $66 million of annual cash flow from clean energy investments would buy approximately $9.5 million of EBITDAC• Assuming all intangibles are tax deductible: $66 million ÷ 15 years = $4.4 million deduction per year $9.5 million of EBITDAC (proxy for tax-basis income) less $4.4 million of tax amortization = $5.1 million of taxable income $5.1 million x 40% tax rate = $2.0 million of taxes $9.5 million of cash less $2.0 of tax = $7.5 million of annual after-tax cash flowIllustrative example implies conversion of $66 million of clean energy cash flows into approximately $7.5 million of brokerage and risk management after-tax annual cash flowsAll figures on this slide are used only for illustration purposes and are not intended to be estimates of Gallagher’s future performance.* EBITDAC is defined as earnings from continuing operations before interest, income taxes, depreciation, amortization and the change in estimated acquisition earnout payables. For a description of the purposes of this non-GAAP measure and a reconciliation to the most directly comparable GAAP measure, see “Information Regarding Non-GAAP Measures and Other” beginning on page 23 in our Annual Report on Form 10-K for the year ended December 31, 2011.See page 2 for information regarding how risks and uncertainties could impact the forward-looking statements, including implied statements, on this slide.28
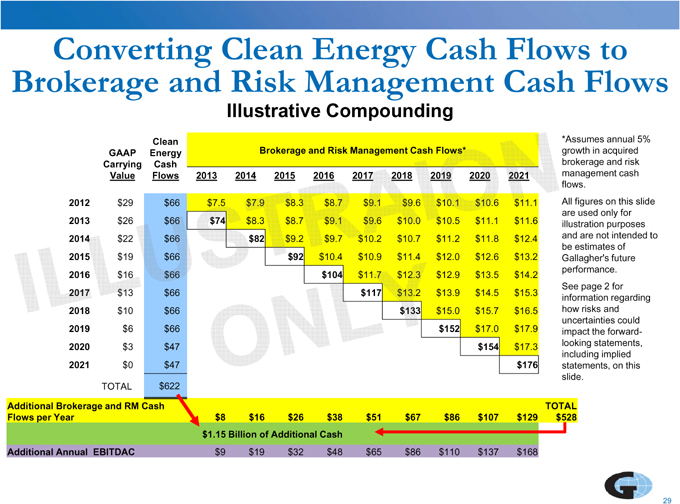
Converting Clean Energy Cash Flows to Brokerage and Risk Management Cash Flows Illustrative CompoundingClean *Assumes annual 5% GAAP Energy Brokerage and Risk Management Cash Flows* growth in acquired Carrying Cash brokerage and risk Value Flows 2013 2014 2015 2016 2017 2018 2019 2020 2021 management cash flows.2012 $29 $66 $7.5 $7.9 $8.3 $8.7 $9.1 $9.6 $10.1 $10.6 $11.1 All figures on this slide 2013 $26 $66 $74 $8.3 $8.7 $9.1 $9.6 $10.0 $10.5 $11.1 $11.6 are used only for illustration purposes 2014 $22 $66 $82 $9.2 $9.7 $10.2 $10.7 $11.2 $11.8 $12.4 and are not intended to be estimates of 2015 $19 $66 $92 $10.4 $10.9 $11.4 $12.0 $12.6 $13.2 Gallagher’s future performance.2016 $16 $66 $104 $11.7 $12.3 $12.9 $13.5 $14.2See page 2 for 2017 $13 $66 $117 $13.2 $13.9 $14.5 $15.3 information regarding 2018 $10 $66 $133 $15.0 $15.7 $16.5 how risks and 2019 $6 $66 $152 $17.0 $17.9 uncertainties could impact the forward-2020 $3 $47 $154 $17.3 looking statements, including implied 2021 $0 $47 $176 statements, on this slide.TOTAL $622Additional Brokerage and RM Cash TOTAL Flows per Year $8 $16 $26 $38 $51 $67 $86 $107 $129 $528 $1.15 Billion of Additional Cash Additional Annual EBITDAC $9 $19 $32 $48 $65 $86 $110 $137 $16829
What Can Go Wrong? – Overview of RisksImportant factors that could cause actual results to differ materially from those described in the forward-looking statements in this presentation include the risks set forth below, as well as those set forth in greater detail in Gallagher’s Annual Report on Form 10-K for the fiscal year ended December 31, 2011, under Item 1A, entitled “Risk Factors” (subheading “Risks Relating to our Investments, Debt and Common Stock”).• Availability of the tax credits• Business risks relating to our financial and operating partners• Operational risks• Demand for coal• Intellectual property risks• Environmental and product liability claims• Key personnel30
Availability of the Tax Credits (I)RISK FACTOR (10-K, page 13): Our ability to claim tax credits under IRC Section 45 depends upon the operations in which we have invested satisfying certain ongoing conditions set forth in IRC Section 45. These include, among others, the emissions reduction, “qualifying technology”, and “placed-in-service” requirements of IRC Section 45, as well as the requirement that at least one of the operations’ owners qualifies as a “producer” of refined coal. While we have received some degree of confirmation from the IRS relating to our ability to claim these tax credits, the IRS could ultimately determine that the operations have not satisfied, or have not continued to satisfy, the conditions set forth in IRC Section 45. Additionally, Congress could modify or repeal IRC Section 45 and remove the tax credits retroactively.Management’s observations regarding possible mitigation alternatives:• Based on our communications with the IRS, we believe our operations satisfy IRC Section 45 and qualify for tax credits We have received 3 Private Letter Rulings (PLRs) covering 8 plants We are in the process of applying for 2 additional PLRs covering 5 plants• However, there is nothing we can do to mitigate the risk that the IRS could write new regulations that would reduce the availability of the credits or that Congress could modify or repeal the tax credits retroactively• If Congress reduces the corporate tax rate, thereby limiting our use of credits, we may be able to sell additional portions of our ownership stake in the LLCs to reduce the tax credits we receive to the level we can use See page 2 for information regarding how risks and uncertainties could impact the forward-looking statements, including implied statements, on this slide.31
Availability of the Tax Credits (II)RISK FACTOR (10-K, page 14): IRC Section 45 contains phase-out provisions based upon the market price of coal, such that, if the price of coal rises to specified levels, we could lose some or all of the tax credits we expect to receive from these investments. Management’s observations regarding possible mitigation alternatives:• There is nothing we can do to control the risk that the price of coal will rise high enough to trigger the phase-out provisions of IRC Section 45• We have and will continue to monitor the factors that would lead to a phase-out. For 2011 and 2012, the threshold was not/is not close to triggering a phase-outSee page 2 for information regarding how risks and uncertainties could impact the forward-looking statements, including implied statements, on this slide.32
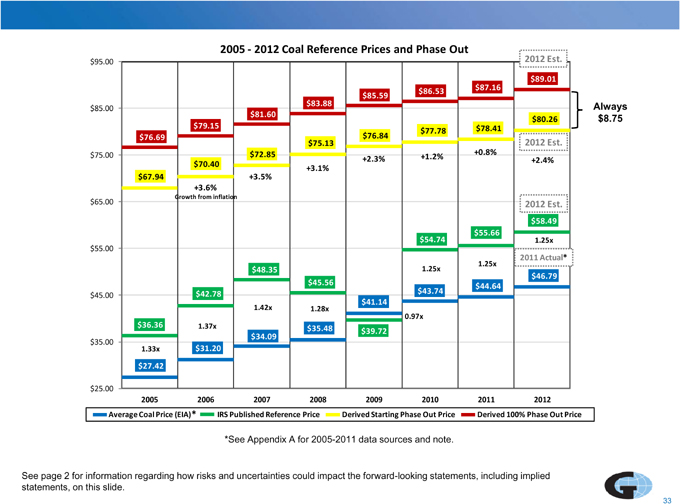
2005 2012 - Coal Reference Prices and Phase Out$95.00 2012 Est.$89.01 $87.16 $86.53 $85.59 $83.88 Alwa Always $85.00$81.60 $8.75 $8.75$79.15 $80.26 $77.78 $78.41 $76.69 $76.84 $75.13 2012 Est.$75.00 $72.85 +0.8%+2.3% +1.2%+2.4%$70.40 +3.1%$67.94 +3.5%+3.6%Growth from inflation$65.00 2012 Est.$58.49 $54.74 $55.66 1.25x$55.001.25x 2011 Actual*$48.35 1.25x$45.56 $46.79 $44.64 $42.78 $43.74 $45.00 $41.14 1.42x 1.28x0.97x$36.36 1.37x$35.48 $39.72 $34.09 $35.00 $31.20 1.33x$27.42 $25.002005 2006 2007 2008 2009 2010 2011 2012Average Coal Price (EIA)* IRS Published Reference Price Derived Starting Phase Out Price Derived 100% Phase Out Price*See Appendix A for 2005-2011 data sources and note.See page 2 for information regarding how risks and uncertainties could impact the forward-looking statements, including implied statements, on this slide.33
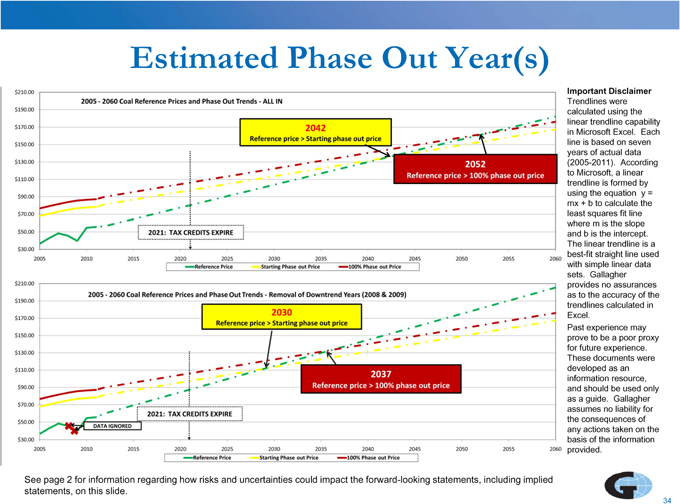
Estimated Phase Out Year(s)Important DisclaimerTrendlines were calculated using the linear trendline capability in Microsoft Excel. Each line is based on seven years of actual data (2005-2011). According to Microsoft, a linear trendline is formed by using the equation y = mx + b to calculate the least squares fit line where m is the slope and b is the intercept. The linear trendline is a best-fit straight line used with simple linear data sets. Gallagher provides no assurances as to the accuracy of the trendlines calculated in Excel.Past experience may prove to be a poor proxy for future experience. These documents were developed as an information resource, and should be used only as a guide. Gallagher assumes no liability for the consequences of any actions taken on the basis of the information provided. See page 2 for information regarding how risks and uncertainties could impact the forward-looking statements, including implied statements, on this slide.34
Business Risks Relating to Our Financial and Operating Partners RISK FACTOR (10-K, pages 13-14): We are working to negotiate and finalize arrangements with potential co-investors for the purchase of equity stakes in one or more of the operations that are not currently producing refined coal. If no satisfactory arrangements can be reached with these potential co-investors, or if in the future any one of our co-investors leaves a project, we could have difficulty finding replacements in a timely manner. We could also be exposed to risk due to our lack of control over the operations if future developments, for example a regulatory change affecting public and private companies differently, caused our interests and those of our co-investors to diverge. Finally, our partners responsible for operation and management could fail to run the operations in compliance with IRC Section 45. If any of these developments occur, we may unable to take full advantage of the tax credits.Management’s observations regarding possible mitigation alternatives:• We work with reputable, financially stable, credit worthy partners and document these relationships carefully• Our partners have limited rights to leave the projects• We require our partners that are responsible for operation and management to carry insurance which meets or exceeds the requirements of the host utilities• We have been working with many of our partners for over a decade (see page 9)See page 2 for information regarding how risks and uncertainties could impact the forward-looking statements, including implied statements, on this slide.35
Operational RisksRISK FACTOR (10-K, page 14): Chem-Mod’s multi-pollutant reduction technologies require chemicals that may not be readily available in the marketplace at reasonable costs. Utilities that use the technologies could be idled for various reasons, including operational or environmental problems at the plants or in the boilers, disruptions in the supply of coal, revocation of their Chem-Mod technologies environmental permits, labor strikes, force majeure events such as hurricanes, or terrorist attacks, any of which could halt or impede the operations. Long-term operations using Chem-Mod’s multi-pollutant reduction technologies could also lead to unforeseen technical or other problems not evident in the short or medium-term. In the event of any such operational problems, we may not be able to take full advantage of the tax credits.Management’s observations regarding possible mitigation alternatives:• We use multiple suppliers for the same products• We anticipate negotiating additional long-term supply contracts• We anticipate investigating the use of different, currently non-patented chemicals that produce the same results as the current chemicals used• We may have the ability to move operations from one power generation facility to another, if necessary, if operational problems occur at a particular power generation facilitySee page 2 for information regarding how risks and uncertainties could impact the forward-looking statements, including implied statements, on this slide.36
Demand for CoalRISK FACTOR (10-K, page 14): Market demand for coal. If the price of natural gas and/or oil declines relative to that of coal, some utilities may choose to burn natural gas or oil instead of coal. Market demand for coal may also decline as a result of an economic slowdown and a corresponding decline in the use of electricity. If utilities burn less coal or eliminate coal in the production of electricity, the availability of the tax credits would also be reduced.RISK FACTOR (10-K, page 14): Environmental concerns regarding coal. Environmental concerns about greenhouse gases, toxic wastewater discharges and the potential hazardous nature of coal combustion waste could lead to regulations that discourage the burning of coal. For example, such regulations could mandate that electric power generating companies purchase a minimum amount of power from renewable energy sources such as wind, hydroelectric, solar and geothermal. This could result in utilities burning less coal, which would reduce the generation of tax credits.Management’s observations regarding possible mitigation alternatives:• There is little we can do to mitigate the risk that power plants’ use of coal may decline because of market forces (e.g., natural gas prices decline or the economy slumps), or environmental concerns or regulations that limit their ability to burn coal• Coal generates approximately 45% of electricity produced in the U.S. and if any facilities shut down, we have a large market into which we may be able to move the clean coal plant(s)• Domestic coal reserves are vast enough to last for over 200 years• Coal should continue to be a cost effective, long-term viable energy source through the life of this programSee page 2 for information regarding how risks and uncertainties could impact the forward-looking statements, including implied statements, on this slide.37
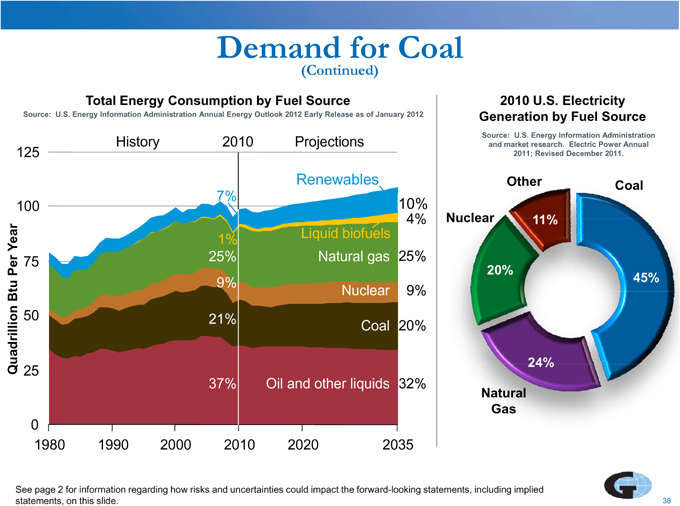
Demand for Coal(Continued)Total Energy Consumption by Fuel Source 2010 U.S. Electricity Source: U.S. Energy Information Administration Annual Energy Outlook 2012 Early Release as of January 2012 Generation by Fuel Source History 2010 Projections Source: U.S. Energy Information Administration and market research. Electric Power Annual 125 Renewables 2011; Revised December 2011.(excluding Renewables liquid biofuels) OtherCoal7%100 10% 11%4% Nuclear 11% Year 1% Liquid biofuels 25% Natural gas 25% 75Per 20% u 9% 45% Bt Nuclear 9%50 21% uadrillion Coal 20%24% Q 25 37% Oil and other liquids 32%Natural Gas01980 1990 2000 2010 2020 2035See page 2 for information regarding how risks and uncertainties could impact the forward-looking statements, including implied statements, on this slide. 38
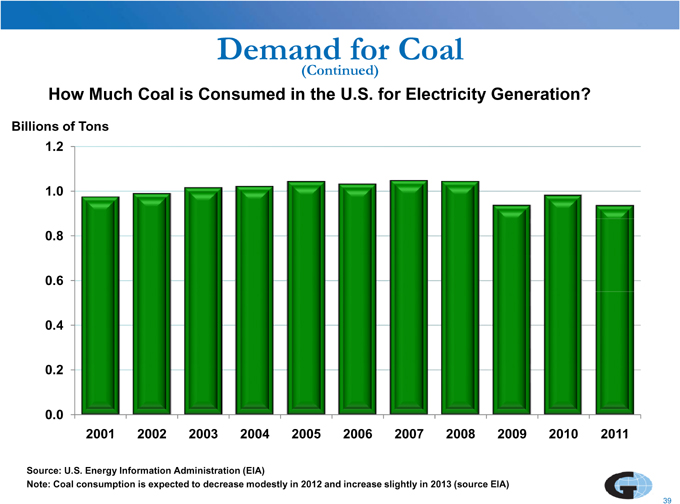
Demand for Coal(Continued)How Much Coal is Consumed in the U.S. for Electricity Generation?Billions of Tons 1.21.0 0.8 0.6 0.4 0.20.02001 2002 2003 2004 2005 2006 2007 2008 2009 2010 2011Source: U.S. Energy Information Administration (EIA)Note: Coal consumption is expected to decrease modestly in 2012 and increase slightly in 2013 (source EIA)39

Demand for Coal(Continued)Electricity from Coal vs. Natural Gas • The U.S. is home to the largest recoverable coal reserves in the world (200+ years based on current consumption levels)• According to the latest government estimates, the share of electricity generation in the U.S. from coal is expected to decrease by 2035• However, the growing demand for electricity is expected to lead to an increase in the actual amount of coal consumed• Although some natural gas facilities are more efficient than coal facilities at generating electricity, the fuel cost of generating one kilowatt-hour of electricity from natural gas generally is higher than that of coal• In addition, coal prices have historically been much less volatile than those of natural gas due, in large part, to the existence of long-term coal supply contracts• Scientists are working on various emissions control technologies to improve the long-term environmental impact of burning coalSource: U.S. Energy Information AdministrationSee page 2 for information regarding how risks and uncertainties could impact the forward-looking statements, including implied statements, on this slide.40
Demand for Coal(Continued)If utilities stop burning coal, it is anticipated that our existing partners will want to move the Section 45 clean coal production plant to a different utility to garner the remaining potential tax benefits.• There would be some “leasehold improvements” left on the site The remaining net book value would be written off, but this is expected to be minimal• There would be tear down, reclamation and transportation costs estimated to be $0.5 to $1.5 million (Gallagher’s commitment would be proportional to our ownership percentage)• There would be new permanent installation costs estimated to be approximately $4.0 million for the average relocation (Gallagher’s commitment would be proportional to our ownership percentage)See page 2 for information regarding how risks and uncertainties could impact the forward-looking statements, including implied statements, on this slide.41
Intellectual Property RisksRISK FACTOR (10-K, page 14): Other companies may make claims of intellectual property infringement with respect to The Chem-Mod™ Solution. Such intellectual property claims, with or without merit, could require that Chem-Mod (or we and our partners) obtain a license to use the intellectual property, which might not be obtainable on favorable terms, if at all. If Chem-Mod (or we and our partners) cannot defend such claims or obtain necessary licenses on reasonable terms, the operations may be precluded from using The Chem-Mod™ Solution.Management’s observations regarding possible mitigation alternatives:• While we believe The Chem-ModTM Solution does not infringe any other company’s intellectual property, there is little we can do to mitigate the risk that other companies may make claims of intellectual property infringement with respect to The Chem-ModTM Solution• Chem-Mod has patent infringement insurance that partially mitigates financial exposuresSee page 2 for information regarding how risks and uncertainties could impact the forward-looking statements, including implied statements, on this slide.42
Environmental and Product Liability ClaimsRISK FACTOR (10-K, page 14): The construction and operation of the IRC Section 45 operations are subject to Federal, state and local laws, regulations and potential liabilities arising under or relating to the protection or preservation of the environment, natural resources and human health and safety. Such laws and regulations generally require the operations and/or the utilities at which the operations are located to obtain and comply with various environmental registrations, licenses, permits, inspections and other approvals. Such laws and regulations also impose liability, without regard to fault or the legality of a party’s conduct, on certain entities that are considered to have contributed to, or are otherwise involved in, the release or threatened release of hazardous substances into the environment. Such hazardous substances could be released as a result of burning refined coal produced using The Chem-Mod™ Solution in a number of ways, including air emissions, waste water, and byproducts such as fly ash. One party may, under certain circumstances, be required to bear more than its share or the entire share of investigation and cleanup costs at a site if payments or participation cannot be obtained from other responsible parties. By using The Chem Mod™ Solution at locations owned and operated by others, we and our partners may be exposed to the risk of becoming liable for environmental damage we may have had little, if any, involvement in creating. Such risk remains even after production ceases at an operation to the extent the environmental damage can be traced to the types of chemicals or compounds used or operations conducted in connection with The Chem-Mod™ Solution. For example, we and our partners could face the risk of product and environmental liability claims related to concrete incorporating fly ash produced using The Chem-Mod™ Solution. No assurances can be given that contractual arrangements and precautions taken to ensure assumption of these risks by facility owners or operators will result in that facility owner or operator accepting full responsibility for any environmental damage. It is also not uncommon for private claims by third parties alleging contamination to also include claims for personal injury, property damage, diminution of property or similar claims. Furthermore, many environmental, health and safety laws authorize citizen suits, permitting third parties to make claims for violations of laws or permits and force compliance. Our insurance may not cover all environmental risk and costs or may not provide sufficient coverage in the event of an environmental claim. If significant uninsured losses arise from environmental damage or product liability claims, or if the costs of environmental compliance increase for any reason, our results of operations and financial condition could be adversely affected.Management’s observations regarding possible mitigation alternatives:• After extensive testing and trials, we believe application of the The Chem-Mod™ Solution at the operations in which we are invested is safe for the environment. However, given the nature of environmental liability litigation, there is little we can do to mitigate the risk that we could be sued over the environmental impact of the operations• We have insurance covering some of these environmental risksSee page 2 for information regarding how risks and uncertainties could impact the forward-looking statements, including implied statements, on this slide.43
Key PersonnelRISK FACTOR (10-K, page 11): The loss of our chief executive officer or any of our other senior managers, brokers or other key personnel (including the key personnel that manage our interests in our IRC Section 45 investments), or our inability to identify, recruit and retain such personnel, could materially and adversely affect our business, operating results and financial condition.Management’s observations regarding possible mitigation alternatives:• Several key employees manage our Section 45 investments and we have partially mitigated the risk of losing them through appropriate compensation incentivesSee page 2 for information regarding how risks and uncertainties could impact the forward-looking statements, including implied statements, on this slide.44

Other Frequently Asked Questions45
How Did Gallagher Get Into These Investments?• Gallagher has a history of developing and realizing value from these types of structured investments dating back to the 1980s Low-income housing Biogas from biomass facilities IRC Section 29 alternative fuel IRC Section 45 refined coal• A core group of five people provide the foundation for our current clean energy investments46
Why a Tax Subsidy for Clean Coal?• U.S. governmental policy is to subsidize the development and utilization of clean energy technologies through the application of tax incentives• The government has been subsidizing energy projects in the U.S. for over a century• We expect the government will continue to play an important role in energy development, particularly with respect to clean energy technologies• Our current tax-advantaged investments involve Section 45 of the Internal Revenue Code which regulates tax credits for clean coal power generation, our latest area of focus• The subsidy, which is inflated every year by the Federal government, was $6.33 per ton of coal sold for 2011 – we anticipate the rate for 2012 to be $6.36 - $6.40 (expected to be announced in April 2012)See page 2 for information regarding how risks and uncertainties could impact the forward-looking statements, including implied statements, on this slide.47

Status of Emerging Environmental Regulations?• Since 2005, the Federal government/EPA have pursued regulations that would require coal power generation facilities to significantly reduce the emissions of mercury, acid gases and particulate matter• Mercury and Air Toxics Standards (MATS) issued December 21, 2011, is the first national standard to reduce emissions from existing and new power facilities• In particular, the rules call for a reduction in mercury emissions of approximately 90%• These new Federal regulations are required to be implemented by the end of 2014, although some states have already taken action• Approximately 40% of the existing coal fleet (580 facilities with 1,400 generators at an average age of 44 years) does not have the necessary emissions control to meet the new guidelines• These regulations will require non-conforming power facilities to install emissions control solutions, primarily for mercury, to comply or cease operations See pages 10 and 12 for a discussion on how Chem-Mod may help utilities comply with new regulationsSee page 2 for information regarding how risks and uncertainties could impact the forward-looking statements, including implied statements, on this slide.48
Any Strategic Alternatives for Investments in Clean Coal Plants?• While Gallagher continually evaluates strategic alternatives, we currently expect to hold minority-position investments in the 29 clean coal plants• If Gallagher sold these investments prior to the expiration of the tax credits, the discount rate on the future cash flows would likely be excessiveSee page 2 for information regarding how risks and uncertainties could impact the forward-looking statements, including implied statements, on this slide.49
What are Next Steps for Chem-Mod?• We, along with our partners, continue to evaluate alternatives to maximize the value of our investment in Chem-Mod• In particular, we will likely need the expertise of a strategic partner to fully realize the financial benefits of deploying the technology into the mercury control market both domestically and internationally• Potential strategic/financial alternatives include: Granting an exclusive license to a strategic partner(s) Separating the company into two distinct businesses: clean coal and mercury control Developing a sales force to market the technology Selling Chem-ModSee page 2 for information regarding how risks and uncertainties could impact the forward-looking statements, including implied statements, on this slide.50

What is the Competitive Landscape for Chem-Mod?• There are a number of emissions control technologies that address mercury, all with varying degrees of cost and effectiveness• The traditional emissions control technology for coal power generation facilities is “scrubbers”, comparatively expensive solutions designed to remove a range of pollutants• The traditional emissions control technology specifically for mercury is activated carbon injection (ACI) systems, often used in conjunction with scrubbers• ACI systems inject powdered activated carbon, which acts as a sorbent, into the exhaust pipes of a coal furnace to capture the mercury after combustion• As an alternative, The Chem-ModTM Solution involves the application of specific chemical reagents before the combustion process to capture the mercury and other pollutants in a chemical bond The chemical bonds created using Chem-Mod’s patented technology are more stable and create a better fly ash for re-use51
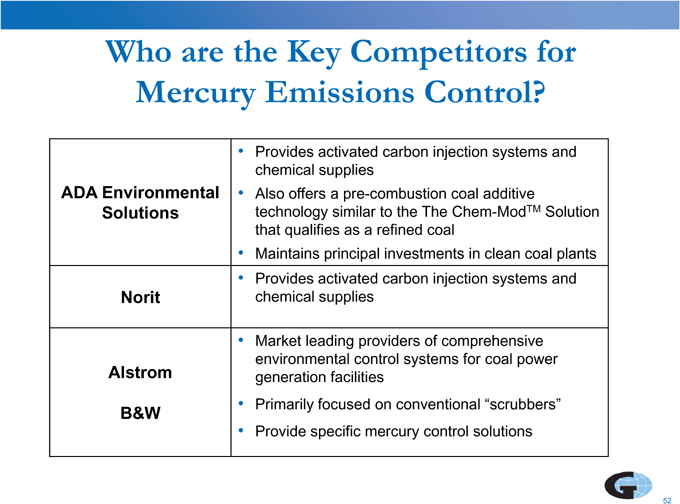
Who are the Key Competitors for Mercury Emissions Control?• Provides activated carbon injection systems and chemical supplies ADA Environmental • Also offers a pre-combustion coal additive Solutions technology similar to the The Chem-ModTM Solution that qualifies as a refined coal• Maintains principal investments in clean coal plants• Provides activated carbon injection systems and Norit chemical supplies• Market leading providers of comprehensive environmental control systems for coal power Alstrom generation facilities• Primarily focused on conventional “scrubbers”B&W• Provide specific mercury control solutions52
What is the Potential for Chem-Mod in International Markets?• Gallagher holds a non-controlling 20% interest in Chem-Mod International LLC• Chem-Mod International LLC owns the rights to license The Chem-ModTM Solution in countries outside the U.S. and Canada• The international market for mercury control solutions is much less developed• Marketing activity to date has been limited• Most of the opportunity will likely come from Asia, which is more dependent on coal power generation than other regions in the worldSee page 2 for information regarding how risks and uncertainties could impact the forward-looking statements, including implied statements, on this slide.53
What Other Clean Energy Technologies Are in Gallagher’s Portfolio?• We hold a non-controlling 8% interest in C-Quest’s global operations• C-Quest was founded by the same founder of Chem-Mod• C-Quest possesses rights, information and technology for the reduction of carbon dioxide emissions created by burning fossil fuels• Thus far, C-Quest’s operations have been limited to laboratory testing• We have options to acquire an additional 19% interest in C-Quest’s global operations for $9.5 million at any time prior to August 1, 201354

For Additional InformationMarsha Akin Director – Investor Relations Marsha_Akin@ajg.com Phone: 630-285-350155
Appendix A
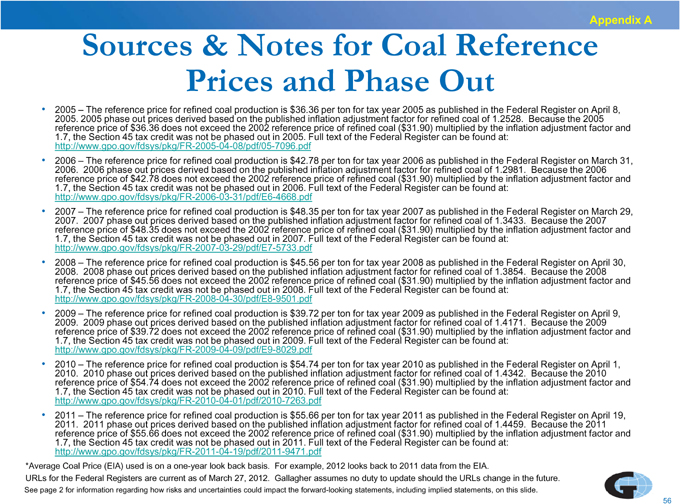
Prices and Phase Out• 2005 – The reference price for refined coal production is $36.36 per ton for tax year 2005 as published in the Federal Register on April 8, 2005. 2005 phase out prices derived based on the published inflation adjustment factor for refined coal of 1.2528. Because the 2005 reference price of $36.36 does not exceed the 2002 reference price of refined coal ($31.90) multiplied by the inflation adjustment factor and 1.7, the Section 45 tax credit was not be phased out in 2005. Full text of the Federal Register can be found at: http://www.gpo.gov/fdsys/pkg/FR-2005-04-08/pdf/05-7096.pdf• 2006 – The reference price for refined coal production is $42.78 per ton for tax year 2006 as published in the Federal Register on March 31, 2006. 2006 phase out prices derived based on the published inflation adjustment factor for refined coal of 1.2981. Because the 2006 reference price of $42.78 does not exceed the 2002 reference price of refined coal ($31.90) multiplied by the inflation adjustment factor and 1.7, the Section 45 tax credit was not be phased out in 2006. Full text of the Federal Register can be found at: http://www.gpo.gov/fdsys/pkg/FR-2006-03-31/pdf/E6-4668.pdf• 2007 – The reference price for refined coal production is $48.35 per ton for tax year 2007 as published in the Federal Register on March 29, 2007. 2007 phase out prices derived based on the published inflation adjustment factor for refined coal of 1.3433. Because the 2007 reference price of $48.35 does not exceed the 2002 reference price of refined coal ($31.90) multiplied by the inflation adjustment factor and 1.7, the Section 45 tax credit was not be phased out in 2007. Full text of the Federal Register can be found at: http://www.gpo.gov/fdsys/pkg/FR-2007-03-29/pdf/E7-5733.pdf• 2008 – The reference price for refined coal production is $45.56 per ton for tax year 2008 as published in the Federal Register on April 30, 2008. 2008 phase out prices derived based on the published inflation adjustment factor for refined coal of 1.3854. Because the 2008 reference price of $45.56 does not exceed the 2002 reference price of refined coal ($31.90) multiplied by the inflation adjustment factor and 1.7, the Section 45 tax credit was not be phased out in 2008. Full text of the Federal Register can be found at: http://www.gpo.gov/fdsys/pkg/FR-2008-04-30/pdf/E8-9501.pdf• 2009 – The reference price for refined coal production is $39.72 per ton for tax year 2009 as published in the Federal Register on April 9, 2009. 2009 phase out prices derived based on the published inflation adjustment factor for refined coal of 1.4171. Because the 2009 reference price of $39.72 does not exceed the 2002 reference price of refined coal ($31.90) multiplied by the inflation adjustment factor and 1.7, the Section 45 tax credit was not be phased out in 2009. Full text of the Federal Register can be found at: http://www.gpo.gov/fdsys/pkg/FR-2009-04-09/pdf/E9-8029.pdf• 2010 – The reference price for refined coal production is $54.74 per ton for tax year 2010 as published in the Federal Register on April 1, 2010. 2010 phase out prices derived based on the published inflation adjustment factor for refined coal of 1.4342. Because the 2010 reference price of $54.74 does not exceed the 2002 reference price of refined coal ($31.90) multiplied by the inflation adjustment factor and 1.7, the Section 45 tax credit was not be phased out in 2010. Full text of the Federal Register can be found at: http://www.gpo.gov/fdsys/pkg/FR-2010-04-01/pdf/2010-7263.pdf• 2011 – The reference price for refined coal production is $55.66 per ton for tax year 2011 as published in the Federal Register on April 19, 2011. 2011 phase out prices derived based on the published inflation adjustment factor for refined coal of 1.4459. Because the 2011 reference price of $55.66 does not exceed the 2002 reference price of refined coal ($31.90) multiplied by the inflation adjustment factor and 1.7, the Section 45 tax credit was not be phased out in 2011. Full text of the Federal Register can be found at: http://www.gpo.gov/fdsys/pkg/FR-2011-04-19/pdf/2011-9471.pdf *Average Coal Price (EIA) used is on a one-year look back basis. For example, 2012 looks back to 2011 data from the EIA. URLs for the Federal Registers are current as of March 27, 2012. Gallagher assumes no duty to update should the URLs change in the future. See page 2 for information regarding how risks and uncertainties could impact the forward-looking statements, including implied statements, on this slide.56
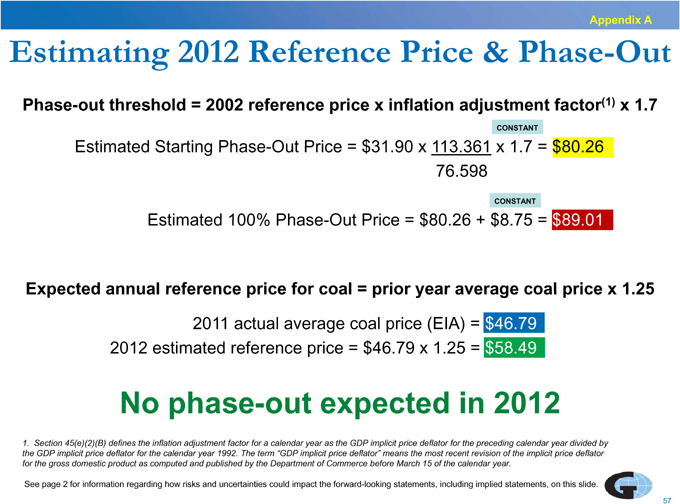
Appendix AEstimating 2012 Reference Price & Phase-OutPhase-out threshold = 2002 reference price x inflation adjustment factor(1) x 1.7CONSTANTEstimated Starting Phase-Out Price = $31.90 x 113.361 x 1.7 = $80.2676.598CONSTANTEstimated 100% Phase-Out Price = $80.26 + $8.75 = $89.01Expected annual reference price for coal = prior year average coal price x 1.252011 actual average coal price (EIA) = $46.79 2012 estimated reference price = $46.79 x 1.25 = $58.49No phase-out expected in 20121. Section 45(e)(2)(B) defines the inflation adjustment factor for a calendar year as the GDP implicit price deflator for the preceding calendar year divided by the GDP implicit price deflator for the calendar year 1992. The term “GDP implicit price deflator” means the most recent revision of the implicit price deflator for the gross domestic product as computed and published by the Department of Commerce before March 15 of the calendar year. See page 2 for information regarding how risks and uncertainties could impact the forward-looking statements, including implied statements, on this slide.57
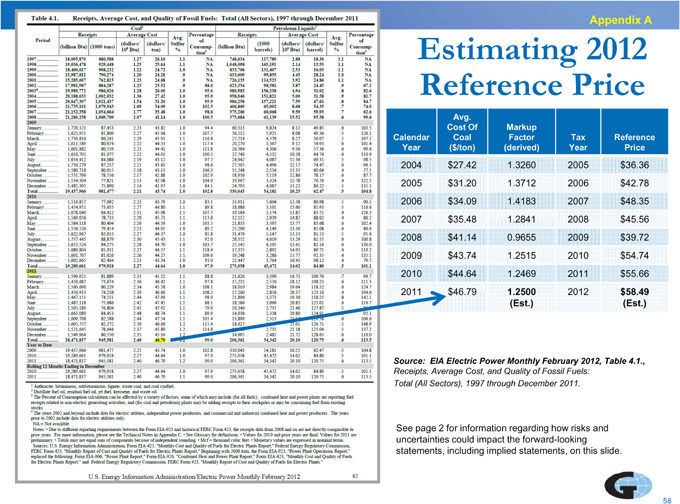
Appendix AEstimating 2012 Reference PriceAvg.Cost Of Markup Calendar Coal Factor Tax Reference Year ($/ton) (derived) Year Price2004 $27.42 1.3260 2005 $36.36 2005 $31.20 1.3712 2006 $42.78 2006 $34.09 1.4183 2007 $48.35 2007 $35.48 1.2841 2008 $45.56 2008 $41.14 0.9655 2009 $39.72 2009 $43.74 1.2515 2010 $54.74 2010 $44.64 1.2469 2011 $55.66 2011 $46.79 1.2500 2012 $58.49 (Est.) (Est.)Source: EIA Electric Power Monthly February 2012, Table 4.1., Receipts, Average Cost, and Quality of Fossil Fuels: Total (All Sectors), 1997 through December 2011.See page 2 for information regarding how risks and uncertainties could impact the forward-looking statements, including implied statements, on this slide.58