Exhibit 99
|

|

Please turn off all cell phones
and PDAs at this time.
Thank you for your cooperation.
|
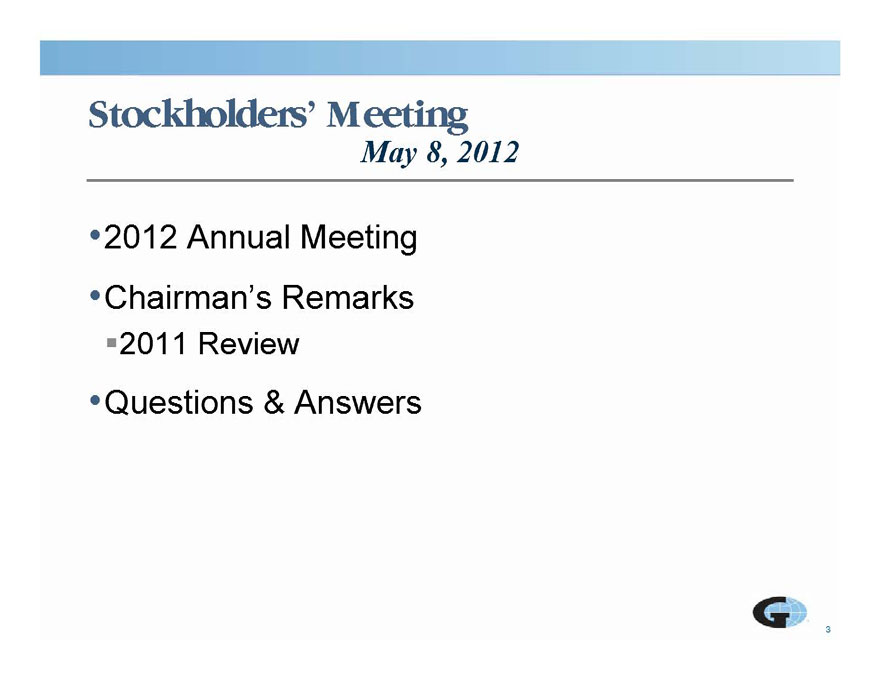
Stockholders’ Meeting
May 8, 2012
•2012 Annual Meeting
•Chairman’s Remarks
?2011 Review
•Questions & Answers
|
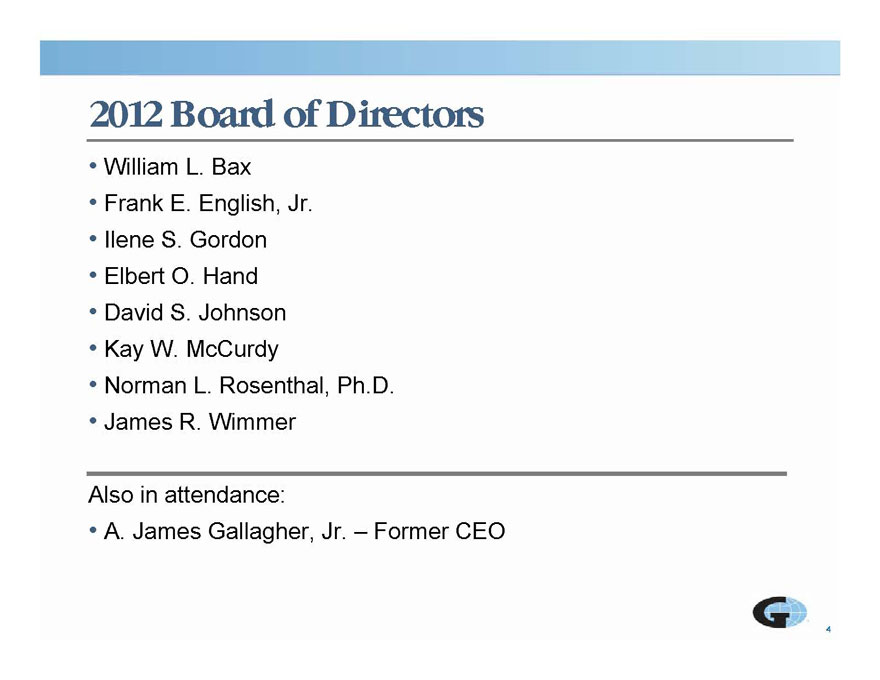
2012 Board of Directors
• William L. Bax
• Frank E. English, Jr.
• Ilene S. Gordon
• Elbert O. Hand
• David S. Johnson
• Kay W. McCurdy
• Norman L. Rosenthal, Ph.D.
• James R. Wimmer
Also in attendance:
• A. James Gallagher, Jr. – Former CEO
4 |
|
Stockholders’ Meeting
May 8, 2012
•2012 Annual Meeting
|
Stockholders’ Meeting
May 8, 2012
•2012 Annual Meeting
•Chairman’s Remarks
?2011 in Review
|
Information Regarding g g Forward-Looking Statements
This presentation contains “forward-looking statements” within the meaning of the Private Securities
Litigation Reform Act of 1995. When used in this presentation, the words “anticipates,” “expects,”
“believes,” “contemplates,” “should,” “could,” “estimates,” “expects,” “intends,” “plans” and similar
expressions are intended to identify forward-looking statements. Examples of forward-looking
statements in this presentation include, but are not limited to, statements relating to: (i) improvements in
the economy and rate environment; (ii) Gallagher’s capabilities for growth and expansion; (iii) trends in
Gallagher’s acquisition strategy and planned levels of acquisition activity; (iv) the integration of recent
acquisitions (including Heath Lambert); (v) drivers of organic growth in Gallagher’s core businesses; (vi)
anticipated future results or performance (including margins) of any segment or Gallagher as a whole;
(vii) Gallagher’s stock performance (including expected future dividend payments); (viii) future debt
levels; (ix) expected uses of cash; (x) international opportunities; and (xi) productivity and expense
reduction initiatives. Important factors that could cause actual results to differ materially from those in
these forward-looking statements include changes in worldwide and national economic conditions (such
as a European debt crisis), changes in premium rates and insurance markets generally, changes in the
insurance brokerage industry’s competitive landscape, and the difficulties inherent in combining the
cultures and systems of different companies.
Please refer to Gallagher’s filings with the SEC, including Item 1A, “Risk Factors,” of its Annual Report
Form 10 K the fiscal December 31 2011 a detailed 7
on 10-for year ended 31, 2011, for more discussion of these and
other factors that could impact its forward-looking statements.
|
Information Regarding g g Forward-Looking Statements This presentation contains “forward-looking statements” within the meaning of the Private Securities Litigation Reform Act of 1995. When used in this presentation, the words “anticipates,” “expects,” “believes,” “contemplates,” “should,” “could,” “estimates,” “expects,” “intends,” “plans” and similar expressions are intended to identify forward-looking statements. Examples of forward-looking statements in this presentation include, but are not limited to, statements relating to: (i) improvements in the economy and rate environment; (ii) Gallagher’s capabilities for growth and expansion; (iii) trends in Gallagher’s acquisition strategy and planned levels of acquisition activity; (iv) the integration of recent acquisitions (including Heath Lambert); (v) drivers of organic growth in Gallagher’s core businesses; (vi) anticipated future results or performance (including margins) of any segment or Gallagher as a whole; (vii) Gallagher’s stock performance (including expected future dividend payments); (viii) future debt levels; (ix) expected uses of cash; (x) international opportunities; and (xi) productivity and expense reduction initiatives. Important factors that could cause actual results to differ materially from those in these forward-looking statements include changes in worldwide and national economic conditions (such as a European debt crisis), changes in premium rates and insurance markets generally, changes in the insurance brokerage industry’s competitive landscape, and the difficulties inherent in combining the cultures and systems of different companies. Please refer to Gallagher’s filings with the SEC, including Item 1A, “Risk Factors,” of its Annual Report Form 10 K the fiscal December 31 2011 a detailed 7 on 10-for year ended 31, 2011, for more discussion of these and other factors that could impact its forward-looking statements.
|
•Adjusted EBITDAC Margin Excluding Heath Lambert is defined as Adjusted EBITDAC further adjusted to exclude the EBITDAC associated with the acquired Heath
Lambert operations divided by Adjusted Revenues, as further adjusted to exclude the revenues associated with the acquired Heath Lambert operations. 8 The most directly comparable GAAP measure for these non-GAAP earnings measures is earnings from continuing operations. For the Brokerage Segment, the Risk Management Segment, and the two segments on a combined basis, earnings from continuing operations was $136 million, $31 million and $167 million, respectively, in 2010, and $140 million, $34 million and $174 million, respectively, in 2011. For all other measures, please see “Reconciliation of Non-GAAP Measures” on Gallagher’s Web site at www.ajg.com under “Investor Relations”.
|
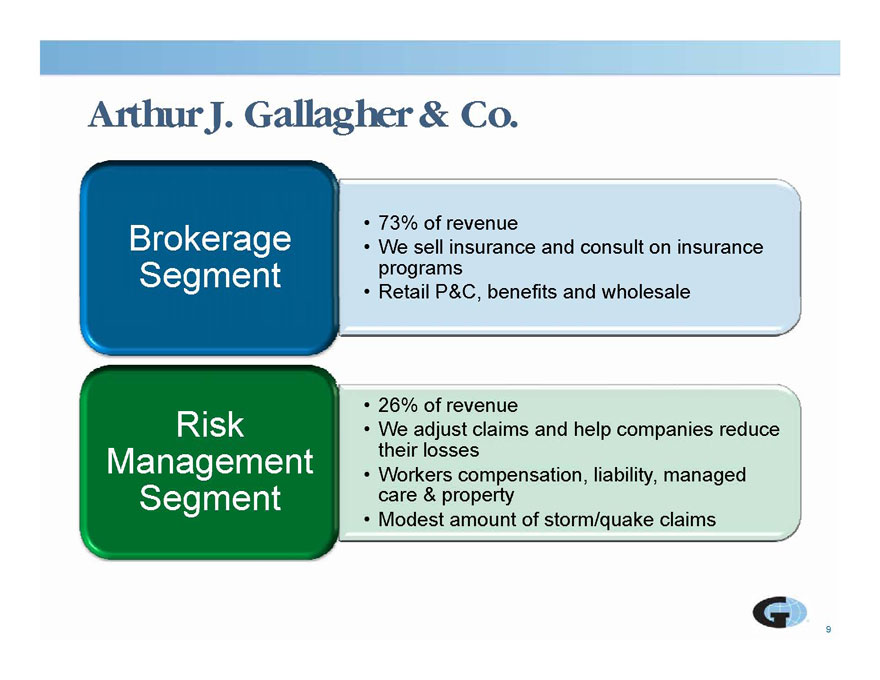
Arthur J. Gallagher & Co.
• 73% of revenue
• We sell insurance and consult on insurance
programs
• benefits and Brokerage
Segment Retail P&C, wholesale
• 26% of revenue
• We adjust claims and help companies reduce
their losses
W k ti li bilit d
Risk
Management
• Workers compensation, liability, managed
care & property
• Modest amount of storm/quake claims
Segment
9
|
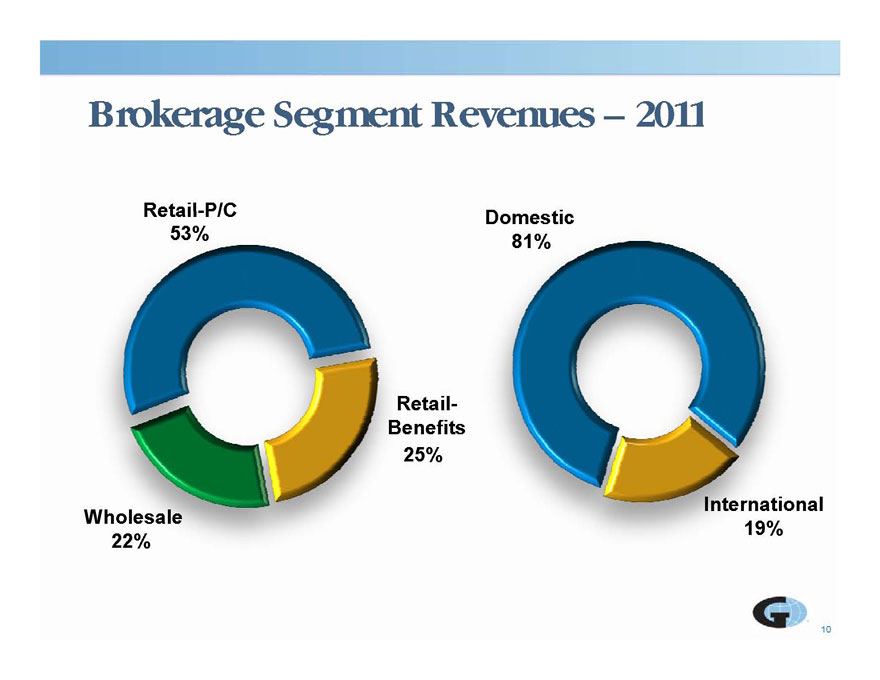
Brokerage Segment – 2011
D ti
81%
Domestic
53%
Retail-P/C
25%
Retail-
Benefits
19%
International
22%
Wholesale
10
|
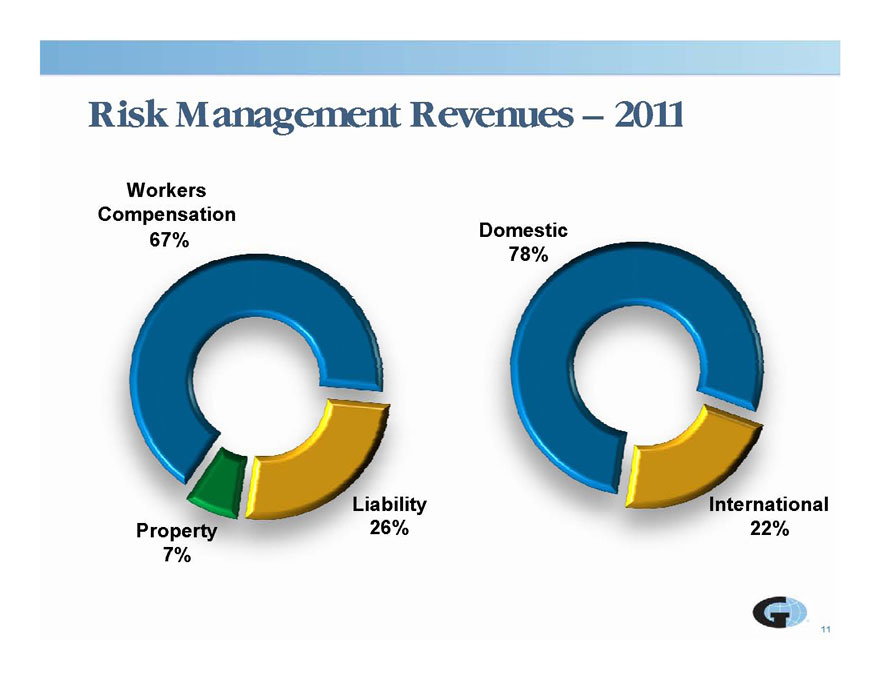
Risk
Management Revenues – 2011
Workers
67%
Compensation
78%
Domestic
26%
7%
Liability
Property 22%
International
|
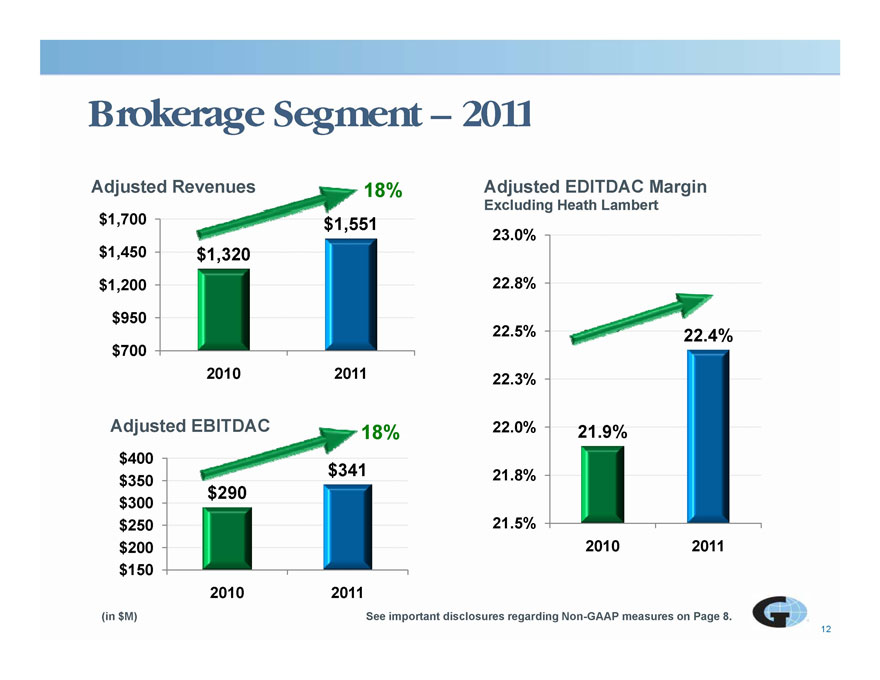
Adjusted Revenues Brokerage Segment 2011 Adjusted EDITDAC Margin Excluding Heath Lambert 18% $1,320 $1,551 $1,200 $1,450 $1,700 22.8% 23.0% g $700 $950 2010 2011 22.4% 22.3% 22.5% $341 $400 Adjusted EBITDAC 22.0% 21.9% 18% $290 $ 200 $250 $300 $350 21.5% 21.8% 2010 2011 12 $150 2010 2011 (in $M) See important disclosures regarding Non-GAAP measures on Page 8.
|
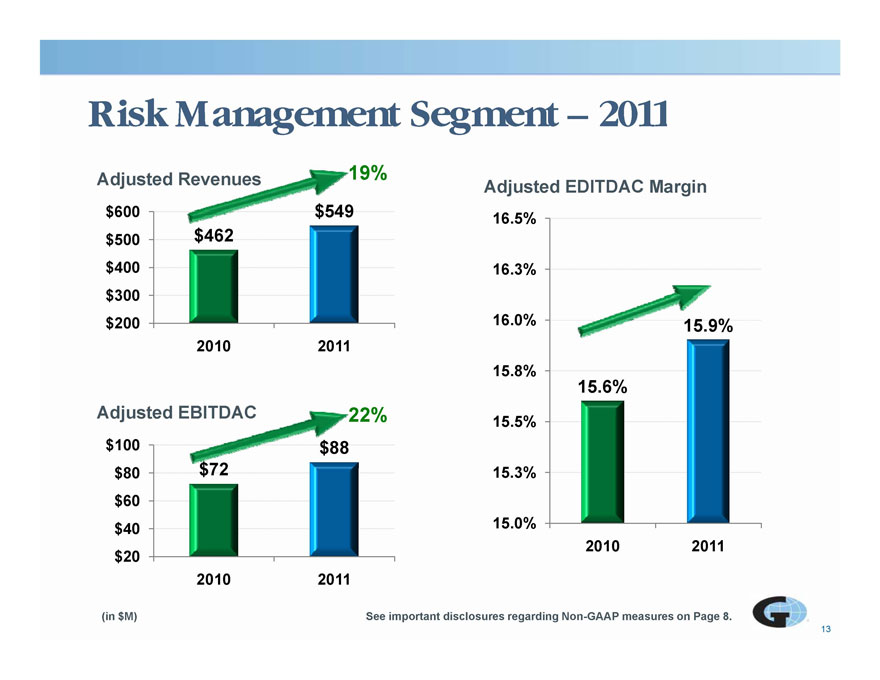
Risk Management 2011 Adjusted EDITDAC Margin 19% $462 $300 $400 $500 16.3% 16.5% $200 2010 2011 15 6% 15.9% 15.8% 16.0% $72 $88 $80 $100 Adjusted EBITDAC 15.6% 15 3% 22% 15.5% $20 $40 $60 15.0% 15.3% 2010 2011 13 2010 2011 (in $M) See important disclosures regarding Non-GAAP measures on Page 8.
|
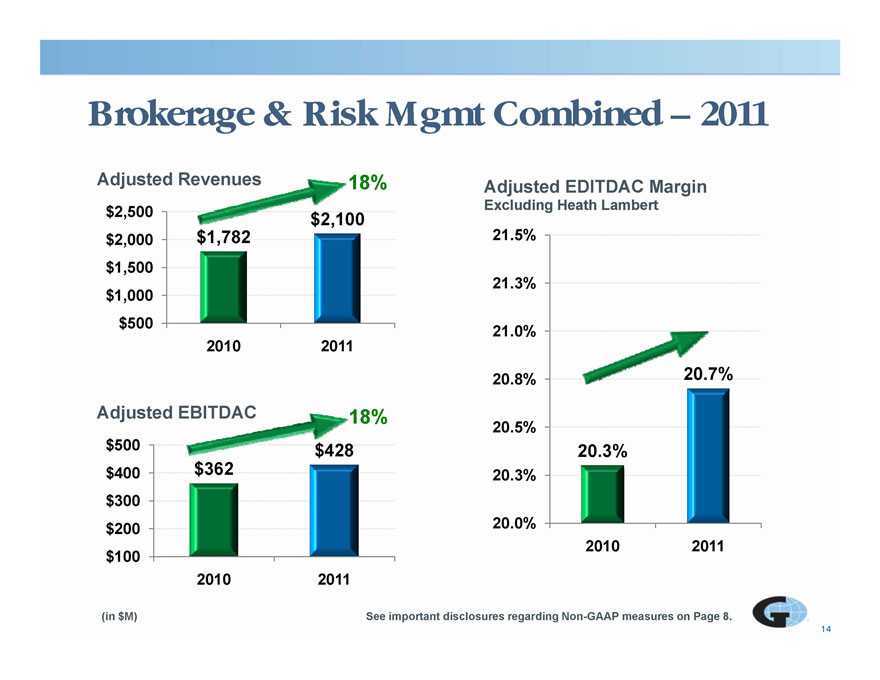
Brokerage & Risk Mgmt Combined – 2011 $2 500 Adjusted Revenues o e ge& s g Co b ed 0 Adjusted EDITDAC Margin Excluding Heath Lambert 18% $1,782 $2,100 $1 000 $1,500 $2,000 2,500 21.3% 21.5% g $500 1,000 2010 2011 20.8% 20.7% 21.0% $362 $428 $400 $500 Adjusted EBITDAC 20.3% 20.5% 18% $100 $200 $300 20.0% 20.3% 2010 2011 14 2010 2011 (in $M) See important disclosures regarding Non-GAAP measures on Page 8.
|
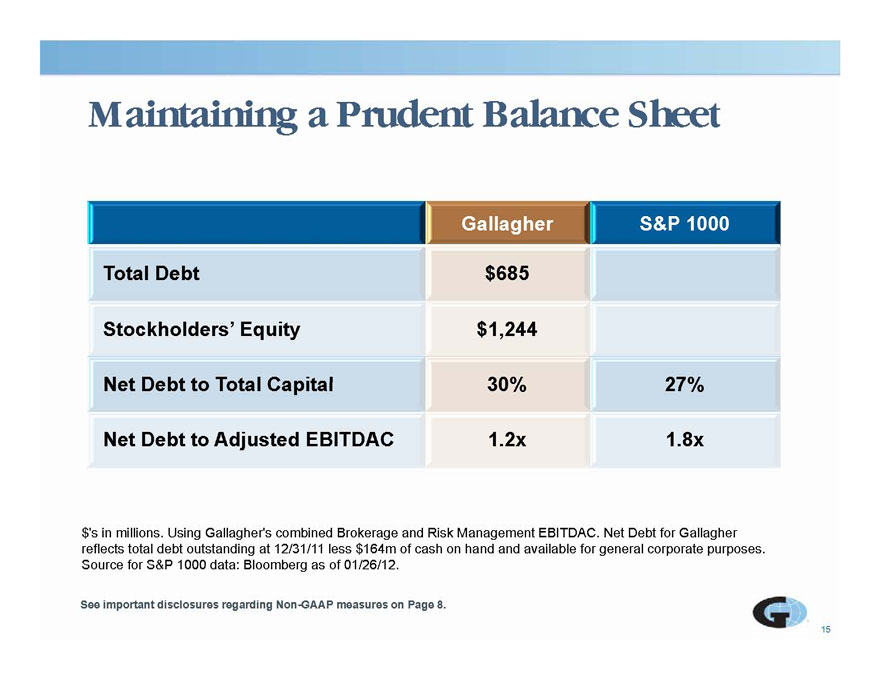
Maintaining a Prudent Balance Sheet
Gallagher S&P 1000
Total Debt $685
Stockholders’ Equity $1,244
Net Debt to Total Capital 30% 27%
Net Debt to Adjusted EBITDAC 1.2x 1.8x
$’s in millions. Using Gallagher’s combined Brokerage and Risk Management EBITDAC. Net Debt for Gallagher
reflects total debt outstanding at 12/31/11 less $ 164m of cash on hand and available for general corporate purposes.
15
g g p p p
Source for S&P 1000 data: Bloomberg as of 01/26/12.
See important disclosures regarding Non-GAAP measures on Page 8.
|
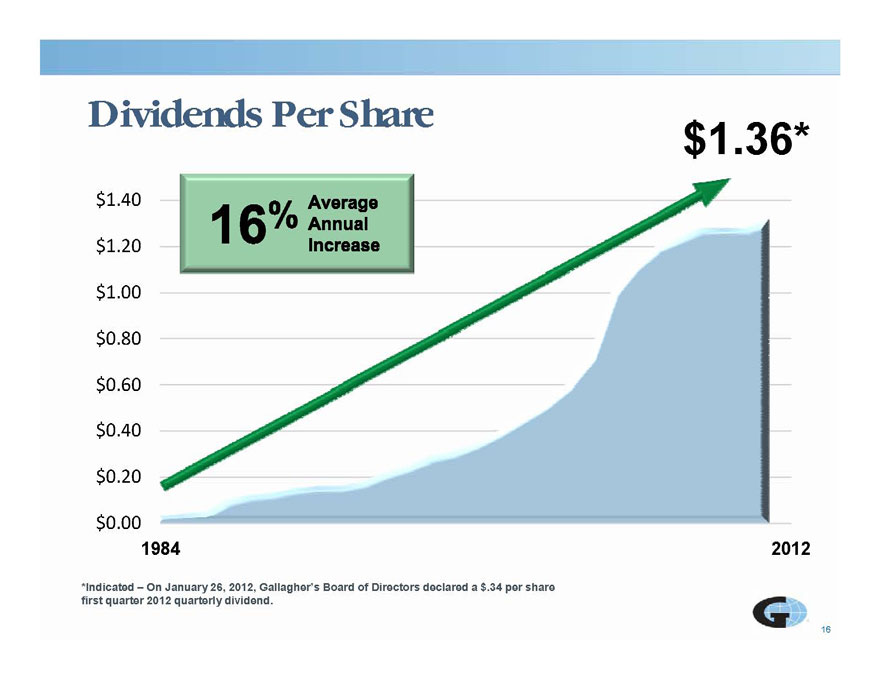
Dividends Per Share $1.36*
$1.00
$1.20
$0 60
$0.80
$
$0.40
0.60
$0.00
0.20
1984 2012
16
*Indicated – On January 26, 2012, Gallagher’s Board of Directors declared a $.34 per share
first quarter 2012 quarterly dividend.
|
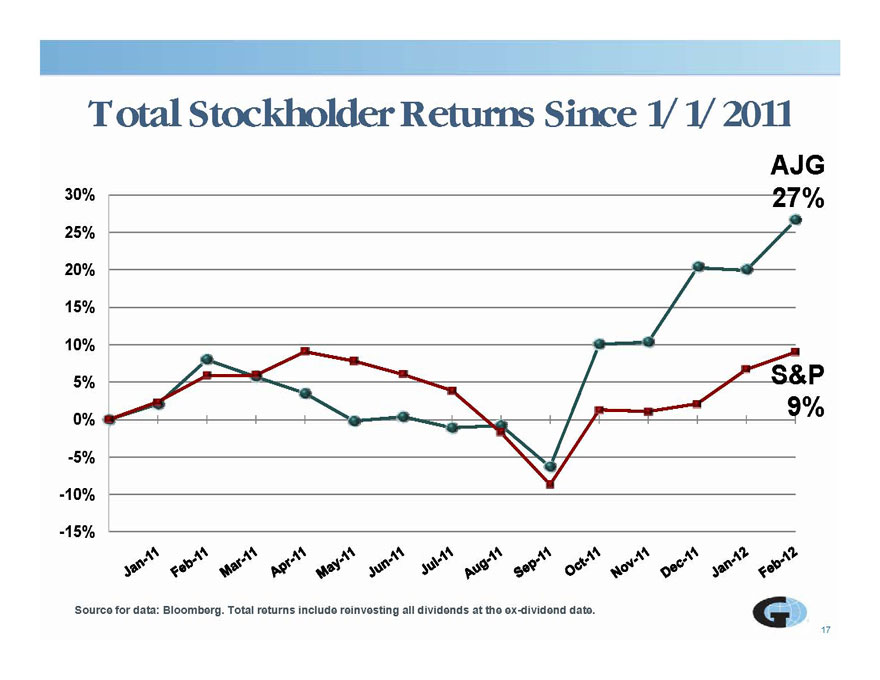
Total Stockholder Returns Since 1/1/2011 30% AJG 27% 20% 25% 5% 10% 15% S&P -5% 0% 9% -15% -10% 17 Source for data: Bloomberg. Total returns include reinvesting all dividends at the ex-dividend date.
|
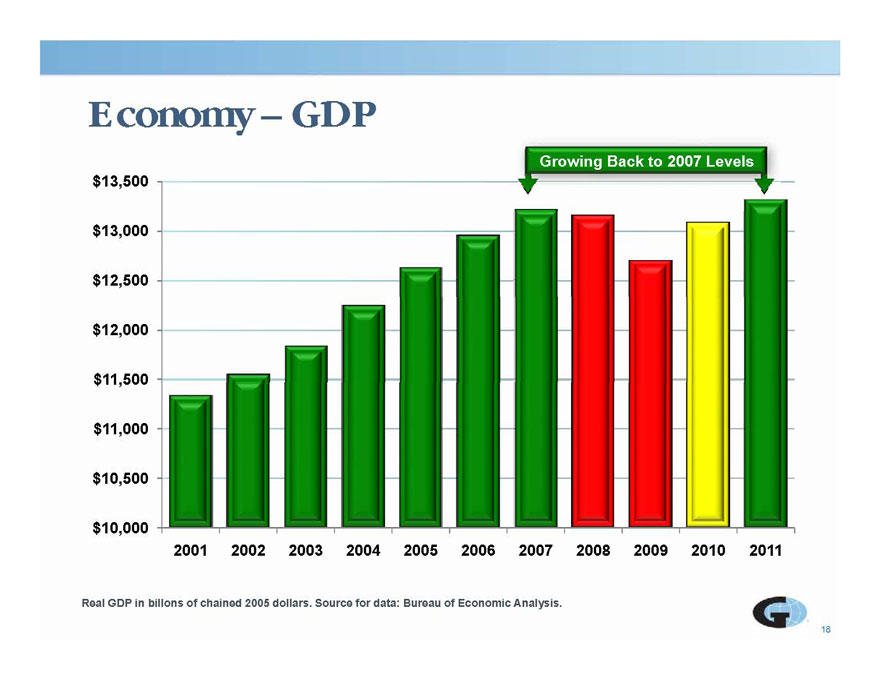
Economy GDP Growing Back to 2007 Levels $12,500 $13,000 $11,500 $12,000 $11,000 $10,000 $10,500 2002 2003 2005 2006 2007 2008 2009 2010 2011 18 2001 2004 Real GDP in billons of chained 2005 dollars. Source for data: Bureau of Economic Analysis.
|
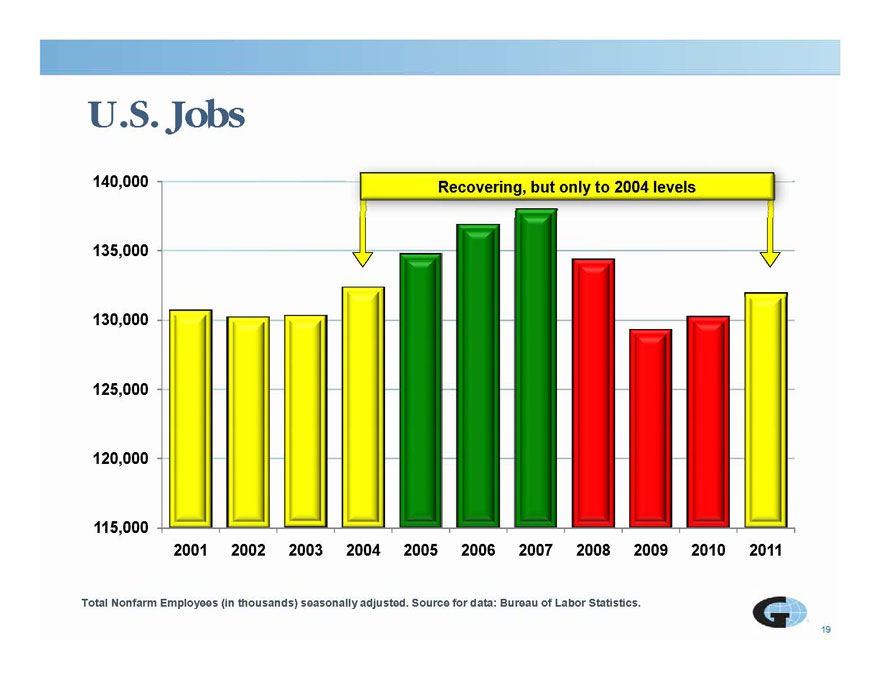
U.S. Jobs Recovering, but only to 2004 levels 135,000 130,000 120,000 125,000 115,000 2002 2003 2005 2006 2007 2008 2009 2010 2011 19 2001 2004 Total Nonfarm Employees (in thousands) seasonally adjusted. Source for data: Bureau of Labor Statistics.
|
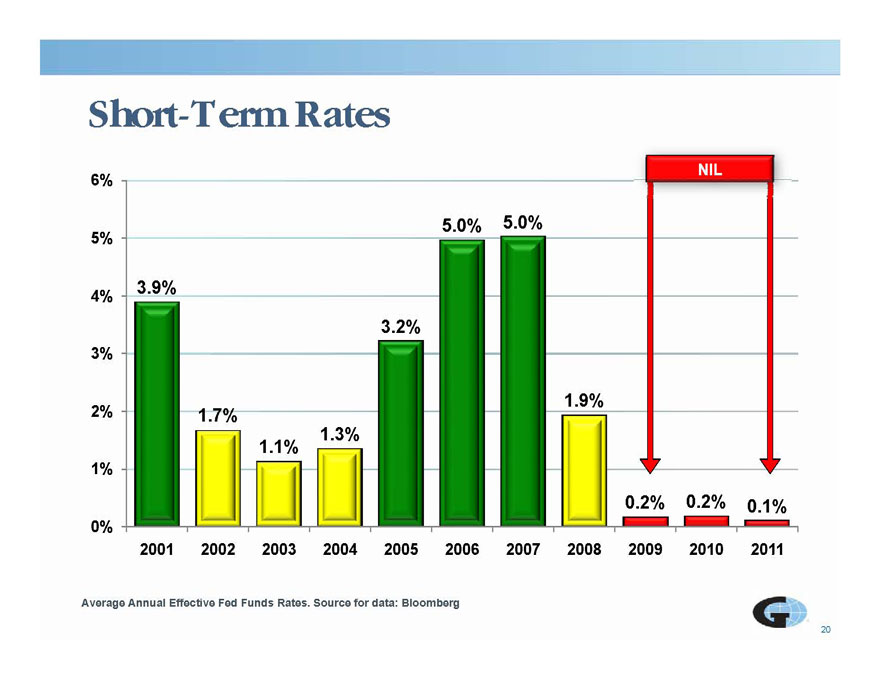
Short Term Rates NIL 3.9% 5.0% 5.0% 4% 5% 3.2% 3% 1.7% 1.1% 1.3% 1.9% 1% 2% 0.2% 0.2% 0.1% 0% 2001 2002 2003 2004 2005 2006 2007 2008 2009 2010 2011 20 Average Annual Effective Fed Funds Rates. Source for data: Bloomberg
|
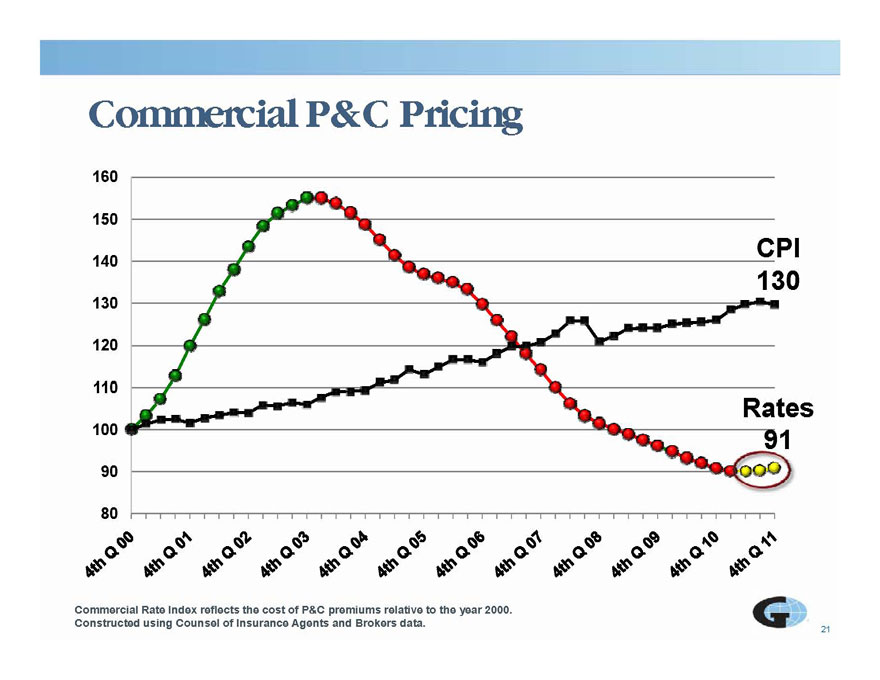
Commercial P&C Pricing 160 140 150 CPI 130 110 120 130 90 100 Rates 91 80 21 Commercial Rate Index reflects the cost of P&C premiums relative to the year 2000. Constructed using Counsel of Insurance Agents and Brokers data.
|
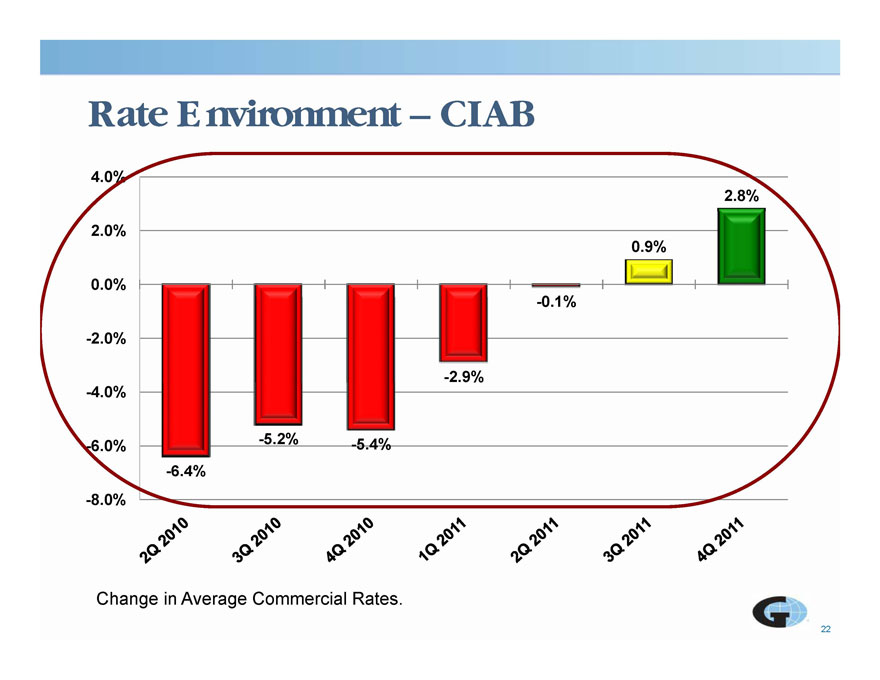
Rate Environment CIAB 0 1% 0.9% 0.0% 2.0% -2.9% -0.1% -2.0% 6 4% -6.0% -5.2% -5.4% -4.0% -6.4% -8.0% 22 Change in Average Commercial Rates.
|
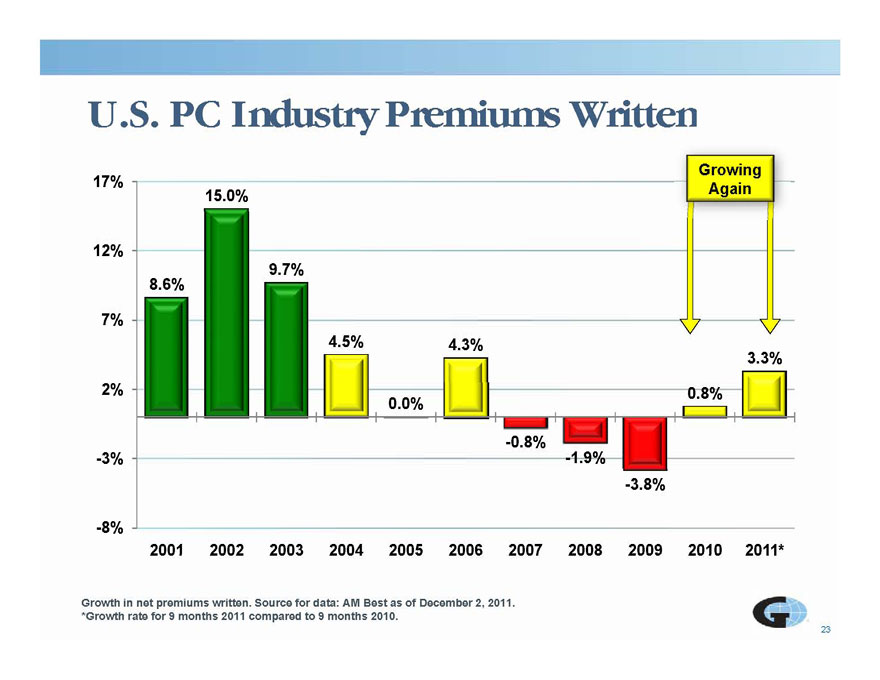
U.S. PC Industry Premiums Written Growing Again 8.6% 9.7% 12% 4.5% 4.3% 3.3% 7% 0.0% -0.8% -1.9% 0.8% -3% 2% -3.8% -8% 2001 2002 2003 2004 2005 2006 2007 2008 2009 2010 2011* 23 2011 Growth in net premiums written. Source for data: AM Best as of December 2, 2011. *Growth rate for 9 months 2011 compared to 9 months 2010.
|
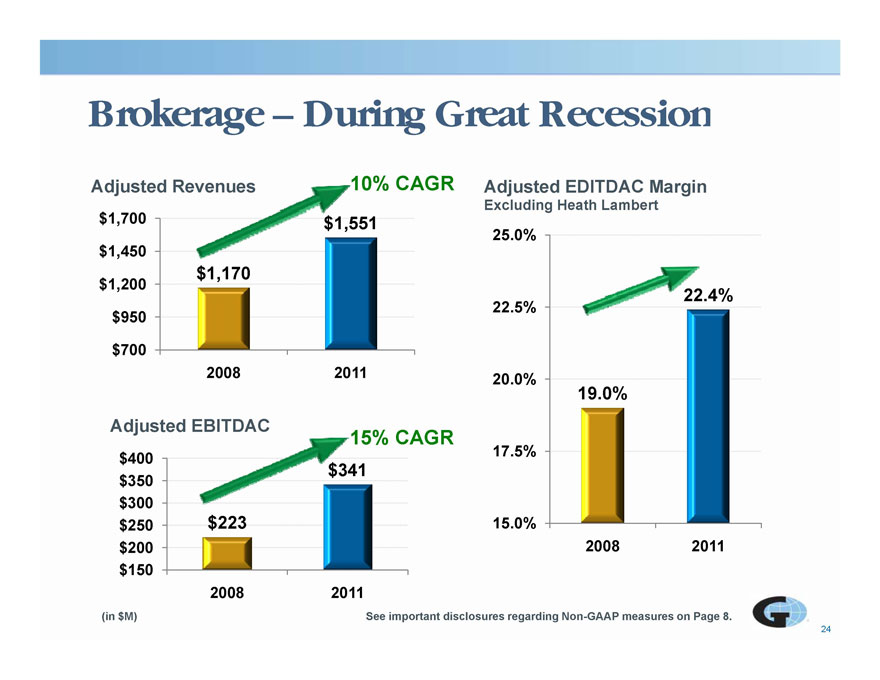
Brokerage During Recession Adjusted EDITDAC Margin Excluding Heath Lambert $1,170 $1,551 $1,200 $1,450 $1,700 22 4% 25.0% g $700 $950 2008 2011 22.4% 20.0% 22.5% $341 $400 Adjusted EBITDAC 19.0% 17.5% 15% CAGR $223 $ 200 $250 $300 $350 15.0% 2008 2011 24 $150 2008 2011 (in $M) See important disclosures regarding Non-GAAP measures on Page 8.
|
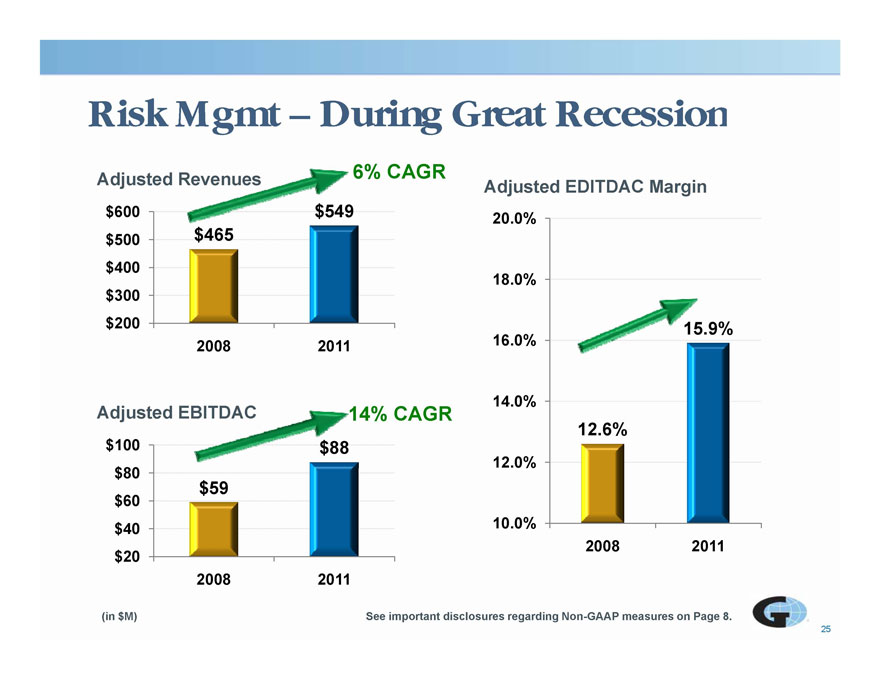
Risk Mgmt During Recession Adjusted EDITDAC Margin 6% CAGR $465 $300 $400 $500 18.0% 20.0% $200 2008 2011 15.9% 16.0% $88 $80 $100 Adjusted EBITDAC 12.6% 12.0% 14.0% 14% CAGR $59 $20 $40 $60 10.0% 2008 2011 25 2008 2011 (in $M) See important disclosures regarding Non-GAAP measures on Page 8.
|
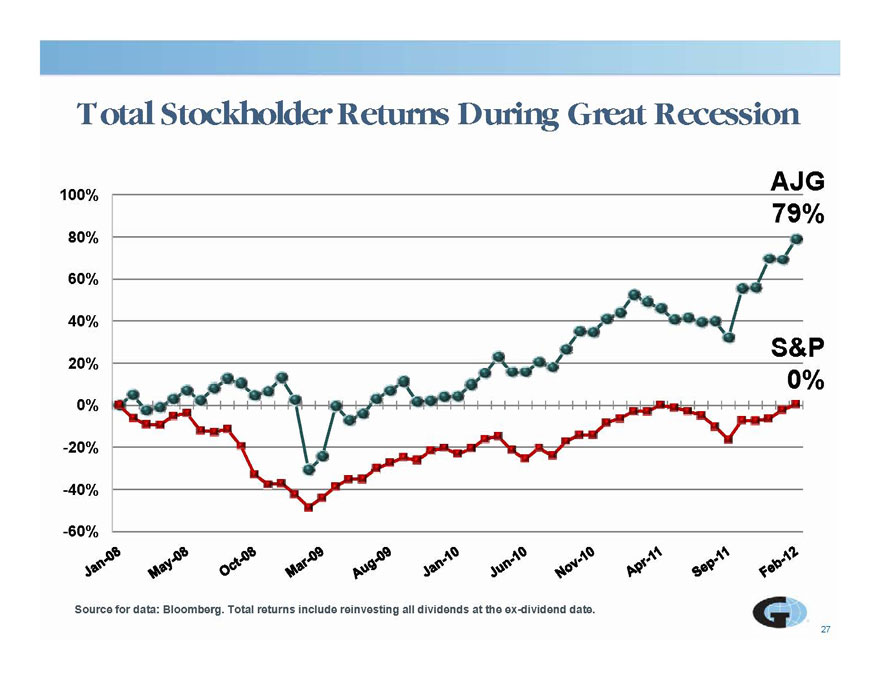
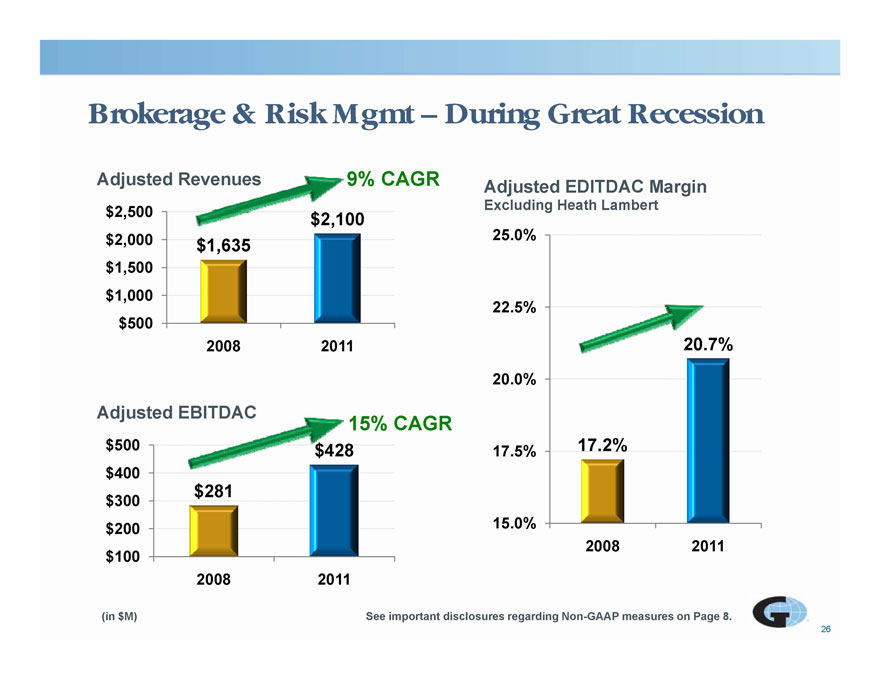
Brokerage & Risk Mgmt – During Great Recession $2 500 Adjusted Revenues g g g Adjusted EDITDAC Margin Excluding Heath Lambert 9% CAGR $1,635 $2,100 $1 000 $1,500 $2,000 2,500 25.0% g $500 1,000 2008 2011 20.7% 20.0% 22.5% $428 $400 $500 Adjusted EBITDAC 17.5% 17.2% 15% CAGR $281 $100 $200 $300 15.0% 2008 2011 26 2008 2011 (in $M) See important disclosures regarding Non-GAAP measures on Page 8. Total Stockholder Returns During Great Recession 100% AJG 60% 80% 79% 20% 40% S&P 0% -20% 0% -60% -40% 27 Source for data: Bloomberg. Total returns include reinvesting all dividends at the ex-dividend date.
|

Plan For Growth
|
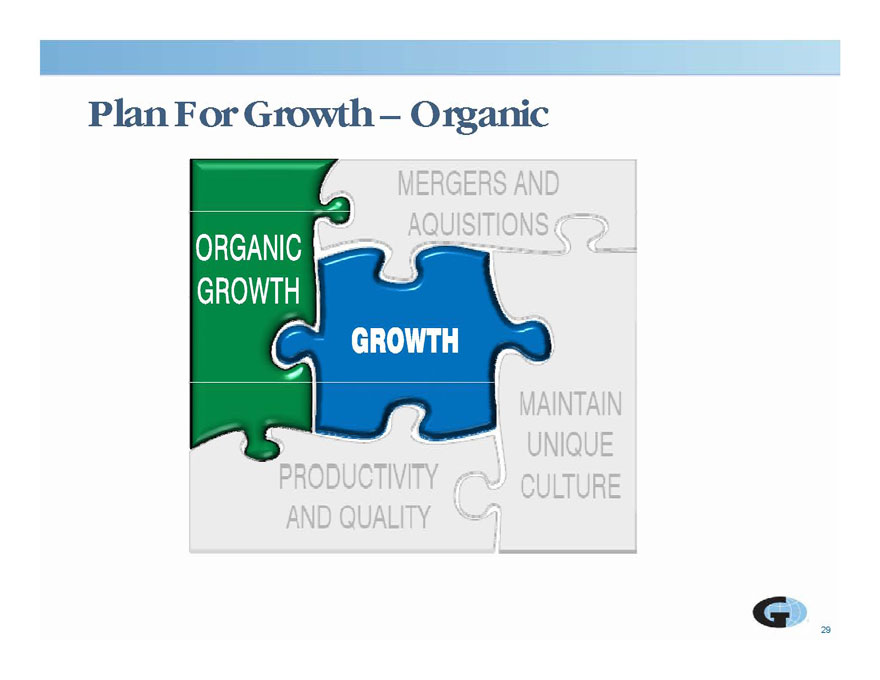
Plan For Growth – Organic
|
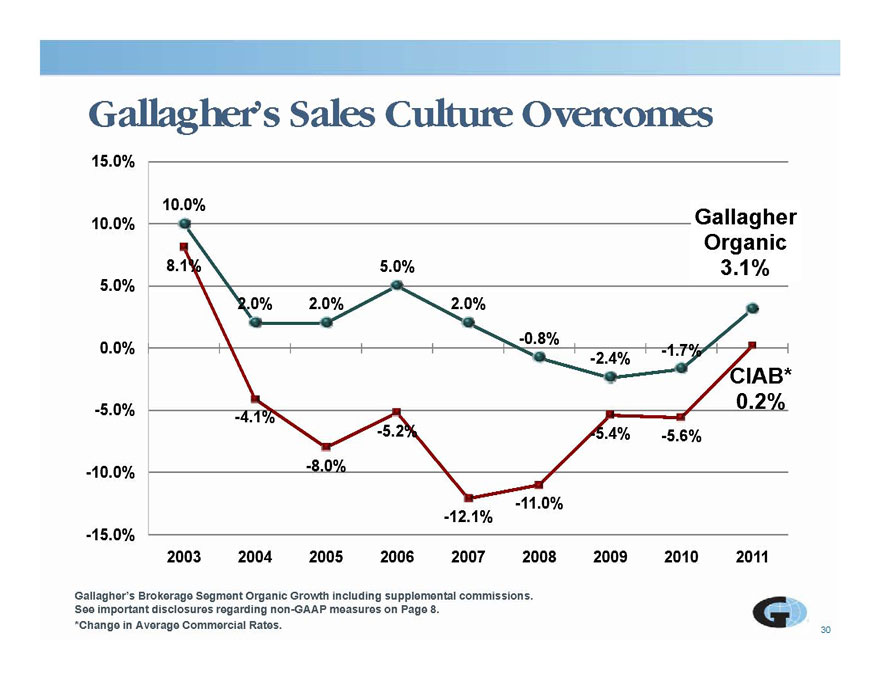
Gallagher s Sales Culture Overcomes 5.0% Gallagher Organic 8.1% 3.1% 5.0% 10.0% 2.0% 2.0% 2.0% -0.8% -2.4% -1.7% CIAB* 0.0% -4.1% -8 0% -5.2% -5.4% -5.6% CIAB 0.2% 10 0% -5.0% 8.0% -12.1% -11.0% -15.0% -10.0% 2003 2004 2005 2006 2007 2008 2009 2010 2011 30 Gallagher’s Brokerage Segment Organic Growth including supplemental commissions. See important disclosures regarding non-GAAP measures on Page 8. *Change in Average Commercial Rates.
|
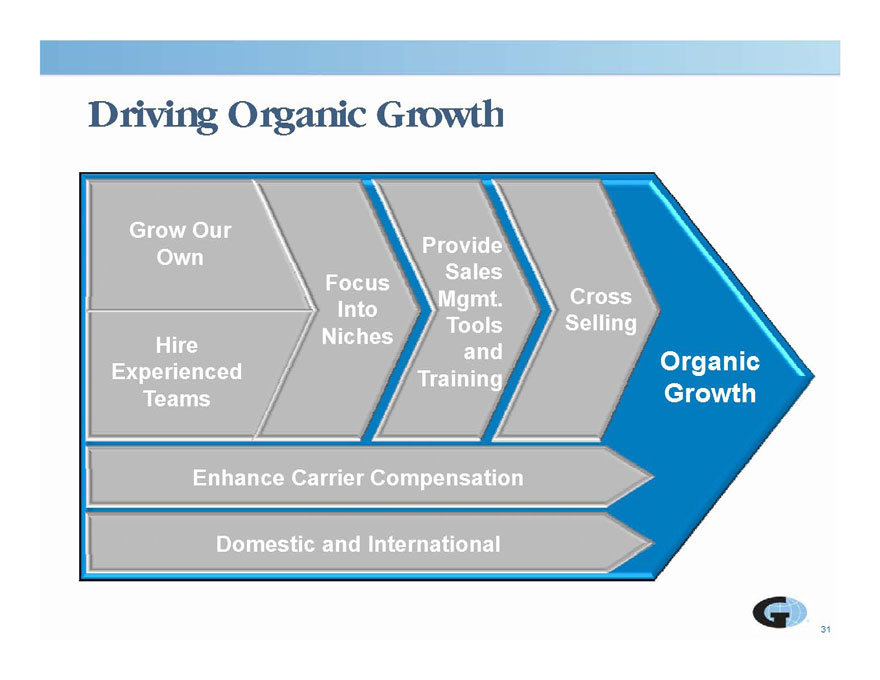
Driving Organic Growth Grow Our Own Focus Provide Sales Mgmt Cross Organic G Hire Experienced Into Niches Mgmt. Tools and Training Selling Growth p Teams Enhance Carrier Compensation Domestic and International 31
|
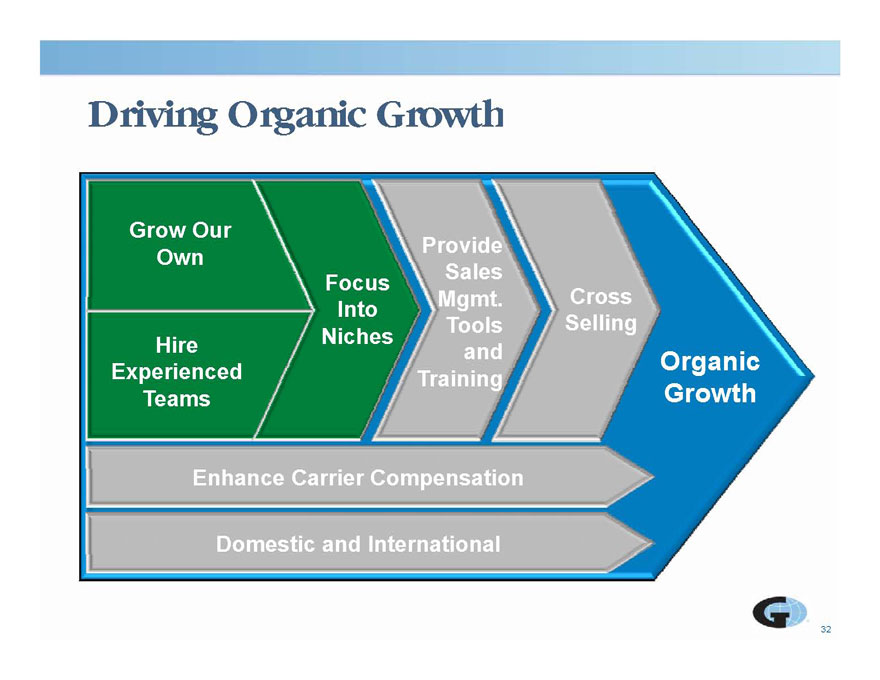
Driving Organic Growth Grow Our Own Focus Provide Sales Mgmt Cross Organic G Hire Experienced Into Niches Mgmt. Tools and Training Selling Growth p Teams Enhance Carrier Compensation Domestic and International 32
|
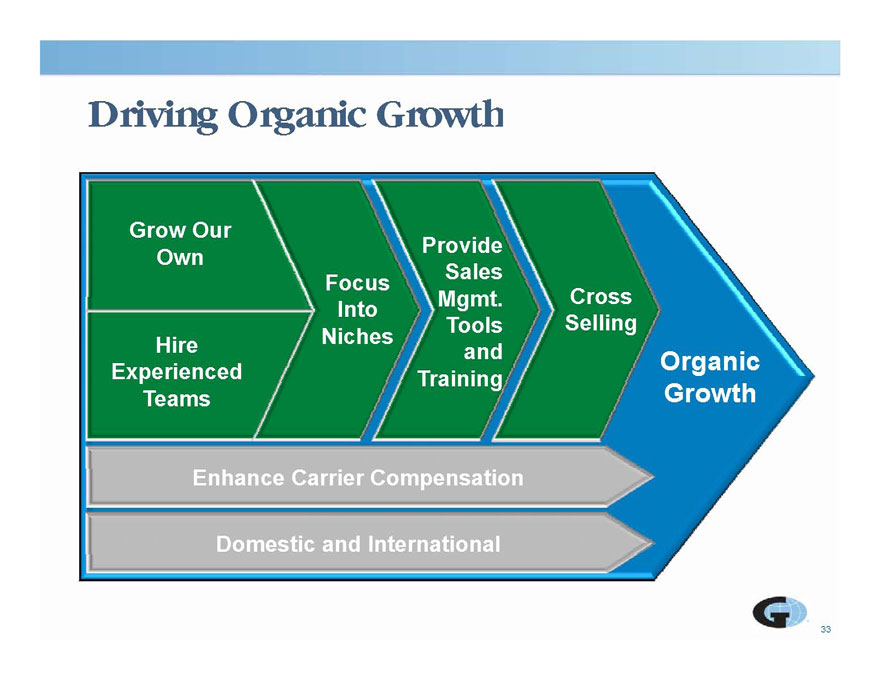
Driving Organic Growth Grow Our Own Focus Provide Sales Mgmt Cross Organic G Hire Experienced Into Niches Mgmt. Tools and Training Selling Growth p Teams Enhance Carrier Compensation Domestic and International 33
|
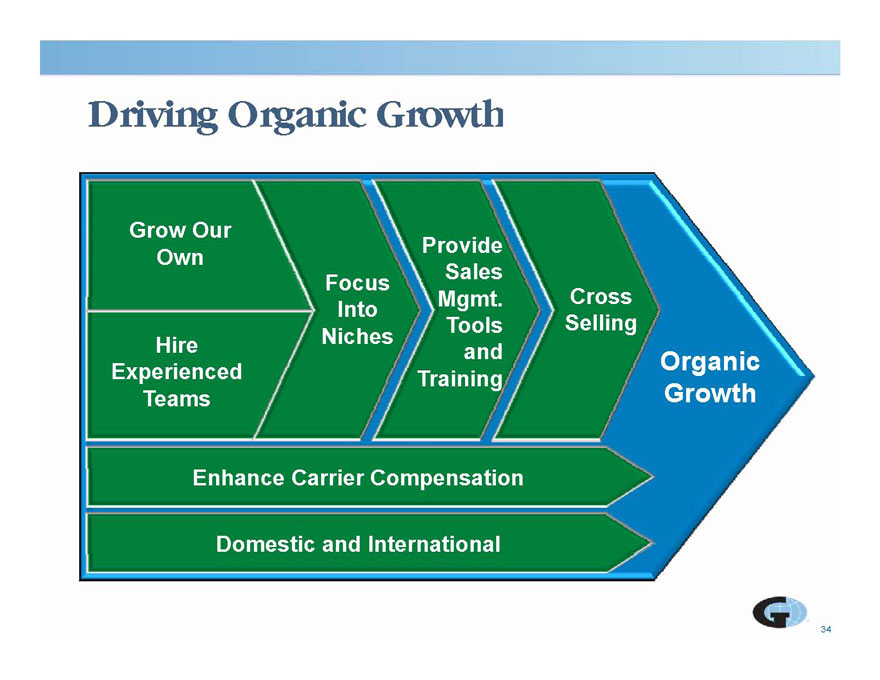
Driving Organic Growth Grow Our Own Focus Provide Sales Mgmt Cross Organic G Hire Experienced Into Niches Mgmt. Tools and Training Selling Growth p Teams Enhance Carrier Compensation Domestic and International
|
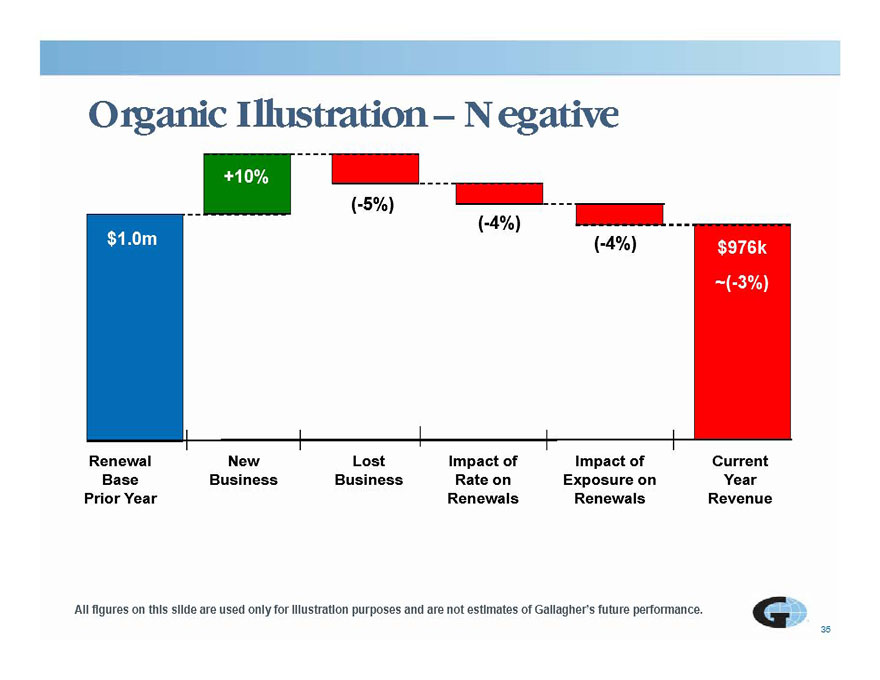
Organic Illustration – Negative +10% (-5%) $1.0m $976k ~(-3%) ( ) (-4%) (-4%) Renewal New Lost Impact of Impact of Current Base Prior Year Business Business Year Revenue p Rate on Renewals p Exposure on Renewals 35 All figures on this slide are used only for illustration purposes and are not estimates of Gallagher’s future performance.
|
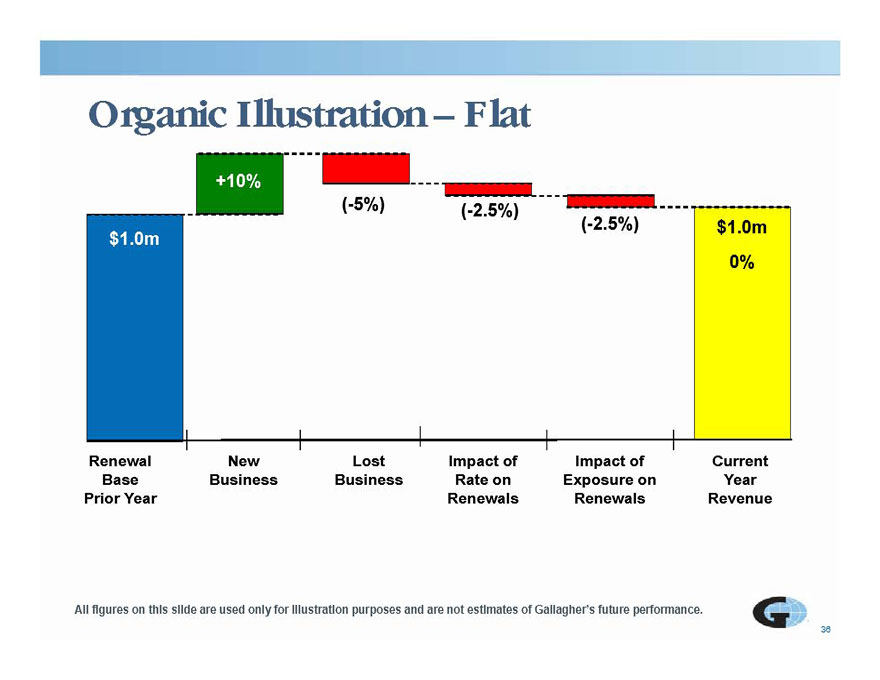
Organic Illustration – Flat +10% (-5%) (-2 5%) $1.0m $1.0m 0% ( ) 2.5%) (-2.5%) Renewal New Lost Impact of Impact of Current Base Prior Year Business Business Year Revenue p Rate on Renewals p Exposure on Renewals 36 All figures on this slide are used only for illustration purposes and are not estimates of Gallagher’s future performance.
|
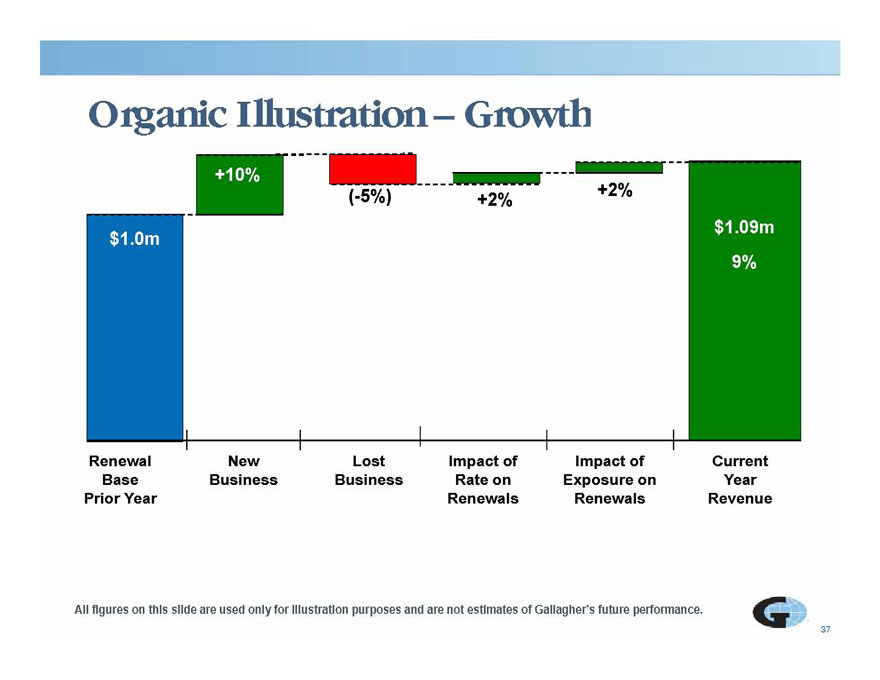
Organic Illustration – Growth +10% (-5%) +2% +2% $1.0m $1.09m 9% Renewal New Lost Impact of Impact of Current Base Business Prior Year Business Year Revenue p Rate on Renewals p Exposure on Renewals 37 All figures on this slide are used only for illustration purposes and are not estimates of Gallagher’s future performance.
|
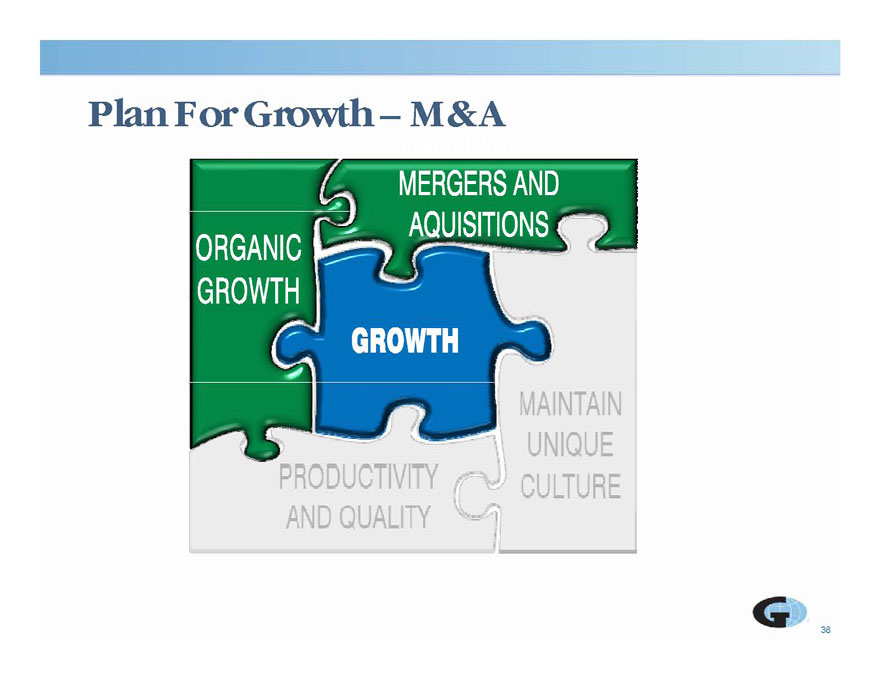
Plan For Growth – M&A
|
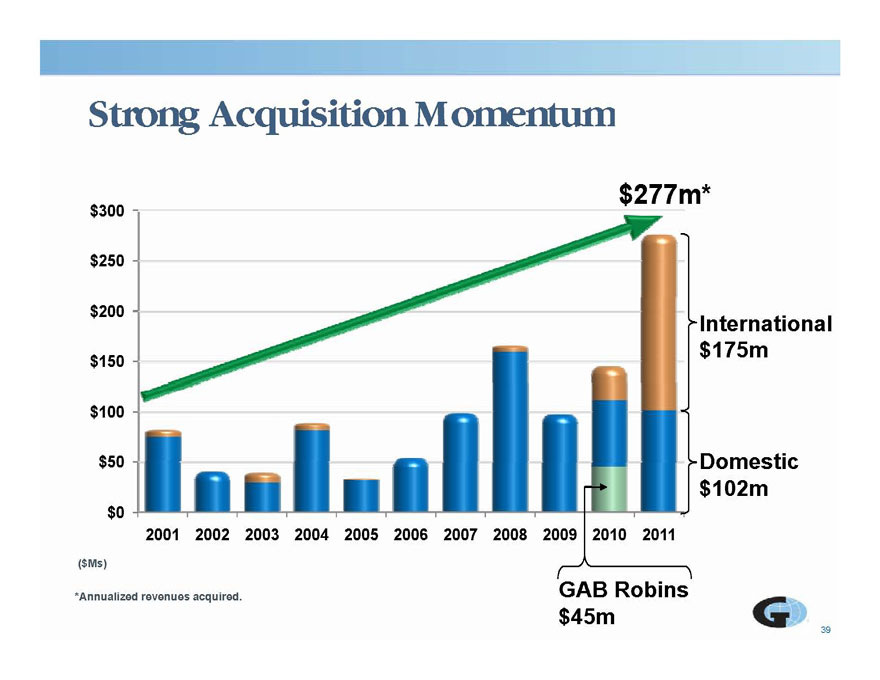
Strong Acquisition Momentum $277m* $250 $150 $200 International $175m $ 50 $100 Domestic $0 2001 2002 2003 2004 2005 2006 2007 2008 2009 2010 2011 $102m 39 ($Ms) GAB Robins $45m *Annualized revenues acquired.
|
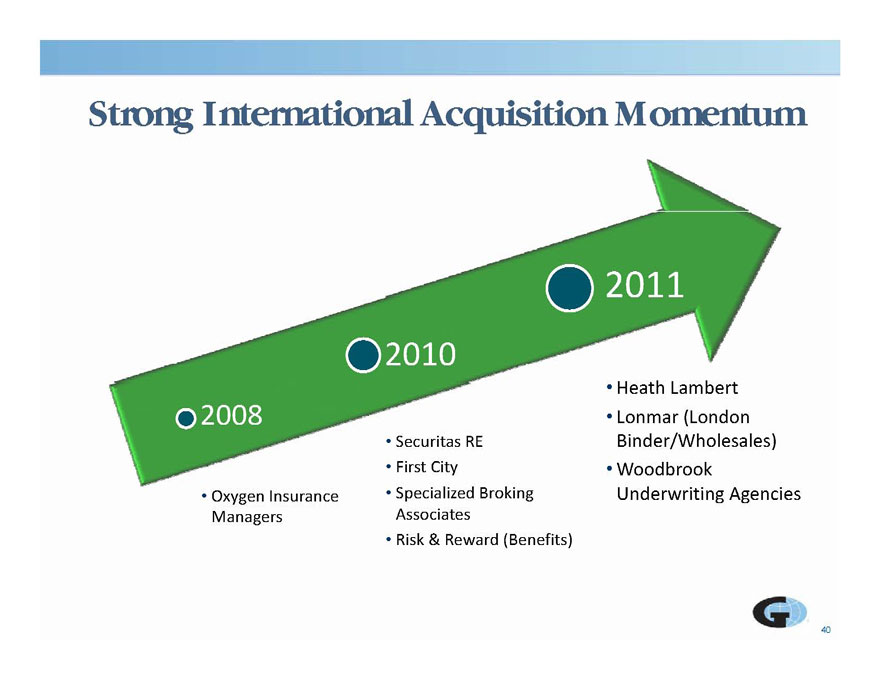
Strong International Acquisition MomentuS o g e o cqus o o e um 2011 2010 0 H thL b t 2008 Securitas RE First City Heath Lambert Lonmar (London Binder/Wholesales) Woodbrook Oxygen Insurance Managers Specialized Broking Associates Risk & Reward (Benefits) Underwriting Agencies 40
|
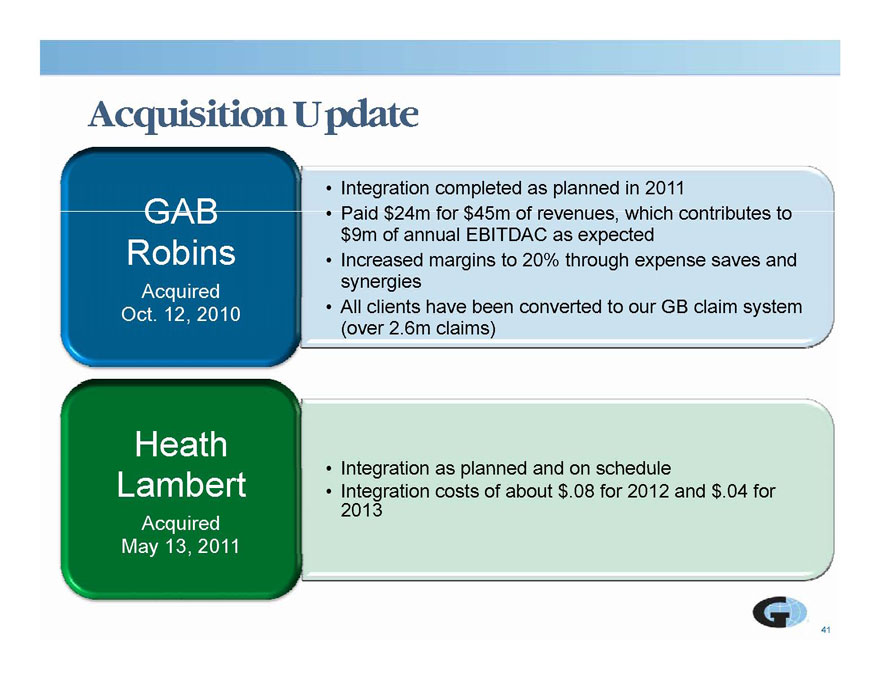
Acquisition Update Integration completed as planned in 2011 GAB Paid $24m for $45m of revenues, which contributes to $9m of annual EBITDAC as expected Increased margins to 20% through expense saves and synergies Robins Acquired All clients have been converted to our GB claim system (over 2.6m claims) Oct. 12, 2010 Heath Integration as planned and on schedule Integration costs of about $.08 for 2012 and $.04 for 2013 Lambert Acquired May 13, 2011 41 y ,
|
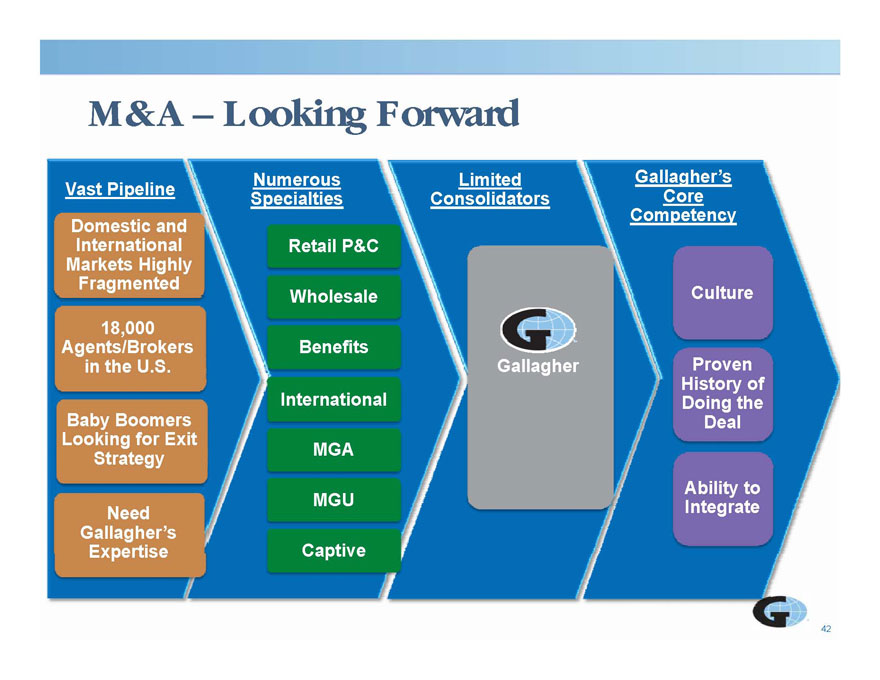
M&A Looking Forward Limited Consolidators Numerous Specialties Gallagher’s Core C t Vast Pipeline Domestic and Competency International Markets Highly Fragmented Retail P&C Wholesale Culture 18,000 Agents/Brokers in the U.S. Benefits Gallagher Proven History Baby Boomers Looking for Exit Strategy International MGA of Doing the Deal gy Need Gallagher’s Expertise MGU Captive Ability to Integrate 42
|
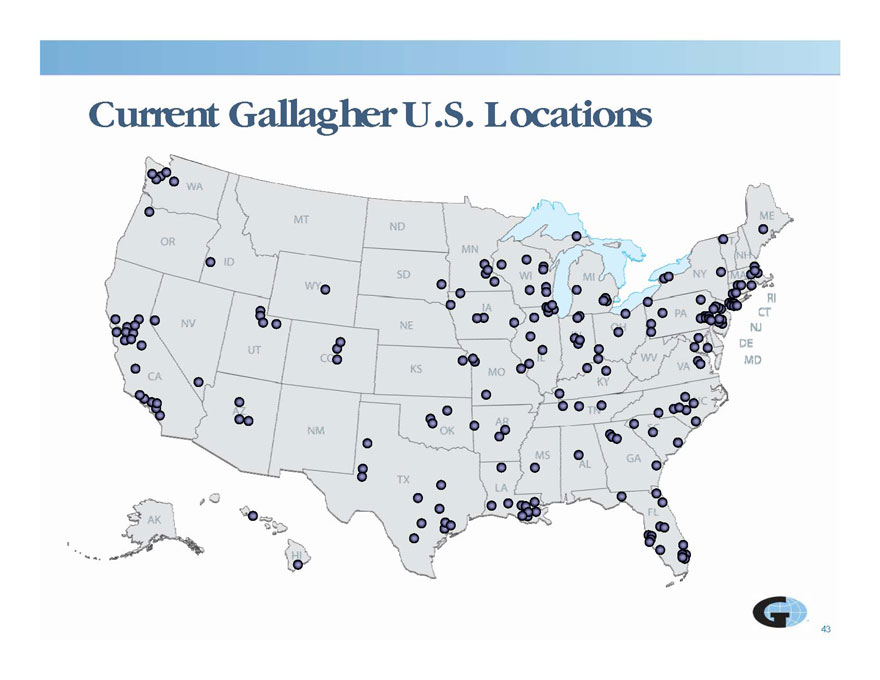
Current Gallagher U.S. Locations
|
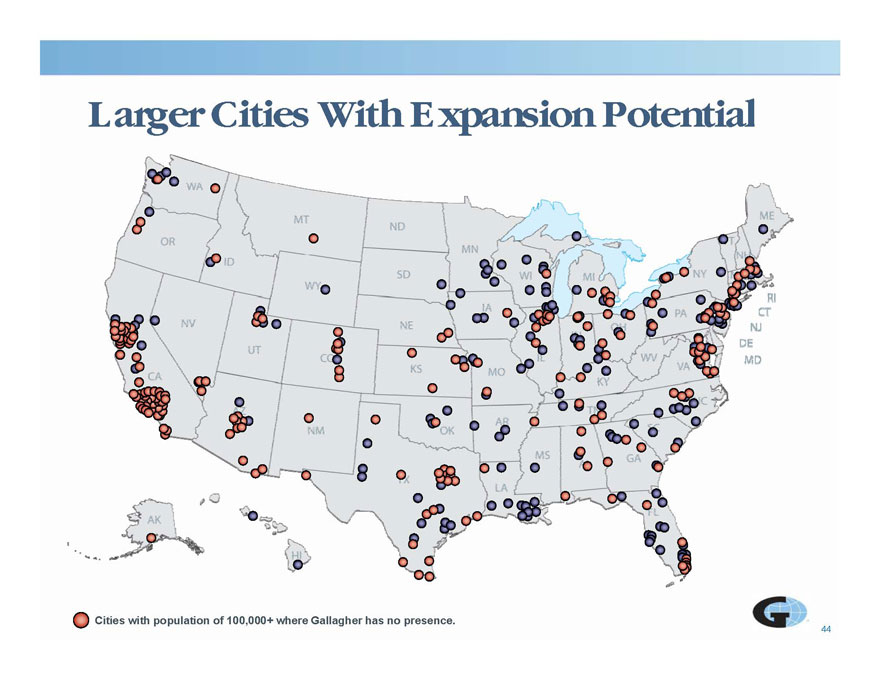
Larger Cities With Expansion Potential
44
Cities with population of 100,000+ where Gallagher has no presence.
|
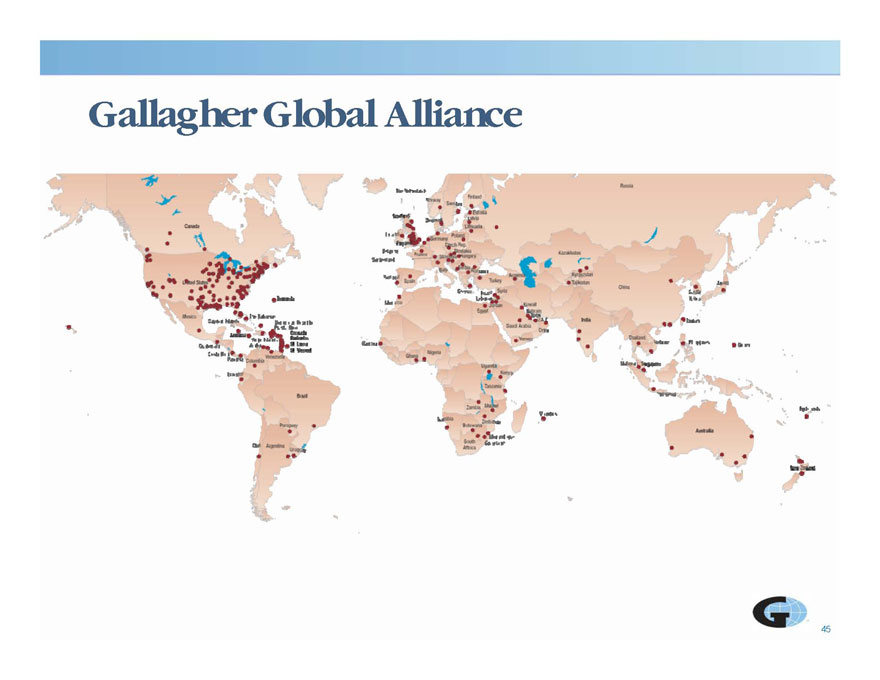
Gallagher Global Alliance
|
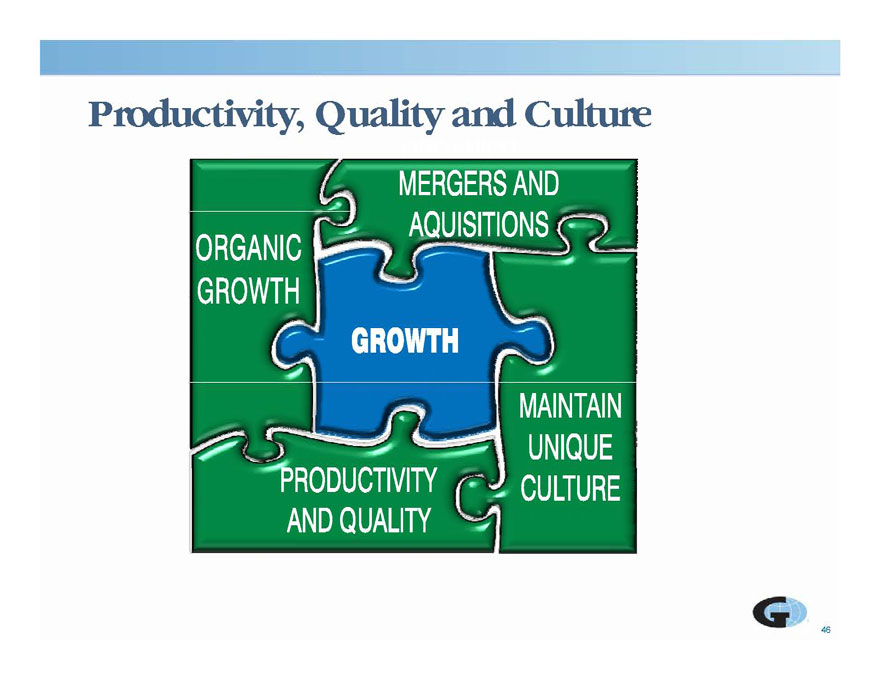
Productivity, Quality and Culture
|
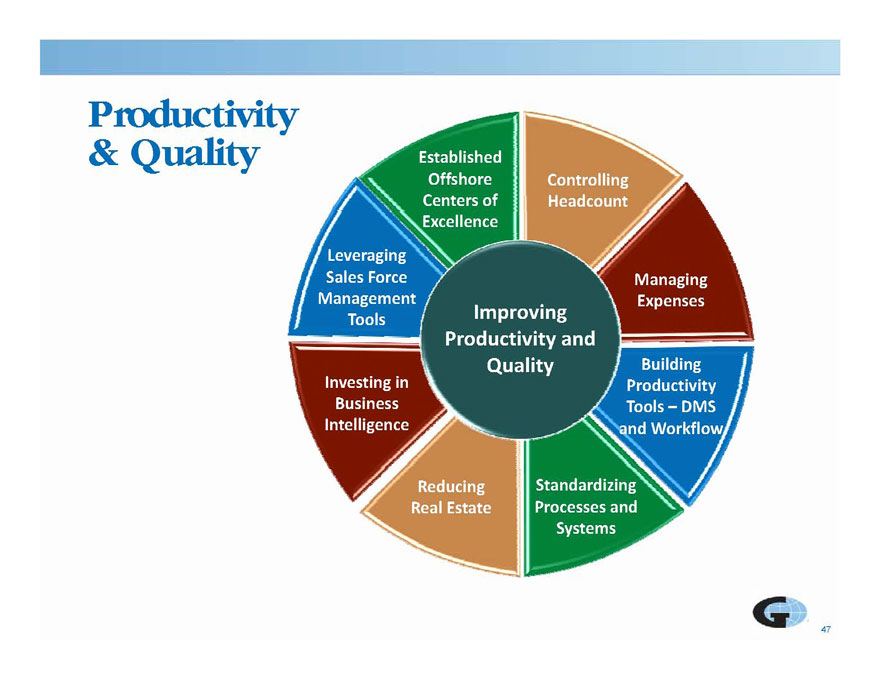
Productivity Controlling Headcount Established Offshore Centers of & Quality Excellence Managing E Leveraging Sales Force Management Expenses Building Investing in Productivity Tools Improving Productivity and Quality Tools – DMS and Workflow Business Intelligence Standardizing Processes and Systems Reducing Real Estate
|
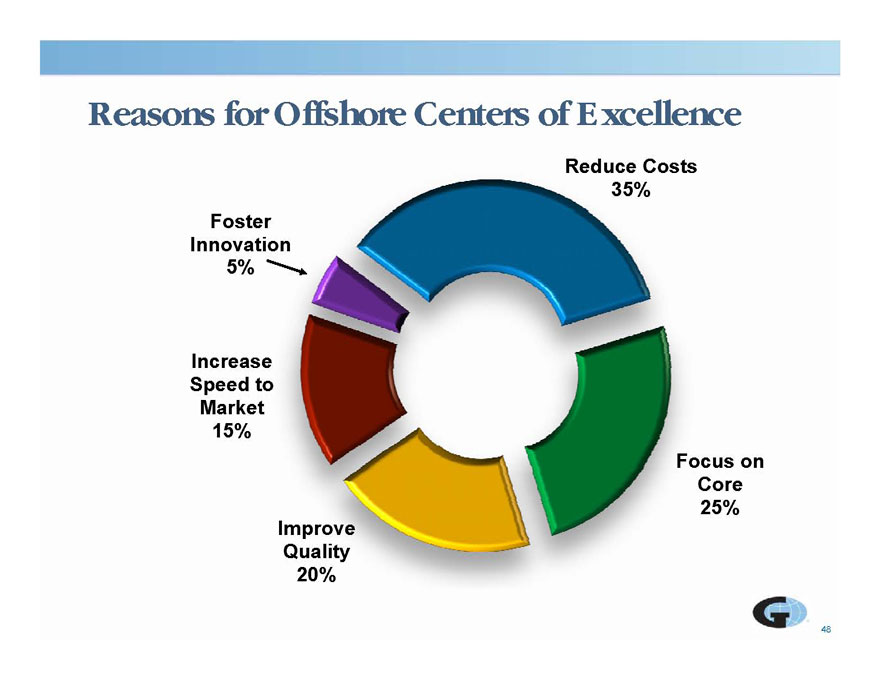
Reasons for Offshore Centers of Excellence Reduce Costs 35% Foster Innovation 5% Increase Speed to Market 15% Focus on Core 25% Improve Quality 48 20%
|
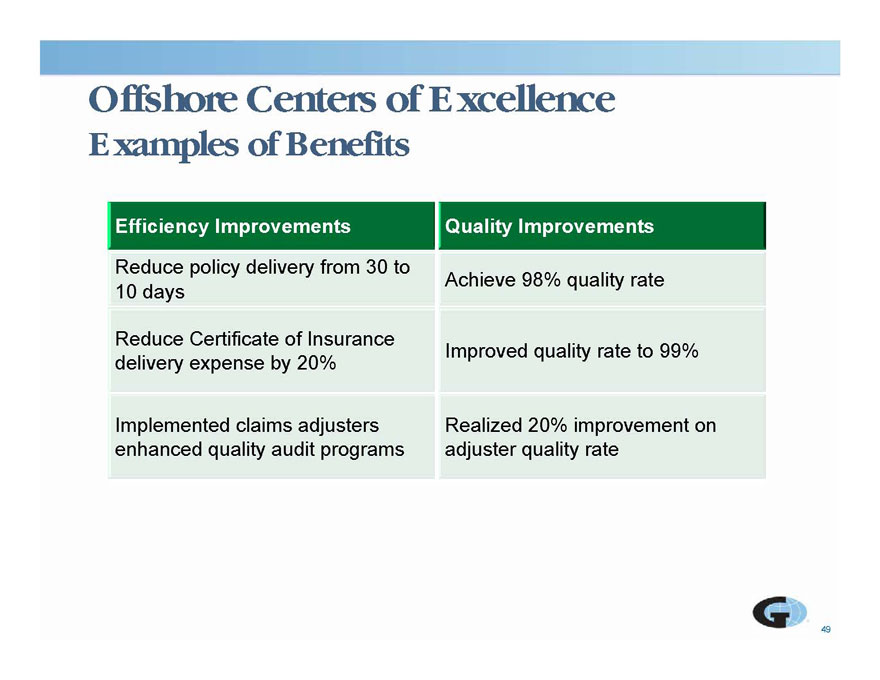
Offshore Centers of Excellence Examples of Benefits Efficiency Improvements Quality Improvements Reduce policy delivery from 30 to 10 days Achieve 98% quality rate Reduce Certificate of Insurance delivery expense by 20% Improved quality rate to 99% Implemented claims adjusters enhanced quality audit programs Realized 20% improvement on adjuster quality rate 49
|
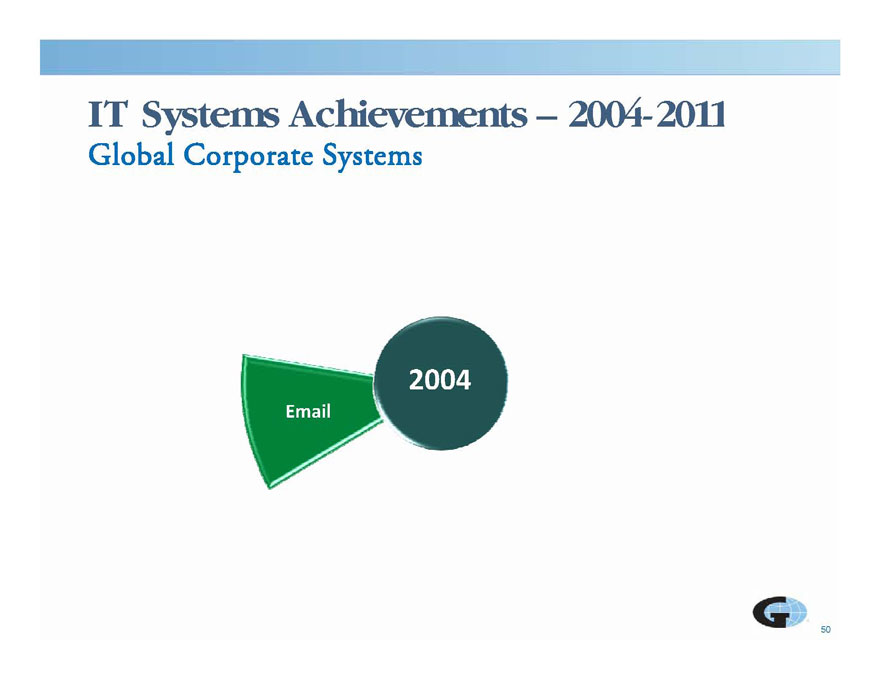
Systems Achievements – IT 2004-2011
Global Corporate Systems
|
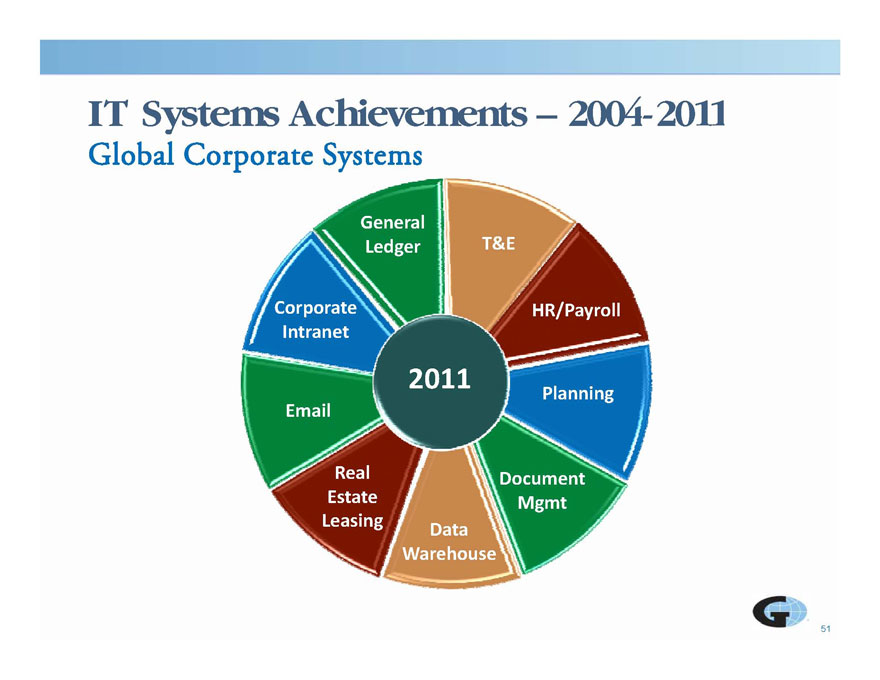
IT Systems 2004-2011 Global Corporate Systems T&E General Ledger Corporate HR/Payroll Intranet 201014 Planning R l Email Document Mgmt Data Warehouse Real Estate Leasing 51
|
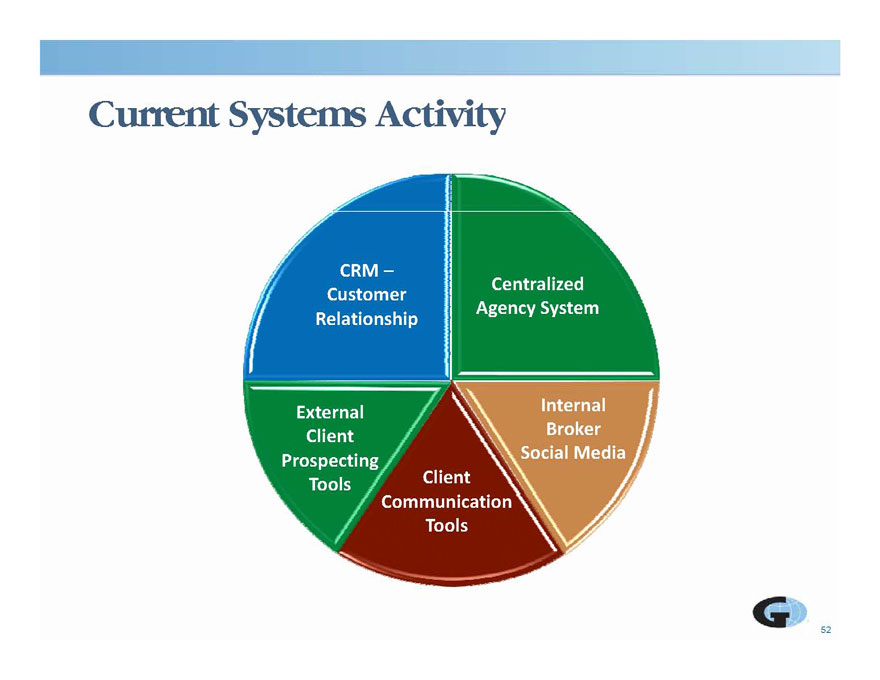
Current Systems Activity CRM – Customer Centralized Relationship Agency System Internal Broker Social Media External Client Prospecting Client Communication Tools p g Tools 52
|
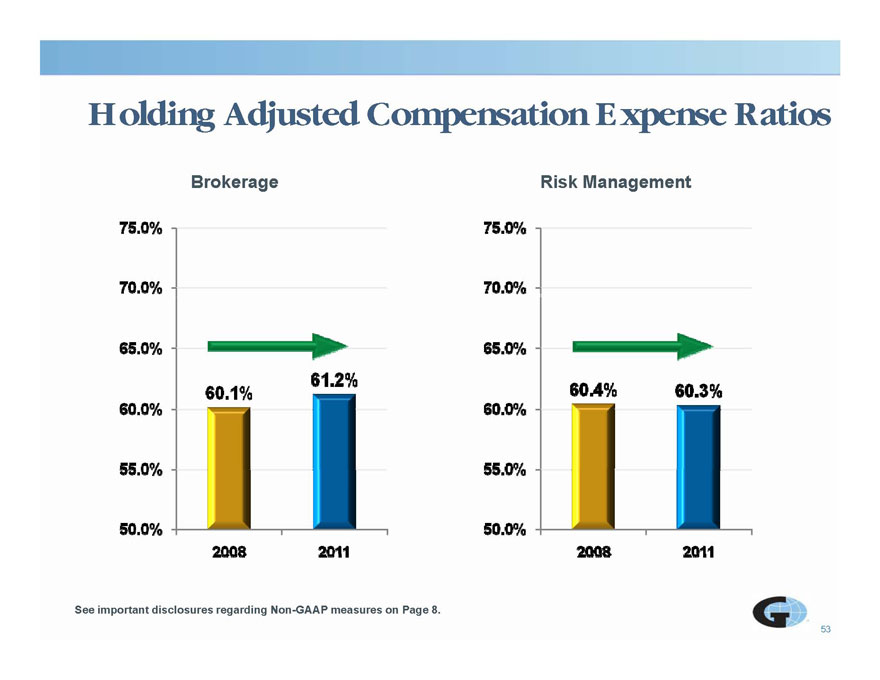
Holding Adjusted Compensation g j pensation Expense Ratios
Brokerage Risk Management
53
See important disclosures regarding Non-GAAP measures on Page 8.
|

Reducing Adjusted Operating g j p g Expense Ratio Brokerage Segment Risk Management Segment 22.5% 25.0% 30.0% 20.8% 17 5% 16 8% 20.0% 27.0% 25 0% 27.5% 16.8% 15.0% 17.5% 23.7% 22.5% 25.0% 10.0% 12.5% 2008 2011 20.0% 2008 2011 54 See important disclosures regarding Non-GAAP measures on Page 8.
|

2011 Greenwich Excellence award for quality of service to large corporations 2011 Mid-Market Buyers Choice TPA Expertise Honoree – Business Insurance 2011 Commercial Broker of the Year (Heath Lambert) – Insurance Times 2011 Sources to the Community Underwriting Agency of the Year finalist (Australis Group 2011 Sources to the Community Award (SBA Gallagher) M k fA hi tA d i – ANZIIF Underwriting) – ANZIIF Mark of Achievement Award winner – British Insurance Award (SBA Gallagher) M k fA hi tA d i – ANZIIF Underwriting) – ANZIIF 55 Mark of Achievement Award winner – British Insurance
|
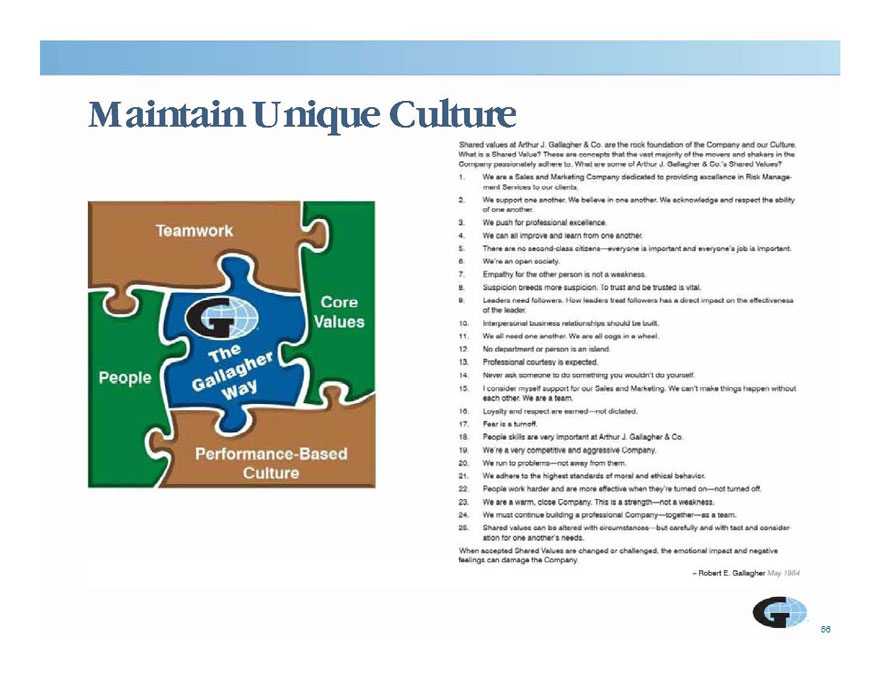
Maintain Unique Culture
56
|

Gallagher Recognized by Ethisphere g g y phere as One of the World’s Most Ethical Companies in 2012 Industry-leading commitment to ethics and dedication to integrity Chosen for: ? Promoting ethical business standards and practices ? Exceeding legal compliance standards ? Innovating to benefit the public ? Demonstrating that corporate citizenship is tied to company success Globally, only 145 organizations named 57
|
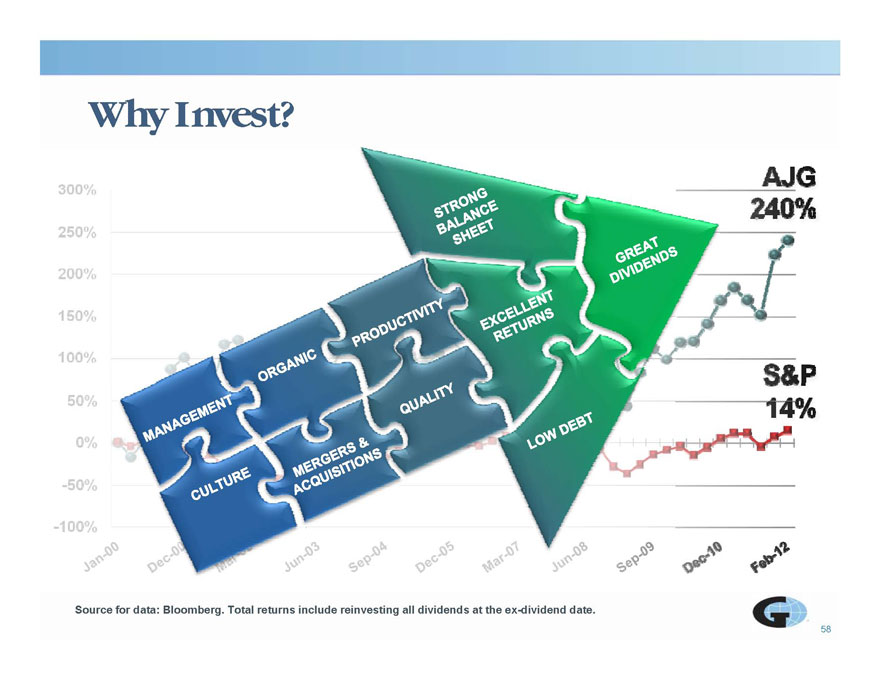
Why Invest?
Source for data: Bloomberg. Total returns include reinvesting all dividends at the ex-dividend date.
|

Questions & Answers