Exhibit 99.2
Investment ProfilE
NYSE: AJG
AuGusT
2012
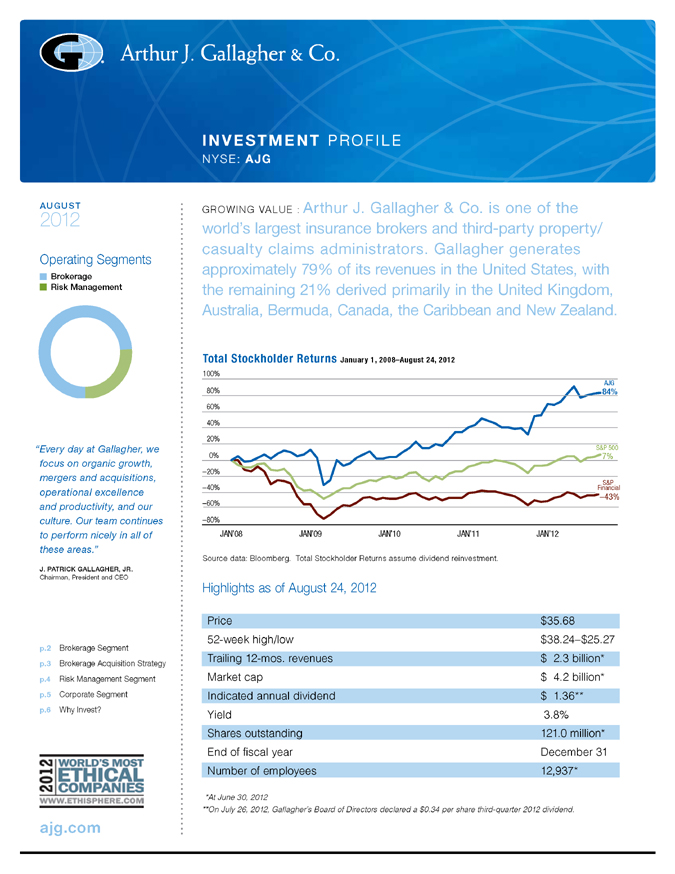
Operating Segments
Brokerage Risk Management
“Every day at Gallagher, we focus on organic growth, mergers and acquisitions, operational excellence and productivity, and our culture. Our team continues to perform nicely in all of these areas.”
J. PATRICK GALLAGHER, JR.
Chairman, President and CEO
p.2 Brokerage Segment p.3 Brokerage Acquisition Strategy p.4 Risk Management Segment p.5 Corporate Segment p.6 Why Invest?
ajg.com
GROWING VALUE : Arthur J. Gallagher & Co. is one of the world’s largest insurance brokers and third-party property/ casualty claims administrators. Gallagher generates approximately 79% of its revenues in the United States, with the remaining 21% derived primarily in the United Kingdom, Australia, Bermuda, Canada, the Caribbean and New Zealand.
Total Stockholder Returns January 1, 2008–August 24, 2012
100%
AJG
80% 84% 60% 40% 20%
S&P 500
0% 7% –20%
S&P –40% Financial
–43%
–60%
–80%
JAN’08 JAN’09 JAN’10 JAN’11 JAN’12
Source data: Bloomberg. Total Stockholder Returns assume dividend reinvestment.
Highlights as of August 24, 2012
Price $35.68 52-week high/low $38.24–$25.27 Trailing 12-mos. revenues $ 2.3 billion* Market cap $ 4.2 billion* Indicated annual dividend $ 1.36** Yield 3.8% Shares outstanding 121.0 million* End of fiscal year December 31 Number of employees 12,937*
*At June 30, 2012
**On July 26, 2012, Gallagher’s Board of Directors declared a $0.34 per share third-quarter 2012 dividend.
BROKERAGE SEGMENT
approxiMately 75% oF reVeNUes
Gallagher’s Brokerage Segment does business through a network of more than 300 retail and wholesale sales and service offices located throughout the United States and in 16 other countries. In addition, Gallagher has developed the Gallagher Global Alliance of independent insurance brokers and consultants, which enables it to provide coverages and services to its clients in more than 110 countries around the world.
Retail Insurance Brokerage Operations
78% oF Broker aGe seGMeNt reVeNUes
Gallagher negotiates and places nearly all lines of property/ casualty (P/C) insurance, employer-provided health and welfare insurance, and retirement solutions, principally for middle-market commercial, industrial, public entity, religious and not-for-profit entities. Revenues are generated through commissions paid by insurance companies, usually based upon a percentage of the premium paid by insureds, and through brokerage and advisory fees paid directly by its clients.
Gallagher’s retail brokerage operations are organized into more than 190 geographic profit centers located primarily throughout the United States, Canada, the Caribbean, the United Kingdom and Australia. They operate primarily within certain key niche/practice groups, which account for approximately 67% of Gallagher’s retail brokerage revenues. These specialized teams target areas of business and/or industries in which Gallagher has developed a depth of expertise and a large client base.
The concentrated focus of these niche/practice groups allows for highly targeted marketing efforts and facilitates the development of value-added products and services specific to those industries or business segments. Gallagher believes that the detailed understanding and broad client contacts developed within these niche/practice groups provide Gallagher with a competitive advantage.
Gallagher anticipates that the greatest revenue growth over the next several years within its retail brokerage operations will continue to come from: mergers and acquisitions; its niche/ practice groups and middle-market accounts; cross-selling other brokerage products and services to existing customers; and developing and managing alternative market mechanisms, such as captives, rent-a-captives and deductible plans/self insurance.
Niche/practice GroUps
Agribusiness International Benefits Aviation & Aerospace Marine Captive Consulting Manufacturing Construction Personal Cyber Liability Professional Groups Energy Private Equity Entertainment Public Entity Executive Benefits Real Estate Global Risks Religious/Not-for-Profit Health and Welfare Restaurant Healthcare Retirement Healthcare Analytics Scholastic Higher Education Technology/Telecom Hospitality Transportation Human Resources Voluntary Benefits
Fluctuations in premiums charged by P/C insurance carriers have a direct and potentially material impact on the insurance brokerage industry. Commission revenues are generally based on a percentage of the premiums paid by insureds and normally follow premium levels. Insurance premiums are cyclical in nature and may vary widely based on market conditions. After several years of premium rate reductions driven by competitive market conditions, commercial P/C pricing began to rebound in the fourth quarter of 2011 and rates continue to increase in 2012. According to a second quarter 2012 market survey conducted by the Council of Insurance Agents & Brokers, U.S. commercial P/C premiums rose by an average of 4.3% in the second quarter of 2012.
2—Arthur J. Gallagher & Co.
Significant lines of coverage & consulting service capabilities
401(k) Solutions Fire 403(b) Solutions General Liability Aviation Life Casualty Marine Commercial Auto Medical Dental Product Liability Directors & Officers Professional Liability Liability Property Disability Wind Earthquake Workers Compensation Errors & Omissions
GallaGher DeliVers GloBal BrokeraGe capaBilities
In addition to the 17 countries where Gallagher now has operations, the company actively manages business relationships with a network of approved independent brokers that expands the P/C brokerage capabilities it offers multinational clients to more than 110 countries around the world. Gallagher Global Alliance (GGA) members are selected based upon common business philosophies and their capabilities within their respective countries. GGA offers both strength and flexibility, enabling global servicing of Gallagher clients, and the clients of other GGA members, no matter where in the world they operate. Gallagher also offers employee benefits brokerage and consulting services to clients throughout North America and the United Kingdom. Through Gallagher International Benefit Services (GIBS), a joint venture formed in 2011 between Gallagher and IBIS Advisors, Gallagher can now handle the international benefits needs of its U.S. clients in more than 90 countries around the world.
Wholesale Insurance Brokerage Operations 22% oF 2011 Broker aGe seGMeNt reVeNUes
Gallagher’s wholesale brokerage operations assist retail brokers and agents in the placement of specialized, unique and hard-to-place insurance programs. Wholesale revenues are generated through sharing the commissions paid to the retail broker by the insurance carrier.
Gallagher’s wholesale brokerage operations are organized into more than 65 geographic profit centers located primarily in the United States and Bermuda, and through its approved Lloyd’s of London broker. In certain cases Gallagher acts as a brokerage wholesaler and in other cases Gallagher acts as a managing general agent or managing general underwriter, handling specialized insurance coverages for insurance carriers.
More than 75% of Gallagher’s wholesale brokerage revenues come from retail brokers and agents not affiliated with Gallagher. Based on wholesale premium volume from P/C risks, Gallagher’s U.S. wholesale brokerage operation ranks as the largest domestic managing general agency/underwriting manager, according to Business Insurance magazine. That operation places a strong focus on binding, programs, standard lines aggregation and open brokerage business.
Gallagher anticipates growing its wholesale brokerage operations by increasing its number of broker clients, by developing new managing general agency/underwriter programs, and through mergers and acquisitions.
BrokeraGe seGMeNt acqUisitioN strateGy
Gallagher is highly growth-oriented. Its Brokerage Segment growth strategy has two primary components: organic growth through new business production and the strategic acquisition of complementary businesses. Gallagher completed and integrated approximately 313 acquisitions from 1985 through June 2012, substantially all within the Brokerage Segment. Most were regional or local retail or wholesale brokers possessing a strong middle-market focus or significant expertise in a desirable market niche. Gallagher typically acquires companies that generate between $1 million and $10 million in annual revenues. In addition, Gallagher is focused on international expansion through acquisitions and joint ventures, where the company typically begins its relationship with an equity position.
Gallagher is highly selective. An acquisition must offer significant benefits, such as expanding the company’s talent pool, enhancing its geographic presence and service capabilities, and/or broadening and further diversifying its business mix. In selecting acquisition candidates, Gallagher also focuses on: a corporate culture that matches Gallagher’s sales-oriented culture; a profitable, growing business that could further enhance its ability to compete by gaining access to Gallagher’s greater resources; clearly defined financial criteria.
Contributing to the company’s success as an acquirer is its attractiveness as a merger partner. Gallagher believes that growth-oriented independent brokers and consultants are attracted by its aggressive, sales-oriented culture, team-based approach and depth of resources.
2012 Investment Profile—3

RISK MANAGEMENT SEGMENT
approxiMately 25% oF reVeNUes
Based on revenues, Gallagher’s Risk Management operation currently ranks as the world’s largest third-party P/C claims administrator, according to Business Insurance magazine. Gallagher provides contract claims settlement and administration services for entities that self-insure and insurance companies that outsource their claims-handling services.
Gallagher’s Risk Management operation also offers managed care, information management and appraisal services, as well as consultative services and training programs that help clients mitigate losses, combat claims fraud and maintain regulatory compliance.
Approximately 67% of Gallagher’s Risk Management Segment revenues are derived from managing workers compensation-related claims, 26% are from general and commercial auto liability-related claims, and 7% are from property-related claims. In addition, Gallagher generates revenues from integrated disability management (employee absence management) programs, information services, risk control consulting (loss control) services, investigative services and appraisal services, either individually or in combination with managing claims. Revenues are substantially in the form of fees, generally negotiated in advance, on a per-claim or per-service basis, depending upon the type and estimated volume of the services to be performed.
Gallagher manages its third-party claims management operations through a network of approximately 110 offices located throughout the United States, the United Kingdom, Australia, New Zealand and Canada. Clients are primarily Fortune 1000 companies, larger middle-market companies, not-for-profit organizations and public entities. More than 86% of Gallagher’s risk management revenues come from clients that do not use Gallagher as their retail or wholesale insurance broker.
The Risk Management Segment expects its most significant growth prospects through the next several years to come from new business with Fortune 1000 companies, governmental agencies, larger middle-market companies, captives, program business and the outsourcing of insurance company claims departments. In addition, the Risk Management Segment may grow in the future through mergers and acquisitions.
expertise
Real-time Claims Management Recoveries (subrogation, salvage, etc.) Appraisal Services Litigation Management
Information Management Managed Care Services Risk Control Services Safety Programs
Settlement Management Education & Training Investigative Services
information regarding Non-Gaap Measures
This investment profile includes references to Adjusted EBITDAC and Adjusted EBITDAC Margin Excluding Heath Lambert, which are performance measures not in accordance with, or an alternative to, GAAP information. EBITDAC is defined as earnings from continuing operations before interest, income taxes, depreciation, amortization and the change in estimated acquisition earnout payables. Adjusted EBITDAC is defined as EBITDAC adjusted to exclude gains realized from sales of books of business, supplemental commission timing amounts, workforce-related charges, acquisition-related integration costs and litigation settlements. Adjusted EBITDAC margin excluding Heath Lambert is defined as Adjusted EBITDAC further adjusted to exclude the EBITDAC associated with the acquisition of Heath Lambert operations, divided by total revenues, as adjusted to exclude gains realized from sales of books of business, supplemental commission timing amounts and the revenues associated with the acquired Heath Lambert operations. For the non-GAAP measures set forth on page 6 of this profile, the most directly comparable GAAP measure is earnings from continuing operations, which, for the Brokerage and Risk Management Segments on a combined basis, was $132 million in 2008, $154 million in 2009, $167 million in
2010 and $174 million in 2011. Please see “Reconciliation of Non-GAAP Measures” on Gallagher’s Web site at ajg.com under “Investor Relations” for the purpose of each non-GAAP measure used and a reconciliation to the most directly comparable GAAP measure.
4—Arthur J. Gallagher & Co.
CORPORATE SEGMENT
Gallagher’s debt, clean energy investments, external acquisition-related costs and other corporate costs are reported in this segment.
cleaN eNerGy iNVestMeNts at jUNe 30, 2012
Gallagher owns positions in various commercial operations that help coal-fired utilities eliminate large quantities of harmful emissions.
1. Gallagher holds investment positions in 29 commercial clean coal production plants of which 14 were built and began production in 2009 and 15 were built and began production in 2011.
Of the 14 total 2009-Era Plants, 12 produce refined coal under long-term agreements with utilities. Gallagher is currently seeking co-investors and long-term utility customers for the remaining 2 plants.
Of the 15 total 2011-Era Plants, 5 produce refined coal under long-term agreements with utilities. Gallagher has a signed, long-term production agreement for one plant and also has non-binding, long-term production agreements for 2 other plants. All three of these plants are currently not operating. Gallagher is currently seeing co-investors and long-term utility customers for the remaining 7 plants.
Gallagher believes all these plants qualify for tax credits under Section 45 of the Internal Revenue Code. See Gallagher’s most recent earnings release at ajg.com for management’s latest guidance on earnings and additional information on these investments.
2. Gallagher owns 42% of Chem-Mod LLC, which possesses rights, information and technologies used for the reduction of unwanted emissions created during the combustion of coal. Various clean coal production plants, including those in which Gallagher has invested, license and use Chem-Mod’s technologies in the production of refined fuel. See Gallagher’s most recent earnings release atajg.com for management’s latest guidance on earnings and additional information on this investment.
information regarding Forward-looking statements
This investment profile contains “forward-looking statements” within the meaning of the Private Securities Litigation Reform Act of 1995. When used in this investment profile, the words “anticipates,” “believes,” “contemplates,” “should,” “could,” “estimates,” “expects,” “intends,” “plans” and variations thereof and similar expressions are intended to identify forward-looking statements. Examples of forward-looking statements in this investment profile include, but are not limited to, statements related to expected dividend amounts, anticipated areas of revenue growth within the Brokerage and Risk Management Segments, Gallagher’s acquisition strategy and level of acquisition activity, and future income and tax credits generated by and developments relating to Gallagher’s clean energy investments. Important factors that could cause actual results to differ materially from those in the forward-looking statements include the following: changes in worldwide and national economic conditions, changes in premium rates and insurance markets generally, and changes in the insurance brokerage industry’s competitive landscape could impact Gallagher’s future dividends, revenue growth and acquisition program; and uncertainties related to Gallagher’s IRC Section 45 investments, including uncertainties related to political and regulatory risks, including potential actions by Congress or challenges by the IRS eliminating or reducing the availability of tax credits under IRC Section 45 retroactively and/or going forward; maintenance of long-term permits needed to operate the plants; the ability to find new operating sites, if necessary; the ability to maintain and find co-investors; utilities’ future use of, or demand for, coal; plant operational risks, including supply-chain risks; the potential for divergent business objectives by co-investors and other stakeholders; intellectual property risks; and environmental
risks; could impact Gallagher’s future income and tax credits generated by and developments relating to its clean energy investments.
Refer to Gallagher’s filings with the SEC, including Item 1A, “Risk Factors,” of its Annual Report on Form 10-K for the fiscal year ended December 31, 2011, for a more detailed discussion of these and other factors that could impact its forward-looking statements.
2012 Investment Profile—5
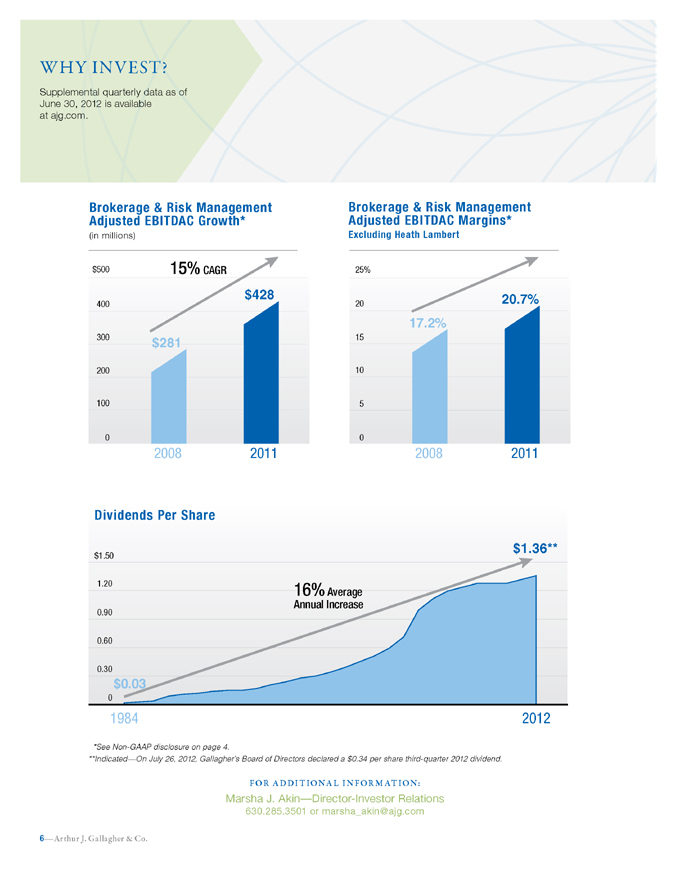
Why INvEST?
Supplemental quarterly data as of June 30, 2012 is available at ajg.com.
Adjusted Brokerage EBITDAC & Risk Management Growth*
(in millions)
$500 13% 15% CAGR CAGR
400 $428 300 $281
200
100
0
2008 2011
Adjusted Brokerage EBITDAC & Risk Management Margins*
Excluding Heath Lambert
25%
20 20.7% 17.2%
15 10 5
0
2008 2011
Dividends Per Share
$1.36**
$1.50
1.20
16% Average Annual Increase
0.90
0.60
0.30 $0.03 0
1984 2012
*See Non-GAAP disclosure on page 4.
**Indicated—On July 26, 2012, Gallagher’s Board of Directors declared a $0.34 per share third-quarter 2012 dividend.
FOR A DDIT IONA L I N FOR M AT ION:
Marsha J. Akin—Director-investor relations
630.285.3501 or marsha_akin@ajg.com
6—Arthur J. Gallagher & Co.