Exhibit 99.1
Exhibit 99.1
ARTHUR J. GALLAGHER & CO.Presented by:J. Patrick Gallagher, Jr. Chairman, President and CEO Douglas K. Howell CFO Bank of America Merrill Lynch Insurance Conference February 13, 2013
|
|
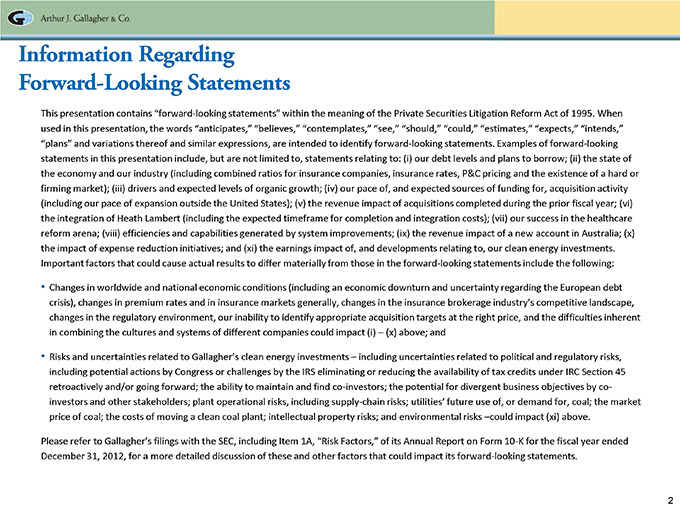
Information Regarding Forward-Looking Statements This presentation contains “forward-looking statements” within the meaning of the Private Securities Litigation Reform Act of 1995. When used in this presentation, the words “anticipates,” “believes,” “contemplates,” “see,” “should,” “could,” “estimates,” “expects,” “intends,” “plans” and variations thereof and similar expressions, are intended to identify forward-looking statements. Examples of forward-looking statements in this presentation include, but are not limited to, statements relating to: (i) our debt levels and plans to borrow; (ii) the state of the economy and our industry (including combined ratios for insurance companies, insurance rates, P&C pricing and the existence of a hard or firming market); (iii) drivers and expected levels of organic growth; (iv) our pace of, and expected sources of funding for, acquisition activity (including our pace of expansion outside the United States); (v) the revenue impact of acquisitions completed during the prior fiscal year; (vi) the integration of Heath Lambert (including the expected timeframe for completion and integration costs); (vii) our success in the healthcare reform arena; (viii) efficiencies and capabilities generated by system improvements; (ix) the revenue impact of a new account in Australia; (x) the impact of expense reduction initiatives; and (xi) the earnings impact of, and developments relating to, our clean energy investments. Important factors that could cause actual results to differ materially from those in the forward-looking statements include the following: Changes in worldwide and national economic conditions (including an economic downturn and uncertainty regarding the European debt crisis), changes in premium rates and in insurance markets generally, changes in the insurance brokerage industry’s competitive landscape, changes in the regulatory environment, our inability to identify appropriate acquisition targets at the right price, and the difficulties inherent in combining the cultures and systems of different companies could impact (i) – (x) above; and Risks and uncertainties related to Gallagher’s clean energy investments – including uncertainties related to political and regulatory risks, including potential actions by Congress or challenges by the IRS eliminating or reducing the availability of tax credits under IRC Section 45 retroactively and/or going forward; the ability to maintain and find co-investors; the potential for divergent business objectives by co-investors and other stakeholders; plant operational risks, including supply-chain risks; utilities’ future use of, or demand for, coal; the market price of coal; the costs of moving a clean coal plant; intellectual property risks; and environmental risks –could impact (xi) above. Please refer to Gallagher’s filings with the SEC, including Item 1A, “Risk Factors,” of its Annual Report on Form 10-K for the fiscal year ended December 31, 2012, for a more detailed discussion of these and other factors that could impact its forward-looking statements.
|
|
This presentation includes references Adjusted EBITDAC, Adjusted EBITDAC margin, Adjusted Revenues, Adjusted Operating Expense Ratio, Organic Growth and Adjusted Cash Generation, which are measures not in accordance with, or an alternative to, the GAAP information provided herein. Earnings Measures—Gallagher believes that each of Adjusted EBITDAC and Adjusted EBITDAC margin, as defined below, provides a meaningful representation of its operating performance and improves the comparability of Gallagher’s results between periods by eliminating the impact of certain items that have a high degree of variability. Adjusted EBITDAC is defined as earnings from continuing operations before interest, income taxes, depreciation, amortization and the change in estimated acquisition earnout payables (EBITDAC), further adjusted to exclude gains realized from sales of books of business, supplemental commission timing amounts, Heath Lambert integration costs, earnout related compensation charges, workforce related charges, lease termination related charges, New Zealand earthquake claims administration costs, GAB Robins integration costs, South Australia ramp up costs, acquisition related adjustments and the impact of foreign currency translation, as applicable. Adjusted EBITDAC margin is defined as Adjusted EBITDAC divided by Adjusted Revenues (defined below). The most directly comparable GAAP measure for these non-GAAP earnings measures is earnings from continuing operations. For the Brokerage Segment, the Risk Management Segment, and the two segments on a combined basis, earnings from continuing operations was $140 million, $33 million, and $173 million, respectively, in 2011, and $156 million, $42 million and $198 million, respectively, in 2012. Revenue and Expense Measures—Gallagher believes that Adjusted Revenues and Adjusted Operating Expense Ratio, each as defined below, provides stockholders and other interested persons with useful information that will assist such persons in analyzing Gallagher’s operating results as they develop a future outlook for Gallagher. Gallagher believes that Organic Growth provides a comparable measurement of revenue growth that is associated with the revenue sources that will be continuing in 2013 and beyond. Gallagher has historically viewed organic revenue growth as an important indicator when assessing and evaluating the performance of its Brokerage and Risk Management segments. Gallagher also believes that using this measure allows financial statement users to measure, analyze and compare the growth from its Brokerage and Risk Management segments in a meaningful and consistent manner. Adjusted Revenues is defined as revenues, adjusted to exclude gains realized from sales of books of business and revenue from New Zealand earthquake claims administration. Adjusted Operating Expense Ratio is defined as operating expense, adjusted to exclude Heath Lambert and GAB Robins integration costs, South Australia ramp up costs, workforce related charges, lease termination related charges, acquisition related adjustments and the impact of foreign currency translation, as applicable, divided by Adjusted Revenues. Organic Growth is defined as organic change in base commission and fee revenues, and excludes the first twelve months of net commission and fee revenues generated from acquisitions accounted for as purchases and the net commission and fee revenues related to operations disposed of in each year presented. These commissions and fees are excluded from organic revenues in order to help interested persons analyze the revenue growth associated with the operations that were a part of Gallagher in both the current and prior year. In addition, change in organic growth excludes the impact of supplemental commission and contingent commission revenues, and the period-over-period impact of foreign currency translation. The amounts excluded with respect to foreign currency translation are calculated by applying 2012 foreign exchange rates to the same periods in 2011. For the Risk Management segment, organic change in base domestic and international fee revenues excludes international performance bonus fees and New Zealand earthquake claims administration to improve the comparability of our results between periods by eliminating the impact of the items that have a high degree of variability or due to the limited-time nature of these revenue sources. The most directly comparable GAAP measure for Adjusted Revenues and Organic Growth is revenues. For the Brokerage Segment, the Risk Management Segment, and the two segments on a combined basis, revenues were $1,556 million, $549 million, and $2,105 million, respectively, in 2011, and $1,827 million, $572 million and $2,399 million, respectively, in 2012. For the Brokerage Segment, revenues were $533 million, $679 million, $783 million, $863 million, $946 million, $1,007 million, $1,114 million, $1,188 million, $1,276 million, $1,341 million, $1,556 million and $1,827 million, in 2001, 2002, 2003, 2004, 2005, 2006, 2007, 2008, 2009, 2010, 2011 and 2012, respectively. The most directly comparable GAAP measure for Adjusted Operating Expense Ratio is operating expense, which was $247 million, $267 million and $313 million in 2008, 2011 and 2012, respectively. Adjusted Cash Generation – Gallagher defines this measure as adjusted EBITDAC further adjusted to add back stock compensation expense (a non-cash charge) and to deduct capital expenditures, interest and banking costs, corporate and acquisition costs and income taxes paid. Gallagher considers Adjusted Cash Generation as a way to measure net cash generated from its operations on an ongoing basis. Reconciliations—Please see page 56 for a reconciliation of Adjusted Cash Generation to the most directly comparable GAAP measure. For all other measures, please see the examples set forth in “Reconciliation of Non-GAAP Measures and supplemental quarterly financial data “ on Gallagher’s Web site at www.ajg.com/IR.
|
|
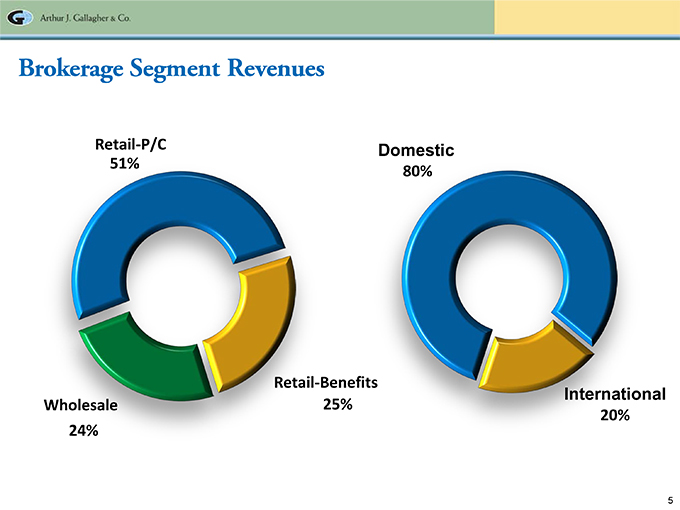
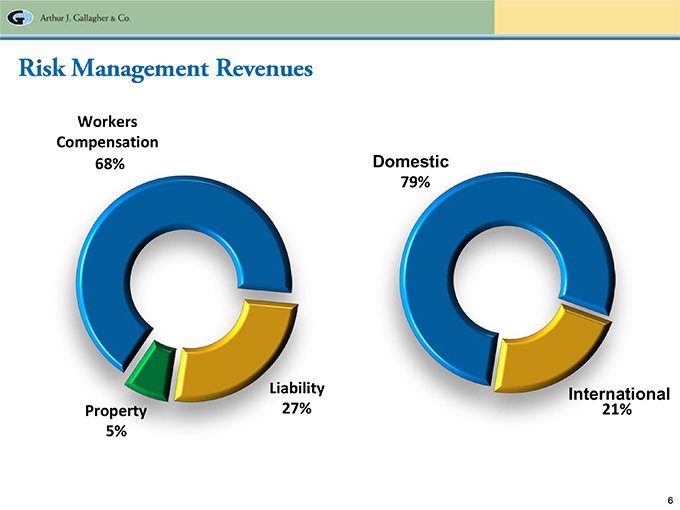
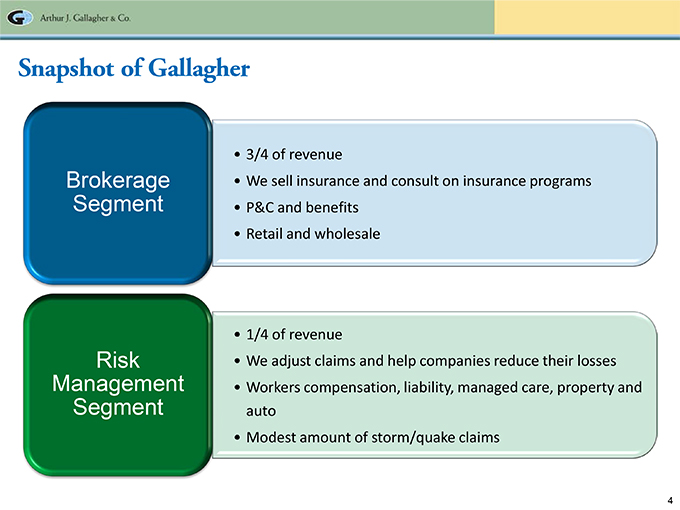
Snapshot of Gallagher 3/4 of revenue We sell insurance and consult on insurance programs P&C and benefits Retail and wholesale 1/4 of revenue We adjust claims and help companies reduce their losses Workers compensation, liability, managed care, property and auto Modest amount of storm/quake claims
Brokerage Segment Revenues
Risk Management Revenues
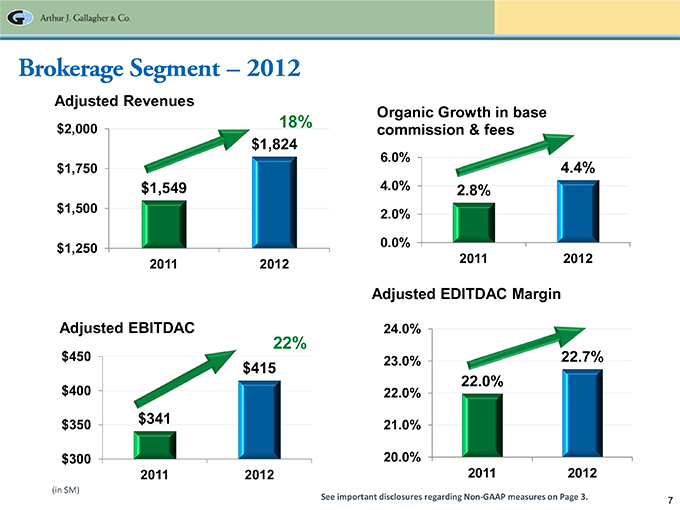
Brokerage Segment – 2012 Adjusted Revenues Organic Growth in base commission & fees Adjusted EDITDAC Margin Adjusted EBITDAC See important disclosures regarding Non-GAAP measures on Page 3.
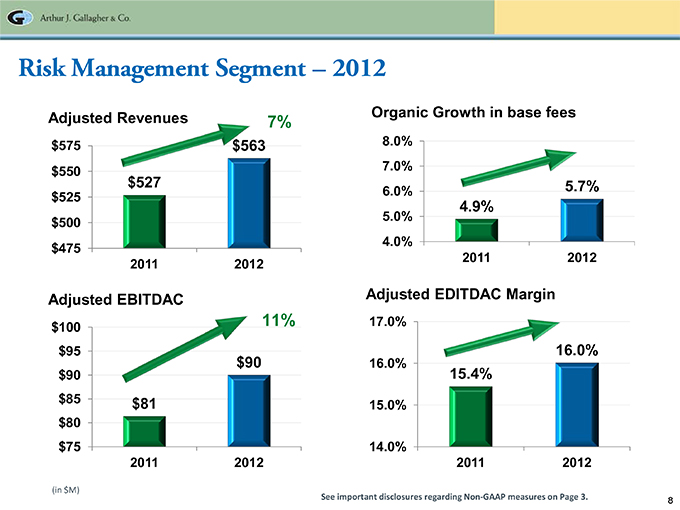
Risk Management Segment – 2012 Adjusted Revenues Organic Growth in base fees Adjusted EBITDAC Adjusted EDITDAC Margin (in $M) Adjusted EDITDAC Margin
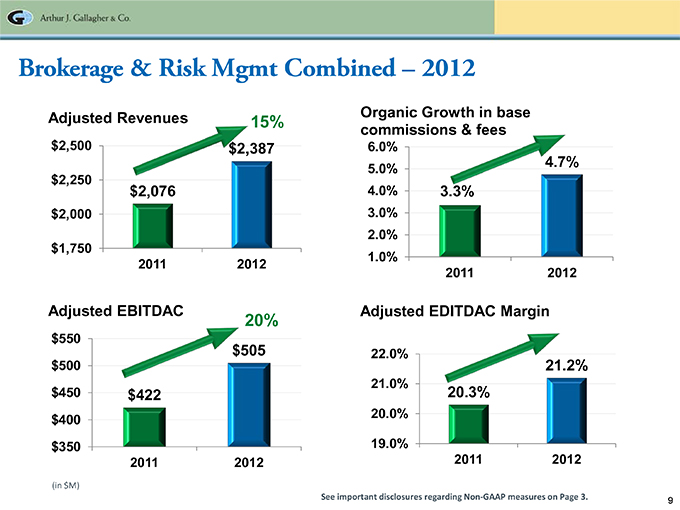
Brokerage & Risk Mgmt Combined – 2012 Adjusted Revenues Organic Growth in base commissions & fees Adjusted EBITDAC Adjusted EDITDAC Margin (in $M) See important disclosures regarding Non-GAAP measures on Page 3.
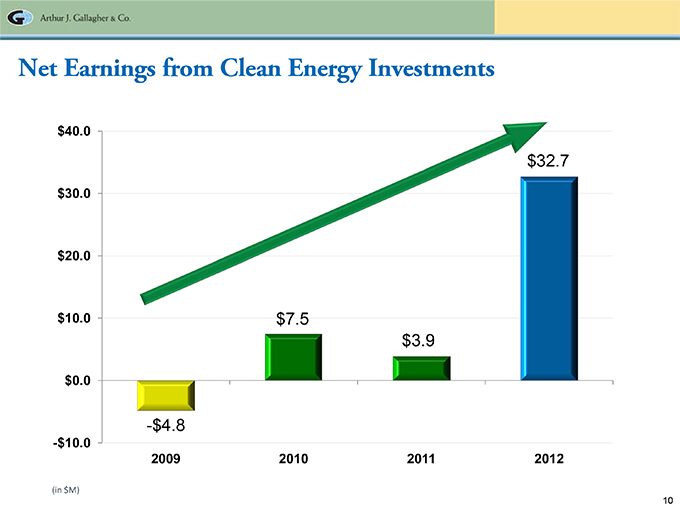
Net Earnings from Clean Energy Investments (in $M)
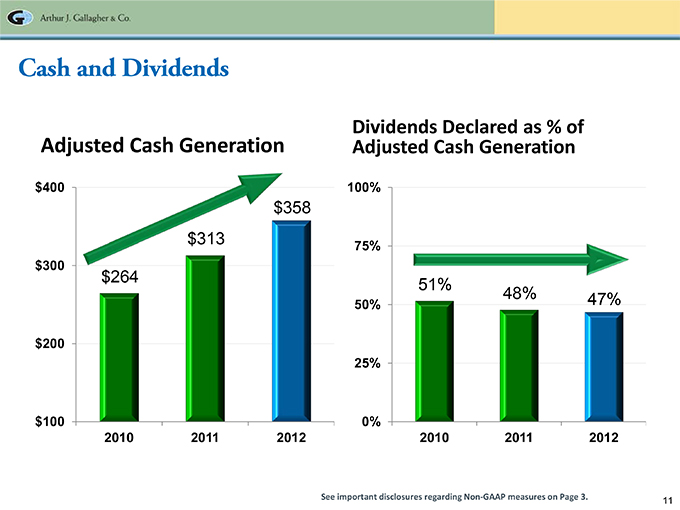
Cash and Dividends Dividends Declared as % of Adjusted Cash Generation Adjusted Cash Generation See important disclosures regarding Non-GAAP measures on Page 3.
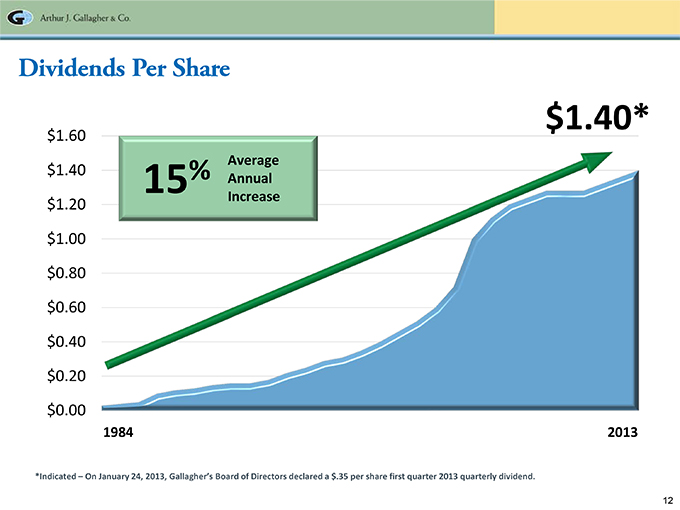
Dividends Per Share *Indicated – On January 24, 2013, Gallagher’s Board of Directors declared a $.35 per share first quarter 2013 quarterly dividend.
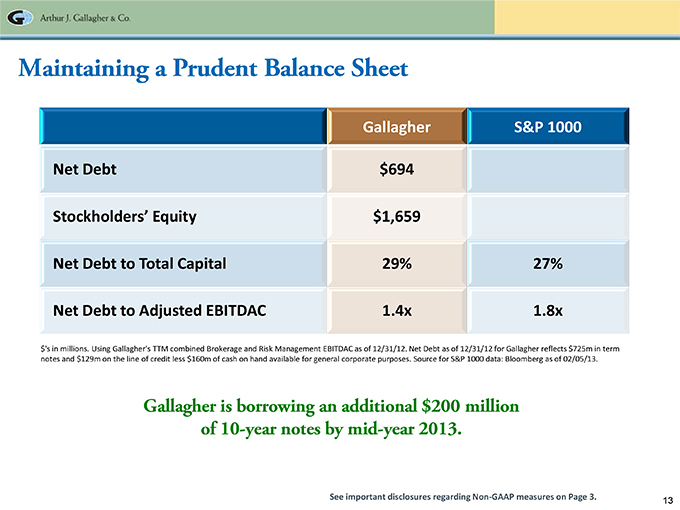
Maintaining a Prudent Balance Sheet Net Debt Stockholders’ Equity Net Debt to Total Capital Net Debt to Adjusted EBITDAC $‘s in millions. Using Gallagher’s TTM combined Brokerage and Risk Management EBITDAC as of 12/31/12. Net Debt as of 12/31/12 for Gallagher reflects $725m in term notes and $129m on the line of credit less $160m of cash on hand available for general corporate purposes. Source for S&P 1000 data: Bloomberg as of 02/05/13. Gallagher is borrowing an additional $200 million of 10-year notes by mid-year 2013. See important disclosures regarding Non-GAAP measures on Page 3.
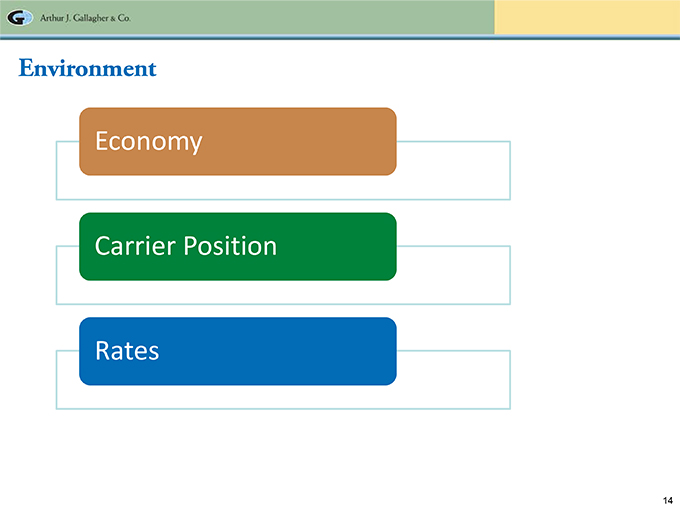
Environment Economy Carrier Position Rates
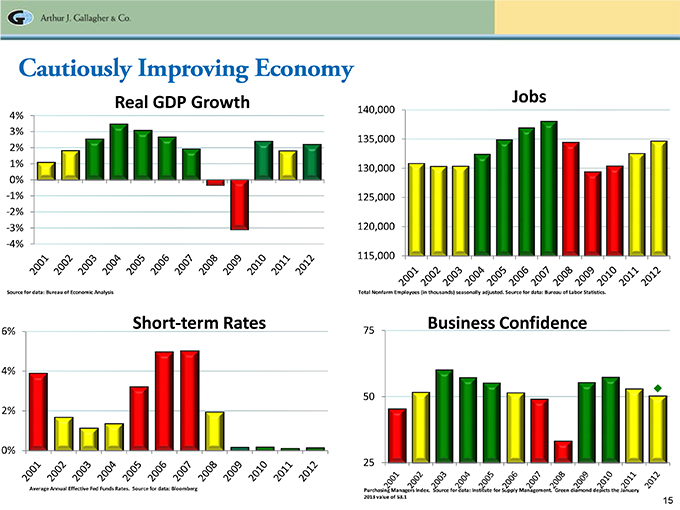
Cautiously Improving Economy Source for data: Bureau of Economic Analysis Total Nonfarm Employees (in thousands) seasonally adjusted. Source for data: Bureau of Labor Statistics. Average Annual Effective Fed Funds Rates. Source for data: Bloomberg Purchasing Managers Index. Source for data: Institute for Supply Management. Green diamond depicts the January 2013 value of 53.1
|
|
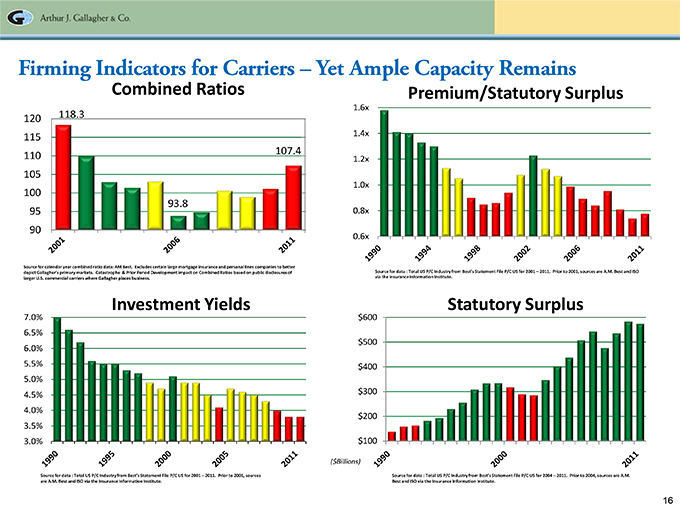
Firming Indicators for Carriers – Yet Ample Capacity Remains Combined Ratios Premium/Statutory Surplus Source for calendar year combined ratio data: AM Best. Excludes certain large mortgage insurance and personal lines companies to better Source for data : Total US P/C Industry from Best’s Statement File P/C US for 2001 – 2011. Prior to 2001, sources are A.M. Best and ISO depict Gallagher’s primary markets. Catastrophe & Prior Period Development impact on Combined Ratios based on public disclosures of via the Insurance Information Institute. larger U.S. commercial carriers where Gallagher places business. Source for data : Total US P/C Industry from Best’s Statement File P/C US for 2001 – 2011. Prior to 2001, sources Source for data : Total US P/C Industry from Best’s Statement File P/C US for 2004 – 2011. Prior to 2004, sources are A.M. are A.M. Best and ISO via the Insurance Information Institute. Best and ISO via the Insurance Information Institute.
|
|
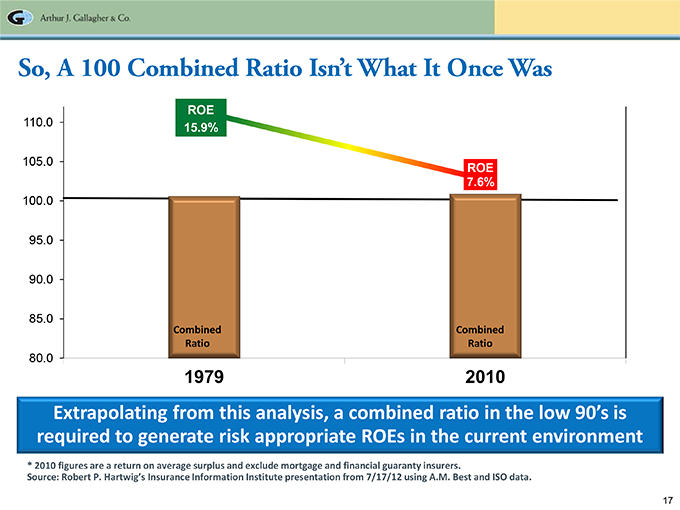
So, A 100 Combined Ratio Isn’t What It Once Was Extrapolating from this analysis, a combined ratio in the low 90’s is required to generate risk appropriate ROEs in the current environment * 2010 figures are a return on average surplus and exclude mortgage and financial guaranty insurers. Source: Robert P. Hartwig’s Insurance Information Institute presentation from 7/17/12 using A.M. Best and ISO data.
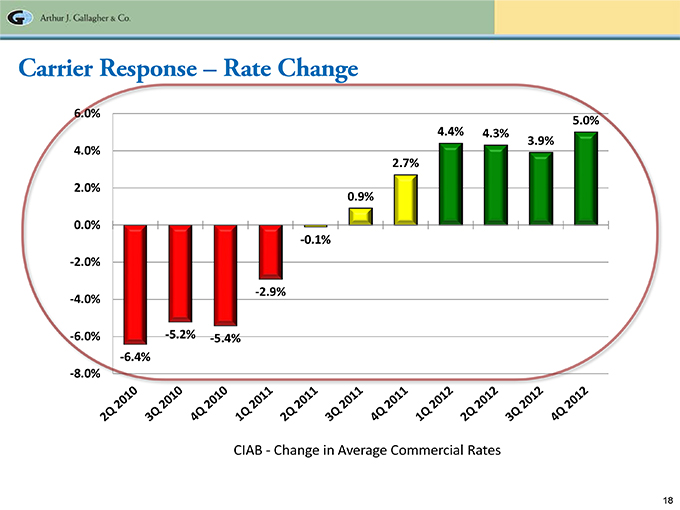
Carrier Response – Rate Change CIAB—Change in Average Commercial Rates
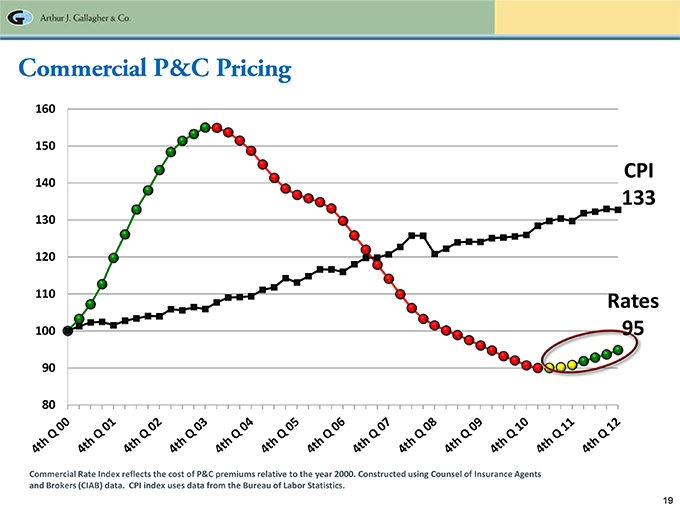
Commercial P&C Pricing Commercial Rate Index reflects the cost of P&C premiums relative to the year 2000. Constructed using Counsel of Insurance Agents and Brokers (CIAB) data. CPI index uses data from the Bureau of Labor Statistics.
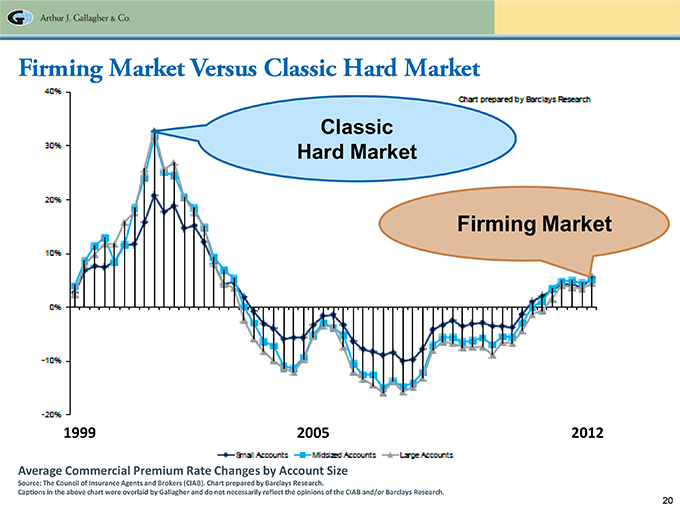
Firming Market Versus Classic Hard Market Average Commercial Premium Rate Changes by Account Size Source: The Council of Insurance Agents and Brokers (CIAB). Chart prepared by Barclays Research. Captions in the above chart were overlaid by Gallagher and do not necessarily reflect the opinions of the CIAB and/or Barclays Research.
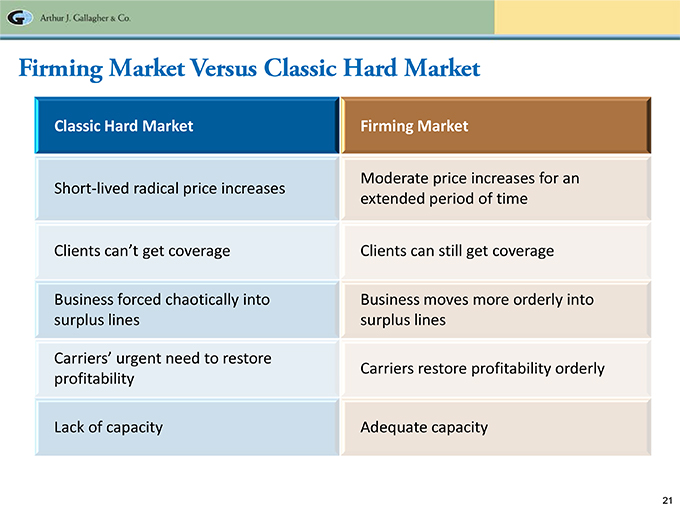
Firming Market Versus Classic Hard Market Classic Hard Market Firming Market oderate price increases for an Short-lived radical price increases extended period of time Clients can’t get coverage Clients can still get coverage Business forced chaotically into Business moves more orderly into surplus lines surplus lines Carriers’ urgent need to restore arriers restore profitability orderly profitability Lack of capacity Adequate capacity
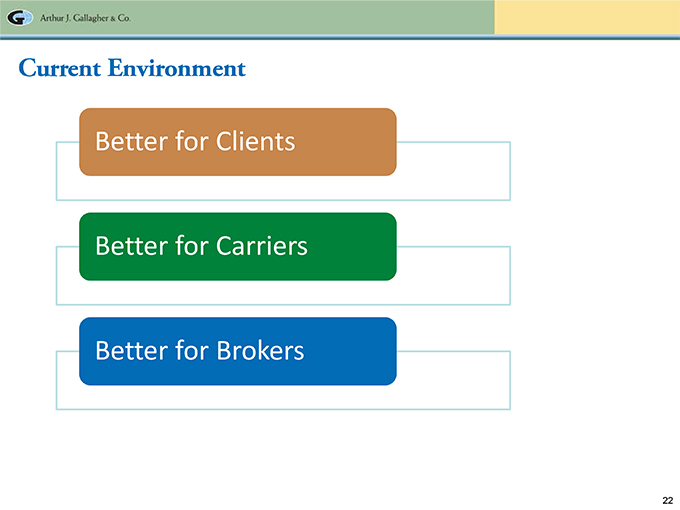
Current Environment
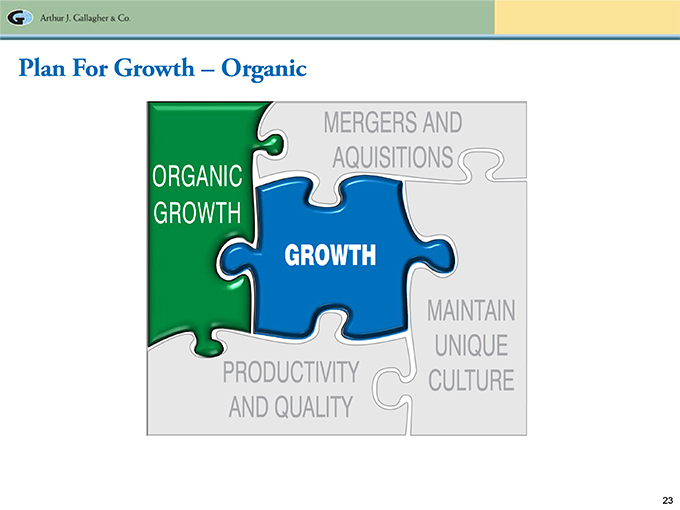
Plan For Growth – Organic
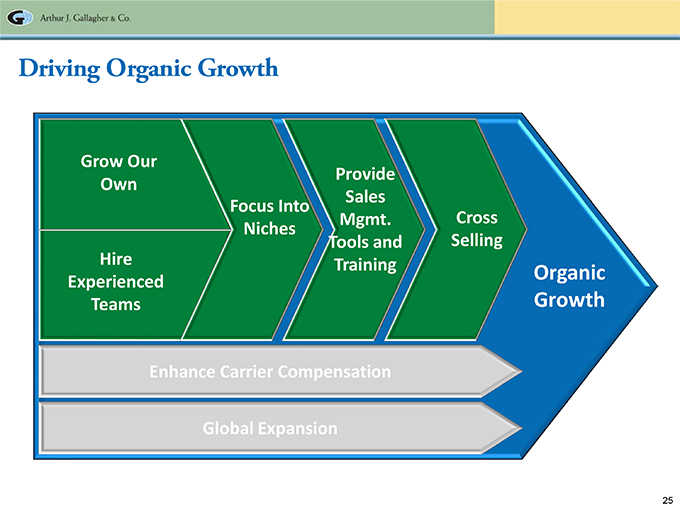
Driving Organic Growth
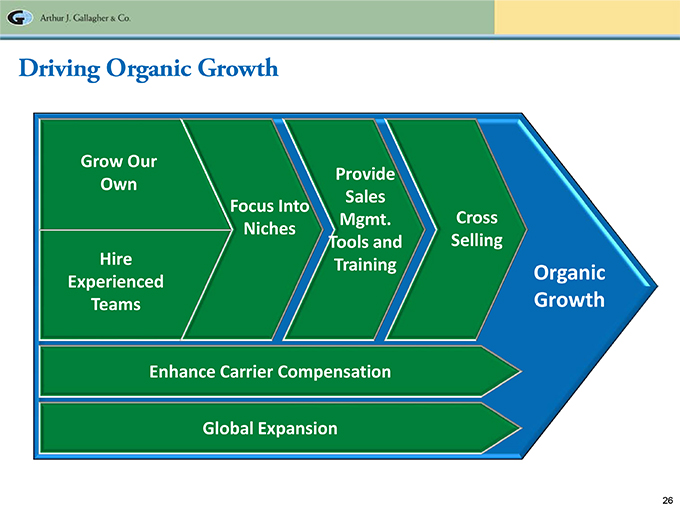
Driving Organic Growth
Driving Organic Growth
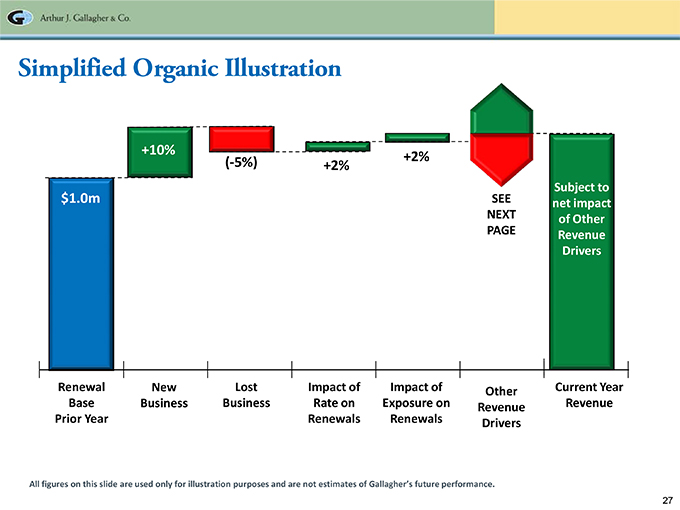
Simplified Organic Illustration All figures on this slide are used only for illustration purposes and are not estimates of Gallagher’s future performance.
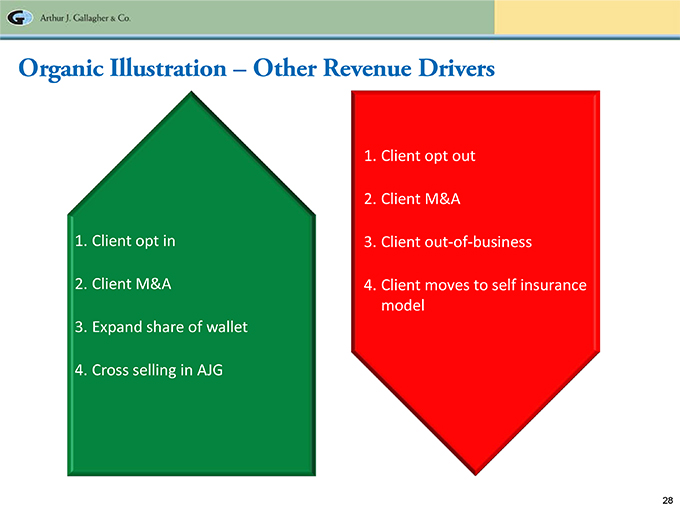
Organic Illustration – Other Revenue Drivers 1. Client opt in 2. Client M&A 3. Expand share of wallet 4. Cross selling in AJG Client opt out Client M&A Client out-of-business Client moves to self insurance model
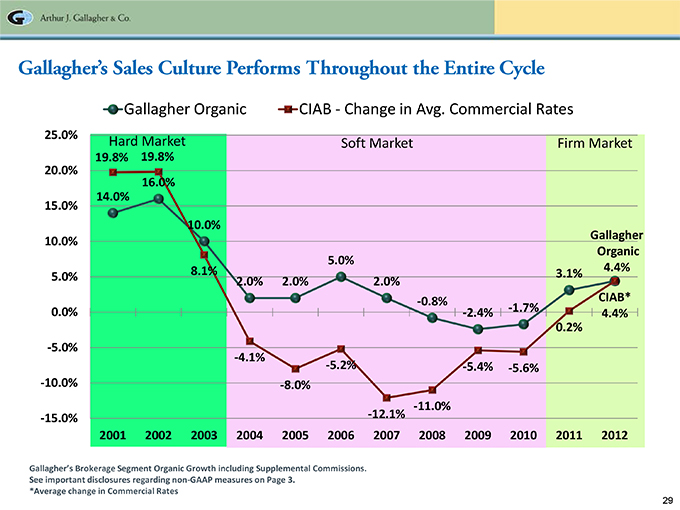
Gallagher’s Sales Culture Performs Throughout the Entire Cycle Gallagher’s Brokerage Segment Organic Growth including Supplemental Commissions. See important disclosures regarding non-GAAP measures on Page 3. *Average change in Commercial Rates
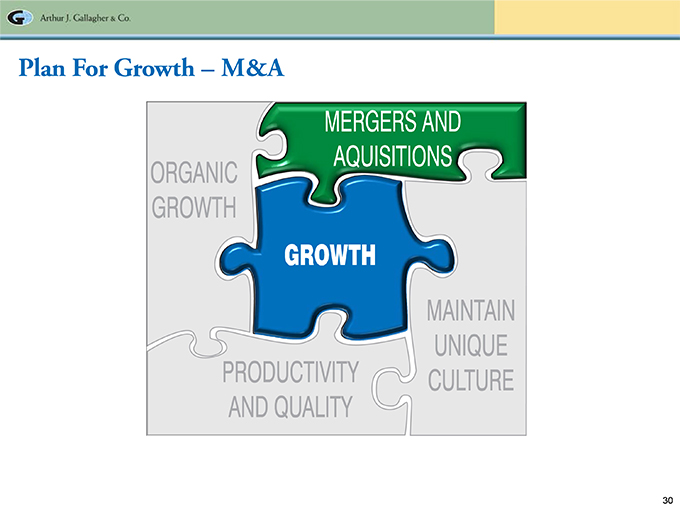
Plan For Growth – M&A
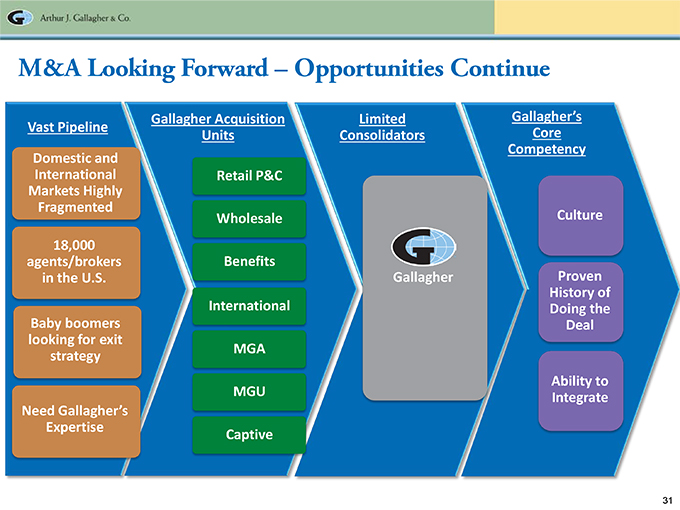
M&A Looking Forward – Opportunities Continue
Current Gallagher U.S. Locations
Larger Cities With Expansion Potential
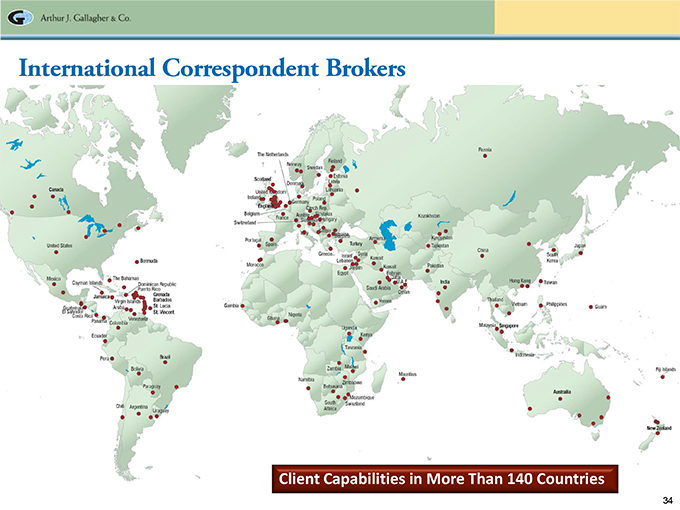
International Correspondent Brokers Client Capabilities in More Than 140 Countries
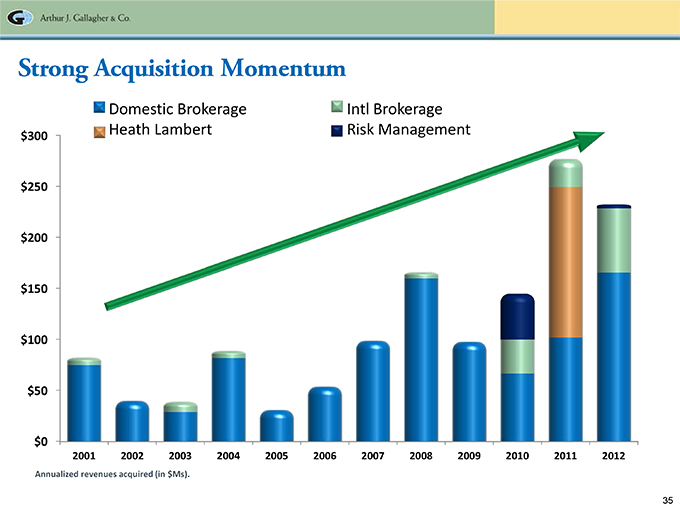
Strong Acquisition Momentum Annualized revenues acquired (in $Ms).
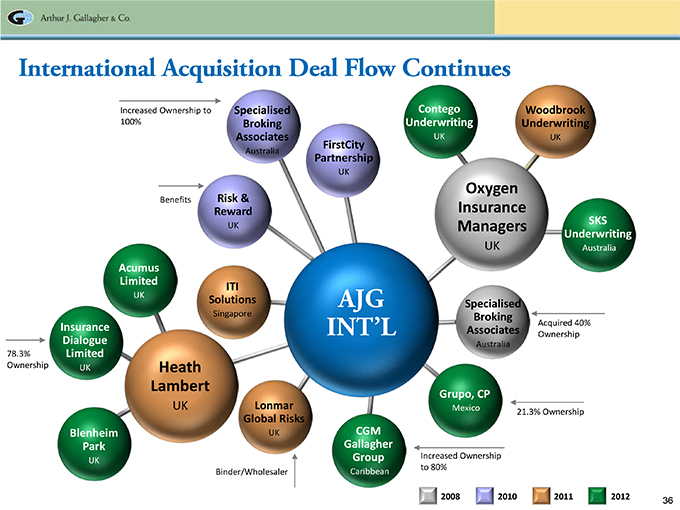
International Acquisition Deal Flow Continues
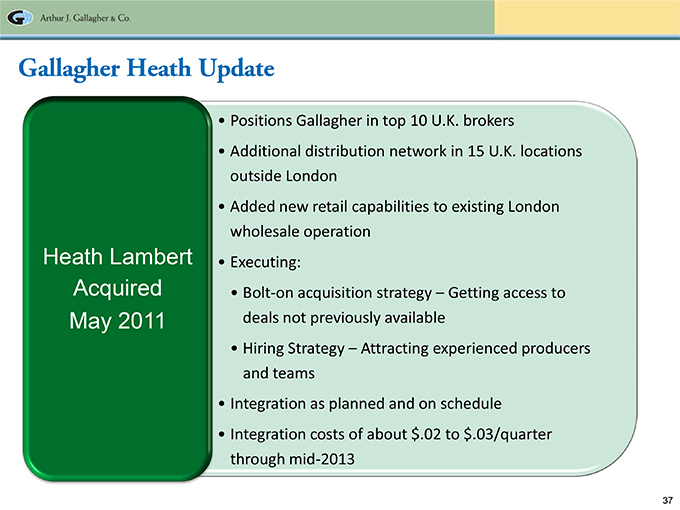
Gallagher Heath Update Heath Lambert Acquired May 2011 • Additional distribution network in 15 U.K. locations outside London • Added new retail capabilities to existing London wholesale operation • Executing: •Bolt-on acquisition strategy – Getting access to deals not previously available •Hiring Strategy – Attracting experienced producers and teams • Integration as planned and on schedule • Integration costs of about $.02 to $.03/quarter through mid-2013
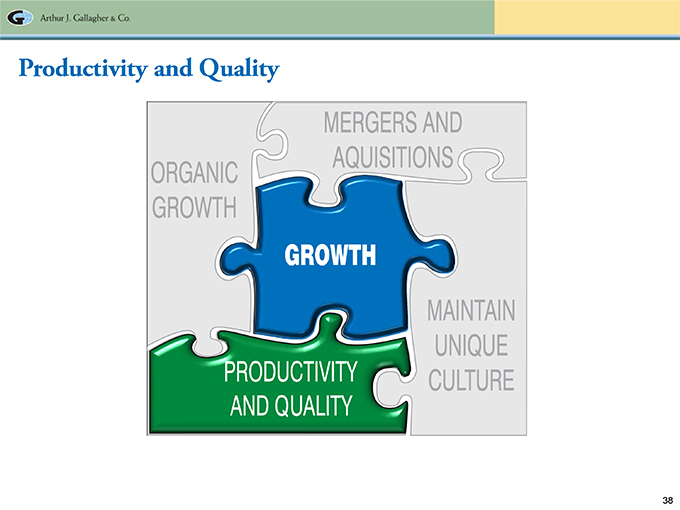
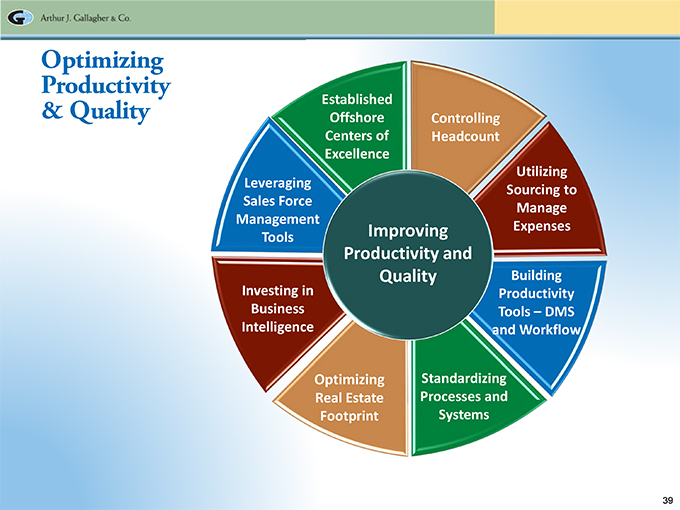
Productivity and Quality
Optimizing Productivity & Quality
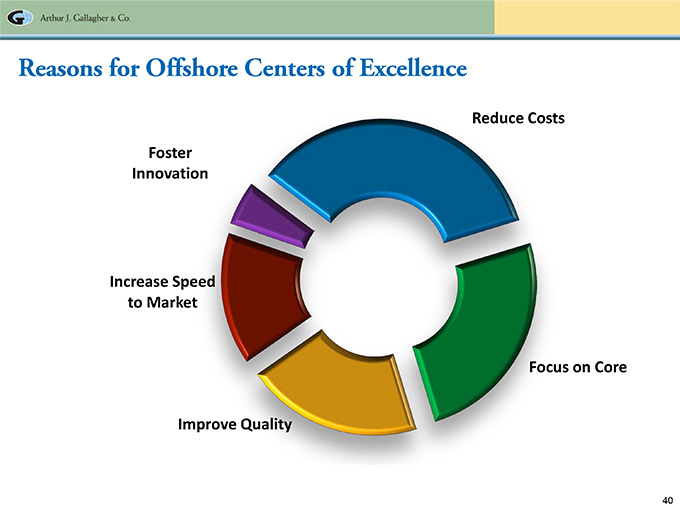
Reasons for Offshore Centers of Excellence
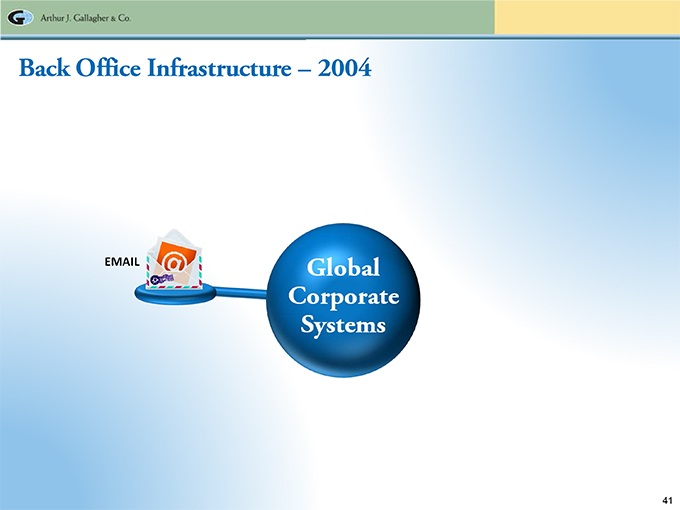
Back Office Infrastructure – 2004
Back Office – Today
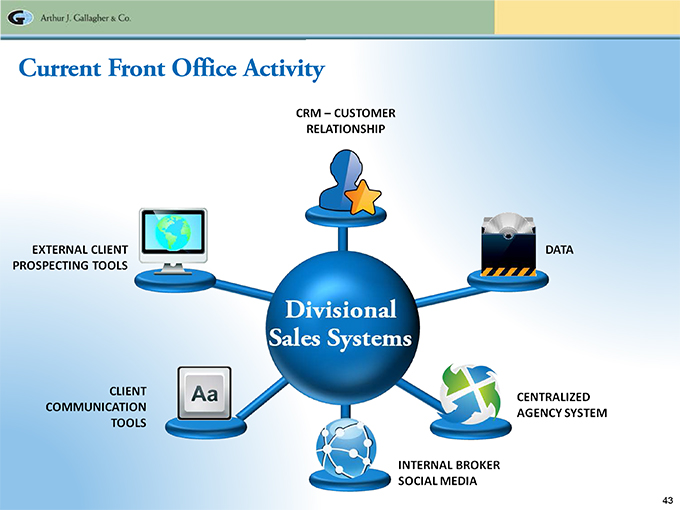
Current Front Office Activity
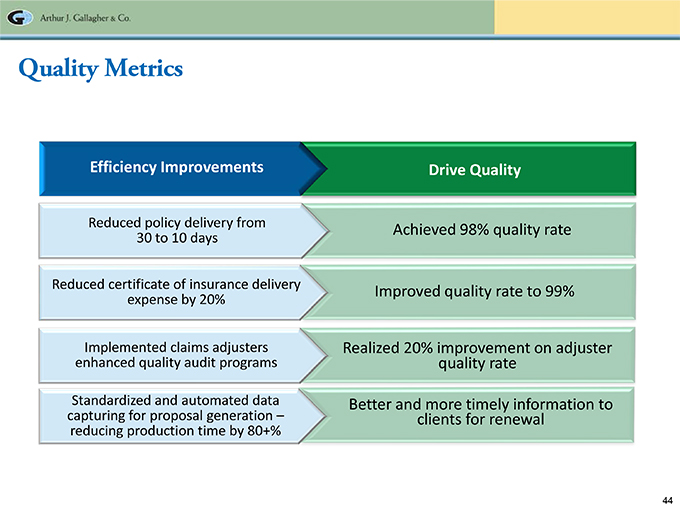
Quality Metrics Efficiency Improvements Drive Quality Reduced policy delivery from Achieved 98% quality rate 30 to 10 days Reduced certificate of insurance delivery Improved quality rate to 99% expense by 20% Implemented claims adjusters Realized 20% improvement on adjuster enhanced quality audit programs quality rate Standardized and automated data Better and more timely information to capturing for proposal generation – clients for renewal reducing production time by 80+%
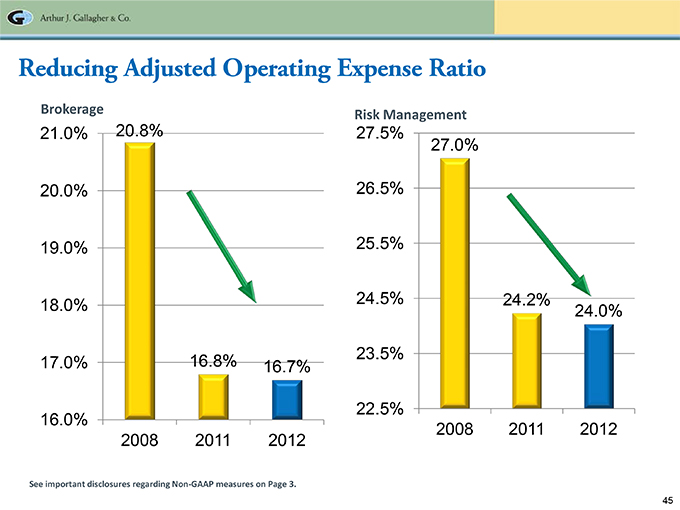
Reducing Adjusted Operating Expense Ratio See important disclosures regarding Non-GAAP measures on Page 3.
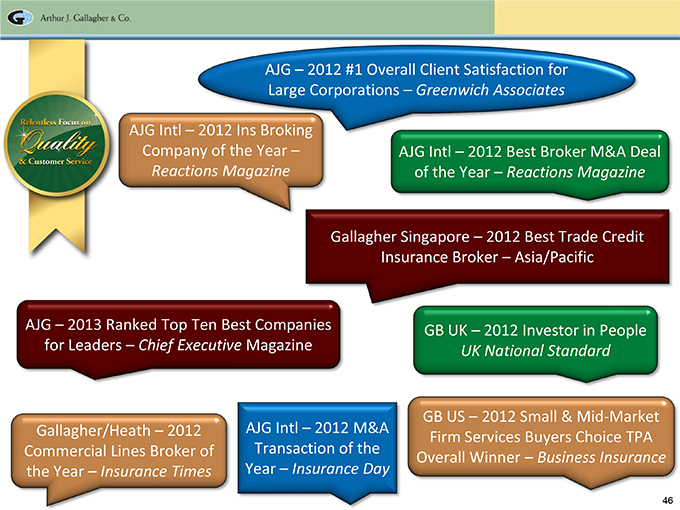
AJG – 2012 #1 Overall Client Satisfaction for Large Corporations – Greenwich Associates AJG Intl – 2012 Ins Broking Company of the Year – Reactions Magazine AJG Intl – 2012 Best Broker M&A Deal of the Year – Reactions Magazine Gallagher Singapore – 2012 Best Trade Credit Insurance Broker – Asia/Pacific AJG – 2013 Ranked Top Ten Best Companies for Leaders – Chief Executive Magazine GB UK – 2012 Investor in People UK National Standard Gallagher/Heath – 2012 Commercial Lines Broker of the Year – Insurance Times GB US – 2012 Small & Mid-Market Firm Services Buyers Choice TPA Overall Winner – Business Insurance
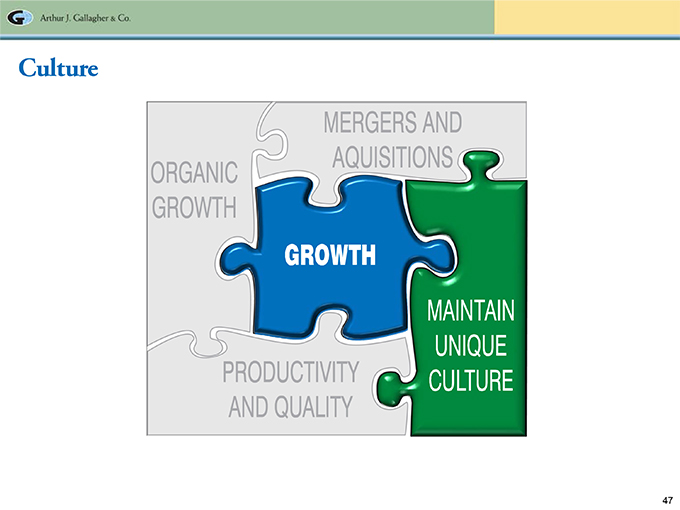
Culture
Maintain Unique Culture
One of the World’s Most Ethical Companies as Recognized by Ethisphere ethics and dedication to integrity • Chosen for:nPromoting ethical business standards and practicesnExceeding legal compliance standardsnInnovating to benefit the publicnDemonstrating that corporate citizenship is tied to company success • Globally, only 145 organizations named
A Top Ten Best Company for Leadership Development As Recognized by Chief Executive Magazine – 2013 • Recognized for:nHigh percentage of senior and mid-manager positions filled internallynFormal leadership processnCommitment to leadership development program
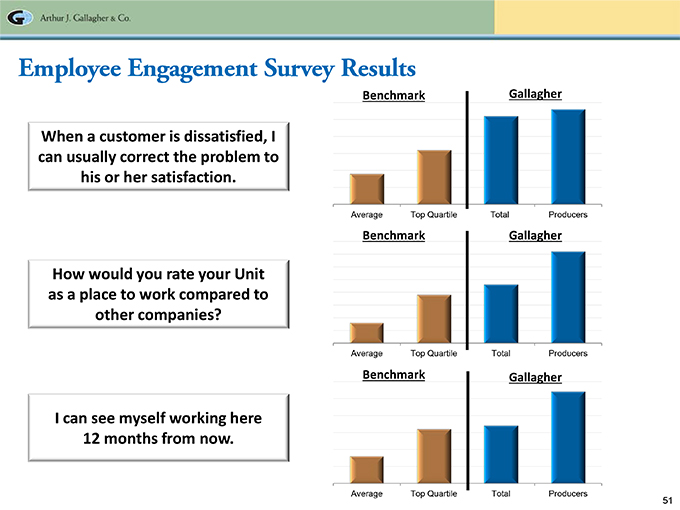
Employee Engagement Survey Results When a customer is dissatisfied, I can usually correct the problem to his or her satisfaction. How would you rate your Unit as a place to work compared to other companies? I can see myself working here 12 months from now.
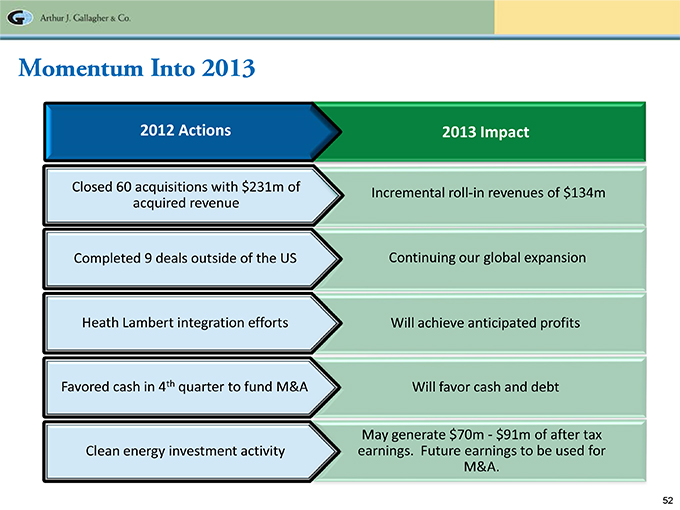
Momentum Into 2013 Closed 60 acquisitions with $231m of acquired revenue Incremental roll-in revenues of $134m Completed 9 deals outside of the US Continuing our global expansion Heath Lambert integration efforts Will achieve anticipated profits Favored cash in 4th quarter to fund M&A Will favor cash and debt May generate $70m—$91m of after tax Clean energy investment activity earnings. Future earnings to be used for M&A.
|
|
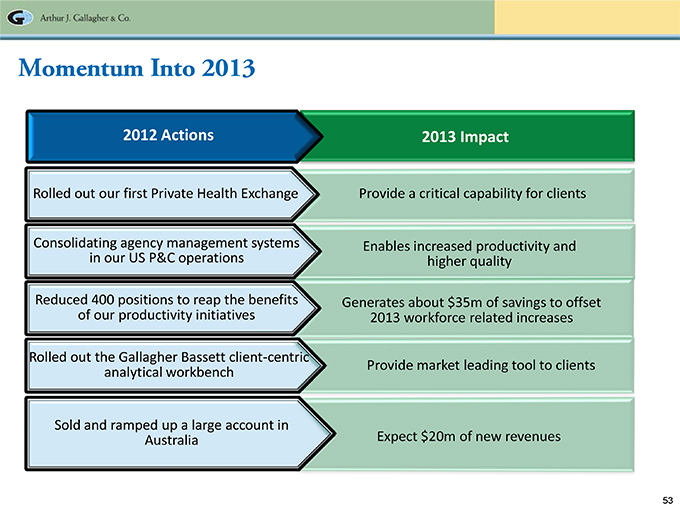
Momentum Into 2013 2012 Actions 2013 Impact Rolled out our first Private Health Exchange Provide a critical capability for clients Consolidating agency management systems Enables increased productivity and in our US P&C operations higher quality Reduced 400 positions to reap the benefits Generates about $35m of savings to offset of our productivity initiatives 2013 workforce related increases Rolled out the Gallagher Bassett client-centric analytical workbench Provide market leading tool to clients Sold and ramped up a large account in Australia Expect $20m of new revenues
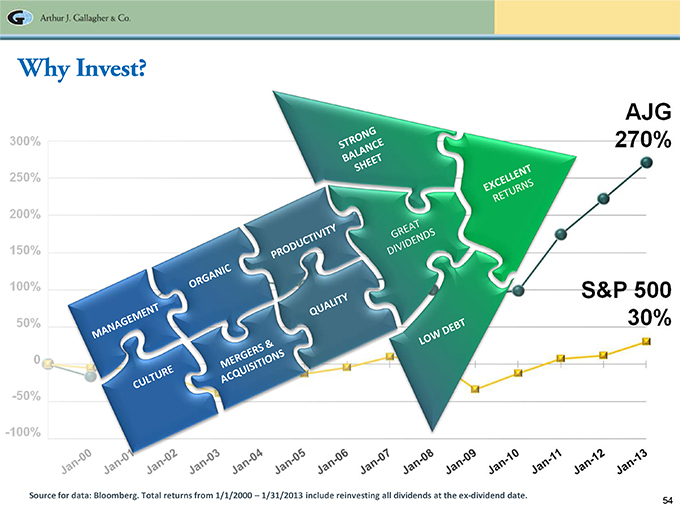
Why Invest? Source for data: Bloomberg. Total returns from 1/1/2000 – 1/31/2013 include reinvesting all dividends at the ex-dividend date.
Questions & Answers For Additional Information Marsha Akin Director – Investor Relations Marsha_Akin@ajg.com Phone: 630?285?3501
|
|
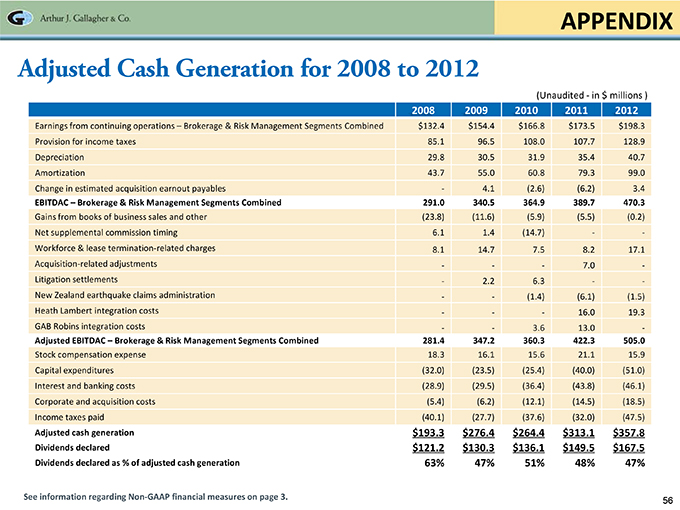
APPENDIX Adjusted Cash Generation for 2008 to 2012 (Unaudited—in $ millions ) 2008 2009 2010 2011 2012 Earnings from continuing operations – Brokerage & Risk Management Segments Combined $132.4 $154.4 $166.8 $173.5 $198.3 Provision for income taxes 85.1 96.5 108.0 107.7 128.9 Depreciation 29.8 30.5 31.9 35.4 40.7 Amortization 43.7 55.0 60.8 79.3 99.0 Change in estimated acquisition earnout payables—4.1 (2.6) (6.2) 3.4 EBITDAC – Brokerage & Risk Management Segments Combined 291.0 340.5 364.9 389.7 470.3 Gains from books of business sales and other (23.8) (11.6) (5.9) (5.5) (0.2) Net supplemental commission timing 6.1 1.4 (14.7) ——Workforce & lease termination-related charges 8.1 14.7 7.5 8.2 17.1 Acquisition-related adjustments — — — 7.0 —Litigation settlements — 2.2 6.3 ——New Zealand earthquake claims administration — (1.4) (6.1) (1.5) Heath Lambert integration costs — — — 16.0 19.3 GAB Robins integration costs — — 3.6 13.0 — Adjusted EBITDAC – Brokerage & Risk Management Segments Combined 281.4 347.2 360.3 422.3 505.0 Stock compensation expense 18.3 16.1 15.6 21.1 15.9 Capital expenditures (32.0) (23.5) (25.4) (40.0) (51.0) Interest and banking costs (28.9) (29.5) (36.4) (43.8) (46.1) Corporate and acquisition costs (5.4) (6.2) (12.1) (14.5) (18.5) Income taxes paid (40.1) (27.7) (37.6) (32.0) (47.5) Adjusted cash generation $193.3 $276.4 $264.4 $313.1 $357.8 Dividends declared $121.2 $130.3 $136.1 $149.5 $167.5 Dividends declared as % of adjusted cash generation 63% 47% 51% 48% 47% See information regarding Non-GAAP financial measures on page 3.