Exhibit 99.1

ARTHUR J. GALLAGHER & CO. Investment Presentation August 2013
Arthur J. Gallagher & Co. Information Regarding Forward-Looking Statements This presentation contains “forward-looking statements” within the meaning of the Private Securities Litigation Reform Act of 1995. When used in this presentation, the words “anticipates,” “believes,” “contemplates,” “see,” “should,” “could,” “estimates,” “expects,” “intends,” “plans” and variations thereof and similar expressions, are intended to identify forward-looking statements. Examples of forward-looking statements in this presentation include, but are not limited to, statements relating to: (i) our debt levels and plans to borrow; (ii) the state of the economy and our industry (including combined ratios for insurance companies, insurance rates, P&C pricing, exposure units and the existence of a hard or firming market); (iii) drivers and expected levels of organic growth; (iv) our pace of, and expected sources of funding for, acquisition activity (including our pace of expansion outside the United States); (v) the financial impact of recent acquisitions; (vi) the integration of Heath Lambert and Bollinger (including the expected timeframe for completion and integration costs); (vii) our success in the healthcare reform arena; (viii) efficiencies and capabilities generated by system improvements; (ix) the revenue impact of a new account in Australia; (x) the impact of expense reduction initiatives; and (xi) the earnings impact of, and developments relating to, our clean energy investments. Important factors that could cause actual results to differ materially from those in the forward-looking statements include the following: • Changes in worldwide and national economic conditions (including an economic downturn and uncertainty regarding the European debt crisis), changes in premium rates and in insurance markets generally, changes in the insurance brokerage industry’s competitive landscape, changes in the regulatory environment, our inability to identify appropriate acquisition targets at the right price, and the difficulties inherent in combining the cultures and systems of different companies could impact (i) – (x) above; and • Risks and uncertainties related to Gallagher’s clean energy investments – including uncertainties related to political and regulatory risks, including potential actions by Congress or challenges by the IRS eliminating or reducing the availability of tax credits under IRC Section 45 retroactively and/or going forward; the ability to maintain and find co-investors; the potential for divergent business objectives by co-investors and other stakeholders; plant operational risks, including supply-chain risks; utilities’ future use of, or demand for, coal; the market price of coal; the costs of moving a clean coal plant; intellectual property risks; and environmental risks –could impact (xi) above. Please refer to Gallagher’s filings with the SEC, including Item 1A, “Risk Factors,” of its Annual Report on Form 10-K for the fiscal year ended December 31, 2012, for a more detailed discussion of these and other factors that could impact its forward-looking statements. 2
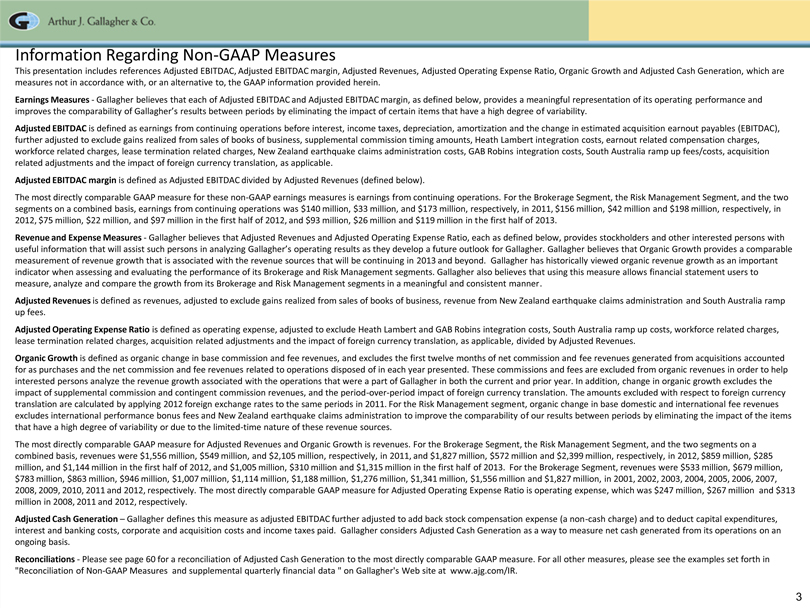
Arthur J. Gallagher & Co. Information Regarding Non-GAAP Measures This presentation includes references Adjusted EBITDAC, Adjusted EBITDAC margin, Adjusted Revenues, Adjusted Operating Expense Ratio, Organic Growth and Adjusted Cash Generation, which are measures not in accordance with, or an alternative to, the GAAP information provided herein. Earnings Measures—Gallagher believes that each of Adjusted EBITDAC and Adjusted EBITDAC margin, as defined below, provides a meaningful representation of its operating performance and improves the comparability of Gallagher’s results between periods by eliminating the impact of certain items that have a high degree of variability. Adjusted EBITDAC is defined as earnings from continuing operations before interest, income taxes, depreciation, amortization and the change in estimated acquisition earn out payables (EBITDAC), further adjusted to exclude gains realized from sales of books of business, supplemental commission timing amounts, Heath Lambert integration costs, earn out related compensation charges, workforce related charges, lease termination related charges, New Zealand earthquake claims administration costs, GAB Robins integration costs, South Australia ramp up fees/costs, acquisition related adjustments and the impact of foreign currency translation, as applicable. Adjusted EBITDAC margin is defined as Adjusted EBITDAC divided by Adjusted Revenues (defined below). The most directly comparable GAAP measure for these non-GAAP earnings measures is earnings from continuing operations. For the Brokerage Segment, the Risk Management Segment, and the two segments on a combined basis, earnings from continuing operations was $140 million, $33 million, and $173 million, respectively, in 2011, $156 million, $42 million and $198 million, respectively, in 2012, $75 million, $22 million, and $97 million in the first half of 2012, and $93 million, $26 million and $119 million in the first half of 2013. Revenue and Expense Measures—Gallagher believes that Adjusted Revenues and Adjusted Operating Expense Ratio, each as defined below, provides stockholders and other interested persons with useful information that will assist such persons in analyzing Gallagher’s operating results as they develop a future outlook for Gallagher. Gallagher believes that Organic Growth provides a comparable measurement of revenue growth that is associated with the revenue sources that will be continuing in 2013 and beyond. Gallagher has historically viewed organic revenue growth as an important indicator when assessing and evaluating the performance of its Brokerage and Risk Management segments. Gallagher also believes that using this measure allows financial statement users to measure, analyze and compare the growth from its Brokerage and Risk Management segments in a meaningful and consistent manner. Adjusted Revenues is defined as revenues, adjusted to exclude gains realized from sales of books of business, revenue from New Zealand earthquake claims administration and South Australia ramp up fees. Adjusted Operating Expense Ratio is defined as operating expense, adjusted to exclude Heath Lambert and GAB Robins integration costs, South Australia ramp up costs, workforce related charges, lease termination related charges, acquisition related adjustments and the impact of foreign currency translation, as applicable, divided by Adjusted Revenues. Organic Growth is defined as organic change in base commission and fee revenues, and excludes the first twelve months of net commission and fee revenues generated from acquisitions accounted for as purchases and the net commission and fee revenues related to operations disposed of in each year presented. These commissions and fees are excluded from organic revenues in order to help interested persons analyze the revenue growth associated with the operations that were a part of Gallagher in both the current and prior year. In addition, change in organic growth excludes the impact of supplemental commission and contingent commission revenues, and the period-over-period impact of foreign currency translation. The amounts excluded with respect to foreign currency translation are calculated by applying 2012 foreign exchange rates to the same periods in 2011. For the Risk Management segment, organic change in base domestic and international fee revenues excludes international performance bonus fees and New Zealand earthquake claims administration to improve the comparability of our results between periods by eliminating the impact of the items that have a high degree of variability or due to the limited-time nature of these revenue sources. The most directly comparable GAAP measure for Adjusted Revenues and Organic Growth is revenues. For the Brokerage Segment, the Risk Management Segment, and the two segments on a combined basis, revenues were $1,556 million, $549 million, and $2,105 million, respectively, in 2011, and $1,827 million, $572 million and $2,399 million, respectively, in 2012, $859 million, $285 million, and $1,144 million in the first half of 2012, and $1,005 million, $310 million and $1,315 million in the first half of 2013. For the Brokerage Segment, revenues were $533 million, $679 million, $783 million, $863 million, $946 million, $1,007 million, $1,114 million, $1,188 million, $1,276 million, $1,341 million, $1,556 million and $1,827 million, in 2001, 2002, 2003, 2004, 2005, 2006, 2007, 2008, 2009, 2010, 2011 and 2012, respectively. The most directly comparable GAAP measure for Adjusted Operating Expense Ratio is operating expense, which was $247 million, $267 million and $313 million in 2008, 2011 and 2012, respectively. Adjusted Cash Generation – Gallagher defines this measure as adjusted EBITDAC further adjusted to add back stock compensation expense (a non-cash charge) and to deduct capital expenditures, interest and banking costs, corporate and acquisition costs and income taxes paid. Gallagher considers Adjusted Cash Generation as a way to measure net cash generated from its operations on an ongoing basis. Reconciliations—Please see page 60 for a reconciliation of Adjusted Cash Generation to the most directly comparable GAAP measure. For all other measures, please see the examples set forth in “Reconciliation of Non-GAAP Measures and supplemental quarterly financial data “ on Gallagher’s Web site at www.ajg.com/IR. 3
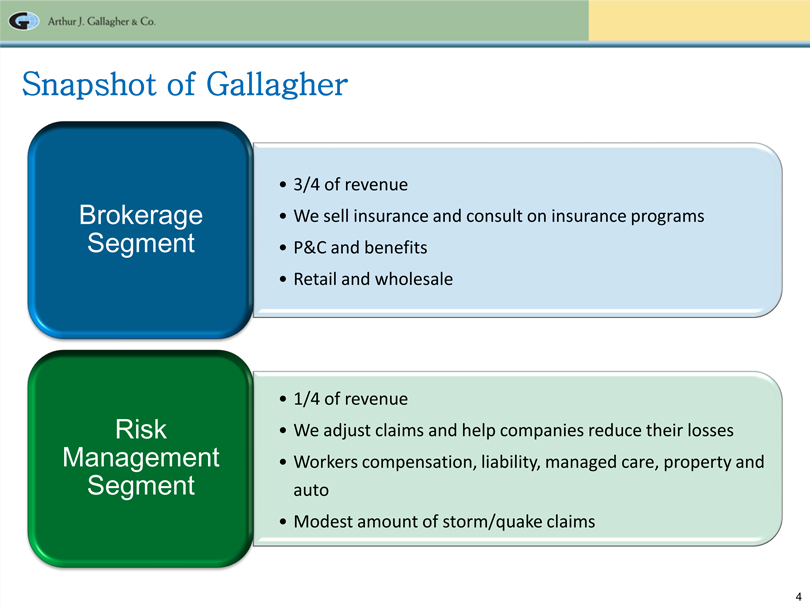
Arthur J. Gallagher & Co. Snapshot of Gallagher Brokerage Segment 3/4 of revenue We sell insurance and consult on insurance programs P&C and benefits Retail and wholesale Risk Management Segment 1/4 of revenue We adjust claims and help companies reduce their losses Workers compensation, liability, managed care, property and auto Modest amount of storm/quake claims
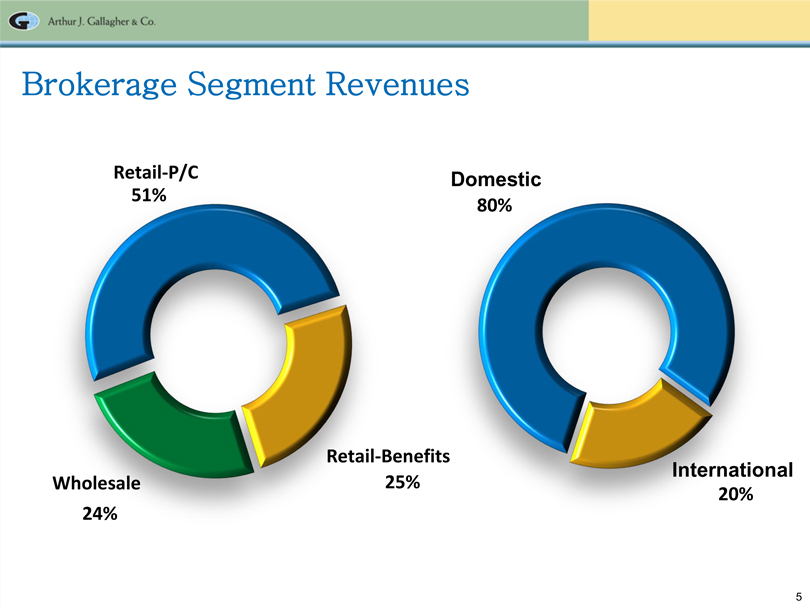
5 Arthur J. Gallagher & Co. Brokerage Segment Revenues 80% 20% International Domestic 51% 25% 24% Wholesale Retail-P/C Retail-Benefits
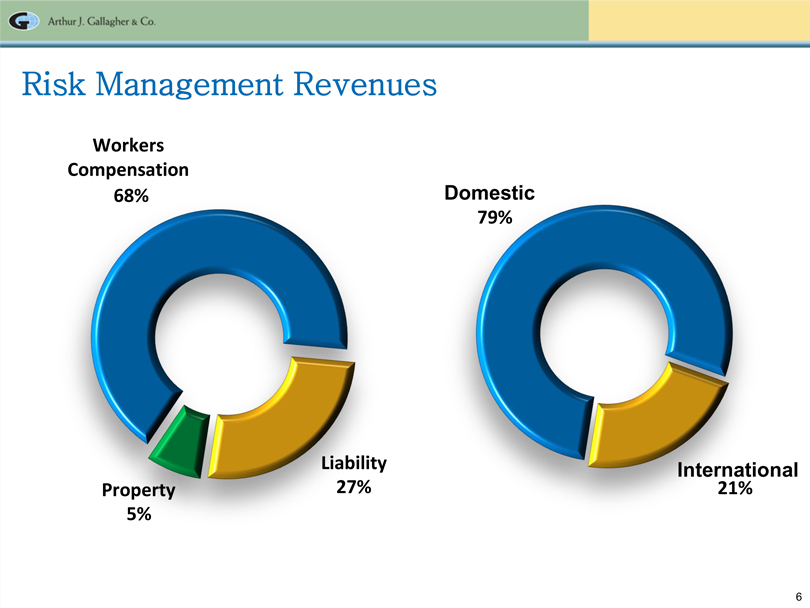
6 Arthur J. Gallagher & Co. 68% 27% 5% Liability Property Workers Compensation 79% 21% International Domestic Risk Management Revenues
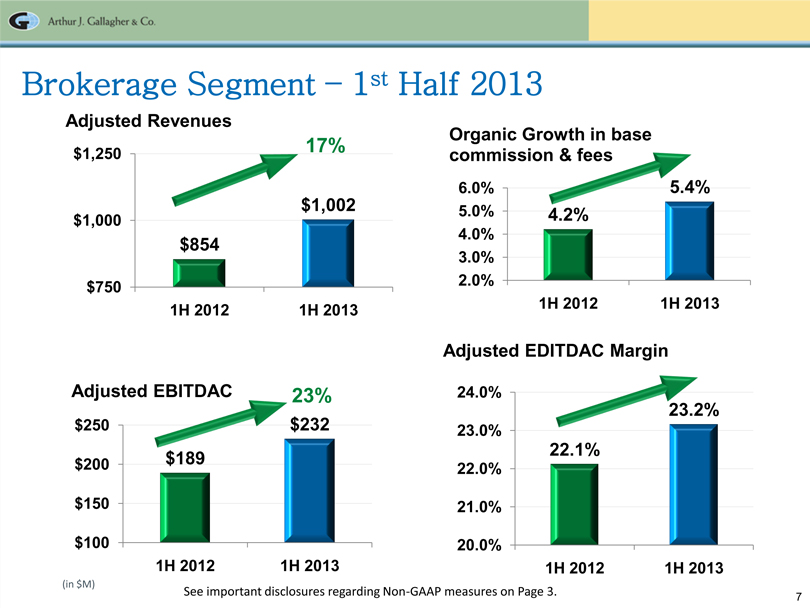
7 Arthur J. Gallagher & Co. $854 $1,002 $750 $1,000 $1,250 1H 2012 1H 2013 Adjusted Revenues 17% $189 $232 $100 $150 $200 $250 1H 2012 1H 2013 Adjusted EBITDAC 23% Brokerage Segment –1st Half 2013 22.1% 23.2% 20.0% 21.0%22.0% 23.0% 24.0% 1H 2012 1H 2013 Adjusted EDITDAC Margin (in $M) 4.2% 5.4% 2.0% 3.0% 4.0% 5.0% 6.0% 1H 2012 1H 2013 Organic Growth in base commission & fees See important disclosures regarding Non-GAAP measures on Page 3.
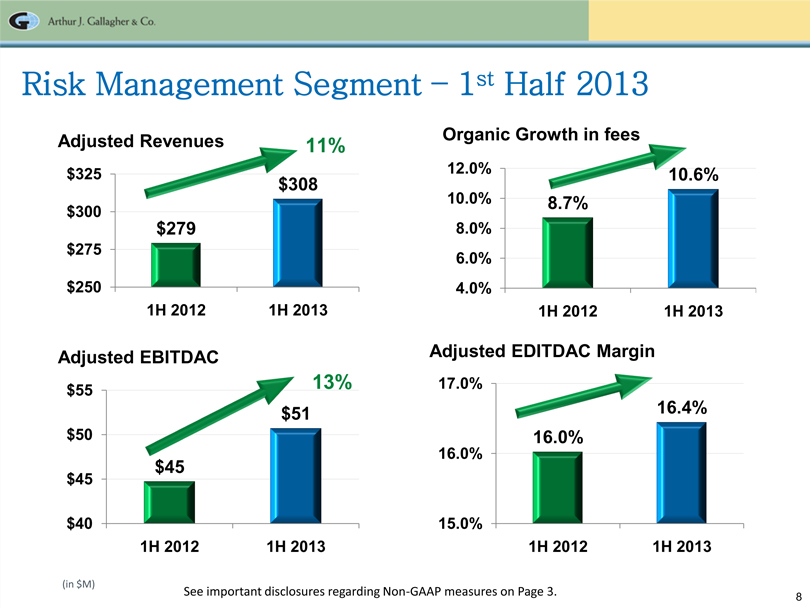
8 Arthur J. Gallagher & Co. $279$308 $250$275 $300 $325 1H 2012 1H 2013 Adjusted Revenues 11% $45 $51 $40 $45 $50 $55 1H 2012 1H 2013 Adjusted EBITDAC 13% Risk Management Segment –1st Half 2013 16.0% 16.4% 15.0% 16.0% 17.0% 1H 2012 1H 2013 Adjusted EDITDAC Margin (in $M) 8.7% 10.6% 4.0% 6.0% 8.0% 10.0% 12.0% 1H 2012 1H 2013 Organic Growth in fees See important disclosures regarding Non-GAAP measures on Page 3.
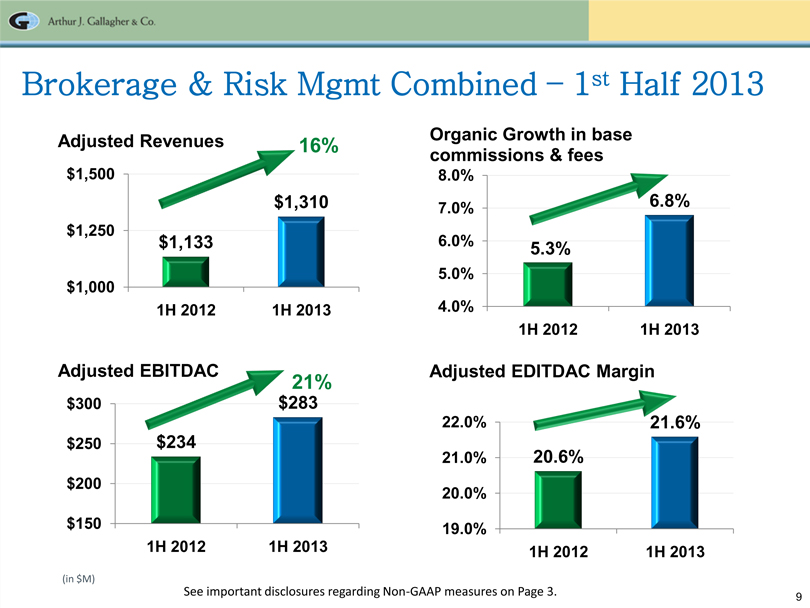
9 Arthur J. Gallagher & Co. $1,133 $1,310 $1,000 $1,250 $1,500 1H 2012 1H 2013 Adjusted Revenues 16% $234 $283 $150 $200 $250 $300 1H 2012 1H 2013 Adjusted EBITDAC 21% Brokerage & Risk Mgmt Combined –1st Half 2013 20.6%21.6% 19.0% 20.0% 21.0% 22.0% 1H 2012 1H 2013 Adjusted EDITDAC Margin (in $M) 5.3% 6.8% 4.0% 5.0% 6.0% 7.0% 8.0% 1H 2012 1H 2013 Organic Growth in base commissions & fees See important disclosures regarding Non-GAAP measures on Page 3.
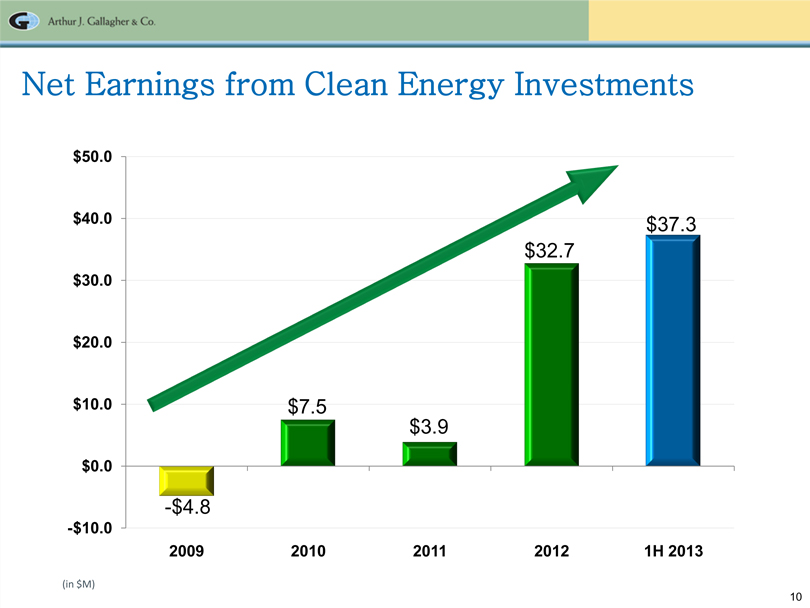
10 Arthur J. Gallagher & Co. -$4.8 $7.5 $3.9 $32.7 $37.3 -$10.0 $0.0 $10.0 $20.0 $30.0 $40.0 $50.0 2009 2010 2011 2012 1H 2013 Net Earnings from Clean Energy Investments (in $M)
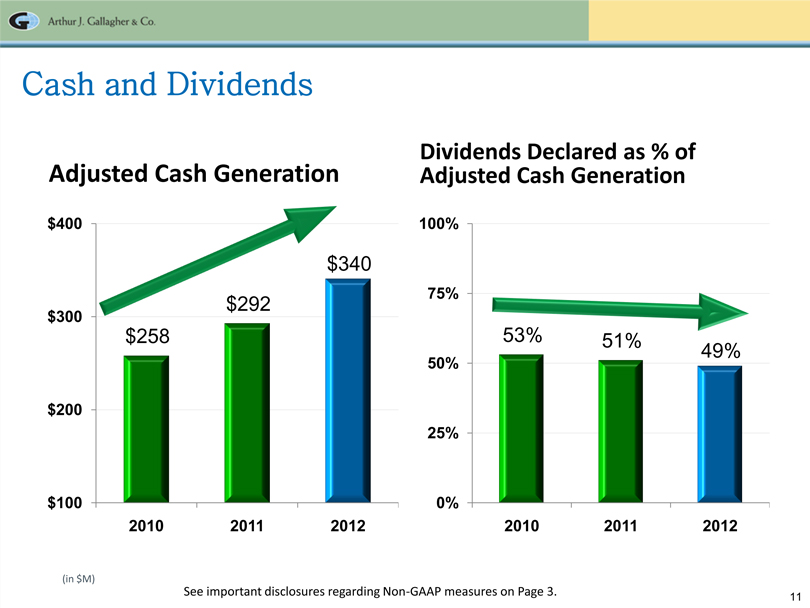
11 Arthur J. Gallagher & Co. Cash and Dividends Adjusted Cash Generation Dividends Declared as % of Adjusted Cash Generation $258 $292 $340 $100 $200 $300 $400 2010 2011 2012 53% 51% 49% 0% 25% 50% 75% 100% 2010 2011 2012 (in $M) See important disclosures regarding Non-GAAP measures on Page 3.
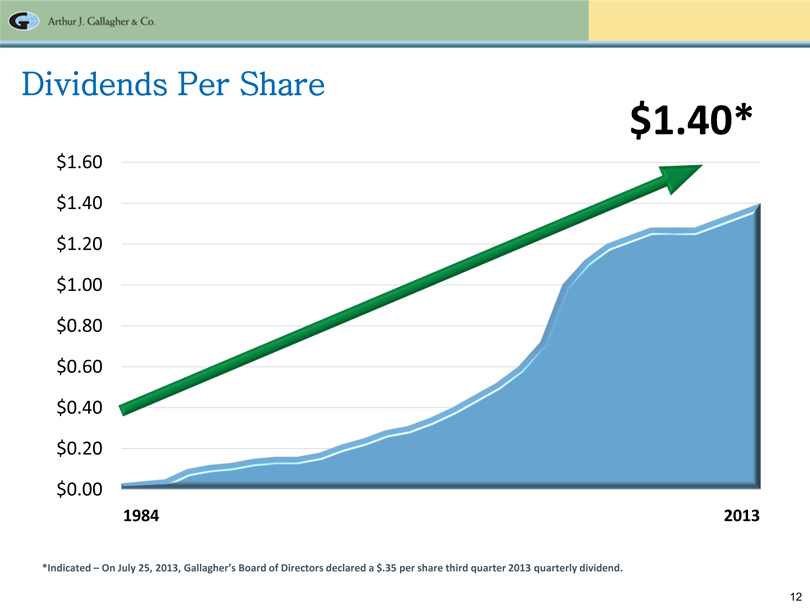
12 Arthur J. Gallagher & Co. $0.00 $0.20 $0.40 $0.60 $0.80 $1.00 $1.20 $1.40 $1.60 Dividends Per Share * Indicated –On July 25, 2013, Gallagher’s Board of Directors declared a $.35 per share third quarter 2013 quarterly dividend. 1984 2013 $1.40*
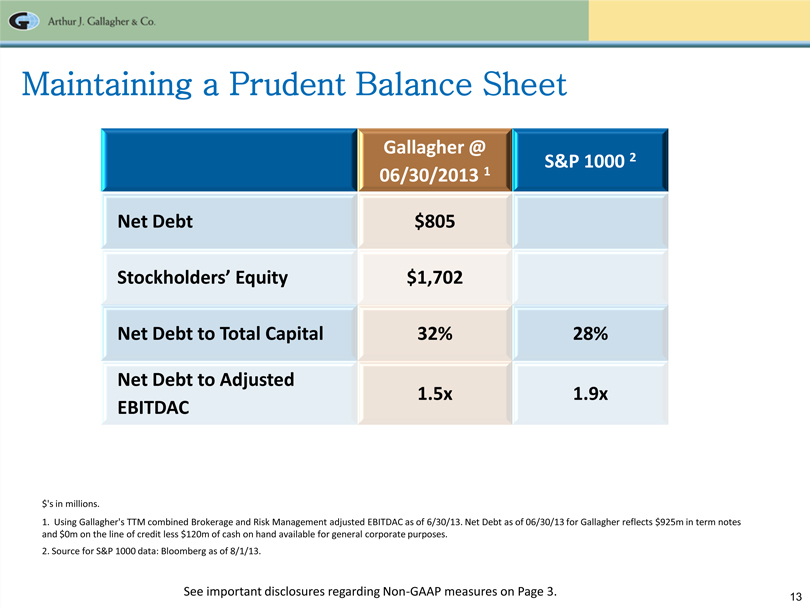
13 Arthur J. Gallagher & Co. Maintaining a Prudent Balance Sheet Gallagher @ 06/30/20131 S&P 1000 2 Net Debt $805 Stockholders’ Equity $1,702 Net Debt to Total Capital 32% 28% Net Debt to Adjusted EBITDAC 1.5x 1.9x $’s in millions. 1. Using Gallagher’s TTM combined Brokerage and Risk Management adjusted EBITDAC as of 6/30/13. Net Debt as of 06/30/13 for Gallagher reflects $925m in term notes and $0m on the line of credit less $120m of cash on hand available for general corporate purposes. 2. Source for S&P 1000 data: Bloomberg as of 8/1/13. See important disclosures regarding Non-GAAP measures on Page 3.
14 Arthur J. Gallagher & Co. Environment Economy Carrier Position Rates
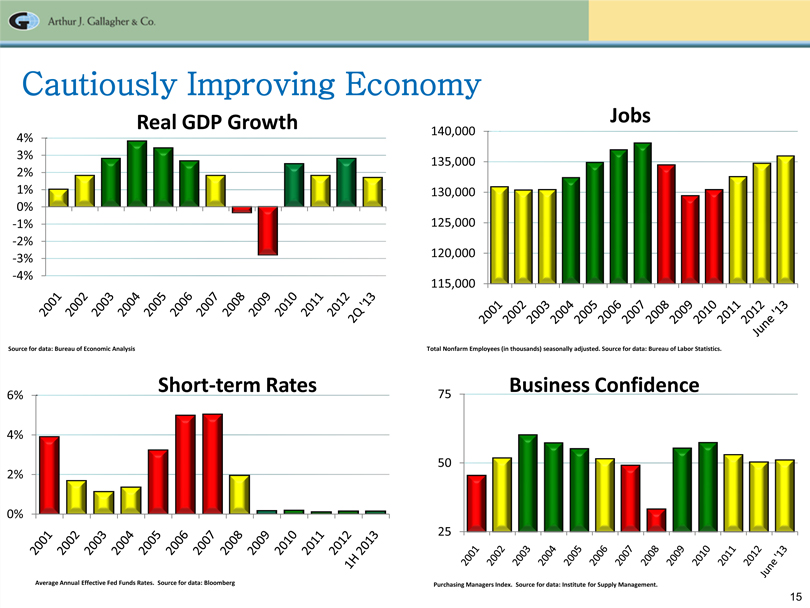
15 Arthur J. Gallagher & Co. Cautiously Improving Economy -4% -3% -2% -1% 0% 1% 2% 3% 4% 115,000 120,00 0 125,000 130,000 135,000 140,000 25 50 75 0% 2% 4% 6 % Source for data: Bureau of Economic Analysis Total Nonfarm Employees (in thousands) seasonally adjusted. Source for data: Bureau of Labor Statistics. Purchasing Managers Index. Source for data: Institute for Supply Management. Average Annual Effective Fed Funds Rates. Source for data: Bloomberg Real GDP Growth Jobs Business Confidence Short-term Rates 2001 2002 2003 2004 2005 2006 2007 2008 2009 2010 2011 2012 2Q’13 2001 2002 2003 2004 2005 2006 2007 2008 2009 2010 2011 2012 June’13 2001 2002 2003 2004 2005 2006 2007 2008 2009 2010 2011 2012 1H 2013 2001 2002 2003 2004 2005 2006 2007 2008 2009 2010 2011 2012 June’13
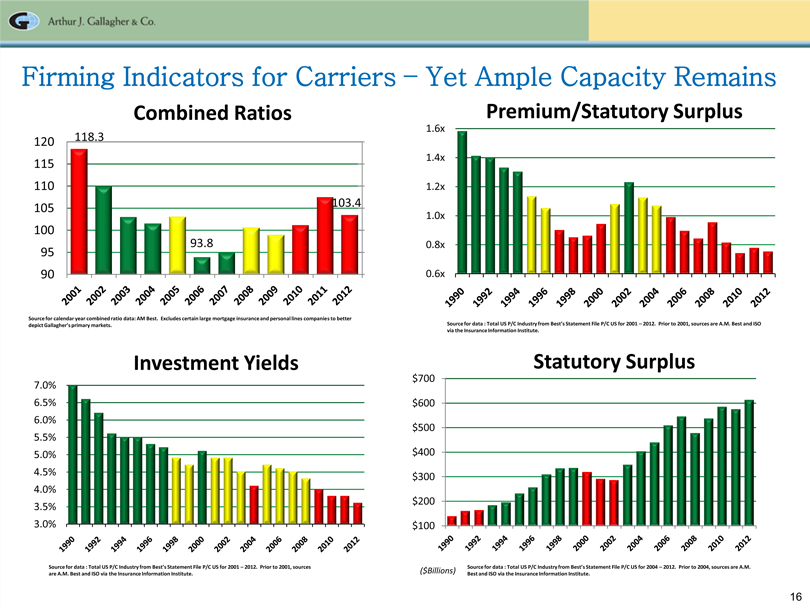
16 Arthur J. Gallagher & Co. 118.3 93.8 103.4 90 95 100 105 110 115 120 $100 $200 $300 $400 $500 $600 $700 Source for calendar year combined ratio data: AM Best. Excludes certain large mortgage insurance and personal lines companies to better depict Gallagher’s primary markets. Firming Indicators for Carriers – Yet Ample Capacity Remains 3.0% 3.5% 4.0% 4.5% 5.0% 5.5% 6.0% 6.5% 7.0% Source for data : Total US P/C Industry from Best’s Statement File P/C US for 2001 – 2012. Prior to 2001, sources are A.M. Best and ISO via the Insurance Information Institute. Investment Yields Statutory Surplus ($Billions) Source for data : Total US P/C Industry from Best’s Statement File P/C US for 2004 –2012. Prior to 2004, sources are A.M. Best and ISO via the Insurance Information Institute. Source for data : Total US P/C Industry from Best’s Statement File P/C US for 2001 – 2012. Prior to 2001, sources are A.M. Best and ISO via the Insurance Information Institute. 0.6x 0.8x 1.0x 1.2x 1.4x 1.6x Premium/Statutory Surplus Combined Ratios 2001 2002 2003 2004 2005 2006 2007 2008 2009 2010 2011 2012 1990 1992 1994 1996 1998 2000 2002 2004 2006 2008 2010 2012 1990 1992 1994 1996 1998 2000 2002 2004 2006 2008 2010 2012 1990 1992 1994 1996 1998 2000 2002 2004 2006 2008 2010 2012
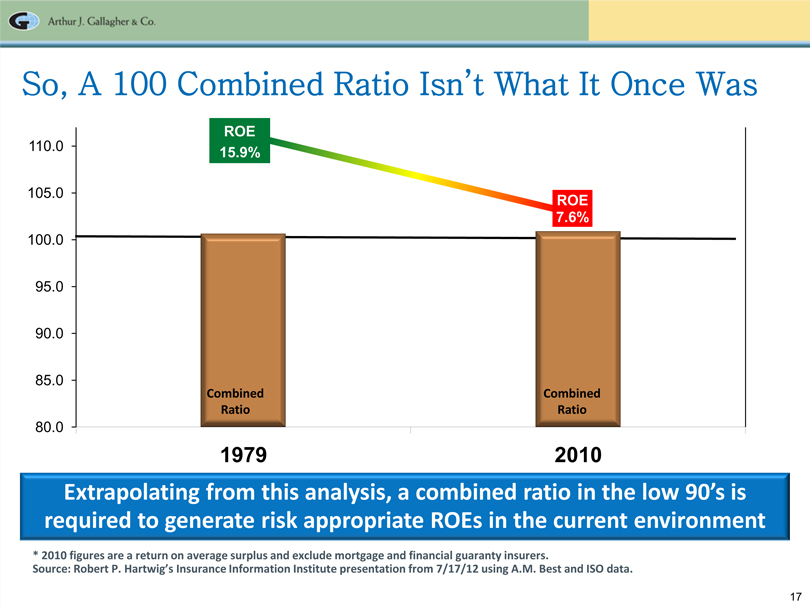
17 Arthur J. Gallagher & Co. So, A 100 Combined Ratio Isn’t What It Once Was *2010 figures are a return on average surplus and exclude mortgage and financial guaranty insurers. Source: Robert P. Hartwig’s Insurance Information Institute presentation from 7/17/12 using A.M. Best and ISO data. ROE 7.6% 80.0 85.0 90.0 95.0 100.0 105.0 110.0 1979 2010 Extrapolating from this analysis, a combined ratio in the low 90’s is required to generate risk appropriate ROEs in the current environment ROE 15.9% Combined Ratio Combined Ratio
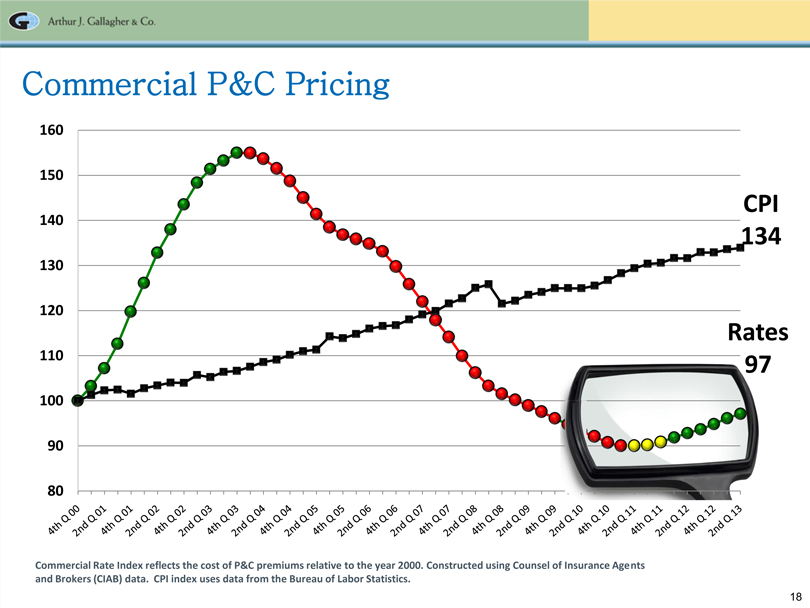
18 Arthur J. Gallagher & Co. Commercial Rate Index reflects the cost of P&C premiums relative to the year 2000. Constructed using Counsel of Insurance Agents and Brokers (CIAB) data. CPI index uses data from the Bureau of Labor Statistics. Commercial P&C Pricing 80 90 100 110 120 130 140 150 160 CPI 134 Rates 97
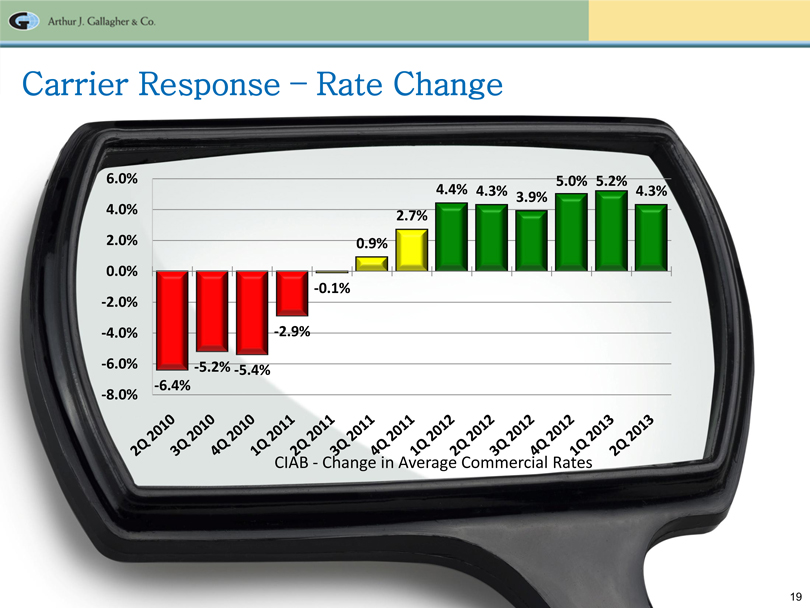
19 Arthur J. Gallagher & Co. -6.4% -5.2% -5.4% -2.9% -0.1% 0.9% 2.7% 4.4% 4.3% 3.9% 5.0% 5.2% 4.3% -8.0% -6.0% -4.0% -2.0% 0.0% 2.0% 4.0% 6.0% CIAB - Change in Average Commercial Rates Carrier Response – Rate Change
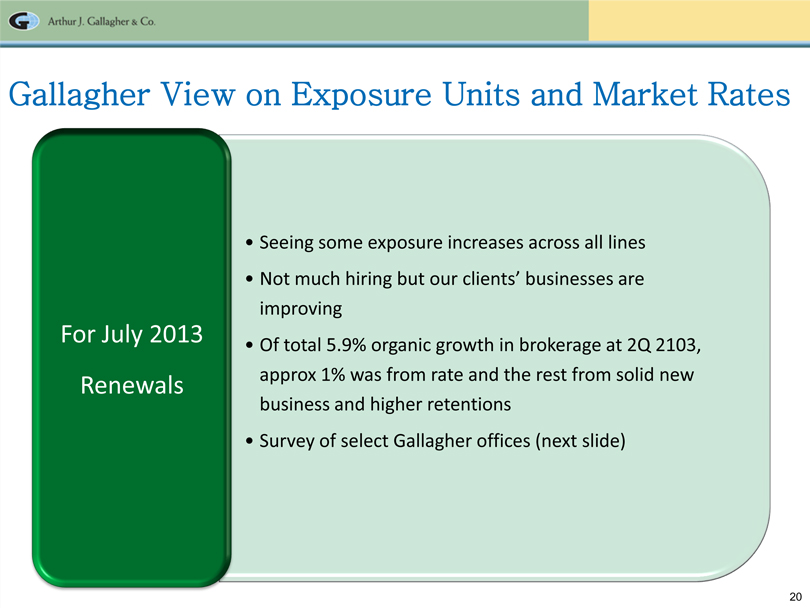
20 Arthur J. Gallagher & Co. Gallagher View on Exposure Units and Market Rates • Seeing some exposure increases across all lines • Not much hiring but our clients’ businesses are improving • Of total 5.9% organic growth in brokerage at 2Q 2103, approx 1% was from rate and the rest from solid new business and higher retentions • Survey of select Gallagher offices (next slide) For July 2013 Renewals
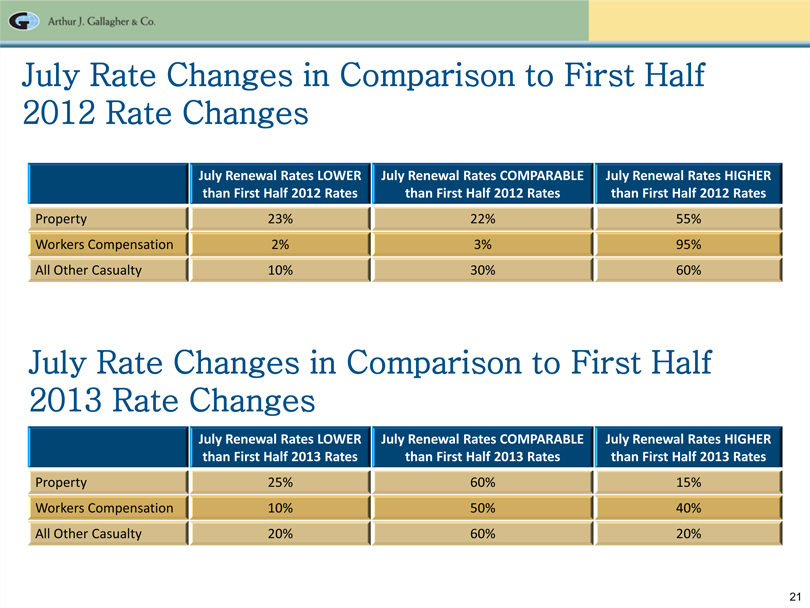
21 July Renewal Rates LOWER than First Half 2012 Rates July Renewal Rates COMPARABLE than First Arthur J. Gallagher & Co. Half 2012 Rates July Renewal Rates HIGHER than First Half 2012 Rates Property 23% 22% 55% Workers Compensation 2% 3% 95% All Other Casualty 10% 30% 60% July Rate Changes in Comparison to First Half 2012 Rate Changes July Rate Changes in Comparison to First Half 2013 Rate Changes July Renewal Rates LOWER than First Half 2013 Rates July Renewal Rates COMPARABLE than First Half 2013 Rates July Renewal Rates HIGHER than First Half 2013 Rates Property 25% 60% 15% Workers Compensation 10% 50% 40% All Other Casualty 20% 60% 20%
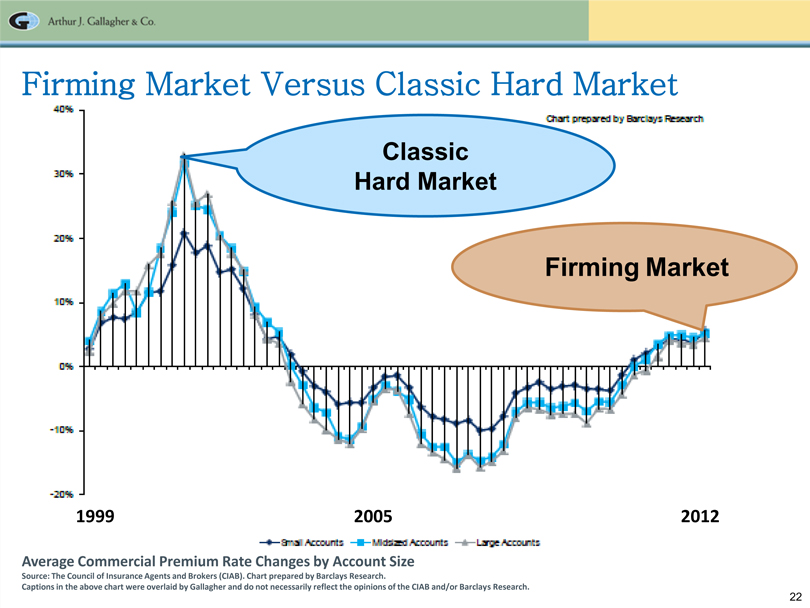
22 Arthur J. Gallagher & Co. Firming Market Versus Classic Hard Market Average Commercial Premium Rate Changes by Account Size Source: The Council of Insurance Agents and Brokers (CIAB). Chart prepared by Barclays Research. Captions in the above chart were overlaid by Gallagher and do not necessarily reflect the opinions of the CIAB and/or Barclays Research. 1999 2005 2012 Classic Hard Market Firming Market
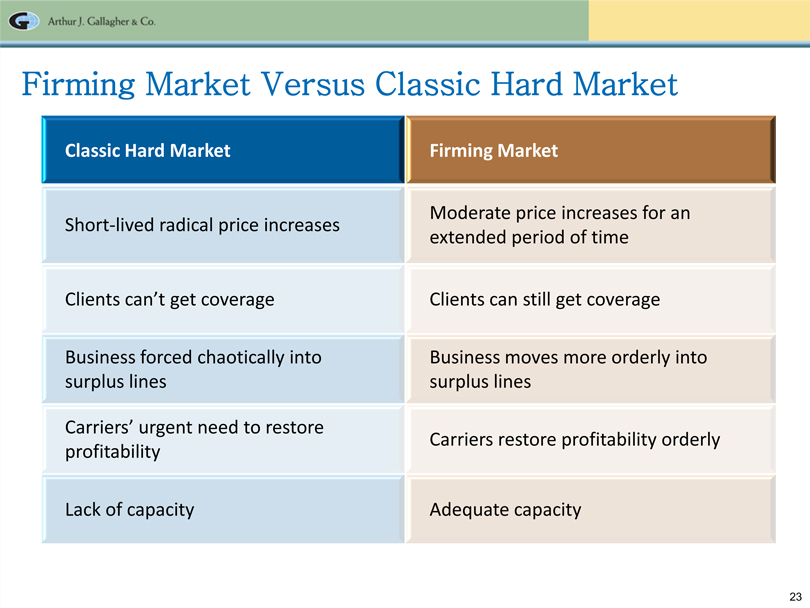
23 Arthur J. Gallagher & Co. Firming Market Versus Classic Hard Market Classic Hard Market Firming Market Short-lived radical price increases Clients can’t get coverage Business forced chaotically into surplus lines Carriers’ urgent need to restore profitability Lack of capacity Moderate price increases for an extended period of time Clients can still get coverage Business moves more orderly into surplus lines Carriers restore profitability orderly Adequate capacity
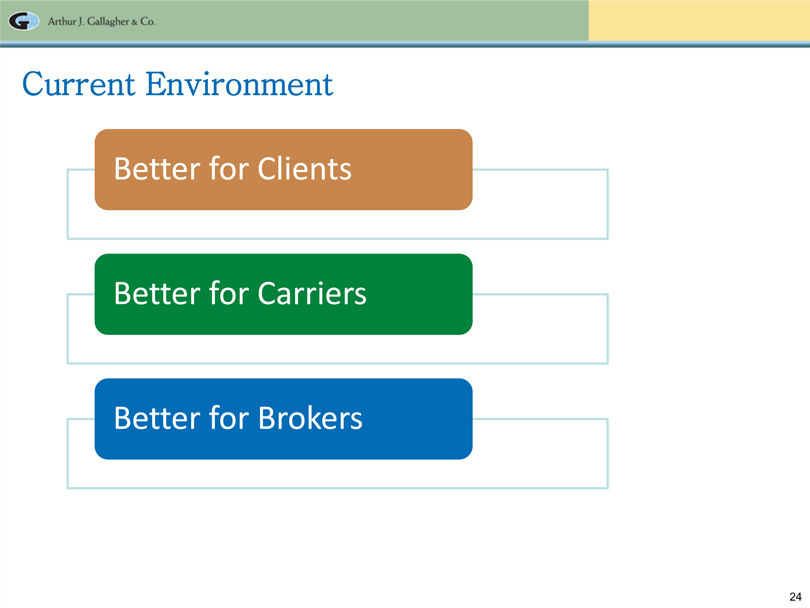
24 Arthur J. Gallagher & Co. Current Environment Better for Clients Better for Carriers Better for Brokers
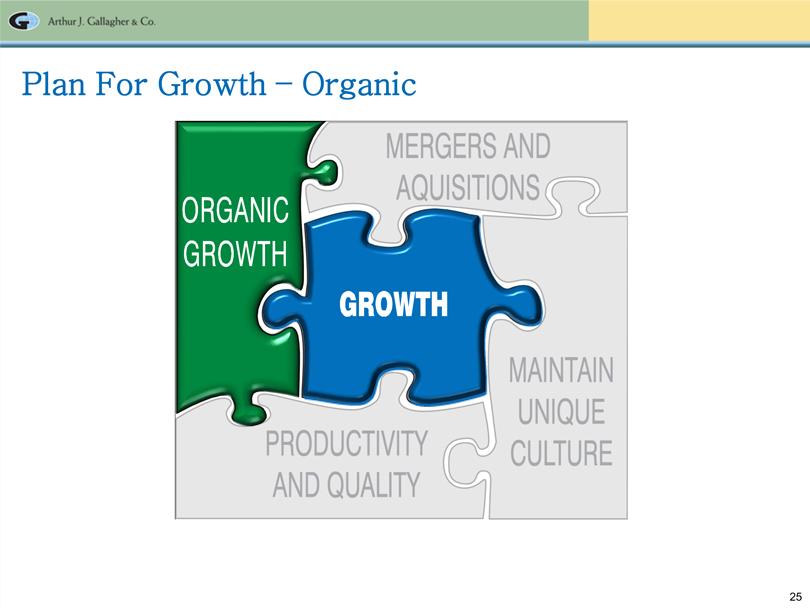
25 Arthur J. Gallagher & Co. Plan For Growth – Organic Organic Growth Mergers and Acquisitions Growth Productivity and quality Maintain unique Culture
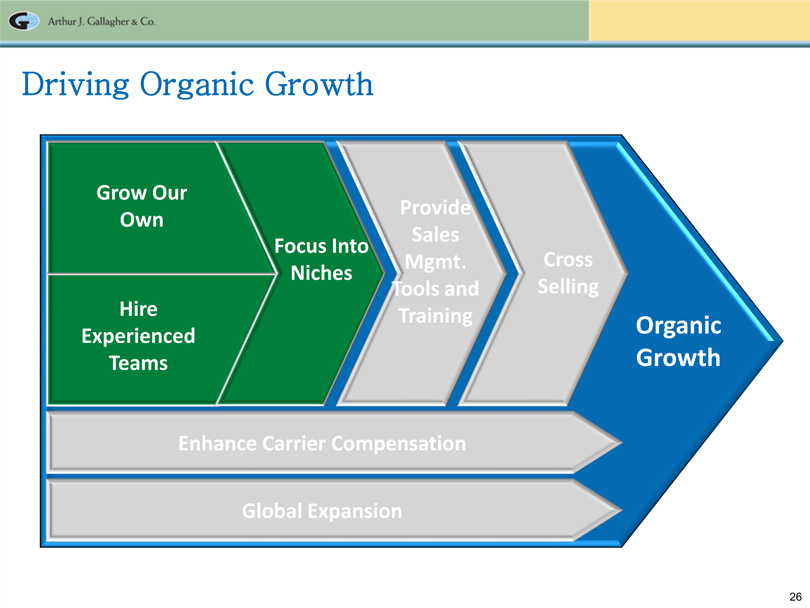
26 Arthur J. Gallagher & Co. Driving Organic Growth Organic Growth Enhance Carrier Compensation Global Expansion Grow Our Own Hire Experienced Teams Focus Into Niches Provide Sales Mgmt. Tools and Training Cross Selling
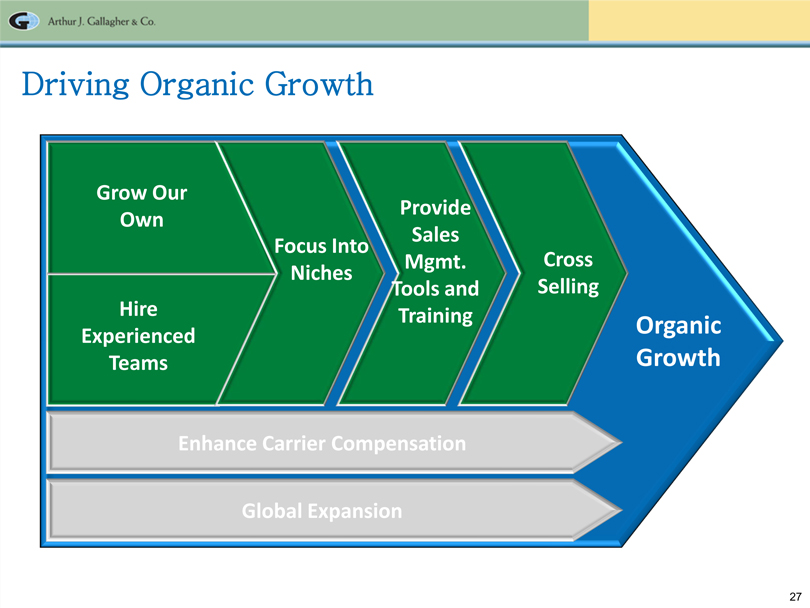
27 Arthur J. Gallagher & Co. Driving Organic Growth Organic Growth Enhance Carrier Compensation Global Expansion Grow Our Own Hire Experienced Teams Focus Into Niches Provide Sales Mgmt. Tools and Training Cross Selling
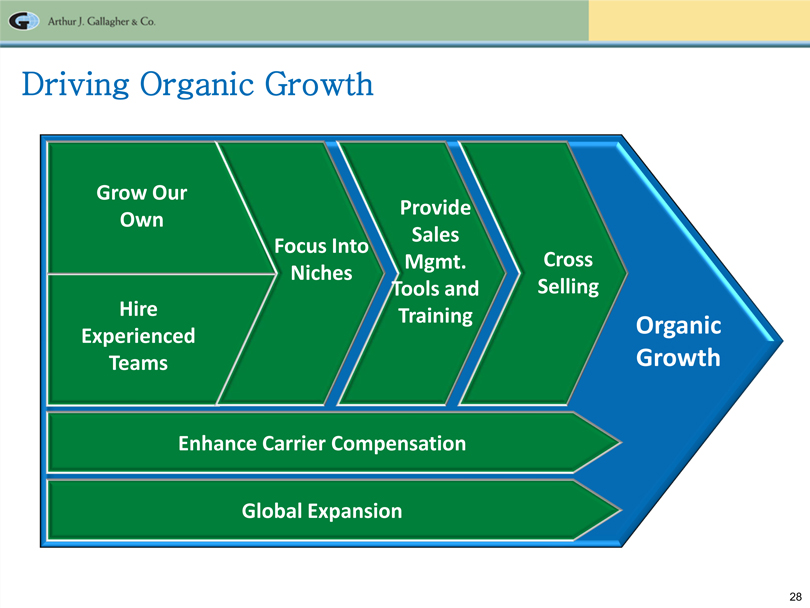
28 Arthur J. Gallagher & Co. Driving Organic Growth Organic Growth Enhance Carrier Compensation Global Expansion Grow Our Own Hire Experienced Teams Focus Into Niches Provide Sales Mgmt. Tools and Training Cross Selling

29 Arthur J. Gallagher & Co. Simplified Organic Illustration All figures on this slide are used only for illustration purposes and are not estimates of Gallagher’s future performance. $1.0m Subject to net impact of Other Revenue Drivers (-5%) +2% +2% Renewal Base Prior Year New Business Lost Business Current Year Revenue Impact of Rate on Renewals Impact of Exposure on Renewals +10% Other Revenue Drivers SEE NEXT PAGE
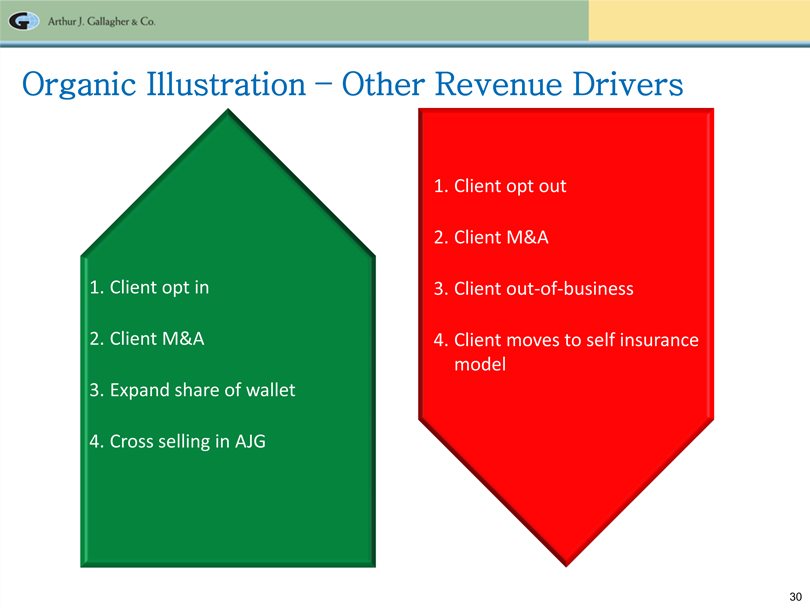
30 Arthur J. Gallagher & Co. Organic Illustration – Other Revenue Drivers 1. Client opt in 2. Client M&A 3. Expand share of wallet 4. Cross selling in AJG 1. Client opt out 2. Client M&A 3. Client out-of-business 4. Client moves to self insurance model
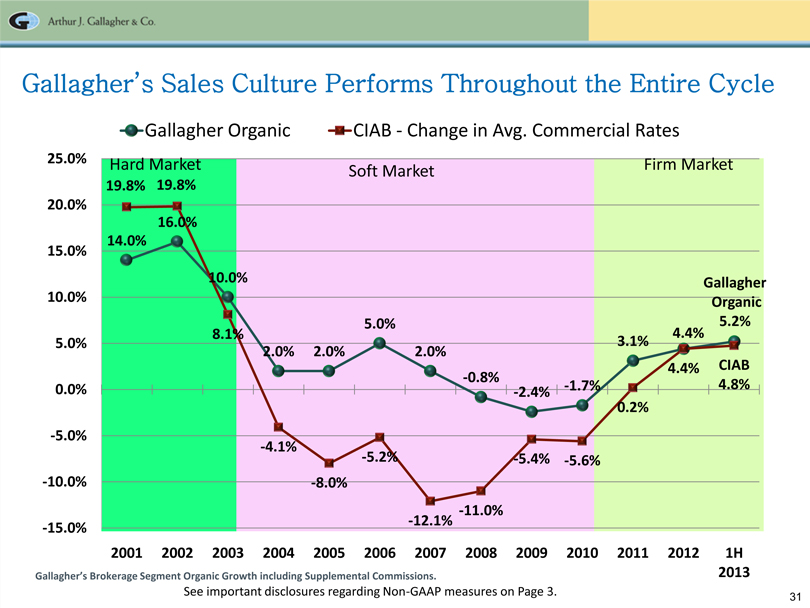
31 Arthur J. Gallagher & Co. Gallagher’s Brokerage Segment Organic Growth including Supplemental Commissions. Gallagher’s Sales Culture Performs Throughout the Entire Cycle 14.0% 16.0% 10.0% 2.0% 2.0% 5.0% 2.0% -0.8% -2.4% -1.7% 3.1% 4.4% Gallagher Organic 5.2% 19.8% 19.8% 8.1% -4.1%- 8.0% -5.2% -12.1% -11.0% -5.4% -5.6% 0.2% 4.4% CIAB 4.8% -15.0% -10.0% -5.0% 0.0% 5.0% 10.0% 15.0% 20.0% 25.0% 2001 2002 2003 2004 2005 2006 2007 20082009 2010 2011 2012 1H 2013 Gallagher Organic CIAB - Change in Avg. Commercial Rates Soft Market Hard Market Firm Market See important disclosures regarding Non-GAAP measures on Page 3.
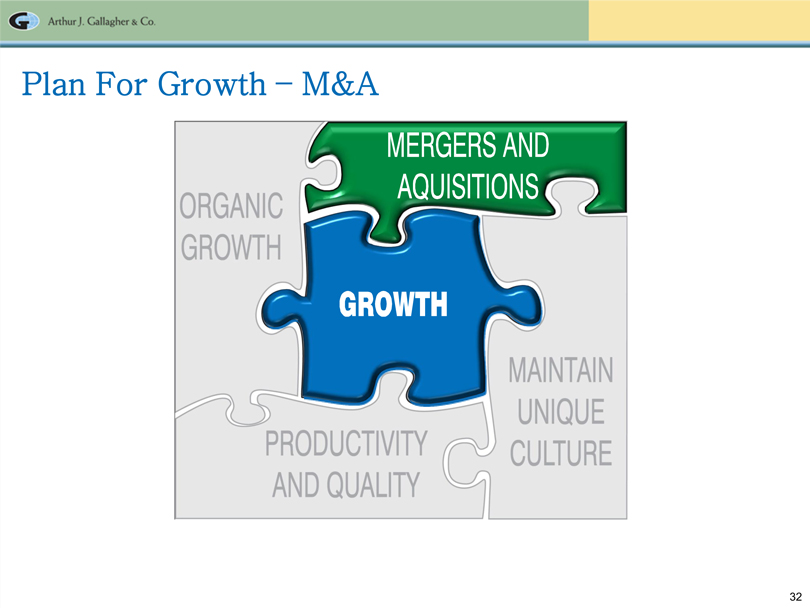
32 Arthur J. Gallagher & Co. Plan For Growth – M&A Organic Growth Mergers and Acquisitions Growth Productivity and quality Maintain unique Culture
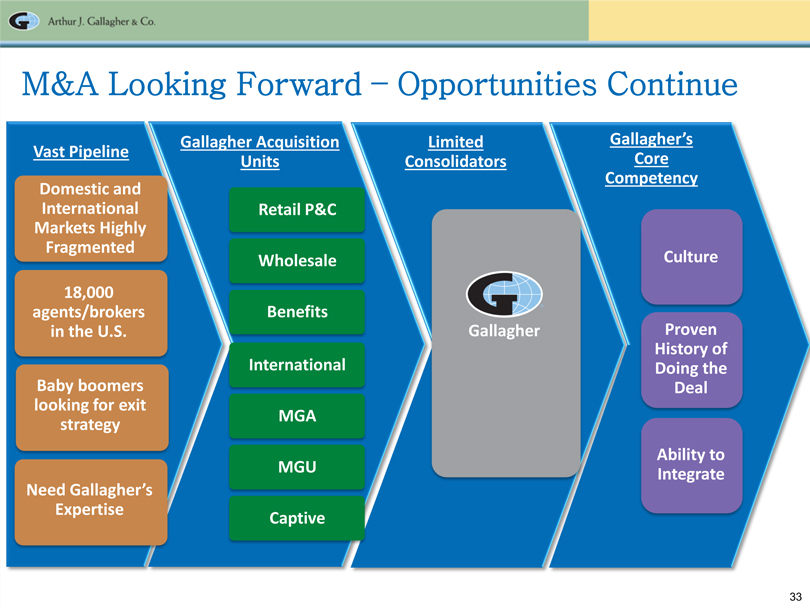
33 Arthur J. Gallagher & Co. M&A Looking Forward – Opportunities Continue Limited Consolidators Gallagher Acquisition Units Gallagher’s Core Competency Vast Pipeline Domestic and International Markets Highly Fragmented 18,000 agents/brokers in the U.S. Baby boomers looking for exit strategy Need Gallagher’s Expertise Retail P&C Wholesale Benefits International MGA MGU Captive Gallagher Culture Proven History of Doing the Deal Ability to Integrate
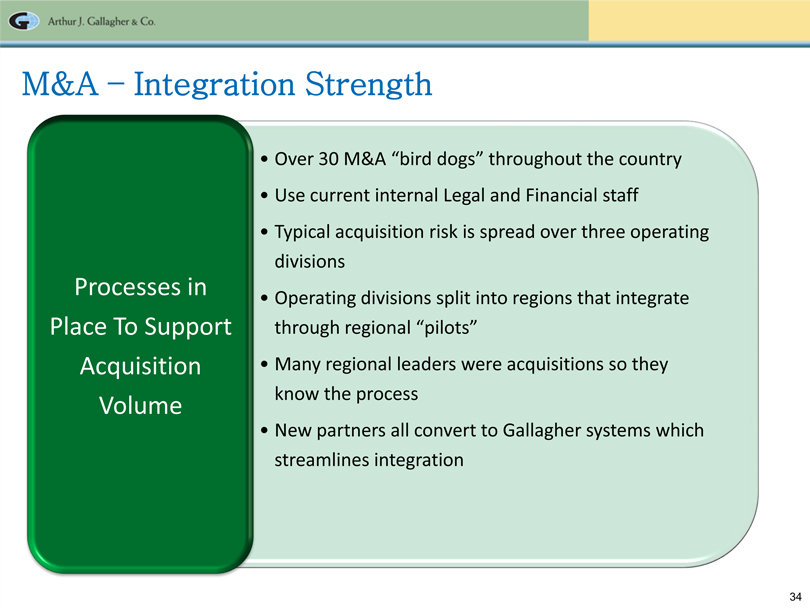
34 Arthur J. Gallagher & Co. M&A – Integration Strength •Over 30 M&A “bird dogs” throughout the country •Use current internal Legal and Financial staff •Typical acquisition risk is spread over three operating divisions •Operating divisions split into regions that integrate through regional “pilots” •Many regional leaders were acquisitions so they know the process •New partners all convert to Gallagher systems which streamlines integration Processes in Place To Support Acquisition Volume
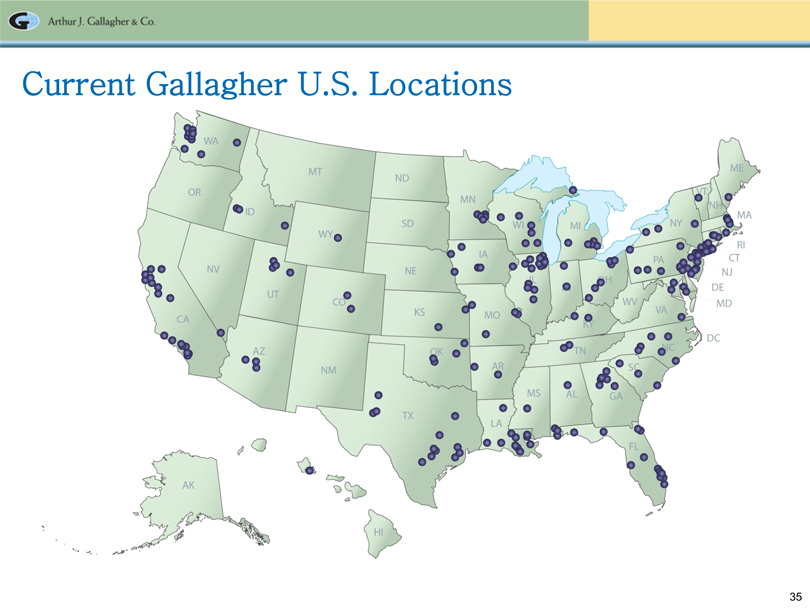
35 Arthur J. Gallagher & Co. Current Gallagher U.S. Locations
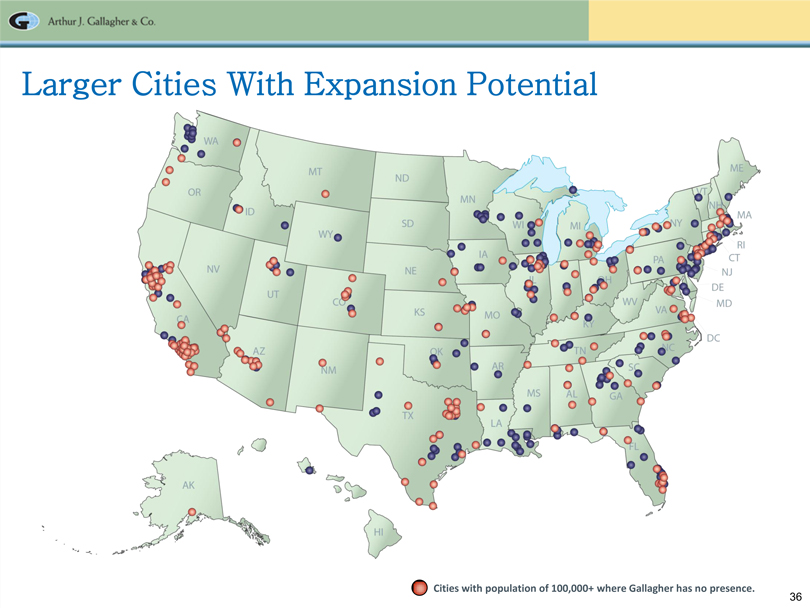
36 Arthur J. Gallagher & Co. Larger Cities With Expansion Potential Cities with population of 100,000+ where Gallagher has no presence.
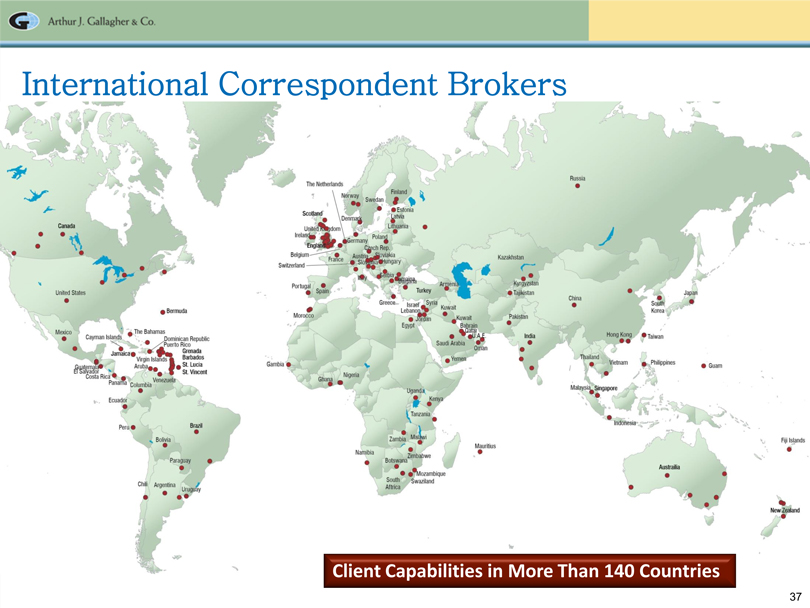
37 Arthur J. Gallagher & Co. International Correspondent Brokers Client Capabilities in More Than 140 Countries
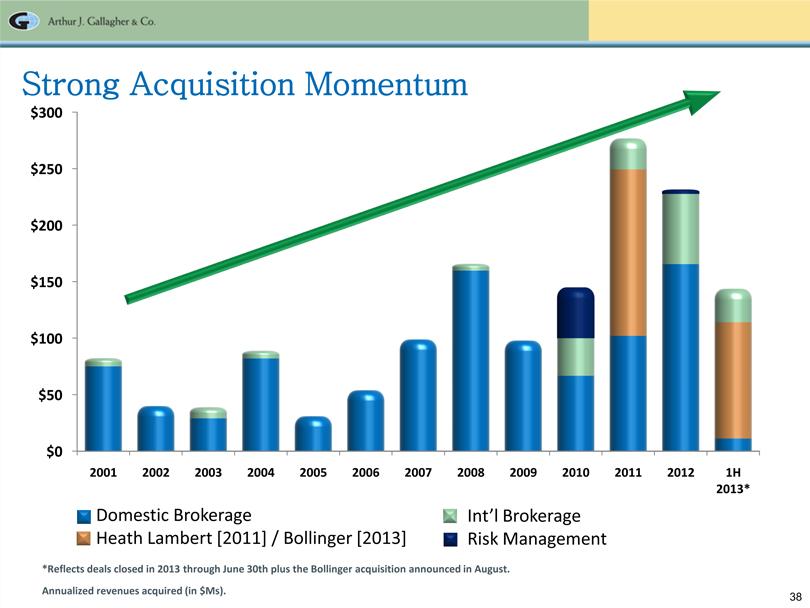
38 Arthur J. Gallagher & Co. $0 $50 $100 $150 $200 $250 $300 2001 2002 2003 2004 2005 2006 2007 2008 2009 2010 2011 2012 1H 2013* Strong Acquisition Momentum Annualized revenues acquired (in $Ms). Domestic Brokerage Heath Lambert [2011] / Bollinger [2013] Int’l Brokerage Risk Management *Reflects deals closed in 2013 through June 30th plus the Bollinger acquisition announced in August.
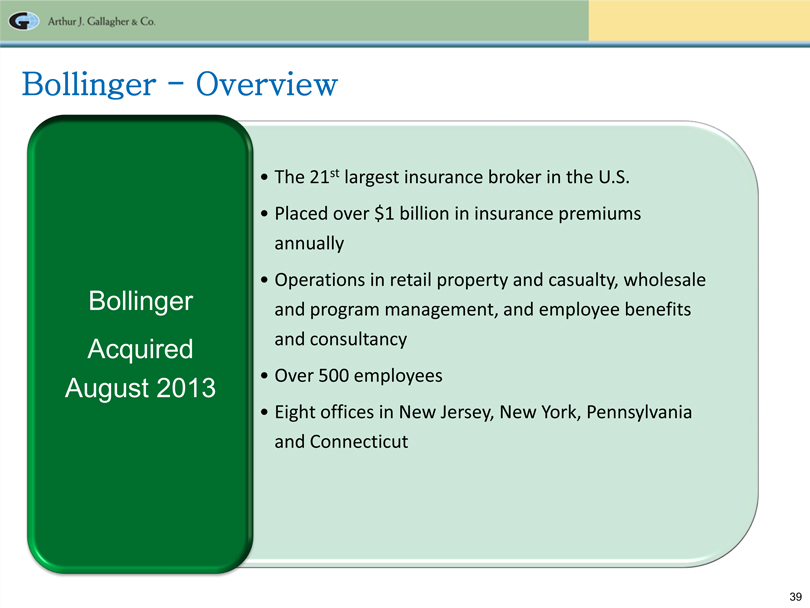
39 Arthur J. Gallagher & Co. Bollinger - Overview •The 21st largest insurance broker in the U.S. •Placed over $1 billion in insurance premiums annually •Operations in retail property and casualty, wholesale and program management, and employee benefits and consultancy •Over 500 employees •Eight offices in New Jersey, New York, Pennsylvania and Connecticut Bollinger Acquired August 2013
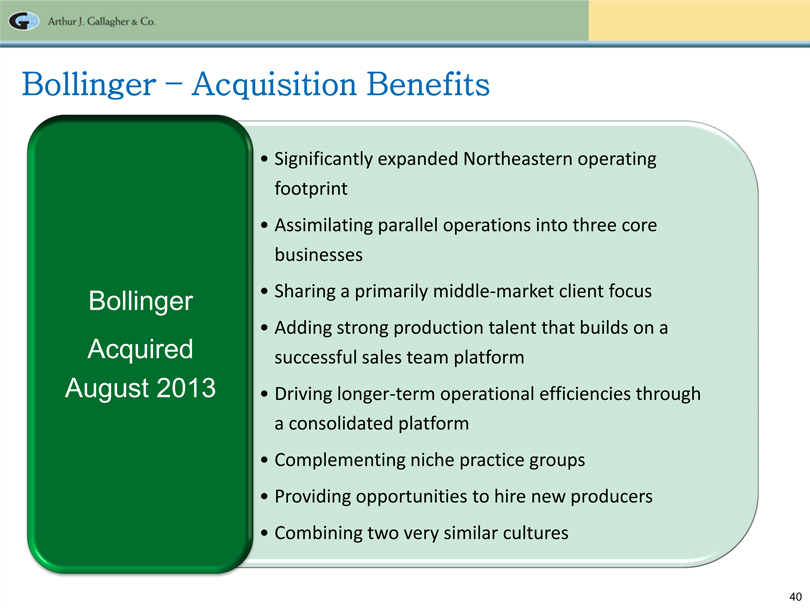
40 Arthur J. Gallagher & Co. Bollinger – Acquisition Benefits •Significantly expanded Northeastern operating footprint •Assimilating parallel operations into three core businesses •Sharing a primarily middle-market client focus •Adding strong production talent that builds on a successful sales team platform •Driving longer-term operational efficiencies through a consolidated platform •Complementing niche practice groups •Providing opportunities to hire new producers •Combining two very similar cultures Bollinger Acquired August 2013
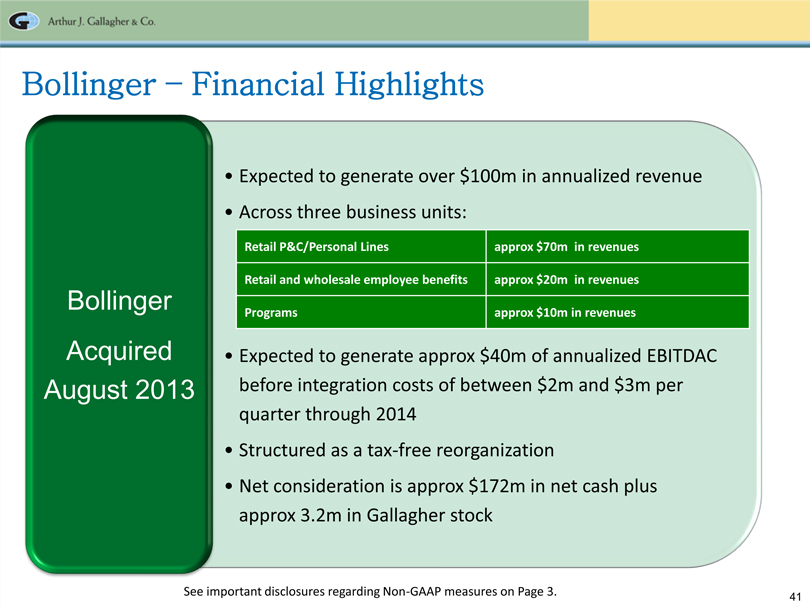
41 Arthur J. Gallagher & Co. Bollinger –Financial Highlights •Expected to generate over $100m in annualized revenue •Across three business units: •Expected to generate approx $40m of annualized EBITDAC before integration costs of between $2m and $3m per quarter through 2014 •Structured as a tax-free reorganization •Net consideration is approx $172m in net cash plus approx 3.2m in Gallagher stock Bollinger Acquired August 2013 Retail P&C/Personal Lines Retail and wholesale employee benefits Programs approx $70m in revenues approx $20m in revenues approx $10m in revenues See important disclosures regarding Non-GAAP measures on Page 3.
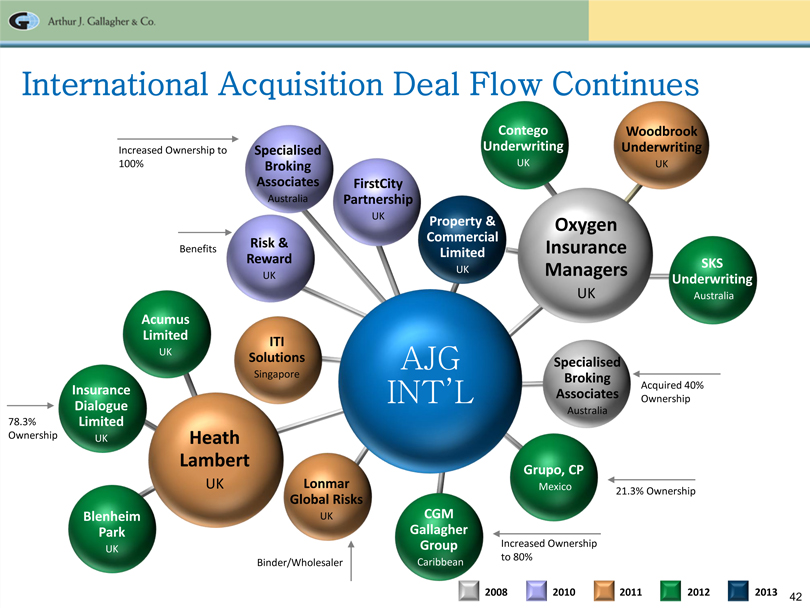
42 Arthur J. Gallagher & Co. International Acquisition Deal Flow Continues Contego Woodbrook Increased Ownership to Specialised Underwriting Underwriting 100% Broking UK UK Associates FirstCity Australia Partnership UK Property & Commercial Oxygen Risk & Benefits Reward Limited Insurance SKS UK Managers UK Underwriting UK Australia Acumus Limited ITI UK Solutions AJG Specialised Singapore Broking Insurance Acquired 40% INT’L Associates Ownership Dialogue Australia 78.3% Limited Ownership UK Heath Lambert Grupo, CP UK Lonmar Mexico 21.3% Ownership Global Risks Blenheim UK CGM Park Gallagher Group Increased Ownership UK to 80% Binder/Wholesaler Caribbean 2008 2010 2011 2012 2013
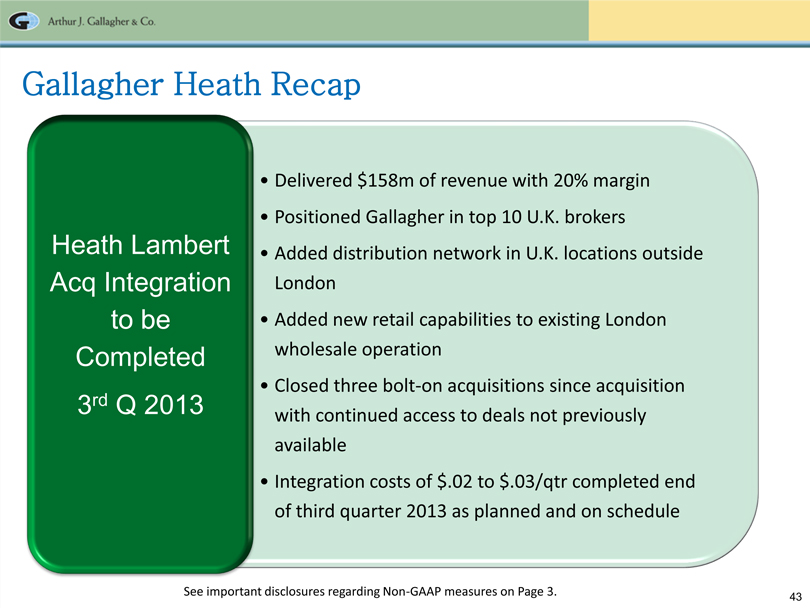
43 Arthur J. Gallagher & Co. Gallagher Heath Recap Delivered $158m of revenue with 20% margin Positioned Gallagher in top 10 U.K. brokers Heath Lambert Added distribution network in U.K. locations outside Acq Integration London to be Added new retail capabilities to existing London Completed wholesale operation Closed three bolt-on acquisitions since acquisition 3rd Q 2013 with continued access to deals not previously available Integration costs of $.02 to $.03/qtr completed end of third quarter 2013 as planned and on schedule See important disclosures regarding Non-GAAP measures on Page 3.
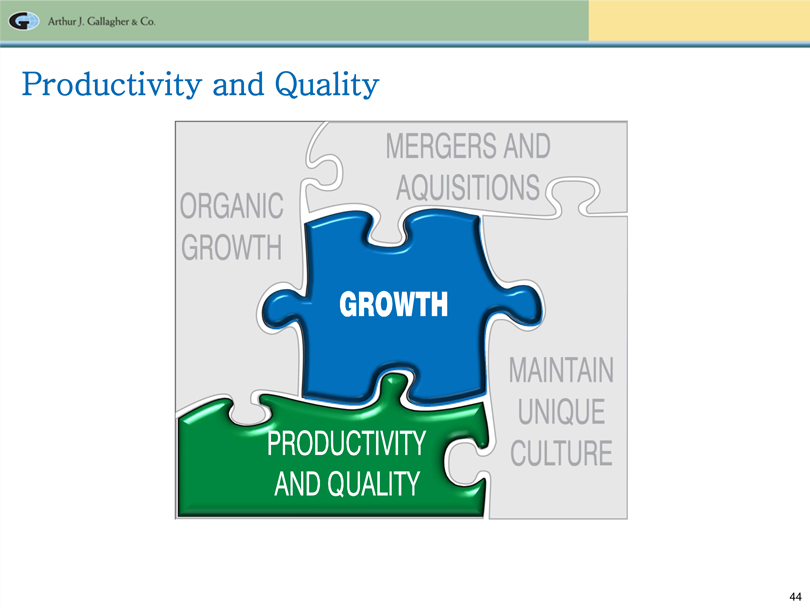
44 Arthur J. Gallagher & Co. Productivity and Quality ORGANIC GROWTH MERGERS AND ACQUISITIONS GROWTH PRODUCTIVITY AND QUALITY MAINTAIN UNIQUE CULTURE
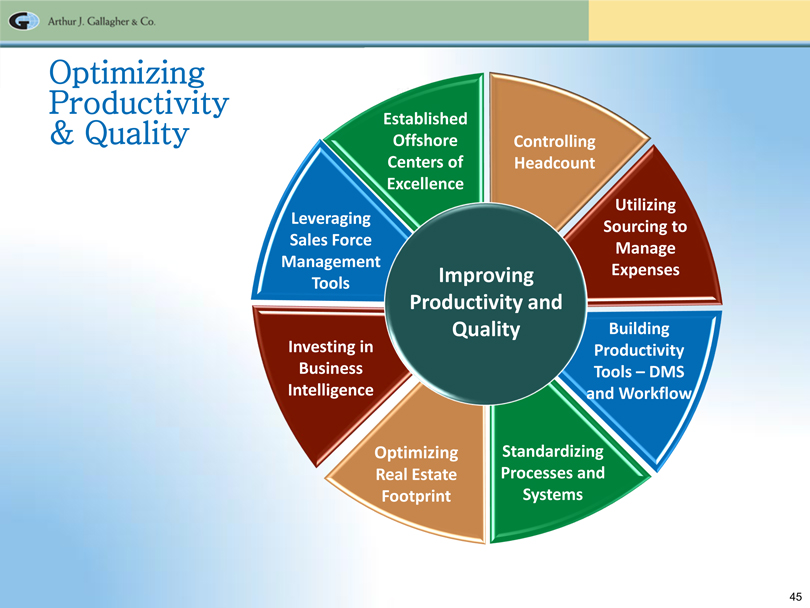
45 Arthur J. Gallagher & Co. Optimizing Productivity Established & Quality Controlling Leveraging Utilizing Sales Force Sourcing to Management Manage Tools Improving Expenses Productivity and Quality Investing in Business DMS Intelligence Workflow Standardizing Real Estate Processes and Footprint Systems
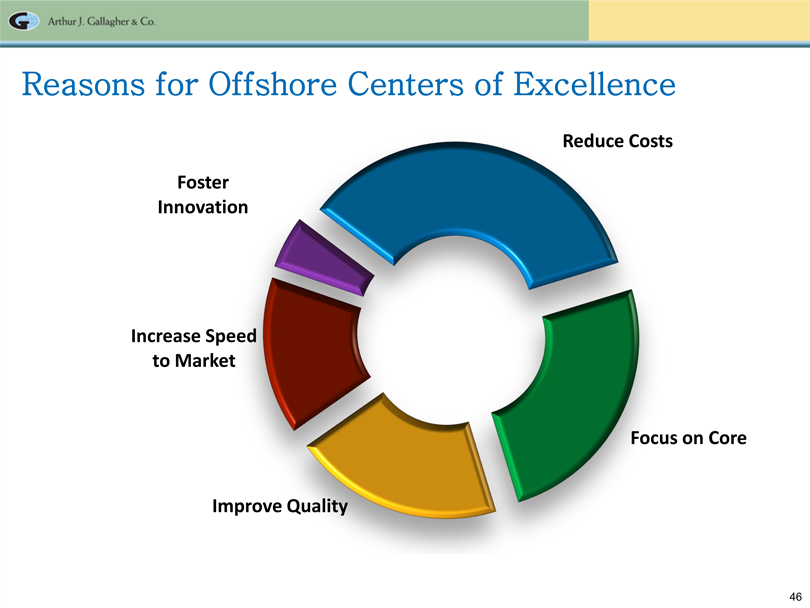
46 Arthur J. Gallagher & Co. Reasons for Offshore Centers of Excellence Reduce Costs Foster Innovation Increase Speed to Market Focus on Core Improve Quality
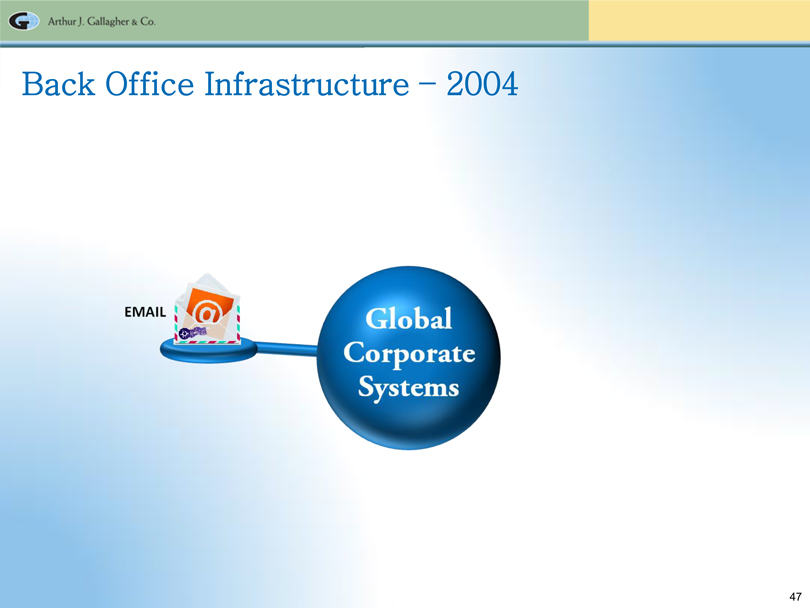
47 Arthur J. Gallagher & Co. Back Office Infrastructure – 2004 EMAIL Global Corporate Systems

48 Arthur J. Gallagher & Co. Back Office – Today GENERAL LEDGER CORPORATE INTRANET DATA WAREHOUSE EMAIL HR/ PAYROLL REAL ESTATE LEASING DOCUMENT MANAGEMENT T&E PLANNING
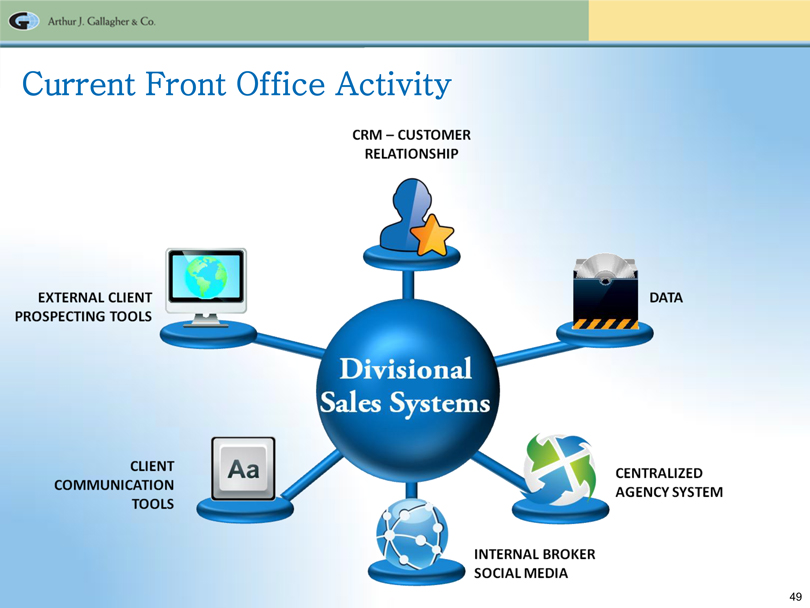
49 Arthur J. Gallagher & Co. Current Front Office Activity CRM – CUSTOMER RELATIONSHIP EXTERNAL CLIENT PROSPECTING TOOLS DATA Divisional Sales Systems CLIENT COMMUNICATION TOOLS Aa CENTRALIZED AGENCY SYSTEM INTERNAL BROKER SOCIAL MEDIA
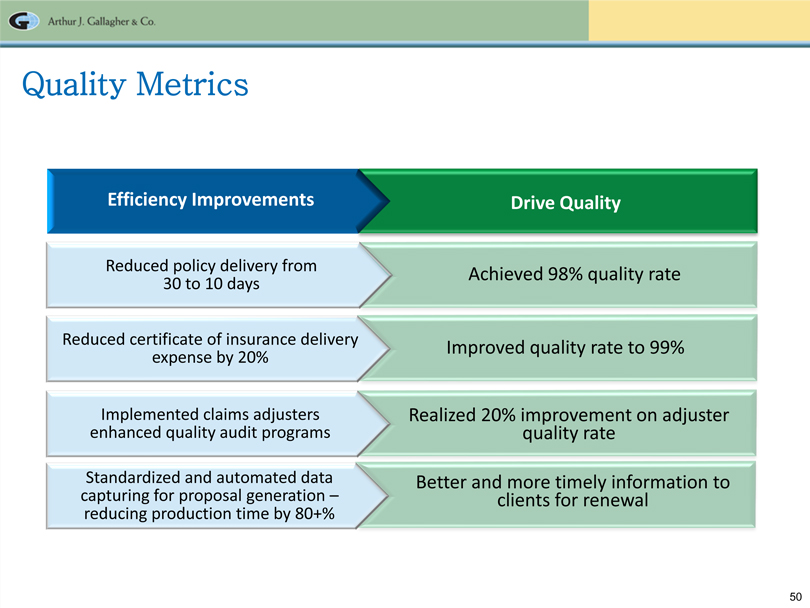
50 Arthur J. Gallagher & Co. Quality Metrics Efficiency Improvements Drive Quality Reduced policy delivery from Achieved 98% quality rate 30 to 10 days Reduced certificate of insurance delivery Improved quality rate to 99% expense by 20% Implemented claims adjusters Realized 20% improvement on adjuster enhanced quality audit programs quality rate Standardized and automated data Better and more timely information to capturing for proposal generation – clients for renewal reducing production time by 80+%
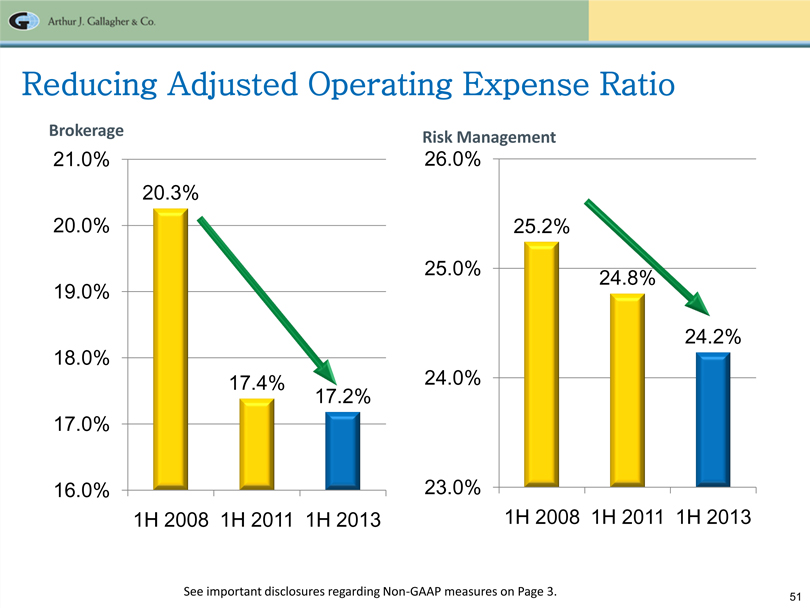
51 Arthur J. Gallagher & Co. Reducing Adjusted Operating Expense Ratio Brokerage Risk Management 21.0% 26.0% 20.3% 20.0% 25.2% 25.0% 19.0% 24.2% 18.0% 24.0% 17.2% 17.0% 16.0% 23.0% 1H 2008 1H 2011 1H 2013 1H 2008 1H 2011 1H 2013 See important disclosures regarding Non-GAAP measures on Page 3.
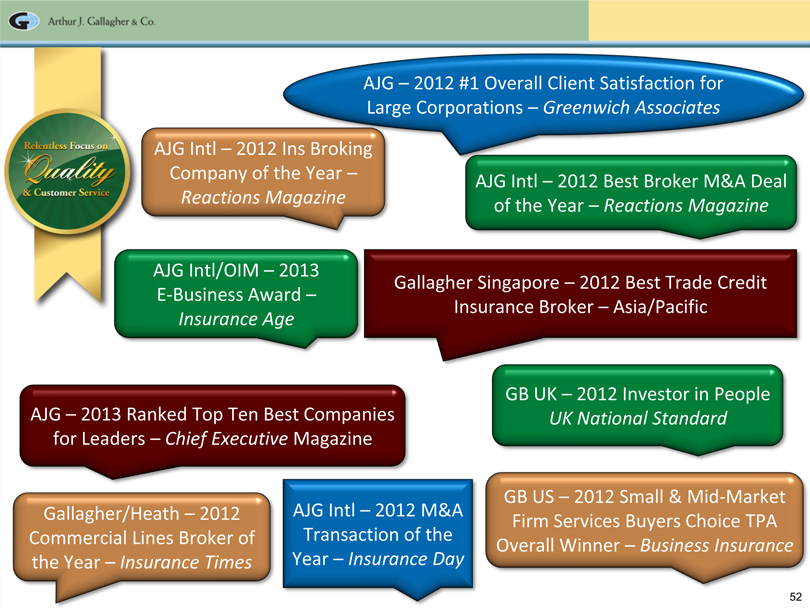
52 Arthur J. Gallagher & Co. Relentless Focus on Quality & Customer Service AJG – 2012 #1 Overall Client Satisfaction for Large Corporations – Greenwich Associates AJG Intl – 2012 Ins Broking Company of the Year – AJG Intl – 2012 Best Broker M&A Deal Reactions Magazine of the Year – Reactions Magazine AJG Intl/OIM – 2013 Gallagher Singapore – 2012 Best Trade Credit E-Business Award – Insurance Broker – Asia/Pacific Insurance Age GB UK – 2012 Investor in People AJG – 2013 Ranked Top Ten Best Companies UK National Standard for Leaders – Chief Executive Magazine GB US – 2012 Small & Mid-Market Gallagher/Heath – 2012 AJG Intl – 2012 M&A Firm Services Buyers Choice TPA Commercial Lines Broker of Transaction of the Overall Winner – Business Insurance the Year – Insurance Times Year – Insurance Day
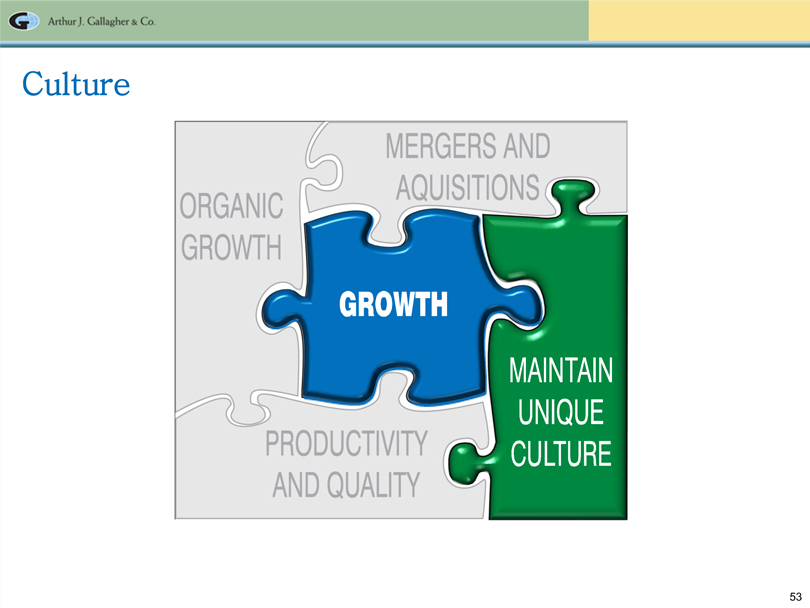
53 Arthur J. Gallagher & Co. Culture ORGANIC GROWTH MERGERS AND ACQUISITIONS GROWTH PRODUCTIVITY AND QUALITY MAINTAIN UNIQUE CULTURE

54 Arthur J. Gallagher & Co. Maintain Unique Culture Teamwork People The Gallagher Way Core Values Performance-Based Culture Shared values at Arthur J. Gallagher & Co. are the rock foundation of the Company and our Culture. What is a Shared Value? These are concepts that the vast majority of the movers and shakers in the Company passionately adhere to. What are some of Arthur J. Gallagher & Co.’s Shared Values? We are a Sales and Marketing Company dedicated to providing excellence in Risk Management Services to our clients. We support one another. We believe in one another. We acknowledge and respect the ability of one another. We push for professional excellence. We can all improve and learn from one another. There are no second-class citizens—everyone is important and everyone’s job is important. We’re an open society. Empathy for the other person is not a weakness. Suspicion breeds more suspicion. To trust and be trusted is vital. Leaders need followers. How leaders treat followers has a direct impact on the effectiveness of the leader. Interpersonal business relationships should be built. We all need one another. We are all cogs in a wheel. No department or person is an island. Professional courtesy is expected. Never ask someone to do something you wouldn’t do yourself. I consider myself support for our Sales and Marketing. We can’t make things happen without each other. We are a team. Loyalty and respect are earned—not dictated. Fear is a turnoff. People skills are very important at Arthur J. Gallagher & Co. We’re a very competitive and aggressive Company. We run to problems—not away from them. We adhere to the highest standards of moral and ethical behavior. People work harder and are more effective when they’re turned on—not turned off. We are a warm, close Company. This is a strength—not a weakness. We must continue building a professional Company—together—as a team. Shared values can be altered with circumstances—but carefully and with tact and consideration for one another’s needs. When accepted Shared Values are changed or challenged, the emotional impact and negative feelings can damage the Company Robert E. Gallagher May 1984
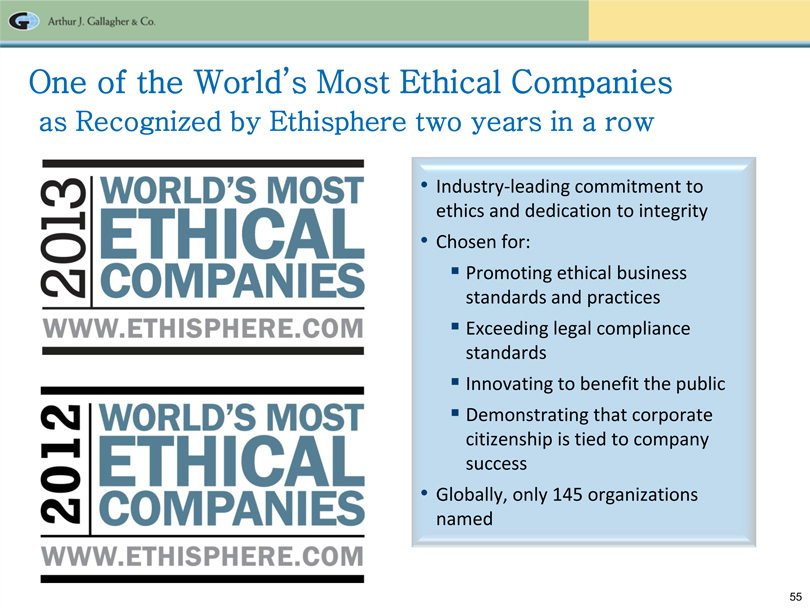
55 Arthur J. Gallagher & Co. One of the World’s Most Ethical Companies as Recognized by Ethisphere two years in a row 2013 WORLD’S MOST ETHICAL COMPANIES WWW.ETHISPHERE.COM 2012 WORLD’S MOST ETHICAL COMPANIES WWW.ETHISPHERE.COM Industry-leading commitment to ethics and dedication to integrity Chosen for: Promoting ethical business standards and practices Exceeding legal compliance standards Innovating to benefit the public Demonstrating that corporate citizenship is tied to company success Globally, only 145 organizations named
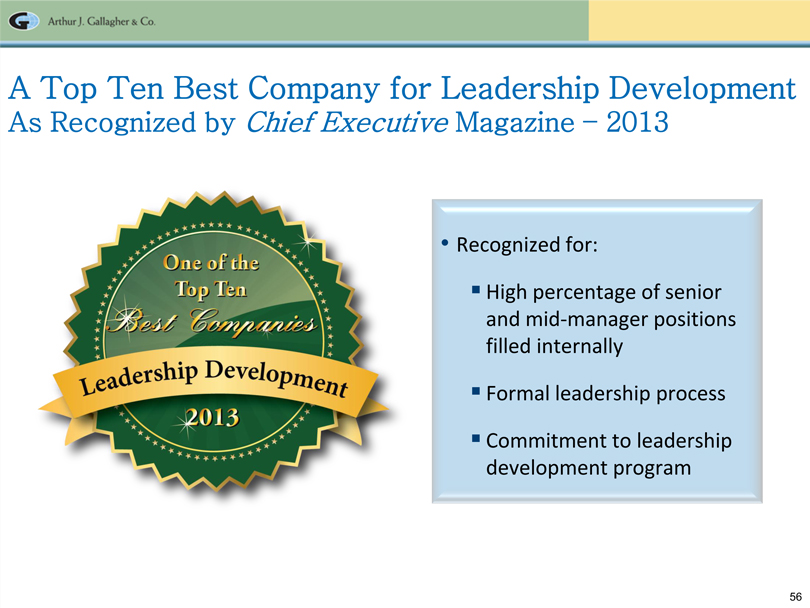
56 Arthur J. Gallagher & Co. A Top Ten Best Company for Leadership Development As Recognized by Chief Executive Magazine – 2013 One of the Top Ten Best Companies Leadership Development 2013 Recognized for: High percentage of senior and mid-manager positions filled internally Formal leadership process Commitment to leadership development program
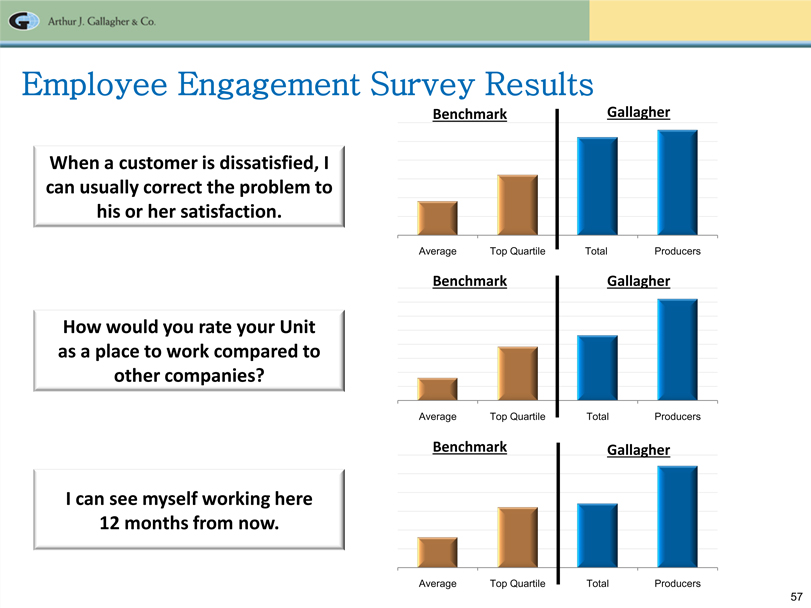
57 Arthur J. Gallagher & Co. Employee Engagement Survey Results Benchmark Gallagher When a customer is dissatisfied, I can usually correct the problem to his or her satisfaction. Average Top Quartile Total Producers Benchmark Gallagher How would you rate your Unit as a place to work compared to other companies? Average Top Quartile Total Producers Benchmark Gallagher I can see myself working here 12 months from now. Average Top Quartile Total Producers
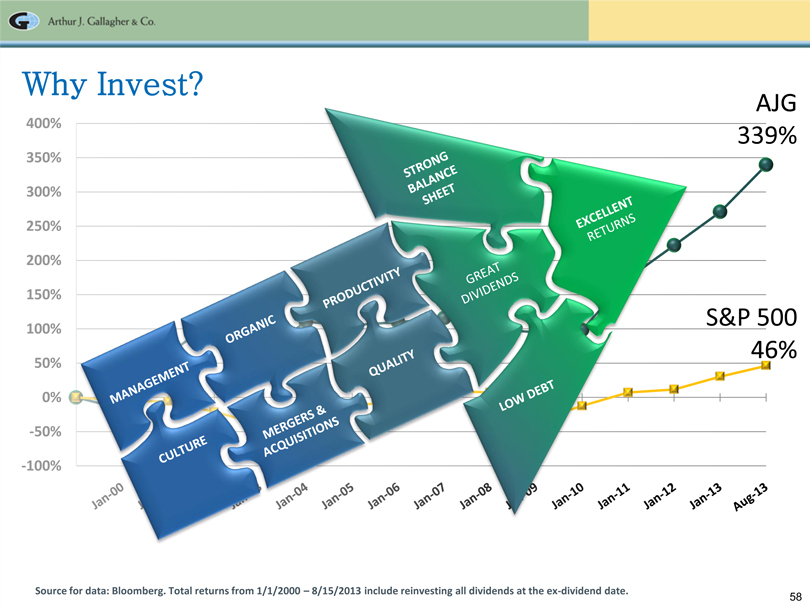
58 Arthur J. Gallagher & Co. Why Invest? MANAGEMENT ORGANIC PRODUCTIVITY STRONG BALANCE SHEET GREAT DIVIDENDS EXCELLENT RETURNS CULTURE MERGERS & ACQUISITIONS QUALITY LOW DEBT -100% -50%0% 50% 100% 150% 200% 250% 300% 350% 400% Jan-00 Jan-01 Jan-02 Jan-03 Jan-04 Jan-05 Jan-06 Jan-07 Jan-08 Jan-09 Jan-10 Jan-11 Jan-12 Jan-13 Aug-13 AJG339% S&P 50046% Source for data: Bloomberg. Total returns from 1/1/2000 –8/15/2013 include reinvesting all dividends at the ex-dividend date.

59 Questions & Answers For Additional Information Marsha Akin Director – Investor Relations Marsha_Akin@ajg.com Phone: 630-285-3501
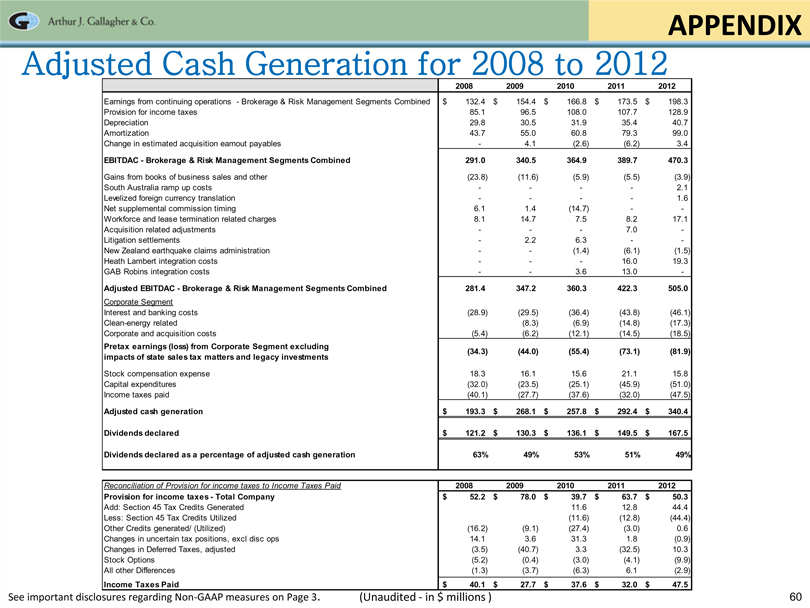
60 Arthur J. Gallagher & Co. APPENDIX Adjusted Cash Generation for 2008 to 2012 2008 2009 2010 2011 2012 Earnings from continuing operations —Brokerage & Risk Management Segments Combined $ 132.4 $ 154.4 $ 166.8 $ 173.5 $ 198.3 Provision for income taxes 85.1 96.5 108.0 107.7 128.9 Depreciation 29.8 30.5 31.9 35.4 40.7 Amortization 43.7 55.0 60.8 79.3 99.0 Change in estimated acquisition earnout payables — 4.1 (2.6) (6.2) 3.4 EBITDAC—Brokerage & Risk Management Segments Combined 291.0 340.5 364.9 389.7 470.3 Gains from books of business sales and other (23.8) (11.6) (5.9) (5.5) (3.9) South Australia ramp up costs — — — — 2.1 Levelized foreign currency translation — — — — 1.6 Net supplemental commission timing 6.1 1.4 (14.7) — -Workforce and lease termination related charges 8.1 14.7 7.5 8.2 17.1 Acquisition related adjustments — — — 7.0 -Litigation settlements — 2.2 6.3 — -New Zealand earthquake claims administration — — (1.4) (6.1) (1.5) Heath Lambert integration costs — — — 16.0 19.3 GAB Robins integration costs — — 3.6 13.0 —Adjusted EBITDAC—Brokerage & Risk Management Segments Combined 281.4 347.2 360.3 422.3 505.0 Corporate Segment Interest and banking costs (28.9) (29.5) (36.4) (43.8) (46.1) Clean-energy related (8.3) (6.9) (14.8) (17.3) Corporate and acquisition costs (5.4) (6.2) (12.1) (14.5) (18.5) Pretax earnings (loss) from Corporate Segment excluding (34.3) (44.0) (55.4) (73.1) (81.9) impacts of state sales tax matters and legacy investments Stock compensation expense 18.3 16.1 15.6 21.1 15.8 Capital expenditures (32.0) (23.5) (25.1) (45.9) (51.0) Income taxes paid (40.1) (27.7) (37.6) (32.0) (47.5) Adjusted cash generation $ 193.3 $ 268.1 $ 257.8 $ 292.4 $ 340.4 Dividends declared $ 121.2 $ 130.3 $ 136.1 $ 149.5 $ 167.5 Dividends declared as a percentage of adjusted cash generation 63% 49% 53% 51% 49% Reconciliation of Provision for income taxes to Income Taxes Paid 2008 2009 2010 2011 2012 Provision for income taxes—Total Company $ 52.2 $ 78.0 $ 39.7 $ 63.7 $ 50.3 Add: Section 45 Tax Credits Generated 11.6 12.8 44.4 Less: Section 45 Tax Credits Utilized (11.6) (12.8) (44.4) Other Credits generated/ (Utilized) (16.2) (9.1) (27.4) (3.0) 0.6 Changes in uncertain tax positions, excl disc ops 14.1 3.6 31.3 1.8 (0.9) Changes in Deferred Taxes, adjusted (3.5) (40.7) 3.3 (32.5) 10.3 Stock Options (5.2) (0.4) (3.0) (4.1) (9.9) All other Differences (1.3) (3.7) (6.3) 6.1 (2.9) Income Taxes Paid $ 40.1 $ 27.7 $ 37.6 $ 32.0 $ 47.5 See important disclosures regarding Non-GAAP measures on Page 3. (Unaudited—in $ millions )