Exhibit 99.1
|
Investment Presentation
FEBRUARY 2015
|
Information Regarding Forward-Looking Statements
This presentation contains “forward-looking statements” within the meaning of the Private Securities Litigation Reform Act of 1995. When used in this presentation, the words “anticipates,” “believes,” “contemplates,” “see,” “should,” “could,” “will,” “estimates,” “expects,” “intends,” “plans” and variations thereof and similar expressions, are intended to identify forward-looking statements. Examples of forward-looking statements in this presentation include, but are not limited to, statements regarding: (i) our debt levels and plans to borrow; (ii) the state of the economy and our industry (including combined ratios for insurance companies, insurance rates, P&C pricing, exposure units and the existence of a hard or firming market); (iii) drivers and expected levels of organic growth; (iv) our pace of, and expected sources of funding for, acquisition activity (including our pace of expansion outside the United States); (v) increasing productivity; (vi) the financial condition of the company; (vii) total shareholder return; (viii) efficiencies and capabilities generated by system improvements; (ix) the impact of expense reduction initiatives; and (x) the earnings impact of, and developments relating to, our clean energy investments. Important factors that could cause actual results to differ materially from those in the forward-looking statements include the following:
Changes in worldwide and national economic conditions , changes in premium rates and in insurance markets generally, changes in the insurance brokerage industry’s competitive landscape, changes in the regulatory environment, our inability to identify appropriate acquisition targets at the right price, and the difficulties inherent in combining the cultures and systems of different companies could impact (i) – (xi) above; and
Risks and uncertainties related to Gallagher’s clean energy investments – including uncertainties related to political and regulatory risks, including potential actions by Congress or challenges by the IRS eliminating or reducing the availability of tax credits under IRC Section 45 retroactively and/or going forward; the ability to maintain and find co-investors; the potential for divergent business objectives by co-investors and other stakeholders; plant operational risks, including supply-chain risks; utilities’ future use of, or demand for, coal; the market price of coal; the costs of moving a clean coal plant; intellectual property litigation risks; and environmental risks –could impact (xii) above.
Please refer to Gallagher’s filings with the SEC, including Item 1A, “Risk Factors,” of its Annual Report on Form 10-K for the fiscal year ended December 31, 2014 for a more detailed discussion of these and other factors that could impact its forward-looking statements.
2 |
|
|
Information Regarding Non-GAAP Measures
This presentation includes references to Adjusted EBITDAC, Adjusted EBITDAC margin, Adjusted Revenues, Adjusted Operating Expense Ratio and Organic Growth, which are measures not in accordance with, or an alternative to, the GAAP information provided herein.
Earnings Measures - Gallagher believes that each of Adjusted EBITDAC and Adjusted EBITDAC margin, as defined below, provides a meaningful representation of its operating performance and improves the comparability of Gallagher’s results between periods by eliminating the impact of certain items that have a high degree of variability.
Adjusted EBITDAC is defined as earnings from continuing operations before interest, income taxes, depreciation, amortization and the change in estimated acquisition earnout payables (EBITDAC), further adjusted to exclude gains realized from sales of books of business, acquisition integration costs, earnout related compensation charges, workforce related charges, lease termination related charges, New South Wales client run-off costs, South Australia and claim portfolio transfer ramp up fees/costs, acquisition related adjustments and the period-over-period impact of foreign currency translation, as applicable.
Adjusted EBITDAC margin is defined as Adjusted EBITDAC divided by Adjusted Revenues (defined below).
The most directly comparable GAAP measure for these non-GAAP earnings measures is net earnings. For the Brokerage Segment, the Risk Management Segment, and the two segments on a combined basis, net earnings was $156 million, $42 million and $198 million, respectively, in 2012, $205 million, $46 million and $251 million in 2013, and $264 million, $41 million and $305 million, respectively, in 2014.
Revenue and Expense Measures - Gallagher believes that Adjusted Revenues and Adjusted Operating Expense Ratio, each as defined below, provides stockholders and other interested persons with useful information that will assist such persons in analyzing Gallagher’s operating results as they develop a future outlook for Gallagher. Gallagher believes that Organic Growth provides a comparable measurement of revenue growth that is associated with the revenue sources that will be continuing in 2015 and beyond. Gallagher has historically viewed organic revenue growth as an important indicator when assessing and evaluating the performance of its Brokerage and Risk Management segments. Gallagher also believes that using this measure allows financial statement users to measure, analyze and compare the growth from its Brokerage and Risk Management segments in a meaningful and consistent manner.
Adjusted Revenues is defined as revenues, adjusted to exclude gains realized from sales of books of business, New Zealand earthquake claims administration fees and South Australia ramp up fees.
Adjusted Operating Expense Ratio is defined as operating expense, adjusted to eliminate lease termination and abandonment charges, acquisition related adjustments and integration costs, costs related to New Zealand earthquake claims administration, South Australia and claim portfolio transfer ramp up costs, and the impact of foreign currency translation, as applicable, divided by Adjusted Revenues.
Organic Growth is defined as organic change in commission and fee revenues (including supplemental and contingent commissions), and excludes the first twelve months of net commission and fee revenues generated from acquisitions accounted for as purchases and the net commission and fee revenues related to operations disposed of in each year presented. These commissions and fees are excluded from organic revenues in order to help interested persons analyze the revenue growth associated with the operations that were a part of Gallagher in both the current and prior year. In addition, change in organic growth excludes the period-over-period impact of foreign currency translation. The amounts excluded with respect to foreign currency translation are calculated by applying 2014 foreign exchange rates to the same periods in 2013.
The most directly comparable GAAP measure for Adjusted Revenues and Organic Growth is reported revenues. For the Brokerage Segment, reported revenues were $533 million, $679 million, $783 million, $863 million, $946 million, $1,007 million, $1,114 million, $1,188 million, $1,276 million, $1,341 million, $1,556 million, $1,827 million, $2,144 million and $2,914 million, in 2001, 2002, 2003, 2004, 2005, 2006, 2007, 2008, 2009, 2010, 2011, 2012, 2013 and 2014, respectively. The most directly comparable GAAP measure for Adjusted Operating Expense Ratio is reported operating expense, which was $247 million and $534 million in 2008 and 2014, respectively, for the Brokerage Segment and $126 million and $173 million in 2008 and 2014, respectively, for the Risk Management Segment.
Reconciliations – For other reconciliations, please see the appendix at the back of this presentation and the examples set forth in “Reconciliation of Non-GAAP Measures and supplemental quarterly financial data “ on Gallagher’s Web site at www.ajg.com/IR.
3 |
|
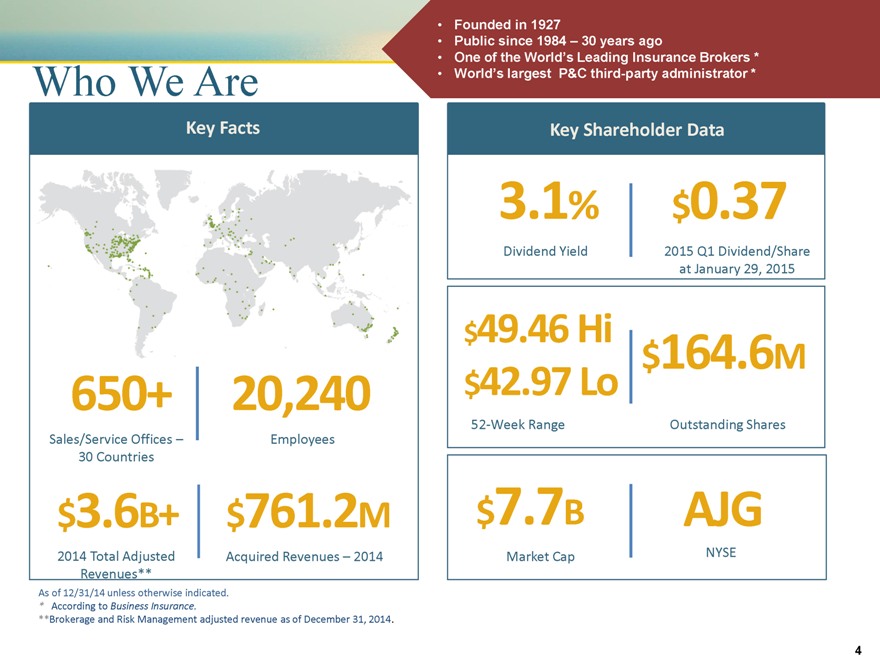
Founded in 1927
Public since 1984 – 30 years ago
One of the World’s Leading Insurance Brokers *
World’s largest P&C third-party administrator *
Who We Are
Key Facts
650+
Sales/Service Offices –
30 Countries
20,240
Employees
$3.6B+
2014 Total Adjusted Revenues**
$761.2M
Acquired Revenues – 2014
Key Shareholder Data
3.1%
Dividend Yield
$0.37
2015 Q1 Dividend/Share at January 29, 2015
$49.46 Hi
$42.97 Lo
52-Week Range
$164.6M
Outstanding Shares
$7.7B
Market Cap
AJG
NYSE
As of 12/31/14 unless otherwise indicated.
* According to Business Insurance.
**Brokerage and Risk Management adjusted revenue as of December 31, 2014.
|
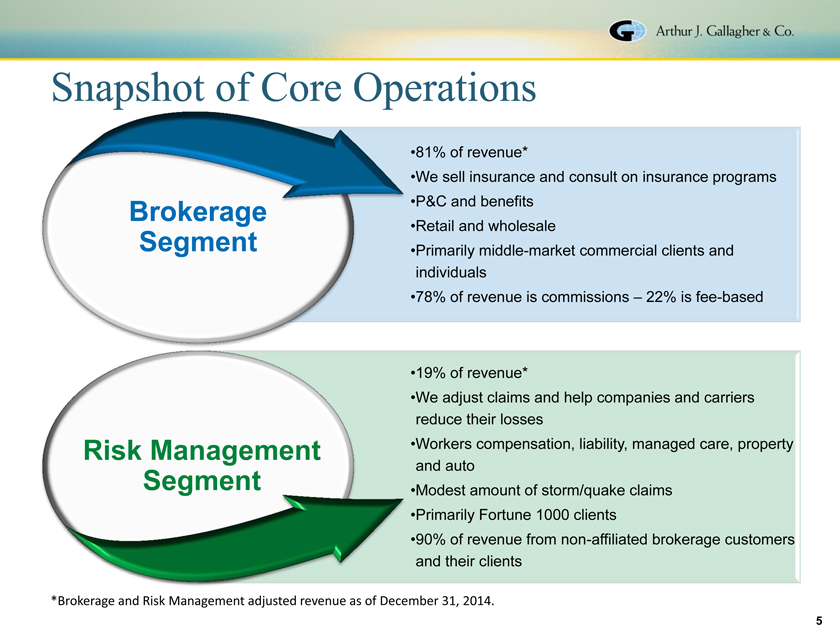
Snapshot of Core Operations
81% of revenue*
We sell insurance and consult on insurance programs Brokerage P&C and benefits Retail and wholesale Segment Primarily middle-market commercial clients and individuals 78% of revenue is commissions – 22% is fee-based
19% of revenue*
We adjust claims and help companies and carriers reduce their losses Risk Management Workers compensation, liability, managed care, property and auto Segment Modest amount of storm/quake claims Primarily Fortune 1000 clients 90% of revenue from non-affiliated brokerage customers and their clients
*Brokerage and Risk Management adjusted revenue as of December 31, 2014.
5
|
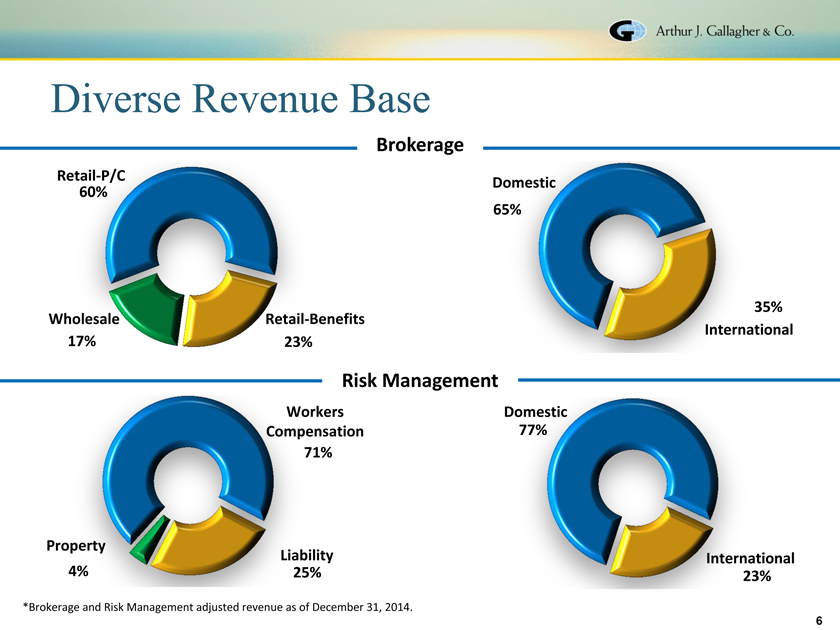
Diverse Revenue Base
Brokerage
Retail-P/C
Domestic 60% 65%
Wholesale Retail-Benefits 35% International 17% 23%
Risk Management
Workers Domestic Compensation 77% 71%
Property
Liability International
4% 25% 23%
*Brokerage and Risk Management adjusted revenue as of December 31, 2014.
6
|
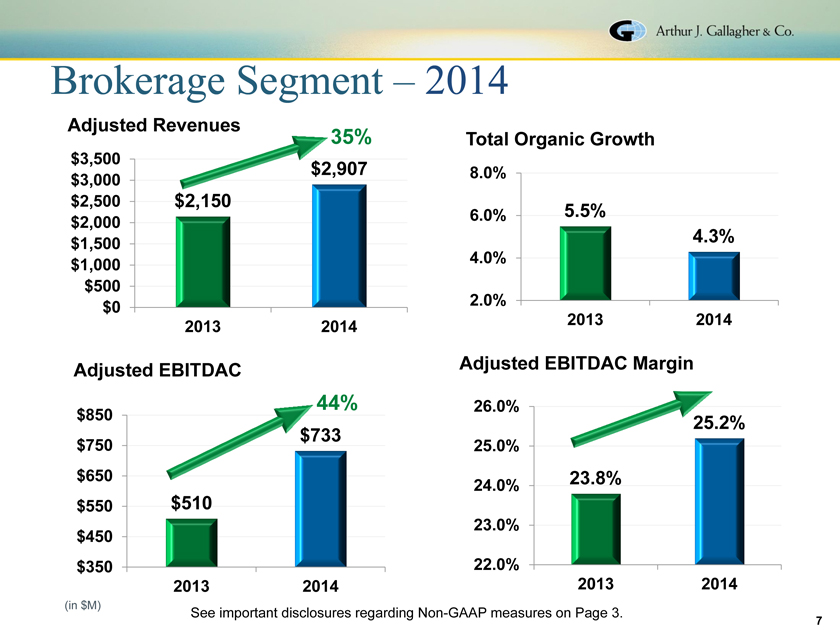
Brokerage Segment – 2014
Adjusted Revenues
35% Total Organic Growth
$3,500
$2,907 8.0%
$3,000
$2,500 $2,150
6.0% 5.5%
$2,000 $1,500 4.3% $1,000 4.0% $500 2.0% $0 2013 2014 2013 2014
Adjusted EBITDAC Adjusted EBITDAC Margin
44% 26.0%
$850 25.2% $733
$750 25.0%
$650 23.8%
24.0%
$550 $510
23.0% $450 $350 22.0%
2013 2014 2013 2014
(in $M)
See important disclosures regarding Non-GAAP measures on Page 3.
7 |
|
|
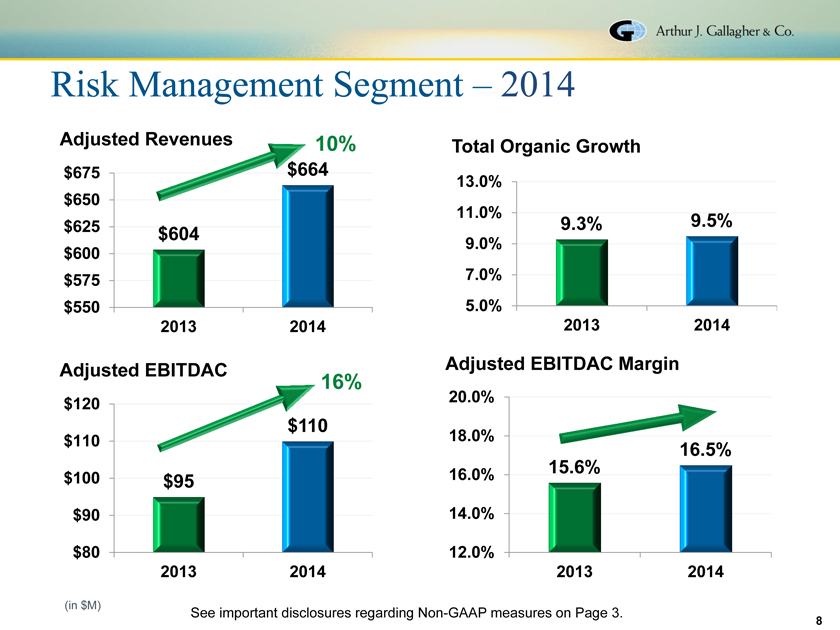
Risk Management Segment – 2014
Adjusted Revenues
10% Total Organic Growth $675 $664
13.0% $650
11.0% 9.5%
$625 9.3% $604
9.0% $600 $575 7.0% $550 5.0%
2013 2014 2013 2014
Adjusted EBITDAC Adjusted EBITDAC Margin 16%
$120 20.0%
$110
$110 18.0%
16.5%
16.0% 15.6%
$100 $95
$90 14.0%
$80 12.0%
2013 2014 2013 2014
(in $M)
See important disclosures regarding Non-GAAP measures on Page 3.
8 |
|
|
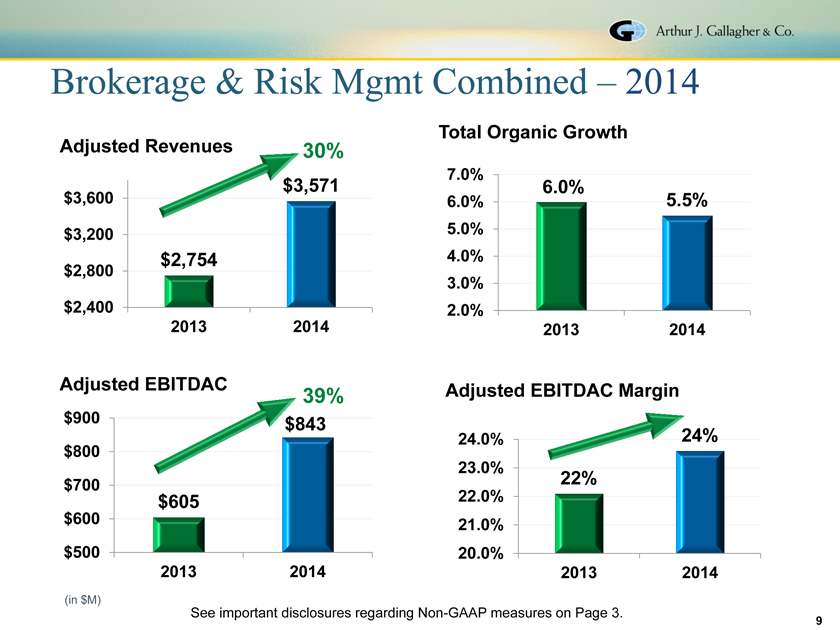
Brokerage & Risk Mgmt Combined – 2014
Total Organic Growth Adjusted Revenues 30%
7.0%
$3,571 6.0%
$3,600 6.0% 5.5% $3,200 5.0%
$2,754 4.0%
$2,800
3.0% $2,400 2.0%
2013 2014 2013 2014
Adjusted EBITDAC Adjusted EBITDAC Margin 39% $900 $843
24.0% 24% $800 23.0% $700 22%
$605 22.0%
$600 21.0% $500 20.0%
2013 2014 2013 2014
(in $M)
See important disclosures regarding Non-GAAP measures on Page 3.
9
|
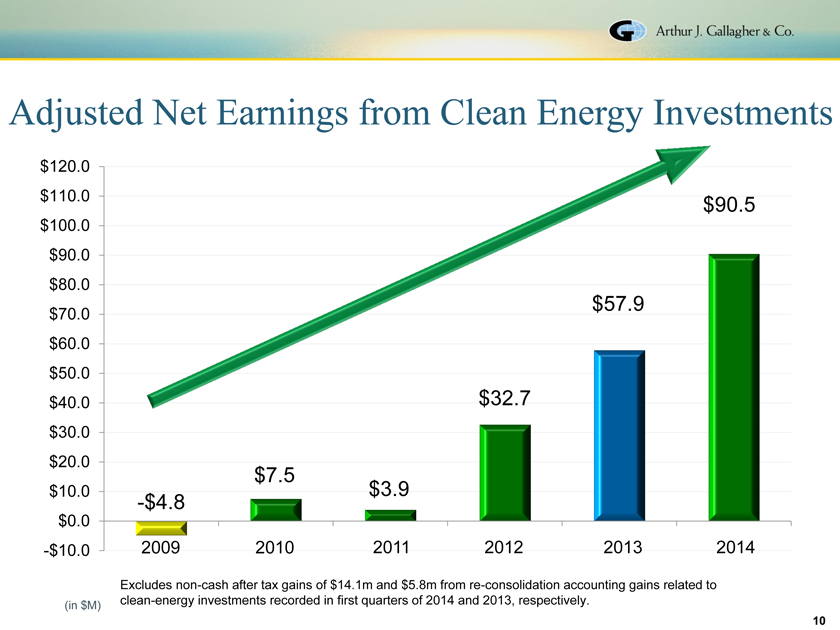
Adjusted Net Earnings from Clean Energy Investments
$120.0 $110.0 $90.5 $100.0
$90.0
$80.0
$57.9
$70.0
$60.0
$50.0
$40.0 $32.7
$30.0
$20.0
$7.5
$10.0 $3.9
-$4.8
$0.0
-$10.0 2009 2010 2011 2012 2013 2014
Excludes non-cash after tax gains of $14.1m and $5.8m from re-consolidation accounting gains related to (in $M) clean-energy investments recorded in first quarters of 2014 and 2013, respectively.
10
|
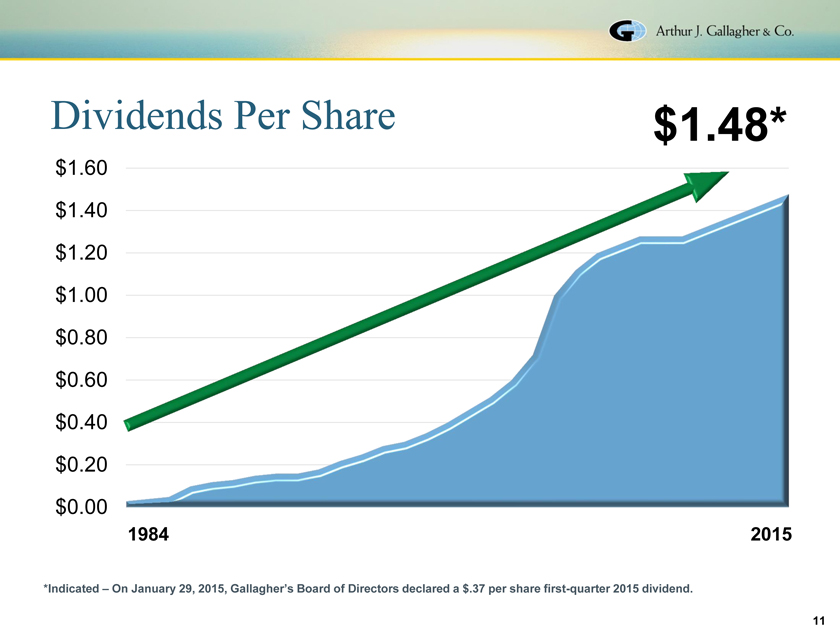
Dividends Per Share $1.48*
$1.60 $1.40 $1.20 $1.00 $0.80 $0.60 $0.40 $0.20
$0.00
1984 2015
*Indicated – On January 29, 2015, Gallagher’s Board -quarter of Directors declared a $.37 per share first-quarter 2015 dividend.
11
|
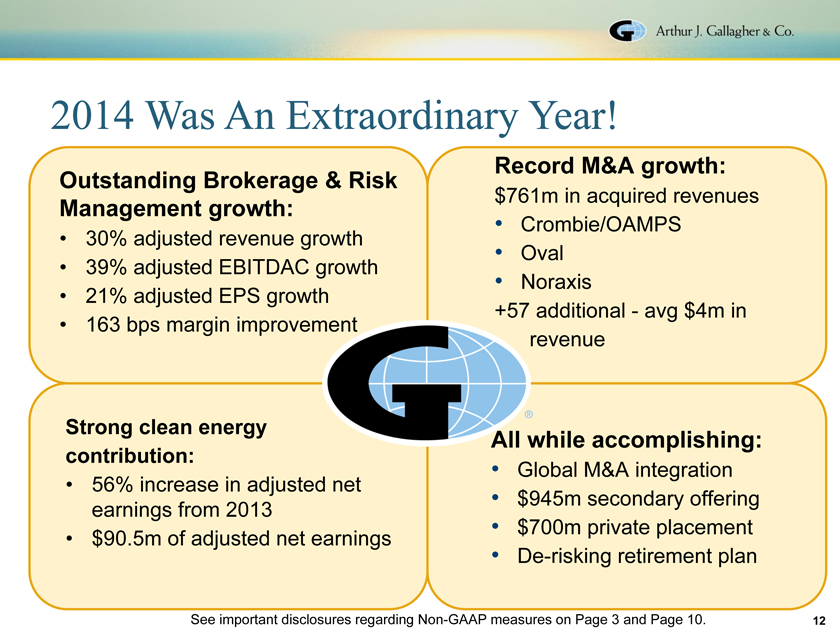
2014 Was An Extraordinary Year!
Record M&A growth: Outstanding Brokerage & Risk $761m in acquired revenues
Management growth:
Crombie/OAMPS
30% adjusted revenue growth
Oval
39% adjusted EBITDAC growth
Noraxis
21% adjusted EPS growth
+57 additional—avg $4m in
163 bps margin improvement revenue
Strong clean energy
All while accomplishing: contribution:
Global M&A integration
56% increase in adjusted net
$945m secondary offering earnings from 2013
$700m private placement
$90.5m of adjusted net earnings
De-risking retirement plan
See important disclosures regarding Non-GAAP measures on Page 3 and Page 10.
12
|
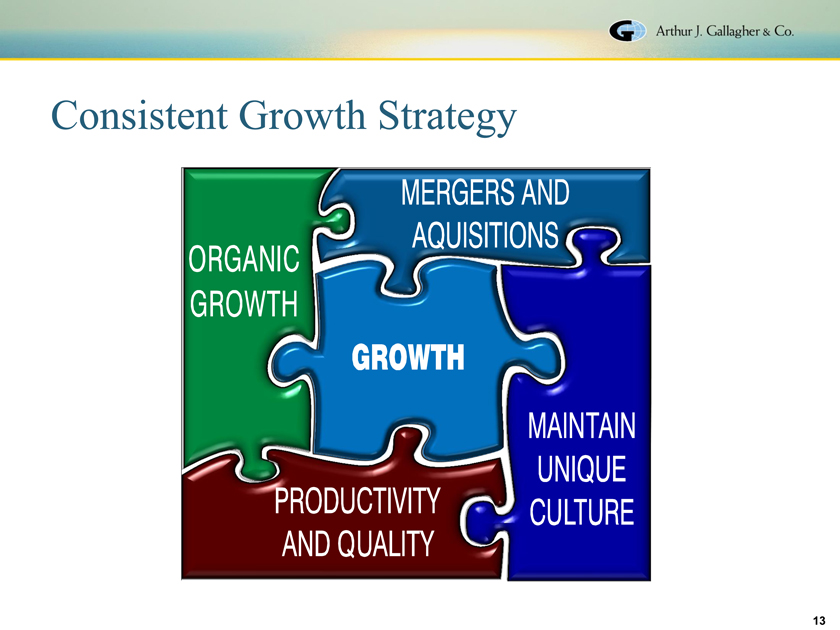
Consistent Growth Strategy
13
|
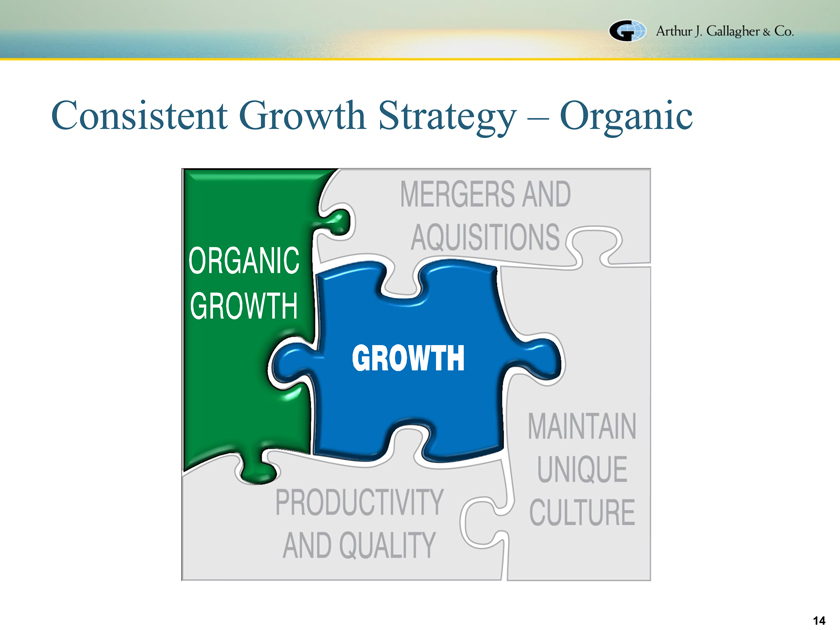
Consistent Growth Strategy – Organic
14
|
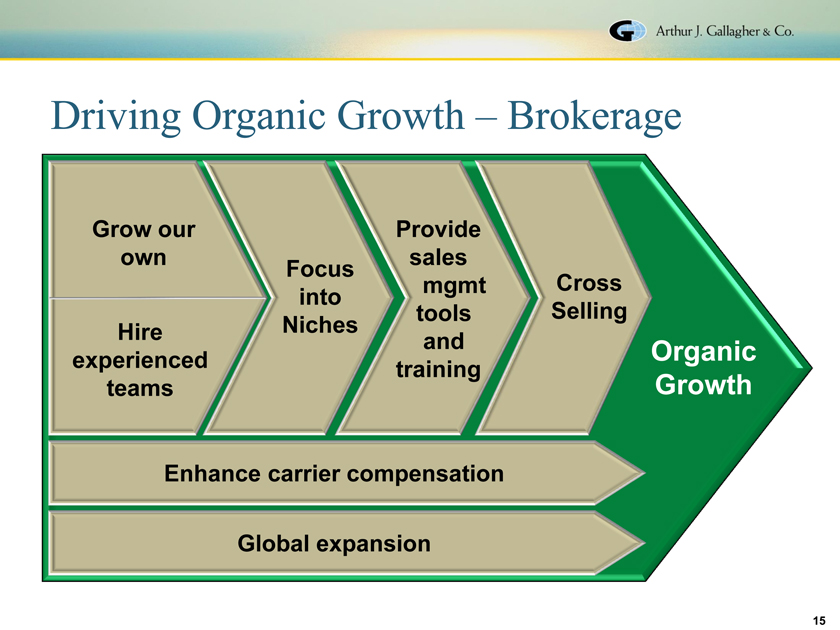
Driving Organic Growth – Brokerage
Grow our Provide own sales Focus mgmt Cross into tools Selling Hire Niches
and Organic
experienced training
teams Growth
Enhance carrier compensation
Global expansion
15
|
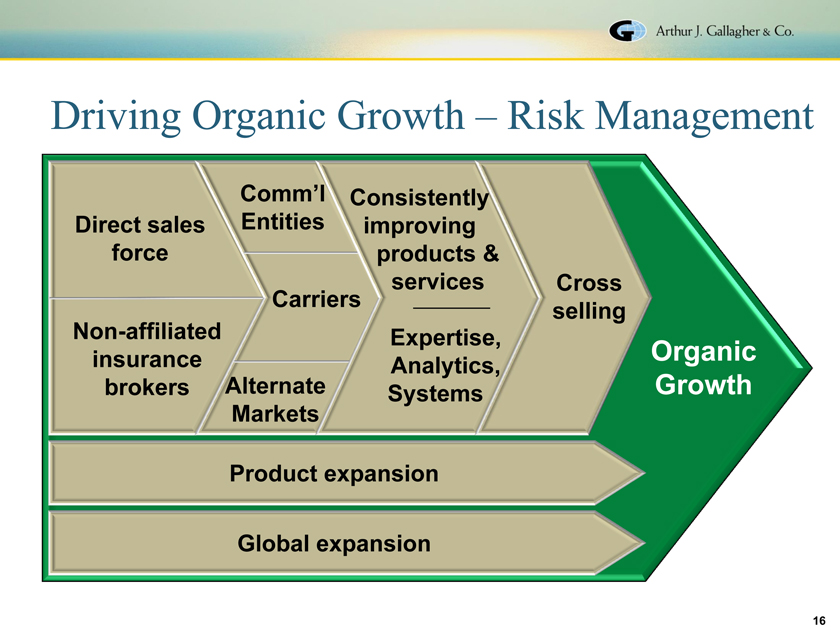
Driving Organic Growth – Risk Management
Comm’l Consistently Direct sales Entities improving force products & services Cross Carriers selling Non-affiliated Expertise, insurance Organic Alternate Analytics, brokers Systems Growth Markets
Product expansion
Global expansion
16
|

Niche Expertise Teams—Brokerage
Agribusiness Manufacturing Automotive Marine Aviation & Aerospace Personal Construction Private Equity Energy Professional Groups Entertainment Public Entity Environmental Real Estate Global Risks Religious/Nonprofit Healthcare Restaurant Higher Education Scholastic Hospitality Technology/Telecom Life Sciences Trade Credit Life Solutions Transportation
17
|
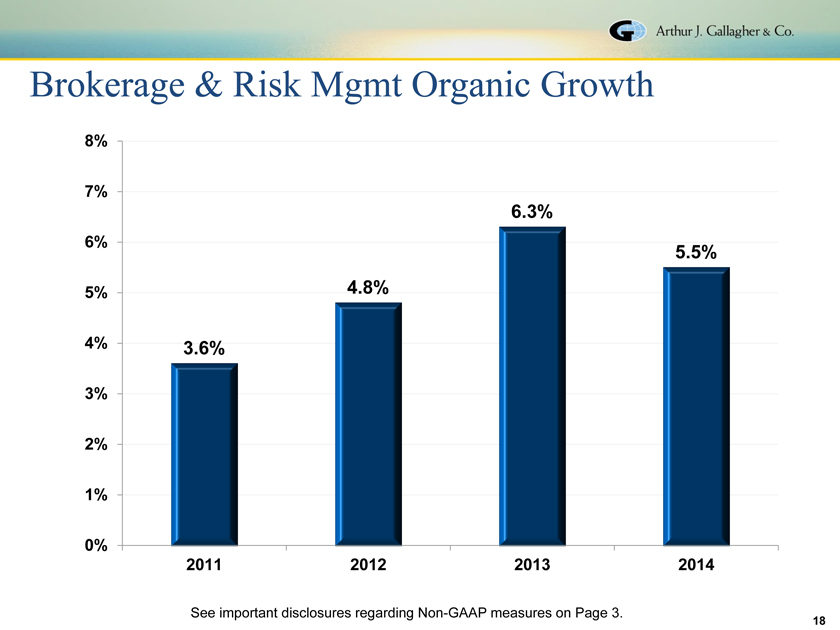
Brokerage & Risk Mgmt Organic Growth
8%
7%
6.3%
6%
5.5%
5% 4.8%
4% 3.6%
3% 2% 1%
0%
2011 2012 2013 2014
See important disclosures regarding Non-GAAP measures on Page 3.
18
|
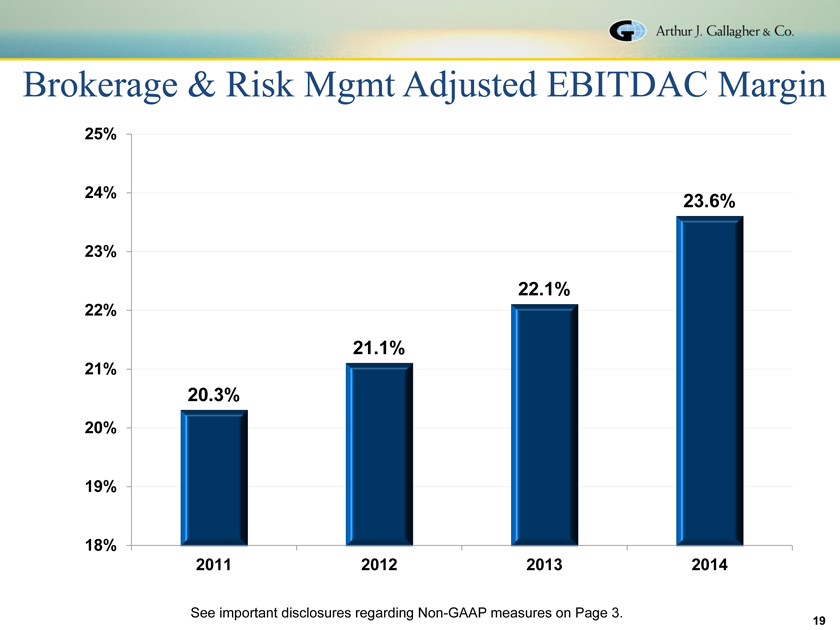
Brokerage & Risk Mgmt Adjusted EBITDAC Margin
25%
2 4% 23.6%
23%
22.1%
22%
21.1%
21%
20.3%
20%
19%
18%
2011 2012 2013 2014
See important disclosures regarding Non-GAAP measures on Page 3.
19
|
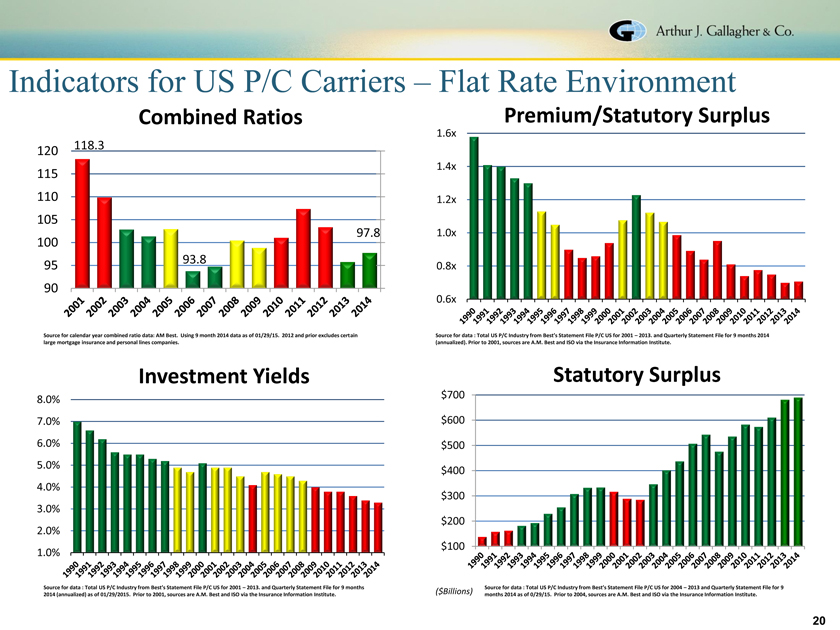
Indicators for US P/C Carriers – Flat Rate Environment
Combined Ratios Premium/Statutory Surplus
1.6x 118.3 120
1.4x 115 110 1.2x
105 100 97.8 1.0x
93.8 95 0.8x 90 0.6x
Source for calendar year combined ratio data: AM Best. Using 9 month 2014 data as of 01/29/15. 2012 and prior excludes certain large mortgage insurance and personal lines companies.
Source for data : Total US P/C Industry from Best’s Statement File P/C US for 2001– 2013. and Quarterly Statement File for 9 months 2014 (annualized). Prior to 2001, sources are A.M. Best and ISO via the Insurance Information Institute.
Investment Yields Statutory Surplus
$700 8.0% 7.0% $600
6.0% $500 5.0% $400
4.0% $300 3.0% $200
2.0% $100 1.0%
Source for data : Total US P/C Industry from Best’s Statement File P/C US for 2001 – 2013. and Quarterly Statement File for 9 months 2014 (annualized) as of 01/29/2015. Prior to 2001, sources are A.M. Best and ISO via the Insurance Information Institute.
Source for data : Total US P/C Industry from Best’s Statement File P/C US for 2004 – 2013 and Quarterly Statement File for 9 months 2014 as of 0/29/15. Prior to 2004, sources are A.M. Best and ISO via the Insurance Information Institute.
20
|
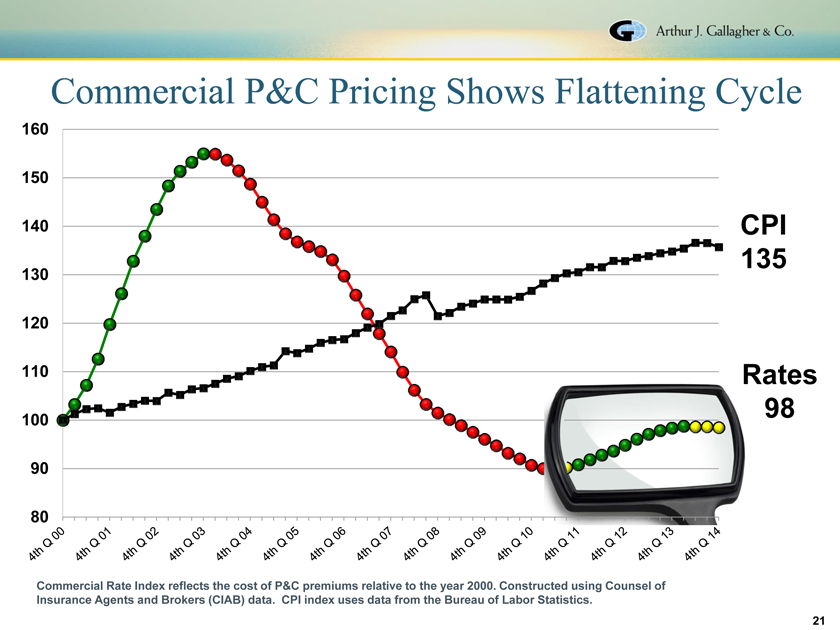
Commercial P&C Pricing Shows Flattening Cycle
160
150
140 CPI 135
130
120
110 Rates 98
100 90 80
Commercial Rate Index reflects the cost of P&C premiums relative to the year 2000. Constructed using Counsel of Insurance Agents and Brokers (CIAB) data. CPI index uses data from the Bureau of Labor Statistics.
21
|
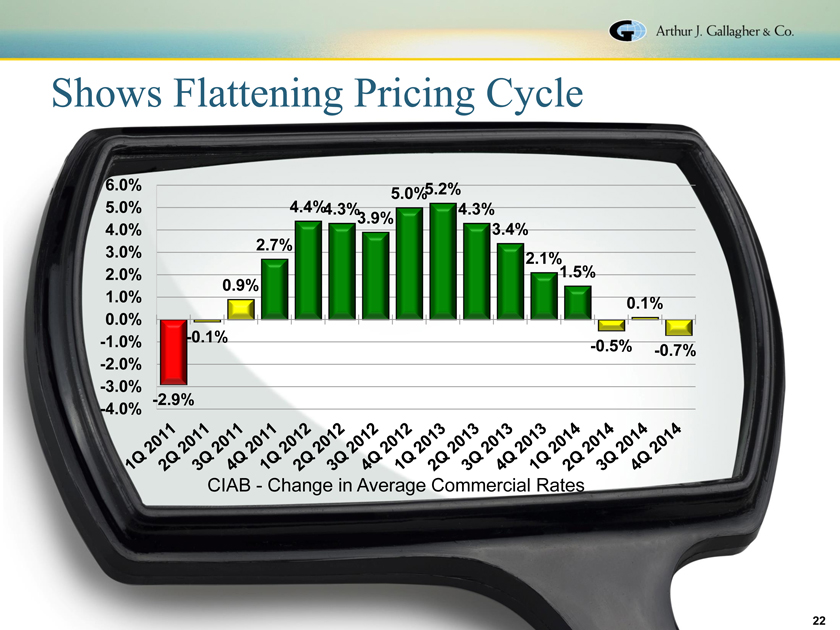
Shows Flattening Pricing Cycle
6.0% 5.2%
5.0%
5.0% 4.4%4.3% 4.3%
3.9%
4.0% 3.4%
2.7%
3.0% 2.1%
2.0% 1.5%
0.9%
1.0% 0.1%
0.0%
-1.0% -0.1%
-0.5% -0.7% -2.0% -3.0% -2.9% -4.0%
CIAB—Change in Average Commercial Rates
22
|
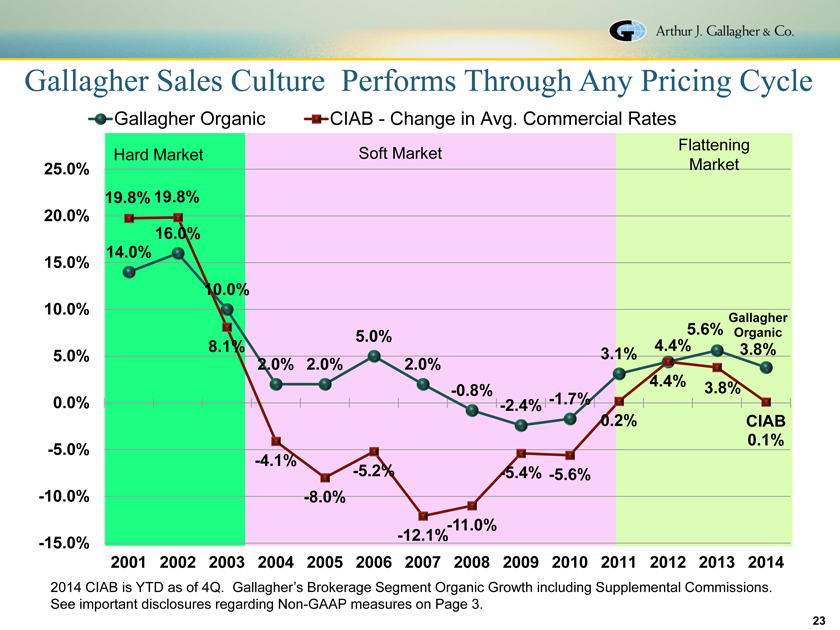
Gallagher Sales Culture Performs Through Any Pricing Cycle
Gallagher Organic CIAB—Change in Avg. Commercial Rates
Flattening Hard Market Soft Market Market
25.0% 19.8% 19.8%
20.0% 16.0% 14.0%
15.0% 10.0% 10.0%
Gallagher
5.0% 5.6% Organic
8.1% 4.4% 3.8%
5.0% 3.1%
2.0% 2.0% 2.0%
4.4% -0.8% 3.8%
0.0% -2.4% -1.7% 0.2%
CIAB
0.1% -5.0% -4.1% -5.2% -5.4% -5.6% -10.0% -8.0% -11.0% -12.1% -15.0% 2001 2002 2003 2004 2005 2006 2007 2008 2009 2010 2011 2012 2013 2014
2014 CIAB is YTD as of 4Q. Gallagher’s Brokerage Segment Organic Growth including Supplemental Commissions.
See important disclosures regarding Non-GAAP measures on Page 3.
23
|
Flattening Rate Environment Is:
Better for Clients
Better for Carriers
Better for Brokers
24
|
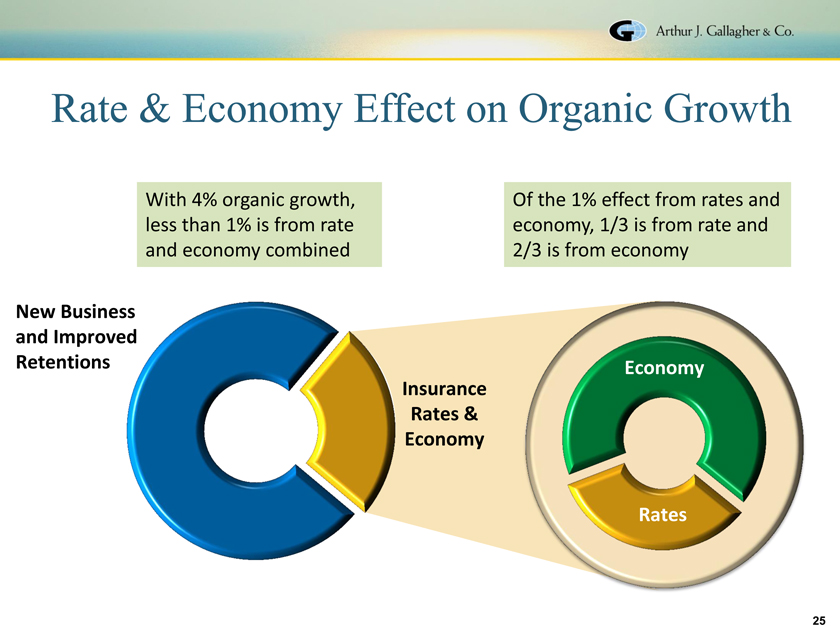
Rate & Economy Effect on Organic Growth
With 4% organic growth, Of the 1% effect from rates and less than 1% is from rate economy, 1/3 is from rate and and economy combined 2/3 is from economy
New Business and Improved
Retentions Economy Insurance Rates & Economy
Rates
25
|

Consistent Growth Strategy – M&A
26
|
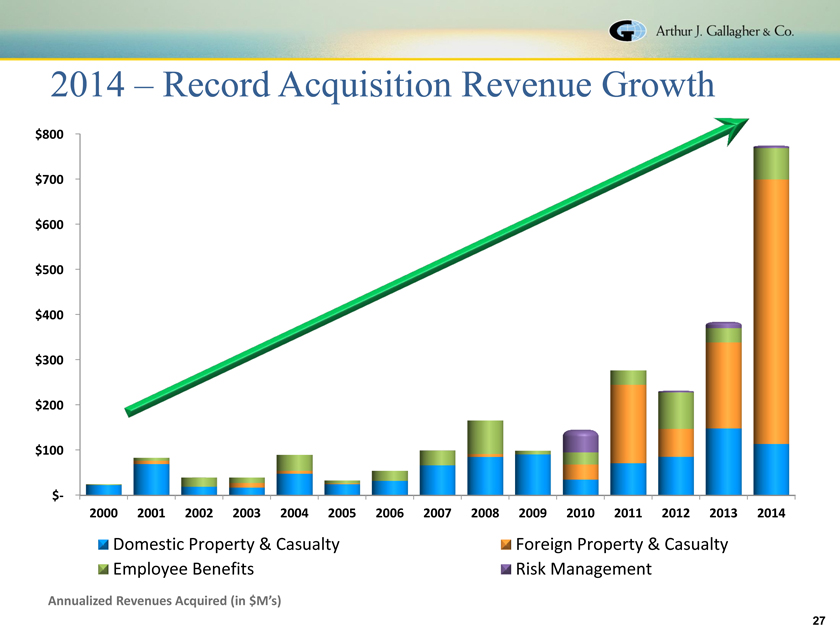
2014 – Record Acquisition Revenue Growth
$800 $700
$600 $500 $400 $300 $200 $100
$-
2000 2001 2002 2003 2004 2005 2006 2007 2008 2009 2010 2011 2012 2013 2014
Domestic Property & Casualty Foreign Property & Casualty Employee Benefits Risk Management
Annualized Revenues Acquired (in $M’s)
27
|
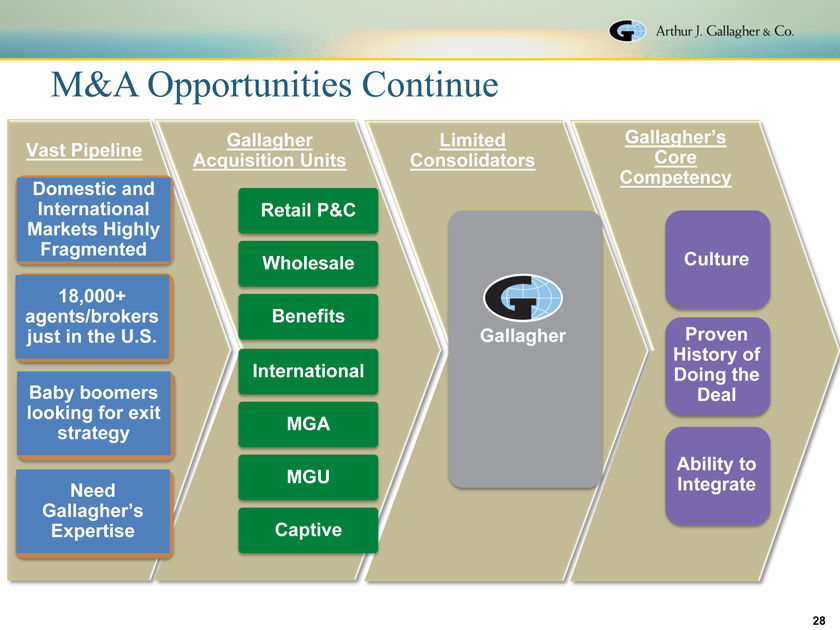
M&A Opportunities Continue
Gallagher Limited Gallagher’s Vast Pipeline Core Acquisition Units Consolidators Competency Domestic and International Retail P&C
Markets Highly Fragmented
Wholesale Culture 18,000+ agents/brokers Benefits just in the U.S. Gallagher Proven International History of Doing the Baby boomers Deal looking for exit MGA strategy Ability to MGU Integrate Need
Gallagher’s
Expertise Captive
28
|
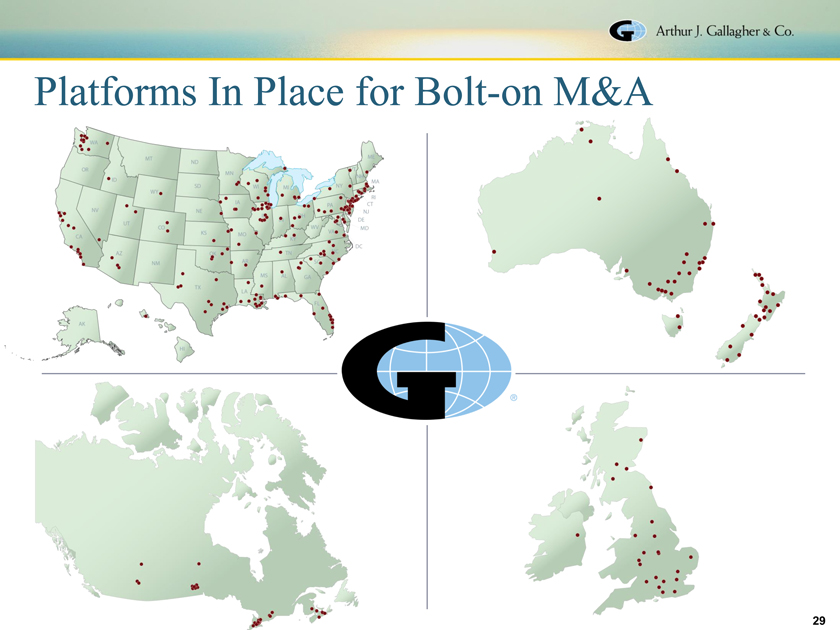
Platforms In Place for Bolt-on M&A
29
|
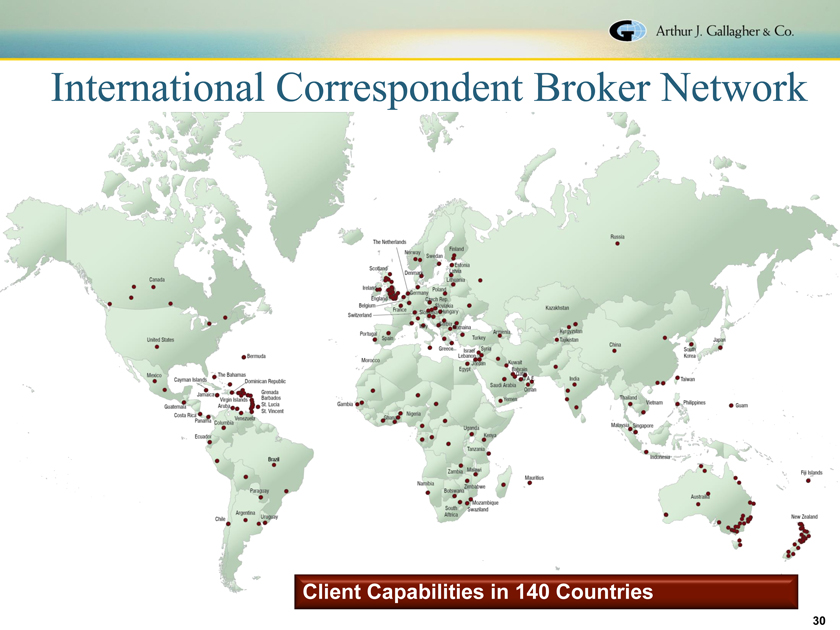
International Correspondent Broker Network
Client Capabilities in 140 Countries
30
|
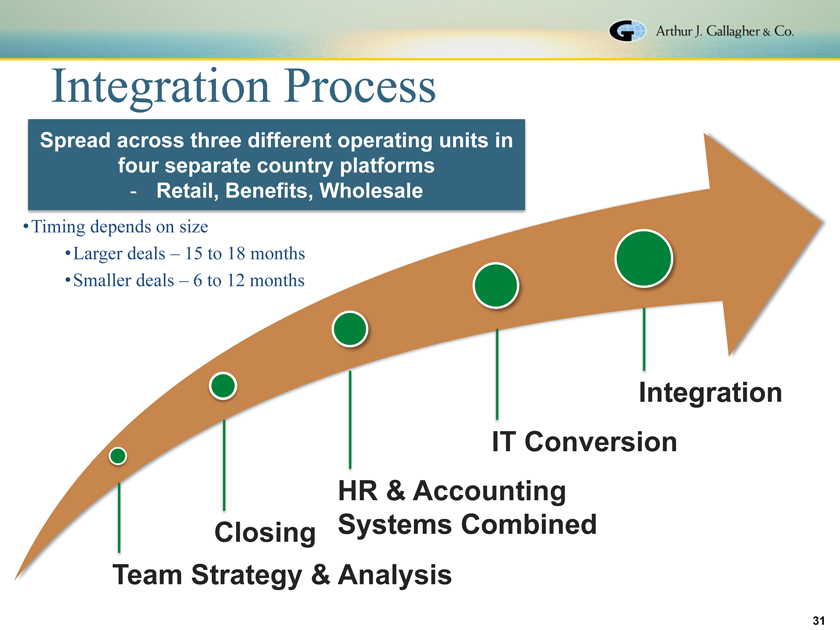
Integration Process
Spread across three different operating units in four separate country platforms
- Retail, Benefits, Wholesale
Timing depends on size
Larger deals – 15 to 18 months
Smaller deals – 6 to 12 months
Integration IT Conversion HR & Accounting Closing Systems Combined Team Strategy & Analysis
31
|
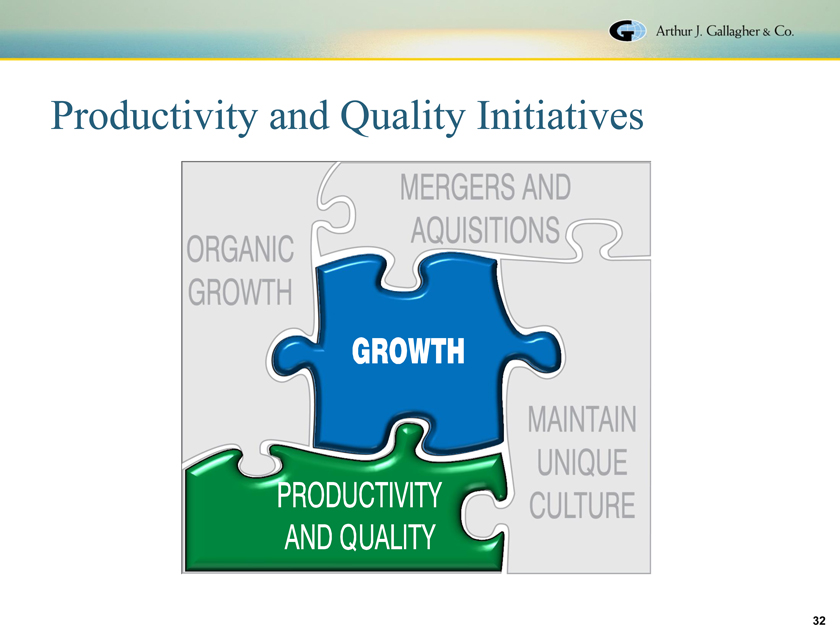
Productivity and Quality Initiatives
32
|
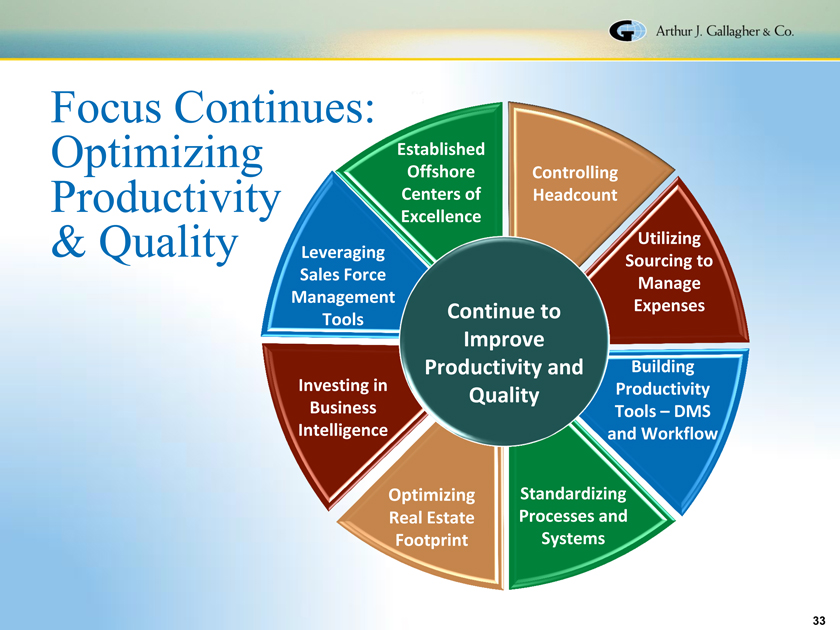
Focus Continues:
Optimizing Established
Offshore Controlling Productivity Centers of Headcount Excellence
& Quality Leveraging Utilizing Sales Force Sourcing to Management Manage Tools Continue to Expenses
Improve
Productivity and Building
Investing in Productivity
Quality
Business Tools – DMS Intelligence and Workflow
Optimizing Standardizing Real Estate Processes and Footprint Systems
33
|
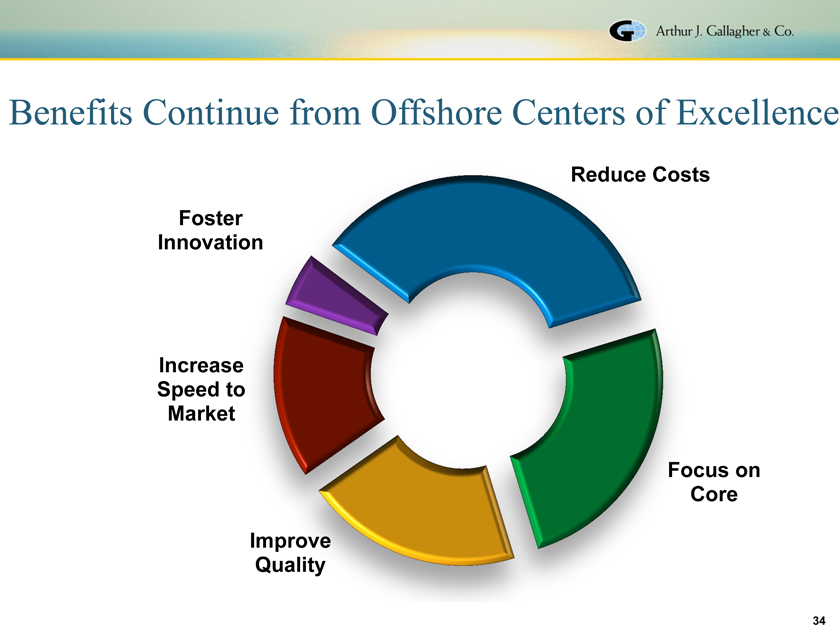
Benefits Continue from Offshore Centers of Excellence
Reduce Costs
Foster Innovation
Increase Speed to Market
Focus on Core
Improve Quality
34
|
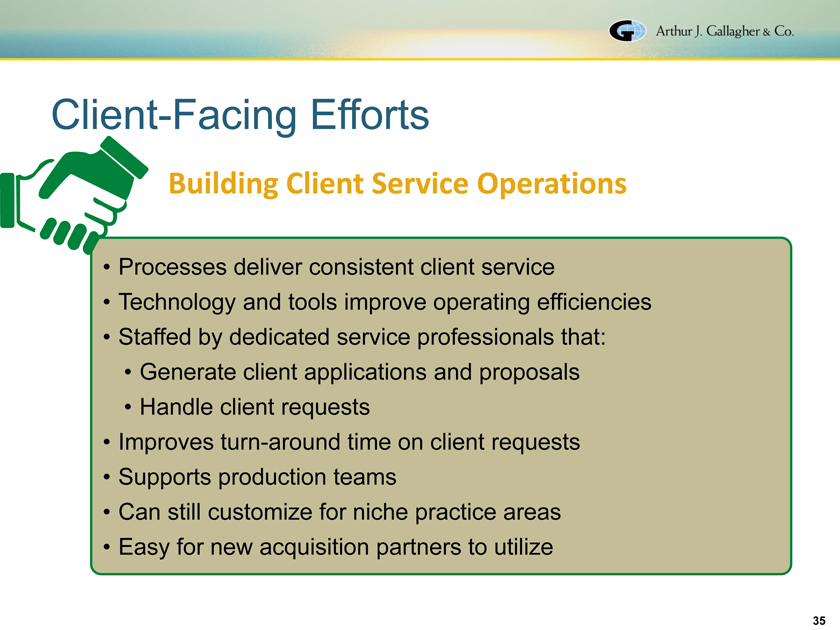
Client-Facing Efforts
Building Client Service Operations
Processes deliver consistent client service
Technology and tools improve operating efficiencies
Staffed by dedicated service professionals that:
Generate client applications and proposals
Handle client requests
Improves turn-around time on client requests
Supports production teams
Can still customize for niche practice areas
Easy for new acquisition partners to utilize
35
|
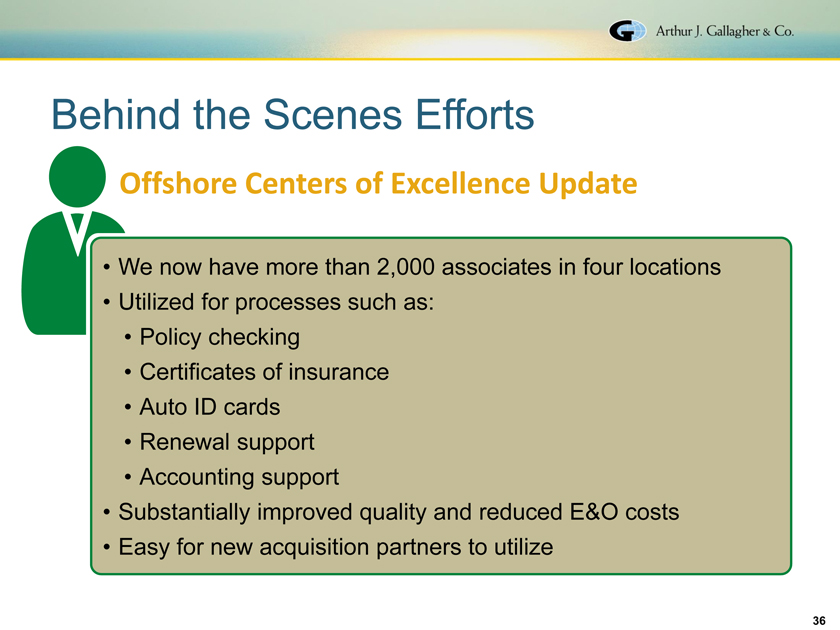
Behind the Scenes Efforts
Offshore Centers of Excellence Update
We now have more than 2,000 associates in four locations Utilized for processes such as: Policy checking Certificates of insurance Auto ID cards Renewal support
Accounting support
Substantially improved quality and reduced E&O costs Easy for new acquisition partners to utilize
36
|
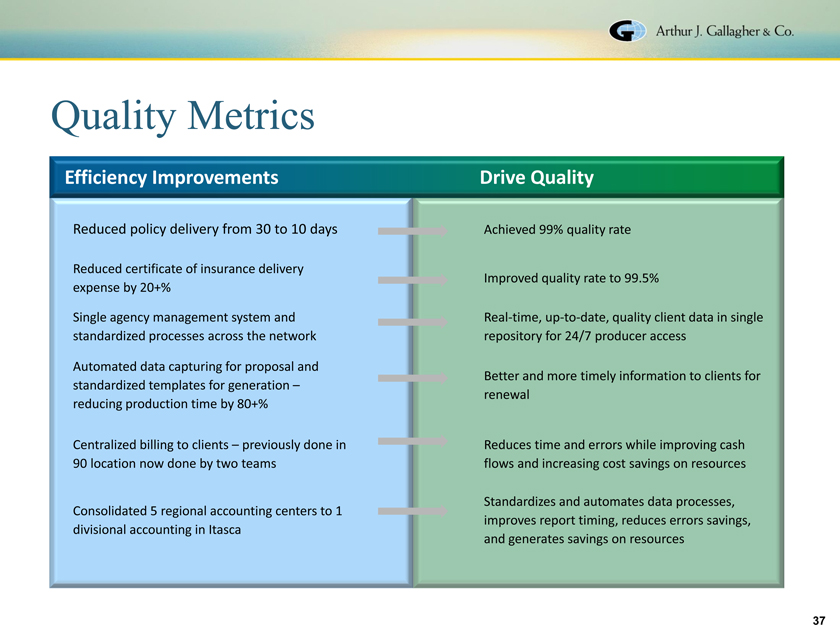
Quality Metrics
Efficiency Improvements
Reduced policy delivery from 30 to 10 days
Reduced certificate of insurance delivery expense by 20+%
Single agency management system and standardized processes across the network
Automated data capturing for proposal and standardized templates for generation – reducing production time by 80+%
Centralized billing to clients – previously done in 90 location now done by two teams
Consolidated 5 regional accounting centers to 1 divisional accounting in Itasca
Drive Quality
Achieved 99% quality rate
Improved quality rate to 99.5%
Real-time, up-to-date, quality client data in single repository for 24/7 producer access
Better and more timely information to clients for renewal
Reduces time and errors while improving cash flows and increasing cost savings on resources
Standardizes and automates data processes, improves report timing, reduces errors savings, and generates savings on resources
37
|
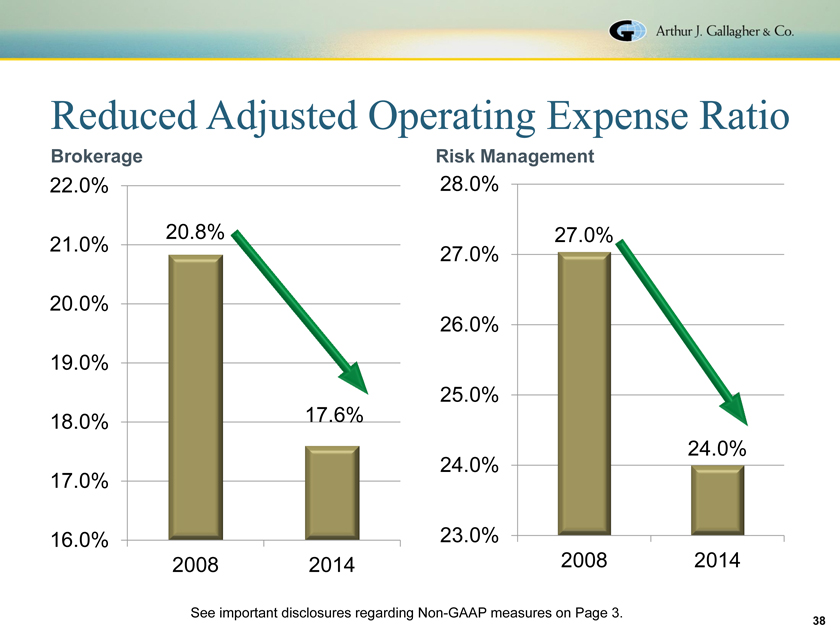
Reduced Adjusted Operating Expense Ratio
Brokerage Risk Management
22.0% 28.0%
20.8% 27.0%
21.0%
27.0%
20.0%
26.0%
19.0%
25.0%
18.0% 17.6%
24.0%
24.0%
17.0%
16.0% 23.0%
2008 2014 2008 2014
See important disclosures regarding Non-GAAP measures on Page 3.
38
|

Arthur J. Gallagher & Co.
Relentless Focus on Quality & Customer Service
AJG – 2014 Best Mid-Sized Broker Reactions Magazine
AJG Intl/OIM – 2014 MGA of the Year Insurance Post
AJG Benefits Team – 2014 Group Risk Adviser of the Year Corporate Adviser
AJG Intl – 2013 Best Broker M&A Deal of the Year Reactions Magazine
AJG U.K. Retail – 2013 Commercial Lines Broker of the Year – Insurance Times
AJG Intl/Palm – 2014 Private Sector Insurer of the Year General Palace
AJG – 2013 Ranked Top Ten Best Companies for Leaders – Chief Executive Magazine
AJG – 2013 Ins Broking CEO of the Year - Reactions Magazine
GB UK – 2013 Investor in People UK National Standard
AJG Intl/GCM – 2013 Best Latin American/Caribbean Insurance Broker Global Finance
39
|

Maintaining Culture
40
|

Maintain Unique Culture
41
|
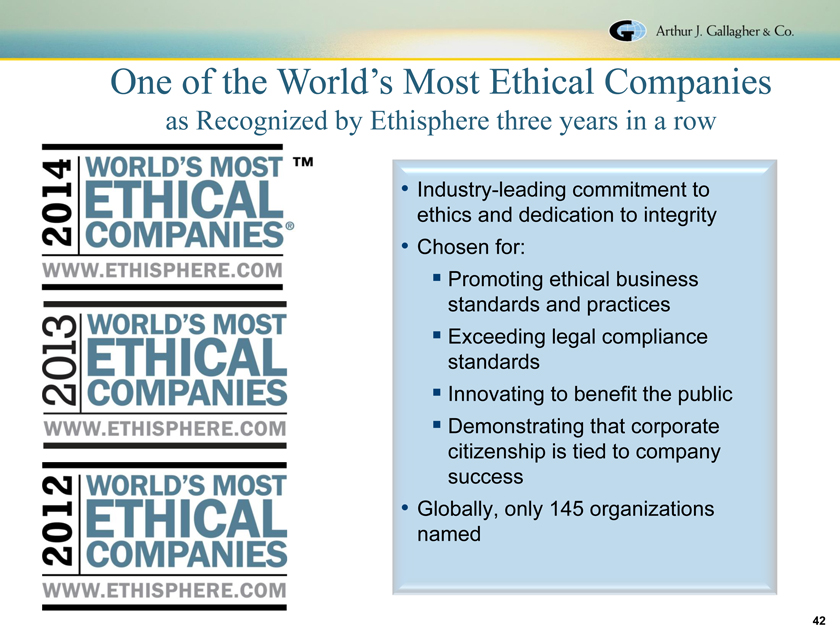
One of the World’s Most Ethical Companies
as Recognized by Ethisphere three years in a row
Industry-leading commitment to ethics and dedication to integrity
Chosen for:
Promoting ethical business standards and practices Exceeding legal compliance standards Innovating to benefit the public Demonstrating that corporate citizenship is tied to company success
Globally, only 145 organizations named
42
|

Why Invest?
You Believe Our Company Has:
Right management Unique culture Proven growth strategy Continuing M&A opportunities Increasing productivity Higher quality Good use of leverage Strong balance sheet Excellent return to shareholders
Gallagher is well positioned for future growth
43
|
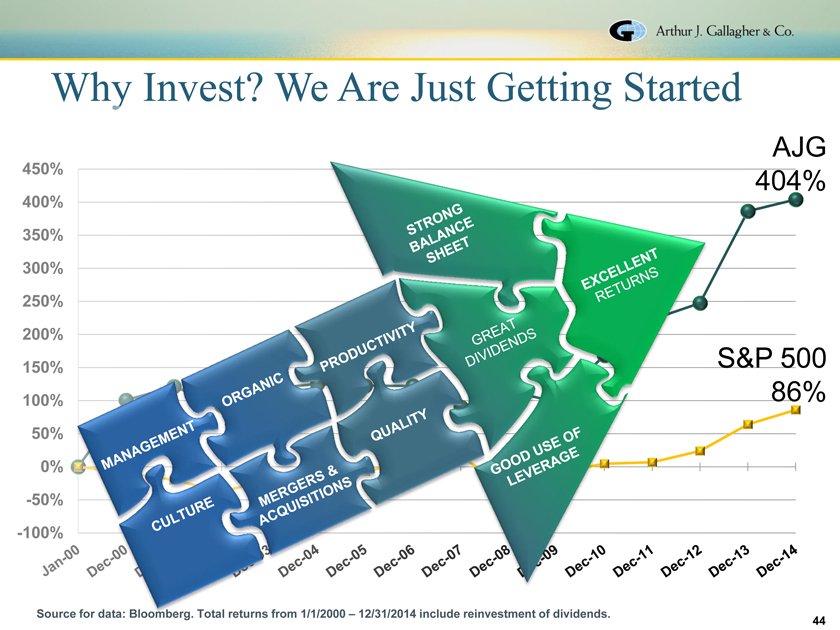
Why Invest? We Are Just Getting Started
AJG
450% 404% 400%
350% 300% 250%
200%
150% S&P 500
100% 86% 50%
0% -50% -100%
Source for data: Bloomberg. Total returns from 1/1/2000 – 12/31/2014 include reinvestment of dividends.
44
|
For Additional Information:
Marsha Akin
Director – Investor Relations Marsha_Akin@ajg.com Phone: 630-285-3501
|
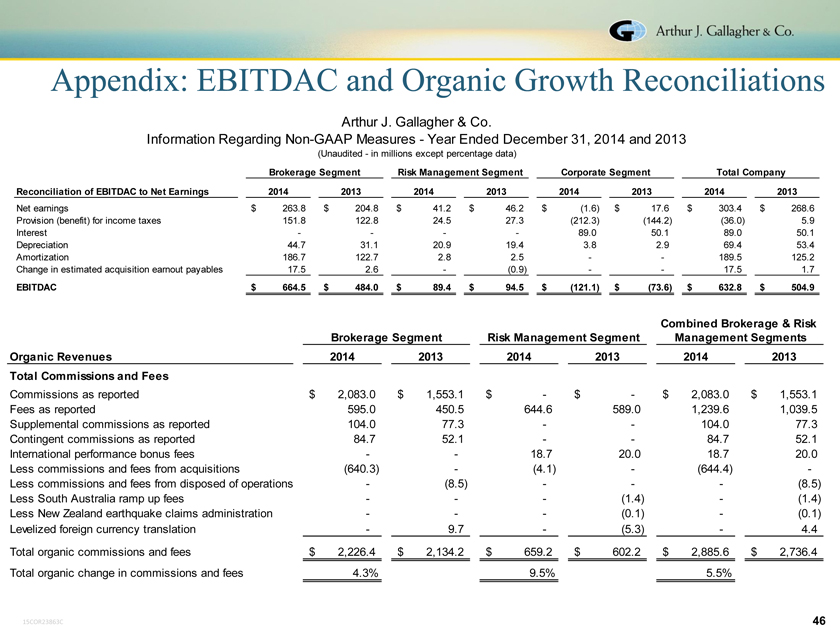
Appendix: EBITDAC and Organic Growth Reconciliations
Arthur J. Gallagher & Co.
Information Regarding Non-GAAP Measures—Year Ended December 31, 2014 and 2013
(Unaudited—in millions except percentage data)
Brokerage Segment Risk Management Segment Corporate Segment Total Company
Reconciliation of EBITDAC to Net Earnings 2014 2013 2014 2013 2014 2013 2014 2013
Net earnings $ 263.8 $ 204.8 $ 41.2 $ 46.2 $(1.6) $ 17.6 $ 303.4 $ 268.6
Provision (benefit) for income taxes 151.8 122.8 24.5 27.3(212.3)(144.2)(36.0) 5.9
Interest — — 89.0 50.1 89.0 50.1
Depreciation 44.7 31.1 20.9 19.4 3.8 2.9 69.4 53.4
Amortization 186.7 122.7 2.8 2.5 — 189.5 125.2
Change in estimated acquisition earnout payables 17.5 2.6 -(0.9) — 17.5 1.7
EBITDAC $ 664.5 $ 484.0 $ 89.4 $ 94.5 $(121.1) $(73.6) $ 632.8 $ 504.9
Combined Brokerage & Risk
Brokerage Segment Risk Management Segment Management Segments
Organic Revenues 2014 2013 2014 2013 2014 2013
Total Commissions and Fees
Commissions as reported $ 2,083.0 $ 1,553.1 $—$—$ 2,083.0 $ 1,553.1
Fees as reported 595.0 450.5 644.6 589.0 1,239.6 1,039.5
Supplemental commissions as reported 104.0 77.3 — 104.0 77.3
Contingent commissions as reported 84.7 52.1 — 84.7 52.1
International performance bonus fees — 18.7 20.0 18.7 20.0
Less commissions and fees from acquisitions(640.3) -(4.1) -(644.4) -
Less commissions and fees from disposed of operations -(8.5) — -(8.5)
Less South Australia ramp up fees — -(1.4) -(1.4)
Less New Zealand earthquake claims administration — -(0.1) -(0.1)
Levelized foreign currency translation—9.7 -(5.3)—4.4
Total organic commissions and fees $ 2,226.4 $ 2,134.2 $ 659.2 $ 602.2 $ 2,885.6 $ 2,736.4
Total organic change in commissions and fees 4.3% 9.5% 5.5%
46