Exhibit 99.2
February 2016
INVESTMENT PROFILE NYSE
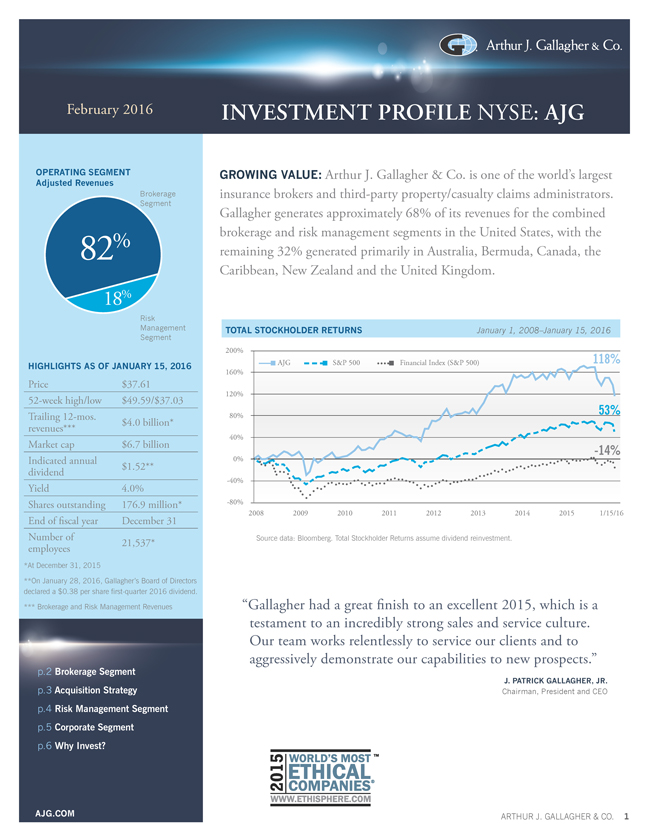
OPERATING SEGMENT Adjusted Revenues
Brokerage Segment
82%
18%
Risk Management Segment
: AJG
HIGHLIGHTS AS OF JANUARY 15, 2016
Price
52-week high/low Trailing 12-mos. revenues*** Market cap Indicated annual dividend Yield Shares outstanding End of fiscal year Number of employees
*At December 31, 2015
$37.61 $49.59/$37.03
$4.0 billion* $6.7 billion $1.52**
4.0% 176.9 million* December 31
21,537*
**On January 28, 2016, Gallagher’s Board of Directors declared a $0.38 per share first-quarter 2016 dividend. *** Brokerage and Risk Management Revenues
p.2 Brokerage Segment p.3 Acquisition Strategy p.4 Risk Management Segment p.5 Corporate Segment p.6 Why Invest?
AJG.COM
GROWING VALUE: Arthur J. Gallagher & Co. is one of the world’s largest insurance brokers and third-party property/casualty claims administrators. Gallagher generates approximately 68% of its revenues for the combined brokerage and risk management segments in the United States, with the remaining 32% generated primarily in Australia, Bermuda, Canada, the Caribbean, New Zealand and the United Kingdom.
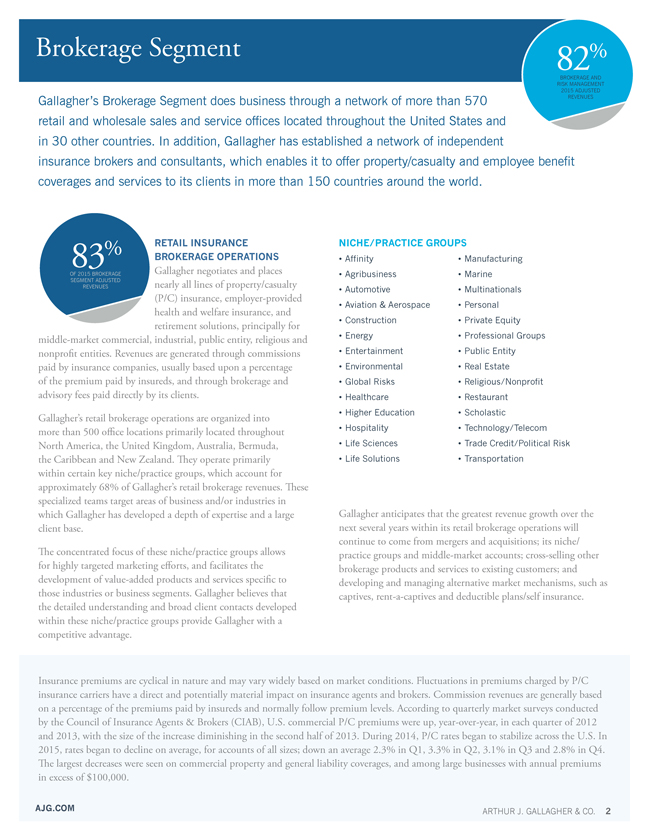
TOTAL STOCKHOLDER RETURNS January 1, 2008–January 15, 2016
200%
AJG S&P 500 Financial Index (S&P 500) 118% 160%
120%
80% 53% 40%
0% -14%
-40%
-80%
2008 2009 2010 2011 2012 2013 2014 2015 1/15/16
Source data: Bloomberg. Total Stockholder Returns assume dividend reinvestment.
“Gallagher had a great finish to an excellent 2015, which is a testament to an incredibly strong sales and service culture. Our team works relentlessly to service our clients and to aggressively demonstrate our capabilities to new prospects.”
J. PATRICK GALLAGHER, JR.
Chairman, President and CEO
ARTHUR J. GALLAGHER & CO. 1
Brokerage Segment
82%
BROKERAGE AND RISK MANAGEMENT
2015 ADJUSTED REVENUES
Gallagher’s Brokerage Segment does business through a network of more than 570 retail and wholesale sales and service offices located throughout the United States and in 30 other countries. In addition, Gallagher has established a network of independent
insurance brokers and consultants, which enables it to offer property/casualty and employee benefit coverages and services to its clients in more than 150 countries around the world.
% RETAIL INSURANCE
83 BROKERAGE OPERATIONS
OF 2015 BROKERAGE Gallagher negotiates and places SEGMENT ADJUSTED nearly all lines of property/casualty
REVENUES
(P/C) insurance, employer-provided health and welfare insurance, and retirement solutions, principally for middle-market commercial, industrial, public entity, religious and nonprofit entities. Revenues are generated through commissions paid by insurance companies, usually based upon a percentage of the premium paid by insureds, and through brokerage and advisory fees paid directly by its clients.
Gallagher’s retail brokerage operations are organized into more than 500 office locations primarily located throughout North America, the United Kingdom, Australia, Bermuda, the Caribbean and New Zealand. They operate primarily within certain key niche/practice groups, which account for approximately 68% of Gallagher’s retail brokerage revenues. These specialized teams target areas of business and/or industries in which Gallagher has developed a depth of expertise and a large client base.
The concentrated focus of these niche/practice groups allows for highly targeted marketing efforts, and facilitates the development of value-added products and services specific to those industries or business segments. Gallagher believes that the detailed understanding and broad client contacts developed within these niche/practice groups provide Gallagher with a competitive advantage.
NICHE/PRACTICE GROUPS
Affinity
Agribusiness
Automotive
Aviation & Aerospace
Construction
Energy
Entertainment
Environmental
Global Risks
Healthcare
Higher Education
Hospitality
Life Sciences
Life Solutions
Manufacturing
Marine
Multinationals
Personal
Private Equity
Professional Groups
Public Entity
Real Estate
Religious/Nonprofit
Restaurant
Scholastic
Technology/Telecom
Trade Credit/Political Risk
Transportation
Gallagher anticipates that the greatest revenue growth over the next several years within its retail brokerage operations will continue to come from mergers and acquisitions; its niche/ practice groups and middle-market accounts; cross-selling other brokerage products and services to existing customers; and developing and managing alternative market mechanisms, such as captives, rent-a-captives and deductible plans/self insurance.
Insurance premiums are cyclical in nature and may vary widely based on market conditions. Fluctuations in premiums charged by P/C insurance carriers have a direct and potentially material impact on insurance agents and brokers. Commission revenues are generally based on a percentage of the premiums paid by insureds and normally follow premium levels. According to quarterly market surveys conducted by the Council of Insurance Agents & Brokers (CIAB), U.S. commercial P/C premiums were up, year-over-year, in each quarter of 2012 and 2013, with the size of the increase diminishing in the second half of 2013. During 2014, P/C rates began to stabilize across the U.S. In 2015, rates began to decline on average, for accounts of all sizes; down an average 2.3% in Q1, 3.3% in Q2, 3.1% in Q3 and 2.8% in Q4. The largest decreases were seen on commercial property and general liability coverages, and among large businesses with annual premiums in excess of $100,000.
SIGNIFICANT LINES OF COVERAGE & CONSULTING SERVICE CAPABILITIES
Aviation
Casualty
Claims Advocacy
Commercial Auto
Compensation
Cyber Liability
Dental
Directors & Officers Liability
Disability
Earthquake
Energy
Errors & Omissions
Exchange Solutions
Executive Benefits
Fiduciary Services
Fine Arts
Fire
General Liability
Health & Welfare
Healthcare Analytics
Human Resources
Institutional Investment
Loss Control
Marine
Medical
Products Liability
Professional Liability
Property
Retirement
Voluntary Benefits
Wind
Workers Compensation
GALLAGHER DELIVERS GLOBAL BROKERAGE CAPABILITIES
In addition to the 31 countries where Gallagher now has operations, the company actively manages business relationships with a network of approved independent brokers that expands the P/C brokerage capabilities it offers multinational clients to more than 150 countries around the world. Gallagher Global Alliance (GGA) members are selected based upon common business philosophies and their capabilities within their respective countries. GGA offers both strength and flexibility, enabling global servicing of Gallagher clients, and the clients of other GGA members, no matter where in the world they operate.
Gallagher also offers employee benefits brokerage and consulting services to clients throughout North America and the United
GALLAGHER’S ACQUISITION STRATEGY
Since 1986, one of Gallagher’s growth strategies has been the acquisition of complementary businesses. Gallagher completed 383 acquisitions worldwide from January 1, 2002 through December 31, 2015, most within the Brokerage Segment. The majority of these acquisitions were regional or local retail or wholesale brokers with a strong middle-market focus or significant expertise in a desirable market niche.
In 2014 Gallagher had the opportunity to complete four larger international acquisitions that fit well within its operations in Australia, Canada, New Zealand and the U.K. Gallagher has now built three solid platforms outside the U.S. in which it can duplicate its successful U.S. acquisition strategy of bolt-on deals that on average generate between $1 million and $15 million in annual revenues. In addition, Gallagher is focused on international expansion through joint ventures, where the company frequently begins its relationship with an equity position.
Kingdom. Gallagher’s multinational benefits and HR consulting practice can handle its clients’ international benefits needs in more than 90 countries around the world.
WHOLESALE INSURANCE
BROKERAGE OPERATIONS %
Gallagher’s wholesale brokerage operations 17 assist retail brokers and agents in the OF 2015 BROKERAGE placement of specialized, unique and hard- SEGMENT ADJUSTED to-place insurance programs. Wholesale REVENUES revenues are generated from sharing the commissions paid to the retail broker by the insurance carrier. Gallagher’s wholesale brokerage operations are organized into more than 70 office locations primarily located in the United States, Australia and Bermuda, and through its approved Lloyd’s of London broker. In certain cases Gallagher acts as a brokerage wholesaler and in other cases Gallagher acts as a managing general agent or managing general underwriter, handling specialized insurance coverages for insurance carriers.
More than 80% of Gallagher’s wholesale brokerage revenues come from retail brokers and agents not affiliated with Gallagher. Based on wholesale premium volume from P/C risks, Gallagher’s U.S. wholesale brokerage operation ranks as one of the largest domestic managing general agencies/underwriting managers/ wholesale brokers, according to Business Insurance magazine. That operation places a strong focus on binding, programs, standard lines aggregation and open brokerage business.
Gallagher anticipates growing its wholesale brokerage operations by increasing its number of broker clients, by developing new managing general agency programs, and through mergers and acquisitions.
Gallagher is highly selective. An acquisition must offer significant benefits, such as expanding the company’s talent pool, enhancing its geographic presence and service capabilities, and/or broadening and further diversifying its business mix.
In selecting acquisition candidates, Gallagher also focuses on:
a corporate culture that matches Gallagher’s team-oriented sales culture; a profitable, growing business that could further enhance its ability to compete by gaining access to Gallagher’s greater resources; new geographic presence and/or capabilities; and clearly defined financial criteria.
Contributing to the company’s success as an acquirer is its attractiveness as a merger partner. Gallagher believes that growth-oriented independent brokers and consultants are attracted by its aggressive, sales-oriented culture, team-based approach and depth of resources.
Risk Management Segment 18%
BROKERAGE AND RISK MANAGEMENT
2015 ADJUSTED
Gallagher’s Risk Management operation currently ranks as the world’s largest third- REVENUES party P/C claims administrator, according to Business Insurance magazine. Gallagher provides contract claims settlement and administration services for entities that choose to self-insure and insurance companies that outsource their claims-handling services.
Gallagher’s Risk Management operation also offers managed care, information management and appraisal services, as well as consultative services and training programs that help clients mitigate losses, combat claims fraud and maintain regulatory compliance.
Approximately 69% of Gallagher’s Risk Management Segment revenues are derived from managing workers compensation-related claims, 27% are from general and commercial auto liability-related claims, and 4% are from property-related claims. In addition, Gallagher generates revenues from integrated disability management (employee absence management) programs, information services, risk control consulting (loss control) services, investigative services and appraisal services, either individually or in combination with managing claims. Revenues are substantially in the form of fees, generally negotiated in advance, on a per-claim or per-service basis, depending upon the type and estimated volume of the services to be performed.
Gallagher manages its third-party claims management operations through a network of more than 110 offices located throughout Australia, Canada, New Zealand, the United Kingdom, and the United States. Clients are primarily Fortune 1000 companies, larger middle-market companies, nonprofit organizations,
public entities and the outsourcing of insurance company claims departments. More than 90% of Gallagher’s risk management revenues come from clients that do not use Gallagher as their retail or wholesale insurance broker.
The Risk Management Segment expects its most significant growth prospects through the next several years to come from new business with Fortune 1000 companies, governmental agencies, larger middle-market companies, captives, program business and the outsourcing of insurance company claims departments. In addition, the Risk Management Segment may grow in the future through mergers and acquisitions.
EXPERTISE
Advanced Analytics
Appraisal Services
Education & Training
Information Management
Investigative Services
Litigation Management
Managed Care Services
Real-time Claims Management
Recoveries (subrogation, salvage, etc.)
Risk Control Services
Safety Programs
Settlement Management
Information Regarding Non-GAAP Measures
This investment profile includes references to adjusted revenue, adjusted EBITDAC and adjusted EBITDAC margin, which are performance measures not in accordance with, or an alternative to, GAAP information. EBITDAC is defined as earnings before interest, income taxes, depreciation, amortization and the change in estimated acquisition earnout payables. Adjusted revenue and adjusted EBITDAC are defined as revenue and EBITDAC, respectively, each adjusted to exclude net gains realized from sales of books of business, acquisition integration costs, workforce-related charges, lease termination-related charges, claim portfolio transfer ramp up fees/costs, client run-off fees/costs, acquisition-related adjustments and the impact of foreign currency translation, as applicable. Adjusted EBITDAC margin is defined as adjusted EBITDAC divided by adjusted revenue. For adjusted revenue and adjusted EBITDAC, the most directly comparable GAAP measures are revenue and net earnings, respectively. For the Brokerage and Risk Management Segments on a combined basis, revenue was $3,579 million in 2014 and $4,051 million in 2015, and net earnings were $305 million in 2014 and $324 million in 2015. Please see “Reconciliation of Non-GAAP Measures” on Gallagher’s website at www.ajg.com under “Investor Relations” for the purpose of each non-GAAP measure used and an example of a reconciliation to the most directly comparable GAAP measure.
Corporate Segment
Gallagher’s debt, clean energy investments, external acquisition-related costs and other corporate costs are reported in this segment.
CLEAN ENERGY INVESTMENTS
Gallagher holds interests in various commercial operations that help coal-fired utilities reduce emissions. These operations consist of 34 clean coal production plants that produce refined coal using proprietary technologies owned by Chem-Mod (see below). Of the 34 plants, 14 were built and began production in 2009, and 20 were built and began production in 2011.
2009 Era Plants – 12 are currently under long-term production contracts with utilities. Two are in late stages of negotiations for long-term production contracts.
2011 Era Plants – 16 are currently under long-term production contracts with utilities. One is under long-term production contract estimated to resume production in first quarter 2016. Three are in very early discussions with several host utilities.
Gallagher believes the refined coal produced at these plants qualifies for tax credits under Section 45 of the Internal Revenue Code.
Gallagher also owns 46.5% of Chem-Mod LLC, which possesses the rights, information and technologies used for the reduction of emissions created during the combustion of coal. Refined coal production plants license and use Chem-Mod’s technologies in the production of refined coal. For management’s latest guidance on these earnings and additional information on these clean energy investments, please refer to ajg.com/financialreports.
For more information, including management’s latest guidance, on debt, mergers and acquisitions, and other corporate costs, please refer to the company’s latest investor supplement and CFO Commentary at ajg.com/financial reports.
Information Regarding Forward-Looking Statements
This investment profile contains “forward-looking statements” within the meaning of the Private Securities Litigation Reform Act of 1995. When used in this investment profile, the words “anticipates,” “believes,” “contemplates,” “see,” “should,” “could,” “estimates,” “expects,” “intends,” “plans” and variations thereof and similar expressions, are intended to identify forward-looking statements. Examples of forward-looking statements include, but are not limited to, (i) statements relating to dividends, (ii) anticipated areas of revenue growth within the Brokerage and Risk Management Segments, (iii) Gallagher’s acquisition strategy and level of acquisition activity, (iv) anticipated future results, performance or the growth of any segment or Gallagher as a whole, (v) financing activity including the use of debt, cash and stock, and (vi) developments relating to Gallagher’s clean energy investments. Important factors that could cause actual results to differ materially from those in the forward-looking statements include the following:
Changes in worldwide and national economic conditions, changes in premium rates and in insurance markets generally, changes in the insurance brokerage industry’s competitive landscape, our inability to identify appropriate acquisition targets at the right price, and the difficulties inherent in combining the cultures and systems of different companies could impact (i)–(v) above; and
Risks and uncertainties related to Gallagher’s clean energy investments—including uncertainties related to political and regulatory risks, including potential actions by Congress or challenges by the IRS eliminating or reducing the availability of tax credits under IRC Section 45 retroactively and/or going forward; the ability to maintain and find co-investors; the potential for divergent business objectives by co-investors and other stakeholders; plant operational risks, including supply-chain risks; utilities’ future use of, or demand for, coal; the market price of coal; the costs of moving a clean coal plant; intellectual property litigation risks; and environmental risks—could impact (vi) above.
Please refer to Gallagher’s filings with the SEC, including Item 1A, “Risk Factors,” of its Annual Report on Form 10-K for the fiscal year ended December 31, 2015, for a more detailed discussion of these and other factors that could impact its forward-looking statements.
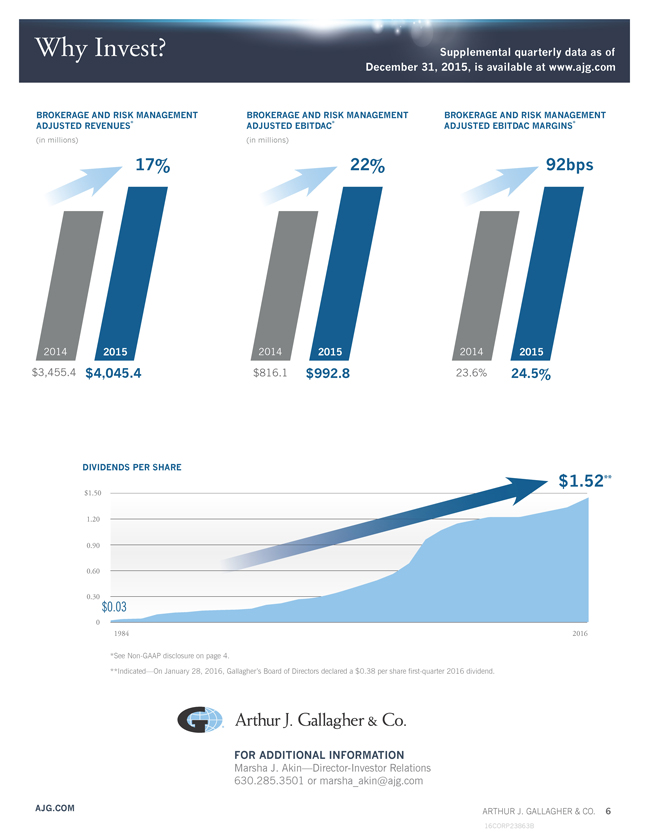
Why Invest?
BROKERAGE AND RISK MANAGEMENT ADJUSTED REVENUES*
(in millions)
17%
2014 2015 $3,455.4 $4,045.4
Supplemental quarterly data as of
December 31, 2015, is available at www.ajg.com
BROKERAGE AND RISK MANAGEMENT ADJUSTED EBITDAC*
(in millions)
22%
2014 2015 $816.1 $992.8
BROKERAGE AND RISK MANAGEMENT ADJUSTED EBITDAC MARGINS*
92bps
2014 2015
23.6% 24.5%
DIVIDENDS PER SHARE
$1.52**
$1.50
1.20
0.90
0.60
0.30 $0.03
0
1984 2016
*See Non-GAAP disclosure on page 4.
**Indicated—On January 28, 2016, Gallagher’s Board of Directors declared a $0.38 per share first-quarter 2016 dividend.
FOR ADDITIONAL INFORMATION
Marsha J. Akin—Director-Investor Relations 630.285.3501 or marsha_akin@ajg.com
AJG.COM ARTHUR J. GALLAGHER & CO. 6
16CORP23863B