![]() 2016 Annual Stockholders Meeting Tuesday, May 17, 2016 Exhibit 99.1 |
![]() 2 Stockholders’ Meeting – May 17, 2016 • 2016 Annual Meeting • Chairman’s Remarks 2015 Review Closing Comments • Questions & Answers |
![]() 3 Stockholders’ Meeting – May 17, 2016 Please turn off all cell phones. All audio and video recording is prohibited. |
![]() 4 2016 Board of Directors • Sherry S. Barrat • William L. Bax • D. John Coldman • Frank E. English, Jr. • Elbert O. Hand • David S. Johnson • Kay W. McCurdy • Ralph J. Nicoletti • Norman L. Rosenthal, Ph.D. |
![]() 5 Stockholders’ Meeting – May 17, 2016 • 2016 Annual Meeting |
![]() Stockholders’ Meeting – May 17, 2016 • 2016 Annual Meeting • Chairman’s Remarks 2015 Review 6 |
![]() 7 Information Regarding Forward-Looking Statements This presentation contains “forward-looking statements” within the meaning of the Private Securities Litigation Reform Act of 1995. When used in this presentation, the words “anticipates,” “believes,” “contemplates,” “see,” “should,” “could,” “will,” “estimates,” “expects,” “intends,” “plans” and variations thereof and similar expressions, are intended to identify forward-looking statements. Examples of forward-looking statements in this presentation include, but are not limited to, statements regarding: (i) improvements in our new business production; (ii) “tuck-in” M&A activity; (iii) global brand recognition; (iv) completion of large UK M&A integration efforts; (v) the leveraging of internal resources across divisions and borders; (vi) our status as the premier provider of claims management services; (vii) our global presence in the claims space; (viii) our ability to stay in front of improvements in technology; (ix) commercial P&C pricing; (x) drivers and expected levels of our organic growth; (xi) future M&A opportunities, including bolt-on acquisitions to our international “platforms”; (xiii) increasing productivity and quality; (xiv) our management team; (xv) our use of leverage; (xvi) our balance sheet; and (xvii) our total shareholder return. Important factors that could cause actual results to differ materially from those in the forward-looking statements include: declines in premiums or other adverse trends in the insurance industry; an economic downturn; competitive pressures in our businesses; failure to successfully or cost-effectively integrate recently acquired businesses; risks to our acquisition strategy, including continuing consolidation in our industry and increased interest in acquiring insurance brokers by private equity firms; our failure to attract and retain key executives and other personnel; risks arising from our international operations, including political and economic uncertainty and regulatory and legal compliance risk; concentration of large amounts of revenue with certain clients in our risk management segment; failure to apply technology effectively in our businesses; business continuity and cybersecurity risks; damage to our reputation; and failure to comply with regulatory requirements, including the FCPA, other anti-corruption laws, and data privacy laws. Please refer to Gallagher’s filings with the SEC, including Item 1A, “Risk Factors,” of its Annual Report on Form 10-K for the fiscal year ended December 31, 2015 for a more detailed discussion of these and other factors that could impact its forward-looking statements. |
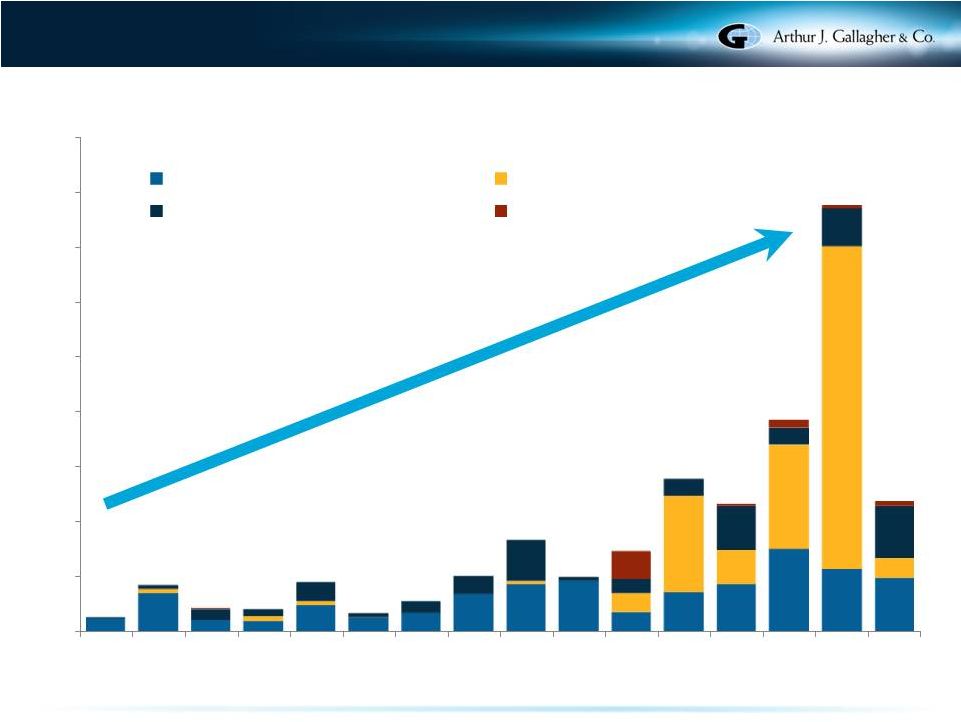
![]() 8 Information Regarding Non-GAAP Measures This presentation includes references to Adjusted EBITDAC, Adjusted EBITDAC margin, Adjusted Revenues, Adjusted Operating Expense Ratio and Organic Growth, which are measures not in accordance with, or an alternative to, the GAAP information provided herein. Earnings Measures - Gallagher believes that each of Adjusted EBITDAC and Adjusted EBITDAC margin, as defined below, provides a meaningful representation of its operating performance and improves the comparability of Gallagher’s results between periods by eliminating the impact of certain items that have a high degree of variability. Adjusted EBITDAC is defined as earnings from continuing operations before interest, income taxes, depreciation, amortization and the change in estimated acquisition earnout payables (EBITDAC), further adjusted to exclude gains realized from sales of books of business, acquisition integration costs, earnout related compensation charges, workforce related charges, lease termination related charges, client run-off/bankruptcy impact, South Australia and claim portfolio transfer ramp up fees/costs, acquisition related adjustments and the period-over-period impact of foreign currency translation, as applicable. Adjusted EBITDAC margin is defined as Adjusted EBITDAC divided by Adjusted Revenues (defined below). The most directly comparable GAAP measure for these non-GAAP earnings measures is net earnings. For the Brokerage Segment, the Risk Management Segment, and the two segments on a combined basis, net earnings was $139 million, $35 million and $174 million, respectively, in 2011, $156 million, $43 million and $199 million, respectively, in 2012, $205 million, $48 million and $253 million, respectively, in 2013, $264 million, $42 million and $306 million, respectively, in 2014 and $268 million, $57 million and $325 million, respectively, in 2015. Revenue and Expense Measures - Gallagher believes that Adjusted Revenues and Adjusted Operating Expense Ratio, each as defined below, provides stockholders and other interested persons with useful information that will assist such persons in analyzing Gallagher’s operating results as they develop a future outlook for Gallagher. Gallagher believes that Organic Growth provides a comparable measurement of revenue growth that is associated with the revenue sources that will be continuing in 2016 and beyond. Gallagher has historically viewed organic revenue growth as an important indicator when assessing and evaluating the performance of its Brokerage and Risk Management segments. Gallagher also believes that using this measure allows financial statement users to measure, analyze and compare the growth from its Brokerage and Risk Management segments in a meaningful and consistent manner. Adjusted Revenues is defined as revenues, adjusted to exclude gains realized from sales of books of business, New Zealand earthquake claims administration fees, South Australia ramp up fees and the impact of client bankruptcy. Adjusted Operating Expense Ratio is defined as operating expense, adjusted to eliminate lease termination and abandonment charges, acquisition related adjustments and integration costs, costs related to New Zealand earthquake claims administration, South Australia and claim portfolio transfer ramp up costs, and the impact of foreign currency translation, as applicable, divided by Adjusted Revenues. Organic Growth is defined as organic change in commission and fee revenues (including supplemental and contingent commissions), and excludes the first twelve months of net commission and fee revenues generated from acquisitions accounted for as purchases and the net commission and fee revenues related to operations disposed of in each year presented. These commissions and fees are excluded from organic revenues in order to help interested persons analyze the revenue growth associated with the operations that were a part of Gallagher in both the current and prior year. In addition, change in organic growth excludes the period-over-period impact of foreign currency translation. The amounts excluded with respect to foreign currency translation are calculated by applying 2015 foreign exchange rates to the same periods in 2014. The most directly comparable GAAP measure for Adjusted Revenues and Organic Growth is reported revenues. For the Brokerage Segment, reported revenues were $533 million, $679 million, $783 million, $863 million, $946 million, $1,007 million, $1,114 million, $1,188 million, $1,276 million, $1,329 million, $1,544 million, $1,812 million, $2,126 million, $2,896 million, and $3,324 million in 2001, 2002, 2003, 2004, 2005, 2006, 2007, 2008, 2009, 2010, 2011, 2012, 2013, 2014 and 2015, respectively. For the Risk Management Segment, reported revenues were $682.3 million and $727.1 million in 2014 and 2015, respectively. The most directly comparable GAAP measure for Adjusted Operating Expense Ratio is reported operating expense, which was $247 million and $638 million in 2008 and 2015, respectively, for the Brokerage Segment and $126 million and $181 million in 2008 and 2015, respectively, for the Risk Management Segment. Reconciliations – For other reconciliations, please see the appendix at the back of this presentation and the examples set forth in "Reconciliation of Non-GAAP Measures and supplemental quarterly financial data " on Gallagher's Web site at ajg.com/IR. |
![]() Who We Are KEY FACTS KEY SHAREHOLDER DATA 3.2% $ 0.38 52-Week Range*** $ 49.59 Hi $ 35.96 Lo Outstanding Shares 176.9M $ 4.0+B Acquired Revenues – 2015 $ 230.8M $ 8.3B 2015 Total Adjusted Revenues** Dividend Yield *** 2016 Q2 Dividend/Share at April 27, 2016 Market Cap*** 680+ Employees 21,537 • Founded in 1927 • Public since 1984 – 32 years ago • One of the World’s Leading Insurance Brokers * • One of the world’s largest P&C third-party administrators * As of December 31, 2015 unless otherwise indicated. * According to Business Insurance. **Brokerage and Risk Management adjusted revenue for the year ended December 31, 2015 *** as of May 13, 2016 Sales/Service Offices – 31 Countries AJG NYSE 9 |
![]() 10 • 82% of revenue* • We sell insurance and consult on insurance programs • P&C and benefits • Retail and wholesale • Primarily middle-market commercial clients and individuals • 77% of revenue* is commissions – 23% is fee-based • 18% of revenue* • We adjust claims and help companies and carriers reduce their losses • Workers compensation, liability, managed care, property and auto • Modest amount of storm/quake claims • Primarily Fortune 1000 clients • 90% of revenue* from non-affiliated brokerage customers and their clients BROKERAGE SEGMENT Snapshot of Core Operations *Brokerage and Risk Management adjusted revenue for the year ended December 31, 2015. RISK MANAGEMENT SEGMENT |
![]() 11 Diverse Revenue Base RISK MANAGEMENT* BROKERAGE* *Brokerage and Risk Management adjusted revenue for the year ended December 31, 2015. 59% 24% 17% WHOLESALE RETAIL P/C RETAIL BENEFITS 64% 36% DOMESTIC INTERNATIONAL 69% 27% 4% PROPERTY WORKERS COMPENSATION LIABILITY 81% 19% DOMESTIC INTERNATIONAL |
![]() 12 Brokerage Segment – 2015 (in $M) See important disclosures regarding Non-GAAP measures on Page 3. $2,795 $3,317 $2,500 $3,000 $3,500 2014 2015 ADJUSTED REVENUES 19% 4.3% 3.6% 2.0% 4.0% 6.0% 8.0% 2014 2015 TOTAL ORGANIC GROWTH $710 $867 $600 $700 $800 $900 $1,000 2014 2015 ADJUSTED EBITDAC 22% 25.4% 26.1% 23.0% 24.0% 25.0% 26.0% 27.0% 2014 2015 ADJUSTED EBITDAC MARGIN |
![]() 13 (in $M) Risk Management Segment – 2015 10% 18% See important disclosures regarding Non-GAAP measures on Page 3. $660 $728 $625 $650 $675 $700 $725 $750 2014 2015 ADJUSTED REVENUES $107 $126 $90 $100 $110 $120 $130 $140 2014 2015 ADJUSTED EBITDAC 16.1% 17.3% 12.0% 14.0% 16.0% 18.0% 20.0% 2014 2015 ADJUSTED EBITDAC MARGIN 9.5% 11.3% 5.0% 7.0% 9.0% 11.0% 13.0% 2014 2015 TOTAL ORGANIC GROWTH |
![]() 14 Brokerage & Risk Management Combined – 2015 (in $M) See important disclosures regarding Non-GAAP measures on Page 3. 17% 22% $3,455 $4,045 $2,800 $3,200 $3,600 $4,000 $4,400 2014 2015 ADJUSTED REVENUES 5.5% 5.1% 2.0% 3.0% 4.0% 5.0% 6.0% 7.0% 2014 2015 TOTAL ORGANIC GROWTH $816 $993 $600 $700 $800 $900 $1,000 $1,100 $1,200 2014 2015 ADJUSTED EBITDAC 23.6% 24.5% 20.0% 21.0% 22.0% 23.0% 24.0% 25.0% 26.0% 2014 2015 ADJUSTED EBITDAC MARGIN |
![]() 15 Adjusted Net Earnings from Clean Energy Investments (in $M) 2009 2010 2011 2012 2013 2014 Excludes non-cash after tax gain of $14.1m from a re-consolidation accounting gain, related to clean-energy investments, recorded in 2014. 2015 -$4.8 $7.5 $3.9 $32.7 $63.7 $90.5 $100.9 -$10.0 $0.0 $10.0 $20.0 $30.0 $40.0 $50.0 $60.0 $70.0 $80.0 $90.0 $100.0 $110.0 $120.0 |
![]() 16 Dividends Per Share *Indicated – On January 28, 2016, Gallagher’s Board of Directors declared a $.38 per share first-quarter 2016 dividend. 1984 2016 $1.52* $0.00 $0.20 $0.40 $0.60 $0.80 $1.00 $1.20 $1.40 $1.60 |
![]() 17 2015 Business Highlights Brokerage & Risk Management growth: • 17% adjusted revenue growth • 22% adjusted EBITDAC growth • 92 bps margin improvement • 5.1% total organic growth M&A growth: $230.8m in acquired revenues • WGA - New England Platform • +43 additional - avg $3.6m in revenue • Returning to tuck-in opportunities Clean energy growth: • $100.9m of adjusted net earnings • 12% increase in adjusted net earnings over 2014 • Additional 2 facilities to long-term production contracts All while accomplishing: Global M&A integration • Completed Australia/New Zealand & Canada • Combining 4 U.K. brokers expected to finish in 2016 • Top 5 broker in the U.K. U.S. retail–one agency system See important disclosures regarding Non-GAAP measures on Page 3 and Page 10. |
![]() 18 • Improving new business production • Continuing tuck-in M&A • Increasing global brand recognition • Completing large U.K. M&A integration • Leveraging internal resources across divisions • To be premier provider of claims management services with superior outcomes • Increasing global presence in claims space • U.S. clients with global operations • Expanding via M&A/new partners • Staying in front of improving technology • Increasing brand recognition globally • Leveraging resources across borders BROKERAGE SEGMENT Where We’re Going RISK MANAGEMENT SEGMENT |
![]() 19 Source for calendar year combined ratio data: AM Best. Using 9 month 2014 data as of 01/29/15. 2012 and prior excludes certain large mortgage insurance and personal lines companies. Indicators for U.S. P/C Carriers – Shallow Rate Environment INVESTMENT YIELDS STATUTORY SURPLUS ($Billions) months 2014 as of 0/29/15. Prior to 2004, sources are A.M. Best and ISO via the Insurance Information Institute. PREMIUM/STATUTORY SURPLUS COMBINED RATIOS 118.3 93.8 97.0 90 95 100 105 110 115 120 0.6x 0.8x 1.0x 1.2x 1.4x 1.6x 1.0% 2.0% 3.0% 4.0% 5.0% 6.0% 7.0% 8.0% $100 $200 $300 $400 $500 $600 $700 $800 Source for data : Total US P/C Industry from Best’s Statement File P/C US for 2001 – 2013. and Quarterly Statement File for 9 months 2014 (annualized). Prior to 2001, sources are A.M. Best and ISO via the Insurance Information Institute. Source for data : Total US P/C Industry from Best’s Statement File P/C US for 2001 – 2013. and Quarterly Statement File for 9 months 2014 (annualized) as of 01/29/2015. Prior to 2001, sources are A.M. Best and ISO via the Insurance Information Institute. Source for data : Total US P/C Industry from Best’s Statement File P/C US for 2004 – 2013 and Quarterly Statement File for 9 |
![]() CPI 136 Rates 96 Commercial P&C Pricing Shows Shallow Cycle Commercial Rate Index reflects the cost of P&C premiums relative to the year 2000. Constructed using Counsel of Insurance Agents and Brokers (CIAB) data. CPI index uses data from the Bureau of Labor Statistics. 80 90 100 110 120 130 140 150 160 20 |
![]() Shows Shallow Pricing Cycle 21 -2.9% -0.1% 0.9% 2.7% 4.4% 4.3% 3.9% 5.0% 5.2% 4.3% 3.4% 2.1% 1.5% -0.5% 0.1% -0.7% -2.3% -3.3% -3.1% -2.8% -4.0% -3.0% -2.0% -1.0% 0.0% 1.0% 2.0% 3.0% 4.0% 5.0% 6.0% CIAB - Change in Average Commercial Rates |
![]() Gallagher Sales Culture Performs Through Any Pricing Cycle Hard Market Shallow Market CIAB is the 4 quarter average. Gallagher’s Brokerage Segment Organic Growth excluding Contingent Commissions. See important disclosures regarding Non-GAAP measures on Page 3. 22 14.0% 16.0% 10.0% 2.0% 2.0% 5.0% 2.0% -0.8% -2.4% -1.7% 3.1% 4.4% 5.6% 3.8% AJG Organic 3.8% 19.8% 19.8% 8.1% -4.1% -8.0% -5.2% -12.1% -11.0% -5.4% -5.6% 0.2% 4.4% 3.8% 0.1% CIAB -2.9% -15.0% -10.0% -5.0% 0.0% 5.0% 10.0% 15.0% 20.0% 25.0% 2001 2002 2003 2004 2005 2006 2007 2008 2009 2010 2011 2012 2013 2014 2015 Gallagher Organic CIAB - Change in Avg. Commercial Rates Soft Market |
![]() Shallow Rate Cycle Is Better for: CLIENTS CARRIERS & BROKERS 23 |
![]() How We’re Getting There-Consistent Growth Strategy |
![]() Consistent Growth Strategy – Organic |
![]() 26 Driving Brokerage Organic Growth |
![]() 27 Niche Expertise Teams – Brokerage Aviation & Aerospace Automotive Agribusiness Real Estate Manufacturing Global Risks Construction Personal Marine Life Solutions Life Sciences Hospitality Higher Education Healthcare Environmental Entertainment Energy Private Equity Professional Groups Public Entity Religious/Nonprofit Restaurant Scholastic Technology/Telecom Trade Credit/ Political Risk Transportation |
![]() Driving Risk Management Organic Growth 28 |
![]() 29 Risk Mgmt Growth Focuses on Four Market Segments ALTERNATIVE MARKET PARTICIPANTS LARGE COMMERCIAL ENTITIES PUBLIC SECTOR ENTITIES INSURANCE CARRIERS |
![]() Consistent Growth Strategy – M&A |
![]() Annualized Revenues Acquired (in $M’s) 2015 –Acquisition Revenue Growth 31 0 100 200 300 400 500 600 700 800 900 2000 2001 2002 2003 2004 2005 2006 2007 2008 2009 2010 2011 2012 2013 2014 2015 Domestic Property & Casualty Foreign Property & Casualty Employee Benefits Risk Management |
![]() M&A Opportunities Continue Vast Pipeline Domestic and international markets highly fragmented 18,000+ agents/ brokers just in the U.S. Baby boomers looking for exit strategy Need Gallagher’s expertise Acquisition Units Retail P&C Wholesale Benefits International MGA MGU Captive Limited Consolidators Core Competency Culture Proven history Ability to integrate 32 |
![]() 33 Platforms In Place for Bolt-on M&A |
![]() Client Capabilities in 150 Countries 34 International Correspondent Broker Network |
![]() Productivity and Quality Initiatives |
![]() Utilizing Offshore Centers of Excellence Controlling Headcount Focus Continues: Optimizing Productivity & Quality Building Productivity Tools – DMS and Workflow Optimizing Real Estate Footprint Investing in Business Intelligence Leveraging Sales Force Management Tools CONTINUE TO IMPROVE PRODUCTIVITY AND QUALITY Utilizing Offshore Centers of Excellence Controlling Headcount Utilizing Sourcing to Manage Expenses Standardizing Processes and Systems 36 |
![]() Benefits Continue: From Offshore Centers of Excellence Increase Speed to Market Foster Innovation Reduce Costs Focus on Core Improve Quality 37 |
![]() 38 Client-Facing Efforts BUILDING CLIENT SERVICE OPERATIONS • Process and deliver consistent client service • Technology and tools improve operating efficiencies • Staffed by dedicated service professionals that: Generate client applications and proposals Handle client requests Manage renewal cycles • Improves turn-around time on client requests • Supports production teams • Can still customize for niche practice areas • Easily integrated for new acquisition partners to utilize |
![]() 39 Behind the Scenes Efforts OFFSHORE CENTERS OF EXCELLENCE UPDATE • We now have more than 2,400 associates in four locations • Utilized for processes such as: Policy checking Policy issuance Certificates of insurance Renewal support Claims support Accounting support • Substantially improved quality and reduced both operating and E&O costs • Easy for new acquisition partners to utilize |
![]() 40 Quality Metrics on Target EFFICIENCY IMPROVEMENTS DRIVE QUALITY AND SERVICE Reduced policy delivery from 30 to 10 days Achieved 99% quality rate Reduced certificate of insurance delivery expense by 20+% Improved quality rate to 99.5% and reduced delivery time from 2 hours to 1 hour Standardized policy issuance for top 30 carriers and reduced issuance time from 12 to 3 days Improved carrier and retailer satisfaction Single agency management system and standardized processes across the network Real-time, up-to-date, quality client data in single repository for 24/7 producer access Offloaded routine work such as ordering reports, filing forms and paying bills from experienced Claims Adjusters to COE staff Allows Claims Adjusters to focus on timely and cost effective resolution of open claims Centralized billing to clients – previously done in 90 locations – thereby reducing costs Improved accuracy, speed and cash flows Consolidated 5 regional accounting centers to 1 divisional accounting center in Itasca Standardizes and automates data processes, improves report timing, reduces errors, and generates savings on resources |
![]() Reduced Adjusted Operating Expense Ratio BROKERAGE RISK MANAGEMENT See important disclosures regarding Non-GAAP measures on Page 3. 41 20.8% 17.3% 16.0% 17.0% 18.0% 19.0% 20.0% 21.0% 22.0% 2008 2015 27.0% 24.4% 23.0% 24.0% 25.0% 26.0% 27.0% 28.0% 2008 2015 |
![]() Brokerage & Risk Mgmt Adjusted EBITDAC Margin See important disclosures regarding Non-GAAP measures on Page 3. 42 20.4% 21.2% 22.1% 23.6% 24.5% 18.0% 19.0% 20.0% 21.0% 22.0% 23.0% 24.0% 25.0% 2011 2012 2013 2014 2015 |
![]() Ranked “Highest in Customer Satisfaction among Brokers for Large Commercial Insurance” According to the 2015 Large Commercial Insurance Study SM conducted by J.D. Power and in partnership with RIMS, Arthur J. Gallagher & Co. ranked highest in customer satisfaction among brokers in the large commercial insurance space. The study focused on 8 factors of customer satisfaction, and Arthur J. Gallagher & Co. scored highest in 6 of the 8 factors. 1 1 Arthur J. Gallagher & Co. received the highest numerical score among brokers for large commercial insurance in the J.D. Power 2015 Large Commercial Insurance Study. Based on 1,285 responses measuring 5 brokers and experiences and perceptions of large commercial insurance insureds, surveyed in April-August 2015. Your experiences may vary. Visit jdpower.com. Gallagher scored highest in the following factors 1 : • Quality of advice/guidance provided • Reasonableness of fees • Ease of the renewal process • Variety of program offerings • Effectiveness of program review • Claims process 1 43 |
![]() 44 Relentless Focus on Quality and Customer Service Best Companies for Leaders – 2015 CHIEF EXECUTIVE MAGAZINE America’s Best Employers – 2015 FORBES MAGAZINE Voted Best UK Broker for Service – 2015 STRATEGIC RISK’S UK FTSE SURVEY Best TPA in Casualty Claims Handling – 2015 ADVISEN CLAIMS SATISFACTION SURVEY UK Employee Benefits Consultancy of the Year – 2015 WORKPLACE SAVINGS AND BENEFITS MAGAZINE Corporate Champion for Board Gender Balance – 2015 WOMEN’S FORUM OF NEW YORK Leadership 500 Excellence Award – 2015 HR.COM Best Mid-Sized Broker – 2014 REACTIONS MAGAZINE AJG Intl/OIM – MGA of the Year – 2014 INSURANCE POST Group Risk Adviser of the Year – 2014 AJG BENEFITS TEAM CORPORATE ADVISER |
![]() Maintaining Culture 45 |
![]() Maintain Unique Culture 46 |
![]() One of the World’s Most Ethical Companies as Recognized by Ethisphere four years in a row • Industry-leading commitment to ethics and dedication to integrity • Chosen for: Promoting ethical business standards and practices Exceeding legal compliance standards Innovating to benefit the public Demonstrating that corporate citizenship is tied to company success • Only 145 organizations named worldwide 47 |
![]() Why Invest? You Believe Our Company Has: • Right management • Unique culture • Proven growth strategy • Continuing M&A opportunities • Increasing productivity • Higher quality • Good use of leverage • Strong balance sheet • Excellent return to shareholders GALLAGHER IS WELL POSITIONED FOR FUTURE GROWTH 48 |
![]() Why Invest? We Are Just Getting Started Source for data: Bloomberg. Total returns from 1/1/2000 – 12/31/2015 include reinvestment of dividends. 352% AJG S&P 500 86% 49 |
![]() For Additional Information: Marsha Akin Director – Investor Relations Marsha_Akin@ajg.com 630-285-3501 Questions & Answers |
![]() 51 Appendix: EBITDAC and Organic Growth Reconciliations 15COR23863C Brokerage Segment Risk Management Segment Corporate Segment Total Company Reconciliation of EBITDAC to Net Earnings 2015 2014 2015 2014 2015 2014 2015 2013 Net earnings 268.1 $ 263.8 $ 57.2 $ 42.1 $ 63.8 $ 21.6 $ 389.1 $ 327.5 $ Provision (benefit) for income taxes 145.3 151.0 35.1 25.3 (276.0) (212.3) (95.6) (36.0) Interest - - 24.3 - 103.0 89.0 127.3 89.0 Depreciation 54.4 44.4 3.0 21.2 15.2 3.8 72.6 69.4 Amortization 237.3 186.3 (0.5) 3.2 - - 236.8 189.5 Change in estimated acquisition earnout payables 41.1 17.6 - (0.1) - - 41.1 17.5 EBITDAC 746.2 $ 663.1 $ 119.1 $ 91.7 $ (94.0) $ (97.9) $ 771.3 $ 656.9 $ Combined Brokerage & Risk Brokerage Segment Risk Management Segment Management Segments Organic Revenues 2015 2014 2015 2014 2015 2014 Total Commissions and Fees Commissions as reported 2,338.7 $ 2,083.0 $ - $ - $ 2,338.7 $ 2,083.0 $ Fees as reported 705.8 577.0 710.9 662.6 1,416.7 1,239.6 Supplemental commissions as reported 125.5 104.0 - - 125.5 104.0 Contingent commissions as reported 93.7 84.7 - - 93.7 84.7 International performance bonus fees - - 15.6 18.7 15.6 18.7 Less commissions and fees from acquisitions (411.3) - (3.9) - (415.2) - Less commissions and fees from disposed of operations - (9.1) - - - (9.1) Less fees from client run-off - - (17.5) (25.8) (17.5) (25.8) Levelized foreign currency translation - (87.0) - (21.8) - (108.8) Total organic commissions and fees 2,852.4 $ 2,752.6 $ 705.1 $ 633.7 $ 3,557.5 $ 3,386.3 $ Total organic change in commissions and fees 3.6% 11.3% 5.1% (Unaudited - in millions except percentage data) Information Regarding Non-GAAP Measures - Year Ended December 31, 2015 and 2014 Arthur J. Gallagher & Co. |