 2018 ANNUAL STOCKHOLDERS MEETING May 15, 2018 Exhibit 99.1 |
 2 18CORP23863J ©2018 ARTHUR J. GALLAGHER & CO. | AJG.COM Stockholders’ Meeting May 15, 2018 • 2018 Annual Meeting • Chairman’s Remarks • 2017 Review • Closing Comments • Questions & Answers |
 3 18CORP23863J ©2018 ARTHUR J. GALLAGHER & CO. | AJG.COM Stockholders’ Meeting May 15, 2018 Please turn off all cell phones. All audio and video recording is prohibited. |
 4 18CORP23863J ©2018 ARTHUR J. GALLAGHER & CO. | AJG.COM 2018 Board of Directors • Sherry S. Barrat • William L. Bax • D. John Coldman • Frank E. English, Jr. • Elbert O. Hand • David S. Johnson • Kay W. McCurdy • Ralph J. Nicoletti • Norman L. Rosenthal, Ph.D. |
 5 18CORP23863J ©2018 ARTHUR J. GALLAGHER & CO. | AJG.COM Stockholders’ Meeting May 15, 2018 • 2018 Annual Meeting |
 6 18CORP23863J ©2018 ARTHUR J. GALLAGHER & CO. | AJG.COM Stockholders’ Meeting May 15, 2018 • 2018 Annual Meeting • Chairman’s Remarks • 2017 Review |
 7 18CORP23863J ©2018 ARTHUR J. GALLAGHER & CO. | AJG.COM Cautionary Note on New Accounting Standard and Information on Forward-Looking Statements Cautionary Note Regarding New Revenue Recognition Accounting Standard The financial information in the slides that follow are presented under “Old GAAP” – i.e., before implementation of the new revenue recognition accounting standard (ASC Topic 606), which we adopted as of January 1, 2018, using the full retrospective method. Accordingly, the financial information for 2017 presented in these slides may not be identical to the financial information for 2017 presented in our filings with the SEC beginning with our Quarterly Report on Form 10-Q for the quarter ended March 31, 2018. Information Regarding Forward-Looking Statements This presentation contains “forward-looking statements” within the meaning of the Private Securities Litigation Reform Act of 1995. Examples of forward-looking statements in this presentation include, but are not limited to, statements regarding: (i) our ability to leverage resources across borders; (ii) future dividends; (iii) improvements in our new business production; (iv) “tuck-in” M&A activity; (v) global brand recognition; (vi) the leveraging of internal resources across divisions and borders; (vii) our status as the premier provider of claims management services; (viii) our global presence in the claims space; (ix) our ability to stay in front of improvements in technology; (x) commercial P&C pricing; (xi) drivers and expected levels of our organic growth; (xii) future M&A opportunities, including bolt-on acquisitions to our “platforms”; (xiii) increasing productivity and quality; (xiv) our management team; (xv) our use of leverage; (xvi) our balance sheet; and (xvii) our return to shareholders. Important factors that could cause actual results to differ materially from those in the forward-looking statements include: declines in premiums or other adverse trends in the insurance industry; an economic downturn (including as a result of Brexit); tax reform, including new interpretations or guidance from regulators; competitive pressures in our businesses; failure to successfully or cost-effectively integrate recently acquired businesses; risks to our acquisition strategy, including continuing consolidation in our industry and increased interest in acquiring insurance brokers by private equity firms; our failure to attract and retain key executives and other personnel; risks arising from our international operations, including political and economic uncertainty and regulatory and legal compliance risk; concentration of large amounts of revenue with certain clients in our risk management segment; failure to apply technology effectively in our businesses; business continuity and cybersecurity risks; damage to our reputation; and failure to comply with regulatory requirements, including the FCPA, other anti-corruption laws, and data privacy laws. Please refer to Gallagher’s filings with the SEC, including Item 1A, “Risk Factors,” of its most recently filed Annual Report on Form 10-K and Quarterly Report on Form 10-Q for a more detailed discussion of these and other factors that could impact its forward-looking statements. |
 8 18CORP23863J ©2018 ARTHUR J. GALLAGHER & CO. | AJG.COM This presentation includes references to Adjusted EBITDAC, Adjusted EBITDAC margin, Adjusted Revenues, Adjusted Operating Expense Ratio and Organic Revenue Growth, which are measures not in accordance with, or an alternative to, the GAAP information provided herein. Earnings Measures - Gallagher believes that each of Adjusted EBITDAC and Adjusted EBITDAC margin, as defined below, provides a meaningful representation of its operating performance and improves the comparability of Gallagher’s results between periods by eliminating the impact of certain items that have a high degree of variability. EBITDAC is defined as net earnings before interest, income taxes, depreciation, amortization and the change in estimated acquisition earnout payables. Adjusted EBITDAC is EBITDAC further adjusted to exclude gains realized from sales of books of business, acquisition integration costs related to large acquisitions, workforce related charges, lease termination related charges, acquisition related adjustments and the period-over-period impact of foreign currency translation, as applicable. Adjusted EBITDAC margin is defined as Adjusted EBITDAC divided by Adjusted Revenues (defined below). The most directly comparable GAAP measure for these non-GAAP earnings measures is net earnings. For the two segments (Brokerage Segment & Risk Management Segment) on a combined basis, net earnings was $174 million, $199 million, $253 million, $306 million, $325 million, $414 million and $484 million in 2011, 2012 , 2013, 2014, 2015, 2016 and 2017. For the Brokerage Segment, net earnings were $357 million and $424 million in 2016 and 2017, respectively. For the Risk Management Segment, net earnings were $57 million and $60 million in 2016 and 2017, respectively. See Cautionary Note on page 7. Revenue and Expense Measures - Gallagher believes that Adjusted Revenues and Adjusted Operating Expense Ratio, each as defined below, provides stockholders and other interested persons with useful information that will assist such persons in analyzing Gallagher’s operating results as they develop a future outlook for Gallagher. Gallagher believes that Organic Revenue Growth provides a comparable measurement of revenue growth that is associated with the revenue sources that will continue in the future. Gallagher has historically viewed organic revenue growth as an important indicator when assessing and evaluating the performance of its Brokerage and Risk Management segments. Gallagher also believes that using this measure allows financial statement users to measure, analyze and compare the growth from its Brokerage and Risk Management segments in a meaningful and consistent manner. Adjusted Revenues is defined as revenues, adjusted to exclude gains realized from sales of books of business, acquisition integration costs for large acquisitions, workforce related charges, lease termination related charges, acquisition related adjustments, and the period-over-period impact of foreign currency translation, as applicable. Adjusted Operating Expense Ratio is defined as operating expense, adjusted to exclude the items listed above for Adjusted Revenues, as applicable, divided by Adjusted Revenues. Organic Revenue Growth. For the Brokerage segment, organic change in commission and fee revenues excludes the first twelve months of net commission and fee revenues generated from acquisitions and the net commission and fee revenues related to operations disposed of in each year presented. These commissions and fees are excluded from organic revenues in order to help interested persons analyze the revenue growth associated with the operations that were a part of Gallagher in both the current and prior year. In addition, change in commission and fee revenue organic growth excludes the period-over-period impact of foreign currency translation. For the Risk Management segment, organic change in fee revenues excludes the first twelve months of fee revenues generated from acquisitions and the fee revenues related to operations disposed of in each year presented. In addition, change in organic growth excludes the impact of the period- over-period impact of foreign currency translation to improve the comparability of our results between periods by eliminating the impact of the items that have a high degree of variability or are due to the limited-time nature of these revenue sources. The most directly comparable GAAP measure for Adjusted Revenues and Organic Growth is reported revenues. For the Brokerage Segment, reported revenues were $533 million, $679 million, $783 million, $863 million, $946 million, $1,007 million, $1,114 million, $1,188 million, $1,276 million, $1,329 million, $1,544 million, $1,812 million, $2,126 million, $2,896 million, $3,324 million, $3,528 million and $3,831 million in 2001, 2002, 2003, 2004, 2005, 2006, 2007, 2008, 2009, 2010, 2011, 2012, 2013, 2014, 2015 , 2016 and 2017, respectively. For the Risk Management Segment, reported revenues were $718 million and $769 million in 2016 and 2017, respectively. On a combined basis (Brokerage Segment & Risk Management Segment) reported revenues were $4,246 million and $4,599 million in 2016 and 2017, respectively. See Cautionary Note on page 7. The most directly comparable GAAP measure for Adjusted Operating Expense Ratio is reported operating expense, which was $247 million and $614 million in 2008 and 2017, respectively, for the Brokerage Segment and $126 million and $189 million in 2008 and 2017, respectively, for the Risk Management Segment. Revenue Recognition Accounting Guidance. These slides present financial information for periods prior to our adoption of the new revenue recognition accounting guidance, ASC Topic 606. All such pre-adoption financial information is non-GAAP. Gallagher’s management believes this non-GAAP information is useful to investors because it assists them in understanding our year-over-year financial performance for periods prior to adoption of the new accounting standard. The 2017 information is provided for illustrative purposes only, and should be read together with, and not considered a substitute for, the Company’s historical financial statements. The financial information for 2017 does not constitute a restatement of the Company’s historical financial statements previously filed with the Securities and Exchange Commission. Reconciliations – For reconciliations, please see the examples set forth in our filings with the Securities and Exchange Commission covering periods prior to our adoption of the new revenue recognition accounting standard. Information Regarding Non-GAAP Measures |
 9 18CORP23863J ©2018 ARTHUR J. GALLAGHER & CO. | AJG.COM 52-Week Range*** $ 70.55 Hi $ 53.63 Lo 2.5% Dividend Yield*** $ 0.41 • Founded in 1927 • Public since 1984 • One of the World’s leading insurance brokers* • One of the World’s largest P&C third-party administrators* As of December 31, 2017 unless otherwise indicated Acquired Revenues 2017** $ 172M $ 4.6B 2017 Total Adjusted Revenue** 33 Countries*** $ 11.8B AJG Who We Are Key Facts Key Shareholder Data * According to Business Insurance ** Brokerage & Risk Management adjusted revenue *** as of February 6, 2018 2018 Q1 Dividend/Share Market Cap*** NYSE Employees 26,783 Outstanding Shares 181.0M |
 10 18CORP23863J ©2018 ARTHUR J. GALLAGHER & CO. | AJG.COM *Brokerage and Risk Management adjusted revenue for the year ended December 31, 2017. Snapshot of Core Operations RISK MANAGEMENT SEGMENT BROKERAGE SEGMENT • 83% of revenue* • We sell insurance and consult on insurance programs • Property/Casualty and employee benefits • Retail and wholesale • Primarily middle-market commercial clients and individuals • 77% of C&F revenue is commission – 23% is fee-based • 17% of revenue* • We adjust claims and help companies and carriers reduce their losses • Workers’ compensation, liability, managed care, auto and property • Modest amount of storm/earthquake claims • Primarily Fortune 1000 clients • More than 90% of revenue* from non-affiliated brokerage customers and their clients 10 |
 11 18CORP23863J ©2018 ARTHUR J. GALLAGHER & CO. | AJG.COM Risk Management* Brokerage* Diverse Revenue Base *Brokerage and Risk Management adjusted revenue for the year ended December 31, 2017. 57% 26% 17% WHOLESALE RETAIL P/C RETAIL BENEFITS 66% 34% DOMESTIC INTERNATIONAL 87% 13% DOMESTIC INTERNATIONAL 64% LIABILITY 32% 4% PROPERTY WORKERS’ COMPENSATION |
 12 18CORP23863J ©2018 ARTHUR J. GALLAGHER & CO. | AJG.COM (in $M) Brokerage Segment See Cautionary Note on page 7 regarding the new revenue recognition accounting standard. See also important disclosures regarding Non-GAAP measures on Page 8. $3,508 $3,827 $3,400 $3,600 $3,800 $4,000 2016 2017 Adjusted Revenues 9% (in $M) 3.6% 4.4% 2.0% 3.0% 4.0% 5.0% 2016 2017 Total Organic Growth 26.9% 27.4% 26.0% 27.0% 28.0% 2016 2017 Adjusted EBITDAC Margin $945 $1,050 $900 $1,000 $1,100 2016 2017 Adjusted EBITDAC 11% |
 13 18CORP23863J ©2018 ARTHUR J. GALLAGHER & CO. | AJG.COM (in $M) Risk Management Segment See Cautionary Note on page 7 regarding the new revenue recognition accounting standard. See also important disclosures regarding Non-GAAP measures on Page 8. $720 $769 $700 $720 $740 $760 $780 2016 2017 Adjusted Revenues 7% (in $M) 1.3% 5.2% 0.0% 2.0% 4.0% 6.0% 2016 2017 Total Organic Growth $125 $133 $120 $125 $130 $135 $140 2016 2017 Adjusted EBITDAC 17.4% 17.4% 15.0% 16.0% 17.0% 18.0% 2016 2017 Adjusted EBITDAC Margin 13 |
 14 18CORP23863J ©2018 ARTHUR J. GALLAGHER & CO. | AJG.COM (in $M) Brokerage & Risk Management See Cautionary Note on page 7 regarding the new revenue recognition accounting standard. See also important disclosures regarding Non-GAAP measures on Page 8. $4,228 $4,596 $4,000 $4,250 $4,500 $4,750 2016 2017 Adjusted Revenues 9% (in $M) 3.1% 4.5% 1.0% 2.0% 3.0% 4.0% 5.0% 2016 2017 Total Organic Growth $1,070 $1,183 $1,000 $1,050 $1,100 $1,150 $1,200 $1,250 2016 2017 Adjusted EBITDAC 11% 25.3% 25.8% 24.5% 25.0% 25.5% 26.0% 2016 2017 Adjusted EBITDAC Margin |
 15 18CORP23863J ©2018 ARTHUR J. GALLAGHER & CO. | AJG.COM (in $M) Net Earnings from Clean Energy Investments *Excludes a non-cash after tax gain of $14.1m from a re-consolidation accounting gain, related to clean-energy investments, recorded in 2014. -$4.8 $7.5 $3.9 $32.7 $63.7 $90.5 $100.9 $114.4 $132.7 -$10 $0 $10 $20 $30 $40 $50 $60 $70 $80 $90 $100 $110 $120 $130 $140 2009 2010 2011 2012 2013 2014* 2015 2016 2017 |
 16 18CORP23863J ©2018 ARTHUR J. GALLAGHER & CO. | AJG.COM 1984 2018E $1.64* Dividends Per Share *Indicated – On January 24, 2018, Gallagher’s Board of Directors declared a $0.41 per share first-quarter 2018 dividend. $0.00 $0.20 $0.40 $0.60 $0.80 $1.00 $1.20 $1.40 $1.60 $1.80 |
 17 18CORP23863J ©2018 ARTHUR J. GALLAGHER & CO. | AJG.COM 9% adjusted revenue growth 4.5% total organic growth 11% adjusted EBITDAC growth 46 bps margin improvement 2017 Business Highlights Brokerage & Risk Management Combined See Cautionary Note on page 7 regarding the new revenue recognition accounting standard. See also important disclosures regarding Non-GAAP measures on Page 8. |
 18 18CORP23863J ©2018 ARTHUR J. GALLAGHER & CO. | AJG.COM $172.3m in acquired revenues +39 additional – average $4.4m in revenue ~8.0x EBITDAC Fair valuations tuck-in opportunities Focus on 2017 Business Highlights Mergers & Acquisitions See Cautionary Note on page 7 regarding the new revenue recognition accounting standard. See also important disclosures regarding Non-GAAP measures on Page 8. |
 19 18CORP23863J ©2018 ARTHUR J. GALLAGHER & CO. | AJG.COM $132.7m of net earnings 16% increase in net earnings over 2016 2017 Business Highlights Clean Energy |
 20 18CORP23863J ©2018 ARTHUR J. GALLAGHER & CO. | AJG.COM Global M&A integration Completed Australia/New Zealand & Canada Completed U.K. retail 2017 integration costs less than a third of 2016 costs 2017 Business Highlights All while accomplishing… |
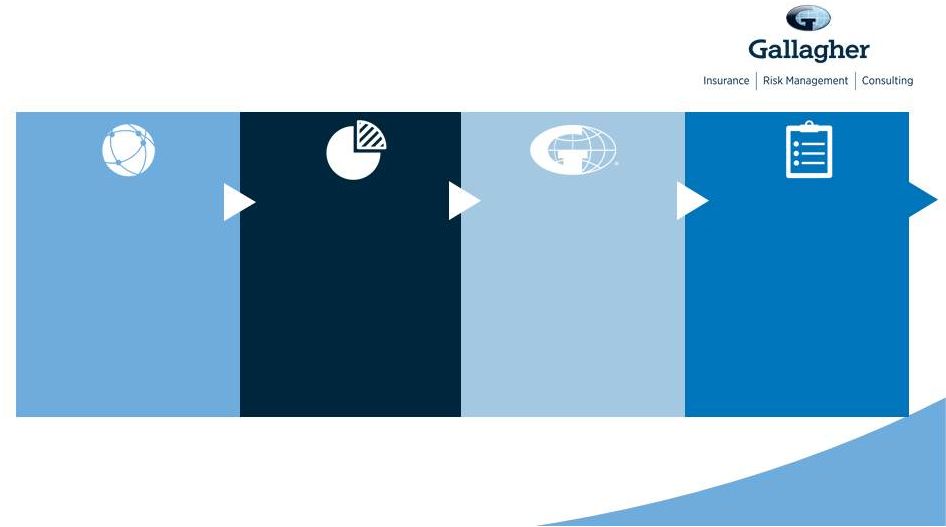
 21 18CORP23863J ©2018 ARTHUR J. GALLAGHER & CO. | AJG.COM Where We Are Going BROKERAGE SEGMENT • Improving new business production • Continuing tuck-in M&A • Increasing global brand recognition • Leveraging internal resources and processes across divisions • To be premier provider of claims management services with superior outcomes • Increasing global presence in claims space • U.S. clients with global operations • Expanding via M&A/new partners • Staying in front of improving technology • Increasing brand recognition globally • Leveraging resources across borders RISK MANAGEMENT SEGMENT |
 22 18CORP23863J ©2018 ARTHUR J. GALLAGHER & CO. | AJG.COM Commercial P&C Pricing Shows Shallow Cycle Commercial Rate Index reflects the cost of P&C premiums relative to the year 2000. Constructed using Counsel of Insurance Agents and Brokers (CIAB) data. CPI index uses data from the Bureau of Labor Statistics. CPI 142 Rates 91 80 90 100 110 120 130 140 150 160 |
 23 18CORP23863J ©2018 ARTHUR J. GALLAGHER & CO. | AJG.COM Shows Shallow Pricing Cycle -2.9% -0.1% 0.9% 2.7% 4.4% 4.3% 3.9% 5.0% 5.2% 4.3% 3.4% 2.1% 1.5% -0.5% 0.1% -0.7% -2.3% -3.3% -3.1% -2.8% -3.7% -3.9% -3.2% -3.3% -2.5% -2.8% -1.3% 0.3% -6.0% -4.0% -2.0% 0.0% 2.0% 4.0% 6.0% CIAB – Change in Average Commercial Rates |
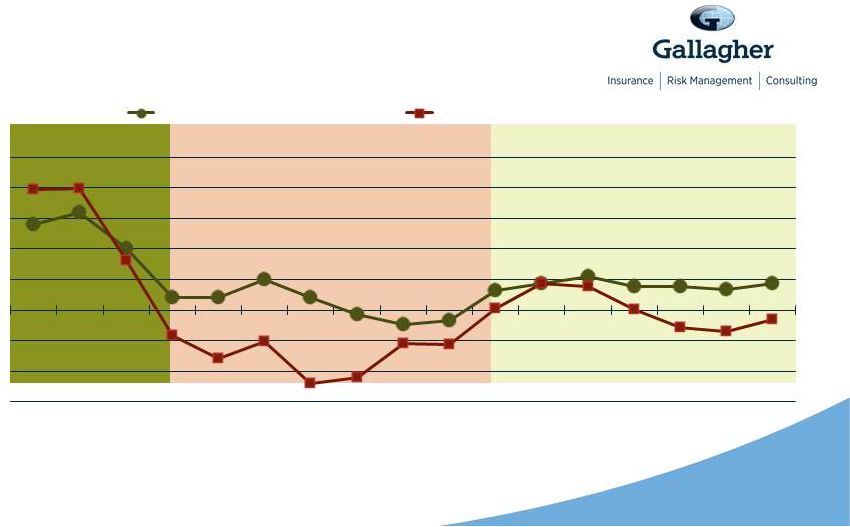 24 18CORP23863J ©2018 ARTHUR J. GALLAGHER & CO. | AJG.COM Hard Market Shallow Market CIAB Sales Culture Performs Through Cycle CIAB is the 4 quarter average. Gallagher’s Brokerage Segment Organic Growth excluding Contingent Commissions. See Cautionary Note on page 7 regarding the new revenue recognition accounting standard. See also important disclosures regarding Non-GAAP measures on Page 8. 14.0% 16.0% 10.0% 2.0% 2.0% 5.0% 2.0% -0.8% -2.4% -1.7% 3.1% 4.4% 5.6% 3.8% 3.8% 3.4% 4.4% 19.8% 19.8% 8.1% -4.1% -8.0% -5.2% -12.1% -11.0% -5.4% -5.6% 0.2% 4.4% 3.8% 0.1% -2.9% -3.5% -1.6% -15.0% -10.0% -5.0% 0.0% 5.0% 10.0% 15.0% 20.0% 25.0% 2001 2003 2005 2007 2009 2011 2013 2015 2017 Gallagher Brk Organic CIAB - Change in Avg. Commercial Rates Soft Market AJG Brk Organic |
 25 18CORP23863J ©2018 ARTHUR J. GALLAGHER & CO. | AJG.COM CLIENTS CARRIERS & BROKERS Shallow Rate Cycle Is Better for: |
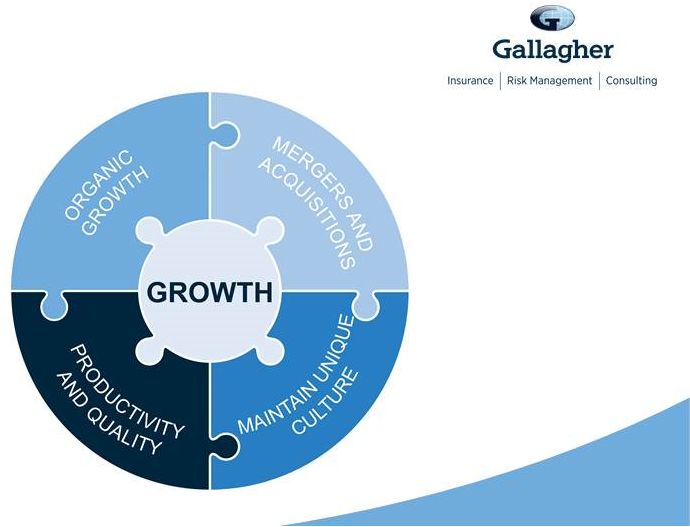 26 18CORP23863J ©2018 ARTHUR J. GALLAGHER & CO. | AJG.COM Consistent Growth Strategy |
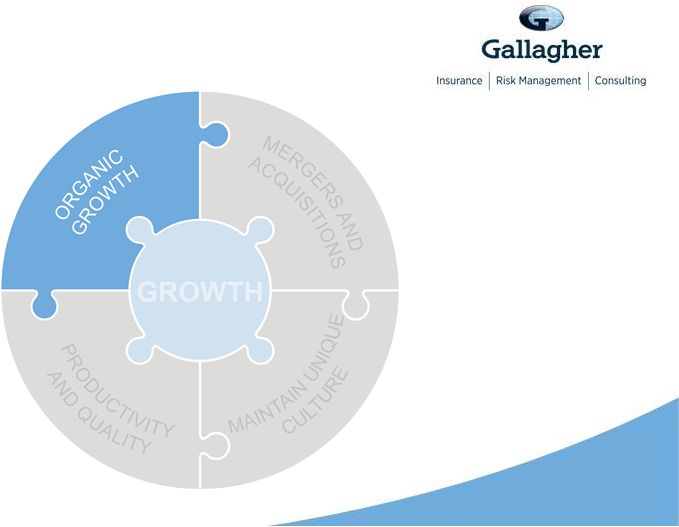 27 18CORP23863J ©2018 ARTHUR J. GALLAGHER & CO. | AJG.COM Consistent Growth Strategy – Organic |
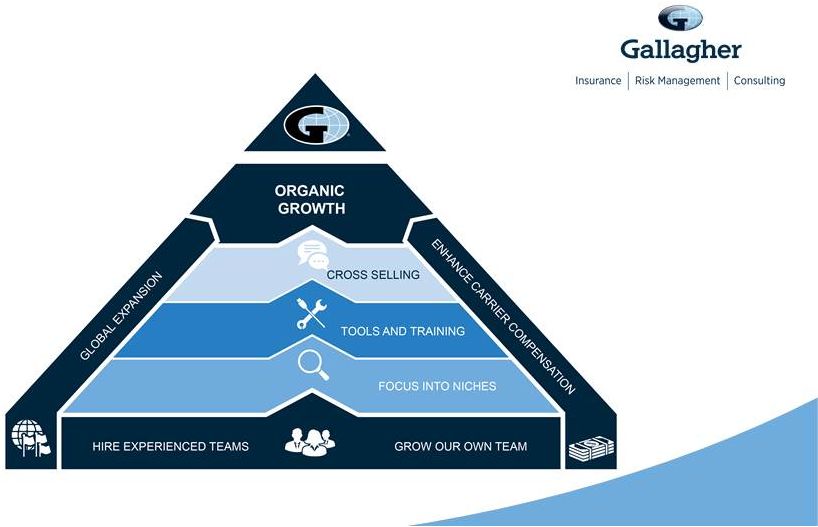 28 18CORP23863J ©2018 ARTHUR J. GALLAGHER & CO. | AJG.COM Driving Brokerage Organic Growth |
 29 18CORP23863J ©2018 ARTHUR J. GALLAGHER & CO. | AJG.COM Aviation Automotive Affinity Real Estate/ Hospitality Global Risks Construction Personal Marine Higher Education Healthcare Environmental Entertainment Energy Private Client Public Entity Religious Restaurant Technology Trade Credit/ Political Risk Transportation Financial Institutions K12 Education Not-for-Profit Equity Advisors Food/Agribusiness Life Sciences Law Firms Niche Expertise Teams – Brokerage |
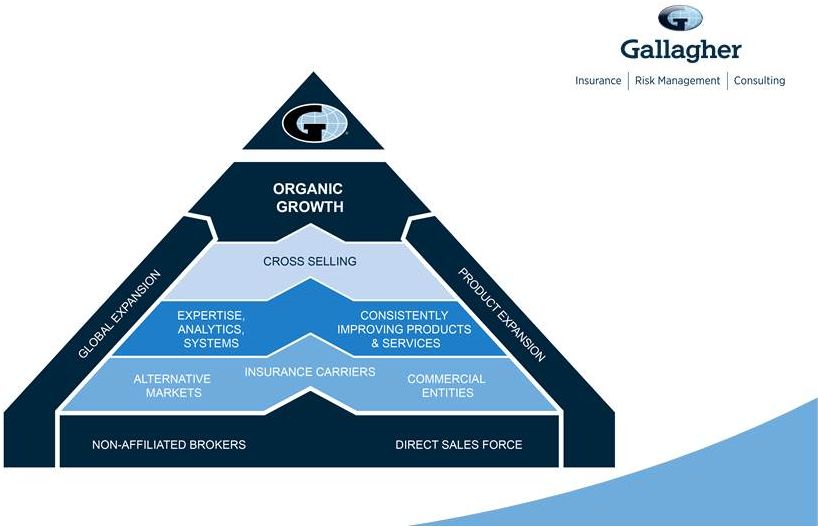 30 18CORP23863J ©2018 ARTHUR J. GALLAGHER & CO. | AJG.COM Driving Risk Management Organic Growth |
 31 18CORP23863J ©2018 ARTHUR J. GALLAGHER & CO. | AJG.COM ALTERNATIVE MARKET PARTICIPANTS LARGE COMMERCIAL ENTITIES PUBLIC SECTOR ENTITIES INSURANCE CARRIERS Risk Management Growth Focuses on Four Market Segments |
 32 18CORP23863J ©2018 ARTHUR J. GALLAGHER & CO. | AJG.COM Consistent Growth Strategy – M&A |
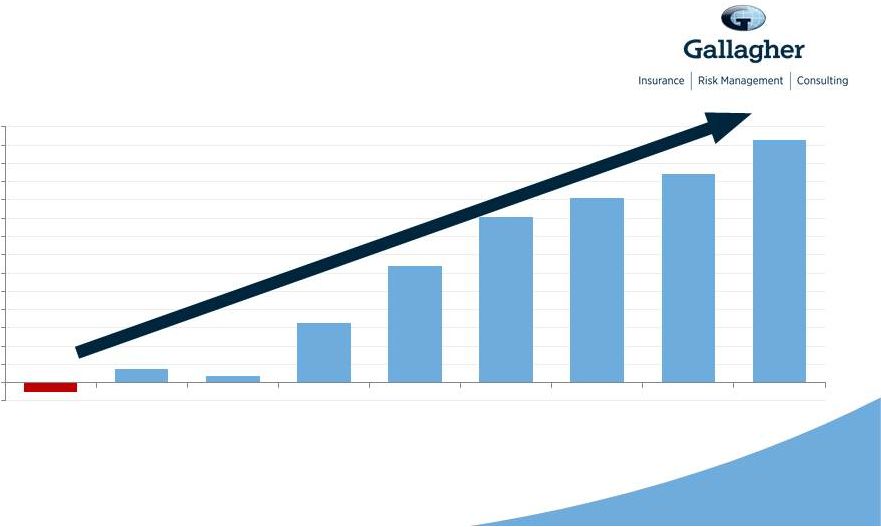
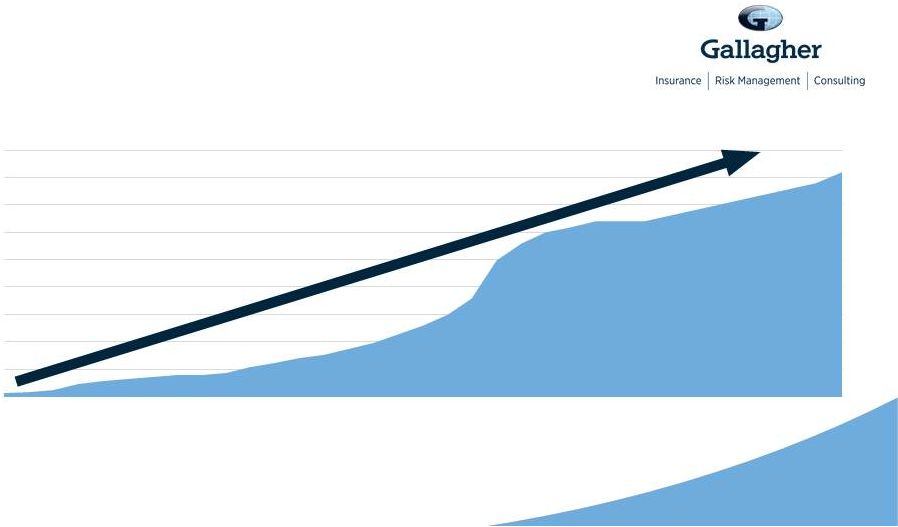
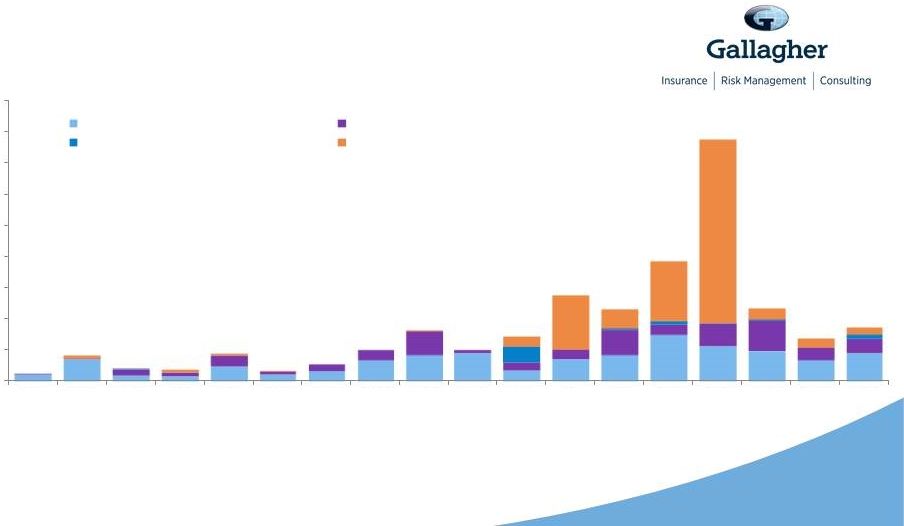 33 18CORP23863J ©2018 ARTHUR J. GALLAGHER & CO. | AJG.COM Acquisition Revenue Growth Annualized Revenues Acquired (in $M’s) See Cautionary Note on page 7 regarding the new revenue recognition accounting standard. $0 $100 $200 $300 $400 $500 $600 $700 $800 $900 2000 2001 2002 2003 2004 2005 2006 2007 2008 2009 2010 2011 2012 2013 2014 2015 2016 2017 Domestic Property & Casualty Employee Benefits Risk Management Foreign Property & Casualty |
 Vast Pipeline Domestic and international markets highly fragmented 18,000+ agents/ brokers just in the U.S. Need Gallagher’s expertise Baby boomers looking for exit strategy Acquisition Units Retail P&C Wholesale Benefits International MGA/MGU Captive TPA Limited Consolidators Core Competency Culture Proven history Ability to integrate M&A Opportunities Continue 34 18CORP23863J ©2018 ARTHUR J. GALLAGHER & CO. | AJG.COM |
 Platforms In Place for Bolt-on M&A 35 18CORP23863J ©2018 ARTHUR J. GALLAGHER & CO. | AJG.COM |
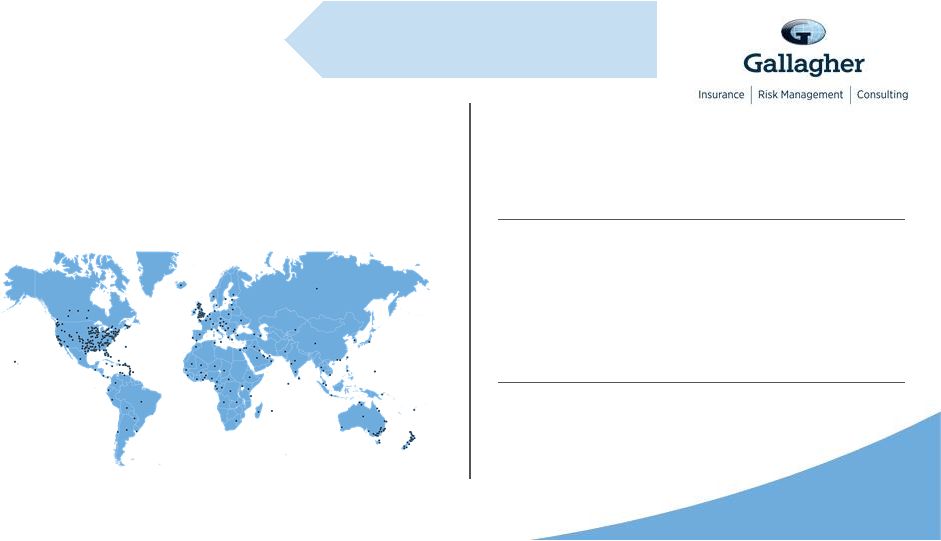
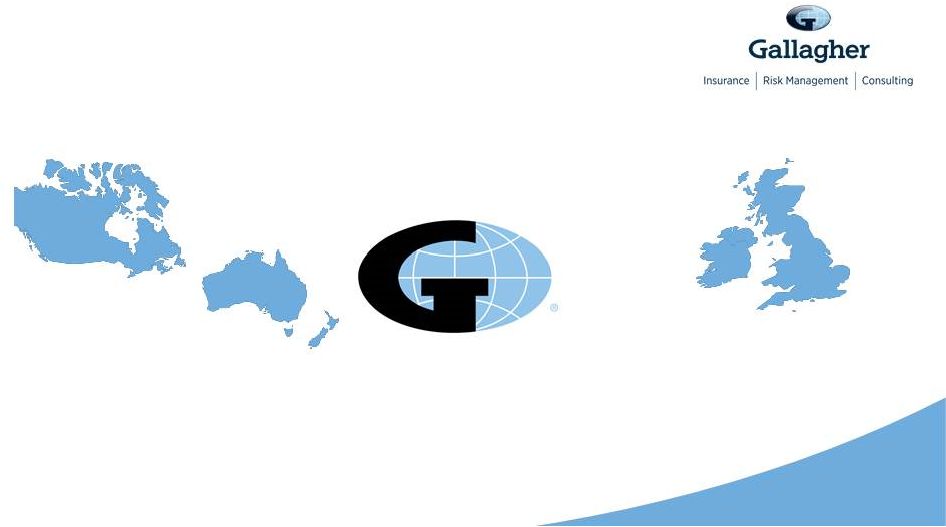
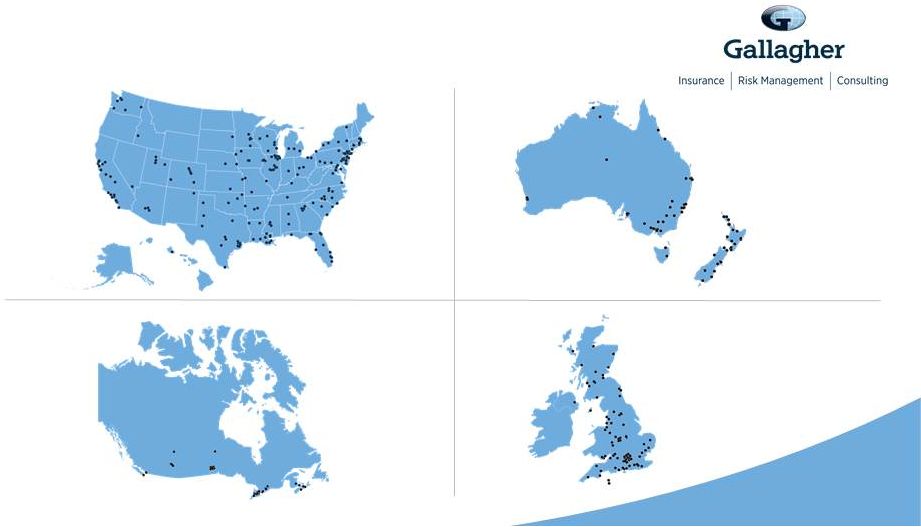
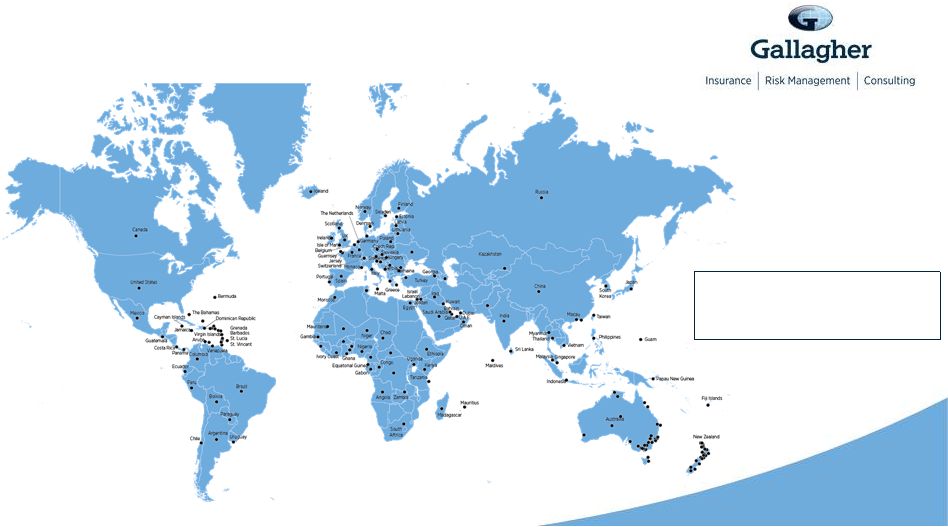 Client Capabilities in 150 Countries International Correspondent Broker Network 36 18CORP23863J ©2018 ARTHUR J. GALLAGHER & CO. | AJG.COM |
 37 18CORP23863J ©2018 ARTHUR J. GALLAGHER & CO. | AJG.COM Productivity and Quality Initiatives |
 38 18CORP23863J ©2018 ARTHUR J. GALLAGHER & CO. | AJG.COM Building Productivity Tools – DMS and Workflow Optimizing Real Estate Footprint Investing in Business Intelligence Leveraging Sales Force Management Tools CONTINUE TO IMPROVE PRODUCTIVITY AND QUALITY Utilizing Centers of Excellence Harmonizing Systems Utilizing Sourcing to Manage Expenses Standardizing Processes Focus Continues: Optimizing Productivity & Quality |
 39 18CORP23863J ©2018 ARTHUR J. GALLAGHER & CO. | AJG.COM Benefits Continue: From Centers of Excellence Foster Innovation Increase Speed to Market Reduce Costs Focus on Core Improve Quality |
 Behind the Scenes Efforts Centers of Excellence Update We now have more than 3,500 associates in three locations 40 18CORP23863J ©2018 ARTHUR J. GALLAGHER & CO. | AJG.COM |
 Policy checking Policy issuance Certificates of insurance Renewal support Accounting support Claims support Behind the Scenes Efforts Centers of Excellence Update Responsible for processes such as: 41 18CORP23863J ©2018 ARTHUR J. GALLAGHER & CO. | AJG.COM |
 Substantially improved quality Reduced both operating and E&O costs Easy for new acquisition partners to leverage Behind the Scenes Efforts Centers of Excellence Update 42 18CORP23863J ©2018 ARTHUR J. GALLAGHER & CO. | AJG.COM |
 43 18CORP23863J ©2018 ARTHUR J. GALLAGHER & CO. | AJG.COM Brokerage Risk Management Reduced Adjusted Operating Expense Ratio See Cautionary Note on page 7 regarding the new revenue recognition accounting standard. See also important disclosures regarding Non-GAAP measures on Page 8. 20.8% 15.6% 14.0% 15.0% 16.0% 17.0% 18.0% 19.0% 20.0% 21.0% 22.0% 2008 2017 27.0% 24.6% 23.0% 24.0% 25.0% 26.0% 27.0% 28.0% 2008 2017 |
 44 18CORP23863J ©2018 ARTHUR J. GALLAGHER & CO. | AJG.COM Brokerage & Risk Management Adjusted EBITDAC Margin See Cautionary Note on page 7 regarding the new revenue recognition accounting standard. See also important disclosures regarding Non-GAAP measures on Page 8. 20.4% 21.2% 22.1% 23.6% 24.5% 25.3% 25.8% 18.0% 19.0% 20.0% 21.0% 22.0% 23.0% 24.0% 25.0% 26.0% 27.0% 2011 2012 2013 2014 2015 2016 2017 |
 Relentless Focus on Quality and Customer Service Best Companies for Leaders – 2016 CHIEF EXECUTIVE MAGAZINE UK Group Risk Adviser of the Year – 2017 UK CORPORATE ADVISER Best UK Employee Benefit Consultant – 2016 REWARD GUIDE VIB AWARDS CEREMONY Shilling Named Best Member Communication Strategy – 2016 UK CORPORATE ADVISER Best Sales/Leadership Program (non-store/restaurant) – 2016 LEADERSHIP EXCELLENCE – PART OF HR.COM UK Insurance Broker of the Year – 2017 2017 REACTIONS LONDON MARKET AWARDS Caribbean Broker of the Year – 2017 2017 REACTIONS LATIN AMERICA AWARDS A Top “Best Culture” Company in Metro Chicago – 2017 USA TODAY Best Casualty Claims Handling Insured/TPA – 2017 ADVISEN CLAIMS SATISFACTION SURVEY 45 18CORP23863J ©2018 ARTHUR J. GALLAGHER & CO. | AJG.COM |
 46 18CORP23863J ©2018 ARTHUR J. GALLAGHER & CO. | AJG.COM Maintaining Culture |
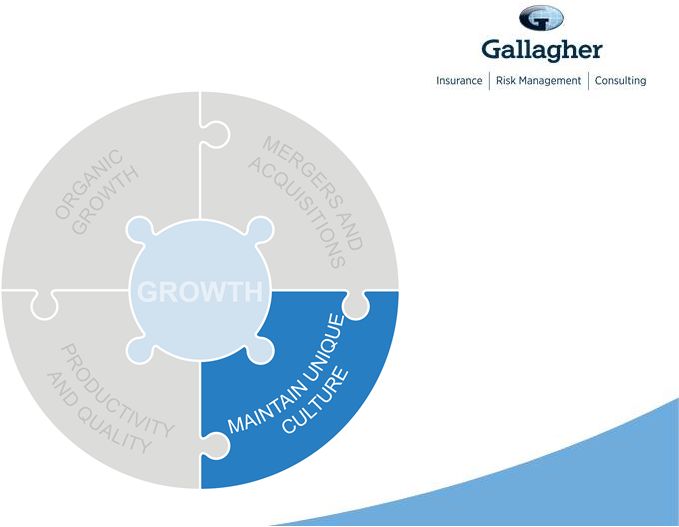
 The Gallagher Way since 1927 Maintain Unique Culture 47 18CORP23863J ©2018 ARTHUR J. GALLAGHER & CO. | AJG.COM |
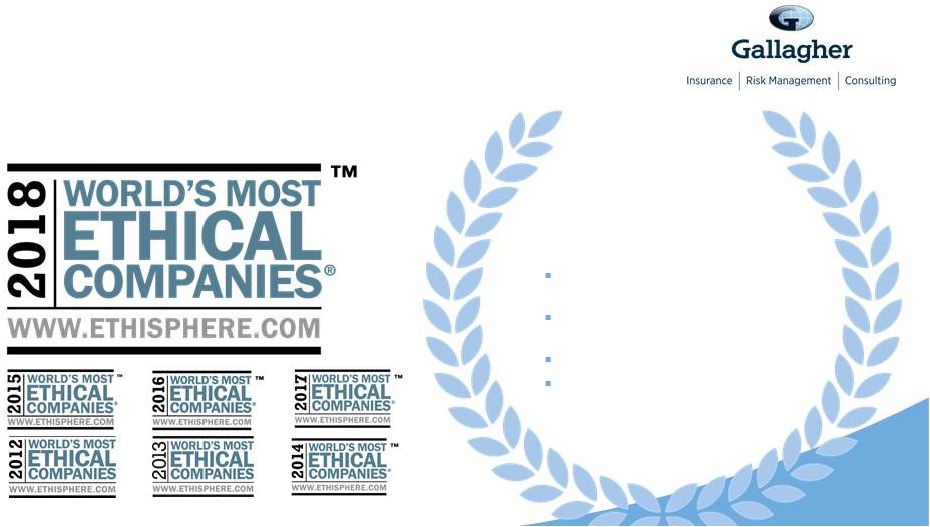 48 18CORP23863J ©2018 ARTHUR J. GALLAGHER & CO. | AJG.COM One of the World’s Most Ethical Companies as Recognized by Ethisphere seven years in a row • Industry-leading commitment to ethics and dedication to integrity • Chosen for: Promoting ethical business standards and practices Exceeding legal compliance standards Innovating to benefit the public Demonstrating that corporate citizenship is tied to company success |
 Why Invest? • Right management • Unique culture • Proven growth strategy • Continuing M&A opportunities • Increasing productivity/quality • Good use of leverage • Strong balance sheet • Excellent return to shareholders You Believe Our Company Has: GALLAGHER IS WELL-POSITIONED FOR FUTURE GROWTH 49 18CORP23863J ©2018 ARTHUR J. GALLAGHER & CO. | AJG.COM |
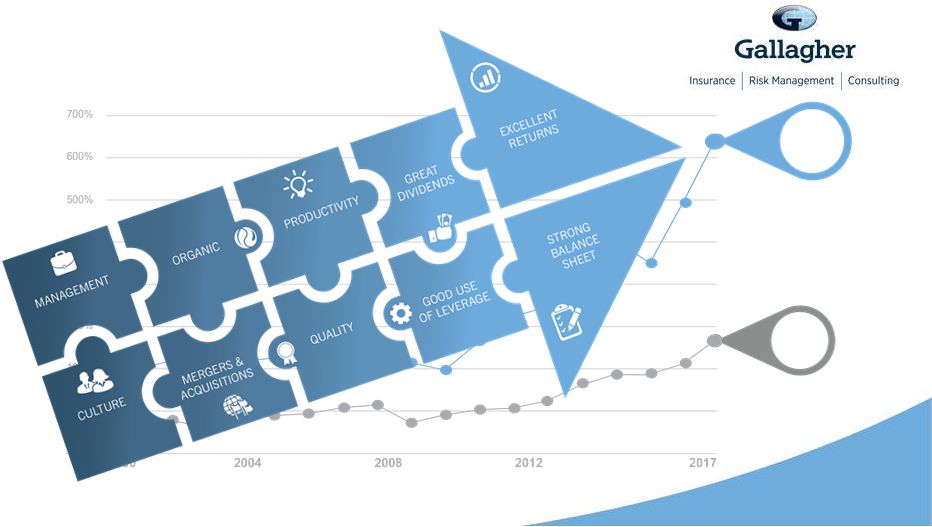 S&P 500 158 % 641 % AJG Why Invest? We Are Just Getting Started! Source for data: Bloomberg. Total returns from 1/1/2000 – 12/31/2017 include reinvestment of dividends. 50 18CORP23863J ©2018 ARTHUR J. GALLAGHER & CO. | AJG.COM |
 51 18CORP23863J ©2018 ARTHUR J. GALLAGHER & CO. | AJG.COM Additional Information: Ray Iardella Vice President, Investor Relations Ray_Iardella@ajg.com Phone: 630 285-3661 |