 |
Forward-Looking Statements
This presentation contains forward-looking statements within the meaning of Section 27A of the Securities Act of 1933, as amended, and Section 21E of the Securities Exchange Act of 1934, as amended. These forward-looking statements are based on Alico’s current expectations about future events and can be identified by terms such as “estimates,” “plans,” “expect,” “may,” “anticipate,” “intend,” “should be,” “will be,” “is likely to,” “strive to,” and similar expressions referring to future periods.
Alico believes the expectations reflected in the forward-looking statements are reasonable but cannot guarantee future results, level of activity, performance or achievements. Actual results may differ materially from those expressed or implied in the forward-looking statements. Therefore, Alico cautions you against relying on any of these forward-looking statements. Factors which may cause future outcomes to differ materially from those foreseen in forward-looking statements include, but are not limited to: changes in laws, regulations and rules; weather conditions that affect production, transportation, storage, import and export of fresh product; increased pressure from disease, insects and other pests; disruption of water supplies or changes in water allocations; pricing and supply of raw materials and products; market responses to industry volume pressures; pricing and supply of energy; changes in interest rates; availability of financing for land development activities; political changes and economic crises; international conflict; acts of terrorism; labor disruptions; inability to pay debt obligations; inability to engage in certain transactions due to restrictive covenants in debt instruments; government restrictions on land use; market and pricing risks due to concentrated ownership of stock. Other risks and uncertainties include those that are described in Alico’s SEC filings, which are available on the SEC’s website at http://www.sec.gov. Alico undertakes no obligation to subsequently update or revise the forward-looking statements made in this presentation, except as required by law.
| 2 |
|
Company Highlights
| • | Agribusiness company with an emphasis on citrus |
| • | A leading citrus grower in Florida with 11,000 acres |
| – | Increasing yields |
| – | Decreasing unit production costs |
| – | Significant industry expertise |
| • | Favorable Florida citrus market outlook |
| • | Planned investment in additional citrus groves |
| • | Other land holdings presently used for: |
| – | Sugarcane |
| – | Cattle |
| – | Leasing and development |
| • | Debt to equity ratio of .42 and substantial availability under LOC |
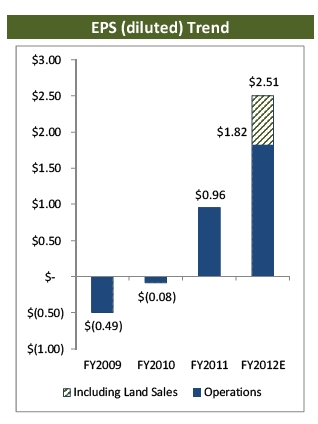
| • | Strong growth in EPS |
| 3 |
|
Quick Overview of Alico, Inc.
| • | Formed in 1960 as a land management company operating in central and southwest Florida |
| • | Owns approximately 140,000 acres in five Florida counties |
| • | Agricultural lines of business include Citrus Groves, Citrus Supply Chain Management, Sugarcane and Cattle |
| • | Other operations include land leasing, rock and sand mining, mineral and oil leasing and real estate development |
| 4 |
|
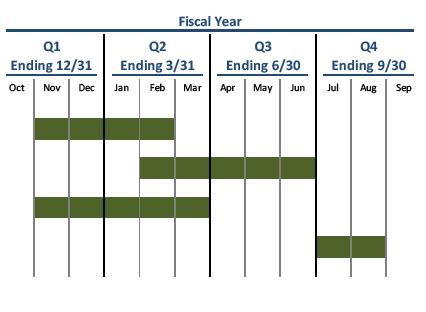
Company Revenue Cycles
Harvest Early/Mid Varieties of Oranges
Harvest Valencia Oranges
Harvest Sugarcane
Deliver Beef Cattle
| 5 |
|
| Consolidated Financial Summary Three Year Trend |
| (in millions, except per share data) |
| Fiscal Years Ended September 30, | ||||||||||||
| 2009 | 2010 | 2011 | CAGR | |||||||||
| Operating Revenue | $ | 89.5 | $ | 79.8 | $ | 98.6 | 3.3 | % | ||||
| Operating Expense | 87.7 | 69.9 | 75.2 | -5.0 | % | |||||||
| Gross Profit | 1.8 | 9.9 | 23.4 | 133.6 | % | |||||||
| General and Administrative Expenses | 9.1 | 6.5 | 8.2 | -3.4 | % | |||||||
| Operating Income | (7.3 | ) | 3.5 | 15.2 | 228.0 | % | ||||||
| Interest and Investment Income (Loss), net | 0.6 | 0.9 | (1.4 | ) | -232.3 | % | ||||||
| Interest Expense | (5.4 | ) | (6.9 | ) | (2.0 | ) | 28.1 | % | ||||
| Other Income, Net | 8.6 | 0.7 | 0.7 | -57.0 | % | |||||||
| Income Tax (Provision) Benefit | (0.2 | ) | 1.2 | (5.4 | ) | 222.4 | % | |||||
| Net Income (Loss) | $ | (3.6 | ) | $ | (0.6 | ) | $ | 7.1 | 224.8 | % | ||
| EPS | $ | (0.49 | ) | $ | (0.08 | ) | $ | 0.96 | 225.1 | % | ||
| 6 |
|
Consolidated Financial Summary
First Half FY2012
(in millions, except per share data)
| Six Months Ended March 31, | |||||||||||
| 2011 | 2012 | % Change | |||||||||
| Operating Revenue | $ | 53.0 | $ | 80.2 | 51 | % | |||||
| Operating Expense | 42.5 | 60.4 | 42 | % | |||||||
| Gross Profit | 10.6 | 19.8 | 88 | % | |||||||
| General and Administrative Expenses | 3.6 | 3.9 | 7 | % | |||||||
| Operating Income | 7.0 | 16.0 | 129 | % | |||||||
| Interest and Investment Income (Loss), net | (1.7 | ) | 0.0 | -102 | % | ||||||
| Interest Expense | (1.1 | ) | (0.9 | ) | -13 | % | |||||
| Other Income, Net | 0.1 | 0.0 | -44 | % | |||||||
| Income Tax (Provision) Benefit | (1.6 | ) | (5.7 | ) | 258 | % | |||||
| Net Income (Loss) | $ | 2.6 | $ | 9.3 | 257 | % | |||||
| EPS | $ | 0.36 | $ | 1.27 | 253 | % | |||||
| 7 |
|
Citrus Market Overview
| • | Total U.S. orange production – 206 million(i)boxes |
| • | Total Florida orange production – 146 million(i)boxes |
| – | Alico grows and harvests approximately 4.4 million boxes of oranges and 0.2 million boxes of grapefruit and other specialty fruit |
| – | Alico handles approximately 3.5 million boxes grown by others thru its supply chain management arm |
| – | Grows, harvests and handles ~5% of Florida production |
| • | Florida production expected to remain relatively flat over next 10 years |
| • | Florida shortfalls in production covered by imports from Brazil to meet demand |
| • | Opportunity for Alico to expand citrus operations |
| – | One of the top ten growers in Florida(ii) |
(i) Source – USDA June 2012 Forecast
(ii) Source – Florida Grower Magazine
| 8 |
|
Industry Trends
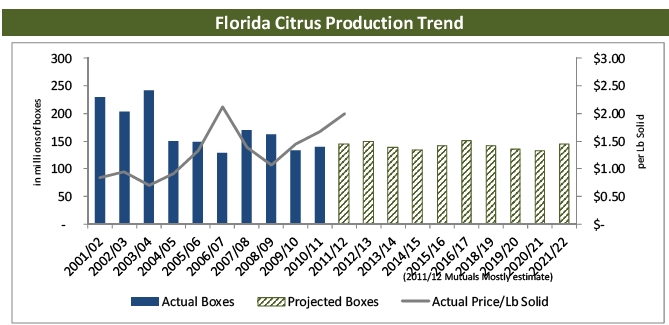
Sources – Florida Agricultural Statistics Service, Allen Morris
| 9 |
|
Industry Trends

Sources – Florida Agricultural Statistics Service, Allen Morris
| 10 |
|
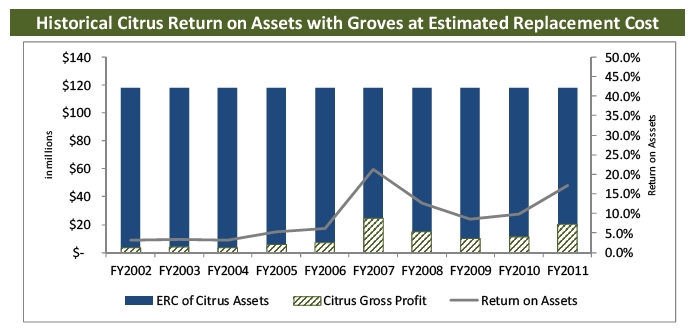
Alico’s Historical Citrus Returns
| 11 |
|
Alico’s Historical Citrus Returns
| 12 |
|
Leading Citrus Grower
Production Increases
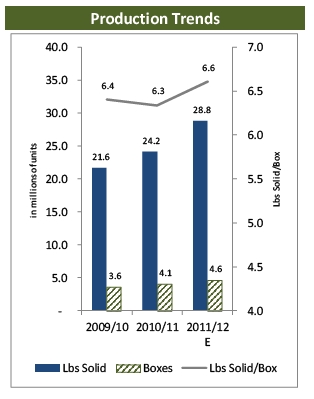
| • | Alico production increases over last two harvest seasons: |
| – | 28% increase in boxes(i) |
| – | 33% increase in Lbs Solid(i) |
| • | Florida production up 9.3% in boxes over the same time period(ii) |
| • | Outpaced Florida’s box increases due in large part to: |
| – | Expertise in foliar nutritional programs |
| – | Proficiency in farming methods |
(i) Source – Internal Estimates for 2011/12 Crop Year
(ii) Source – USDA June 2012 Forecast
| 13 |
|
Leading Citrus Grower
Production Costs Per Box
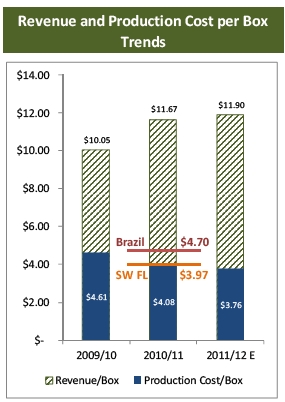
| • | Alico production costs per box: |
| – | 18%(i)decrease in cost per box over last two harvest seasons |
| – | Lower production costs per box than Brazil average(ii) |
| – | Expect lower 2011/12 production costs per box than southwest Florida region average(iii) |
(i) Source – Internal Estimates for 2011/12 Crop Year
(ii) GCONCI (2010/11 Estimates)
(iii) Source – University of Florida/IFAS (2010/11 Estimates)
| 14 |
|
Leading Citrus Grower
Significant Industry/Management Experience
| • | JD Alexander, CEO – Over 30 years experience in Florida citrus |
| • | Dr. Ken Smith, COO – Over 23 years in agriculture |
| • | Daniel Sutton, Director of Citrus Operations – Over 18 years experience in Florida citrus |
| • | Chris Moore, President of Bowen Brothers – Over 20 years experience in Florida citrus |
| • | Mark Humphrey, CFO – Over 17 years experience in finance |
| 15 |
|
Revenue and Gross Profit by Segment
Three Year Trend
(in millions)
| Fiscal Years Ended September 30, | |||||||||||||||
| 2009 | 2010 | 2011 | CAGR | ||||||||||||
| Revenue: | |||||||||||||||
| Bowen (Citrus Supply Chain Management) | $ | 28.0 | $ | 28.9 | $ | 36.1 | 8.9 | % | |||||||
| Citrus Groves | 36.0 | 36.5 | 47.1 | 9.3 | % | ||||||||||
| Sugarcane | 7.6 | 4.1 | 7.8 | 0.7 | % | ||||||||||
| Cattle | 8.2 | 4.0 | 4.6 | -17.5 | % | ||||||||||
| Real Estate | 1.4 | - | - | -100.0 | % | ||||||||||
| Land Leasing and Rental | 2.7 | 2.4 | 2.4 | -3.3 | % | ||||||||||
| Land Sales and Other | 5.6 | 3.9 | 0.5 | -54.0 | % | ||||||||||
| Total Revenue | $ | 89.5 | $ | 79.8 | $ | 98.6 | 3.3 | % | |||||||
| Gross Profit: | |||||||||||||||
| Bowen (Citrus Supply Chain Management) | $ | 1.3 | $ | 0.7 | $ | 1.0 | -9.1 | % | |||||||
| Citrus Groves | 8.7 | 10.7 | 19.3 | 30.3 | % | ||||||||||
| Sugarcane | (2.2 | ) | 0.4 | 1.0 | 176.1 | % | |||||||||
| Cattle | (2.0 | ) | 0.3 | 1.4 | 190.1 | % | |||||||||
| Real Estate | (3.9 | ) | (1.6 | ) | (0.6 | ) | 46.8 | % | |||||||
| Land Leasing and Rental | 1.6 | 1.3 | 1.2 | -8.3 | % | ||||||||||
| Land Sales and Other | (1.8 | ) | (1.8 | ) | 0.1 | 135.5 | % | ||||||||
| Total Gross Profit | $ | 1.8 | $ | 9.9 | $ | 23.4 | 133.6 | % | |||||||
| 16 |
|
Revenue and Gross Profit by Segment
First Half FY2012
(in millions)
| Six Months Ended March 31, | |||||||||||
| 2011 | 2012 | %Change | |||||||||
| Revenue: | |||||||||||
| Bowen (Citrus Supply Chain Management) | $ | 18.9 | $ | 30.8 | 62.8 | % | |||||
| Citrus Groves | 24.6 | 33.5 | 36.0 | % | |||||||
| Sugarcane | 7.5 | 13.7 | 83.1 | % | |||||||
| Cattle | 0.4 | 0.6 | 33.6 | % | |||||||
| Real Estate | - | - | NM | ||||||||
| Land Leasing and Rental | 1.3 | 1.3 | 2.2 | % | |||||||
| Land Sales and Other | 0.3 | 0.3 | 12.9 | % | |||||||
| Total Revenue | $ | 53.0 | $ | 80.2 | 51.2 | % | |||||
| Gross Profit: | |||||||||||
| Bowen (Citrus Supply Chain Management) | $ | 0.6 | $ | 1.1 | 83.0 | % | |||||
| Citrus Groves | 8.7 | 14.5 | 67.3 | % | |||||||
| Sugarcane | 0.6 | 3.1 | 398.9 | % | |||||||
| Cattle | 0.2 | 0.3 | 50.8 | % | |||||||
| Real Estate | (0.3 | ) | (0.2 | ) | 11.7 | % | |||||
| Land Leasing and Rental | 0.7 | 0.8 | 19.1 | % | |||||||
| Land Sales and Other | 0.1 | 0.3 | 197.1 | % | |||||||
| Total Gross Profit | $ | 10.6 | $ | 19.8 | 87.6 | % | |||||
| 17 |
|
FY2012 Estimated Citrus Results
| • | 15% increase in production of early/mid varieties versus prior year |
| • | 27% increase in production of Valencias versus prior year |
| • | Production increases due in large part to continually improving farming methods |

| 18 |
|
FY2012 First Half Sugarcane and Cattle Results
| • | Sugarcane |
| – | Revenue of $13.7MM versus $7.5MM last year |
| – | Gross profit of $3.1MM versus $0.6MM last year |
| – | Standard Tons harvested increased 52% |
| • | Cattle |
| – | Revenue of $0.6MM versus $0.4MM last year |
| – | Gross profit of $0.3MM |
| – | Approximately 752M pounds sold (691M pounds last year) |
| – | Price per pound increased 23% |
| 19 |
|
Full Year FY2012 Estimate
| Fiscal Years Ended September 30, | ||||||||||||||||||
| 2009 | 2010 | 2011 | 2012E | CAGR | ||||||||||||||
| Revenue | $ | 89.5 | $ | 98.6 | $ | 79.8 | $ | 125.8 | 8.9 | % | ||||||||
| Gross Profit by Segment: | ||||||||||||||||||
| Bowen (Citrus Supply Chain Management) | 1.3 | 0.7 | 1.0 | 1.2 | -2.7 | % | ||||||||||||
| Citrus Groves | 8.7 | 10.7 | 19.3 | 24.1 | 28.9 | % | ||||||||||||
| Sugarcane | (2.2 | ) | 0.4 | 1.0 | 3.0 | 8.2 | % | |||||||||||
| Cattle | (2.0 | ) | 0.3 | 1.4 | 2.6 | 7.3 | % | |||||||||||
| Real Estate | (3.9 | ) | (1.6 | ) | (0.6 | ) | (0.5 | ) | 40.1 | % | ||||||||
| Land Leasing and Rental | 1.6 | 1.3 | 1.2 | 1.3 | -4.7 | % | ||||||||||||
| Land Sales | - | - | - | 8.2 | NM | |||||||||||||
| Other Operations | (1.8 | ) | (1.8 | ) | 0.1 | 0.3 | 35.8 | % | ||||||||||
| Total Gross Profit | 1.8 | 9.9 | 23.4 | 40.2 | 116.3 | % | ||||||||||||
| General and Administrative Expenses | 9.1 | 6.5 | 8.2 | 8.5 | -1.7 | % | ||||||||||||
| Operating Income | (7.3 | ) | 3.5 | 15.2 | 31.7 | 44.6 | % | |||||||||||
| Interest and Investment Income (Loss), net | 0.6 | 0.9 | (1.4 | ) | - | -100.0 | % | |||||||||||
| Interest Expense | (5.4 | ) | (6.9 | ) | (2.0 | ) | (1.7 | ) | -25.2 | % | ||||||||
| Other Income, Net | 8.6 | 0.7 | 0.7 | - | -100.0 | % | ||||||||||||
| Income Tax (Provision) Benefit | (0.2 | ) | 1.2 | (5.4 | ) | (11.6 | ) | 190.6 | % | |||||||||
| Net Income (Loss) | $ | (3.6 | ) | $ | (0.6 | ) | $ | 7.1 | $ | 18.5 | 50.0 | % | ||||||
| EPS | $ | (0.49 | ) | $ | (0.08 | ) | $ | 0.96 | $ | 2.51 | 50.4 | % | ||||||
| 20 |
|
Alico’s Strategic Assessment
Citrus
| • | Brands require Florida oranges |
| – | Tropicana and Minute Maid |
| • | Highest priced |
| • | Consumer preferred |
| • | Grown to over half the orange juice market |
| • | Marketers need to partner with Florida producers |
| – | Long-term marketing agreements |
| • | Volume and price incentives |
| – | Require stable and efficient growers |
| • | Growers bear all risks |
| – | Pricing |
| – | Weather/Diseases |
| • | Relatively high long-term expected returns |
Sugarcane
| • | Government supported industry |
| • | Most profitably grown on muck soils |
| • | Lower long-term expected returns |
Cattle
| • | Supply levels generally dictate pricing |
| • | Lower long-term expected returns |
| 21 |
|
Strategic Vision and Initiatives
| • | Market and sell under-productive assets |
| • | Invest in citrus groves to increase citrus production and partner with marketers |
| – | Plant groves on owned land |
| – | 10,000 additional acres |
| – | Acquire groves in Florida |
| – | 10,000 additional acres |
| Current Land Utilization: | Gross Acreage | Net Producing | ||||
| Citrus Groves | 15,000 | 10,700 | ||||
| Sugarcane | 30,000 | 18,800 | ||||
| Developable Acreage (Lee County) | 5,200 | - | ||||
| Improved Pasture | 10,000 | - | ||||
| Unimproved Acreage and Other | 79,400 | - | ||||
| Total | 139,600 | 29,500 |
| 22 |