Exhibit 99.2
| CVB FINANCIAL CORP. 1 Chris Myers |
| Safe Harbor Certain matters set forth herein (including the exhibits hereto) constitute forward-looking statements within the meaning of the Private Securities Litigation Reform Act of 1995, including forward-looking statements relating to the Company's current business plan and expectations regarding future operating results. These forward-looking statements are subject to risks and uncertainties that could cause actual results, performance or achievements to differ materially from those projected. These risks and uncertainties include, but are not limited to, local, regional, national and international economic conditions and events and the impact they may have on us and our customers; ability to attract deposits and other sources of liquidity; oversupply of inventory and continued deterioration in values of California real estate, both residential and commercial; a prolonged slowdown in construction activity; changes in the financial performance and/or condition of our borrowers; changes in the level of non- performing assets and charge-offs; ability to repurchase our securities issued to the U.S. Treasury pursuant to its Capital Purchase Program; the effect of changes in laws and regulations (including laws and regulations concerning taxes, banking, securities, executive compensation and insurance) with which we and our subsidiaries must comply; changes in estimates of future reserve requirements based upon the periodic review thereof under relevant regulatory and accounting requirements; inflation, interest rate, securities market and monetary fluctuations; political instability; acts of war or terrorism, or natural disasters, such as earthquakes, or the effects of pandemic flu; the timely development and acceptance of new banking products and services and perceived overall value of these products and services by users; changes in consumer spending, borrowing and savings habits; technological changes; the ability to increase market share and control expenses; changes in the competitive environment among financial and bank holding companies and other financial service providers; continued volatility in the credit and equity markets and its effect on the general economy; the effect of changes in accounting policies and practices, as may be adopted by the regulatory agencies, as well as the Public Company Accounting Oversight Board, the Financial Accounting Standards Board and other accounting standard setters; changes in our organization, management, compensation and benefit plans; the costs and effects of legal and regulatory developments including the resolution of legal proceedings or regulatory or other governmental inquiries and the results of regulatory examinations or reviews; our success at managing the risks involved in the foregoing items and other factors set forth in the Company's public reports including its Annual Report on Form 10-K for the year ended December 31, 2009, and particularly the discussion of risk factors within that document. The Company does not undertake, and specifically disclaims any obligation to update any forward-looking statements to reflect occurrences or unanticipated events or circumstances after the date of such statements except as required by law. 2 |
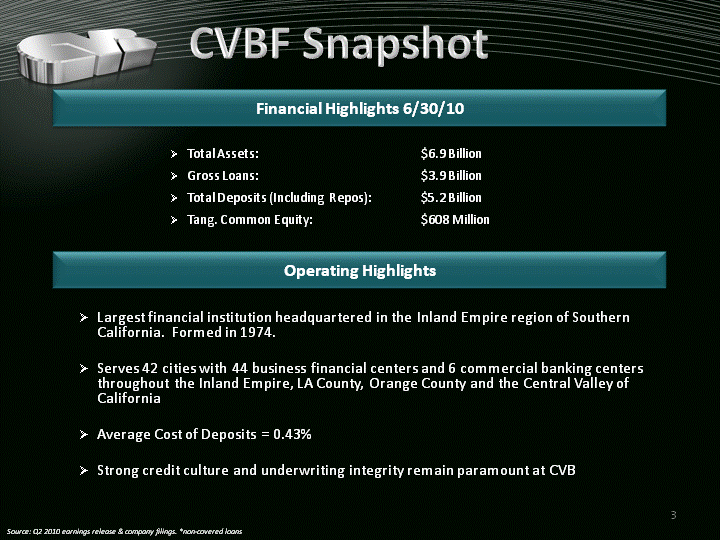
| 3 Total Assets: $6.9 BillionGross Loans: $3.9 BillionTotal Deposits (Including Repos): $5.2 BillionTang. Common Equity: $608 Million Source: Q2 2010 earnings release & company filings. *non-covered loans Operating Highlights Financial Highlights 6/30/10 Largest financial institution headquartered in the Inland Empire region of Southern California. Formed in 1974.Serves 42 cities with 44 business financial centers and 6 commercial banking centers throughout the Inland Empire, LA County, Orange County and the Central Valley of CaliforniaAverage Cost of Deposits = 0.43% Strong credit culture and underwriting integrity remain paramount at CVB CVBF Snapshot |
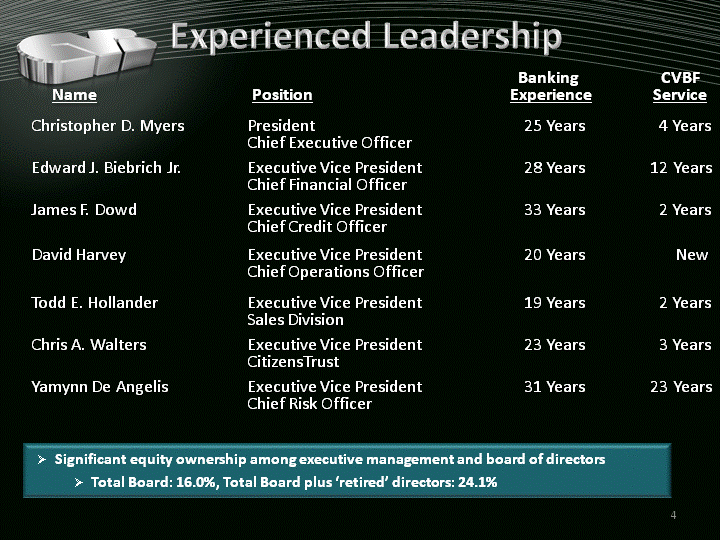
| 4 Significant equity ownership among executive management and board of directors Total Board: 16.0%, Total Board plus 'retired' directors: 24.1% Edward J. Biebrich Jr. Executive Vice President 28 Years 12 Years Chief Financial Officer Todd E. Hollander Executive Vice President 19 Years 2 Years Sales Division Christopher D. Myers President 25 Years 4 Years Chief Executive Officer Yamynn De Angelis Executive Vice President 31 Years 23 Years Chief Risk Officer Chris A. Walters Executive Vice President 23 Years 3 Years CitizensTrust Banking CVBF Name Position Experience Service James F. Dowd Executive Vice President 33 Years 2 Years Chief Credit Officer David Harvey Executive Vice President 20 Years New Chief Operations Officer Experienced Leadership |
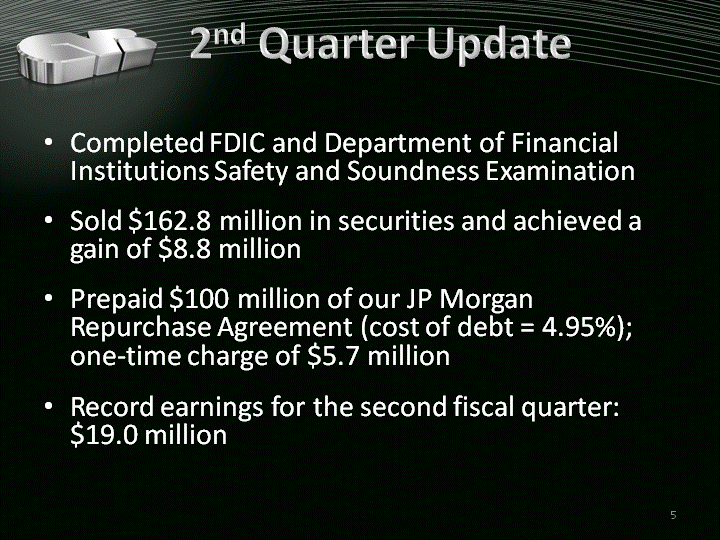
| 2nd Quarter Update Completed FDIC and Department of Financial Institutions Safety and Soundness ExaminationSold $162.8 million in securities and achieved a gain of $8.8 millionPrepaid $100 million of our JP Morgan Repurchase Agreement (cost of debt = 4.95%); one-time charge of $5.7 millionRecord earnings for the second fiscal quarter: $19.0 million 5 |
| Who is CVB Financial? 6 |
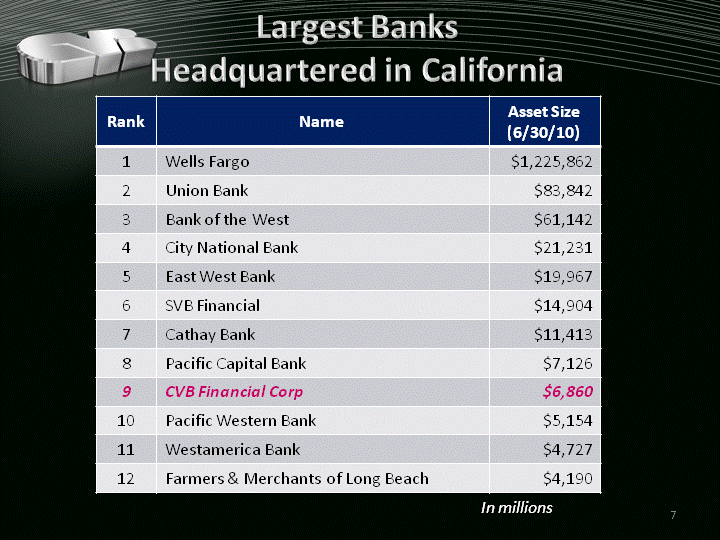
| Largest Banks Headquartered in California Headquartered in California Headquartered in California 7 In millions |
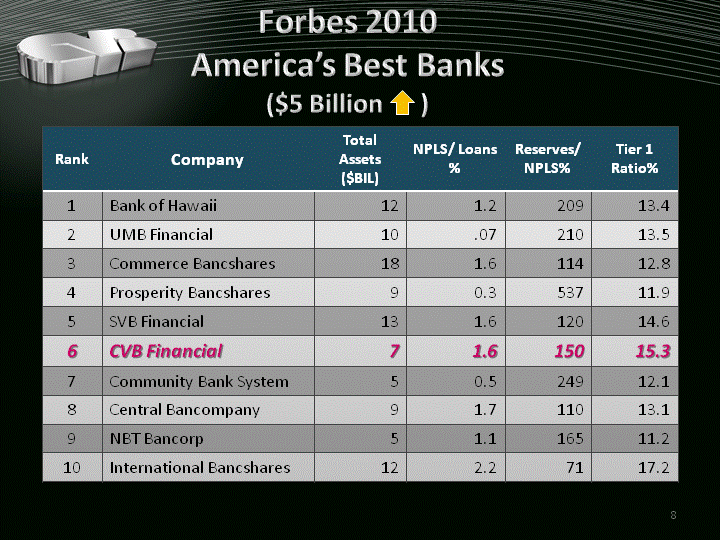
| Forbes 2010 America's Best Banks ($5 Billion ) 8 Rank Company Total Assets ($BIL) NPLS/ Loans % Reserves/NPLS% Tier 1 Ratio% 1 Bank of Hawaii 12 1.2 209 13.4 2 UMB Financial 10 .07 210 13.5 3 Commerce Bancshares 18 1.6 114 12.8 4 Prosperity Bancshares 9 0.3 537 11.9 5 SVB Financial 13 1.6 120 14.6 6 CVB Financial 7 1.6 150 15.3 7 Community Bank System 5 0.5 249 12.1 8 Central Bancompany 9 1.7 110 13.1 9 NBT Bancorp 5 1.1 165 11.2 10 International Bancshares 12 2.2 71 17.2 |
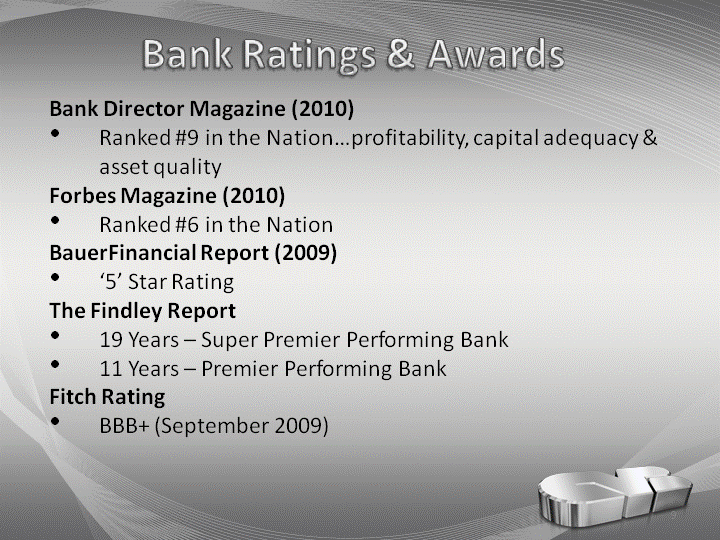
| Bank Ratings & Awards Bank Director Magazine (2010)Ranked #9 in the Nation...profitability, capital adequacy & asset qualityForbes Magazine (2010)Ranked #6 in the NationBauerFinancial Report (2009)'5' Star RatingThe Findley Report19 Years - Super Premier Performing Bank11 Years - Premier Performing BankFitch RatingBBB+ (September 2009) 9 |

| What are our Markets? 10 |
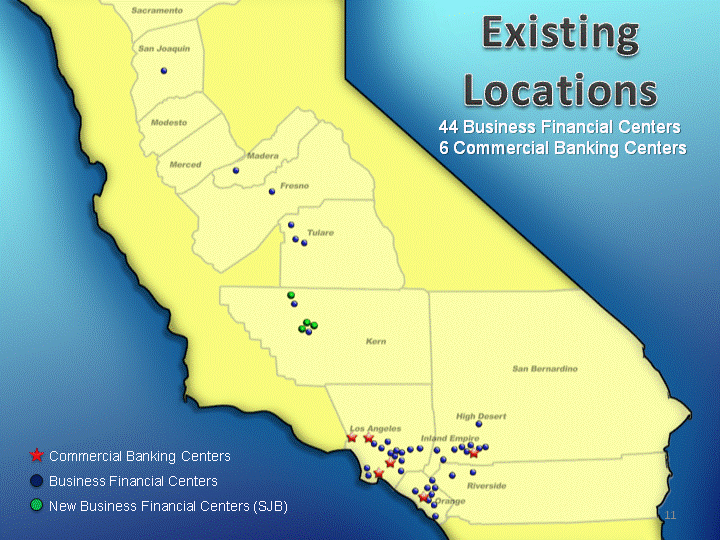
| Existing Locations 11 Commercial Banking CentersBusiness Financial CentersNew Business Financial Centers (SJB) 44 Business Financial Centers6 Commercial Banking Centers |
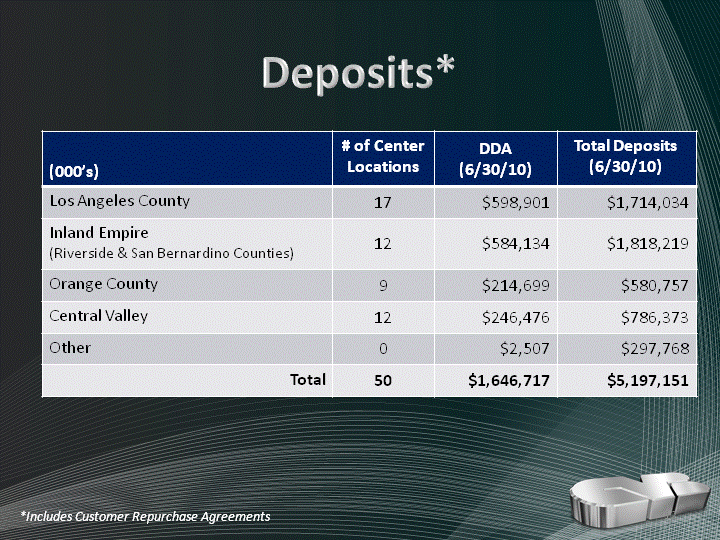
| Deposits* 12 12 *Includes Customer Repurchase Agreements |
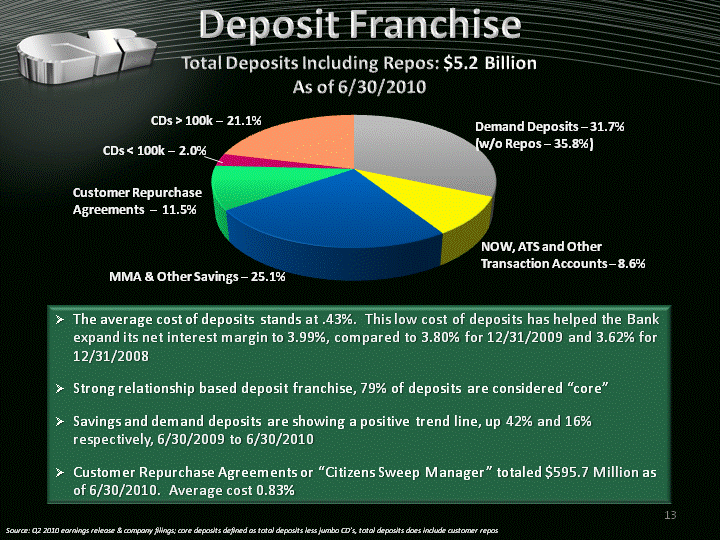
| Deposit Franchise Total Deposits Including Repos: $5.2 Billion As of 6/30/2010 13 Source: Q2 2010 earnings release & company filings; core deposits defined as total deposits less jumbo CD's, total deposits does include customer repos The average cost of deposits stands at .43%. This low cost of deposits has helped the Bank expand its net interest margin to 3.99%, compared to 3.80% for 12/31/2009 and 3.62% for 12/31/2008Strong relationship based deposit franchise, 79% of deposits are considered "core"Savings and demand deposits are showing a positive trend line, up 42% and 16% respectively, 6/30/2009 to 6/30/2010Customer Repurchase Agreements or "Citizens Sweep Manager" totaled $595.7 Million as of 6/30/2010. Average cost 0.83% (CHART) Demand Deposits - 31.7%(w/o Repos - 35.8%) NOW, ATS and Other Transaction Accounts - 8.6% CDs < 100k - 2.0% MMA & Other Savings - 25.1% CDs > 100k - 21.1% Customer Repurchase Agreements - 11.5% |
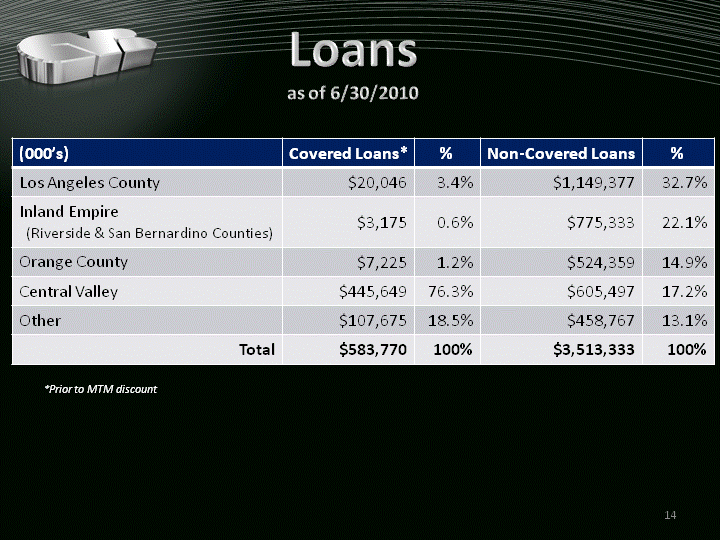
| Loans as of 6/30/2010 as of 6/30/2010 as of 6/30/2010 14 *Prior to MTM discount |
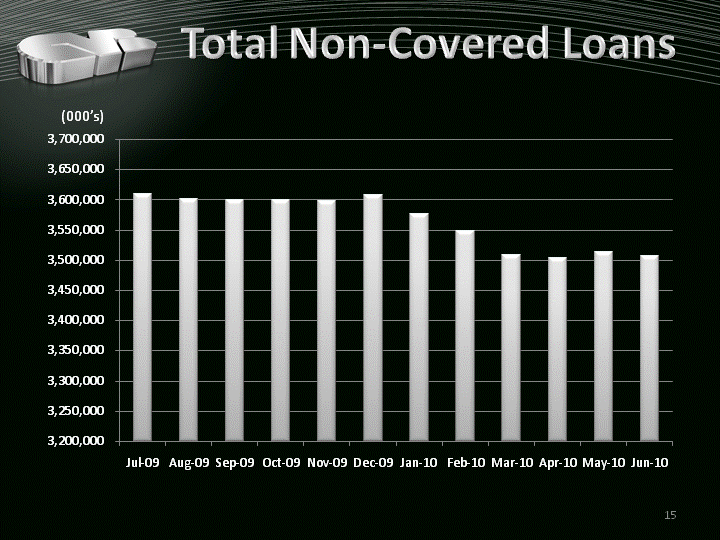
| Total Non-Covered Loans Total Non-Covered Loans 15 (000's) |
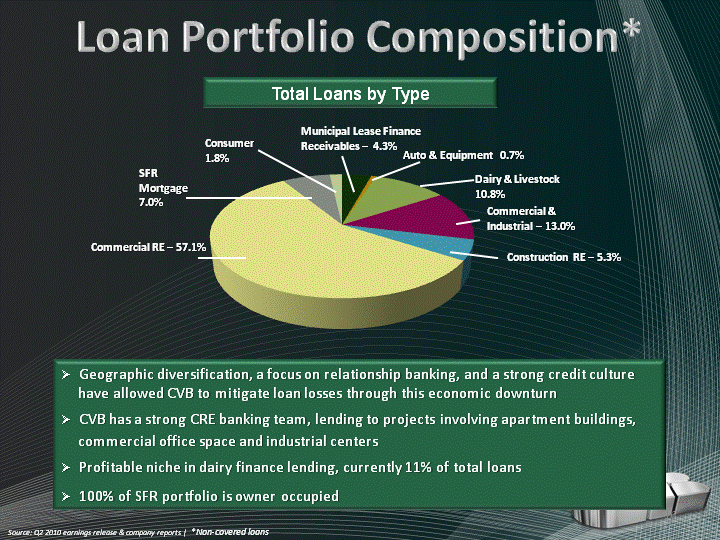
| 16 Geographic diversification, a focus on relationship banking, and a strong credit culture have allowed CVB to mitigate loan losses through this economic downturnCVB has a strong CRE banking team, lending to projects involving apartment buildings, commercial office space and industrial centersProfitable niche in dairy finance lending, currently 11% of total loans100% of SFR portfolio is owner occupied Source: Q2 2010 earnings release & company reports | *Non-covered loans Loan Portfolio Composition* Total Loans by Type (CHART) Commercial RE - 57.1% Consumer 1.8% SFR Mortgage 7.0% Municipal Lease Finance Receivables - 4.3% Auto & Equipment 0.7% Dairy & Livestock 10.8% Commercial & Industrial - 13.0% Construction RE - 5.3% |
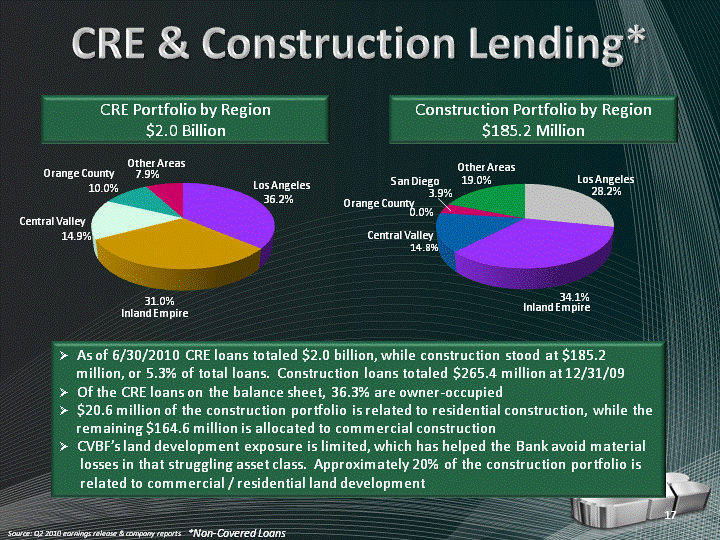
| (CHART) (CHART) 17 As of 6/30/2010 CRE loans totaled $2.0 billion, while construction stood at $185.2 million, or 5.3% of total loans. Construction loans totaled $265.4 million at 12/31/09Of the CRE loans on the balance sheet, 36.3% are owner-occupied$20.6 million of the construction portfolio is related to residential construction, while the remaining $164.6 million is allocated to commercial constructionCVBF's land development exposure is limited, which has helped the Bank avoid material losses in that struggling asset class. Approximately 20% of the construction portfolio is related to commercial / residential land development Source: Q2 2010 earnings release & company reports Orange County Other Areas Los Angeles Inland Empire Central Valley Orange County San Diego Other Areas Los Angeles Inland Empire Central Valley CRE & Construction Lending* CRE Portfolio by Region$2.0 Billion Construction Portfolio by Region$185.2 Million *Non-Covered Loans |
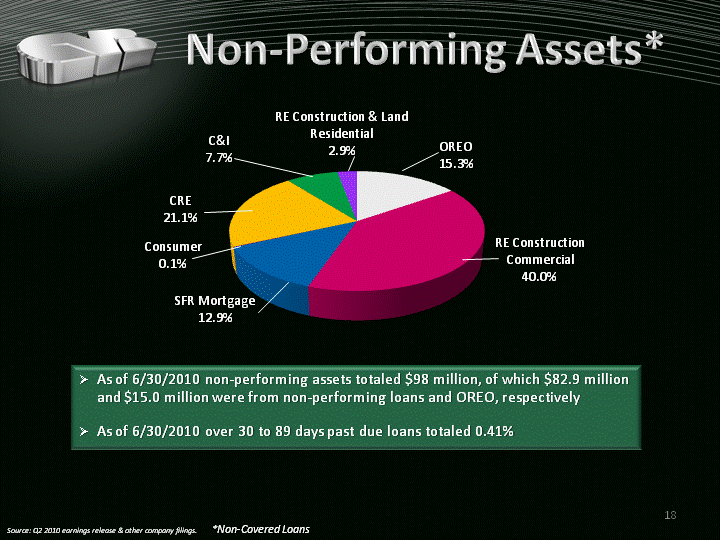
| As of 6/30/2010 non-performing assets totaled $98 million, of which $82.9 million and $15.0 million were from non-performing loans and OREO, respectivelyAs of 6/30/2010 over 30 to 89 days past due loans totaled 0.41% 18 Non-Performing Assets* *Non-Covered Loans Source: Q2 2010 earnings release & other company filings. |
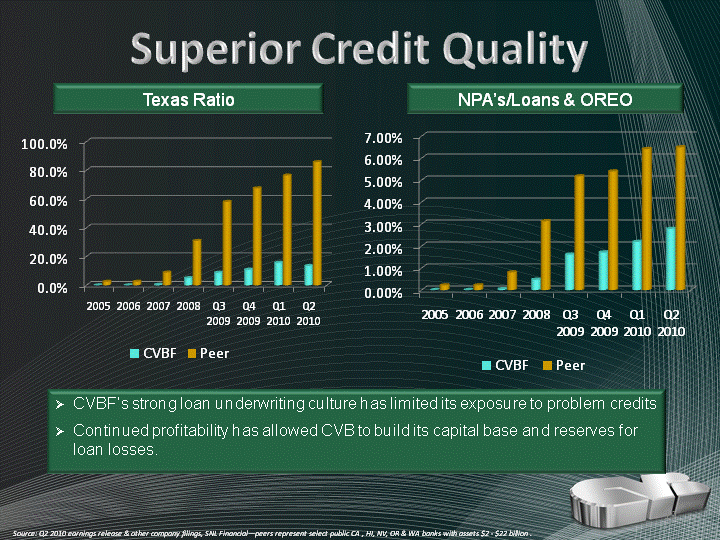
| 19 CVBF's strong loan underwriting culture has limited its exposure to problem creditsContinued profitability has allowed CVB to build its capital base and reserves for loan losses. Superior Credit Quality Texas Ratio NPA's/Loans & OREO (CHART) (CHART) Source: Q2 2010 earnings release & other company filings, SNL Financial-peers represent select public CA , HI, NV, OR & WA banks with assets $2 - $22 billion . |

| Profits 20 |
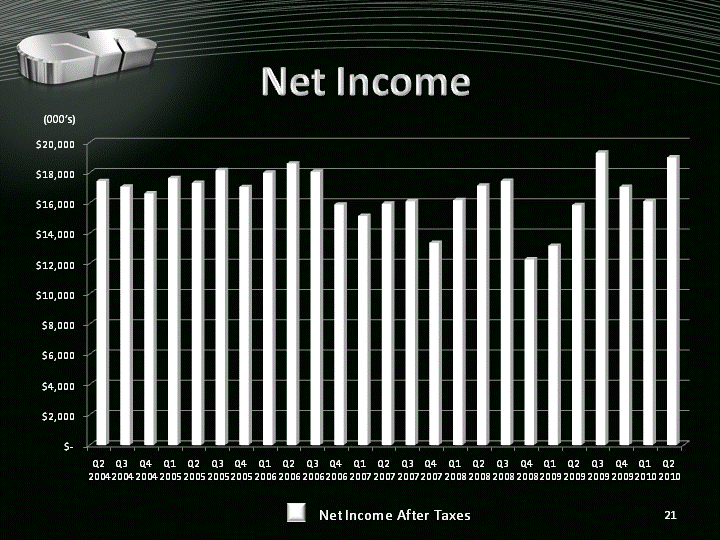
| (CHART) Net Income 21 (000's) Net Income After Taxes |
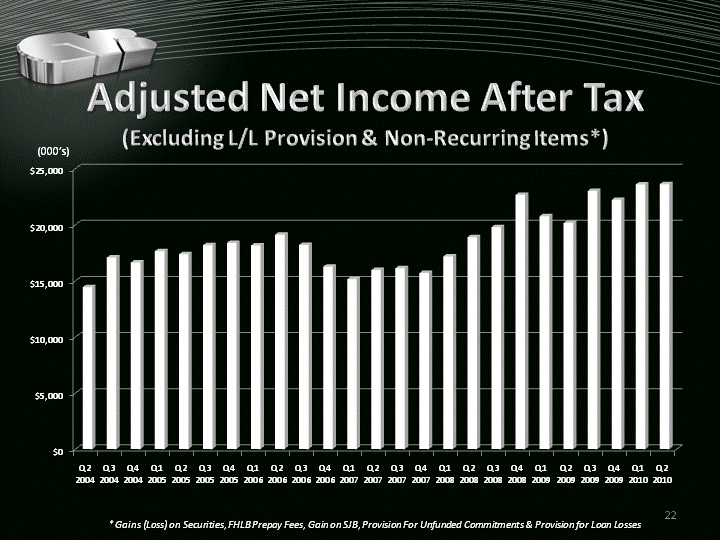
| Adjusted Net Income After Tax (Excluding L/L Provision & Non-Recurring Items*) (Excluding L/L Provision & Non-Recurring Items*) (Excluding L/L Provision & Non-Recurring Items*) 22 *Gains (Loss) on Securities, FHLB Prepay Fees, Gain on SJB, Provision For Unfunded Commitments & Provision for Loan Losses (000's) |
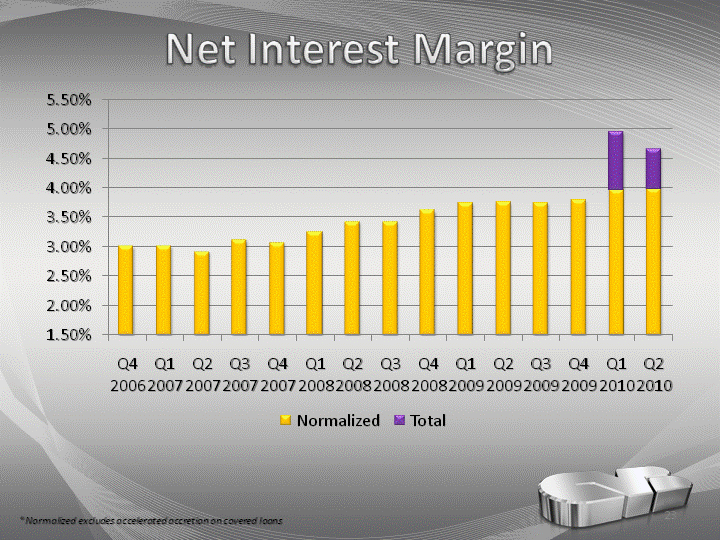
| Net Interest Margin Net Interest Margin 23 *Normalized excludes accelerated accretion on covered loans |
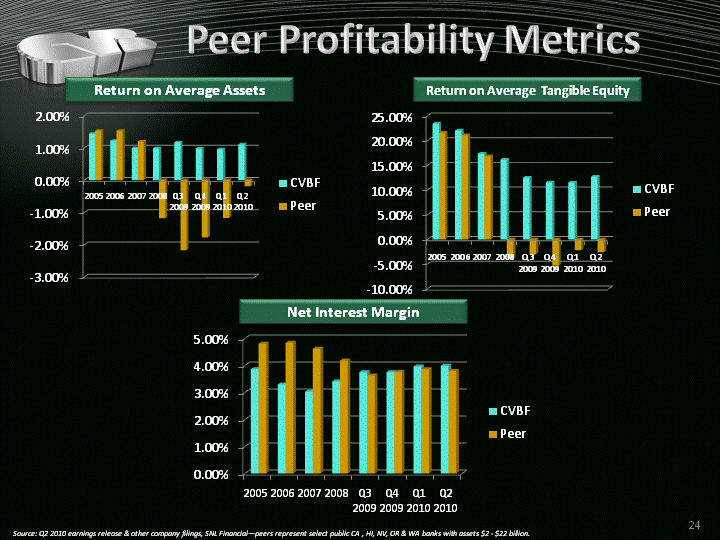
| 24 Peer Profitability Metrics Return on Average Assets Return on Average Tangible Equity Net Interest Margin (CHART) (CHART) (CHART) Source: Q2 2010 earnings release & other company filings, SNL Financial-peers represent select public CA , HI, NV, OR & WA banks with assets $2 - $22 billion. |

| Capital 25 |
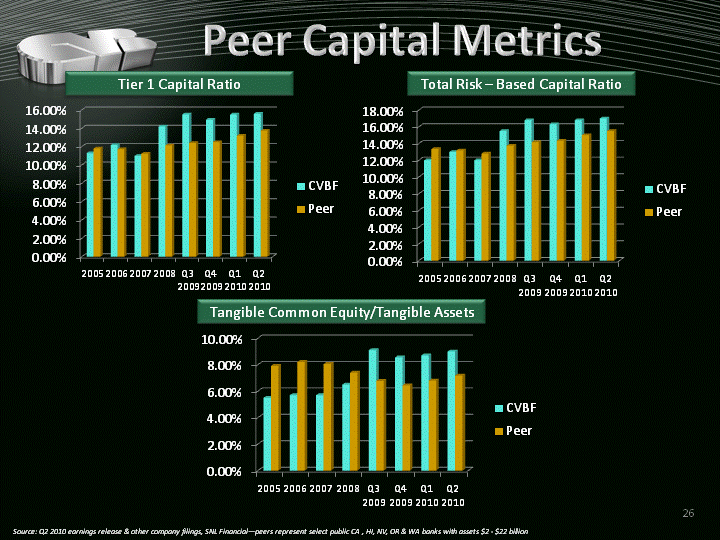
| (CHART) 26 Source: Q2 2010 earnings release & other company filings, SNL Financial-peers represent select public CA , HI, NV, OR & WA banks with assets $2 - $22 billion Peer Capital Metrics Tier 1 Capital Ratio Total Risk - Based Capital Ratio Tangible Common Equity/Tangible Assets (CHART) (CHART) |

| Securities/Investments 27 |
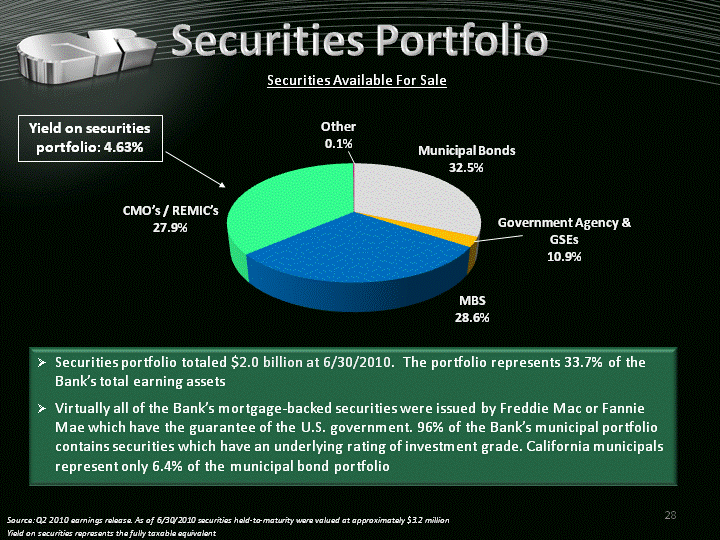
| (CHART) 28 Source: Q2 2010 earnings release. As of 6/30/2010 securities held-to-maturity were valued at approximately $3.2 millionYield on securities represents the fully taxable equivalent Securities Available For Sale Securities portfolio totaled $2.0 billion at 6/30/2010. The portfolio represents 33.7% of the Bank's total earning assetsVirtually all of the Bank's mortgage-backed securities were issued by Freddie Mac or Fannie Mae which have the guarantee of the U.S. government. 96% of the Bank's municipal portfolio contains securities which have an underlying rating of investment grade. California municipals represent only 6.4% of the municipal bond portfolio Government Agency & GSEs10.9% MBS28.6% CMO's / REMIC's27.9% Municipal Bonds32.5% Yield on securities portfolio: 4.63% Securities Portfolio Other0.1% |
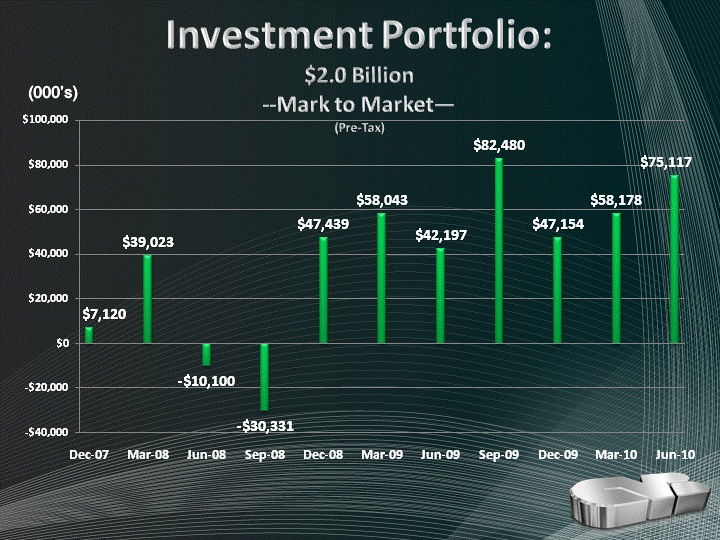
| Investment Portfolio: $2.0 Billion - --Mark to Market- (Pre-Tax) (CHART) (000's) |

| 3rd Quarter Events 30 |
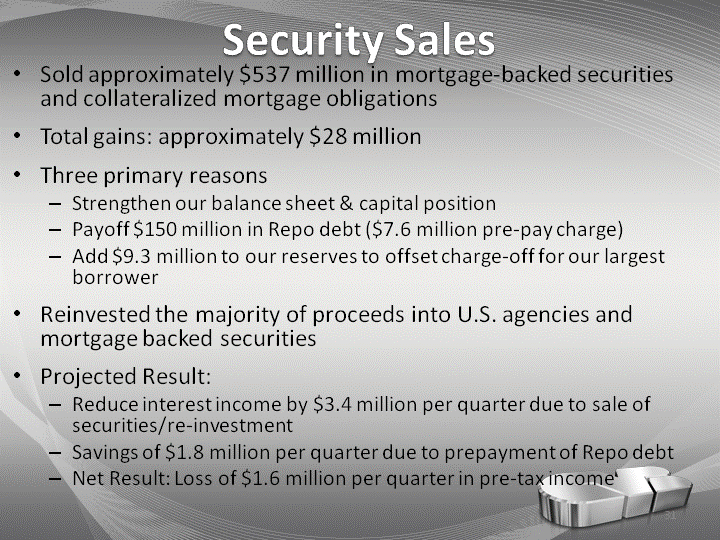
| Security Sales Sold approximately $537 million in mortgage-backed securities and collateralized mortgage obligationsTotal gains: approximately $28 millionThree primary reasonsStrengthen our balance sheet & capital positionPayoff $150 million in Repo debt ($7.6 million pre-pay charge)Add $9.3 million to our reserves to offset charge-off for our largest borrowerReinvested the majority of proceeds into U.S. agencies and mortgage backed securitiesProjected Result:Reduce interest income by $3.4 million per quarter due to sale of securities/re-investmentSavings of $1.8 million per quarter due to prepayment of Repo debtNet Result: Loss of $1.6 million per quarter in pre-tax income 31 |
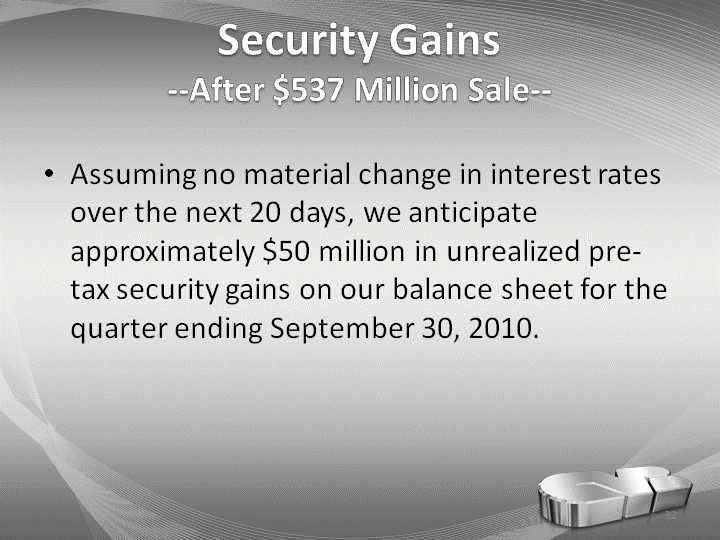
| Security Gains - --After $537 Million Sale-- Assuming no material change in interest rates over the next 20 days, we anticipate approximately $50 million in unrealized pre- tax security gains on our balance sheet for the quarter ending September 30, 2010. 32 |
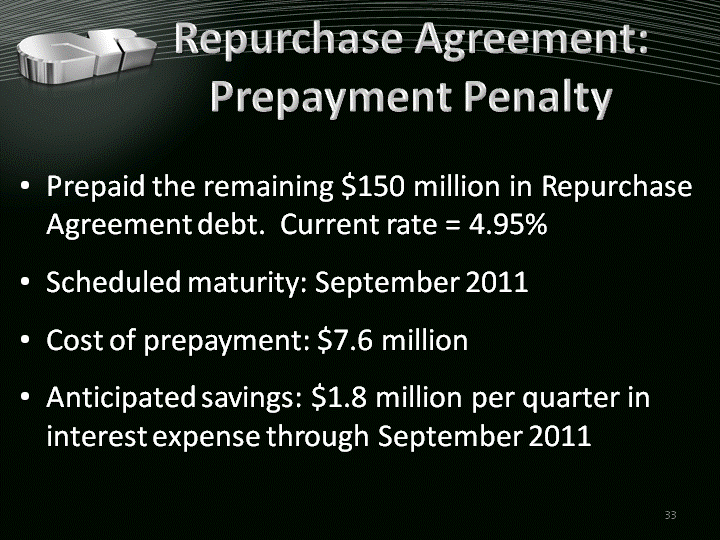
| Repurchase Agreement: Prepayment Penalty Prepaid the remaining $150 million in Repurchase Agreement debt. Current rate = 4.95%Scheduled maturity: September 2011Cost of prepayment: $7.6 millionAnticipated savings: $1.8 million per quarter in interest expense through September 2011 33 |
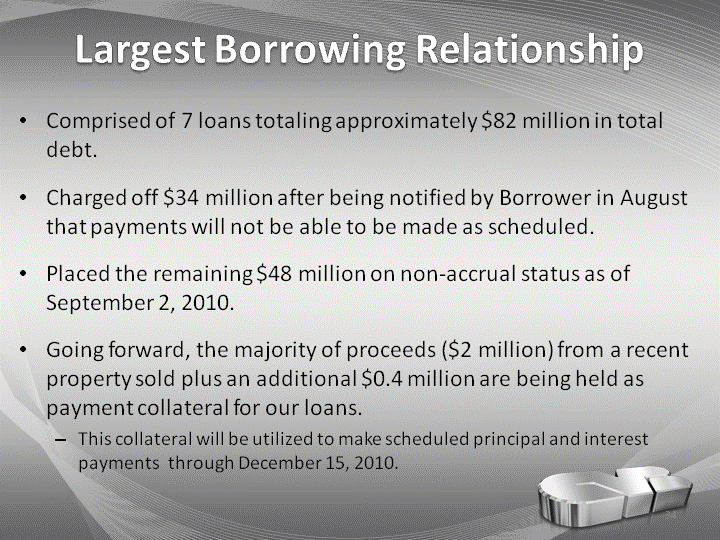
| Largest Borrowing Relationship Comprised of 7 loans totaling approximately $82 million in total debt.Charged off $34 million after being notified by Borrower in August that payments will not be able to be made as scheduled.Placed the remaining $48 million on non-accrual status as of September 2, 2010.Going forward, the majority of proceeds ($2 million) from a recent property sold plus an additional $0.4 million are being held as payment collateral for our loans. This collateral will be utilized to make scheduled principal and interest payments through December 15, 2010. 34 |
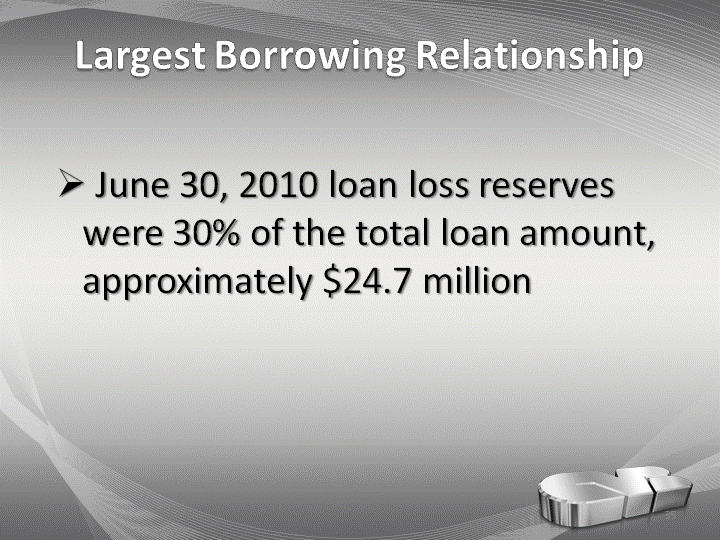
| Largest Borrowing Relationship June 30, 2010 loan loss reserves were 30% of the total loan amount, approximately $24.7 million 35 |
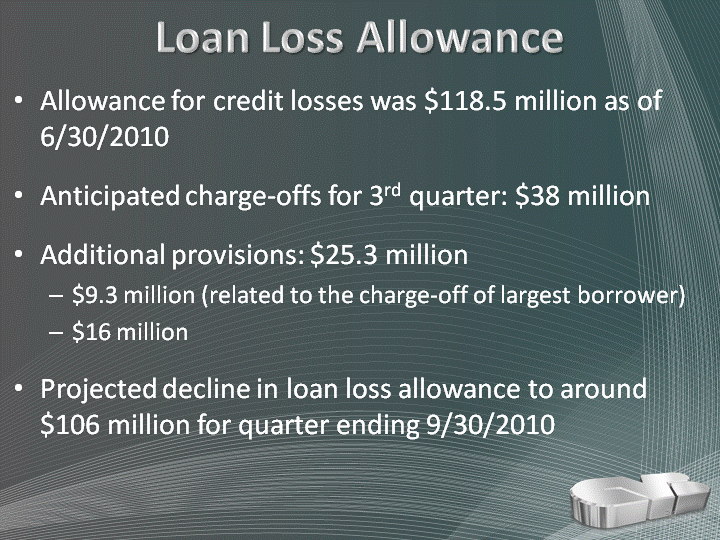
| Loan Loss Allowance 36 Allowance for credit losses was $118.5 million as of 6/30/2010Anticipated charge-offs for 3rd quarter: $38 millionAdditional provisions: $25.3 million$9.3 million (related to the charge-off of largest borrower)$16 millionProjected decline in loan loss allowance to around $106 million for quarter ending 9/30/2010 |

| 3rd Quarter Profit Projection 37 Our pre-tax, pre-security gains, pre-provision income is anticipated between $30 and $34 millionProjected pre-tax earnings of $25 to $29 millionProjected after-tax earnings of $17 to $20 million or $.16 to $.19 per share |
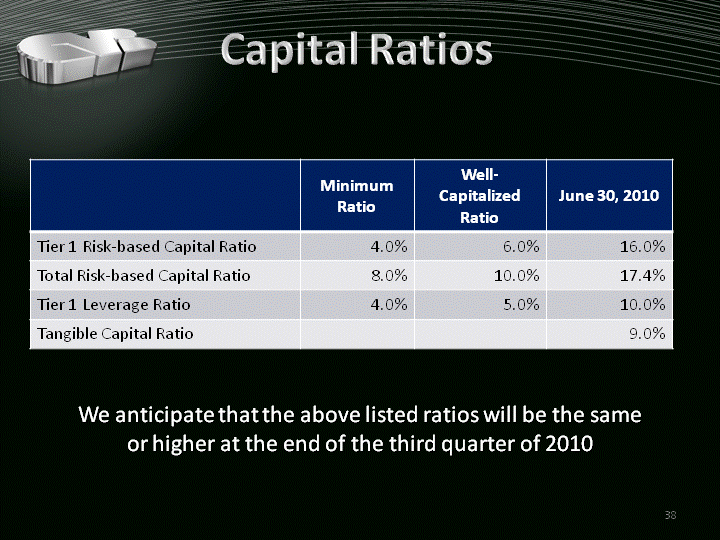
| Capital Ratios Capital Ratios 38 We anticipate that the above listed ratios will be the same or higher at the end of the third quarter of 2010 |
| Our Growth Strategy Transitioning from a Community Bank to a Regional Bank 39 |
| Citizens Business Bank: Our 10 Year Vision Citizens Business Bank will strive to become the dominant financial services company operating throughout the state of California, servicing the comprehensive financial needs of successful small to medium sized businesses and their owners. 40 |
| Target Customer 41 The best privately-held and/or family-owned businesses throughout California Annual revenues of $1-200 million Top 25% in their respective industry Full relationship banking Build 20-year relationships |

| Three Areas of Growth 42 (CHART) Acquisitions - --Banks-- - --Trust-- |
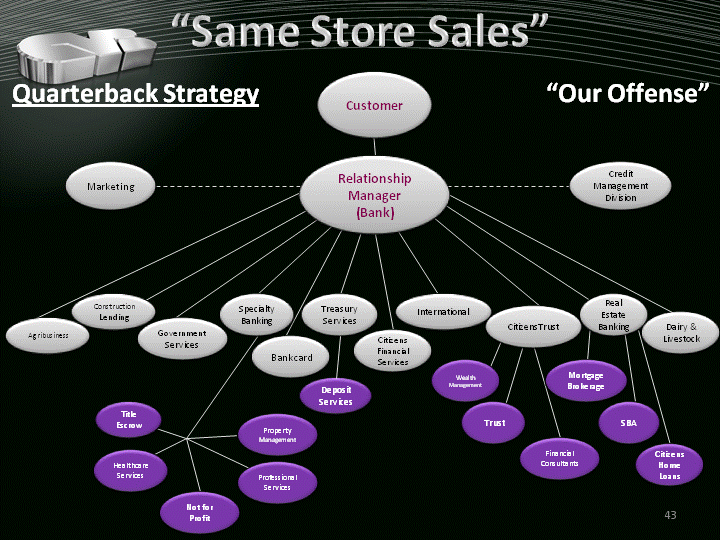
| "Same Store Sales" 43 43 Relationship Manager (Bank) Property Management Real Estate Banking International Treasury Services Specialty Banking Construction Lending CitizensTrust Bankcard SBA Citizens Home Loans Mortgage Brokerage Title Escrow Marketing Citizens Financial Services Government Services Deposit Services Wealth Management Trust Financial Consultants Healthcare Services Professional Services Not for Profit Quarterback Strategy "Our Offense" Customer Credit Management Division Dairy & Livestock Agribusiness |
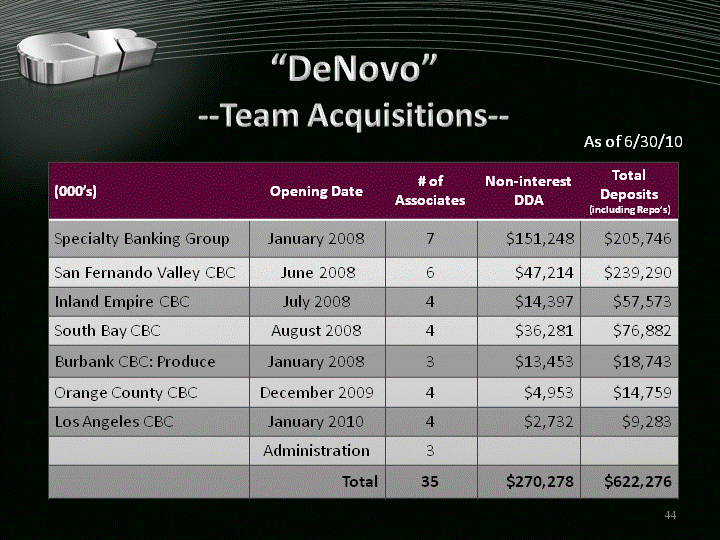
| "DeNovo" - --Team Acquisitions-- - --Team Acquisitions-- - --Team Acquisitions-- 44 As of 6/30/10 |
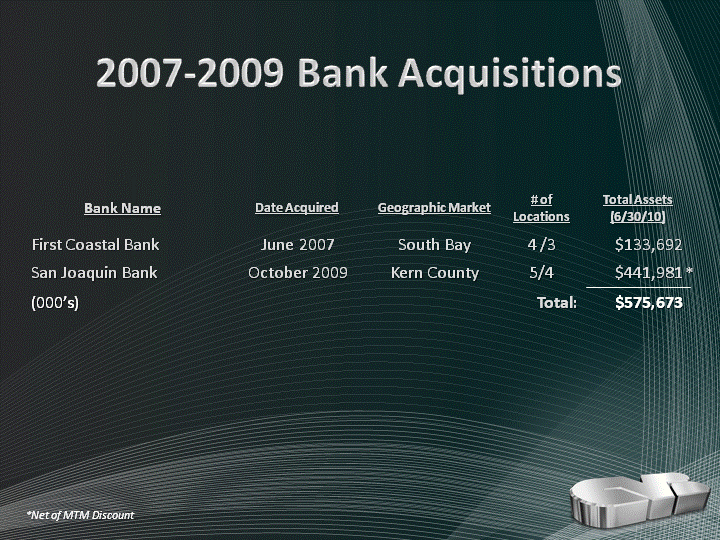
| Bank Name Date Acquired Geographic Market # of Locations Total Assets (6/30/10) First Coastal Bank June 2007 South Bay 4 /3 $133,692 San Joaquin Bank October 2009 Kern County 5/4 $441,981 (000's) Total: $575,673 2007-2009 Bank Acquisitions * *Net of MTM Discount |
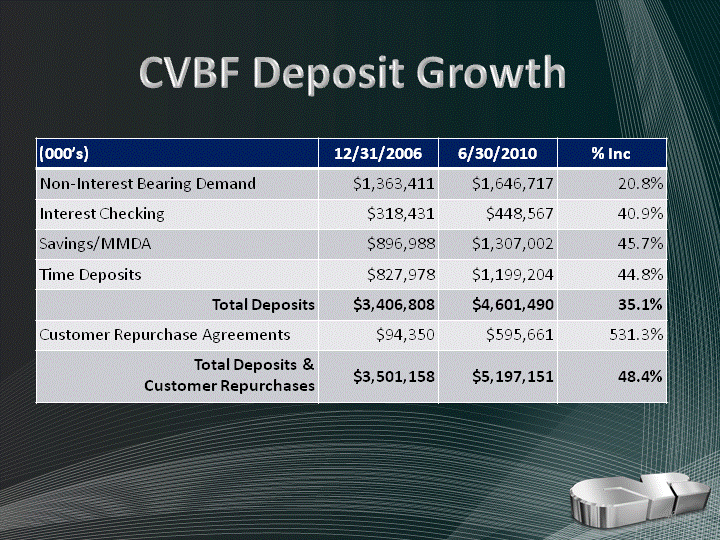
| CVBF Deposit Growth 46 46 |
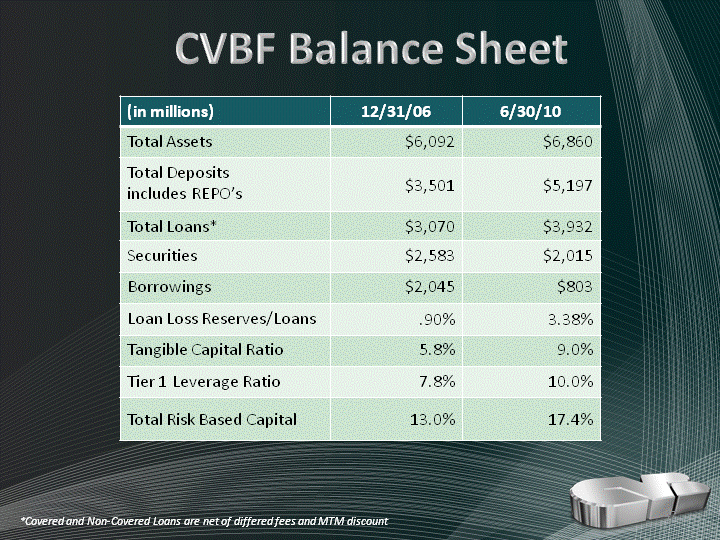
| CVBF Balance Sheet 47 (in millions) 12/31/06 6/30/10 Total Assets $6,092 $6,860 Total Depositsincludes REPO's $3,501 $5,197 Total Loans* $3,070 $3,932 Securities $2,583 $2,015 Borrowings $2,045 $803 Loan Loss Reserves/Loans .90% 3.38% Tangible Capital Ratio 5.8% 9.0% Tier 1 Leverage Ratio 7.8% 10.0% Total Risk Based Capital 13.0% 17.4% *Covered and Non-Covered Loans are net of differed fees and MTM discount |
| Our Strategic Focus 48 Strong Capital position Strong, disciplined credit underwriting/credit culture Drive low-cost deposits Multiple forms of growth (don't depend on one) Same Store Sales DeNovo Acquisitions Cross-sell: capture the whole wallet Build new Fee Income opportunities Long-term outlook |

| THANK YOU!COPY OF PRESENTATION: JCSCHAAP@CBBANK.COM 49 |