
1
KBW 8th Annual Community Bank
Investor Conference
July 31 – Aug. 1, 2007

Safe Harbor
Certain matters set forth herein constitute forward-looking statements within the
meaning of the Private Securities Litigation Reform Act of 1995, including forward-
looking statements relating to the Company’s current business plan and
expectations regarding future operating results. These forward-looking
statements are subject to risks and uncertainties that could cause actual results,
performance or achievements to differ materially from those projected. These
risks and uncertainties include, but are not limited to, the impact of changes in
interest rates, a decline in economic conditions, adverse changes resulting
from natural and manmade disasters, effects of government regulation and
increased competition among financial services providers and other factors set
forth in the Company’s public reports including its Annual Report on Form 10-K for
the year ended December 31, 2006, and particularly the discussion of risk
factors within that document. The Company does not undertake, and specifically
disclaims any obligation to update any forward-looking statements to reflect
occurrences or unanticipated events or circumstances after the date of such
statements except as required by law.
2

3
1974
Chino Valley Bank formed
1981
CVB Financial Corp.
(holding company formed)
1996
Chino Valley Bank
becomes Citizens Business Bank

Headquarters
Origin
Business Financial Centers
Assets
Deposits
Loans
Market Capitalization
4
Ontario, California
August 9, 1974
44
$6.137 Billion
$3.509 Billion
$3.303 Billion
$940.80 Million
5
Name
Christopher D. Myers
Edward J. Biebrich Jr.
Jay W. Coleman
Edward J. Mylett Jr.
Chris A. Walters
Yamynn De Angelis
Elsa Zavala
David M. Krebs
Position
President
Chief Executive Officer
Executive Vice President
Finance Division
Executive Vice President
Sales Division
Executive Vice President
Credit Management Division
Executive Vice President
Wealth Management
Senior Vice President
Service Division
Senior Vice President
Information Technology Division
Senior Vice President
Human Resources
Banking
Experience
23 Years
25 Years
43 Years
33 Years
21 Years
28 Years
27 Years
13 Years
CVB
Service
1 Year
9 Years
19 Years
11 Years
New
20 Years
14 Years
4 Years

Name
Nancy A. Sinclair
Stephen Tidland
James E. Mead
Vince L. Gottuso
Mark Richardson
John H. Tait
Ted Dondanville
Larry Zivelonghi
6
Average: 28 Years 12 Years
Position
Senior Vice President
The Marketing Group
Senior Vice President
President – Golden West Financial
Senior Vice President
Regional Manager – Region 1
Senior Vice President
Regional Manager – Region 2
Senior Vice President
Regional Manager – Region 3
Senior Vice President
Regional Manager – Region 4
Senior Vice President
Regional Manager – Region 5
Senior Vice President
Dairy & Livestock Industries Group
Banking
Experience
38 Years
38 Years
32 Years
21 Years
18 Years
38 Years
25 Years
27 Years
CVB
Service
10 Years
20 Years
14 Years
14 Years
14 Years
6 Years
9 Years
14 Years

“The vision of CVB Financial Corp. is to be
recognized as the premier relationship
financial institution for businesses and
professionals in California with $8.0 billion in
assets by December 31, 2008 and $12.0 billion
in assets by December 31, 2012, with earnings
growth of 15.0% a year, a return on equity of
20.0% and a return on assets of 1.6%”
7

“The Mission of CVB Financial Corp. is to achieve
superior performance and rank in the top 10% of all
financial institutions in the nation in return on equity
and return on assets. This will be achieved by
delivering the finest in financial products and services
through relationship banking commitments with
businesses and professionals in the Inland Empire,
Los Angeles County, Orange County and the Central
Valley areas of California. It will be supported by an
unqualified commitment to our five core values of
financial strength, superior people, customer focus,
cost-effective operation and having fun.”
8

9
U.S. Banker Magazine
Top Business Bank in the Nation
15th Ranked Bank in the Nation
America’s Finest Companies investment
directory
One of 318 out of 19,000 U.S. public companies.
Bank Director Magazine (December 2006)
14th Ranked Bank in the Nation
The Findley Report
27 Consecutive Years – Premier Performing Bank
16 Consecutive Years – Super Premier Performing Bank
KBW Honor Roll
Five Consecutive Years
Fitch Ratings
BBB+
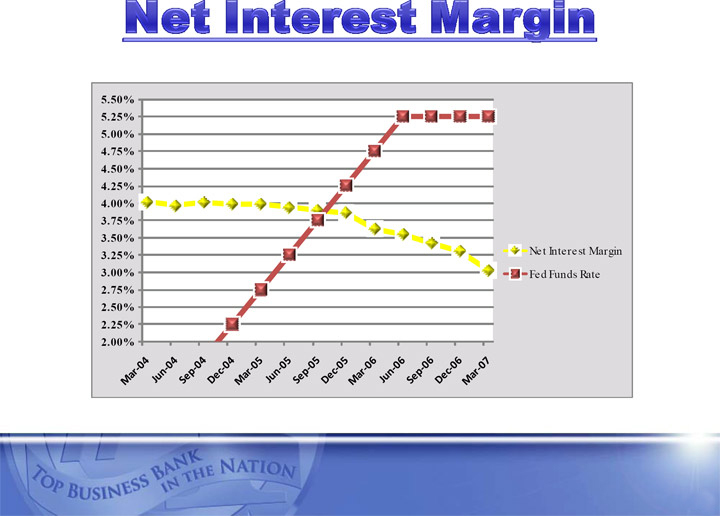
10

Rising Short-term Interest Rates
Slowing Housing Market
Economic Volatility (Oil prices, etc.)
11

Total Deposits
Total Loans
Total Capital
Total Assets
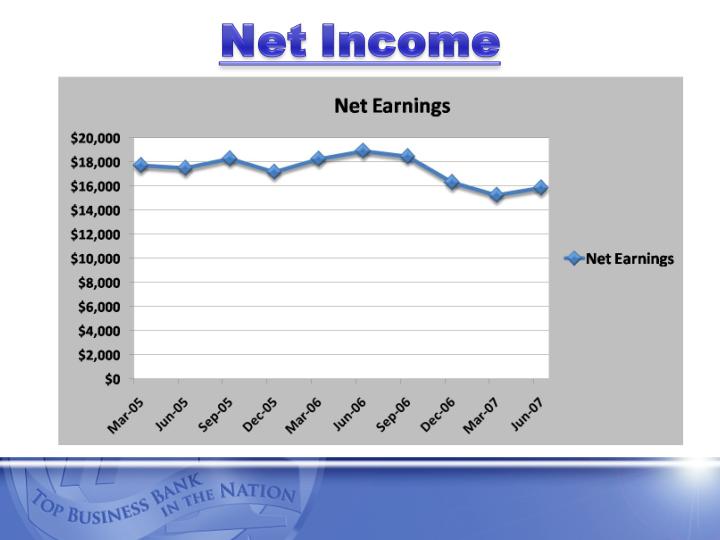
Net Earnings
12

(000s)
12/31/05
12/31/06
Change
%
Demand
Deposits
$1,490,613
$1,363,411
($127,202)
(8.53)
Total
Deposits
(including REPOs)
3,424,045
3,501,208
77,163
2.25
Total Loans
2,663,864
3,070,196
406,332
15.25
Capital
342,877
389,339
46,462
13.55
Assets
5,422,971
6,094,262
671,291
12.38
13
(000s)
12/31/01
12/31/06
Change
Demand
Deposits
$766,329
$1,363,411
$597,082
Total
Deposits
(including REPOs)
1,876,959
3,501,208
1,624,249
Total Loans
1,187,540
3,070,196
1,882,656
Capital
220,748
389,339
168,591
Assets
2,514,102
6,094,262
3,580,160
14

*Earnings before securities gains & losses, OREO gains & losses, provisions for OREO &
loan losses, and income taxes.
(000s)
2005
2006
Change
%
Operating
Earnings*
$109,280
$105,573
($3,707)
(3.39)
Earnings
Before Taxes
106,964
103,630
(3,334)
(3.12)
Taxes
36,346
31,724
(4,622)
(12.72)
Net Earnings
After Taxes
70,618
71,906
1,288
1.82
Diluted EPS
0.83
0.85
0.02
2.41
15

*Earnings before securities gains & losses, OREO gains & losses, provisions for OREO &
loan losses, and income taxes.
(000s)
2001
2006
Change
Annual %
Increase
Operating
Expenses*
$64,922
$105,573
40,651
10.21
Earnings
Before Taxes
63,358
103,630
40,272
10.34
Taxes
23,300
31,724
8,424
6.37
Net Earnings
After Taxes
40,058
71,906
31,848
12.41
Diluted EPS
0.48
0.85
0.37
12.11
16

Source: Federal Deposit Insurance Corporation
CVB
California
Banks
U.S.
Banks
Deposits
82%
35%
66%
Loans
159%
51%
73%
Capital
76%
49%
106%
Assets
142%
53%
72%
17
Source: Federal Deposit Insurance Corporation
CVB
California
Banks
U.S.
Banks
Return on
Average Equity
19.75%
13.03%
12.65%
Return on
Average Assets
1.25%
1.53%
1.35%
18
19
CVB Financial
Corp.
NASDAQ
Market Index
01/01/2002
$100.00
$100.00
12/31/2006
185.42
128.12
20
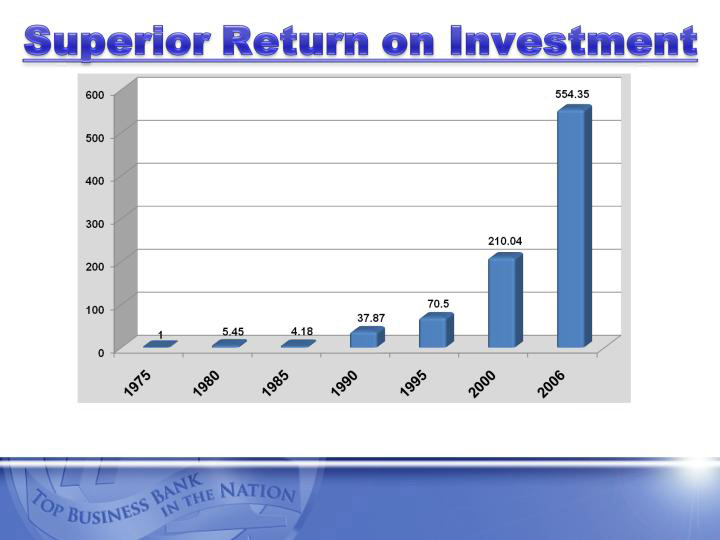
One dollar invested on February 11, 1975, with dividends reinvested,
would be valued at $554.35 as of December 31, 2006.
21

Rank Bank Assets*
1
Wells Fargo Bank
$482,000
2
Bank of the West
56,400
3
Union Bank of California
52,600
4
City National Bank
5
California Bank & Trust
14,715
10,834
6 East-West Bank
10,800
7 United Commercial Bank
10,346
8 Greater Bay Bank
7,400
9 Pacific Capital Bank
7,000
10 Cathay Bank
6,400
11 Silicon Valley Bank
6,043
12 Citizens Business Bank
6,034
13 California National Bank
5,518
14 Westamerica Bank
4,769
*Assets in thousands as of December 31, 2006
22

(21.47)
(257,209)
940,795
1,198,004
Market Capitalization
(16.19)
(3,063)
15,854
18,917
Earnings
3.10
184,624
6,137,043
5,952,419
Assets
17.32
58,580
396,834
338,254
Capital
16.35
464,128
3,303,273
2,839,145
Gross Loans
4.82
173,103
3,765,956
3,592,853
Total Deposits (including
Customer REPOs)
(1.92)
($26,247)
$1,340,768
$1,367,015
Demand Deposits
%
Decrease
06/30/07
06/30/06
(000s)
23
24
25
Flat or inverted yield curve
Increasing cost of borrowings
Fixed-Rate Composition of our
loan portfolio
Lack of demand deposit growth
26
California
Peer Banks
%
CVBF
%
Assets
Loans
2,749,452
70.5
3,070,196
50.4
Investments
788,469
20.2
2,582,902
42.4
Other Assets
359,360
9.2
441,164
7.2
Total Assets
3,897,281
100.0
6,094,262
100.0
Liabilities & Equity
Total Deposits
2,897,433
74.3
3,406,808
55.9
Borrowings
439,257
11.3
2,146,495
35.2
Other Liabilities
55,713
1.4
151,620
2.5
Equity
504,878
13.0
389,339
6.4
Total Liabilities & Equity
3,897,281
100.0
6,094,262
100.0
27

2004
2005
2006
Q2 2007
Yield on
Investments
4.38%
4.64%
5.06%
5.24%
Cost of
Borrowings
2.85%
3.39%
4.40%
5.01%
Spread
1.53%
1.25%
.66%
.23%
Yield on Loans
6.01%
6.52%
6.92%
6.85%
Cost of
Deposits
.56%
.94%
1.91%
2.12%
Spread
5.45%
5.58%
5.01%
4.73%
28

Amount %
Fixed Rate Loans $1,487,422 48.3
Fixed with Reset 716,887 23.3
Variable Rate Loans 874,556 28.4
$3,078,865 100.0%
29
6/30/06
6/30/07
Demand Deposits
$1,367,015
$1,340,768
Total Deposits
(including REPOs)
3,592,853
3,765,956
30

31

Intelligent
Balance Sheet Sensitive
Interest Rate Sensitive
Strategic
Sustainable
Achievable
32

Relationship Banking
Credit Quality
Outstanding Customer Service
33

Demand deposit growth
Business loan growth
Lower cost time deposit growth
Fee income growth
Cost effective operation
34
DeNovo
Acquisition of business
& community banks
44 business financial centers growing
to over 50 by the end of 2008
35

36
44 Existing Business
Financial Centers
Assets $238 million
Loans $157 million
Deposits $190 million
Locations in Manhattan Beach,
Marina del Rey, El Segundo and Gardena.
37

Stockton
Modesto
Merced
Santa Clarita
Encino
Century City
Santa Fe Springs
Anaheim
Torrance
Newport Beach
Temecula
38
Demand Deposits
Lower cost time/interest
bearing deposits
39
Marketing Focus
Business Expertise
40

Medical/Healthcare
Property Management/
Homeowner’s Associations
Professional Services (Law firms,
Insurance brokers, CPA firms)
Title/Escrow
Non-Profit Corporations
Government Services
41

Citizens Sweep Manager
Preferred Choice Banking
Citizens Automated Deposit
42
Target: business
clients with
medium six figure
deposit balances
or higher.
43

Target: individuals
and businesses with
deposit balances of
$25,000 or greater.
44

Target: “premium”
business clients
and prospects.
45

46
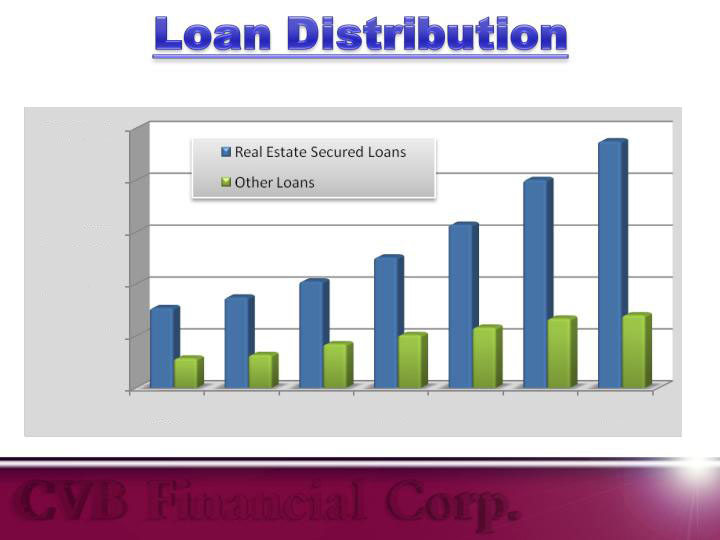
Real Estate Secured Loans vs. Other Loans
2,500,000
2,000,000
1,500,000
1,000,000
500,000
-
2000
2001
2002
2003
2004
2005
2006
47

Commercial and Industrial Lending (C&I)
Real Estate Lending
Small Business Lending
(credit scoring up to $250,000)
Home/Business Equity Lines of Credit
Asset Based Lending
SBA Lending
Dairy and Livestock Industries Group
Municipal Leasing
Golden West Financial Services
Equipment & Vehicle Leasing
48
Trust, Asset Management & Brokerage
Real Estate Loan Brokering
49

Non-Interest Expense
Net Interest Income + Non-Interest Income
Efficiency Ratio
=
70.00
65.00
60.00
55.00
50.00
45.00
40.00
1996
1997
1998
1999
2000
2001
2002
2003
2004
2005
2006
50

Increase Demand Deposits
• Deposit Rich Industries
• Technology/Treasury Management Products
• Deposit Sales Incentives
Increase Variable Rate Lending
• Commercial & Industrial
• Construction/ABL/Dairy & Livestock, etc…
• Utilization of interest rate swaps
51
De-Leverage
• $50 million per month available to pay debt or fund loans
Fee Income
•Trust, Asset Management & Brokerage
• Real Estate Loan Brokering
Geographic Expansion
52
• Share price as of June 19, 2007 for CVBF is
$10.13, 34% below its high of $15.34.
• Excellent asset quality.
• CVBF will greatly benefit from a decline in
short-term interest rates.
• Acquisition of First Coastal is accretive to
earnings.
53
• The dominant community bank in its markets
• The fastest growing markets in California & Nation
• Strong capital position
• Excellent credit quality
• Consistent superior returns
- well above those of its peers
• Attractive dividends
• Recognized locally and nationally for superior
business and financial performance
54
55