EXHIBIT 99.1
Exhibit 99.1
CVB Financial Corp.
December 2011
1
Safe Harbor
Certain matters set forth herein (including the exhibits hereto) constitute forward-looking statements within the meaning of the Private Securities Litigation Reform Act of 1995, including forward-looking statements relating to the Company’s current business plan and expectations regarding future operating results. These forward-looking statements are subject to risks and uncertainties that could cause actual results, performance or achievements to differ materially from those projected. These risks and uncertainties include, but are not limited to, local, regional, national and international economic conditions and events and the impact they may have on us and our customers; ability to attract deposits and other sources of liquidity; oversupply of inventory and continued deterioration in values of California real estate, both residential and commercial; a prolonged slowdown in construction activity; changes in the financial performance and/or condition of our borrowers; changes in the level of non-performing assets and charge-offs; the effect of changes in laws and regulations (including laws and regulations concerning taxes, banking, securities, executive compensation and insurance) with which we and our subsidiaries must comply; changes in estimates of future reserve requirements based upon the periodic review thereof under relevant regulatory and accounting requirements; inflation, interest rate, securities market and monetary fluctuations; political instability; acts of war or terrorism, or natural disasters, such as earthquakes, or the effects of pandemic flu; the timely development and acceptance of new banking products and services and perceived overall value of these products and services by users; changes in consumer spending, borrowing and savings habits; technological changes; the ability to increase market share and control expenses; changes in the competitive environment among financial and bank holding companies and other financial service providers; continued volatility in the credit and equity markets and its effect on the general economy; the effect of changes in accounting policies and practices, as may be adopted by the regulatory agencies, as well as the Public Company Accounting Oversight Board, the Financial Accounting Standards Board and other accounting standard setters; changes in our organization, management, compensation and benefit plans; the costs and effects of legal and regulatory developments including the resolution of legal proceedings or regulatory or other governmental inquiries and the results of regulatory examinations or reviews; our success at managing the risks involved in the foregoing items and other factors set forth in the Company’s public reports including its Annual Report on Form 10-K for the year ended December 31, 2010, and particularly the discussion of risk factors within that document. The Company does not undertake, and specifically disclaims any obligation to update any forward-looking statements to reflect occurrences or unanticipated events or circumstances after the date of such statements except as required by law.
2
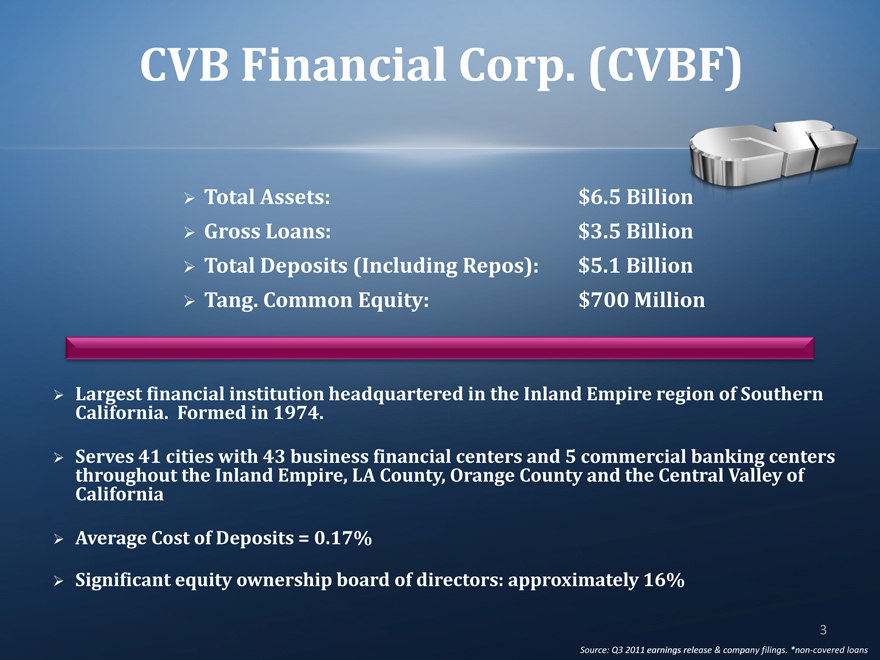
CVB Financial Corp. (CVBF)
Total Assets: Gross Loans:
Total Deposits (Including Repos): Tang. Common Equity:
$6.5 Billion $3.5 Billion $5.1 Billion $700 Million
Largest California. financial Formed institution in 1974. headquartered in the Inland Empire region of Southern throughout Serves 41 cities the Inland with 43 Empire, business LA financial County, Orange centers County and 5 commercial and the Central banking Valley centers of California
Average Cost of Deposits = 0.17%
Significant equity ownership board of directors: approximately 16%
3
Source: Q3 2011 earnings release & company filings. *non-covered loans
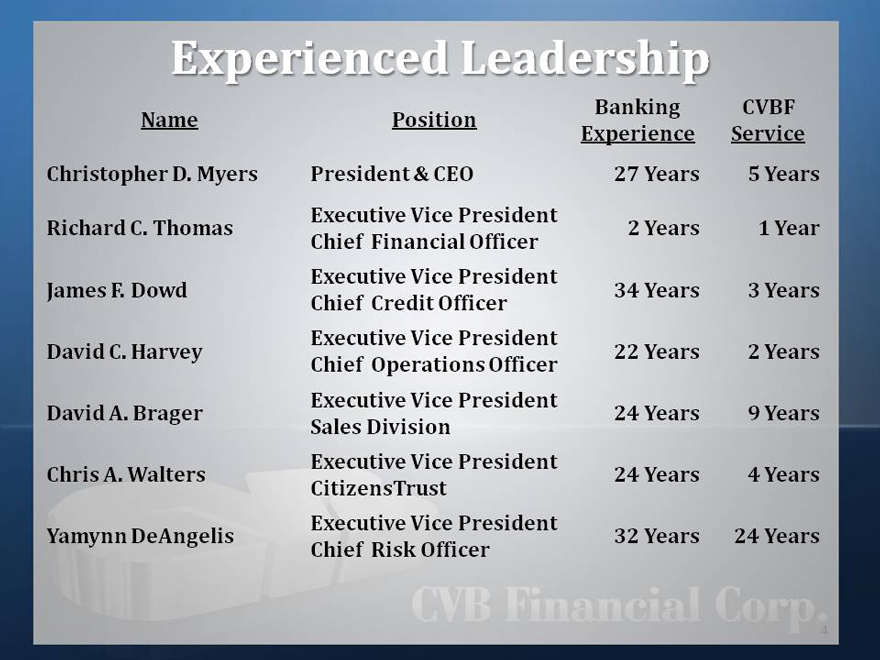
Experienced Leadership
Name Position Banking CVBF
Experience Service
Christopher D. Myers President & CEO 27 Years 5 Years
Executive Vice President
Richard C. Thomas 2 Years 1 Year
Chief Financial Officer
Executive Vice President
James F. Dowd 34 Years 3 Years
Chief Credit Officer
Executive Vice President
David C. Harvey 22 Years 2 Years
Chief Operations Officer
Executive Vice President
David A. Brager 24 Years 9 Years
Sales Division
Executive Vice President
Chris A. Walters 24 Years 4 Years
CitizensTrust
Executive Vice President
Yamynn DeAngelis 32 Years 24 Years
Chief Risk Officer
4
Who is
CVB Financial Corp.?
5
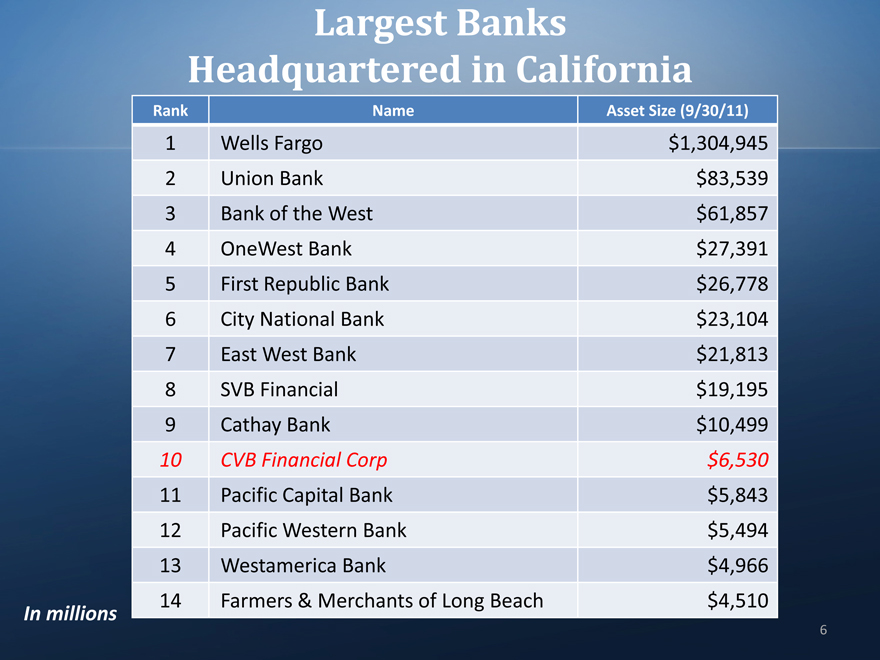
Largest Banks Headquartered in California
Rank Name Asset Size (9/30/11)
1 Wells Fargo $1,304,945
2 Union Bank $83,539
3 Bank of the West $61,857
4 OneWest Bank $27,391
5 First Republic Bank $26,778
6 City National Bank $23,104
7 East West Bank $21,813
8 SVB Financial $19,195
9 Cathay Bank $10,499
10 CVB Financial Corp $6,530
11 Pacific Capital Bank $5,843
12 Pacific Western Bank $5,494
13 Westamerica Bank $4,966
14 Farmers & Merchants of Long Beach $4,510
In millions
6
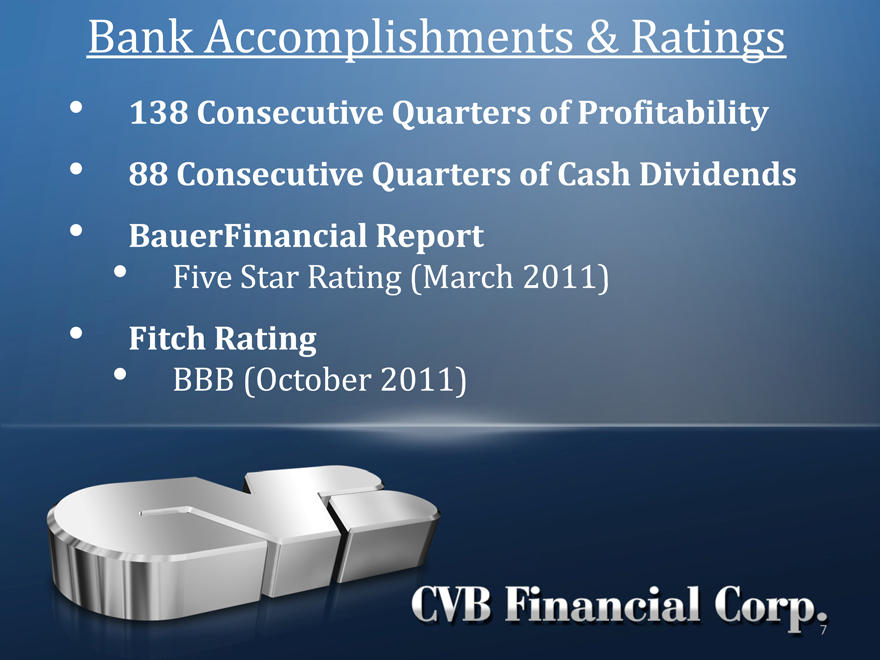
Bank
138 Consecutive Quarters of Profitability
88 Consecutive Quarters of Cash Dividends BauerFinancial Report
Five Star Rating (March 2011)
Fitch Rating
BBB (October 2011)
CVB Financial Corp.
Our Markets
8
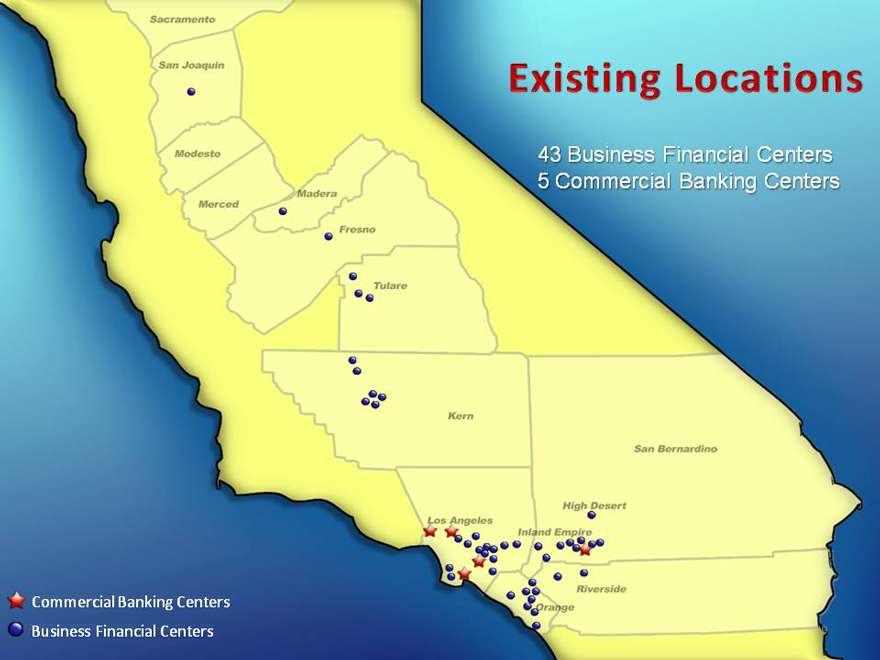
Existing Locations
43 Business Financial Centers
5 Commercial Banking Centers
Commercial Banking Centers Business Financial Centers
9
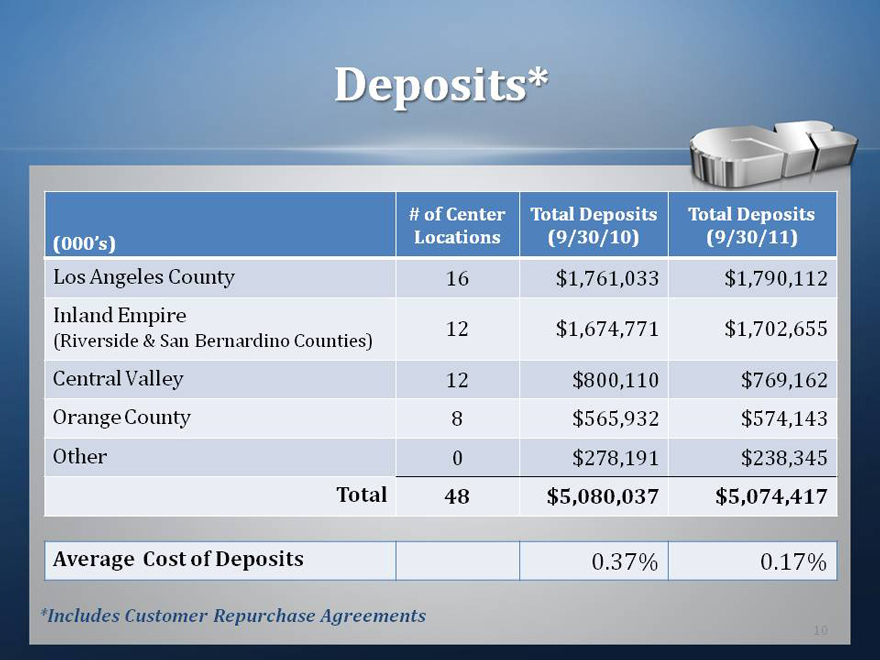
Deposits*
# of Center Total Deposits Total Deposits
(000’s) Locations(9/30/10)(9/30/11)
Los Angeles County 16 $17610331790112,761,033 $1,790,112
Inland Empire 12 $1,674,771
(Riverside & San Bernardino Counties)
Central Valley 12 $800110800,110 $769,162
Orange County 8 $565,932
Other 0 $278,191
Total 48 $5,080,037 $5,074,417
Average Cost of Deposits 037%0.37% 017%0.17%
*Includes Customer Repurchase Agreements
10
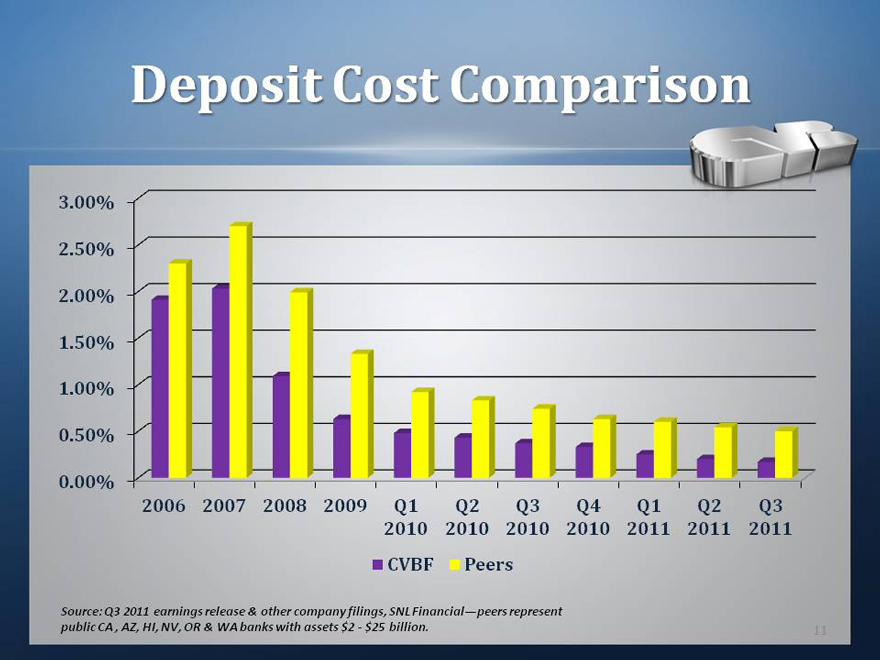
Deposit Cost Comparison
3.00% 2.50% 2.00% 1.50% 1.00% 0.50% 0.00%
2006 2007 2008 2009 Q1 Q2 Q3 Q4 Q1 Q2 Q3
2010 2010 2010 2010 2011 2011 2011
CVBF Peers
Source: Q3 2011 earnings release & other company filings, SNL Financial—peers represent public CA , AZ, HI, NV, OR & WA banks with assets $2—$25 billion.
11
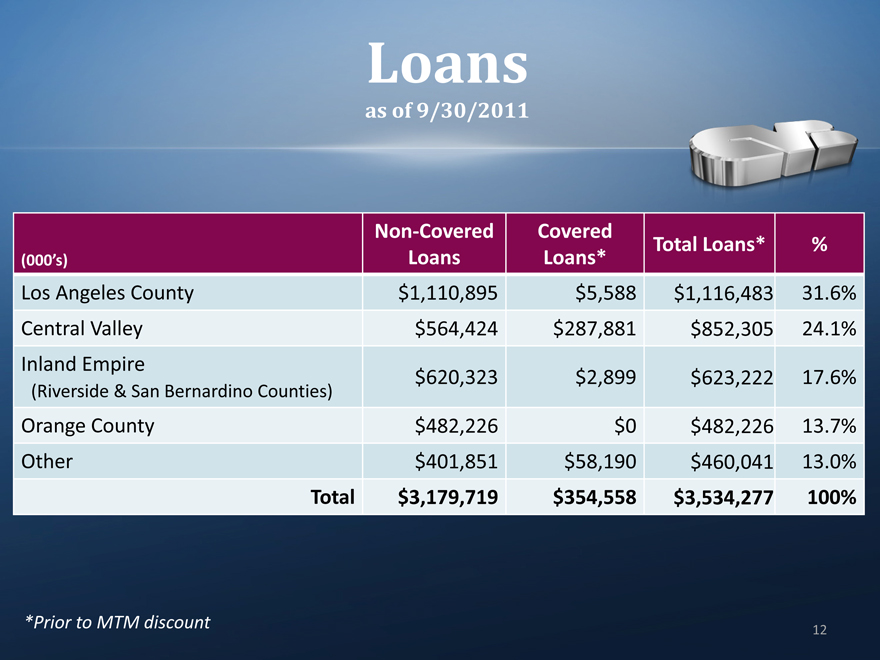
Loans
as of 9/30/2011
Non-Covered Covered Total Loans* %
(000’s) Loans Loans*
Los Angeles County $1,110,895 $5,588 $1,116,483 31.6%
Central Valley $564,424 $287,881 $852,305 24.1%
Inland Empire $620,323 $2,899 $623,222 17.6%
(Riverside & San Bernardino Counties)
Orange County $482,226 $0 $482,226 13.7%
Other $401,851 $58,190 $460,041 13.0%
Total $3,179,719 $354,558 $3,534,277 100%
*Prior to MTM discount
12
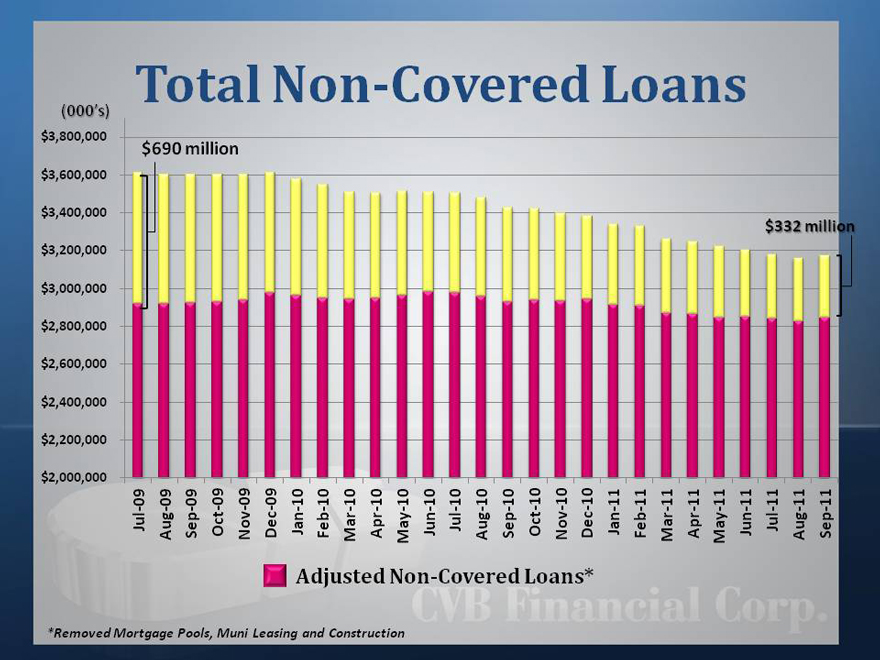
Total Non-Covered Loans
(000’s) $3,800,000
$3,600,000 $3,400,000 $3,200,000 $3,000,000 $2,800,000 $2,600,000 $2,400,000 $2,200,000
$2,000,000
$690 million
$332 million
Jul-09 Aug-09 Sep-09 Oct-09 Nov-09 Dec-09 Jan-10 Feb-10 Mar-10 Apr-10 May-10 Jun-10 Jul-10 Aug-10 Sep-10 Oct-10 Nov-10 Dec-10 Jan-11 Feb-11 Mar-11 Apr-11 May-11 Jun-11 Jul-11 Aug-11 Sep-11
Adjusted Non-Covered Loans*
*Removed Mortgage Pools, Muni Leasing and Construction
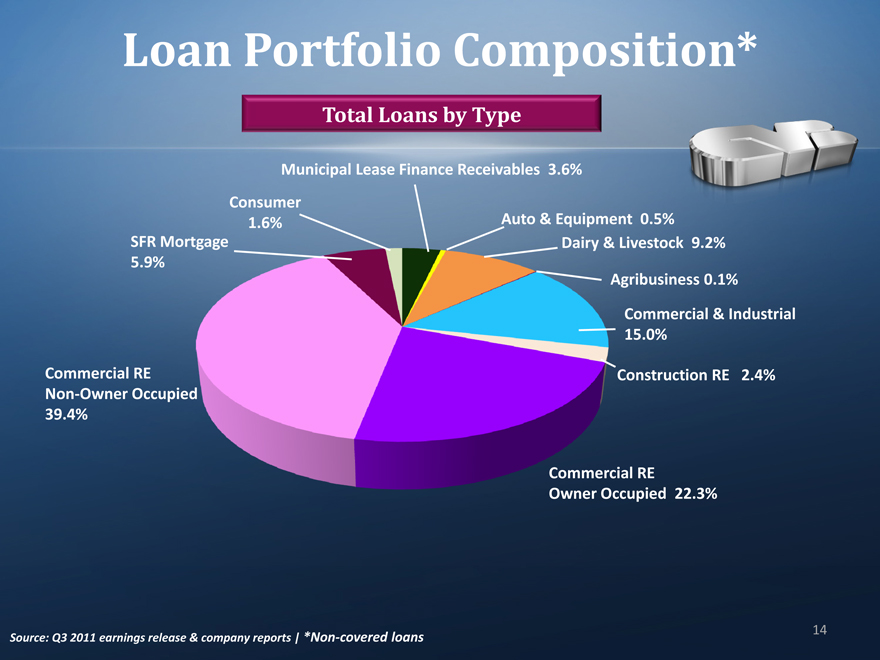
Loan Portfolio Composition*
Total Loans by Type
Municipal Lease Finance Receivables 3.6%
Consumer 1.6%
SFR Mortgage 5.9%
Commercial RE Non-Owner Occupied 39.4%
Auto & Equipment 0.5%
Dairy & Livestock 9.2%
Agribusiness 0.1%
Commercial & Industrial 15.0%
Construction RE 2.4%
Commercial RE
Owner Occupied 22.3%
Source: Q3 2011 earnings release & company reports | *Non-covered loans
14
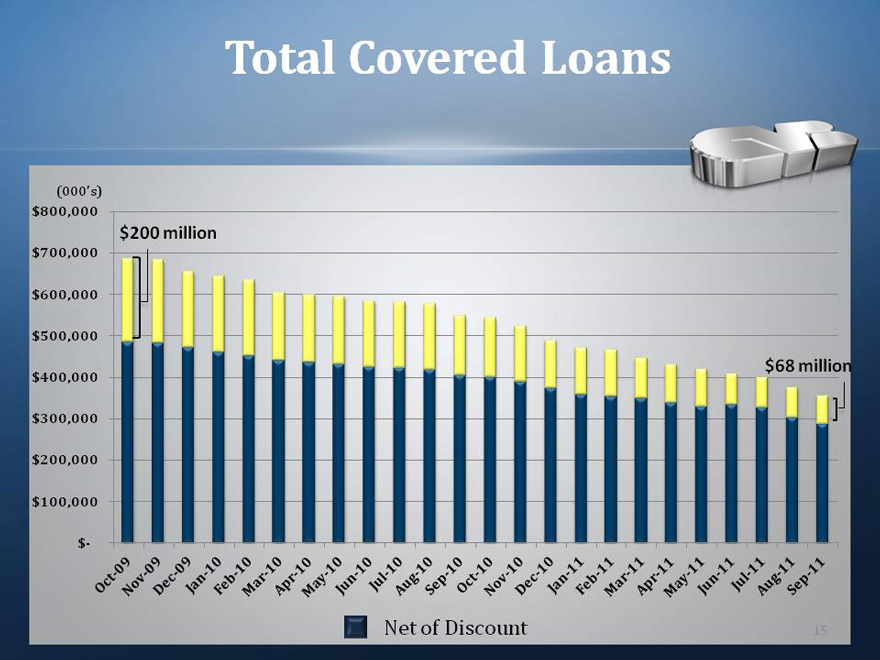
Total Covered Loans
‘ $800,000
$700,000 $600,000 $500,000 $400,000 $300,000 $200,000 $100,000 $-
$200 million
$68 million
Oct-09 Nov-09 Dec-09 Jan-10 Feb-10 Mar-10 Apr-10 May-10 Jun-10 Jul-10 Aug-10 Sep-10 Oct-10 Nov-10 Dec-10 Jan-11 Feb-11 Mar-11 Apr-11 May-11 Jun-11 Jul-11 Aug-11 Sep-11
Net of Discount
15
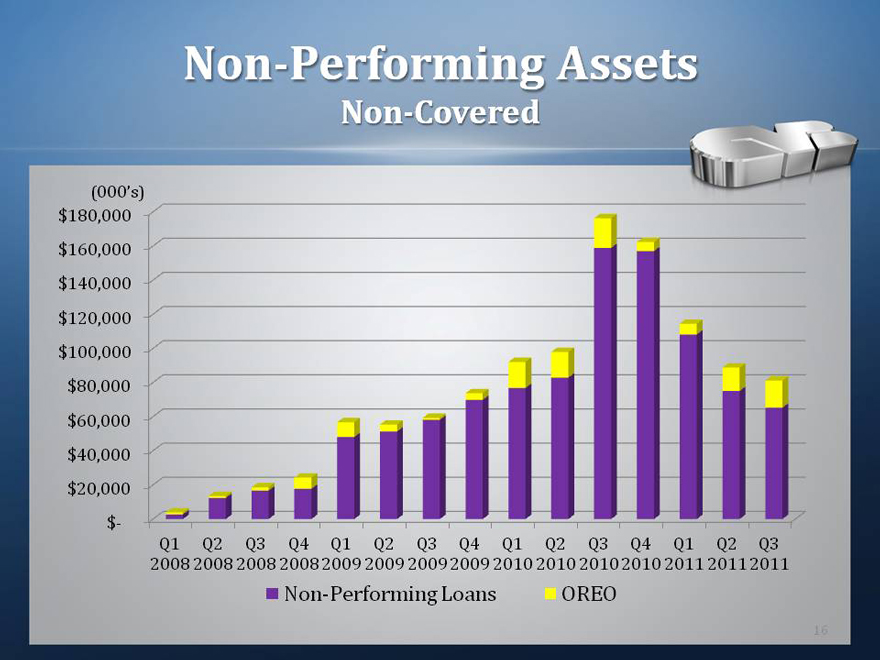
Non-Performing Assets
Non-Covered
(000’s) $180,000 $160,000 $140,000 $120,000 $100,000 $80,000 $60,000 $40,000 $20,000 $-
Q1 Q2 Q3 Q4 Q1 Q2 Q3 Q4 Q1 Q2 Q3 Q4 Q1 Q2 Q3 2008 2008 2008 2008 2009 2009 2009 2009 2010 2010 2010 2010 2011 2011
Non-Performing OREO
16
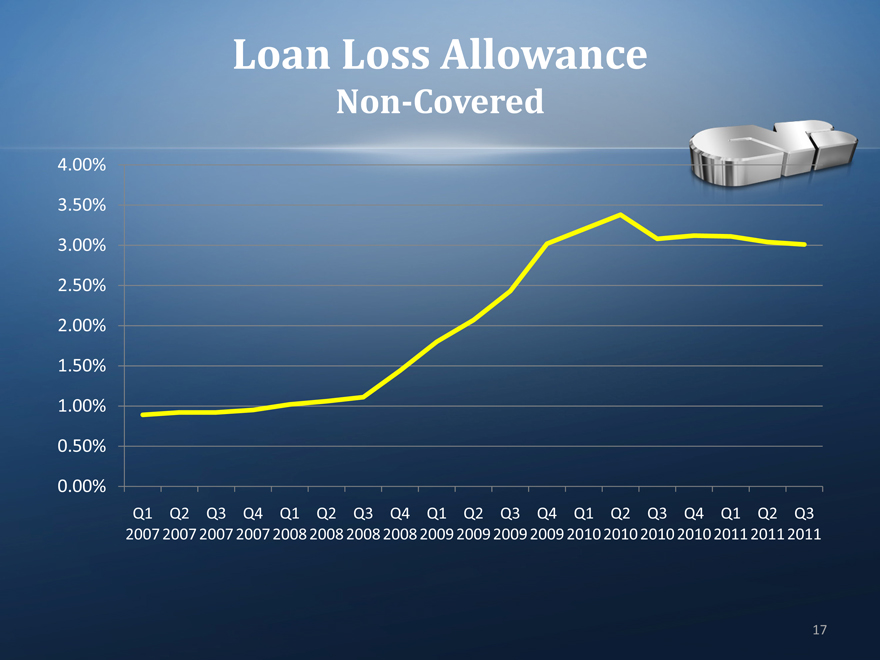
Loan Loss Allowance
Non-Covered
4.00% 3.50% 3.00% 2.50% 2.00% 1.50% 1.00% 0.50% 0.00%
Q1 Q2 Q3 Q4 Q1 Q2 Q3 Q4 Q1 Q2 Q3 Q4 Q1 Q2 Q3 Q4 Q1 Q2 Q3 2007 2007 2007 2007 2008 2008 2008 2008 2009 2009 2009 2009 2010 2010 2010 2010 2011 2011 2011
17
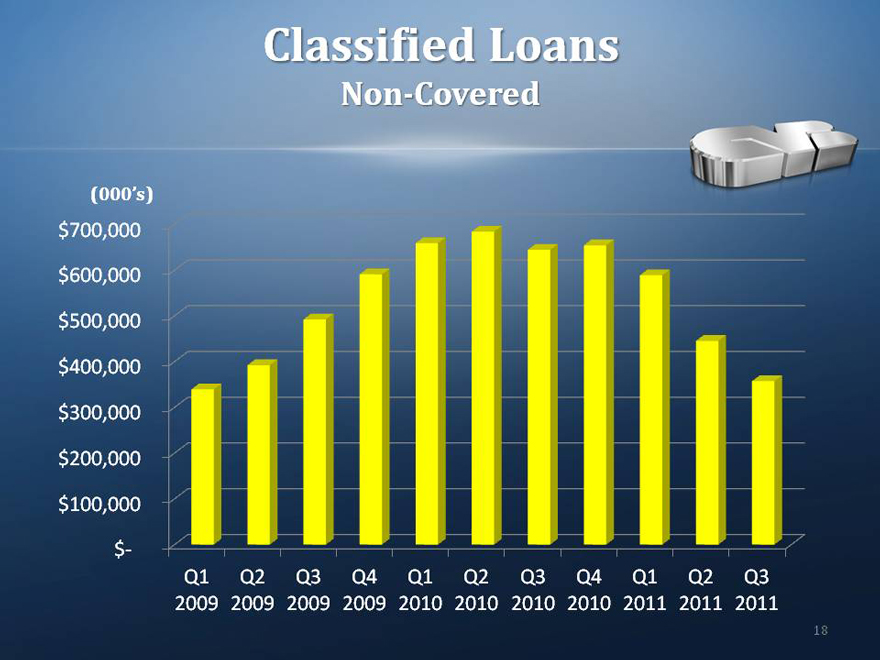
Classified Loans
Non-Covered
(000’s) $700,000 $600,000 $500,000 $400,000 $300,000 $200,000 $100,000 $-
Q1 Q2 Q3 Q4 Q1 Q2 Q3 Q4 Q1 Q2 Q3 2009 2009 2009 2009 2010 2010 2010 2010 2011 2011 2011
18
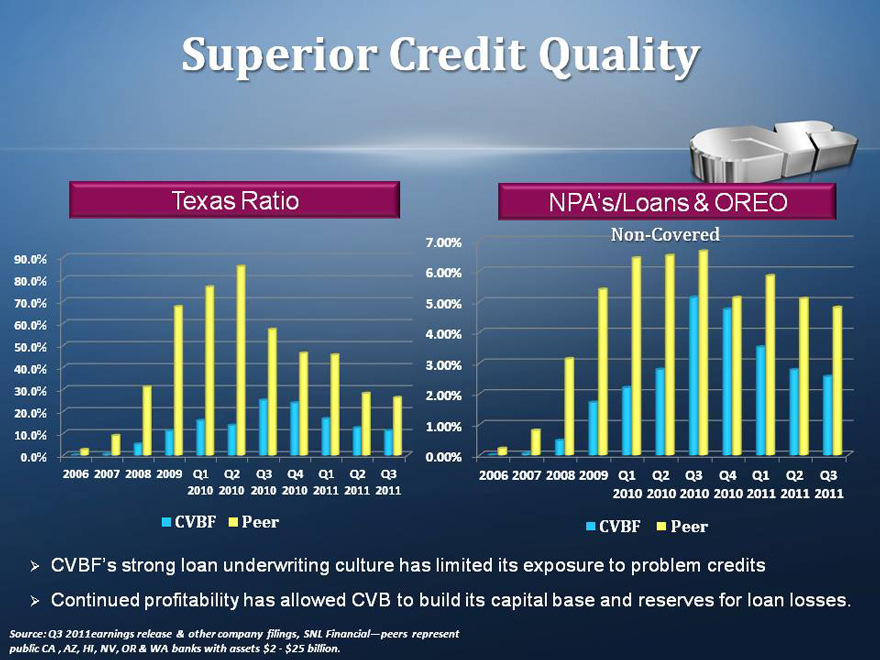
Superior Credit Quality
Texas Ratio
90.0% 80.0% 70.0% 60.0% 50.0% 40.0% 30.0% 20.0% 10.0% 0.0%
2006 2007 2008 2009 Q1 Q2 Q3 Q4 Q1 Q2 Q3
2010 2010 2010 2010 2011 2011 2011
CVBF Peer
NPA’s/Loans & OREO
7.00% 6.00% 5.00% 4.00% 3.00% 2.00% 1.00% 0.00%
Non —
2006 2007 2008 2009 Q1 Q2 Q3 Q4 Q1 Q2 Q3
2010 2010 2010 2010 2011 2011 2011
CVBF Peer
CVBF’s strong loan underwriting culture has limited its exposure to problem credits
Continued profitability has allowed CVB to build its capital base and reserves for loan losses.
Source: Q3 2011 earnings release & other company filings, SNL Financial—peers represent public CA , AZ, HI, NV, OR & WA banks with assets $2—$25 billion.
CVB Financial Corp.
Profits
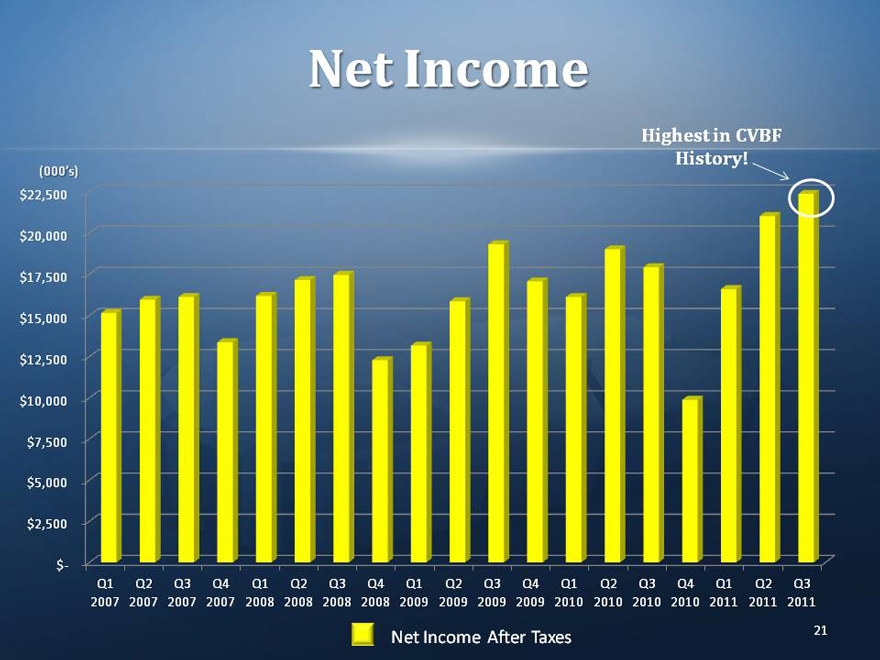
Net Income
Highest in CVBF
History!
(000’s)
$22,500
$20,000
$17,500
$15,000
$12,500
$10,000
$7,500
$5,000
$2,500
$-
Q1 Q2 Q3 Q4 Q1 Q2 Q3 Q4 Q1 Q2 Q3 Q4 Q1 Q2 Q3 Q4 Q1 Q2 Q3
2007 2007 2007 2007 2008 2008 2008 2008 2009 2009 2009 2009 2010 2010 2010 2010 2011 2011 2011
Net Income After Taxes
21
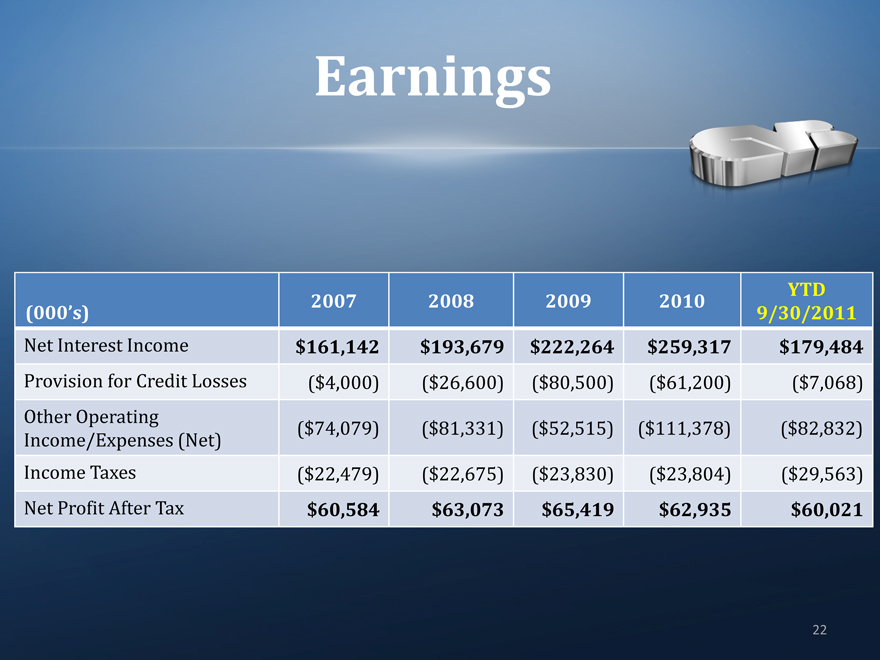
Earnings
2007 2008 2009 2010 YTD
(000’s) 9/30/2011
Net Interest Income $161,142 $193,679 $222,264 $259,317 $179,484
Provision for Credit Losses ($4,000) ($26,600) ($80,500) ($61,200) ($7,068)
Other Operating ($74,079) ($81,331) ($52,515) ($111,378) ($82,832)
Income/Expenses (Net)
Income Taxes Income Taxes ($22,479) ($22,675) ($23,830) ($23,804) ($29,563)
Net Profit After Tax $60,584 $63,073 $65,419 $62,935 $60,021
22
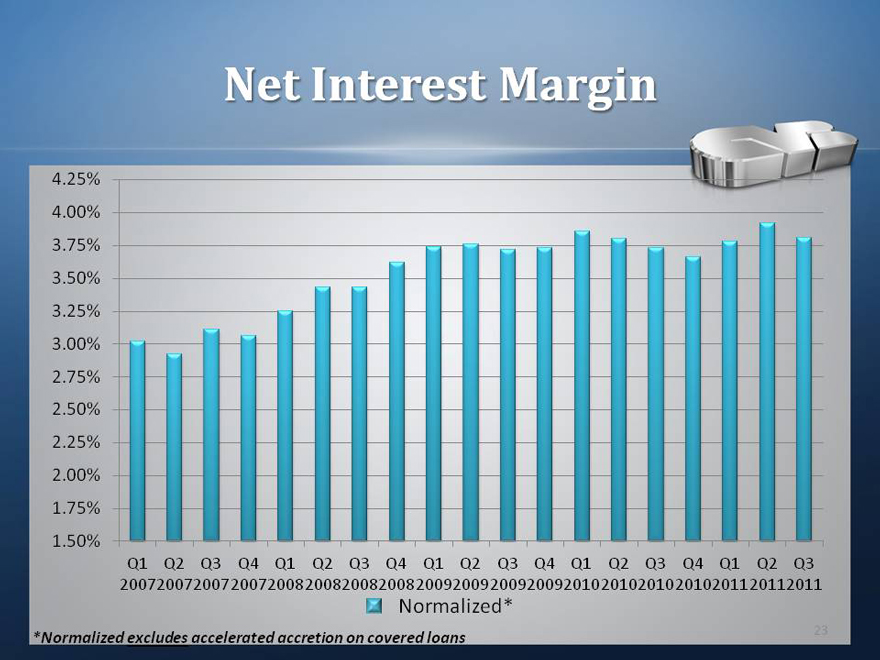
Net Interest Margin
4.25%
4.00%
3.75%
3.50%
3.25%
3.00%
2.75%
2.50%
2.25%
2.00%
1.75%
1.50%
Q1 Q2 Q3 Q4 Q1 Q2 Q3 Q4 Q1 Q2 Q3 Q4 Q1 Q2 Q3 Q4 Q1 Q2 Q3
2007 2007 2007 2007 2008 2008 2008 2008 2009 2009 2009 2009 2010 2010 2010 2010 2011 2011 2011
Normalized*
*Normalized excludes accelerated accretion on covered loans
23
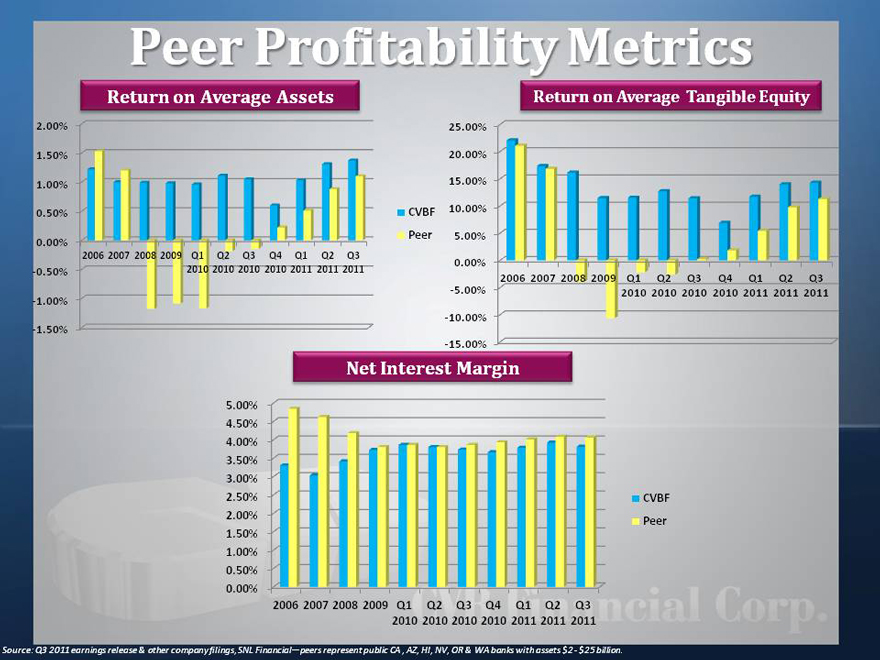
Peer Profitability Metrics
Return on Average Assets
2.00%
1.50%
1.00%
0.50% CVBF
0.00% Peer
2006 2007 2008 2009 Q1 Q2 Q3 Q4 Q1 Q2 Q3
-0.50% 2010 2010 2010 2010 2011 2011 2011
-1.00%
-1.50%
Return on Average Tangible Equity
25.00%
20.00%
15.00%
10.00%
5.00%
0.00%
2006 2007 2008 2009 Q1 Q2 Q3 Q4 Q1 Q2 Q3
-5.00% 2010 2010 2010 2010 2011 2011 2011
-10.00%
-15.00%
Net Interest Margin
5.00%
4.50%
4.00%
3.50%
3.00%
2.50% CVBF
2.00%
1.50% Peer
1.00%
0.50%
0.00%
2006 2007 2008 2009 Q1 Q2 Q3 Q4 Q1 Q2 Q3
2010 2010 2010 2010 2011 2011 2011
Source: Q3 2011 earnings release & other company filings, SNL Financial—peers represent public CA , AZ, HI, NV, OR & WA banks with assets $2—$25 billion.
CVB Financial Corp.
Capital
25
CVB Financial Corp.
Capital
25
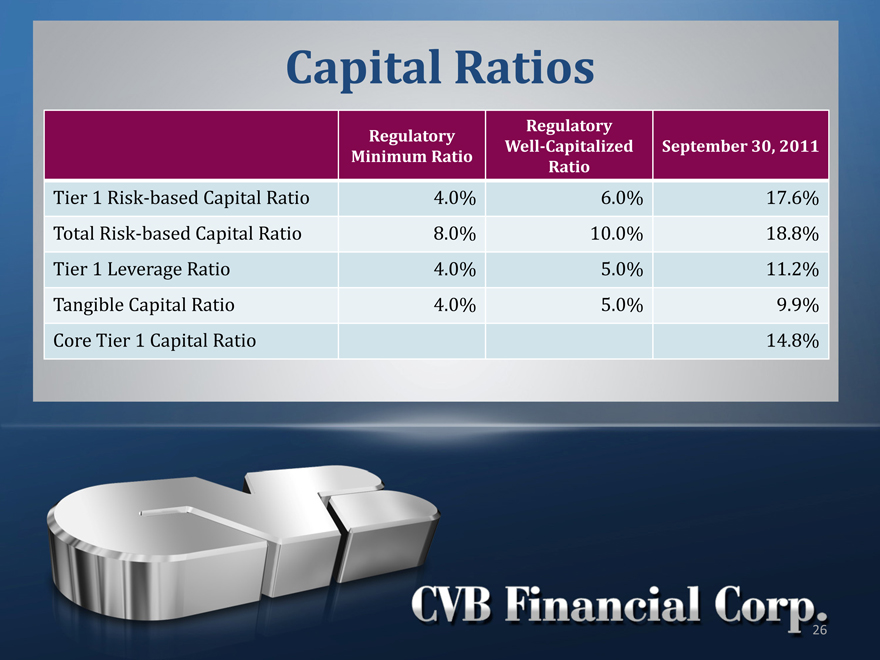
Capital Ratios
Regulatory Minimum Ratio
Regulatory Well-Capitalized Ratio September 30, 2011
Tier 1 Risk-based Capital Ratio 4.0%
Total Risk-based Capital Ratio 8.0%
Tier 1 Leverage Ratio 4.0%
Tangible Capital Ratio 4.0%
Core Tier 1 Capital Ratio
CVB Financial Corp.
26
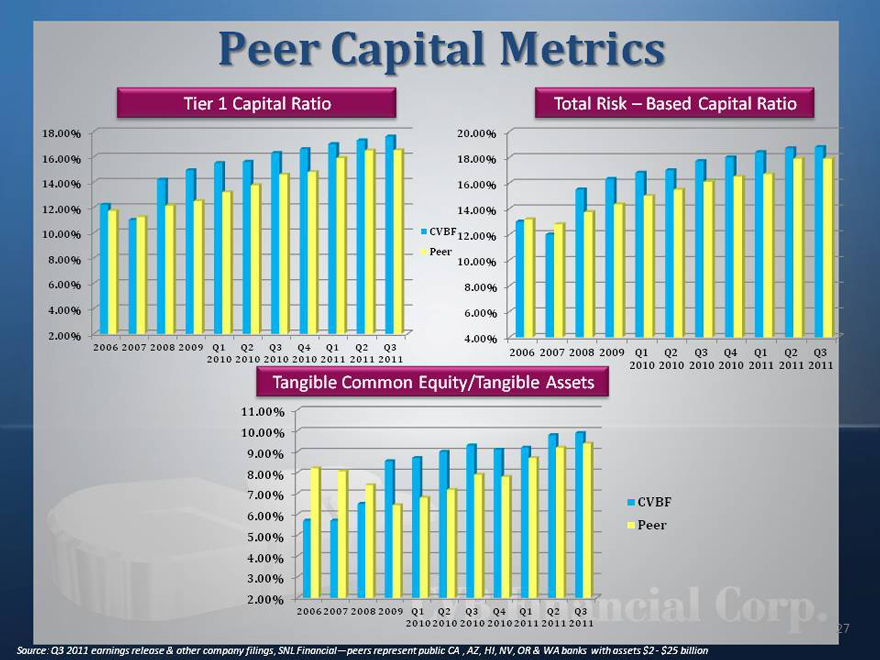
Peer Capital Metrics
Tier 1 Capital Ratio
18.00%
16.00%
14.00%
12.00%
10.00% CVBF
8.00% Peer
6.00%
4.00%
2.00%
2006 2007 2008 2009 Q1 Q2 Q3 Q4 Q1 Q2 Q3
2010 2010 2010 2010 2011 2011 2011
Total Risk – Based Capital Ratio
20.00%
18.00%
16.00%
14.00%
12.00%
10.00%
8.00%
6.00%
4.00%
2006 2007 2008 2009 Q1 Q2 Q3 Q4 Q1 Q2 Q3
2010 2010 2010 2010 2011 2011 2011
Tangible Common Equity/Tangible Assets
11.00%
10.00%
9.00%
8.00%
7.00%
6.00% CVBF
5.00% Peer
4.00%
3.00%
2.00%
2006 2007 2008 2009 Q1 Q2 Q3 Q4 Q1 Q2 Q3
2010 2010 2010 2010 2011 2011 2011
Source: Q3 2011 earnings release & other company filings, SNL Financial—peers represent public CA , AZ, HI, NV, OR & WA banks with assets $2 - $25 billion
27
CVB Financial Corp.
Securities/Investments
28
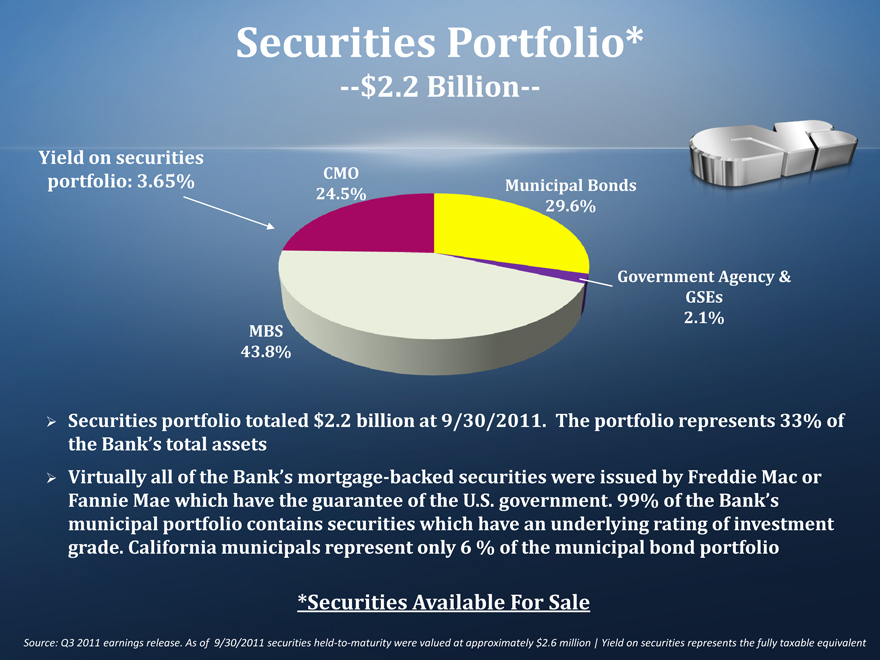
Securities Portfolio*
—$2.2 Billion—
Yield on securities portfolio: 3.65%
CMO 24.5%
Municipal Bonds 29.6%
MBS 43.8%
Government Agency & GSEs 2.1%
??Securities portfolio totaled $2.2 billion at 9/30/2011. The portfolio represents 33% of the Bank’s total assets
??Virtually all of the Bank’s mortgage-backed securities were issued by Freddie Mac or Fannie Mae which have the guarantee of the U.S. government. 99% of the Bank’s municipal portfolio contains securities which have an underlying rating of investment grade. California municipals represent only 6 % of the municipal bond portfolio
*Securities Available For Sale
Source: Q3 2011 earnings release. As of 9/30/2011 securities held-to-maturity were valued at approximately $2.6 million | Yield on securities represents the fully taxable equivalent
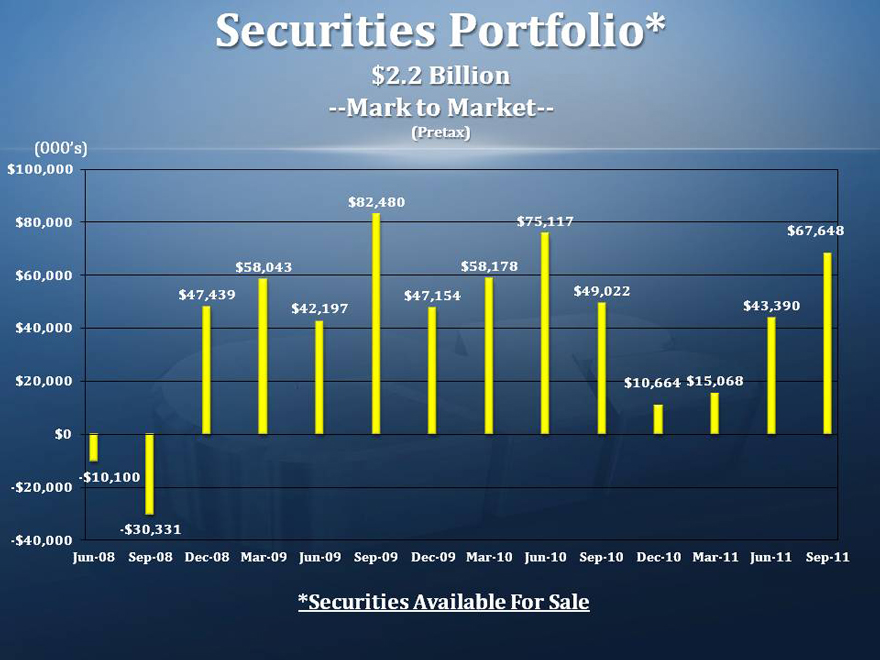
Securities Portfolio*
$2.2 Billion
—Mark to Market—
(Pretax)
(000’s)
$100,000
$82,480
$80,000 $75,117 $67,648
$60,000 $58,043 $58,178
$47,439 $47,154 $49,022
$42,197 $43,390
$40,000
$20,000 $10,664 $15,068
$0
-$20,000 -$10,100
-$40,000 -$30,331
Jun-08 Sep-08 Dec-08 Mar-09 Jun-09 Sep-09 Dec-09 Mar-10 Jun-10 Sep-10 Dec-10 Mar-11 Jun-11 Sep-11
*Securities Available For Sale
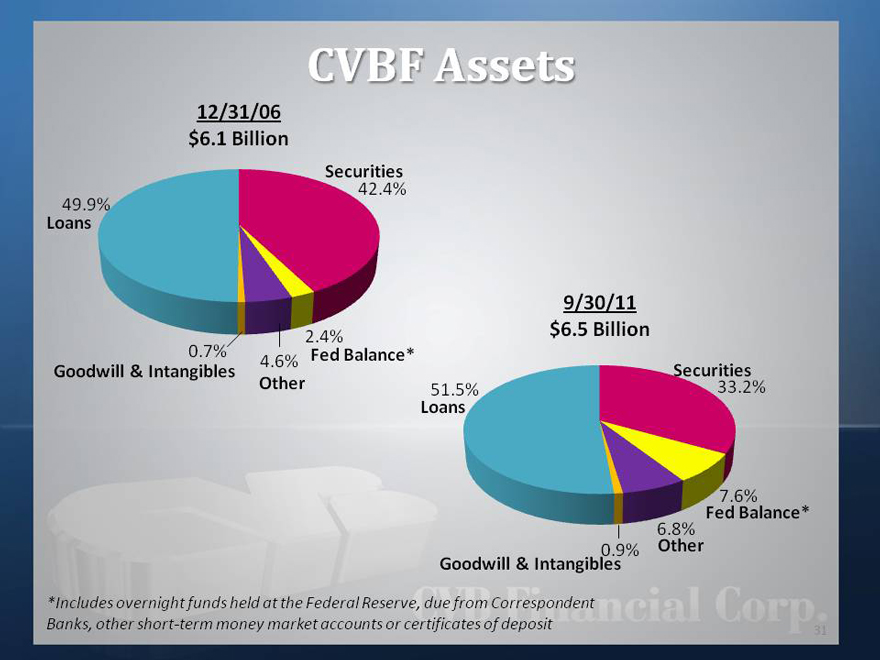
CVBF Assets
12/31/06 $6.1 Billion
Loans 49.9%
Securities 42.4%
0.7%
Goodwill & Intangibles
4.6%
Other
2.4% Fed Balance*
9/30/11 $6.5 Billion
51.5%
Loans
Securities
33.2%
0.9%
Goodwill & Intangibles
6.8%
Other
7.6%
Fed Balance*
*Includes overnight funds held at the Federal Reserve, due from Correspondent Banks, other short-term money market accounts or certificates of deposit
31
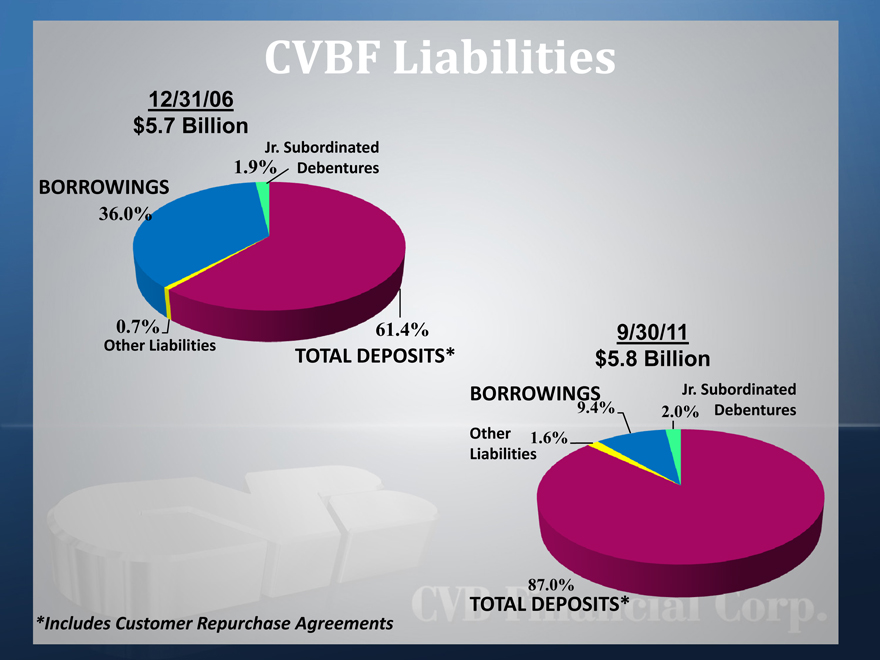
CVBF Liabilities
12/31/06 $5.7 Billion
BORROWINGS
36.0%
Jr. Subordinated
1.9% Debentures
0.7%
Other Liabilities
61.4%
TOTAL DEPOSITS*
9/30/11 $5.8 Billion
BORROWINGS
9.4%
Other 1.6% Liabilities
Jr. Subordinated
2.0% Debentures
87.0%
TOTAL DEPOSITS*
*Includes Customer Repurchase Agreements
CVB Financial Corp.
Recent Updates & Highlights
33
CVB Financial Corp. (CVBF)
—3rd Quarter Highlights—
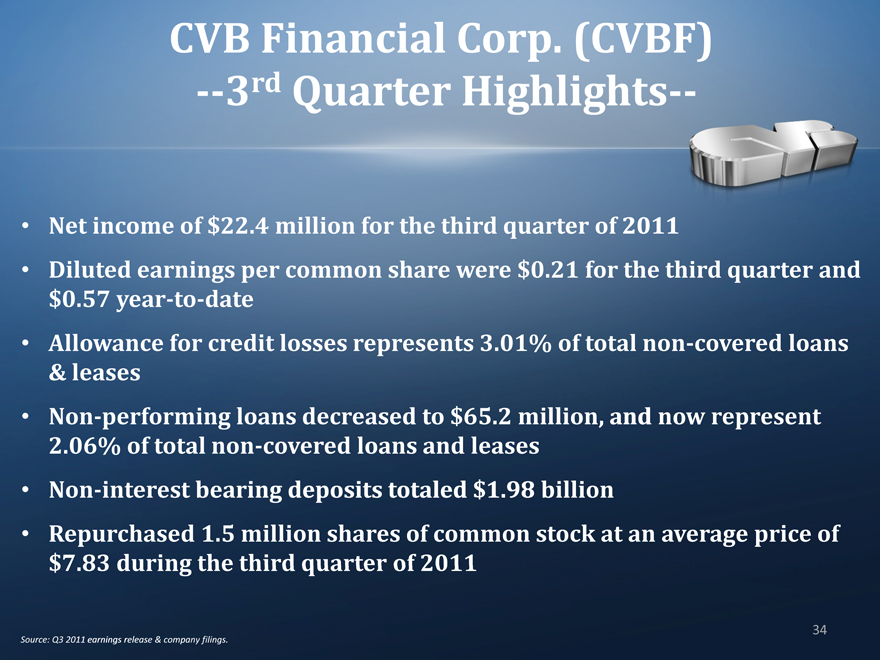
• Net income of $22.4 million for the third quarter of 2011
• Diluted earnings per common share were $0.21 for the third quarter and $0.57 year-to-date
• Allowance for credit losses represents 3.01% of total non-covered loans & leases
• Non-performing loans decreased to $65.2 million, and now represent 2.06% of total non-covered loans and leases
• Non-interest bearing deposits totaled $1.98 billion
• Repurchased 1.5 million shares of common stock at an average price of $7.83 during the third quarter of 2011
Source: Q3 2011 earnings release & company filings.
34
Recent Updates
• FDIC and DFI completed Safety and Soundness Field Examination in mid-July.
CVB Financial Corp.
35
CVB Financial Corp.
Our Growth Strategy
36
Our Vision
Citizens Business Bank will strive to become the dominant financial services company operating throughout the state of California, servicing the comprehensive financial needs medium of successful small to medium sized businesses and their owners.
37
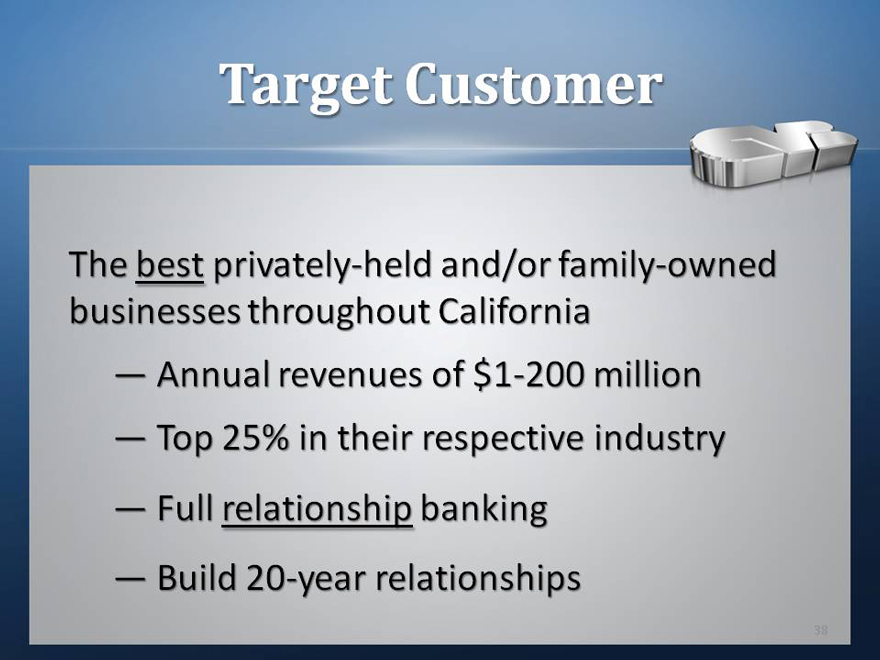
Target Customer
The best privately-held and/or family-owned businesses throughout California
Annual revenues of $1-200 million
Top 25% in their respective industry Full relationship banking
Build 20-year relationships
38
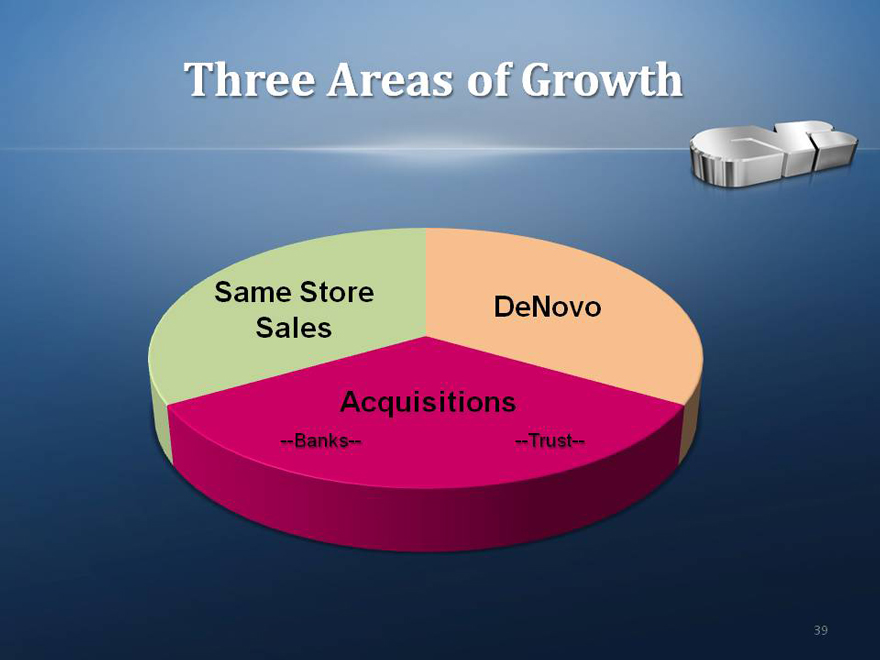
Three Areas of Growth
Same Store Sales
DeNovo
Acquisitions
—Banks—
—Trust—
39
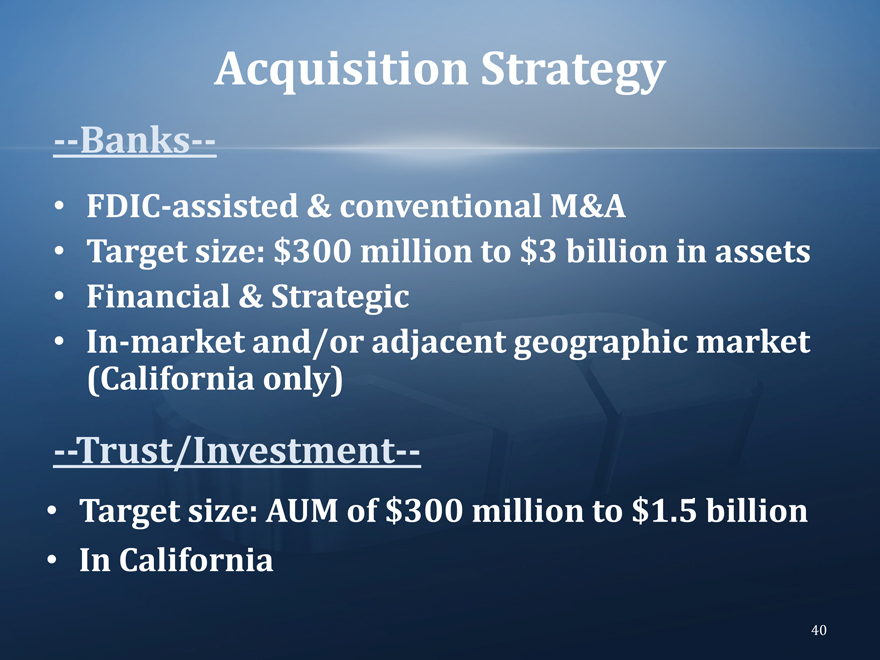
Acquisition Strategy
—Banks—
FDIC-assisted & conventional M&A
Target size: $300 million to $3 billion in assets Financial & Strategic In-market and/or adjacent geographic market (California only)
Trust/Investment—
Target size: AUM of $300 million to $1.5 billion In California
40
CVB Financial Corp.
—Four Key Objectives—
Quality Loan Growth
Non—Interest—Bearing Deposit Growth
Non—Interest – Income Growth
Expense Control
41
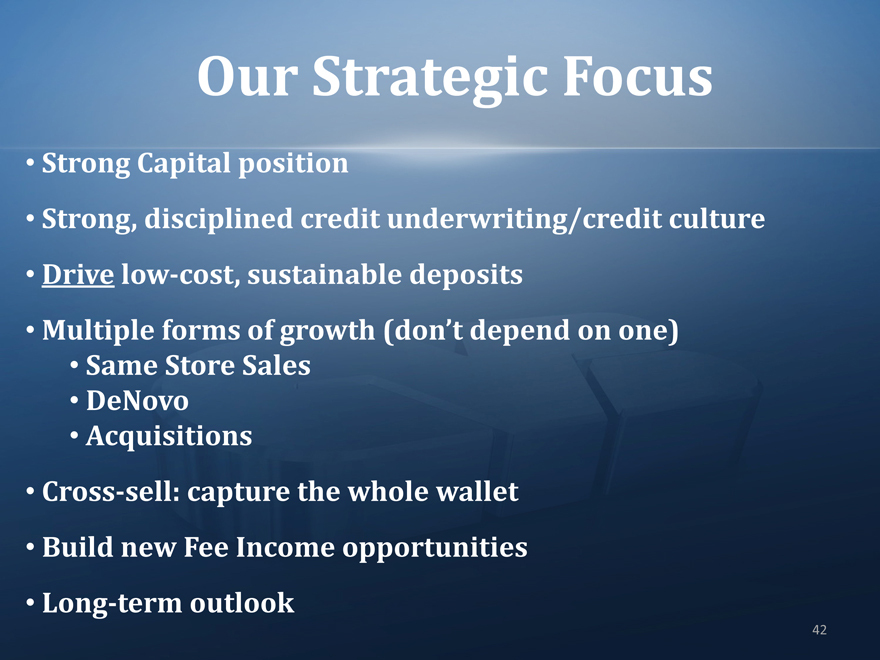
Our Strategic Focus
Strong Capital position
Strong, disciplined credit underwriting/credit culture
Drive low-cost, sustainable deposits
Multiple forms of growth (don’t depend on one)
Same Store Sales
DeNovo Acquisitions
Cross-sell: capture the whole wallet Build new Fee Income opportunities Long-term outlook
42
CVB Financial Corp.
Copy of Presentation: www.cbbank.com
43