Exhibit 99.1
Exhibit 99.1
37th Annual Shareholder’s Meeting May 16th 2012
Safe Harbor
Certain matters set forth herein (including the exhibits hereto) constitute forward-looking statements within the meaning of the Private Securities Litigation Reform Act of 1995, including forward-looking statements relating to the Company’s current business plans and expectations regarding future operating results. These forward-looking statements are subject to risks and uncertainties that could cause actual results, performance or achievements to differ materially from those projected. These risks and uncertainties include, but are not limited to, local, regional, national and international economic conditions and events and the impact they may have on us and our customers; ability to attract deposits and other sources of liquidity; oversupply of inventory and continued deterioration in values of real estate in California and other states where our bank makes loans, both residential and commercial; a prolonged slowdown in construction activity; changes in the financial performance and/or condition of our borrowers; changes in the level of non-performing assets and charge-offs; the effect of changes in laws and regulations (including laws and regulations concerning taxes, banking, business and consumer credit, securities, executive compensation and insurance) with which we and our subsidiaries must comply; changes in estimates of future reserve requirements based upon the periodic review thereof under relevant regulatory and accounting requirements; inflation, interest rate, securities market and monetary fluctuations; the availability and effectiveness of hedging instruments and strategies; political instability; acts of war or terrorism, or natural disasters, such as earthquakes, or the effects of pandemic flu; the timely development and acceptance of new banking products and services and perceived overall value of these products and services by users; changes in consumer spending, borrowing and savings habits; technological changes; threats to the stability and security of our technology hardware and software, and to the stability and security of any related vendor or customer hardware and software; the ability to increase market share and control expenses; changes in the competitive environment among financial and bank holding companies and other financial service providers; continued volatility in the credit and equity markets and its effects on the general economy; the effect of changes in accounting policies and practices, as may be adopted by the regulatory agencies, as well as the Public Company Accounting Oversight Board, the Financial Accounting Standards Board and other accounting standard setters; changes in our organization, management, compensation and benefit plans; the costs and effects of legal and regulatory developments including the resolution of legal proceedings or regulatory or other governmental inquiries and the results of regulatory examinations or reviews; our success at managing the risks involved in the foregoing items and other factors set forth in the Company’s public reports including its Annual Report on Form 10-K for the year ended December 31, 2011, and particularly the discussion of risk factors within that document. The Company does not undertake, and specifically disclaims any obligation to update any forward-looking statements to reflect occurrences or unanticipated events or circumstances after the date of such statements except as required by law.
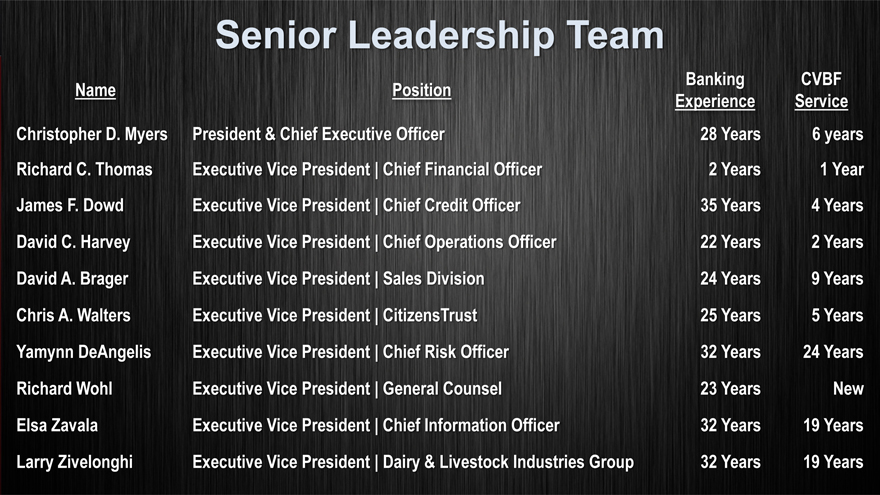
Senior Leadership Team
Name
Christopher D. Myers
Richard C. Thomas
1Year
James F. Dowd
Years
David C. Harvey
Years
David A. Brager
Years
Chris A. Walters
Years
Yamynn DeAngelis
Years
Richard Wohl
New
Elsa Zavala
Years
Larry Zivelonghi
Years
President & Chief Executive Officer
Executive Vice President
Executive Vice President
Executive Vice President
Executive Vice President
Executive Vice President
Executive Vice President
Executive Vice President
Executive Vice President
Executive Vice President
Position
28
Banking
Experience
Years
Chief Financial Officer
Chief Credit Officer
Chief Operations Officer
Sales Division
CitizensTrust
Chief Risk Officer
General Counsel
Chief Information Officer
Dairy & Livestock Industries Group
CVBF
Service
6years
2
35
22
24
25
32
23
32
32
Years
Years
Years
Years
Years
Years
Years
Years
Years
4
2
9
5
24
19
19
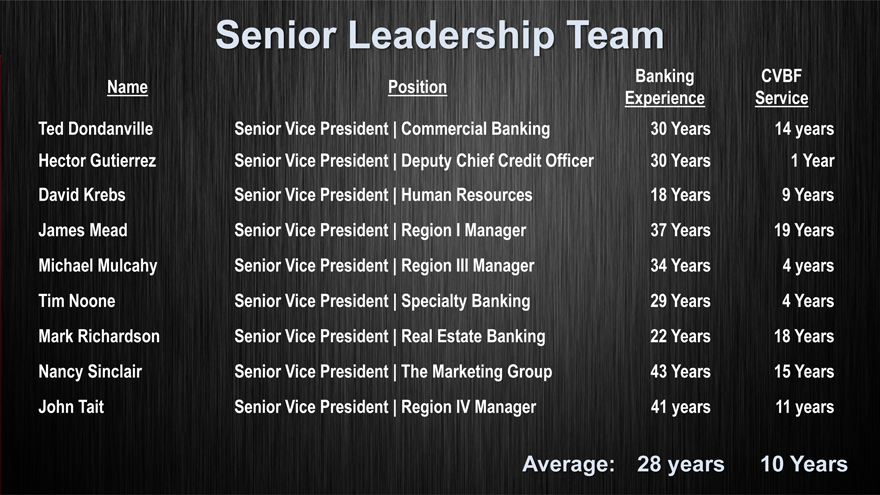
Senior Leadership Team
Position
Name
Ted Dondanville
Hector Gutierrez
David Krebs
Years
James Mead
Years
Michael Mulcahy
Tim Noone
Years
Mark Richardson
Years
Nancy Sinclair
John Tait
Senior Vice President
Senior Vice President
Senior Vice President
Senior Vice President
Senior Vice President
Senior Vice President
Senior Vice President
Senior Vice President
Senior Vice President
Banking
CVBF
Average:
Experience
Commercial Banking
Deputy Chief Credit Officer
Human Resources
Region I Manager
Region III Manager
Specialty Banking
Real Estate Banking
The Marketing Group
Region IV Manager
28
Service
30
30
18
37
34
29
22
43
41 years
years
Years
Years
Years
Years
Years
Years
Years
Years
11 years
10 Years
14 years
9
19
18
15 Years
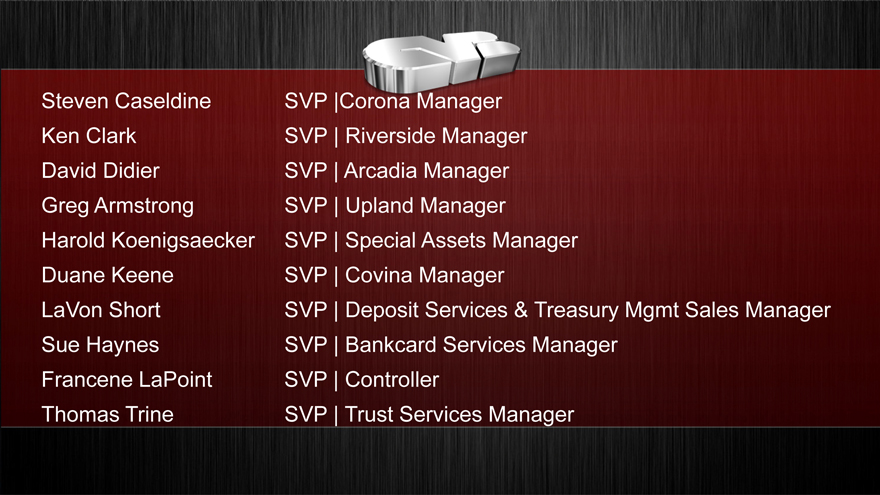
Steven Caseldine
Ken Clark
David Didier
Greg Armstrong
Harold Koenigsaecker
Duane Keene
LaVon Short
Sue Haynes
Francene LaPoint
Thomas Trine
SVP
SVP
SVP
SVP
SVP
SVP
SVP
SVP
SVP
SVP
Corona Manager
Riverside Manager
Arcadia Manager
Upland Manager
Special Assets Manager
Covina Manager
Deposit Services & Treasury Mgmt Sales Manager
Bankcard Services Manager
Controller
Trust Services Manager

CVB
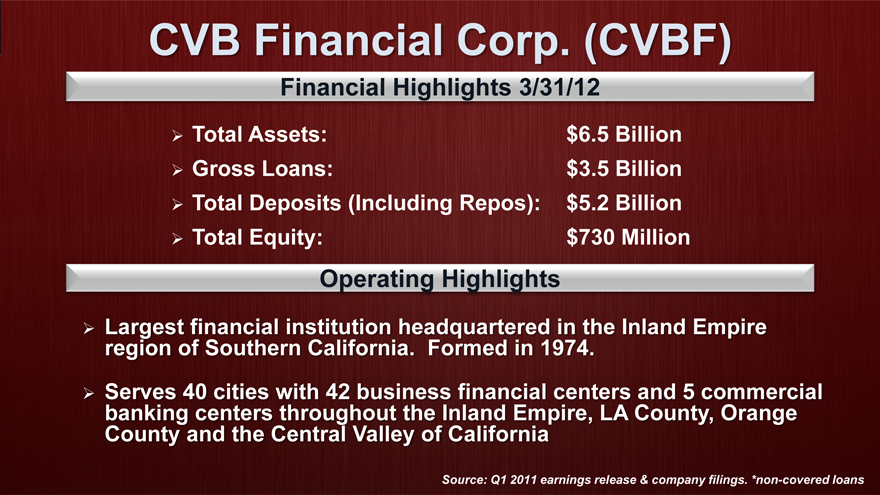
CVB Financial Corp. (CVBF)
Financial Highlights 3/31/12
Total Assets:
Gross Loans:
Total Deposits (Including Repos):
Total Equity:
Operating Highlights
$6.5
$3.5
$5.2
$730
Billion
Billion
Billion
Million
Largest financial institution headquartered in the Inland Empire region of Southern California. Formed in 1974.
Serves 40 cities with 42 business financial centers and 5 commercial banking centers throughout the Inland Empire, LA County, Orange County and the Central Valley of California
Source: Q1 2011 earnings release & company filings. *non-covered loans
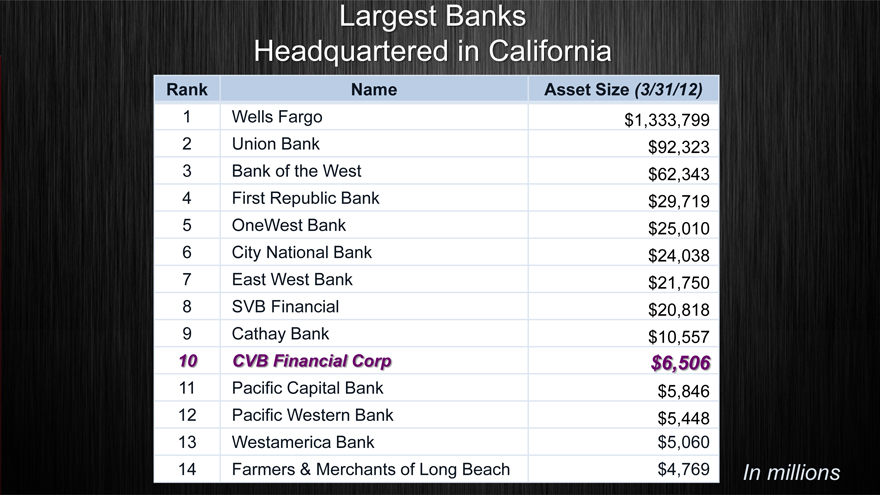
Largest Banks Headquartered in California
Rank Name Asset Size (3/31/12)
3 | | Bank of the West $62,343 |
4 | | First Republic Bank $29,719 |
6 | | City National Bank $24,038 |
9 Cathay Bank $10,557
10 | | CVB Financial Corp $6,506 |
11 | | Pacific Capital Bank $5,846 |
12 | | Pacific Western Bank $5,448 |
13 | | Westamerica Bank $5,060 |
14 | | Farmers & Merchants of Long Beach $4,769 In millions |
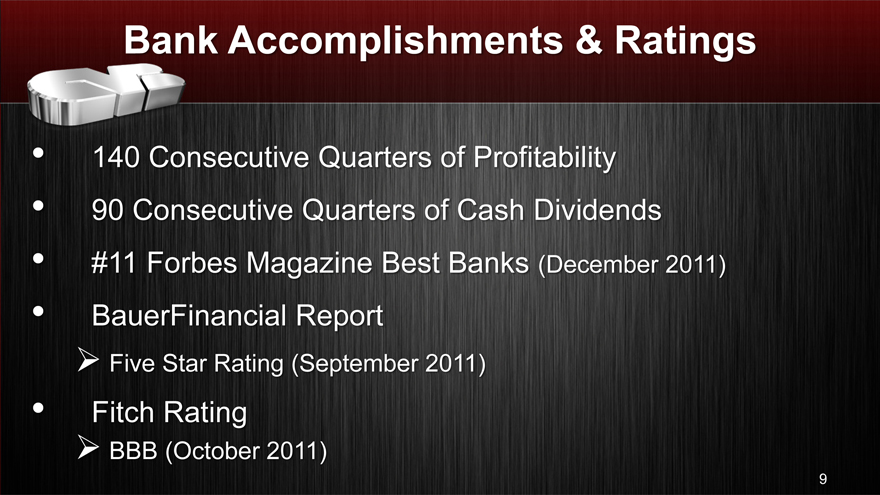
Bank Accomplishments & Ratings
140 Consecutive Quarters of Profitability
90 Consecutive Quarters of Cash Dividends
#11 Forbes Magazine Best Banks (December 2011)
BauerFinancial Report
Five Star Rating (September 2011)
Fitch Rating
BBB (October 2011)
9

What are our Markets?
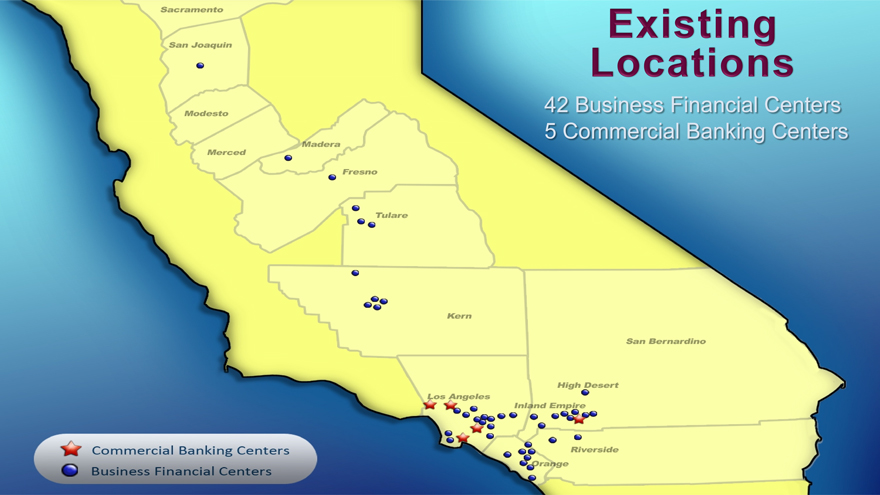
42 Business Financial Centers
5 Commercial Banking Centers
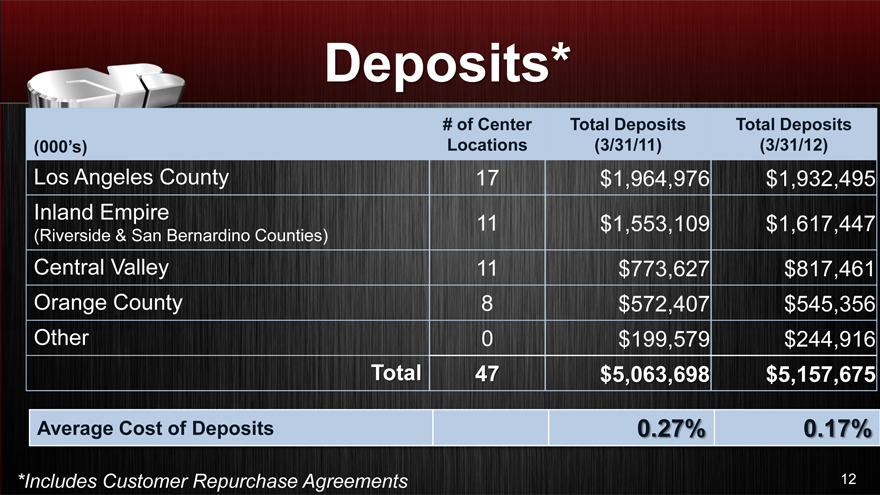
Deposits*
# of Center Total Deposits Total Deposits
(000’s) Locations(3/31/11)(3/31/12)
Los Angeles County 17 $1,964,976 $1,932,495
Inland Empire 11 $1,553,109 $1,617,447
(Riverside & San Bernardino Counties)
Central Valley 11 $773,627 $817,461
Orange County 8 $572,407 $545,356
Other 0 $199,579 $244,916
Total 47 $5,063,698 $5,157,675
Average Cost of Deposits 0.27% 0.17%
*Includes Customer Repurchase Agreements 12
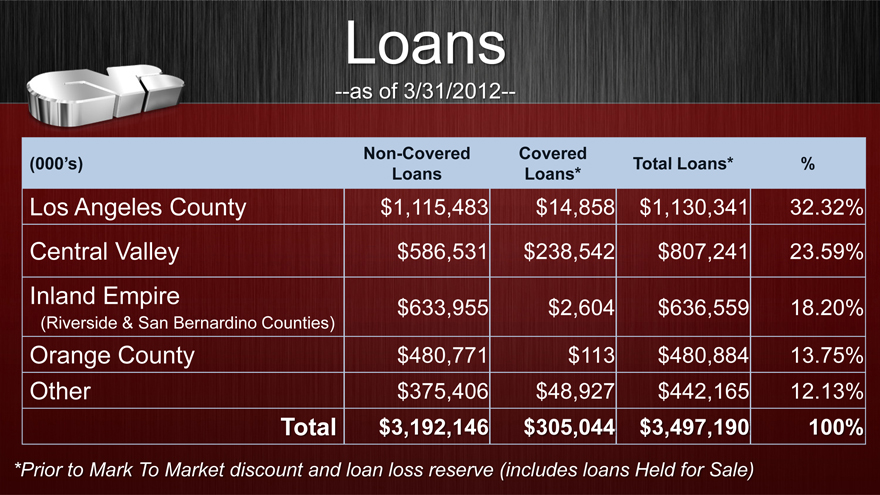
Loans
—as of 3/31/2012—
Non-Covered Covered
(000’s) Total Loans*%
Loans Loans*
Los Angeles County $1,115,483 $14,858 $1,130,341 32.32%
Central Valley $586,531 $238,542 $807,241 23.59%
Inland Empire $633,955 $2,604 $636,559 18.20%
(Riverside & San Bernardino Counties)
Orange County $480,771 $113 $480,884 13.75%
Other $375,406 $48,927 $442,165 12.13%
Total $3,192,146 $305,044 $3,497,190 100%
*Prior to Mark To Market discount and loan loss reserve (includes loans Held for Sale)
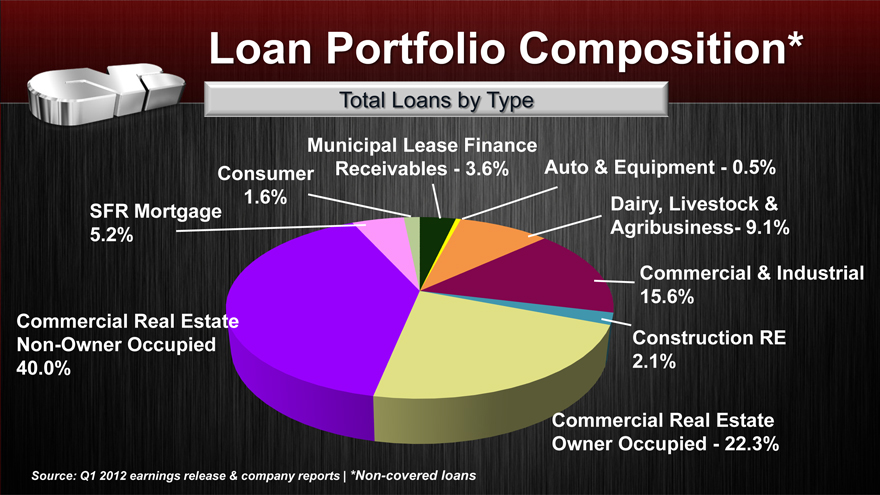
Loan Portfolio Composition*
Total Loans by Type
Municipal Lease Finance
Consumer Receivables—3.6% Auto & Equipment—0.5%
1.6% Dairy, Livestock &
SFR Mortgage
5.2% Agribusiness- 9.1%
Commercial & Industrial
15.6%
Commercial Real Estate
Non-Owner Occupied Construction RE
40.0% 2.1%
Commercial Real Estate
Owner Occupied—22.3%
Source: Q1 2012 earnings release & company reports | *Non-covered loans
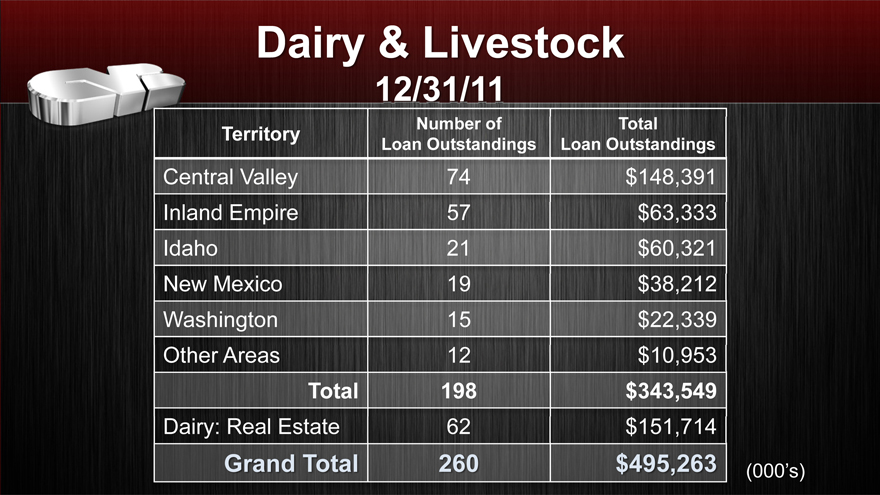
Dairy & Livestock
12/31/11
Territory Number of Total
Loan Outstandings Loan Outstandings
Central Valley 74 $148,391
Inland Empire 57 $63,333
Idaho 21 $60,321
New Mexico 19 $38,212
Washington 15 $22,339
Other Areas 12 $10,953
Total 198 $343,549
Dairy: Real Estate 62 $151,714
Grand Total 260 $495,263(000’s)
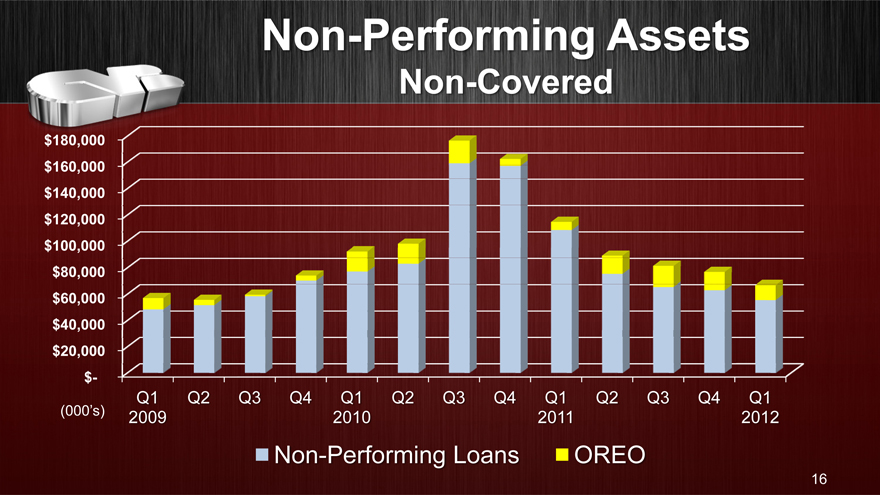
Non-Performing Assets
Non-Covered
$180,000
$160,000
$140,000
$120,000
$100,000
$80,000
$60,000
$40,000
$20,000
$-
Q1 Q2 Q3 Q4 Q1 Q2 Q3 Q4 Q1 Q2 Q3 Q4 Q1
(000’s) 2009 2010 2011 2012
Non-Performing Loans OREO
16
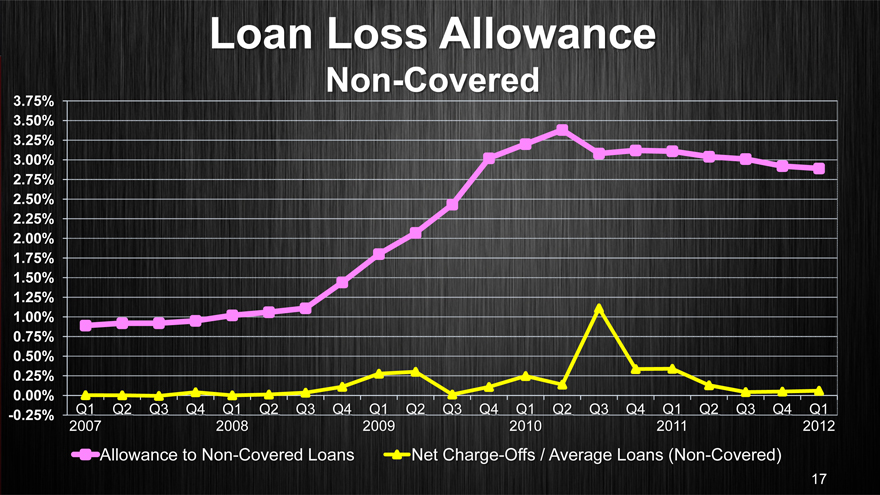
Loan Loss Allowance
Non-Covered
3.75%
3.50%
3.25%
3.00%
2.75%
2.50%
2.25%
2.00%
1.75%
1.50%
1.25%
1.00%
0.75%
0.50%
0.25%
0.00%
-0.25% Q1 Q2 Q3 Q4 Q1 Q2 Q3 Q4 Q1 Q2 Q3 Q4 Q1 Q2 Q3 Q4 Q1 Q2 Q3 Q4 Q1
2007 2008 2009 2010 2011 2012
Allowance to Non-Covered Loans Net Charge-Offs / Average Loans (Non-Covered)
17
Profits
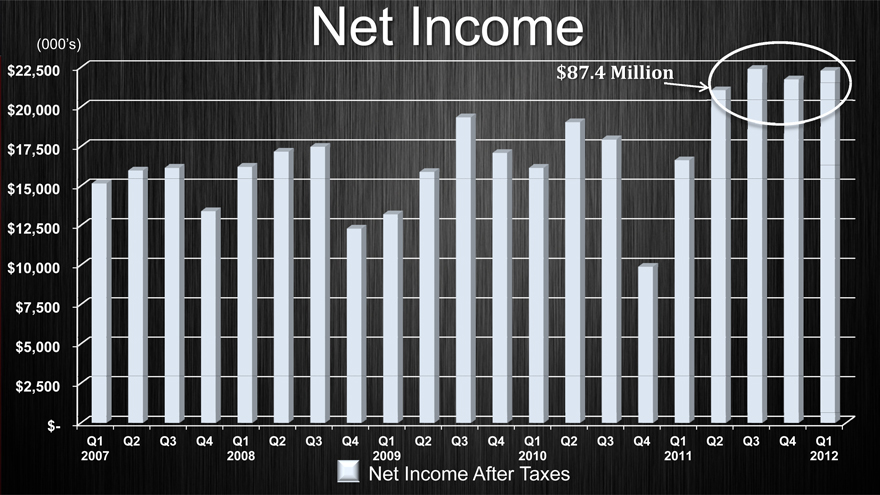
(000’s) Net Income
$22,500 $87.4 Million
$20,000
$17,500
$15,000
$12,500
$10,000
$7,500
$5,000
$2,500
$-
Q1 Q2 Q3 Q4 Q1 Q2 Q3 Q4 Q1 Q2 Q3 Q4 Q1 Q2 Q3 Q4 Q1 Q2 Q3 Q4 Q1
2007 2008 2009 2010 2011 2012
Net Income After Taxes
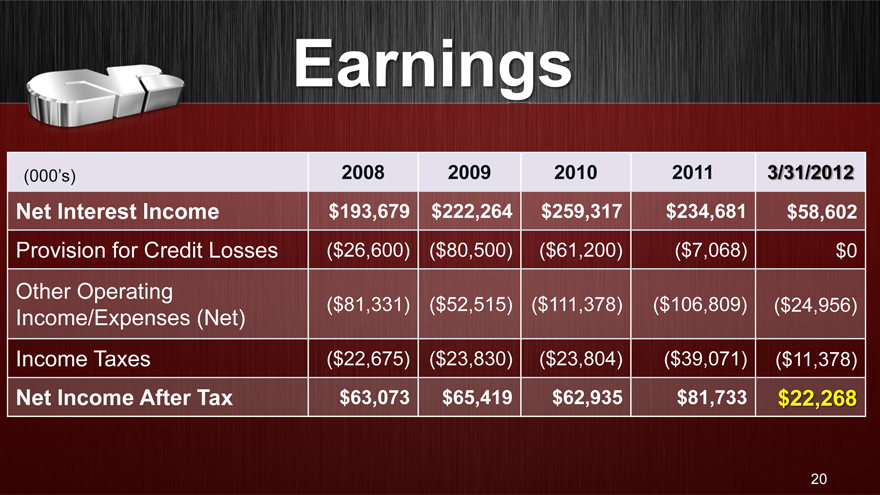
Earnings
(000’s) 2008 2009 2010 2011 3/31/2012
Net Interest Income $193,679 $222,264 $259,317 $234,681 $58,602
Provision for Credit Losses($26,600)($80,500)($61,200)($7,068) $0
Other Operating
Income/Expenses (Net)($81,331)($52,515)($111,378)($106,809)($24,956)
Income Taxes($22,675)($23,830)($23,804)($39,071)($11,378)
Net Income After Tax $63,073 $65,419 $62,935 $81,733 $22,268
20
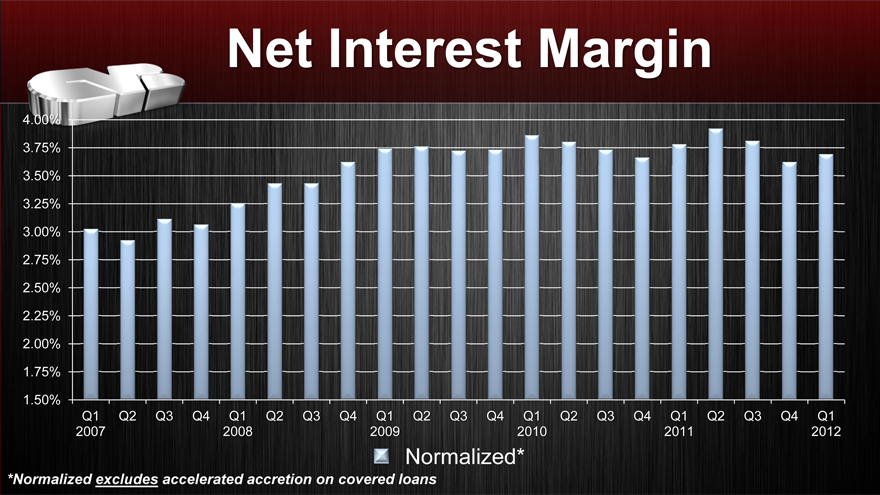
Net Interest Margin
4.00%
3.75%
3.50%
3.25%
3.00%
2.75%
2.50%
2.25%
2.00%
1.75%
1.50%
Q1 Q2 Q3 Q4 Q1 Q2 Q3 Q4 Q1 Q2 Q3 Q4 Q1 Q2 Q3 Q4 Q1 Q2 Q3 Q4 Q1
2007 2008 2009 2010 2011 2012
Normalized*
*Normalized excludes accelerated accretion on covered loans
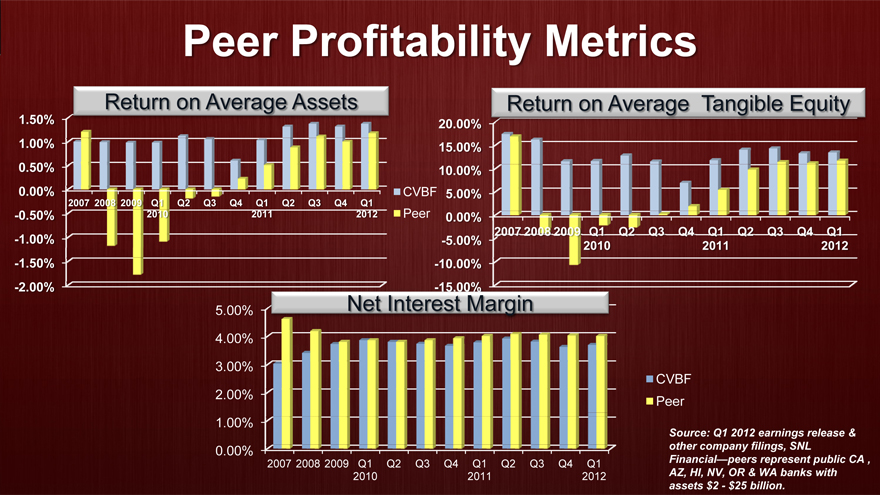
Peer Profitability Metrics
Return on Average Assets
1.50% 1.00% 0.50%
0.00% CVBF
2007 2008 2009 Q1 Q2 Q3 Q4 Q1 Q2 Q3 Q4 Q1
-0.50% 2010 2011 2012 Peer
-1.00% -1.50% -2.00%
Return on Average Tangible Equity
20.00% 15.00% 10.00% 5.00% 0.00%
2007 2008 2009 Q1 Q2 Q3 Q4 Q1 Q2 Q3 Q4 Q1 -5.00% 2010 2011 2012 -10.00% -15.00%
5.00% Net Interest Margin
4.00% 3.00% 2.00% 1.00%
0.00%
2007 2008 2009 Q1 Q2 Q3 Q4 Q1 Q2 Q3 Q4 Q1 2010 2011 2012
CVBF Peer
Source: Q1 2012 earnings release & other company filings, SNL
Financial—peers represent public CA , AZ, HI, NV, OR & WA banks with assets $2—$25 billion.
Capital
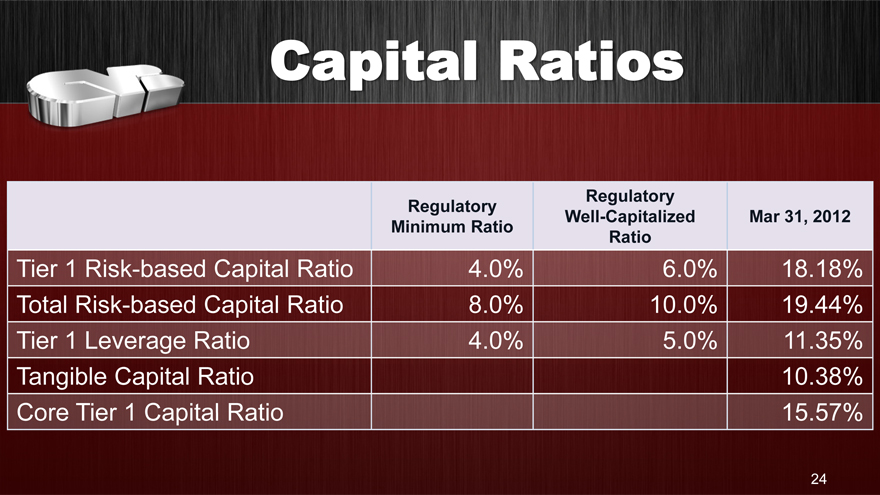
Capital Ratios
Regulatory
Regulatory Well-Capitalized Mar 31, 2012
Minimum Ratio Ratio
Tier 1 Risk-based Capital Ratio 4.0% 6.0% 18.18%
Total Risk-based Capital Ratio 8.0% 10.0% 19.44%
Tier 1 Leverage Ratio 4.0% 5.0% 11.35%
Tangible Capital Ratio 10.38%
Core Tier 1 Capital Ratio 15.57%
24

Securities/Investments
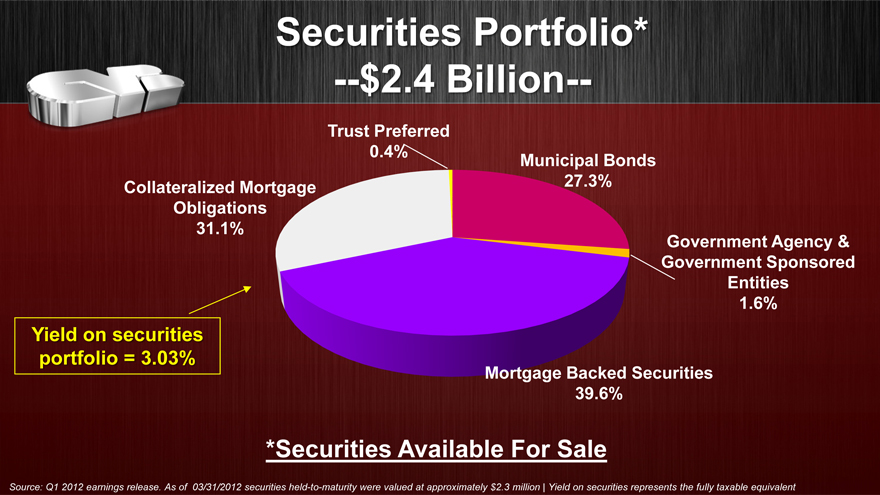
Securities Portfolio*
—$2.4 Billion—
Trust Preferred 0.4%
Municipal Bonds Collateralized Mortgage 27.3% Obligations
31.1%
Government Agency & Government Sponsored Entities 1.6%
Yield on securities portfolio = 3.03%
Mortgage Backed Securities
39.6%
*Securities Available For Sale
Source: Q1 2012 earnings release. As of 03/31/2012 securities held-to-maturity were valued at approximately $2.3 million | Yield on securities represents the fully taxable equivalent
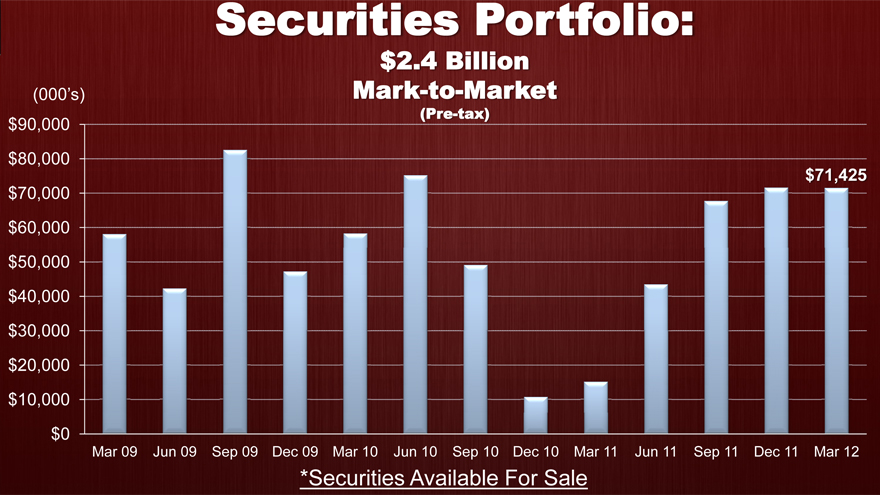
Securities Portfolio:
$2.4 Billion
(000’s) Mark-to-Market
$90,000(Pre-tax)
$80,000
$71,425
$70,000
$60,000
$50,000
$40,000
$30,000
$20,000
$10,000
$0
Mar 09 Jun 09 Sep 09 Dec 09 Mar 10 Jun 10 Sep 10 Dec 10 Mar 11 Jun 11 Sep 11 Dec 11 Mar 12
*Securities Available For Sale
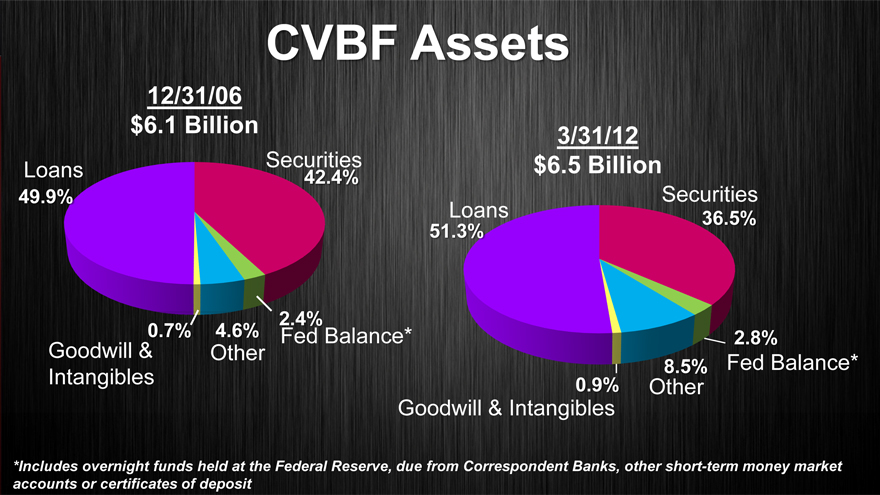
CVBF Assets
12/31/06 $6.1 Billion 3/31/12 Securities $6.5 Billion
Loans 42.4%
49.9% Securities Loans 36.5%
51.3%
2.4%
0.7% 4.6% Fed Balance* 2.8%
Goodwill & Other
8.5% Fed Balance* Intangibles 0.9% Other Goodwill & Intangibles
*Includes overnight funds held at the Federal Reserve, due from Correspondent Banks, other short-term money market accounts or certificates of deposit
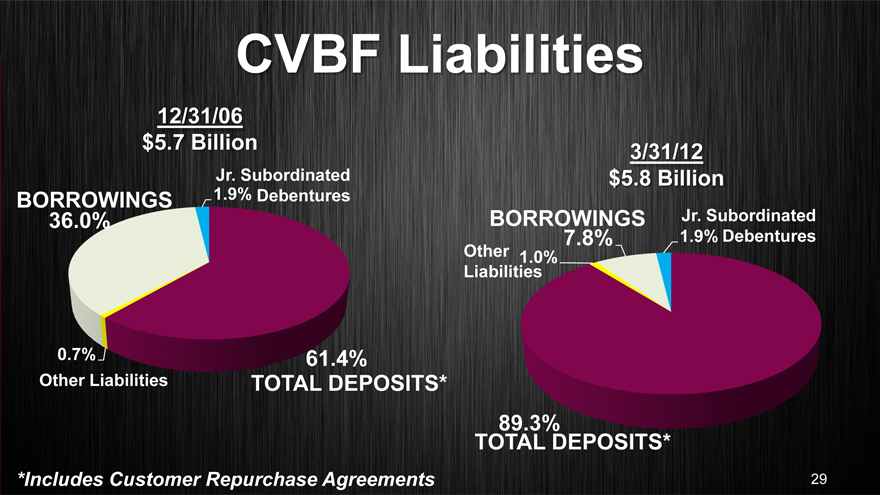
CVBF Liabilities
12/31/06 $5.7 Billion 3/31/12
Jr. Subordinated $5.8 Billion BORROWINGS 1.9% Debentures
36.0% BORROWINGS Jr. Subordinated Other 7.8% 1.9% Debentures 1.0% Liabilities
0.7% 61.4%
Other Liabilities TOTAL DEPOSITS*
89.3%
TOTAL DEPOSITS*
*Includes Customer Repurchase Agreements 29
May 2012
- Update -
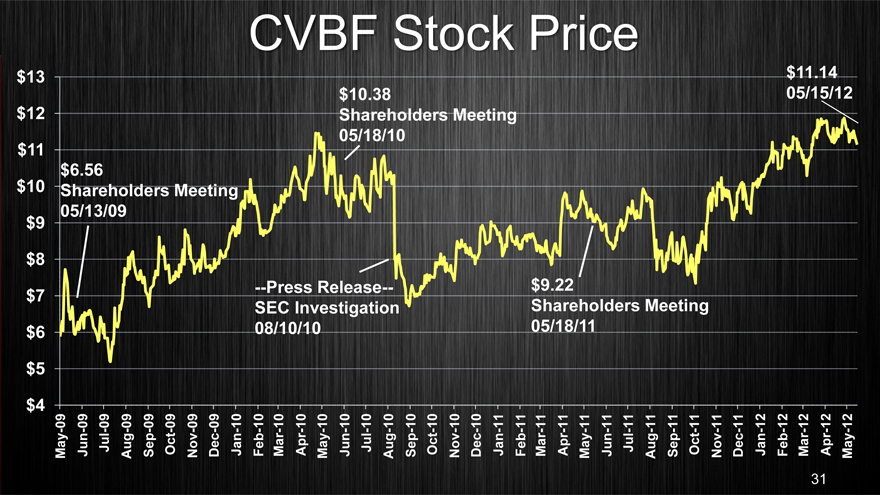
CVBF Stock Price
$13 $11.14
$10.38 05/15/12
$12 Shareholders Meeting
05/18/10
$11
$6.56
$10 Shareholders Meeting
$9 05/13/09
$8
$7 —Press Release— $9.22
SEC Investigation Shareholders Meeting
$6 08/10/10 05/18/11
$5
4 $
May-09
Jun-09
Jul-09
Aug-09
Sep-09
Oct-09
Nov-09
Dec-09
Jan-10
Feb-10
Mar-10
Apr-10
May-10
Jun-10
Jul-10
Aug-10
Sep-10
Oct-10
Nov-10
Dec-10
Jan-11
Feb-11
Mar-11
Apr-11
May-11
Jun-11
Jul-11
Aug-11
Sep-11
Oct-11
Nov-11
Dec-11
Jan-12
Feb-12
Mar-12
Apr-12
May-12
31
SEC Investigation
SEC investigation related to CBB loan loss reserves was initiated in late July 2010
CVBF and outside counsel have fully cooperated with the SEC
We are hopeful the investigation will be resolved but have no specific insight as to timing or
outcome
32
Lawsuits: Shareholder and Derivative
Federal securities shareholder class action complaint was dismissed by judge in January 2012.
Plaintiffs re-filed amended securities complaint in February 2012, and we renewed our motion to dismiss in March 2012.
The hearing before the judge is scheduled for June 2012, and we intend to continue to vigorously contest the claims, which we believe are without merit.
State law derivative action has been deferred pending the June hearing and ruling on our motion to dismiss the companion federal suit.
— 2012 & Beyond –
Our Growth Strategy
Our Mission
“The mission of CVB Financial Corp. is to achieve superior performance and rank in the top 10% of all financial institutions in the nation in return on equity and return on assets. This will be achieved by delivering the finest in financial products and services through relationship banking commitments with businesses and professionals in the Inland Empire, Los Angeles County, Orange County and the Central Valley areas of California. It will be supported by an unqualified commitment to our five core values.”
35
5 Core Values
1. Financial Strength
2. Superior People
3. Customer Focus
4. Cost Effective Operation
5. Having Fun
36
Our Vision
Citizens Business Bank will strive to become the dominant financial services company operating throughout the state of California, servicing the comprehensive financial needs of successful small to medium sized businesses and their owners.
37
Target Customer
The best privately-held and/or family-owned businesses throughout California.
—Annual revenues of $1-200 million
— Top 25% in their respective industry
— Full relationship banking
— Build 20-year relationships
38
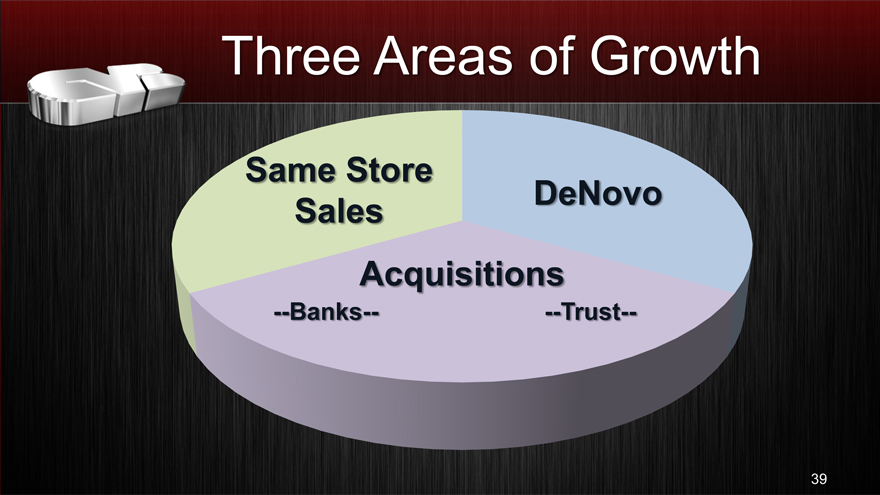
Three Areas of Growth
Same Store
DeNovo Sales Acquisitions
—Banks— —Trust—
39
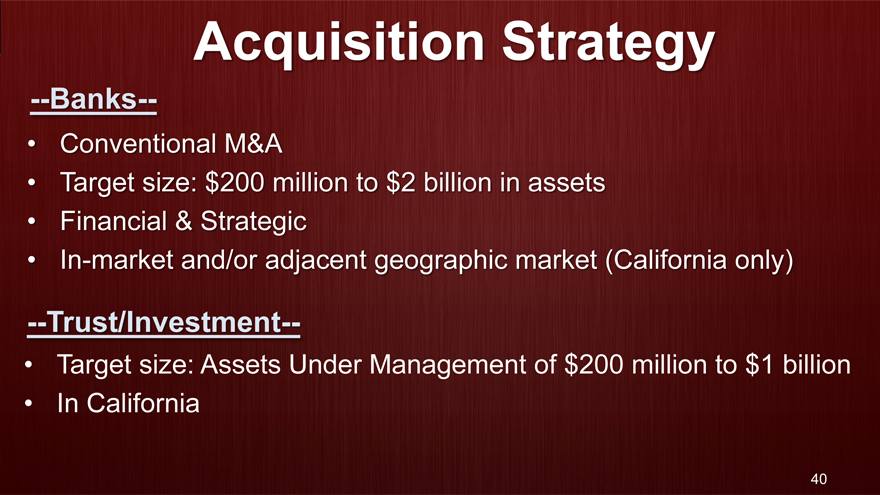
Acquisition Strategy
—Banks—
Conventional M&A
Target size: $200 million to $2 billion in assets
Financial & Strategic
In-market and/or adjacent geographic market (California only)
—Trust/Investment—
Target size: Assets Under Management of $200 million to $1 billion
In California
40
2012 Strategy:
Five Key Objectives
Our ‘Critical Few’
• Quality Loan Growth
• Non-Interest Bearing Deposit Growth
• Non-Interest Income Growth
• Expense Control
• Grow Through Acquisition
42
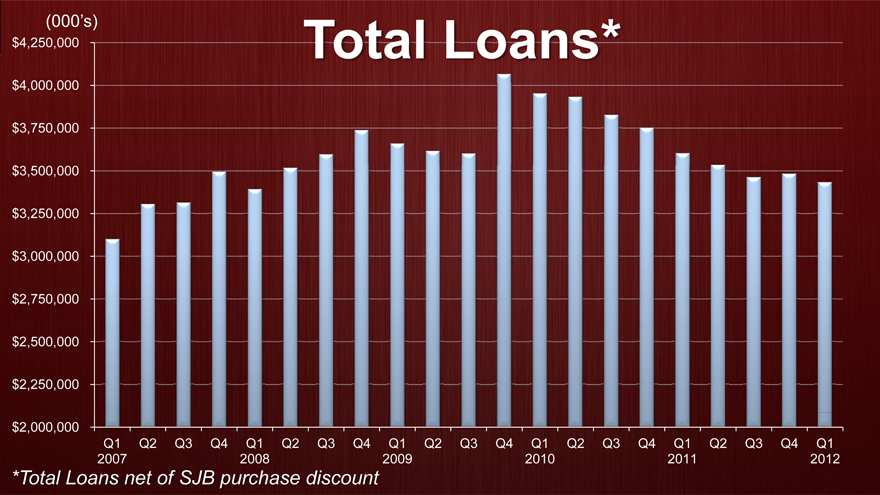
(000’s)
$4,250,000 Total Loans*
$4,000,000
$3,750,000
$3,500,000
$3,250,000
$3,000,000
$2,750,000
$2,500,000
$2,250,000
$2,000,000
Q1 Q2 Q3 Q4 Q1 Q2 Q3 Q4 Q1 Q2 Q3 Q4 Q1 Q2 Q3 Q4 Q1 Q2 Q3 Q4 Q1
2007 2008 2009 2010 2011 2012
*Total Loans net of SJB purchase discount
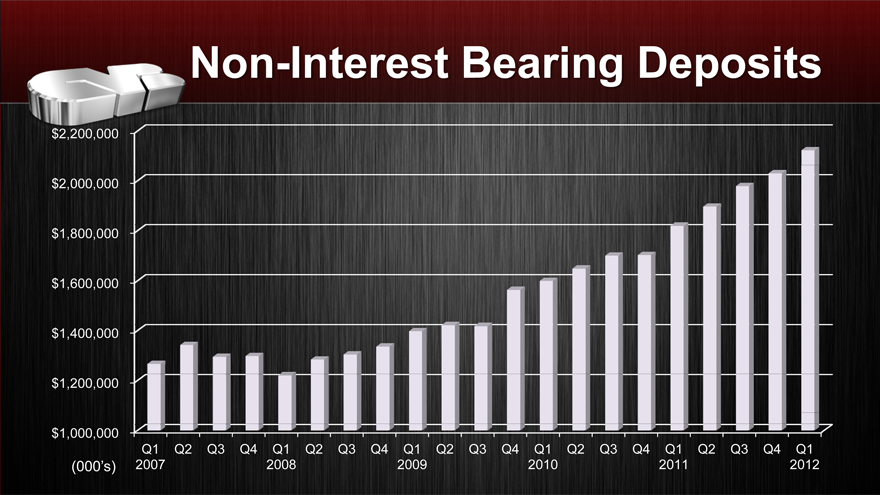
Non-Interest Bearing Deposits
$2,200,000
$2,000,000
$1,800,000
$1,600,000
$1,400,000
$1,200,000
$1,000,000
Q1 Q2 Q3 Q4 Q1 Q2 Q3 Q4 Q1 Q2 Q3 Q4 Q1 Q2 Q3 Q4 Q1 Q2 Q3 Q4 Q1
(000’s) 2007 2008 2009 2010 2011 2012
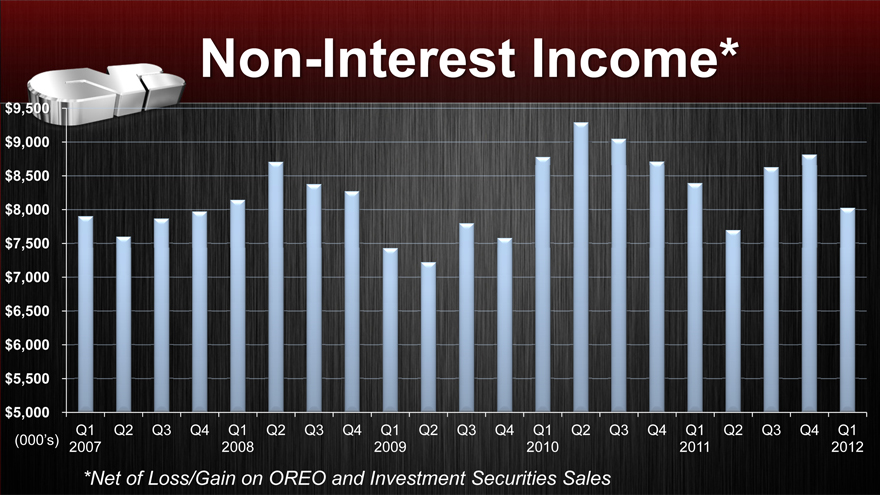
Non-Interest Income*
$9,500
$9,000
$8,500
$3,000
$7,500
$7,000
$6,000
$6,500
$5,500
$5,000
Q1 Q2 Q3 Q4 Q1 Q2 Q3 Q4 Q1 Q2 Q3 Q4 Q1 Q2 Q3 Q4 Q1 Q2 Q3 Q4 Q1
(000’s) 2007 2008 2009 2010 2011 2012
*Net of Loss/Gain on OREO and Investment Securities Sales
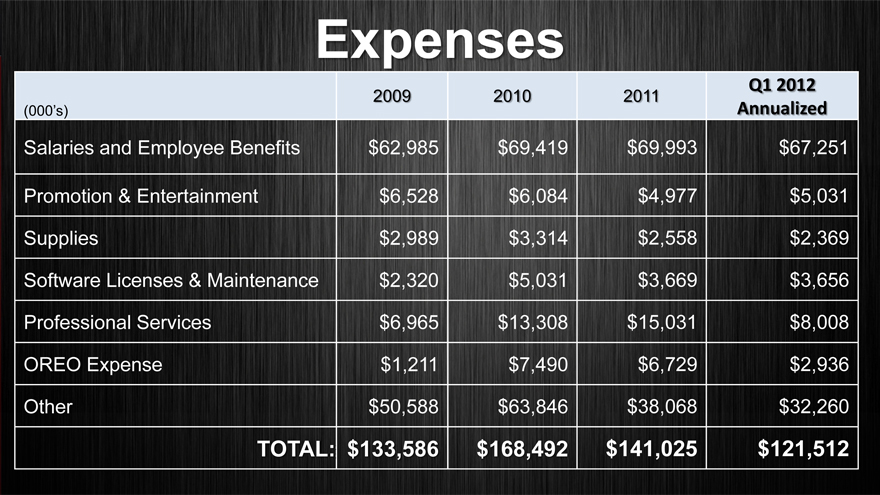
Expenses
2009 2010 2011 Q1 2012
(000’s) Annualized
Salaries and Employee Benefits $62,985 $69,419 $69,993 $67,251
Promotion & Entertainment $6,528 $6,084 $4,977 $5,031
Supplies $2,989 $3,314 $2,558 $2,369
Software Licenses & Maintenance $2,320 $5,031 $3,669 $3,656
Professional Services $6,965 $13,308 $15,031 $8,008
OREO Expense $1,211 $7,490 $6,729 $2,936
Other $50,588 $63,846 $38,068 $32,260
TOTAL: $133,586 $168,492 $141,025 $121,512
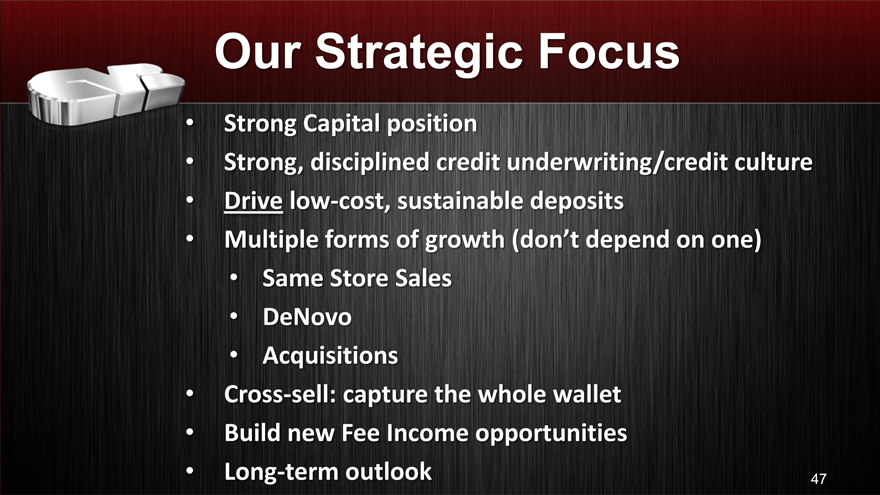
Our Strategic Focus
Strong Capital position
Strong, disciplined credit underwriting/credit culture
Drive low cost, sustainable deposits
Multiple forms of growth (don’t depend on one)
Same Store Sales
DeNovo
Acquisitions
Cross sell: capture the whole wallet
Build new Fee Income opportunities
Long term outlook
47
CVB