Exhibit 99.1

CVB Financial Corp.
February 2014
4Q Results 2013 | cbbank.com
Safe Harbor
Certain matters set forth herein (including the exhibits hereto) constitute forward-looking statements within the meaning of the Private Securities Litigation Reform Act of 1995, including forward-looking statements relating to the Company’s current business plans and expectations regarding future operating results. These forward-looking statements are subject to risks and uncertainties that could cause actual results, performance or achievements to differ materially from those projected. These risks and uncertainties include, but are not limited to, local, regional, national and international economic conditions and events and the impact they may have on us and our customers; ability to attract deposits and other sources of liquidity; supply and demand for real property inventory and periodic deterioration in values of California real estate, both residential and commercial; a prolonged slowdown or decline in construction activity; changes in the financial performance and/or condition of our borrowers; changes in the level of non-performing assets and charge-offs; the cost or effect of acquisitions we may make; the effect of changes in laws and regulations (including laws, regulations and judicial decisions concerning financial reform, taxes, banking capital levels, securities, employment, executive compensation, insurance and information security) with which we and our subsidiaries must comply; changes in estimates of future reserve requirements and minimum capital requirements based upon the periodic review thereof under relevant regulatory and accounting requirements, including changes in the Basel Committee framework establishing capital standards for credit, operations and market risk; inflation, interest rate, securities market and monetary fluctuations; changes in government interest rate or monetary policies; changes in the amount and availability of deposit insurance; cyber-security threats including loss of system functionality or theft or loss of Company or customer data; political instability; acts of war or terrorism, or natural disasters, such as earthquakes, or the effects of pandemic diseases; the timely development and acceptance of new banking products and services and perceived overall value of these products and services by users; changes in consumer spending, borrowing and savings habits; technological changes and the expanding use of technology in banking (including the adoption of mobile banking applications); the ability to retain and increase market share, retain and grow customers and control expenses; changes in the competitive environment among financial and bank holding companies and other financial service providers; continued volatility in the credit and equity markets and its effect on the general economy or local business conditions; fluctuations in the price of the Company’s stock; the effect of changes in accounting policies and practices, as may be adopted from time-to-time by the regulatory agencies, as well as by the Public Company Accounting Oversight Board, the Financial Accounting Standards Board and other accounting standard- setters; changes in our organization, management, compensation and benefit plans, and our ability to retain or expand our management team and/or our board of directors; the costs and effects of legal and regulatory developments, including the resolution of legal proceedings or regulatory or other governmental inquiries or investigations and the results of regulatory examinations or reviews; our success at managing the risks involved in the foregoing items and all other factors set forth in the Company’s public reports including its Annual Report on Form 10-K for the year ended December 31, 2012, and particularly the discussion of risk factors within that document. The Company does not undertake, and specifically disclaims any obligation, to update any forward-looking statements to reflect occurrences or unanticipated events or circumstances after the date of such statements except as required by law.
4Q Results 2013 | cbbank.com
2
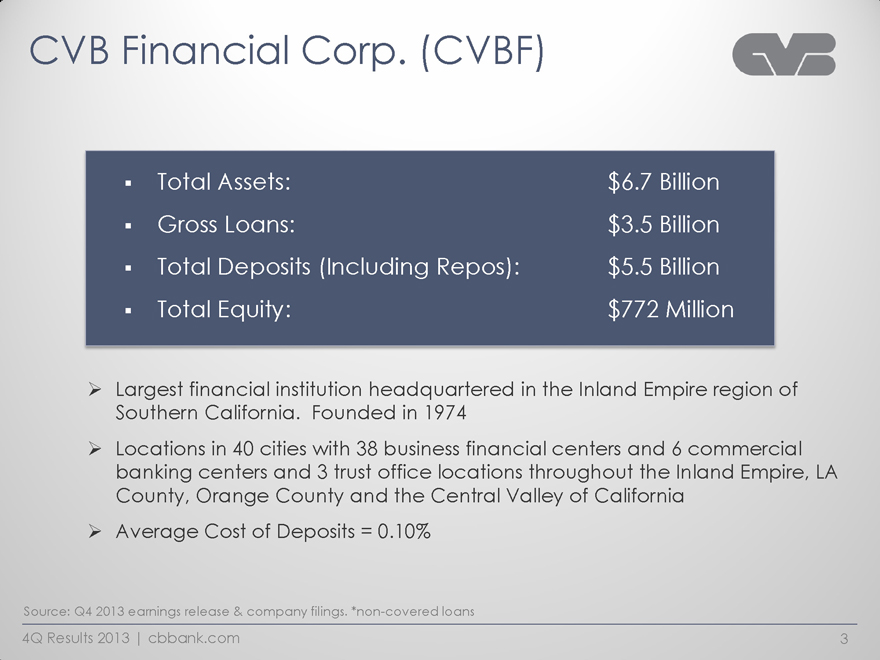
CVB Financial Corp. (CVBF)
Total Assets: $6.7 Billion
Gross Loans: $3.5 Billion
Total Deposits (Including Repos): $5.5 Billion
Total Equity: $772 Million
Largest financial institution headquartered in the Inland Empire region of Southern California. Founded in 1974
Locations in 40 cities with 38 business financial centers and 6 commercial banking centers and 3 trust office locations throughout the Inland Empire, LA County, Orange County and the Central Valley of California
Average Cost of Deposits = 0.10%
Source: Q4 2013 earnings release & company filings. *non-covered loans
4Q Results 2013 | cbbank.com
3
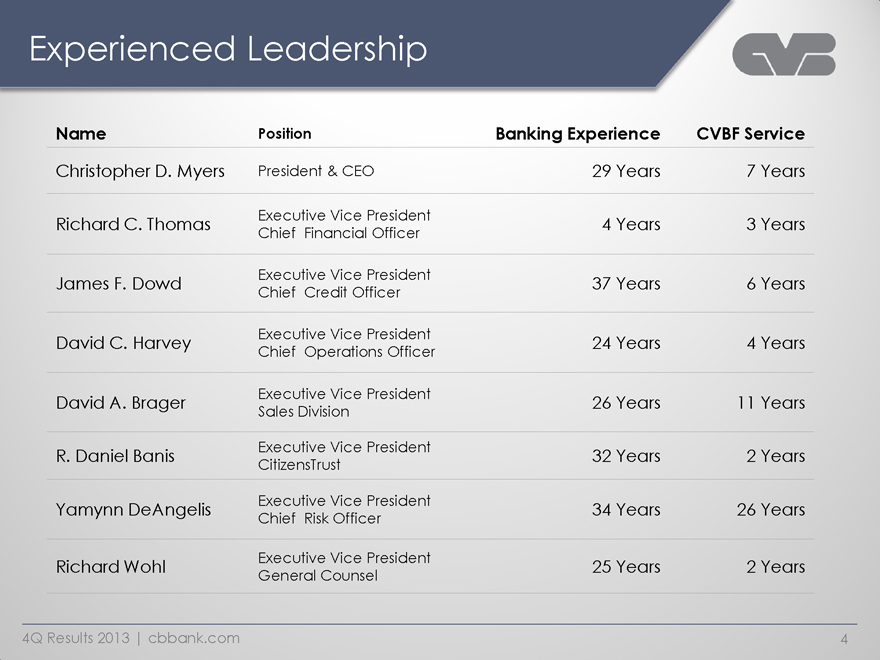
Experienced Leadership
Name
Christopher D. Myers
Richard C. Thomas
James F. Dowd
David C. Harvey
David A. Brager
R. Daniel Banis
Yamynn DeAngelis
Richard Wohl
Position
President & CEO
Executive Vice President
Chief Financial Officer
Executive Vice President
Chief Credit Officer
Executive Vice President
Chief Operations Officer
Executive Vice President
Sales Division
Executive Vice President
CitizensTrust
Executive Vice President
Chief Risk Officer
Executive Vice President
General Counsel
Banking Experience
29 Years
4 Years
37 Years
24 Years
26 Years
32 Years
34 Years
25 Years
CVBF Service
7 Years
3 Years
6 Years
4 Years
11 Years
2 Years
26 Years
2 Years
4Q Results 2013 | cbbank.com
4
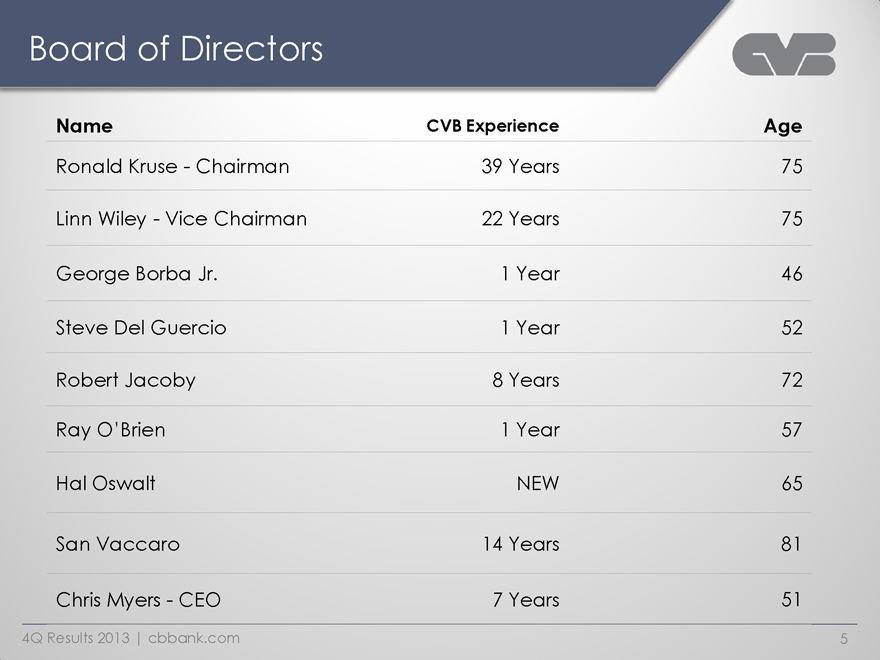
Board of Directors
Name
Ronald Kruse - Chairman
Linn Wiley - Vice Chairman
George Borba Jr.
Steve Del Guercio
Robert Jacoby
Ray O’Brien
Hal Oswalt
San Vaccaro
Chris Myers - CEO
CVB Experience
39 Years
22 Years
1 Year
1 Year
8 Years
1 Year
NEW
14 Years
7 Years
Age
75
75
46
52
72
57
65
81
51
4Q Results 2013 | cbbank.com
5
CVB Financial Corp.
Who is CVB Financial Corp.?
4Q Results 2013 | cbbank.com
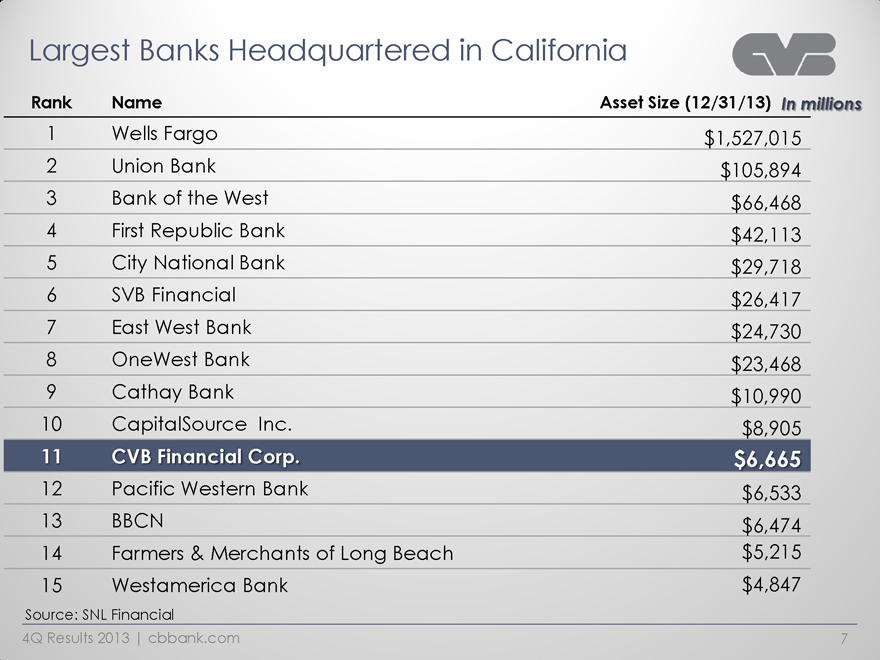
Largest Banks Headquartered in California
Rank
1 2 3 4 5 6 7 8 9 10 11 12 13 14 15
Name
Wells Fargo
Union Bank
Bank of the West
First Republic Bank
City National Bank
SVB Financial
East West Bank
OneWest Bank
Cathay Bank
CapitalSource Inc.
CVB Financial Corp.
Pacific Western Bank
BBCN
Farmers & Merchants of Long Beach
Westamerica Bank
Asset Size (12/31/13) In millions
$1,527,015
$105,894
$66,468
$42,113
$29,718
$26,417
$24,730
$23,468
$10,990
$8,905
$6,665
$6,533
$6,474
$5,215
$4,847
Source: SNL Financial
4Q Results 2013 | cbbank.com
7
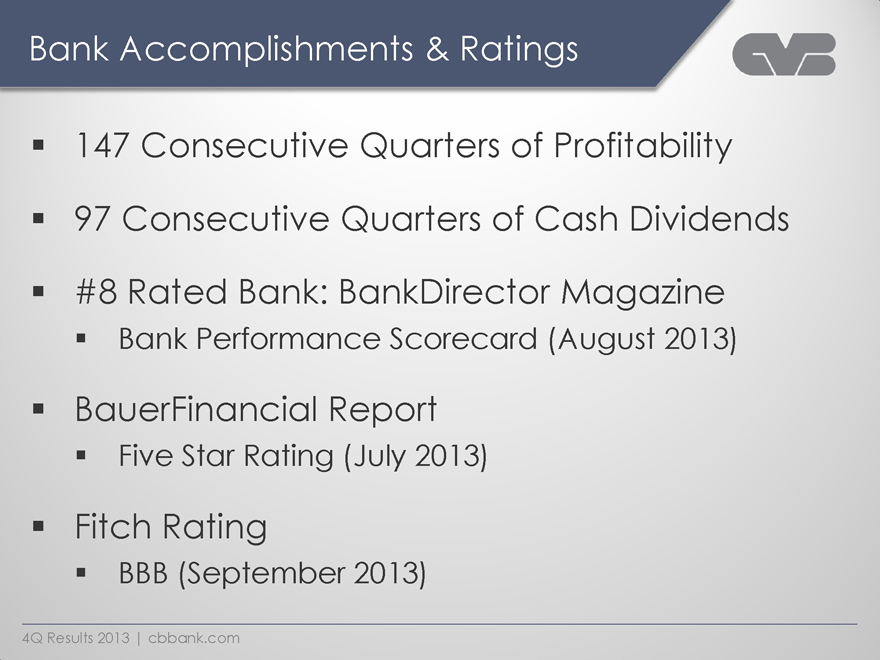
Bank Accomplishments & Ratings
147 Consecutive Quarters of Profitability
97 Consecutive Quarters of Cash Dividends
#8 Rated Bank: BankDirector Magazine
Bank Performance Scorecard (August 2013)
BauerFinancial Report
Five Star Rating (July 2013)
Fitch Rating
BBB (September 2013)
4Q Results 2013 | cbbank.com
CVB Financial Corp.
Our Markets
4Q Results 2013 | cbbank.com
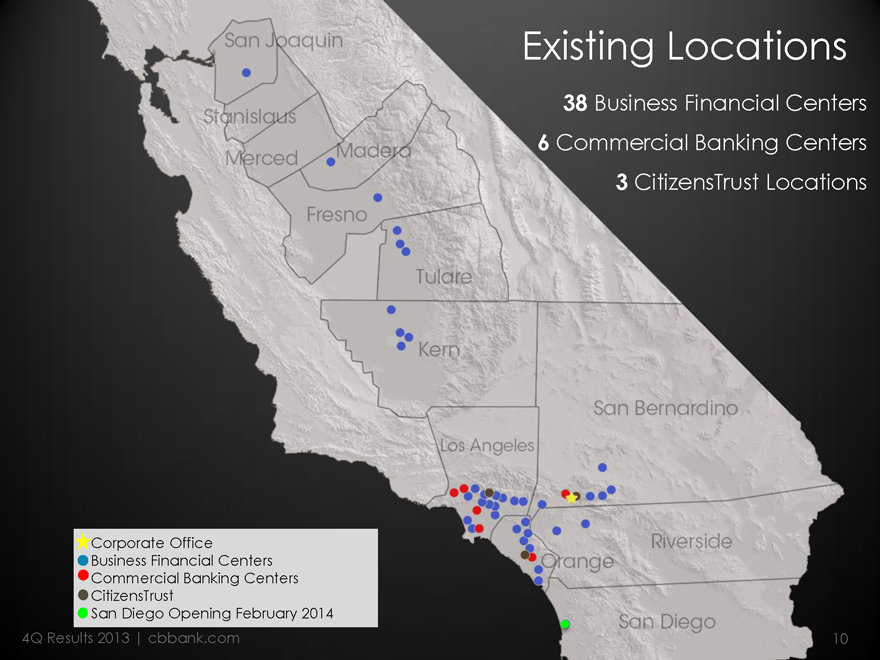
Existing Locations
38 Business Financial Centers
6 Commercial Banking Centers
3 CitizensTrust Locations
San Joaquin
Stanislaus
Merced
Madera
Fresno
Tulare
Kern
Los Angeles
San Bernardino
Orange
Riverside
San Diego
Corporate Office
Business Financial Centers
Commercial Banking Centers
CitizensTrust
San Diego Opening February 2014
4Q Results 2013 | cbbank.com
10
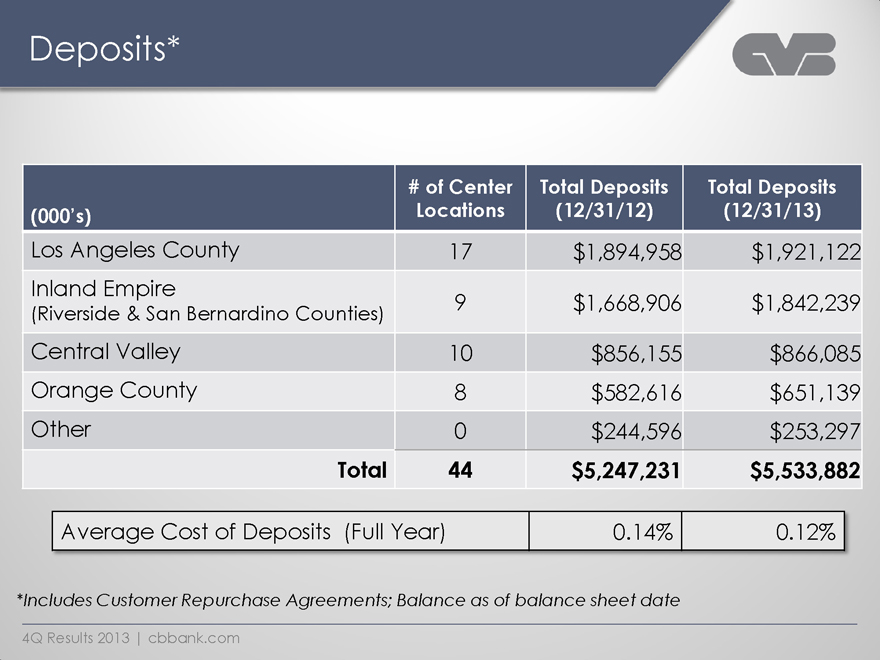
Deposits*
(000’s)
Los Angeles County
Inland Empire
(Riverside & San Bernardino Counties)
Central Valley
Orange County
Other
Total
# of Center Locations
17
9
10
8
0
44
Total Deposits (12/31/12)
$1,894,958
$1,668,906
$856,155
$582,616
$244,596
$5,247,231
Total Deposits (12/31/13)
$1,921,122
$1,842,239
$866,085
$651,139
$253,297
$5,533,882
Average Cost of Deposits (Full Year) 0.14% 0.12%
*Includes Customer Repurchase Agreements; Balance as of balance sheet date
4Q Results 2013 | cbbank.com
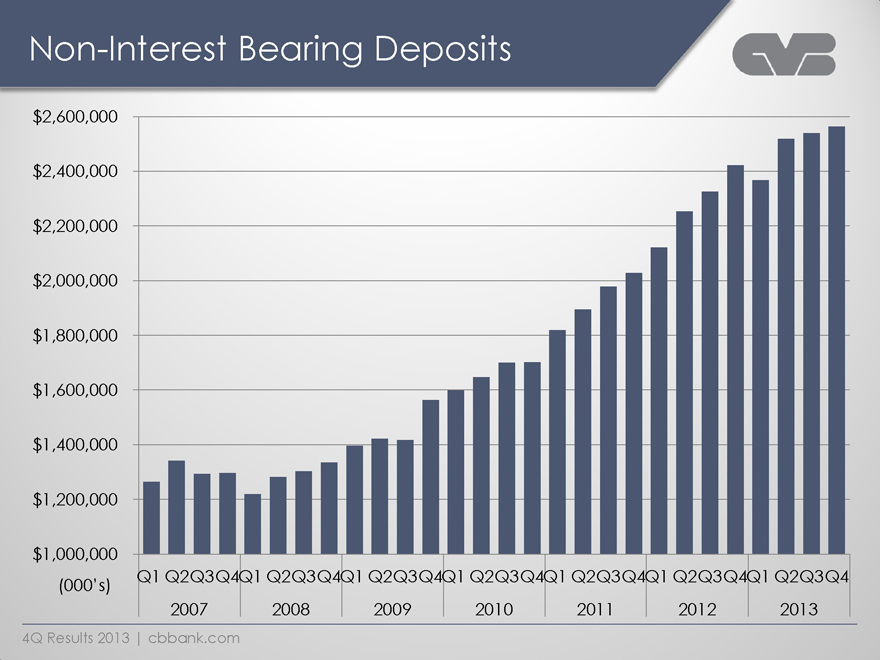
Non-Interest Bearing Deposits
$2,600,000
$2,400,000
$2,200,000
$2,000,000
$1,800,000
$1,600,000
$1,400,000
$1,200,000
$1,000,000
(000’s)
Q1 Q2 Q3 Q4 Q1 Q2 Q3 Q4 Q1 Q2 Q3 Q4 Q1 Q2 Q3 Q4 Q1 Q2 Q3 Q4 Q1 Q2 Q3 Q4 Q1 Q2 Q3 Q4
2007
2008
2009
2010
2011
2012
2013
4Q Results 2013 | cbbank.com
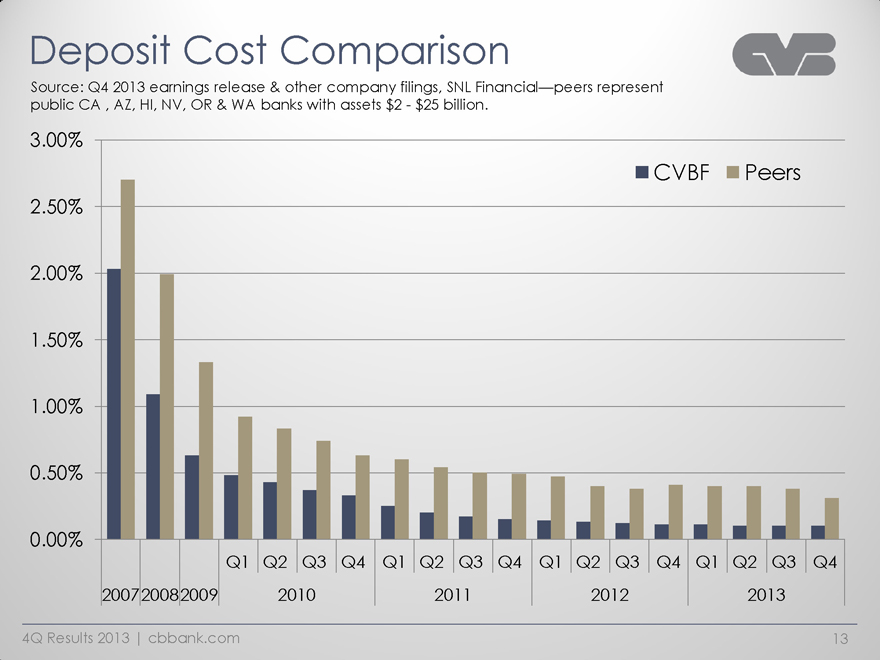
Deposit Cost Comparison
Source: Q4 2013 earnings release & other company filings, SNL Financial—peers represent public CA , AZ, HI, NV, OR & WA banks with assets $2 - $25 billion.
3.00%
2.50%
2.00%
1.50%
1.00%
0.50%
0.00%
CVBF
Peers
Q1 Q2 Q3 Q4 Q1 Q2 Q3 Q4 Q1 Q2 Q3 Q4 Q1 Q2 Q3 Q4
2007 2008 2009 2010 2011 2012 2013
4Q Results 2013 | cbbank.com
13
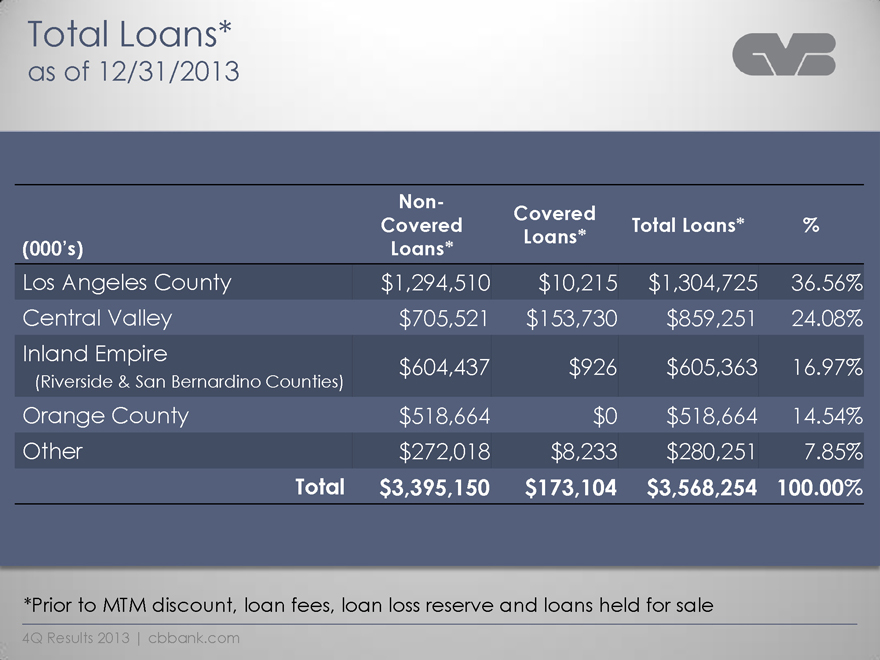
Total Loans*
as of 12/31/2013
(000’s)
Los Angeles County
Central Valley
Inland Empire
(Riverside & San Bernardino Counties)
Orange County
Other
Total
Non- Covered Loans*
$1,294,510
$705,521
$604,437
$518,664
$272,018
$3,395,150
Covered Loans*
$10,215
$153,730
$926
$0
$8,233
$173,104
Total Loans*
$1,304,725
$859,251
$605,363
$518,664
$280,251
$3,568,254
%
36.56%
24.08%
16.97%
14.54%
7.85%
100.00%
*Prior to MTM discount, loan fees, loan loss reserve and loans held for sale
4Q Results 2013 | cbbank.com
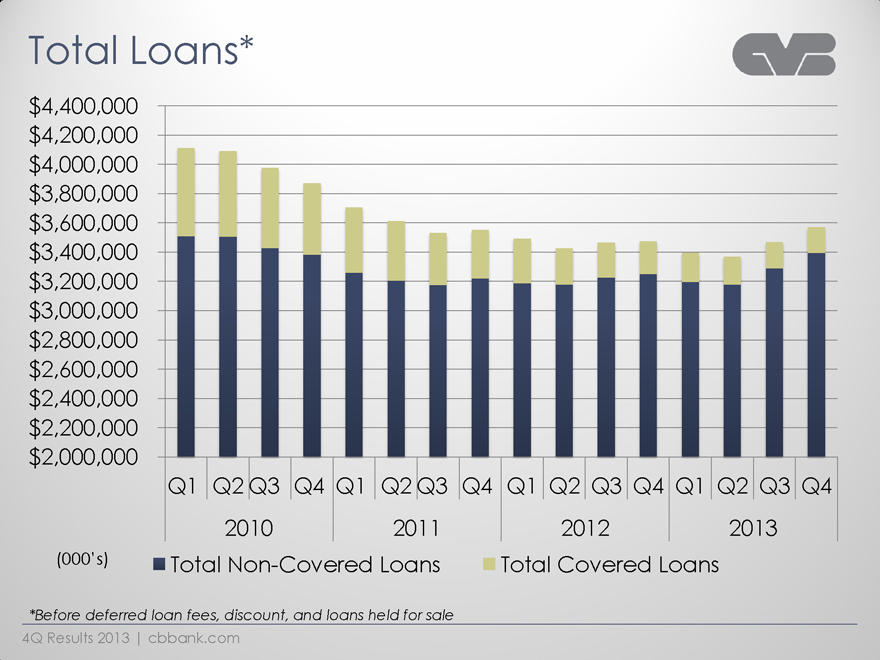
Total Loans*
$4,400,000
$4,200,000
$4,000,000
$3,800,000
$3,600,000
$3,400,000
$3,200,000
$3,000,000
$2,800,000
$2,600,000
$2,400,000
$2,200,000
$2,000,000
(000’s)
Q1 Q2 Q3 Q4 Q1 Q2 Q3 Q4 Q1 Q2 Q3 Q4 Q1 Q2 Q3 Q4
2010
2011
2012
2013
Total Non-Covered Loans
Total Covered Loans
*Before deferred loan fees, discount, and loans held for sale
4Q Results 2013 | cbbank.com
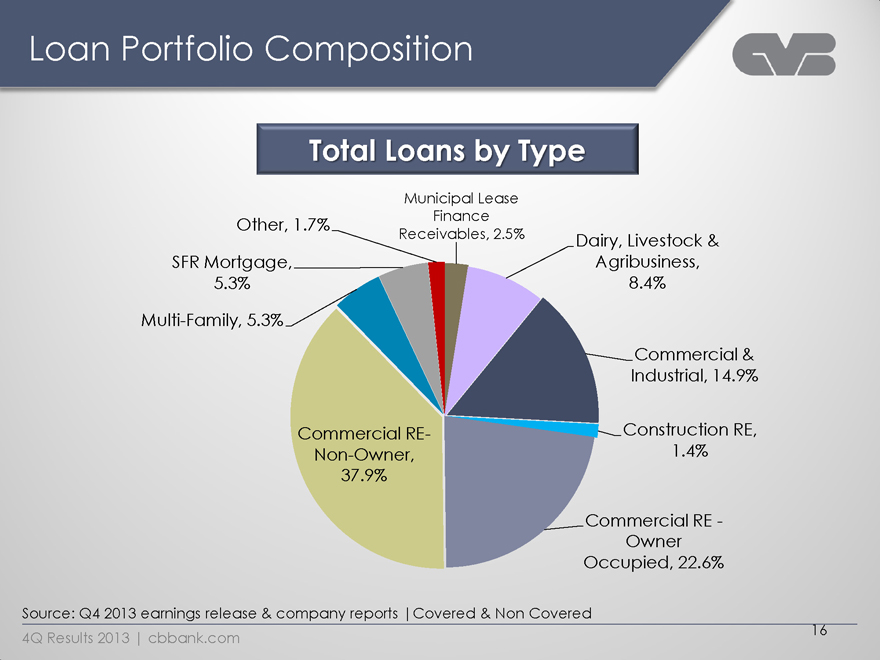
Loan Portfolio Composition
Total Loans by Type
Municipal Lease Finance Receivables, 2.5%
Dairy, Livestock & Agribusiness, 8.4%
Commercial & Industrial, 14.9%
Construction RE, 1.4%
Commercial RE - Owner Occupied, 22.6%
Other, 1.7%
SFR Mortgage, 5.3%
Multi-Family, 5.3%
Commercial RE- Non-Owner, 37.9%
Source: Q4 2013 earnings release & company reports | Covered & Non Covered
4Q Results 2013 | cbbank.com
16
New/Enhanced Lending Initiatives
Residential Real Estate
Multi-Family
Asset Based Lending
Residential and Commercial Construction
4Q Results 2013 | cbbank.com
17
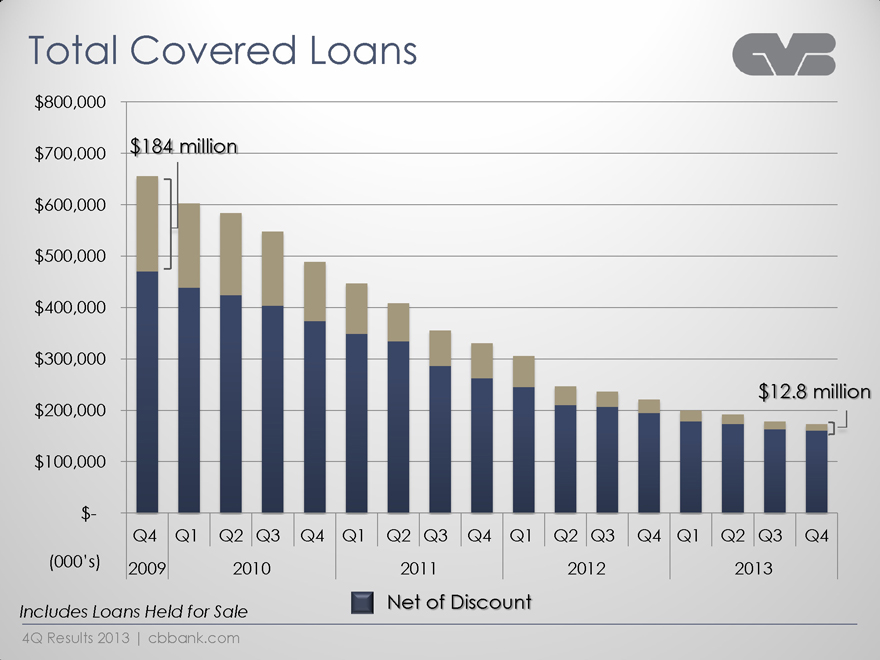
Total Covered Loans
$800,000
$700,000
$600,000
$500,000
$400,000
$300,000
$200,000
$100,000
$-
(000’s)
$184 million
$12.8 million
Q4 Q1 Q2 Q3 Q4 Q1 Q2 Q3 Q4 Q1 Q2 Q3 Q4 Q1 Q2 Q3 Q4
2009
2010
2011
2012
2013
Net of Discount
Includes Loans Held for Sale
4Q Results 2013 | cbbank.com
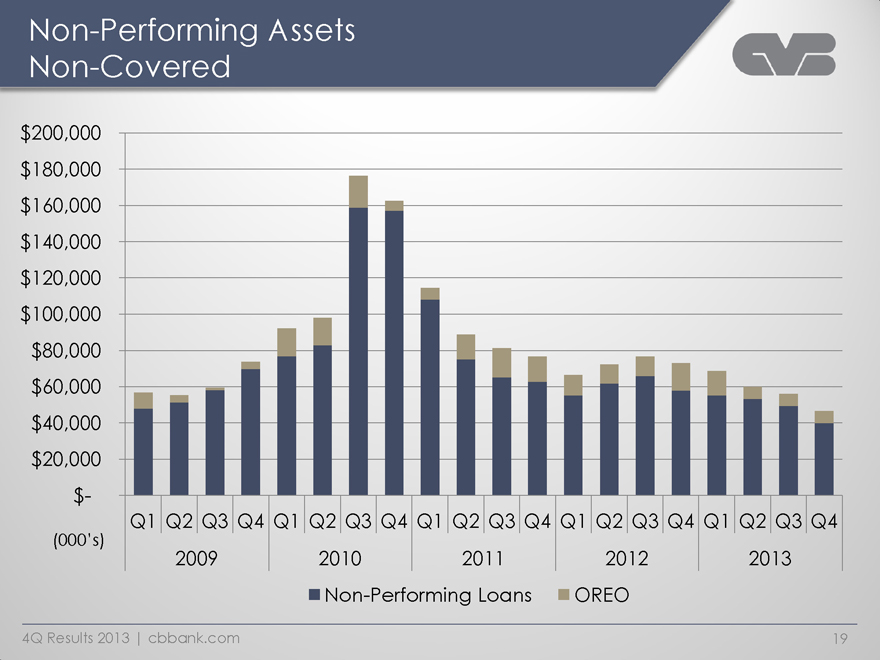
Non-Performing Assets Non-Covered
$200,000
$180,000
$160,000
$140,000
$120,000
$100,000
$80,000
$60,000
$40,000
$20,000
$-
(000’s)
Q1 Q2 Q3 Q4 Q1 Q2 Q3 Q4 Q1 Q2 Q3 Q4 Q1 Q2 Q3 Q4 Q1 Q2 Q3 Q4
2009
2010
2011
2012
2013
Non-Performing Loans
OREO
4Q Results 2013 | cbbank.com
19
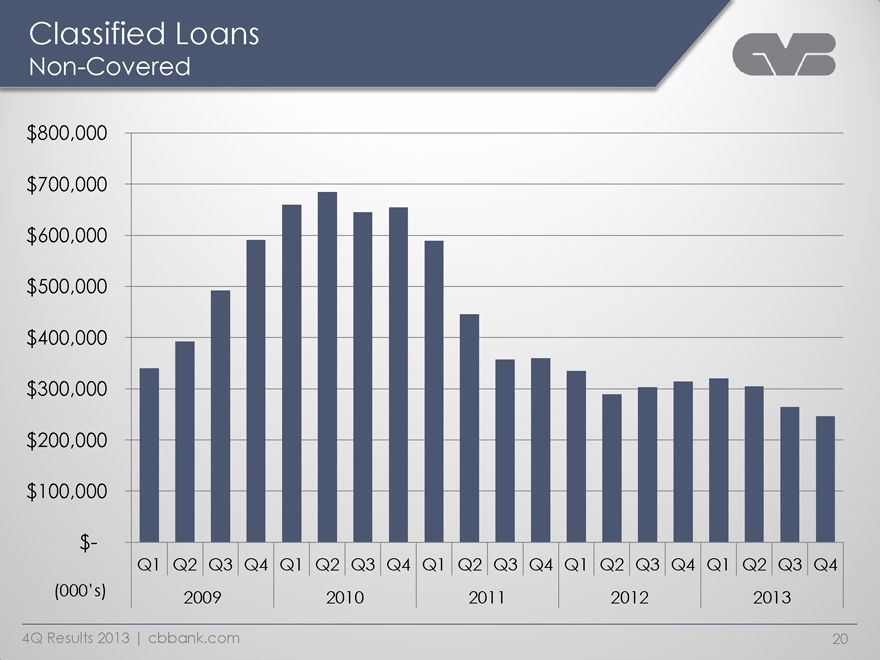
Classified Loans
Non-Covered
$800,000
$700,000
$600,000
$500,000
$400,000
$300,000
$200,000
$100,000
$-
(000’s)
Q1 Q2 Q3 Q4 Q1 Q2 Q3 Q4 Q1 Q2 Q3 Q4 Q1 Q2 Q3 Q4 Q1 Q2 Q3 Q4
2009
2010
2011
2012
2013
4Q Results 2013 | cbbank.com
20
CVB Financial Corp.
Profits
4Q Results 2013 | cbbank.com
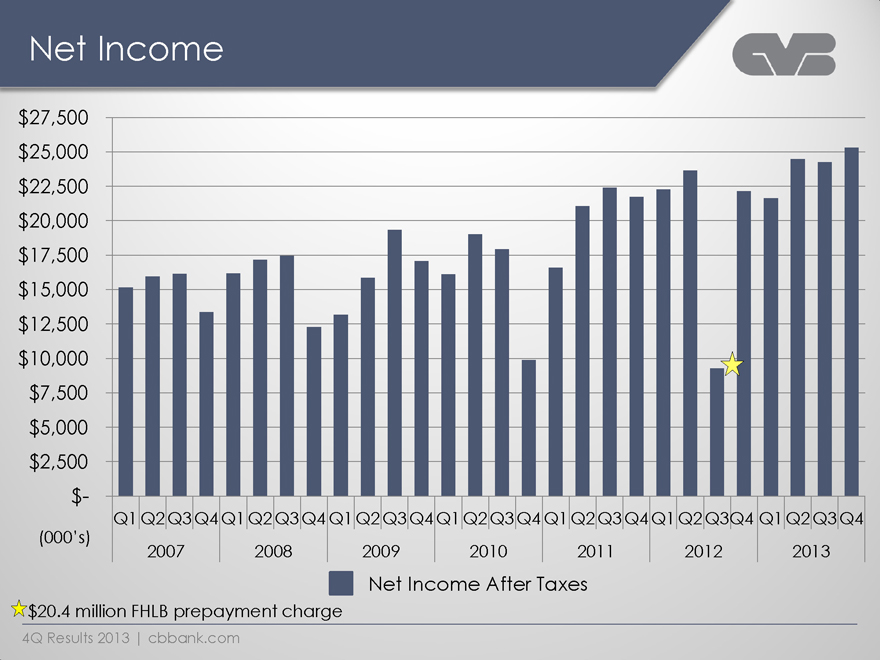
Net Income
$27,500
$25,000
$22,500
$20,000
$17,500
$15,000
$12,500
$10,000
$7,500
$5,000
$2,500
$-
Q1 Q2 Q3 Q4 Q1 Q2 Q3 Q4 Q1 Q2 Q3 Q4 Q1 Q2 Q3 Q4 Q1 Q2 Q3 Q4 Q1 Q2 Q3 Q4 Q1 Q2 Q3 Q4
(000’s) 2007 2008 2009 2010 2011 2012 2013
Net Income After Taxes
$20.4 million FHLB prepayment charge
4Q Results 2013 | cbbank.com
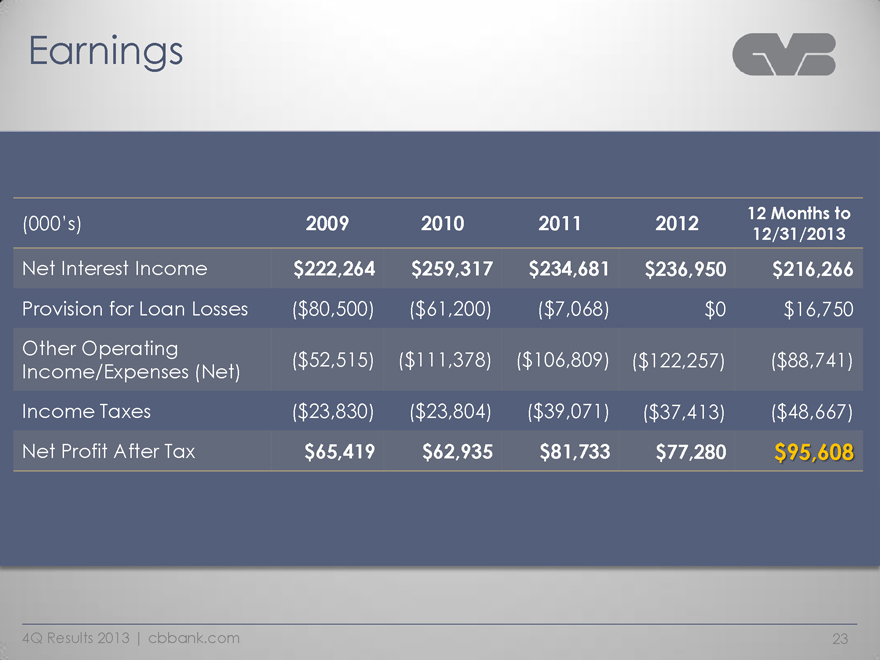
Earnings
(000’s) 2009 2010 2011 2012 12 Months to 12/31/2013
Net Interest Income $222,264 $259,317 $234,681 $236,950 $216,266
Provision for Loan Losses ($80,500) ($61,200) ($7,068) $0 $16,750
Other Operating Income/Expenses (Net) ($52,515) ($111,378) ($106,809) ($122,257) ($88,741)
Income Taxes ($23,830) ($23,804) ($39,071) ($37,413) ($48,667)
Net Profit After Tax $65,419 $62,935 $81,733 $77,280 $95,608
4Q Results 2013 | cbbank.com 23
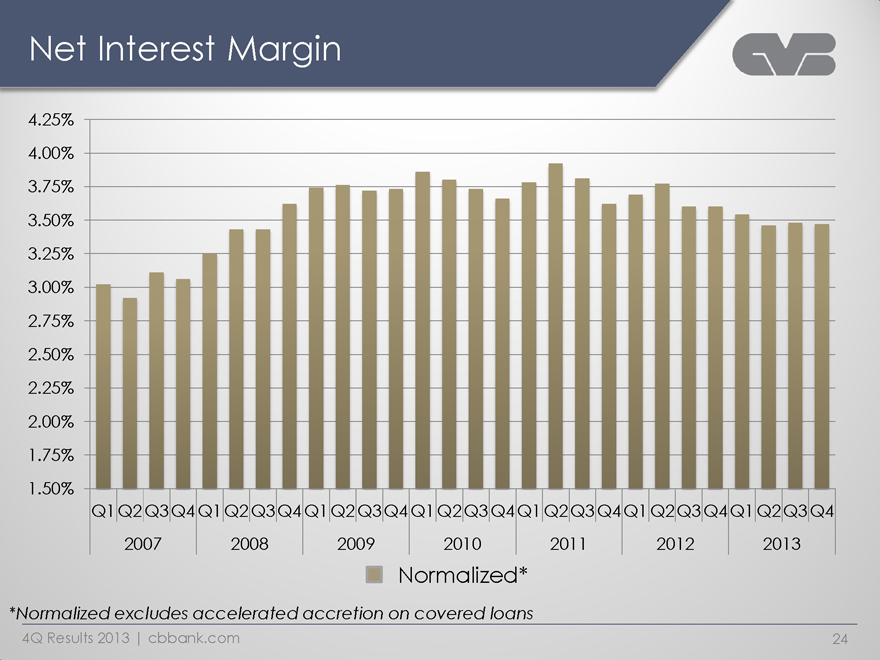
Net Interest Margin
4.25%
4.00%
3.75%
3.50%
3.25%
3.00%
2.75%
2.50%
2.25%
2.00%
1.75%
1.50%
Q1 Q2 Q3 Q4 Q1 Q2 Q3 Q4 Q1 Q2 Q3 Q4 Q1 Q2 Q3 Q4 Q1 Q2 Q3 Q4 Q1 Q2 Q3 Q4 Q1 Q2 Q3 Q4
2007 2008 2009 2010 2011 2012 2013
Normalized*
*Normalized excludes accelerated accretion on covered loans
4Q Results 2013 | cbbank.com 24
Exhibit A
Exhibit A
CVB Financial Corp.
Expenses
4Q Results 2013 | cbbank.com
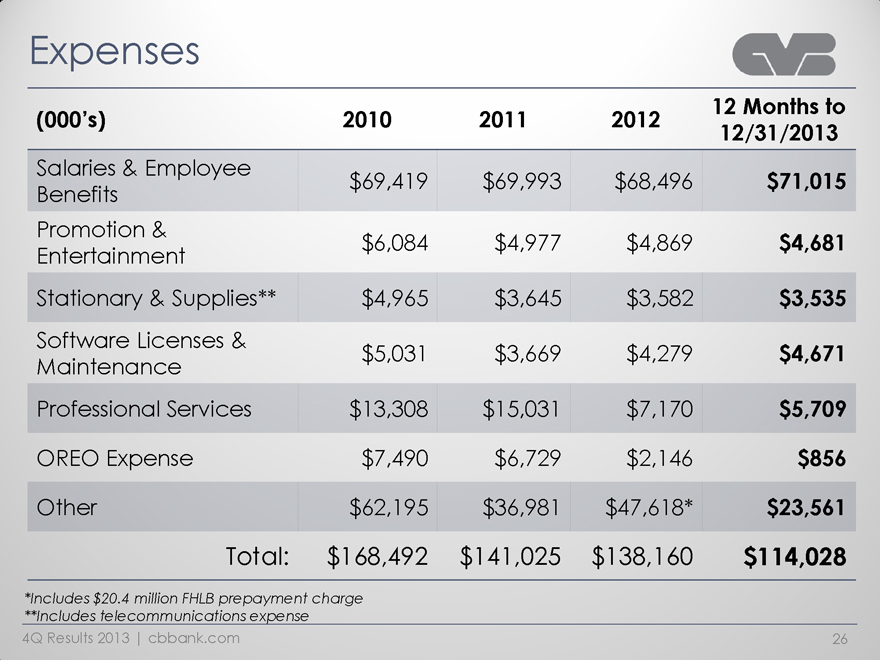
Expenses
(000’s) 2010 2011 2012 12 Months to 12/31/2013
Salaries & Employee Benefits $69,419 $69,993 $68,496 $71,015
Promotion & Entertainment $6,084 $4,977 $4,869 $4,681
Stationary & Supplies** $4,965 $3,645 $3,582 $3,535
Software Licenses & Maintenance $5,031 $3,669 $4,279 $4,671
Professional Services $13,308 $15,031 $7,170 $5,709
OREO Expense $7,490 $6,729 $2,146 $856
Other $62,195 $36,981 $47,618* $23,561
Total: $168,492 $141,025 $138,160 $114,028
*Includes $20.4 million FHLB prepayment charge
**Includes telecommunications expense
4Q Results 2013 | cbbank.com 26
CVB Financial Corp.
Bank Borrowings
4Q Results 2013 | cbbank.com
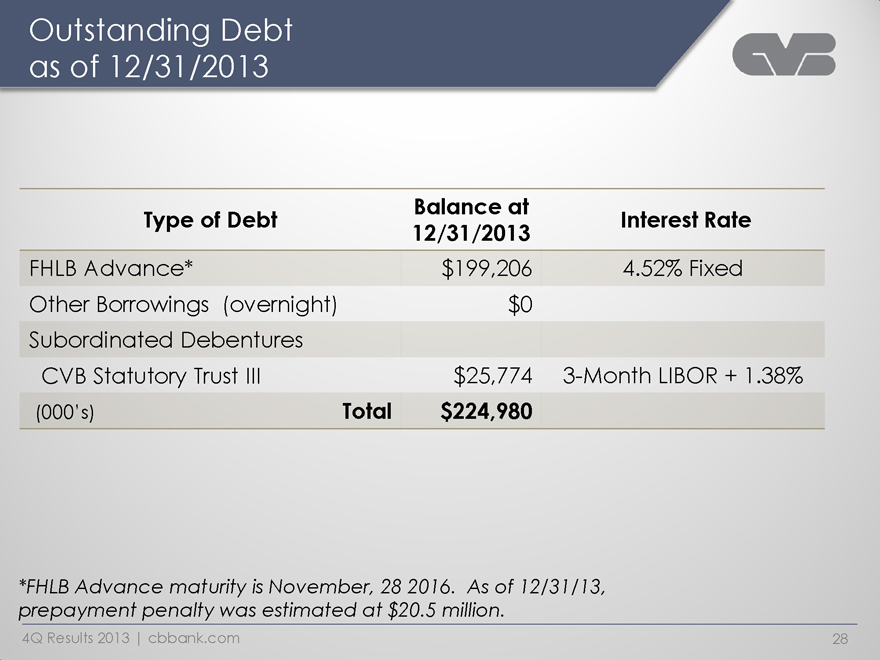
Outstanding Debt as of 12/31/2013
Type of Debt Balance at 12/31/2013 Interest Rate
FHLB Advance* $199,206 4.52% Fixed
Other Borrowings (overnight) $0
Subordinated Debentures
CVB Statutory Trust III $25,774 3-Month LIBOR + 1.38%
(000’s) Total $224,980
*FHLB Advance maturity is November, 28 2016. As of 12/31/13, prepayment penalty was estimated at $20.5 million.
4Q Results 2013 | cbbank.com 28
CVB Financial Corp.
Capital
4Q Results 2013 | cbbank.com
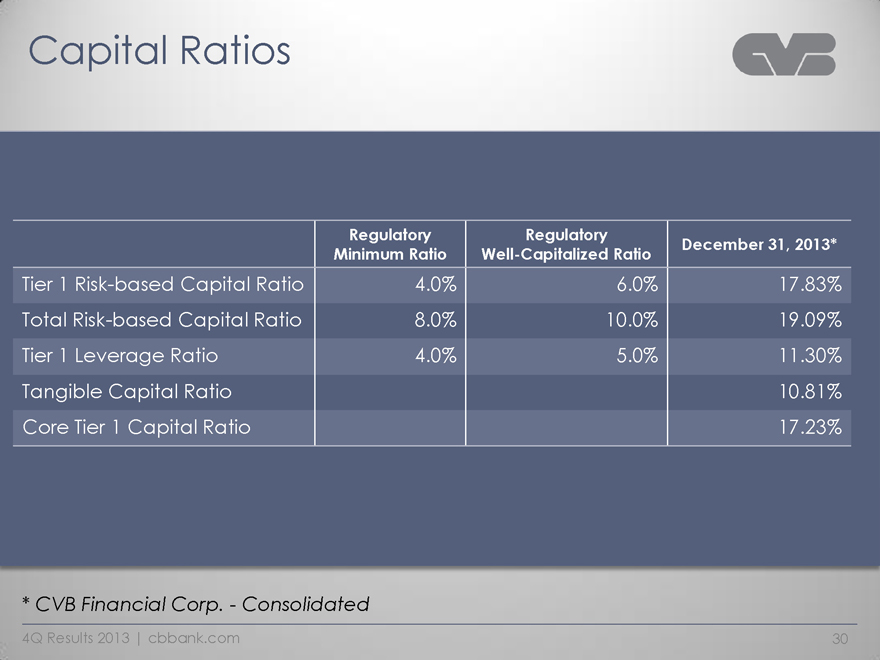
Capital Ratios
Regulatory Minimum Ratio Regulatory Well-Capitalized Ratio December 31, 2013*
Tier 1 Risk-based Capital Ratio 4.0% 6.0% 17.83%
Total Risk-based Capital Ratio 8.0% 10.0% 19.09%
Tier 1 Leverage Ratio 4.0% 5.0% 11.30%
Tangible Capital Ratio 10.81%
Core Tier 1 Capital Ratio 17.23%
* CVB Financial Corp. - Consolidated
4Q Results 2013 | cbbank.com 30

CVB Financial Corp.
Securities & Investments
4Q Results 2013 | cbbank.com
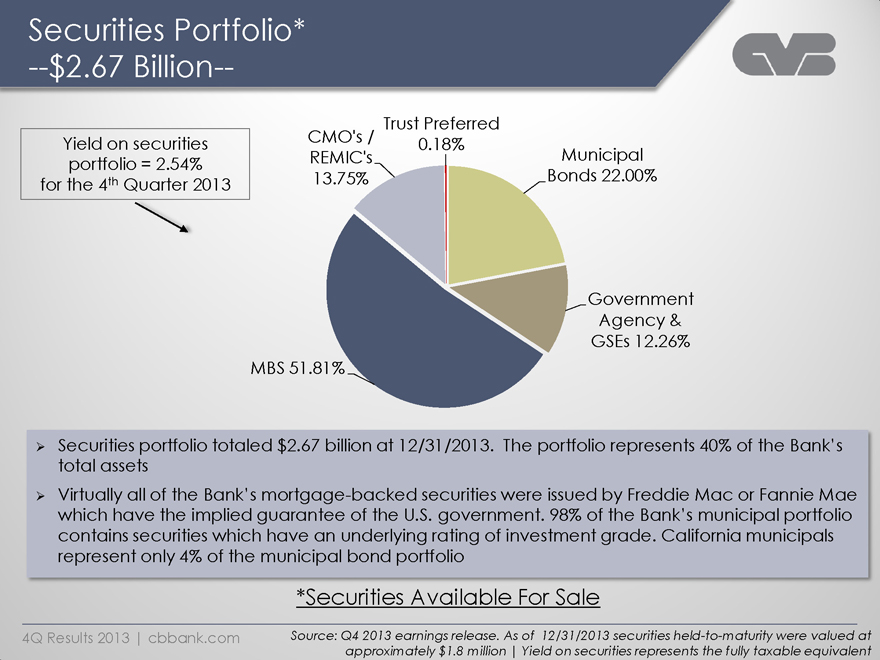
Securities Portfolio*
--$2.67 Billion--
CMO’s REMIC’s 13.75%
Trust Preferred 0.18%
Municipal Bonds 22.00%
MBS 51.81%
Government Agency & GSEs 12.26%
Yield on securities portfolio = 2.54% for the 4th Quarter 2013
Securities portfolio totaled $2.67 billion at 12/31/2013. The portfolio represents 40% of the Bank’s total assets
Virtually all of the Bank’s mortgage-backed securities were issued by Freddie Mac or Fannie Mae which have the implied guarantee of the U.S. government. 98% of the Bank’s municipal portfolio contains securities which have an underlying rating of investment grade. California municipals represent only 4% of the municipal bond portfolio
*Securities Available For Sale
4Q Results 2013 | cbbank.com
Source: Q4 2013 earnings release. As of 12/31/2013 securities held-to-maturity were valued at approximately $1.8 million | Yield on securities represents the fully taxable equivalent
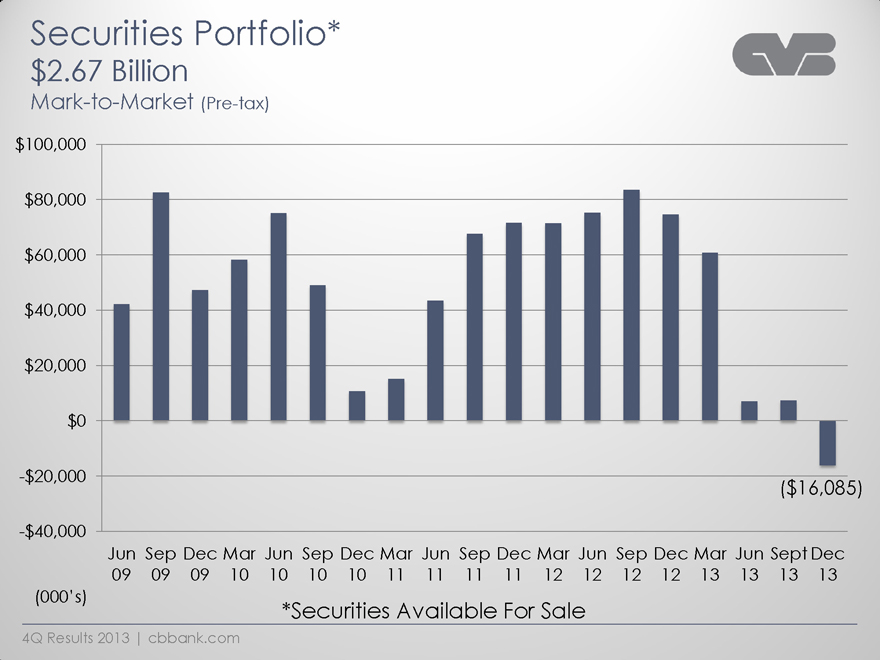
Securities Portfolio*
$2.67 Billion
Mark-to-Market (Pre-tax)
$100,000
$80,000
$40,000
$20,000
$0
-$20,000
-$40,000 ($16,085)
Jun Sep Dec Mar Jun Sep Dec Mar Jun Sep Dec Mar Jun Sep Dec Mar Jun Sep Dec
09 09 09 10 10 10 10 11 11 11 11 12 12 12 12 13 13 13 13
(000’s)
*Securities Available For Sale
4Q Results 2013 | cbbank.com
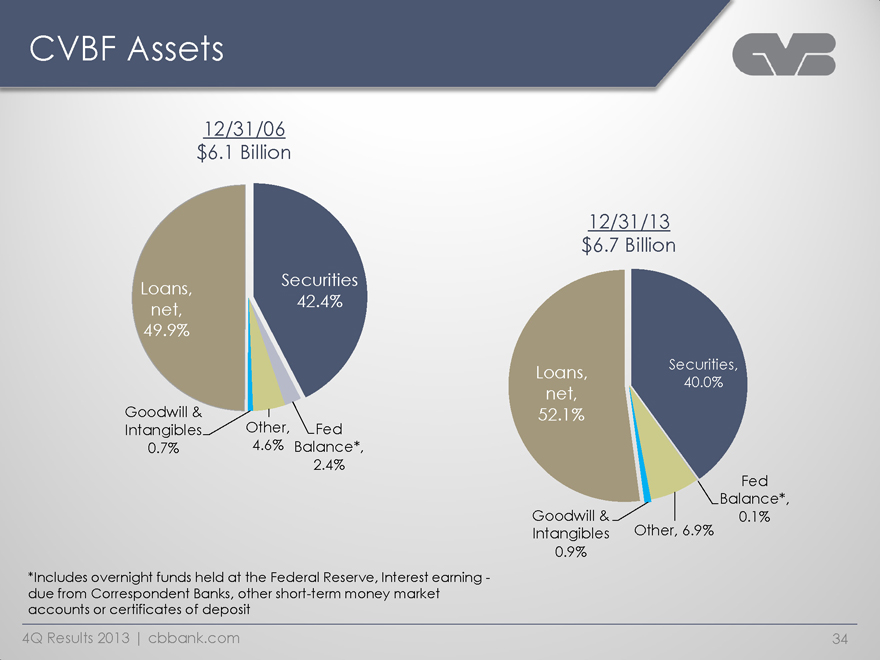
CVBF Assets
12/31/06 $6.1 Billion
Loans, net, 49.9%
Securities 42.4%
Goodwill and intangibles 0.7%
Other, 4.6%
Fed Balance*, 2.4%
12/31/13 $6.7 Billion
Loans, net, 52.1%
Securities, 40.0%
Goodwill and intangibles 0.9%
Other, 6.9%
Fed Balance*, 0.1%
*Includes overnight funds held at the Federal Reserve, Interest earning - due from Correspondent Banks, other short-term money market accounts or certificates of deposit
4Q Results 2013 | cbbank.com 34
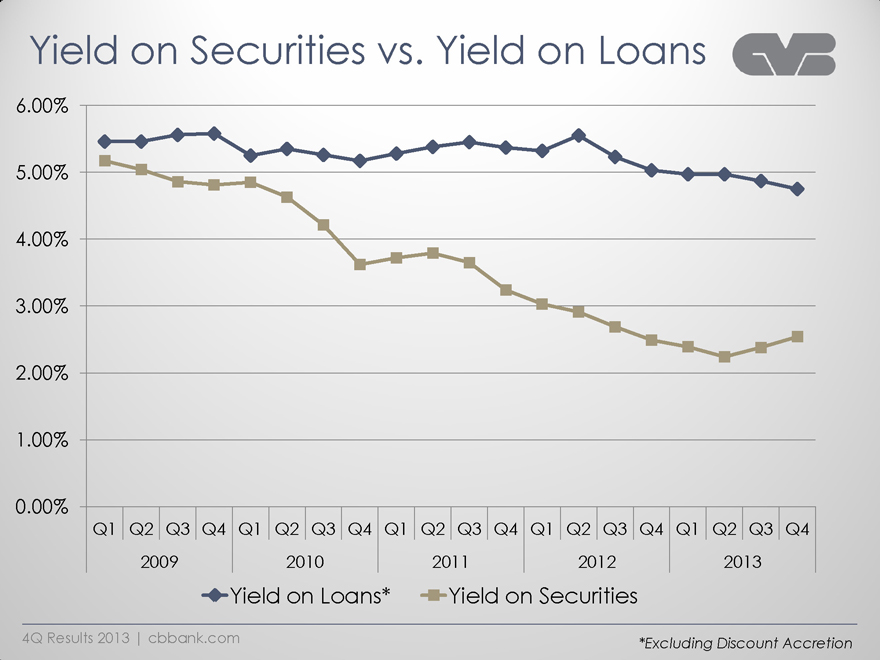
Yield on Securities vs. Yield on Loans
6.00%
5.00%
4.00%
3.00%
2.00%
1.00%
0.00%
Q1 Q2 Q3 Q4 Q1 Q2 Q3 Q4 Q1 Q2 Q3 Q4 Q1 Q2 Q3 Q4 Q1 Q2 Q3 Q4
2009 2010 2011 2012 2013
Yield on Loans* Yield on Securities
4Q Results 2013 | cbbank.com *Excluding Discount Accretion
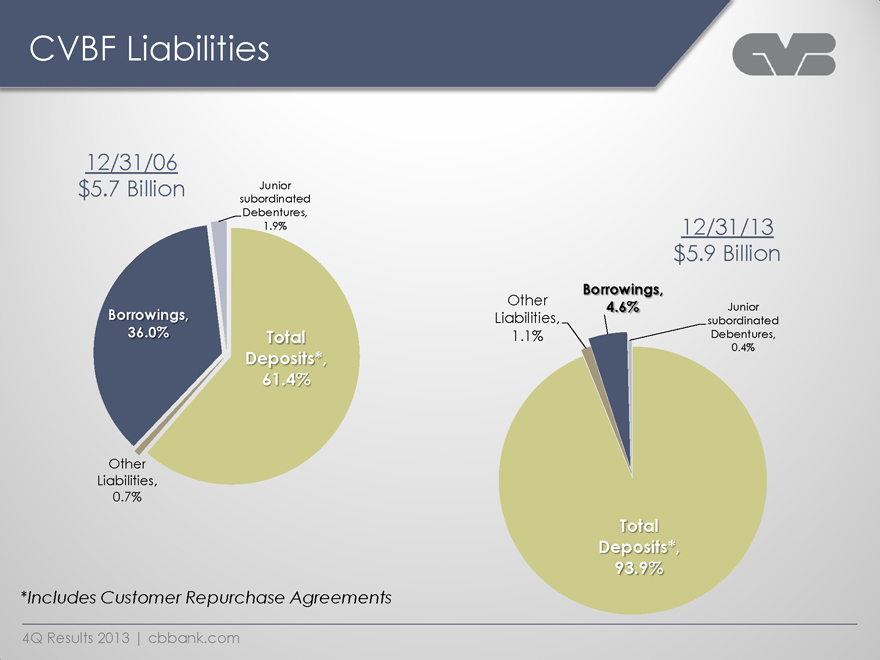
CVBF Liabilities
12/31/06 $5.7 Billion
Junior subordinated Debentures, 1.9%
Borrowings, 36.0%
Total Deposits*, 61.4%
Other Liabilities, 0.7%
12/31/13 $5.9 Billion
Other Liabilities, 1.1%
Junior subordinated Debentures, 0.4%
Borrowings, 4.6%
Total Deposits*, 93.9%
*Includes Customer Repurchase Agreements
4Q Results 2013 | cbbank.com
CVB Financial Corp.
New Acquisition
4Q Results 2013 | cbbank.com 37
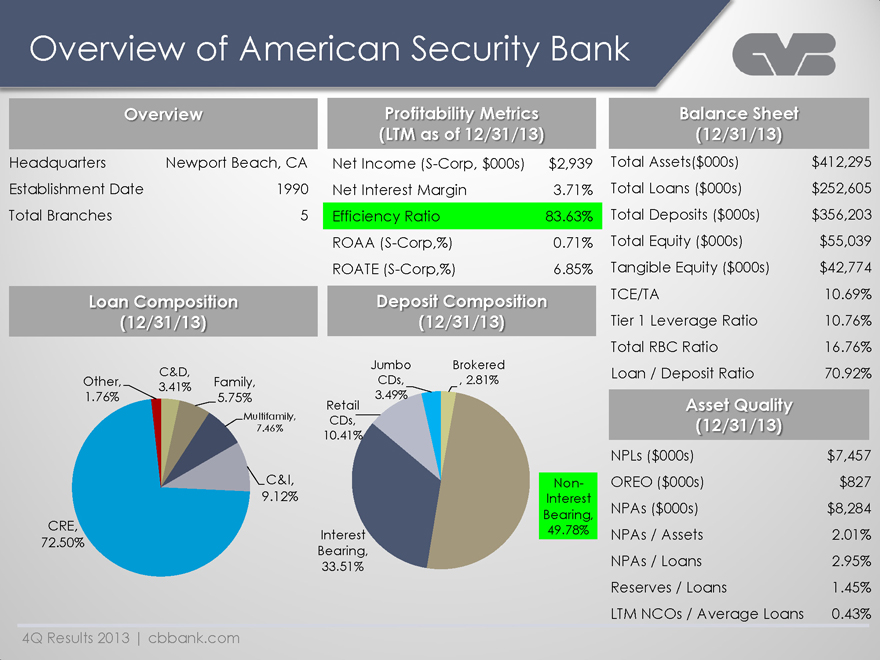
Overview of American Security Bank
Overview
Headquarters
Newport Beach, CA
Establishment Date
1990
Total Branches
5
Loan Composition (12/31/2013)
Profitability Metrics (LTM as of 12/31/2013)
Net Income (S-Corp, $000s) $2,939
Net Interest Margin 3.71%
Efficiency Ratio 83.63%
ROAA (S-Corp,%) 0.71%
ROATE (S-Corp,%) 6.85%
Deposit Composition (12/31/13)
Other 1.76%
CRE 72.50%
C&D,
3.41% Family
5.75%
Multifamily, 7.46%
C&I
9.12%
Jumbo Brokered
CDs, 2.81%
3.49% Retail
CDs,
10.41%
Interest Bearing; 33.51%
Non-Interest Bearing, 49.78%
Balance Sheet (12/31/13)
Total Assets($000s) $412,295
Total Loans ($000s) $252,605
Total Deposits ($000s) $356,203
Total Equity ($000s) $55,039
Tangible Equity ($000s) $42,774
TCE/TA 10.69%
Tier 1 Leverage Ratio 10.76%
Total RBC Ratio 16.76%
Loan / Deposit Ratio 70.92%
Asset Quality (12/31/13)
NPLs ($000s) $7,457
OREO ($000s) $827
NPAs ($000s) $8,284
NPAs / Assets 2.01%
NPAs / Loans 2.95%
Reserves / Loans 1.45%
LTM NCOs / Average Loans 0.43%
4Q Results 2013 | cbbank.com
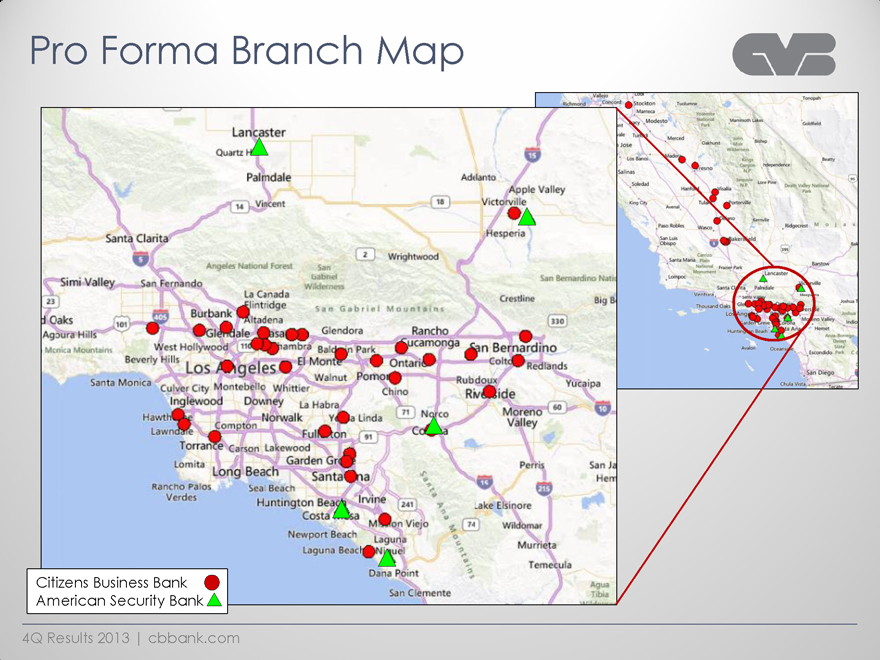
Pro Forma Branch Map
Lancaster
Palmdale
Santa Clarita
Vincent
Simi Valley
San Fernando
Burbank
La Canada
Flintridge
Wrightwood
Adelanto
Apple Valley
Victorville
Hesperia
Angeles National Forest
San Gabriel Wildernes
Crestline
San Bernardino
San Gabriel Mountains
Glendale
Glendora
Rancho
Cucamonga
San Bernardino
West Hollywood
Beverly Hills
Ontario
Rediands
Santa Monica
Culver City
Montebello
Los Angeles
El Monte
Walnut
Rubdoux
Yucaip
Chino
Whittler
Inglewood
Downey
La Habra
Compton
Norwalk
Torrance
Carson
Lakewood
Peris
Lomita
Long Beach
Sea Beach
Rancho Pajos Verdes
Hunting Beach
Irvine
Newport Beach
Laguna
Lake Elsinore
Wildomar
Murrieta
Temecula
Dana Point
San Clemente
Citizens Business Bank
American Security Bank
4Q Results 2013 | cbbank.com
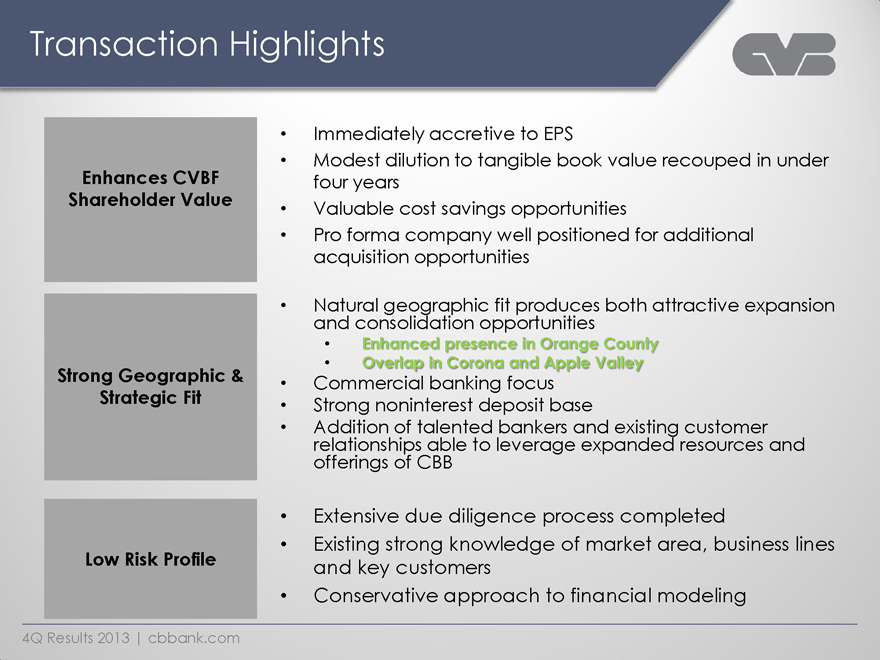
Transaction Highlights
Enhances CVBF
Shareholder Value
Strong Geographic &
Strategic Fit
Low Risk Profile
Immediately accretive to EPS
Modest dilution to tangible book value recouped in under four years
Valuable cost savings opportunities
Pro forma company well positioned for additional acquisition opportunities
Natural geographic fit produces both attractive expansion and consolidation opportunities
Enhanced presence in Orange County
Overlap in Corona and Apple Valley
Commercial banking focus
Strong noninterest deposit base
Addition of talented bankers and existing customer relationships able to leverage expanded resources and offerings of CBB
Extensive due diligence process completed
Existing strong knowledge of market area, business lines and key customers
Conservative approach to financial modeling
4Q Results 2013 | cbbank.com
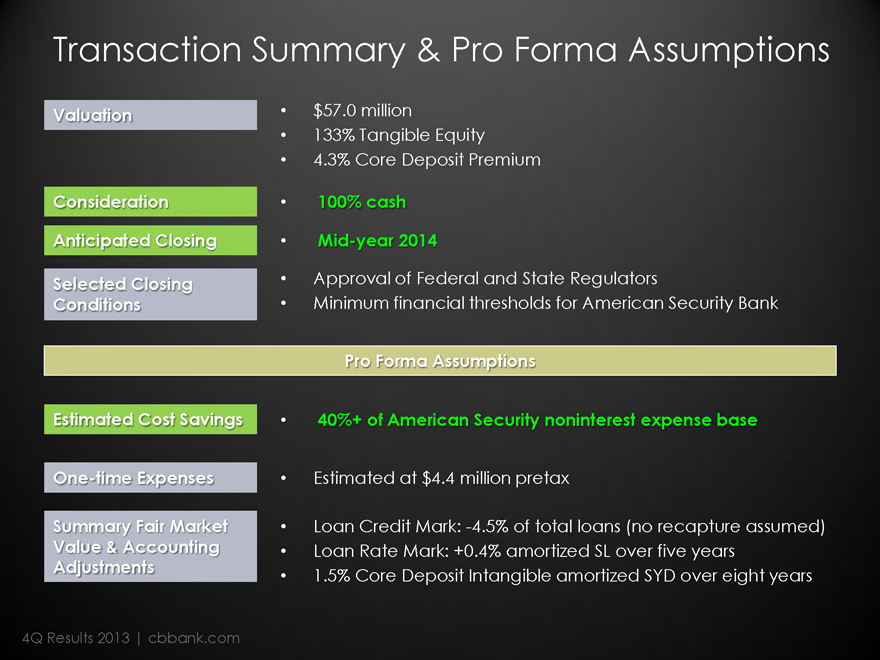
Transaction Summary & Pro Forma Assumptions
Valuation
$57.0 million
133% Tangible Equity
4.3% Core Deposit Premium
Consideration 100% cash
Anticipated Closing Mid-year 2014
Selected Closing Conditions
Approval of Federal and State Regulators
Minimum financial thresholds for American Security Bank
Pro Forma Assumptions
Estimated Cost Savings
40%+ of American Security noninterest expense base
One-time Expenses
Estimated at $4.4 million pretax
Summary Fair Market Value & Accounting Adjustments
Loan Credit Mark: -4.5% of total loans (no recapture assumed)
Loan Rate Mark: +0.4% amortized SL over five years
1.5% Core Deposit Intangible amortized SYD over eight years
4Q Results 2013 | cbbank.com
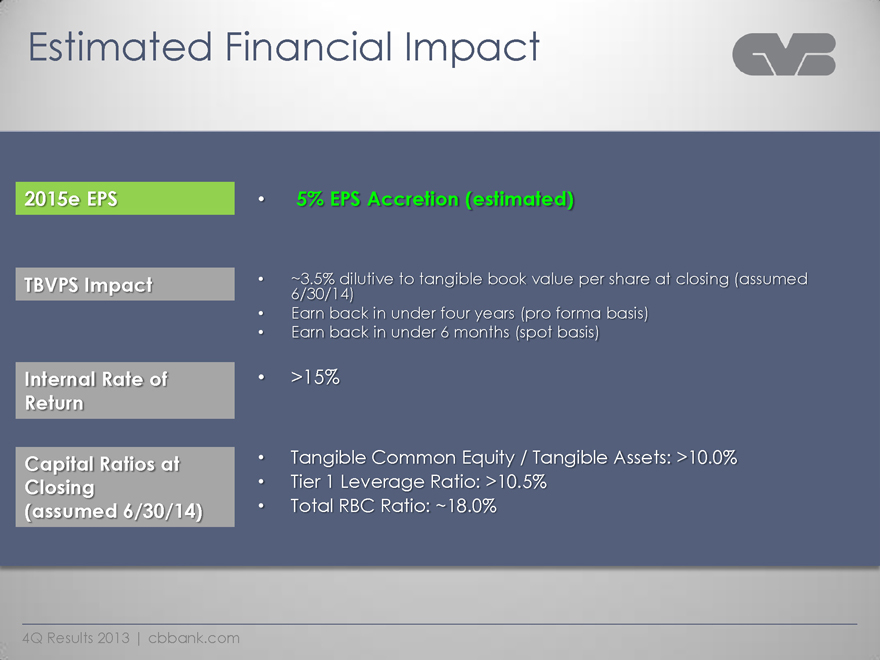
Estimated Financial Impact
2015e EPS
5% EPS Accretion (estimated)
TBVPS Impact
~3.5% dilutive to tangible book value per share at closing (assumed 6/30/14)
Earn back in under four years (pro forma basis)
Earn back in under 6 months (spot basis)
Internal Rate of Return
>15%
Capital Ratios at Closing (assumed 6/30/14)
Tangible Common Equity / Tangible Assets: >10.0%
Tier 1 Leverage Ratio: >10.5%
Total RBC Ratio: ~18.0%
4Q Results 2013 | cbbank.com
CVB Financial Corp.
Our Growth Strategy
4Q Results 2013 | cbbank.com
Our Vision
Citizens Business Bank will strive to become the dominant financial services company operating throughout the state of California, servicing the comprehensive financial needs of successful small to medium sized businesses and their owners.
4Q Results 2013 | cbbank.com 44
Target Customer
The best privately-held and/or family-owned businesses throughout California
— Annual revenues of $1-200 million
— Top 25% in their respective industry
— Full relationship banking
— Build 20-year relationships
4Q Results 2013 | cbbank.com 45
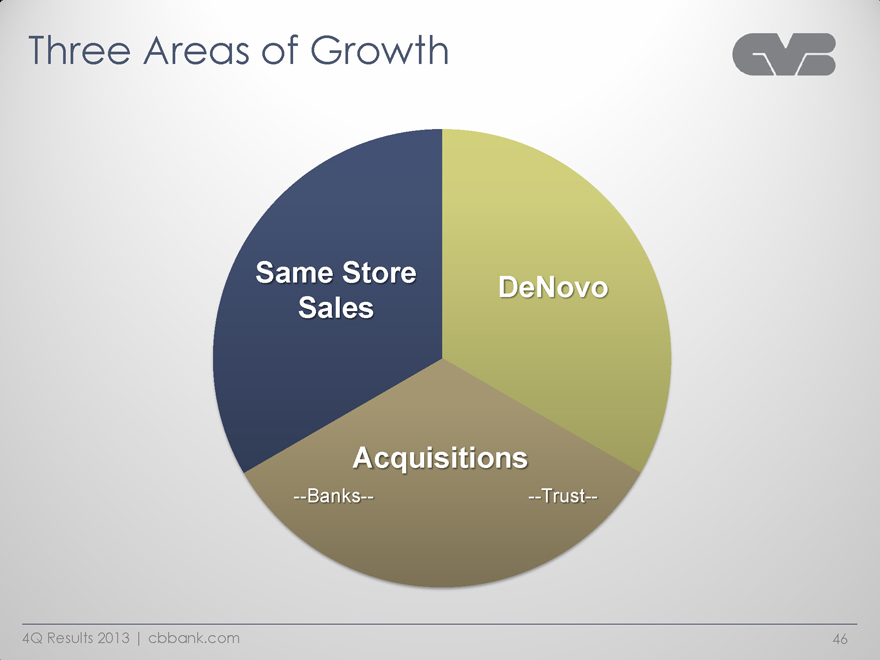
Three Areas of Growth
Same Store Sales
DeNovo
Acquisitions
Banks Trust
4Q Results 2013 | cbbank.com 46
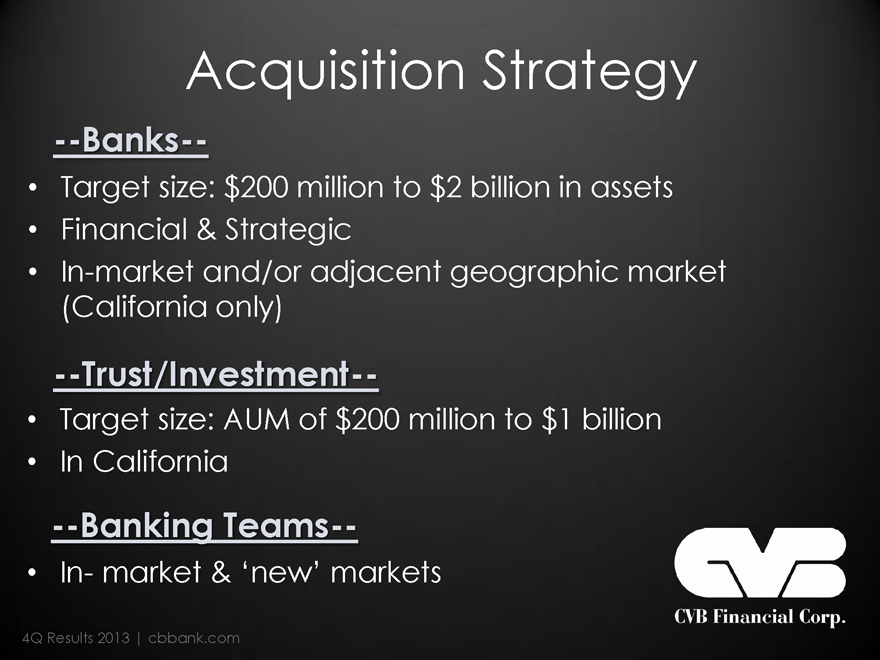
Acquisition Strategy
--Banks--
Target size: $200 million to $2 billion in assets
Financial & Strategic
In-market and/or adjacent geographic market (California only)
--Trust/Investment--
Target size: AUM of $200 million to $1 billion
In California
--Banking Teams--
In- market & ‘new’ markets
CVB Financial Corp.
4Q Results 2013 | cbbank.com
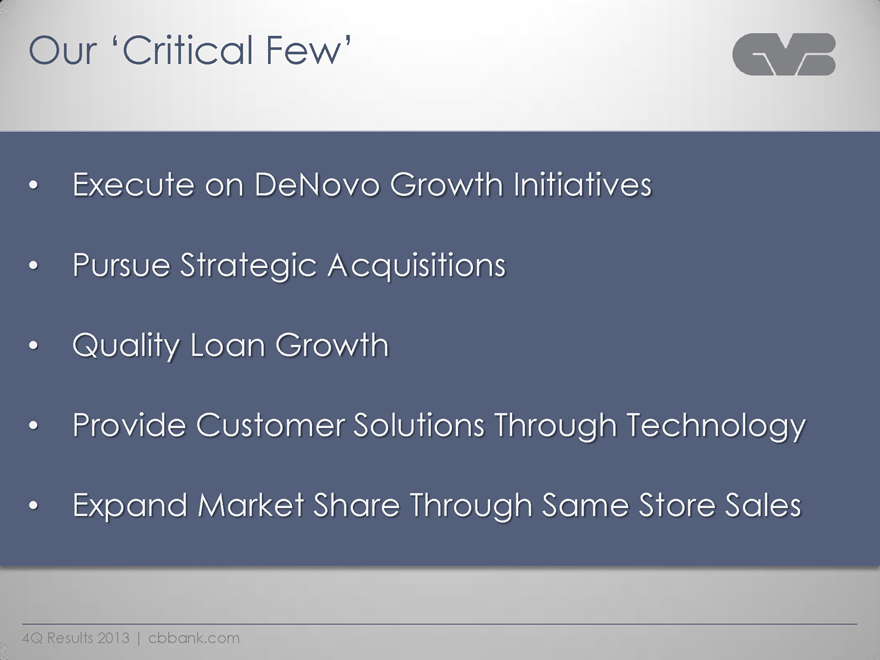
Our ‘Critical Few’
Execute on DeNovo Growth Initiatives
Pursue Strategic Acquisitions
Quality Loan Growth
Provide Customer Solutions Through Technology
Expand Market Share Through Same Store Sales
4Q Results 2013 | cbbank.com
CVB Financial Corp.
Copy of presentation at www.cbbank.com
4Q Results 2013 | cbbank.com