April 3, 2014
Mr. Brad Skinner
Senior Assistant Chief Accountant
United States Securities and Exchange Commission
Division of Corporation Finance
100 F Street, N.E.
Washington, D.C. 20549
| Re: | Bolt Technology Corporation | |
| Form 10-K for Year End June 30, 2013 | ||
| Filed on September 13, 2013 | ||
| Supplemental Response dated February 18, 2014 | ||
| File No. 001-12075 |
Dear Mr. Skinner:
We have carefully considered each of the comments set forth in your letter of March 6, 2014 regarding your review of the Bolt Technology Corporation Form 10-K for the fiscal year ended June 30, 2013 and have responded to them in the enclosed attachment. For your convenience, we have included the original text of comments from your letter of March 6, 2014 followed by our response.
We also acknowledge that the Company is responsible for the adequacy and accuracy of the disclosure in our filings; staff comments or changes to disclosure in response to staff comments do not foreclose the Commission from taking any action with respect to the filing; and the Company may not assert staff comments as a defense in any proceeding initiated by the Commission or any person under the federal securities laws of the United States.
Should you have any further questions and/or require additional information please contact the undersigned. Thank you for your attention to this matter.
Very truly yours,
/s/ Joseph Espeso
Joseph Espeso
Chief Financial Officer
Attachment
BOLT TECHNOLOGY CORPORATION
Form 10-K for Fiscal Year Ended June 30, 2013
Consolidated Statements of Cash Flows, page F-6
1. We note your response to comment one in our comment letter dated February 3, 2014 and your proposal to reclassify from investing activities to operating activities the portion of the contingent earnout payments made in fiscal year 2013 that were in excess of the acquisition date fair value of the contingent earnout liability. In this regard, please also tell us why you believe that the contingent earnout payments of the $5,000,000 liability accrued at the acquisition date should be classified as investing activities versus financing activities in the statements of cash flows. We note the payments were made over a three year period. Address FASB ASC paragraphs 230-10-45-13c and 15c in your response.
In your March 6, 2014 letter you inquire as to our classification of the $5.0 million accrued liability for contingent earnout payments in the statements of cash flows as investing activities rather than financing activities. At the time of the acquisition, we considered the $5.0 million accrued contingent earnout payment to be of the nature of a future investment activity, based on future growth and revenues of the newly acquired SeaBotix entity. The $5.0 million accrual for contingent earnout payments was an estimate only, not a fixed debt obligation for an amount certain. As a revenue based earnout, we did not consider it to be debt with principal payments due to seller under ASC 230-10-45-13c, or to be directly related to the purchase of property, plant and equipment or other productive assets under ASC 230-10-45-15c. For these reasons we considered it to be most appropriately classified as an investment activity.
We are aware, however, that other issuers have treated such payments as financing activities and that there is guidance suggesting that approach under ASC 230-10-45-13c and ASC 230-10-45-15c. In view of your comments and such guidance, we would propose to do the following in regard to the Company’s Statement of Cash Flows (in addition to our response of February 18, 2014):
Reclassify from investing activities to financing activities the $4.5 million acquisition date fair value of the contingent earnout liability in the Company’s cash flow statements. (Although the acquisition date fair value of the contingent earnout liability was estimated to be $5.0 million, the actual amount paid was $4.5 million.) This reclassification will be made in any future filings by the Company with the Commission containing comparable prior period cash flow statements, as appropriate.
| Page 1 of 11 |
2. Tell us in more detail how you determined the fair value of the contingent consideration for each period through December 31, 2013, including, but not limited to, the valuation technique used and how you evaluated the probability of achieving the required financial performance under the earnout. Address trends and other factors which impacted your assumptions and estimation process. For example, tell us how sales projections changed from the initial valuation to the subsequent valuations, addressing how the projections reflected actual results and how you adjusted your assumptions as a result.
The SeaBotix contingent earnout liability is a Level 3 in the fair value hierarchy. Management must deal with unobservable inputs to make its best estimate of inputs that market participants would use in pricing the asset or liability at the measurement date, including assumptions about risk.
As reviewed below, the most important of these unobservable inputs for the SeaBotix contingent earnout liability is the lack of predictability as to the demand, timing or size of large-dollar, multi-unit orders primarily from ADS, a SeaBotix distributor who in turn sells the underwater robotic vehicles to the U.S. Navy. These orders, which have had a material effect on the contingent earnout liability, were not part of SeaBotix’s historical revenues as of the January 1, 2011 acquisition date. The first such order was not received until the final quarter of calendar year 2011. In the following two years, this category of orders increased to constitute 23% of revenues in calendar year 2012 and 62% of revenues in calendar year 2013.
Valuation Technique
The Company made its initial estimate of the fair value of the SeaBotix contingent earnout liability as of the January 1, 2011 acquisition date and estimated it to be $5.0 million. This initial contingent earnout liability was comprised of two components:
| 1. | The purchase price included a contingent earnout component based on orders received during the two month period following the closing (the “Post-Close Earnout”), comprised of (i) $2.0 million if calendar year 2010 revenues, plus revenues and booked orders received during the post-closing two month period (the “Adjusted Revenues”), exceeded $7.3 million, plus (ii) $3.0 million if the Adjusted Revenues exceeded $8.0 million. The Company estimated the acquisition date fair value of the Post-Close Earnout component to be $5.0 million. |
| 2. | In addition to the Post-Close Earnout component, the purchase price included a four-year earnout based on annual sales in each of calendar years 2011 through 2014 (the “Revenue Earnout”). Each year’s Revenue Earnout liability was contingent on SeaBotix having (i) a minimum of $10.0 million in revenue per annum on a cumulative basis, and (ii) a gross profit margin of at least 50% each year. If SeaBotix failed to meet either target, no Revenue Earnout payment would be due for that calendar year. |
| Page 2 of 11 |
In estimating the contingent earnout liability for the Revenue Earnout, management considered the likelihood and timing of achieving these revenue and gross profit margin thresholds based on then available information, including historical revenue performance and the lack of backlog. Revenue for calendar years 2009 and 2010 were $8.3 million and $7.2 million, respectively, significantly below the $10.0 million threshold. Management expected that revenue growth would be dependent on the market acceptance and orders for several new products being introduced by SeaBotix at the time of the acquisition.
Based on these factors, management estimated that SeaBotix was unlikely to achieve the cumulative $10.0 million revenue per annum threshold during the four-year Revenue Earnout period. As a result, management estimated that the former stockholders of SeaBotix (the “sellers”) would not earn any additional earnout payments, other than the $5.0 million contingent earnout liability accrued for the Post-Close Earnout.
After the acquisition date fair value estimate of the contingent earnout liability was established, management reviewed and estimated the fair value of the SeaBotix contingent earnout liability at the end of each quarterly accounting period by modeling future business, based primarily on management’s estimate of projected revenues for SeaBotix, using the following process:
| 1. | Management estimated future revenue for the remaining portion of the then current calendar year, based on its review and judgment of relevant factors, including historical performance, current backlog, market conditions, new product introductions, revenue volatility, economic conditions, customer profiles and concentration, and penetration of new markets. |
| 2. | After completion of step 1, management estimated an appropriate revenue multiplier for future years based on management’s review and judgment as to future years’ revenue trend lines and consideration of the factors that management considered relevant to such future years. This revenue multiplier was then applied to the current calendar year’s estimated revenues to estimate revenue for each of the future years in the earnout period ending December 31, 2014. |
| 3. | After the end of calendar year 2011, management was able to refine the modeling process based on the Company’s first year of ownership of SeaBotix and its business. For calendar year 2012 and beyond, the modeling process has also included (a) estimating and weighting of the probability of three different revenue scenarios (low, base, and high) for each calendar year, (b) estimating the likelihood that SeaBotix would achieve the required 50% gross profit margin threshold, (c) calculating the present value of the contingent earnout liability for each calendar year using a discount rate for the time value of money, and (d) totaling the present value of the contingent earnout liability for each year to arrive at the required total contingent earnout liability. |
| Page 3 of 11 |
Trends and Factors Considered for Probability of Achieving Estimated Revenues
Several important trends and factors impact this process and the resulting estimates, including:
Revenue Earnout Structure: The Revenue Earnout is paid based on actual revenues for each calendar year 2011 through 2014. However, in order for any amount to be payable for a given calendar year, SeaBotix must have (a) cumulative revenues per annum in excess of $10.0 million, and (b) at least a 50% gross profit margin. If either condition is not met, no Revenue Earnout is owed for that year.
New Product Introductions: At the time of the acquisition, SeaBotix was making several new product introductions which were expected to be an important source of revenue growth but for which there was no prior revenue. This factor was particularly important for calendar year 2011, when there was little ability to predict the market reception to such new products.
Significant Revenue from a Single Customer: Sales to an independent SeaBotix distributor (ADS) for use by the U.S. Navy accounted for approximately 23% and 62% of SeaBotix’s revenues in calendar years 2012 and 2013, respectively. This concentration of significant sales with a single customer created additional uncertainties as to future revenues because of possible changes in demand levels from such a substantial customer.
ADS Sales for U.S. Navy: ADS did not make its first sale to the U.S. Navy until the fourth quarter of calendar year 2011 and since then the ordering pattern for products for the U.S. Navy has been extremely variable and unpredictable. Despite strong communication channels between SeaBotix and ADS, there is limited information with which to make a probability assessment as to the timing and amount of orders, or the likelihood of repetitive orders for products for the U.S. Navy.
Governmental Constraints: The budgetary and political constraints of the U.S. government made predicting future ADS sales to the U.S. Navy all the more difficult. This was exacerbated by the prospect of sequestration in calendar year 2012, and then the implementation of sequestration in calendar year 2013. This also contributed to the limited predictive value of prior sales to ADS for the purpose of estimating future revenues, both as to timing and amount.
| Page 4 of 11 |
Variability between Quarters: ADS orders for the U.S. Navy tend to be single, large-dollar orders of multiple units, and do not reoccur in a consistent pattern as to the timing or the number of units in the order. This complicates the estimation process because it creates (i) substantial variability in SeaBotix’s quarterly revenues (for example, only $0.3 million in revenue from ADS was recorded in the fourth quarter of calendar year 2012, but in the immediately following year, revenue of $6.4 million from ADS was recorded in the fourth quarter, accounting for 33% of total revenues in calendar year 2013), and (ii) uncertainty until the later part of each calendar year, particularly for calendar year 2011, when it was difficult to determine if SeaBotix would attain the cumulative $10.0 million revenue per annum threshold required for any earnout payment.
Backlog: Backlog generally is useful in estimating future revenues. SeaBotix, however, typically ships orders within six weeks of receipt, making backlog of limited predictive value for more than a single future quarter.
Projections, Actual Results and Changes to Assumptions
The following section summarizes the estimation process used by management to determine the amount of the contingent earnout liability during calendar years 2011, 2012 and 2013.
Contingent Earnout Liability at Acquisition
At acquisition, management analyzed SeaBotix revenue for the prior two calendar years of 2009 ($8.3 million) and 2010 ($7.2 million). In 2009, $2.0 million (24%) of total revenue was from a single, non-recurring order. Excluding such order, revenue would have been $6.3 million. In 2010, revenue included $0.3 million for settlement of a lawsuit. Excluding such item, revenue would have been $6.9 million.
Management also considered SeaBotix’s new product introductions, one of which was just being introduced to the market and another introduced in calendar year 2010 without much market acceptance as of the acquisition date. Management estimated moderate growth from these new products when estimating the contingent earnout liability.
Reviewing these revenues and trends, management believed that revenue would not result in cumulative revenue averaging at least $10.0 million per year through December 31, 2014. Based on these assessments, management estimated that no contingent earnout liability was necessary to cover the four-year earnout period ending December 31, 2014 except for the $5.0 million acquisition date contingent earnout liability for the Post-Close Earnout described above.
After this acquisition date estimate of contingent earnout liability, the process for subsequent periods primarily focused on the Revenue Earnout, since the Post-Close Earnout measurement period had been completed and the full amount of the Post-Close Earnout was included in the amount of the acquisition date fair value of the contingent earnout liability.
| Page 5 of 11 |
Quarterly Reviews and Full Year 2011
Revenue for the nine months ended September 30, 2011 was $3.7 million. Based on this revenue level, management believed that SeaBotix would not achieve $10.0 million of revenues for the full 2011 calendar year.
In the fourth quarter of calendar year 2011, SeaBotix recorded revenue of $6.4 million, of which $3.7 million was from single large orders, including a $0.8 million sale of a demonstration container in late December 2011. This was the first and only sale of the container product and the sale required modifications to the container since the customer’s intended purpose for the container was not its designed purpose. This container sale increased calendar year 2011 revenue to $10.1 million, 1.0% above the $10.0 million threshold.
Management reviewed fourth quarter calendar year 2011 revenue, noting that $3.7 million of the revenue was the result of large orders from customers for which SeaBotix had little or no sales history. In determining the possibility of receiving similar large orders in the future, management looked at historical SeaBotix revenue and determined that the last similar type of sale was in calendar year 2009 and from a different customer. Based on this review and assessment, management estimated that the attainment of the $10.0 million threshold in calendar year 2011 was a function of several factors not likely to repeat in calendar year 2012.
During calendar year 2011, management and the sellers had disagreed on whether the $8.0 million revenue threshold had been met for the $3.0 million Post-Close Earnout payment (the initial $2.0 million Post-Close Earnout payment was undisputed and had been paid). Such dispute remained unresolved as of the end of calendar year 2011.
Management reviewed the probability of settling this dispute with the sellers in conjunction with the contingent earnout payment owed to the sellers for attaining calendar year 2011 revenue of $10.1 million. Based on such reviews, management considered the $3.0 million estimated contingent earnout liability recorded at December 31, 2011 to be appropriately estimated for settlement of the $3.0 million Post-Close Earnout amount and payment of the 2011 Revenue Earnout and any estimated future earnout payments.
Quarter Ended March 31, 2012
In February 2012, the Company and the sellers agreed to a $2.5 million settlement amount in full payment of the disputed $3.0 million Post-Close Earnout payment and the 2011 Revenue Earnout.
Management reviewed operating revenues for the prior three calendar years, which had been less than $7.0 million in each year, excluding the unprecedented large-dollar, multi-unit orders in the fourth quarter of calendar year 2011. For the first quarter of calendar year 2012, the amount of large-dollar sales transactions decreased from $3.7 million in the previous quarter to $1.8 million in the current quarter, giving little visibility as to the likelihood or predictability of such orders continuing.
| Page 6 of 11 |
Based upon an assessment of the above considerations, management concluded that the contingent earnout liability should be $0.5 million at March 31, 2012.
Quarter Ended June 30, 2012
Management reviewed SeaBotix’s backlog and historical revenue patterns and year-to-date revenue for the six months ended June 30, 2012 of $7.8 million. Management considered that year-to-date revenue now included large-dollar, multi-unit sales aggregating $3.7 million, and that the three most recent quarters provided a preliminary pattern of large-dollar, multi-unit sales.
Based upon an assessment of the above considerations, management concluded that a $4.5 million increase in the contingent earnout liability was required.
Quarter Ended September 30, 2012
Revenue for the nine months ended September 30, 2012 was $11.4 million. This included, however, a 40% decrease in large-dollar, multi-unit sales in the third quarter compared with the previous quarter. This 40% decrease raised concerns regarding the continuation of multi-unit sales to ADS for the U.S. Navy, particularly in view of the uncertainty as to the effect of possible sequestration in government procurement for military spending.
Year Ended December 31, 2012
Revenue for the twelve months ended December 31, 2012 was $14.2 million. Management reviewed the revenues and noted that only $0.3 million in sales to ADS for the U.S. Navy were recorded during the fourth quarter, continuing the reduced sales trend to ADS for the U.S. Navy in the prior quarter of calendar year 2012. Management continued to be concerned that government entities would have to re-prioritize their spending leading to reduced purchases of SeaBotix products.
Quarter Ended March 31, 2013
Revenue for the three months ended March 31, 2013 was $2.5 million, with only $0.4 million in sales to ADS for the U.S. Navy. Management continued to be concerned about sequestration and the unpredictability of receiving ADS orders for the U.S. Navy.
Quarter Ended June 30, 2013
Revenue for the six months ended June 30, 2013 was $8.3 million, of which sales to ADS for the U.S. Navy of $3.8 million occurred in the three months ended June 30, 2013. Management reviewed whether the potential impact of sequestration had ended. Based upon the above considerations, management determined that a $0.5 million increase in the contingent earnout liability was required.
| Page 7 of 11 |
Quarter Ended September 30, 2013
Revenue for the nine months ended September 30, 2013 was $11.5 million, of which sales to ADS for the U.S. Navy were $1.5 million for the three months ended September 30, 2013. Management considered the inability to predict sales to ADS for the U.S. Navy due to the lack of information and the uneven historical sales pattern of such sales. Management also considered the concentration of revenue with one customer as a significant risk to revenue stability.
Year Ended December 31, 2013
Revenue for the twelve months ended December 31, 2013 was $19.5 million, of which sales to ADS for the U.S. Navy amounted to $6.4 million for the three months ended December 31, 2013.
Management assessed the $6.4 million revenue from ADS to the U.S. Navy in the fourth quarter of calendar year 2013, and an additional order of $8.0 million received from ADS in the fourth quarter of 2013, representing an even larger concentration of revenue with one customer and heightened unpredictability of demand. Based upon the above considerations, management determined that a $1.5 million increase in the contingent earnout liability was required.
Conclusion
Estimating future revenue for SeaBotix has been a challenge starting with pre-acquisition due diligence. Given this lack of visibility, the purchase price structure included the Post-Close Earnout to address the period immediately after closing and the Revenue Earnout to reflect revenues achieved for the four years after the closing.
The sellers of SeaBotix earned a Revenue Earnout payment in calendar year 2011 only because of a one-time and unprecedented sale of a demonstration container booked at the end of that year. SeaBotix recorded several large-dollar sales transactions with ADS for the U.S. Navy in the first six months of calendar year 2012, which management considered, together with the settlement of the disputed Post-Close Earnout, in its estimate to increase the contingent earnout liability by $4.5 million at June 30, 2012. For the second six months of calendar year 2012, however, these large-dollar, multi-unit sales significantly decreased, again raising concerns regarding the lack of predictability of such sales. In calendar year 2013, SeaBotix recorded large-dollar, multi-unit sales in a somewhat more consistent pattern. Based on this, management increased its estimated future revenues for SeaBotix and adjusted the contingent earnout liability twice in calendar year 2013, $0.5 million at June 30, 2013 and $1.5 million at December 31, 2013.
| Page 8 of 11 |
Appendices
Attached are the following appendices, illustrating the uneven pattern of large-dollar, multi-unit revenue of SeaBotix over the last three years.
Appendix 1 – Chart showing actual dollar revenue by components (total revenue, revenue from large transactions and revenue from non-large transactions) for each quarter for calendar years 2011, 2012 and 2013 and chart showing the contingent earnout liability balance for each quarter for calendar years 2011, 2012 and 2013.
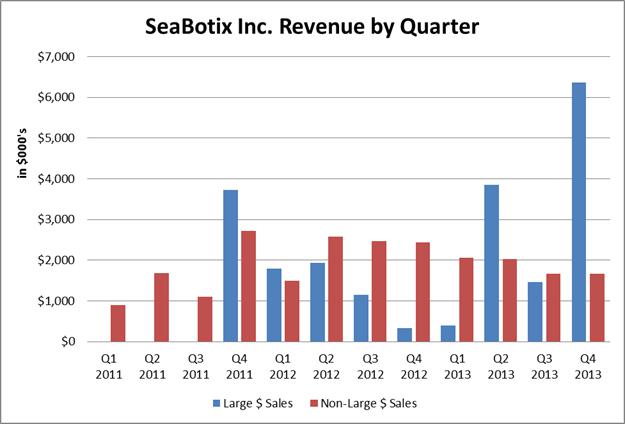
Appendix 2– Bar chart showing revenue by components (large transactions and non-large transactions) by quarter for calendar years 2011, 2012 and 2013.
For both charts, large dollar sales transactions are defined as sales transactions, primarily multi-unit sales to ADS and multi-unit sales to other customers.
| Page 9 of 11 |
Appendix 1
SeaBotix Inc. Revenue by Quarter
(in $000’s)
| March 31 | June 30 | September 30 | December 31 | |||||||||||||||||||||||||||||||||||||||||||||
| Revenue | Revenue | Revenue | Revenue | |||||||||||||||||||||||||||||||||||||||||||||
| Total | ADS & Other Large $ | Ex Large $ | Total | ADS & Other Large $ | Ex Large $ | Total | ADS & Other Large $ | Ex Large $ | Total | ADS & Other Large $ | Ex Large $ | |||||||||||||||||||||||||||||||||||||
| 2011 | $ | 895 | - | $ | 895 | $ | 1,680 | - | $ | 1,680 | $ | 1,108 | - | $ | 1,108 | $ | 6,443 | $ | (3,723 | ) | $ | 2,720 | ||||||||||||||||||||||||||
| 2011YTD | - | - | - | $ | 2,575 | - | $ | 2,575 | $ | 3,683 | - | $ | 3,683 | $ | 10,126 | $ | (3,723 | ) | $ | 6,403 | ||||||||||||||||||||||||||||
| 2012 | $ | 3,287 | $ | (1,787 | ) | $ | 1,500 | $ | 4,506 | $ | (1,929 | ) | $ | 2,577 | $ | 3,624 | $ | (1,151 | ) | $ | 2,473 | $ | 2,766 | $ | (333 | ) | $ | 2,433 | ||||||||||||||||||||
| 2012YTD | - | - | - | $ | 7,793 | $ | (3,716 | ) | $ | 4,077 | $ | 11,417 | $ | (4,867 | ) | $ | 6,550 | $ | 14,183 | $ | (5,200 | ) | $ | 8,983 | ||||||||||||||||||||||||
| 2013 | $ | 2,459 | $ | (392 | ) | $ | 2,067 | $ | 5,869 | $ | (3,844 | ) | $ | 2,025 | $ | 3,122 | $ | (1,458 | ) | $ | 1,664 | $ | 8,029 | $ | (6,359 | ) | $ | 1,670 | ||||||||||||||||||||
| 2013YTD | - | - | - | $ | 8,328 | $ | (4,236 | ) | $ | 4,092 | $ | 11,450 | $ | (5,694 | ) | $ | 5,756 | $ | 19,479 | $ | (12,053 | ) | $ | 7,426 | ||||||||||||||||||||||||
SeaBotix Inc. Contingent Earnout Liability by Quarter
(in $000’s)
| March 31 | June 30 | Sept 30 | Dec 31 | |||||||||||||
| Contingent Earnout Liability Balance – 2011 | $ | 5,000 | $ | 3,000 | $ | 3,000 | $ | 3,000 | ||||||||
| Contingent Earnout Liability Balance – 2012 | $ | 500 | $ | 5,000 | $ | 5,000 | $ | 5,000 | ||||||||
| Contingent Earnout Liability Balance – 2013 | $ | 2,815 | $ | 3,315 | $ | 3,315 | $ | 4,815 |
| Page 10 of 11 |
Appendix 2
| Page 11 of 11 |