UNITED STATES
SECURITIES AND EXCHANGE COMMISSION
Washington, D.C. 20549
FORM 10-K
| x | ANNUAL REPORT PURSUANT TO SECTION 13 OR 15(d) OF THE SECURITIES EXCHANGE ACT OF 1934 |
For the Fiscal Year Ended June 30, 2008
or
| ¨ | TRANSITION REPORT PURSUANT TO SECTION 13 OR 15(d) OF THE SECURITIES EXCHANGE ACT OF 1934 |
For the Transition Period From To
Commission File Number 001-12075
BOLT TECHNOLOGY CORPORATION
(Exact name of registrant as specified in its charter)
| | |
| Connecticut | | 06-0773922 |
(State or other jurisdiction of incorporation or organization) | | (I.R.S. Employer Identification No.) |
| |
| Four Duke Place, Norwalk, Connecticut | | 06854 |
| (Address of principal executive offices) | | (Zip Code) |
Registrant’s telephone number, including area code: (203) 853-0700
Securities registered pursuant to Section 12(b) of the Act:
| | |
Title of Class | | Name of Each Exchange on Which Registered |
| Common Stock, without par value | | The NASDAQ Stock Market LLC |
Securities registered pursuant to Section 12(g) of the Act: None
Indicate by check mark if the registrant is a well-known seasoned issuer, as defined in Rule 405 of the Securities Act. YES ¨ NO x
Indicate by check mark if the registrant is not required to file reports pursuant to Section 13 or 15(d) of the Act. YES ¨ NO x
Indicate by check mark whether the registrant (1) has filed all reports required to be filed by Section 13 or 15(d) of the Securities Exchange Act of 1934 during the preceding 12 months (or for such shorter period that the registrant was required to file such reports), and (2) has been subject to such filing requirements for the past 90 days. YES x NO ¨
Indicate by check mark if disclosure of delinquent filers pursuant to Item 405 of Regulation S-K (§229.405 of this chapter) is not contained herein, and will not be contained, to the best of registrant’s knowledge, in definitive proxy or information statements incorporated by reference in Part III of this Form 10-K or any amendment to this Form 10-K. x
Indicate by check mark whether the registrant is a large accelerated filer, an accelerated filer, a non-accelerated filer, or a smaller reporting company. See definitions of “large accelerated filer”, “accelerated filer” and “smaller reporting company” in Rule 12b-2 of the Exchange Act.
| | |
Large accelerated filer ¨ | | Accelerated filer x |
Non-accelerated filer ¨ (Do not check if a smaller reporting company) | | Smaller reporting company ¨ |
Indicate by check mark whether the registrant is a shell company (as defined in Rule 12b-2 of the Exchange Act). YES ¨ NO x
The aggregate market value of Common Stock, without par value, held by non-affiliates on December 31, 2007: $213,100,000
As of September 5, 2008 there were 8,636,093 shares of Common Stock, without par value, outstanding.
DOCUMENTS INCORPORATED BY REFERENCE
Portions of the Definitive Proxy Statement for our 2008 Annual Meeting of Stockholders, which will be filed no later than 120 days after June 30, 2008, are incorporated herein by reference into Part III of this Form 10-K.
Note Regarding Forward-Looking Statements
Forward-looking statements in this Annual Report on Form 10-K, future filings by the Company with the Securities and Exchange Commission, the Company’s press releases and oral statements by authorized officers of the Company are intended to be subject to the safe harbor provisions of the Private Securities Litigation Reform Act of 1995. These include statements about anticipated financial performance, future revenues or earnings, business prospects, new products, anticipated energy industry activity, anticipated market performance, planned production and shipping of products, expected cash needs and similar matters. Investors are cautioned that all forward-looking statements involve risks and uncertainty, including without limitation (i) the risk of technological change relating to the Company’s products and the risk of the Company’s inability to develop new competitive products in a timely manner, (ii) the risk of changes in demand for the Company’s products due to fluctuations in energy industry activity, (iii) the Company’s reliance on certain significant customers, (iv) risks associated with a significant amount of foreign sales, (v) the risk of fluctuations in future operating results and (vi) other risks detailed in this Annual Report on Form 10-K and the Company’s other filings with the Securities and Exchange Commission. The Company believes that forward-looking statements made by it are based on reasonable expectations. However, no assurances can be given that actual results will not differ materially from those contained in such forward-looking statements. The words “estimate,” “project,” “anticipate,” “expect,” “predict,” “believe” and similar expressions are intended to identify forward-looking statements.
1
PART I
Preliminary Note: In this Annual Report on Form 10-K, we refer to Bolt Technology Corporation and its subsidiaries as “we,” “our,” “us,” “the registrant” or “the Company,” unless the context clearly indicates otherwise.
The Company, organized as a corporation in 1962, consists of three operating units that manufacture and sell oilfield services equipment (previously referred to as the ��geophysical equipment” segment): Bolt Technology Corporation (“Bolt”), A-G Geophysical Products, Inc. (“A-G”) and Real Time Systems Inc. (“RTS”). Bolt develops, manufactures and sells marine seismic energy sources (air guns) and replacement parts; A-G develops, manufactures and sells underwater cables, connectors, hydrophones and seismic source monitoring systems; and RTS develops, manufactures and sells air gun controllers/synchronizers, data loggers and auxiliary equipment.
In May 2008, the Company sold substantially all of the assets of its wholly-owned subsidiary, Custom Products Corporation (“Custom”), for $5,250,000, subject to adjustments for certain liabilities. Custom, a developer, manufacturer and seller of miniature industrial clutches and brakes and seller of sub-fractional horsepower electrical motors, formerly constituted the Company’s “industrial products” segment. As a result of this sale, amounts related to Custom have been reported as discontinued operations in fiscal year 2008. All prior fiscal year information relating to Custom has been restated as discontinued operations, and all information reported or discussed in this Form 10-K reflects the treatment of Custom as discontinued operations. The Company now operates only in oilfield services.
The Company’s products are mostly used in offshore marine seismic surveys, and sales of the Company’s products are generally related to the level of worldwide oil and gas exploration and development activity, which is dependent, primarily, on oil and gas prices. The recent high price of oil, increased worldwide energy demand and the depletion of proven oil and natural gas reserves have contributed to an increased demand for marine seismic surveys.
The Company provides critical products to the marine seismic exploration industry. Marine seismic exploration typically involves sophisticated ocean-going vessels deployed by large, multi-national firms to acquire data about the geological formations under the ocean bed. The industry standard to acquire such data is to use an energy source to create acoustic waves that penetrate the ocean bed, capture the waves as they reflect back to the ocean surface, transmit data to the seismic vessel and then, using sophisticated computer models, create a picture of the structures under the ocean bed. The picture is interpreted by geoscientists to identify subsurface formations conducive to the retention of hydrocarbons. The Company’s products provide the energy source (marine air gun), underwater cables, connectors and hydrophones as well as the controller that monitors the performance of the energy source. The following discussion contains more information on the Company’s products.
Marine Air Guns
Energy sources, such as our air guns, used in seismic exploration create acoustic waves at frequencies that readily travel to great depths in the earth. As acoustic waves travel through the earth, portions are reflected by variations in the underlying rock layers and the reflected energy is received as signals by devices known as hydrophones. A shipboard unit containing electronic recording equipment converts the signals to digital form. By using computer programs with complex calculations to manipulate the processed seismic data, geoscientists can model and visualize the subsurface through the creation and analysis of spatial representations. The analysis of seismic and other geological data is an important factor in decisions to drill exploratory and development wells. Because of the significant expense associated with drilling oil and gas wells, decisions on whether or where to drill are critical to the overall process. A seismic exploration vessel may tow as many as 96 air guns along with multiple hydrophone streamers of up to approximately 6.2 miles in length. The air guns are fired simultaneously every 75 to 150 feet along the survey line.
2
Improvements in drilling success rates through the use of advanced seismic survey techniques, particularly 3-D techniques, have substantially increased the demand for seismic data. As a result, 3-D surveys utilizing these advanced technologies have gained increasing acceptance in the oil and gas industry as an exploration risk management tool and in field development and reservoir management activities. The precise shot to shot repeatability of our marine air guns and their reliability of operation make them especially useful in 3-D surveys.
The Company sells two types of air guns: “long-life” marine air guns and Annular Port Air Guns (“APG gun”). The long-life marine air gun is made to maximize the period between routine air gun maintenance and to provide characteristics that are advantageous to geoscientists in designing 3-D surveys. The APG gun is designed to maximize operating efficiency and acoustic output through a configuration that permits the implementation of simplified multi-gun arrays. These arrays produce less towing drag and provide ease of deployment and shielding of fragile hoses and cables from the high pressure air blasts released by the air gun. The selling prices are approximately $13,000 and $31,000 for the long-life marine air gun and APG gun, respectively.
After-market revenue from the sale of air gun replacement parts is a significant source of the Company’s revenue.
Underwater Cables, Connectors and Hydrophones
The Company’s marine cables and connectors are injection molded of thermoplastic polyurethane designed for use with marine air gun firing lines, bulkhead connectors and other underwater connectors required in seismic vessel operations. The Company’s signature hydrophones and pressure transducers are designed for use with marine air guns in a high shock environment. The purpose of the hydrophone and pressure transducer is for “near field” measurements of the outgoing energy waveforms from air guns and pressure monitoring.
The Company’s cables and connectors, hydrophones and pressure transducers are used with marine air guns manufactured by the Company as well as air guns manufactured by others.
Marine Air Gun Controllers and Synchronizers
In July 2007, the Company acquired substantially all of the net assets of RTS. RTS develops, manufactures and sells controllers and synchronizers for marine seismic energy sources (air guns). RTS products are designed to control and synchronize up to 96 air guns in a single seismic exploration vessel. The results of operations of RTS have been included in our financial statements from July 1, 2007. See Note 2 to Consolidated Financial Statements for further information concerning the RTS acquisition.
The Company’s marine air gun controllers and synchronizers are used with marine air guns manufactured by the Company as well as air guns manufactured by others.
Long-Lived Assets
Long-lived assets consist of: property, plant and equipment; goodwill; other intangible assets and other non-current assets. All of the Company’s long-lived assets are located in the United States. As of June 30, 2008 and 2007, the Company’s long-lived assets totaled $16,342,000 and $10,957,000, respectively.
Foreign Sales
During fiscal years 2008, 2007 and 2006, approximately 80%, 78% and 78%, respectively, of the Company’s sales were from shipments to customers outside the United States or to foreign locations of United States customers. See Note 13 to the Consolidated Financial Statements for information regarding the geographic distribution of sales.
3
Backlog
Because of the relatively short period (generally less than 60 days) between order and shipment dates for our products, the dollar amount of current backlog is not considered to be a reliable indicator of future sales.
Competition
Our marine air guns compete primarily with marine air guns manufactured by ION Geophysical Corporation and Sercel Inc., a subsidiary of Compagnie Generale de Geophysique-Veritas. The Company’s principal competitor for connectors and cables is ION Geophysical Corporation, and the principal competitor for air gun controllers and synchronizers is Seamap, a division of Mitcham Industries, Inc. We believe that technology, product reliability and durability are the primary bases of competition in the market for our products and that the remaining competitive factors in the industry are field product support and price. The Company also believes that it can compete effectively with respect to each of these factors, although there can be no assurance that the sales of our products will not be adversely affected if current competitors or others introduce equipment with better performance or product support or lower price.
Marketing
The Company’s principal customers are worldwide marine seismic exploration contractors, who operate seismic vessels for collection of seismic data in accordance with their customers’ specifications or for their own seismic data libraries, and foreign national oil and gas companies.
Marketing of our products is principally performed by salaried sales personnel, all of whom are based in the United States. We also use sales agents for individual sales in certain foreign countries. In general, we market our products and services through our sales force, together with our technical services and engineering staffs, primarily to representatives of major geophysical contractors. The principal marketing techniques used are direct sales visits to current and potential customers, product demonstrations and participation at industry trade shows and meetings.
In general, products are sold on standard 30-day credit terms. In certain instances, we require our customers to furnish letters of credit payable upon shipment or provide advance payments. In limited cases, the Company allows customers extended payment terms of up to 12 months. We consider these practices to be consistent with industry practice.
Research and Development
Our ability to compete successfully depends upon, among other things, the development of new products as well as the improvement of our existing products. During fiscal years 2008, 2007 and 2006, we spent $272,000, $270,000 and $289,000, respectively, to develop new products and to improve existing products.
Employees
As of June 30, 2008, we employed 132 people on a full-time basis, all of whom are employed in the United States. The Company is not a party to any collective bargaining agreement and has had no work stoppages. The Company believes that relations with employees are good.
Manufacturing and Raw Materials
The Company manufactures and assembles its products in Norwalk, Connecticut, Cypress, Texas and Fredericksburg, Texas. Our manufacturing and assembly operations consist of machining or molding the necessary components and assembling and testing the final product. We generally maintain adequate levels of
4
inventory to enable us to satisfy customer requirements within a short period of time. The raw materials used in our products, sourced from multiple suppliers, are generally in adequate supply. The costs of certain raw materials, especially the high quality steel required for the Company’s air guns, have increased. The Company monitors its costs and may pass cost increases on to its customers, when necessary.
For some marine air gun orders, we occasionally supply auxiliary equipment such as compressors, winches or other equipment manufactured by others. We have not experienced any supply problems with respect to these auxiliary items. Because we manufacture based on customer orders, we do not generally maintain inventory of fully assembled finished products. We consider our practices to be consistent with industry standards.
Regulatory Matters
We believe that we are currently in compliance with the requirements of environmental and occupational health and safety laws and regulations. Compliance with such laws and regulations has not resulted in significant expense in the past, and we do not foresee the need for substantial expenditures to ensure compliance with such laws and regulations as they currently exist.
Intellectual Property
We seek to protect our intellectual property by means of patents, trademarks and other measures. We currently own 11 patents relating to the manufacture of our products, with expiration dates from 2010 to 2027. Most of these patents are United States patents. Patents have been of value in the growth of our business and may continue to be of value in the future. However, we believe that our business is not primarily dependent upon patent protection, and therefore the expiration of our patents would not have a material adverse effect on our business.
Major Customers
Historically, a significant portion of our sales has been attributable to a small number of customers. The table set forth below indicates the customers accounting for 10% or more of consolidated sales in fiscal 2008 and 2007.
| | | | | | |
| | | Fiscal 2008 | | | Fiscal 2007 | |
Compagnie Generale de Geophysique-Veritas | | 17 | % | | 19 | % |
Schlumberger Limited | | 15 | % | | 10 | % |
Petroleum Geo-Services | | 10 | % | | 8 | % |
Wavefield Inseis | | 7 | % | | 10 | % |
SeaBird Exploration | | 6 | % | | 11 | % |
The loss of any of the above customers or a significant decrease in the amount of their purchases could have a material adverse effect on the Company.
Available Information
The Company maintains an internet website at the following address:www.bolt-technology.com. We make available, free of charge, through our website our annual reports on Form 10-K, our quarterly reports on Form 10-Q, our current reports on Form 8-K and amendments to those reports, filed or furnished pursuant to Section 13(a) or 15(d) of the Securities Exchange Act of 1934, as soon as reasonably practicable after we electronically file such material with, or furnish it to, the Securities and Exchange Commission (the “SEC”). These reports and amendments to such reports and our other SEC filings are also available on the website maintained by the SEC at www.sec.gov. Alternatively, you may read and copy any materials we file with the SEC at the SEC’s Public Reference Room in Washington, D.C. You can obtain information on the operation of the Public Reference Room by calling the SEC at 1-800-SEC-0330.
5
An investment in our Common Stock involves various risks. Set forth below are the risks that we believe are material to our investors. When considering an investment in our Common Stock, you should consider carefully all of the risk factors described below, as well as other information included and incorporated by reference in this report. The risks described below could materially and adversely affect our business, financial condition and results of operations and the actual outcome of matters as to which forward-looking statements are made in this report. The risk factors described below are not the only ones we face. Our business, financial condition and results of operations may also be affected by additional factors that are not currently known to us or that we currently consider immaterial or that are not specific to us, such as general economic conditions.
You should refer to the explanation of the qualifications and limitations on forward-looking statements on page 1 of this report. All forward-looking statements made by us are qualified by the risk factors described below.
Industry Related Risks
Technological change in the seismic industry may require us to make substantial research and development expenditures and may render our technology obsolete.
The market for our products is characterized by changing technology and new product introductions. Our air gun technology may become obsolete due to the introduction of a superior technology. We may be required to invest substantial capital to develop and produce successfully and timely new and enhanced products to stay abreast of technological change. We have no assurance that we will receive an adequate rate of return on such investment. If we are unable to stay abreast of technological change, we will be unable to compete in the future. If we are not competitive, our business, our results of operations and financial condition will be materially and adversely affected.
Volatility of oil and natural gas prices, which is affected by factors outside of our control, affects demand for our products.
Sales of our products correlate highly with oil and natural gas price trends, which are typically cyclical. If oil and natural gas prices are high, as is currently the case, marine seismic activity increases. This increases demand for our products. If oil and natural gas prices are low, the level of marine seismic activity decreases. This decreases demand for our products. In extreme cases, when oil and natural gas prices are significantly lower, older seismic vessels may be decommissioned and our equipment on those ships may be removed and put into storage for future use. Under such a scenario, our revenues could further decrease while our customers deplete stored inventories prior to placing new orders. Accordingly, a decrease in oil and natural gas prices could decrease our customers’ activity and decrease demand for our products. Any decrease in demand for our products could have a material adverse effect on our results of operations and financial condition.
Oil and gas prices are typically cyclical and affected by many factors. These include:
| | • | | the level of worldwide oil and gas production and exploration activity |
| | • | | worldwide economic conditions and their effect on worldwide demand for energy |
| | • | | the policies of the Organization of Petroleum Exporting Countries |
| | • | | the cost of producing oil and gas |
| | • | | interest rates and the cost of capital |
| | • | | technological advances affecting hydrocarbon consumption |
| | • | | environmental regulation |
| | • | | level of oil and gas inventories |
6
| | • | | weather-related factors that may disrupt oil and gas exploration |
| | • | | policies of national governments |
| | • | | war, civil disturbances and political instability. |
We expect prices for oil and natural gas to continue to be volatile due to circumstances outside of our control and to continue to affect our customers’ level of activity and the demand for our products.
Company Specific Risks
Loss of any major customer or consolidation among major customers could materially and adversely impact our results of operations and financial condition.
We have a concentration of business with a small number of major customers who are independent contractors performing marine seismic surveys on behalf of major oil companies. Sales to these major customers are significant in relation to our consolidated revenues. In addition, a large percentage of our consolidated accounts receivable balance at the end of any accounting period is from these customers. The loss of any major customer could have a material and adverse impact on our results of operations and financial condition. This risk would increase if consolidation of oil service companies continues. Additional information relating to concentration of business with a small number of major customers is provided in Note 13 to the Consolidated Financial Statements and in “Management’s Discussion and Analysis of Financial Condition and Results of Operations—Liquidity and Capital Resources.”
We derive a significant amount of our revenues from foreign sales, which pose additional risks, including economic, political and other uncertainties.
Our foreign sales are significant in relation to consolidated sales. In fiscal 2008, sales outside of the United States accounted for approximately 80% of our consolidated net sales. We believe that export sales will remain a significant percentage of our revenue. Our sales contracts are denominated in U.S. dollars. Fluctuations in foreign exchange rates could make it more difficult for our overseas customers to meet their U.S. dollar obligations. In addition, sales of our products to customers operating in foreign countries that experience political/economic instability or armed conflict could result in difficulties in delivering and installing complete energy source systems within those geographic areas and receiving payment from these customers. These factors could materially adversely affect our results of operations and financial condition. Refer to Note 13 to Consolidated Financial Statements for additional information relating to foreign sales.
We experience fluctuations in operating results.
Complete air gun systems sales, which typically are large dollar amounts, do not occur in every accounting period. In certain periods, several complete air gun system sales may be recorded, and none in other periods. This “uneven” sales pattern is due largely to our customers’ schedules for the anticipated completion date for building a new seismic vessel or the target date for outfitting a conventional vessel to do seismic work. Customer demand for air gun replacement parts, underwater electrical connectors and cables and air gun controllers is ongoing, but the demand level for these products varies based on oil and gas prices and trends. Accordingly, our results of operations can vary significantly from one fiscal quarter to another and from one fiscal year to another. This may cause volatility in the price of the Company’s Common Stock.
An impairment of goodwill could reduce our earnings and stockholders’ equity.
Our consolidated goodwill balance at June 30, 2008 accounts for 17% of consolidated assets at that date. Goodwill is recorded when the purchase price of a business exceeds the fair market value of the tangible and separately measurable intangible net assets of the business. Our goodwill balance relates exclusively to the acquisition of subsidiaries. Generally accepted accounting principles require us to test goodwill for impairment
7
on an annual basis or when events or circumstances occur indicating that goodwill might be impaired. If we were to determine that any of our remaining balance of goodwill was impaired, we would record an immediate non-cash charge to earnings with a corresponding reduction in goodwill. Refer to Notes 1, 2 and 4 to the Consolidated Financial Statements for additional information relating to goodwill.
Weak sales demand or obsolescence of our inventory may require an increase to our inventory valuation reserve.
A significant source of our revenue arises from the sale of replacement parts required by customers who have previously purchased our products. As a result, we maintain a large quantity of parts on hand that may not be sold or used in final assemblies for a lengthy period of time. Management has established an inventory valuation reserve to recognize that certain inventory may become obsolete or supplies may be excessive. The inventory valuation reserve is a significant estimate made by management. The actual results may differ from this estimate, and the difference could be material. The inventory valuation reserve is adjusted at the close of each accounting period, based on management’s estimate of the valuation reserve required. This estimate is calculated on a consistent basis as determined by our inventory valuation policy. Increases to the inventory valuation reserve result in a charge to cost of sales, and decreases to the reserve result in a credit to cost of sales. The inventory valuation reserve is also decreased to reflect scrapped or disposed of items. Weak sales demand or obsolescence may require an increase to the inventory valuation reserve, and such an increase may have a material and adverse impact on our results of operations with a corresponding decrease to inventory. Refer to Notes 1 and 6 to the Consolidated Financial Statements for additional information relating to the inventory valuation reserve.
We may be unable to obtain broad intellectual property protection for our current and future products, which could result in loss of revenue and any competitive advantage we hold.
Certain of the proprietary technologies used in our products are not patent protected. We rely on a combination of patents, common laws, trade secrets, confidentiality procedures and contractual provisions to protect our proprietary technologies. Our competitors may attempt to copy aspects of our products despite our efforts to protect our proprietary rights, or may design around the proprietary features of our products. Policing unauthorized use of our proprietary rights is difficult, and we are unable to determine the extent to which such use occurs. Also, the laws of certain foreign countries do not offer as much protection for proprietary rights as the laws of the United States. Further, obtaining, maintaining or defending intellectual property rights in many countries is costly. The costs of pursuing any intellectual property claim against a third party, whether in the United States or in a foreign country, could be significant.
From time to time third parties may claim that we have infringed upon their intellectual property rights. Any such claims, with or without merit, could be time consuming, result in costly litigation and possible injunctions, require product modifications, cause product shipment delays or require us to enter into royalty or licensing arrangements. Such claims could have a material adverse effect on our results of operations and financial condition.
The loss of any member of our senior management and other key employees may adversely affect our results of operations.
Our success depends heavily on the continued services of our senior management and other key employees. Our senior management consists of a small number of individuals relative to larger companies. These individuals, as well as other key employees, possess sales and marketing, engineering, manufacturing, financial and administrative skills that are critical to the operation of our business. We generally do not have employment or non-competition agreements with members of our senior management or other key employees, except for employment agreements with our Chief Executive Officer and each subsidiary president. There is no assurance that any of our senior management or other key personnel will continue in such capacity for any particular period
8
of time. If we lose the services of one or more of our senior management or other key employees, our operations may be materially adversely affected. We maintain life insurance policies for certain key employees of our subsidiaries with the Company as beneficiary.
Provisions in our certificate of incorporation and bylaws could discourage a takeover attempt, which may reduce or eliminate the likelihood of a change of control transaction and, therefore, the ability of our stockholders to sell their shares for a premium.
Our certificate of incorporation and bylaws contain certain provisions that could have the effect of delaying or preventing a third party from obtaining control of our Company. These provisions may reduce or eliminate our stockholders’ ability to sell their shares of Common Stock at a premium. They include a classified board, regulation of the nomination and election of directors, limiting who may call special stockholder meetings and requiring the vote of the holders of 95% of all shares of our stock to authorize certain business combinations.
Because we have no plans to pay any dividends for the foreseeable future, investors must look solely to stock appreciation for a return on their investment in us.
We have not paid cash dividends on our Common Stock since 1985 and do not anticipate paying any cash dividends in the foreseeable future. We currently intend to retain any future earnings to support our operations and growth, including any possible acquisition(s). Any payment of cash dividends in the future will be dependent on the amount of funds legally available, our earnings, financial condition, capital requirements and other factors that our board of directors may deem relevant. Accordingly, investors must rely on sales of their Common Stock after price appreciation, which may never occur, as the only way to realize any future gains on their investment. Investors seeking cash dividends should not purchase our Common Stock.
The market price of our Common Stock may be volatile.
The market price of our Common Stock has experienced significant fluctuations and may continue to fluctuate significantly in the future. Many factors cause the market price of our Common Stock to fluctuate, including, but not limited to (i) the volume of trading in our Common Stock and (ii) sales of our Common Stock by large institutional investors and others. These market fluctuations may adversely affect the market price of our Common Stock.
| ITEM 1B. | Unresolved Staff Comments |
None.
The following table sets forth certain information with respect to the Company’s principal properties, all of which are leased, except for the Cypress, Texas facility, which is owned.
| | | | | | |
Location | | Nature of Property | | Approximate
Area (Sq. Feet) | | Expiration Date of
Lease |
Norwalk, Connecticut | | Manufacturing | | 21,600 | | 2013 |
Norwalk, Connecticut | | Administration/Engineering/Sales | | 6,600 | | 2013 |
Houston, Texas | | Sales Office | | 150 | | 2009 |
Fredericksburg, Texas | | Administration/Manufacturing | | 4,000 | | (1) |
Cypress, Texas | | Administration/Manufacturing | | 32,500 | | (2) |
| (1) | The Fredericksburg, Texas lease is on a month-to-month basis. Refer to “Contractual Obligations” in Management’s Discussion and Analysis of Financial Condition and Results of Operations for information relating to relocation to new leased premises in Fredericksburg, Texas. |
| (2) | The Cypress, Texas facility is owned by the Company. |
9
The Company’s products are manufactured and assembled at the Norwalk, Connecticut, Cypress, Texas and Fredericksburg, Texas facilities. In the opinion of the Company’s management, the properties described above are in good condition and repair and are suitable and adequate for the Company’s purposes. The properties are currently fully utilized and, operating in conjunction with second shifts, overtime and strategic outsourcing, provide sufficient productive capacity.
The Company is not aware of any material pending litigation or proceedings to which it or any of its subsidiaries are a party or to which any of its properties are subject.
| ITEM 4. | Submission of Matters to a Vote of Security Holders |
None.
Executive Officers of Bolt Technology Corporation
Set forth below is information with respect to the executive officers of the Company relating to age, as of September 12, 2008, and business experience. With the exception of Mr. Andrews, all of the positions have been held for at least five years.
Prior to joining the Company in September 2007, Mr. Andrews was employed for a total of 13 years by Pitney Bowes Inc., from 1989 to 1999 and from 2005 to 2007. Mr. Andrews served in various capacities within Pitney Bowes Inc., including serving as Director, Finance-Latin America and US Dealer Channels and Director of Compliance and Controls-Finance Shared Services. During 2004, Mr. Andrews was engaged as a consultant. From 1999 to 2003, Mr. Andrews served as a principal at a residential construction and development company.
| | | | |
Name | | Age | | Present Position |
Raymond M. Soto | | 69 | | Chairman, President, Chief Executive Officer and Director |
| | |
Joseph Espeso | | 66 | | Senior Vice President-Finance, Chief Financial Officer, Assistant Secretary and Director |
| | |
Joseph Mayerick, Jr. | | 66 | | Senior Vice President-Marketing, Assistant Secretary and Director |
| | |
William C. Andrews | | 48 | | Vice President-Administration and Compliance and Secretary |
10
PART II
| ITEM 5. | Market for Registrant’s Common Equity, Related Stockholder Matters and Issuer Purchases of Equity Securities |
On November 20, 2007, the Company’s Board of Directors approved a 3-for-2 stock split. The additional shares resulting from the stock split were distributed on January 30, 2008 to shareholders of record on January 16, 2008. Share and per share amounts reflected throughout the Consolidated Financial Statements and notes thereto and elsewhere in this Annual Report on Form 10-K have been restated to reflect the stock split.
In January 2008, the Company’s Common Stock began trading on the NASDAQ Global Select Market under the symbol “BOLT”. Prior to the change, the Company’s Common Stock was listed on the American Stock Exchange under the symbol “BTJ.” The following table sets forth the high and low sales prices for our Common Stock for the quarters indicated:
| | | | | | |
Fiscal 2008 | | High | | Low |
First Quarter | | $ | 39.57 | | $ | 20.67 |
Second Quarter | | | 32.83 | | | 21.77 |
Third Quarter | | | 28.93 | | | 14.67 |
Fourth Quarter | | | 25.22 | | | 17.50 |
| | |
Fiscal 2007 | | High | | Low |
First Quarter | | $ | 13.85 | | $ | 7.47 |
Second Quarter | | | 15.90 | | | 7.33 |
Third Quarter | | | 23.57 | | | 10.67 |
Fourth Quarter | | | 30.83 | | | 20.70 |
The number of stockholders of record at August 29, 2008 was 190. We believe that the number of beneficial owners is substantially greater than the number of record holders, because a large portion of our Common Stock is held of record in broker “street names.”
We have not paid a dividend since 1985. We do not intend to pay cash dividends on our Common Stock in the foreseeable future. Any decision to pay cash dividends will depend upon our growth, profitability, financial condition and other factors that the Board of Directors may deem relevant.
The Company did not make any repurchases of the Company’s equity securities during fiscal 2008.
Equity Compensation Plan Information
The following table sets forth aggregate information for the Bolt Technology Corporation 2006 Amended and Restated Stock Option and Restricted Stock Plan (the “Plan”), which was approved by the Company’s stockholders and is the Company’s only equity compensation plan in effect as of June 30, 2008:
| | | | | | | |
Plan Category | | Number of securities to be
issued upon exercise of
outstanding options,
warrants and rights (a) | | Weighted-average exercise
price of outstanding options,
warrants and rights (b) | | Number of securities
remaining available for
future issuance under equity
compensation plans
(excluding securities reflected
in column (a)) (c) (1) |
Equity compensation plans approved by security holders | | 108,000 | | $ | 19.74 | | 605,250 |
Equity compensation plans not approved by security holders | | — | | | — | | — |
Total | | 108,000 | | $ | 19.74 | | 605,250 |
| (1) | The Plan provides that of the 750,000 shares of Common Stock that may be used for grants of stock options and restricted stock awards, up to 225,000 shares of Common Stock may be used for restricted stock awards. During fiscal 2008, 36,750 shares of restricted stock were awarded at an average fair value of $18.67 at date of grant. As of June 30, 2008, 188,250 shares of Common Stock remained available for issuance of restricted stock awards under the Plan. |
11
Performance Graph
The following graph and table compare total stockholder return on our Common Stock for the five-year period ending June 30, 2008, with the Standard & Poor’s SmallCap Index and Value Line’s Oilfield Services Industry Index over the same period. This comparison assumes the investment of $100 on June 30, 2003. The information in the graph is being furnished pursuant to Securities and Exchange Commission rules, and the stockholder return set forth is not intended to forecast and is not necessarily indicative of possible future performance.
Comparison of Five-Year Cumulative Total Return
Bolt Technology Corporation, Standard & Poor’s SmallCap Index and Value Line’s
Oilfield Services Industry Index
(Performance Results Through 6/30/2008)
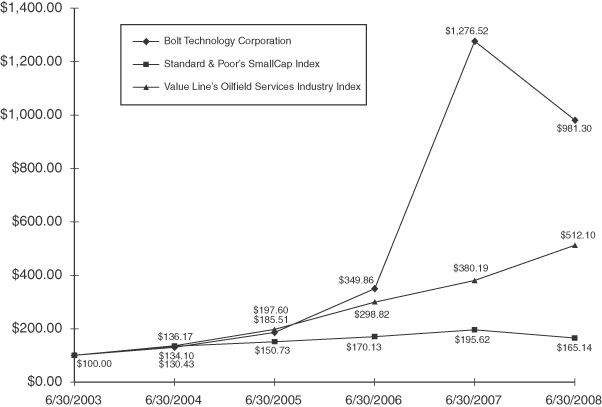
Assumes $100 invested at the close of trading on June 30, 2003 in Bolt Technology Corporation Common Stock, Standard & Poor’s SmallCap Index and Value Line’s Oilfield Services Industry Index.
| | | | | | | | | | | | | | | | | | |
| | | June 30, |
| | | 2003 | | 2004 | | 2005 | | 2006 | | 2007 | | 2008 |
Bolt Technology Corporation | | $ | 100.00 | | $ | 130.43 | | $ | 185.51 | | $ | 349.86 | | $ | 1,276.52 | | $ | 981.30 |
Standard & Poor’s SmallCap Index | | | 100.00 | | | 134.10 | | | 150.73 | | | 170.13 | | | 195.62 | | | 165.14 |
Value Line’s Oilfield Services Industry Index | | | 100.00 | | | 136.17 | | | 197.60 | | | 298.82 | | | 380.19 | | | 512.10 |
The information included under the caption “Performance Graph” shall not be deemed “filed” for purposes of Section 18 of the Securities Exchange Act of 1934 or otherwise subject to the liabilities of that section, nor shall it be deemed incorporated by reference in any filing under the Securities Act of 1933 or the Securities Exchange Act of 1934, except as expressly set forth by specific reference in such a filing.
12
| ITEM 6. | Selected Financial Data |
The following table has been derived from the Company’s audited financial statements and sets forth selected consolidated financial data with respect to the Company and its subsidiaries. This information should be read in conjunction with the Management’s Discussion and Analysis of Financial Condition and Results of Operations and the Consolidated Financial Statements and accompanying notes provided elsewhere in this Form 10-K. This information differs from amounts previously reported on Form 10-K filings for the years ended June 30, 2004 through June 30, 2007 as a result of restatements attributable to the sale of Custom Products Corporation (see Note 3 to Consolidated Financial Statements) and the 3-for-2 stock split to shareholders of record on January 16, 2008 (see Note 1 to Consolidated Financial Statements).
| | | | | | | | | | | | | | | | | | | | |
| | | For the Years Ended June 30, | |
| | | 2008 | | | 2007 | | | 2006 | | | 2005 | | | 2004 | |
(In thousands, except per share amounts) | | | | | | | | | | | | | | | | | | | | |
| | | | | |
Income Statement Data: | | | | | | | | | | | | | | | | | | | | |
| | | | | |
Sales | | $ | 61,635 | | | $ | 46,929 | | | $ | 29,393 | | | $ | 15,551 | | | $ | 11,743 | |
| | | | | | | | | | | | | | | | | | | | |
| | | | | |
Costs and expenses: | | | | | | | | | | | | | | | | | | | | |
Cost of sales | | | 33,164 | | | | 25,347 | | | | 17,226 | | | | 9,148 | | | | 7,419 | |
Research and development | | | 272 | | | | 270 | | | | 289 | | | | 271 | | | | 208 | |
Selling, general and administrative | | | 8,228 | | | | 6,766 | | | | 5,254 | | | | 4,276 | | | | 3,356 | |
Interest income | | | (191 | ) | | | (211 | ) | | | (135 | ) | | | (47 | ) | | | (15 | ) |
| | | | | | | | | | | | | | | | | | | | |
| | | 41,473 | | | | 32,172 | | | | 22,634 | | | | 13,648 | | | | 10,968 | |
| | | | | | | | | | | | | | | | | | | | |
Income from continuing operations before income taxes | | | 20,162 | | | | 14,757 | | | | 6,759 | | | | 1,903 | | | | 775 | |
Provision for income taxes | | | 6,453 | | | | 4,758 | | | | 2,352 | | | | 640 | | | | 270 | |
| | | | | | | | | | | | | | | | | | | | |
Income from continuing operations | | | 13,709 | | | | 9,999 | | | | 4,407 | | | | 1,263 | | | | 505 | |
Discontinued operations, net of taxes | | | 860 | | | | 608 | | | | 438 | | | | 396 | | | | 348 | |
| | | | | | | | | | | | | | | | | | | | |
Net income | | $ | 14,569 | | | $ | 10,607 | | | $ | 4,845 | | | $ | 1,659 | | | $ | 853 | |
| | | | | | | | | | | | | | | | | | | | |
Per Share Data: | | | | | | | | | | | | | | | | | | | | |
Earnings per share—basic | | | | | | | | | | | | | | | | | | | | |
Income from continuing operations | | $ | 1.60 | | | $ | 1.19 | | | $ | 0.54 | | | $ | 0.15 | | | $ | 0.06 | |
Discontinued operations, net of taxes | | | 0.10 | | | | 0.07 | | | | 0.05 | | | | 0.05 | | | | 0.05 | |
| | | | | | | | | | | | | | | | | | | | |
Net income | | $ | 1.70 | | | $ | 1.26 | | | $ | 0.59 | | | $ | 0.20 | | | $ | 0.11 | |
| | | | | | | | | | | | | | | | | | | | |
Earnings per share—diluted | | | | | | | | | | | | | | | | | | | | |
Income from continuing operations | | $ | 1.60 | | | $ | 1.17 | | | $ | 0.52 | | | $ | 0.15 | | | $ | 0.06 | |
Discontinued operations, net of taxes | | | 0.10 | | | | 0.07 | | | | 0.05 | | | | 0.05 | | | | 0.04 | |
| | | | | | | | | | | | | | | | | | | | |
Net income | | $ | 1.70 | | | $ | 1.24 | | | $ | 0.57 | | | $ | 0.20 | | | $ | 0.10 | |
| | | | | | | | | | | | | | | | | | | | |
Average number of common shares outstanding: | | | | | | | | | | | | | | | | | | | | |
Basic | | | 8,581 | | | | 8,416 | | | | 8,196 | | | | 8,128 | | | | 8,122 | |
Diluted | | | 8,587 | | | | 8,524 | | | | 8,446 | | | | 8,300 | | | | 8,233 | |
| | | | | |
Cash dividends | | | — | | | | — | | | | — | | | | — | | | | — | |
| | | | | |
Financial data at June 30: | | | | | | | | | | | | | | | | | | | | |
Working capital | | $ | 39,175 | | | $ | 26,932 | | | $ | 15,055 | | | $ | 10,450 | | | $ | 9,330 | |
Total assets | | | 61,867 | | | | 47,618 | | | | 34,717 | | | | 27,423 | | | | 22,918 | |
Long term debt | | | — | | | | — | | | | — | | | | — | | | | — | |
Stockholders’ equity | | | 55,517 | | | | 40,686 | | | | 28,332 | | | | 23,075 | | | | 21,392 | |
13
| ITEM 7. | Management’s Discussion and Analysis of Financial Condition and Results of Operations |
The following management’s discussion and analysis should be read together with the Consolidated Financial Statements and accompanying notes and other detailed information appearing elsewhere in this Form��10-K. This discussion includes forward-looking statements about the demand for our products and future results. Please refer to the “Note Regarding Forward-Looking Statements” section of this Form 10-K.
Overview
Sales of the Company’s products are generally related to the level of worldwide oil and gas exploration and development activity, which is dependent, primarily, on oil and gas prices. The recent high price of oil, increased worldwide energy demand and the depletion of proven oil and natural gas reserves have contributed to an increased demand for marine seismic surveys. As a result, the demand for the Company’s products is strong. The Company’s sales increased 31% in the fiscal year ended June 30, 2008 compared to the year ended June 30, 2007, aided by the acquisition, effective July 1, 2007, of Real Time Systems Inc., a developer, manufacturer and seller of air gun controllers/synchronizers (“RTS”). The Company believes that the oilfield services industry will continue to be strong during fiscal 2009 because of the continued imbalance between supply and demand for hydrocarbons, low reserve replacement rates and high commodity prices. The Company also anticipates continued use of more sophisticated technology, such as 4-D and wide-azimuth seismic exploration surveys. In particular, wide-azimuth surveys create a need for a larger seismic vessel fleet because such surveys require utilization of several vessels working in tandem.
Effective May 31, 2008, the Company sold substantially all of the assets of its wholly-owned subsidiary, Custom Products Corporation (“Custom”). Custom, a developer, manufacturer and seller of miniature industrial clutches and brakes and seller of sub-fractional horsepower electrical motors, formerly comprised the Company’s “industrial products” segment. Custom was the only unit in the industrial products segment. Therefore, due to the sale of Custom, the Company operates only in the oilfield services equipment business. In the Consolidated Financial Statements, amounts relating to Custom have been reported as discontinued operations in fiscal year 2008 and prior fiscal year information relating to Custom has been restated as discontinued operations. See Note 3 to Consolidated Financial Statements for further information concerning discontinued operations.
Primarily due to the increase in oilfield services equipment sales and secondarily due to the sale of Custom’s assets, as described above, the Company’s balance sheet continued to strengthen during fiscal 2008. Working capital at June 30, 2008 was $39.2 million compared to $26.9 million at June 30, 2007.
Liquidity and Capital Resources
As of June 30, 2008, the Company believes that current cash and cash equivalent balances are, and projected cash flow from operations in fiscal 2009 will be, adequate to meet foreseeable operating needs in fiscal 2009 as well as any possible earnout payments associated with the acquisition of RTS. See Note 2 to Consolidated Financial Statements for further information concerning the RTS acquisition.
In May 2007, the Company entered into a $4,000,000 unsecured revolving credit agreement with a bank to provide funds for general corporate purposes should the need arise. During fiscal 2008 and 2007, the Company did not borrow against this facility. See Note 15 to Consolidated Financial Statements for further information concerning the revolving credit agreement.
Year Ended June 30, 2008
At June 30, 2008, the Company had $19,137,000 in cash and cash equivalents compared to $9,988,000 at June 30, 2007.
In fiscal 2008, cash flow from continuing operating activities after changes in working capital items was $9,332,000, primarily due to net income adjusted for depreciation, deferred taxes and stock based
14
compensation expense and partially offset by higher inventories and lower current liabilities. In fiscal 2008, cash flow from discontinued operating activities after changes in working capital items was $846,000.
In fiscal 2008, the Company used $4,472,000, net of $147,000 of cash acquired, for the acquisition of RTS and $1,610,000 for capital expenditures relating to continuing operations. These capital expenditures relate primarily to new and replacement equipment and a small expansion of the Cypress, Texas manufacturing facility. In fiscal 2008, the Company used $73,000 for capital expenditures relating to discontinued operations and received net proceeds from the sale of discontinued operations of $5,078,000.
The Company anticipates that capital expenditures for fiscal 2009 will approximate $1,000,000, which will be funded from operating cash flow. These anticipated capital expenditures will relate primarily to new and replacement production machinery and leasehold improvements relating to a new leased manufacturing facility in Fredericksburg, Texas (refer to “Contractual Obligations” below for additional information regarding this facility).
Since a relatively small number of customers account for the majority of the Company’s sales, the consolidated accounts receivable balance at the end of any period tends to be concentrated in a small number of customers. At June 30, 2008 and June 30, 2007, the five customers with the highest accounts receivable balances represented, in the aggregate, 62% and 67%, respectively, of the consolidated accounts receivable balances on those dates.
Year Ended June 30, 2007
At June 30, 2007, the Company had $9,988,000 in cash and cash equivalents. This amount was $5,408,000 or 118% higher than the amount of cash and cash equivalents at June 30, 2006.
In fiscal 2007, cash flow from continuing operating activities after changes in working capital items was $3,871,000, primarily due to net income adjusted for depreciation and higher current liabilities partially offset by higher accounts receivable and inventories. In fiscal 2007, cash flow from discontinued operating activities after changes in working capital items was $795,000.
In fiscal 2007, the Company used $837,000 for capital expenditures relating to continuing operations for new and replacement equipment and $112,000 for capital expenditures relating to discontinued operations.
Off-Balance Sheet Arrangements
The Company has no off-balance sheet financing arrangements.
Contractual Obligations
The Company had no long-term borrowings, capital leases, purchase obligations or other long-term liabilities at June 30, 2008 or 2007. The Company has an unsecured $4,000,000 revolving credit facility with a bank (see Note 15 to Consolidated Financial Statements for further information regarding this facility). During fiscal 2008 and 2007, there were no borrowings under this facility. The Company is obligated for minimum lease payments as of June 30, 2008 under several operating leases for its facilities as follows:
| | | | | | | | | | | | | | | |
| | | Total | | Payments Due by Period |
Contractual Obligations | | | Less than 1 year | | 1-3 years | | 3-5 years | | More than 5 years |
Operating Lease Obligations | | $ | 1,566,000 | | $ | 348,000 | | $ | 696,000 | | $ | 522,000 | | $ | — |
Such amounts are exclusive of any “additional rent” for taxes, utilities or similar charges, under triple net leases. See Note 12 to Consolidated Financial Statements under “Lease Commitments” for further information regarding future payments and other information relating to such leases.
15
The Company will be relocating the RTS facility to new leased premises (approximately 7,000 square feet) in Fredericksburg, Texas under a five-year, triple net, operating lease. As of June 30, 2008, the Company had not yet finalized a lease with the lessor, which is an affiliate of the President and former owner of RTS. Capital expenditures to be incurred by the Company in fiscal 2009 relating to this facility are estimated to be $120,000.
Results of Operations
Year Ended June 30, 2008 Compared to Year Ended June 30, 2007
Consolidated sales for the year ended June 30, 2008 totaled $61,635,000, an increase of $14,706,000 or 31% from fiscal year 2007 primarily due to higher volume of sales of complete energy source systems, air gun replacement parts, underwater electrical connectors and cables, and effective July 1, 2007, sales of air gun controllers/synchronizers, data loggers and auxiliary equipment. Higher sales reflected continued strength in marine seismic activity and the acquired RTS business, which contributed sales of $5,465,000.
Consolidated gross profit as a percentage of consolidated sales was 46% for the year ended June 30, 2008, unchanged from the year ended June 30, 2007. The gross profit in fiscal 2008 was positively impacted by higher gross profit associated with the acquired RTS business, partially offset by lower gross profit associated with certain foreign sales, which included sales of auxiliary equipment purchased from outside vendors that normally have a lower margin than the Company’s proprietary products.
Research and development costs for the year ended June 30, 2008 increased by $2,000 or 1% from the year ended June 30, 2007. These expenditures were associated with work being done to improve the Company’s Annular Port Air Guns (“APG guns”) and Seismic Source Monitoring System (“SSMS”).
Selling, general and administrative (“SG&A”) expenses increased by $1,462,000 in fiscal year 2008 from fiscal year 2007 due primarily to the SG&A expenses of RTS ($661,000), additional personnel and salary increases ($341,000), bad debt expense ($201,000), stock based compensation expense ($158,000) and shareholder relations expenses ($80,000), partially offset by lower professional fees ($285,000) due primarily to lower Sarbanes-Oxley compliance costs.
The Company conducted an annual impairment test of goodwill balances as of July 1, 2008 and 2007. The results of these tests indicated that there was no impairment of the June 30, 2008 and 2007 goodwill balances.
The provision for income taxes for the year ended June 30, 2008 was $6,453,000, an effective tax rate of 32%. This rate was lower than the federal statutory rate of 35% due primarily to the tax benefit associated with the manufacturer’s deduction. The provision for income taxes for year ended June 30, 2007 was $4,758,000, an effective tax rate of 32%. This rate was lower than the federal statutory rate of 35%, primarily due to the tax benefits associated with export sales and the manufacturer’s deduction, partially offset by state income taxes.
The above mentioned factors resulted in income from continuing operations for the year ended June 30, 2008 of $13,709,000 compared to income from continuing operations of $9,999,000 for the year ended June 30, 2007.
Effective May 31, 2008, substantially all of the assets of Custom Products Corporation (“Custom”), a wholly owned subsidiary of Bolt, were sold for $5,250,000, subject to adjustments for certain liabilities. Custom, a developer, manufacturer and seller of miniature industrial clutches and brakes and seller of sub-fractional horsepower electrical motors, was formerly in the Company’s “industrial products” segment. Custom was the only unit in the industrial products segment; therefore, due to the sale of Custom, the Company now operates only in the oilfield services equipment business. In the Consolidated Financial Statements, reported amounts relating to Custom have been reported as discontinued operations. During the year ended June 30, 2008, the Company recorded as discontinued operations the operating results of Custom for the eleven-month period ending May 31, 2008 of $575,000, net of income taxes, and a gain on the sale of the assets of Custom of
16
$285,000, net of income taxes. In addition, prior year information relating to Custom was restated to report such information as discontinued operations. During the year ended June 30, 2007, income from discontinued operations was $608,000, net of income taxes. See the Consolidated Financial Statements and Note 3 to Consolidated Financial Statements for additional information concerning discontinued operations.
The above mentioned factors resulted in net income for the year ended June 30, 2008 of $14,569,000 compared to net income of $10,607,000 for the year ended June 30, 2007.
Year Ended June 30, 2007 Compared to Year Ended June 30, 2006
Consolidated sales for the year ended June 30, 2007 totaled $46,929,000, an increase of $17,536,000 or 60% from fiscal year 2006 primarily due to higher volume of sales of complete energy source systems, air gun replacement parts, underwater electrical connectors and cables and SSMS. Higher sales reflected continued strength in marine seismic activity.
Consolidated gross profit as a percentage of consolidated sales was 46% for the year ended June 30, 2007 versus 41% for the year ended June 30, 2006. The gross profit improvement was due to higher manufacturing efficiencies associated with the 60% increase in sales and higher pricing, partially offset by higher material and labor costs. In addition, the gross profit for the year ended June 30, 2006 was adversely affected by sales of auxiliary equipment purchased from third party suppliers. Third party auxiliary equipment had significantly lower margin than the Company’s proprietary products.
Research and development costs for the year ended June 30, 2007 decreased by $19,000 or 7% from the year ended June 30, 2006. These expenditures were associated with work being done to improve the Company’s APG guns and SSMS. The decrease was primarily due to lower spending for SSMS.
Selling, general and administrative expenses increased by $1,512,000 for the year ended June 30, 2007 from the year ended June 30, 2006 due primarily to higher professional fees ($713,000), compensation expense ($611,000) and freight out ($125,000). Higher professional fees were primarily due to the incremental expenses incurred to become compliant with Section 404 of the Sarbanes-Oxley Act of 2002. The increase in compensation expense primarily reflected higher incentive compensation, the addition of personnel and salary increases. Higher freight out reflects the 60% increase in consolidated sales.
The Company conducted an annual impairment test of goodwill balances as of July 1, 2007 and 2006. The results of these tests indicated that there was no impairment of the June 30, 2007 and 2006 goodwill balances.
The provision for income taxes for the year ended June 30, 2007 was $4,758,000, an effective tax rate of 32%. This rate was lower than the federal statutory rate of 35% due primarily to tax benefits associated with export sales and the manufacturer’s deduction, partially offset by state income taxes. The provision for income taxes for the year ended June 30, 2006 was $2,352,000, an effective tax rate of 35%. This rate was higher than the federal statutory rate of 34%, primarily due to state income taxes, partially offset by the tax benefits associated with export sales and the manufacturer’s deduction.
The above mentioned factors resulted in income from continuing operations for the year ended June 30, 2007 of $9,999,000 compared to income from continuing operations of $4,407,000 for the year ended June 30, 2006.
During the year ended June 30, 2007, income from discontinued operations was $608,000, net of income taxes, versus $438,000 for the year ended June 30, 2006. See the Consolidated Financial Statements and Note 3 to Consolidated Financial Statements for additional information concerning discontinued operations.
The above mentioned factors resulted in net income for the year ended June 30, 2007 of $10,607,000 compared to net income of $4,845,000 for the year ended June 30, 2006.
17
Critical Accounting Policies
The methods, estimates and judgments the Company uses in applying the accounting policies most critical to its financial statements have a significant impact on the results the Company reports in its financial statements. The Securities and Exchange Commission has defined the most critical accounting policies as the ones that are most important to the portrayal of the Company’s financial condition and results, and requires the Company to make its most difficult and subjective judgments.
Based on this definition, the Company’s most critical accounting policies include: revenue recognition, recording of inventory reserves, deferred taxes, and the potential impairment of goodwill. These policies are discussed below. The Company also has other key accounting policies, including the establishment of bad debt reserves. The Company believes that these other policies either do not generally require it to make estimates and judgments that are as difficult or as subjective, or are less likely to have a material impact on the Company’s reported results of operations for a given period.
Although the Company believes that its estimates and assumptions are reasonable, they are based upon information available at the end of each reporting period and involve inherent risks and uncertainties. Actual results may differ significantly from the Company’s estimates and its estimates could be different using different assumptions or conditions.
See Note 1 to Consolidated Financial Statements for additional information concerning significant accounting policies.
Revenue Recognition
The Company recognizes sales revenue when it is realized and earned. The Company’s reported sales revenue is based on meeting the following criteria: (1) manufacturing products based on customer specifications; (2) delivering product to the customer before the close of the reporting period, whereby delivery results in the transfer of ownership risk to the customer; (3) establishing a set sales price with the customer; (4) collecting the sales revenue from the customer is reasonably assured; and (5) no contingencies exist.
Inventory Reserves
A significant source of the Company’s revenue arises from the sale of replacement parts required by customers who have previously purchased products. As a result, the Company maintains a large quantity of parts on hand that may not be sold or used in final assemblies for an extended period of time. In order to recognize that certain inventory may become obsolete or that the Company may have supplies in excess of reasonably supportable sales forecasts, an inventory valuation reserve has been established. The inventory valuation reserve is a significant estimate made by management. Actual results may differ from this estimate, and the difference could be material.
Management establishes the inventory valuation reserve by reviewing the inventory for items that should be reserved in full based on a lack of usage for a specified period of time and for which future demand is not forecasted and establishes an additional reserve for slow moving inventory based on varying percentages of the cost of the items. The reserve for inventory valuation at June 30, 2008 and 2007 was $406,000 and $524,000, respectively. At June 30, 2008 and 2007, approximately $1,247,000 and $1,401,000, respectively, of the raw materials and sub-assemblies inventory were considered slow moving and subject to a reserve provision equal to all or a portion of the cost, less an estimate for scrap value. In certain instances, this inventory has been unsold for more than five years from date of manufacture or purchase, and in other instances the Company has more than a five-year supply of inventory on hand based on recent sales volume. At June 30, 2008, the cost of inventory for which the Company has more than a five-year supply on hand and the cost of inventory for which the Company has had no sales during the last five years amounted to approximately $780,000. Management
18
believes that this inventory is properly valued and appropriately reserved. Even if management’s estimate were incorrect, that would not result in a cash outlay since the cash required to manufacture or purchase the older inventory was expended in prior years.
The inventory valuation reserve is adjusted at the close of each accounting period, as necessary, based on management’s estimate of the valuation reserve required. This estimate is calculated on a consistent basis as determined by the Company’s inventory valuation policy. Increases to the inventory valuation reserve result in a charge to cost of sales, and decreases to the reserve result in a credit to cost of sales. The inventory valuation reserve is also decreased when items are scrapped or disposed of. During the fiscal year ended June 30, 2008, the inventory valuation reserve was decreased by $118,000, and the Company did not scrap or dispose of any items.
Deferred Taxes
The Company applies an asset and liability approach to accounting for income taxes. Deferred tax assets and liabilities are recognized for the expected future tax consequences of temporary differences between the financial statement and tax basis of assets and liabilities using enacted tax rates in effect for the years in which the differences are expected to reverse. The recoverability of deferred tax assets is dependent upon the Company’s assessment of whether it is more likely than not that sufficient future taxable income will be generated in the relevant tax jurisdiction to utilize the deferred tax asset. The Company reviews its internal forecasted sales and pre-tax earnings estimates to make its assessment about the utilization of deferred tax assets. In the event the Company determines that future taxable income will not be sufficient to utilize the deferred tax asset, a valuation allowance is recorded. If that assessment changes, a charge or a benefit would be recorded in the consolidated statement of income. The Company has concluded that no deferred tax valuation allowance was necessary at June 30, 2008 and June 30, 2007 because future taxable income is believed to be sufficient to utilize any deferred tax asset.
Goodwill Impairment Testing
As required by SFAS No. 142, “Goodwill and Other Intangible Assets,” the Company reviews goodwill for impairment annually or more frequently if impairment indicators arise. Management tested goodwill for impairment as of July 1, 2008 and 2007 and the tests indicated no impairment of the goodwill balances at June 30, 2008 and 2007.
Goodwill represents approximately 17% of the Company’s total assets at June 30, 2008 and is thus a significant estimate by management. Even if management’s estimate were incorrect, it would not result in a cash outlay because the goodwill amounts arose out of acquisition accounting. See Notes 1, 2 and 4 to Consolidated Financial Statements for additional information concerning goodwill.
Recent Accounting Developments
Business Combinations
In December 2007, the Financial Accounting Standards Board (“FASB”) issued Statement of Financial Accounting Standards (“SFAS”) No. 141 (revised 2007), “Business Combinations” (“SFAS 141(R)”), which is a revision of SFAS 141. SFAS 141(R) continues to require the purchase method of accounting for business combinations and the identification and recognition of intangible assets separately from goodwill. SFAS 141(R) requires, among other things, the buyer to: (1) fair value assets and liabilities acquired as of the acquisition date (i.e., a “fair value” model rather than a “cost allocation” model); (2) expense acquisition-related costs; (3) recognize assets or liabilities assumed arising from contractual contingencies at acquisition date using acquisition-date fair values; (4) recognize goodwill as the excess of the consideration transferred plus the fair value of any noncontrolling interest over the acquisition-date fair value of net assets acquired; (5) recognize at acquisition any contingent consideration using acquisition-date fair values (i.e., fair value earn-outs in the initial accounting for the acquisition); and (6) eliminate the recognition of liabilities for restructuring costs expected to be incurred as a result of the business combination. SFAS 141(R) also defines a “bargain” purchase as a business
19
combination where the total acquisition-date fair value of the identifiable net assets acquired exceeds the fair value of the consideration transferred plus the fair value of any noncontrolling interest. Under this circumstance, the buyer is required to recognize such excess (formerly referred to as “negative goodwill”) in earnings as a gain. In addition, if the buyer determines that some or all of its previously booked deferred tax valuation allowance is no longer needed as a result of the business combination, SFAS 141(R) requires that the reduction or elimination of the valuation allowance be accounted as a reduction of income tax expense. SFAS 141(R) is effective for fiscal years beginning on or after December 15, 2008. The Company will apply SFAS 141(R) to any acquisitions that are made on or after July 1, 2009.
The Fair Value Option for Financial Assets and Financial Liabilities Including an Amendment of FASB Statement No. 115
In February 2007, the FASB issued SFAS No. 159, “The Fair Value Option for Financial Assets and Financial Liabilities Including an Amendment of FASB Statement No. 115” (“SFAS 159”). SFAS 159 permits companies to measure many financial instruments and certain other items at fair value. SFAS 159 is effective as of the beginning of the Company’s first fiscal year that begins after November 15, 2007. The Company believes that SFAS 159 will not have an impact on the Company’s consolidated financial statements.
Fair Value Measurements
In September 2006, the FASB issued SFAS No. 157, “Fair Value Measurements” (“SFAS 157”), which establishes a framework for measuring fair value under generally accepted accounting principles, and expands disclosures about fair value measurements. SFAS 157 does not require new fair value measurements. The purpose of SFAS 157 is to provide a single definition of fair value and to provide additional guidance relative to fair value measurements. The end result of SFAS 157 application will be consistency and comparability in fair value measurements. SFAS 157 is effective for fiscal years beginning after November 15, 2007. The Company believes that it is unlikely that SFAS 157 will have any impact on the Company’s consolidated financial statements because the Company does not deal in transactions requiring complex fair value measurements.
| ITEM 7A. | Quantitative and Qualitative Disclosures about Market Risk |
None.
| ITEM 8. | Financial Statements and Supplementary Data |
The information required under this Item 8 is set forth on pages F-1 through F-23 of this Report.
| ITEM 9. | Changes in and Disagreements with Accountants on Accounting and Financial Disclosure |
None.
| ITEM 9A. | Controls and Procedures |
The chief executive officer and the chief financial officer, with the assistance of key employees throughout the Company, including its subsidiaries, evaluated the Company’s disclosure controls and procedures as of June 30, 2008. Based upon the results of such evaluation, the chief executive officer and chief financial officer have concluded that such disclosure controls and procedures are effective in providing reasonable assurance that information required to be disclosed by the Company in the reports that it files or submits under the Securities Exchange Act of 1934 is recorded, processed, summarized and reported within the time periods specified in the Securities and Exchange Commission’s rules and forms. Disclosure controls and procedures include, without limitation, controls and procedures designed to ensure that information required to be disclosed by the Company in the reports that it files under the Securities Exchange Act of 1934 is accumulated and communicated to management, including the principal executive and financial officers, as appropriate to allow timely decisions regarding required disclosure.
20
See page F-1 of this Report for Management’s Report on Internal Control Over Financial Reporting and page F-2 of this Report for Report of Independent Registered Public Accounting Firm on the effectiveness of the Company’s internal control over financial reporting.
There have been no changes in the Company’s internal control over financial reporting that occurred during the quarter ended June 30, 2008 that have materially affected, or are reasonably likely to materially affect, our internal control over financial reporting.
| ITEM 9B. | Other Information |
None.
21
PART III
| ITEM 10. | Directors, Executive Officers and Corporate Governance |
The information required by Item 10 is incorporated by reference to the information appearing under the captions “Election of Directors,” “Management,” “Section 16(a) Beneficial Ownership Reporting Compliance,” and “General Information Relating to the Board of Directors” in the Company’s definitive proxy statement relating to the 2008 Annual Meeting of Stockholders to be filed with the Securities and Exchange Commission within 120 days after the end of the fiscal year covered by this Form 10-K (the “Definitive Proxy Statement”).
| ITEM 11. | Executive Compensation |
The information required by Item 11 is incorporated by reference to the information appearing under the captions “Executive Compensation” and “General Information Relating to the Board of Directors” in the Definitive Proxy Statement.
| ITEM 12. | Security Ownership of Certain Beneficial Owners and Management and Related Stockholder Matters |
The information required by Item 12 is incorporated by reference to the information appearing under the caption “Equity Compensation Plan Information” under Part II, Item 5 of this Form 10-K and the information appearing under the captions “Security Ownership of Certain Beneficial Owners” and “Security Ownership of Management” in the Definitive Proxy Statement.
| ITEM 13. | Certain Relationships and Related Transactions, and Director Independence |
The information required by Item 13 is incorporated by reference to the information appearing under the captions “Certain Relationships and Related Transactions” and “General Information Relating to the Board of Directors” in the Definitive Proxy Statement.
| ITEM 14. | Principal Accountant Fees and Services |
The information required by Item 14 is incorporated by reference to the information appearing under the caption “Relationship with Independent Accountants” in the Definitive Proxy Statement.
22
PART IV
| ITEM 15. | Exhibits and Financial Statement Schedules |
The following are being filed as part of this Annual Report on Form 10-K:
(a) Financial Statements and Financial Statement Schedule
Consolidated Financial Statements
Schedules other than the one listed above are omitted because they are not applicable, or the required information is shown in the financial statements or the notes thereto.
(b) Exhibits
| | |
Exhibit No. | | Description |
| 3.1 | | Restated Certificate of Incorporation of the Registrant, as amended (incorporated by reference to Exhibit 3.1 to Form 8-K Current Report, SEC File No. 001-12075, dated November 20, 2007 and filed with the Commission on November 21, 2007). |
| |
| 3.2 | | Bylaws of the Registrant, amended and restated effective as of January 23, 2008 (incorporated by reference to Exhibit 3.1 to Form 8-K Current Report, SEC File No. 001-12075, dated January 23, 2008 and filed with the Commission on January 25, 2008). |
| |
| 10.1 | | Bolt Technology Corporation Amended and Restated 2006 Stock Option and Restricted Stock Plan together with (i) Form of Incentive Stock Option Agreement, (ii) Form of Nonqualified Stock Option Agreement, (iii) Form of Non-Employee Director Nonqualified Stock Option Agreement, and (iv) Form of Restricted Stock Award Agreement (incorporated by reference to Exhibit 10.1 to Form 8-K Current Report, SEC File No. 001-12075, dated November 20, 2007 and filed with the Commission on November 21, 2007).† |
| |
| 10.2 | | Bolt Technology Corporation Amended and Restated Severance Compensation Plan together with Form of Designation of Participation (incorporated by reference to Exhibit 10.2 to Form 8-K Current Report, SEC File No. 001-12075, dated November 20, 2007 and filed with the Commission on November 21, 2007).† |
| |
| 10.3 | | Lease Agreement dated January 10, 2003 between 381 Connecticut Avenue Corporation and Bolt Technology Corporation (incorporated by reference to Exhibit 10.6 to Form 10-K for the year ended June 30, 2003, SEC File No. 001-12075). |
| |
| 10.4 | | Lease Agreement dated January 10, 2003 between 381 Connecticut Avenue Corporation and Bolt Technology Corporation (incorporated by reference to Exhibit 10.7 to Form 10-K for the year ended June 30, 2003, SEC File No. 001-12075). |
23
| | |
Exhibit No. | | Description |
| 10.5 | | Employment Agreement between Bolt Technology Corporation and Raymond M. Soto effective as of June 10, 1996; Amendment to Employment Agreement between Bolt Technology Corporation and Raymond M. Soto effective as of September 20, 2001 (incorporated by reference to Exhibit 10.3 to Form 10-Q for the quarter ended September 30, 2006, SEC File No. 001-12075); Amendment to Employment Agreement between Bolt Technology Corporation and Raymond M. Soto effective as of November 20, 2007 (incorporated by reference to Exhibit 10.3 to Form 8-K Current Report, SEC File No. 001-12075, dated November 20, 2007 and filed with the Commission on November 21, 2007).† |
| |
| 10.6 | | Restricted Stock Award Agreement by and between Bolt Technology Corporation and Raymond M. Soto dated as of January 23, 2008 (incorporated by reference to Exhibit 10.6 to Form 10-Q for the quarter ended March 31, 2008, SEC File No. 001-12075).† |
| |
| 10.7 | | Employment Agreement between Custom Products Corporation and Gerald H. Shaff effective as of January 1, 2003 (incorporated by reference to Exhibit 10.5 to Form 10-K for the year ended June 30, 2003, SEC File No. 001-12075); Letter Agreement dated as of February 9, 2005 amending the Employment Agreement between Custom Products Corporation and Gerald H. Shaff, effective as of January 1, 2003 (incorporated by reference to Exhibit 10.8 to Form 10-Q for the quarter ended December 31, 2004, SEC File No. 001-12075).† |
| |
| 10.8 | | Employment Agreement between A-G Geophysical Products, Inc. and Michael C. Hedger, dated May 13, 2005 (incorporated by reference to Exhibit 10.10 to Form 10-Q for the quarter ended March 31, 2005, SEC File No. 001-12075); Amendment to Employment Agreement between A-G Geophysical Products, Inc. and Michael C. Hedger effective as of November 20, 2007 (incorporated by reference to Exhibit 10.4 to Form 8-K Current Report, SEC File No. 001-12075, dated November 20, 2007 and filed with the Commission on November 21, 2007).† |
| |
| 10.9 | | Asset Purchase Agreement by and among Real Time Systems Inc., Embedded Microsystems, Inc. dba Real Time Systems, W. Allen Nance and Molly L. Nance dated July 10, 2007 (incorporated by reference to Exhibit 10.1 to Form 8-K Current Report, SEC File No. 001-12075, dated July 10, 2007 and filed with the Commission on July 12, 2007). |
| |
| 10.10 | | Employment Agreement by and between Real Time Systems Inc. and W. Allen Nance dated July 10, 2007 (incorporated by reference to Exhibit 10.2 to Form 8-K Current Report, SEC File No. 001-12075, dated July 10, 2007 and filed with the Commission on July 12, 2007).† |
| |
| 10.11 | | Non-Competition Agreement by and among Real Time Systems Inc., Bolt Technology Corporation, Embedded Microsystems, Inc. dba Real Time Systems and W. Allen Nance dated July 10, 2007 (incorporated by reference to Exhibit 10.3 to Form 8-K Current Report, SEC File No. 001-12075, dated July 10, 2007 and filed with the Commission on July 12, 2007). |
| |
| 10.12 | | Asset Purchase Agreement by and among Custom Products Corporation, Bolt Technology Corporation and A&A Manufacturing Co., Inc. dated May 6, 2008.* |
| |
| 21 | | Subsidiaries of the Registrant.* |
| |
| 23 | | Consent of Independent Registered Public Accounting Firm.* |
| |
| 31.1 | | Certification pursuant to Rule 13a-14(a)/15d-14(a), as adopted pursuant to Section 302 of the Sarbanes-Oxley Act of 2002 (Chief Executive Officer).* |
| |
| 31.2 | | Certification pursuant to Rule 13a-14(a)/15d-14(a), as adopted pursuant to Section 302 of the Sarbanes-Oxley Act of 2002 (Chief Financial Officer).* |
| |
| 32.1 | | Certification pursuant to 18 U.S.C. Section 1350, as adopted pursuant to Section 906 of the Sarbanes-Oxley Act of 2002 (Chief Executive Officer).* |
24
| | |
Exhibit No. | | Description |
| 32.2 | | Certification pursuant to 18 U.S.C. Section 1350, as adopted pursuant to Section 906 of the Sarbanes-Oxley Act of 2002 (Chief Financial Officer).* |
| |
| 99.1 | | Commercial Loan Agreement, dated as of May 30, 2007, by and among Webster Bank National Association, Bolt Technology Corporation, A-G Geophysical Products, Inc. and Custom Products Corporation (incorporated by reference to Exhibit 99.1 to Form 10-K for the year ended June 30, 2007, SEC File No. 001-12075). |
| † | Management contract or compensatory plan |
25
Signatures
Pursuant to the requirements of Section 13 or 15(d) of the Securities Exchange Act of 1934, the Registrant has duly caused this report to be signed on its behalf by the undersigned, thereunto duly authorized.
| | | | | | |
| | BOLT TECHNOLOGY CORPORATION |
| | |
Date: September 12, 2008 | | By: | | /s/ RAYMOND M. SOTO |
| | | | | | Raymond M. Soto |
| | | | | | (Chairman of the Board, President and |
| | | | | | Chief Executive Officer) |
Pursuant to the requirements of the Securities Exchange Act of 1934, this report has been signed below by the following persons on behalf of the Registrant and in the capacities and on the dates indicated.
| | | | |
Signature | | Title | | Date |
/s/ RAYMOND M. SOTO (Raymond M. Soto) | | Chairman of the Board, President, Chief Executive Officer and Director (Principal Executive Officer) | | September 12, 2008 |
| | |
/s/ JOSEPH ESPESO (Joseph Espeso) | | Senior Vice President—Finance, Chief Financial Officer and Director (Principal Financial Officer and Principal Accounting Officer) | | September 12, 2008 |
| | |
/s/ KEVIN M. CONLISK (Kevin M. Conlisk) | | Director | | September 12, 2008 |
| | |
/s/ MICHAEL H. FLYNN (Michael H. Flynn) | | Director | | September 12, 2008 |
| | |
/s/ MICHAEL C. HEDGER (Michael C. Hedger) | | Director | | September 12, 2008 |
| | |
/s/ GEORGE R. KABURECK (George R. Kabureck) | | Director | | September 12, 2008 |
| | |
/s/ JOSEPH MAYERICK, JR. (Joseph Mayerick, Jr.) | | Director | | September 12, 2008 |
| | |
/s/ STEPHEN F. RYAN (Stephen F. Ryan) | | Director | | September 12, 2008 |
| | |
/s/ GERALD A. SMITH (Gerald A. Smith) | | Director | | September 12, 2008 |
26
MANAGEMENT’S REPORT ON INTERNAL CONTROL OVER
FINANCIAL REPORTING
The management of Bolt Technology Corporation is responsible for establishing and maintaining adequate internal control over financial reporting, as defined in Rule 13a-15(f) of the Securities Exchange Act of 1934.
Internal control over financial reporting, no matter how well designed, has inherent limitations. Accordingly, even those systems determined to be effective can provide only reasonable assurance with respect to financial statement preparation and presentation. Further, because of changes in conditions, the effectiveness of internal control over financial reporting could vary over time.
The management of Bolt Technology Corporation, including our Chief Executive Officer and Chief Financial Officer, conducted an evaluation to assess the effectiveness of our internal control over financial reporting as of June 30, 2008 based upon criteria set forth in the “Internal Control—Integrated Framework,” issued by the Committee of Sponsoring Organizations of the Treadway Commission. Based on our assessment, we believe that, as of June 30, 2008, our internal control over financial reporting is effective.
The effectiveness of our internal control over financial reporting as of June 30, 2008 has been audited by McGladrey & Pullen, LLP, our independent registered public accounting firm, as stated in their report which appears on page F-2 of this Annual Report on Form 10-K.
F-1
REPORT OF INDEPENDENT REGISTERED PUBLIC ACCOUNTING FIRM
To the Board of Directors and Stockholders
Bolt Technology Corporation and Subsidiaries
We have audited Bolt Technology Corporation and subsidiaries’ internal control over financial reporting as of June 30, 2008, based on, “criteria established in Internal Control—Integrated Framework issued by the Committee of Sponsoring Organizations of the Treadway Commission (COSO)”. Bolt Technology Corporation’s management is responsible for maintaining effective internal control over financial reporting and for its assessment of the effectiveness of internal control over financial reporting included in the accompanying Management’s Report on Internal Control Over Financial Reporting. Our responsibility is to express an opinion on the company’s internal control over financial reporting based on our audit.
We conducted our audit in accordance with the standards of the Public Company Accounting Oversight Board (United States). Those standards require that we plan and perform the audit to obtain reasonable assurance about whether effective internal control over financial reporting was maintained in all material respects. Our audit included obtaining an understanding of internal control over financial reporting, assessing the risk that a material weakness exists, and testing and evaluating the design and operating effectiveness of internal control based on the assessed risk. Our audit also included performing such other procedures as we considered necessary in the circumstances. We believe that our audit provides a reasonable basis for our opinion.
A company’s internal control over financial reporting is a process designed to provide reasonable assurance regarding the reliability of financial reporting and the preparation of financial statements for external purposes in accordance with generally accepted accounting principles. A company’s internal control over financial reporting includes those policies and procedures that (1) pertain to the maintenance of records that, in reasonable detail, accurately and fairly reflect the transactions and dispositions of the assets of the company; (2) provide reasonable assurance that transactions are recorded as necessary to permit preparation of financial statements in accordance with generally accepted accounting principles, and that receipts and expenditures of the company are being made only in accordance with authorizations of management and directors of the company; and (3) provide reasonable assurance regarding prevention or timely detection of unauthorized acquisition, use, or disposition of the company’s assets that could have a material effect on the financial statements.
Because of its inherent limitations, internal control over financial reporting may not prevent or detect misstatements. Also, projections of any evaluation of effectiveness to future periods are subject to the risk that controls may become inadequate because of changes in conditions, or that the degree of compliance with the policies or procedures may deteriorate.
In our opinion, Bolt Technology Corporation and subsidiaries maintained, in all material respects, effective internal control over financial reporting as of June 30, 2008, based on“criteria established in Internal Control—Integrated Framework issued by the Committee of Sponsoring Organizations of the Treadway Commission (COSO).”
We have also audited, in accordance with the standards of the Public Company Accounting Oversight Board (United States), the consolidated financial statements of Bolt Technology Corporation and subsidiaries and our report dated September 10, 2008 expressed an unqualified opinion.
/s/ McGladrey & Pullen, LLP
Stamford, Connecticut
September 10, 2008
F-2
REPORT OF INDEPENDENT REGISTERED PUBLIC ACCOUNTING FIRM
To the Board of Directors and Stockholders
Bolt Technology Corporation and Subsidiaries
We have audited the consolidated balance sheets of Bolt Technology Corporation and subsidiaries as of June 30, 2008 and 2007, and the related consolidated statements of income and cash flows for each of the three years in the period ended June 30, 2008. Our audits also included the financial statement schedule of Bolt Technology Corporation listed in Item 15(a). These financial statements and financial statement schedule are the responsibility of the Company’s management. Our responsibility is to express an opinion on these financial statements based on our audits.
We conducted our audits in accordance with the standards of the Public Company Accounting Oversight Board (United States). Those standards require that we plan and perform the audit to obtain reasonable assurance about whether the financial statements are free of material misstatement. An audit includes examining, on a test basis, evidence supporting the amounts and disclosures in the financial statements. An audit also includes assessing the accounting principles used and significant estimates made by management, as well as evaluating the overall financial statement presentation. We believe that our audits provide a reasonable basis for our opinion.
In our opinion, the consolidated financial statements referred to above present fairly, in all material respects, the financial position of Bolt Technology Corporation and subsidiaries as of June 30, 2008 and 2007, and the results of their operations and their cash flows for each of the three years in the period ended June 30, 2008, in conformity with U.S. generally accepted accounting principles. Also, in our opinion, the related financial statement schedule, when considered in relation to the basic consolidated financial statements taken as a whole, present fairly in all material respects the information set forth therein.
We also have audited, in accordance with the standards of the Public Company Accounting Oversight Board (United States), Bolt Technology Corporation and subsidiaries’ internal control over financial reporting as of June 30, 2008, based on“criteria established in Internal Control—Integrated Framework issued by the Committee of Sponsoring Organizations of the Treadway Commission (COSO)” and our report dated September 10, 2008, expressed an unqualified opinion on the effectiveness of Bolt Technology Corporation’s internal control over financial reporting.
/s/McGladrey & Pullen, LLP
Stamford, Connecticut
September 10, 2008
F-3
Bolt Technology Corporation and Subsidiaries
Consolidated Balance Sheets
| | | | | | |
| | | June 30, |
| | | 2008 | | 2007 |
| Assets | | | | | | |
Current Assets: | | | | | | |
Cash and cash equivalents | | $ | 19,137,000 | | $ | 9,988,000 |
Accounts receivable, less allowance for uncollectible accounts of $81,000 in 2008 and $63,000 in 2007 | | | 11,067,000 | | | 10,199,000 |
Inventories | | | 14,879,000 | | | 11,281,000 |
Deferred income taxes | | | 190,000 | | | 228,000 |
Other current assets | | | 252,000 | | | 461,000 |
Current assets of discontinued operations | | | — | | | 1,065,000 |
| | | | | | |
Total current assets | | | 45,525,000 | | | 33,222,000 |
| | | | | | |
Property, Plant and Equipment, net | | | 4,331,000 | | | 3,056,000 |
Goodwill, net | | | 10,330,000 | | | 7,679,000 |
Other Intangible Assets, net | | | 1,472,000 | | | — |
Other Assets | | | 209,000 | | | 222,000 |
Long-term Assets of Discontinued Operations | | | — | | | 3,439,000 |
| | | | | | |
Total assets | | $ | 61,867,000 | | $ | 47,618,000 |
| | | | | | |
| Liabilities and Stockholders’ Equity | | | | | | |
Current Liabilities: | | | | | | |
Accounts payable | | $ | 2,479,000 | | $ | 3,615,000 |
Accrued expenses | | | 3,045,000 | | | 2,565,000 |
Income taxes payable | | | 826,000 | | | — |
Current liabilities of discontinued operations | | | — | | | 110,000 |
| | | | | | |
Total current liabilities | | | 6,350,000 | | | 6,290,000 |
| | | | | | |
Deferred income taxes of discontinued operations | | | — | | | 642,000 |
| | | | | | |
Total liabilities | | | 6,350,000 | | | 6,932,000 |
| | | | | | |
Stockholders’ Equity: | | | | | | |
Common stock, no par value, authorized 20,000,000 shares (9,000,000 shares in 2007); issued and outstanding 8,618,093 shares (8,581,598 shares in 2007) | | | 28,597,000 | | | 28,335,000 |
Retained Earnings | | | 26,920,000 | | | 12,351,000 |
| | | | | | |
Total stockholders’ equity | | | 55,517,000 | | | 40,686,000 |
| | | | | | |
Total liabilities and stockholders’ equity | | $ | 61,867,000 | | $ | 47,618,000 |
| | | | | | |
See Notes to Consolidated Financial Statements.
F-4
Bolt Technology Corporation and Subsidiaries
Consolidated Statements of Income
| | | | | | | | | | | | |
| | | For the Years Ended June 30, | |
| | | 2008 | | | 2007 | | | 2006 | |
Revenues: | | | | | | | | | | | | |
Sales | | $ | 61,635,000 | | | $ | 46,929,000 | | | $ | 29,393,000 | |
| | | | | | | | | | | | |
Costs and Expenses: | | | | | | | | | | | | |
Cost of sales | | | 33,164,000 | | | | 25,347,000 | | | | 17,226,000 | |
Research and development | | | 272,000 | | | | 270,000 | | | | 289,000 | |
Selling, general and administrative | | | 8,228,000 | | | | 6,766,000 | | | | 5,254,000 | |
Interest income | | | (191,000 | ) | | | (211,000 | ) | | | (135,000 | ) |
| | | | | | | | | | | | |
| | | 41,473,000 | | | | 32,172,000 | | | | 22,634,000 | |
| | | | | | | | | | | | |
Income from continuing operations before income taxes | | | 20,162,000 | | | | 14,757,000 | | | | 6,759,000 | |
Provision for income taxes | | | 6,453,000 | | | | 4,758,000 | | | | 2,352,000 | |
| | | | | | | | | | | | |
Income from continuing operations | | | 13,709,000 | | | | 9,999,000 | | | | 4,407,000 | |
Discontinued operations: | | | | | | | | | | | | |
Income from discontinued operations, net of taxes | | | 575,000 | | | | 608,000 | | | | 438,000 | |
Gain on sale of discontinued operations, net of taxes | | | 285,000 | | | | — | | | | — | |
| | | | | | | | | | | | |
Discontinued operations, net of taxes | | | 860,000 | | | | 608,000 | | | | 438,000 | |
| | | | | | | | | | | | |
Net income | | $ | 14,569,000 | | | $ | 10,607,000 | | | $ | 4,845,000 | |
| | | | | | | | | | | | |
Earnings Per Share: | | | | | | | | | | | | |
Earnings per share—basic | | | | | | | | | | | | |
Income from continuing operations | | $ | 1.60 | | | $ | 1.19 | | | $ | 0.54 | |
Income from discontinued operations, net of taxes | | | 0.07 | | | | 0.07 | | | | 0.05 | |
Gain on sale of discontinued operations, net of taxes | | | 0.03 | | | | — | | | | — | |
| | | | | | | | | | | | |
Net income | | $ | 1.70 | | | $ | 1.26 | | | $ | 0.59 | |
| | | | | | | | | | | | |
Earnings per share—diluted | | | | | | | | | | | | |
Income from continuing operations | | $ | 1.60 | | | $ | 1.17 | | | $ | 0.52 | |
Income from discontinued operations, net of taxes | | | 0.07 | | | | 0.07 | | | | 0.05 | |
Gain on sale of discontinued operations, net of taxes | | | 0.03 | | | | — | | | | — | |
| | | | | | | | | | | | |
Net income | | $ | 1.70 | | | $ | 1.24 | | | $ | 0.57 | |
| | | | | | | | | | | | |
Average number of common shares outstanding: | | | | | | | | | | | | |
Basic | | | 8,581,491 | | | | 8,415,689 | | | | 8,196,399 | |
Diluted | | | 8,586,518 | | | | 8,523,549 | | | | 8,446,151 | |
See Notes to Consolidated Financial Statements.
F-5
Bolt Technology Corporation and Subsidiaries
Consolidated Statements of Cash Flows
| | | | | | | | | | | | |
| | | 2008 | | | 2007 | | | 2006 | |
Cash Flows From Operating Activities: | | | | | | | | | | | | |
Net income | | $ | 14,569,000 | | | $ | 10,607,000 | | | $ | 4,845,000 | |
Less: Income from discontinued operations, net of taxes | | | (860,000 | ) | | | (608,000 | ) | | | (438,000 | ) |
| | | | | | | | | | | | |
Income from continuing operations | | | 13,709,000 | | | | 9,999,000 | | | | 4,407,000 | |
Adjustments to reconcile income from continuing operations to cash provided by operating activities: | | | | | | | | | | | | |
Depreciation and amortization | | | 667,000 | | | | 319,000 | | | | 274,000 | |
Deferred income taxes | | | 57,000 | | | | (2,000 | ) | | | 122,000 | |
Stock based compensation expense | | | 214,000 | | | | 56,000 | | | | — | |
| | | |
Change in operating assets and liabilities, net of RTS acquisition effect: | | | | | | | | | | | | |
Accounts receivable | | | (453,000 | ) | | | (3,009,000 | ) | | | (4,542,000 | ) |
Inventories | | | (3,225,000 | ) | | | (3,699,000 | ) | | | (1,148,000 | ) |
Other assets | | | 225,000 | | | | (232,000 | ) | | | (98,000 | ) |
Accounts payable | | | (1,136,000 | ) | | | 1,274,000 | | | | 270,000 | |
Accrued expenses | | | (386,000 | ) | | | 323,000 | | | | 1,265,000 | |
Income taxes payable | | | (340,000 | ) | | | (1,158,000 | ) | | | 810,000 | |
Customer deposit | | | — | | | | — | | | | (414,000 | ) |
| | | | | | | | | | | | |
Net cash provided by continuing operations | | | 9,332,000 | | | | 3,871,000 | | | | 946,000 | |
Net cash provided by discontinued operations | | | 846,000 | | | | 795,000 | | | | 562,000 | |
| | | | | | | | | | | | |
Net cash provided by operating activities | | | 10,178,000 | | | | 4,666,000 | | | | 1,508,000 | |
| | | | | | | | | | | | |
Cash Flows From Investing Activities: | | | | | | | | | | | | |
Purchase of Real Time Systems Inc., net of cash received | | | (4,472,000 | ) | | | — | | | | — | |
Purchase of property, plant and equipment, continuing operations | | | (1,610,000 | ) | | | (837,000 | ) | | | (971,000 | ) |
Purchase of property, plant and equipment, discontinued operations | | | (73,000 | ) | | | (112,000 | ) | | | (23,000 | ) |
Net proceeds from sale of discontinued operations | | | 5,078,000 | | | | — | | | | — | |
| | | | | | | | | | | | |
Net cash used in investing activities | | | (1,077,000 | ) | | | (949,000 | ) | | | (994,000 | ) |
| | | | | | | | | | | | |
Cash Flows From Financing Activities: | | | | | | | | | | | | |
Exercise of stock options | | | — | | | | 403,000 | | | | 412,000 | |
Tax benefits on stock options exercised | | | 53,000 | | | | 1,288,000 | | | | — | |
Payment for fractional shares (3-for-2 stock split) | | | (5,000 | ) | | | — | | | | — | |
| | | | | | | | | | | | |
Net cash provided by financing activities | | | 48,000 | | | | 1,691,000 | | | | 412,000 | |
| | | | | | | | | | | | |
Net increase in cash | | | 9,149,000 | | | | 5,408,000 | | | | 926,000 | |
Cash and cash equivalents at beginning of year | | | 9,988,000 | | | | 4,580,000 | | | | 3,654,000 | |
| | | | | | | | | | | | |
Cash and cash equivalents at end of year | | $ | 19,137,000 | | | $ | 9,988,000 | | | $ | 4,580,000 | |
| | | | | | | | | | | | |
Supplemental disclosure of cash flow information: | | | | | | | | | | | | |
Cash transactions: | | | | | | | | | | | | |
Income taxes paid | | $ | 6,767,000 | | | $ | 4,824,000 | | | $ | 1,513,000 | |
Non-cash transactions: | | | | | | | | | | | | |
Transfer of inventory to property, plant and equipment | | $ | — | | | $ | — | | | $ | 88,000 | |
See Note 2 to Consolidated Financial Statements for allocation of RTS purchase price.
See Notes to Consolidated Financial Statements.
F-6
Bolt Technology Corporation and Subsidiaries
Notes To Consolidated Financial Statements
Note 1—Description of Business and Significant Accounting Policies
The Company consists of three operating units: Bolt Technology Corporation (“Bolt”), A-G Geophysical Products, Inc. (“A-G”) and Real Time Systems Inc. (“RTS”), which was acquired on July 1, 2007 (see Note 2 to Consolidated Financial Statements). Bolt, A-G and RTS are in the oilfield services equipment business. Bolt develops, manufactures and sells marine seismic energy sources (air guns) and replacement parts; A-G develops, manufactures and sells underwater cables, connectors, hydrophones and seismic source monitoring systems; and RTS develops, manufactures and sells air gun controllers/synchronizers, data loggers and auxiliary equipment.
On May 31, 2008, substantially all of the assets of Custom Products Corporation (“Custom”), a wholly owned subsidiary of Bolt, were sold. Custom, a developer, manufacturer and seller of miniature industrial clutches and brakes and seller of sub-fractional horsepower electrical motors, formerly comprised the Company’s “industrial products” segment. Custom was the only operating unit in the industrial products segment; therefore, due to the sale of Custom, the Company now operates only in the oilfield services equipment business (formerly referred to as the “geophysical equipment” segment). In the Consolidated Financial Statements, amounts relating to Custom have been reported as discontinued operations in fiscal year 2008 and prior fiscal year information relating to Custom has been restated as discontinued operations. See Note 3 to Consolidated Financial Statements for additional information concerning discontinued operations.
On November 20, 2007, the Company’s Board of Directors approved a 3-for-2 stock split. The additional shares resulting from the stock split were distributed on January 30, 2008 to shareholders of record on January 16, 2008. Share and per share amounts reflected throughout the Consolidated Financial Statements and notes thereto have been restated to reflect the stock split.
Principles of Consolidation:
The Consolidated Financial Statements include the accounts of Bolt and its subsidiary companies. All significant intercompany balances and transactions have been eliminated.
Cash and Cash Equivalents:
The Company considers all highly liquid investments with a maturity of three months or less when purchased to be cash equivalents.
Allowance for Uncollectible Accounts:
The allowance for uncollectible accounts is established through a provision for bad debts charged to expense. Accounts receivable are charged against the allowance for uncollectible accounts when the Company believes that collectibility of the principal is unlikely. The allowance is an amount that the Company believes will be adequate to absorb estimated losses on existing accounts receivable balances based on the evaluation of their collectibility and prior bad debt experience. This evaluation also takes into consideration such factors as changes in the nature and volume of the accounts receivable, overall quality of accounts receivable, review of specific problem accounts receivable, and current economic and industry conditions that may affect customers’ ability to pay. While the Company uses the best information available to make its evaluation, future adjustments to the allowance may be necessary if there are significant changes in economic and industry conditions or any other factors considered in the Company’s evaluation. The allowance for uncollectible accounts balance and activity information is presented in Schedule II-Valuation and Qualifying Accounts for the Three Years Ended June 30, 2008.
F-7
Bolt Technology Corporation and Subsidiaries
Notes To Consolidated Financial Statements—(Continued)
Inventories:
Inventories are valued at the lower of cost or market, with cost principally determined on an average cost method that approximates the first-in, first-out method. The Company maintains an inventory valuation reserve to provide for slow moving and obsolete inventory. Amounts are charged to the reserve when the Company scraps or disposes of inventory. See Note 6 to Consolidated Financial Statements for additional information concerning inventories.
Property, Plant and Equipment:
Property, plant and equipment are stated at cost. Depreciation for financial accounting purposes is computed using the straight-line method over the estimated useful lives of 40 years for buildings, over the shorter of the term of the lease or the estimated useful life for leasehold improvements, and 5 to 10 years for machinery and equipment. Major improvements which add to the productive capacity or extend the life of an asset are capitalized, while repairs and maintenance are charged to expense as incurred. See Note 7 to Consolidated Financial Statements for additional information concerning property, plant and equipment.
Goodwill and Other Long-Lived Assets:
Goodwill represents the unamortized excess cost over the value of net assets acquired in business combinations. As required by SFAS No. 142, “Goodwill and Other Intangible Assets,” the Company tests goodwill for impairment annually or more frequently if impairment indicators arise. Step one of the goodwill impairment test is to compare the “fair value” of the reporting unit with its “carrying amount.” The fair value of a reporting unit is the amount that a willing party would pay to buy or sell the unit other than in a forced liquidation sale. The carrying amount of a reporting unit is total assets, including goodwill, minus total liabilities. If the fair value of a reporting unit is greater than the carrying amount, the Company considers goodwill not to be impaired. If the fair value is below the carrying amount, the Company would proceed to the next step, which is to measure the impairment loss. Any such impairment loss would be recognized in the Company’s results of operations in the period in which the impairment loss arose. Goodwill was tested for impairment as of July 1, 2008 and 2007, and the tests indicated no impairment of the goodwill balances at June 30, 2008 and 2007.
The Company’s approach to determining the fair value of the A-G and RTS reporting units was based on two different valuation methods: (a) a capitalized cash flow method which relies on historical financial performance, an estimate of the long-term growth rate in free cash flows and a determination of the weighted average cost of capital of each reporting unit and (b) a market price method that gives consideration to the prices paid for publicly traded stocks.
The estimated fair values of the A-G and RTS reporting units were determined utilizing each of the above methods, and the valuation methods were analyzed as indicators of value. Based on the foregoing, the Company determined that there was no impairment as of July 1, 2008 and 2007.
The Company’s other long-lived assets consist of property, plant and equipment, other intangible assets and other non-current assets. The Company reviews for the impairment of these assets whenever events or changes in circumstances indicate that the carrying amount of an asset may not be recoverable. The carrying amount is considered impaired when anticipated undiscounted cash flows expected to result from the use of the asset and its eventual disposition is less than its carrying amount. The Company’s reviews as of June 30, 2008 and 2007 did not result in any indicators of impairment, and therefore no impairment tests were performed on these other long-lived assets.
F-8
Bolt Technology Corporation and Subsidiaries
Notes To Consolidated Financial Statements—(Continued)
See Notes 2, 4 and 5 to Consolidated Financial Statements for additional information concerning goodwill and other intangible assets.
Revenue Recognition and Warranty Costs:
The Company recognizes sales revenue when it is realized and earned. The Company’s reported sales revenue is based on meeting the following criteria: (1) manufacturing products based on customer specifications; (2) delivering product to the customer before the close of the reporting period, whereby delivery results in the transfer of ownership risk to the customer; (3) establishing a set sales price with the customer; (4) collecting the sales revenue from the customer is reasonably assured; and (5) no contingencies exist.
Warranty costs and product returns incurred by the Company have not been significant.
Income Taxes:
The provision for income taxes is determined under the liability method. Deferred tax assets and liabilities are recognized based on differences between the book and tax bases of assets and liabilities using currently enacted tax rates. The provision for income taxes is the sum of the amount of income tax paid or payable for the year determined by applying the provisions of enacted tax laws to the taxable income for that year and the net change during the year in the Company’s deferred tax assets and liabilities. See Note 8 to Consolidated Financial Statements for additional information concerning the provision for income taxes and deferred tax accounts.
Use of Estimates:
The preparation of financial statements in conformity with accounting principles generally accepted in the United States requires management to make estimates and assumptions that affect the reported amounts of assets and liabilities and disclosure of contingent assets and liabilities at the date of financial statements, and the reported amounts of revenues and expenses during the reporting period. The most critical estimates made by the Company are those relating to inventory valuation reserves, goodwill impairment and the realization of deferred tax assets. Actual results could differ from those estimates.
F-9
Bolt Technology Corporation and Subsidiaries
Notes To Consolidated Financial Statements—(Continued)
Computation of Earnings Per Share:
Basic earnings per share is computed by dividing net income by the average number of common shares outstanding during the period. Diluted earnings per share is computed by dividing net income by the average number of common shares outstanding including common share equivalents (which includes stock option grants and restricted stock awards) assuming dilution. The following is a reconciliation of basic earnings per share to diluted earnings per share for each of the last three years:
| | | | | | | | | |
| | | Years Ended June 30, |
| | | 2008 | | 2007 | | 2006 |
Income from continuing operations | | $ | 13,709,000 | | $ | 9,999,000 | | $ | 4,407,000 |
Discontinued operations | | | 860,000 | | | 608,000 | | | 438,000 |
| | | | | | | | | |
Net income | | $ | 14,569,000 | | $ | 10,607,000 | | $ | 4,845,000 |
| | | | | | | | | |
Divided by: | | | | | | | | | |
Weighted average common shares | | | 8,581,491 | | | 8,415,689 | | | 8,196,399 |
Weighted average common share equivalents | | | 5,027 | | | 107,860 | | | 249,752 |
| | | | | | | | | |
Total weighted average common shares and common share equivalents | | | 8,586,518 | | | 8,523,549 | | | 8,446,151 |
| | | | | | | | | |
Earnings per share—basic: | | | | | | | | | |
Income from continuing operations | | $ | 1.60 | | $ | 1.19 | | $ | 0.54 |
Discontinued operations, net of income taxes | | | 0.10 | | | 0.07 | | | 0.05 |
| | | | | | | | | |
Net income | | $ | 1.70 | | $ | 1.26 | | $ | 0.59 |
| | | | | | | | | |
Earnings per share—diluted: | | | | | | | | | |
Income from continuing operations | | $ | 1.60 | | $ | 1.17 | | $ | 0.52 |
Discontinued operations | | | 0.10 | | | 0.07 | | | 0.05 |
| | | | | | | | | |
Net income | | $ | 1.70 | | $ | 1.24 | | $ | 0.57 |
| | | | | | | | | |
For the fiscal years ended June 30, 2008 and 2007, the calculations do not include options to acquire 54,750 and 27,000 shares, respectively, since the inclusion of these shares would have been anti-dilutive.
Recent Accounting Developments:
Business Combinations
In December 2007, the FASB issued SFAS No. 141 (revised 2007), “Business Combinations” (“SFAS 141(R)”), which is a revision of SFAS 141. SFAS 141(R) continues to require the purchase method of accounting for business combinations and the identification and recognition of intangible assets separately from goodwill. SFAS 141(R) requires, among other things, the buyer to: (1) fair value assets and liabilities acquired as of the acquisition date (i.e., a “fair value” model rather than a “cost allocation” model); (2) expense acquisition-related costs; (3) recognize assets or liabilities assumed arising from contractual contingencies at acquisition date using acquisition-date fair values; (4) recognize goodwill as the excess of the consideration transferred plus the fair value of any noncontrolling interest over the acquisition-date fair value of net assets acquired; (5) recognize at acquisition any contingent consideration using acquisition-date fair values (i.e., fair value earn-outs in the initial accounting for the acquisition); and (6) eliminate the recognition of liabilities for restructuring costs expected to be incurred as a result of the business combination. SFAS 141(R) also defines a “bargain” purchase as a business combination where the total acquisition-date fair value of the identifiable net assets acquired exceeds the fair
F-10
Bolt Technology Corporation and Subsidiaries
Notes To Consolidated Financial Statements—(Continued)
value of the consideration transferred plus the fair value of any noncontrolling interest. Under this circumstance, the buyer is required to recognize such excess (formerly referred to as “negative goodwill”) in earnings as a gain. In addition, if the buyer determines that some or all of its previously booked deferred tax valuation allowance is no longer needed as a result of the business combination, SFAS 141(R) requires that the reduction or elimination of the valuation allowance be accounted as a reduction of income tax expense. SFAS 141(R) is effective for fiscal years beginning on or after December 15, 2008. The Company will apply SFAS 141(R) to any acquisitions that are made on or after July 1, 2009.
The Fair Value Option for Financial Assets and Financial Liabilities Including an Amendment of FASB Statement No. 115
In February 2007, the FASB issued SFAS No. 159, “The Fair Value Option for Financial Assets and Financial Liabilities Including an Amendment of FASB Statement No. 115” (“SFAS 159”). SFAS 159 permits companies to measure many financial instruments and certain other items at fair value. SFAS 159 is effective as of the beginning of the Company’s first fiscal year that begins after November 15, 2007. The Company believes that SFAS 159 will not have an impact on the Company’s consolidated financial statements.
Fair Value Measurements
In September 2006, the FASB issued SFAS No. 157, “Fair Value Measurements” (“SFAS 157”), which establishes a framework for measuring fair value under generally accepted accounting principles, and expands disclosures about fair value measurements. SFAS 157 does not require new fair value measurements. The purpose of SFAS 157 is to provide a single definition of fair value and to provide additional guidance relative to fair value measurements. The end result of SFAS 157 application will be consistency and comparability in fair value measurements. SFAS 157 is effective for fiscal years beginning after November 15, 2007. The Company believes that it is unlikely that SFAS 157 will have any impact on the Company’s consolidated financial statements because the Company does not deal in transactions requiring complex fair value measurements.
Note 2—Real Time Systems Inc. Acquisition
In July 2007, the Company acquired substantially all of the net assets of Real Time Systems Inc. (RTS) for $5,379,000 including cash paid at closing of $4,532,000, acquisition costs of $87,000 and $760,000 due as of June 30, 2008 under an “earnout agreement.” RTS develops, manufactures and sells airgun controllers and synchronizers for seismic energy sources (air guns). RTS products are designed to control and synchronize up to 96 air guns in a single seismic exploration vessel. Effective July 1, 2007, the operations of RTS were included in the Company’s Consolidated Financial Statements.
The earnout agreement provides that additional payments are due if RTS’s net sales in each of fiscal years 2008 and 2009 are in excess of $2,000,000. Such payments are calculated at 33% of net sales, in each year, in excess of $2,000,000 but less than $2,500,000, and 20% of net sales, in each year, in excess of $2,500,000. Amounts earned under the earnout agreement are added to goodwill.
The purchase price allocation, including the earnout due as of June 30, 2008, is as follows:
| | | |
Net current assets, including cash of $147,000 | | $ | 925,000 |
Property and equipment | | | 91,000 |
Goodwill | | | 2,651,000 |
Other intangible assets | | | 1,712,000 |
| | | |
| | $ | 5,379,000 |
| | | |
F-11
Bolt Technology Corporation and Subsidiaries
Notes To Consolidated Financial Statements—(Continued)
See Notes 4 and 5 to Consolidated Financial Statements for additional information concerning RTS goodwill and other intangible assets, respectively.
The following table summarizes, on an unaudited pro forma basis, the consolidated results of operations of the Company for the fiscal year ended June 30, 2007, assuming the acquisition of RTS was made on July 1, 2006.
| | | |
Sales | | $ | 52,161,000 |
| | | |
Income from continuing operations | | $ | 11,554,000 |
Income from discontinued operations | | | 608,000 |
| | | |
Net income | | $ | 12,162,000 |
| | | |
Earnings per share—basic: | | | |
Income from continuing operations | | $ | 1.37 |
Income from discontinued operations | | | 0.07 |
| | | |
Net income | | $ | 1.44 |
| | | |
Earnings per share—diluted: | | | |
Income from continuing operations | | $ | 1.36 |
Income from discontinued operations | | | 0.07 |
| | | |
Net income | | $ | 1.43 |
| | | |
The foregoing unaudited pro forma results are for informational purposes only and are not necessarily indicative of the actual results of operations that might have occurred had the acquisition of RTS been consummated on July 1, 2006, nor are they necessarily indicative of results in the future.
Note 3—Discontinued Operations
Effective May 31, 2008, the Company sold substantially all of the assets of its wholly-owned subsidiary, Custom Products Corporation (“Custom”), for $5,250,000, subject to adjustments for certain liabilities. Custom, a developer, manufacturer and seller of miniature industrial clutches and brakes and seller of sub-fractional horsepower electrical motors, formerly comprised the Company’s industrial products segment. Net cash proceeds were $5,078,000 after expenses associated with the disposition ($88,000) and adjustments for liabilities. The Company recorded a pre-tax gain of $473,000 ($285,000 net of tax) relating to this transaction.
The following amounts relating to Custom’s operations have been reported as discontinued operations in the consolidated statements of income for the three years ended June 30:
| | | | | | | | | |
| | | 2008 | | 2007 | | 2006 |
Net sales | | $ | 3,448,000 | | $ | 3,535,000 | | $ | 3,198,000 |
| | | | | | | | | |
Income from discontinued operations before income taxes | | $ | 926,000 | | $ | 897,000 | | $ | 671,000 |
Income taxes | | | 351,000 | | | 289,000 | | | 233,000 |
| | | | | | | | | |
Income from discontinued operations | | $ | 575,000 | | $ | 608,000 | | $ | 438,000 |
| | | | | | | | | |
See Note 1 to Consolidated Financial Statements for information regarding earnings per share, including earnings per share data relating to income from discontinued operations, net of taxes and the gain on sale of discontinued operations, net of taxes.
F-12
Bolt Technology Corporation and Subsidiaries
Notes To Consolidated Financial Statements—(Continued)
The consolidated balance sheet at June 30, 2007 has been restated to classify Custom’s assets and liabilities separately from assets and liabilities of continuing operations. These include: “current assets of discontinued operations” of $1,065,000, primarily consisting of accounts receivable and inventory; “long-term assets of discontinued operations” of $3,439,000, primarily consisting of goodwill; and “current liabilities of discontinued operations” of $110,000, primarily consisting of employee benefits.
The consolidated statements of cash flows reflect discontinued operations for all periods presented.
Note 4—Goodwill
The Company’s goodwill carrying amounts relate solely to the acquisitions of A-G in fiscal year 1999 and RTS in fiscal year 2008, which are two SFAS No. 142 reporting units. Bolt, the parent of A-G and RTS, is a third reporting unit and has no goodwill.
The composition of the net goodwill balance at June 30 is as follows:
| | | | | | |
| | | 2008 | | 2007 |
A-G | | $ | 7,679,000 | | $ | 7,679,000 |
RTS | | | 2,651,000 | | | — |
| | | | | | |
| | $ | 10,330,000 | | $ | 7,679,000 |
| | | | | | |
Goodwill represents approximately 17% of the Company’s total assets at June 30, 2008 and thus the evaluation of goodwill impairment is a significant estimate by management. Even if management’s estimate were incorrect, it would not result in a cash outlay because the goodwill amounts arose out of acquisition accounting.
See Notes 1 and 2 to Consolidated Financial Statements for additional information concerning goodwill.
Note 5—Other Intangible Assets
Other intangible assets at June 30, 2008 in the gross amount of $1,712,000 represent the intangible assets acquired in the purchase of RTS. The major portion of these assets ($1,487,000) is being amortized using the straight-line method over a period of six to nine and one-half years. Amortization cost recorded in the fiscal year ended June 30, 2008 amounted to $240,000. Other intangible asset amortization over the next five years is estimated to be $240,000 per year ($60,000 per quarter).
See Note 2 to Consolidated Financial Statements for additional information concerning RTS intangible assets.
Note 6—Inventories
Inventories at June 30 consist of the following:
| | | | | | | | |
| | | 2008 | | | 2007 | |
Raw materials and sub-assemblies | | $ | 13,849,000 | | | $ | 11,087,000 | |
Work-in-process | | | 1,436,000 | | | | 718,000 | |
| | | | | | | | |
| | | 15,285,000 | | | | 11,805,000 | |
Less-Reserve for inventory valuation | | | (406,000 | ) | | | (524,000 | ) |
| | | | | | | | |
| | $ | 14,879,000 | | | $ | 11,281,000 | |
| | | | | | | | |
F-13
Bolt Technology Corporation and Subsidiaries
Notes To Consolidated Financial Statements—(Continued)
A significant source of the Company’s revenue arises from the sale of replacement parts required by customers who have previously purchased products. As a result, the Company maintains a large quantity of parts on hand that may not be sold or used in final assemblies for an extended period of time. In order to recognize that certain inventory may become obsolete or that the Company may have supplies in excess of reasonably supportable sales forecasts, an inventory valuation reserve has been established. The inventory valuation reserve is a significant estimate made by management. Actual results may differ from this estimate, and the difference could be material.
Management establishes the inventory valuation reserve by reviewing the inventory for items that should be reserved in full based on a lack of usage for a specified period of time and for which future demand is not forecasted and establishes an additional reserve for slow moving inventory based on varying percentages of the cost of the items. The reserve for inventory valuation at June 30, 2008 and 2007 was $406,000 and $524,000, respectively. At June 30, 2008 and 2007, approximately $1,247,000 and $1,401,000, respectively, of the raw materials and sub-assemblies inventory were considered slow moving and subject to a reserve provision equal to all or a portion of the cost, less an estimate for scrap value. In certain instances, this inventory has been unsold for more than five years from date of manufacture or purchase, and in other instances the Company has more than a five-year supply of inventory on hand based on recent sales volume. At June 30, 2008, the cost of inventory for which the Company has more than a five-year supply on hand and the cost of inventory for which the Company has had no sales during the last five years amounted to approximately $780,000. Management believes that this inventory is properly valued and appropriately reserved. Even if management’s estimate were incorrect, that would not result in a cash outlay since the cash required to manufacture or purchase the older inventory was expended in prior years.
The inventory valuation reserve is adjusted at the close of each accounting period, as necessary, based on management’s estimate of the valuation reserve required. This estimate is calculated on a consistent basis as determined by the Company’s inventory valuation policy. Increases to the inventory valuation reserve result in a charge to cost of sales, and decreases to the reserve result in a credit to cost of sales. The inventory valuation reserve is also decreased when items are scrapped or disposed of. During the fiscal year ended June 30, 2008, the inventory valuation reserve was decreased by $118,000, and the Company did not scrap or dispose of any items.
Note 7—Property, Plant and Equipment
Property, plant and equipment at June 30 consist of the following:
| | | | | | | | |
| | | 2008 | | | 2007 | |
Land | | $ | 253,000 | | | $ | 253,000 | |
Buildings | | | 1,114,000 | | | | 1,029,000 | |
Leasehold improvements | | | 495,000 | | | | 381,000 | |
Machinery and equipment | | | 8,843,000 | | | | 7,547,000 | |
| | | | | | | | |
| | | 10,705,000 | | | | 9,210,000 | |
Less—accumulated depreciation | | | (6,374,000 | ) | | | (6,154,000 | ) |
| | | | | | | | |
| | $ | 4,331,000 | | | $ | 3,056,000 | |
| | | | | | | | |
F-14
Bolt Technology Corporation and Subsidiaries
Notes To Consolidated Financial Statements—(Continued)
Note 8—Income Taxes
Income tax expense consists of the following for the three years ended June 30:
| | | | | | | | | | | |
| | | 2008 | | | 2007 | | | 2006 |
Current: | | | | | | | | | | | |
Federal | | $ | 6,507,000 | | | $ | 4,732,000 | | | $ | 2,064,000 |
State | | | (111,000 | ) | | | 28,000 | | | | 166,000 |
Deferred: | | | | | | | | | | | |
Federal | | | 57,000 | | | | (26,000 | ) | | | 98,000 |
State | | | — | | | | 24,000 | | | | 24,000 |
| | | | | | | | | | | |
Income tax expense | | $ | 6,453,000 | | | $ | 4,758,000 | | | $ | 2,352,000 |
| | | | | | | | | | | |
A reconciliation of the federal statutory rate to the effective tax rate reflected in the total provision for income taxes is as follows:
| | | | | | | | | |
| | | Years Ended June 30, | |
| | | 2008 | | | 2007 | | | 2006 | |
Statutory rate | | 35 | % | | 35 | % | | 34 | % |
State income taxes, net of federal tax benefit | | — | | | — | | | 2 | |
Nondeductible expenses | | — | | | — | | | 1 | |
Exempt income from domestic production activities and foreign sales | | (2 | ) | | (2 | ) | | (2 | ) |
Other | | (1 | ) | | (1 | ) | | — | |
| | | | | | | | | |
Effective rate | | 32 | % | | 32 | % | | 35 | % |
| | | | | | | | | |
Deferred income taxes under the liability method reflect the net tax effects of temporary differences between the carrying amounts of assets and liabilities for financial reporting purposes and the amounts used for income tax purposes. Components of the Company’s net deferred income tax asset and liability accounts for continuing operations were as follows at June 30:
| | | | | | | |
| | | 2008 | | | 2007 |
Net deferred tax asset-current: | | | | | | | |
Inventory valuation reserve | | $ | 158,000 | | | $ | 204,000 |
Allowance for uncollectible accounts | | | 32,000 | | | | 24,000 |
| | | | | | | |
Total | | $ | 190,000 | | | $ | 228,000 |
| | | | | | | |
Net deferred tax asset-noncurrent (included in other assets): | | | | | | | |
Stock options and restricted stock | | $ | 47,000 | | | $ | 14,000 |
Amortization of intangible assets | | | 49,000 | | | | — |
Property, plant and equipment depreciation | | | 52,000 | | | | 99,000 |
Amortization of goodwill | | | (54,000 | ) | | | — |
| | | | | | | |
Total | | $ | 94,000 | | | $ | 113,000 |
| | | | | | | |
Effective July 1, 2007, the Company adopted FASB Interpretation No. 48 (“FIN 48”), “Accounting for Uncertainty in Income Taxes.” Adoption of FIN 48 requires the Company to review all open tax years in all tax jurisdictions to determine if there are any uncertain income tax positions that require recognition in the
F-15
Bolt Technology Corporation and Subsidiaries
Notes To Consolidated Financial Statements—(Continued)
Company’s financial statements, including any penalties and interest, based on the “more-likely-than-not” criterion. Based on its review, the Company has concluded that there were no significant income tax positions that would require the providing of additional income taxes or the recognition of any tax benefit in the Company’s financial statements at June 30, 2008. There were no unallocated tax reserves at June 30, 2008. The Company’s policy is to record any interest and penalties as a component of income tax expense. The Company’s federal income tax returns for fiscal years prior to 2005 are no longer subject to examination by the Internal Revenue Service.
Note 9—Benefit Plan
The Company maintains a defined contribution retirement plan (the “Retirement Plan”) covering substantially all employees who satisfy the age and service requirements of the Retirement Plan. The Company’s contributions to the Retirement Plan are discretionary and for the years ended June 30, 2008, 2007 and 2006 amounted to $177,000, $142,000 and $119,000, respectively.
Note 10—Stock Options and Restricted Stock
Effective July 1, 2005, the Company adopted SFAS 123 (Revised 2004), “Share Based Payment” (“SFAS 123 (R)”). Accordingly, the Company recognizes compensation costs for all share-based payments granted subsequent to July 1, 2005, based on the grant-date fair value estimated in accordance with the provisions of SFAS 123 (R).
The Company receives a tax deduction for certain stock option exercises when the options are exercised, generally for the excess of the fair market value over the exercise price of the option. In accordance with SFAS 123 (R), the Consolidated Statements of Cash Flows reports tax benefits from the exercise of stock options as financing cash flows.
All share amounts in the following paragraphs and table have been adjusted to reflect the 3-for-2 stock split paid on January 30, 2008 to shareholders of record on January 16, 2008.
The Bolt Technology Corporation Amended and Restated 2006 Stock Option and Restricted Stock Plan (the “Plan”) was approved by the Company’s stockholders at the November 20, 2007 Annual Meeting of Stockholders. The Plan amends and restates the Bolt Technology Corporation 2006 Stock Option Plan. The Plan provides that of the 750,000 shares of Common Stock that may be used for awards under the Plan, up to 225,000 shares of Common Stock may be used for restricted stock awards. Options granted to employees can become vested over, and can be exercisable for, a period of up to ten years. The Plan also provides that each non-employee director is granted options to purchase 7,500 shares of Common Stock on the date of his or her election to the Board of Directors. Each such option granted to a non-employee director has an option term of five years from the date of grant and is exercisable with respect to 25% of the shares covered under the option in each of the second through fifth years of its term. Under the terms of the Plan, no options can be granted subsequent to June 30, 2016.
The aggregate compensation expense for stock options, using the Black-Scholes option-pricing model, for outstanding grants under the Plan was $1,169,000 as of the option grant dates. This expense, which is a non-cash item, is being recognized in the Company’s financial statements over the four-year vesting period. During the fiscal year ended June 30, 2008, $157,000 of stock option compensation expense was recognized. Unrecognized compensation expense for stock options at June 30, 2008 amounted to $956,000 and is expected to be recognized over the next five years.
F-16
Bolt Technology Corporation and Subsidiaries
Notes To Consolidated Financial Statements—(Continued)
A summary of changes in stock options during the fiscal year ended June 30, 2008 is as follows:
| | | | | | | | | | | |
| | | Shares | | | Weighted
Average
Exercise
Price | | Weighted
Average
Fair Value
at Grant Date | | Weighted
Average
Contractual Life |
Options outstanding at June 30, 2007 | | 64,500 | | | $ | 18.82 | | | — | | 4.6 years |
Granted | | 46,500 | | | $ | 21.58 | | $ | 11.30 | | 4.5 years |
Exercised | | — | | | | — | | | — | | — |
Cancelled | | (3,000 | ) | | $ | 28.48 | | | — | | — |
| | | | | | | | | | | |
Options outstanding at June 30, 2008 | | 108,000 | | | $ | 19.74 | | | — | | 4.4 years |
| | | | | | | | | | | |
During the fiscal year ended June 30, 2008, stock option grants were awarded in November 2007 (7,500 shares), January 2008 (15,750 shares) and June 2008 (23,250 shares). The fair value of options granted on these dates were $13.51, $9.43 and $11.85, respectively, as estimated on the dates of grant using the Black-Scholes option-pricing model with the following assumptions:
| | | | | | | | | |
| | | Stock Option Grant Dates | |
| | | 11/2007 | | | 01/2008 | | | 06/2008 | |
Expected dividend yield | | 0 | % | | 0 | % | | 0 | % |
Expected stock price volatility | | 57 | % | | 56 | % | | 59 | % |
Risk-free interest rate | | 3.52 | % | | 2.70 | % | | 3.38 | % |
Expected life (years) | | 5 | | | 5 | | | 5 | |
The aggregate intrinsic value (market price at June 30, 2008 less the weighted average exercise price) of outstanding stock options at June 30, 2008 was $306,000. The expiration dates for the outstanding options at June 30, 2008 are: 37,500 shares in November 2011, 24,000 shares in April 2012, 7,500 shares in November 2012, 15,750 shares in January 2013 and 23,250 shares in June 2013. Options outstanding at June 30, 2008, of which 15,375 shares were exercisable, consisted of 47,145 non-qualified and 60,855 qualified stock options.
The fair value of shares vested during fiscal year 2008 was approximately $352,000. No shares vested during fiscal years 2007 and 2006. The intrinsic value of options exercised during fiscal years 2007 and 2006 was approximately $5,279,000 and $1,269,000, respectively. No shares were exercised during fiscal year 2008. The weighted average exercise price of exercisable shares as of June 30, 2008 was $18.34; the aggregate intrinsic value of exercisable shares at June 30, 2008 was approximately $65,000; and the weighted average remaining contractual life of exercisable shares at June 30, 2008 was 3.6 years.
In January 2008, 36,750 shares of restricted stock were granted. These shares vest over a five year period and the cost to recipients is zero. These were the only restricted shares granted under the Plan during the fiscal year ended June 30, 2008. The aggregate compensation cost for restricted stock was $686,000 as of the grant date. This expense, which is a non-cash item, is being recognized in the Company’s financial statements over the five-year vesting period. During the fiscal year ended June 30, 2008, $57,000 of restricted stock compensation expense was recognized. Unrecognized compensation expense for restricted stock at June 30, 2008 amounted to $629,000.
F-17
Bolt Technology Corporation and Subsidiaries
Notes To Consolidated Financial Statements—(Continued)
Note 11—Stockholders’ Equity
Changes in issued Common Stock and Stockholders’ Equity for each of the three years ended June 30, 2008, 2007 and 2006 were as follows:
| | | | | | | | | | | | | | | |
| | | Common Stock | | | Retained Earnings
(Accumulated Deficit) | | | Total | |
| | | Shares * | | | Amount | | | |
Balance June 30, 2005 | | 8,135,940 | | | $ | 26,176,000 | | | $ | (3,101,000 | ) | | $ | 23,075,000 | |
Exercise of stock options, net of 3,090 shares tendered for payment | | 205,089 | | | | 412,000 | | | | — | | | | 412,000 | |
Income from continuing operations | | — | | | | — | | | | 4,407,000 | | | | 4,407,000 | |
Income from discontinued operations | | — | | | | — | | | | 438,000 | | | | 438,000 | |
| | | | | | | | | | | | | | | |
Balance June 30, 2006 | | 8,341,029 | | | | 26,588,000 | | | | 1,744,000 | | | | 28,332,000 | |
Exercise of stock options, net of 8,715 shares tendered for payment | | 240,569 | | | | 403,000 | | | | — | | | | 403,000 | |
Stock based compensation expense | | — | | | | 56,000 | | | | — | | | | 56,000 | |
Tax benefit on stock options exercised | | — | | | | 1,288,000 | | | | — | | | | 1,288,000 | |
Income from continuing operations | | — | | | | — | | | | 9,999,000 | | | | 9,999,000 | |
Income from discontinued operations | | — | | | | — | | | | 608,000 | | | | 608,000 | |
| | | | | | | | | | | | | | | |
Balance June 30, 2007 | | 8,581,598 | | | | 28,335,000 | | | | 12,351,000 | | | | 40,686,000 | |
Restricted stock grants | | 36,750 | | | | — | | | | — | | | | — | |
Stock based compensation expense | | — | | | | 214,000 | | | | — | | | | 214,000 | |
Tax benefit on stock options exercised | | — | | | | 53,000 | | | | — | | | | 53,000 | |
Payment for fractional shares (3-for-2 stock split) | | (255 | ) | | | (5,000 | ) | | | — | | | | (5,000 | ) |
Income from continuing operations | | — | | | | — | | | | 13,709,000 | | | | 13,709,000 | |
Income from discontinued operations | | — | | | | — | | | | 575,000 | | | | 575,000 | |
Gain on sale of discontinued operations | | — | | | | — | | | | 285,000 | | | | 285,000 | |
| | | | | | | | | | | | | | | |
Balance June 30, 2008 | | 8,618,093 | | | $ | 28,597,000 | | | $ | 26,920,000 | | | $ | 55,517,000 | |
| | | | | | | | | | | | | | | |
| * | Adjusted for 3-for-2 stock split effective January 16, 2008. |
Note 12—Commitments and Contingencies
Concentration of Credit Risk:
Financial instruments which potentially subject the Company to concentrations of credit risk are primarily cash and cash equivalents and trade accounts receivable. The Company believes that the concentration of credit risk in its trade receivables is substantially mitigated by the Company’s ongoing credit evaluation and its short collection terms. The Company does not generally require collateral from its customers but, in certain cases, the Company does require the customer to provide a letter of credit or an advance payment. In limited cases, the Company will grant customers extended payment terms of up to 12 months. The Company establishes an allowance for uncollectible accounts based upon factors surrounding the credit risk of specific customers. Historically, the Company has not incurred significant credit related losses. The Company invests its excess cash in time deposits with maturities of less than three months in an effort to maintain safety and liquidity.
F-18
Bolt Technology Corporation and Subsidiaries
Notes To Consolidated Financial Statements—(Continued)
Financial Instruments:
The Company does not hold or issue financial instruments for trading or hedging purposes, nor does it hold interest rate, leveraged, or other types of derivative financial instruments. Fair values of accounts receivable, accounts payable, accrued expenses and income taxes payable reflected in the June 30, 2008 and 2007 balance sheets approximate carrying values at those dates.
Lease Commitments:
The following table presents the Company’s future minimum lease payments as of June 30, 2008 relating to its non-cancelable operating leases with terms in excess of one year:
| | | |
Years Ended June 30, | | Amount |
2009 | | $ | 348,000 |
2010 | | | 348,000 |
2011 | | | 348,000 |
2012 | | | 348,000 |
2013 | | | 174,000 |
| | | |
Total | | $ | 1,566,000 |
| | | |
Under such operating leases, rent expense amounted to $418,000, $334,000 and $329,000 for the years ended June 30, 2008, 2007 and 2006, respectively.
The Company’s current leases for its Norwalk, Connecticut office and manufacturing facilities expire in 2013.
Employment Severance Agreements:
The Company has a severance compensation plan for two executive officers of the Company, other than the president, which becomes operative upon their termination if such termination occurs within 24 months subsequent to a change in ownership of the Company, as defined in the plan.
The Company also has employment agreements with its president and the president of a subsidiary which provide for severance in the case of voluntary or involuntary termination following a change in control. These employment agreements each have terms through June 30, 2011, subject to extension as set forth in the agreements.
The aggregate maximum potential severance liability under the above-mentioned agreements approximates $5,400,000 at June 30, 2008. No amounts were due as of that date because no events had occurred which would have triggered payments under the severance compensation plan or severance payments under the employment agreements.
Litigation:
From time to time, the Company is a party to routine litigation and proceedings that are considered part of the ordinary course of its business. The Company is not aware of any material current or pending litigation.
F-19
Bolt Technology Corporation and Subsidiaries
Notes To Consolidated Financial Statements—(Continued)
Note 13—Segment and Customer Information
Since the sale of Custom effective May 31, 2008, the Company operates only in the oilfield services equipment business. Custom formerly operated in the “industrial products” segment and was the only operating unit in that segment. See Note 3 to Consolidated Financial Statements for additional information concerning discontinued operations.
The following table reports sales by country for the fiscal years ended June 30, 2008, 2007 and 2006 for continuing operations. Sales are attributed to each country based on the location of the customer. Total sales to all foreign countries for the fiscal years ended June 30, 2008, 2007 and 2006 were $49,544,000, $36,383,000 and $23,070,000, respectively.
| | | | | | | | | |
| | | 2008 | | 2007 | | 2006 |
Norway | | $ | 21,160,000 | | $ | 15,790,000 | | $ | 6,969,000 |
United States | | | 12,091,000 | | | 10,546,000 | | | 6,323,000 |
United Arab Emirates | | | 10,761,000 | | | 7,801,000 | | | 6,068,000 |
Peoples Republic of China | | | 4,294,000 | | | 2,227,000 | | | 2,486,000 |
France | | | 3,886,000 | | | 2,967,000 | | | 2,118,000 |
Japan | | | 3,117,000 | | | 496,000 | | | 613,000 |
United Kingdom | | | 2,827,000 | | | 1,395,000 | | | 686,000 |
India | | | 398,000 | | | 709,000 | | | 1,815,000 |
Other | | | 3,101,000 | | | 4,998,000 | | | 2,315,000 |
| | | | | | | | | |
| | $ | 61,635,000 | | $ | 46,929,000 | | $ | 29,393,000 |
| | | | | | | | | |
A relatively small number of customers has accounted for the Company’s sales. Customers accounting for 10% or more of consolidated sales for 2008, 2007 and 2006 are as follows:
| | | | | | | | | |
| | | 2008 | | | 2007 | | | 2006 | |
Customer A | | 17 | % | | 19 | % | | 15 | % |
Customer B | | 15 | | | 10 | | | 22 | |
Customer C | | 10 | | | 8 | | | 4 | |
Customer D | | 7 | | | 10 | | | 4 | |
Customer E | | 6 | | | 11 | | | 4 | |
Note 14—Accrued Expenses
Accrued expenses at June 30, 2008 and 2007 consist of the following:
| | | | | | |
| | | 2008 | | 2007 |
Compensation and related taxes | | $ | 1,243,000 | | $ | 1,479,000 |
Compensated absences | | | 353,000 | | | 344,000 |
Commissions payable | | | 427,000 | | | 454,000 |
RTS earnout payable | | | 760,000 | | | — |
Other | | | 262,000 | | | 288,000 |
| | | | | | |
| | $ | 3,045,000 | | $ | 2,565,000 |
| | | | | | |
F-20
Bolt Technology Corporation and Subsidiaries
Notes To Consolidated Financial Statements—(Continued)
Note 15—Credit Line
In May 2007, the Company entered into a $4,000,000 unsecured revolving credit facility with a bank to support general corporate purposes. The facility expires on May 31, 2010, and the Company has an option to extend the maturity date for one year periods. Borrowings bear interest based on LIBOR plus 1%. The unpaid principal is repayable on the earlier of an event of default or May 31, 2010, subject to extension. In addition, a commitment fee of 0.25% per year is payable based on the unused amount of the facility. The agreement requires, among other things, that the Company maintain certain financial covenants. During fiscal 2008 and 2007, there were no borrowings under this facility.
F-21
Bolt Technology Corporation and Subsidiaries
Notes To Consolidated Financial Statements—(Continued)
Note 16—Quarterly Results (unaudited)
The following table summarizes results for each of the four quarters in the fiscal years ended June 30, 2008 and 2007. This information differs from amounts previously reported on Form 10-Q filings for each of the six quarters ended September 30, 2006 through March 31, 2008 as a result of the restatements attributable to the sale of Custom Products Corporation (see Note 3 to Consolidated Financial Statements) and the 3-for-2 stock split (see Note 1 to Consolidated Financial Statements).
| | | | | | | | | | | | |
| | | Quarter Ended |
2008 | | Sept. 30 | | Dec. 31 | | March 31 | | June 30 |
Sales | | $ | 14,336,000 | | $ | 16,665,000 | | $ | 15,713,000 | | $ | 14,921,000 |
Gross profit | | | 6,635,000 | | | 7,221,000 | | | 6,989,000 | | | 7,626,000 |
Income from continuing operations | | $ | 3,295,000 | | $ | 3,503,000 | | $ | 3,219,000 | | $ | 3,692,000 |
Income from discontinued operations, net of taxes | | | 160,000 | | | 97,000 | | | 185,000 | | | 133,000 |
Gain on sale of discontinued operations, net of taxes | | | — | | | — | | | — | | | 285,000 |
| | | | | | | | | | | | |
Net income | | $ | 3,455,000 | | $ | 3,600,000 | | $ | 3,404,000 | | $ | 4,110,000 |
| | | | | | | | | | | | |
Earnings per share—basic: | | | | | | | | | | | | |
Income from continuing operations | | $ | 0.38 | | $ | 0.41 | | $ | 0.38 | | $ | 0.43 |
Income from discontinued operations | | | 0.02 | | | 0.01 | | | 0.02 | | | 0.02 |
Gain on sale of discontinued operations | | | — | | | — | | | — | | | 0.03 |
| | | | | | | | | | | | |
Net income per share | | $ | 0.40 | | $ | 0.42 | | $ | 0.40 | | $ | 0.48 |
| | | | | | | | | | | | |
Earnings per share—diluted: | | | | | | | | | | | | |
Income from continuing operations | | $ | 0.38 | | $ | 0.41 | | $ | 0.38 | | $ | 0.43 |
Income from discontinued operations | | | 0.02 | | | 0.01 | | | 0.02 | | | 0.02 |
Gain on sale of discontinued operations | | | — | | | — | | | — | | | 0.03 |
| | | | | | | | | | | | |
Net income per share | | $ | 0.40 | | $ | 0.42 | | $ | 0.40 | | $ | 0.48 |
| | | | | | | | | | | | |
| |
| | | Quarter Ended |
2007 | | Sept. 30 | | Dec. 31 | | March 31 | | June 30 |
Sales | | $ | 9,046,000 | | $ | 11,558,000 | | $ | 11,830,000 | | $ | 14,495,000 |
Gross profit | | | 4,099,000 | | | 5,135,000 | | | 5,646,000 | | | 6,702,000 |
Income from continuing operations | | $ | 1,793,000 | | $ | 2,309,000 | | $ | 2,686,000 | | $ | 3,211,000 |
Income from discontinued operations, net of taxes | | | 209,000 | | | 61,000 | | | 159,000 | | | 179,000 |
| | | | | | | | | | | | |
Net income | | $ | 2,002,000 | | $ | 2,370,000 | | $ | 2,845,000 | | $ | 3,390,000 |
| | | | | | | | | | | | |
Earnings per share—basic: | | | | | | | | | | | | |
Income from continuing operations | | $ | 0.22 | | $ | 0.27 | | $ | 0.32 | | $ | 0.38 |
Income from discontinued operations | | | 0.02 | | | 0.01 | | | 0.02 | | | 0.02 |
| | | | | | | | | | | | |
Net income per share | | $ | 0.24 | | $ | 0.28 | | $ | 0.34 | | $ | 0.40 |
| | | | | | | | | | | | |
Earnings per share—diluted: | | | | | | | | | | | | |
Income from continuing operations | | $ | 0.21 | | $ | 0.27 | | $ | 0.31 | | $ | 0.38 |
Income from discontinued operations | | | 0.02 | | | 0.01 | | | 0.02 | | | 0.02 |
| | | | | | | | | | | | |
Net income per share | | $ | 0.23 | | $ | 0.28 | | $ | 0.33 | | $ | 0.40 |
| | | | | | | | | | | | |
F-22
Bolt Technology Corporation and Subsidiaries
Schedule II—Valuation and Qualifying Accounts
For the Three Years Ended June 30, 2008
| | | | | | | | | | | | | | | | | |
| | | | | Additions | | | | | |
Description | | Balance At
Beginning Of
Year | | Charged
To
Costs And
Expenses | | | Charged
To
Other
Accounts | | Deductions | | | Balance At
End Of Year |
Allowance for uncollectible accounts: | | | | | | | | | | | | | | | | | |
2006 | | $ | 72,000 | | $ | 73,000 | | | $ | — | | $ | (52,000 | )(a) | | $ | 93,000 |
2007 | | | 93,000 | | | 98,000 | | | | — | | | (128,000 | )(a) | | | 63,000 |
2008 | | | 63,000 | | | 302,000 | | | | — | | | (284,000 | )(a) | | | 81,000 |
Reserve for inventory valuation: | | | | | | | | | | | | | | | | | |
2006 | | $ | 715,000 | | $ | 135,000 | | | $ | — | | $ | (345,000 | )(b) | | $ | 505,000 |
2007 | | | 505,000 | | | 19,000 | | | | — | | | — | | | | 524,000 |
2008 | | | 524,000 | | | (118,000 | ) | | | — | | | — | | | | 406,000 |
| (b) | Inventory disposed of. |
F-23
EXHIBIT INDEX
| | |
Exhibit No. | | Description |
| 3.1 | | Restated Certificate of Incorporation of the Registrant, as amended (incorporated by reference to Exhibit 3.1 to Form 8-K Current Report, SEC File No. 001-12075, dated November 20, 2007 and filed with the Commission on November 21, 2007). |
| |
| 3.2 | | Bylaws of the Registrant, amended and restated effective as of January 23, 2008 (incorporated by reference to Exhibit 3.1 to Form 8-K Current Report, SEC File No. 001-12075, dated January 23, 2008 and filed with the Commission on January 25, 2008). |
| |
| 10.1 | | Bolt Technology Corporation Amended and Restated 2006 Stock Option and Restricted Stock Plan together with (i) Form of Incentive Stock Option Agreement, (ii) Form of Nonqualified Stock Option Agreement, (iii) Form of Non-Employee Director Nonqualified Stock Option Agreement, and (iv) Form of Restricted Stock Award Agreement (incorporated by reference to Exhibit 10.1 to Form 8-K Current Report, SEC File No. 001-12075, dated November 20, 2007 and filed with the Commission on November 21, 2007).† |
| |
| 10.2 | | Bolt Technology Corporation Amended and Restated Severance Compensation Plan together with Form of Designation of Participation (incorporated by reference to Exhibit 10.2 to Form 8-K Current Report, SEC File No. 001-12075, dated November 20, 2007 and filed with the Commission on November 21, 2007).† |
| |
| 10.3 | | Lease Agreement dated January 10, 2003 between 381 Connecticut Avenue Corporation and Bolt Technology Corporation (incorporated by reference to Exhibit 10.6 to Form 10-K for the year ended June 30, 2003, SEC File No. 001-12075). |
| |
| 10.4 | | Lease Agreement dated January 10, 2003 between 381 Connecticut Avenue Corporation and Bolt Technology Corporation (incorporated by reference to Exhibit 10.7 to Form 10-K for the year ended June 30, 2003, SEC File No. 001-12075). |
| |
| 10.5 | | Employment Agreement between Bolt Technology Corporation and Raymond M. Soto effective as of June 10, 1996; Amendment to Employment Agreement between Bolt Technology Corporation and Raymond M. Soto effective as of September 20, 2001 (incorporated by reference to Exhibit 10.3 to Form 10-Q for the quarter ended September 30, 2006, SEC File No. 001-12075); Amendment to Employment Agreement between Bolt Technology Corporation and Raymond M. Soto effective as of November 20, 2007 (incorporated by reference to Exhibit 10.3 to Form 8-K Current Report, SEC File No. 001-12075, dated November 20, 2007 and filed with the Commission on November 21, 2007).† |
| |
| 10.6 | | Restricted Stock Award Agreement by and between Bolt Technology Corporation and Raymond M. Soto dated as of January 23, 2008 (incorporated by reference to Exhibit 10.6 to Form 10-Q for the quarter ended March 31, 2008, SEC File No. 001-12075).† |
| |
| 10.7 | | Employment Agreement between Custom Products Corporation and Gerald H. Shaff effective as of January 1, 2003 (incorporated by reference to Exhibit 10.5 to Form 10- K for the year ended June 30, 2003, SEC File No. 001-12075); Letter Agreement dated as of February 9, 2005 amending the Employment Agreement between Custom Products Corporation and Gerald H. Shaff, effective as of January 1, 2003 (incorporated by reference to Exhibit 10.8 to Form 10-Q for the quarter ended December 31, 2004, SEC File No. 001-12075).† |
| |
| 10.8 | | Employment Agreement between A-G Geophysical Products, Inc. and Michael C. Hedger, dated May 13, 2005 (incorporated by reference to Exhibit 10.10 to Form 10- Q for the quarter ended March 31, 2005, SEC File No. 001-12075); Amendment to Employment Agreement between A-G Geophysical Products, Inc. and Michael C. Hedger effective as of November 20, 2007 (incorporated by reference to Exhibit 10.4 to Form 8-K Current Report, SEC File No. 001-12075, dated November 20, 2007 and filed with the Commission on November 21, 2007).† |
| | |
Exhibit No. | | Description |
| 10.9 | | Asset Purchase Agreement by and among Real Time Systems Inc., Embedded Microsystems, Inc. dba Real Time Systems, W. Allen Nance and Molly L. Nance dated July 10, 2007 (incorporated by reference to Exhibit 10.1 to Form 8-K Current Report, SEC File No. 001-12075, dated July 10, 2007 and filed with the Commission on July 12, 2007). |
| |
| 10.10 | | Employment Agreement by and between Real Time Systems Inc. and W. Allen Nance dated July 10, 2007 (incorporated by reference to Exhibit 10.2 to Form 8-K Current Report, SEC File No. 001-12075, dated July 10, 2007 and filed with the Commission on July 12, 2007).† |
| |
| 10.11 | | Non-Competition Agreement by and among Real Time Systems Inc., Bolt Technology Corporation, Embedded Microsystems, Inc. dba Real Time Systems and W. Allen Nance dated July 10, 2007 (incorporated by reference to Exhibit 10.3 to Form 8-K Current Report, SEC File No. 001-12075, dated July 10, 2007 and filed with the Commission on July 12, 2007). |
| |
| 10.12 | | Asset Purchase Agreement by and among Custom Products Corporation, Bolt Technology Corporation and A&A Manufacturing Co., Inc. dated May 6, 2008.* |
| |
| 21 | | Subsidiaries of the Registrant.* |
| |
| 23 | | Consent of Independent Registered Public Accounting Firm.* |
| |
| 31.1 | | Certification pursuant to Rule 13a-14(a)/15d-14(a), as adopted pursuant to Section 302 of the Sarbanes-Oxley Act of 2002 (Chief Executive Officer).* |
| |
| 31.2 | | Certification pursuant to Rule 13a-14(a)/15d-14(a), as adopted pursuant to Section 302 of the Sarbanes-Oxley Act of 2002 (Chief Financial Officer).* |
| |
| 32.1 | | Certification pursuant to 18 U.S.C. Section 1350, as adopted pursuant to Section 906 of the Sarbanes-Oxley Act of 2002 (Chief Executive Officer).* |
| |
| 32.2 | | Certification pursuant to 18 U.S.C. Section 1350, as adopted pursuant to Section 906 of the Sarbanes-Oxley Act of 2002 (Chief Financial Officer).* |
| |
| 99.1 | | Commercial Loan Agreement, dated as of May 30, 2007, by and among Webster Bank National Association, Bolt Technology Corporation, A-G Geophysical Products, Inc. and Custom Products Corporation (incorporated by reference to Exhibit 99.1 to Form 10-K for the year ended June 30, 2007, SEC File No. 001-12075). |
| † | Management contract or compensatory plan |