
December 1, 2009
FBR Capital Markets
2009 Fall Investor Conference
Exhibit 99.1

1
Safe Harbor Statement
This presentation includes “forward-looking statements” within the meaning of Section 27A of the
Securities Act and Section 21E of the Securities Exchange Act of 1934, as amended, regarding,
among other things, our business strategy, our prospects and our financial position. These
statements can be identified by the use of forward-looking terminology such as “believes,”
“estimates,” “expects,” “intends,” “may,” “will,” “should,” “could,” or “anticipates” or the negative or
other variation of these similar words, or by discussions of strategy or risks and uncertainties. These
statements are based on current expectations of future events. If underlying assumptions prove
inaccurate or unknown risks or uncertainties materialize, actual results could vary materially from the
Company’s expectations and projections. Important factors that could cause actual results to differ
materially from such forward-looking statements include, without limitation, risks related to the
following:
nIncreasing competition in the communications industry; and
nA complex and uncertain regulatory environment.
A further list and description of these risks, uncertainties and other factors can be found in the
Company’s Annual Report on Form 10-K for the fiscal year ended December 31, 2008. Copies of this
Form 10-K, as well as subsequent filings, are available online at www.sec.gov, www.shentel.com or
on request from the Company. The Company does not undertake to update any forward-looking
statements as a result of new information or future events or developments.

2
Use of Non-GAAP Financial Measures
Included in this presentation are certain non-GAAP financial measures that are not determined in
accordance with US generally accepted accounting principles. These financial performance
measures are not indicative of cash provided or used by operating activities and exclude the effectors
of certain operating, capital and financing costs and may differ from comparable information provided
by other companies, and they should not be considered in isolation, as an alternative to, or more
meaningful than measures of financial performance determined in accordance with US generally
accepted accounting principles. These financial performance measures are commonly used in the
industry and are presented because Shentel believes they provide relevant and useful information to
investors. Shentel utilizes these financial performance measures to assess its ability to meet future
capital expenditure and working capital requirements, to incur indebtedness if necessary, return
investment to shareholders and to fund continued growth. Shentel also uses these financial
performance measures to evaluate the performance of its business and for budget planning
purposes.

3
Agenda
Introduction and Shentel Overview - Earle MacKenzie - EVP/COO
Overview of Wireless
Overview of Wireline
Overview of Cable
Financials - - Adele Skolits - CFO
4
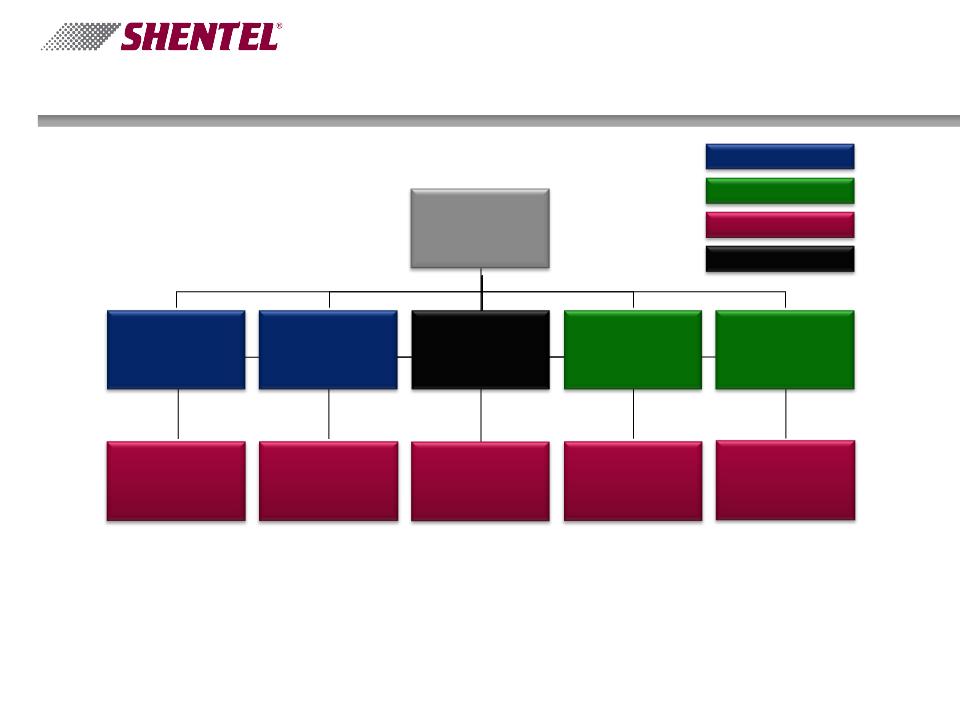
Shenandoah Telecommunications Company
n Reporting Segments: Wireless, Wireline and Cable
n Shentel Management Company: Allocation subsidiary for all
employees and shared expenses
employees and shared expenses
Allocation Subsidiary
Wireline Entities
Wireless Entities
Shenandoah
Telecommunications
Company
Telecommunications
Company
Shentel Cable
Company
Company
Shentel Service
Company
Company
Shenandoah Mobile
Company
Company
Shenandoah Cable
Television Company
Television Company
Shentel Management
Company
Company
Shentel
Communications
Company
Communications
Company
Shenandoah
Telephone Company
Telephone Company
Shenandoah
Personal
Communications
Company
Personal
Communications
Company
Shenandoah
Network Company
Network Company
Shenandoah Long
Distance Company
Distance Company
Cable Entities

5
Business Overview
n Public company with 4,400+ shareholders
u ≈ 70% individual / 30% institutional
n Sprint PCS Affiliate of Sprint Nextel
n Profitable
n Strong growth
n Healthy balance sheet
n Continuity of ownership & management
n Focused business plan

6
Growth Strategy - Capitalize on Core Competencies
n Wireless
u Increase penetration in existing PCS footprint
u Look for new wireless opportunities in surrounding
geographic areas
geographic areas
n Cable
u Focus on smaller less competitive markets
u Build clusters to gain operating efficiencies
u Upgrade networks to offer “Triple Play”
n Wireline
u Attractive markets at reasonable prices

7
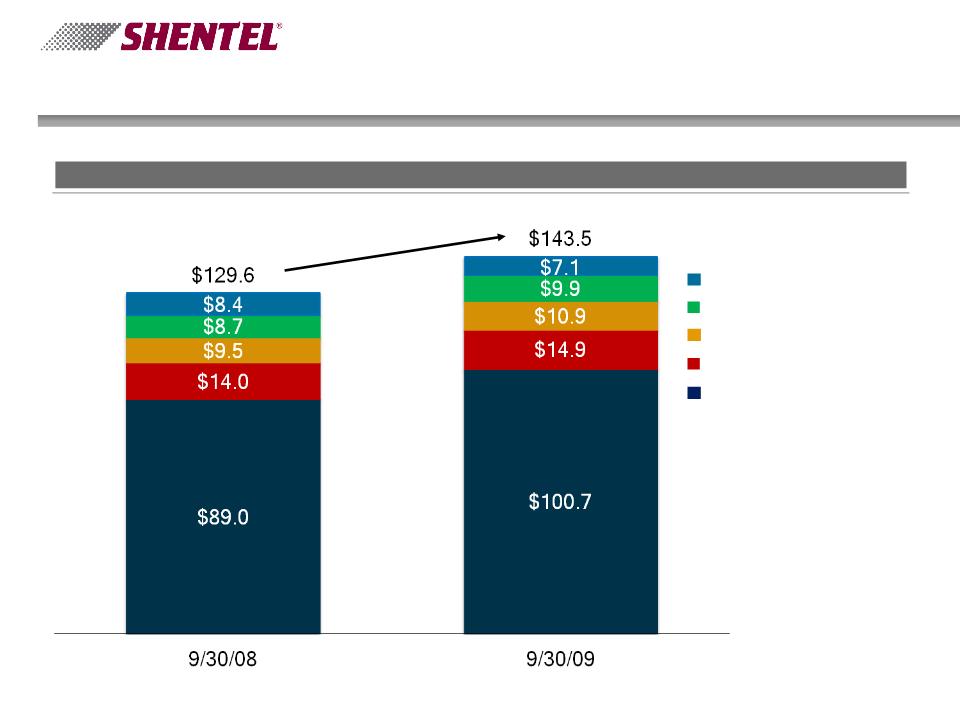
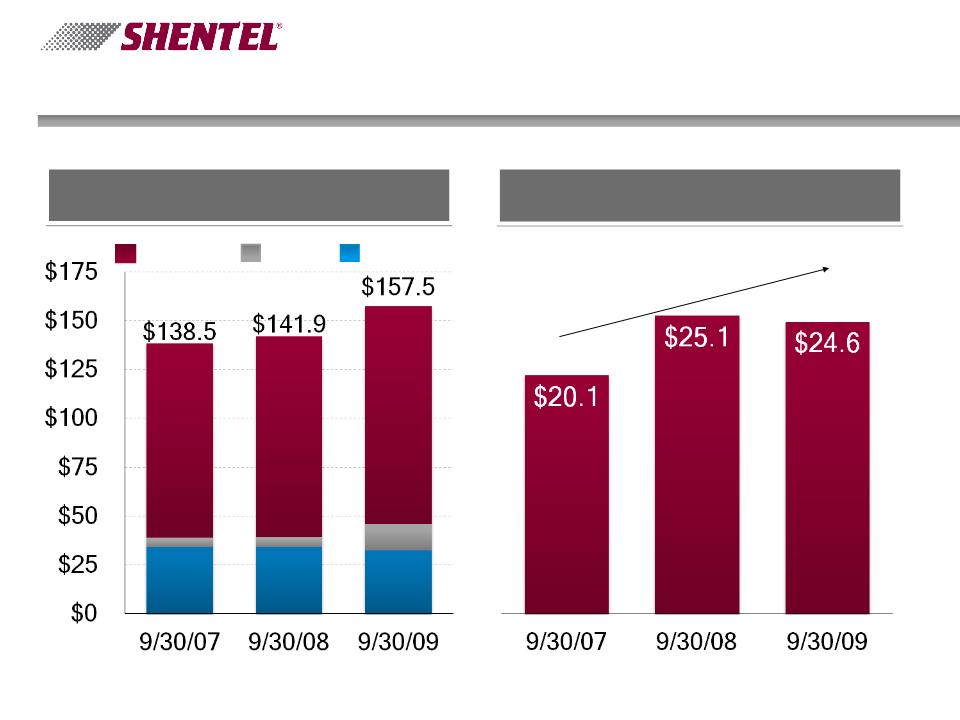
Segment Overview
12 Months Ending September 30, 2009
Total External Revenues = $157.5 million
Operating Income Before Depreciation &
Amortization (OIBDA) by Segment
Amortization (OIBDA) by Segment
Revenue by Segment

8
Agenda
Introduction and Shentel Overview
Overview of Wireless
Overview of Wireline
Overview of Cable
Financials
9
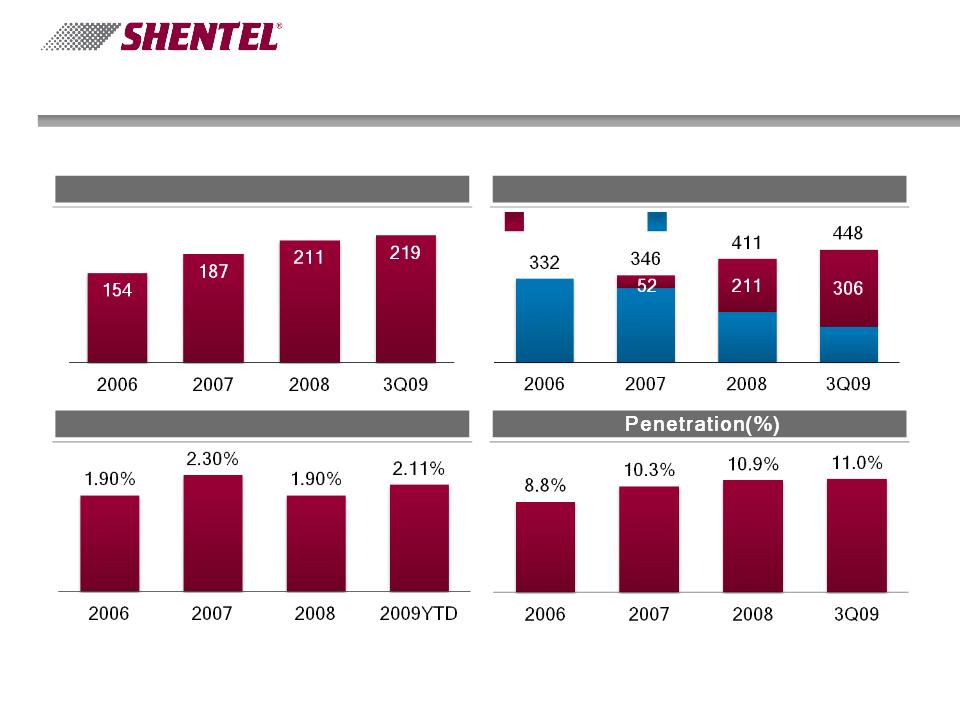
PCS Overview
n One of 2 remaining Sprint Nextel
affiliates
affiliates
n 2.3 million licensed POPs
n 2.0 million covered POPs
n 219k total subscribers
u 11.0% penetration of covered
POPs
POPs
n 448 CDMA base stations
n 306 EVDO enabled cell sites
u 94% EVDO covered POPs
n $41,000 Estimated Average
household income
household income
10
Key Operational Metrics - PCS
Period Ending
Period Ending
Retail Subscribers (000s)
Number of Cell Sites
Churn (%)
EVDO Sites
Non-EVDO Sites
11
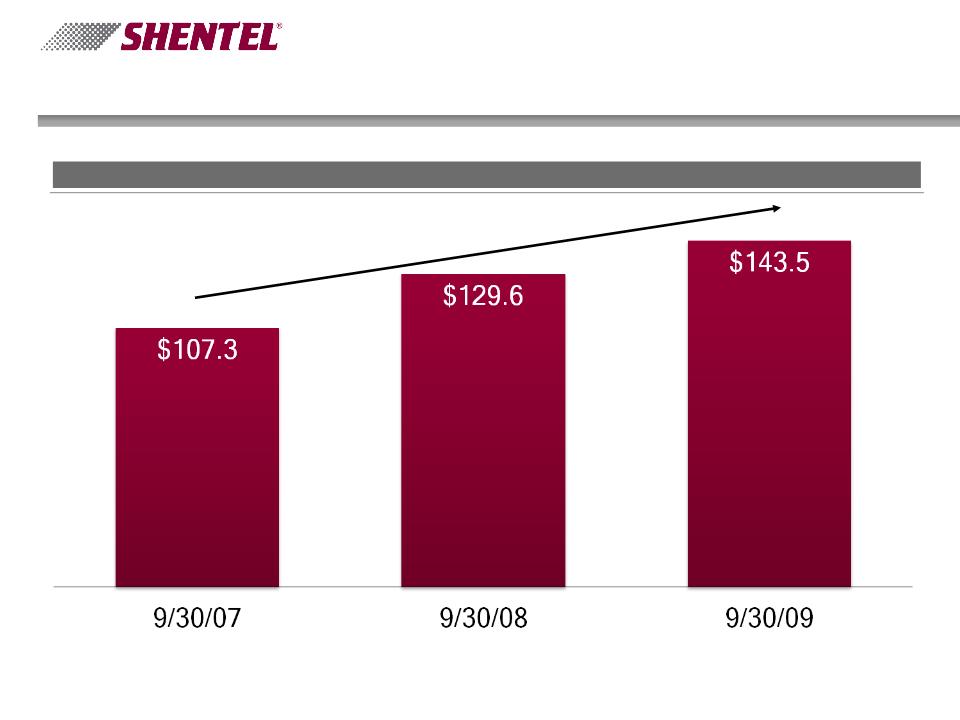
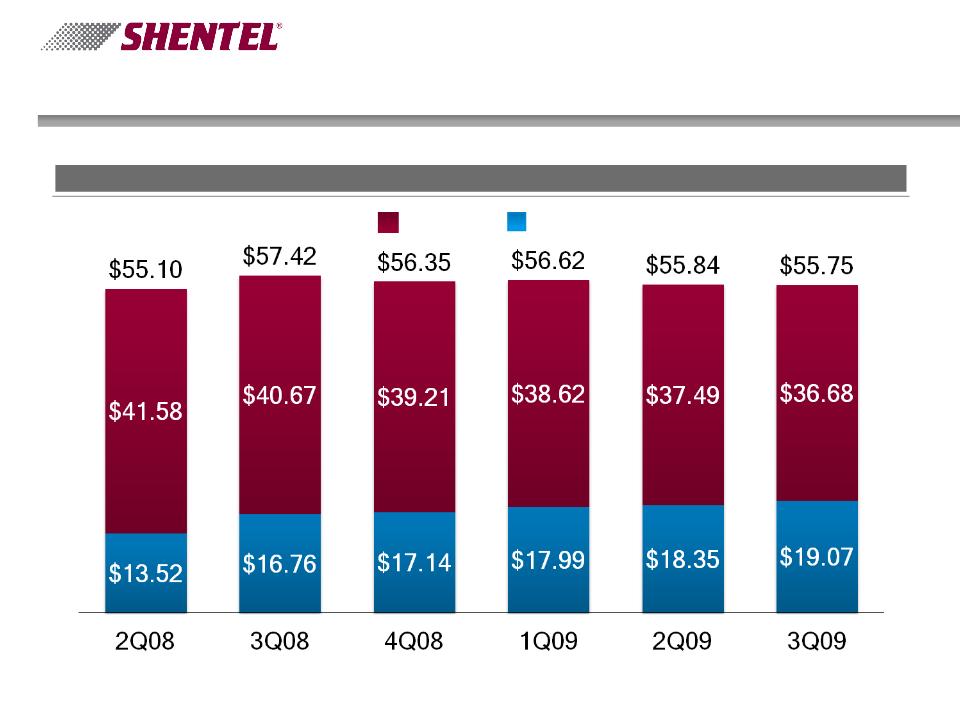
Attractive Service Revenue Growth - PCS
12 Months Ending
12 Months Ending
Gross Billed PCS Revenue ($ millions)1
1 Before credits and fees
15.6% CAGR
12
PCS Revenues
12 Months Ending
12 Months Ending
Billed Revenue ($ millions)
Up 10.7%
Bad Debt
Management Fee
Service Credits
Service Fee
Net Revenue
13
PCS Revenue per Subscriber
Period Ending
Period Ending
Gross Billed Revenue per Subscriber1
1 Before credits and fees
Voice
Data
14
Wireless Segment
12 Months Ending
Reported Revenue ($ millions)
OIBDA ($ millions)
16.8% CAGR

15
Capital Expenditures - Wireless
12 Months Ending
12 Months Ending
Capital Expenditures by Category ($ millions)
# Cell Sites 332 346 411 475
% Covered POPs 77% 79% 85% 88%
# EVDO Sites 0 52 211 336
% POPs Covered N/A 27% 86% 94%
Other
Capacity
Coverage
EVDO
Mobile (Towers)

16
Agenda
Introduction and Shentel Overview
Overview of Wireless
Overview of Wireline
Overview of Cable
Financials

17
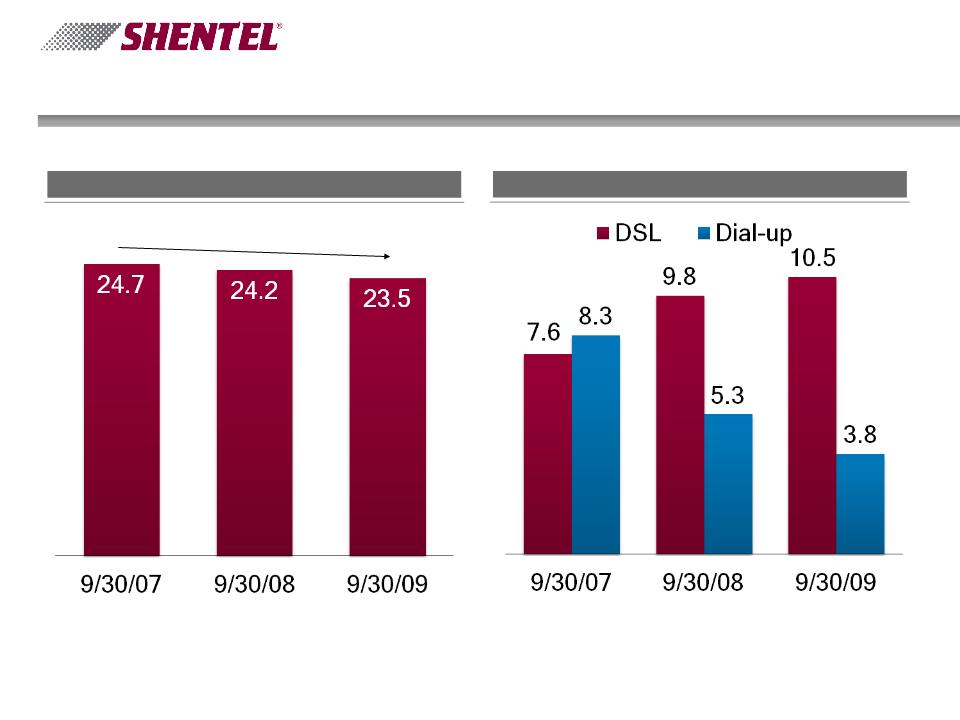
Wireline Customers
12 Months Ending September 30, 2009
12 Months Ending September 30, 2009
n 23.5k LEC access lines
n Acquisition of North River
Telephone closed November
2nd
Telephone closed November
2nd
u 1.0k access lines
n 10.5k DSL subscribers
n 3.8k dial-up Internet
subscribers
subscribers
n 10.8k long distance
subscribers
subscribers
n One FTTH community in
service outside of LEC area
service outside of LEC area
n Fiber Network
u Route miles: 784
18
Access lines (000s)
-2.5% CAGR
Internet Customers (000s)
1 DSL only available within LEC area
2 Dial-up offered inside and outside the LEC area
Wireline Customers
12 Months Ending
12 Months Ending
1
2
19
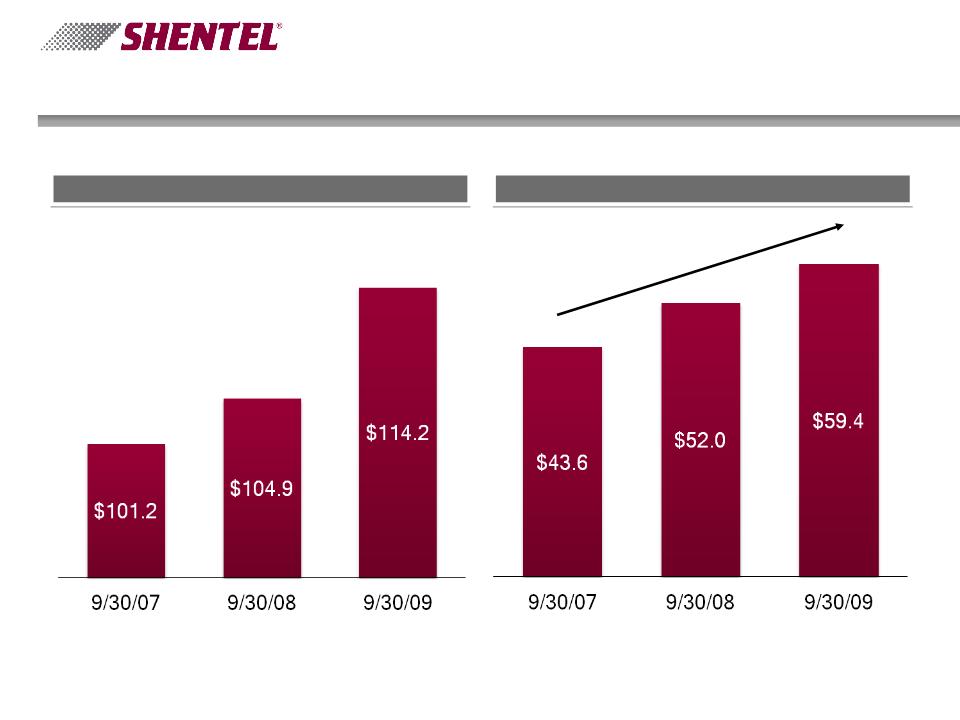
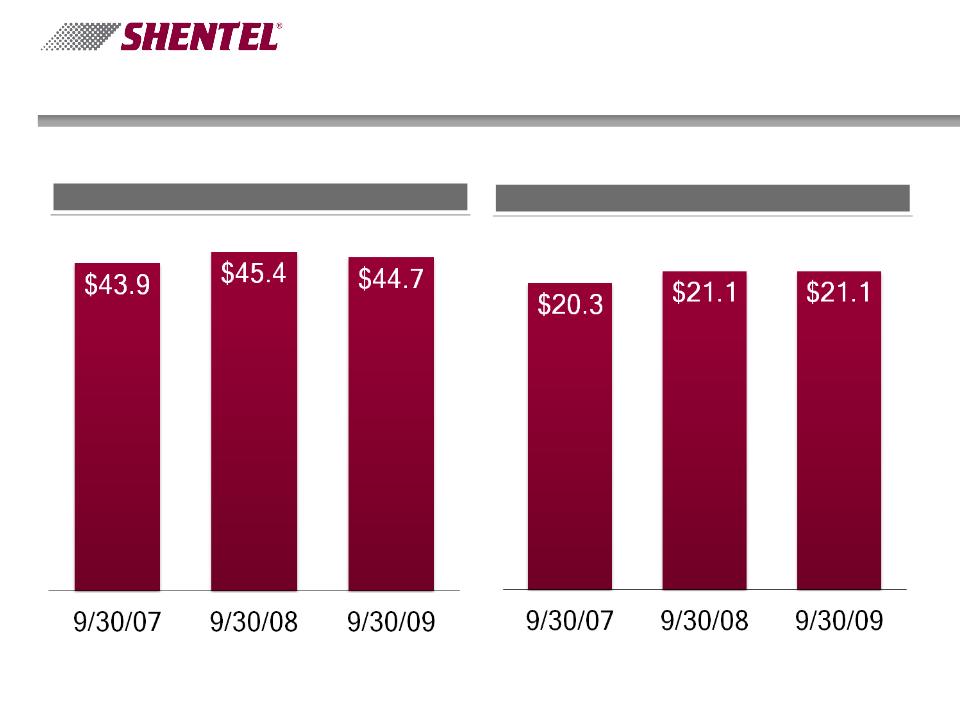
Wireline Overview
12 Months Ending
12 Months Ending
Revenue ($ millions)
OIBDA ($ millions)

20
Agenda
Introduction and Shentel Overview
Overview of PCS
Overview of Wireline
Overview of Cable
Financials

21
Cable TV Overview
n Complimentary (with LEC business)
u 15k Homes Passed
u 7.9k Video Subscribers
n Offensive positioning (Outside ILEC)
u 44k Homes Passed
u 16.2k Video and 1.6k Internet Subscribers
n All two-way by mid 2010
22
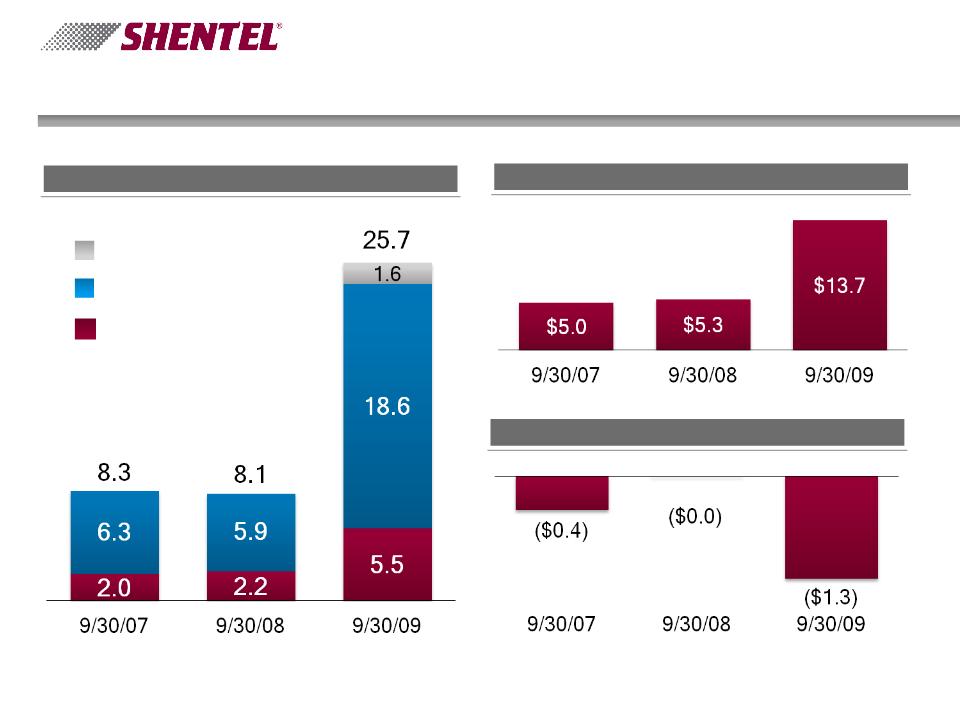
Cable TV
12 Months Ending
12 Months Ending
RGUs (000s)
Revenue ($ millions)
OIBDA ($ millions)
1 Includes Rapid Communications acquisition - December 2008
2 Only includes internet for areas outside ILEC service area
1
1
1
Digital
Internet 2
Basic

23
Agenda
Introduction and Shentel Overview
Overview of PCS
Overview of Wireline
Overview of Cable
Financials - - Adele Skolits - CFO
24
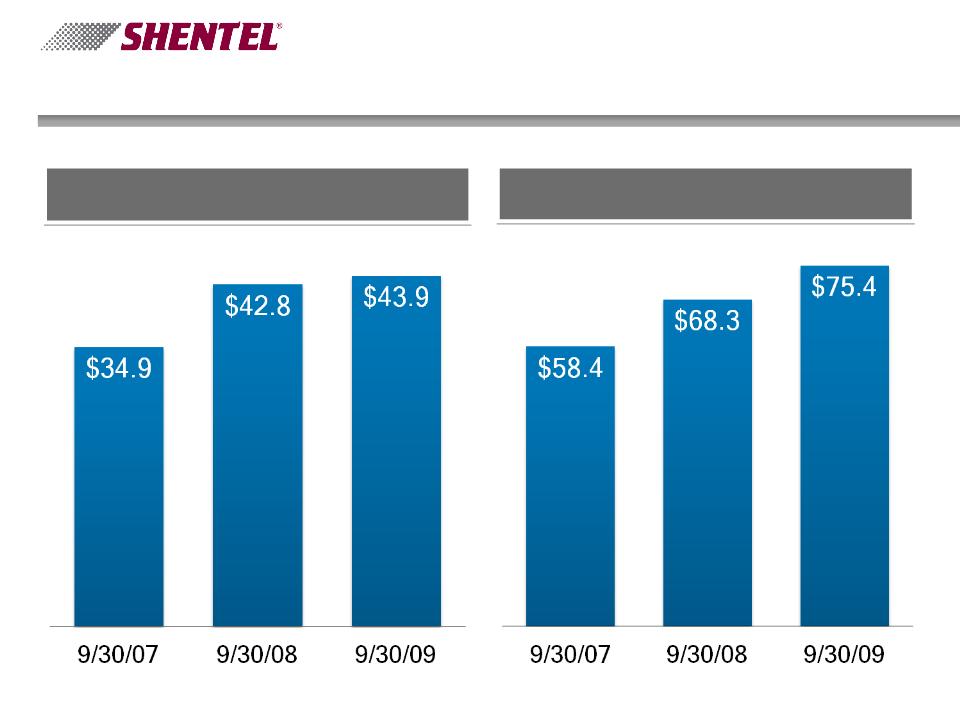
Key Financial Results - Continuing Operations1
12 Months Ending
12 Months Ending
Net Income from Continuing Operations
($ millions)
10.7% CAGR
Revenue ($ millions)
1 Shentel Converged Services has been reclassed as discontinued operations. All results have been restated.
Wireless
Wireline
Cable
25
Operating Income ($ millions)
Operating Income Before Depreciation &
Amortization ($ millions)
Amortization ($ millions)
Key Financial Results - Continuing Operations1
12 Months Ending
12 Months Ending
1 Shentel Converged Services has been reclassed as discontinued operations. All results have been restated.

26
Key Financial Results - Consolidated
12 Months Ending
12 Months Ending
Earnings Per Share
- Continuing Operations1
Earnings Per Share
- Net Income
2
1 Shentel Converged Services has been reclassed as discontinued operations. All results have been restated.
2 Includes $10.7 million write down of Converged Service Business Unit ($0.45 per share) in Q1 2009

27
Total Capex
12 Months Ending
12 Months Ending
Wireless
Wireline
Cable
Capital Expenditures by Segment ($ millions)

28
Q&A

29
Appendix
30
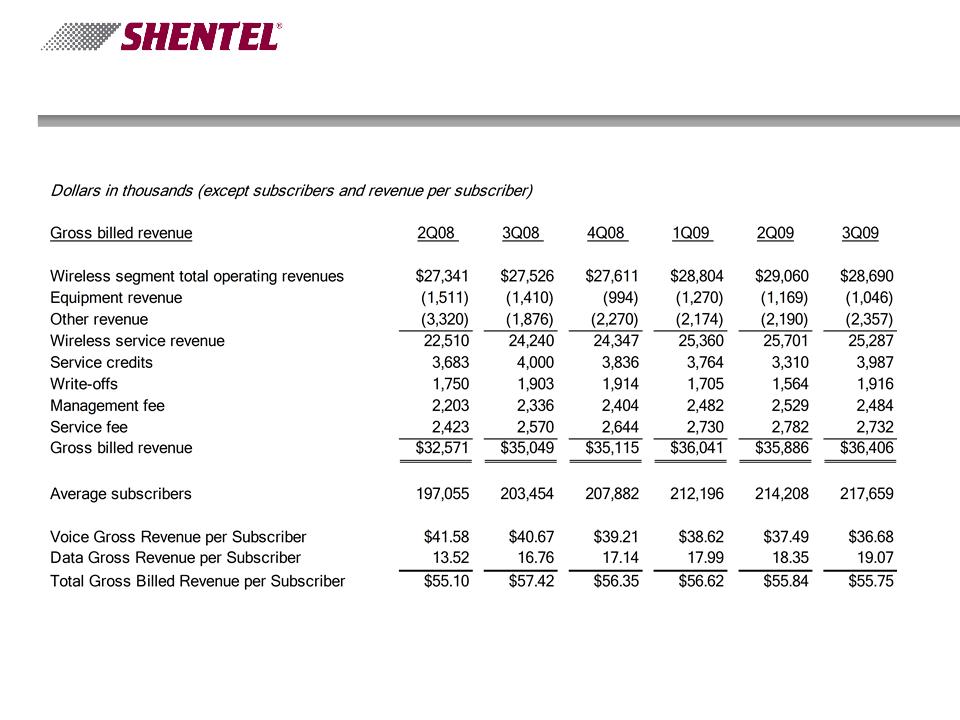
Non-GAAP Financial Measure - Billed Revenue per Subscriber
Period Ending
Period Ending

31
Dollars in thousands | |||||
Wireless | Wireline | Cable | Other | Consolidated | |
Operating Income | $39,724 | $12,758 | ($4,296) | ($4,130) | $43,876 |
Depreciation and amortization | 19,669 | 8,502 | 2,979 | 332 | 31,482 |
OIBDA | $59,393 | $21,080 | ($1,317) | ($3,798) | $75,358 |
Non-GAAP Financial Measure - OIBDA
12 Months Ended 9/30/2009
12 Months Ended 9/30/2009

32
Dollars in thousands | |||||
Wireless | Wireline | Cable | Other | Consolidated | |
Operating Income | $34,834 | $14,121 | ($1,045) | ($5,130) | $42,780 |
Depreciation and amortization | 17,184 | 6,988 | 1,042 | 299 | 25,513 |
OIBDA | $52,018 | $21,109 | ($3) | ($4,831) | $68,293 |
Non-GAAP Financial Measure - OIBDA
12 Months Ended 9/30/2008
12 Months Ended 9/30/2008

33
Dollars in thousands | |||||
Wireless | Wireline | Cable | Other | Consolidated | |
Operating Income | $27,384 | $14,291 | ($1,497) | ($5,247) | $34,931 |
Depreciation and amortization | 16,188 | 6,030 | 1,060 | 240 | 23,518 |
OIBDA | $43,572 | $20,321 | ($437) | ($5,007) | $58,449 |
Non-GAAP Financial Measure - OIBDA
12 Months Ended 9/30/2007
12 Months Ended 9/30/2007

December 1, 2009
FBR Capital Markets
2009 Fall Investor Conference