Exhibit 99.2
Horizon Telcom Acquisition October 25, 2023

This presentation includes “forward - looking statements” within the meaning of Section 27 A of the Securities Act and Section 21 E of the Securities Exchange Act of 1934 , as amended, regarding our business strategy, our prospects and our financial position . These statements can be identified by the use of forward - looking terminology such as “pro - forma,” “believes,” “estimates,” “expects,” “intends,” “may,” “will,” “should,” “could” or “anticipates” or the negative or other variation of these similar words, or by discussions of strategy or risks and uncertainties . These statements are based on current expectations of future events . If underlying assumptions prove inaccurate or unknown risks or uncertainties materialize, actual results could vary materially from the Company’s expectations and projections . Important factors that could cause actual results to differ materially from such forward - looking statements include, without limitation, risks related to the following : □ The ability to obtain the required regulatory approvals and satisfy the closing conditions required for the Transaction □ Shentel's ability to obtain the financing for the Transaction □ The closing of the Transaction may not occur on time or at all □ The expected savings and synergies from the Transaction may not be realized or may take longer or cost more than expected to realize The financial results for Horizon in this press release have been derived from audited financial statements prepared by Horizon, without adjustment to conform to the accounting principles and methodologies used by Shentel. The accounting polices and methodologies used by Horizon differ in certain respects from those used by Shentel, but Shentel does not believe these differences are material. A further list and description of these risks, uncertainties and other factors can be found in the Company’s SEC filings which are available online at www . sec . gov, www . shentel . com or on request from the Company . The Company does not undertake to update any forward - looking statements as a result of new information or future events or developments . 2 Safe Harbor Statement
3 Chris French President and CEO

4 Transformative Transaction x Accelerates our Fiber First strategy • Doubles the size of our commercial fiber business • Creates new beachhead for Glo Fiber expansion x Expected to increase most key metrics by ~ 25% x Combined company long - term growth rates expected to be among the leaders for publicly - traded broadband companies x Diversifies Shentel geographically x Provides sizeable expected synergy opportunity of $10 million annually 1 x Improves operating scale driving margin expansion Notes 1. Includes $9.6m of run - rate Opex synergies and $0.6m of run - rate Capex synergies
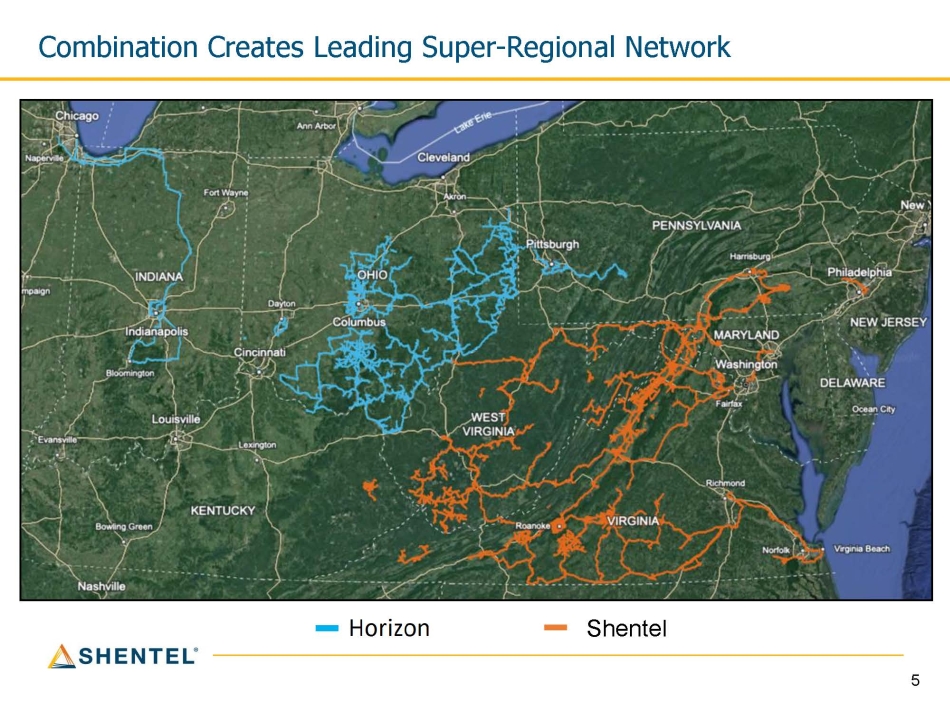
5 Combination Creates Leading Super - Regional Network Shentel
6 • Similar history and strategies • Investing in state - of - the - art communication services in rural markets • Providing outstanding local customer service • Complementary core competencies • Shentel: residential focus and proven FTTH expansion platform • Horizon: advanced commercial fiber business Shentel + Horizon = Win Together
7 Jim Volk SVP of Finance and CFO
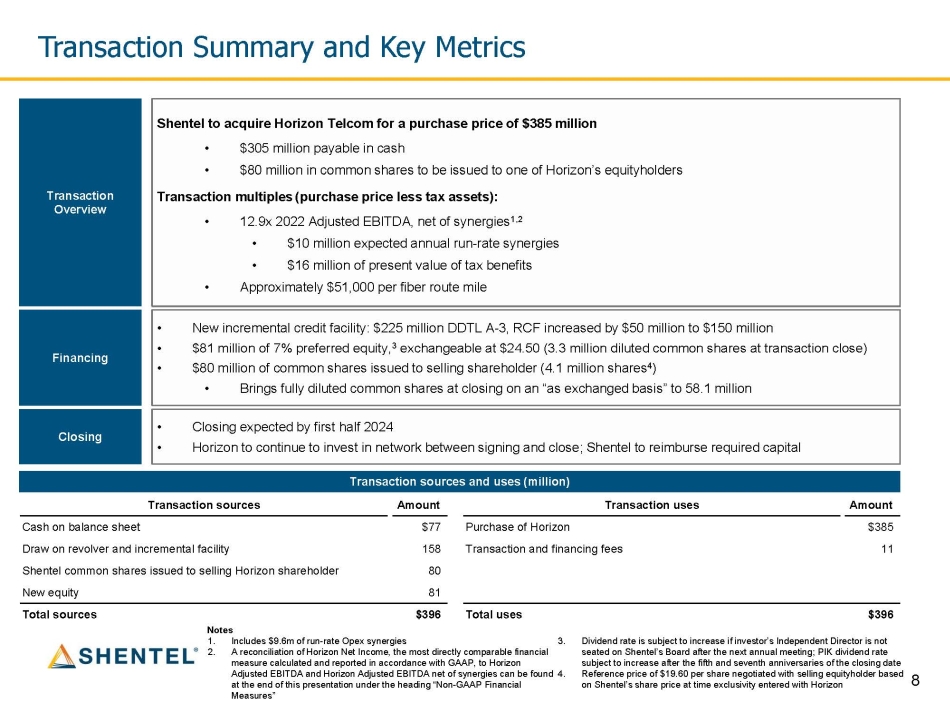
8 Transaction Overview Shentel to acquire Horizon Telcom for a purchase price of $385 million • $305 million payable in cash • $80 million in common shares to be issued to one of Horizon’s equityholders Transaction multiples (purchase price less tax assets): • 12.9x 2022 Adjusted EBITDA, net of synergies 1,2 • $10 million expected annual run - rate synergies • $16 million of present value of tax benefits • Approximately $51,000 per fiber route mile • New incremental credit facility: $225 million DDTL A - 3, RCF increased by $50 million to $150 million • $81 million of 7% preferred equity, 3 exchangeable at $24.50 (3.3 million diluted common shares at transaction close) • $80 million of common shares issued to selling shareholder (4.1 million shares 4 ) • Brings fully diluted common shares at closing on an “as exchanged basis” to 58.1 million • Closing expected by first half 2024 • Horizon to continue to invest in network between signing and close; Shentel to reimburse required capital Financing Closing Transaction sources and uses (million) Notes 1. Includes $9.6m of run - rate Opex synergies 2. A reconciliation of Horizon Net Income, the most directly comparable financial measure calculated and reported in accordance with GAAP, to Horizon Adjusted EBITDA and Horizon Adjusted EBITDA net of synergies can be found 4. at the end of this presentation under the heading “Non - GAAP Financial Measures” 3. Dividend rate is subject to increase if investor’s Independent Director is not seated on Shentel’s Board after the next annual meeting; PIK dividend rate subject to increase after the fifth and seventh anniversaries of the closing date Reference price of $19.60 per share negotiated with selling equityholder based on Shentel’s share price at time exclusivity entered with Horizon Transaction Summary and Key Metrics Transaction sources Amount Transaction uses Amount $385 Purchase of Horizon $77 Cash on balance sheet 11 Transaction and financing fees 158 Draw on revolver and incremental facility 80 Shentel common shares issued to selling Horizon shareholder 81 New equity $396 Total uses $396 Total sources
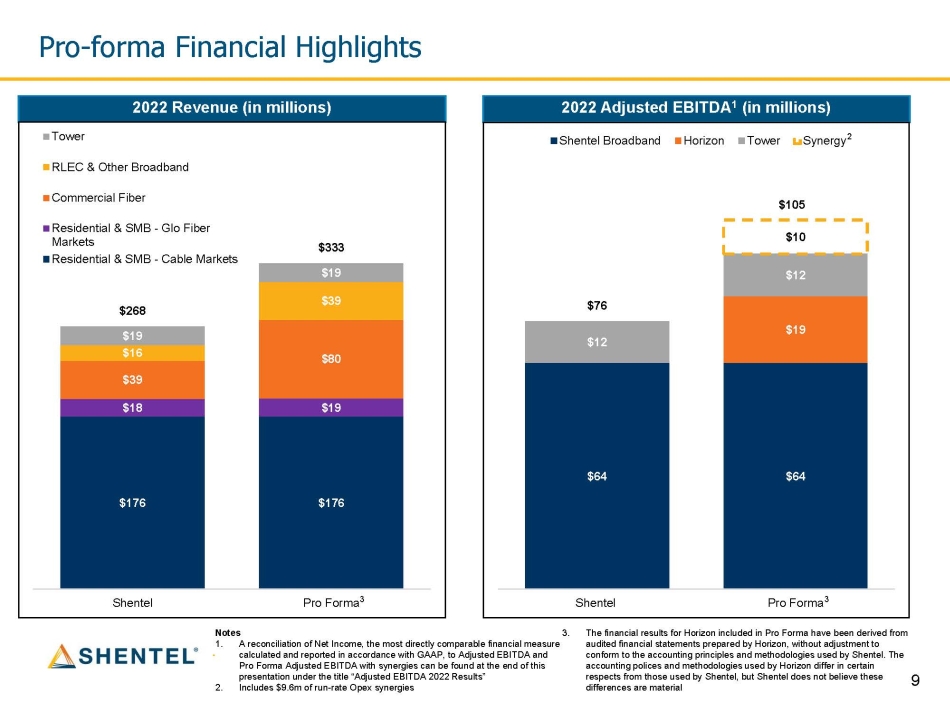
9 2022 Revenue (in millions) 2022 Adjusted EBITDA 1 (in millions) $176 $176 $18 $19 $39 $80 $16 $39 $19 $19 $268 $333 Shentel Tower RLEC & Other Broadband Commercial Fiber Residential & SMB - Glo Fiber Markets Residential & SMB - Cable Markets Pro Forma 3 Pro - forma Financial Highlights $64 $64 $19 $12 $12 $10 $76 $105 Notes 1. A reconciliation of Net Income, the most directly comparable financial measure calculated and reported in accordance with GAAP, to Adjusted EBITDA and Pro Forma Adjusted EBITDA with synergies can be found at the end of this presentation under the title “Adjusted EBITDA 2022 Results” 2. Includes $9.6m of run - rate Opex synergies Shentel Pro Forma 3 3. The financial results for Horizon included in Pro Forma have been derived from audited financial statements prepared by Horizon, without adjustment to conform to the accounting principles and methodologies used by Shentel. The accounting polices and methodologies used by Horizon differ in certain respects from those used by Shentel, but Shentel does not believe these differences are material Shentel Broadband Horizon Tower Synergy 2
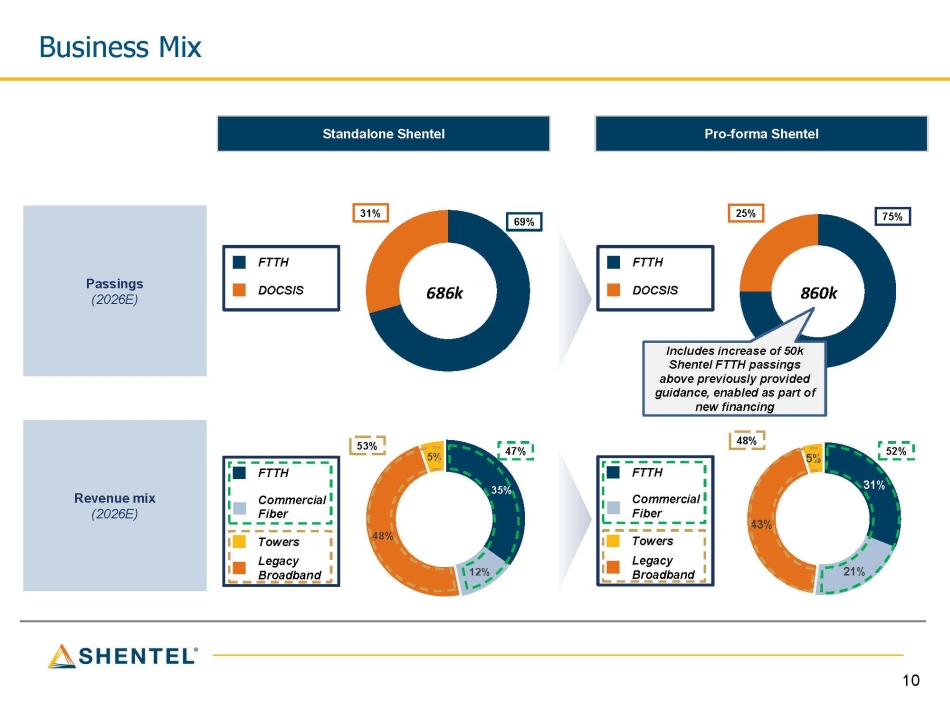
10 35% 12% 48% 5% 31% 21% 43% 5% Revenue mix (2026E) Passings (2026E) 47% 52% 69% 75% FTTH DOCSIS FTTH DOCSIS FTTH Commercial Fiber Towers Legacy Broadband 31% 25% 53% 48% Standalone Shentel Pro - forma Shentel FTTH Commercial Fiber Towers Legacy Broadband 686k 860k Business Mix Includes increase of 50k Shentel FTTH passings above previously provided guidance, enabled as part of new financing

11 Ed McKay EVP and COO
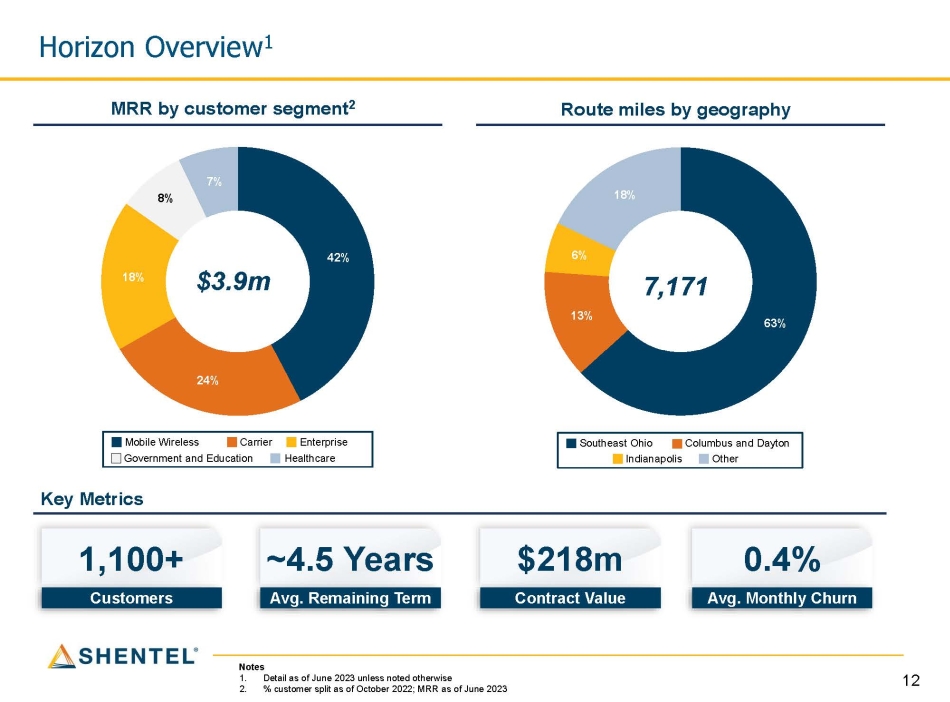
12 63% 13% 6% 18% 42% 24% 18% 8% 7% $3.9m Avg. Remaining Term ~4.5 Years Avg. Monthly Churn 0.4% Customers 1,100+ Contract Value $218m Key Metrics 7,171 MRR by customer segment 2 Route miles by geography Mobile Wireless Carrier Enterprise Government and Education Healthcare Horizon Overview 1 Notes 1. Detail as of June 2023 unless noted otherwise 2. % customer split as of October 2022; MRR as of June 2023 Southeast Ohio Columbus and Dayton Indianapolis Other

13 MRR + MAR (thousands) 2 $7,238 $3,890 + 120% $3,348 $3,348 767,173 767,173 938,680 1,705,853 9,082 9,082 7,171 16,253 Fiber strand miles 1 Fiber route miles 1 Notes 1. Horizon Fiber Route Miles and Fiber Strand Miles include 1,102 and 3,897, respectively, of IRU and leased miles 2. MRR = Monthly Recurring Revenue; MAR = Monthly Amortized Revenue, recurring revenues and backlog as of June 2023 Combined Company Commercial Fiber Key Metrics Shentel Horizon + 80% + 120% Backlog MRR + MAR (thousands) 2 $694 $541 + 350% $153 $153
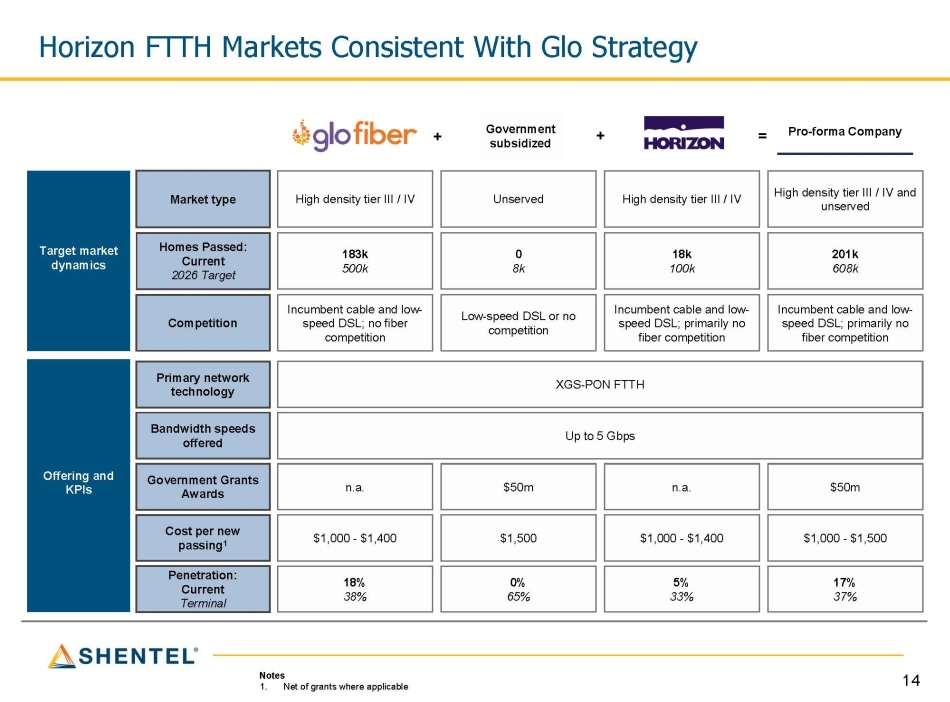
14 Pro - forma Company + = Notes 1. Net of grants where applicable Offering and KPIs Target market dynamics Market type Competition Government Grants Awards Cost per new passing 1 Primary network technology Penetration: Current Terminal Homes Passed: Current 2026 Target Bandwidth speeds offered + High density tier III / IV and unserved High density tier III / IV Unserved High density tier III / IV 201k 608k 18k 100k 0 8k 183k 500k Incumbent cable and low - speed DSL; primarily no fiber competition Incumbent cable and low - speed DSL; primarily no fiber competition Low - speed DSL or no competition Incumbent cable and low - speed DSL; no fiber competition XGS - PON FTTH Up to 5 Gbps $50m n.a. $50m n.a. $1,000 - $1,500 $1,000 - $1,400 $1,500 $1,000 - $1,400 17% 37% 5% 33% 0% 65% 18% 38% Government subsidized Horizon FTTH Markets Consistent With Glo Strategy
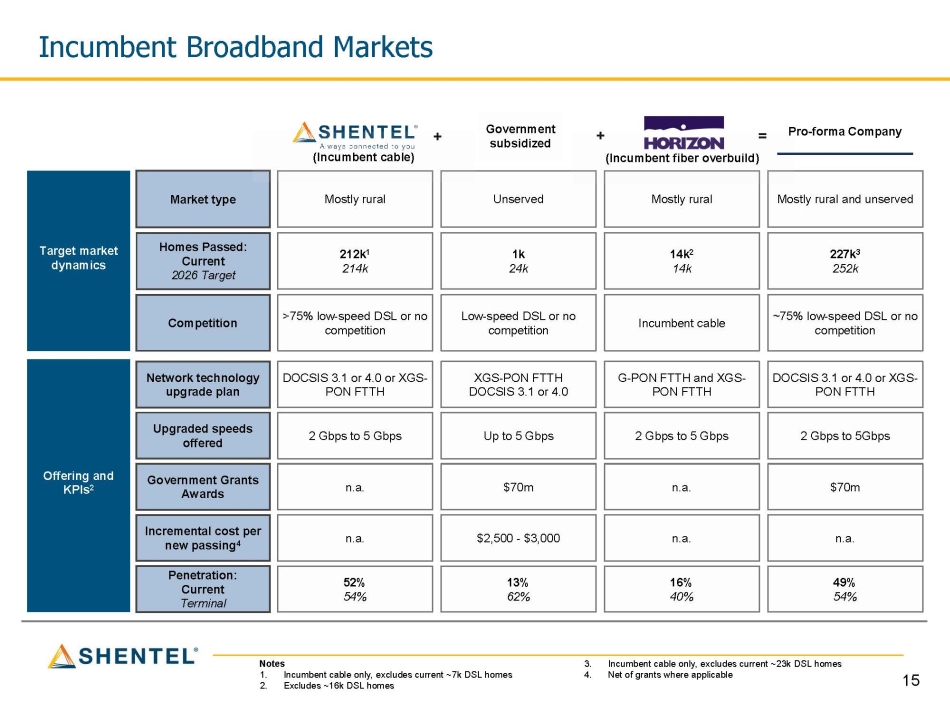
15 + Notes 1. Incumbent cable only, excludes current ~7k DSL homes 2. Excludes ~16k DSL homes 3. Incumbent cable only, excludes current ~23k DSL homes 4. Net of grants where applicable Offering and KPIs 2 Target market dynamics Market type Competition Government Grants Awards Incremental cost per new passing 4 Network technology upgrade plan Penetration: Current Terminal Homes Passed: Current 2026 Target Upgraded speeds offered Government subsidized + Mostly rural and unserved Mostly rural Unserved Mostly rural 227k 3 252k 14k 2 14k 1k 24k 212k 1 214k ~75% low - speed DSL or no competition Incumbent cable Low - speed DSL or no competition >75% low - speed DSL or no competition DOCSIS 3.1 or 4.0 or XGS - PON FTTH G - PON FTTH and XGS - PON FTTH XGS - PON FTTH DOCSIS 3.1 or 4.0 DOCSIS 3.1 or 4.0 or XGS - PON FTTH 2 Gbps to 5Gbps 2 Gbps to 5 Gbps Up to 5 Gbps 2 Gbps to 5 Gbps $70m n.a. $70m n.a. n.a. n.a. $2,500 - $3,000 n.a. 49% 54% 16% 40% 13% 62% 52% 54% (Incumbent cable) = (Incumbent fiber overbuild) Pro - forma Company Incumbent Broadband Markets
16 Q&A
17 Appendix

18 Pro - forma credit facility New preferred equity 58.1 million fully diluted common shares at closing on an “as exchanged basis” 1 Detail Term Detail Tranche 7% per annum payable in cash or in - kind (PIK) at Shentel’s option Dividend rate $150 million due June 2026 Term Loan A - 1 Subject to increase if investor’s Independent Director not seated on Board after the next annual meeting PIK dividend rate subject to increase after the fifth and seventh anniversaries of the closing date Dividend rate increase $150 million due June 2028 Term Loan A - 2 Exchangeable into Shentel common shares at $24.50 per Shentel share Exchange $225 million due June 2028 Term Loan A - 3 3.3 million shares at close on an “as exchanged basis” Shares at close $150 million due June 2026 Revolving Line of Credit Peak net leverage of 4.0x expected in 2025 Notes 1. Includes 50.7 million outstanding shares of Shentel common stock on a fully - diluted basis, 4.1 million shares issued to selling Horizon equityholder and 3.3 million common shares from the preferred equity on an “as exchanged basis” Pro - forma Capital Structure

19 Included in this presentation are certain non - GAAP financial measures that are not determined in accordance with U . S . generally accepted accounting principles . These financial performance measures are not indicative of cash provided or used by operating activities and exclude the effects of certain operating, capital and financing costs and may differ from comparable information provided by other companies, and they should not be considered in isolation, as an alternative to, or more meaningful than measures of financial performance determined in accordance with U . S . generally accepted accounting principles . Management believes these measures facilitate comparisons of our operating performance from period to period and comparisons of our operating performance to that of our peers and other companies by excluding certain differences . Shentel utilizes these financial performance measures to facilitate internal comparisons of our historical operating performance, which are used by management for business planning purposes, and also facilitates comparisons of our performance relative to that of our competitors . In addition, we believe these measures are widely used by investors and financial analysts as measures of our financial performance over time, and to compare our financial performance with that of other companies in our industry . Use of Non - GAAP Financial Measures

20 Pro - forma combined Plus: Horizon 1 Shentel consolidated ($ in thousands) ($20,417) ($12,038) ($8,379) Net income (loss) from continuing operations 83,192 14,293 68,899 Depreciation and amortization 5,241 - 5,241 Impairment expense 18,835 18,835 - Interest and Loss on extinguishment of debt 810 (538) 1,348 Other expense (income), net (4,347) (3,420) (927) Income tax expense (benefit) 1,681 430 1,251 Transaction, financing and restructuring fees 396 396 - Settlement of legal dispute 9,072 544 8,528 Stock - based compensation 511 511 - Shareholder management fees $94,974 $19,013 $75,961 Adjusted EBITDA 9,600 9,600 Expected synergies 2 $104,574 $28,613 $75,961 Adjusted EBITDA, net of synergies Year Ended December 31, 2022 Adjusted EBITDA 2022 Results Notes 1. The financial results for Horizon have been derived from audited financial statements prepared by Horizon, without adjustment to conform to the accounting principles and methodologies used by Shentel. The accounting polices and methodologies used by Horizon differ in certain respects from those used by Shentel, but Shentel does not believe these differences are material. 2. The Company expects to realize synergy savings in overlapping back - office systems and resources, as well as excess office space, over the 18 months following closing. The expected savings and synergies are a forward - looking statement and may not be realized or may take longer or cost more than expected to realize.