Exhibit 99.1
Fifth Third Bancorp
2005 Lehman Brothers Financial Services Conference
“Investing in a Franchise”
Kevin T. Kabat Neal E. Arnold Executive Vice President Executive Vice President
September 14, 2005

Affiliates & Markets
I. Affiliate Operating Model II. Markets III. Deposit Performance IV. Loan Performance
2
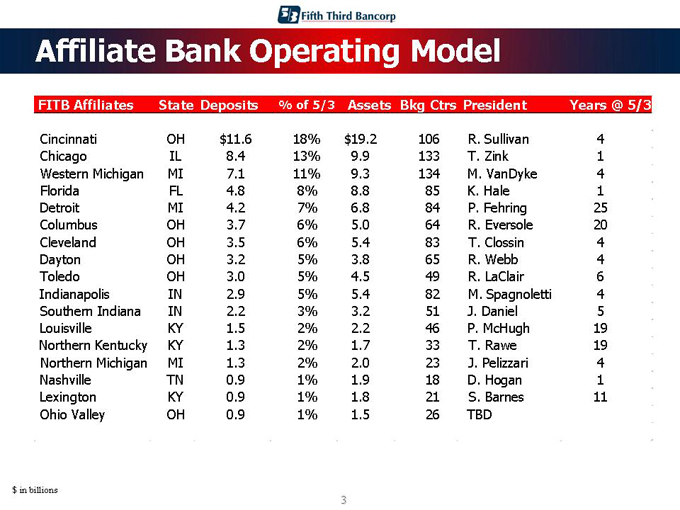
Affiliate Bank Operating Model
FITB Affiliates State Deposits % of 5/3 Assets Bkg Ctrs President Years @ 5/3
Cincinnati OH $11.6 18% $19.2 106 R. Sullivan 4 Chicago IL 8.4 13% 9.9 133 T. Zink 1 Western Michigan MI 7.1 11% 9.3 134 M. VanDyke 4 Florida FL 4.8 8% 8.8 85 K. Hale 1 Detroit MI 4.2 7% 6.8 84 P. Fehring 25 Columbus OH 3.7 6% 5.0 64 R. Eversole 20 Cleveland OH 3.5 6% 5.4 83 T. Clossin 4 Dayton OH 3.2 5% 3.8 65 R. Webb 4 Toledo OH 3.0 5% 4.5 49 R. LaClair 6 Indianapolis IN 2.9 5% 5.4 82 M. Spagnoletti 4 Southern Indiana IN 2.2 3% 3.2 51 J. Daniel 5 Louisville KY 1.5 2% 2.2 46 P. McHugh 19 Northern Kentucky KY 1.3 2% 1.7 33 T. Rawe 19 Northern Michigan MI 1.3 2% 2.0 23 J. Pelizzari 4 Nashville TN 0.9 1% 1.9 18 D. Hogan 1 Lexington KY 0.9 1% 1.8 21 S. Barnes 11 Ohio Valley OH 0.9 1% 1.5 26 TBD
$ in billions
3
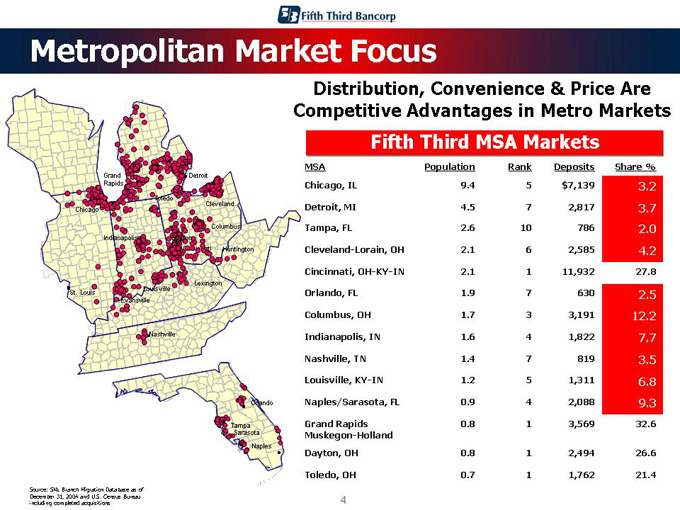
Metropolitan Market Focus
Distribution, Convenience & Price Are Competitive Advantages in Metro Markets
Fifth Third MSA Markets
MSA Population Rank Deposits Share% Chicago, IL 9.4 5 $7,139 3.2 Detroit, MI 4.5 7 2,817 3.7 Tampa, FL 2.6 10 786 2.0 Cleveland-Lorain, OH 2.1 6 2,585 4.2 Cincinnati, OH-KY-IN 2.1 1 11,932 27.8
Orlando, FL 1.9 7 630 2.5 Columbus, OH 1.7 3 3,191 12.2 Indianapolis, IN 1.6 4 1,822 7.7 Nashville, TN 1.4 7 819 3.5 Louisville, KY-IN 1.2 5 1,311 6.8 Naples/Sarasota, FL 0.9 4 2,088 9.3 Grand Rapids 0.8 1 3,569 32.6 Muskegon-Holland Dayton, OH 0.8 1 2,494 26.6
Toledo, OH 0.7 1 1,762 21.4
4
Grand Detroit
Rapids Chicago Toledo Cleveland Columbus Indianapolis Dayton Cincinnati Huntington Lexington Louisville St. Louis Evansville
Nashville
Orlando
Tampa
Sarasota
Naples
Source: SNL Branch Migration Database as of December 31, 2004 and U.S. Census Bureau including completed acquisitions
4
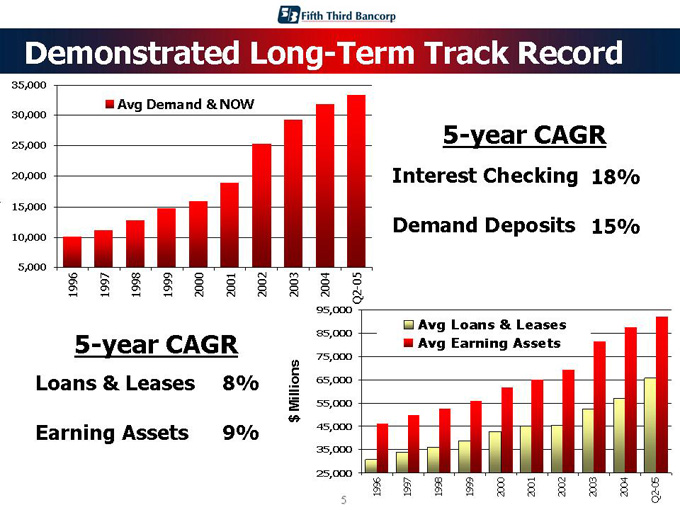
Demonstrated Long-Term Track Record
35,000
30,000
25,000 20,000 15,000 10,000 5,000
Avg Demand & NOW
1996 1997 1998 1999 2000 2001 2002 2003 2004 Q2-05
5-year CAGR
Interest Checking 18%
Demand Deposits 15%
5-year CAGR
Loans & Leases 8%
Earning Assets 9% $ Millions
95,000 85,000 75,000 65,000 55,000 45,000 35,000 25,000
Avg Loans & Leases Avg Earning Assets
1996 1997 1998 1999 2000 2001 2002 2003 2004 Q2-05
5
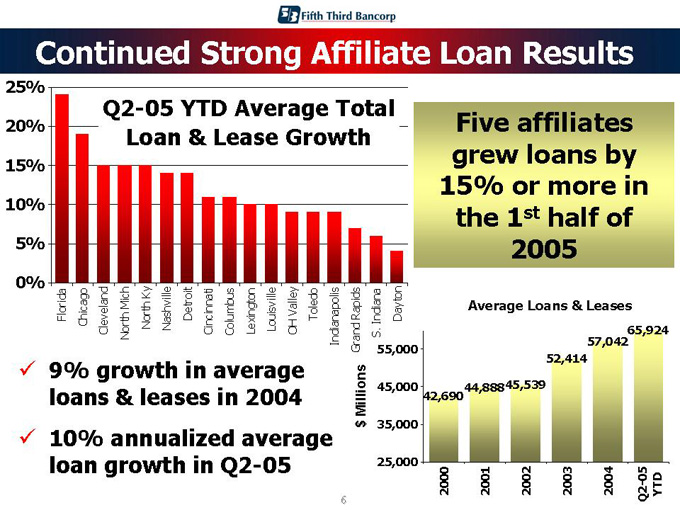
Continued Strong Affiliate Loan Results
25% 20% 15% 10% 5% 0%
Q2-05 YTD Average Total Loan & Lease Growth
Florida Chicago Cleveland North Mich North Ky Nashville Detroit Cincinnati Columbus Lexington Louisville OH Valley Toledo Indianapolis Grand Rapids
S. Indiana Dayton
9% growth in average loans & leases in 2004 10% annualized average loan growth in Q2-05
Five affiliates grew loans by 15% or more in the 1st half of 2005
Average Loans & Leases $ Millions
55,000 45,000 35,000 25,000
57,04265,924 52,414
42,69044,88845,539
2000 2001 2002 2003
2004
Q2-05 YTD
6
Retail Banking
I. Funding Balance Sheet Growth II. The Challenge III. Deposit Base IV. Retail Deposit Strategy
7
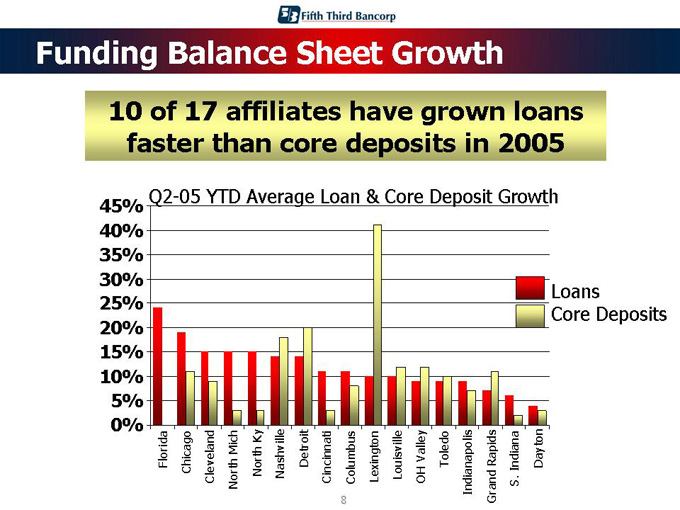
Funding Balance Sheet Growth
10 of 17 affiliates have grown loans faster than core deposits in 2005
Q2-05 YTD Average Loan & Core Deposit Growth
45% 40% 35% 30% 25% 20% 15% 10% 5% 0%
Florida Chicago Cleveland North Mich North Ky Nashville Detroit Cincinnati
Columbus Lexington Louisville OH Valley Toledo Indianapolis Grand Rapids S. Indiana Dayton
Loans Core Deposits
8
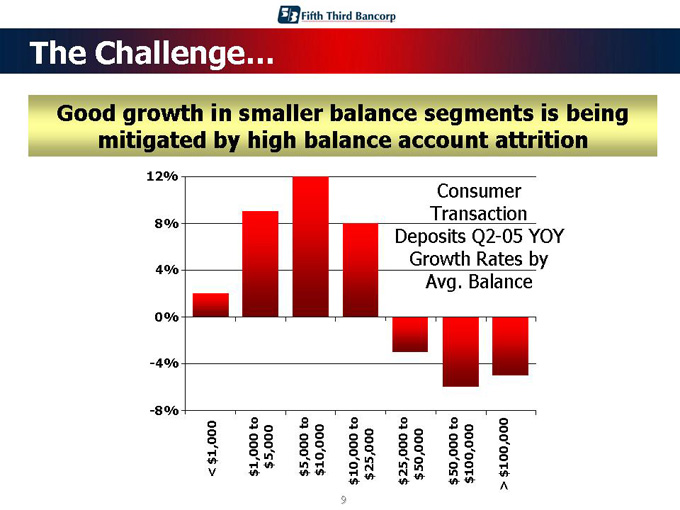
The Challenge…
Good growth in smaller balance segments is being mitigated by high balance account attrition
Consumer Transaction Deposits Q2-05 YOY
Growth Rates by Avg. Balance
12% 8% 4% 0% -4% -8%
< $1,000
$1,000 to $5,000
$5,000 to $10,000
$10,000 to $25,000
$25,000 to $50,000
$50,000 to $100,000
> $100,000
9
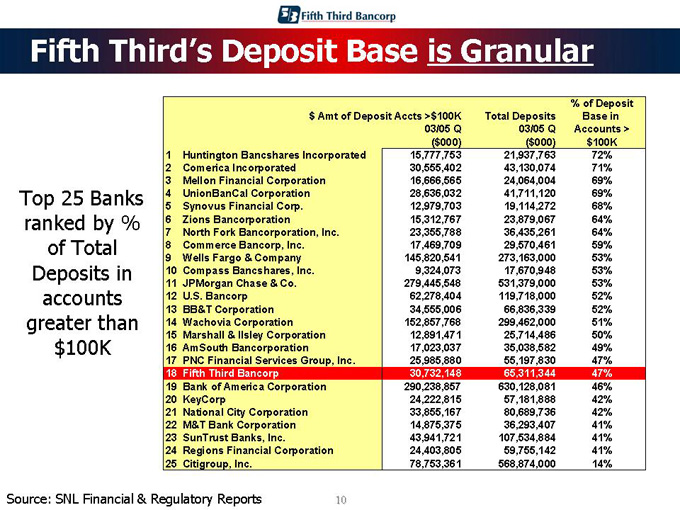
Fifth Third’s Deposit Base is Granular
Top 25 Banks ranked by % of Total Deposits in accounts greater than $100K $ Amt of Deposit Accts >$100K
03/05 Q
($000)
Total Deposits 03/05 Q
($000)
% of Deposit Base in Accounts > $100K
1 Huntington Bancshares Incorporated 15,777,753 21,937,763 72%
2 Comerica Incorporated 30,555,402 43,130,074 71%
3 Mellon Financial Corporation 16,666,565 24,064,004 69%
4 UnionBanCal Corporation 28,636,032 41,711,120 69%
5 Synovus Financial Corp. 12,979,703 19,114,272 68%
6 Zions Bancorporation 15,312,767 23,879,067 64%
7 North Fork Bancorporation, Inc. 23,355,788 36,435,261 64%
8 Commerce Bancorp, Inc. 17,469,709 29,570,461 59%
9 Wells Fargo & Company 145,820,541 273,163,000 53%
10 Compass Bancshares, Inc. 9,324,073 17,670,948 53%
11 JPMorgan Chase & Co. 279,445,548 531,379,000 53%
12 U.S. Bancorp 62,278,404 119,718,000 52%
13 BB&T Corporation 34,555,006 66,836,339 52%
14 Wachovia Corporation 152,857,768 299,462,000 51%
15 Marshall & Ilsley Corporation 12,891,471 25,714,486 50%
16 AmSouth Bancorporation 17,023,037 35,038,582 49%
17 PNC Financial Services Group, Inc. 25,985,880 55,197,830 47%
18 Fifth Third Bancorp 30,732,148 65,311,344 47%
19 Bank of America Corporation 290,238,857 630,128,081 46%
20 KeyCorp 24,222,815 57,181,888 42%
21 National City Corporation 33,855,167 80,689,736 42%
22 M&T Bank Corporation 14,875,375 36,293,407 41%
23 SunTrust Banks, Inc. 43,941,721 107,534,884 41%
24 Regions Financial Corporation 24,403,805 59,755,142 41%
25 Citigroup, Inc. 78,753,361 568,874,000 14%
Source: SNL Financial & Regulatory Reports
10
Driving Deposit Growth
Initiatives
Quarterly deposit campaigns De-novo banking center expansion Increased retention and service focus Segmentation focus
Right price Right product
11
Affiliate Updates
I. Fifth Third (Chicago) “Back on Track”
II. Fifth Third (Florida) ... @ 7 months “It’s Early…but Promising”
12
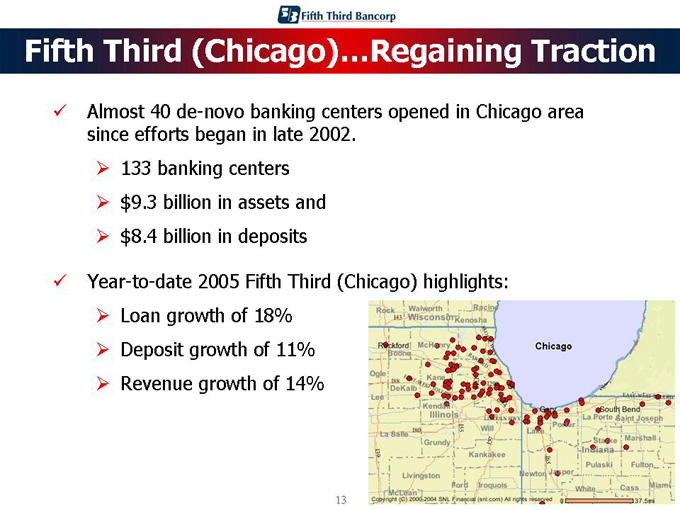
Fifth Third (Chicago)…Regaining Traction
Almost 40 de-novo banking centers opened in Chicago area since efforts began in late 2002.
133 banking centers $9.3 billion in assets and $8.4 billion in deposits
Year-to-date 2005 Fifth Third (Chicago) highlights:
Loan growth of 18% Deposit growth of 11% Revenue growth of 14%
13
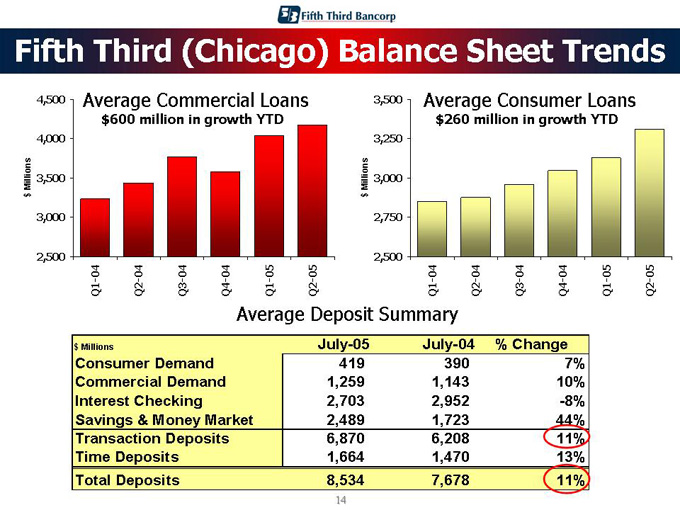
Fifth Third (Chicago) Balance Sheet Trends
Average Commercial Loans
$600 million in growth YTD
4,500
4,000
Millions 3,500 $
3,000
2,500
Q1-04
Q2-04
Q3-04
Q4-04
Q1-05
Q2-05
Average Consumer Loans
$260 million in growth YTD
3,500
3,250
Millions 3,000 $
2,750
2,500
Q1-04 Q2-04 Q3-04 Q4-04 Q1-05 Q2-05
Average Deposit Summary $ Millions July-05 July-04 % Change Consumer Demand 419 390 7% Commercial Demand 1,259 1,143 10% Interest Checking 2,703 2,952 -8% Savings & Money Market 2,489 1,723 44% Transaction Deposits 6,870 6,208 11% Time Deposits 1,664 1,470 13% Total Deposits 8,534 7,678 11%
14
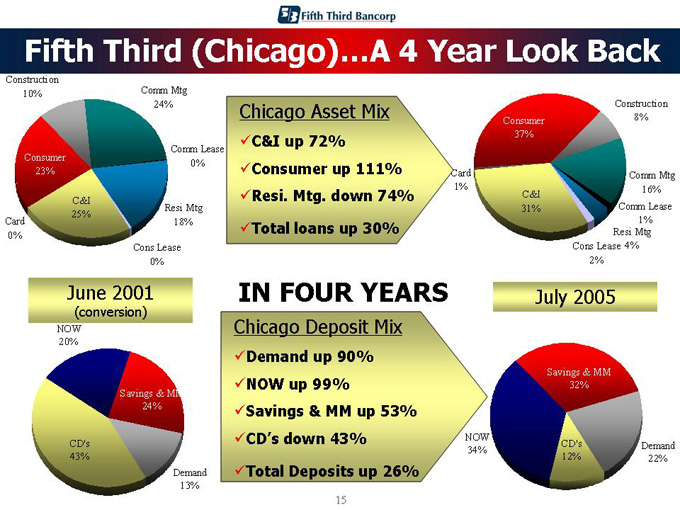
Fifth Third (Chicago)…A 4 Year Look Back Construction 10% Comm Mtg 24% Comm Lease 0% Resi Mtg 18% Cons Lease 0% Card 0% Consumer 23% C&I 25% June 2001 (conversion) NOW 20% Savings & MM 24% CD’s 43%
Demand 13%
Construction 8%
Comm Mtg 16%
Comm Lease 1%
Resi Mtg Cons Lease 4% 2%
C&I 31%
Consumer 37%
Card 1%
July 2005
Savings & MM
32%
Demand 22%
CD’s 12%
Chicago Asset Mix
C&I up 72% Consumer up 111% Resi. Mtg. down 74% Total loans up 30%
IN FOUR YEARS
Chicago Deposit Mix
Demand up 90% NOW up 99% Savings & MM up 53% CD’s down 43% Total Deposits up 26%
15
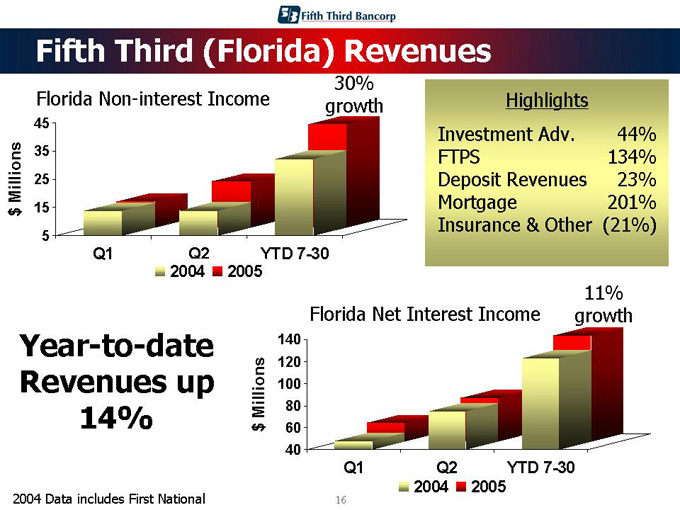
Fifth Third (Florida) Revenues
Florida Non-interest Income
30% growth
Q1 Q2 YTD 7-30
2004
2005
45 35
Millions 25
15
$
5
Highlights
Investment Adv. 44% FTPS 134% Deposit Revenues 23% Mortgage 201% Insurance & Other (21%)
Year-to-date Revenues up 14%
11% growth
Florida Net Interest Income
140 120 100
Millions 80
$ 60 40
Q1 Q2 YTD 7-30
2004
2005
2004 Data includes First National
16
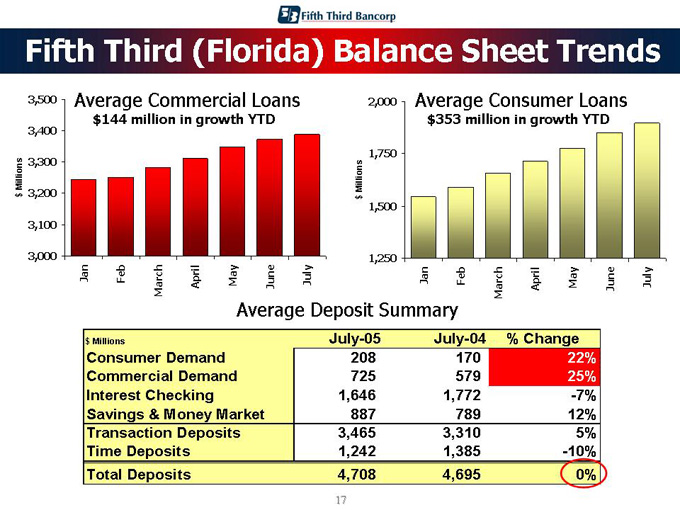
Fifth Third (Florida) Balance Sheet Trends
Average Commercial Loans
$144 million in growth YTD
3,500
3,400
Millions 3,300
3,200 $
3,100
3,000
Jan Feb March April May June July
Average Consumer Loans
$353 million in growth YTD
2,000
1,750
Millions $
1,500
1,250
Jan Feb March April May June July
Average Deposit Summary
$ Millions July-05 July-04 % Change Consumer Demand 208 170 22% Commercial Demand 725 579 25% Interest Checking 1,646 1,772 -7% Savings & Money Market 887 789 12% Transaction Deposits 3,465 3,310 5% Time Deposits 1,242 1,385 -10% Total Deposits 4,708 4,695 0%
17
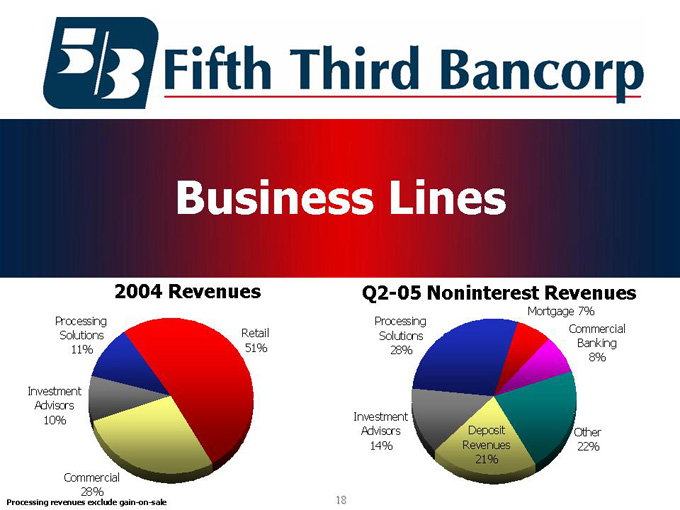
Business Lines
2004 Revenues
Processing Solutions 11%
Investment Advisors 10%
Commercial 28%
Retail 51%
Q2-05 Noninterest Revenues
Processing Solutions 28%
Investment Advisors 14%
Deposit Revenues 21%
Other 22%
Commercial Banking 8%
Mortgage 7%
Processing revenues exclude gain-on-sale
18
Commercial Banking
I. Revenue & Net Income Performance II. Loan Performance
III. Deposit Performance
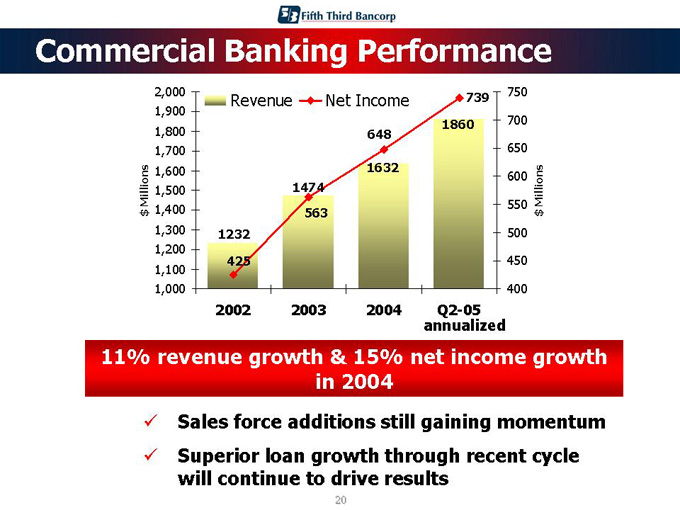
Commercial Banking Performance
2,000 1,900 1,800 1,700 1,600
Millions 1,500
1,400
$
1,300 1,200 1,100 1,000
Revenue
Net Income
750 700 650
600 Millions
550
$
500 450 400
1232 425
2002
1474 563
2003
648
1632
2004
739 1860
Q2-05 annualized
11% revenue growth & 15% net income growth in 2004
Sales force additions still gaining momentum Superior loan growth through recent cycle will continue to drive results
20
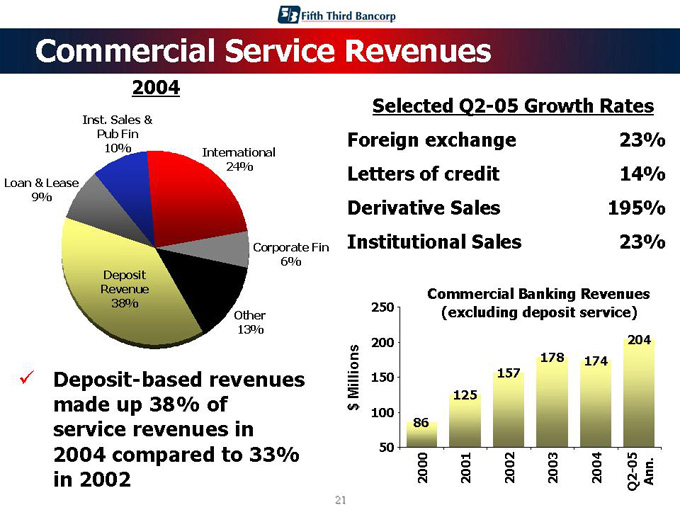
Commercial Service Revenues
2004
Inst. Sales & Pub Fin 10%
International 24%
Corporate Fin 6%
Other 13%
Deposit Revenue 38%
Loan & Lease 9%
Deposit-based revenues made up 38% of service revenues in 2004 compared to 33% in 2002
Selected Q2-05 Growth Rates Foreign exchange 23% Letters of credit 14% Derivative Sales 195% Institutional Sales 23%
Commercial Banking Revenues 250 (excluding deposit service)
200 204 178 174
Millions 150 157 125 $ 100 86 50
2000 2001 2002 2003 2004 Q2-05 Ann.
21
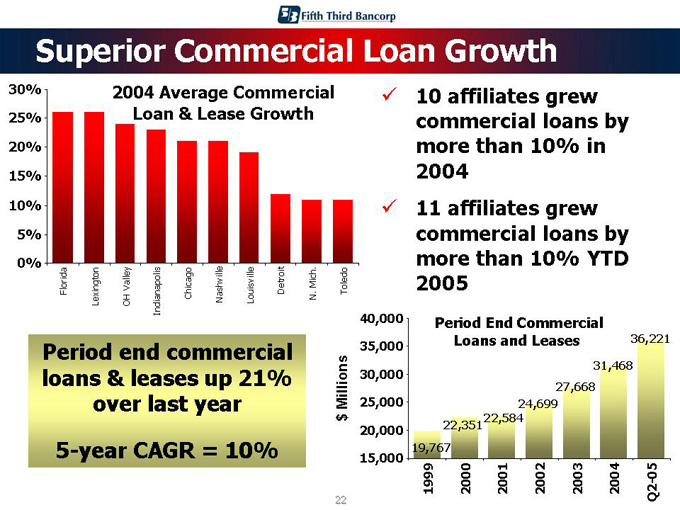
Superior Commercial Loan Growth
2004 Average Commercial Loan & Lease Growth
30% 25% 20% 15% 10% 5% 0%
Florida Lexington OH Valley Indianapolis Chicago Nashville Louisville Detroit N. Mich.
Toledo
Period end commercial loans & leases up 21% over last year 5-year CAGR = 10%
10 affiliates grew commercial loans by more than 10% in 2004 11 affiliates grew commercial loans by more than 10% YTD 2005
Period End Commercial Loans and Leases $ Millions
40,000 35,000 30,000 25,000 20,000 15,000
36,221
31,468
27,668
24,699
22,584
22,351
19,767
1999 2000 2001 2002 2003 2004 Q2-05
22
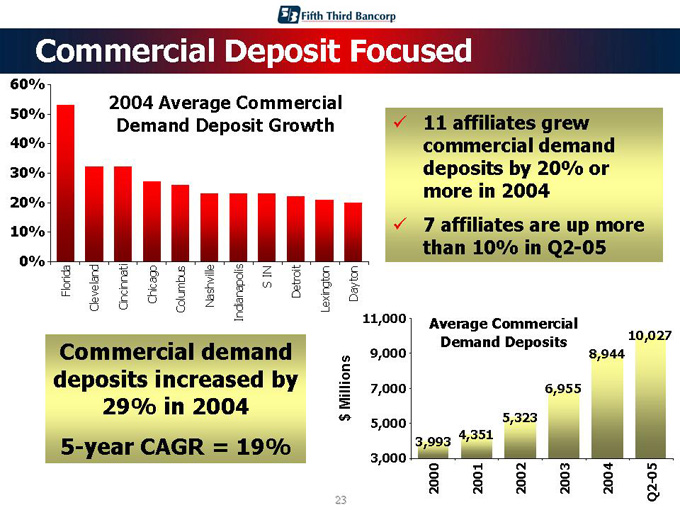
Commercial Deposit Focused
2004 Average Commercial Demand Deposit Growth
60% 50% 40% 30% 20% 10% 0%
Florida Cleveland Cincinnati Chicago Columbus Nashville Indianapolis S IN
Detroit Lexington Dayton
Commercial demand deposits increased by 29% in 2004 5-year CAGR = 19%
11 affiliates grew commercial demand deposits by 20% or more in 2004 7 affiliates are up more than 10% in Q2-05
Average Commercial Demand Deposits $ Millions
11,000 9,000 7,000 5,000 3,000
10,027
8,944
6,955
5,323 3,993 4,351
2000 2001 2002 2003 2004 Q2-05
23
Fifth Third Processing Solutions
I. Business Mix II. Revenue History III. Initiatives
24
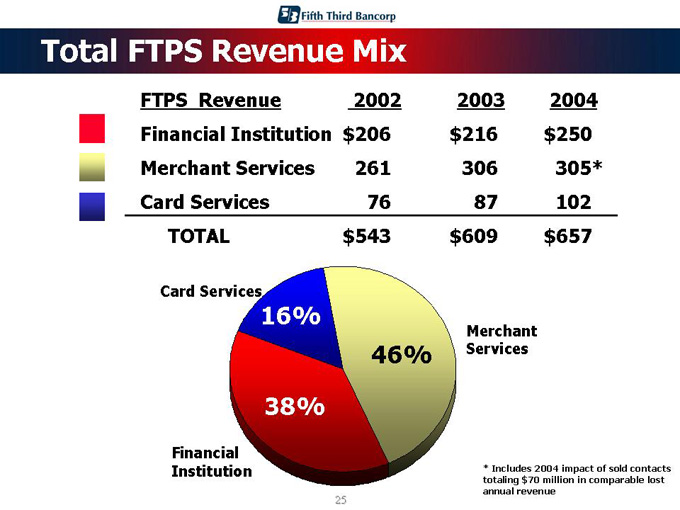
Total FTPS Revenue Mix
FTPS Revenue 2002 2003 2004 Financial Institution $206 $216 $250 Merchant Services 261 306 305
Card Services 76 87 102 TOTAL $543 $609 $657
Card Services
16%
Merchant 46% Services
38%
Financial Institution
Includes 2004 impact of sold contacts totaling $70 million in comparable lost annual revenue
25
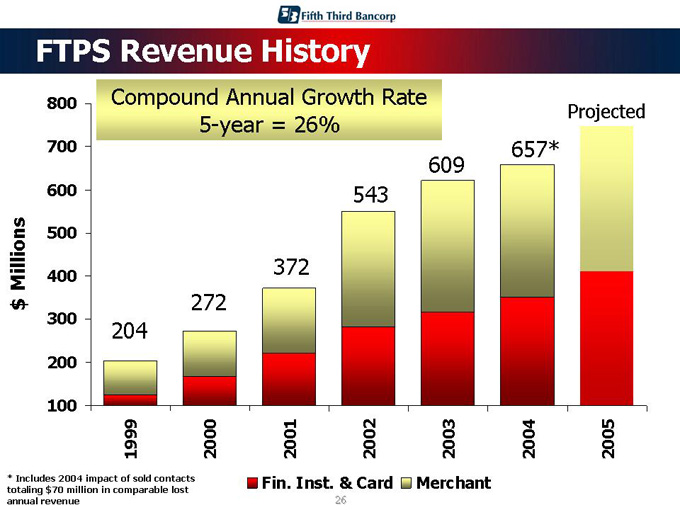
FTPS Revenue History
Compound Annual Growth Rate 5-year = 26% $ Millions
800 700 600 500 400 300 200 100
Projected
657
609 543
372 272 204
1999 2000 2001 2002 2003 2004 2005
Includes 2004 impact of sold contacts totaling $70 million in comparable lost annual revenue
Fin. Inst. & Card
Merchant
26
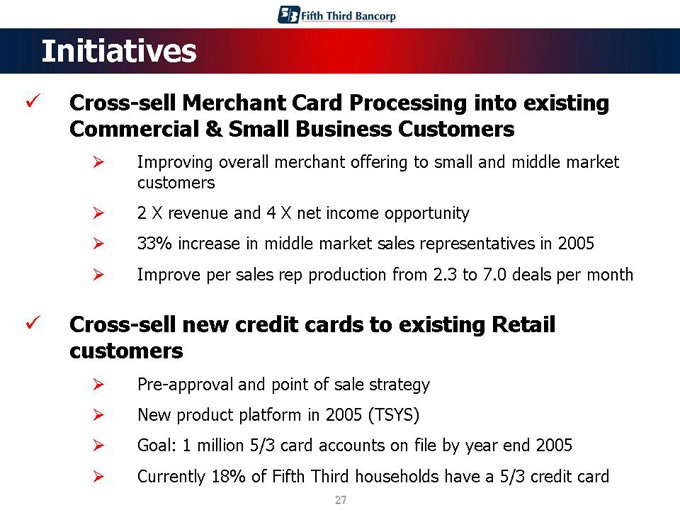
Initiatives
Cross-sell Merchant Card Processing into existing Commercial & Small Business Customers
Improving overall merchant offering to small and middle market customers 2 X revenue and 4 X net income opportunity 33% increase in middle market sales representatives in 2005 Improve per sales rep production from 2.3 to 7.0 deals per month
Cross-sell new credit cards to existing Retail customers
Pre-approval and point of sale strategy New product platform in 2005 (TSYS)
Goal: 1 million 5/3 card accounts on file by year end 2005 Currently 18% of Fifth Third households have a 5/3 credit card
27
Investment Advisors
I. Business Mix II. Initiatives
28
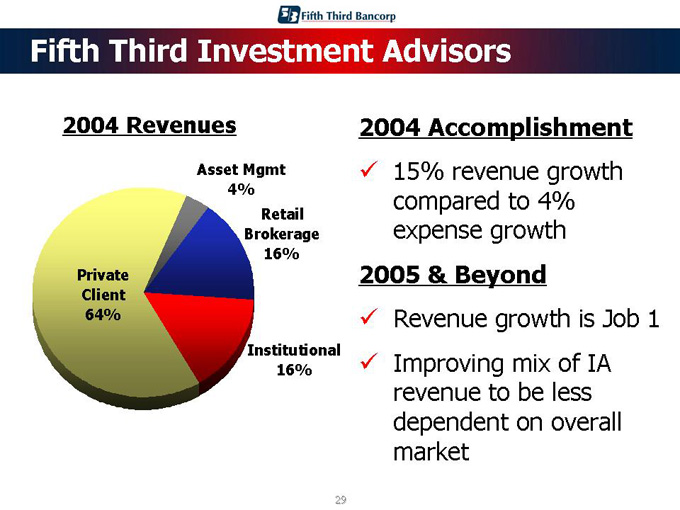
Fifth Third Investment Advisors
2004 Revenues
Asset Mgmt 4%
Retail Brokerage 16%
Institutional 16%
Private Client 64%
2004 Accomplishment
15% revenue growth compared to 4% expense growth
2005 & Beyond
Revenue growth is Job 1 Improving mix of IA revenue to be less dependent on overall market
29
Initiatives
Expand sales of investment management nationally through Fifth Third Asset Management (FTAM)
Taft-Hartley, Corporate and Public pension client focus
Penetrate commercial and small business client base with 401K Retirement Plans
Continued Expansion of Private Client and Retail Brokerage
Sales force additions in private banking and brokerage in newer markets New Affiliate Markets – Tennessee and Florida Expanded and enhanced product offerings (wealth planning, insurance and equity derivatives)
30
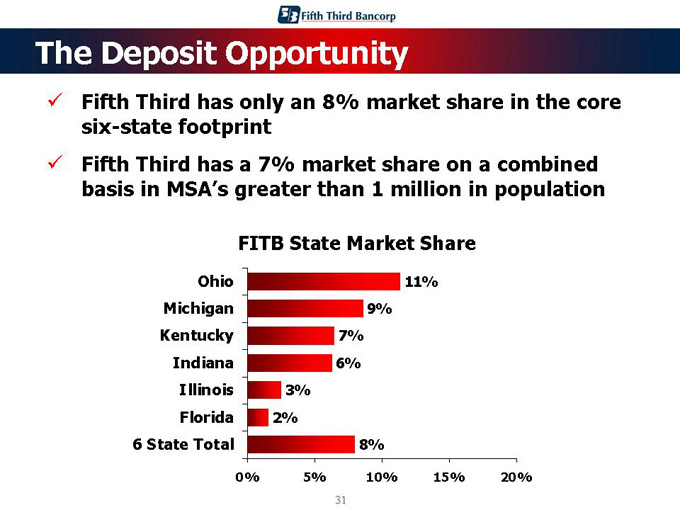
The Deposit Opportunity
Fifth Third has only an 8% market share in the core six-state footprint Fifth Third has a 7% market share on a combined basis in MSA’s greater than 1 million in population
FITB State Market Share
Ohio 11% Michigan 9% Kentucky 7% Indiana 6% Illinois 3% Florida 2% 6 State Total 8%
0% 5% 10% 15% 20%
31
Questions
This presentation may contain forward-looking statements about Fifth Third Bancorp and/or the company as combined with acquired entities within the meaning of Sections 27A of the Securities Act of 1933, as amended, and Rule 175 promulgated thereunder, and 21E of the Securities Exchange Act of 1934, as amended, and Rule 3b-6 promulgated thereunder, that involve inherent risks and uncertainties. This presentation may contain certain forward-looking statements with respect to the financial condition, results of operations, plans, objectives, future performance and business of Fifth Third Bancorp and/or the combined company including statements preceded by, followed by or that include the words or phrases such as “believes,” “expects,” “anticipates,” “plans,” “trend,” “objective,” “continue,” “remain” or similar expressions or future or conditional verbs such as “will,” “would,” “should,” “could,” “might,” “can,” “may” or similar expressions. There are a number of important factors that could cause future results to differ materially from historical performance and these forward-looking statements. Factors that might cause such a difference include, but are not limited to: (1) competitive pressures among depository institutions increase significantly; (2) changes in the interest rate environment reduce interest margins; (3) prepayment speeds, loan origination and sale volumes, charge-offs and loan loss provisions; (4) general economic conditions, either national or in the states in which Fifth Third and/or combined entities do business, are less favorable than expected; (5) political developments, wars or other hostilities may disrupt or increase volatility in securities markets or other economic conditions; (6) changes and trends in the securities markets; (7) legislative or regulatory changes or actions, or significant litigation, adversely affect Fifth Third and/or acquired entities or the businesses in which Fifth Third and/or combined entities are engaged; (8) difficulties in combining the operations of acquired entities and (9) the impact of reputational risk created by the developments discussed above on such matters as business generation and retention, funding and liquidity. We undertake no obligation to release revisions to these forward-looking statements or reflect events or circumstances after the date of this release. Further information on other factors which could affect the financial results of Fifth Third are included in Fifth Third’s and/or the acquired entity’s filings with the Securities and Exchange Commission. These documents are available free of charge at the Commission’s website at http://www.sec.gov and/or from Fifth Third.
32