Exhibit 99.1
2005 Merrill Lynch Financial Services Conference
“Investing in a Franchise”
Neal E. Arnold Executive Vice President
Terry E. Zink President Fifth Third Bank (Chicago)
November 17, 2005
1 |
|
Affiliates & Markets
I. Affiliate Operating Model
II. Markets
III. Loan Performance
IV. Deposit Performance
2
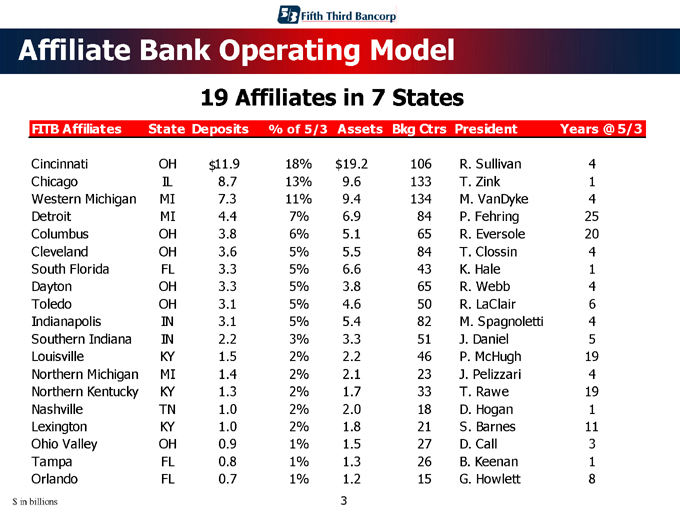
Affiliate Bank Operating Model
19 Affiliates in 7 States
FITB |
| Affiliates State Deposits % of 5/3 Assets Bkg Ctrs President Years @ 5/3 |
Cincinnati |
| OH $11.9 18% $19.2 106 R. Sullivan 4 |
Chicago |
| IL 8.7 13% 9.6 133 T. Zink 1 |
Western |
| Michigan MI 7.3 11% 9.4 134 M. VanDyke 4 |
Detroit |
| MI 4.4 7% 6.9 84 P. Fehring 25 |
Columbus |
| OH 3.8 6% 5.1 65 R. Eversole 20 |
Cleveland |
| OH 3.6 5% 5.5 84 T. Clossin 4 |
South |
| Florida FL 3.3 5% 6.6 43 K. Hale 1 |
Dayton |
| OH 3.3 5% 3.8 65 R. Webb 4 |
Toledo |
| OH 3.1 5% 4.6 50 R. LaClair 6 |
Indianapolis |
| IN 3.1 5% 5.4 82 M. Spagnoletti 4 |
Southern |
| Indiana IN 2.2 3% 3.3 51 J. Daniel 5 |
Louisville |
| KY 1.5 2% 2.2 46 P. McHugh 19 |
Northern |
| Michigan MI 1.4 2% 2.1 23 J. Pelizzari 4 |
Northern |
| Kentucky KY 1.3 2% 1.7 33 T. Rawe 19 |
Nashville |
| TN 1.0 2% 2.0 18 D. Hogan 1 |
Lexington |
| KY 1.0 2% 1.8 21 S. Barnes 11 |
Ohio |
| Valley OH 0.9 1% 1.5 27 D. Call 3 |
Tampa |
| FL 0.8 1% 1.3 26 B. Keenan 1 |
Orlando |
| FL 0.7 1% 1.2 15 G. Howlett 8 |
$ in billions
3 |
|
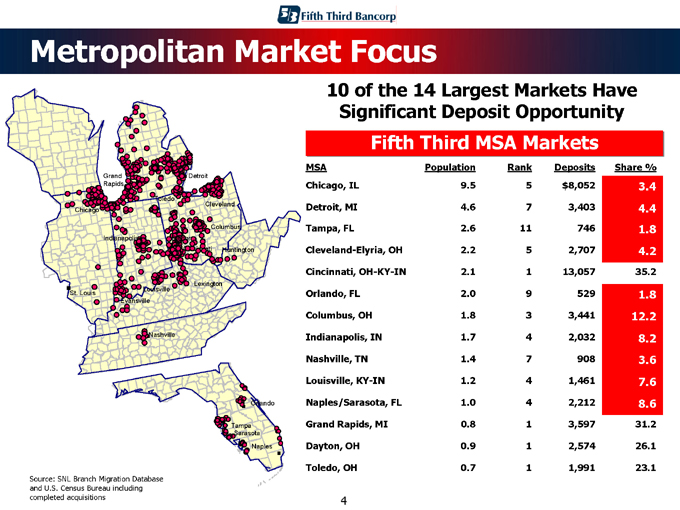
Metropolitan Market Focus
10 of the 14 Largest Markets Have Significant Deposit Opportunity
Fifth Third MSA Markets
MSA |
| Population Rank Deposits Share % |
Chicago, |
| IL 9.5 5 $8,052 3.4 |
Detroit, |
| MI 4.6 7 3,403 4.4 |
Tampa, |
| FL 2.6 11 746 1.8 |
Cleveland-Elyria, |
| OH 2.2 5 2,707 4.2 |
Cincinnati, |
| OH-KY-IN 2.1 1 13,057 35.2 |
Orlando, |
| FL 2.0 9 529 1.8 |
Columbus, |
| OH 1.8 3 3,441 12.2 |
Indianapolis, |
| IN 1.7 4 2,032 8.2 |
Nashville, |
| TN 1.4 7 908 3.6 |
Louisville, |
| KY-IN 1.2 4 1,461 7.6 |
Naples/Sarasota, |
| FL 1.0 4 2,212 8.6 |
Grand |
| Rapids, MI 0.8 1 3,597 31.2 |
Dayton, |
| OH 0.9 1 2,574 26.1 |
Toledo, |
| OH 0.7 1 1,991 23.1 |
Source: SNL Branch Migration Database and U.S. Census Bureau including completed acquisitions
4 |
|
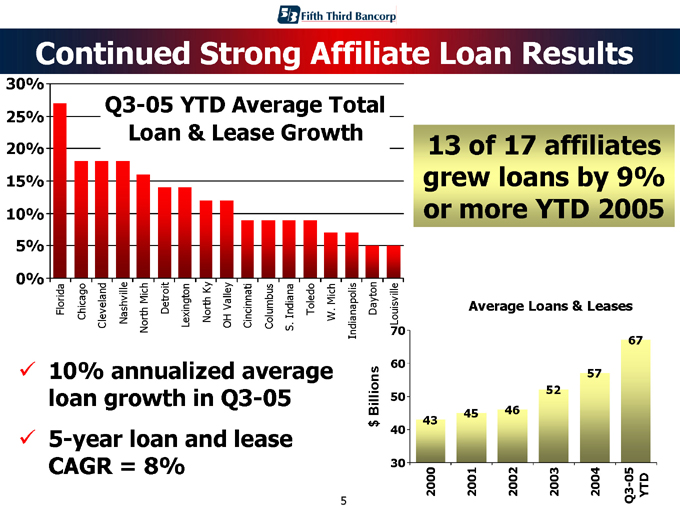
Continued Strong Affiliate Loan Results
30%
25%
20%
15%
10%
5%
0%
Florida Chicago Cleveland Nashville North Mich Detroit Lexington North Ky OH Valley Cincinnati Columbus S. Indiana Toledo W. Mich Indianapolis Dayton
Louisville
Q3-05 YTD Average Total Loan & Lease Growth
13 of 17 affiliates grew loans by 9% or more YTD 2005
10% annualized average loan growth in Q3-05 5-year loan and lease CAGR = 8% $ Billions
70
60
50
40
30
43
45
46
52
57
67
Average Loans & Leases
2000 2001 2002 2003
2004
Q3-05 YTD
5 |
|
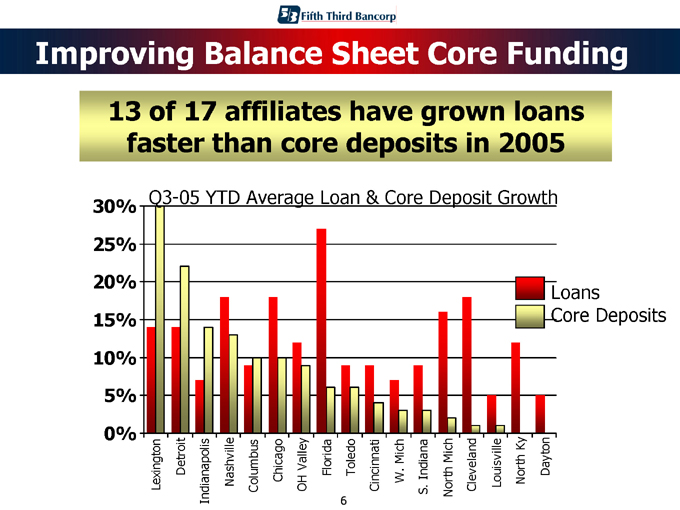
Improving Balance Sheet Core Funding
13 of 17 affiliates have grown loans faster than core deposits in 2005
Q3-05 YTD Average Loan & Core Deposit Growth
30%
25%
20%
15%
10%
5%
0%
Loans Core Deposits
Lexington Detroit Indianapolis
Nashville Columbus Chicago OH Valley Florida Toledo Cincinnati W. Mich S. Indiana North Mich Cleveland Louisville North Ky Dayton
6 |
|
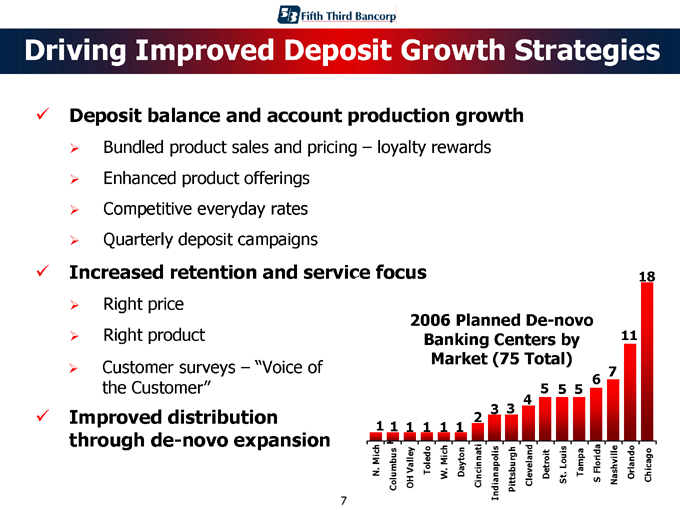
Driving Improved Deposit Growth Strategies
Deposit balance and account production growth
Bundled product sales and pricing – loyalty rewards
Enhanced product offerings
Competitive everyday rates
Quarterly deposit campaigns
Increased retention and service focus
Right price
Right product
Customer surveys – “Voice of the Customer”
Improved distribution through de-novo expansion
2006 Planned De-novo Banking Centers by Market (75 Total)
1 |
| 1 1 1 1 1 2 3 3 4 5 5 5 6 7 11 18 |
N.Mich Columbus OH Valley Toledo W. Mich Dayton Cincinnati Indianapolis Pittsburgh Cleveland Detroit St. Louis Tampa S Florida Nashville Orlando Chicago
7 |
|
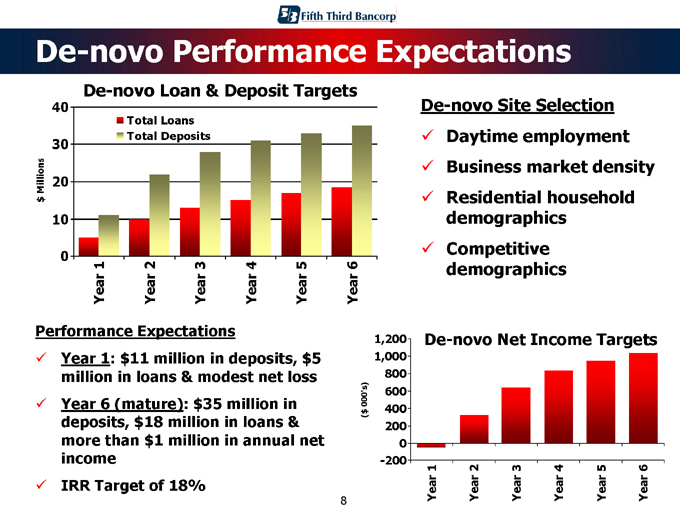
De-novo Performance Expectations
De-novo Loan & Deposit Targets $ Millions
40 30 20 10 0
Total Loans Total Deposits
Year 1 Year 2 Year 3 Year 4 Year 5 Year 6
Performance Expectations
Year 1: $11 million in deposits, $5 million in loans & modest net loss
Year 6 (mature): $35 million in deposits, $18 million in loans & more than $1 million in annual net income
IRR Target of 18%
De-novo Site Selection
Daytime employment
Business market density
Residential household demographics
Competitive demographics
De-novo Net Income Targets
($ 000’s)
1,200 1,000 800 600 400 200 0 -200
Year 1 Year 2 Year 3 Year 4 Year 5 Year 6
8 |
|
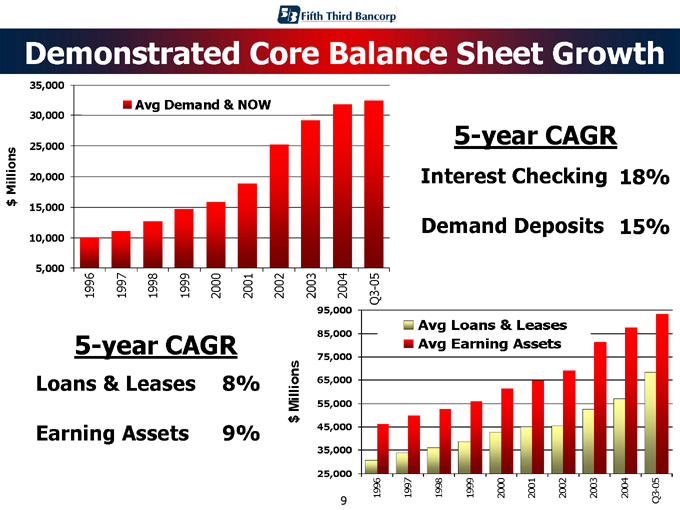
Demonstrated Core Balance Sheet Growth $ Millions
35,000
30,000
25,000 20,000 15,000 10,000 5,000
Avg Demand & NOW
1996 1997 1998 1999 2000 2001 2002 2003 2004 Q3-05
5-year CAGR
Interest Checking 18%
Demand Deposits 15%
5-year CAGR
Loans & Leases 8%
Earning Assets 9% $ Millions
95,000 85,000 75,000 65,000 55,000 45,000 35,000 25,000
Avg Loans & Leases Avg Earning Assets
1996 1997 1998 1999 2000 2001 2002 2003 2004 Q3-05
9
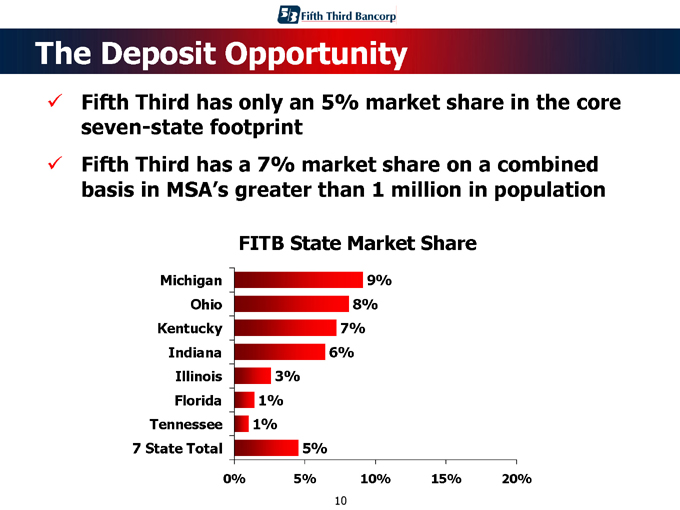
The Deposit Opportunity
Fifth Third has only an 5% market share in the core seven-state footprint Fifth Third has a 7% market share on a combined basis in MSA’s greater than 1 million in population
FITB State Market Share
Michigan Ohio Kentucky Indiana Illinois Florida Tennessee 7 State Total
9%
8%
7%
6%
3%
1%
1%
5%
0% 5% 10% 15% 20%
10
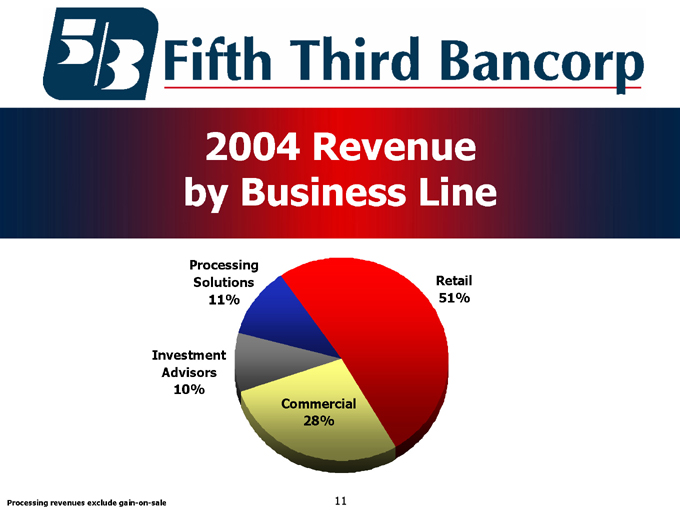
2004 Revenue by Business Line
Processing Solutions 11%
Investment Advisors 10%
Retail 51%
Commercial 28%
Processing revenues exclude gain-on-sale
11
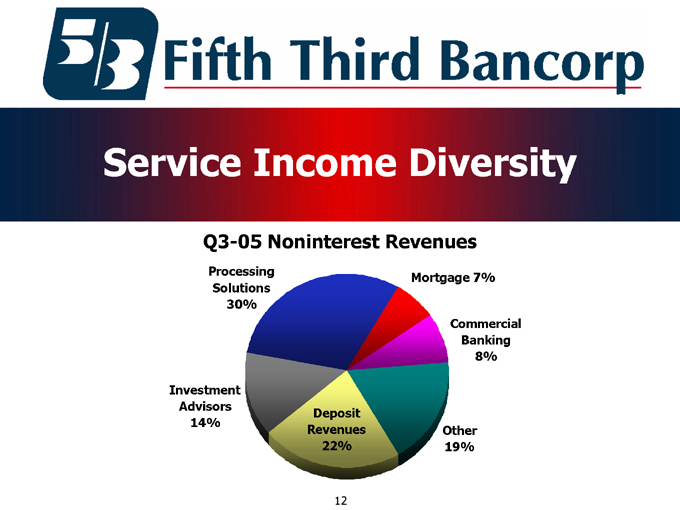
Service Income Diversity
Q3-05 Noninterest Revenues
Processing Solutions 30%
Investment Advisors 14%
Mortgage 7%
Commercial Banking 8%
Other 19%
Deposit Revenues 22%
12
Fifth Third Bank (Chicago)
I. Market Summary
II. Historical Performance
III. Retail Banking
IV. De-novo Strategy
V. Commercial Banking
13
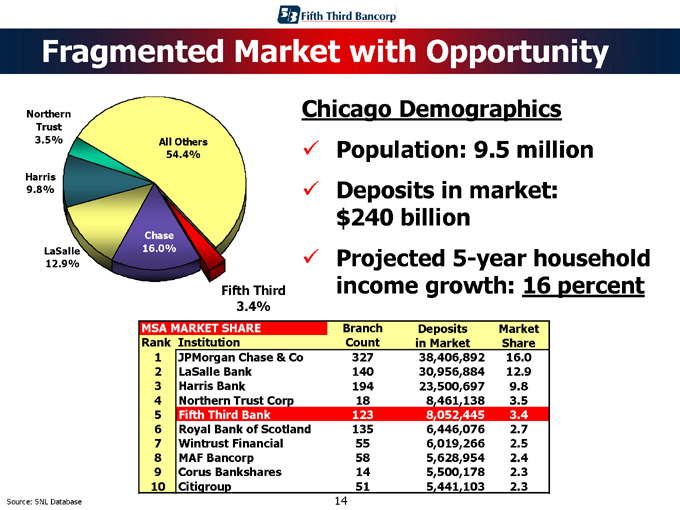
Fragmented Market with Opportunity
Northern Trust 3.5%
Harris 9.8%
LaSalle 12.9%
All Others 54.4%
Chase 16.0%
Fifth Third 3.4%
Chicago Demographics
Population: 9.5 million Deposits in market: $240 billion Projected 5-year household income growth: 16 percent
MSA |
| MARKET SHARE Branch Deposits Market |
Rank |
| Institution Count in Market Share |
1 |
| JPMorgan Chase & Co 327 38,406,892 16.0 |
2 |
| LaSalle Bank 140 30,956,884 12.9 |
3 |
| Harris Bank 194 23,500,697 9.8 |
4 |
| Northern Trust Corp 18 8,461,138 3.5 |
5 |
| Fifth Third Bank 123 8,052,445 3.4 |
6 |
| Royal Bank of Scotland 135 6,446,076 2.7 |
7 |
| Wintrust Financial 55 6,019,266 2.5 |
8 |
| MAF Bancorp 58 5,628,954 2.4 |
9 |
| Corus Bankshares 14 5,500,178 2.3 |
10 |
| Citigroup 51 5,441,103 2.3 |
Source: SNL Database
14
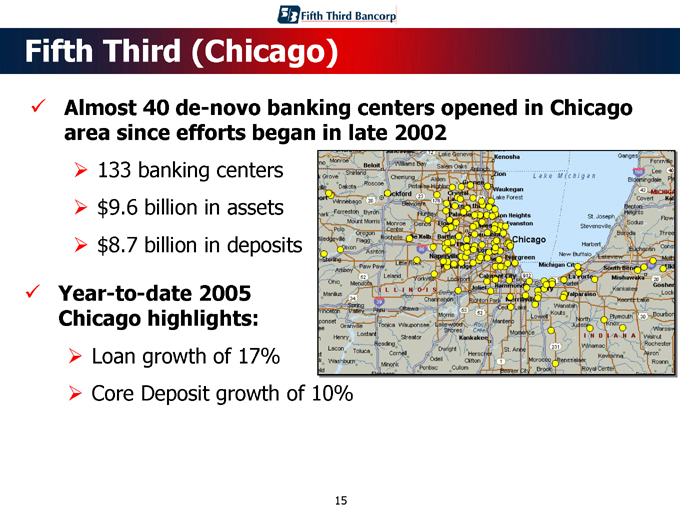
Fifth Third (Chicago)
Almost 40 de-novo banking centers opened in Chicago area since efforts began in late 2002
133 banking centers $9.6 billion in assets $8.7 billion in deposits
Year-to-date 2005 Chicago highlights:
Loan growth of 17% Core Deposit growth of 10%
15
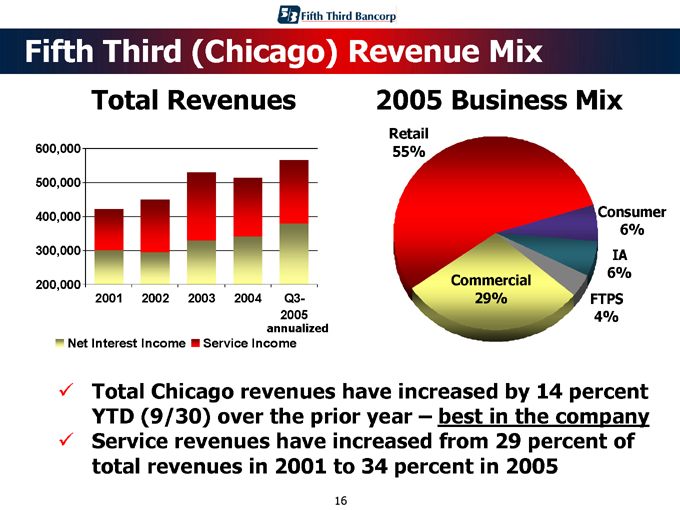
Fifth Third (Chicago) Revenue Mix
Total Revenues
600,000 500,000 400,000 300,000 200,000
2001 2002 2003 2004 Q3-2005 annualized
Net Interest Income Service Income
2005 Business Mix
Retail 55%
Commercial 29%
Consumer 6%
IA 6%
FTPS 4%
Total Chicago revenues have increased by 14 percent YTD (9/30) over the prior year – best in the company Service revenues have increased from 29 percent of total revenues in 2001 to 34 percent in 2005
16
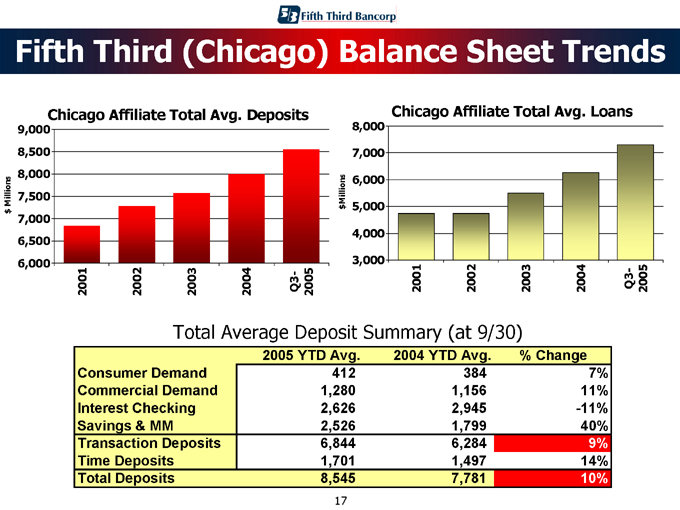
Fifth Third (Chicago) Balance Sheet Trends
Chicago Affiliate Total Avg. Deposits $ Millions
9,000 8,500 8,000 7,500 7,000 6,500 6,000
2001 2002 2003
2004
Q3-2005
Chicago Affiliate Total Avg. Loans $ Millions
8,000 7,000 6,000 5,000 4,000 3,000
2001 2002 2003
2004
Q3-2005
Total Average Deposit Summary (at 9/30)
2005 |
| YTD Avg. 2004 YTD Avg. % Change |
Consumer |
| Demand 412 384 7% |
Commercial |
| Demand 1,280 1,156 11% |
Interest |
| Checking 2,626 2,945 -11% |
Savings |
| & MM 2,526 1,799 40% |
Transaction |
| Deposits 6,844 6,284 9% |
Time |
| Deposits 1,701 1,497 14% |
Total |
| Deposits 8,545 7,781 10% |
17
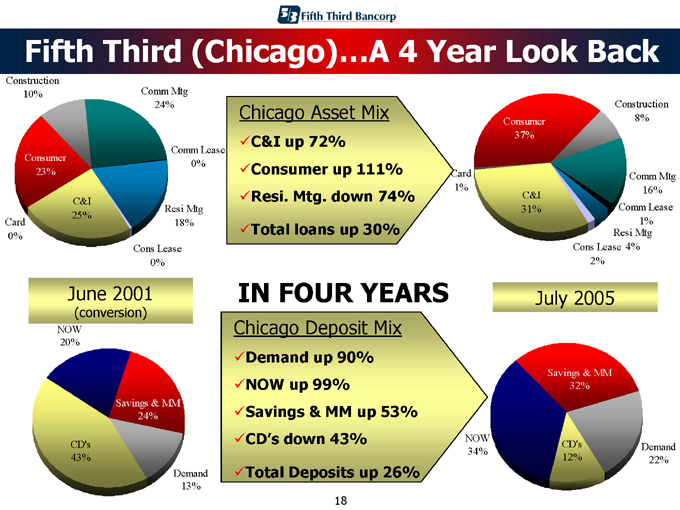
Fifth Third (Chicago)…A 4 Year Look Back
Construction 10%
Consumer 23%
Card 0%
C&I 25%
Comm Mtg 24%
Comm Lease 0%
Resi Mtg 18%
Cons Lease 0%
June 2001
(conversion)
NOW 20%
Savings & MM
24%
CD’s 43%
Demand 13%
Chicago Asset Mix
C&I up 72% Consumer up 111% Resi. Mtg. down 74% Total loans up 30%
Card 1%
Consumer 37%
Construction 8%
Comm Mtg 16%
Comm Lease 1%
Resi Mtg 4%
C&I 31%
Cons Lease 2%
IN FOUR YEARS
Chicago Deposit Mix
Demand up 90% NOW up 99% Savings & MM up 53% CD’s down 43% Total Deposits up 26%
July 2005
Now 34%
Savings & MM
32%
CD’s 12%
Demand 22%
18
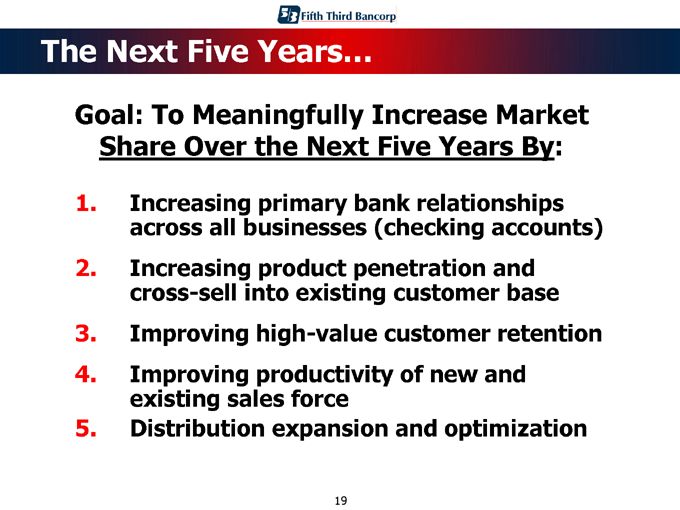
The Next Five Years…
Goal: To Meaningfully Increase Market Share Over the Next Five Years By:
1. Increasing primary bank relationships across all businesses (checking accounts)
2. Increasing product penetration and cross-sell into existing customer base
3. Improving high-value customer retention
4. Improving productivity of new and existing sales force
5. Distribution expansion and optimization
19
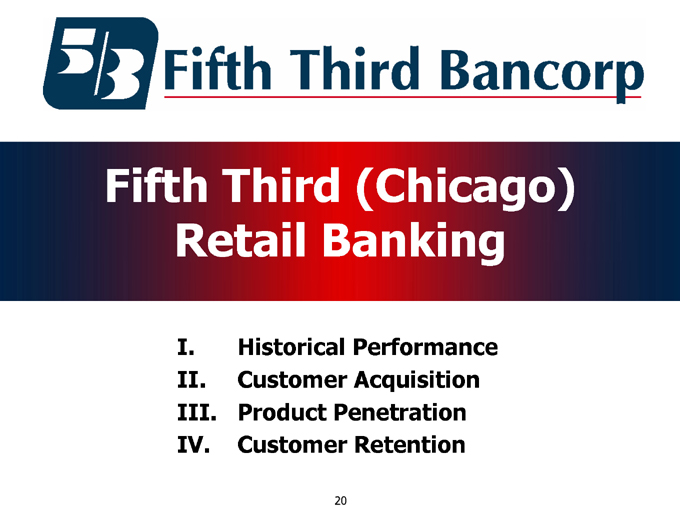
Fifth Third (Chicago) Retail Banking
I. Historical Performance II. Customer Acquisition III. Product Penetration IV. Customer Retention
20
Fifth Third (Chicago) Retail Performance
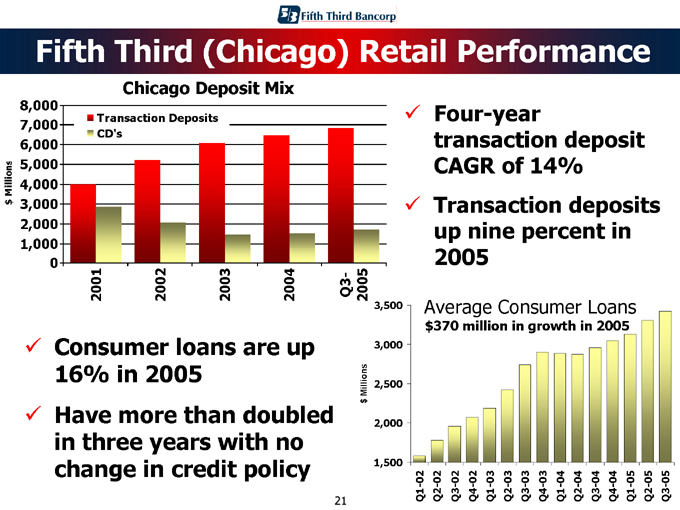
Chicago Deposit Mix $ Millions
8,000 7,000 6,000 5,000 4,000 3,000 2,000 1,000 0
Transaction Deposits CD’s
2001 2002 2003
2004
Q3-2005
Four-year transaction deposit CAGR of 14% Transaction deposits up nine percent in 2005
Consumer loans are up 16% in 2005 Have more than doubled in three years with no change in credit policy $ Millions
3,000 2,500 2,000 1,500
Average Consumer Loans
$370 million in growth in 2005
Q1-02 Q2-02 Q3-02 Q4-02 Q1-03 Q2-03 Q3-03 Q4-03 Q1-04 Q2-04 Q3-04 Q4-04 Q1-05 Q2-05 Q3-Q5
21
Customer Acquisition
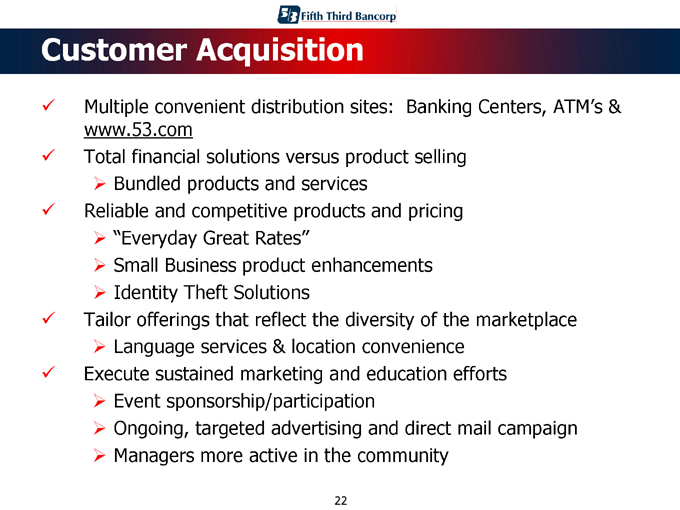
Multiple convenient distribution sites: Banking Centers, ATM’s & www.53.com
Total financial solutions versus product selling
Bundled products and services
Reliable and competitive products and pricing
“Everyday Great Rates”
Small Business product enhancements
Identity Theft Solutions
Tailor offerings that reflect the diversity of the marketplace
Language services & location convenience
Execute sustained marketing and education efforts
Event sponsorship/participation
Ongoing, targeted advertising and direct mail campaign
Managers more active in the community
22
Product Penetration
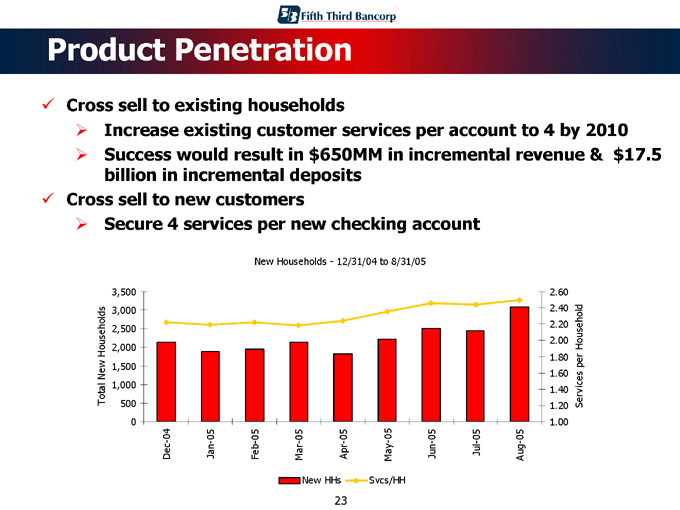
Cross sell to existing households
Increase existing customer services per account to 4 by 2010
Success would result in $650MM in incremental revenue & $17.5 billion in incremental deposits
Cross sell to new customers
Secure 4 services per new checking account
New Households—12/31/04 to 8/31/05
Total New Households
3,500 3,000 2,500 2,000 1,500 1,000 500 0
Dec-04 Jan-05 Feb-05 Mar-05 Apr-05 May-05 Jun-05 Jul-05 Aug-05
2.60 2.40 2.20 2.00 1.80 1.60 1.40 1.20 1.00
Services per Household
New HHs
Svcs/HH
23
Customer Retention
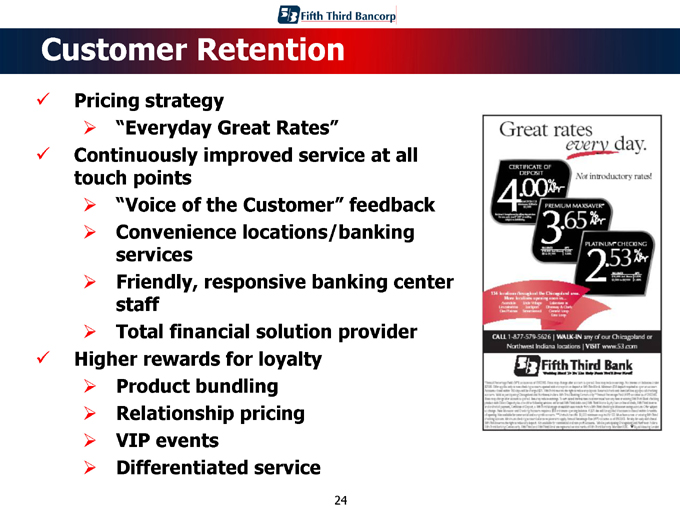
Pricing strategy
“Everyday Great Rates”
Continuously improved service at all touch points
“Voice of the Customer” feedback
Convenience locations/banking services
Friendly, responsive banking center staff
Total financial solution provider
Higher rewards for loyalty
Product bundling
Relationship pricing
VIP events
Differentiated service
24
Fifth Third (Chicago) De-novo Expansion
To strategically position Fifth Third as the preferred “Convenience and Community” financial provider in optimal neighborhoods and urban work-hoods
25
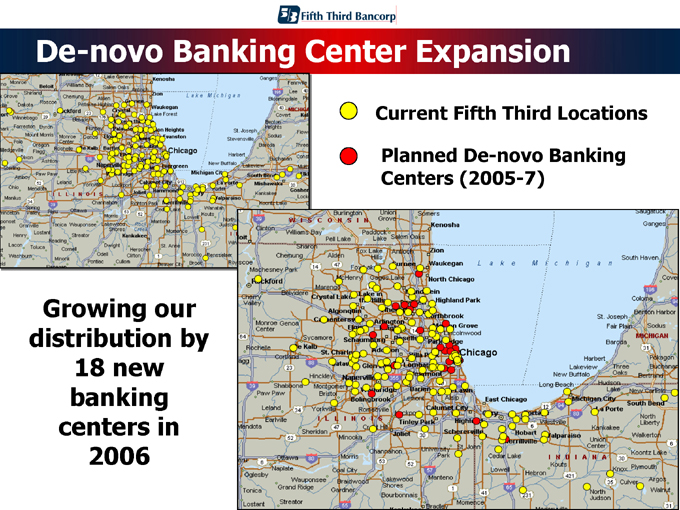
De-novo Banking Center Expansion
Current Fifth Third Locations
Planned De-novo Banking Centers (2005-7)
Growing our distribution by 18 new banking centers in 2006
26
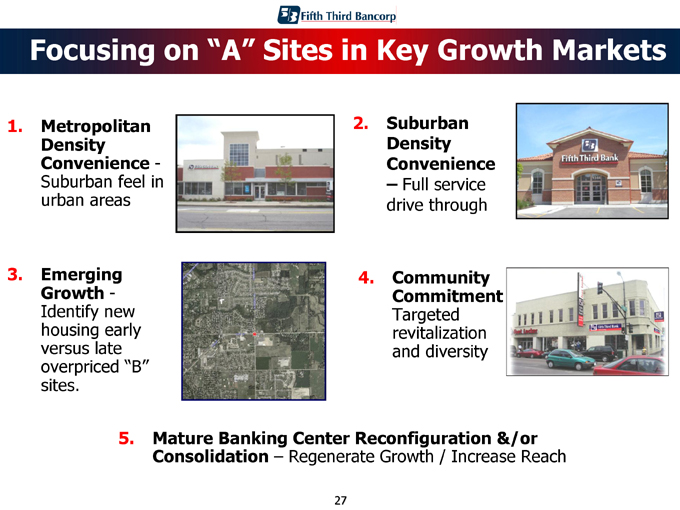
Focusing on “A” Sites in Key Growth Markets
1. Metropolitan Density Convenience -Suburban feel in urban areas
2. Suburban Density Convenience
– Full service drive through
3. Emerging Growth -Identify new housing early versus late overpriced “B” sites.
4. Community Commitment
Targeted revitalization and diversity
5. Mature Banking Center Reconfiguration &/or Consolidation – Regenerate Growth / Increase Reach
27
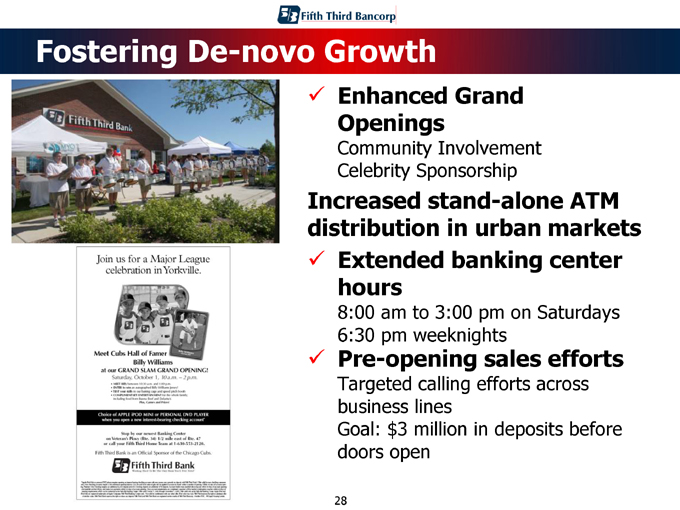
Fostering De-novo Growth
Enhanced Grand Openings
Community Involvement Celebrity Sponsorship
Increased stand-alone ATM distribution in urban markets
Extended banking center hours
8:00 am to 3:00 pm on Saturdays 6:30 pm weeknights
Pre-opening sales efforts
Targeted calling efforts across business lines
Goal: $3 million in deposits before doors open
28
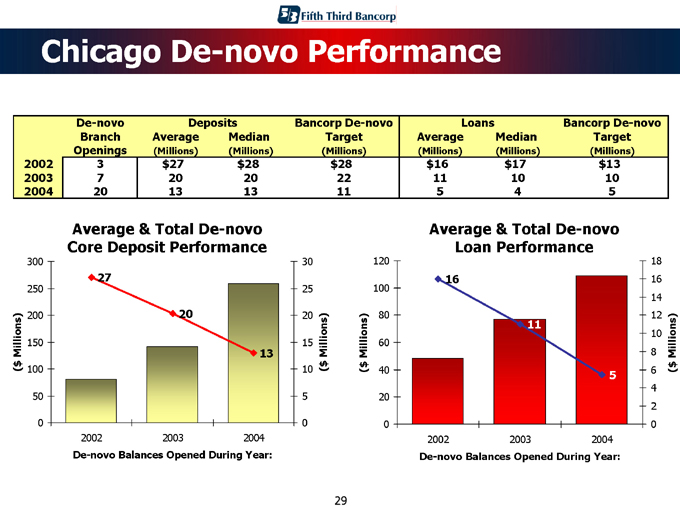
Chicago De-novo Performance
De-novo |
| Deposits Bancorp De-novo Loans Bancorp De-novo |
Branch Openings Average (Millions) Median (Millions) Target (Millions) Average (Millions) Median (Millions) Target (Millions)
2002 |
| 3 $27 $28 $28 $16 $17 $13 |
2003 |
| 7 20 20 22 11 10 10 |
2004 |
| 20 13 13 11 5 4 5 |
Average & Total De-novo Core Deposit Performance
($ Millions)
300 250 200 150 100 50 0
27
20
13
30 25 20 15 10 5 0
($ Millions)
2002 2003 2004
De-novo Balances Opened During Year:
Average & Total De-novo Loan Performance
($ Millions)
120 100 80 60 40 20 0
16
11
5 |
|
18 16 14 12 10 8 6 4 2 0
($ Millions)
2002 2003 2004
De-novo Balances Opened During Year:
29
Fifth Third (Chicago) Commercial Banking
I. Strong Historical Performance
II. Target high-value customers
III. Increase customer penetration
IV. Continue market positioning
30
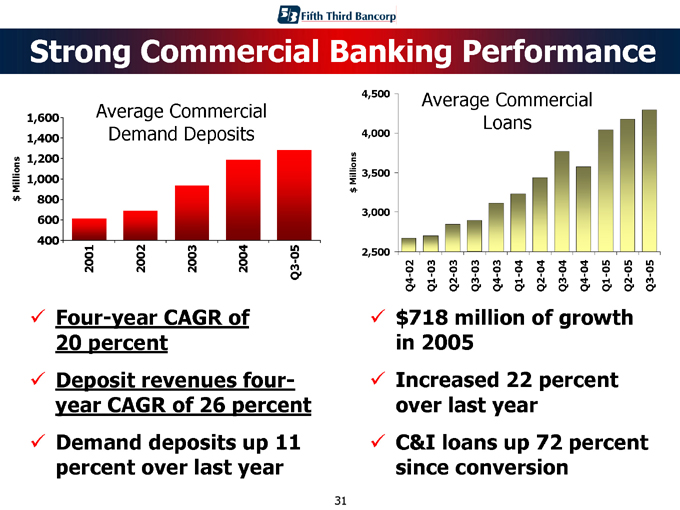
Strong Commercial Banking Performance
Average Commercial Demand Deposits $ Millions
1,600 1,400 1,200 1,000 800 600 400
2001
2002 2003 2004
Q3-05
Four-year CAGR of 20 percent
Deposit revenues four-year CAGR of 26 percent
Demand deposits up 11 percent over last year
Average Commercial Loans $ Millions
4,500 4,000 3,500 3,000 2,500
Q4-02 Q1-03 Q2-03 Q3-03 Q4-03 Q1-04 Q2-04 Q3-04 Q4-04 Q1-05 Q2-05 Q3-05 $718 million of growth in 2005 Increased 22 percent over last year C&I loans up 72 percent since conversion
31
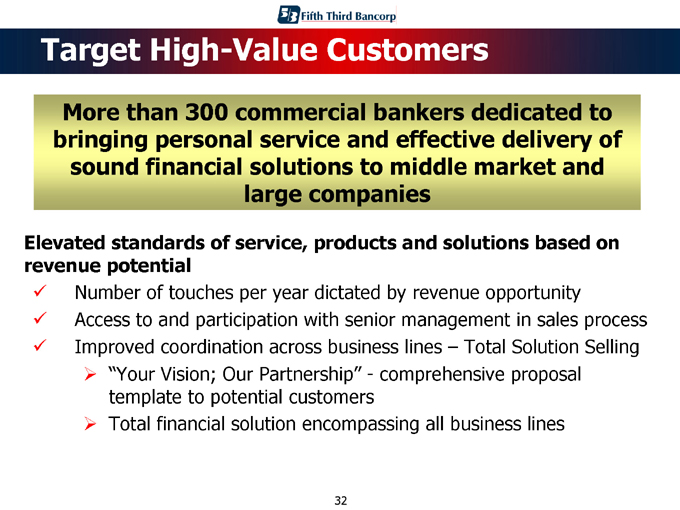
Target High-Value Customers
More than 300 commercial bankers dedicated to bringing personal service and effective delivery of sound financial solutions to middle market and large companies
Elevated standards of service, products and solutions based on revenue potential
Number of touches per year dictated by revenue opportunity
Access to and participation with senior management in sales process
Improved coordination across business lines – Total Solution Selling
“Your Vision; Our Partnership” - comprehensive proposal template to potential customers
Total financial solution encompassing all business lines
32
Increase Customer Penetration
Goal is to penetrate existing Commercial and other business line customers by identifying and executing cross-sell opportunities
Introducing competitively priced and innovative products to truly differentiate Fifth Third in the marketplace Establishing minimum calling and production standards
Each customer meeting includes a different Fifth Third business partner (i.e., Investment Advisors, Retail)
Scorecard will be uniform for all relationship managers
Supported by weekly coaching sessions
Measured systematically to recognize and reward high performers
33
Ongoing Market Positioning
Maintain Momentum By:
Continued strength in loan and deposit generation with ongoing commitment to credit quality Continuing to differentiate Fifth Third from the competition
Local decision making
Total value proposition
Responsiveness
Sense of urgency
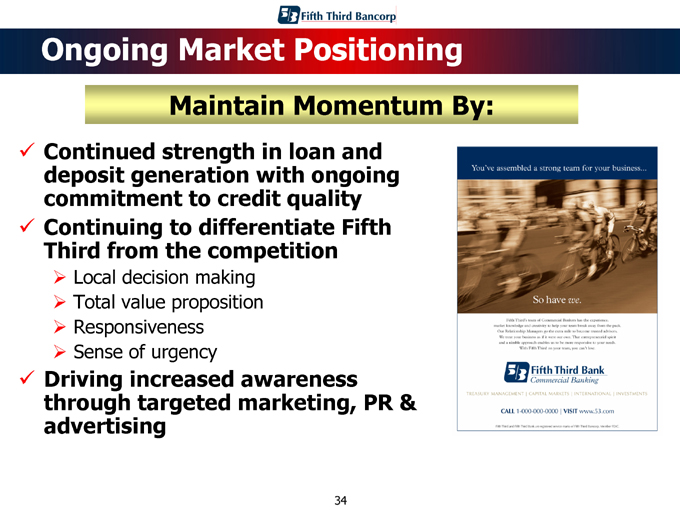
Driving increased awareness through targeted marketing, PR & advertising
34
Questions
This presentation may contain forward-looking statements about Fifth Third Bancorp and/or the company as combined with acquired entities within the meaning of Sections 27A of the Securities Act of 1933, as amended, and Rule 175 promulgated thereunder, and 21E of the Securities Exchange Act of 1934, as amended, and Rule 3b-6 promulgated thereunder, that involve inherent risks and uncertainties. This presentation may contain certain forward-looking statements with respect to the financial condition, results of operations, plans, objectives, future performance and business of Fifth Third Bancorp and/or the combined company including statements preceded by, followed by or that include the words or phrases such as “believes,” “expects,” “anticipates,” “plans,” “trend,” “objective,” “continue,” “remain” or similar expressions or future or conditional verbs such as “will,” “would,” “should,” “could,” “might,” “can,” “may” or similar expressions. There are a number of important factors that could cause future results to differ materially from historical performance and these forward-looking statements. Factors that might cause such a difference include, but are not limited to: (1) competitive pressures among depository institutions increase significantly; (2) changes in the interest rate environment reduce interest margins; (3) prepayment speeds, loan origination and sale volumes, charge-offs and loan loss provisions; (4) general economic conditions, either national or in the states in which Fifth Third and/or combined entities do business, are less favorable than expected; (5) political developments, wars or other hostilities may disrupt or increase volatility in securities markets or other economic conditions; (6) changes and trends in the securities markets; (7) legislative or regulatory changes, actions or approvals, or significant litigation, adversely affect Fifth Third and/or acquired entities or the businesses in which Fifth Third and/or combined entities are engaged; (8) difficulties in combining the operations of acquired entities and (9) the impact of reputational risk created by the developments discussed above on such matters as business generation and retention, funding and liquidity. We undertake no obligation to release revisions to these forward-looking statements or reflect events or circumstances after the date of this release. Further information on other factors which could affect the financial results of Fifth Third are included in Fifth Third’s and/or the acquired entity’s filings with the Securities and Exchange Commission. These documents are available free of charge at the Commission’s website at http://www.sec.gov and/or from Fifth Third.
The financial information for affiliate operating segments in this presentation is reported on the basis used internally by the Bancorp’s management to evaluate performance and allocate resources. Allocations have been consistently applied for all periods presented. The performance measurement of the operating segments is based on the management structure of the Bancorp and is not necessarily comparable with similar information for any other financial institution. The information presented is also not necessarily indicative of the segments’ financial condition and results of operations if they were independent entities.
35