 Fifth Third Bank | All Rights Reserved Investor Update August 2007 Exhibit 99.1 |
 Fifth Third Bank | All Rights Reserved Strategic Overview August 2007 Kevin Kabat, President, Chief Executive Officer 2 |
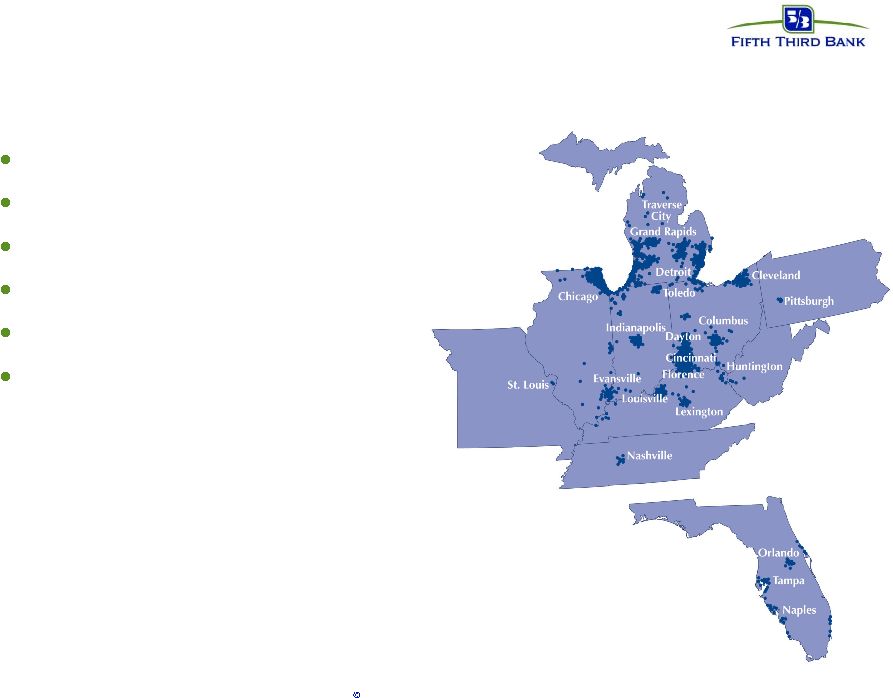 3 Fifth Third Bank | All Rights Reserved Fifth Third profile $101 billion assets (#13) $20 billion market cap* (#12) 1,167 banking centers 2,132 ATMs 18 affiliates in 10 states $1.5 billion operating income # * as of 8/22/07. # 2Q07 annualized. |
 4 Fifth Third Bank | All Rights Reserved Historical context Strong sales culture — Loan, deposit growth > industry — Affiliate/entrepreneurial drive Strong expense management — Low 50s efficiency ratio Average service/customer satisfaction — “Sold through” attrition (e.g., DDA high-teens) Internal orientation Retain and leverage historical strengths while capturing incremental growth opportunities |
 5 Fifth Third Bank | All Rights Reserved Strategic focus: 2007–2009 Strategic focus: 2007–2009 Deliver growth in excess of industry Enhance the customer experience Increase employee engagement Institutionalize enterprise operational excellence Banking Banking Processing Processing Investments Investments Employee Engagement Customer Experience Operational Excellence Fifth Third Bank |
 6 Fifth Third Bank | All Rights Reserved Growth opportunities Areas of evident success — De novo – accelerate new branch openings — Credit card – increase cardholder acquisition — Healthcare – enhance product offerings, specialized channel Works in progress — Middle market expansion – expand products, services, and sales — Commercial underserved markets – targeted markets for deployment of additional bankers and teams — Small business banking – leverage existing distribution channels Deferred — Commercial new markets (LPOs) – targeted markets for deployment of additional bankers and teams |
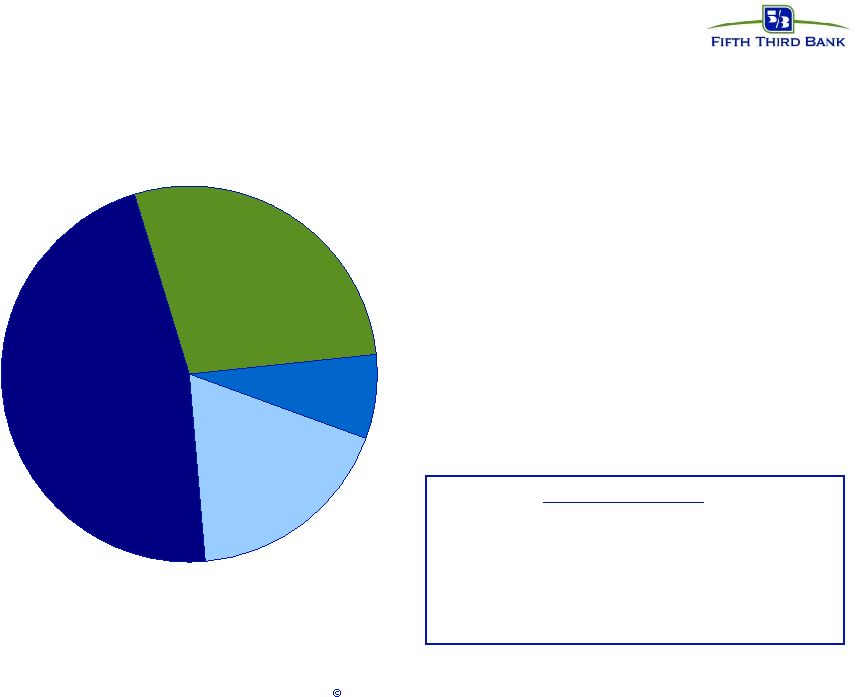 7 Fifth Third Bank | All Rights Reserved De novo activities De novo statistics • Mature* deposits $40MM • Mature* loans $13MM • Expected IRR 20%+ • Breakeven 20 months • Cumulative breakeven 36 months • Opened 55 total new branches in the past 12 months • Continue to invest in high opportunity markets • Site selection focuses on market potential, predictive modeling and IRR optimization • De novo activity has been, and will continue to be, of significant economic value to Fifth Third 2007- 2009 planned builds 47% 28% 7% 18% Florida Chicago Other Tennessee * Six years |
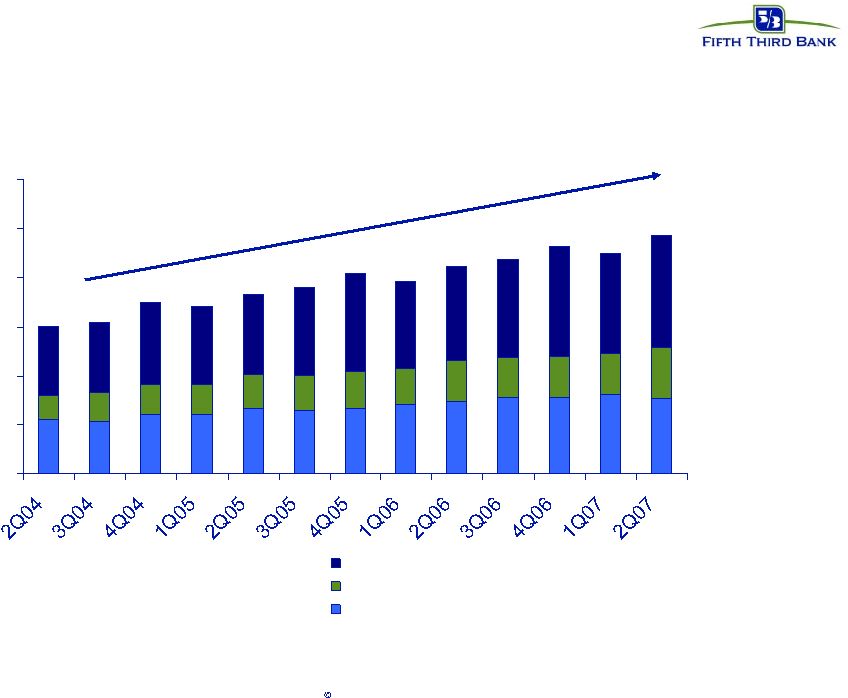 8 Fifth Third Bank | All Rights Reserved EPP: Strong growth, high value business 0 50 100 150 200 250 300 Merchant Card Interchange FI/EFT CAGR 12% CAGR 30% CAGR 16% CAGR 17% |
 9 Fifth Third Bank | All Rights Reserved Credit cards: capturing our fair share 13th largest bank, 24th largest credit card issuer We’ve underinvested in the credit card business relative to competitors Significant opportunity in high risk-adjusted return business — Improve retail production by deploying sales technologies to enhance ease of sale — Move from “ultra” conservative underwriting to “conservative” underwriting (weighted average FICO from >740 to >720) — Optimize profitability of existing portfolio through modest investments in marketing, analytics, and human capital Goal: double assets, accounts, net income by 2009 Assets Accounts Net income 2006 2009 1,100 2,400 1.0 2.0 41 83 ($ MMs) |
 10 Fifth Third Bank | All Rights Reserved Reengineering retail sales management Reduction of non-sales activities for sales employees in banking centers — Dedicated branch service personnel combined with improved back office support to maximize sales effectiveness Consistent sales management process — Performance expectations set for each role with incentive pay based on sales and service Individual productivity reporting — Scorecards available on all sales employees daily to highlight strengths and identify focus areas Consistent branded sales process — New tools, products, and marketing integrated with our new brand promise across the footprint Role clarity between sales and service |
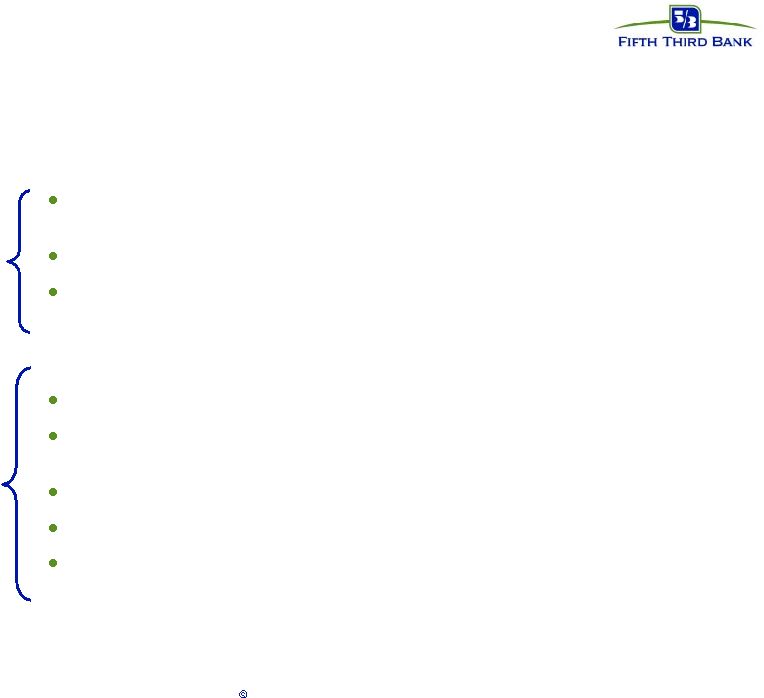 11 Fifth Third Bank | All Rights Reserved Retail Banking - Branded Sales and Service Process Launched January 2007 Consistent branded process – Across all 18 Affiliates, with scalability & transferability to support growth Role clarity tied to sales & service execution Removal of non-sales activities from financial centers Sales management process tied to new brand promise Individual productivity reporting and performance goals for increased accountability, tied to incentive compensation Greater accountability around service execution Improved product strategy Refreshed rewards & recognition program Sales Process Sales Management Process |
 12 Fifth Third Bank | All Rights Reserved Fifth Third: relative service performance 54% 29% 76% 74% 51% 58% 0% 20% 40% 60% 80% 100% Overall Satisfaction Loyalty Problem Incidence 3Q05 2Q07 45% 55% 36% 46% 27% 21% 2007 Key Actions Financial Center service optimization initiative launched Add KDI component to new incentive compensation plan Financial Center action planning in place Implementing a consistent process and support tools for handling customers problems at the Financial Centers and Call Center Creating a central escalation team to manage problems that cannot be resolved immediately Source : Gallup Customer Surveys: 3Q05/2Q07 Percentages within bars = % of surveyed customers rating metric at target level or experiencing a problem Goal: 75 th percentile |
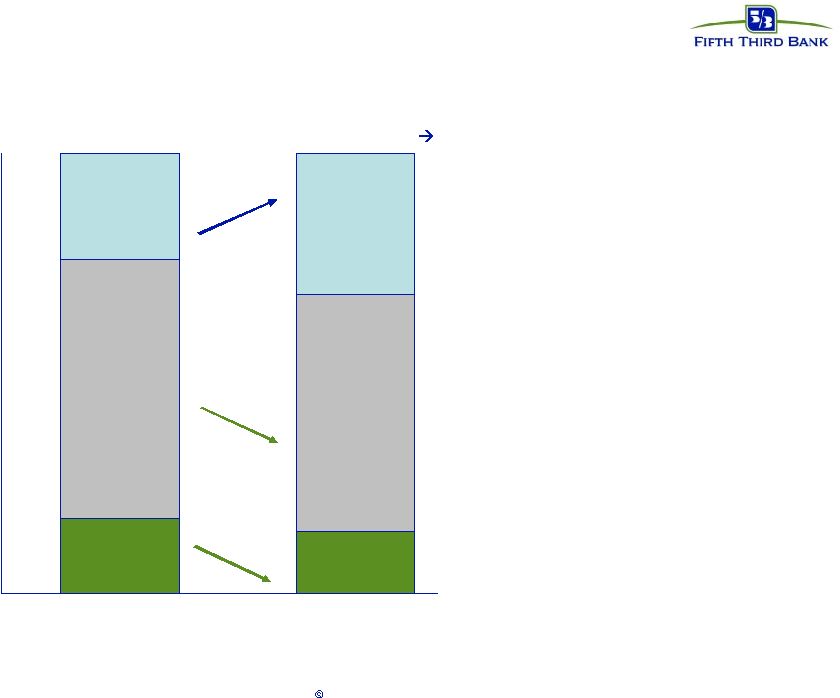 13 Fifth Third Bank | All Rights Reserved Copyright © 2007 The Gallup Organization, Princeton, NJ. All rights reserved. 14 59 54 24 32 17 0% 20% 40% 60% 80% 100% Fifth Third Bank Overall 2005 Fifth Third Bank Overall 2007 Engaged Not Engaged Actively Disengaged 1.41:1 2.29:1 Ratio of Engaged to Actively Disengaged * Source: Gallup Poll data of U.S. working population 18 years and older, accumulated during 2006 2.67:1 2007 Gallup Overall Database 2.00:1 U.S. Working Population* Employee Engagement update +33% - 8% -18% |
 14 Fifth Third Bank | All Rights Reserved Enterprise Operational Excellence Improve operational efficiencies — Standardize, digitize and optimize core processes — Deploy technology to eliminate manual processes and improve quality — Reducing cycle times and errors is increasing customer satisfaction Modernize servicing platforms and capabilities — Understand our customers, know our customer & know their issues — Call Center transformation to improve customer experiences — Provide seamless & consistent support between web, voice, ATM, etc. Integrated product suites to help our customers be more effective — Remote Capture product suite — Virtual vault — National Lockbox — Healthcare EOB 835 suite |
 15 Fifth Third Bank | All Rights Reserved Fifth Third: building a better tomorrow Balancing growth and profitability Capitalizing on strengths and developing plans to address areas of weakness Communicating clearly with investors Delivering on promises Producing above-par performance and returns |
 16 Fifth Third Bank | All Rights Reserved Appendix Segment results — Branch Banking — Consumer Lending |
 17 Fifth Third Bank | All Rights Reserved Branch Banking Branch Banking 2007 2007 2006 2006 2005 Performance Summary Second First Sequential Second YOY Full Full (Dollars in millions) Quarter Quarter % Change Quarter % Change Year Year % Change Income Statement Data Net Interest Income (FTE) $ 370 359 3% 326 13% $ 1,290 1,251 3% Non-interest Income 218 191 14% 197 11% 763 716 7% Total Revenue 588 550 7% 523 12% 2,053 1,967 4% Provision for Credit Losses 39 22 77% 26 50% 101 91 11% Non-interest Expense 291 281 4% 270 8% 1,072 1,030 4% Income before Taxes 258 247 4% 227 14% 880 846 4% Income Taxes 91 87 5% 80 14% 310 298 4% Segment Earnings $ 167 160 4% 147 14% $ 570 548 4% Average Balance Sheet Data Commercial loans $ 5,140 5,185 -1% 5,304 -3% $ 4,297 3,995 8% Consumer loans 11,619 11,699 -1% 11,345 2% 11,391 10,687 7% Total loans 16,759 16,884 -1% 16,649 1% 15,688 14,682 7% Transaction deposits 29,389 28,614 3% 28,594 3% 27,909 28,146 -1% Core deposits 40,016 39,542 1% 38,914 3% 39,260 37,319 5% Efficiency Ratio (FTE) 49.49% 51.09% -3% 51.63% -4% 52.22% 52.36% 0% FTE Employees 9,136 9,223 -1% 8,896 3% 9,082 9,032 1% •Revenue up 7% sequentially, up 12% year over year •Net interest income up 3% sequentially and 13% over 2Q 2006, primarily driven by deposit growth and wider deposit spreads •Non-interest income up 14% sequentially reflecting higher deposit service charges; up 11% year over year driven by deposit fees and interchange income •Expenses up 4% sequentially, and 8% year over year •Increase due to growth in net occupancy and equipment costs resulting from de novo openings |
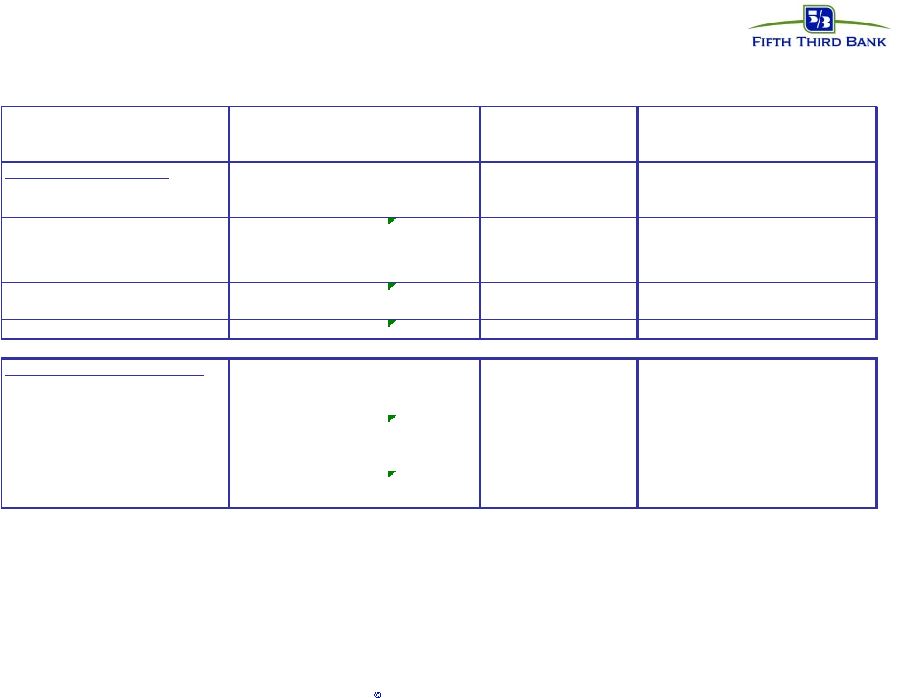 18 Fifth Third Bank | All Rights Reserved Consumer Lending •Revenue up 1% sequentially, down 5% year over year •Net interest income down 3% sequentially and 4% year over year on higher auto loan spreads offset by narrowing spreads on mortgage products •Non-interest income up 10% sequentially reflecting higher loan delivery gains and servicing revenue; down 5% year over year driven by lower loan sales and decreased operating lease income •Expenses down 2% sequentially, down 11% year over year •Year over year decrease driven by lower salaries and lower operating lease expense Consumer Lending 2007 2007 2006 2006 2005 Performance Summary Second First Sequential Second YOY Full Full (Dollars in millions) Quarter Quarter % Change Quarter % Change Year Year % Change Income Statement Data Net Interest Income (FTE) $ 88 91 -3% 92 -4% $ 380 397 -4% Non-interest Income 57 52 10% 60 -5% 229 290 -21% Total Revenue 145 143 1% 152 -5% 609 687 -11% Provision for Credit Losses 27 26 4% 17 59% 94 90 4% Non-interest Expense 64 65 -2% 72 -11% 303 350 -13% Income before Taxes 54 52 4% 63 -14% 212 247 -14% Income Taxes 19 18 6% 22 -14% 75 87 -14% Segment Earnings $ 35 34 3% 41 -15% $ 137 160 -14% Average Balance Sheet Data Commercial loans $ - - - - - $ - - - Consumer loans 21,993 21,622 2% 20,664 6% 20,430 19,164 7% Total loans 21,993 21,622 2% 20,664 6% 20,430 19,164 7% Transaction deposits 527 439 20% 471 12% 436 420 4% Core deposits 527 439 20% 471 12% 436 420 4% Efficiency Ratio (FTE) 44.14% 45.45% -3% 47.37% -7% 49.75% 50.95% -2% FTE Employees 1,837 1,989 -8% 2,252 -18% 2,042 2,266 -10% |
 Fifth Third Bank | All Rights Reserved Finance August 2007 Chris Marshall, Executive Vice President, Chief Financial Officer 19 |
 20 Fifth Third Bank | All Rights Reserved Capital Plan Current tangible capital levels very strong — Tangible common equity/tangible assets ratio of 6.92% at 6/30/2007 — Post acquisition TCE/TA target: 6.5% (Crown = 45 bps, First Charter = 35 bps) 2007 plans — Improve efficiency of capital structure through limited substitution of hybrids for common stock — Remaining share repurchase authorization of approximately 22 million shares (as of 6/30/2007) Future considerations — Evaluate future capital position in context of performance, operating environment, and acquisition plans — Maintain strong regulatory capital levels in conjunction with management of tangible equity ratio — Maintain strong capital levels relative to peers and commensurate with business profile |
 21 Fifth Third Bank | All Rights Reserved M&A – What Matters to Fifth Third Markets — Expansion into demographically attractive geographies — Creation of deeper shares in existing markets Attractive business lines — Supplement existing business, addition of complementary businesses or capabilities Favorable economics — Conservative assumptions — Accretion within a reasonable timeframe — Deal IRR hurdle of mid-teens Protection of debt ratings |
 22 Fifth Third Bank | All Rights Reserved R-G Crown Acquisition Manageable risks $3.0 billion in assets, $1.8 billion deposits, 33 branches – Expands presence in Orlando and Tampa; creates position in attractive Jacksonville and Georgia markets 9 branches (9 th share) in Jacksonville serve as a base for future growth – Moves Fifth Third from 10 th to 7 th in Orlando deposit market share and from 9 th to 5 th in Tampa – Accelerates long-term plans in Florida, displaces $4MM+/branch de novo investment for similar locations Opportunity to expand our footprint in Georgia Paying 0.87x book value for Florida franchise (1.56x tangible book value) Accretive to cash basis EPS in first year Generates 19% IRR Significant cost savings achievable from leveraging existing Florida infrastructure Improved profitability readily achievable based on Florida franchise results Existing Florida platform provides for efficient conversion Satisfactory resolution of Crown’s cease and desist order and delivery of financial statements in accordance with GAAP are conditions of closing Transaction highlights Financial discipline |
 23 Fifth Third Bank | All Rights Reserved First Charter Acquisition Manageable risks $4.9 billion in assets, $3.2 billion in deposits, 59 branches – Immediate presence in Charlotte, ranking 4th in deposit market share – Entry into the Charlotte, Raleigh-Durham and Atlanta markets – 5 branches in Raleigh serve as a base for future growth Opportunity to develop Georgia presence Helps connect Fifth Third’s Midwest and Florida operations Cash EPS accretion, operating EPS neutrality achieved within two years of closing*, excluding revenue synergies IRR of 14%, excluding revenue synergies Achievable cost savings, earnings growth assumptions; Significant revenue enhancement opportunities present but not modeled Price/earnings ratio, price/book ratio, price/tangible book ratio considerably lower than comparable deals Maintaining target TCE/TA ratio of 6.5% Strong credit history – Recent Penland situation an isolated situation, reserves adequate – Remaining portfolio continues to perform relatively well Previous financial reporting issues solved and behind the company Transaction highlights Financial discipline * Assumes 1Q08 closing, 1Q09 measurement date. |
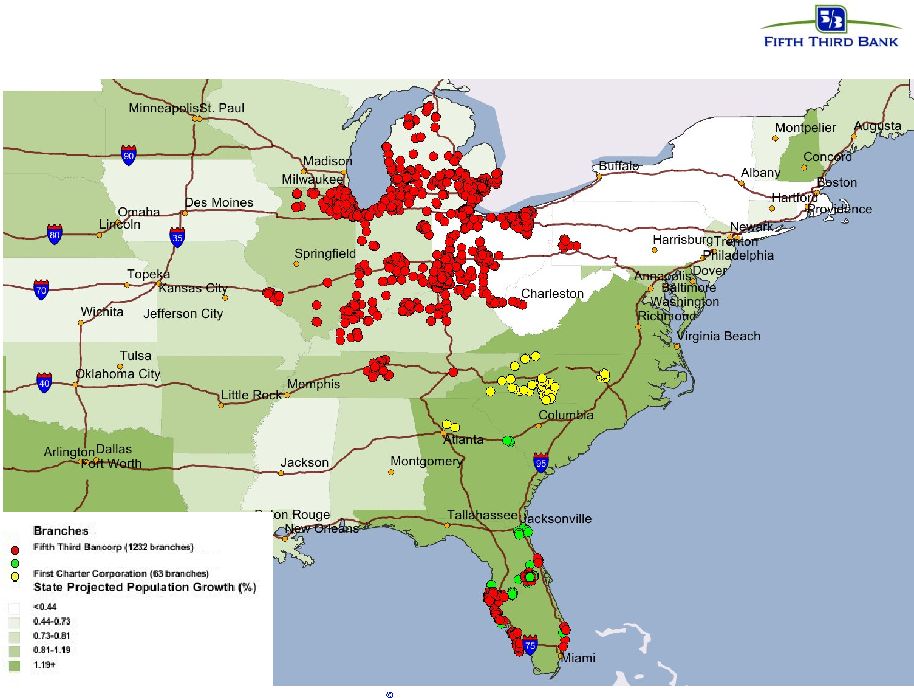 24 Fifth Third Bank | All Rights Reserved Combined Footprint Copyright © 2007 SNL Financial. All Rights Reserved. R-G Crown Bank (33 branches) |
 25 Fifth Third Bank | All Rights Reserved FITB “Outperformance” Dependent On: Revenue opportunities — Commitment — Consistency of pursuit, tracking, and measurement Expense opportunities — Discipline — Process improvement Proactive credit risk management Optimization of balance sheet and capital position Disciplined M&A |
 Fifth Third Bank | All Rights Reserved Risk Management August 2007 Mary Tuuk, Executive Vice President, Chief Risk Officer 26 |
 27 Fifth Third Bank | All Rights Reserved Risk Management Philosophy Risk and Compliance Committee — Independent of Management — Approves charters for Management Governance Committees Governance Committees — Oversee specific risk – Establish and monitor Risk limits and tolerances approved by RCC |
 28 Fifth Third Bank | All Rights Reserved Enterprise Risk Management Organization Credit Risk Operational Risk Management Market Risk Management Risk Strategies Regulatory Compliance Risk Policy Repository Insurance Risk Management IA Risk Management LOB Risk Managers have either a direct or dotted reporting line |
 29 Fifth Third Bank | All Rights Reserved Corporate Credit Committee New committee accountable to the Bancorp Board’s Risk and Compliance Committee Purpose/Mission — Establishes priorities, develops initiatives and makes policy recommendations to the Enterprise Committee that improves the ability to understand, measure and report credit trends, forecast loss and their associated drivers. Members — Chaired by the Bancorp’s Chief Risk Officer and the Chief Financial Officer — Commercial LOB Head, Consumer LOB Head, IA/FTPS LOB Head, Head of Affiliate Administration |
 30 Fifth Third Bank | All Rights Reserved Commercial Loan Approval Process Current Signature authority process – all delegated through ERM — Various affiliate limits – the highest is $25MM at 4 largest affiliates — Affiliate Credit Officers report through EVP of Commercial — Senior Credit Officer up to $40MM — Chief Commercial Credit Officer up to $50MM — Over $50MM requires additional approval from EVP of Commercial — Over $100MM requires additional approval from CEO or Chief Risk Officer Approval limits governed by affiliate limits and regulatory risk rating — Borrowers with a criticized rating require additional signatures based on size of aggregate exposure — Borrowers with certain policy exceptions require an additional level of approval Standardization — Uniform underwriting and approval processes — Separate Lending and Credit functions — Uniform Funding Desk process — Enhanced efficiency |
 31 Fifth Third Bank | All Rights Reserved Underwriting Policies General trends: — Commercial has seen no loosening of standards vs. 12 months ago — Consumer has tightened standards vs. 12 months ago Commercial exceptions to underwriting policies and guidelines are reviewed at the individual credit level and managed through the approval process Commercial exceptions are approved through the signature authority process and adequate mitigants are required to be described in the underwriting documentation Consumer exceptions are managed through the lending and override authority process with documented compensating factors in the loan file and justification statement listed in the underwriting system. Credit Risk Review – independent evaluation function under CRO that monitors strength of underwriting |
 32 Fifth Third Bank | All Rights Reserved Consumer Underwriting Policies General trends: — Underwriting standards have tightened vs. 12 months ago — Enhanced collateral review process-New AVM process, employing staff appraisers — Exception tolerances have tightened Centralized underwriting to standard Bancorp policies and guidelines Consumer products are underwritten utilizing a combination of bureaus scores and internal custom scorecards. Enhanced underwriting in 2006 by rolling out new decision models that improve underwriting efficiency and reduce exceptions |
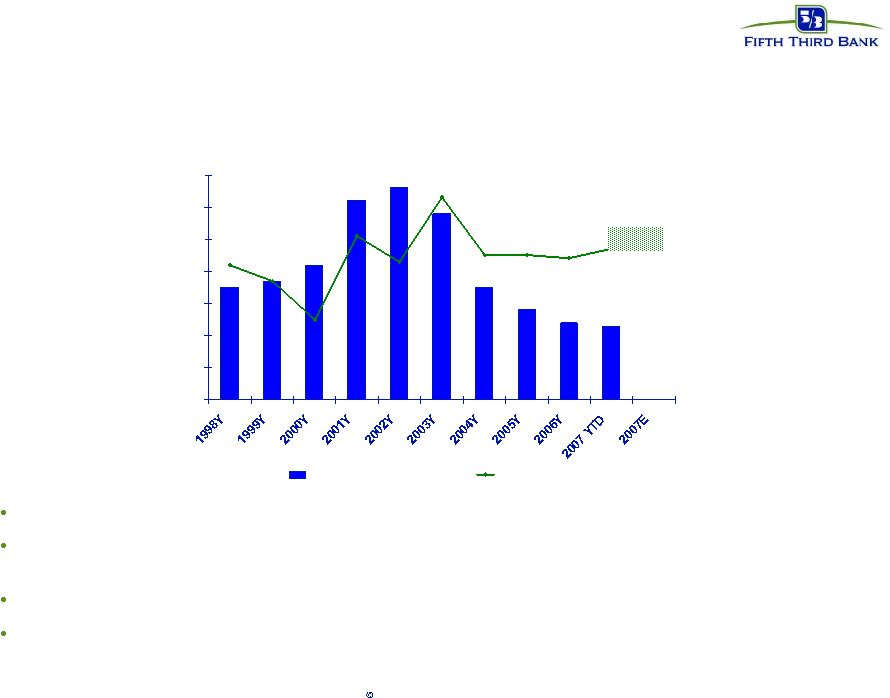 33 Fifth Third Bank | All Rights Reserved 0.00% 0.10% 0.20% 0.30% 0.40% 0.50% 0.60% 0.70% Peer group median Fifth Third 2007 outlook: low 50s bps Total net charge-offs Credit quality Relatively stable net charge-off experience vs. peers Increasing trends in probability of default ratings in commercial — 2003 through June 2007 vintages all in 6.1-6.7 PD range at origination Over 75% of commercial loans originated or renewed in past two years Midwest economy |
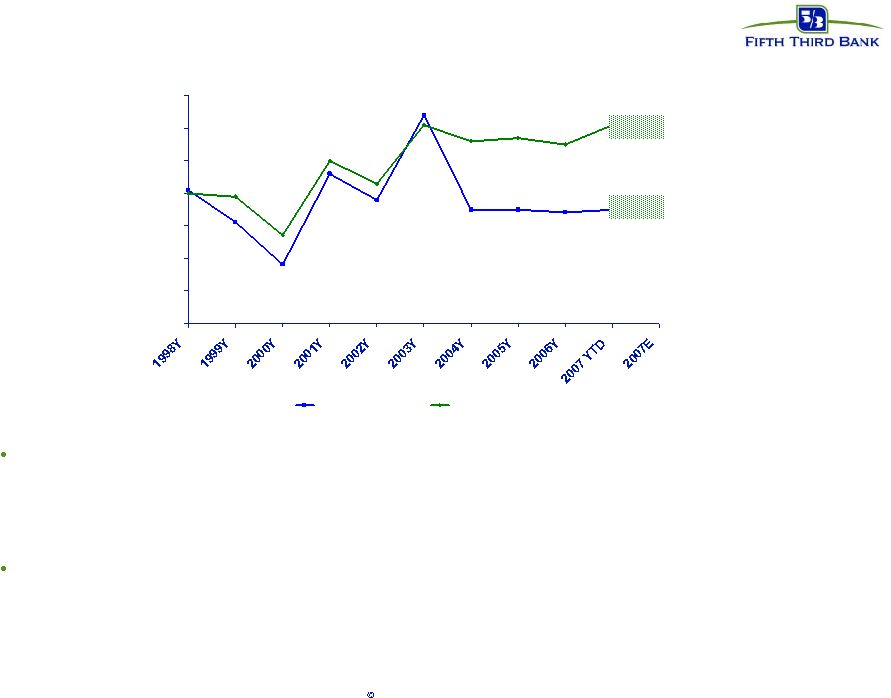 34 Fifth Third Bank | All Rights Reserved 0.00% 0.10% 0.20% 0.30% 0.40% 0.50% 0.60% 0.70% Total Commercial Total Consumer Mid-high 60s bps Commercial and consumer net charge-offs* Mid-high 30s bps Credit quality (cont.) Commercial NCO ratios have historically ranged between 20-60 bps — 2006: 34 bps — 2Q07: 44 bps — YTD07: 36 bps Consumer NCO ratios have historically ranged between 40-65 bps — 2006: 55 bps — 2Q07: 68 bps — YTD07: 61 bps 2007 outlook: |
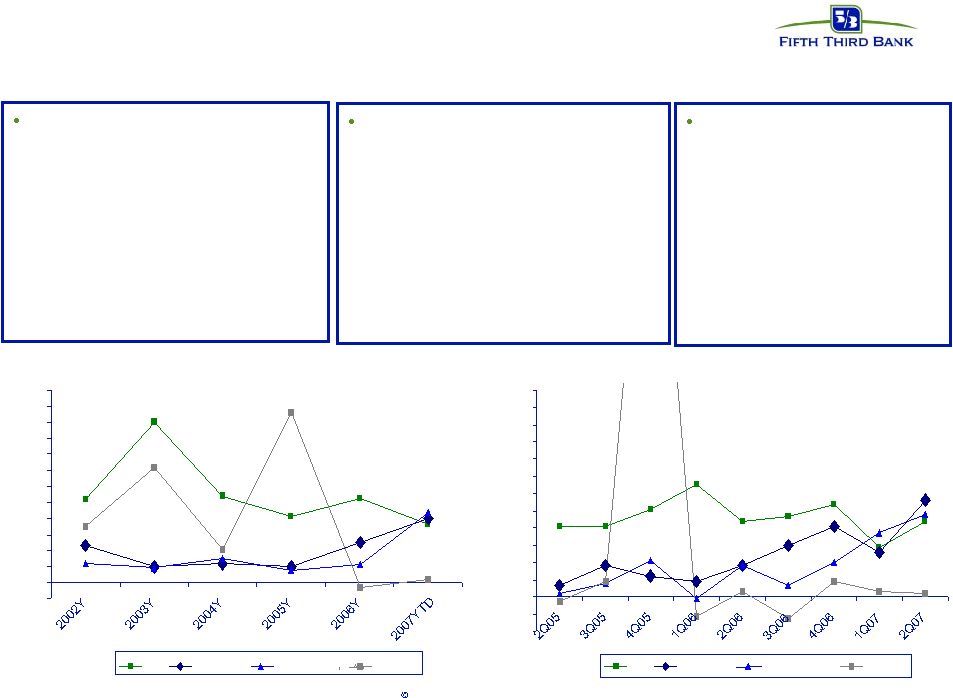 35 Fifth Third Bank | All Rights Reserved Yearly Commercial net charge-offs C&I - $22.2 billion — One charge-off in the $4-6M range in 2Q07 — Weighted average PD ratings increased from 6.3 to 6.7 in 2007 — PD ratings on large credits (>$5 million) substantially better than overall portfolio CRE - $16.5 billion — Commercial mortgage charge- offs of 56 bps in 2Q07 rose 30 bps from 1Q07 and are higher than recent years, reflecting stress particularly in the upper Midwest — Construction NCO ratio was higher in 2Q at 48 bps vs. a range of -1 to 20 bps over the past 2 years Leasing - $3.7 billion — Large airline-related charge-offs source of volatility experience in 2005 — NCO flat for 2Q07 Quarterly Commercial net charge-offs Commercial credit -0.10% 0.00% 0.10% 0.20% 0.30% 0.40% 0.50% 0.60% 0.70% 0.80% 0.90% 1.00% 1.10% 1.20% C&I Mortgage Construction Leasing -0.20% -0.10% 0.00% 0.10% 0.20% 0.30% 0.40% 0.50% 0.60% 0.70% 0.80% 0.90% 1.00% 1.10% 1.20% C&I Mortgage Construction Leasing |
 36 Fifth Third Bank | All Rights Reserved Commercial Loan Portfolio Composition CRE - $16.5 billion outstanding and $20.2 billion exposure C&I - $22.2 billion outstanding and $47.8 billion exposure Outstanding balances on owner-occupied vs. non-owner occupied properties split approximately 39 / 61%. Big 3 auto concentration – includes direct outstandings of $100 million and auto suppliers outstandings of $693million |
 37 Fifth Third Bank | All Rights Reserved Commercial Loan Credit Outlook Largest non-performers –Top 2: $15mm and $10mm Criticized assets trending up Areas of strength in the portfolio — Other than softening in real estate, in general no deterioration in any given industry — Industry diversification spreads systemic (economic) risk — Granular relationship size spreads idiosyncratic risk – Average relationship size is $0.8MM outstanding Areas of weakness in the portfolio — Midwest economy is lagging other parts of the country — Softening in Michigan and Northern Ohio — NPA’s have increased as credit cycle turns |
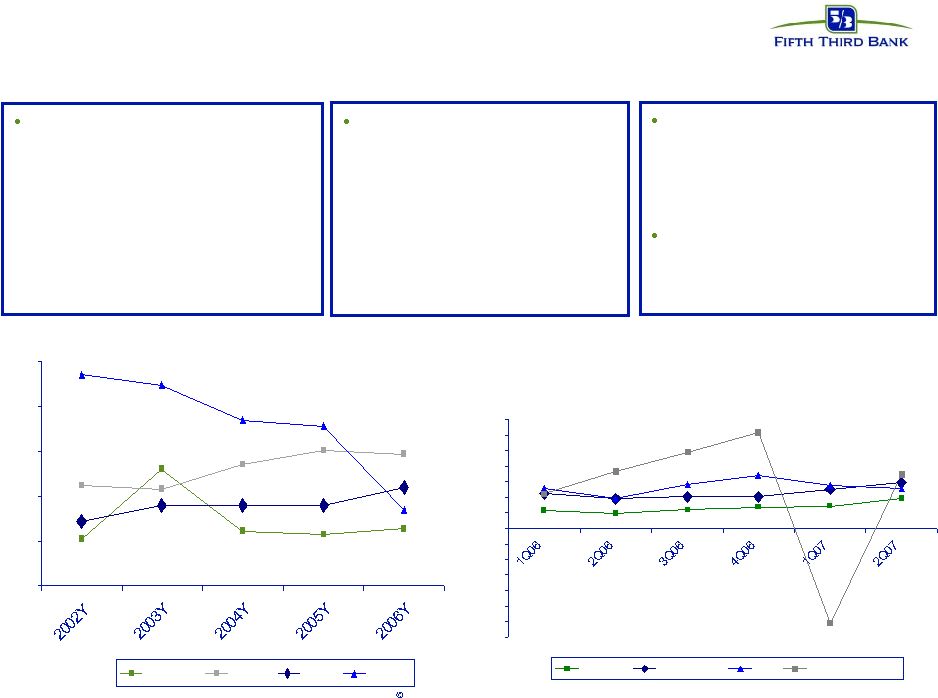 38 Fifth Third Bank | All Rights Reserved Consumer credit Home Equity - $11.8 billion — NCO ratio of 61 bps YTD vs. historical ratios of 40- 45 bps — Higher concentration of net charge-offs in Eastern Michigan (Detroit) market Auto - $10.7 billion — Fifth Third has larger exposure to auto lending than peers — Auto NCO ratio is in-line with competitors (YTD = 59 bps) Mortgage - $8.5 billion — Mortgage charge off ratio has increased in 2007 driven by housing depreciation and a declining portfolio balance Leasing - $1.1 billion — Leasing portfolio is running off, gross loss rates are declining Yearly consumer net charge-offs Quarterly consumer net charge-offs 0.00% 0.22% 0.44% 0.66% 0.87% 1.09% Mortgage Indirect Direct Lease -1.56% -1.34% -1.11% -0.89% -0.67% -0.45% -0.22% 0.00% 0.22% 0.45% 0.67% 0.89% 1.11% 1.34% 1.56% Mortgage Home Equity Auto Other Cons L&L |
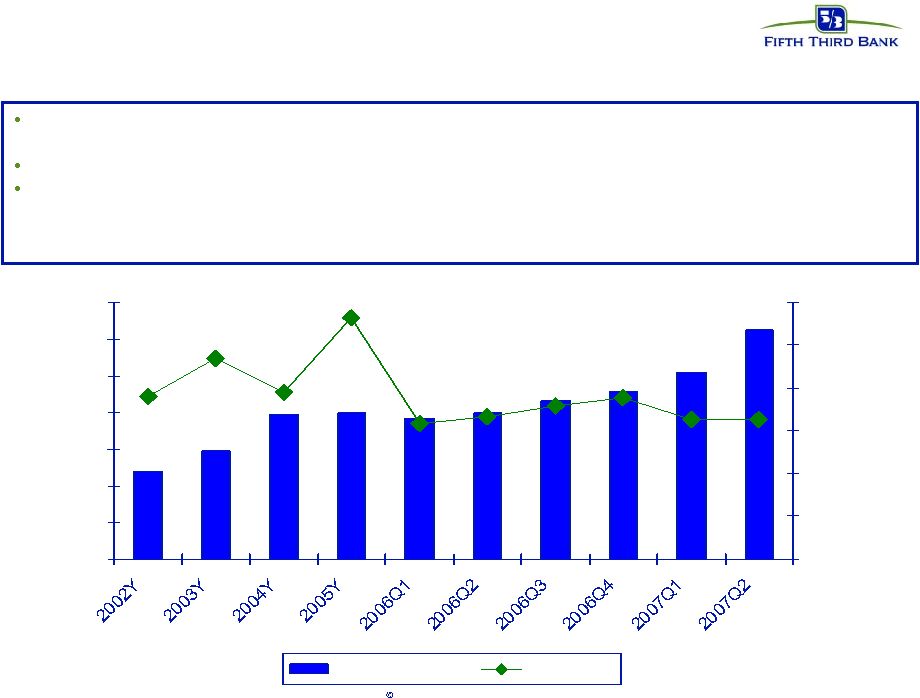 39 Fifth Third Bank | All Rights Reserved Credit cards Over 85% of consumer credit card portfolio originated from our retail network — Remaining balances from agent-bank relationships and legacy run-off portfolio of acquired cards Two-thirds of Fifth Third’s organically generated portfolio has a FICO score over 740 2005 bankruptcy reform led to a spike in NCOs in 4Q05 — Recoveries were higher than normal in following two quarters — Expect NCO ratio closer to 4% range going forward 0 0.2 0.4 0.6 0.8 1 1.2 1.4 0.00% 1.00% 2.00% 3.00% 4.00% 5.00% 6.00% Average Balance NCO Ratio |
 40 Fifth Third Bank | All Rights Reserved Appendix |
 41 Fifth Third Bank | All Rights Reserved Residential real estate - topical areas* Mortgage: $8.5B outstanding — 1 st liens: 100% — Weighted average LTV: 80%; weighted average FICO: 720 – Origination FICO bands: <659 13%; 660-689 11%; 690-719 17%; 720-749 18%; 750+ 39% (note: loans <659 includes CRA loans and FHA/VA loans) — % through broker: 10% — NPAs: $112MM (1.30%); over 90s: $98MM (1.15%) — Charge-offs: $16MM YTD (0.38%) OH 34% IL 10% KY 9% FL 6% MI 23% IN 11% Other 7% OH 30% FL 23% IL 7% KY 6% MI 18% IN 8% Other 8% * All data as of 6/30/07 No subprime Alt A originations: 2Q07 $192MM; $123MM warehouse, WA FICO 702, WA LTV 73% — $38MM in loan portfolio (viewed as unsaleable in current market environment), WA FICO 698 Home equity: $11.8B outstanding — 1 st liens: 30%; 2 nd liens: 70% (25% of 2 nd liens behind FITB 1 st s) — Weighted average CLTV: 78% (1 st liens 62%; 2 nd liens 83%) — Weighted average FICO: 742 (1 st liens 750; 2 nd liens 740) – Origination FICO bands: <659 5%; 660-689 10%; 690-719 16%; 720-749 20%; 750+ 48% — % through broker: 23% (broker WA FICO 735; direct WA FICO 745) — NPAs: $68MM (0.58%); over 90s: $61MM (0.52%) — Charge-offs: $36 million YTD (0.61%) |
 Fifth Third Bank | All Rights Reserved Commercial Banking August 2007 Bruce Lee, Executive Vice President, Commercial Banking 42 |
 43 Fifth Third Bank | All Rights Reserved Core Business Projections and Strategies Middle Market Strategy — Increase sales force productivity and operating efficiency. — Improve service fee income mix from 25% to 40%. — Improve deposit penetration by becoming Primary Bank for all of our customer relationships (current relationship market share is 15% with Primary Bank status at 9% market share). |
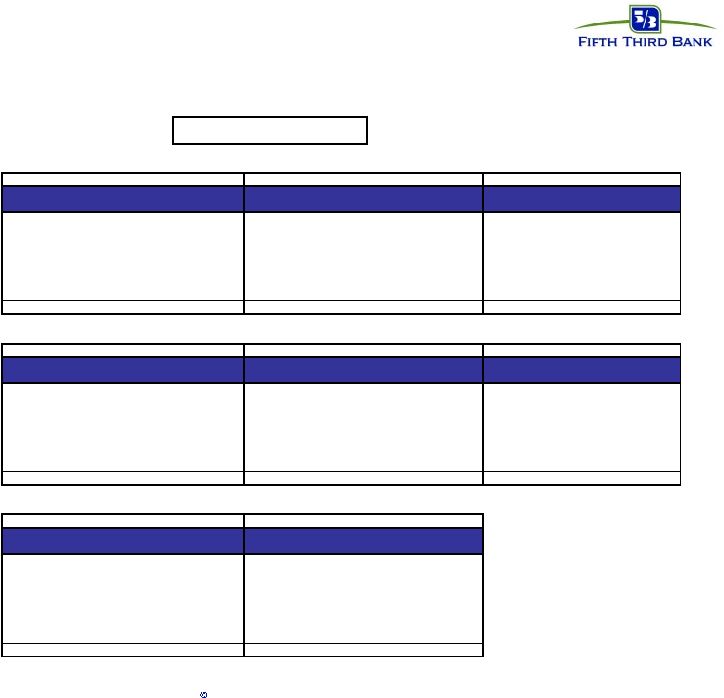 44 Fifth Third Bank | All Rights Reserved Commercial LOB Performance Trends by Department (Six Months YTD Data) JUNE YEAR-TO-DATE Net Revenue (exluding provision) Service Income Net Income vs vs vs 2006 2007 2006% 2006 2007 2006% 2006 2007 2006% Middle Market $323,276 $342,669 6% $79,902 $81,368 2% $142,116 $164,355 16% Large Corporate 75,463 75,318 (0%) 36,547 32,447 (11%) 36,233 38,663 7% Professional Services 22,240 21,613 (3%) 7,000 6,996 (0%) 12,004 11,785 (2%) International 55,281 56,761 3% 42,540 42,405 (0%) 11,431 12,278 7% Real Estate 222,766 210,609 (5%) 20,033 18,089 (10%) 115,371 96,205 (17%) Leasing 54,359 55,841 3% 17,359 26,891 55% 34,112 33,175 (3%) Other/Elims 61,350 87,639 32,526 57,972 (51,645) (36,685) Total Commercial $814,734 $850,450 4% $235,907 $266,168 13% $299,622 $319,775 7% JUNE YEAR-TO-DATE Operating Expense Salaries & Benefits Total Direct Expenses vs vs vs 2006 2007 2006% 2006 2007 2006% 2006 2007 2006% Middle Market $74,484 $76,773 3% $24,133 $23,767 (2%) $13,220 $14,637 11% Large Corporate 19,504 15,739 (19%) 2,586 2,113 (18%) 3,006 2,590 (14%) Professional Services 3,295 3,396 3% 903 790 (13%) 415 351 (15%) International 37,625 37,799 0% 3,422 3,709 8% 1,252 1,666 33% Real Estate 37,052 36,018 (3%) 10,129 7,512 (26%) 8,846 7,582 (14%) Leasing 13,242 16,200 22% 5,182 4,135 (20%) 8,530 12,607 48% Other/Elims 171,809 196,376 14% 75,550 89,451 18% 46,659 54,038 16% Total Commercial $357,013 $382,299 7% $121,906 $131,477 8% $81,928 $93,472 14% JUNE YEAR-TO-DATE Core Deposits Commercial Loans YWA YWA vs YWA YWA vs 2006 2007 2006% 2006 2007 2006% Middle Market $3,983,440 $3,805,519 (4%) $12,887,553 $14,375,999 12% Large Corporate 1,788,262 1,699,909 (5%) 505,863 927,506 83% Professional Services 581,568 544,221 (6%) 419,080 431,188 3% International 587,914 575,117 (2%) 141,326 177,101 25% Real Estate 1,486,415 1,270,374 (15%) 12,402,957 12,349,605 (0%) Leasing 13,192 5,271 (60%) 4,599,062 4,855,117 6% Other/Elims 6,356,468 6,061,521 (5%) 1,000,210 1,277,362 28% Total Commercial $14,797,260 $13,961,931 (6%) $31,956,051 $34,393,878 8% |
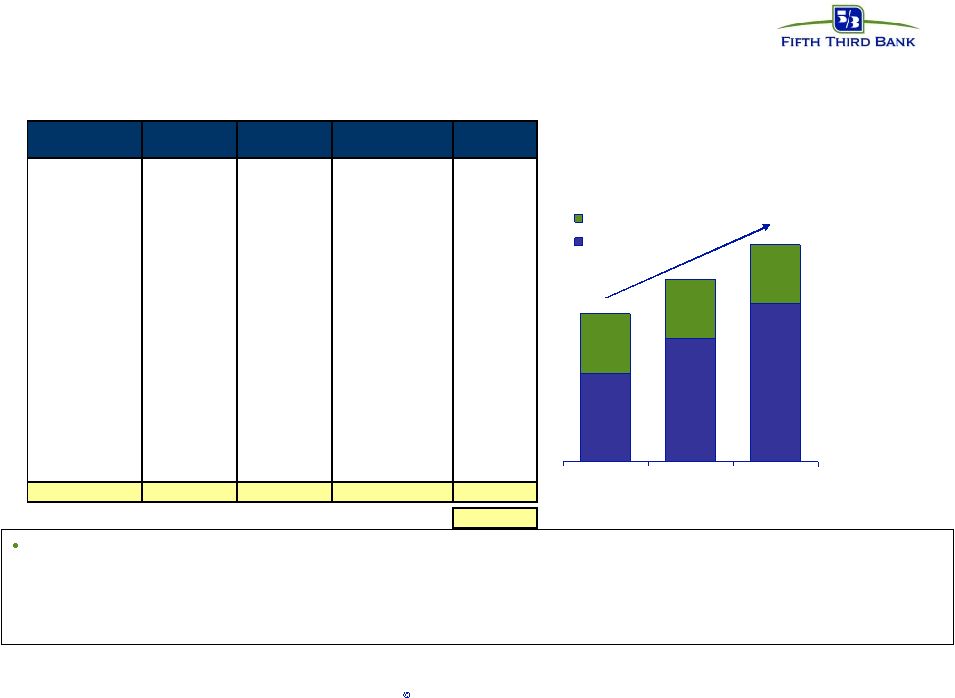 45 Fifth Third Bank | All Rights Reserved Middle market: leveraging our position 5/3 Middle Market Share 9% 16% 6% 6% 6% 12.5% 2006 2009 2012 lending only full-service Markets $10mm to $100mm $100mm to $250mm $250mm to $500mm Total Chicago 5,085 405 148 5,638 Eastern Michigan 2,164 187 60 2,411 South Florida 1,662 110 35 1,807 Northeastern Ohio 1,532 98 33 1,663 Western Michigan 1,234 74 30 1,338 Central Indiana 1,167 84 39 1,290 Tampa 867 59 27 953 St. Louis 834 76 36 946 Pittsburgh 796 66 22 884 Cincinnati 754 48 28 830 Central Florida 690 47 21 758 Central Ohio 659 59 25 743 Louisville 617 49 24 690 Tennessee 559 54 21 634 Western Ohio 500 30 15 545 Northwestern Ohio 434 34 10 478 Southern Indiana 319 27 11 357 Northern Michigan 329 20 5 354 Ohio Valley 239 24 5 268 Central Kentucky 210 20 5 235 Northern Kentucky 128 7 3 138 Total Footprint 20,779 1,578 603 22,960 Fifth Third total relationship market share 15% # of Businesses with Sales of: Convert existing accounts to full service while increasing new accounts 15% 22% 18.5% Goals — Increase primary market share for middle market from 9% to 16% by 2012. — Establish presence as the #1 or #2 middle market bank by dollar market share in affiliate markets by 2012. — Increase market share by 10% in markets where we currently are the #1 middle market bank. |
 46 Fifth Third Bank | All Rights Reserved Commercial Banking Strategy The Fifth Third Way — Standardized underwriting — Standardized sales management — Reduce cycle times, reduce errors and enhance the overall customer experience — Implement straight-through processing Expand capital markets businesses — New or expanded product offerings (FX, Commodities, Loan Syndication, Tender Option Bond program) — Further educate the sales force Commercial real estate — Expand product offering to full suite of debt and equity products — Provide executive management the ability to better manage exposure through securitization program — Commercial Mortgage Backed Securities (CMBS) — Commercial Real Estate Collateralized Debt Obligations (CRE CDO) |
 47 Fifth Third Bank | All Rights Reserved Commercial Banking Strategy (cont’d) Expand treasury management product offerings (payments) — Remote Currency Manager (April) — Escrow Manager (May) — National Lockbox (September) — Thin Client for Electronic Deposit (September) — Commercial Card Management (September) — Fifth Third Direct Enhanced Authentication (IP Intelligence – October) — ACH Web/Tel Capability (November) — Integrated Merchant Processing and ACH Capability (November) — Accounts Payable Management (December) — Integrated Receivables (December / January) — Fifth Third Direct Enhanced Authentication (Customer Q&A’s) – Q1 2008 Sales force investment — Add specialty receivables product sales personnel to facilitate incremental revenue growth — Invest in additional Multi-card account managers to facilitate incremental revenue growth — Improve skill set of sales force through education and addition of new talent |
 48 Fifth Third Bank | All Rights Reserved Commercial Banking Strategy (cont’d) Expand international lending business — Organize approach to market through a national team of international relationship managers and trade specialists targeting foreign-owned companies and global trade opportunities regionally positioned throughout the Bancorp — Specialized employees with foreign language skills will be more effectively deployed across affiliate lines — Centralized credit and underwriting by professionals experienced in foreign guarantees and better positioned to monitor country risk on a Bancorp level — Coordinated overseas calling effort to more efficiently call on foreign parents, potentially reducing the number of overseas trips on a Bancorp level |
 49 Fifth Third Bank | All Rights Reserved Commercial Banking Strategy (cont’d) Healthcare Industry Opportunity Today… — At 7%, one of the fastest growing segments of the GDP — Total spend equals $1.8 Trillion — Approximately 750,000 healthcare providers in the U.S. — Hospital spending approximates $540 Billion — Approximately 6,000 hospitals in the U.S. (20% of these are For-Profit) Going Forward… — Estimated to be 18%+ in 2015 — Estimated to be $4 Trillion in 2015 (8%+ annual growth) — Expected to grow 8% per annum Payments Management will be paramount to their success. We MUST play an integral part. |
 50 Fifth Third Bank | All Rights Reserved Commercial Banking Strategy (cont’d) Fifth Third Current Healthcare Position Relationships — Primary bank for less than 50 hospitals / health systems — Over 600 healthcare entities in-footprint with revenues > $100 Million — Current market share of 2.3% which represents a gap of 12.7% to total commercial business market share Treasury Management Product Gaps — EOB Capture (August) — Electronic Remittance Advice Integration (October) — Secondary Billing / Denial Management (October) Staffing — Eight healthcare teams (approximately 30 commercial RM’s) “cover” healthcare in affiliates with no centralized coordination — Significant reliance on Financial Advisors (i.e. investment banks) Significant opportunity to gain share both within our footprint and in selected national markets. |
 51 Fifth Third Bank | All Rights Reserved Commercial Banking Strategy (cont’d) Promote a comprehensive healthcare strategy for the Bancorp — Established healthcare as a core competency of Fifth Third (complete) — Hired senior executive to lead initiative (Kevin Lavender) (complete) — Established national team to target relationships in excess of $100M (complete) — Define healthcare market, targeted opportunities, and pursuit strategy – Pharma, disease management, dialysis, hospice, OT/PT, imaging – Managed care, home health, insurance, specialty hospitals, behavioral health — Coordinate all healthcare strategies and offerings across all LOBs — Double our current market share (2.3% - 5%) to projected revenue of $190MM by 2011 — Target in-footprint and on a selective national scale Standard and streamlined approval process — Standardize and centralize all credit approvals above $10MM through the National Credit department. — Consistent with current large corporate credit process — Common guidelines for underwriting across all lines of business |
 52 Fifth Third Bank | All Rights Reserved Commercial Banking Strategy (cont’d) Underserved Markets Opportunity Selection Criteria — Less than 10% market share — Large concentration of middle market businesses — Strong YOY growth Realize full potential in selected low market share affiliates through addition of top tier sales talent 2006 Net Income % YOY Growth Chicago 7% 5,638 12% Detroit 5% 2,411 24% Cleveland 4% 1,663 4% Nashville 2% 634 18% Tampa 5% 953 37% Pittsburgh <1% 884 62% Ft Lauderdale <1% 643 <1% St. Louis <1% 946 65% Middle Market Businesses Selected Market Market Share |
 53 Fifth Third Bank | All Rights Reserved Commercial Banking Commercial Banking 2007 2007 2006 2006 2005 Performance Summary Second First Sequential Second YOY Full Full (Dollars in millions) Quarter Quarter % Change Quarter % Change Year Year % Change Income Statement Data Net Interest Income (FTE) $ 292 292 0% 291 0% $ 1,254 1,190 5% Non-interest Income 134 132 2% 120 12% 515 494 4% Total Revenue 426 424 0% 411 4% 1,769 1,684 5% Provision for Credit Losses 25 17 47% 21 19% 105 97 8% Non-interest Expense 189 193 -2% 182 4% 761 717 6% Income before Taxes 212 214 -1% 208 2% 903 870 4% Income Taxes 50 57 -12% 58 -14% 252 256 -2% Segment Earnings $ 162 157 3% 150 8% $ 651 614 6% Average Balance Sheet Data Commercial loans $ 34,826 33,983 2% 32,458 7% $ 33,559 30,373 10% Consumer loans 65 36 81% 3 2067% 80 58 38% Total loans 34,891 34,019 3% 32,461 7% 33,639 30,431 11% Transaction deposits 13,729 14,147 -3% 14,533 -6% 15,222 14,414 6% Core deposits 13,755 14,172 -3% 14,553 -5% 15,245 14,429 6% Efficiency Ratio (FTE) 44.37% 45.52% -3% 44.28% 0% 43.02% 42.58% 1% FTE Employees 2,221 2,252 -1% 2,181 2% 2,227 2,387 -7% |
 54 Fifth Third Bank | All Rights Reserved Appendix |
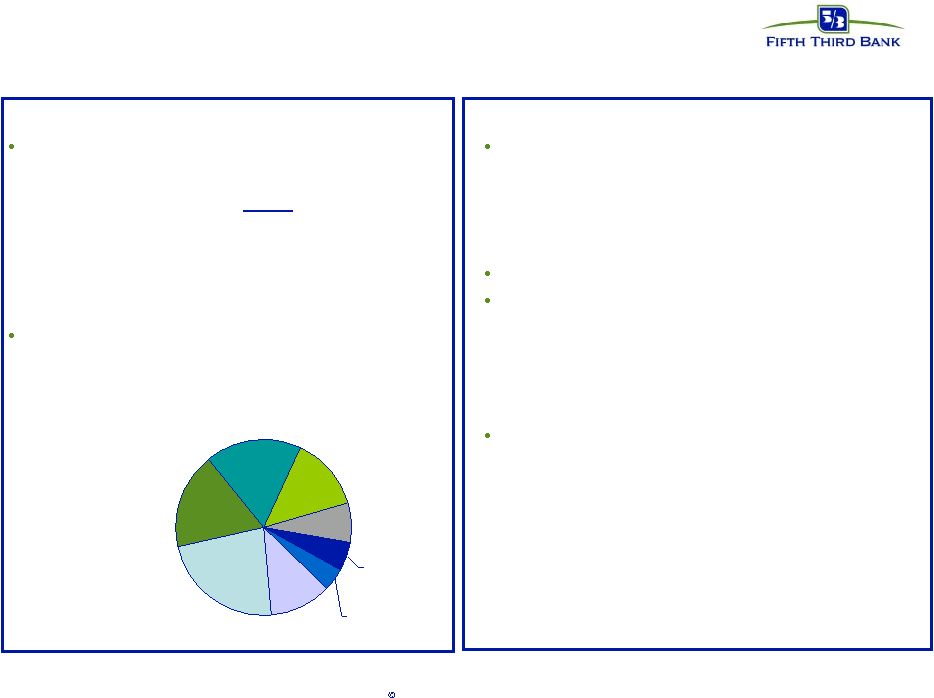 55 Fifth Third Bank | All Rights Reserved Commercial portfolio - topical areas* Commercial real estate (CRE) Total outstandings $16.5B — Commercial mort $11.0B (50% owner occ’d) — Construction 5.5B (20% owner occ’d) Total CRE 16.5B (40% owner occ’d) Total CRE exp $20.2B — Average size $1MM (relationship) — 39% of commercial loans, 22% of total loans Problem assets — NPAs $183MM (1.11%) — > 90 days past due 70MM (0.42%) — YTD charge-offs 35MM (0.41%) Syndicated lending Total loans ~$4B outstandings — PD rating # 5.5 vs. 6.5 for commercial portfolio — Ave size ~$8 million — Relationships ~550 < 10% of commercial loans, < 5% total loans Leveraged^ < $200MM outstandings — Ave size ~$6MM — Relationships ~20 — Syndication warehouse $100 million – No “hung” deals Problem assets – NPAs $12MM – >90 days past due 0MM * # Weighted average probability of default rating ^Regulatory HLT definition, i.e., priced at L+250 bps or greater Office 23% Other 11% Raw land 5% Land under devel't 7% Indu 14% Apts 18% Retail 18% Devel'd land 4% CRE collateral type * All data as of 6/30/07 |
 Fifth Third Bank | All Rights Reserved Fifth Third Processing Solutions August 2007 Charles Drucker, Executive Vice President, FTPS and IA 56 |
 57 Fifth Third Bank | All Rights Reserved Merchant Services Bankcard Financial Institutions Products Distribution • Payment Authorization Clearing and Settlement -Credit -Debit -POS Check • Gift Card Solutions • Card Settlement • Credit & Debit Card Issuing -Consumer -Business • Healthcare Savings Accounts • Electronic Funds Transfer (EFT) • ATM Driving and Support • Debit Card Processing • Correspondent Banking - Cash Letter & ECL - Image Exchange • National • Affiliates • Telesales • Association Referrals • Affiliate Banking Centers • Direct Mail • Agent Bank Programs • Portfolio Acquisitions • National • Referrals from FI • Core Processor Alliances • Correspondent Bankers FTPS at a Glance |
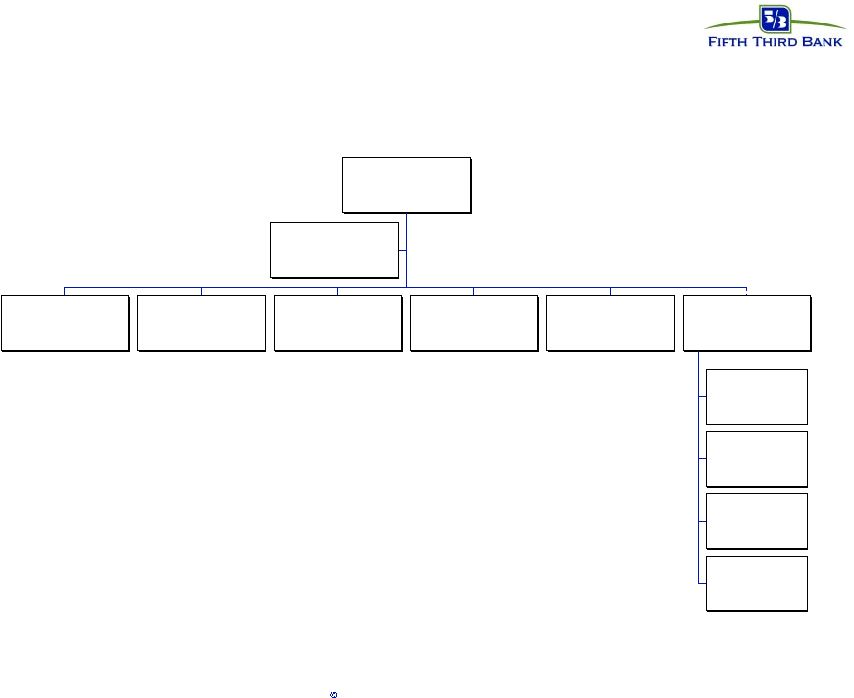 58 Fifth Third Bank | All Rights Reserved FTPS Management Structure Sally Newman Executive Assistant Donald Boeding Senior Vice President Merchant Services Robert Uhrig Senior Vice President and General Counsel FTPS Chris Bell Senior Vice President CFO - FTPS & IA Jon Groch Senior Vice President Bankcard Products Angela Brown Senior Vice President Financial Institutions Bob Bartlett Vice President Information Technology FTPS Susan Makris Vice President Sr. HR Business Partner FTPS (Interim) Delane Starliper Vice President Operations Lynn Rhoads Vice President Marketing FTPS Business Partners Charles Drucker Executive Vice President Fifth Third Processing Solutions Strategic Product Development |
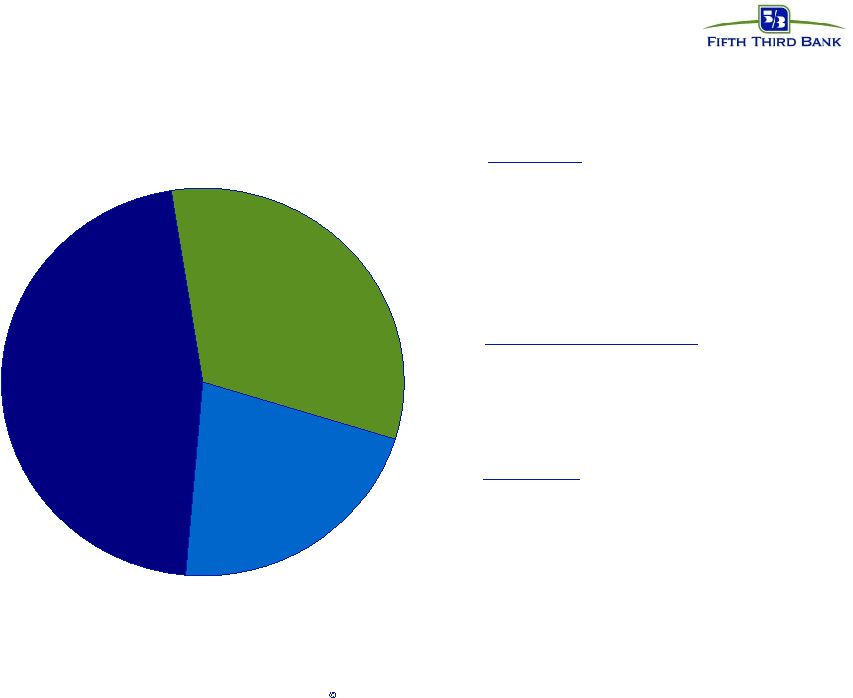 59 Fifth Third Bank | All Rights Reserved FTPS: key growth engine Bankcard • $1.3B in outstanding balances • 1.0MM cardholders • Top three Debit MasterCard Issuer • 24 th largest U.S. bankcard issuer * Excludes $12 million in pre-tax gains related to sale of certain non-strategic credit card accounts in Q2 07 Merchant • 4 th Largest U.S. Acquirer • Over 35,000 merchants • $150B in processing volume • Over 4.4M acquired transactions Financial Institutions • 2,300 FI relationships • Over 900MM POS/ATM transactions 2007 YTD revenue* 46% 32% 22% Merchant Services Financial Institutions Bankcard |
 60 Fifth Third Bank | All Rights Reserved EPP: Strong growth, high value business 0 50 100 150 200 250 300 Merchant Card Interchange FI/EFT CAGR 12% CAGR 30% CAGR 16% CAGR 17% |
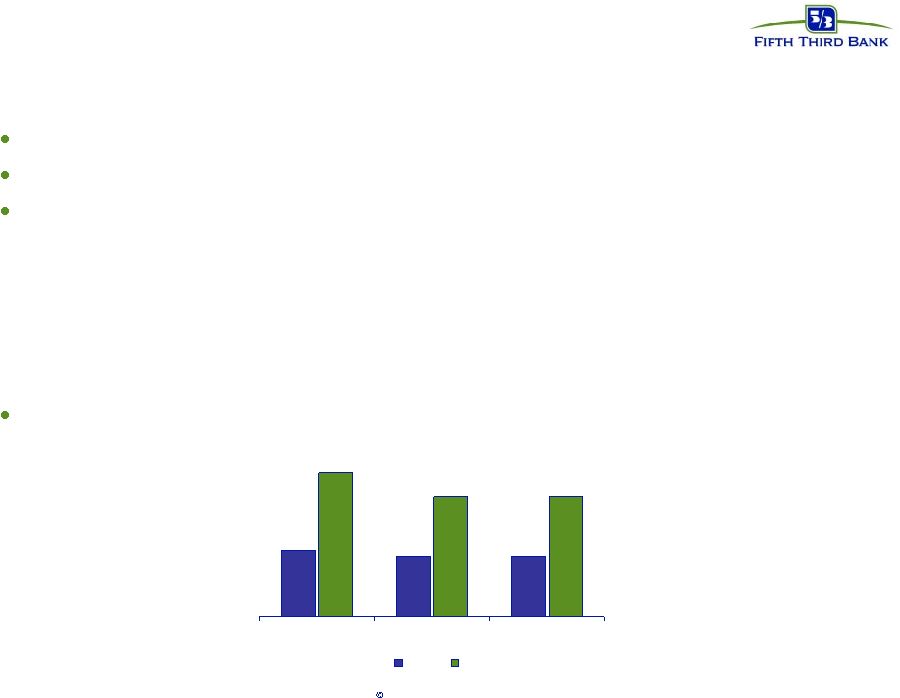 61 Fifth Third Bank | All Rights Reserved Credit cards: capturing our fair share 13th largest bank, 24th largest credit card issuer We’ve underinvested in the credit card business relative to competitors Significant opportunity in high risk-adjusted return business — Improve retail production by deploying sales technologies to enhance ease of sale — Move from “ultra” conservative underwriting to “conservative” underwriting (weighted average FICO from >740 to >720) — Optimize profitability of existing portfolio through modest investments in marketing, analytics, and human capital Goal: double assets, accounts, net income by 2009 Assets Accounts Net income 2006 2009 1,100 2,400 1.0 2.0 41 83 ($ MMs) |
 62 Fifth Third Bank | All Rights Reserved Market Outlook Expected Impacts • Payments revenue growth from 20% to potentially 40% of banks fee revenue • 50-60 Billion additional payment transactions annually by 2010 • 20 to 25B additional Debit payments • 10 to 12B additional Credit payments • 15 to 20B additional DDA based payments • Potentially an additional “must have” payment requirement (i.e., CDHP) • 15 to 20 Million specialized healthcare accounts with payments vehicles • Increased complexity and importance to customers and suppliers • More Alliances and Partnerships • Updated Product Models • Coordinated Sales efforts Key Trends in the Market • Increased importance of Payments • Consumers • Employers • Banks • Expanding need in terms of • Types of payments and usage • Locations and venues where they are used • Fundamental shifts in payment processing models expected to reach “tipping” points • Internet Delivery for Bill Payment, Statement Rendering, Self Service • Electronic Payment Vehicles versus paper • Checks Imaging • Competitors aggressively responding • Extension of existing bank capabilities to new markets • Emergence of new non-bank players • Gaining share by buying revenue streams • Focus on emerging payment segments (Card not present, Recurring, Unattended) Sources: 1. “An enterprise approach to bank payments: Elevating payments to strategic advantage” Economist Intelligence Unit (May 2005) 2. NACHA 3. “CDHP and HSA Market Opportunity” Forrester Research (October 2005) 1 2 3 |
 63 Fifth Third Bank | All Rights Reserved Outlook Response • Share in client gain from more efficient processing and interchange management strategies • Streamline servicing through alternative payment methods • Renegotiate membership association deals with newly formed public entities • Increase scrutiny of client contract commitments Drive Margin Expansion Increase market share of payment processing in 5/3rd footprint - Leverage marquee names to win mid-market merchants - Increase market share in high opportunity geographies Execute a more effective cross-selling and product bundling approach to sell more relationships - Enhance partnership with commercial and business banking - Optimize sales channel productivity • Expand the product offerings to capture through point-of-sales innovation to achieve target of 20/branch/month Improve Penetration Of FITB Customer Base • Execute a more effective cross-selling and product bundling approach to sell more relationships - Develop products and tools based on and targeted for specific industry segments (e.g., CNP, Gift Cards, etc.) - Increase internal skill sets and industry expertise of FITB team members (e.g., image capture) - Debit Rewards to Incent Signature Transactions, Segmentation to Match DDA Segments (Gold, Platinum Debit Card) • Provide differentiated Product Set for key customer segments (affluent, new credit, affinity, students) • Extend credit franchise by offering product to the underserved near prime market • Extend into key growth segments such as MasterCard branded gift, single load and loadable, Health care card markets (HSAs), Un-and Under Banked consumer markets • Create key partnerships with prepaid resellers (Incentive and Award Firms, BIN sponsorships, etc.) • Transition to a full service payments provider • Leverage sales efforts across EFT and correspondent business lines Increase Number Of Services Sold To New And Existing Customers • Leverage industry dominance in National footprint - Sell into strategic new national segments / vertical markets - Create key partnerships and alliances (e.g., petroleum) • Increase market share of payment processing in 5/3rd footprint - Leverage marquee names to win mid-market merchants - Focus on business to business opportunities • Develop partnerships and alliances with key 3 party processors, resellers, and other channel partners • Expand JEANIE Network beyond FTPS clients, develop upstream market capabilities Leverage Market Positions And Distribution Capabilities To Win New Customers STRATEGIC FOCUS AND TACTICS PERFORMANCE THEME rd |
 64 Fifth Third Bank | All Rights Reserved Representative Merchant Client List |
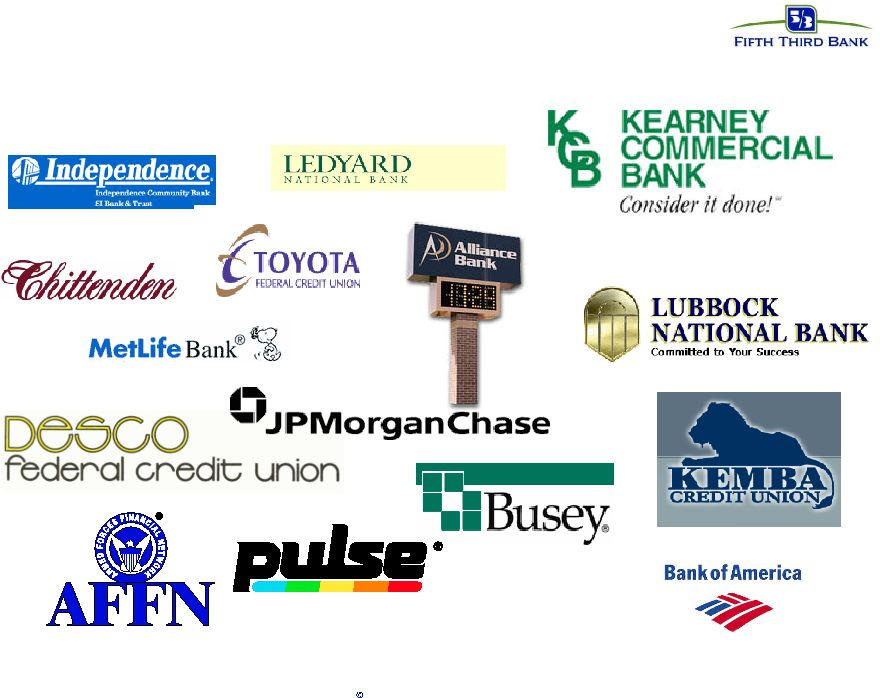 65 Fifth Third Bank | All Rights Reserved Representative FI Client List |
 66 Fifth Third Bank | All Rights Reserved Contract Extension Add Debit Network Processing Contract Extension Recent Wins |
 67 Fifth Third Bank | All Rights Reserved Fifth Third Processing Solutions •Revenue growth of 12% sequentially, 7% year over year •Sequential trends reflect seasonality; year over year trend reflects strong customer acquisition •Expense growth 3% sequentially; 17% year over year •Sequential trends reflect seasonality; year over year trend reflects higher processing volume, some margin compression, and unusual items * 2006 includes gains on sale of MasterCard stock of $24 million in 2Q06 and $53 million in 3Q06. Note: Fifth Third Processing Solutions statements do not include balances, revenues and expenses for the Fifth Third consumer credit card portfolio. * * * * Fifth Third Processing Solutions 2007 2007 2006 2006 2005 Performance Summary Second First Sequential Second YOY Full Full (Dollars in millions) Quarter Quarter % Change Quarter % Change Year Year % Change Income Statement Data Net Interest Income (FTE) $ 8 8 0% 8 0% $ 33 28 18% Non-interest Income 212 188 13% 198 7% 782 633 24% Total Revenue 220 196 12% 206 7% 815 661 23% Provision for Credit Losses 9 2 350% 2 350% 10 18 -44% Non-interest Expense 149 144 3% 126 18% 527 462 14% Income before Taxes 62 50 24% 78 -21% 278 181 54% Income Taxes 22 18 22% 28 -21% 98 64 53% Segment Earnings $ 40 32 25% 51 -22% $ 180 117 54% Average Balance Sheet Data Commercial loans $ 37 57 -35% 52 -29% $ 52 29 79% Consumer loans 175 149 17% 113 55% 121 133 -9% Total loans 212 206 3% 165 28% 173 162 7% Transaction deposits 337 365 -8% 501 -33% 423 405 4% Core deposits 337 365 -8% 501 -33% 423 405 4% Efficiency Ratio (FTE) 67.73% 73.47% -8% 61.17% 11% 64.66% 69.89% -7% FTE Employees 726 759 -4% 711 2% 790 444 78% |
 Fifth Third Bank | All Rights Reserved Investment Advisors August 2007 Charles Drucker, Executive Vice President, IA and FTPS 68 |
 69 Fifth Third Bank | All Rights Reserved Investment Advisors Group at a Glance IA (Non-Exclusive Distribution) Third Parties (Merrill Lynch, Morgan Stanley, etc.) Affiliates and Nationally Affiliates Affiliates DISTRIBUTION >$10MM Third Party Consultant Based Varies depending on product <$1MM in investable assets $1MM+ in investable assets TARGET CLIENTS Asset Management Mutual Funds Wrap Accounts Investment Management Retirement Plans Custody Services Endowment Investment Management Mutual Funds Insurance Annuities Wrap Accounts Stocks and Bonds Investment Management Private Banking Fiduciary Wealth Planning HNW Insurance Hedging Wrap Accounts PRODUCTS & SERVICES Fifth Third Asset Management (FTAM) Institutional Services Fifth Third Securities Private Bank |
 70 Fifth Third Bank | All Rights Reserved Investment Advisors Structure David Pittman IA Division President Charles Drucker Executive Vice President National Marketing National HR Director Director IM&T Director IS Director Private Banking Fifth Third Securities Director Investment Management Client Management Sales Products and Marketing Trading & Investment Ops Affiliate IA Executives Equity Research & Strategy External Mgmnt Program Portfolio Management Hedging Fixed Income Keith Wirtz FTAM Director, Inv. Mgt Group LOB CFO |
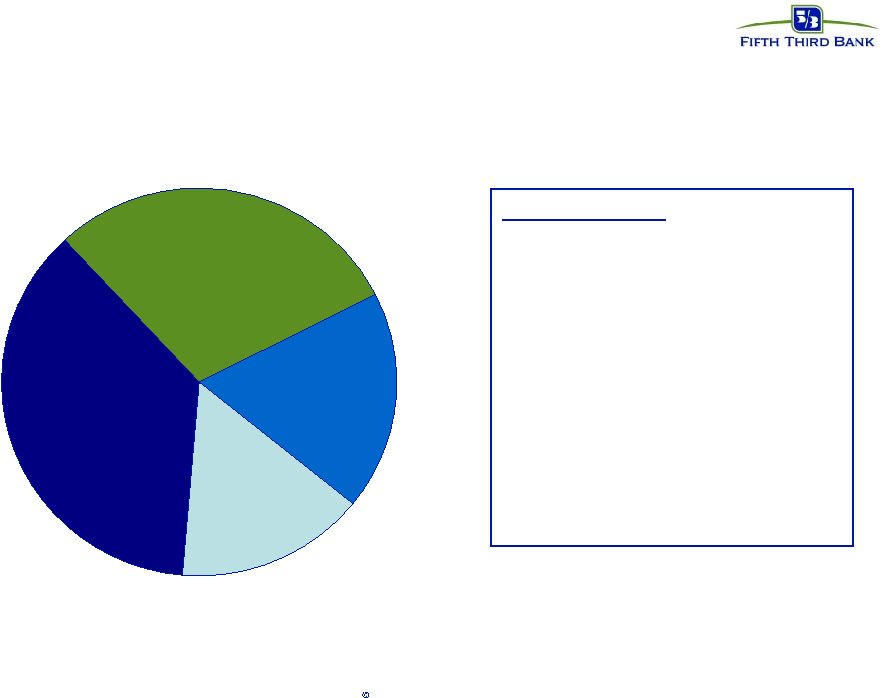 71 Fifth Third Bank | All Rights Reserved Investment Advisors revenue dispersion Key Statistics: • Loans $3.2B • Deposits $4.9B • AUM – $33.7B • AUC – $232.1B • Fifth Third Funds – $12.5B 2007 YTD revenue Brokerage Fees 29% Private Client Services 37% Institutional Trust 18% Mutual Funds 16% |
 72 Fifth Third Bank | All Rights Reserved Market Outlook Expected Impacts $15-$20 Trillion of new investable assets $13-$15 Billion in additional investment revenues Increased client sophistication Increased pricing pressure especially as clients look towards quality as service differentiator Increased importance of integration and non-biased advice to customers Significant growth of “knowledge” technologies Firms look to provide consistency Use of technology as “advisor expert in box” More Alliances and Partnerships Updated Product Models Coordinated Sales efforts 10+% average annual market growth Wealthy growing at 12% Emerging wealthy at 11% Mass affluent at 9% Lower Gross Margins Margins largely dependent upon market and competition Leading to lower margins at this time Increasing product specialization Driving significant delivery and service complexity Increasing the importance of retaining experienced and knowledgeable advisors Increased client desire for integrated and “Open Architecture” based solutions Competitors aggressively responding Market favors large highly integrated players Banks looking to extend existing capabilities to new markets Growth of independent advisors Key Trends |
 73 Fifth Third Bank | All Rights Reserved Outlook Response Optimize advisory sales and delivery resources across FITB footprint - Restructure Portfolio Management Staffing to focus on HNW - Optimize Private Banker Books of Business – Achieve Baseline Performance Adhere to sales to support ratios Rationalize Resource Deployments to Drive Margin Expansion Move to an “Open Architecture” and solution based investment approach - Integrated products with rest of FITB wholesale platform Expand investment offerings to include alternative investments Establish a dedicated Private Banking platform for delivering complex services to HNW clients - Deploy distinct and dedicated resources to focus on specific needs of HNW • Focus on growing Insurance business with HNW individuals Product / Service Differentiation “Top Grade” advisory sales team and selling skills - Dramatically Improve Sales Team Skill set – Develop “large deal” closing capabilities - Enforce sales effectiveness processes for managing out weak performers Build consistent brand and image throughout footprint including one branded sales process and client experience model. Build effective sales support function that allows affiliates to increase focus on sales Build Effective Sales Delivery & Management Capability Rationalize the list of “Right Clients” for the Private Bank through client segmentation initiative Leverage FITB market positions to reach additional clients - Focus on leveraging internal referrals - Leverage Retail and Commercial Partnerships Increase Product Penetration Rates - Cross-sell Insurance, Wealth Planning, and Investment Management Services - Conduct Wealth Planning for 5/3 employees Emphasize Cross-Sell to existing FITB client base STRATEGIC FOCUS AND TACTICS PERFORMANCE THEME |
 74 Fifth Third Bank | All Rights Reserved Investment Advisors •Revenue growth of 2% sequentially, 6% year over year •Non-interest income impacted by realization of approximately $3 million more in trust tax fees due to earlier completion of tax filings and recognition in 1Q. •Expenses grew 4% sequentially and 3% year over year Investment Advisors 2007 2007 2006 2006 2005 Performance Summary Second First Sequential Second YOY Full Full (Dollars in millions) Quarter Quarter % Change Quarter % Change Year Year % Change Income Statement Data Net Interest Income (FTE) $ 37 36 3% 32 16% $ 125 131 -5% Non-interest Income 104 102 2% 101 3% 386 376 3% Total Revenue 141 138 2% 133 6% 511 507 1% Provision for Credit Losses 2 3 -33% 1 100% 3 4 -25% Non-interest Expense 103 99 4% 100 3% 383 385 -1% Income before Taxes 36 36 0% 32 13% 125 118 6% Income Taxes 13 12 8% 11 18% 44 42 5% Segment Earnings $ 23 24 -4% 21 10% $ 81 76 7% Average Balance Sheet Data Commercial loans $ 1,879 1,925 -2% 2,020 -7% $ 2,000 1,730 16% Consumer loans 1,284 1,185 8% 1,052 22% 1,068 954 12% Total loans 3,163 3,110 2% 3,072 3% 3,068 2,684 14% Transaction deposits 4,785 4,651 3% 4,528 6% 4,366 3,888 12% Core deposits 4,924 4,811 2% 4,658 6% 4,499 3,976 13% Efficiency Ratio (FTE) 73.05% 71.74% 2% 75.19% -3% 74.95% 75.94% -1% FTE Employees 1,278 1,324 -3% 1,356 -6% 1,347 1,436 -6% |
 75 Fifth Third Bank | All Rights Reserved Cautionary Statement This report may contain forward-looking statements about Fifth Third Bancorp and/or the company as combined acquired entities within the meaning of Sections 27A of the Securities Act of 1933, as amended, and Rule 175 promulgated thereunder, and 21E of the Securities Exchange Act of 1934, as amended, and Rule 3b-6 promulgated thereunder, that involve inherent risks and uncertainties. This report may contain certain forward-looking statements with respect to the financial condition, results of operations, plans, objectives, future performance and business of Fifth Third Bancorp and/or the combined company including statements preceded by, followed by or that include the words or phrases such as “believes,” “expects,” “anticipates,” “plans,” “trend,” “objective,” “continue,” “remain” or similar expressions or future or conditional verbs such as “will,” “would,” “should,” “could,” “might,” “can,” “may” or similar expressions. There are a number of important factors that could cause future results to differ materially from historical performance and these forward-looking statements. Factors that might cause such a difference include, but are not limited to: (1) general economic conditions, either national or in the states in which Fifth Third, one or more acquired entities and/or the combined company do business, are less favorable than expected; (2) political developments, wars or other hostilities may disrupt or increase volatility in securities markets or other economic conditions; (3) changes in the interest rate environment reduce interest margins; (4) prepayment speeds, loan origination and sale volumes, charge-offs and loan loss provisions; (5) our ability to maintain required capital levels and adequate sources of funding and liquidity; (6) changes and trends in capital markets; (7) competitive pressures among depository institutions increase significantly; (8) effects of critical accounting policies and judgments; (9) changes in accounting policies or procedures as may be required by the Financial Accounting Standards Board or other regulatory agencies; (10) legislative or regulatory changes or actions, or significant litigation, adversely affect Fifth Third, one or more acquired entities and/or the combined company or the businesses in which Fifth Third, one or more acquired entities and/or the combined company are engaged; (11) ability to maintain favorable ratings from rating agencies; (12) fluctuation of Fifth Third’s stock price; (13) ability to attract and retain key personnel; (14) ability to receive dividends from its subsidiaries; (15) potentially dilutive effect of future acquisitions on current shareholders' ownership of Fifth Third; (16) effects of accounting or financial results of one or more acquired entity; (17) difficulties in combining the operations of acquired entities; (18) ability to secure confidential information through the use of computer systems and telecommunications network; and (19) the impact of reputational risk created by these developments on such matters as business generation and retention, funding and liquidity. Additional information concerning factors that could cause actual results to differ materially from those expressed or implied in the forward-looking statements is available in the Bancorp’s Annual Report on Form 10-K for the year ended December 31, 2006, filed with the United States Securities and Exchange Commission (SEC). Copies of this filing are available at no cost on the SEC’s Web site at www.sec.gov or on Fifth Third’s web site at www.53.com. Fifth Third undertakes no obligation to release revisions to these forward-looking statements or reflect events or circumstances after the date of this report. |
 76 Fifth Third Bank | All Rights Reserved Additional Information Where You Can Find Additional Information About The Merger The proposed Merger will be submitted to First Charter’s shareholders for consideration. Fifth Third will file a Form S-4 Registration Statement, First Charter will file a Proxy Statement and both companies will file other relevant documents regarding the Merger with the Securities and Exchange Commission (the “SEC”). First Charter will mail the Proxy Statement/Prospectus to its shareholders. These documents, and any applicable amendments or supplements, will contain important information about the Merger, and Fifth Third and First Charter urge you to read these documents when they become available. You may obtain copies of all documents filed with the SEC regarding the Merger, free of charge, at the SEC’s website (www.sec.gov). You may also obtain these documents free of charge from Fifth Third’s website (www.53.com) under the heading “About Fifth Third” and then under the heading “Media and Investors-Investor Relations” and then under the item “SEC Filings.” You may also obtain these documents, free of charge, from First Charter’s website (www.FirstCharter.com) under the section “About First Charter” and then under the heading “Investor Relations” and then under the item “Financial Reports / SEC Filings.” Participants in The Merger Fifth Third and First Charter and their respective directors and executive officers may be deemed participants in the solicitation of proxies from First Charter’s shareholders in connection with the Merger. Information about the directors and executive officers of Fifth Third and First Charter and information about other persons who may be deemed participants in the Merger will be included in the Proxy Statement/Prospectus. You can find information about Fifth Third’s executive officers and directors in its definitive proxy statement filed with the SEC on March 9, 2007. You can find information about First Charter’s executive officers and directors in its definitive proxy statement filed with the SEC on March 25, 2007. You can obtain free copies of these documents from the websites of Fifth Third, First Charter or the SEC. |