 Fifth Third Bank | All Rights Reserved Fox-Pitt Kelton Cochran Caronia Waller Financial Services Conference Chris Marshall, EVP and Chief Financial Officer November 29, 2007 Exhibit 99.1 |
 2 Fifth Third Bank | All Rights Reserved Agenda Profile Geographic diversification De novo activities Business mix diversification Payments processing Credit Capital and liquidity Appendix |
 3 Fifth Third Bank | All Rights Reserved Cincinnati Florence Louisville Lexington Nashville Atlanta Augusta Orlando Tampa Naples Raleigh Charlotte Huntington Pittsburgh Cleveland Columbus Toledo Detroit Grand Rapids Traverse City Chicago Evansville Jacksonville Indianapolis Fifth Third’s current footprint First Charter (pending) First Horizon branches (pending) St. Louis First quarter 2008 Cincinnati Florence Louisville Lexington Cleveland Columbus Toledo Grand Rapids Traverse City Chicago Evansville Indianapolis Geographic diversification First quarter 2004 * Pro forma as of 9/30/07 for pending acquisitions and 47 de novo branches expected in 4Q07 and 1Q08. 15 branches in Florida 12 6 # of states with branches 1,329 960 Banking centers $74B $55B Deposits $112B $94B Assets 1Q-08* 1Q-04 Detroit |
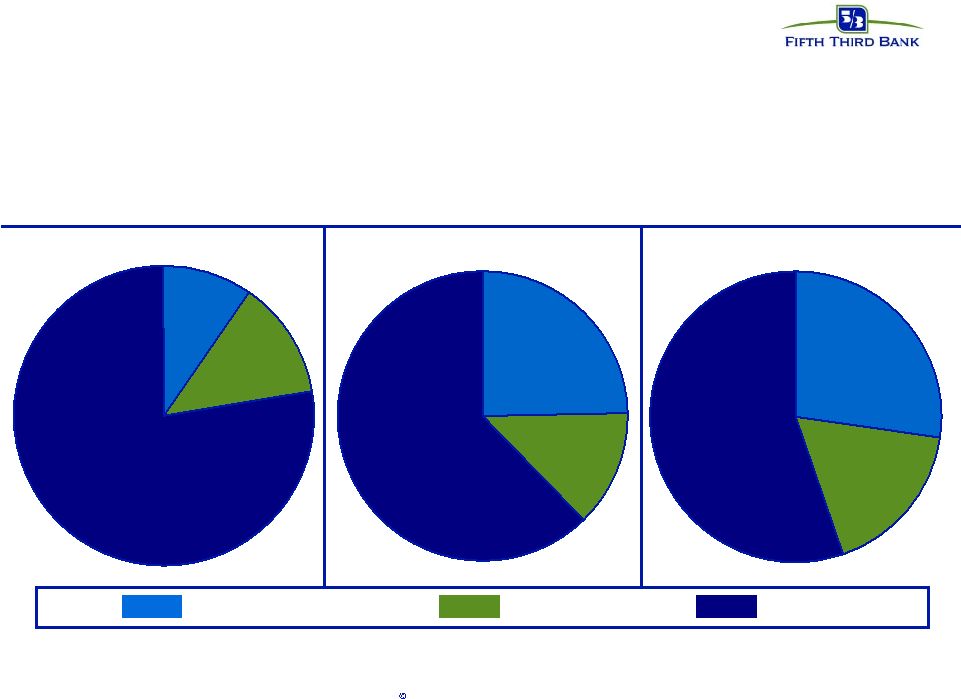
 4 Fifth Third Bank | All Rights Reserved 77% 13% 10% 13% 25% 62% Changing our profile 2004 1Q08 pro forma 2010 plan # 55% 27% 18% 23% in high growth* markets 1,005 branches 38% in high growth* markets 1,329 branches Southeast Chicago Other 45% in high growth* markets 1,552 branches Southeast includes: Florida, Georgia, Kentucky, North Carolina and Tennessee. * Growth markets include Southeast and Chicago. # assumes 47 de novos in 4Q07 and 1Q08 and 80 net de novos per year thereafter 778 branches 827 branches 858 branches 99 327 421 128 175 273 |
 5 Fifth Third Bank | All Rights Reserved De novo activities • Opened 58 total new branches in the past 12 months (expect 80 per year for the next few years) • Continue to invest in high opportunity markets • Site selection focuses on market potential, predictive modeling and IRR optimization • De novo activity has been, and will continue to be, of significant economic value to Fifth Third 2007- 2009 planned builds 47% 28% 7% 18% Florida Chicago Other Tennessee * Six years De novo targets (2007 vintage) • Mature* deposits $40MM • Mature* loans $13MM • Expected IRR 20%+ • Breakeven 20 months • Cumulative breakeven 36 months |
 6 Fifth Third Bank | All Rights Reserved 0 5000 10000 15000 20000 25000 30000 35000 40000 Y0 Y1 Y2 Y3 Y4 Y5 Y6 2005 Average 04-05 Goal 0 5000 10000 15000 20000 25000 30000 35000 40000 Y0 Y1 Y2 Y3 Y4 Y5 Y6 2003 Average 04-05 Goal De novo performance growth markets $35 mm pace $35 mm goal $35 mm goal $38 mm goal $40mm goal Source: SNL. FDIC deposit year vintages (July 1-June 30). Deposit balances annualized using day-weighting (e.g., branch opened Dec. 31 of a given year has first year deposits doubled; second year deposits multiplied by 1.333x, etc.) All Fifth Third full service de novos (excludes BankMart, satellite office, retirement center locations). Excludes relocations and locations with first year deposits >$30 million. 0 5000 10000 15000 20000 25000 30000 35000 40000 Y0 Y1 Y2 Y3 Y4 Y5 Y6 2007 Average 07 Goal 0 5000 10000 15000 20000 25000 30000 35000 40000 Y0 Y1 Y2 Y3 Y4 Y5 Y6 2006 Average 0 5000 10000 15000 20000 25000 30000 35000 40000 Y0 Y1 Y2 Y3 Y4 Y5 Y6 2004 Average 04-05 Goal 06 Goal |
 7 Fifth Third Bank | All Rights Reserved Diversified franchise 39% 14% 29% 9% 9% 2007 Revenue - $6 billion* Branch Banking $2.3B FTPS $826MM Investment Advisors $560MM Commercial Banking $1.7B Consumer Lending $561MM Branch Banking (40% of earnings) Retail & Business banking 2.8 million households 1,181 branches, 2,153 ATMs Commercial Banking (39%) Corporate & Middle Market Lending, Treasury Services, International Trade Finance, Commercial leasing and syndicated finance Processing Solutions (8%) Over 154,000 merchant locations Processes transactions for over 2,400 Financial Institutions 3 rd leading issuer of MasterCard Branded debit cards 1 Consumer Lending (7%) 8,700 dealer indirect auto lending network $33.1 billion mortgage servicing portfolio Federal and private student education loans Investment Advisors (6%) 2,000 Registered Representatives 423 Private Bank Relationship Managers Over 80,000 Private Bank Relationships *Represents tax-equivalent revenue. Excludes eliminations/other revenue; Data 3Q YTD annualized. 1 Source Media 2007 edition |
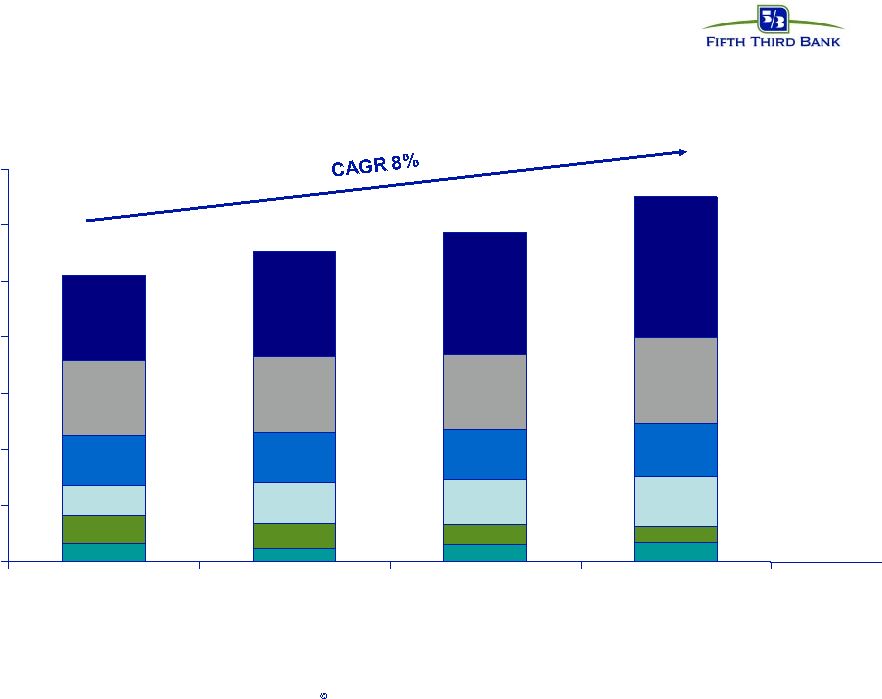
 8 Fifth Third Bank | All Rights Reserved Fee income diversification $50 $150 $250 $350 $450 $550 $650 $750 3Q-2004 3Q-2005 3Q-2006 3Q-2007 ($ in millions) 18% 4% 3% 19% -19% -7% Payment processing Deposit service charges Investment advisory Corporate banking Mortgage Other CAGR Category 2006-2007 Growth 16% 13% 7% 15% -28% 6% 42% of revenue 47% of revenue 45% of revenue 48% of revenue Excludes securities gains/losses and operating lease income. |
 9 Fifth Third Bank | All Rights Reserved FTPS: key growth engine Merchant • 4th Largest U.S. Acquirer • Over 35,000 merchants • $150B in processing volume • Over 4.4B acquired transactions • e.g. Nordstrom, Saks, Walgreen's, Office Max, Barnes and Noble, U.S. Treasury Bankcard • $1.7B in outstanding balances • 1.0MM cardholders • Top three Debit MasterCard Issuer • 23rd largest U.S. bankcard issuer Financial Institutions • 2,400 FI relationships • Over 900MM POS/ATM transactions 2007 YTD revenue* 47% 32% 21% Merchant Services Financial Institutions Bankcard $0 $50 $100 $150 $200 $250 3Q04 4Q04 1Q05 2Q05 3Q05 4Q05 1Q06 2Q06 3Q06 4Q06 1Q07 2Q07 3Q07 Merchant Card Interchange FI/EFT CAGR 22% CAGR 14% CAGR 19% CAGR 18% * Excludes $12mm in pre-tax gains related to the sale of certain non-strategic credit card accounts in 2Q07. |
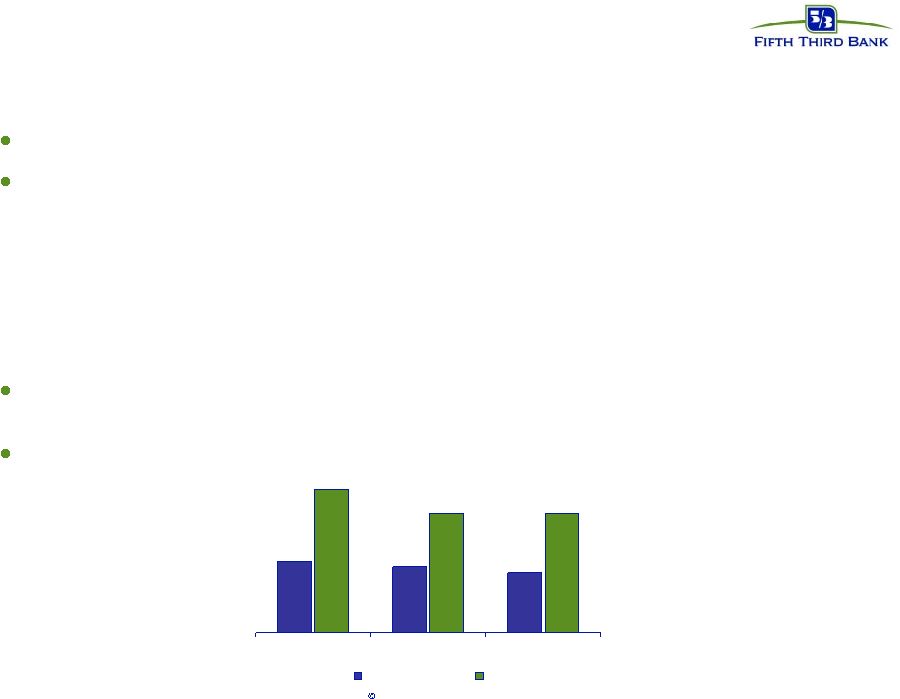
 10 Fifth Third Bank | All Rights Reserved Credit cards: capturing our fair share 13th largest bank, 23rd largest credit card issuer Significant opportunity in high risk-adjusted return business — Improve retail production by deploying sales technologies to enhance ease of sale — Move from “ultra” conservative underwriting to “conservative” underwriting (weighted average FICO from >740 to >720) — Optimize profitability of existing portfolio through modest investments in marketing, analytics, and human capital 3Q07 balances up 57% from 3Q06; originations up 83% year-over-year, from 14 to 28 cards per banking center per month Goal: double assets, accounts, net income by 2009 Assets Accounts Net income 2006 2009 1,200 2,400 1.1 2.0 41 83 ($ MMs) |
 11 Fifth Third Bank | All Rights Reserved Payments business value to FITB Standalone payments processing business value: $3.9 billion at 24.0x LTM earnings Implied value of remainder of Fifth Third: $11.0 billion, or 8.4x 2007 LTM earnings Implied FITB discount: $2.7- 4.0 billion, or $5.10-$7.50 per share. 3% 5% ^Standalone payments process business includes FI, Merchant and Credit Card (with “agent bank” residuals to Fifth Third) and excludes correspondent banking, ATM administration, HSA administration, and Multicard. Trailing four quarters earnings for standalone payments business of $164 million. Represents 1) FTPS trailing four quarters segment earnings of $80 million, plus $51 million after-tax related to VISA settlement with AMEX, less $10 million after-tax related to gains on sale of single product credit card accounts, plus 2) net addition of $43 million of after-tax earnings to reflect additional earnings contribution, primarily card issuer interchange reflected in the Branch Banking segment, when viewed as standalone entity. *2007 average P/E for publicly traded payments processors (TSS, GPN, FIS, ADS). Stock prices and 2007 estimates as of 11/23/07. Source: Bloomberg. #2007 P/E for top 15 U.S. regional banks. Stock prices and 2007 estimates as of 11/23/07. Source: Bloomberg. LTM earnings Market value 2007 P/E Total Fifth Third 1,471 $ X 10.1 = $ 14.9B Standalone payments processing^ 164 $ X 24.0* = $ 3.9 B Rest of Fifth Third 1,307 $ X 8.4 = $ 11.0 B Top 15 U.S. Regionals # - Average 11.5 - Median 10.5 |
 12 Fifth Third Bank | All Rights Reserved Diversified loan portfolio $42 billion commercial loan portfolio 93% secured $880,000 average outstanding $1.7 million average exposure YTD NCOs: 35 bps $35 billion consumer loan portfolio 93% secured - 63% secured by real estate, 30% by auto Real estate portfolio - 79% weighted average CLTV - Weighted average FICO 733 - 56% first lien secured No subprime YTD NCOs: 72 bps Commercial and Industrial Commercial Mortgage Credit Card Auto Loans Commercial Leases 14% 28% Commercial Construction Residential Mortgage 7% Home Equity 14% 13% 5% Other Consumer 2% 2% 15% Third quarter YTD average loan portfolio 3% 5% |
 13 Fifth Third Bank | All Rights Reserved 0.00% 0.10% 0.20% 0.30% 0.40% 0.50% 0.60% 0.70% 0.80% 0.90% 1998 1999 2000 2001 2002 2003 2004 2005 2006 2007 Fifth Third Bank Normalized Peer Group Average Peer Group Average* Net charge-offs Credit quality *Peer group includes Top 15 U.S. regional banks: BBT, CMA, FHN, HBAN, KEY, MTB, MI, NCC, PNC, RF, STI, USB, WB, and WFC. Data per FR- Y9C regulatory data. 2007 data as of June. #Peer loan mix normalized to FITB loan mix, multiplied by peer charge-off ratio for each loan type. Data per FR-Y9C regulatory data. 2007 data as of June. Midwest Loan mix FITB 3Q # |
 14 Fifth Third Bank | All Rights Reserved 4.20 5.28 5.38 5.42 5.42 6.32 6.42 6.78 6.83 8.26 CMA FITB KEY MI STI HBAN BBT NCC USB WB 6.88 7.19 7.20 7.45 7.67 7.92 8.35 8.46 8.60 9.30 BBT USB FITB HBAN KEY CMA STI WB MI NCC Strong capital position Tangible Common Equity as % of Tangible Assets Tier 1 Ratio Target 6.5% *Peer group: U.S. banks sharing similar geography or debt ratings |
 15 Fifth Third Bank | All Rights Reserved * Excludes intangibles. Financial data period end as of 9/30/2007. Strong liquidity position Strong core funding* 7% 60% Core deposits Other deposits Tangible equity Fed funds, other ST borrowings Other liabilities Long-term debt 12% 4% 8% 9% 0% 10% 20% 30% 40% 50% 60% 70% 80% 90% 100% MI USB WB KEY NCC HBAN STI BBT CMA FITB Tangible equity Core deposits Other liabilities Long term debt ST borrowings Relatively low wholesale borrowings* Wholesale funding TCE & core deposits |
 16 Fifth Third Bank | All Rights Reserved Fifth Third: building a better tomorrow Balancing growth and profitability Capitalizing on strengths and developing plans to address areas of weakness Communicating clearly with investors Delivering on promises Returning to above-par performance and shareholder returns |
 17 Fifth Third Bank | All Rights Reserved Cautionary Statement This report may contain forward-looking statements about Fifth Third Bancorp and/or the company as combined acquired entities within the meaning of Sections 27A of the Securities Act of 1933, as amended, and Rule 175 promulgated thereunder, and 21E of the Securities Exchange Act of 1934, as amended, and Rule 3b-6 promulgated thereunder, that involve inherent risks and uncertainties. This report may contain certain forward-looking statements with respect to the financial condition, results of operations, plans, objectives, future performance and business of Fifth Third Bancorp and/or the combined company including statements preceded by, followed by or that include the words or phrases such as “believes,” “expects,” “anticipates,” “plans,” “trend,” “objective,” “continue,” “remain” or similar expressions or future or conditional verbs such as “will,” “would,” “should,” “could,” “might,” “can,” “may” or similar expressions. There are a number of important factors that could cause future results to differ materially from historical performance and these forward-looking statements. Factors that might cause such a difference include, but are not limited to: (1) general economic conditions, either national or in the states in which Fifth Third, one or more acquired entities and/or the combined company do business, are less favorable than expected; (2) political developments, wars or other hostilities may disrupt or increase volatility in securities markets or other economic conditions; (3) changes in the interest rate environment reduce interest margins; (4) prepayment speeds, loan origination and sale volumes, charge-offs and loan loss provisions; (5) our ability to maintain required capital levels and adequate sources of funding and liquidity; (6) changes and trends in capital markets; (7) competitive pressures among depository institutions increase significantly; (8) effects of critical accounting policies and judgments; (9) changes in accounting policies or procedures as may be required by the Financial Accounting Standards Board or other regulatory agencies; (10) legislative or regulatory changes or actions, or significant litigation, adversely affect Fifth Third, one or more acquired entities and/or the combined company or the businesses in which Fifth Third, one or more acquired entities and/or the combined company are engaged; (11) ability to maintain favorable ratings from rating agencies; (12) fluctuation of Fifth Third’s stock price; (13) ability to attract and retain key personnel; (14) ability to receive dividends from its subsidiaries; (15) potentially dilutive effect of future acquisitions on current shareholders' ownership of Fifth Third; (16) effects of accounting or financial results of one or more acquired entity; (17) difficulties in combining the operations of acquired entities; (18) ability to secure confidential information through the use of computer systems and telecommunications network; and (19) the impact of reputational risk created by these developments on such matters as business generation and retention, funding and liquidity. Additional information concerning factors that could cause actual results to differ materially from those expressed or implied in the forward-looking statements is available in the Bancorp’s Annual Report on Form 10-K for the year ended December 31, 2006, filed with the United States Securities and Exchange Commission (SEC). Copies of this filing are available at no cost on the SEC’s Web site at www.sec.gov or on Fifth Third’s web site at www.53.com. Fifth Third undertakes no obligation to release revisions to these forward-looking statements or reflect events or circumstances after the date of this report. |
 18 Fifth Third Bank | All Rights Reserved Appendix |
 19 Fifth Third Bank | All Rights Reserved De novo performance all markets $35 mm pace $35 mm goal $35 mm goal $35 mm pace $38 mm goal $40 mm goal Source: SNL. FDIC deposit year vintages (July 1-June 30). Deposit balances annualized using day-weighting (e.g., branch opened Dec. 31 of a given year has first year deposits doubled; second year deposits multiplied by 1.333x, etc.) All Fifth Third full service de novos (excludes BankMart, satellite office, retirement center locations). Excludes relocations and locations with first year deposits >$30 million. 0 5000 10000 15000 20000 25000 30000 35000 40000 Y0 Y1 Y2 Y3 Y4 Y5 Y6 2002 Average 04-05 Goal 0 5000 10000 15000 20000 25000 30000 35000 40000 Y0 Y1 Y2 Y3 Y4 Y5 Y6 2004 Average 04-05 Goal 0 5000 10000 15000 20000 25000 30000 35000 40000 Y0 Y1 Y2 Y3 Y4 Y5 Y6 2003 Average 04-05 Goal 0 5000 10000 15000 20000 25000 30000 35000 40000 Y0 Y1 Y2 Y3 Y4 Y5 Y6 2007 Average 07 Goal 0 5000 10000 15000 20000 25000 30000 35000 40000 Y0 Y1 Y2 Y3 Y4 Y5 Y6 2006 Average 06 Goal 0 5000 10000 15000 20000 25000 30000 35000 40000 Y0 Y1 Y2 Y3 Y4 Y5 Y6 2005 Average 04-05 Goal |
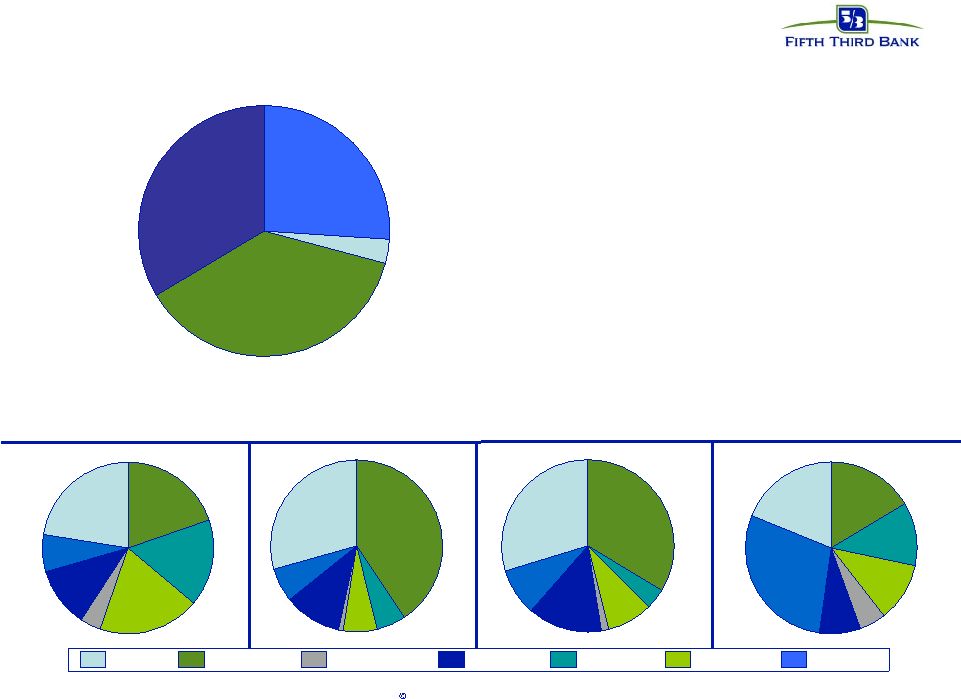
 20 Fifth Third Bank | All Rights Reserved Nonperforming assets –Total NPA’s of $706M, or 92 bps –Commercial NPA’s of $446M; recent growth driven by commercial constraint and real estate, particularly in Eastern Michigan, Northeastern Ohio, and Southern Florida –Consumer NPA’s of $260M; recent growth driven by residential real estate, particularly in Michigan and Florida –97% of commercial and 100% of consumer NPA’s are secured 22% 20% 16% 19% 4% 12% 7% 29% 4% 9% 2% 14% 9% 33% 17% 12% 5% 28% 8% 19% 11% 29% 5% 7% 1% 11% 6% 41% C&I CRE Residential Other Consumer OTHER ILLINOIS INDIANA FLORIDA KENTUCKY MICHIGAN OHIO Reported NPA's by loan type Residential $238M 34% C&I $179M 26% Other $27M 3% CRE $262M 37% |
 21 Fifth Third Bank | All Rights Reserved Commercial portfolio - topical areas* Commercial real estate (CRE) Total outstandings $16.6B — Commercial mort $11.1B (50% owner occ’d) — Construction 5.5B (20% owner occ’d) Total CRE 16.6B (40% owner occ’d) Total CRE exp $20.2B — Average size $1MM (relationship) — 39% of commercial loans, 22% of total loans Problem assets — NPAs $262MM (1.58%) — > 90 days past due 96MM (0.58%) — YTD charge-offs 46MM (0.37%) Syndicated lending Total loans ~$4B O/S — PD rating # 5.5 vs. 6.7 for commercial portfolio — Ave size ~$8 million — Relationships ~550 < 10% of commercial loans, < 5% total loans Leveraged^ < $200MM O/S — Ave size ~$6MM — Relationships ~20 — Syndication warehouse $100 million – No “hung” deals Problem assets — NPAs $11MM — >90 days past due 0MM Commercial paper conduit $3.0B outstandings under current facility — High quality, short-term commercial loans, commercial receivables, commercial securities — No subprime, mortgage assets in conduit Fully backed, enhanced by Fifth Third Bank * # Weighted average probability of default rating ^Regulatory HLT definition, i.e., priced at L+250 bps or greater Office 23% Other 11% Raw land 5% Land under devel't 7% Indu 14% Apts 18% Retail 18% Devel'd land 4% CRE collateral type * All data as of 9/30/07 |
 22 Fifth Third Bank | All Rights Reserved Residential real estate - topical areas* Mortgage: $9.1B outstanding 1 st liens: 100% ; weighted average LTV: 80%; weighted average origination FICO: 720 Origination FICO distribution: <659 12%; 660-689 10%; 690-719 15%; 720-749 16%; 750+ 47% (note: loans <659 includes CRA loans and FHA/VA loans) Origination LTV distribution: <70 26%; >70-80 41%; >80-90 11%; >90 22% % through broker: 13% NPAs: $150MM (1.70%); over 90s: $116MM (1.32%) Charge-offs: $25MM YTD (0.39%) * All data updated as of 9/30/07 Home equity: $11.7B outstanding 1 st liens: 25%; 2 nd liens: 75% (20% of 2 nd liens behind FITB 1 st s) Weighted average CLTV: 78% (1 st liens 64%; 2 nd liens 82%) Origination CLTV distribution: <70 27%; >70-80 22%; >80-90 21%; >90.1 30% Weighted average origination FICO: 741 (1 st liens 749; 2 nd liens 739) Origination FICO distribution: <659 5%; 660-689 10%; 690-719 16%; 720-749 20%; 750+ 48% Vintage distribution: 2007 12%; 2006 21%; 2005 19%; 2004 14%; prior to 2004 34% % through broker channels: 24% WA FICO: 733 brokered, 744 direct; WA CLTV: 89% brokered, 74% direct NPAs: $88MM (0.76%); over 90s: $64MM (0.54%) Charge-offs: $64 million YTD (0.72%) No subprime Alt A originations: 3Q07 $71MM; $43MM warehouse, WA FICO 700, WA LTV 72% — All warehoused loans after 10/01/07 are being delivered under an agency flow agreement. — $163MM in loan portfolio (viewed as un-saleable in current market environment), WA origination FICO 700, WA origination LTV 72% OH 30% FL 23% IL 7% KY 6% MI 18% IN 8% Other 8% OH 34% IL 10% KY 10% FL 6% MI 23% IN 11% Other 6% |