 Fifth Third Bank | All Rights Reserved UBS Global Financial Services Conferences Kevin Kabat, President and CEO May 12, 2008 Exhibit 99.1 |
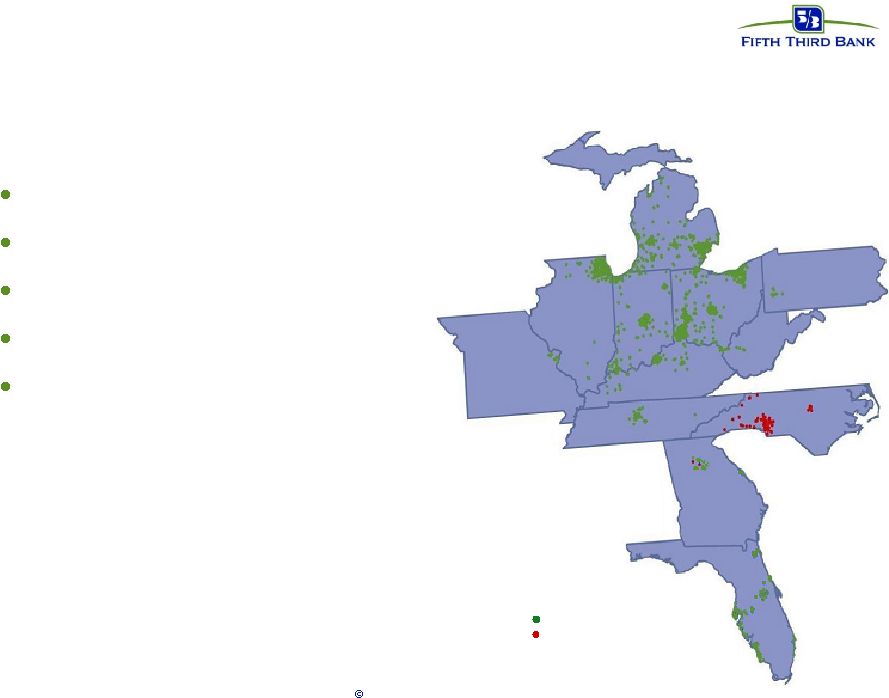 2 Fifth Third Bank | All Rights Reserved Cincinnati Florence Louisville Lexington Nashville Atlanta Augusta Orlando Tampa Naples Raleigh Charlotte Huntington Pittsburgh Cleveland Columbus Toledo Detroit Grand Rapids Traverse City Chicago Evansville Jacksonville Indianapolis Fifth Third’s current footprint First Charter (pending) St. Louis Footprint* Fifth Third overview *Pro forma as of 3/31/08 for pending acquisition ^ As of 4/28/08 $111 billion assets #14 $11 billion market cap #12 ^ 1,232 banking centers 2,221 ATMs 18 affiliates in 11 states |
 3 Fifth Third Bank | All Rights Reserved 1Q08 in review Difficult quarter due to economic environment — BOLI charge and VISA gain distorted financial results — Significant 1Q08 increase in charge-offs and provision Core business momentum remains strong — NII growth of 11% versus 1Q07 — Fee income growth of 22% excluding the impact of significant unusual items* — Average loan growth of 12% and core deposit growth of 5% (transaction deposit growth of 7%) — Operating efficiency ratio ^ of 54%; includes fast growing payments business (~70% efficiency ratio) *Reported noninterest income growth was 42%. Comparison excludes $152 million BOLI charge and $273 million Visa IPO gain in 1Q08. **Loans including held for investment and held for sale; transaction deposits represent core deposits excluding CDs ^ Reported efficiency ratio was 42.3%. Excludes $152 million BOLI charge, $273 million Visa IPO gain, $152 million reversal of Visa litigation expenses and $16 million in merger-related and severance charges. |
 4 Fifth Third Bank | All Rights Reserved FITB 1Q08 Large bank peers (1) 1Q08 Midwest peers (2) 1Q08 YOY performance vs. peers Loan growth 12% 7% 10% Outperformed Transaction deposit growth NII growth 7% 11% 4% 9% 5% 10% Outperformed Outperformed Operating fee growth* 22% 2% 7% Outperformed Operating efficiency ratio* Operating ROE** 54% 12% 61% 7% 62% 8.5% Outperformed Outperformed NPA growth 222% 228% 264% In line Net charge-off ratio 1.37% 1.02% 0.93% Underperformed * Operating data per SNL. Operating fees for all banks exclude VISA gains and BOLI. Operating expenses for all banks excludes Visa-related expenses and expense reversals and merger-related/severance charges. See slides 4, 6 and 8 for more information regarding FITB results. ** Operating ROE equals First Call consensus EPS times average fully diluted shares divided by average common equity. FITB reported ROE was 12%. (1) Large bank peer average consists of BBT, COF, CMA, HBAN, KEY, MTB, MI, NCC, PNC, RF, STI, USB, WB, WM, WFC and ZION; for peer deposit and loan comparisons, excludes HBAN, NCC, and PNC due to significant impact of acquisitions. (2) Midwest peer average consists of HBAN, KEY, MI, CMA, NCC and USB, except where outlined above. Source: SNL and company reports. Loans include held for investment and held for sale. Core deposits excluding CDs. Peer performance summary Continue to outperform on key value drivers; credit challenging |
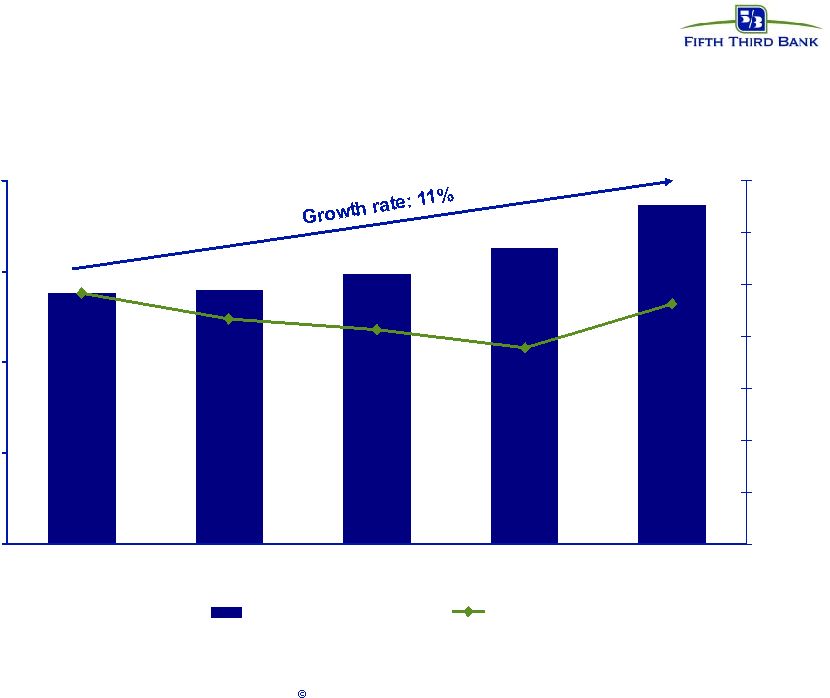 5 Fifth Third Bank | All Rights Reserved 2.75% 3.00% 3.25% 3.50% 3.75% 1Q07 2Q07 3Q07 4Q07 1Q08 $500 $550 $600 $650 $700 $750 $800 $850 Net interest income NIM Increasing net interest income |
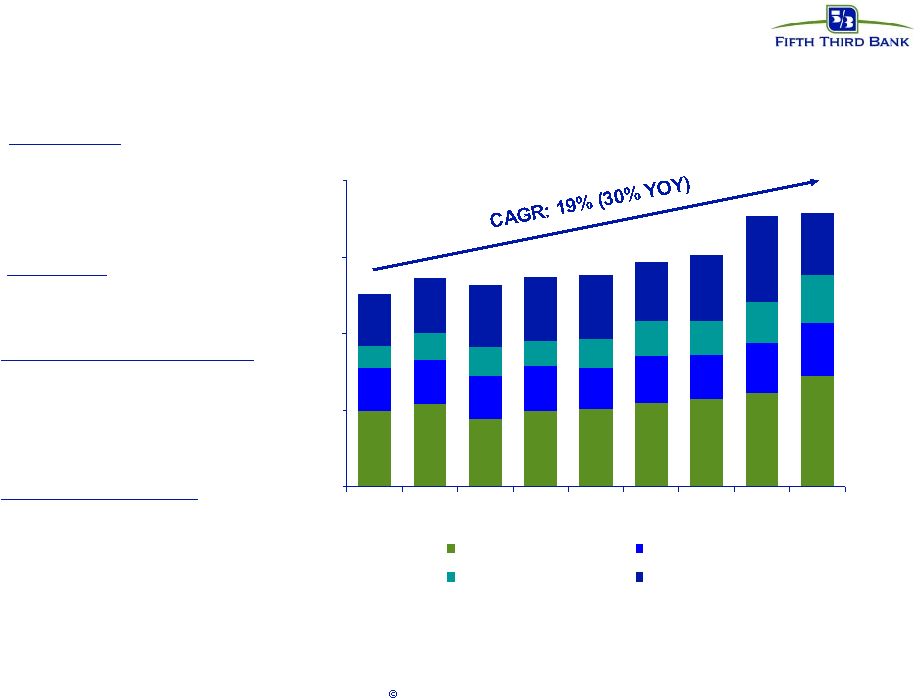
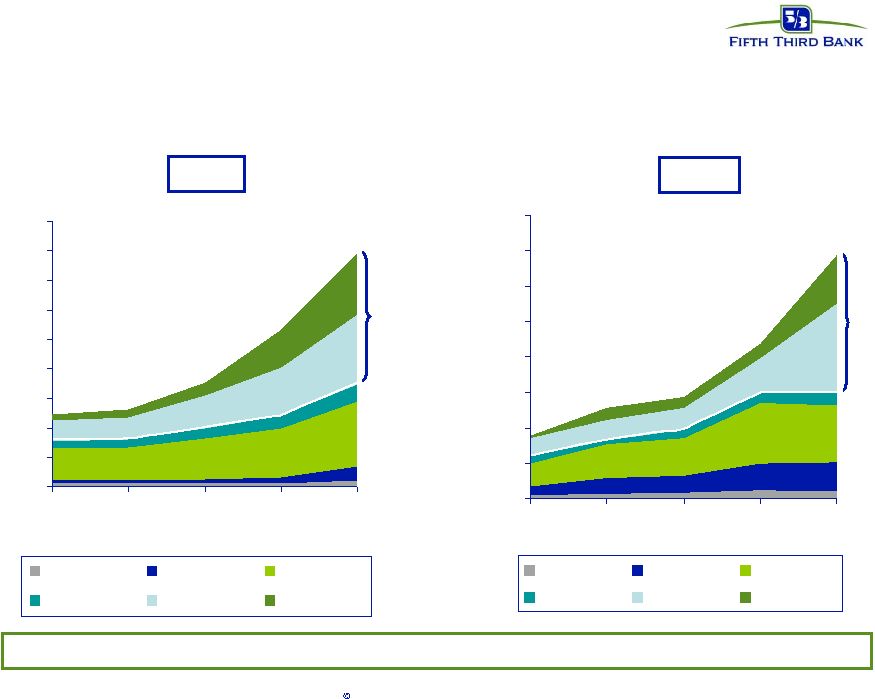
 6 Fifth Third Bank | All Rights Reserved Fee income growth and diversification $0 $100 $200 $300 $400 $500 $600 $700 $800 $900 1Q07 2Q07 3Q07 4Q07 1Q08 Payment processing Deposit service charges Investment advisory Corporate banking Mortgage Secs/other Reported noninterest income growth 42%. Excludes $152 million BOLI charge and $273 million Visa IPO gain in 1Q08; excludes $177 million BOLI charge in 4Q07. YOY growth +15% +17% -3% +30% +144% +10% |
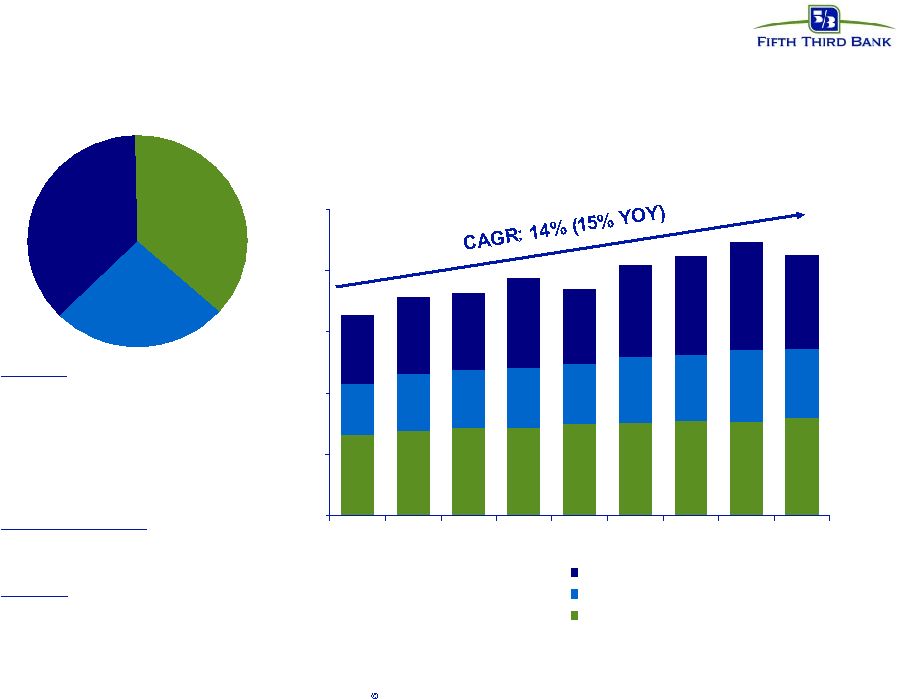 7 Fifth Third Bank | All Rights Reserved FTPS: key growth engine 1Q08 revenue 36% 37% 27% Merchant Services Financial Institutions Bankcard $0 $50 $100 $150 $200 $250 1Q06 2Q06 3Q06 4Q06 1Q07 2Q07 3Q07 4Q07 1Q08 Merchant Bankcard FI/EFT +17% 2-Yr CAGR Merchant • 4th Largest U.S. Acquirer • Over 37,500 merchants • $26.7B in credit/debit processing volume • Over 5.6B acquired transactions • e.g. Nordstrom, Saks, Walgreen's, Office Max, Barnes and Noble, U.S. Treasury Financial Institutions • 2,700 FI relationships • 877MM POS/ATM transactions Bankcard • $2.0B in outstanding balances • 1.6MM cardholders • Top three Debit MasterCard Issuer • 23rd largest U.S. bankcard issuer YOY growth +16% +10% +23% +17% +6% |
 8 Fifth Third Bank | All Rights Reserved Corporate banking $0 $30 $60 $90 $120 1Q06 2Q06 3Q06 4Q06 1Q07 2Q07 3Q07 4Q07 1Q08 International Business lending Derivatives Capital markets lending fees 2-Yr CAGR YOY growth +9% +48% +12% +20% -2% +68% +28% +42% International • Letters of credit • Foreign exchange Capital markets lending fees • Institutional Sales • Asset securitization/conduit fees • Loan/lease syndication fees Derivatives • Customer interest rate derivatives Business lending fees • Commitment and other loan fees |
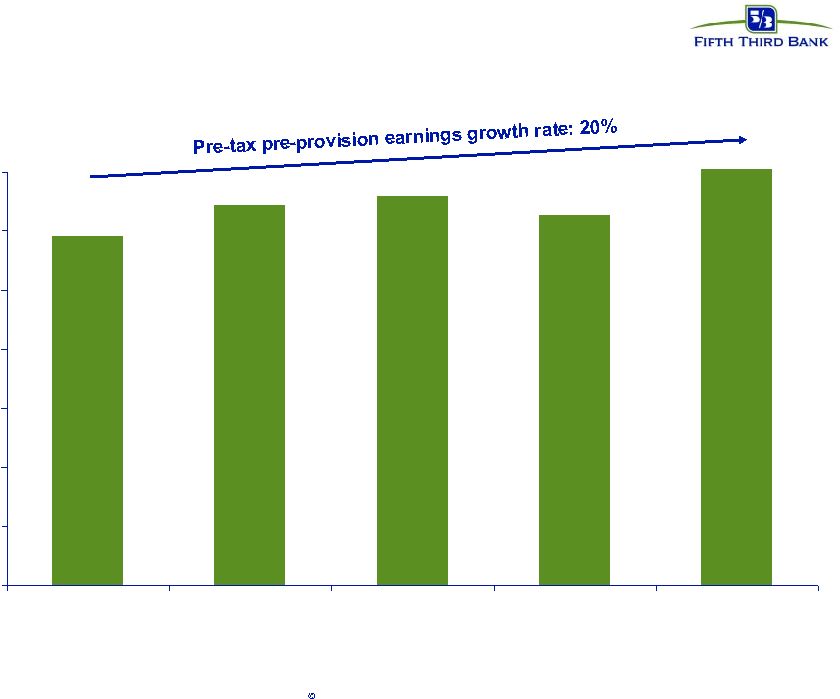 9 Fifth Third Bank | All Rights Reserved Strong operating performance… $0 $100 $200 $300 $400 $500 $600 $700 1Q07 2Q07 3Q07 4Q07 1Q08 Reported pre-tax pre-provision earnings growth 64%. Excludes $152 BOLI charge, $273 Visa IPO gain, $152 million reversal of Visa litigation expenses and $16 million in merger-related and severance charges in 1Q08; excludes $177 million BOLI charge, $94 million in Visa litigation expense, and $8 million in merger-related expenses in 4Q07; excludes $78 million in Visa litigation expense in 3Q07. |
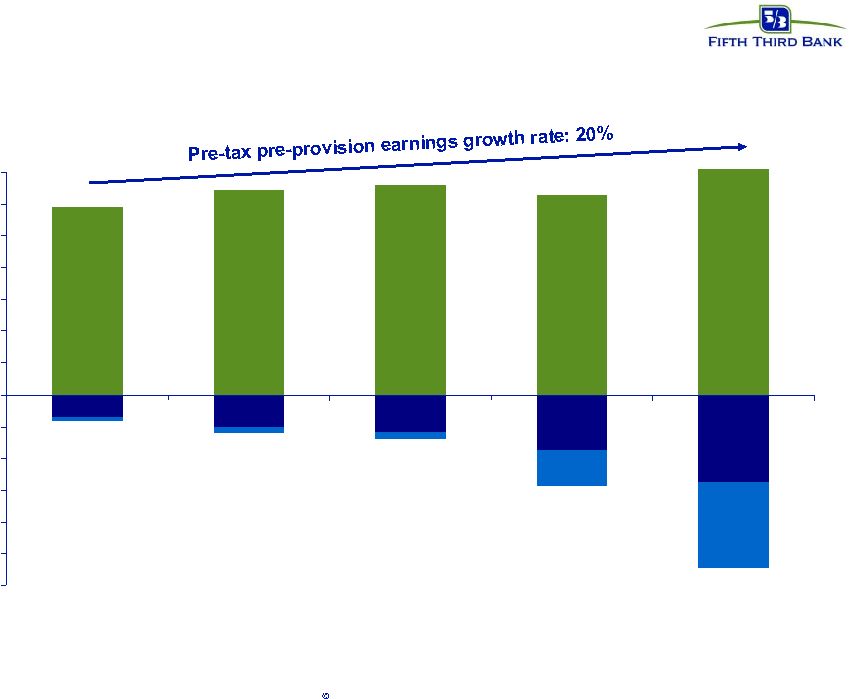 10 Fifth Third Bank | All Rights Reserved … offset by current high credit costs -$600 -$500 -$400 -$300 -$200 -$100 $0 $100 $200 $300 $400 $500 $600 $700 1Q07 2Q07 3Q07 4Q07 1Q08 Net charge- offs Reported pre-tax pre-provision earnings growth 64%. Excludes $152 BOLI charge, $273 Visa IPO gain, $152 million reversal of Visa litigation expenses and $16 million in merger-related and severance charges in 1Q08; excludes $177 million BOLI charge, $94 million in Visa litigation expense, and $8 million in merger-related expenses in 4Q07; excludes $78 million in Visa litigation expense in 3Q07. Additional provision |
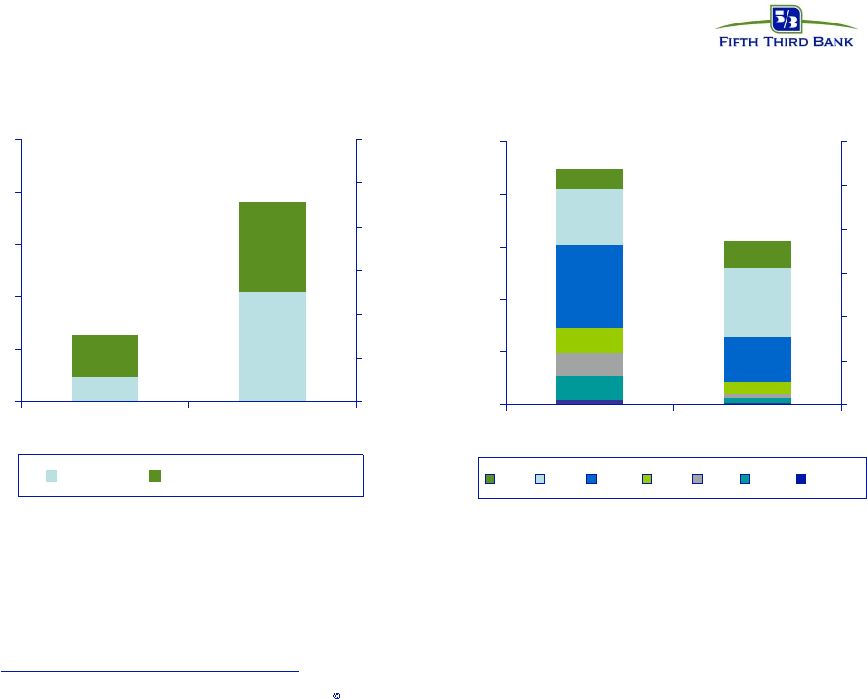
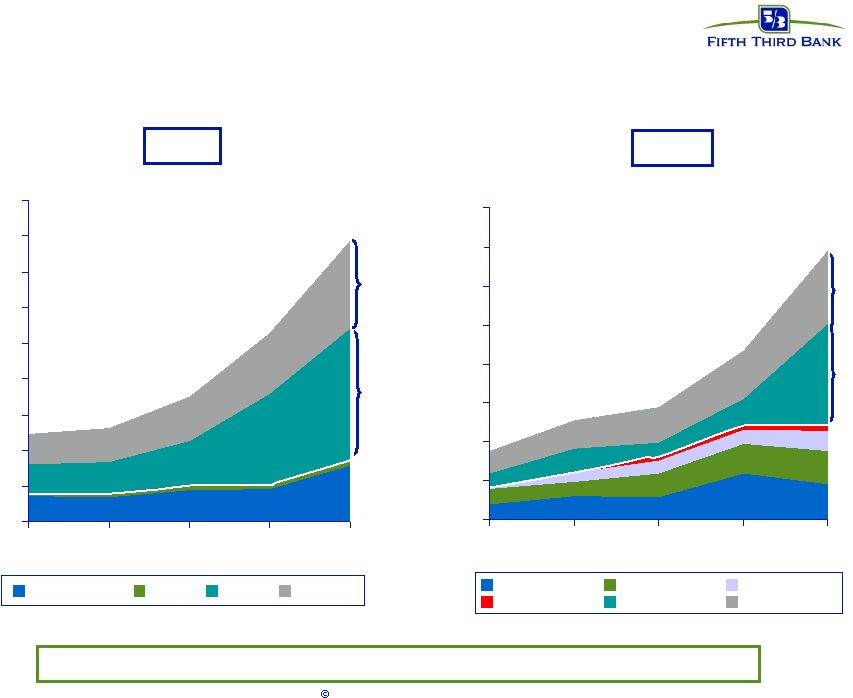 11 Fifth Third Bank | All Rights Reserved 0 40,000 80,000 120,000 160,000 200,000 240,000 280,000 320,000 Q1 2007 Q2 2007 Q3 2007 Q4 2007 Q1 2008 C&I/Lease Auto Credit Card Other CRE Res RE NCOs NPAs 0 200,000 400,000 600,000 800,000 1,000,000 1,200,000 1,400,000 1,600,000 1,800,000 Q1 2007 Q2 2007 Q3 2007 Q4 2007 Q1 2008 C&I/Lease Auto CRE Res RE Res RE CRE NPA, charge-off growth driven by residential, commercial real estate Res RE CRE Real estate driving credit deterioration |
 12 Fifth Third Bank | All Rights Reserved - 200,000 400,000 600,000 800,000 1,000,000 1,200,000 1,400,000 1,600,000 1,800,000 Q1 2007 Q2 2007 Q3 2007 Q4 2007 Q1 2008 Other SE National Other MW NE Ohio Michigan Florida - 40,000 80,000 120,000 160,000 200,000 240,000 280,000 320,000 Q1 2007 Q2 2007 Q3 2007 Q4 2007 Q1 2008 Other SE National Other MW NE Ohio Michigan Florida NCOs NPAs Stressed markets Stressed markets Michigan and Florida: most stressed markets NPA, charge-off growth driven by Florida and Michigan |
 13 Fifth Third Bank | All Rights Reserved Credit containment Eliminated all brokered home equity production Suspended all new developer lending Significantly tightened underwriting limits and exception authorities Major expansion of commercial and consumer workout teams Aggressive write downs in stressed geographies Significant addition to reserve levels Direct executive management oversight of every major credit decision Fifth Third has moved aggressively to stay ahead of emerging credit issues |
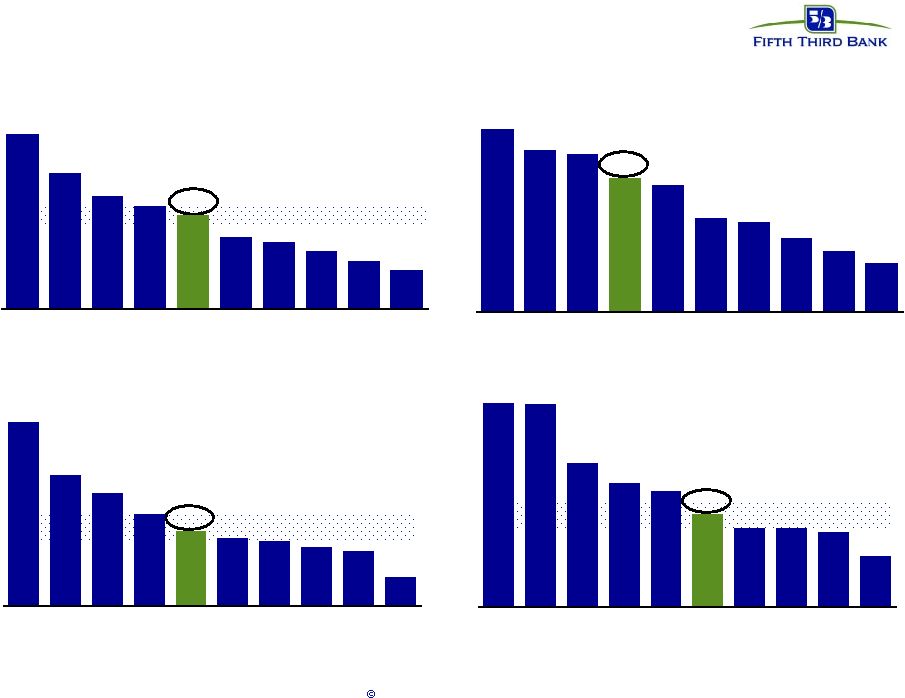 14 Fifth Third Bank | All Rights Reserved Strong capital positioning Tangible Common Equity as % of Tangible Assets Tier 1 Ratio As of 3/31/08; MI as of 12/31/07 Peer group: U.S. banks sharing similar geography or debt ratings. Source: SNL and company reports Target : 6-6.5% Target : 7.5-8% 10.22% 9.00% 8.60% 8.09% 7.72% 7.55% 7.50% 7.35% 7.25% 6.65% MI BBT USB KEY FITB HBAN WB CMA STI NCC 9.01% 7.64% 6.53% 6.22% 5.46% 5.30% 5.00% 4.66% 4.35% 6.85% MI CMA KEY STI FITB BBT USB NCC HBAN WB Total Capital Target : 11-11.5% 14.10% 14.07% 12.60% 12.10% 11.90% 11.34% 11.00% 11.00% 10.86% 10.28% BBT MI USB WB KEY FITB CMA STI HBAN NCC 9.46% 8.96% 8.28% 8.10% 7.30% 7.20% 6.82% 6.49% 6.20% 8.86% MI KEY CMA FITB USB BBT STI HBAN NCC WB Leverage |
 15 Fifth Third Bank | All Rights Reserved Fifth Third differentiators Integrated affiliate delivery model Aggressive sales culture Operational efficiency Streamlined decision making Integrated payments platform (FTPS) Acquisition integration Customer satisfaction |
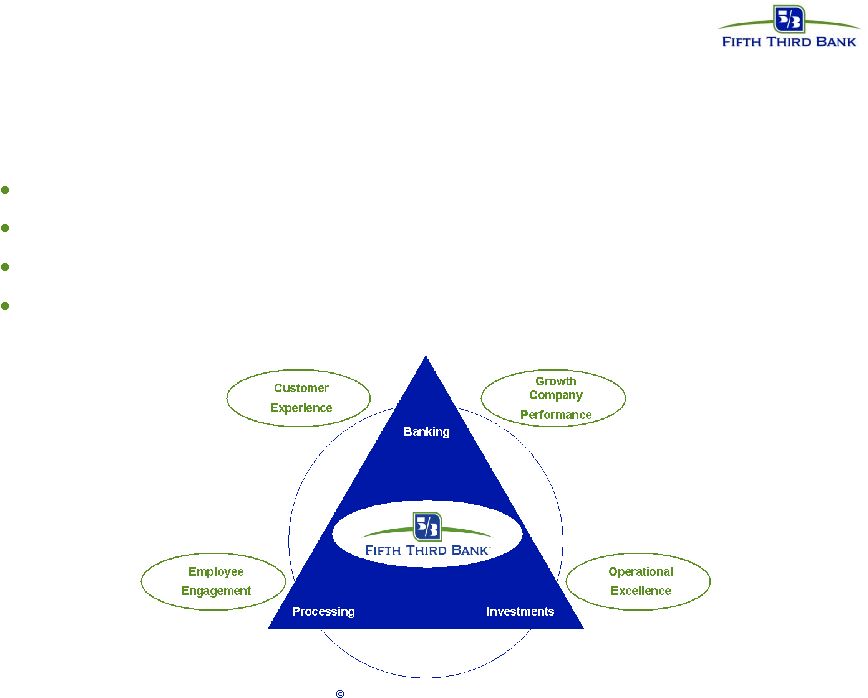 16 Fifth Third Bank | All Rights Reserved Fifth Third: building a better tomorrow Consistently outperform the U.S. banking industry Deliver growth in excess of industry Enhance the customer experience Increase employee engagement Institutionalize enterprise operational excellence |
 17 Fifth Third Bank | All Rights Reserved Appendix |
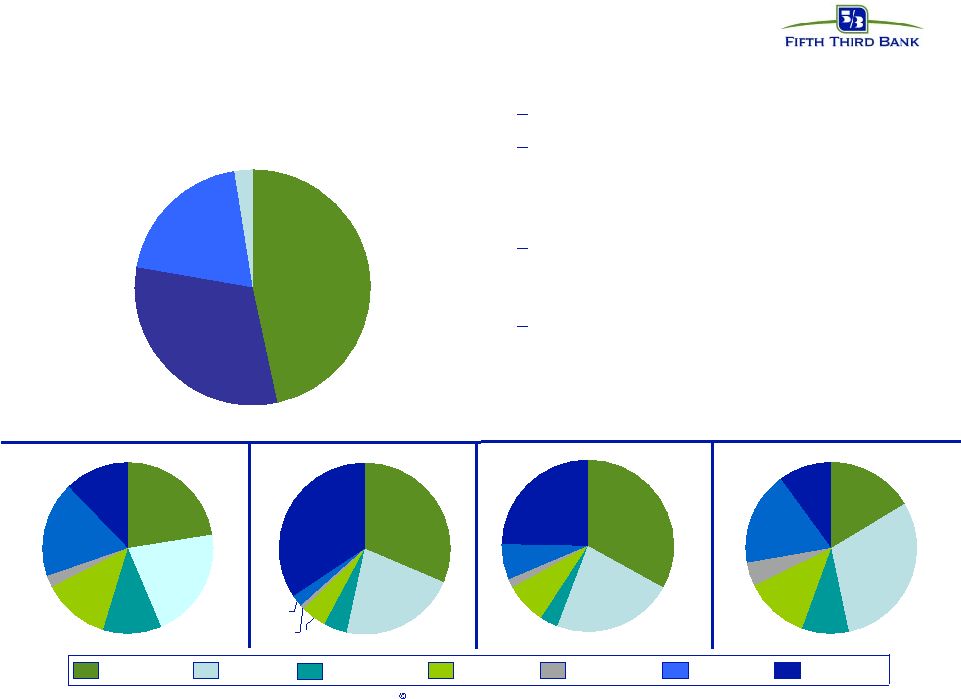
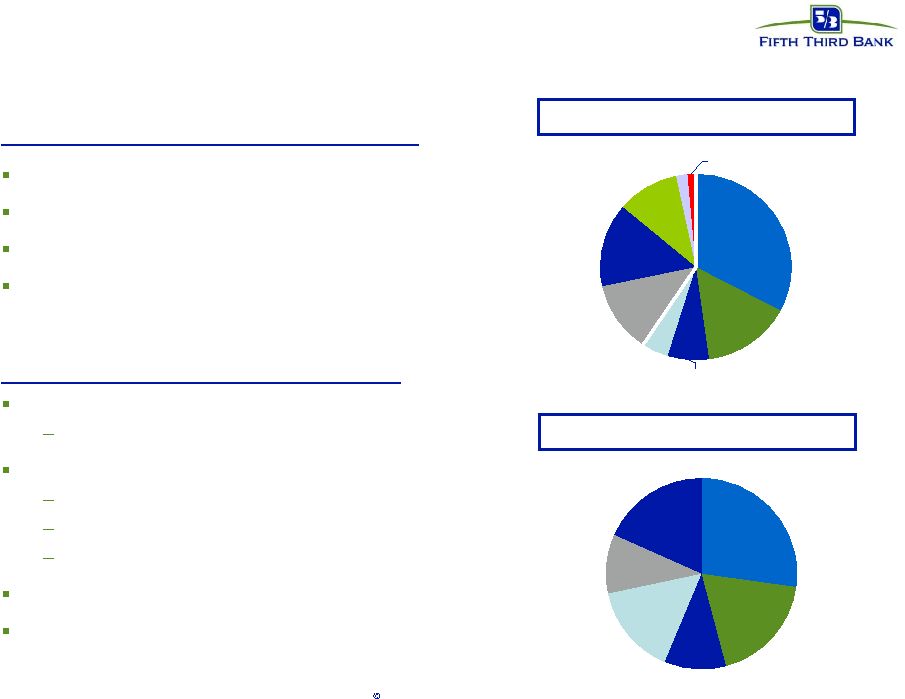 18 Fifth Third Bank | All Rights Reserved Diversified loan portfolio $48 billion commercial loan portfolio 91% secured $1.0 million average outstanding $1.9 million average exposure 1Q08 NCOs: 121 bps $33 billion consumer loan portfolio 95% secured 66% secured by real estate, 26% by auto Real estate portfolio 77% weighted average CLTV Weighted average origination FICO 735 58% first lien secured No subprime originations 1Q08 NCOs: 158 bps Coml Lease 5% Resi Mortgage 12% Home Equity 15% Auto 10% Credit Card 2% C&I 33% Commercial Mortgage 15% Coml Const 7% Other Cons 1% Distributed by type* Geography Distribution* Other 15% Florida 10% National 18% Ohio 27% Michigan 19% Illinois 11% *1Q08 end of period balances |
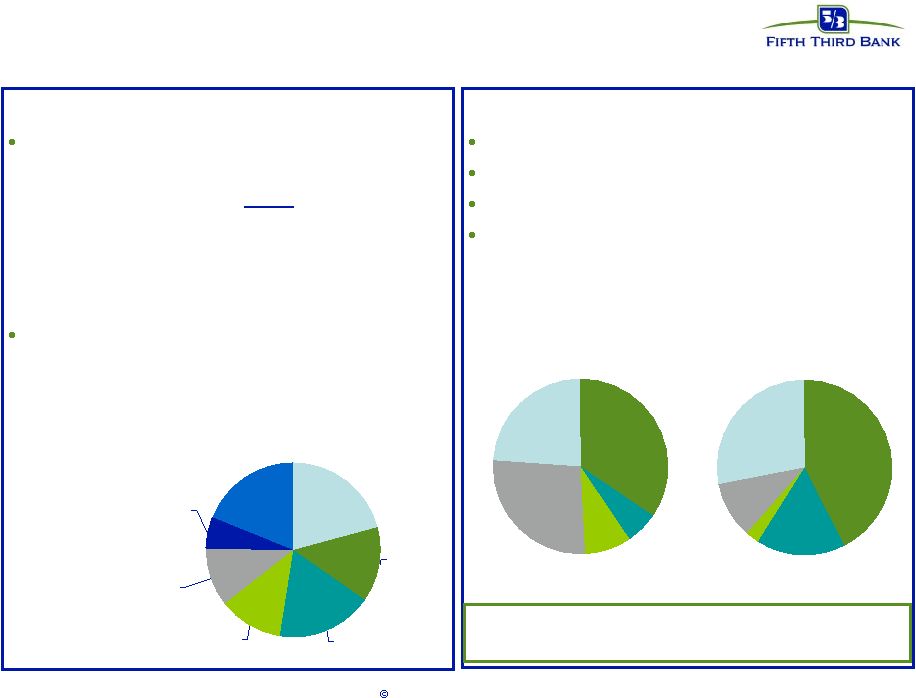
 19 Fifth Third Bank | All Rights Reserved Nonperforming assets Total NPAs of $1.6B, or 196 bps Commercial NPAs of $1.1B; recent growth driven by commercial construction and real estate, particularly in Michigan, Northern Ohio, and Florida Consumer NPAs of $534M; recent growth driven by residential real estate, particularly in Michigan and Florida 98% of commercial and 98% of consumer NPAs are secured 21% 11% 13% 2% 19% 22% 12% 32% 3% 8% 2% 7% 25% 23% 29% 9% 5% 10% 18% 17% 12% 31% 4% 5% 1% 2% 35% 22% C&I (20%) CRE (47%) Residential (31%) Other Consumer (2%) ILLINOIS INDIANA FLORIDA OTHER KENTUCKY OHIO MICHIGAN Residential $494M 31% C&I $315M 20% Other $39M 2% CRE $743M 47% Reported NPAs by loan type |
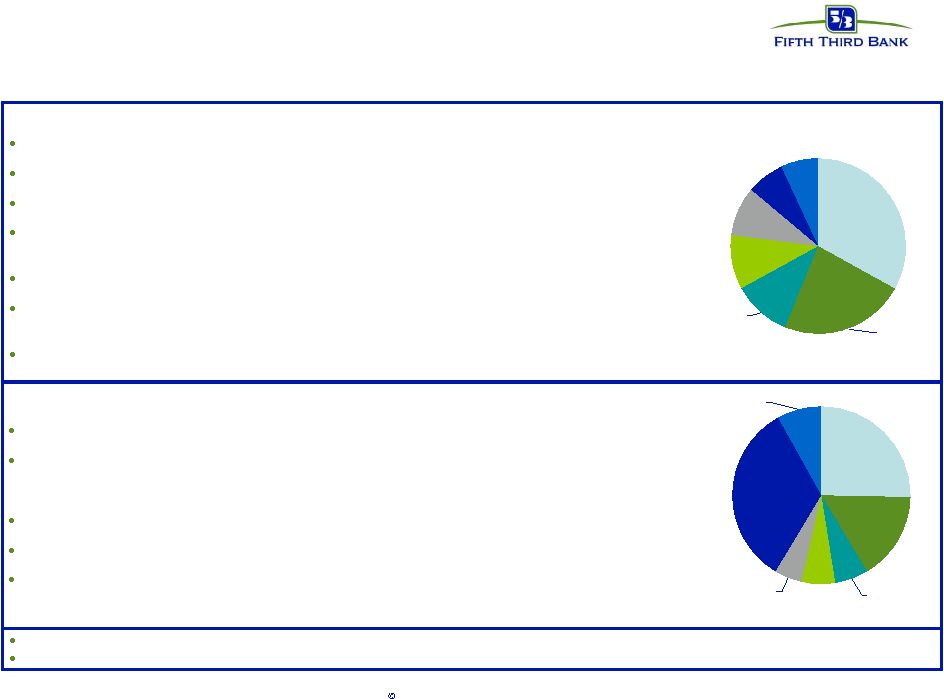
 20 Fifth Third Bank | All Rights Reserved Commercial real estate portfolio Commercial real estate (CRE) Total outstandings $17.8B — Commercial mort $12.2B (45% owner occ’d) — Construction 5.6B (19% owner occ’d) Total CRE 17.8B (37% owner occ’d) Total CRE exp $21.7B — Average size by Relationship $910K — 37% of commercial loans, 22% of total loans Problem assets — NPAs $743MM (4.18%) — > 90 days past due 146MM (0.82%) — 1Q08 charge-offs 105MM (2.40%) CRE collateral type All data as of 3/31/2008 Homebuilders and residential development Total outstandings $2.7B ~6% of commercial loans, ~15% of CRE Crown contributed $313MM to totals Problem assets — NPAs $309MM (11.42%) — > 90 days past due 60MM (2.21%) — 1Q08 charge-offs 42MM (6.32%) Geography Other MW 27% MI 24% Other SE 9% NE OH 6% FLA 34% Office 20% Devel'd land 6% Raw land 11% Indu 12% Apts 14% Retail 18% Other 19% Other MW 11% MI 28% Other SE 2% NE OH 17% FLA 42% Loans NPAs Making no new loans to builder/developer sector |
 21 Fifth Third Bank | All Rights Reserved Residential real estate - topical areas* * All data as of 3/31/08 No subprime originations Alt A originations for delivery only OH 25% FL 34% IL 6% KY 5% MI 16% IN 6% Other 8% Home equity: $11.8B outstanding 1st liens: 23%; 2nd liens: 77% (17% of 2nd liens behind FITB 1st s) Weighted average origination FICO: 742 Origination FICO distribution: <659 5%; 660-689 10%; 690-719 16%; 720-749 20%; 750+ 50% Weighted average CLTV: 78% (1st liens 64%; 2nd liens 82%)Origination CLTV distribution: <70 28%; 70.1- 80 21%; 80.1-90 21%; 90.1-100 29%; >100 1% Vintage distribution: 2008 2%; 2007 16%; 2006 20%; 2005 18%; 2004 13%; prior to 2004 32% % through broker channels: 22% WA FICO: 734 brokered, 745 direct; WA CLTV: 89% brokered; 74% direct NPAs: $162MM (1.37%); over 90s: $76MM (0.64%); 2007 Charge-offs: $97 million (0.82%); 2008 YTD Charge-offs: $41 million YTD (1.39%) Mortgage: $9.9B outstanding 1st liens: 100% ; weighted average LTV: 77%; weighted average origination FICO: 724 Origination FICO distribution: <659 13%; 660-689 11%; 690-719 17%; 720-749 18%; 750+ 40% (note: loans <659 includes CRA loans and FHA/VA loans) Origination LTV distribution: <70 26%; 70.1-80 42%; 80.1-90 12%; >90.1 20% % through broker: 11% NPAs: $333MM (3.33%); over 90s: $192MM (1.92%); 2007 Charge-offs: $43MM YTD (0.48%); 2008 YTD Charge-offs: $34MM (1.33%) IL 10% KY 9% FL 7% OH 33% MI 23% IN 11% Other 7% |
 22 Fifth Third Bank | All Rights Reserved • Michigan represented 23% of direct loans and 53% of direct losses in 1Q08 • TDRs and other early interventions actively pursued in stressed areas ($86MM in 1Q08) • CLTV cap of 90% except for highest quality, relationship borrowers • Loans, LTVs, FICOs, and debt-to-income are risk-tiered 0 2,000 4,000 6,000 8,000 10,000 Balance NCOs 0 5 10 15 20 25 30 HEA Other retail brokered Home equity • Brokered home equity: 22% of loans, 56% of 1Q08 charge-offs • HEA represented 8% of home equity loans and 31% of 1Q08 charge-offs • Reduced brokered originations by 64% during 2007 and have shut down channel completely Other KY IN OH MI FL IL Brokered Direct 0 2,000 4,000 6,000 8,000 10,000 Balance NCOs 0 5 10 15 20 25 30 |
 23 Fifth Third Bank | All Rights Reserved Loans (bn) % of FITB NPAs (mm) % of FITB NCOs (mm) % of FITB C&I 4.83 18% 69 23% 8.5 24% Commercial mortgage 3.76 31% 114 35% 21.0 64% Commercial construction 1.16 21% 119 29% 47.1 65% Commercial lease 0.22 6% 2 15% - - Commercial 9.98 21% 304 29% 76.6 54% Residential mortgage 0.92 9% 109 33% 5.0 14% Home equity 2.55 22% 54 33% 11.8 29% Auto 1.17 14% 4 16% 4.5 13% Credit card 0.30 18% 3 19% 3.8 19% Other consumer loan and leases 0.10 10% 0 4% 0.6 12% Consumer 5.04 15% 170 32% 25.6 19% Total 15.02 19% 474 30% 102.2 37% Michigan market Total Loans Home Equity 17% Credit Card 2% Auto 8% Resi Mortgage 6% Coml Lease 1% C&I 32% Commercial Mortgage 25% Coml Const 8% Other Cons 1% NPAs Home Equity 11% Credit Card 1% Auto 1% Resi Mortgage 23% Coml Lease 0% C&I 15% Commercial Mortgage 24% Coml Const 25% Net charge-offs Auto 4% Other Cons 1% Credit Card 4% Home Equity 12% Resi Mortgage 5% C&I 8% Commercial Mortgage 21% Coml Const 45% Summary: Deterioration in home price values coupled with weak economy (unemployment rate of 7.4%) impacting credit trends due to frequency of defaults and severity Issues: homebuilders, developers tied to weak real estate market Issues: valuations, economy, unemployment Economic weakness impacts commercial real estate market Issues: valuations, economy, unemployment |
 24 Fifth Third Bank | All Rights Reserved Florida market NPAs Auto 1% Home Equity 3% Resi Mortgage 29% C&I 10% Commercial Mortgage 19% Coml Const 38% Net charge-offs Auto 4% Other Cons 1% Credit Card 2% Home Equity 8% Resi Mortgage 32% C&I 11% Commercial Mortgage 11% Coml Const 31% Loans (bn) % of FITB NPAs (mm) % of FITB NCOs (mm) % of FITB C&I 1.95 7% 39 13% 5.8 16% Commercial mortgage 1.94 16% 75 23% 6.0 18% Commercial construction 1.30 23% 147 35% 17.1 24% Commercial lease - - - - - - Commercial 5.19 11% 261 25% 28.9 21% Residential mortgage 1.41 14% 111 33% 17.1 50% Home equity 0.79 7% 10 6% 4.4 11% Auto 0.39 5% 3 13% 2.3 6% Credit card 0.08 4% 0 3% 1.0 5% Other consumer loan and leases 0.10 10% 0 26% 0.5 11% Consumer 2.77 8% 125 24% 25.2 19% Total 7.96 10% 386 24% 54.1 20% Summary: Deterioration in real estate values having effect on credit trends as evidenced by increasing NPA/NCOs in real estate related products Issues: homebuilders, developers tied to weakening real estate market Issues: increasing severity of loss due to significant declines in valuations Issues: valuations; relatively small home equity portfolio Total Loans Home Equity 10% Credit Card 1% Auto 5% Resi Mortgage 18% C&I 25% Commercial Mortgage 24% Coml Const 16% Other Cons 1% |
 25 Fifth Third Bank | All Rights Reserved Cautionary Statement This report may contain forward-looking statements about Fifth Third Bancorp and/or the company as combined acquired entities within the meaning of Sections 27A of the Securities Act of 1933, as amended, and Rule 175 promulgated thereunder, and 21E of the Securities Exchange Act of 1934, as amended, and Rule 3b-6 promulgated thereunder, that involve inherent risks and uncertainties. This report may contain certain forward-looking statements with respect to the financial condition, results of operations, plans, objectives, future performance and business of Fifth Third Bancorp and/or the combined company including statements preceded by, followed by or that include the words or phrases such as “believes,” “expects,” “anticipates,” “plans,” “trend,” “objective,” “continue,” “remain” or similar expressions or future or conditional verbs such as “will,” “would,” “should,” “could,” “might,” “can,” “may” or similar expressions. There are a number of important factors that could cause future results to differ materially from historical performance and these forward-looking statements. Factors that might cause such a difference include, but are not limited to: (1) general economic conditions, either national or in the states in which Fifth Third, one or more acquired entities and/or the combined company do business, are less favorable than expected; (2) political developments, wars or other hostilities may disrupt or increase volatility in securities markets or other economic conditions; (3) changes in the interest rate environment reduce interest margins; (4) prepayment speeds, loan origination and sale volumes, charge-offs and loan loss provisions; (5) our ability to maintain required capital levels and adequate sources of funding and liquidity; (6) changes and trends in capital markets; (7) competitive pressures among depository institutions increase significantly; (8) effects of critical accounting policies and judgments; (9) changes in accounting policies or procedures as may be required by the Financial Accounting Standards Board or other regulatory agencies; (10) legislative or regulatory changes or actions, or significant litigation, adversely affect Fifth Third, one or more acquired entities and/or the combined company or the businesses in which Fifth Third, one or more acquired entities and/or the combined company are engaged; (11) ability to maintain favorable ratings from rating agencies; (12) fluctuation of Fifth Third’s stock price; (13) ability to attract and retain key personnel; (14) ability to receive dividends from its subsidiaries; (15) potentially dilutive effect of future acquisitions on current shareholders' ownership of Fifth Third; (16) effects of accounting or financial results of one or more acquired entity; (17) difficulties in combining the operations of acquired entities; (18) ability to secure confidential information through the use of computer systems and telecommunications network; (19) the impact of reputational risk created by these developments on such matters as business generation and retention, funding and liquidity; and (20) deteriorating credit quality. Additional information concerning factors that could cause actual results to differ materially from those expressed or implied in the forward-looking statements is available in the Bancorp’s Annual Report on Form 10-K for the year ended December 31, 2007, filed with the United States Securities and Exchange Commission (SEC). Copies of this filing are available at no cost on the SEC’s Web site at www.sec.gov or on Fifth Third’s web site at www.53.com. Fifth Third undertakes no obligation to release revisions to these forward-looking statements or reflect events or circumstances after the date of this report. |