 Fifth Third Bank | All Rights Reserved 4Q09 Credit Trends January 21, 2010 Please refer to earnings release dated January 21, 2010 for full results including those reported on a U.S. GAAP basis Exhibit 99.4 |
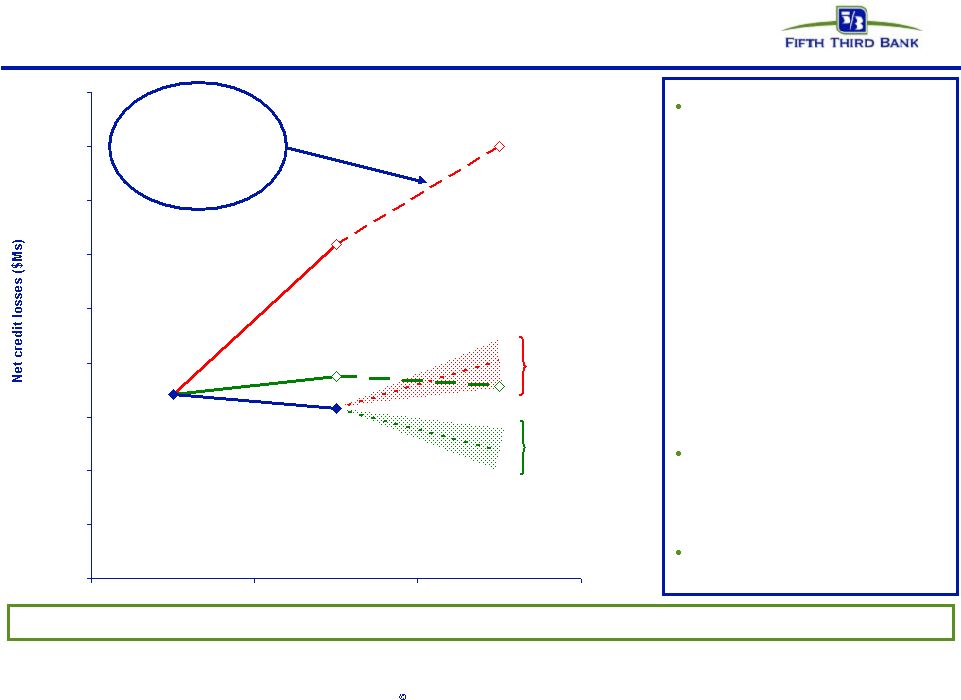 2 Fifth Third Bank | All Rights Reserved Updated credit loss expectations vs. SCAP scenarios $4.1B $5.0B $2.8B Moody’s Longer Recession / Weaker Recovery Case** Assumptions (Dec. 2009) Moody’s Base Case** Assumptions (Dec. 2009) Realized credit losses have been significantly below SCAP submissions, which is expected to continue SCAP Baseline Scenario (Submitted; Mar 2009) SCAP Adverse Scenario (Supervisory; Mar 2009) * Red SCAP line represents more adverse scenario as adjusted by supervisors for additional assumed two-year losses. Supervisory estimates of total two-year losses under more adverse scenario were not allocated by period. Estimate allocates total two-year supervisory losses using the allocation under Fifth Third’s submission. ** Source for assumptions: Moody’s Economy.com. Assumptions as of 2009 year end. Actual $2.6B Actual $2.7B Fifth Third capitalized for this level of losses under SCAP (plus surplus raised vs. buffer) Fifth Third’s realized credit losses have been significantly below its SCAP submitted baseline and more adverse scenarios – In SCAP submissions, we incorporated significant conservatism, given then- prevailing negative economic and industry trends and extreme uncertainty in potential loss outcomes at the time – Economic and credit market conditions have been much better than potential downside expectations in Spring 2009, benefitting results vs. SCAP scenarios Base and stress scenarios reflect Moody’s Base Case and Moody’s Longer Recession and Weaker Recovery Case (as of December 2009)** Our current expectation is for 2010 losses to be lower than 2009 $2.9B $1,000 $1,500 $2,000 $2,500 $3,000 $3,500 $4,000 $4,500 $5,000 $5,500 2008 2009 2010 |
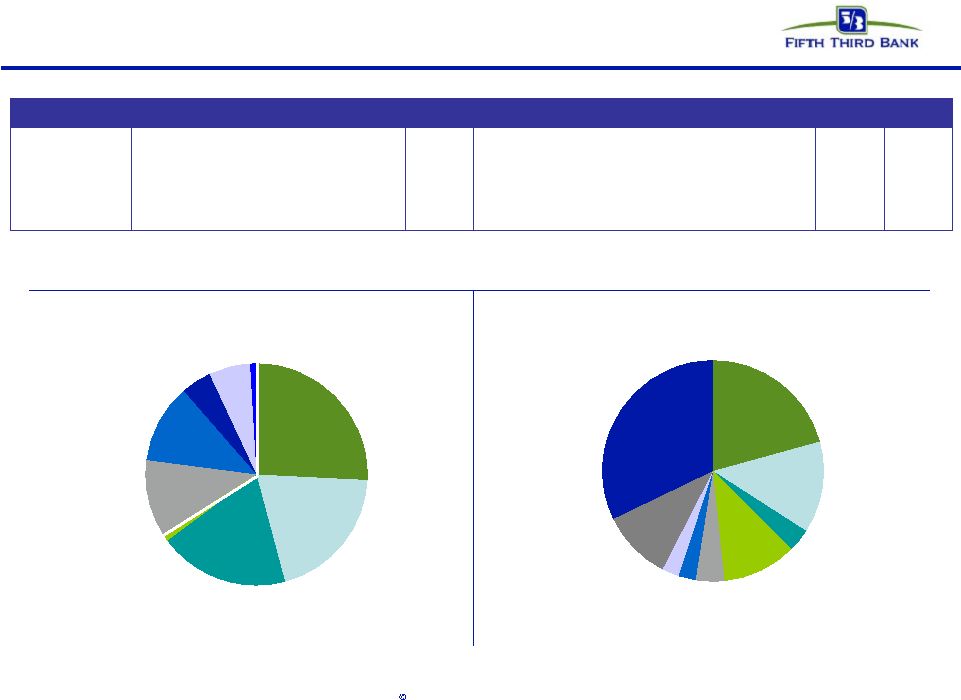 3 Fifth Third Bank | All Rights Reserved Credit by portfolio* C&I 26% Other consumer 1% Residential mortgage 11% Auto 4% Commercial construction 19% Commercial mortgage 20% Coml Lease 1% Home equity 12% Card 6% Net charge-offs by loan type Net charge-offs by geography * NPAs exclude loans held-for-sale. MI 21% OH 13% IN 4% IL 11% KY 4% TN 3% NC 3% Other / National 9% FL 32% ($ in millions) C&I Commercial mortgage Commercial construction Commercial lease Total commercial Residential mortgage Home equity Auto Credit card consumer Total consumer Total loans & leases Loan balances $25,683 $11,803 $3,784 $3,535 $44,805 $8,035 $12,174 $8,995 $1,990 $780 $31,974 $76,779 % of total 33% 15% 5% 5% 58% 10% 16% 12% 3% 1% 42% NPAs $781 $985 $707 $67 $2,540 $523 $71 $23 $87 $0 $704 $3,244 NPA ratio 3.04% 8.34% 18.68% 1.90% 5.67% 6.51% 0.58% 0.26% 4.38% 0.08% 2.20% 4.21% Net charge-offs $183 $142 $135 $8 $468 $78 $82 $32 $44 $4 $240 $708 Net charge-off ratio 2.81% 4.69% 13.28% 0.88% 4.08% 3.82% 2.65% 1.38% 8.81% 2.49% 2.97% 3.62% Other |
 4 Fifth Third Bank | All Rights Reserved Portfolio performance drivers Performance Largely Driven By No Participation In Discontinued or Suspended Lending * Residential construction-related consumer mortgages intended to be held in portfolio until permanent financing complete. Jumbo mortgage originations currently being held due to market conditions. Geography • Florida and Michigan most stressed • Remaining Midwest and Southeast performance reflect economic trends Products • Homebuilder/developer charge-offs $110 million in 4Q09 – Total charge-off ratio 3.6% (3.1% ex-HBs) – Commercial charge-off ratio 4.1% (3.2% ex- HBs) • Brokered home equity charge-offs 7.0% in 4Q09 – Direct home equity portfolio 1.9% 4Q09 NCO Ratios Coml Cons Total FL/MI 8.4% 5.3% 7.1% Other 2.5% 2.1% 2.3% • Subprime • Option ARMs Discontinued in 2007 • Brokered home equity ($1.9B) Suspended in 2008 • Homebuilder/residential development ($1.6B) • Other non-owner occupied commercial RE excluding homebuilder/developer ($8.0B) Saleability • All mortgages originated for intended sale* Total 4.1% 3.0% 3.6% |
 5 Fifth Third Bank | All Rights Reserved Non-performing assets and net charge-offs: Product view* * NPAs exclude loans held-for-sale. Net charge-offs exclude losses on loans sold or transferred to held-for-sale in 4Q08. During 1Q09 the Bancorp modified its nonaccrual policy to exclude TDR loans less than 90 days past due because they were performing in accordance with restructured terms. For comparability purposes, prior periods were adjusted to reflect this reclassification. Total NPAs Total NCOs 0 200 400 600 800 1,000 4Q08 1Q09 2Q09 3Q09 4Q09 C&I/Lease Auto/Other CRE Res RE 0 500 1,000 1,500 2,000 2,500 3,000 3,500 4Q08 1Q09 2Q09 3Q09 4Q09 C&I/Lease Auto/Other CRE Res RE |
 6 Fifth Third Bank | All Rights Reserved - 500 1,000 1,500 2,000 2,500 3,000 3,500 4Q08 1Q09 2Q09 3Q09 4Q09 Other SE National Other MW Michigan Florida - 200 400 600 800 1,000 4Q08 1Q09 2Q09 3Q09 4Q09 Other SE National Other MW Michigan Florida Total NPAs Total NCOs * NPAs exclude loans held-for-sale. Net charge-offs exclude losses on loans sold or transferred to held-for-sale in 4Q08. During 1Q09 the Bancorp modified its nonaccrual policy to exclude TDR loans less than 90 days past due because they were performing in accordance with restructured terms. For comparability purposes, prior periods were adjusted to reflect this reclassification. Non-performing assets and net charge-offs: Geographic view* |
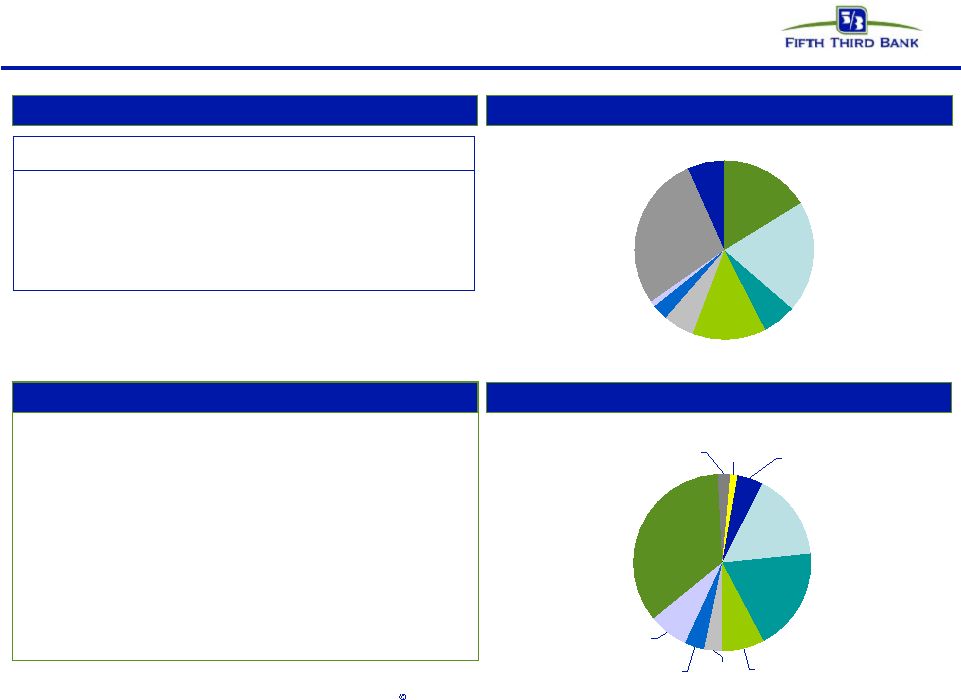
 7 Fifth Third Bank | All Rights Reserved Nonperforming assets* • Total NPAs of $3.2B • Homebuilder/developer NPAs of $548M; represent 17% of total NPAs • Commercial NPAs of $2.5B; down 1% from the previous quarter • Consumer NPAs of $704M; up 7% from the previous quarter 17% 6% 17% 11% 4% 0% 14% 18% 13% 13% 18% 46% 1% 1% 7% 3% 4% 7% 21% 8% 6% 2% 8% 7% 39% 16% 5% 10% 3% 11% 6% 29% 3% 17% C&I^ (26%) CRE (53%) Residential (18%) Other Consumer (3%) Residential $594M 18% C&I* $848M 26% Other $111M 3% CRE $1.7B 53% ^ C&I includes commercial lease ILLINOIS INDIANA FLORIDA TENNESSEE KENTUCKY OHIO MICHIGAN NORTH CAROLINA OTHER / NATIONAL * NPAs exclude loans held-for-sale. |
 8 Fifth Third Bank | All Rights Reserved Commercial & industrial* Loans by geography Credit trends Loans by industry Comments • 39% of 4Q09 losses on loans to companies in real estate related industries – Loans to real estate related industries of $3.3B; 4Q09 NCO ratio of 8.5% – 4Q09 C&I loss rate of 2.8%, excluding loans to real estate related industries, 2.0% • FL represented 30% of 4Q09 losses, 7% of loans OH 20% IN 6% Other 29% NC 1% TN 3% IL 13% KY 5% FL 7% MI 16% * NPAs exclude loans held-for-sale. Net charge-offs exclude losses on loans sold or transferred to held-for-sale in 4Q08. Auto Retailers 3% Wholesale Trade 7% Other 35% Real Estate 8% Manufacturing 19% Finance & Insurance 16% Auto Manufacturing 1% Construction 5% Retail Trade 4% Accomodation 2% ($ in millions) 4Q08 1Q09 2Q09 3Q09 4Q09 Balance $29,197 $28,617 $28,409 $26,175 $25,683 90+ days delinquent $76 $131 $142 $256 $118 as % of loans 0.26% 0.46% 0.50% 0.98% 0.46% NPAs $548 $675 $634 $790 $781 as % of loans 1.88% 2.36% 2.23% 3.02% 3.04% Net charge-offs $151 $103 $177 $256 $183 as % of loans 5.03% 1.45% 2.53% 3.70% 2.81% C&I |
 9 Fifth Third Bank | All Rights Reserved Commercial mortgage* Accomodation 4% Retail Trade 4% Construction 10% Auto Manufacturing 0% Finance & Insurance 1% Manufacturing 5% Real Estate 50% Other 21% Wholesale Trade 2% Auto Retailers 3% Loans by geography Credit trends Loans by industry Comments • Owner occupied 4Q09 NCO ratio of 2.2%, other non-owner occupied 4Q09 NCO ratio of 6.9% • In 4Q08 reduced concentrations in most stressed markets (FL and MI) • Loans from FL/MI represented 39% of total loans, 56% of total losses in 4Q09 OH 27% IN 6% NC 7% IL 10% KY 4% TN 2% Other 5% FL 13% MI 26% * NPAs exclude loans held-for-sale. Net charge-offs exclude losses on loans sold or transferred to held-for-sale in 4Q08. ($ in millions) 4Q08 1Q09 2Q09 3Q09 4Q09 Balance $12,502 $12,560 $12,407 $12,105 $11,803 90+ days delinquent $136 $124 $131 $184 $59 as % of loans 1.09% 0.99% 1.06% 1.52% 0.50% NPAs $502 $718 $791 $968 $985 as % of loans 4.02% 5.72% 6.37% 8.00% 8.34% Net charge-offs $151 $77 $85 $118 $142 as % of loans 2.84% 2.50% 2.73% 3.82% 4.69% Commercial mortgage |
 10 Fifth Third Bank | All Rights Reserved Commercial construction* Accomodation 1% Auto Retailers 1% Finance & insurance 3% Construction 33% Manufacturing 1% Real estate 48% Retail Trade 1% Other 11% Wholesale Trade 1% Loans by geography Credit trends Loans by industry Comments OH 29% IN 6% IL 10% KY 3% TN 4% NC 8% Other 8% FL 18% MI 14% * NPAs exclude loans held-for-sale. Net charge-offs exclude losses on loans sold or transferred to held-for-sale in 4Q08. ($ in millions) 4Q08 1Q09 2Q09 3Q09 4Q09 Balance $5,114 $4,745 $4,491 $4,147 $3,784 90+ days delinquent $73 $49 $60 $168 $16 as % of loans 1.44% 1.02% 1.34% 4.04% 0.44% NPAs $400 $597 $735 $751 $707 as % of loans 7.82% 12.59% 16.36% 18.11% 18.68% Net charge-offs $151 $76 $79 $126 $135 as % of loans 10.00% 6.21% 6.76% 11.56% 13.28% Commercial construction • Owner occupied 4Q09 NCO ratio of 6.8%, other non-owner occupied 4Q09 NCO ratio of 14.8% • In 4Q08 reduced concentrations in most stressed markets (FL and MI) • Loans from FL/MI represented 32% of total loans, 61% of total losses in 4Q09 |
 11 Fifth Third Bank | All Rights Reserved Homebuilders/developers* Loans by geography Credit trends Loans by industry Comments • Making no new loans to builder/developer sector • Residential & land valuations under continued stress • 3% of commercial loans; 2% of total loans • Balance by product approximately 42% Construction, 45% Mortgage, 13% C&I MI 18% OH 24% IN 7% IL 5% KY 4% TN 5% NC 15% Other 2% FL 20% C&I 13% Commercial construction 42% Commercial mortgage 45% * NPAs exclude loans held-for-sale. Net charge-offs exclude losses on loans sold or transferred to held-for-sale in 4Q08. ($ in millions) 4Q08 1Q09 2Q09 3Q09 4Q09 Balance $2,481 $2,322 $2,102 $1,846 $1,563 90+ days delinquent $74 $37 $53 $79 $19 as % of loans 2.98% 1.59% 2.51% 4.29% 1.19% NPAs $366 $554 $613 $600 $548 as % of loans 14.74% 23.87% 29.14% 32.51% 35.09% Net charge-offs $128 $64 $76 $108 $110 as % of loans 19.71% 10.73% 14.06% 21.92% 26.25% Homebuilders/developers |
 12 Fifth Third Bank | All Rights Reserved st Residential mortgage 1 liens: 100% ; weighted average LTV: 78% Weighted average origination FICO: 728 Origination FICO distribution: <660 10%; 660-689 8%; 690-719 12%; 720-749 13%; 750+ 30%; Other ^ 27% (note: loans <660 includes CRA loans and FHA/VA loans) Origination LTV distribution: <=70 26%; 70.1-80 41%; 80.1-90 11%; 90.1-95 5%; >95% 17% Vintage distribution: 2009 6%; 2008 13%; 2007 16%; 2006 16%; 2005 25%; 2004 and prior 24% % through broker: 13%; performance similar to direct Loans by geography Credit trends Portfolio details Comments 28% FL concentration driving 59% of total losses FL lots ($281M) running at 30% annualized loss rate (YTD) Mortgage company originations targeting 95% salability MI 14% OH 22% IN 5% IL 8% KY 4% TN 2% NC 6% Other 11% FL 28% ^ Includes acquired loans where FICO at origination is not available During 1Q09 the Bancorp modified its nonaccrual policy to exclude TDR loans less than 90 days past due because they were performing in accordance with restructured terms. For comparability purposes, prior periods were adjusted to reflect this reclassification. ($ in millions) 4Q08 1Q09 2Q09 3Q09 4Q09 Balance $9,385 $8,875 $8,489 $8,229 $8,035 90+ days delinquent $198 $231 $242 $198 $189 as % of loans 2.11% 2.60% 2.85% 2.41% 2.35% NPAs $397 $475 $475 $484 $523 as % of loans 4.23% 5.35% 5.59% 5.89% 6.51% Net charge-offs $68 $75 $112 $92 $78 as % of loans 2.90% 3.27% 5.17% 4.38% 3.82% Residential mortgage |
 13 Fifth Third Bank | All Rights Reserved nd Home equity 1 liens: 26%; 2 liens: 74% Weighted average origination FICO: 757 Origination FICO distribution: <660 4%; 660-689 8%; 690-719 13%; 720-749 17%; 750+ 48%; Other 10% Weighted average CLTV: 76% (1 liens 61%; 2 liens 81%) Origination CLTV distribution: <=70 38%; 70.1-80 21%; 80.1-90 18%; 90.1-95 8%; >95 15% Vintage distribution: 2009 5%; 2008 12%; 2007 12%; 2006 16%; 2005 15%; 2004 and prior 40% % through broker channels: 16% WA FICO: 739 brokered, 760 direct; WA CLTV: 90% brokered; 73% direct Portfolio details Comments Brokered loans by geography Direct loans by geography Credit trends Approximately 16% of portfolio concentration in broker product driving approximately 42% total loss Portfolio experiencing increased loss severity (losses on 2 liens approximately 100%) Aggressive home equity line management strategies in place Note: Brokered and direct home equity net charge-off ratios are calculated based on end of period loan balances ^ Includes acquired loans where FICO at origination is not available MI 21% OH 33% IN 9% IL 12% KY 8% Other 1% FL 9% NC 5% TN 2% MI 21% OH 25% IN 10% IL 11% KY 7% Other 20% FL 3% NC 1% TN 2% st nd st nd ($ in millions) 4Q08 1Q09 2Q09 3Q09 4Q09 Balance $2,313 $2,225 $2,125 $2,028 $1,948 90+ days delinquent $37 $42 $34 $38 $33 as % of loans 1.58% 1.91% 1.58% 1.87% 1.72% Net charge-offs $26 $30 $39 $30 $34 as % of loans 4.52% 5.46% 7.41% 5.96% 7.02% Home equity - brokered ($ in millions) 4Q08 1Q09 2Q09 3Q09 4Q09 Balance $10,439 $10,486 $10,386 $10,349 $10,226 90+ days delinquent $58 $61 $63 $66 $65 as % of loans 0.55% 0.59% 0.61% 0.64% 0.64% Net charge-offs $27 $42 $49 $49 $48 as % of loans 1.04% 1.62% 1.91% 1.89% 1.85% Home equity - direct |
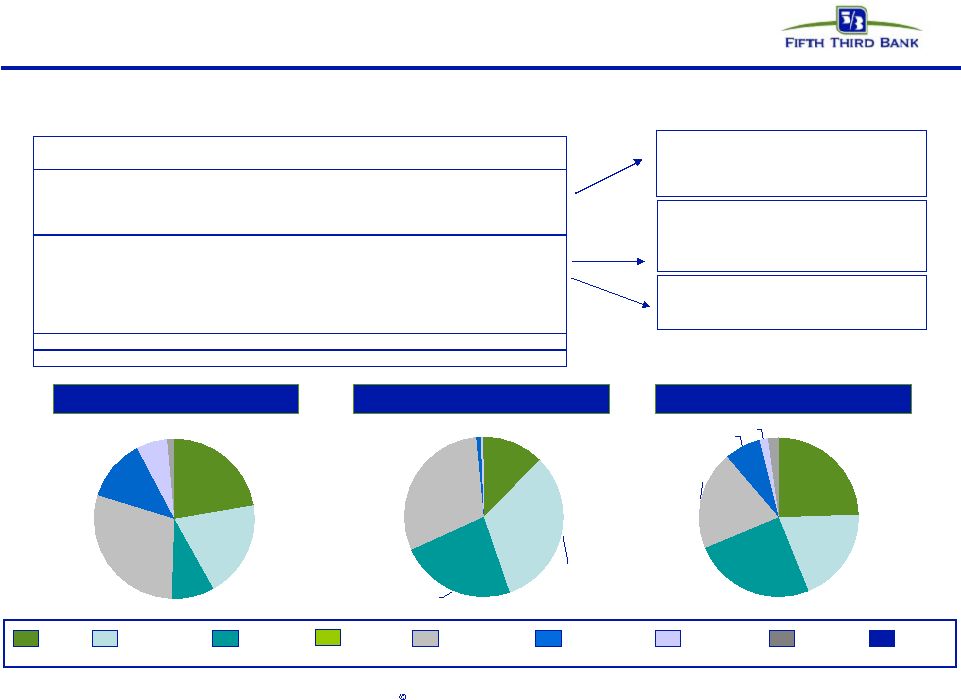 14 Fifth Third Bank | All Rights Reserved Florida market* Deterioration in real estate values having effect on credit trends as evidenced by increasing NPA/NCOs in real estate related products Homebuilders, developers tied to weakening real estate market Increasing severity of loss due to significant declines in valuations Valuations; relatively small home equity portfolio 22% 20% 9% 29% 13% 6% 1% COML MORTGAGE C&I RESI MORTGAGE OTHER CONS COML CONST COML LEASE HOME EQUITY AUTO CREDIT CARD Total Loans NPAs NCOs 31% 32% 23% 12% 1% 1% 24% 20% 25% 20% 2% 7% 2% * NPAs exclude loans held-for-sale. ($ in millions) Loans (bn) % of FITB NPAs (mm) % of FITB NCOs (mm) % of FITB Commercial loans 1.7 7% 110 14% 56 30% Commercial mortgage 1.5 13% 282 29% 44 31% Commercial construction 0.7 18% 206 29% 56 42% Commercial lease 0.0 1% 2 4% - 0% Commercial 3.9 9% 600 24% 156 33% Mortgage 2.3 28% 270 52% 46 59% Home equity 1.0 8% 6 9% 17 20% Auto 0.5 5% 2 10% 4 13% Credit card 0.1 6% 5 6% 5 11% Other consumer 0.0 2% 0 23% 1 12% Consumer 3.9 12% 283 40% 73 30% Total 7.8 10% 883 27% 229 32% |
 15 Fifth Third Bank | All Rights Reserved Michigan market* Deterioration in home price values coupled with weak economy impacting credit trends due to frequency of defaults and severity Homebuilders, developers tied to weak real estate market Negative impact from housing valuations, economy, unemployment Economic weakness impacts commercial real estate market 31% 4% 7% 20% 2% 23% 9% 1% 3% COML MORTGAGE C&I RESI MORTGAGE OTHER CONS COML CONST COML LEASE HOME EQUITY AUTO CREDIT CARD Total Loans NPAs NCOs 8% 15% 2% 27% 24% 6% 18% 27% 37% 15% 2% 4% 1% 10% 4% * NPAs exclude loans held-for-sale. ($ in millions) Loans (bn) % of FITB NPAs (mm) % of FITB NCOs (mm) % of FITB Commercial loans 4.1 16% 145 19% 40 22% Commercial mortgage 3.0 26% 194 20% 35 25% Commercial construction 0.5 14% 81 11% 27 20% Commercial lease 0.2 6% 10 14% 0 0% Commercial 7.8 17% 430 17% 102 22% Mortgage 1.1 14% 55 10% 11 15% Home equity 2.6 21% 22 30% 22 27% Auto 0.9 10% 4 18% 4 11% Credit card 0.3 16% 20 22% 8 19% Other consumer 0.1 10% 0 4% 1 12% Consumer 5.0 16% 101 14% 46 19% Total 12.8 17% 531 16% 148 21% |
 16 Fifth Third Bank | All Rights Reserved Cautionary statement This report may contain statements that we believe are “forward-looking statements” within the meaning of Section 27A of the Securities Act of 1933, as amended, and Rule 175 promulgated thereunder, and Section 21E of the Securities Exchange Act of 1934, as amended, and Rule 3b-6 promulgated thereunder. These statements relate to our financial condition, results of operations, plans, objectives, future performance or business. They usually can be identified by the use of forward-looking language such as “will likely result,” “may,” “are expected to,” “is anticipated,” “estimate,” “forecast,” “projected,” “intends to,” or may include other similar words or phrases such as “believes,” “plans,” “trend,” “objective,” “continue,” “remain,” or similar expressions, or future or conditional verbs such as “will,” “would,” “should,” “could,” “might,” “can,” or similar verbs. You should not place undue reliance on these statements, as they are subject to risks and uncertainties, including but not limited to the risk factors set forth in our most recent Annual Report on Form 10-K and our most recent quarterly report on Form 10-Q. When considering these forward-looking statements, you should keep in mind these risks and uncertainties, as well as any cautionary statements we may make. Moreover, you should treat these statements as speaking only as of the date they are made and based only on information then actually known to us. There are a number of important factors that could cause future results to differ materially from historical performance and these forward- looking statements. Factors that might cause such a difference include, but are not limited to: (1) general economic conditions and weakening in the economy, specifically the real estate market, either nationally or in the states in which Fifth Third, one or more acquired entities and/or the combined company do business, are less favorable than expected; (2) deteriorating credit quality; (3) political developments, wars or other hostilities may disrupt or increase volatility in securities markets or other economic conditions; (4) changes in the interest rate environment reduce interest margins; (5) prepayment speeds, loan origination and sale volumes, charge-offs and loan loss provisions; (6) Fifth Third’s ability to maintain required capital levels and adequate sources of funding and liquidity; (7) maintaining capital requirements may limit Fifth Third’s operations and potential growth; (8) changes and trends in capital markets; (9) problems encountered by larger or similar financial institutions may adversely affect the banking industry and/or Fifth Third (10) competitive pressures among depository institutions increase significantly; (11) effects of critical accounting policies and judgments; (12) changes in accounting policies or procedures as may be required by the Financial Accounting Standards Board (FASB) or other regulatory agencies; (13) legislative or regulatory changes or actions, or significant litigation, adversely affect Fifth Third, one or more acquired entities and/or the combined company or the businesses in which Fifth Third, one or more acquired entities and/or the combined company are engaged; (14) ability to maintain favorable ratings from rating agencies; (15) fluctuation of Fifth Third’s stock price; (16) ability to attract and retain key personnel; (17) ability to receive dividends from its subsidiaries; (18) potentially dilutive effect of future acquisitions on current shareholders’ ownership of Fifth Third; (19) effects of accounting or financial results of one or more acquired entities; (20) difficulties in separating Fifth Third Processing Solutions from Fifth Third; (21) loss of income from any sale or potential sale of businesses that could have an adverse effect on Fifth Third’s earnings and future growth; (22) ability to secure confidential information through the use of computer systems and telecommunications networks; and (23) the impact of reputational risk created by these developments on such matters as business generation and retention, funding and liquidity. You should refer to our periodic and current reports filed with the Securities and Exchange Commission, or “SEC,” for further information on other factors, which could cause actual results to be significantly different from those expressed or implied by these forward-looking statements. |