 Fifth Third Bank | All Rights Reserved Annual Meeting of Fifth Third Shareholders Kevin T. Kabat Chairman, President & Chief Executive Officer April 20, 2010 Please refer to earnings release dated January 21, 2010 and 10-K dated February 26, 2010 for further information, including full results reported on a U.S. GAAP basis Exhibit 99.1 |
 2 Fifth Third Bank | All Rights Reserved Agenda Overview Economic backdrop 2009 performance summary and highlights Capital and loan loss reserve analysis Strategy for 2010 and beyond |
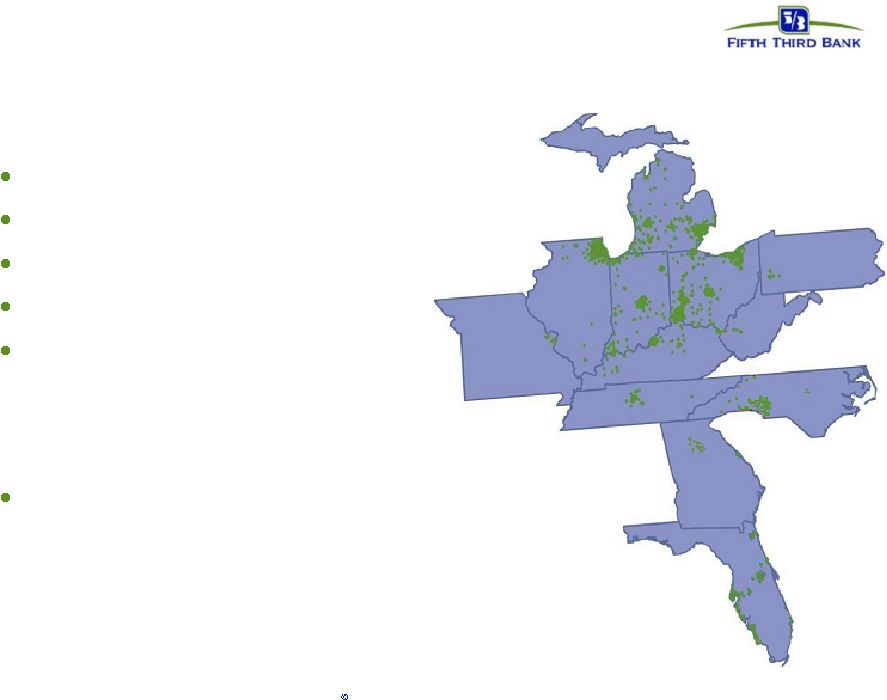 3 Fifth Third Bank | All Rights Reserved Fifth Third today * Fortune magazine, March 16, 2009 $113 billion assets 16 affiliates in 12 states 1,309 banking centers 2,358 ATMs Fifth Third Bank has been dedicated to serving the needs of its retail and commercial customers for more than 150 years Top 10 Superregional Bank for 8 consecutive years* Naples Raleigh Cincinnati Florence Louisville Lexington Nashville Atlanta Augusta Orlando Tampa Naples Raleigh Charlotte Huntington Pittsburgh Cleveland Columbus Toledo Detroit Grand Rapids Traverse City Chicago Evansville Jacksonville Indianapolis St. Louis |
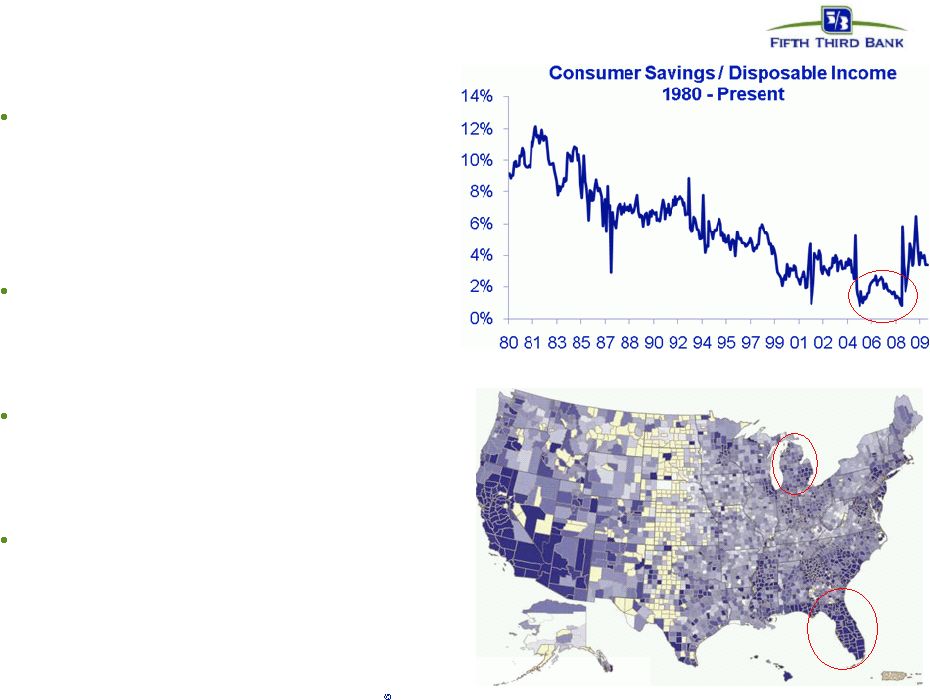 4 Fifth Third Bank | All Rights Reserved Operating environment update Roots of the crisis — Global savings imbalances — The housing bubble — Higher than normal leverage in financial system — Oversight failures Government actions — TARP and CPP — The “stress test” — Ongoing intervention in housing market Economy is improving — GDP growth — Housing market stabilization — Employment stabilizing Outlook — Higher consumer savings rates — Loan demand remains measured — Limited role for non-bank lenders 90+ Delinquency Mortgage Heat Map – Q409 Sources: Bureau of Economic Analysis, Federal Reserve Bank of New York |
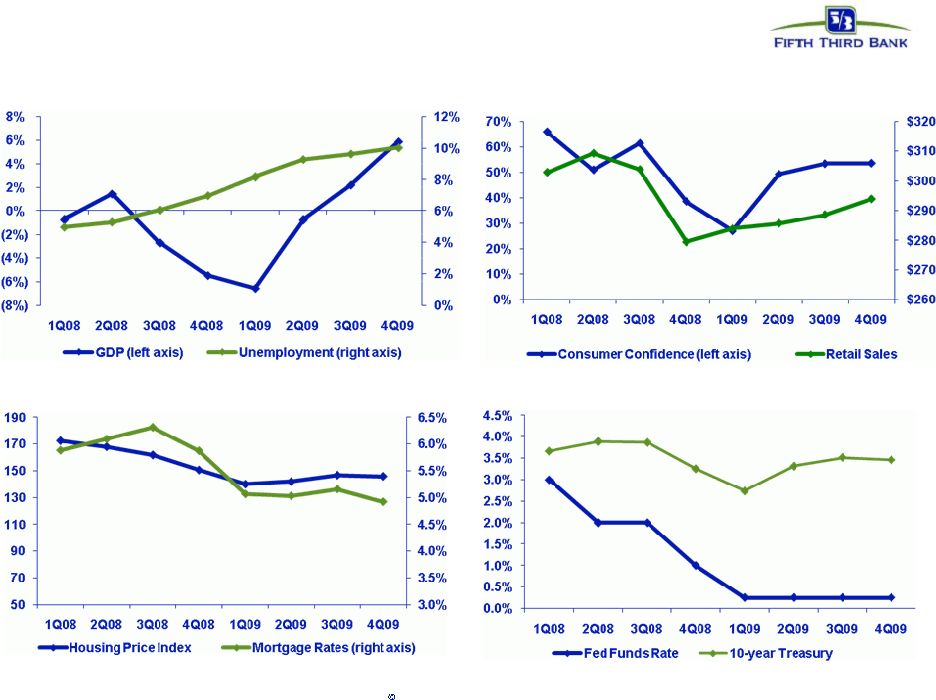 5 Fifth Third Bank | All Rights Reserved GDP and Unemployment Consumer Confidence and Retail Sales Interest Rate Market Macro economic indicators Housing Market Source: Bloomberg. |
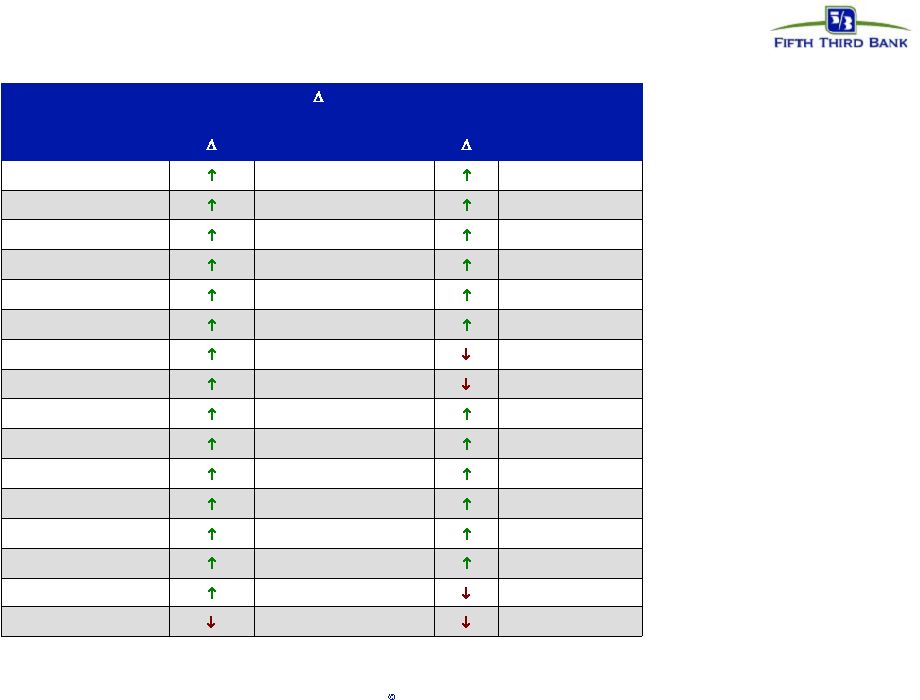
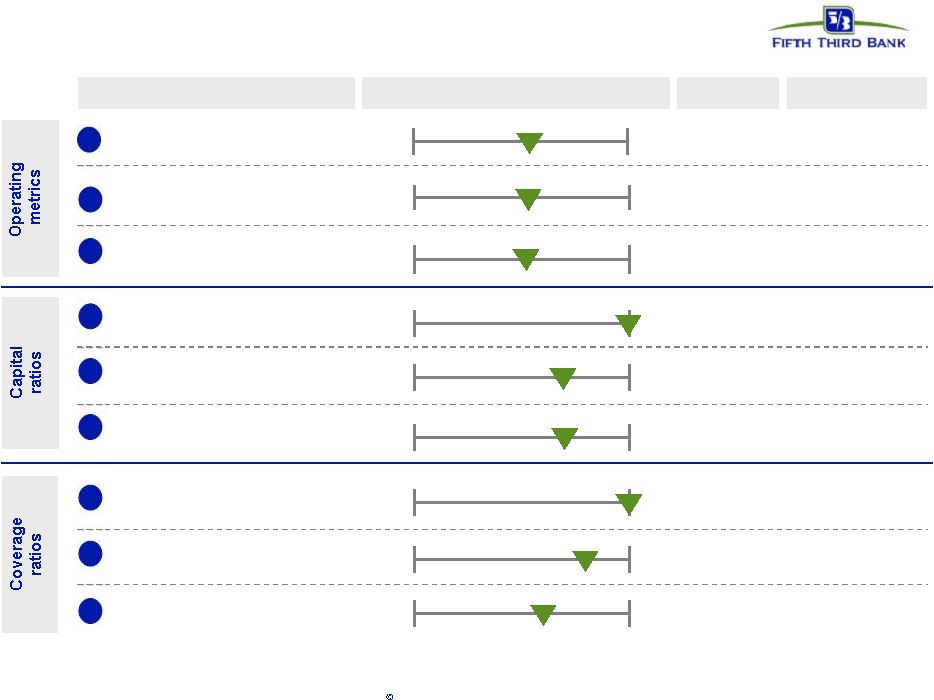 6 Fifth Third Bank | All Rights Reserved 2009 results vs. peers Range Metric Rank / 13 Peer average Core Deposit growth^ 8 9.7% (1.8%) 18.1% 9.8% Tier 1 ratio* 1 11.1% 8.4% 13.3% 13.3% Tier 1 common ratio* 7 7.0% 5.5% 8.5% 7.0% 5 6.2% 4.3% 8.1% 6.5% Tangible common equity ratio 1 3.10% Net Interest Margin* 7 3.47% 2.72% 4.31% 3.55% 2 Core PPNR / Average Loans* (annualized) 5 2.7% 1.4% 4.8% 2.9% 1 3 4 5 6 7 1.69% 4.88% 4.88% Reserves / loans 2 78% 8 51% 130% 116% Reserves / NPAs 4 113% 9 65% 163% 132% Reserves / annualized NCOs Peers include: BBT, CMA, HBAN, KEY, MI, MTB, PNC, RF, STI, USB, WFC, ZION. Source: SNL and company reports ^ Excludes core deposit increases resulting from acquisitions in 2009 *4Q09 data. Growth year-over-year. NPAs exclude HFS portion and covered loans for all banks. |
 7 Fifth Third Bank | All Rights Reserved Deposit share momentum Source: FDIC, SNL Financial; branches included are full service retail / brick and mortar; data excludes headquarters branches with over $250 million in deposits. • Continued focus on customer satisfaction and building full relationships has given strong momentum to the retail network • Fifth Third grew deposits in 15 of 16 affiliate markets in 2009 – Modest attrition in North Carolina acquisition market • Fifth Third grew deposit market share in 75% of affiliate markets in 2009 Affiliate 5/3 Deposit (08-09) 5/3 Market Share Name Deposit ($) (%) Share 2009 2008 Chicago 788,601 9.8% 4.0% 3.8% Northeastern Ohio 606,708 17.0% 4.2% 3.8% South Florida 579,342 21.1% 3.1% 2.8% Eastern Michigan 418,525 11.9% 5.4% 5.0% Central Florida 338,091 28.9% 3.0% 2.5% Tampa 334,080 24.5% 3.5% 3.1% Central Ohio 213,971 5.6% 11.1% 11.2% Cincinnati 212,656 2.2% 21.5% 21.9% Southern Indiana 195,169 8.6% 4.1% 4.0% Louisville 194,593 13.0% 8.9% 8.2% Northwestern Ohio 177,122 7.5% 16.2% 15.4% Western Michigan 149,252 2.1% 18.4% 18.4% Tennessee 142,615 12.8% 3.5% 3.3% Central Indiana 139,354 4.7% 8.4% 8.3% Central Kentucky 2,608 0.3% 8.1% 8.7% North Carolina (113,631) (4.4%) 4.8% 5.3% |
 8 Fifth Third Bank | All Rights Reserved Third Party customer experience recognition University of Michigan American Customer Satisfaction Index (ACSI)* Fifth Third Bank was tied for first (Wachovia) in the latest ACSI ranking. We were significantly higher than all of the other measured banks, including JP Morgan Chase, Bank of America, Wells Fargo and Citigroup Forrester Fifth Third finished second among large banks in customer experience (CXPi 2010) Fifth Third ranked #1 for correlation between a positive customer experience and repurchase plans (2008) Gallup Achieved top quartile customer loyalty in 2009 Achieved top quartile customer satisfaction in 2008 JD Power Fifth Third ranked 6 among our peer group (up from 13 in 2007) Fifth Third ranked 8 among the top 20 banks (up from 16 in 2007) Convergys Fifth Third ranked 3 among peer group and 5 overall in 2009 Convergys Retail Bank study th th th th rd th * Fifth Third Bank engaged the American Customer Satisfaction Index (ACSI) in custom research projects surveying Fifth Third Bank customers. In the surveys, ACSI used the same statistical methodology as the independently measured banks, Bank of America, Chase, Wells Fargo, and Citigroup |
 9 Fifth Third Bank | All Rights Reserved 4Q09 credit results Source: SNL and company reports. NPAs exclude loans held-for-sale and covered assets. Year-over-year NCO growth versus peers Peer average: 122% NPA ratio versus peers Year-over-year NPA growth versus peers Peer average: 100% Net charge-off ratio versus peers |
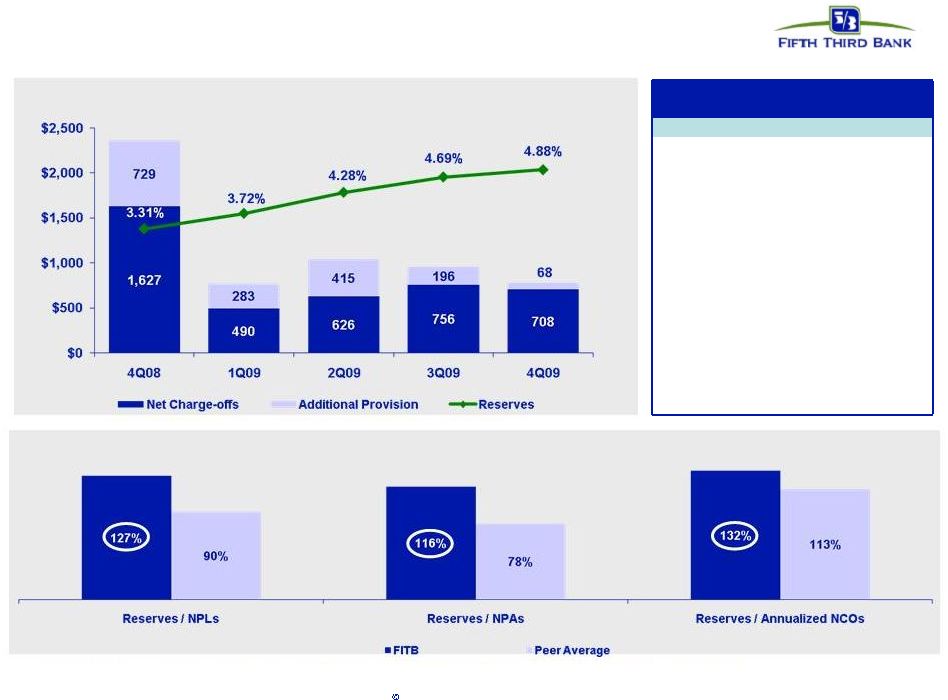 10 Fifth Third Bank | All Rights Reserved Strong reserve position Coverage ratios are strong relative to peers Source: SNL and company reports. NPAs/NPLs exclude held-for-sale portion for all banks and covered assets for BBT, USB, and ZION. 1. FITB 4.88% 2. KEY 4.31% 3. HBAN 4.03% 4. ZION 3.81% 5. RF 3.43% 6. MI 3.36% 7. PNC 3.22% 8. WFC 3.13% 9. STI 2.74% 10. USB 2.66% 11. BBT 2.51% 12. CMA 2.34% 13. MTB 1.71% Peer Average 3.11% Reserves / Total loans Industry leading reserve level |
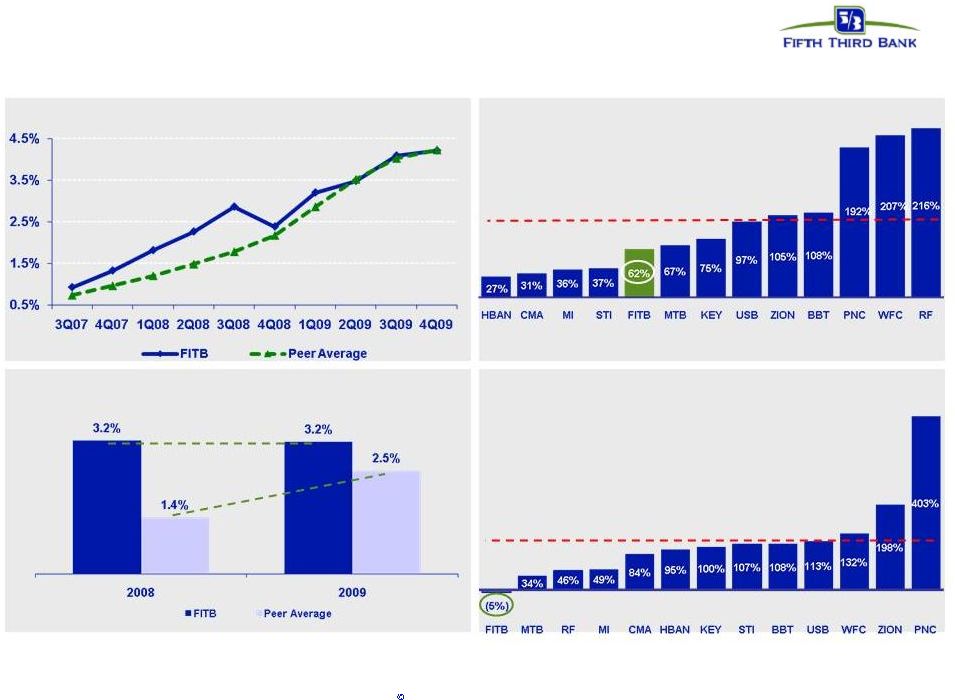
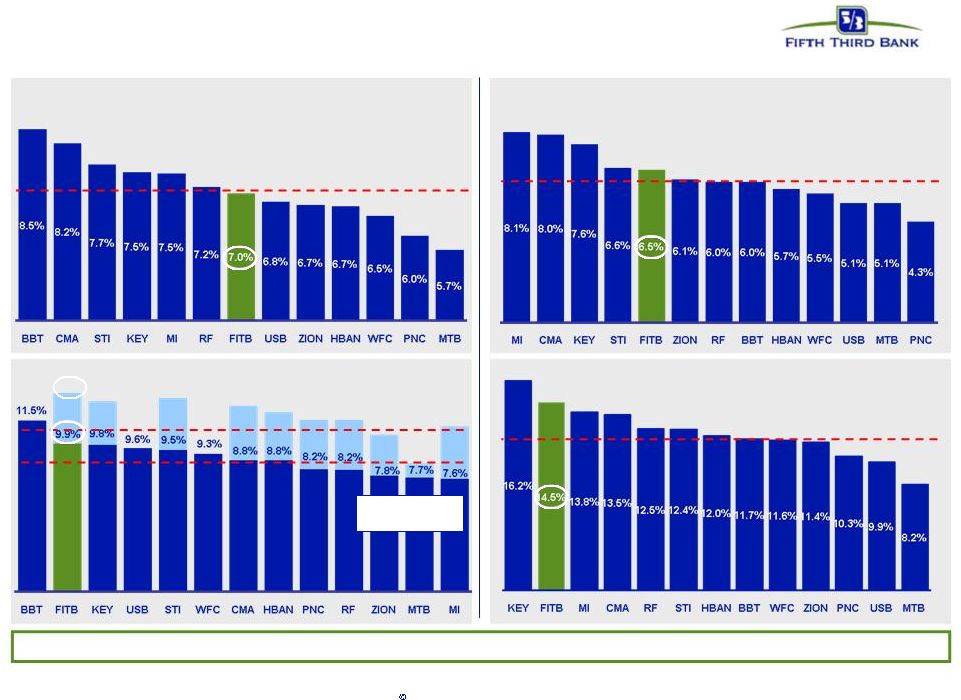 Strong capital position Source: SNL and company reports. (TCE + reserves) / Loans Tangible common equity ratio Peer average: 6.2% Peer average: 12.0% Tier 1 common ratio Peer average: 7.1% Peer average w/ TARP: 11.2% Peer average w/o TARP: 8.9% Tier 1 capital ratio (with and without TARP) 8.6% 11.1% 10.5% 11.5% 11.5% 12.0% 12.5% 13.0% 12.8% 13.3% Strong capital ratios relative to peers, particularly considering reserve levels 11 Fifth Third Bank | All Rights Reserved |
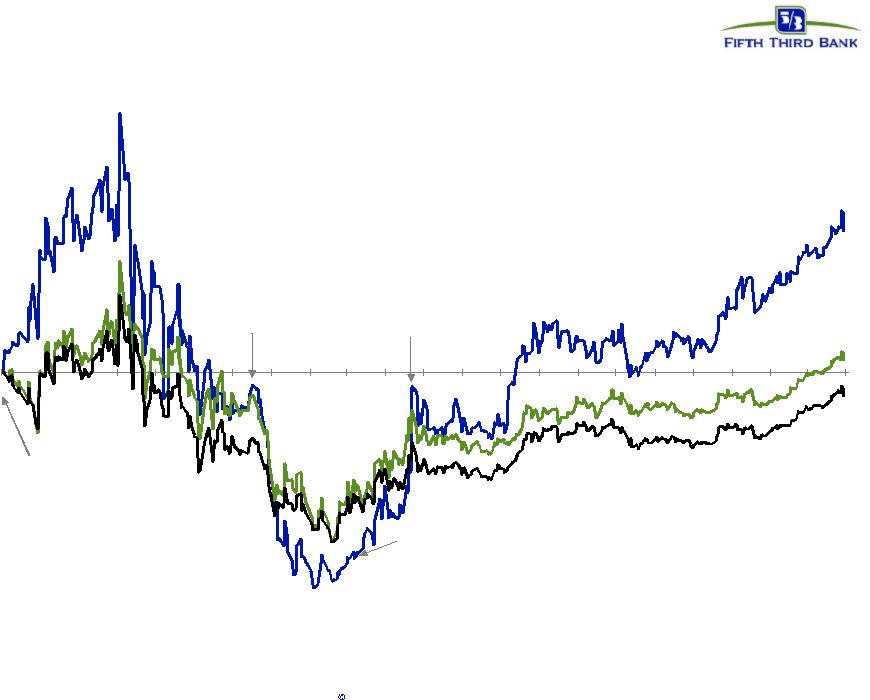 12 Fifth Third Bank | All Rights Reserved Strong relative stock performance From June 2008 capital actions to date (110%) (90%) (70%) (50%) (30%) (10%) 10% 30% 50% 70% 90% 110% 6/08 7/08 8/08 9/08 10/08 11/08 12/08 1/09 2/09 3/09 4/09 5/09 6/09 7/09 8/09 9/09 10/09 11/09 12/09 1/10 2/10 3/10 4/10 FITB 59% SP Banks 6% BKX (9%) TARP investment FTPS announcement SCAP results Source: Bloomberg, 06/18/08 – 04/16/10. June 2008 capital actions FITB stock price $9.26 FITB stock price $14.20 |
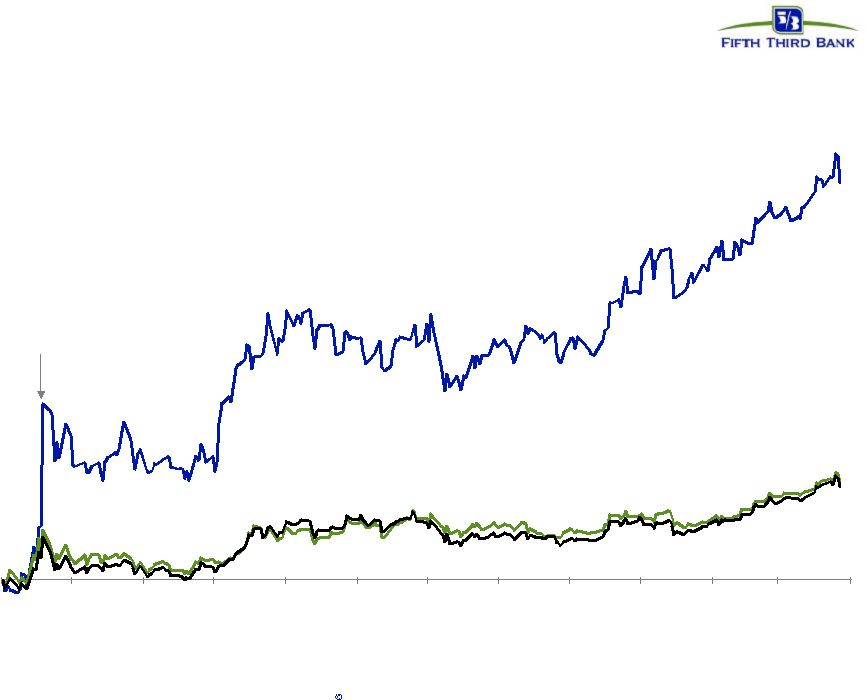 13 Fifth Third Bank | All Rights Reserved Strong relative stock performance From last year’s Annual Shareholder Meeting to date (50%) 0% 50% 100% 150% 200% 250% 300% 4/09 5/09 6/09 7/09 8/09 9/09 10/09 11/09 12/09 1/10 2/10 3/10 4/10 FITB 259% SP Banks 65% BKX 61% Source: Bloomberg, 04/21/09 – 04/16/10. FITB stock price $3.65 FITB stock price $14.20 SCAP results |
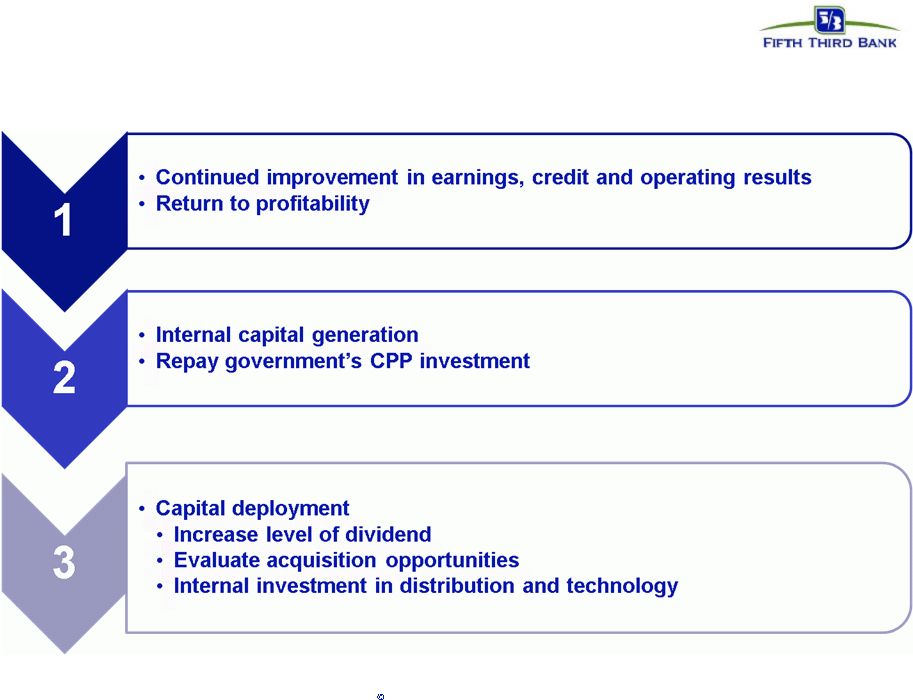 14 Fifth Third Bank | All Rights Reserved Focus areas for 2010 and beyond |
 |
 16 Fifth Third Bank | All Rights Reserved Cautionary statement This report may contain statements that we believe are “forward-looking statements” within the meaning of Section 27A of the Securities Act of 1933, as amended, and Rule 175 promulgated thereunder, and Section 21E of the Securities Exchange Act of 1934, as amended, and Rule 3b-6 promulgated thereunder. These statements relate to our financial condition, results of operations, plans, objectives, future performance or business. They usually can be identified by the use of forward-looking language such as “will likely result,” “may,” “are expected to,” “is anticipated,” “estimate,” “forecast,” “projected,” “intends to,” or may include other similar words or phrases such as “believes,” “plans,” “trend,” “objective,” “continue,” “remain,” or similar expressions, or future or conditional verbs such as “will,” “would,” “should,” “could,” “might,” “can,” or similar verbs. You should not place undue reliance on these statements, as they are subject to risks and uncertainties, including but not limited to the risk factors set forth in our most recent Annual Report on Form 10-K. When considering these forward-looking statements, you should keep in mind these risks and uncertainties, as well as any cautionary statements we may make. Moreover, you should treat these statements as speaking only as of the date they are made and based only on information then actually known to us. There are a number of important factors that could cause future results to differ materially from historical performance and these forward- looking statements. Factors that might cause such a difference include, but are not limited to: (1) general economic conditions and weakening in the economy, specifically the real estate market, either nationally or in the states in which Fifth Third, one or more acquired entities and/or the combined company do business, are less favorable than expected; (2) deteriorating credit quality; (3) political developments, wars or other hostilities may disrupt or increase volatility in securities markets or other economic conditions; (4) changes in the interest rate environment reduce interest margins; (5) prepayment speeds, loan origination and sale volumes, charge-offs and loan loss provisions; (6) Fifth Third’s ability to maintain required capital levels and adequate sources of funding and liquidity; (7) maintaining capital requirements may limit Fifth Third’s operations and potential growth; (8) changes and trends in capital markets; (9) problems encountered by larger or similar financial institutions may adversely affect the banking industry and/or Fifth Third (10) competitive pressures among depository institutions increase significantly; (11) effects of critical accounting policies and judgments; (12) changes in accounting policies or procedures as may be required by the Financial Accounting Standards Board (FASB) or other regulatory agencies; (13) legislative or regulatory changes or actions, or significant litigation, adversely affect Fifth Third, one or more acquired entities and/or the combined company or the businesses in which Fifth Third, one or more acquired entities and/or the combined company are engaged; (14) ability to maintain favorable ratings from rating agencies; (15) fluctuation of Fifth Third’s stock price; (16) ability to attract and retain key personnel; (17) ability to receive dividends from its subsidiaries; (18) potentially dilutive effect of future acquisitions on current shareholders’ ownership of Fifth Third; (19) effects of accounting or financial results of one or more acquired entities; (20) difficulties in separating Fifth Third Processing Solutions from Fifth Third; (21) loss of income from any sale or potential sale of businesses that could have an adverse effect on Fifth Third’s earnings and future growth;(22) ability to secure confidential information through the use of computer systems and telecommunications networks; and (23) the impact of reputational risk created by these developments on such matters as business generation and retention, funding and liquidity. You should refer to our periodic and current reports filed with the Securities and Exchange Commission, or “SEC,” for further information on other factors, which could cause actual results to be significantly different from those expressed or implied by these forward-looking statements. |