 Exhibit 99.1 Credit Suisse Financial Services Forum Kevin T. Kabat President & Chief Executive Officer February 8, 2012 Please refer to earnings release dated January 20, 2012 for further information © Fifth Third Bank | All Rights Reserved |
 Well-positioned for success and leadership in new banking landscape Key themes Strong levels of profitability Broad-based credit improvements Exceed fully phased -in Basel III capital standards today All crisis-era government support programs exited; no TLGP No significant business at Fifth Third impaired by crisis Disciplined expense control Traditional banking focus consistent with direction of financial reform 2 © Fifth Third Bank | All Rights Reserved Continued investments to maintain and enhance revenue- generation |
 3 © Fifth Third Bank | All Rights Reserved Environment characterized by low growth expectations and low interest rates Prolonged low-rate environment, coupled with modest economic growth (possibly strengthening) Lower securities reinvestment yields on portfolio cash flows Strong deposit flows Competitive dynamics Elevated mortgage refinance activity Firms facing significant litigation related to: — Mortgage securitizations — GSE repurchases — Private label mortgage repurchases Concerns about European banks and sovereign debt Higher capital standards; limitations on dividend payout ratios; some uncertainty regarding near-term overall capital distributions Continued strong loan production — Rates on loan originations relatively stable Careful management of liability costs — Disciplined pricing on deposits — Continued evaluation of term liabilities including CDs and TruPS Strong mortgage banking results Mortgage risks manageable — Quarterly mortgage repurchase costs ~$20mm; claims inventory declining — Total mortgage securitizations outstanding $22mm (2003 HELOC and performing well) No direct European sovereign exposure — Total exposure to European peripheral* borrowers <$0.2bn — Gross exposure to European banks <$0.2bn Strong profitability and capital in excess of fully phased-in Basel III standards today — 2012 CCAR** plan to increase distributions * Greece, Ireland, Italy, Portugal, Spain ** Comprehensive Capital Analysis & Review by Federal Reserve; subject to Board of Directors and regulatory approval. Fifth Third is well-positioned to deal with current environmental challenges Characteristics of current environment Fifth Third’s response / position |
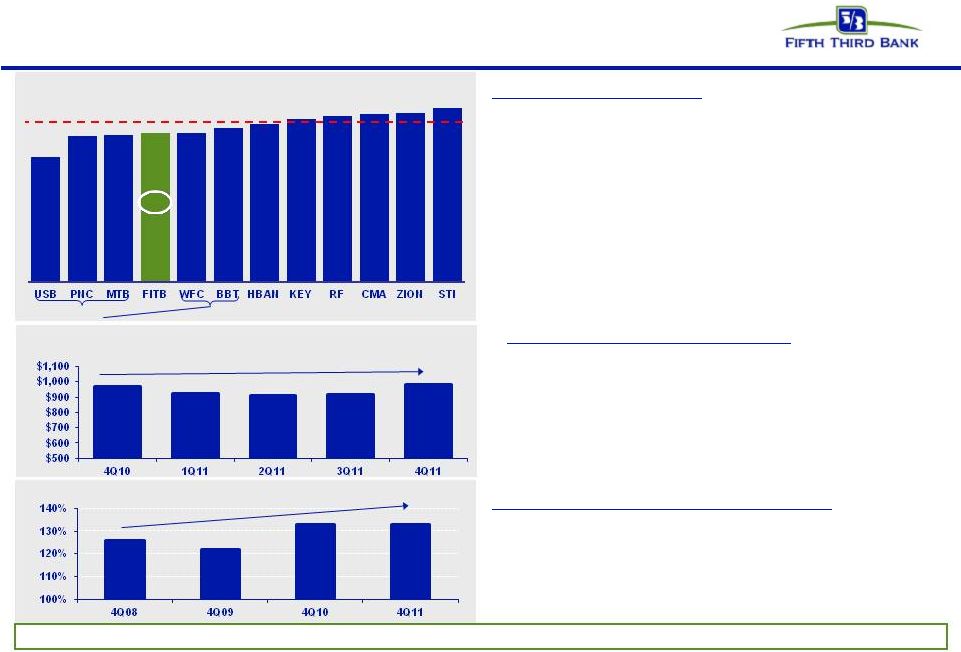
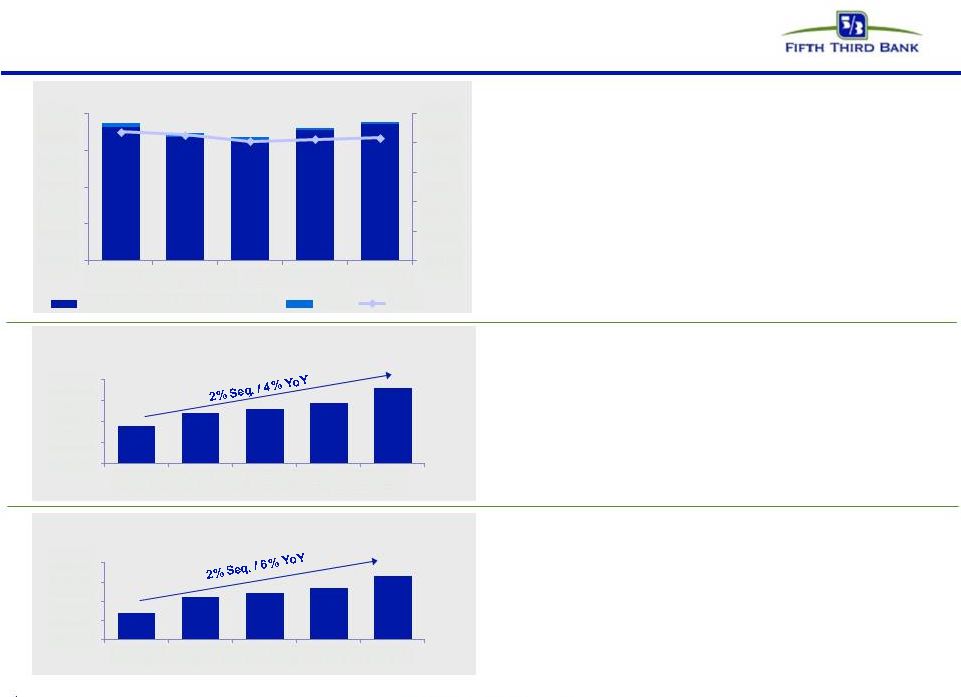 4 Net interest income Balance sheet growth mitigating rate environment Commercial Loan Growth^ ($bn) Consumer Loan Growth^ ($bn) • Sustained growth in commercial loans driven by C&I – Manufacturing has been significant driver of C&I growth – Growth is geographically diverse • CRE portfolio run-off at slowing rate – Selective opportunities now providing for modest current origination volume NII and NIM (FTE) ($mm) $920 • Net interest income and net interest margin results supported by business and balance sheet mix – Significant emphasis on variable rate C&I lending – Fixed rate securities only 15% of earning assets – High percentage of funding base in noninterest- bearing DDA and low-cost transaction deposits • Modest natural asset sensitivity creates NIM pressure but we expect to be manageable – ~50% of earning assets, ~40% of funding variable in nature • Consumer loan growth driven by auto, bankcard and in-branch mortgage originations – Auto volumes strong; spread pressure due to competition – Branch mortgage refi product has FICO over 780, LTV ~60% and avg. term ~17 years while yielding above market rates due to convenience * Represents purchase accounting adjustments included in net interest income. ^ Excluding loans held-for-sale 3.75% 3.71% 3.62% 3.65% 3.67% $450 $550 $650 $750 $850 $950 2.0% 2.5% 3.0% 3.5% 4.0% 4Q10 1Q11 2Q11 3Q11 4Q11 Net Interest Income (right axis) PAA* NIM $919 $884 $869 $902 42.8 43.4 43.6 43.9 44.6 $41 $42 $43 $44 $45 4Q10 1Q11 2Q11 3Q11 4Q11 33.4 34.2 34.4 34.7 35.3 $32 $33 $34 $35 $36 4Q10 1Q11 2Q11 3Q11 4Q11 © Fifth Third Bank | All Rights Reserved |
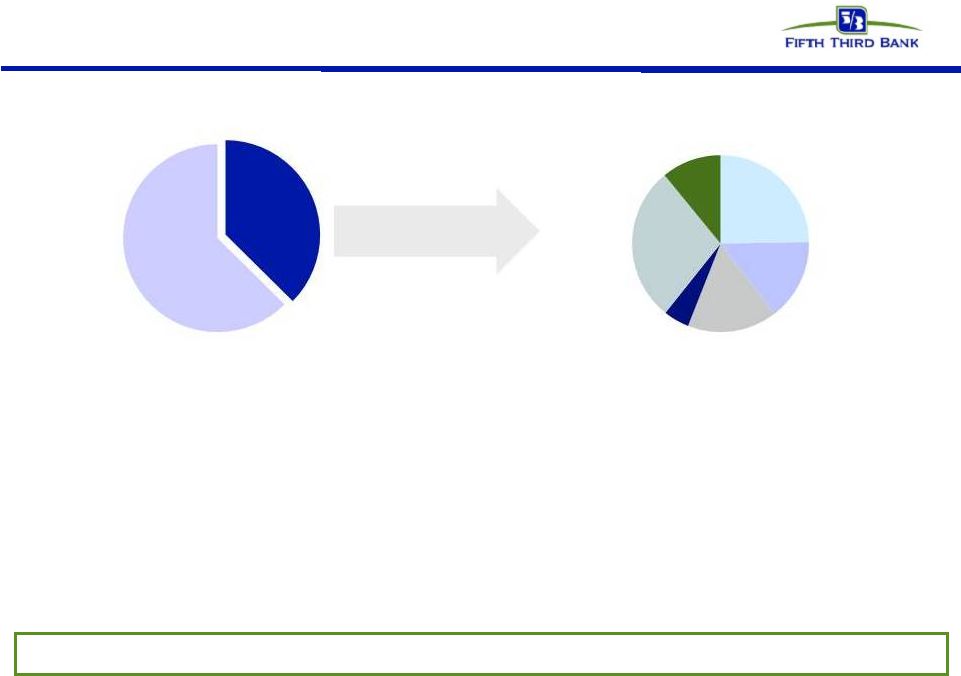 5 © Fifth Third Bank | All Rights Reserved 37% fee income (~40% adjusted*) Diverse revenue base Deposit fees Corporate banking Investment advisors Other Mortgage Card & Processing net interest income Fee income as % of 4Q11 revenue 4Q11 Fee income distribution Revenue results remain solid, profitability strong despite sluggish economy * ~40% fee income adjusted for items outlined on page 26. 63% 28% 11% 25% 16% 5% 15% • Business mix provides higher than average diversity among spread and fee revenues — Current NII lower than normalized levels due to impact of sustained low rate environment (e.g. low cost deposits including DDAs providing little NII benefit) • Near-term effect of changes in deposit and interchange fee rules depressing current non-interest income levels — Negative impact from debit interchange legislation and Reg E in run-rates — Initial impact of debit interchange legislation (~$30 million per quarter) expected to be mitigated over time (~2/3 by 3Q12); will implement carefully and deliberately |
 6 © Fifth Third Bank | All Rights Reserved Customer oriented solutions • Broad suite of product offerings with distinct value propositions to appeal to various customer segments • Implementation of new products, like DUO Card, Real Life Rewards, Relationship Savings – DUO Card introduced in 3Q11 – Customer chooses to pay debit or credit at the point of sale • Letting customers choose how to pay for products and services they use Providing customers with products and services they find valuable • Reduce costs associated with debit card offerings • Changes and eliminations of reward programs • Incorporation of debit usage into bundled deposit product offerings • Adjustment of product and fee structures relative to services provided • Charge card alternatives • Implementation of new products • In-depth discussions with customers to determine what matters most to them • Actively seeking input and feedback from customer base and prospective customers • Working carefully to ensure we align value to the customer with value to us Listening to the voice of our customers Deliberate and multi-pronged approach to mitigation of regulatory / legislative impacts |
 7 © Fifth Third Bank | All Rights Reserved Significant purchase accounting benefit Disciplined expense control Adjusted efficiency ratio*^ Peer average: 65% Sales / support ratio** Efficient business model: • Efficiency ratio better than most peers through weak economic environment – Reflects below-capacity balance sheet and lower revenue than we expect and can support longer term – Current impact of credit costs on revenue and expenses; initial impact of regulatory reforms (e.g., debit interchange) Disciplined expense management: • Expenses being managed carefully in response to revenue environment – Relatively flat year-over-year and over past several years – Continuous process of expense evaluation at 5/3 Investments to provide for future growth: • Sales to support ratio has increased through careful management of back office and front office staff Adjusted noninterest expense trend*** ($mm) (Flat YoY) * Source: Company reports. Data as of FY11. Efficiency ratio calculated as reported noninterest expense / (net interest income (fully taxable equivalent)+ noninterest income) adjusted for one-time items for comparison purposes to peers. See page 26 for list of adjustments. 4Q11 actual efficiency ratio 68%; 4Q11 actual noninterest expense $993mm (flat YoY); 4Q11 actual revenue $1,470mm. ** Sales / support ratio calculated as Sales Headcount (full-time equivalent) / Support Headcount (full-time equivalent) *** Noninterest expense adjusted for one-time items (4Q11 actual noninterest expense $993mm (flat YoY)). See page 26 for list of adjustments. ^ Non-GAAP measure. See Reg. G reconciliation in the Appendix to the presentation. 52% 60% 61% 62% 62% 64% 65% 68% 69% 69% 70% 72% $970 $920 $907 $914 $979 Managing expenses for current revenue environment and long-term franchise value |
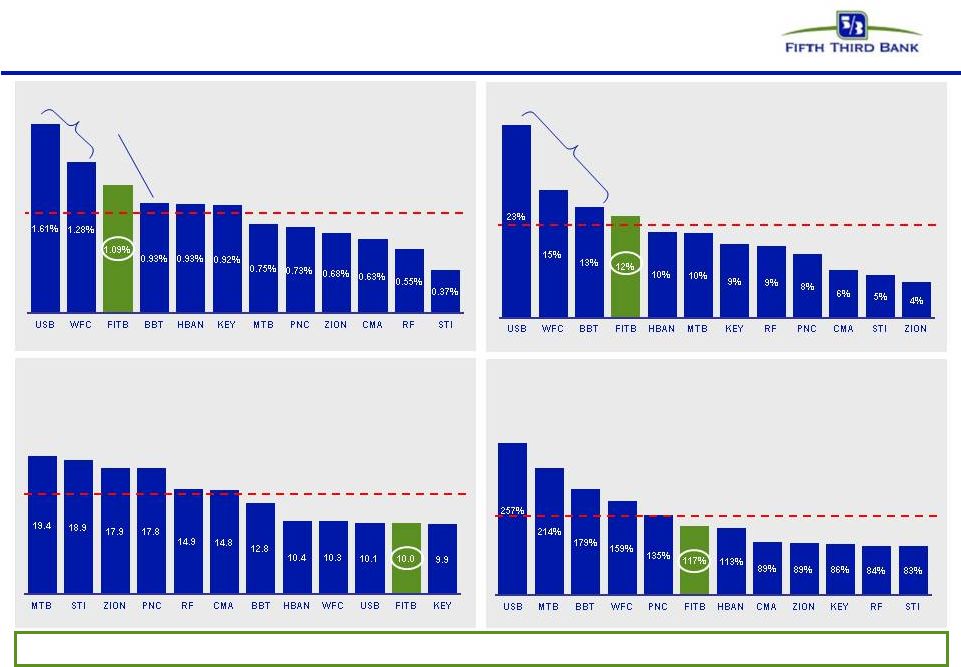
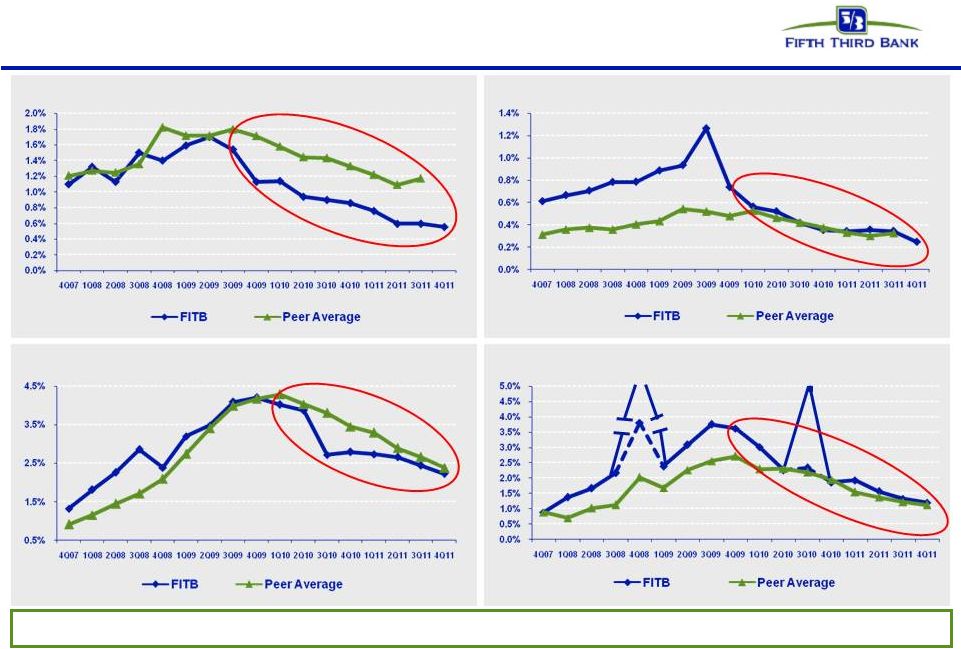 8 © Fifth Third Bank | All Rights Reserved Strong relative credit trends FITB credit metrics are in line with or better than peers NPA ratio vs. peers Net charge-off ratio vs. peers Loans 90+ days delinquent % vs. peers Loans 30-89 days delinquent % vs. peers (7.5%)* (HFS transfer) 3.8% Before credit actions 5.0%* 2.3% Before credit actions Peer average includes: BBT, CMA, HBAN, KEY, MTB, PNC, RF, STI, USB, WFC, and ZION Source: SNL Financial and company filings. All ratios exclude loans held-for-sale and covered assets for peers where appropriate. * 4Q08 NCOs included $800mm in NCOs related to commercial loans moved to held-for-sale; 3Q10 NCOs included $510mm in NCOs related to loans sold or moved to held-for-sale |
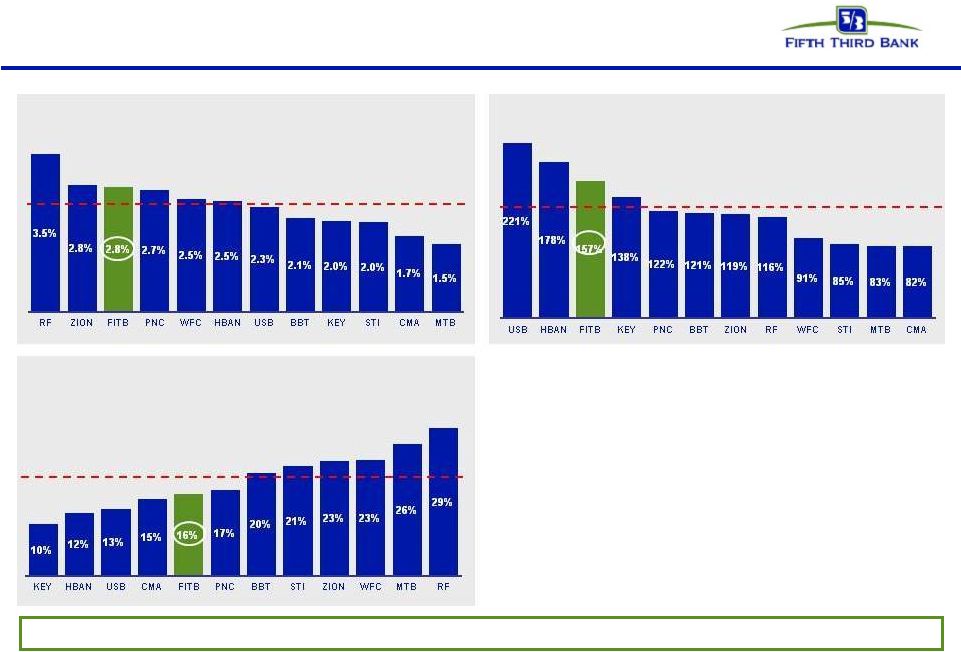 9 © Fifth Third Bank | All Rights Reserved Strong credit coverage levels Source: SNL Financial and company reports. Data as of 4Q11. HFI NPAs and NPLs exclude loans held-for-sale and also exclude covered assets for BBT, USB, and ZION * Non-GAAP measure. See Reg. G reconciliation on pages in the Appendix to the presentation. Reserves, pre-provision profits and capital levels significant in relation to problem assets Reserves / NPLs Peer average: 123% “Texas Ratio” (HFI NPAs + Over 90s) / (Reserves + TCE)* Peer average: 19% Reserves / Loans Peer average: 2.3% • Reserves remain significantly higher than pre-crisis levels • Strong reserve coverage ratios of problem assets and net charge-offs • PPNR levels and profitability provides Fifth Third with strong ongoing loss absorption capacity |
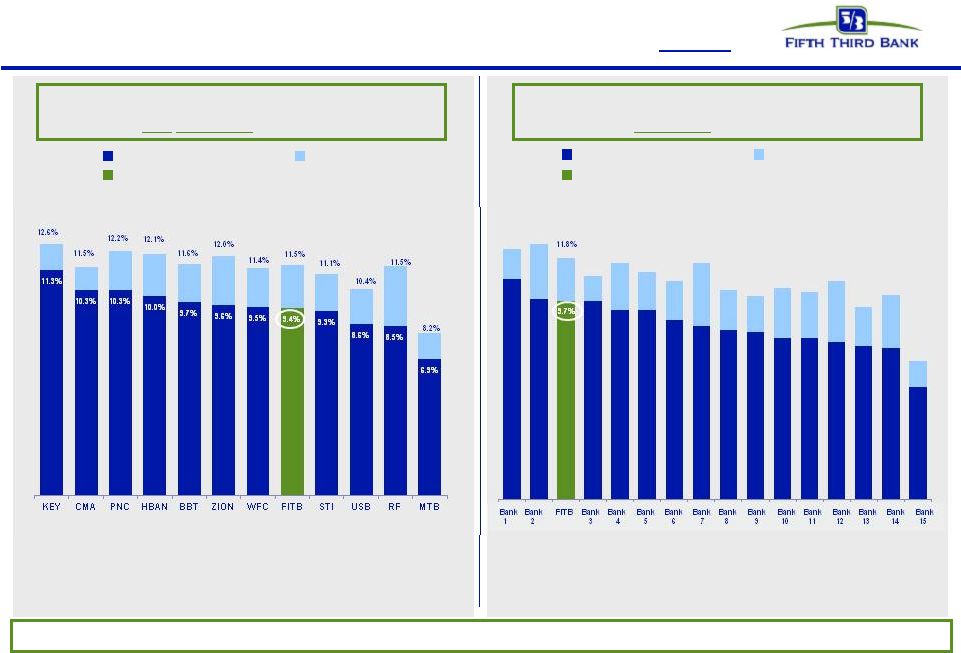 Exceed fully phased-in Basel III capital standards today Fifth Third’s capital position already well in excess of established standards, likely standards, and most peers (Tier 1 common + reserves) / RWA** (not adjusted for Basel III) Peers* not in order of graph at left; estimated (Tier 1 common + reserves) / RWA** (adjusted for Basel III) Note: Estimates based on current Basel III rules released by the Basel Committee; actual rules subject to U.S. banking regulation. Assumes unrealized securities gains included in Tier 1 common. Not adjusted for potential mitigation efforts. Four large peers include estimated Basel III RWA impact based on BIS proposals. Tier 1 common (peers) Tier 1 common (FITB) Reserves Reserves Tier 1 common (peers) Tier 1 common (FITB) 10 © Fifth Third Bank | All Rights Reserved Source: SNL Financial, company filings, and third-party estimates. Regulatory financial data as of 4Q11. MTB, PNC, and ZION as of 3Q11. * Peers include BAC, BBT, C, CMA, COF, HBAN, JPM, KEY, MTB, PNC, RF, STI, USB, WFC, ZION ** Non-GAAP measure. See Reg. G reconciliation on pages in the Appendix to the presentation. |
 11 © Fifth Third Bank | All Rights Reserved Capital management philosophy * Subject to Board of Directors and regulatory approval ** Comprehensive Capital Analysis & Review by Federal Reserve Organic growth opportunities • Support growth of core banking franchise • Continued loan growth despite sluggish economy Return to more normal dividend policy * • Strong levels of profitability would support higher dividend than current level • Move towards levels more consistent with Fed’s near-term payout ratio guidance of 30% Strategic opportunities * • Prudently expand franchise or increase density in core markets via disciplined acquisitions or selective de novos • Expect future acquisition activity although less likely in near-term • Attain top 3 market position in 65% of markets or more longer term Repurchases / Redemptions * • Initiate common share repurchases to manage growing excess capital levels; retain amount of common equity to accommodate asset growth • Potential redemption of certain TruPS included in 1Q12 CCAR ** submission – Will evaluate in context of regulatory developments and desired capital structure given continued changes in regulations Strong internal capital generation; current long-term Tier 1 common equity target of ~8% Manage common equity in light of regulatory environment, other alternatives, maintenance of desired / required buffers, and stock price – |
 © Fifth Third Bank | All Rights Reserved Strong returns drive capital generation * 4Q11 annualized. RF adjusted to exclude 4Q11 goodwill impairment expense. ^Non-GAAP measure. See Reg. G reconciliation on pages in the Appendix to the presentation. Price as of 2/2/12 Well above average profitability and capital generation, well below average valuation Price / Tangible Book Value Peer average: 135% Peer average: 10% Significant purchase accounting benefit Peer average: 0.85% Price / Earnings* Peer average: 14.3 Significant purchase accounting benefit Return on Average Tangible Common Equity *^ Return on Average Assets * 12 |
 13 © Fifth Third Bank | All Rights Reserved Well-positioned for the future • Holding company cash currently sufficient for more than 2 years of obligations; minimal holding company or Bank debt maturities until 2013 • Fifth Third has completely exited all crisis-era government support programs Superior capital and liquidity position • NCOs of 1.2%; 2.4x reserves / annualized NCOs • Substantial reduction in exposure to CRE since 1Q09; relatively low CRE exposure versus peers • Very low relative exposure to areas of concern, e.g. European financials, mortgage repurchase risk Proactive approach to risk management • Traditional commercial banking franchise built on customer-oriented localized operating model • Strong market share in key markets with focus on further improving density • Fee income ~40% of total revenues Diversified traditional banking platform • PPNR has remained strong throughout the credit cycle • PPNR substantially exceeds annual net charge-offs (198% PPNR / NCOs^ in 4Q11) • 1.1% ROAA; 12% return on average tangible common equity^ Industry leader in earnings power ^ Non-GAAP measure. See Reg. G reconciliation in the Appendix to the presentation. – Fifth Third is one of the few large banks that have no TLGP-guaranteed debt to refinance in 2012 |
 14 © Fifth Third Bank | All Rights Reserved Cautionary statement This report contains statements that we believe are “forward-looking statements” within the meaning of Section 27A of the Securities Act of 1933, as amended, and Rule 175 promulgated thereunder, and Section 21E of the Securities Exchange Act of 1934, as amended, and Rule 3b-6 promulgated thereunder. These statements relate to our financial condition, results of operations, plans, objectives, future performance or business. They usually can be identified by the use of forward-looking language such as “will likely result,” “may,” “are expected to,” “is anticipated,” “estimate,” “forecast,” “projected,” “intends to,” or may include other similar words or phrases such as “believes,” “plans,” “trend,” “objective,” “continue,” “remain,” or similar expressions, or future or conditional verbs such as “will,” “would,” “should,” “could,” “might,” “can,” or similar verbs. You should not place undue reliance on these statements, as they are subject to risks and uncertainties, including but not limited to the risk factors set forth in our most recent Annual Report on Form 10-K. When considering these forward-looking statements, you should keep in mind these risks and uncertainties, as well as any cautionary statements we may make. Moreover, you should treat these statements as speaking only as of the date they are made and based only on information then actually known to us. There are a number of important factors that could cause future results to differ materially from historical performance and these forward- looking statements. Factors that might cause such a difference include, but are not limited to: (1) general economic conditions and weakening in the economy, specifically the real estate market, either nationally or in the states in which Fifth Third, one or more acquired entities and/or the combined company do business, are less favorable than expected; (2) deteriorating credit quality; (3) political developments, wars or other hostilities may disrupt or increase volatility in securities markets or other economic conditions; (4) changes in the interest rate environment reduce interest margins; (5) prepayment speeds, loan origination and sale volumes, charge-offs and loan loss provisions; (6) Fifth Third’s ability to maintain required capital levels and adequate sources of funding and liquidity; (7) maintaining capital requirements may limit Fifth Third’s operations and potential growth; (8) changes and trends in capital markets; (9) problems encountered by larger or similar financial institutions may adversely affect the banking industry and/or Fifth Third; (10) competitive pressures among depository institutions increase significantly; (11) effects of critical accounting policies and judgments; (12) changes in accounting policies or procedures as may be required by the Financial Accounting Standards Board (FASB) or other regulatory agencies; (13) legislative or regulatory changes or actions, or significant litigation, adversely affect Fifth Third, one or more acquired entities and/or the combined company or the businesses in which Fifth Third, one or more acquired entities and/or the combined company are engaged, including the Dodd-Frank Wall Street Reform and Consumer Protection Act; (14) ability to maintain favorable ratings from rating agencies; (15) fluctuation of Fifth Third’s stock price; (16) ability to attract and retain key personnel; (17) ability to receive dividends from its subsidiaries; (18) potentially dilutive effect of future acquisitions on current shareholders’ ownership of Fifth Third; (19) effects of accounting or financial results of one or more acquired entities; (20) difficulties in separating Vantiv, LLC, formerly Fifth Third Processing Solutions from Fifth Third; (21) loss of income from any sale or potential sale of businesses that could have an adverse effect on Fifth Third’s earnings and future growth; (22) ability to secure confidential information through the use of computer systems and telecommunications networks; and (23) the impact of reputational risk created by these developments on such matters as business generation and retention, funding and liquidity. You should refer to our periodic and current reports filed with the Securities and Exchange Commission, or “SEC,” for further information on other factors, which could cause actual results to be significantly different from those expressed or implied by these forward-looking statements. |
 15 © Fifth Third Bank | All Rights Reserved Appendix |
 16 © Fifth Third Bank | All Rights Reserved Traditional banking focus consistent with direction of financial reform Business profile positions Fifth Third well – today and in the future • Do not require substantial changes to Fifth Third’s business model or asset mix with attendant execution risk • Fifth Third’s business model is driven by traditional banking activities, consistent with direction of financial reform Dodd-Frank / Basel III • International activity primarily related to trade finance and lending to U.S. subsidiaries of foreign companies (e.g. Fifth Third loss in Lehman bankruptcy expected to be less than $2mm) Financial system interconnectedness • Little to no impact (de minimis market maker in derivatives, proprietary trading) – Low trading business activity; daily VaR ~$1mm or less – Small private equity portfolio <$200mm Volcker rule • Other large firms facing significant litigation related to mortgage securitizations, GSE repurchases, and private label mortgage repurchases • Fifth Third’s mortgage risks are manageable – Quarterly mortgage repurchase costs ~$20mm and claims inventory declining – Total mortgage securitizations outstanding $22mm (2003 HELOC) and performing well Mortgage Putback / Litigation risk – No originations of CDOs, securitizations on behalf of others – Didn’t originate or sell subprime mortgages or Option ARMs Effect of crisis on core business – Total exposure to European peripheral borrowers (Greece, Ireland, Italy, Portugal, Spain) less than $200mm – Gross exposure to European banks less than $200mm European banks and sovereign debt exposure • No direct European sovereign exposure • No significant business at Fifth Third impaired during crisis |
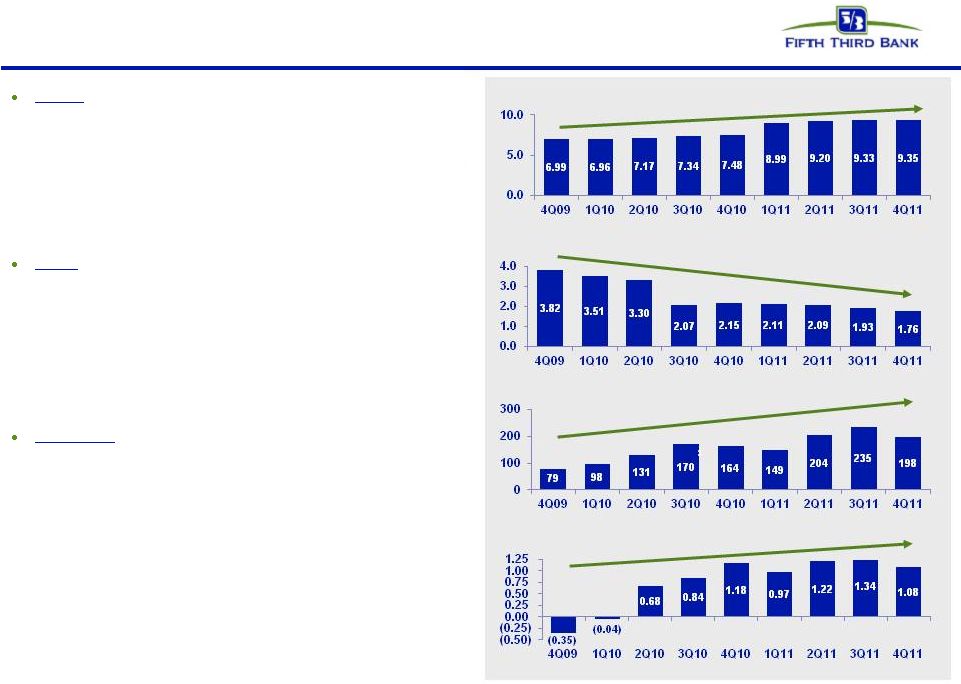 17 © Fifth Third Bank | All Rights Reserved A foundation of continued robust results Capital – exceeds required and targeted levels — Tier 1 common* capital up ~500bps or $4.9bn from 4Q08 — Capital base transformed through series of capital actions – ~9.7% pro forma 1 Tier 1 common ratio* on a fully-phased in Basel III-adjusted basis — Capital levels supplemented by strong reserve levels – Loan loss reserves 2.78% of loans and 157% of NPLs Credit – ongoing steady improvement — Broad-based improvements in problem loans – 80% reduction in 90+ day delinquent loans since 3Q09 – NCO ratio of 1.19%, lowest NCO level since 4Q07 – 198% PPNR / NCOs* — Balance sheet risk lowered through asset sales, resolutions – $1.5bn (51%) decline in NPLs since 4Q09 Profitability – strong relative and absolute results — PPNR* remained stable throughout cycle — 7 consecutive profitable quarters — Return on assets 1.1% — Return on average tangible common equity* 12% * Non-GAAP measure; see Reg. G reconciliation in the Appendix to the presentation. 1 Current estimate (non-GAAP), subject to final rule-making and clarification by U.S. banking regulators; currently assumes unrealized securities gains are included in common equity for purposes of this calculation 2 Nonperforming loans and leases as a percent of portfolio loans, leases and other assets, including other real estate owned (does not include nonaccrual loans held-for-sale) 3 Excluding $510mm net charge-offs attributable to credit actions Tier 1 common ratio (%)* NPL / Loans ² (%) PPNR / Net charge-offs (%)* Return on assets (%) 3 |
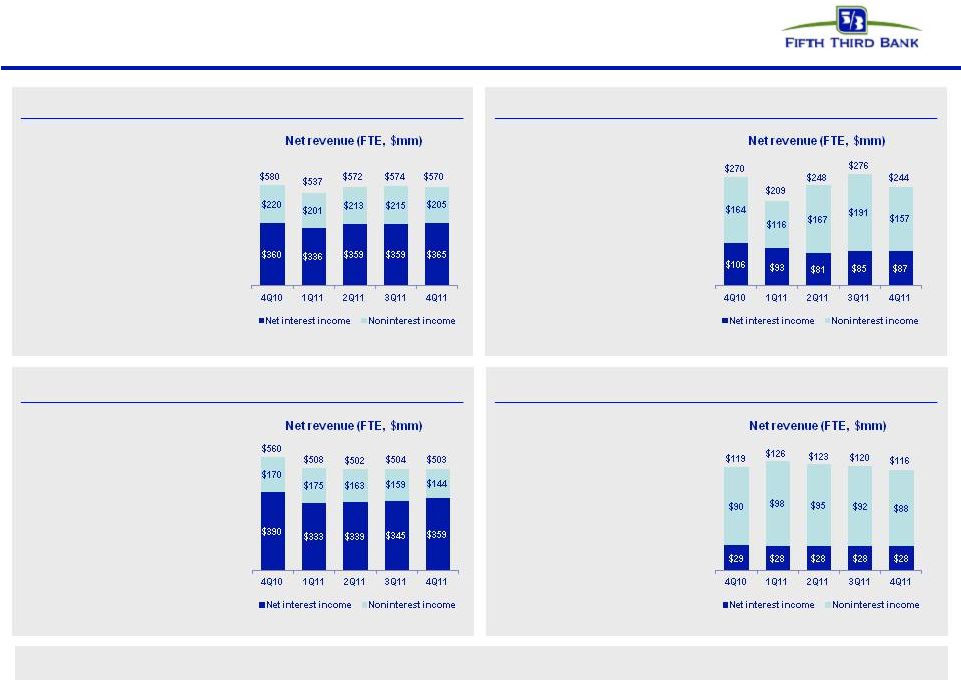 18 © Fifth Third Bank | All Rights Reserved Diverse business mix Branch Banking Consumer Lending Commercial Banking Investment Advisors • Professionals committed to understanding customers’ unique needs, providing options and identifying the right solution • Top 5 market share within the non-captive prime auto lending space • Top 13 mortgage origination share • $1.0bn total revenue • Holistic approach to branch banking combined with mobile convenience to improve the banking experience and be the trusted financial partner for our customers • 1,316 full-service banking centers • 2,425 full-service ATMs • $2.3bn total revenue • Comprehensive product and service offering including commercial lending, treasury management, and capital markets • Innovative products, advancements in technology, and exceptional customer service • $2.0bn total revenue • Provide financial insight, a wide array of leading-edge products and services, and a professional team to help develop a strategy for clients’ financial success • $485mm total revenue • $24bn assets under management • $282bn assets under care • 49% interest in Vantiv, LLC, formerly Fifth Third Processing Solutions, LLC |
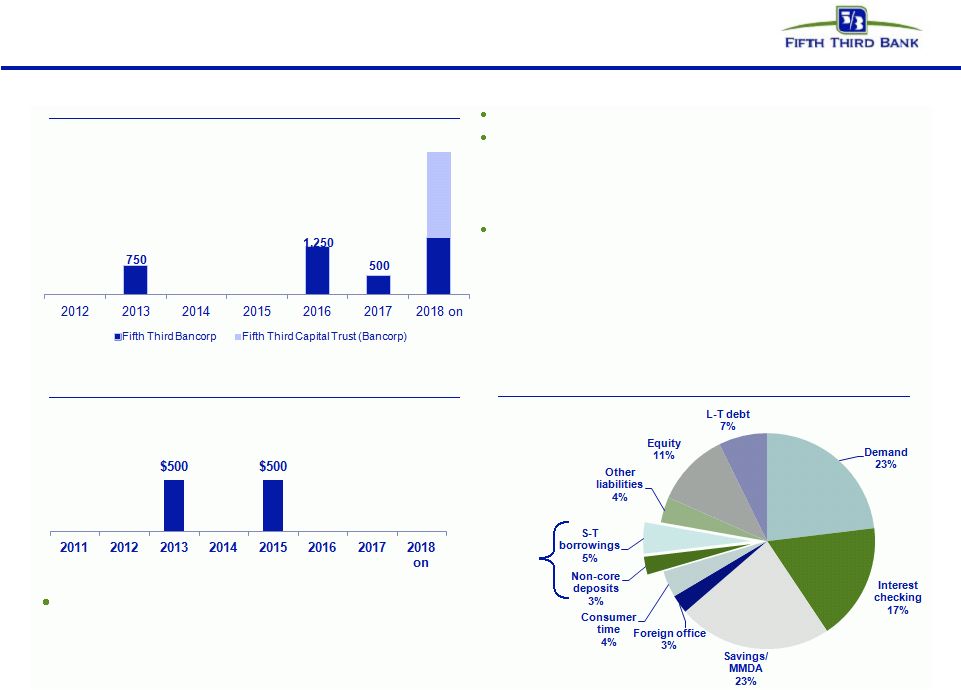 19 © Fifth Third Bank | All Rights Reserved Available and contingent borrowing capacity (4Q11): – FHLB ~$9B – Federal Reserve ~$22B Holding Company cash at 12/31/11: $2.6B Cash currently sufficient to satisfy all fixed obligations for more than 2 years (debt maturities, common and preferred dividends, interest and other expenses) without accessing capital markets; relying on dividends from subsidiaries; proceeds from asset sales Expected cash obligations over the next 12 months — ~$368mm common dividends — ~$35mm Series G preferred dividends — ~$419mm interest and other expenses Holding company unsecured debt maturities ($mm) Bank unsecured debt maturities ($mm – excl. Brokered CDs) Heavily core funded Strong liquidity profile S-T wholesale 8% 3,749 |
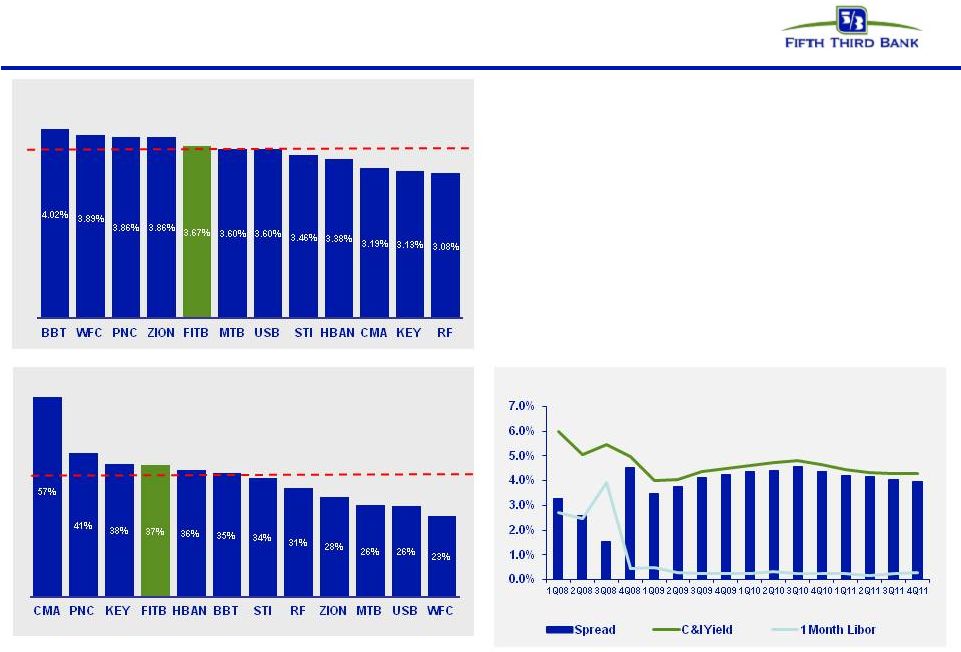 20 © Fifth Third Bank | All Rights Reserved C&I/Total Loans*^ NIM • NIM supported by balance sheet and business mix – Heavy emphasis on traditional C&I lending, much of which is variable • Pricing discipline on commercial loans – Spreads have narrowed from post-crisis levels but remain attractive – Loan origination rates have stabilized the past several months Relatively strong NIM results due to balance sheet and business mix Source: SNL Financial and company filings. All data as of 4Q11. *ZION & BBT exclude government guaranteed loans; ZION presented as end of period data. ^Presented on an average basis; Excluding held-for-sale loans. C&I Spread to 1-month LIBOR Peer average: 34% Peer average: 3.55% |
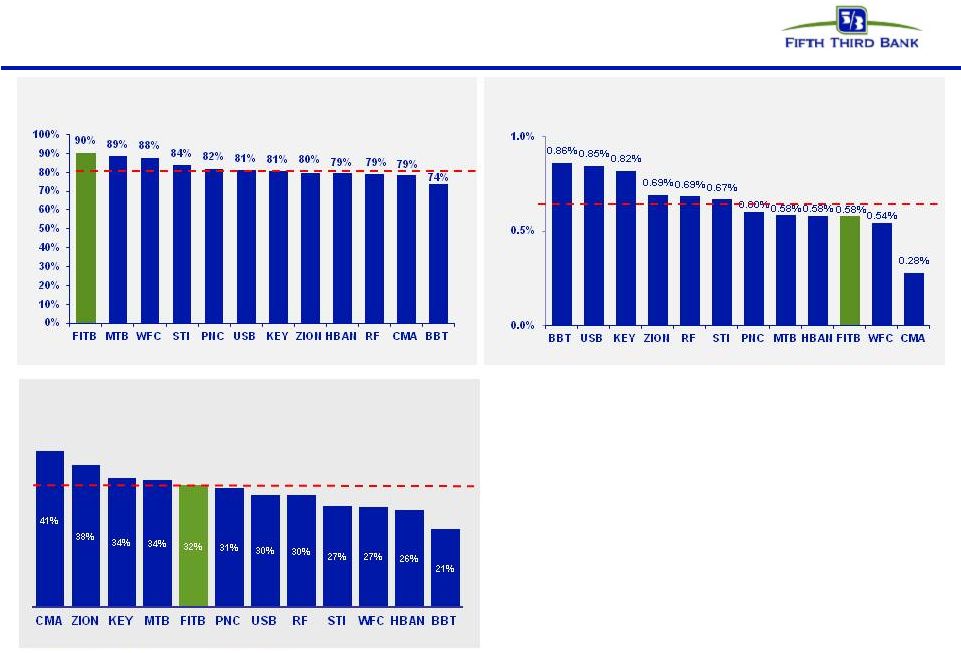 21 © Fifth Third Bank | All Rights Reserved Core funded balance sheet and pricing discipline • Strong, deposit-rich core funding mix supports relatively low cost of funds – High percentage of funding base in low cost transaction deposits and noninterest- bearing DDA accounts – Low reliance on wholesale funding • Run-off of high cost CDs (particularly from 2H08) benefited NII in 4Q11 SOURCE: SNL Financial and company reports. Data as of 4Q11 Transaction deposits defined as DDA, NOW and Savings/MMDA accounts; Cost of Funds defined as interest incurred on interest-bearing liabilities as a percentage of average noninterest-bearing deposits and interest- bearing liabilities; Transaction deposits/Total deposits presented on an average basis; DDA/Total deposits presented on end-of-period basis. Transaction Deposits / Total Deposits Peer average 81% Cost of Funds Peer average 0.65% DDA/Total Deposits Peer average 31% |
 22 © Fifth Third Bank | All Rights Reserved European Exposure z • International exposure primarily related to trade finance and financing activities of U.S. companies with foreign parent or overseas activities of U.S. customers • No European sovereign exposure (total international sovereign exposure $3mm) • Total exposure to European financial institutions <$200mm • Total exposure to five peripheral Europe countries <$200mm • $875mm in funded exposure to Eurozone-related companies (~1% of total loan portfolio) z z Note: Numbers may not sum due to rounding. Total Exposure Funded Exposure Total Exposure Funded Exposure Total Exposure Funded Exposure Total Exposure Funded Exposure (amounts in $mms) Peripheral Europe - - 2 - 136 72 138 72 Other Eurozone - - 111 53 1,106 751 1,217 804 Total Eurozone - - 113 53 1,242 823 1,355 875 Other Europe - - 60 31 801 501 862 532 Total Europe - - 173 84 2,043 1,324 2,216 1,407 Sovereigns Financial Institutions Non-Financial Entities Total Total exposure includes funded and unfunded commitments, net of collateral; funded exposure excludes unfunded exposure Peripheral Europe includes Greece, Ireland, Italy, Portugal and Spain Eurozone includes countries participating in the European common currency (Euro) Other Europe includes European countries not part of the Euro (primarily the United Kingdom and Switzerland) Data above includes exposure to U.S. subsidiaries of Europe-domiciled companies |
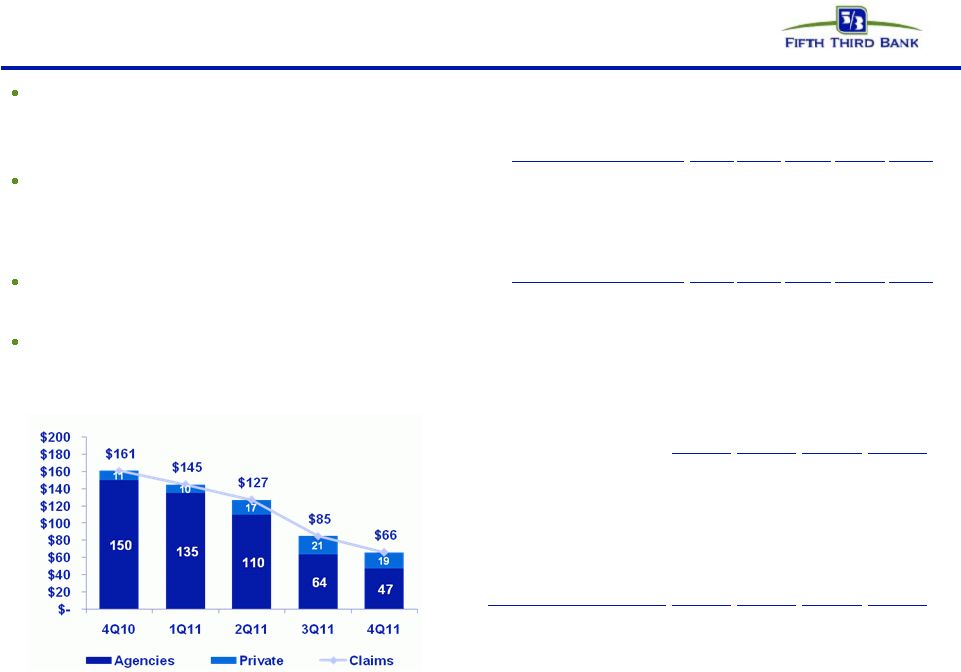 23 © Fifth Third Bank | All Rights Reserved Mortgage repurchase overview 22% drop in 4Q11 outstanding claims balance from prior quarter — Increase in file requests by GSEs on current (performing) loans Virtually all sold loans and the majority of new claims relate to agencies — 98% of outstanding balance of loans sold — 71% of current quarter outstanding claims Majority of outstanding balances of the serviced for others portfolio relates to origination activity in 2009 and later Private claims and exposure relate to whole loan sales (no outstanding first mortgage securitizations) — Preponderance of private sales prior to 2006 Repurchase Reserves* ($ in millions) Outstanding Balance of Sold Loans ($ in millions) 4Q10 1Q11 2Q11 3Q11 4Q11 Beginning balance 103 101 87 80 69 Net reserve additions 21 10 15 20 20 Repurchase losses (23) (23) (22) (31) (17) Ending balance 101 88 80 69 72 2005 and prior GSE GNMA Private Total $7,214 $287 $530 $8,030 2006 1,668 59 263 1,990 2007 2,697 88 228 3,014 2008 2,664 680 0.3 3,344 2009 and later 31,714 9,040 1 40,755 Total $45,957 $10,154 $1,022 $57,133 * Includes reps and warranty reserve ($55mm) and reserve for loans sold with recourse ($17mm) Outstanding Counterparty Claims ($ in millions) % Current 25% 40% 42% 49% 42% |
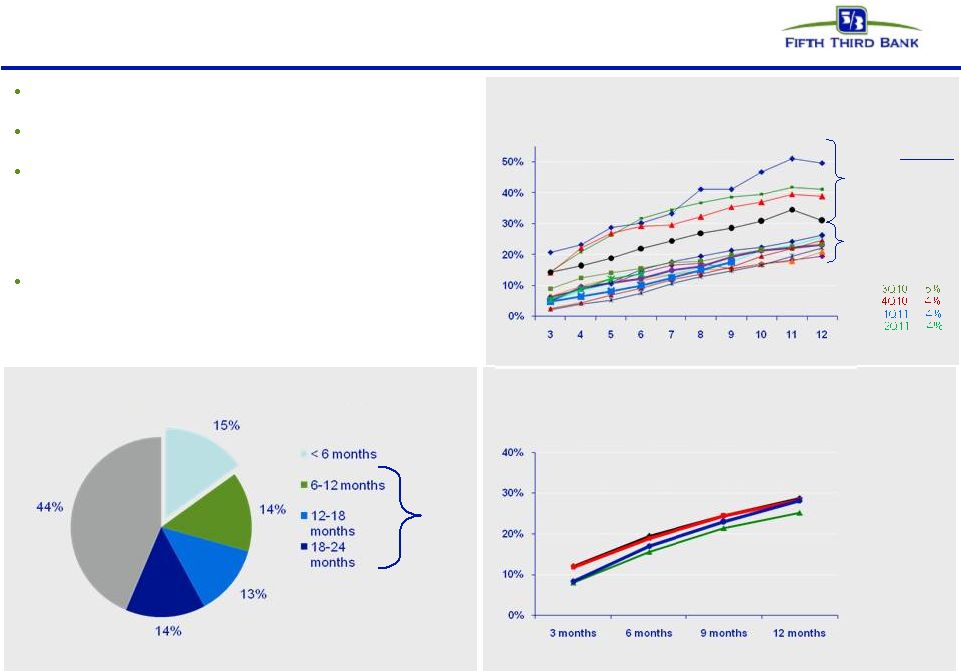 24 © Fifth Third Bank | All Rights Reserved Troubled debt restructurings overview Successive improvement in vintage performance during 2008 and 2009 as volume of modification increased Fifth Third’s mortgage portfolio TDRs have redefaulted at a lower rate than GSE composites Of $1.8B in consumer TDRs, $1.6B were on accrual status and $220mm were nonaccruals — $1.1B of TDRs are current and have been on the books 6 or more months; within that, nearly $940mm of TDRs are current and have been on the books for more than a year As current TDRs season, their default propensity declines significantly — We see much lower defaults on current loans after a vintage approaches 12 months since modification TDR performance has improved in newer vintages Source: Fifth Third and OCC/OTS data through 2Q11 $1.3B current consumer TDRs (%) * Fifth Third data includes changes made to align with OCC/OTS methodology (i.e. excludes government loans, closed loans and OREO from calculations) Outperforming redefault benchmarks Mortgage TDR 60+ redefault trend by vintage* 1Q08 3% 2Q08 7% 3Q08 7% 4Q08 8% 1Q09 11% 2Q09 12% Months since modification Mortgage TDR 60+ redefault rate: Fifth Third comparison (January 1, 2008 through September 2011)* Fannie Mae Industry portfolio loans Fifth Third Volume by vintage Freddie Mac 3Q09 12% 4Q09 7% 2008 2009- 2011 1Q10 7% 2Q10 5% $1.1 billion |
 25 © Fifth Third Bank | All Rights Reserved NPL HFI Rollforward Commercial 4Q10 1Q11 2Q11 3Q11 4Q11 Beginning NPL Amount 1,261 1,214 1,211 1,253 1,155 Transfers to nonperforming 269 329 340 217 190 Transfers to performing (2) (2) (10) (11) - Transfers to performing (restructured) - - - (1) - Transfers from held for sale - - - - 4 Transfers to held for sale - (16) (15) (58) (3) Loans sold from portfolio (9) (12) (7) (17) (21) Loan paydowns/payoffs (111) (108) (91) (77) (150) Transfer to other real estate owned (48) (37) (39) (20) (14) Charge-offs (170) (164) (141) (136) (113) Draws/other extensions of credit 24 7 5 5 10 Ending Commercial NPL 1,214 1,211 1,253 1,155 1,058 Consumer 4Q10 1Q11 2Q11 3Q11 4Q11 Beginning NPL Amount 323 466 434 386 383 Transfers to nonperforming 365 232 214 201 206 Transfers to performing (36) (35) (34) (33) (28) Transfers to performing (restructured) (25) (50) (41) (39) (39) Transfers to held for sale - - - - - Loans sold from portfolio - (1) (21) - - Loan paydowns/payoffs (17) (18) (27) (27) (26) Transfer to other real estate owned (20) (18) (15) (16) (30) Charge-offs (130) (144) (126) (91) (87) Draws/other extensions of credit 4 2 2 2 1 Ending Consumer NPL 466 434 386 383 380 Total NPL 1,680 1,645 1,639 1,538 1,438 Total new nonaccrual loans - HFI 634 561 554 418 396 NPL Rollforward Significant improvement in NPL inflows over past year |
 26 © Fifth Third Bank | All Rights Reserved Regulation G Non-GAAP reconciliation $ in millions For the Three Months Ended (unaudited) December September June March December September June March December 2011 2011 2011 2011 2010 2010 2010 2010 2009 Pre-tax Pre-provision Net Revenue: Income before income taxes (a) $ 418 $ 530 $ 506 $ 377 $ 417 $ 303 $ 242 $ (22) $ (214) Provision expense (b) 55 87 113 168 166 457 325 590 776 Pre-tax, pre-provision net revenue (PPNR) (a) + (b) 473 617 619 545 583 760 567 568 562 Annualized PPNR (c) 1,877 2,448 2,483 2,210 2,313 3,015 2,274 2,304 2,230 Adjustments remove (benefit) / detriment From noninterest income: Securities (gains) / losses (5) (26) (6) (8) (21) (4) (8) (14) (2) Gain on BOLI settlement - - - - - (127) - - - Valuation of 2009 Visa total return swap 54 17 4 9 5 - - 9 - Vantiv, LLC warrants & puts (10) (3) (29) 2 (3) 5 (10) 2 (20) Adjustments to noninterest income (l) 39 (12) (31) 3 (19) (126) (18) (3) (22) From noninterest expense: Termination of certain borrowings & hedging transactions - 28 - - - - - - - Other litigation reserve expense 14 4 - 1 - - 3 4 22 Extinguishment (gains) / losses - - (6) (3) 17 - - - - Adjustments to noninterest expense (m) 14 32 (6) (2) 17 - 3 4 22 Adjusted PPNR (k) 526 637 582 546 581 634 552 569 562 Annualized Adjusted PPNR (d) 2,087 2,527 2,334 2,214 2,305 2,515 2,214 2,308 2,230 Credit-related items in noninterest income Gain / (loss) on sale of loans 9 3 8 17 21 (1) 25 8 8 Commercial loans HFS FV adjustment (18) (6) (9) (16) (35) (9) (9) (17) (30) Gain / (loss) on sale of OREO properties (22) (21) (26) (2) (19) (29) (16) (21) (22) Mortgage repurchase costs (1) (2) (0) (2) (1) (4) - (2) - Total credit-related revenue impact (i) 33 25 28 3 34 44 1 31 45 Credit-related items in noninterest expense Mortgage repurchase expense 18 19 14 8 20 45 39 17 11 Provision for unfunded commitments (6) (10) (14) (16) (4) (23) 9 11 44 Derivative valuation adjustments (5) 4 1 (0) (1) 8 8 (2) 21 OREO expense 8 7 6 13 11 9 6 9 6 Other problem asset related expenses 28 25 30 28 27 28 29 37 29 Total credit-related operating expenses (j) 44 45 36 32 53 67 91 73 111 Credit-adjusted PPNR (k) + (i) + (j) 603 707 646 581 668 745 643 673 717 PPNR excluding credit costs (a) + (b) + (i) + (j) 550 687 683 580 670 871 658 672 717 Financial & Asset Quality Metrics: Net charge-offs $ 239 $ 262 $ 304 $ 367 $ 356 $ 956 $ 434 $ 582 $ 708 Annualized net charge-offs (f) 948 1,039 1,219 1,488 1,412 3,793 1,741 2,360 2,809 Net interest income (FTE) (n) 920 902 869 884 919 916 887 901 882 Noninterest income (o) 550 665 656 584 656 827 620 627 651 Noninterest expense (p) 993 946 901 918 987 979 935 956 967 Adjusted noninterest expense (p) - (m) 979 914 907 920 970 979 932 952 945 Ratios: PPNR / NCO (c) / (f) 198% 235% 204% 149% 164% 79% 131% 98% 79% Efficiency ratio (p) / ((n) + (o)) 68% 60% 59% 63% 63% 56% 62% 63% 63% Adjusted PPNR / NCO (d) / (f) 220% 243% 191% 149% 163% 66% 127% 98% 79% Adjusted efficiency ratio ((p) - (m)) / ((n) + (o) + (l)) 65% 59% 61% 63% 62% 61% 63% 62% 63% FY2011 Adjusted efficiency ratio ((p) - (m)) / ((n) + (o) + (l)) 62% |
 27 © Fifth Third Bank | All Rights Reserved Regulation G Non-GAAP reconciliation $ and shares in millions (unaudited) For the Three Months Ended December September June March December 2011 2011 2011 2010 2010 Income before income taxes (U.S. GAAP) 418 530 506 377 417 Add: Provision expense (U.S. GAAP) 55 87 113 168 166 Pre-provision net revenue (a) 473 617 619 545 583 Net income available to common shareholders (U.S. GAAP) 305 373 328 88 270 Add: Intangible amortization, net of tax 3 3 4 5 7 Tangible net income available to common shareholders 308 376 332 93 277 Tangible net income available to common shareholders (annualized) (b) 1,222 1,492 1,332 377 1,099 Average Bancorp shareholders' equity (U.S. GAAP) 13,147 12,841 12,365 13,052 14,007 Less: Average preferred stock 398 398 398 1,557 3,648 Average goodwill 2,417 2,417 2,417 2,417 2,417 Average intangible assets 42 47 52 59 67 Average tangible common equity (c) 10,920 9,979 9,498 9,019 7,875 Total Bancorp shareholders' equity (U.S. GAAP) 13,201 13,029 12,572 12,163 14,051 Less: Preferred stock (398) (398) (398) (398) (3,654) Goodwill (2,417) (2,417) (2,417) (2,417) (2,417) Intangible assets (40) (45) (49) (55) (62) Tangible common equity, including unrealized gains / losses (d) 10,346 10,169 9,708 9,293 7,918 Less: Accumulated other comprehensive income / loss (470) (542) (396) (263) (314) Tangible common equity, excluding unrealized gains / losses (e) 9,876 9,627 9,312 9,030 7,604 Total assets (U.S. GAAP) 116,967 114,905 110,805 110,485 111,007 Less: Goodwill (2,417) (2,417) (2,417) (2,417) (2,417) Intangible assets (40) (45) (49) (55) (62) Tangible assets, including unrealized gains / losses (f) 114,510 112,443 108,339 108,013 108,528 Less: Accumulated other comprehensive income / loss, before tax (723) (834) (609) (405) (483) Tangible assets, excluding unrealized gains / losses (g) 113,787 111,609 107,730 107,608 108,045 Common shares outstanding (h) 920 920 920 919 796 Net charge-offs (i) 239 262 304 367 356 Ratios: Return on average tangible common equity (b) / (c) 11.88% 14.95% 14.02% 4.18% 13.95% Tangible common equity (excluding unrealized gains/losses) (e) / (g) 8.68% 8.63% 8.64% 8.39% 7.04% Tangible common equity (including unrealized gains/losses) (d) / (f) 9.04% 9.04% 8.96% 8.60% 7.30% Tangible book value per share (d) / (h) 11.25 11.05 10.55 10.11 9.94 Pre-provision net revenue / net charge-offs (a) / (i) 198% 235% 204% 149% 164% |
 28 © Fifth Third Bank | All Rights Reserved Regulation G Non-GAAP reconciliation $ and shares in millions (unaudited) December September June March December 2011 2011 2011 2011 2010 Total Bancorp shareholders' equity (U.S. GAAP) 13,201 13,029 12,572 12,163 14,051 Goodwill and certain other intangibles (2,514) (2,514) (2,536) (2,546) (2,546) Unrealized gains (470) (542) (396) (263) (314) Qualifying trust preferred securities 2,248 2,273 2,312 2,763 2,763 Other 38 20 20 12 11 Tier I capital 12,503 12,266 11,972 12,129 13,965 Less: Preferred stock (398) (398) (398) (398) (3,654) Qualifying trust preferred securities (2,248) (2,273) (2,312) (2,763) (2,763) Qualifying noncontrolling interest in consolidated subsidiaries (50) (30) (30) (30) (30) Tier I common equity (a) 9,807 9,565 9,232 8,938 7,518 Unrealized gains 470 542 Disallowed deferred tax assets - - Disallowed MSRs 70 64 Other 12 10 Less: 10% of individual deferred tax assets, MSRs, investment in financial entities - - 15% of aggregate deferred tax assets, MSRs, investment in financial entities - - Tier 1 common equity, Basel III proforma (b) 10,359 10,181 Risk-weighted assets, determined in accordance with prescribed regulatory requirements (c) 104,945 102,560 100,320 99,392 100,561 Regulatory deductions not deducted from Tier 1 common equity, risk-weighted at 250% 1,453 1,377 Risk-weighted assets, Basel III proforma (d) 106,398 103,937 Ratios: Tier I common equity (a) / (c) 9.35% 9.33% 9.20% 8.99% 7.48% Tier I common equity, Basel III proforma (b) / (d) 9.7% 9.8% For the Three Months Ended Add: |