 Fifth Third Bank | All Rights Reserved Annual Meeting of Shareholders April 17, 2012 Please refer to earnings release dated January 20, 2012 and 10-K dated February 29, 2012 for further information, including full results reported on a U.S. GAAP basis Exhibit 99.1 |
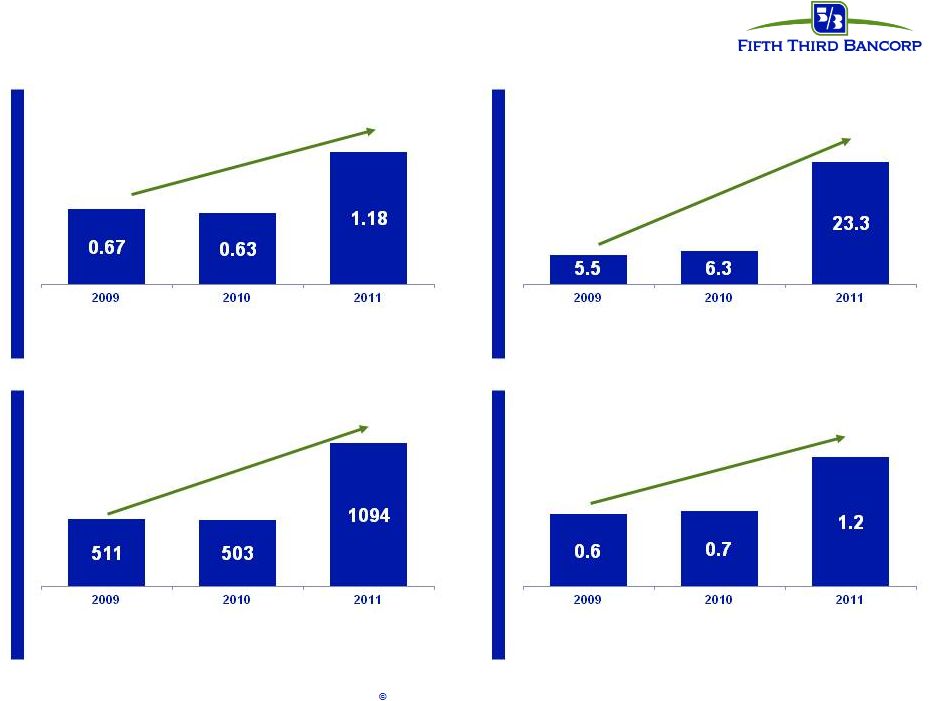 2011: A year of strong performance Dividend payout ratio (%) Diluted earnings per share ($) Return on assets (%) Net income to common ($) Earnings per share nearly doubled compared with 2010 Increased quarterly dividend twice during 2011 resulting in $0.32 annualized dividend Net income available to common shareholders more than doubled compared with 2010 ROA of 1.2% increased nearly 50 bps compared with 2010 2 Fifth Third Bank | All Rights Reserved |
 3 Fifth Third Bank | All Rights Reserved The environment is improving… but remains challenging Gross Domestic Product Employment Rate Environment Real Estate Unemployment has declined, but still remains elevated vs. pre-crisis levels GDP has grown consistently but sluggishly since 4Q08 Home prices have stabilized, but new construction continues to lag Prolonged low rate environment reduces value of bank deposits and lowers asset yields |
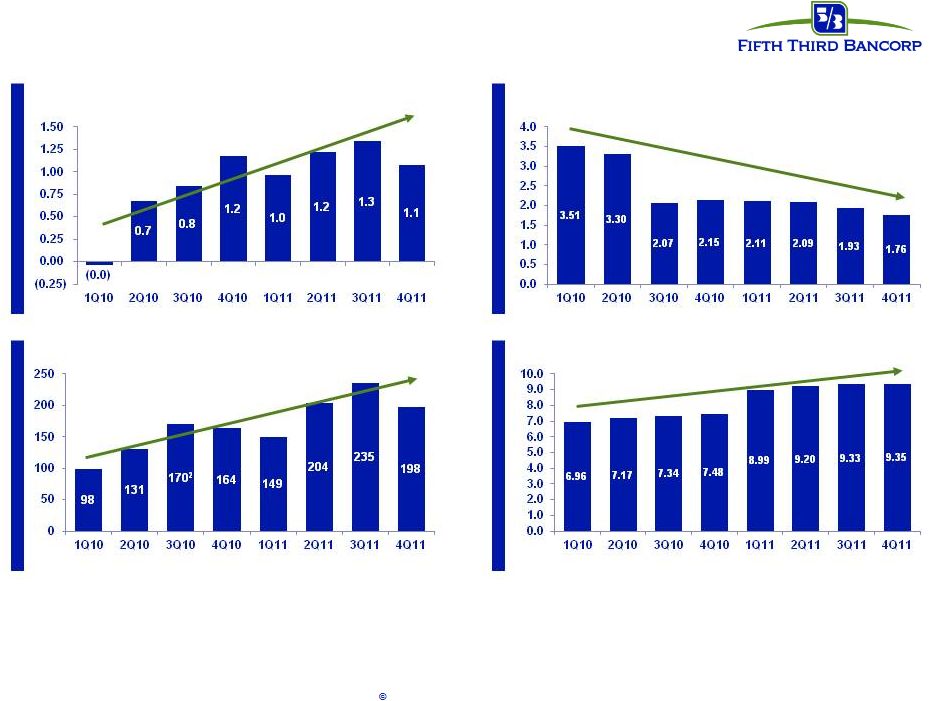 4 Fifth Third Bank | All Rights Reserved We relentlessly pursue positive outcomes 1 Nonperforming loans and leases as a percent of portfolio loans, leases and other assets, including other real estate owned (does not include nonaccrual loans held-for- sale) 2 Excluding $510mm net charge-offs attributable to credit actions * Non-GAAP measure. See Reg. G reconciliation in the Appendix to the presentation Tier 1 common ratio (%)* Return on assets (%) PPNR / Net charge-offs (%)* NPLs / Loans 1 (%) 2011 was most profitable year since 2006 |
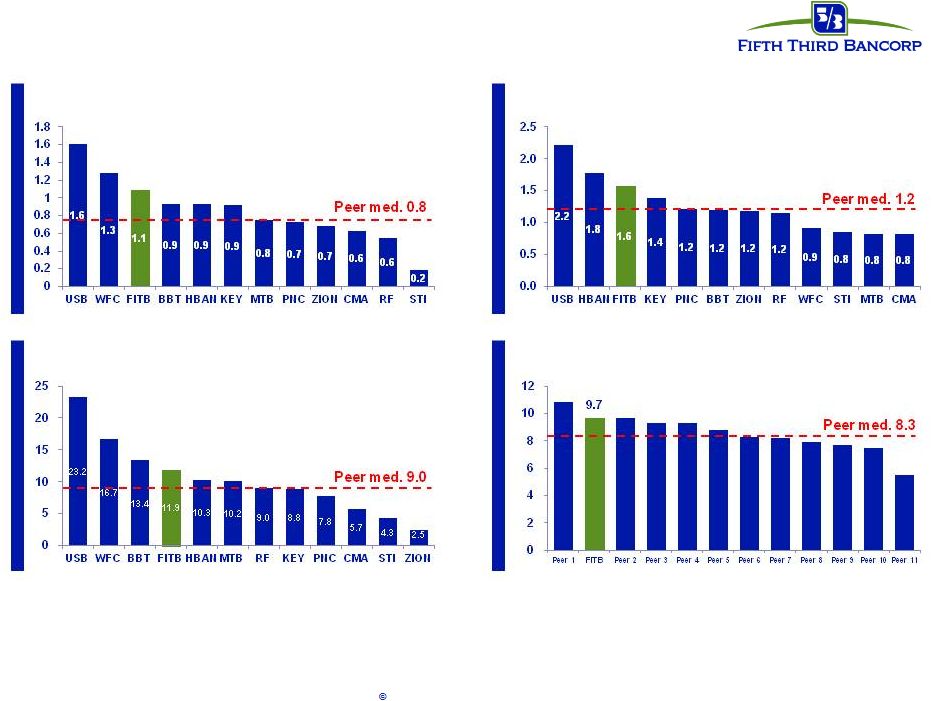 5 Fifth Third Bank | All Rights Reserved We aim to set ourselves apart 4Q11 Tier 1 common (%)* (adjusted for Basel III^) 4Q11 Return on assets (%) 4Q11 Reserves / NPLs (%) 4Q11 Return on tangible common equity (%)* Industry leader in earnings power Source: SNL Financial and Company Reports. * Non-GAAP measure. See Reg. G reconciliation in the Appendix to the presentation ^ Estimates based on current Basel III rules released by the Basel Committee; actual rules subject to U.S. banking regulation. Assumes unrealized securities gains included in Tier 1 common. Not adjusted for potential mitigation efforts. |
 6 Fifth Third Bank | All Rights Reserved We are focused on effective capital management * Subject to Board of Directors and regulatory approval ** Comprehensive Capital Analysis & Review by Federal Reserve Organic growth opportunities • Support growth of core banking franchise • Continued loan growth despite sluggish economy Strategic opportunities * • Prudently expand franchise or increase density in core markets via disciplined acquisitions or selective de novos • Expect future acquisition activity although less likely in near-term • Attain top 3 market position in 65% of markets or more longer term Return to more normal dividend policy * • Strong levels of profitability would support higher dividend than current level • Move towards levels more consistent with Fed’s near-term payout ratio guidance of 30% Repurchases / Redemptions * Recommendations for increased shareholder distributions upon Federal Reserve approval of capital plan** Capital Deployment Capital Return Manage common equity in light of regulatory environment, other alternatives, maintenance of desired / required buffers, and stock price Initiate common share repurchases to manage growing excess capital levels; retain amount of common equity to accommodate asset growth |
 7 Fifth Third Bank | All Rights Reserved We are positioned well for industry changes No significant changes to business model or asset mix Traditional banking activities, consistent with direction of financial reform No direct European sovereign exposure; very modest exposures overall Little to no impact Mortgage risks are manageable No significant business at Fifth Third impaired during crisis Dodd-Frank Act / Basel III Volcker rule Effect of crisis on core business Mortgage Putback / Litigation risk Financial system interconnectedness European crisis |
 8 Fifth Third Bank | All Rights Reserved You don’t get to new ideas by using the same old ideas. |
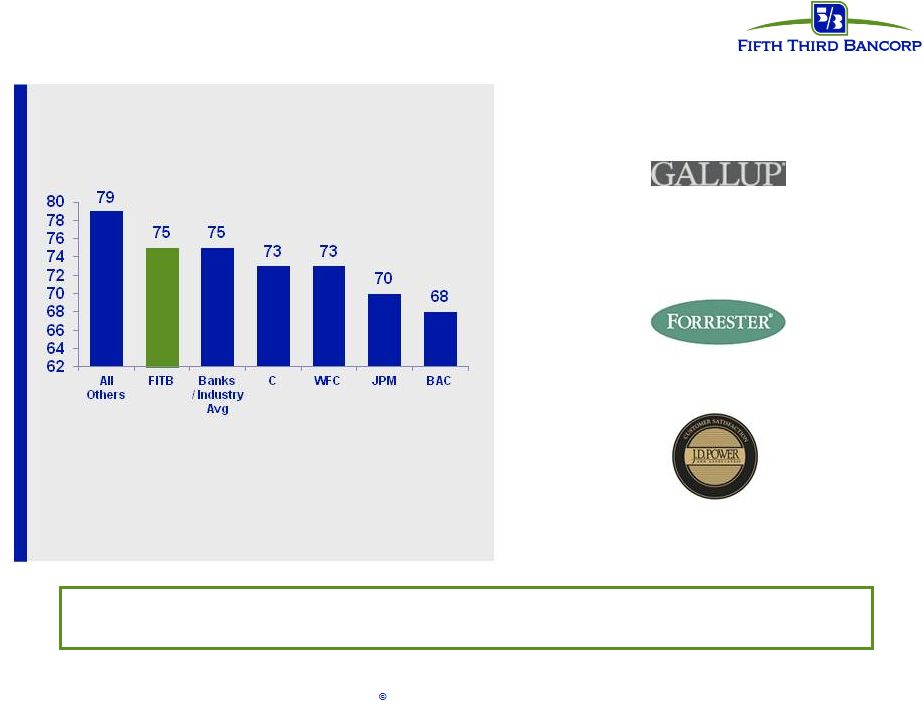 9 Fifth Third Bank | All Rights Reserved We are focused on the customer experience Fifth Third Bank engaged the American Customer Satisfaction Index (ACSI) in custom research projects surveying Fifth Third Bank customers in the 3 quarter of 2011. In the surveys, ACSI used the same statistical methodology as the independently measured banks, Bank of America, J.P. Morgan Chase, Wells Fargo, and Citigroup. The Customer Experience Index, 2012”, Forrester Research, Inc., January 23, 2012 Consistently achieving leading customer satisfaction scores through focus on providing valuable products and services at fair prices Fifth Third outscored the bank industry average Fifth Third recipient of “Great Workplace Award” (March 2011) Fifth Third improved consistently over last 4 years Third-Party Recognition Fifth Third’s score was in line with the ACSI Banks industry average (Bank of America, Citi, Wells Fargo, J.P. Morgan Chase and an aggregate of smaller banks) 2011 ACSI Scores Customer Satisfaction Scores rd |
 10 Fifth Third Bank | All Rights Reserved Well-positioned for success and leadership in new banking landscape Resilient business model provides strength Strong levels of profitability Broad-based credit improvements Exceed fully phased-in Basel III capital standards today All crisis-era government support programs exited; no TLGP No significant business at Fifth Third impaired by crisis Continued investments to maintain and enhance revenue- generation Disciplined expense control Traditional banking focus consistent with direction of financial reform |
 Fifth Third Bank | All Rights Reserved |
 12 Fifth Third Bank | All Rights Reserved Cautionary statement This report contains statements that we believe are “forward-looking statements” within the meaning of Section 27A of the Securities Act of 1933, as amended, and Rule 175 promulgated thereunder, and Section 21E of the Securities Exchange Act of 1934, as amended, and Rule 3b-6 promulgated thereunder. These statements relate to our financial condition, results of operations, plans, objectives, future performance or business. They usually can be identified by the use of forward-looking language such as “will likely result,” “may,” “are expected to,” “is anticipated,” “estimate,” “forecast,” “projected,” “intends to,” or may include other similar words or phrases such as “believes,” “plans,” “trend,” “objective,” “continue,” “remain,” or similar expressions, or future or conditional verbs such as “will,” “would,” “should,” “could,” “might,” “can,” or similar verbs. You should not place undue reliance on these statements, as they are subject to risks and uncertainties, including but not limited to the risk factors set forth in our most recent Annual Report on Form 10-K. When considering these forward-looking statements, you should keep in mind these risks and uncertainties, as well as any cautionary statements we may make. Moreover, you should treat these statements as speaking only as of the date they are made and based only on information then actually known to us. There are a number of important factors that could cause future results to differ materially from historical performance and these forward-looking statements. Factors that might cause such a difference include, but are not limited to: (1) general economic conditions and weakening in the economy, specifically the real estate market, either nationally or in the states in which Fifth Third, one or more acquired entities and/or the combined company do business, are less favorable than expected; (2) deteriorating credit quality; (3) political developments, wars or other hostilities may disrupt or increase volatility in securities markets or other economic conditions; (4) changes in the interest rate environment reduce interest margins; (5) prepayment speeds, loan origination and sale volumes, charge-offs and loan loss provisions; (6) Fifth Third’s ability to maintain required capital levels and adequate sources of funding and liquidity; (7) maintaining capital requirements may limit Fifth Third’s operations and potential growth; (8) changes and trends in capital markets; (9) problems encountered by larger or similar financial institutions may adversely affect the banking industry and/or Fifth Third; (10) competitive pressures among depository institutions increase significantly; (11) effects of critical accounting policies and judgments; (12) changes in accounting policies or procedures as may be required by the Financial Accounting Standards Board (“FASB”) or other regulatory agencies; (13) legislative or regulatory changes or actions, or significant litigation, adversely affect Fifth Third, one or more acquired entities and/or the combined company or the businesses in which Fifth Third, one or more acquired entities and/or the combined company are engaged, including the Dodd-Frank Wall Street Reform and Consumer Protection Act (“Dodd-Frank Act”); (14) ability to maintain favorable ratings from rating agencies; (15) fluctuation of Fifth Third’s stock price; (16) ability to attract and retain key personnel; (17) ability to receive dividends from its subsidiaries; (18) potentially dilutive effect of future acquisitions on current shareholders’ ownership of Fifth Third; (19) effects of accounting or financial results of one or more acquired entities; (20) difficulties from the separation of Vantiv Holding, LLC, formerly Fifth Third Processing Solutions, LLC, from Fifth Third; (21) loss of income from any sale or potential sale of businesses that could have an adverse effect on Fifth Third’s earnings and future growth; (22) ability to secure confidential information through the use of computer systems and telecommunications networks; and (23) the impact of reputational risk created by these developments on such matters as business generation and retention, funding and liquidity. You should refer to our periodic and current reports filed with the Securities and Exchange Commission, or “SEC,” for further information on other factors, which could cause actual results to be significantly different from those expressed or implied by these forward-looking statements. |
 13 Fifth Third Bank | All Rights Reserved Appendix |
 Fifth Third Bank | All Rights Reserved Regulation G Non-GAAP reconciliation $ in millions (unaudited) For the Three Months Ended December September June March December September June March 2011 2011 2011 2011 2010 2010 2010 2010 Income before income taxes (U.S. GAAP) 418 530 506 377 417 303 242 (22) Add: Provision expense (U.S. GAAP) 55 87 113 168 166 457 325 590 Pre-provision net revenue (a) 473 617 619 545 583 760 567 568 Net charge-offs (b) 239 262 304 367 356 446 434 582 Ratios: Pre-provision net revenue / net charge-offs (a) / (b) 198% 235% 204% 149% 164% 170% 131% 98% Note: 3Q10 net-charge offs exclude $510mm net charge-offs attributable to credit actions. Including these actions, 3Q10 net charge-offs were $956mm and pre-provision net revenue / net charge-offs was 79%. 14 |
 15 Fifth Third Bank | All Rights Reserved Regulation G Non-GAAP reconciliation $ in millions (unaudited) December 2011 Net income available to common shareholders (U.S. GAAP) 305 Add: Intangible amortization, net of tax 3 Tangible net income available to common shareholders 308 Tangible net income available to common shareholders (annualized) (a) 1,222 Average Bancorp shareholders' equity (U.S. GAAP) 13,147 Less: Average preferred stock 398 Average goodwill 2,417 Average intangible assets 42 Average tangible common equity (b) 10,290 Ratios: Return on average tangible common equity (a) / (b) 11.9% |
 16 Fifth Third Bank | All Rights Reserved Regulation G Non-GAAP reconciliation $ in millions (unaudited) For the Three Months Ended December September June March December September June March 2011 2011 2011 2011 2010 2010 2010 2010 Total Bancorp shareholders' equity (U.S. GAAP) 13,201 13,029 12,572 12,163 14,051 13,884 13,701 13,408 Goodwill and certain other intangibles (2,514) (2,514) (2,536) (2,546) (2,546) (2,525) (2,537) (2,556) Unrealized gains (470) (542) (396) (263) (314) (432) (440) (288) Qualifying trust preferred securities 2,248 2,273 2,312 2,763 2,763 2,763 2,763 2,763 Other 38 20 20 12 11 8 (25) (30) Tier I capital 12,503 12,266 11,972 12,129 13,965 13,698 13,462 13,297 Less: Preferred stock (398) (398) (398) (398) (3,654) (3,642) (3,631) (3,620) Qualifying trust preferred securities (2,248) (2,273) (2,312) (2,763) (2,763) (2,763) (2,763) (2,763) Qualifying noncontrolling interest in consolidated subsidiaries (50) (30) (30) (30) (30) (30) - - Tier I common equity (a) 9,807 9,565 9,232 8,938 7,518 7,263 7,068 6,914 Unrealized gains 470 Disallowed deferred tax assets - Disallowed MSRs 70 Other 12 Less: 10% of individual deferred tax assets, MSRs, investment in financial entities - 15% of aggregate deferred tax assets, MSRs, investment in financial entities - Tier 1 common equity, Basel III proforma (b) 10,359 Risk-weighted assets, determined in accordance with prescribed regulatory requirements (c) 104,945 102,562 100,320 99,392 100,561 98,904 98,604 99,281 Add: Regulatory deductions not deducted from Tier 1 common equity, risk-weighted at 250% 1,453 Risk-weighted assets, Basel III proforma (d) 106,398 Ratios: Tier I common equity (a) / (c) 9.35% 9.33% 9.20% 8.99% 7.48% 7.34% 7.17% 6.96% Tier I common equity, Basel III proforma (b) / (d) 9.7% |