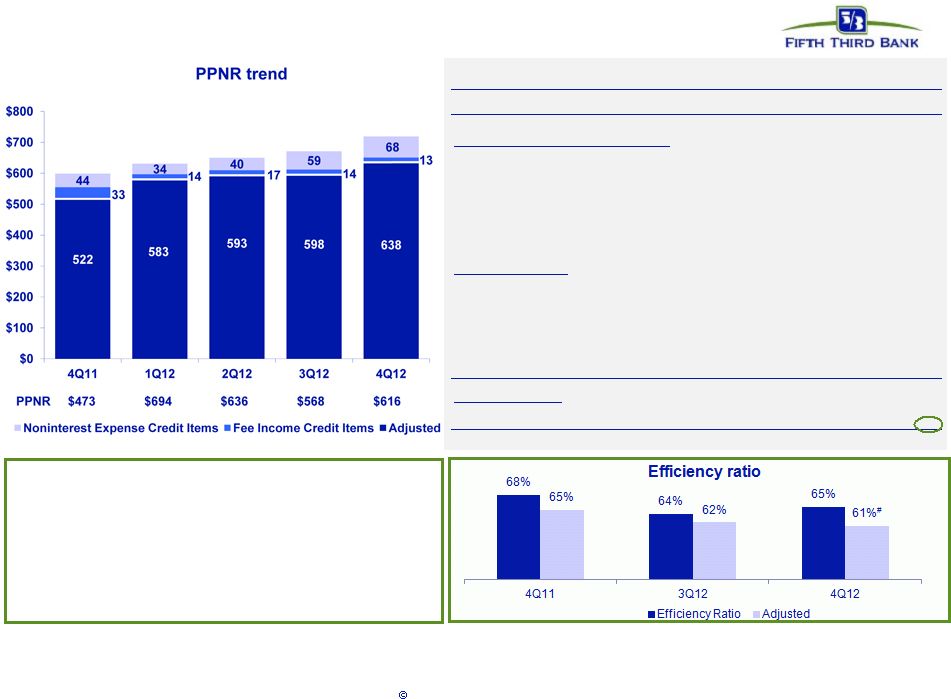
20 Fifth Third Bank | All Rights Reserved Regulation G Non-GAAP reconciliation Fifth Third Bancorp and Subsidiaries Regulation G Non-GAAP Reconcilation $ and shares in millions (unaudited) December September June March December 2012 2012 2012 2012 2011 Income before income taxes (U.S. GAAP) $540 $503 $565 $603 $418 Add: Provision expense (U.S. GAAP) 76 65 71 91 55 Pre-provision net revenue (a) 616 568 636 694 473 Net income available to common shareholders (U.S. GAAP) 390 354 376 421 305 Add: Intangible amortization, net of tax 2 2 2 3 3 Tangible net income available to common shareholders 392 356 378 424 308 Tangible net income available to common shareholders (annualized) (b) 1,559 1,416 1,520 1,705 1,222 Average Bancorp shareholders' equity (U.S. GAAP) 13,855 13,887 13,628 13,366 13,147 Less: Average preferred stock (398) (398) (398) (398) (398) Average goodwill (2,417) (2,417) (2,417) (2,417) (2,417) Average intangible assets (28) (31) (34) (38) (42) Average tangible common equity (c) 11,012 11,041 10,779 10,513 10,290 Total Bancorp shareholders' equity (U.S. GAAP) 13,716 13,718 13,773 13,560 13,201 Less: Preferred stock (398) (398) (398) (398) (398) Goodwill (2,416) (2,417) (2,417) (2,417) (2,417) Intangible assets (27) (30) (33) (36) (40) Tangible common equity, including unrealized gains / losses (d) 10,875 10,873 10,925 10,709 10,346 Less: Accumulated other comprehensive income / loss (375) (468) (454) (468) (470) Tangible common equity, excluding unrealized gains / losses (e) 10,500 10,405 10,471 10,241 9,876 Total assets (U.S. GAAP) 121,894 117,483 117,543 116,747 116,967 Less: Goodwill (2,416) (2,417) (2,417) (2,417) (2,417) Intangible assets (27) (30) (33) (36) (40) Tangible assets, including unrealized gains / losses (f) 119,451 115,036 115,093 114,294 114,510 Less: Accumulated other comprehensive income / loss, before tax (577) (720) (698) (720) (723) Tangible assets, excluding unrealized gains / losses (g) 118,874 114,316 114,395 113,574 113,787 Common shares outstanding (h) 882 897 919 920 920 Net charge-offs (i) 147 156 181 220 239 Ratios: Return on average tangible common equity (b) / (c) 14.2% 12.8% 14.1% 16.2% 11.9% Tangible common equity (excluding unrealized gains/losses) (e) / (g) 8.83% 9.10% 9.15% 9.02% 8.68% Tangible common equity (including unrealized gains/losses) (d) / (f) 9.10% 9.45% 9.49% 9.37% 9.04% Tangible book value per share (d) / (h) 12.33 12.12 11.89 11.64 11.25 Pre-provision net revenue / net charge-offs (a) / (i) 419% 364% 351% 315% 198% For the Three Months Ended |