 © Fifth Third Bank | All Rights Reserved Deutsche Bank Financial Services Investor Conference Tayfun Tuzun Executive Vice President & Chief Financial Officer May 28, 2014 Please refer to earnings release dated April 17, 2014 and 10-Q dated May 8, 2014 for further information Exhibit 99.1 |
 2 © Fifth Third Bank | All Rights Reserved Strong core businesses driving results Wholesale bank Consumer lending Branch banking • Specialized industry verticals, treasury management, and capital markets driving loan growth and corporate banking revenue • Transitioned from refi-focused mortgage operation to more traditional purchase/refi split • #5 bank indirect auto originator in the country¹ • Actively managing product and distribution model to address changing customer needs and operating environment • Improving efficiency while driving deposit growth and improving customer service 1 Source: Inside Mortgage Finance 2 Retail cross sell service set includes Checking, Savings, CD, Home Equity, Direct/Indirect Loan, Mortgage (incl EHR), Credit Card, Annuity, Brokerage, Insurance, Early Access, Debt Protection, ID Alert, Debit Card, Access 360, Online Bill Pay, Direct Deposit, Mobile Banking and Internet Banking. Households with Access 360 only are not included. Avg Bancorp cons deposits ($MM) Retail cross sell Corporate banking revenue ($B) Investment Advisors • Investment and retirement focus driving wealth management • Distribution model oriented to mass affluent; recurring revenue streams Investment Advisory revenue ($B) Retail brokerage revenue ($MM) Indirect auto footprint Avg Bancorp cons loans ($MM) Avg Bancorp coml loans ($MM) 40.5 45.3 FY11 FY13 4.5 5.5 FY11 FY13 350 400 FY11 FY13 375 393 FY11 FY13 117 144 FY11 FY13 FY09 FY13 36 states 45 states 36.1 38.5 FY11 FY13 44.1 50.6 FY11 FY13 2 |
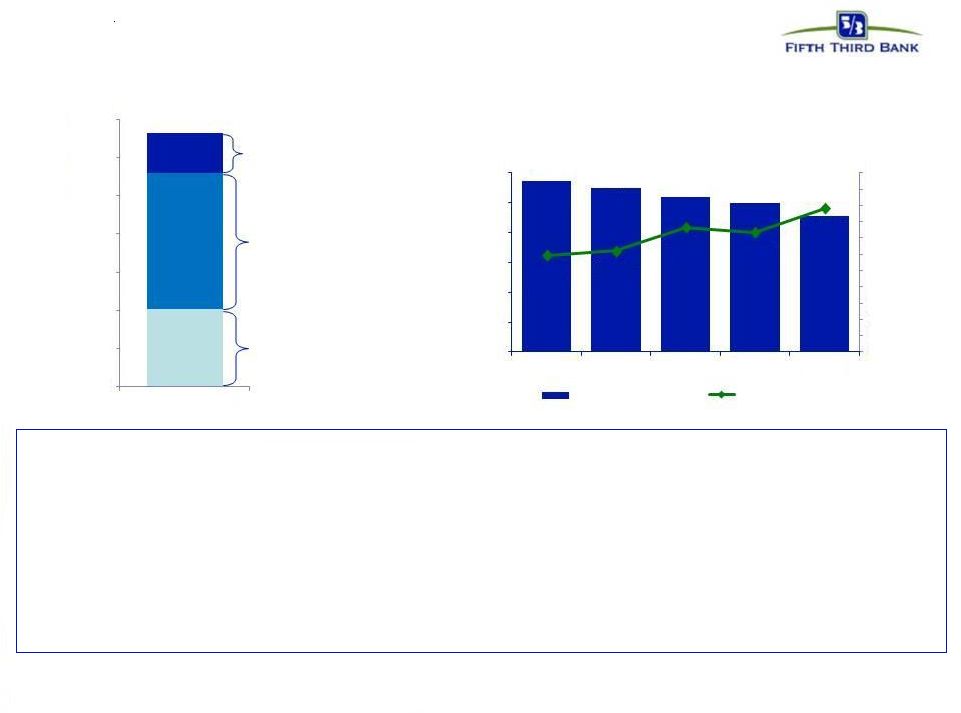
 3 © Fifth Third Bank | All Rights Reserved Repositioning consumer bank with investments and strategic changes Improving the customer experience while reducing the cost to serve Growing sales through launch of a hybrid universal banker role Consumer deposit activity Transaction volume by ATM and Mobile channels Year-over-Year Sales Production 1Q13 vs 1Q14 Universal Banker Pilot Results Total EOP Consumer Deposits ($B) excludes CDs Retail Banking Employees 15-month change (Dec. 2012 – Mar. 2014) 12% 19% 27% 0% 5% 10% 15% 20% 25% 30% March 2012 March 2013 March 2014 6% 19% 0% 5% 10% 15% 20% Non-pilot Branches Pilot Branches $43.4 $46.3 $47.6 $0 $10 $20 $30 $40 $50 1Q12 1Q13 1Q14 (10%) (19%) 6% (20%) (10%) 0% 10% Total Banking Center Staff Total Service FTE Total Sales FTE |
 4 © Fifth Third Bank | All Rights Reserved Investing in Commercial Banking to improve capabilities and diversification Middle Market Mid Corporate Specialty Groups Target customers: $5 million to $500 million revenue Target customers: $500 million to $2 billion revenue Target customers: Healthcare, Energy, International, and CRE industry specializations Investments made in sales force and service efficiency Investments made in capital markets capabilities, “lead left” strategy and sales force Investments made in sales force and specialized product development Local affiliate delivery model National Coverage Model National and Specialty Model Supported by Treasury Management and Retirement Plan Services Providing complex solutions; supported by Capital Markets Advisory, Treasury Management, and vertical expertise Also includes Structured Lending, Dealer Financing, Food and Transportation, and Leasing 3% increase in average C&I loans since 1Q12 13 sequential quarters of average loan growth Healthcare portfolio approx. $4 billion; Energy portfolio over $650 million |
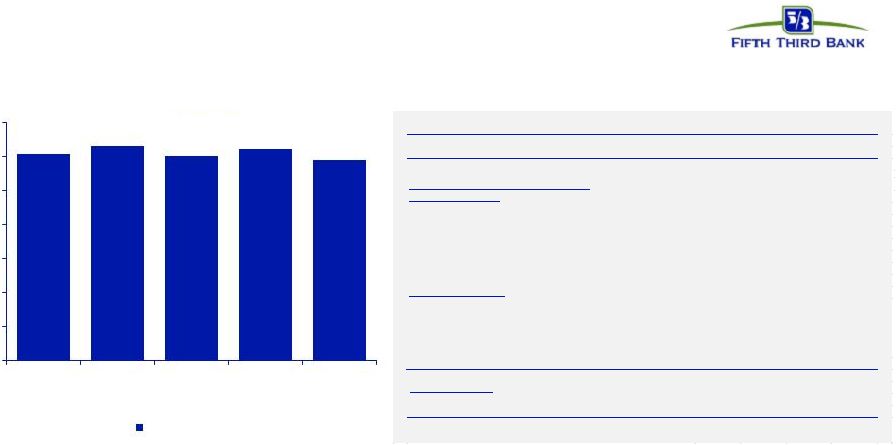
 5 © Fifth Third Bank | All Rights Reserved Commercial Banking – financial performance Total Revenue grew 13% over 2 years Capital Markets fees increased notably with entry into debt capital markets Note: Prior periods have not been restated for changes in the structure of the reporting units that occurred in 1Q14. $49.6B $45.9B $53.1B 1,357 1,432 1,487 641 737 780 - 500 1,000 1,500 2,000 2,500 2011 2012 2013 Total Revenue ($MM) Net Interest Income Noninterest Income $0 $10 $20 $30 $40 $50 $60 1Q12 1Q13 1Q14 Total Avg. Commercial Loans ($B) Middle Market Energy Healthcare Large Corporate Mid Corporate CRE Other |
 6 © Fifth Third Bank | All Rights Reserved Capital management – core focus 1 Non-GAAP measure; See Reg. G reconciliation in appendix. 2 Capital ratios presented under current U.S. capital regulations. The pro forma Basel III Tier I common equity ratio is management’s estimate based upon its current interpretation of recent prospective regulatory capital requirements approved in July 2013. $710MM common stock repurchases (net of $398MM shares issued related to Series G conversion) $407MM common dividends declared $212MM common stock repurchases utilizing AT Vantiv gains Common Shares Outstanding (MM) and Tangible Book Value per share 2014 CCAR plan designed to maintain regulatory common equity capital ratios generally at current levels $0 $200 $400 $600 $800 $1,000 $1,200 $1,400 2013 Net Payouts ($MM) 913 901 888 878 858 $12.62 $12.69 $13.09 $13.00 $13.40 650 675 700 725 750 775 800 825 850 875 900 925 $11.00 $11.50 $12.00 $12.50 $13.00 $13.50 $14.00 1Q13 2Q13 3Q13 4Q13 1Q14 Common Shares O/S TBV per share Ongoing impact of Vantiv ownership on capital management • Total gains / earnings recognized to date ~$3B • Currently own 26% interest in Vantiv Holding, LLC, convertible to Vantiv, Inc. shares (NYSE: VNTV) – Carrying (book) value of $437MM as of 3/31/14; ownership (market) value of ~$1.5B as of 3/31/14 • Ongoing equity method earnings • Warrant to purchase additional shares in Vantiv carried as a derivative asset at fair value of $348MM as of 3/31/14 • Annual payment corresponding with tax benefits accruing to Fifth Third associated with the tax receivable agreement (TRA) – Vantiv reported FITB TRA at a gross value of $551MM as of 1Q14; FITB realized $9MM in 4Q13 |
 7 © Fifth Third Bank | All Rights Reserved Investment thesis Healthy balance sheet with strong growth potential Balanced capital management supporting growth and shareholder returns Strategic investments in key businesses providing momentum Long history of disciplined expense management |
 8 © Fifth Third Bank | All Rights Reserved Cautionary statement This report contains statements that we believe are “forward-looking statements” within the meaning of Section 27A of the Securities Act of 1933, as amended, and Rule 175 promulgated thereunder, and Section 21E of the Securities Exchange Act of 1934, as amended, and Rule 3b-6 promulgated thereunder. These statements relate to our financial condition, results of operations, plans, objectives, future performance or business. They usually can be identified by the use of forward-looking language such as “will likely result,” “may,” “are expected to,” “is anticipated,” “estimate,” “forecast,” “projected,” “intends to,” or may include other similar words or phrases such as “believes,” “plans,” “trend,” “objective,” “continue,” “remain,” or similar expressions, or future or conditional verbs such as “will,” “would,” “should,” “could,” “might,” “can,” or similar verbs. You should not place undue reliance on these statements, as they are subject to risks and uncertainties, including but not limited to the risk factors set forth in our most recent Annual Report on Form 10-K. When considering these forward-looking statements, you should keep in mind these risks and uncertainties, as well as any cautionary statements we may make. Moreover, you should treat these statements as speaking only as of the date they are made and based only on information then actually known to us. There are a number of important factors that could cause future results to differ materially from historical performance and these forward-looking statements. Factors that might cause such a difference include, but are not limited to: (1) general economic conditions and weakening in the economy, specifically the real estate market, either nationally or in the states in which Fifth Third, one or more acquired entities and/or the combined company do business, are less favorable than expected; (2) deteriorating credit quality; (3) political developments, wars or other hostilities may disrupt or increase volatility in securities markets or other economic conditions; (4) changes in the interest rate environment reduce interest margins; (5) prepayment speeds, loan origination and sale volumes, charge-offs and loan loss provisions; (6) Fifth Third’s ability to maintain required capital levels and adequate sources of funding and liquidity; (7) maintaining capital requirements may limit Fifth Third’s operations and potential growth; (8) changes and trends in capital markets; (9) problems encountered by larger or similar financial institutions may adversely affect the banking industry and/or Fifth Third; (10) competitive pressures among depository institutions increase significantly; (11) effects of critical accounting policies and judgments; (12) changes in accounting policies or procedures as may be required by the Financial Accounting Standards Board (FASB) or other regulatory agencies; (13) legislative or regulatory changes or actions, or significant litigation, adversely affect Fifth Third, one or more acquired entities and/or the combined company or the businesses in which Fifth Third, one or more acquired entities and/or the combined company are engaged, including the Dodd-Frank Wall Street Reform and Consumer Protection Act; (14) ability to maintain favorable ratings from rating agencies; (15) fluctuation of Fifth Third’s stock price; (16) ability to attract and retain key personnel; (17) ability to receive dividends from its subsidiaries; (18) potentially dilutive effect of future acquisitions on current shareholders’ ownership of Fifth Third; (19) effects of accounting or financial results of one or more acquired entities; (20) difficulties from Fifth Third’s investment in, relationship with, and nature of the operations of Vantiv, LLC; (21) loss of income from any sale or potential sale of businesses that could have an adverse effect on Fifth Third’s earnings and future growth; (22) ability to secure confidential information and deliver products and services through the use of computer systems and telecommunications networks; and (23) the impact of reputational risk created by these developments on such matters as business generation and retention, funding and liquidity. You should refer to our periodic and current reports filed with the Securities and Exchange Commission, or “SEC,” for further information on other factors, which could cause actual results to be significantly different from those expressed or implied by these forward-looking statements. |
 9 © Fifth Third Bank | All Rights Reserved Appendix |
 10 © Fifth Third Bank | All Rights Reserved Pre-tax pre-provision earnings¹ PPNR trend 1 Non-GAAP measure; see Reg. G reconciliation in appendix. 2 Prior quarters include similar adjustments. 3 There are limitations on the usefulness of credit-adjusted PPNR, including the significant degree to which changes in credit and fair value are integral, recurring components of the Bancorp’s core operations as a financial institution. This measure has been included herein to facilitate a greater understanding of the Bancorp’s financial condition. Note: 1Q14, 2Q13, and 1Q13 included the impact of $3MM, $20MM, and $22MMM, respectively in mortgage repurchase provision. 4Q13 and 3Q13 also included benefits to the mortgage repurchase provision of $28MM and $4MM, respectively. These impacts are reflected in “Credit-related items” and “Adjusted Efficiency Ratio” listed above. PPNR declined 17% sequentially, reflecting impact of $83MM and $9MM in net detriments to 1Q14 and 4Q13, respectively. Excluding those items, adjusted PPNR declined 5% from 4Q13, driven by seasonal increase in FICA and unemployment tax expense and lower mortgage banking net revenue. PPNR reconciliation ($ in millions) 1Q13 2Q13 3Q13 4Q13 1Q14 Income before income taxes (U.S. GAAP) (a) $591 $841 $604 $561 $438 Add: Provision expense (U.S. GAAP) (b) 62 64 51 53 69 PPNR (a) + (b) $653 $905 $655 $614 $507 2 In noninterest income: Gain from sales of Vantiv shares - (242) (85) - - Vantiv warrant valuation (34) (76) (6) (91) 36 Other Vantiv-related income - - - (9) - Valuation of 2009 Visa total return swap 7 5 2 18 (1) Sale of certain Fifth Third funds (7) - - - - BOLI settlement - (10) - - - Securities (gains) / losses (17) - (2) (2) (7) In noninterest expense: Debt extinguishment (gains) / losses - - - 8 - Severance expense 3 1 5 8 4 Large bank assessment fees - - 5 - - Gain on sale of affordable housing investments (9) (2) (1) - - Donation to Fifth Third Foundation 3 - - 8 - Litigation reserve charges 9 51 30 69 51 Adjusted PPNR $608 $632 $603 $623 $590 Credit-related items: In noninterest income 10 6 5 5 10 In noninterest expense 24 35 16 (12) 9 Credit-adjusted PPNR 3 $642 $673 $624 $616 $609 : $608 $632 $603 $623 $590 $0 $100 $200 $300 $400 $500 $600 $700 1Q13 2Q13 3Q13 4Q13 1Q14 Adjusted PPNR PPNR $653 $905 $655 $614 $507 Adjustments to remove (benefit) / detriment |
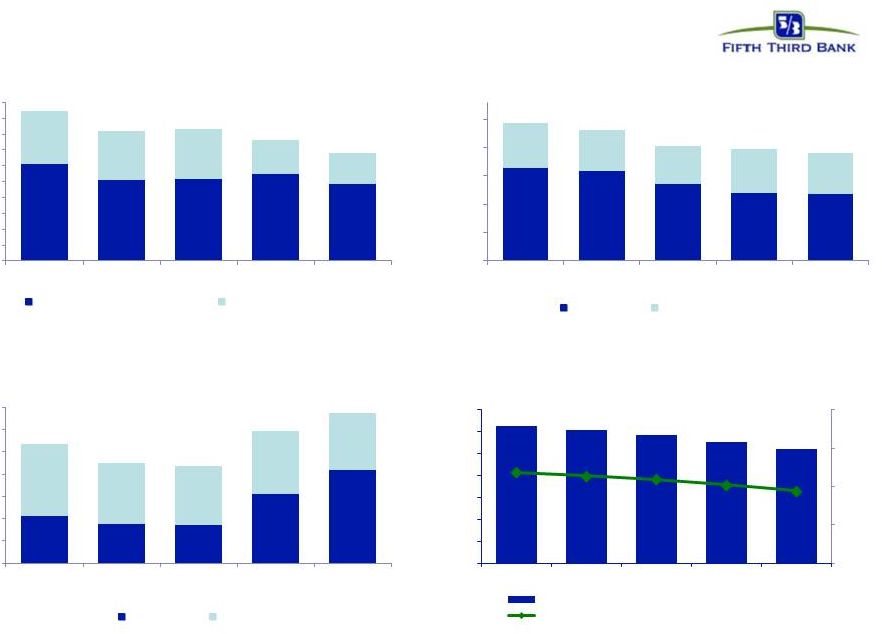 11 © Fifth Third Bank | All Rights Reserved Credit quality overview $112 Net charge-offs ($MM) $109 $168 4Q13 and 1Q14 net charge-offs elevated; broader portfolio still at low levels $133 NCO ratio 0.63% 0.51% 0.49% 0.67% 0.76% $148 HFI Nonperforming assets ($MM) $1,210 $1,150 $1,014 $946 $980 NPAs down 22% from 1Q13; lowest level since 2007 Reserve Coverage Accruing Past Due ($MM) $470 $410 $414 $337 $379 Includes 1Q14 provision expense of $69MM; reserve coverage levels remain strong. Total delinquencies declined 28% from 1Q13; remain at very low levels NPA ratio 1.41% 306 258 258 276 243 164 152 156 103 94 $0 $50 $100 $150 $200 $250 $300 $350 $400 $450 $500 1Q13 2Q13 3Q13 4Q13 1Q14 30-89 Days Past Due 90+ Days Past Due 828 794 680 607 595 382 356 334 373 351 $0 $250 $500 $750 $1,000 $1,250 1Q13 2Q13 3Q13 4Q13 1Q14 Commercial Consumer 54 45 44 78 105 79 67 65 70 63 $0 $25 $50 $75 $100 $125 $150 $175 1Q13 2Q13 3Q13 4Q13 1Q14 Commercial Consumer $1,783 $1,735 $1,677 $1,582 $1,483 2.08% 1.99% 1.92% 1.79% 1.65% $0 $500 $1,000 $1,500 $2,000 0.00% 0.50% 1.00% 1.50% 2.00% 2.50% 3.00% 3.50% 1Q13 2Q13 3Q13 4Q13 1Q14 Allowance for Loan & Lease Losses (ALLL) ($MM) ALLL / Loans and Leases 1.32% 1.16% 1.10% 1.05% |
 12 © Fifth Third Bank | All Rights Reserved Regulation G Non-GAAP reconciliation Fifth Third Bancorp and Subsidiaries Regulation G Non-GAAP Reconcilation $ and shares in millions (unaudited) March December September June March 2014 2013 2013 2013 2013 Income before income taxes (U.S. GAAP) $438 $561 $604 $841 $591 Add: Provision expense (U.S. GAAP) 69 53 51 64 62 Pre-provision net revenue (a) 507 614 655 905 653 Net income available to common shareholders (U.S. GAAP) 309 383 421 582 413 Add: Intangible amortization, net of tax 1 1 1 1 1 Tangible net income available to common shareholders 310 384 422 583 414 Tangible net income available to common shareholders (annualized) (b) 1,257 1,523 1,674 2,338 1,679 Average Bancorp shareholders' equity (U.S. GAAP) 14,862 14,757 14,440 14,221 13,779 Less: Average preferred stock (1,034) (703) (593) (717) (398) Average goodwill (2,416) (2,416) (2,416) (2,416) (2,416) Average intangible assets (19) (20) (22) (24) (26) Average tangible common equity (c) 11,393 11,618 11,409 11,064 10,939 Total Bancorp shareholders' equity (U.S. GAAP) 14,826 14,589 14,641 14,239 13,882 Less: Preferred stock (1,034) (1,034) (593) (991) (398) Goodwill (2,416) (2,416) (2,416) (2,416) (2,416) Intangible assets (18) (19) (21) (23) (25) Tangible common equity, including unrealized gains / losses (d) 11,358 11,120 11,611 10,809 11,043 Less: Accumulated other comprehensive income (196) (82) (218) (149) (333) Tangible common equity, excluding unrealized gains / losses (e) 11,162 11,038 11,393 10,660 10,710 Total assets (U.S. GAAP) 129,654 130,443 125,673 123,360 121,382 Less: Goodwill (2,416) (2,416) (2,416) (2,416) (2,416) Intangible assets (18) (19) (21) (23) (25) Tangible assets, including unrealized gains / losses (f) 127,220 128,008 123,236 120,921 118,941 Less: Accumulated other comprehensive income / loss, before tax (302) (126) (335) (229) (512) Tangible assets, excluding unrealized gains / losses (g) 126,918 127,882 122,901 120,692 118,429 Common shares outstanding (h) 848 855 887 851 875 Ratios: Return on average tangible common equity (b) / (c) 11.0% 13.1% 14.7% 21.1% 15.4% Tangible common equity (excluding unrealized gains/losses) (e) / (g) 8.79% 8.63% 9.27% 8.83% 9.03% Tangible common equity (including unrealized gains/losses) (d) / (f) 8.93% 8.69% 9.42% 8.94% 9.28% Tangible book value per share (d) / (h) 13.40 13.00 13.09 12.69 12.62 For the Three Months Ended |
 13 © Fifth Third Bank | All Rights Reserved Regulation G Non-GAAP reconciliation Fifth Third Bancorp and Subsidiaries Regulation G Non-GAAP Reconcilation $ and shares in millions (unaudited) March December September June March 2014 2013 2013 2013 2012 Total Bancorp shareholders' equity (U.S. GAAP) $14,826 $14,589 $14,641 $14,239 $13,882 Goodwill and certain other intangibles (2,490) (2,492) (2,492) (2,496) (2,504) Unrealized gains (196) (82) (218) (149) (333) Qualifying trust preferred securities 60 60 810 810 810 Other (18) 19 21 22 23 Tier I capital 12,182 12,094 12,762 12,426 11,878 Less: Preferred stock (1,034) (1,034) (593) (991) (398) Qualifying trust preferred securities (60) (60) (810) (810) (810) Qualifying noncontrolling interest in consolidated subsidiaries (1) (37) (39) (38) (38) Tier I common equity (a) 11,087 10,963 11,320 10,587 10,632 Risk-weighted assets, determined in accordance with prescribed regulatory requirements (b) 116,622 116,736 114,544 112,285 109,626 Ratio: Tier I common equity (a) / (b) 9.51% 9.39% 9.88% 9.43% 9.70% Basel III - Estimated Tier 1 common equity ratio March December September 2014 2013 2013 Tier 1 common equity (Basel I) $11,087 $10,963 $11,320 Add: Adjustment related to capital components $99 $82 $88 Estimated Tier 1 common equity under final Basel III rules without AOCI (opt out)(c) $11,186 $11,045 $11,408 Add: Adjustment related to AOCI $196 $82 $218 Estimated Tier 1 common equity under final Basel III rules with AOCI (non opt out)(d) $11,382 $11,127 $11,626 Estimated risk-weighted assets under final Basel III rules (e) 122,659 122,851 120,447 Estimated Tier 1 common equity ratio under final Basel III rules (opt out) (c) / (e) 9.12% 8.99% 9.47% Estimated Tier 1 common equity ratio under final Basel III rules (non opt out) (d) / (e) 9.28% 9.06% 9.65% For the Three Months Ended (c), (d) Under the final Basel III rules, non-advanced approach banks are permitted to make a one-time election to opt out of the requirement to include AOCI in Tier 1 common equity. Other adjustments include mortgage servicing rights and deferred tax assets subject to threshold limitations and deferred tax liabilities related to intangible assets. (e) Key differences under Basel III in the calculation of risk-weighted assets compared to Basel I include: (1) Risk weighting for commitments under 1 year; (2) Higher risk weighting for exposures to securitizations, past due loans, foreign banks and certain commercial real estate; (3) Higher risk weighting for mortgage servicing rights and deferred tax assets that are under certain thresholds as a percent of Tier 1 capital; and (4) Derivatives are differentiated between exchange clearing and over-the-counter and the 50% risk-weight cap is removed. |