 Barclays Capital Global Financial Services Conference Kevin Kabat Vice Chair & Chief Executive Officer September 8, 2014 Refer to earnings release dated July 17, 2014 and 10-Q dated August 7, 2014 for further information Exhibit 99.1 Fifth Third Bank | All Rights Reserved |
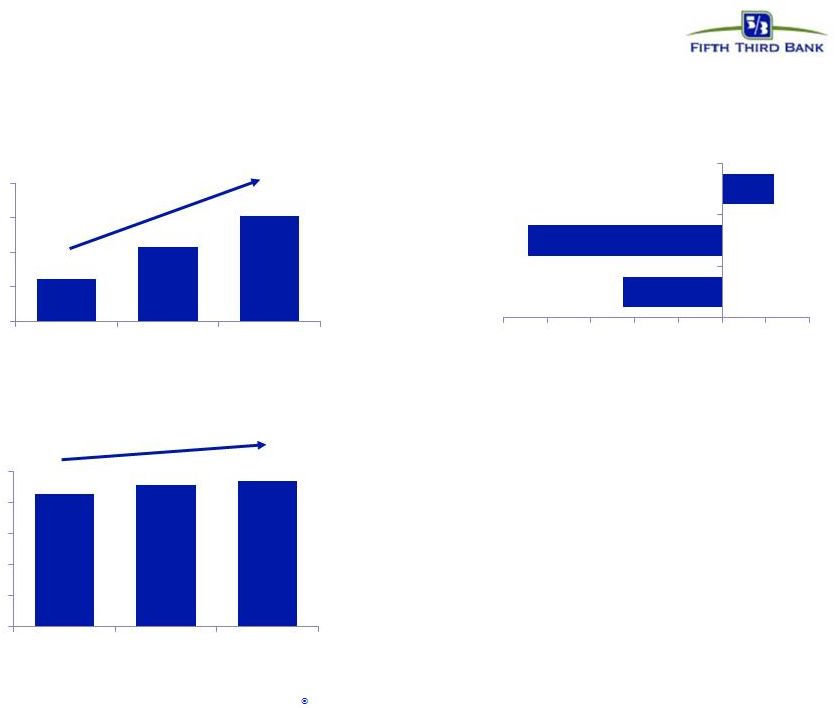
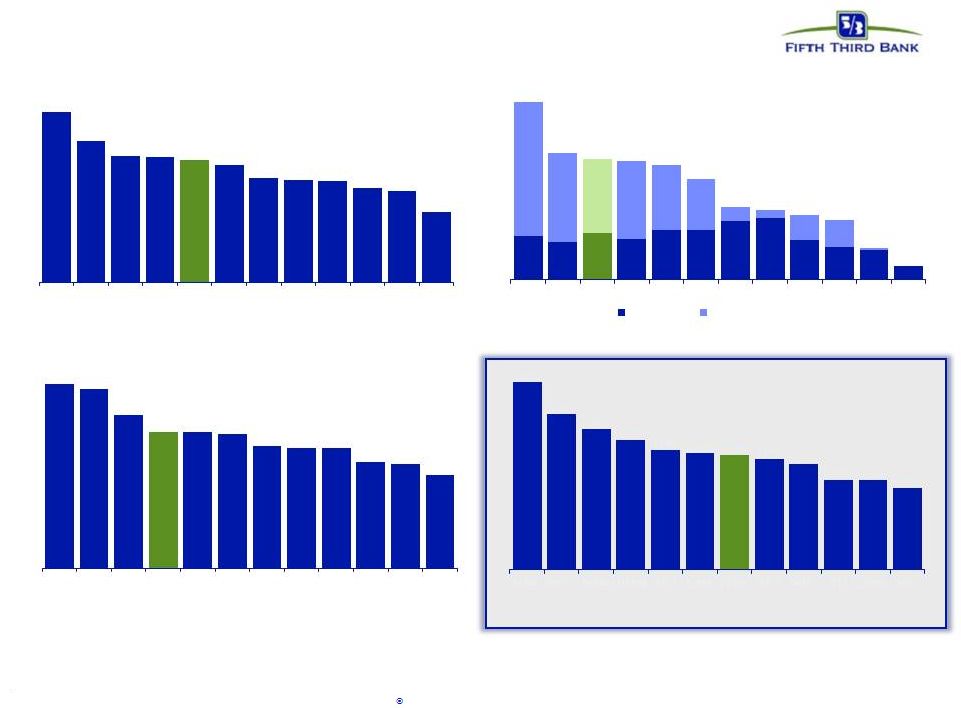 Solid 1H14 profitability results PPNR 1 / Average assets Total Payout Ratio Price to Book Value ROAA …supporting strong returns to shareholders… Strong pre-provision profitability… Relative position not yet reflected in valuation. …and driving above average profitability. 1 Annualized; excludes securities gains / losses for FITB and peers. Non-GAAP measure; See Reg. G reconciliation in appendix. Source: SNL Financial and company reports. Data as of 2Q14. Price to Book as of 9/3/14. Total payout ratio calculated based on dividends declared and shares repurchased using average stock price during the period. 2 Fifth Third Bank | All Rights Reserved 2.56% 2.13% 1.91% 1.90% 1.84% 1.77% 1.57% 1.54% 1.52% 1.42% 1.38% 1.06% USB WFC PNC MTB FITB BBT HBAN STI RF KEY CMA ZION 112% 80% 76% 75% 73% 64% 46% 44% 41% 38% 20% 8% HBAN KEY FITB CMA USB WFC BBT MTB PNC STI RF ZION Dividends Share Repurchases 1.58% 1.54% 1.32% 1.17% 1.16% 1.15% 1.05% 1.03% 1.03% 0.91% 0.90% 0.80% USB WFC PNC FITB MTB BBT RF HBAN KEY STI CMA ZION 201% 165% 149% 138% 127% 124% 122% 117% 113% 96% 95% 87% USB WFC MTB HBAN BBT CMA FITB KEY PNC STI ZION RF |
 3 Broad scope of products and services addressing the needs of wide array of customers Consumer Lending Branch Banking Wealth Management Wholesale Banking Retail Bank Cards Mortgage Auto 2013 total revenue of $560MM 2013 average loans of $2.0B 2013 average core deposits of $8.8B $27B assets under management $305B assets under care 2013 total revenue of $2.6B 2013 average loans of $47.3B 2013 average core deposits of $30.2B 2013 total revenue of $2.0B 2013 average loans of $17.5B 1,309 banking centers 2,619 ATMs 12 states 2013 total revenue of $1.1B 2013 average loans of $22.2B Private Bank Retail Brokerage Institutional Services Commercial Bank Footprint Business Lines Highlights Diversified financial services company with local orientation and strong national businesses In footprint markets National commercial banking In footprint markets National consumer lending Fifth Third Bank | All Rights Reserved |
 Key strategies in the commercial bank driving success Healthcare • Expanded suite of products designed to meet full range of healthcare clients’ needs • Innovative cash management solutions simplify cash handling and improve cash flow Currency Processing Solutions Segment Specialization Industry Specialization Treasury Management Capabilities Energy • Launched in 3Q12 • Focused on extraction and distribution (upstream / downstream) Commercial Real Estate • Centralized group focused on select opportunities • Target clients: businesses that generate $500MM to $2B in revenue • Investments in capital markets capabilities • “Lead left” strategy Mid-Corporate • Streamline processes, reduce costs and maximize convenience Commercial Card Solutions CONSULTATIVE SALES APPROACH 4 Fifth Third Bank | All Rights Reserved |
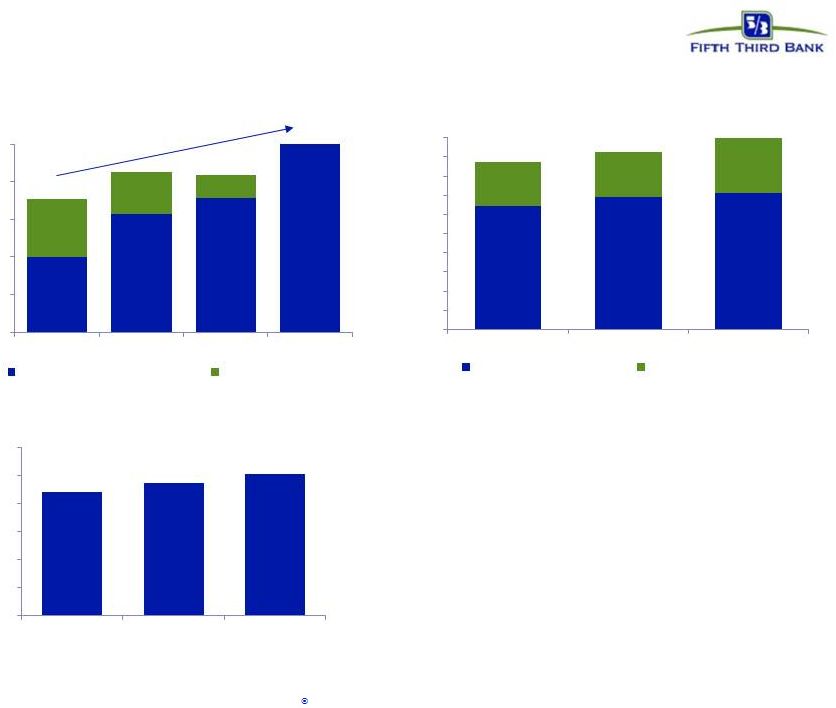
 Key strategies in the commercial bank driving success • Commercial banking total revenue in 1H14 increased 6% vs. 1H13 – Growth in capital markets fees driven by industry verticals • Continued focus on C&I lending – 76% of 2Q14 total average commercial loans and leases (59% 4 years ago) 1 1H11 and 1H12 have not been restated for changes in the structure of the reporting units that occurred in 1Q14. Fifth Third Bank | All Rights Reserved 662 696 772 814 338 354 403 430 - 200 400 600 800 1,000 1,200 1,400 1H11 1H12 1H13 1H14 Commercial Bank Revenue ($MM) 1 Net Interest Income Noninterest Income $0 $10 $20 $30 $40 $50 $60 2Q11 2Q12 2Q13 2Q14 Total Avg. Commercial Loans ($B) Middle Market Energy Healthcare Large Corporate Mid Corporate CRE Other - 20 40 60 80 100 120 1H11 1H12 1H13 1H14 Capital Markets Fees ($MM) Syndication Fees Foreign Exchange Institutional Sales Derivatives Commodities 5 |
 Repositioning consumer bank with investments and strategic changes Maximize the value offered and the revenue earned from every relationship • Growth in high value segments Execution consistency Dedicated team of specialists for focused segmentation Optimize the current distribution model • Redesign branch formats and re-define job categories while preserving revenue streams • Testing to break through the previous minimum staffing levels by deploying new technologies Enhance digital capabilities to lower costs while improving the customer experience • Enhancement of customer service levels through the ease and convenience of digital banking • Deliver solutions in digital channels for increased sales effectiveness and drive adoption 1 Online banking 47% 50% Mobile banking 9% 28% Alternative channel delivery % of checking households with Branch transactions Average monthly trans. in millions 7.7 7.0 6.4 2Q12 2Q13 2Q14 2009 2Q14 2011 2Q14 6 Fifth Third Bank | All Rights Reserved 2 |
 Repositioning consumer bank with investments and strategic changes Consumer deposit activity Transaction volume by ATM and Mobile channels Total EOP Consumer Deposits ($B) excludes CDs • Remote deposit capture launched in 2012 • All ATMs image-enabled and 49 Smart ATMs deployed with additional consumer-friendly upgrades – Touch-screen and dual screen interface – Ability to split deposits into two accounts – Small denomination withdrawals • Testing smaller technology-focused branch formats with lower staffing requirements • Redefining roles of branch personnel and testing hybrid roles Fifth Third Bank | All Rights Reserved 12% 22% 31% 0% 10% 20% 30% 40% 2Q12 2Q13 2Q14 $42.8 $45.7 $47.2 $0 $10 $20 $30 $40 $50 2Q12 2Q13 2Q14 (11%) (22%) 6% (25%) (20%) (15%) (10%) (5%) 0% 5% 10% Total Banking Center Staff Total Service FTE Total Sales FTE Retail Banking Headcount 7 18-month change (Dec. 2012 - June 2014) |
 8 Retail Brokerage Private Bank Institutional Services ClearArc Capital Mass market and mass affluent clients Financial elite clients Consulting, investment and record-keeping services for corporations, financial institutions, foundations, endowments and not-for-profit organizations Provides asset management services to institutional clients Investment Advisors serves individual and institutional clients with all levels of wealth; provides for significant cross-sell opportunity Retail brokerage revenue ($MM) Assets under management ($B) Institutional services revenue ($MM) Assets under management ($B) Wealth management contributing to ongoing momentum Fifth Third Bank | All Rights Reserved 117 144 FY11 FY13 16 21 FY11 2Q14 62 84 FY11 FY13 6.3 6.8 1Q13 2Q14 Teams of professionals dedicated to helping clients achieve their financial goals – Retirement, investment and education planning, managed money, annuities and transactional brokerage services – Retirement plans, endowment management, planned giving and custody services – Divested all proprietary mutual funds in 2012 to complete transition to open architecture – |
 9 Wealth management contributing to ongoing momentum • Investment advisory fees excluding mutual fund revenue increased 19% FY13 vs FY10; 1H14 up 3% vs 1H13 • Shift towards recurring revenue streams; 77% of total revenue is recurring as of 2Q14 compared with 71% in 2010 • Significant cross-sell opportunity – Private Bank revenue per household increased 79% 2Q14 compared with 2012 – Number of >$1MM households increased 8% in last 12 months Noninterest expense ($MM) Fifth Third Bank | All Rights Reserved $290 $310 $330 $350 $370 $390 2010 2011 2012 2013 Investment advisory fees ($MM) $330 $353 $361 $393 $31 $22 $13 IA Fees (excl. mutual fund) Mutual fund fees $50 $100 $150 $200 $250 $300 $350 $400 $450 $500 $550 2011 2012 2013 Total Revenue ($MM) 373 396 406 113 117 154 Noninterest Income Net Interest Income $421 $437 $453 $200 $250 $300 $350 $400 $450 $500 2011 2012 2013 |
 10 Adding value through newly created Payments and Commerce Solutions division Future Opportunity Efficiencies Gained Competitive Advantage • Growing core existing payments markets • New market development • Innovative sector solutions (e.g. Healthcare and Retail) • Extensive payments infrastructure • Scale and experience in enrollment, access, support services, etc. • Existing customer contacts and relationships • Shift from opportunistic player to proactive market leader • Resource optimization through consolidated card strategy, product development, and operational execution • Creates a focused and more nimble organization with industry expertise • Incremental revenue streams reflected on Commercial and Consumer Bank P&L through value- add solution offerings How we will control expenses and grow revenue How we will compete with non-bank entities How we will increase our value proposition Fifth Third Bank | All Rights Reserved – Treasury management – Financial supply chain management – Currency processing solutions – Card solutions – Payment security – Mobile payments – Cobranded cards and loyalty |
 11 Balance sheet positioning 1 Estimate; funding (DDAs + interest-bearing liabilities); liabilities attributed to fixed or floating using terms and expected beta Fixed / Floating Portfolio Interest-Earning Assets Funding 1 • Asset sensitive positioning • Mix of asset classes (59% commercial, 41% consumer) • Disciplined loan growth • Balance sheet well-positioned for the new LCR rules • Minimal reliance on short-term borrowings • Core deposits represent over 80% of total liabilities vs. 68% in 2Q07 – Represent approximately 2 percent of total liabilities – Focused in areas with strong cross-sell opportunities (verticals, cap. mkts, TM) – Additional portfolio leverage or cash levels to be added to generate higher buffer to minimum ratio requirements Fifth Third Bank | All Rights Reserved Total Average Liabilities ($B) Fixed 18% Floating 54% Non- Interest Bearing 28% Fixed 48% Floating 52% Investment Portfolio 18% Loans 30% Investment Portfolio 3% 0 20 40 60 80 100 120 2Q07 2Q08 2Q09 2Q10 2Q11 2Q12 2Q13 2Q14 Core Deposits CDs- $100K+ S-T Borrowings L-T debt Other Loans 49% $116 B $91 B |
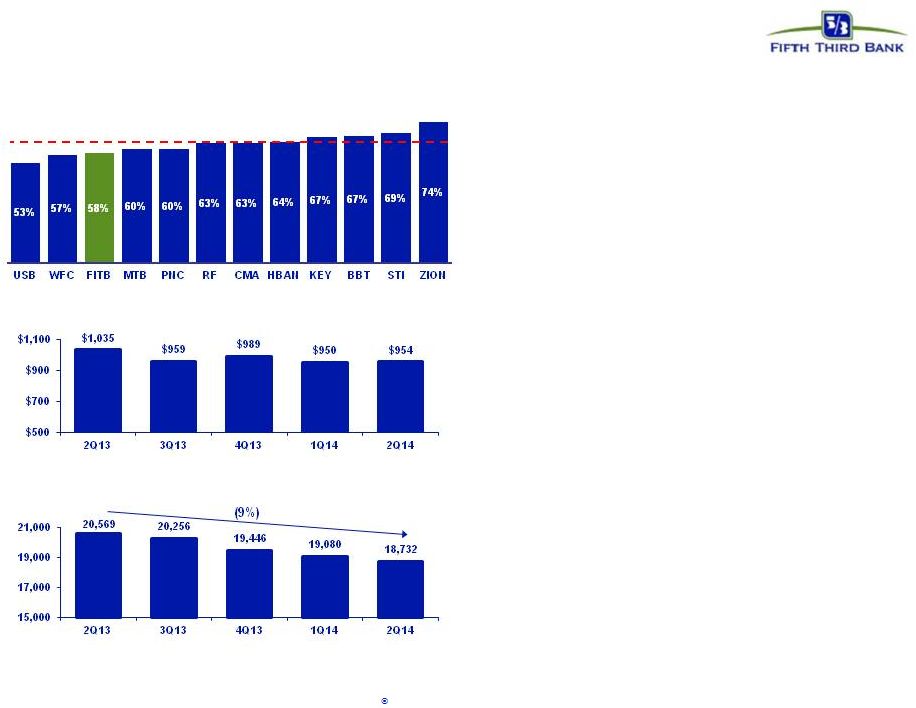 12 Expense discipline 2Q14 Efficiency ratio Peer median: 64% Total FTE • Operating leverage strategic priority in all environments • Expect continued improvement in 2014 • Mid-50% efficiency ratio target in normalized interest rate environment Noninterest expense ($MM) Source: SNL Financial and company reports. Efficiency ratio calculated as reported noninterest expense / (net interest income (fully taxable equivalent)+ noninterest income) • Reduction in FTE includes the impact of branch and mortgage staffing changes – 50% of year-over-year decline in mortgage and 37% in retail • Carefully managing expenses in response to revenue environment (total noninterest expense down 8% year-over-year) • Continued R&D investments with increased technology, communications, and equipment expense in 2014 Fifth Third Bank | All Rights Reserved |
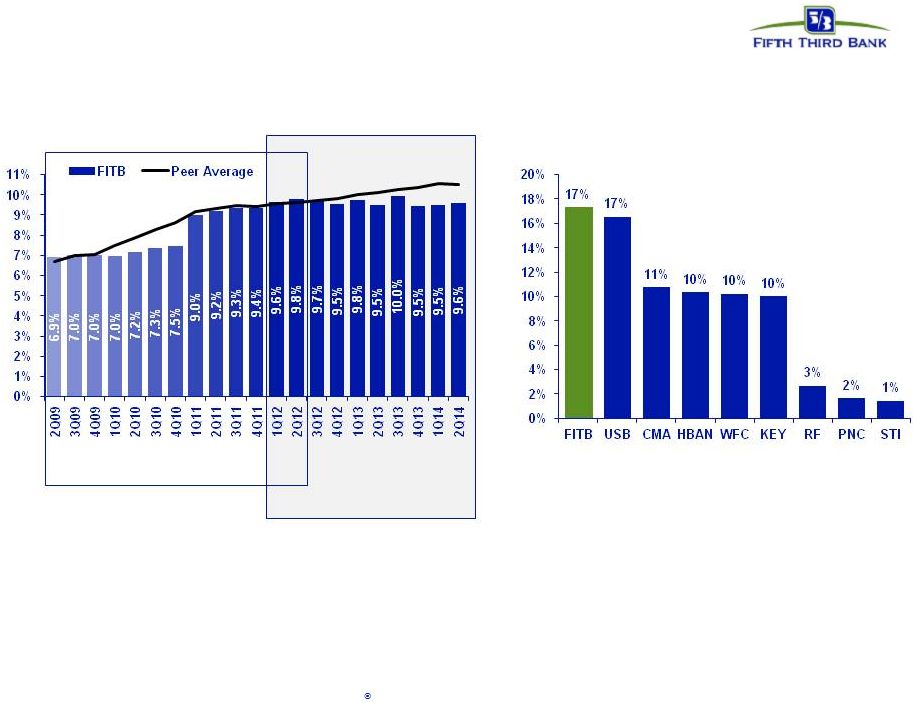 13 1Q12-2Q14 Common Equity Repurchased / 2011 Total Common Equity Strong capital position 1 Non-GAAP measure; See Reg. G reconciliation in appendix. Peer average includes: BBT, CMA, HBAN, KEY, MTB, PNC, RF, STI, USB, WFC, and ZION Tier 1 common equity 1 From building capital… …to maintaining capital at relatively stable levels… …through share repurchase activity Capital generation and overall capital position, well above current and future requirements, support balance sheet growth and continued prudent capital return to shareholders. Fifth Third Bank | All Rights Reserved |
 Valuable ownership stake in Vantiv, Inc. March 2009 Significant unrecognized value unlocked March 2009 – Present Realizing earning potential Ongoing impact Positioned well to generate future value $2.35 billion enterprise value Debt incurred Equity value • Equity valuation of $1.1B – Including $561MM cash payment related to Advent’s 51% ownership and put rights – Fifth Third retained 49% ownership with additional warrants Recognized value to date ($MM pre-tax) • Currently own 23% interest in Vantiv Holding, LLC, convertible to Vantiv, Inc. shares (NYSE: VNTV) – Carrying (book) value of $384MM as of 6/30/14 – Ownership (market) value of ~$1.4B as of 6/30/14 • Ongoing equity method earnings • Warrant to purchase additional shares in Vantiv – Carried as a derivative asset at fair value of $412MM as of 6/30/14 • Annual payment corresponding with tax benefits accruing to Fifth Third associated with the tax receivable agreement (TRA) – FITB realized $9MM in 4Q13 Equity ownership & earnings Total gains / earnings recognized ~$3.1 billion $1.10B $1.25B Enterprise Value Components $115 $618 $362 $254 Gain on IPO Gains on share sales and TRA Net put and warrant valuation gains Equity method earnings 83.9 70.2 48.8 43.0 $0 $20 $40 $60 $80 0 15 30 45 60 75 90 2011 2012 2013 2014 YTD Class B shares (MM) Equity method earnings ($MM) 1 1 1 Before Fifth Third’s valuation of warrants, put rights, and minority interest discounts expected to reduce its implied valuation of the business by an estimated $50 million. • Pre-tax gain of $1.8B Fifth Third Bank | All Rights Reserved 14 |
 15 Investment thesis Investing in the future of our company Creating shareholder value with long-term focus while optimizing our current opportunities Continuously improving all of our business platforms to adapt to changing environment Managing prudently in the current competitive environment Fifth Third Bank | All Rights Reserved |
 16 Cautionary statement Fifth Third Bank | All Rights Reserved This report contains statements that we believe are “forward-looking statements” within the meaning of Section 27A of the Securities Act of 1933, as amended, and Rule 175 promulgated thereunder, and Section 21E of the Securities Exchange Act of 1934, as amended, and Rule 3b-6 promulgated thereunder. These statements relate to our financial condition, results of operations, plans, objectives, future performance or business. They usually can be identified by the use of forward-looking language such as “will likely result,” “may,” “are expected to,” “is anticipated,” “estimate,” “forecast,” “projected,” “intends to,” or may include other similar words or phrases such as “believes,” “plans,” “trend,” “objective,” “continue,” “remain,” or similar expressions, or future or conditional verbs such as “will,” “would,” “should,” “could,” “might,” “can,” or similar verbs. You should not place undue reliance on these statements, as they are subject to risks and uncertainties, including but not limited to the risk factors set forth in our most recent Annual Report on Form 10-K. When considering these forward-looking statements, you should keep in mind these risks and uncertainties, as well as any cautionary statements we may make. Moreover, you should treat these statements as speaking only as of the date they are made and based only on information then actually known to us. There are a number of important factors that could cause future results to differ materially from historical performance and these forward- looking statements. Factors that might cause such a difference include, but are not limited to: (1) general economic conditions and weakening in the economy, specifically the real estate market, either nationally or in the states in which Fifth Third, one or more acquired entities and/or the combined company do business, are less favorable than expected; (2) deteriorating credit quality; (3) political developments, wars or other hostilities may disrupt or increase volatility in securities markets or other economic conditions; (4) changes in the interest rate environment reduce interest margins; (5) prepayment speeds, loan origination and sale volumes, charge-offs and loan loss provisions; (6) Fifth Third’s ability to maintain required capital levels and adequate sources of funding and liquidity; (7) maintaining capital requirements may limit Fifth Third’s operations and potential growth; (8) changes and trends in capital markets; (9) problems encountered by larger or similar financial institutions may adversely affect the banking industry and/or Fifth Third; (10) competitive pressures among depository institutions increase significantly; (11) effects of critical accounting policies and judgments; (12) changes in accounting policies or procedures as may be required by the Financial Accounting Standards Board (FASB) or other regulatory agencies; (13) legislative or regulatory changes or actions, or significant litigation, adversely affect Fifth Third, one or more acquired entities and/or the combined company or the businesses in which Fifth Third, one or more acquired entities and/or the combined company are engaged, including the Dodd-Frank Wall Street Reform and Consumer Protection Act; (14) ability to maintain favorable ratings from rating agencies; (15) fluctuation of Fifth Third’s stock price; (16) ability to attract and retain key personnel; (17) ability to receive dividends from its subsidiaries; (18) potentially dilutive effect of future acquisitions on current shareholders’ ownership of Fifth Third; (19) effects of accounting or financial results of one or more acquired entities; (20) difficulties from Fifth Third’s investment in, relationship with, and nature of the operations of Vantiv, LLC; (21) loss of income from any sale or potential sale of businesses that could have an adverse effect on Fifth Third’s earnings and future growth; (22) ability to secure confidential information and deliver products and services through the use of computer systems and telecommunications networks; and (23) the impact of reputational risk created by these developments on such matters as business generation and retention, funding and liquidity. You should refer to our periodic and current reports filed with the Securities and Exchange Commission, or “SEC,” for further information on other factors, which could cause actual results to be significantly different from those expressed or implied by these forward-looking statements. |
 17 Appendix Fifth Third Bank | All Rights Reserved |
 18 Fifth Third Bank | All Rights Reserved Regulation G Non-GAAP reconciliation Fifth Third Bancorp and Subsidiaries Regulation G Non-GAAP Reconcilation $ and shares in millions (unaudited) June March December September June 2014 2014 2013 2013 2013 Income before income taxes (U.S. GAAP) $606 $438 $561 $604 $841 Add: Provision expense (U.S. GAAP) 76 69 53 51 64 Pre-provision net revenue (a) 682 507 614 655 905 Net income available to common shareholders (U.S. GAAP) 416 309 383 421 582 Add: Intangible amortization, net of tax 1 1 1 1 1 Tangible net income available to common shareholders 417 310 384 422 583 Tangible net income available to common shareholders (annualized) (b) 1,673 1,257 1,523 1,674 2,338 Average Bancorp shareholders' equity (U.S. GAAP) 15,157 14,862 14,757 14,440 14,221 Less: Average preferred stock (1,119) (1,034) (703) (593) (717) Average goodwill (2,416) (2,416) (2,416) (2,416) (2,416) Average intangible assets (17) (19) (20) (22) (24) Average tangible common equity (c) 11,605 11,393 11,618 11,409 11,064 Total Bancorp shareholders' equity (U.S. GAAP) 15,469 14,826 14,589 14,641 14,239 Less: Preferred stock (1,331) (1,034) (1,034) (593) (991) Goodwill (2,416) (2,416) (2,416) (2,416) (2,416) Intangible assets (17) (18) (19) (21) (23) Tangible common equity, including unrealized gains / losses (d) 11,705 11,358 11,120 11,611 10,809 Less: Accumulated other comprehensive income (382) (196) (82) (218) (149) Tangible common equity, excluding unrealized gains / losses (e) 11,323 11,162 11,038 11,393 10,660 Total assets (U.S. GAAP) 132,562 129,654 130,443 125,673 123,360 Less: Goodwill (2,416) (2,416) (2,416) (2,416) (2,416) Intangible assets (17) (18) (19) (21) (23) Tangible assets, including unrealized gains / losses (f) 130,129 127,220 128,008 123,236 120,921 Less: Accumulated other comprehensive income / loss, before tax (588) (302) (126) (335) (229) Tangible assets, excluding unrealized gains / losses (g) 129,541 126,918 127,882 122,901 120,692 Common shares outstanding (h) 844 848 855 887 851 Ratios: Return on average tangible common equity (b) / (c) 14.4% 11.0% 13.1% 14.7% 21.1% Tangible common equity (excluding unrealized gains/losses) (e) / (g) 8.74% 8.79% 8.63% 9.27% 8.83% Tangible common equity (including unrealized gains/losses) (d) / (f) 9.00% 8.93% 8.69% 9.42% 8.94% Tangible book value per share (d) / (h) $13.86 $13.40 $13.00 $13.09 $12.69 For the Three Months Ended |
 19 Fifth Third Bank | All Rights Reserved Regulation G Non-GAAP reconciliation Fifth Third Bancorp and Subsidiaries Regulation G Non-GAAP Reconcilation $ and shares in millions (unaudited) June March December September June 2014 2014 2013 2013 2013 Total Bancorp shareholders' equity (U.S. GAAP) $15,469 $14,826 $14,589 $14,641 $14,239 Goodwill and certain other intangibles (2,484) (2,490) (2,492) (2,492) (2,496) Unrealized gains (382) (196) (82) (218) (149) Qualifying trust preferred securities 60 60 60 810 810 Other (19) (18) 19 21 22 Tier I capital 12,644 12,182 12,094 12,762 12,426 Less: Preferred stock (1,331) (1,034) (1,034) (593) (991) Qualifying trust preferred securities (60) (60) (60) (810) (810) Qualifying noncontrolling interest in consolidated subsidiaries (1) (1) (37) (39) (38) Tier I common equity (a) 11,252 11,087 10,963 11,320 10,587 Risk-weighted assets, determined in accordance with prescribed regulatory requirements (b) 117,117 116,622 115,969 113,801 111,559 Ratio: Tier I common equity (a) / (b) 9.61% 9.51% 9.45% 9.95% 9.49% Basel III - Estimated Tier 1 common equity ratio June March December September 2014 2014 2013 2013 Tier 1 common equity (Basel I) 11,252 11,087 10,963 11,320 Add: Adjustment related to capital components 96 99 82 88 Estimated Tier 1 common equity under final Basel III rules without AOCI (opt out)(c) 11,348 11,186 11,045 11,408 Add: Adjustment related to AOCI 382 196 82 218 Estimated Tier 1 common equity under final Basel III rules with AOCI (non opt out)(d) 11,730 11,382 11,127 11,626 Estimated risk-weighted assets under final Basel III rules (e) 122,465 122,659 122,074 120,447 Estimated Tier 1 common equity ratio under final Basel III rules (opt out) (c) / (e) 9.27% 9.12% 9.05% 9.47% Estimated Tier 1 common equity ratio under final Basel III rules (non opt out) (d) / (e) 9.58% 9.28% 9.12% 9.65% (c), (d) (e) Under the final Basel III rules, non-advanced approach banks are permitted to make a one-time election to opt out of the requirement to include AOCI in Tier 1 common equity. Other adjustments include mortgage servicing rights and deferred tax assets subject to threshold limitations and deferred tax liabilities related to intangible assets. Key differences under Basel III in the calculation of risk-weighted assets compared to Basel I include: (1) Risk weighting for commitments under 1 year; (2) Higher risk weighting for exposures to securitizations, past due loans, foreign banks and certain commercial real estate; (3) Higher risk weighting for mortgage servicing rights and deferred tax assets that are under certain thresholds as a percent of Tier 1 capital; and (4) Derivatives are differentiated between exchange clearing and over-the-counter and the 50% risk-weight cap is removed. For the Three Months Ended |