 © Fifth Third Bank | All Rights Reserved 4Q14 Earnings Conference Call January 21, 2015 Refer to earnings release dated January 21, 2015 for further information. Exhibit 99.2 |
 2 © Fifth Third Bank | All Rights Reserved Cautionary statement This report contains statements that we believe are “forward-looking statements” within the meaning of Section 27A of the Securities Act of 1933, as amended, and Rule 175 promulgated thereunder, and Section 21E of the Securities Exchange Act of 1934, as amended, and Rule 3b-6 promulgated thereunder. These statements relate to our financial condition, results of operations, plans, objectives, future performance or business. They usually can be identified by the use of forward-looking language such as “will likely result,” “may,” “are expected to,” “is anticipated,” “estimate,” “forecast,” “projected,” “intends to,” or may include other similar words or phrases such as “believes,” “plans,” “trend,” “objective,” “continue,” “remain,” or similar expressions, or future or conditional verbs such as “will,” “would,” “should,” “could,” “might,” “can,” or similar verbs. You should not place undue reliance on these statements, as they are subject to risks and uncertainties, including but not limited to the risk factors set forth in our most recent Annual Report on Form 10-K as updated by our Quarterly Reports on Form 10-Q. When considering these forward-looking statements, you should keep in mind these risks and uncertainties, as well as any cautionary statements we may make. Moreover, you should treat these statements as speaking only as of the date they are made and based only on information then actually known to us. There are a number of important factors that could cause future results to differ materially from historical performance and these forward- looking statements. Factors that might cause such a difference include, but are not limited to: (1) general economic conditions and weakening in the economy, specifically the real estate market, either nationally or in the states in which Fifth Third, one or more acquired entities and/or the combined company do business, are less favorable than expected; (2) deteriorating credit quality; (3) political developments, wars or other hostilities may disrupt or increase volatility in securities markets or other economic conditions; (4) changes in the interest rate environment reduce interest margins; (5) prepayment speeds, loan origination and sale volumes, charge-offs and loan loss provisions; (6) Fifth Third’s ability to maintain required capital levels and adequate sources of funding and liquidity; (7) maintaining capital requirements and adequate sources of funding and liquidity may limit Fifth Third’s and potential growth; (8) changes and trends in capital markets; (9) problems encountered by larger or similar financial institutions may adversely affect the banking industry and/or Fifth Third; (10) competitive pressures among depository institutions increase significantly; (11) effects of critical accounting policies and judgments; (12) changes in accounting policies or procedures as may be required by the Financial Accounting Standards Board (FASB) or other regulatory agencies; (13) legislative or regulatory changes or actions, or significant litigation, adversely affect Fifth Third, one or more acquired entities and/or the combined company or the businesses in which Fifth Third, one or more acquired entities and/or the combined company are engaged, including the Dodd-Frank Wall Street Reform and Consumer Protection Act; (14) ability to maintain favorable ratings from rating agencies; (15) fluctuation of Fifth Third’s stock price; (16) ability to attract and retain key personnel; (17) ability to receive dividends from its subsidiaries; (18) potentially dilutive effect of future acquisitions on current shareholders’ ownership of Fifth Third; (19) effects of accounting or financial results of one or more acquired entities; (20) difficulties from Fifth Third’s investment in, relationship with, and nature of the operations of Vantiv, LLC; (21) loss of income from any sale or potential sale of businesses that could have an adverse effect on Fifth Third’s earnings and future growth; (22) ability to secure confidential information and deliver products and services through the use of computer systems and telecommunications networks; and (23) the impact of reputational risk created by these developments on such matters as business generation and retention, funding and liquidity. You should refer to our periodic and current reports filed with the Securities and Exchange Commission, or “SEC,” for further information on other factors, which could cause actual results to be significantly different from those expressed or implied by these forward-looking statements. |
 3 © Fifth Third Bank | All Rights Reserved 4Q14 in review Balancing current earnings results with prudent decisions to increase long-term shareholder value ($ in millions) 4Q14 Seq. YOY Average Balances Total loans & leases 1 $91,041 $242 $3,146 Core deposits $96,350 $3,190 $7,081 Income Statement Data Net interest income (taxable equivalent) $888 (2%) (2%) Provision for loan and lease losses 99 40% 87% Noninterest income 653 26% (7%) Noninterest expense 918 3% (7%) Net income attributable to Bancorp $385 13% (4%) Net income available to common shareholders $362 10% (6%) Financial Ratios Earnings per share, diluted 0.43 10% - Net interest margin 2.96% (14bps) (25bps) Efficiency ratio 59.6% (250bps) (190bps) Return on average assets 1.13% 11bps (11bps) Return on avg common equity 10.0% 80bps (80bps) Return on avg tangible common equity 2 12.1% 100bps (100bps) Tangible book value per share 2 $14.40 3% 11% Note: The percentages in all of the tables in this presentation are calculated on actual dollar amounts and not the rounded dollar amounts. 1 Excludes loans held-for-sale 2 Non-GAAP measure; see Reg. G reconciliation in appendix Significant pre-tax items in 4Q14 results: — $56MM positive valuation adjustment on Vantiv warrant — $23MM of provision expense related to the transfer of $720MM residential mortgage TDRs to held- for-sale — $19MM negative valuation adjustment on Visa total return swap 2014 operating results reflect core deposit growth, conservative lending, and well-controlled expenses Credit quality continues to improve — Excluding $87MM of NCOs related to TDR transfer, NCOs down 10% compared with 3Q14 — NPAs down 7% compared with 3Q14 Strong capital ratios; tangible book value per share² up 11% from 4Q13 |
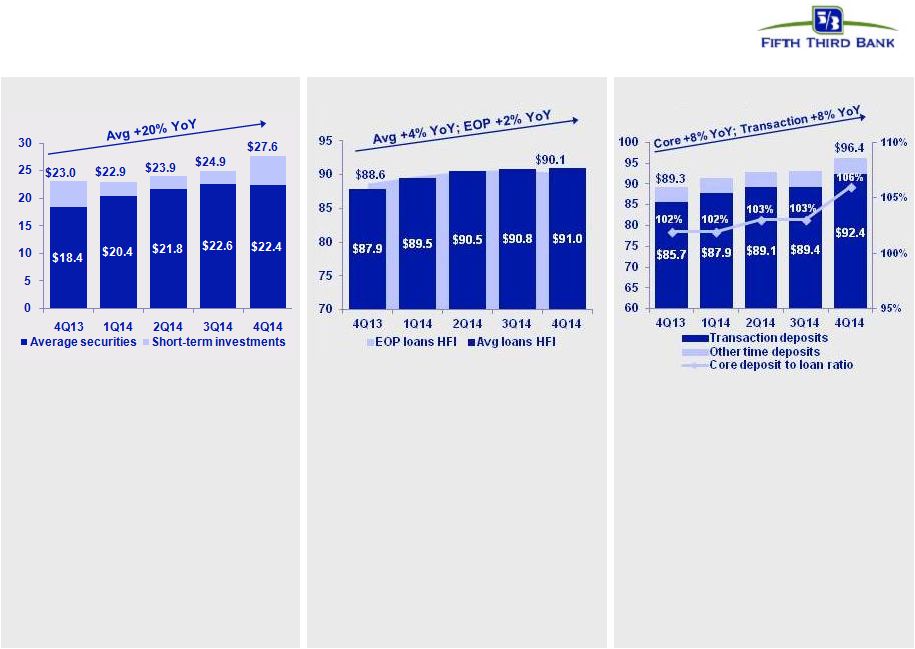 4 © Fifth Third Bank | All Rights Reserved Balance sheet Loan balances ($B) • Continuing to target prudent risk/reward profile in lending • Average commercial loans flat sequentially and up 6% year-over-year – Year-over-year commercial loan growth driven primarily by C&I and commercial construction, partially offset by lower commercial mortgage – End of period commercial line utilization 32%; flat sequentially • Consumer loan growth driven by residential mortgage and bankcard • Average transaction deposits up $3.1 billion sequentially with increases in money market, demand, and interest checking deposit balances – Consumer average transaction deposits up 2% sequentially and up 6% year-over-year – Commercial average transaction deposits up 5% sequentially and up 10% year-over-year • Core deposit to loan ratio of 106% Average core deposit balances ($B) • Average securities up $4.0B from 4Q13 • Securities portfolio / total assets of 16.5% in 4Q14, up from 14.7% a year ago • End of period short-term investments increased $4.3B sequentially, reflecting higher cash balances held at the Federal Reserve Average securities and short-term investments ($B) |
 5 © Fifth Third Bank | All Rights Reserved Net interest income NII and NIM (FTE) • Net interest income down $20MM from 3Q14 – Decrease driven by the effects of loan repricing and higher interest expense from 3Q14 debt issuance, partially offset by the benefit of loan growth • Sequential decline in asset yield lowest we have seen in 2014 • NIM decreased 14 bps sequentially reflecting elevated cash balances • Year-over-year NII decreased $17MM and NIM decreased 25 bps – NII decrease driven by loan repricing and debt issuances, partially offset by higher investment securities and loan balances – NIM decrease due to the impact of loan repricing • Expect lower 1Q15 NII, reflecting decline related to changes to deposit advance product and negative impact from lower day count Yield Analysis 4Q13 3Q14 4Q14 Seq. (bps) YoY (bps) Commercial and industrial loans 3.46% 3.25% 3.21% (4) (25) Commercial mortgage loans 3.53% 3.34% 3.28% (6) (25) Commercial construction loans 3.46% 3.49% 3.30% (19) (16) Commercial leases 3.10% 2.96% 2.96% - (14) Residential mortgage loans 3.88% 3.84% 3.80% (4) (8) Home equity 3.62% 3.69% 3.68% (1) 6 Automobile loans 2.96% 2.72% 2.73% 1 (23) Credit card 9.90% 9.87% 10.08% 21 18 Other consumer loans and leases 43.19% 36.98% 31.97% (501) (1,122) Total loans and leases 3.79% 3.61% 3.58% (3) (21) Taxable securities 3.32% 3.32% 3.28% (4) (4) Tax exempt securities 5.65% 5.34% 4.42% (92) (123) Other short-term investments 0.26% 0.26% 0.26% - - Total interest-earning assets 3.57% 3.49% 3.38% (11) (19) Total interest-bearing liabilities 0.52% 0.56% 0.61% 5 9 Net interest rate spread 3.05% 2.93% 2.77% (16) (28) |
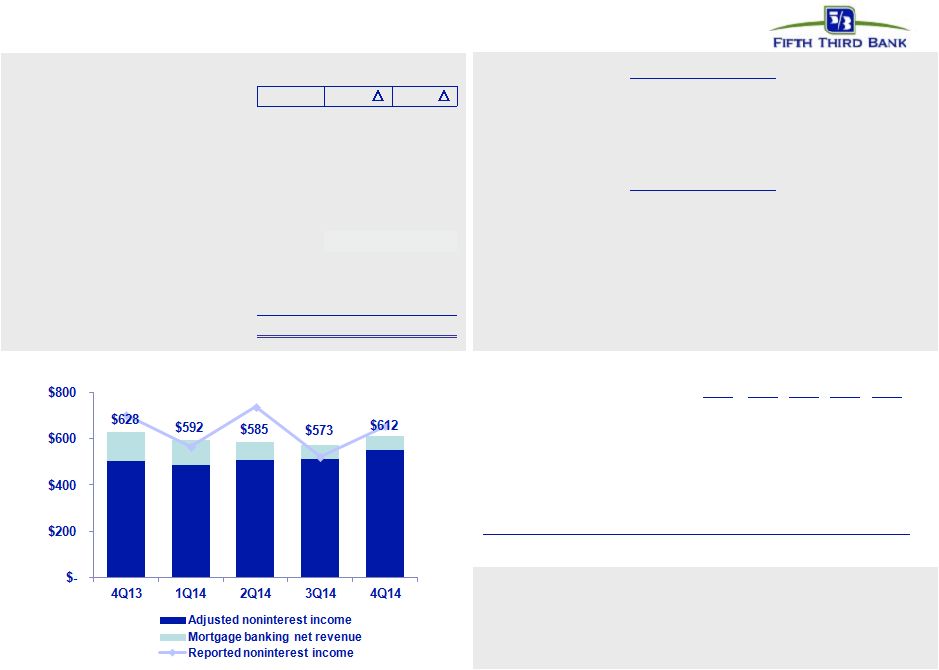 6 © Fifth Third Bank | All Rights Reserved • 4Q14 and 4Q13 include $23MM and $9MM, respectively, of payments received from Vantiv pursuant to TRA • Expect lower 1Q15 fee income due to seasonal impacts on deposit service charges and card and processing revenue and the absence of the Vantiv TRA payment 4Q14 Seq. YOY ($ in millions) Service charges on deposits $142 (2%) - Corporate banking revenue 120 20% 27% Mortgage banking net revenue 61 - (51%) Investment advisory revenue 100 (2%) 2% Card and processing revenue 76 2% 7% Other noninterest income 1 150 NM (13%) Securities gains, net 4 15% NM Securities gains (losses), net - - - - non-qualifying hedges on MSRs Total noninterest income $653 26% (7%) Noninterest income 1 Net credit-related costs recognized in other noninterest income were $1MM in 4Q14. This compares with immaterial net credit-related costs in 3Q14, $4MM in 2Q14, $10MM in 1Q14, and $5MM in 4Q13. Compared with 3Q14 • Corporate banking revenue results driven by higher syndication, business lending, and foreign exchange fees • Retail service changes on deposits decreased due to a decrease in overdraft occurrences Compared with 4Q13 • Decrease in mortgage banking results reflect lower production, partially due to exiting broker channel in early 2014 • Card and processing revenue reflects greater card utilization and higher consumer purchase volume • Investment advisory revenue reflects increase in personal asset management fees 4Q13 1Q14 2Q14 3Q14 4Q14 Reported noninterest income $703 $564 $736 $520 $653 Gain on sale of Vantiv shares - - (125) - - Vantiv warrant valuation (91) 36 (63) 53 (56) Other Vantiv-related items - - 12 - - Valuation of Visa total return swap 18 (1) 16 3 19 Land valuation adjustments - - 17 - - Securities (gains) / losses (2) (7) (8) (3) (4) Adjusted noninterest income $628 $592 $585 $573 $612 Components of noninterest income 5 quarter trend ($MM) Adjustments to remove (benefit) / detriment |
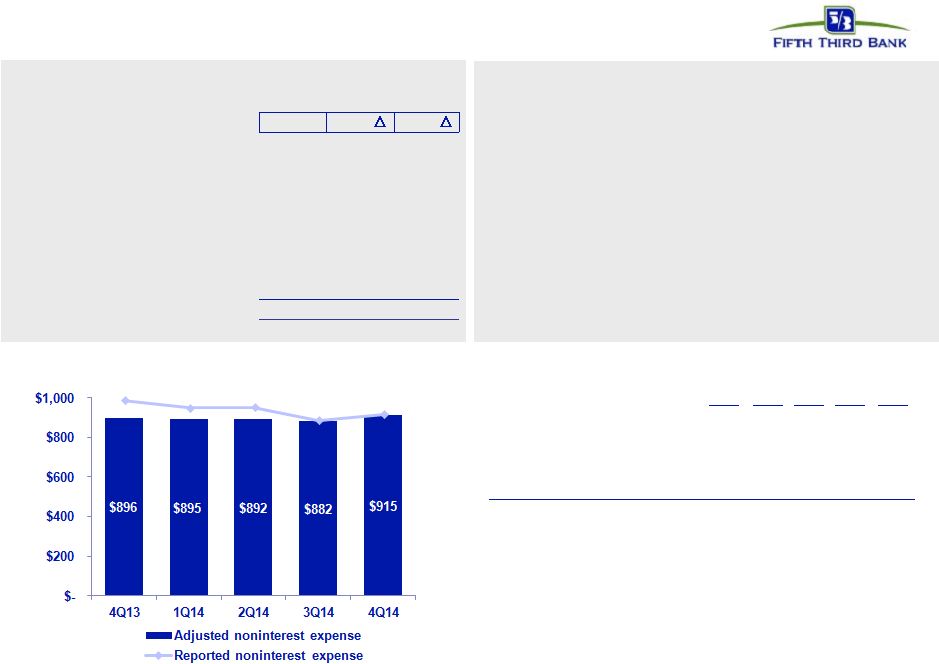 7 © Fifth Third Bank | All Rights Reserved Noninterest expense 1 Net credit-related costs recognized in other noninterest expense were $33MM in 4Q14. This compares with net credit-related costs of $13MM in 3Q14, $6MM in 2Q14, $9MM in 1Q14, and ($12MM) in 4Q13. • Expenses increased sequentially due to higher credit-related costs¹ and personnel expenses • 7% year-over-year decline reflects impact of credit- related costs¹ in both periods, as well as lower employee-related costs — Retail FTE down 10% from 4Q13 as branch roles are consolidated and redefined • Expect higher 1Q15 expenses primarily due to seasonally higher FICA and unemployment expense 4Q14 Seq. YOY ($ in millions) Salaries, wages and incentives $366 3% (6%) Employee benefits 79 5% 1% Net occupancy expense 77 (1%) - Technology and communications 54 2% 2% Equipment expense 30 - 3% Card and processing expense 36 (1%) (2%) Other noninterest expense¹ 276 7% (16%) Total noninterest expense $918 3% (7%) 4Q13 1Q14 2Q14 3Q14 4Q14 Reported noninterest expense $989 $950 $954 $888 $918 Litigation reserve charges (69) (51) (61) (4) 3 Severance expense (8) (4) (1) (2) (6) Debt extinguishment costs (8) - - - - Donation to Fifth Third Foundation (8) - - - - Adjusted noninterest expense $896 $895 $892 $882 $915 5 quarter trend ($MM) Components of noninterest expense Adjustments to remove benefit / (detriment) |
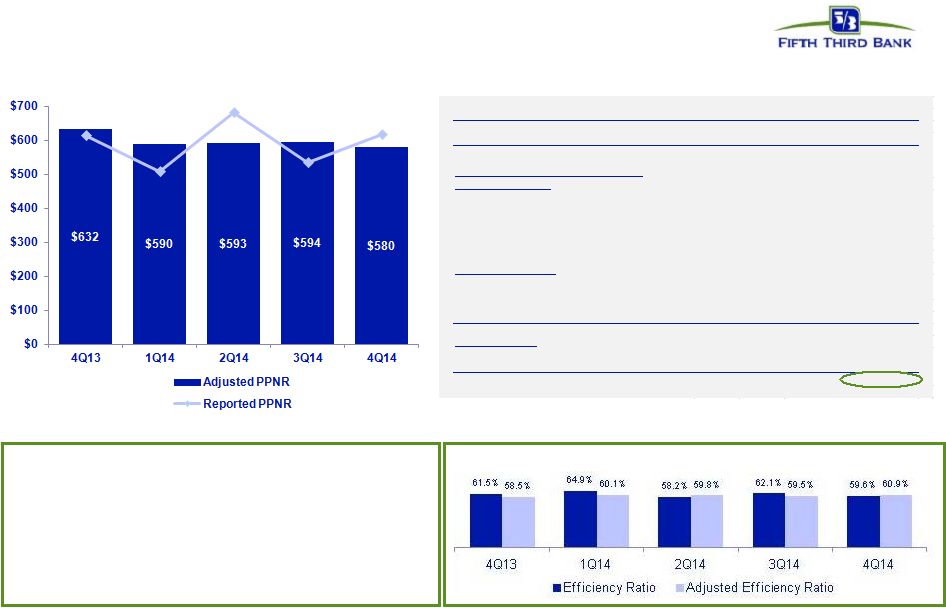 8 © Fifth Third Bank | All Rights Reserved ($ in millions) 4Q13 1Q14 2Q14 3Q14 4Q14 Income before income taxes (U.S. GAAP) (a) $561 $438 $606 $464 $519 Add: Provision expense (U.S. GAAP) (b) 53 69 76 71 99 PPNR (a) + (b) $614 $507 $682 $535 $618 Adjustments to remove (benefit) / detriment : 2 In noninterest income: Gain from sales of Vantiv shares - - (125) - - Vantiv warrant valuation (91) 36 (63) 53 (56) Reduction in equity method income from interest in Vantiv - - 12 - - Land valuation adjusments - - 17 - - Valuation of 2009 Visa total return swap 18 (1) 16 3 19 Securities (gains) / losses (2) (7) (8) (3) (4) In noninterest expense: Debt extinguishment (gains) / losses 8 - - - - Severance expense 8 4 1 2 6 Donation to Fifth Third Foundation 8 - - - - Litigation reserve charges 69 51 61 4 (3) Adjusted PPNR $632 $590 $593 $594 $580 Credit-related items: In noninterest income 5 10 4 (0) 1 In noninterest expense (12) 9 6 13 33 Credit-adjusted PPNR³ $625 $609 $603 $607 $614 Pre-tax pre-provision earnings 1 PPNR trend 1 Non-GAAP measure; see Reg. G reconciliation in appendix. 2 Prior quarters include similar adjustments. 3 There are limitations on the usefulness of credit-adjusted PPNR, including the significant degree to which changes in credit and fair value are integral, recurring components of the Bancorp’s core operations as a financial institution. This measure has been included herein to facilitate a greater understanding of the Bancorp’s financial condition. Note: 4Q14 included an immaterial amount of mortgage repurchase provision. 3Q14, 2Q14, and 1Q14 included the impact of $3MM, $1MM, and $3MM, respectively in mortgage repurchase provision. 4Q13 included a benefit to the mortgage repurchase provision of $26MM. These impacts are reflected in “Credit-related items” and “Adjusted Efficiency Ratio” listed above. PPNR increased 16% sequentially, reflecting impact of $38MM in net benefit in 4Q14 and $59MM in net detriment in 3Q14 from significant items. Excluding those items, adjusted PPNR decreased 2% sequentially, reflecting higher expense, partially offset by the $23MM Vantiv TRA payment. PPNR reconciliation Efficiency ratio |
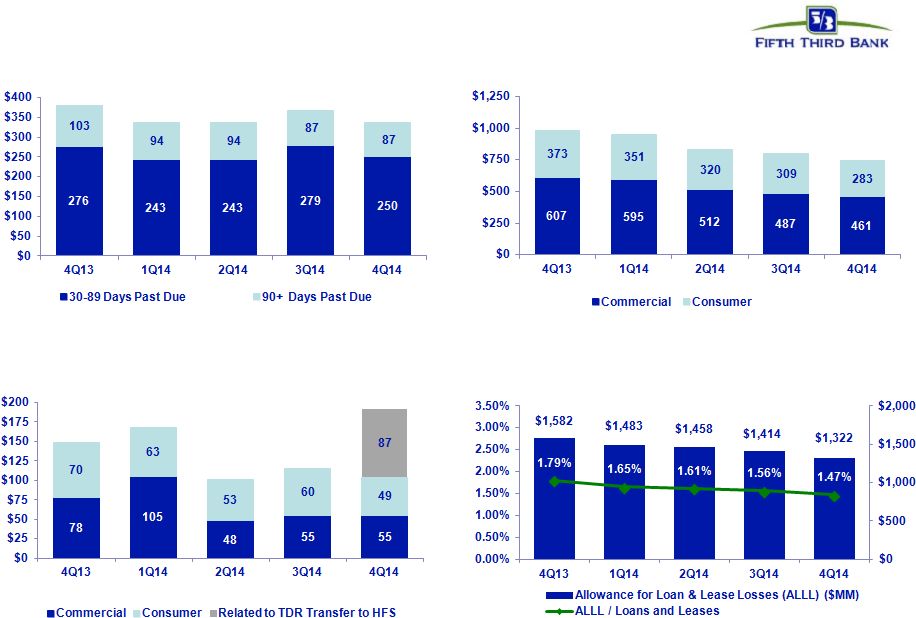 9 © Fifth Third Bank | All Rights Reserved Credit quality overview Net charge-offs ($MM) $148 $101 NCO ratio 0.67% 0.76% 0.45% 0.50% 0.83% $168 HFI Nonperforming assets ($MM) $796 $744 $980 $832 $946 NPAs down 24% from 4Q13; lowest level since 2007 Reserve Coverage Accruing Past Due ($MM) $379 $337 $337 Includes 4Q14 provision expense of $99MM, reflecting $23MM impact of TDR transaction; reserve coverage levels remain solid Total delinquencies declined 11% from 4Q13 NPA ratio 1.10% 1.05% 0.92% 0.88% 0.82% Excluding TDR transfer, net charge-offs down 10% sequentially $115 $366 $191 $337 |
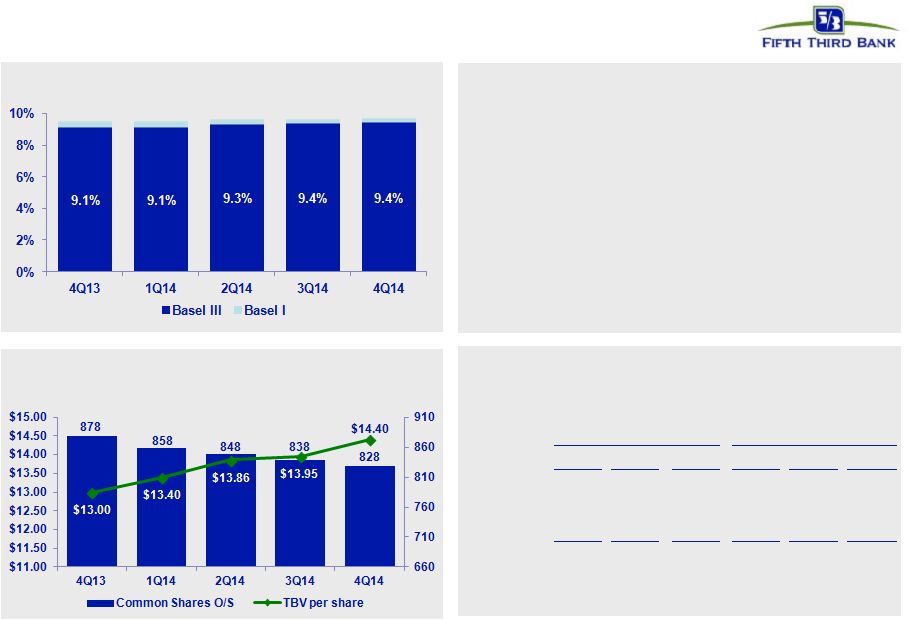 10 © Fifth Third Bank | All Rights Reserved Strong capital position 1 Non-GAAP measure; See Reg. G reconciliation in appendix. 2 Capital ratios estimated; presented under current U.S. capital regulations. The pro forma Basel III Tier I common equity ratio is management’s estimate based upon its current interpretation of the Basel III Final Rule approved in July 2013. 3 1Q15 end of period and average share impacts reflect settlement of the $180MM share repurchase transaction as described in the Form 8-K filed on January 5, 2015. Tier 1 common equity 1 Avg. Diluted Shares Outstanding (MM) • Returned $1.1 billion to common shareholders in 2014 in dividends and share repurchases • 2014 CCAR plan included the potential repurchase of common shares in an amount up to $669MM – Announced $180MM of share repurchases in 4Q14; completed on 1/5/15 3 • 2015 CCAR submitted in early January; capital plan subject to regulatory non-objection EOP share impact (MM) Average share impact (MM) 3Q14 4Q14 1Q15 3Q14 4Q14 1Q15 $150MM ASR 1.0 - - 2.8 0.2 - $225MM ASR 9.4 1.9 - 7.0 4.0 0.3 $180MM ASR 3 - 8.3 0.8 - 6.3 2.7 10.4 10.2 0.8 9.8 10.5 3.0 Capital Actions Impact of Share Repurchases 9.5% 9.5% 9.6% 9.6% 2 9.7% and Tangible Book Value per share 1 |
 11 © Fifth Third Bank | All Rights Reserved Appendix |
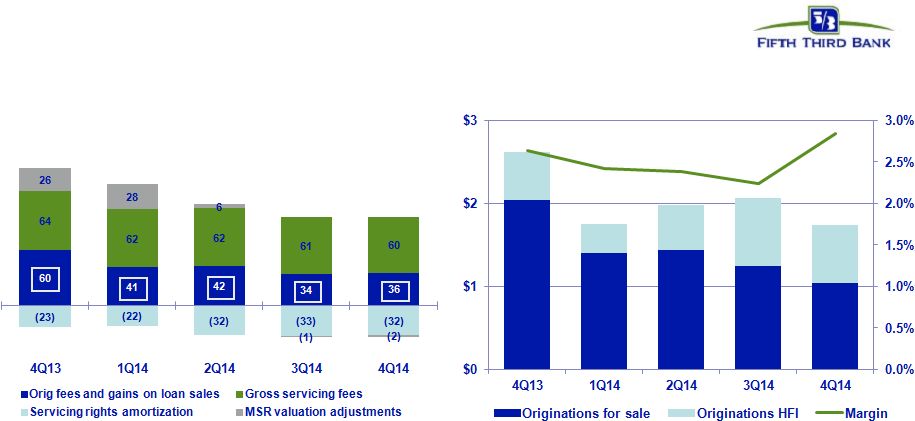 12 © Fifth Third Bank | All Rights Reserved Mortgage banking results • $1.7B in originations; 57% purchase volume – Discontinued broker channel originations in 1Q14 • 4Q14 mortgage drivers: – Origination fees and gain on sale revenue up $1.4MM – Gain on sale margin up 60 bps sequentially – Retaining conforming ARMs and shorter-term fixed-rate production on balance sheet – MSR valuation adjustments of negative $2MM; servicing rights amortization of negative $32MM – $60MM in gross servicing fees Mortgage originations ($B) and gain on sale margin¹ Mortgage Banking Net Revenue ($MM) Note: Numbers may not sum due to rounding. 1 Gain on sale margin represents gains on all loans originated for sale. $61 $78 $126 $109 1 $61 |
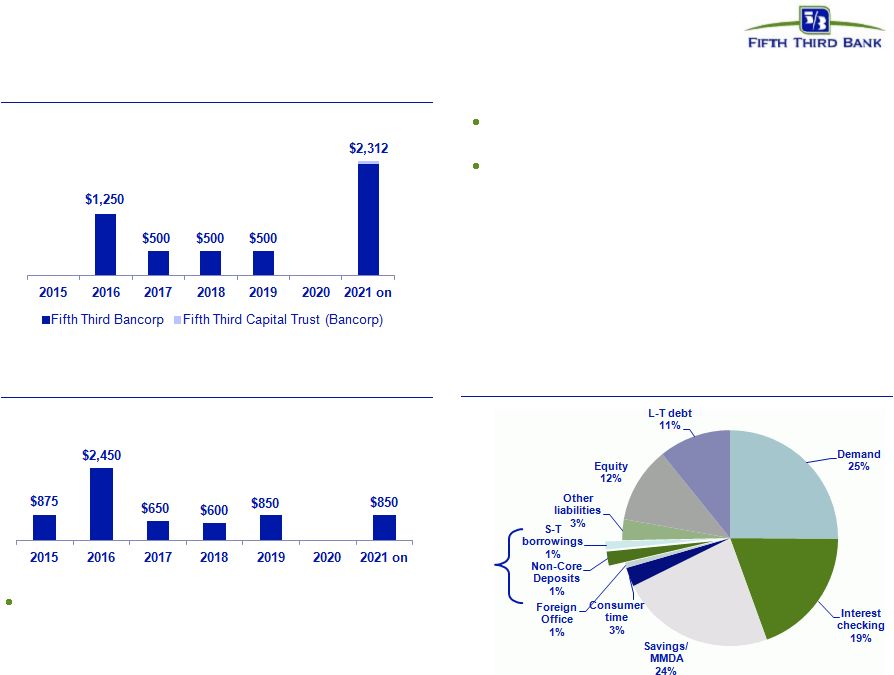 13 Available and contingent borrowing capacity (4Q14): – FHLB ~$14.3B available – Federal Reserve ~$27.4B Holding Company cash at 12/31/14: $2.4B Cash currently sufficient to satisfy all fixed obligations in a stressed environment for over 24 months (debt maturities, common and preferred dividends, interest and other expenses) without accessing capital markets, relying on future dividends from subsidiaries, or any other discretionary actions Holding company unsecured debt maturities ($MM) Bank unsecured debt maturities ($MM – excl. Brokered CDs) Heavily core funded Strong liquidity profile S-T wholesale 2% © Fifth Third Bank | All Rights Reserved |
 14 © Fifth Third Bank | All Rights Reserved Interest rate risk management 1 Repricing percentage or “beta” is the estimated change in yield over 12 months as a result of a shock or ramp 100 bps parallel shift in the yield curve. 2 Actual results may vary from these simulated results due to timing, magnitude, and frequency of interest rate changes, as well as changes in market conditions and management strategies. Strategically positioned balance sheet to limit risk to downside rate scenarios • Balance sheet is well positioned for a rising rate environment — 64% of total loans are floating rate (81% of commercial and 39% of consumer) — Investment portfolio duration of approximately 5 years — Short-term wholesale funding represents only 2% of total funding — $16B in wholesale funding will reprice beyond 1 year • Interest rate sensitivities are based on conservative deposit assumptions — Weighted-average deposit beta of 70% (2004 – 2006 cycle betas ~50%) 1 — No modeled lag in deposit repricing — Modeled DDA runoff of approximately $2.5B (approximately 8%) for each 100 bps increase in rates — For every $1B of incremental DDA runoff beyond what is modeled, asset sensitivity decreases: – 15 bps in year 1 and 28 bps in year 2 in a 100 bps ramp – 35 bps in both year 1 and year 2 in a 100 bps shock • Forecasted balances represent our current expectations regarding balance sheet trends • Static balances assume current composition of balance sheet remains constant • In ramp scenarios, rate changes occur evenly over the first four quarters • In shock scenarios, rate changes are instantaneous +100 bps +200 bps +100 bps +200 bps NII - Asset Sensitivity² Forecast Balances Static Balances Year 1 1.2% 2.2% 1.0% 2.0% Year 2 4.2% 6.5% 4.2% 6.5% Year 1 3.4% 6.3% 3.1% 5.8% Year 2 6.1% 10.0% 6.2% 10.1% +100 bps +200 bps (0.6%) (2.2%) EVE at Risk |
 15 © Fifth Third Bank | All Rights Reserved NPL rollforward NPL HFI Rollforward Commercial 4Q13 1Q14 2Q14 3Q14 4Q14 521 458 464 396 385 Transfers to nonperforming 107 164 141 116 99 Transfers to performing (1) (2) (20) - - Transfers to performing (restructured) (2) (1) (47) - (1) Transfers from held for sale - - - - - Transfers to held for sale - - (1) (3) - Loans sold from portfolio (19) (2) (24) (12) (5) Loan paydowns/payoffs (61) (43) (54) (39) (45) Transfers to other real estate owned (12) (7) (18) (9) (7) Charge-offs (78) (105) (46) (66) (62) Draws/other extensions of credit 3 2 1 2 3 458 464 396 385 367 Consumer 4Q13 1Q14 2Q14 3Q14 4Q14 248 293 269 244 235 Transfers to nonperforming 165 93 85 90 86 Transfers to performing (25) (28) (24) (15) (14) Transfers to performing (restructured) (22) (22) (20) (25) (19) Transfers to held for sale - - - - (24) Loans sold from portfolio - - - - - Loan paydowns/payoffs (24) (29) (11) (5) (5) Transfers to OREO/other repossessed property (20) (24) (24) (21) (20) Charge-offs (30) (15) (30) (33) (27) Draws/other extensions of credit 1 1 (1) - - 293 269 244 235 212 Total NPL 751 733 640 620 579 272 257 226 206 185 Beginning NPL amount Ending Commercial NPL Beginning NPL amount Ending Consumer NPL Total new nonaccrual loans - HFI |
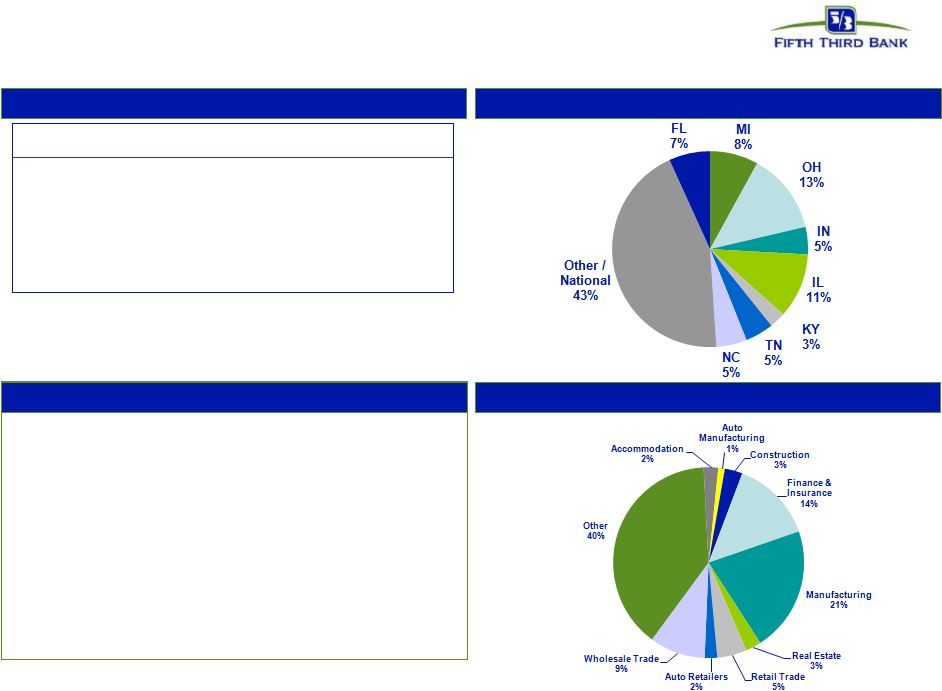 16 Commercial & industrial Loans by geography Credit trends Loans by industry Comments • Commercial & industrial loans represented 45% of total loans and 23% of net charge-offs • C&I loans were down 1% sequentially and increased 4% since 4Q13 * Excludes loans held-for-sale. ($ in millions) 4Q13 1Q14 2Q14 3Q14 4Q14 EOP Balance* $39,316 $40,591 $41,299 $41,072 $40,765 Avg Loans* $38,835 $40,377 $41,374 $41,477 $41,277 90+ days delinquent - $1 - - - as % of loans NM NM NM NM NM NPAs* $290 $304 $265 $278 $246 as % of loans 0.74% 0.75% 0.64% 0.68% 0.60% Net charge-offs $66 $97 $31 $50 $44 as % of loans 0.67% 0.97% 0.30% 0.48% 0.43% C&I © Fifth Third Bank | All Rights Reserved |
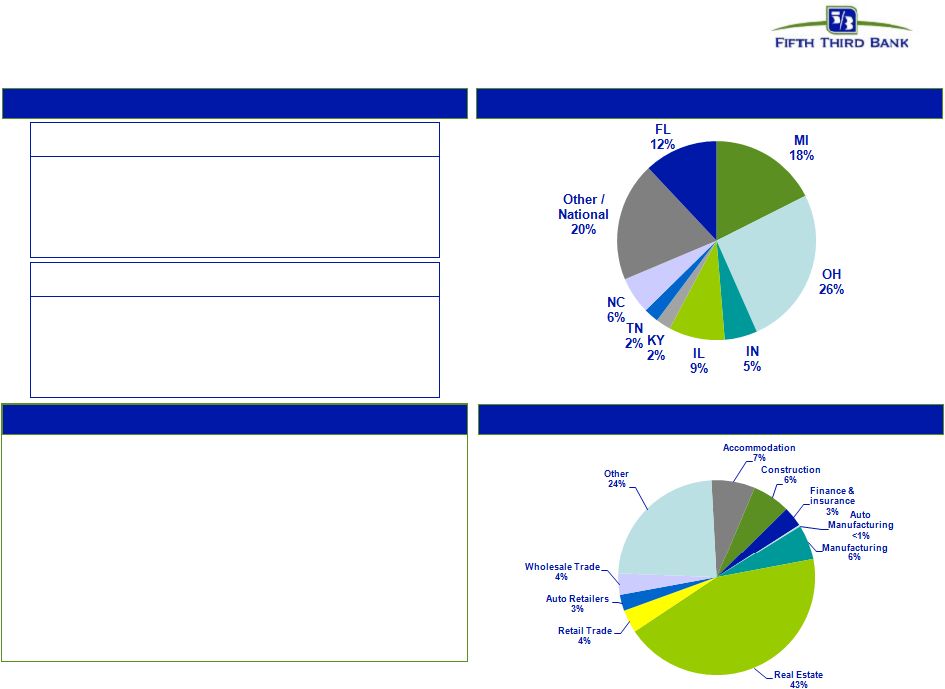     17 Commercial real estate Loans by geography Credit trends Loans by industry Comments • Commercial mortgage loans represented 8% of total loans — Non-owner occupied 4Q14 NCO ratio of 1.1% — Loans from FL/MI represented 34% of portfolio loans and $8MM of portfolio losses in 4Q14 • Commercial construction loans represented 2% of total loans — Portfolio focused on large professional developers — Top 3 categories: Apartments, REIT, and office * Excludes loans held-for-sale. ($ in millions) 4Q13 1Q14 2Q14 3Q14 4Q14 EOP Balance* $1,039 $1,218 $1,424 $1,702 $2,069 Avg Loans* $952 $1,116 $1,362 $1,563 $1,909 NPAs* $59 $46 $31 $19 $16 as % of loans 5.53% 3.68% 2.17% 1.09% 0.75% Net charge-offs $4 $5 $8 - - as % of loans 1.65% 1.66% 2.26% (0.11%) (0.01%) Commercial construction ($ in millions) 4Q13 1Q14 2Q14 3Q14 4Q14 EOP Balance* $8,066 $7,958 $7,805 $7,564 $7,399 Avg Loans* $8,047 $7,981 $7,885 $7,633 $7,480 NPAs* $252 $240 $212 $186 $195 as % of loans 3.09% 2.98% 2.69% 2.43% 2.62% Net charge-offs $8 $3 $9 $5 $10 as % of loans 0.40% 0.16% 0.44% 0.24% 0.53% Commercial mortgage © Fifth Third Bank | All Rights Reserved |
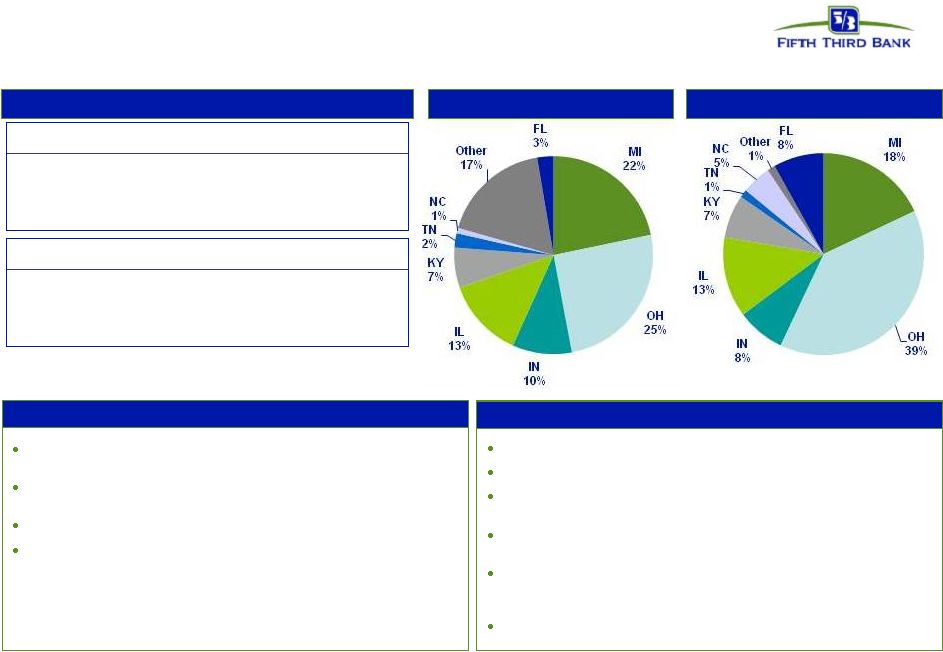
  18 © Fifth Third Bank | All Rights Reserved Residential mortgage 1 st liens: 100%; weighted average LTV: 73.5% Weighted average origination FICO: 754 Origination FICO distribution: <660 5%; 660-689 5%; 690-719 9%; 720-749 14%; 750+ 61%; Other^ 6% (note: loans <660 includes CRA loans and FHA/VA loans) Origination LTV distribution: <=70 39%; 70.1-80 36%; 80.1-90 7%; 90.1-95 5%; >95 13% Vintage distribution: 2014: 18%, 2013: 21%; 2012 21%; 2011 12%; 2010 7%; 2009 4%; 2008 3%; 2007 3%; 2006 3%; 2005 4%; 2004 and prior 4% 15% originated through 3 rd party; performance similar to direct Loans by geography Credit trends Portfolio details Comments ^ Includes acquired loans where FICO at origination is not available * Excludes loans held-for-sale • Residential mortgage loans represented 14% of total loans and 49% of net charge-offs; 7% excluding TDR transaction • Net charge-offs increased by $85MM in 4Q14 and included $87MM related to the transfer of TDRs to held-for-sale — OH, FL, and MI account for 30%, 22%, and 19% of residential mortgage net charge-offs, respectively ($ in millions) 4Q13 1Q14 2Q14 3Q14 4Q14 EOP Balance* $12,680 $12,626 $12,652 $12,941 $12,389 Avg Loans* $12,609 $12,659 $12,611 $12,785 $13,046 90+ days delinquent $66 $56 $60 $57 $55 as % of loans 0.52% 0.44% 0.47% 0.44% 0.44% NPAs* $223 $201 $172 $164 $126 as % of loans 1.76% 1.59% 1.36% 1.27% 1.01% Net charge-offs $13 $15 $8 $9 $94 as % of loans 0.39% 0.49% 0.24% 0.28% 2.87% Residential mortgage |
 19 © Fifth Third Bank | All Rights Reserved Home equity loans represented 10% of total loans and 6% of net charge-offs Approximately 12% of portfolio in broker product generated 25% total loss 38% of Fifth Third 2 nd liens are behind Fifth Third 1 st liens 2005/2006 vintages represent approximately 23% of portfolio; account for 48% of losses Home equity 1 st liens: 34%; 2 nd liens: 66% Weighted average origination FICO: 753 Origination FICO distribution^: <660 3%; 660-689 7%; 690-719 12%; 720-749 16%; 750+ 54%; Other 8% Average CLTV: 72%; Origination CLTV distribution: <=70 41%; 70.1- 80 24%; 80.1-90 18%; 90.1-95 6%; >95 11% Vintage distribution: 2014: 8%, 2013: 6%; 2012 4%; 2011 3%; 2010 2%; 2009 3%; 2008 9%; 2007 9%; 2006 12%; 2005 11%; 2004 and prior 33% % through broker channels: 12% WA FICO: 734 brokered, 756 direct; WA CLTV: 88% brokered; 70% direct Portfolio details Comments Brokered loans by geography Direct loans by geography Credit trends Note: Brokered and direct home equity net charge-off ratios are calculated based on end of period loan balances ^ Includes acquired loans where FICO at origination is not available * Excludes loans held-for-sale ($ in millions) 4Q13 1Q14 2Q14 3Q14 4Q14 EOP Balance* $1,190 $1,155 $1,131 $1,094 $1,062 90+ days delinquent - - - - - as % of loans NM NM NM NM NM Net charge-offs $8 $5 $7 $4 $3 as % of loans 2.81% 1.85% 2.35% 1.42% 1.05% Home equity - brokered ($ in millions) 4Q13 1Q14 2Q14 3Q14 4Q14 EOP Balance* $8,056 $7,970 $7,925 $7,893 $7,824 90+ days delinquent - - - - - as % of loans NM NM NM NM NM Net charge-offs $18 $11 $11 $10 $8 as % of loans 0.87% 0.55% 0.58% 0.51% 0.42% Home equity - direct |
 20 © Fifth Third Bank | All Rights Reserved Regulation G Non-GAAP reconciliation Fifth Third Bancorp and Subsidiaries Regulation G Non-GAAP Reconcilation $ and shares in millions (unaudited) December September June March December 2014 2014 2014 2014 2013 Income before income taxes (U.S. GAAP) 519 464 606 438 561 Add: Provision expense (U.S. GAAP) 99 71 76 69 53 Pre-provision net revenue 618 535 682 507 614 Net income available to common shareholders (U.S. GAAP) 362 328 416 309 383 Add: Intangible amortization, net of tax 1 1 1 1 1 Tangible net income available to common shareholders 363 329 417 310 384 Tangible net income available to common shareholders (annualized) (a) 1,440 1,305 1,673 1,257 1,523 Average Bancorp shareholders' equity (U.S. GAAP) 15,644 15,486 15,157 14,862 14,757 Less: Average preferred stock (1,331) (1,331) (1,119) (1,034) (703) Average goodwill (2,416) (2,416) (2,416) (2,416) (2,416) Average intangible assets and other servicing rights (17) (16) (17) (19) (20) Average tangible common equity (b) 11,880 11,723 11,605 11,393 11,618 Total Bancorp shareholders' equity (U.S. GAAP) 15,626 15,404 15,469 14,826 14,589 Less: Preferred stock (1,331) (1,331) (1,331) (1,034) (1,034) Goodwill (2,416) (2,416) (2,416) (2,416) (2,416) Intangible assets and other servicing rights (16) (16) (17) (18) (19) Tangible common equity, including unrealized gains / losses (c) 11,863 11,641 11,705 11,358 11,120 Less: Accumulated other comprehensive income (429) (301) (382) (196) (82) Tangible common equity, excluding unrealized gains / losses (d) 11,434 11,340 11,323 11,162 11,038 Total assets (U.S. GAAP) 138,706 134,188 132,562 129,654 130,443 Less: Goodwill (2,416) (2,416) (2,416) (2,416) (2,416) Intangible assets and other servicing rights (16) (16) (17) (18) (19) Tangible assets, including unrealized gains / losses (e) 136,274 131,756 130,129 127,220 128,008 Less: Accumulated other comprehensive income / loss, before tax (660) (463) (588) (302) (126) Tangible assets, excluding unrealized gains / losses (f) 135,614 131,293 129,541 126,918 127,882 Common shares outstanding (g) 824 834 844 848 855 Ratios: Return on average tangible common equity (a) / (b) 12.1% 11.1% 14.4% 11.0% 13.1% Tangible common equity (excluding unrealized gains/losses) (d) / (f) 8.43% 8.64% 8.74% 8.79% 8.63% Tangible common equity (including unrealized gains/losses) (c) / (e) 8.71% 8.84% 9.00% 8.93% 8.69% Tangible book value per share (c) / (g) $14.40 $13.95 $13.86 $13.40 $13.00 For the Three Months Ended |
 21 © Fifth Third Bank | All Rights Reserved Regulation G Non-GAAP reconciliation Fifth Third Bancorp and Subsidiaries Regulation G Non-GAAP Reconcilation $ and shares in millions (unaudited) December September June March December 2014 2014 2014 2014 2013 Total Bancorp shareholders' equity (U.S. GAAP) 15,626 15,404 15,469 14,826 14,589 Goodwill and certain other intangibles (2,476) (2,484) (2,484) (2,490) (2,492) Unrealized gains (429) (301) (382) (196) (82) Qualifying trust preferred securities 60 60 60 60 60 Other (17) (18) (19) (18) 19 Tier I capital 12,764 12,661 12,644 12,182 12,094 Less: Preferred stock (1,331) (1,331) (1,331) (1,034) (1,034) Qualifying trust preferred securities (60) (60) (60) (60) (60) Qualifying noncontrolling interest in consolidated subsidiaries (1) (1) (1) (1) (37) Tier I common equity (a) 11,372 11,269 11,252 11,087 10,963 Risk-weighted assets, determined in accordance with prescribed regulatory requirements (b) 117,887 116,917 117,117 116,622 115,969 Ratio: Tier I common equity (a) / (b) 9.65% 9.64% 9.61% 9.51% 9.45% Basel III - Estimated Tier 1 common equity ratio December September June March December 2014 2014 2014 2014 2013 Tier 1 common equity (Basel I) 11,372 11,269 11,252 11,087 10,963 Add: Adjustment related to capital components 84 99 96 99 82 Estimated Tier 1 common equity under final Basel III rules without AOCI (opt out)(c) 11,456 11,368 11,348 11,186 11,045 Add: Adjustment related to AOCI 429 301 382 196 82 Estimated Tier 1 common equity under final Basel III rules with AOCI (non opt out)(d) 11,885 11,669 11,730 11,382 11,127 Estimated risk-weighted assets under final Basel III rules (e) 122,027 121,219 122,465 122,659 122,074 Estimated Tier 1 common equity ratio under final Basel III rules (opt out) (c) / (e) 9.39% 9.38% 9.27% 9.12% 9.05% Estimated Tier 1 common equity ratio under final Basel III rules (non opt out) (d) / (e) 9.74% 9.63% 9.58% 9.28% 9.12% (c), (d) (e) Under the final Basel III rules, non-advanced approach banks are permitted to make a one-time election to opt out of the requirement to include AOCI in Tier 1 common equity. Other adjustments include mortgage servicing rights and deferred tax assets subject to threshold limitations and deferred tax liabilities related to intangible assets. Key differences under Basel III in the calculation of risk-weighted assets compared to Basel I include: (1) Risk weighting for commitments under 1 year; (2) Higher risk weighting for exposures to securitizations, past due loans, foreign banks and certain commercial real estate; (3) Higher risk weighting for mortgage servicing rights and deferred tax assets that are under certain thresholds as a percent of Tier 1 capital; and (4) Derivatives are differentiated between exchange clearing and over-the-counter and the 50% risk-weight cap is removed. For the Three Months Ended |