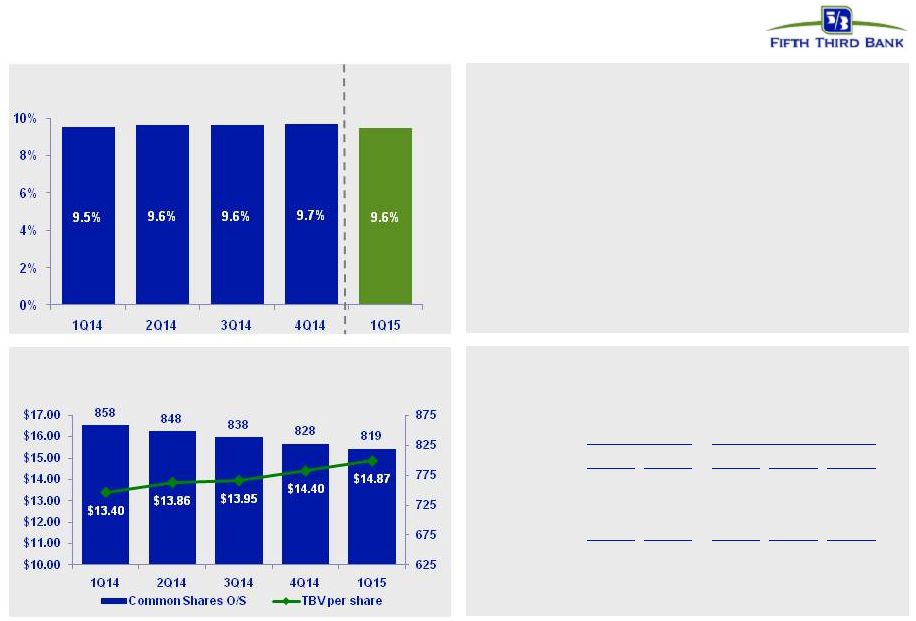
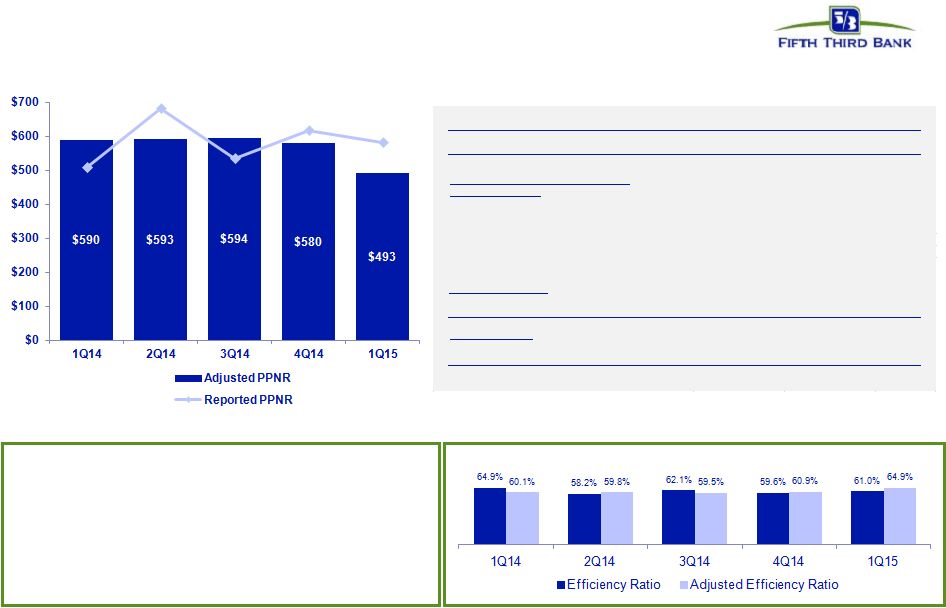
20 © Fifth Third Bank | All Rights Reserved Regulation G Non-GAAP reconciliation Fifth Third Bancorp and Subsidiaries Regulation G Non-GAAP Reconcilation $ and shares in millions (unaudited) March December September June March 2015 2014 2014 2014 2014 Income before income taxes (U.S. GAAP) 515 519 464 606 438 Add: Provision expense (U.S. GAAP) 69 99 71 76 69 Pre-provision net revenue 584 618 535 682 507 Net income available to common shareholders (U.S. GAAP) 367 362 328 416 309 Add: Intangible amortization, net of tax - 1 1 1 1 Tangible net income available to common shareholders 367 363 329 417 310 Tangible net income available to common shareholders (annualized) (a) 1,488 1,440 1,305 1,673 1,257 Average Bancorp shareholders' equity (U.S. GAAP) 15,820 15,644 15,486 15,157 14,862 Less: Average preferred stock (1,331) (1,331) (1,331) (1,119) (1,034) Average goodwill (2,416) (2,416) (2,416) (2,416) (2,416) Average intangible assets and other servicing rights (15) (17) (16) (17) (19) Average tangible common equity (b) 12,058 11,880 11,723 11,605 11,393 Total Bancorp shareholders' equity (U.S. GAAP) 15,885 15,626 15,404 15,469 14,826 Less: Preferred stock (1,331) (1,331) (1,331) (1,331) (1,034) Goodwill (2,416) (2,416) (2,416) (2,416) (2,416) Intangible assets and other servicing rights (15) (16) (16) (17) (18) Tangible common equity, including unrealized gains / losses (c) 12,123 11,863 11,641 11,705 11,358 Less: Accumulated other comprehensive income (588) (429) (301) (382) (196) Tangible common equity, excluding unrealized gains / losses (d) 11,535 11,434 11,340 11,323 11,162 Total assets (U.S. GAAP) 140,499 138,706 134,188 132,562 129,654 Less: Goodwill (2,416) (2,416) (2,416) (2,416) (2,416) Intangible assets and other servicing rights (15) (16) (16) (17) (18) Tangible assets, including unrealized gains / losses (e) 138,068 136,274 131,756 130,129 127,220 Less: Accumulated other comprehensive income / loss, before tax (905) (660) (463) (588) (302) Tangible assets, excluding unrealized gains / losses (f) 137,163 135,614 131,293 129,541 126,918 Common shares outstanding (g) 815 824 834 844 848 Ratios: Return on average tangible common equity (a) / (b) 12.3% 12.1% 11.1% 14.4% 11.0% Tangible common equity (excluding unrealized gains/losses) (d) / (f) 8.41% 8.43% 8.64% 8.74% 8.79% Tangible common equity (including unrealized gains/losses) (c) / (e) 8.78% 8.71% 8.84% 9.00% 8.93% Tangible book value per share (c) / (g) $14.87 $14.40 $13.95 $13.86 $13.40 For the Three Months Ended |