 Annual Meeting of Shareholders April 19, 2016 Please refer to earnings release dated January 21, 2016 and 10-K dated February 25, 2016 for further information, including full results reported on a U.S. GAAP basis. Exhibit 99.1 © Fifth Third Bank | All Rights Reserved |
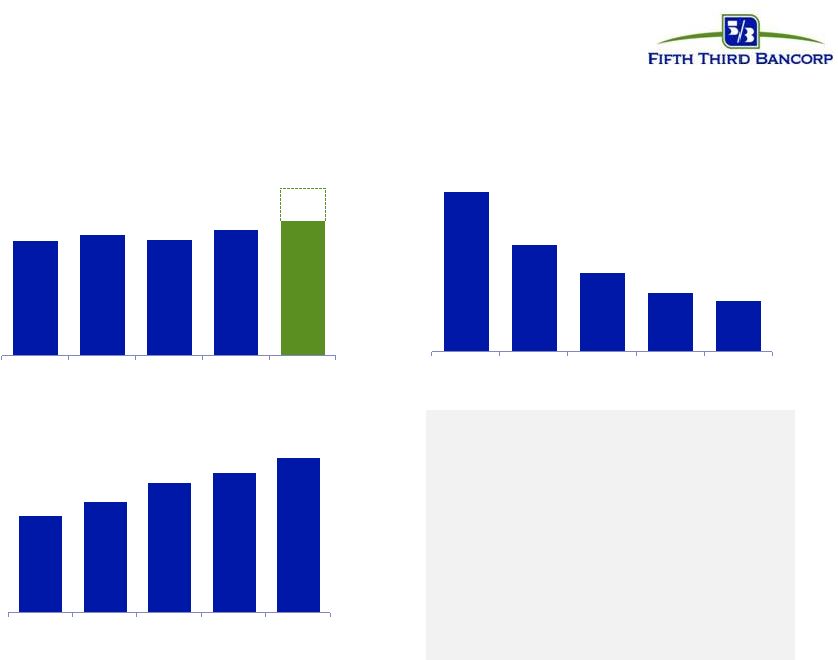
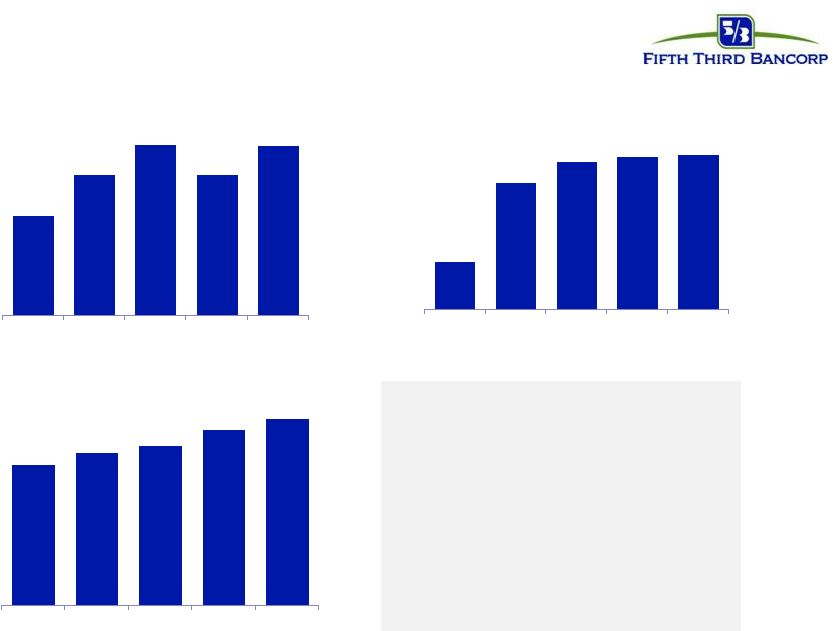 2 © Fifth Third Bank | All Rights Reserved 24% 63% 74% 76% 77% 2011 2012 2013 2014 2015 2015 performance at a glance $1.18 $1.66 $2.02 $1.66 $2.01 2011 2012 2013 2014 2015 Diluted earnings per share 1 Includes dividends declared and share repurchases. 2013 is net of the issuance of shares valued at $398MM related to the Series G preferred stock conversion on July 1, 2013. 2012, 2013, 2014 and 2015 also include repurchases of shares in the amount of after-tax gains on the sale of Vantiv shares. Book value per share $13.92 $15.10 $15.85 $17.35 $18.48 2011 2012 2013 2014 2015 Total payout ratio 1 — Strong earnings growth partly driven by Vantiv gains — Consistent top quartile payout ratios over the last 3 years — Track record of increasing book value over time |
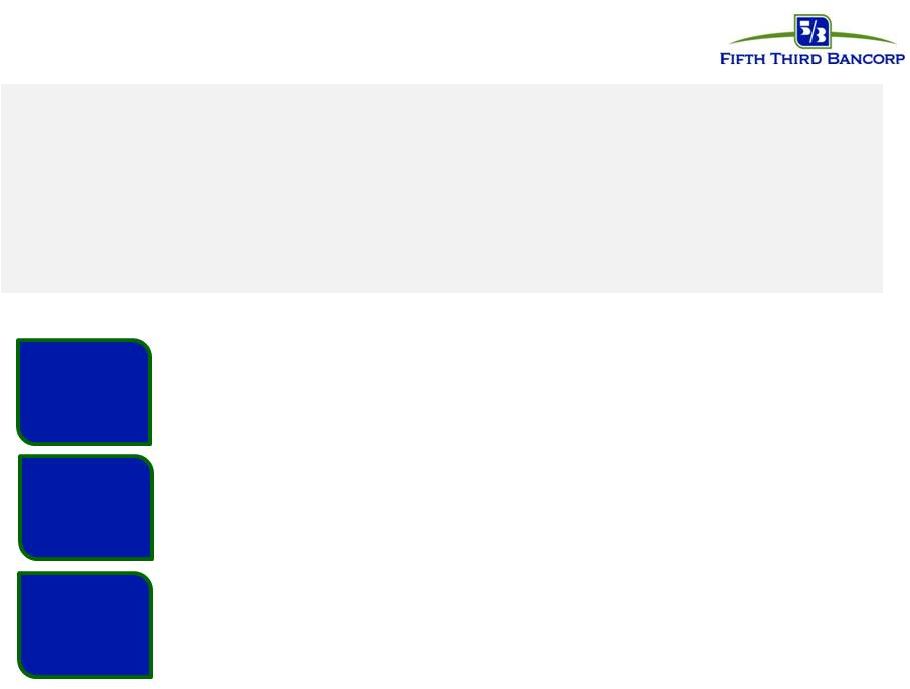
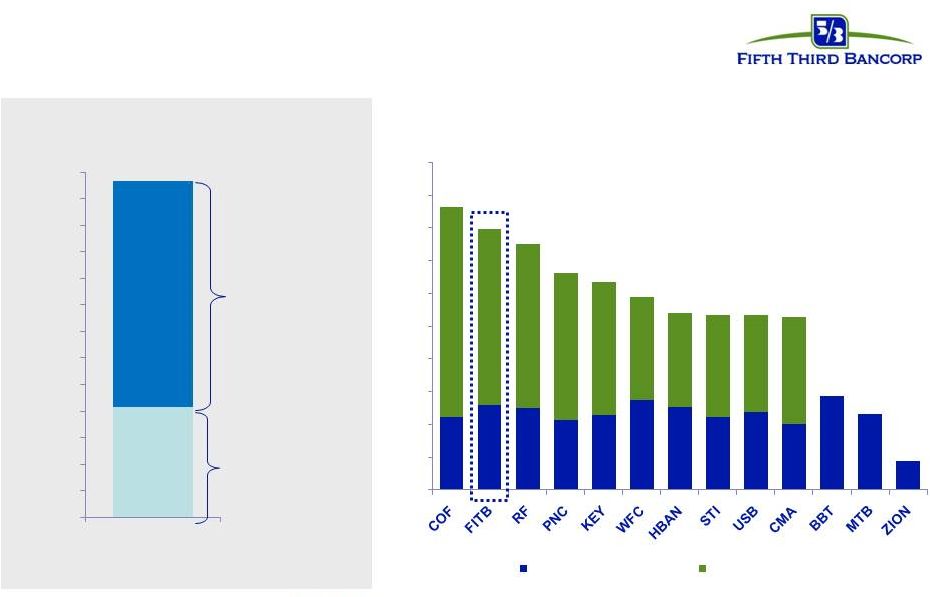 © Fifth Third Bank | All Rights Reserved 3 Strong capital return to shareholders 2015 total payout yield (regional peers) Stable common stock dividend and continued active share repurchase program ~$1.3 billion in capital returned to common shareholders $0 $100 $200 $300 $400 $500 $600 $700 $800 $900 $1,000 $1,100 $1,200 $1,300 2015 Payouts ($MM) $850MM common stock repurchases $417MM common dividends declared Source: SNL Financial. Total payout yield equals dividend yield plus shares repurchased ($) / reported market cap at 12/31/15. 0% 1% 2% 3% 4% 5% 6% 7% 8% 9% 10% Dividend Payout Yield Buyback Yield |
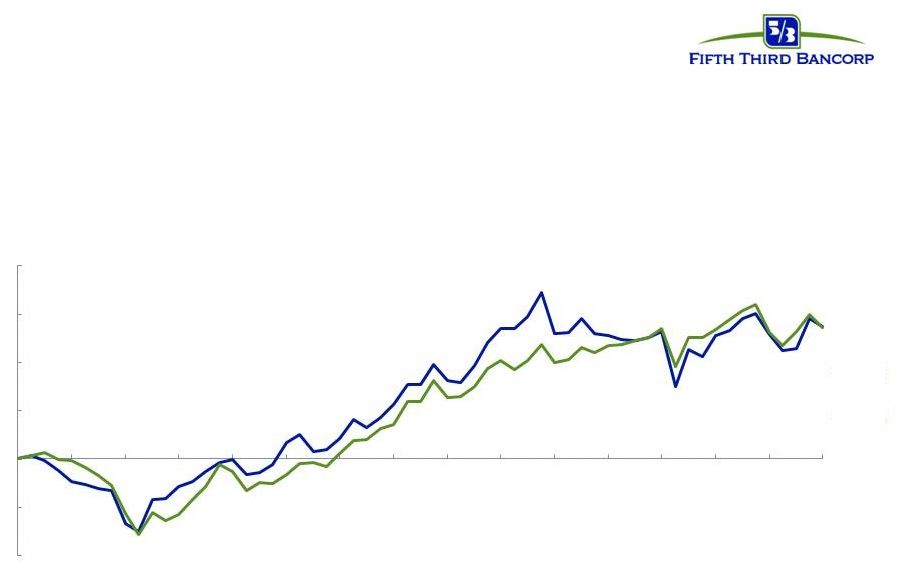 © Fifth Third Bank | All Rights Reserved 4 Performance track-record Total Shareholder Return Fifth Third (FITB) vs. KBW Regional Bank Index (BKX) Source: Bloomberg; refer to 10-K dated February 25, 2016 for additional views of total shareholder return. Total shareholder return includes dividend reinvestment. 5 years 2010-2015 BKX 54.7% FITB 55.0% (40%) (20%) 0% 20% 40% 60% 80% 12/10 4/11 8/11 12/11 4/12 8/12 12/12 4/13 8/13 12/13 4/14 8/14 12/14 4/15 8/15 12/15 |
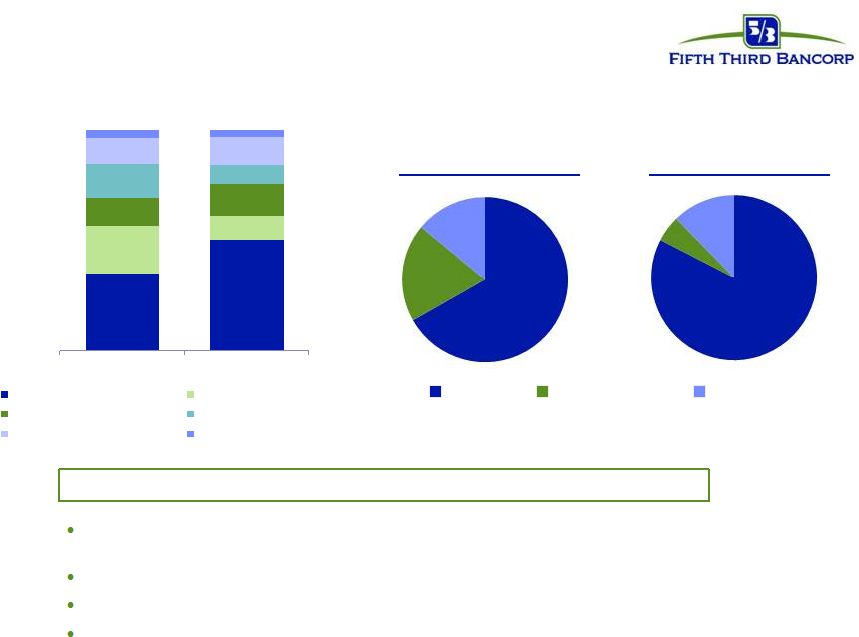 5 © Fifth Third Bank | All Rights Reserved We have reduced our risk exposure… Reduced exposure to commercial real estate, commodities and leveraged lending and exited the mortgage broker business Less volatility in stressed scenarios Significant improvement in commercial loan customer credit profile Greater mix of stable core deposits Better Balance Sheet Positioning EOP Portfolio Loan Balances 35% 50% 22% 11% 13% 14% 15% 9% 12% 12% 3% 3% 4Q07 4Q15 C&I + Commercial Lease Commercial Real Estate Resi Mortgage Home Equity Auto Loans Other Consumer 83% 5% 12% Fourth Quarter 2015 67% 19% 14% Fourth Quarter 2007 Core Deposits Short-term Borrowing Long-term Borrowing Funding Mix |
 © Fifth Third Bank | All Rights Reserved 6 …While strengthening our balance sheet 2.23% 1.49% 1.10% 0.82% 0.70% 2011 2012 2013 2014 2015 Nonperforming asset ratio 4 9.4% 9.5% 9.5% 9.7% 9.8% 2011 2012 2013 2014 2015 10.5% 3 Tier 1 common ratio 1 / Common Equity Tier 1 Ratio (Basel III) 2 157% 180% 211% 228% 252% 2011 2012 2013 2014 2015 ALLL / NPLs 1 Non-GAAP measure; see Reg. G reconciliation in appendix. 2 Represents Basel III Transitional Common Equity Tier 1 ratio under the final capital rule, subject to phase-in periods. 3 Adjusted CET1 ratio includes unrealized after-tax Vantiv position as of 12/31/15. [{($47.42 Vantiv stock price x 35M shares) LESS the carrying value of Vantiv of $360M] x 0.65 ] / Risk-Weighted Assets .. Assumes no share buyback from Vantiv sales. 4 Portfolio NPAs • Strong Common Equity Tier 1 2 above targets and requirements • Problem assets at lowest levels since before crisis • Maintaining prudent level of reserves |
 7 © Fifth Third Bank | All Rights Reserved Commercial Bank Stability Growth Profitability • Enhancing fee revenues – insurance services, capital markets, treasury management and investment advisors • Deploying new sales tools to drive more profitable growth • Disciplined expense management and optimal resource allocation Current Market Trends • Intense competition from banks and non-banks is driving the need to develop expertise in targeted industries • Commercial customers expect highly customized advice and end-to-end, industry- specific solutions • Accelerating technological innovation is driving mid-market companies to more sophisticated products and services as they transform their businesses in a global marketplace Key Areas of Focus • Deploying capital toward attractive growth opportunities (e.g. asset based lending & key industry verticals) • New, experienced talent – new Head of Insurance Services & other leaders in industry verticals • Focusing on portfolio management, credit quality, and returns |
 © Fifth Third Bank | All Rights Reserved 8 Retail Bank • Right-sizing our branch network • Enhancing our product and service offerings • Digitizing branch operations Current Market Trends • Digital channels are integral to how people shop for, apply for, and use financial services; 80%+ of Fifth Third customers have used multiple channels in the last six months • Digital channel experiences are generally higher rated than traditional service channels • Customers expect access to products and services more quickly Key Areas of Focus Stability Growth Profitability • Exiting higher risk businesses • Credit quality improvements • Investing in regulation / compliance • Providing an enhanced digital and integrated customer experience • Driving household growth with new products • Growing deposits with targeted marketing offers |
 9 © Fifth Third Bank | All Rights Reserved Payments & Commerce Solutions • Simplifying and enhancing value proposition of our product offerings • Leveraging innovation, partnerships, and acquisition to develop and deploy new products and solutions Current Market Trends • Continued shift away from cash & paper checks to electronic payments – Commercial customers expect additional insights into their businesses to help drive revenue growth and efficiencies • Non-bank competitors are evolving quickly to try to displace banks in the value chain • Risks around cyber threats and fraud costs driving the need for greater transparency, control, and automation across entire payment life cycle Key Areas of Focus Stability Growth Profitability • Completing EMV and Card Not Present initiative which will reduce fraud and improve the customer experience • Currently implementing risk and compliance initiatives • Optimizing relationships • Reducing costs to deliver and increasing margin |
 © Fifth Third Bank | All Rights Reserved 10 Investing in our Community • Directing donations toward cancer research with purchases made using Fifth Third SU2C debit or credit card • More than $6 million raised to date Veterans Assistance • Job search coaching for those leaving active duty • Fifth Third volunteers make critical repairs and improvements to veterans homes, including modifications for disabled vets • Fifth Third contributed more than $7.8 million in employee and corporate gifts across our footprint. |
 11 © Fifth Third Bank | All Rights Reserved Investing in our Community In February 2016, we announced a $27.5 billion Community Commitment, including: • $20 billion in mortgage credit, small business loans & investments • $7.5 billion in community development loans and other investments • $77 million of related investments such as down payment assistance, homebuyer education, and financial literacy programs |
 12 © Fifth Third Bank | All Rights Reserved Accolades 2015 Gallup Great Workplace Award for the 3 rd time Recognized as “Best Brand in Small Business Banking” by Greenwich Associates Green Business Award Honoree March 2015 2015 Disability Matters honoree, presented by Springboard Consulting LLC for the 3 rd consecutive year Significant national and local recognition across diverse areas Business Practices • Employment • Green Initiatives • Customer Service • Philanthropy |
 13 © Fifth Third Bank | All Rights Reserved Fifth Third priorities Strong performance through various business cycles Improving operating efficiency and effectiveness Investing prudently to drive shareholder value |
 © Fifth Third Bank | All Rights Reserved |
 © Fifth Third Bank | All Rights Reserved 15 Cautionary statement This release contains statements that we believe are “forward-looking statements” within the meaning of Section 27A of the Securities Act of 1933, as amended, and Rule 175 promulgated thereunder, and Section 21E of the Securities Exchange Act of 1934, as amended, and Rule 3b-6 promulgated thereunder. These statements relate to our financial condition, results of operations, plans, objectives, future performance or business. They usually can be identified by the use of forward-looking language such as “will likely result,” “may,” “are expected to,” “is anticipated,” “estimate,” “forecast,” “projected,” “intends to,” or may include other similar words or phrases such as “believes,” “plans,” “trend,” “objective,” “continue,” “remain,” or similar expressions, or future or conditional verbs such as “will,” “would,” “should,” “could,” “might,” “can,” or similar verbs. You should not place undue reliance on these statements, as they are subject to risks and uncertainties, including but not limited to the risk factors set forth in our most recent Annual Report on Form 10-K as updated from time to time by our Quarterly Reports on Form 10-Q. When considering these forward-looking statements, you should keep in mind these risks and uncertainties, as well as any cautionary statements we may make. Moreover, you should treat these statements as speaking only as of the date they are made and based only on information then actually known to us. There is a risk that additional information may become known during the company’s quarterly closing process or as a result of subsequent events that could affect the accuracy of the statements and financial information contained herein. There are a number of important factors that could cause future results to differ materially from historical performance and these forward-looking statements. Factors that might cause such a difference include, but are not limited to: (1) general economic conditions and weakening in the economy, specifically in the real estate market, either nationally or in the states in which Fifth Third, one or more acquired entities and/or the combined company do business, are less favorable than expected; (2) deteriorating credit quality; (3) political developments, wars or other hostilities may disrupt or increase volatility in securities markets or other economic conditions; (4) changes in the interest rate environment reduce interest margins; (5) prepayment speeds, loan origination and sale volumes, charge-offs and loan loss provisions; (6) Fifth Third’s ability to maintain required capital levels and adequate sources of funding and liquidity; (7) maintaining capital requirements and adequate sources of funding and liquidity may limit Fifth Third’s operations and potential growth; (8) changes and trends in capital markets; (9) problems encountered by larger or similar financial institutions may adversely affect the banking industry and/or Fifth Third; (10) competitive pressures among depository institutions increase significantly; (11) effects of critical accounting policies and judgments; (12) changes in accounting policies or procedures as may be required by the Financial Accounting Standards Board (FASB) or other regulatory agencies; (13) legislative or regulatory changes or actions, or significant litigation, adversely affect Fifth Third, one or more acquired entities and/or the combined company or the businesses in which Fifth Third, one or more acquired entities and/or the combined company are engaged, including the Dodd-Frank Wall Street Reform and Consumer Protection Act; (14) ability to maintain favorable ratings from rating agencies; (15) fluctuation of Fifth Third’s stock price; (16) ability to attract and retain key personnel; (17) ability to receive dividends from its subsidiaries; (18) potentially dilutive effect of future acquisitions on current shareholders’ ownership of Fifth Third; (19) effects of accounting or financial results of one or more acquired entities; (20) difficulties from Fifth Third’s investment in, relationship with, and nature of the operations of Vantiv, LLC; (21) loss of income from any sale or potential sale of businesses that could have an adverse effect on Fifth Third’s earnings and future growth; (22) difficulties in separating the operations of any branches or other assets divested; (23) inability to achieve expected benefits from branch consolidations and planned sales within desired timeframes, if at all; (24) ability to secure confidential information and deliver products and services through the use of computer systems and telecommunications networks; and (25) the impact of reputational risk created by these developments on such matters as business generation and retention, funding and liquidity. You should refer to our periodic and current reports filed with the Securities and Exchange Commission, or “SEC,” for further information on other factors, which could cause actual results to be significantly different from those expressed or implied by these forward-looking statements. |
 © Fifth Third Bank | All Rights Reserved 16 Regulation G Non-GAAP reconciliation Fifth Third Bancorp and Subsidiaries Regulation G Non-GAAP Reconcilation $ and shares in millions (unaudited) 2015 2014 2013 2012 2011 Total Bancorp shareholders' equity (U.S. GAAP) N/A $15,626 $14,589 $13,716 $13,201 Goodwill and certain other intangibles N/A (2,476) (2,492) (2,499) (2,514) Unrealized gains N/A (429) (82) (375) (470) Qualifying trust preferred securities N/A 60 60 810 2,248 Other N/A (17) 19 33 38 Tier I capital N/A 12,764 12,094 11,685 12,503 Less: Preferred stock N/A (1,331) (1,034) (398) (398) Qualifying trust preferred securities N/A (60) (60) (810) (2,248) Qualifying noncontrolling interest in consolidated subsidiaries N/A (1) (37) (48) (50) Tier I common equity (a) N/A 11,372 10,963 10,429 9,807 Risk-weighted assets, determined in accordance with prescribed regulatory requirements (b) N/A 117,878 115,969 109,301 104,219 Ratio: Tier I common equity (a) / (b) N/A 9.65% 9.45% 9.54% 9.41% For the Year Ended |